


Abstract
Zearalenone (ZEN), an estrogenic mycotoxin affecting cow reproduction, and deoxynivalenol (DON) are cytotoxic and immunotoxic, reducing protein synthesis. Contamination with ZEN and DON decreases the productivity of breeding cows. We evaluated the feasibility of commercial lateral flow immunochromatographic strip tests (LFISTs) as a rapid first-line screening approach for urinary ZEN and DON exposure in cattle. Using 81 samples from 13 Japanese Black (JB) and 14 Holstein Friesian (HF) herds, line intensity ratios were quantified by analyzing photographs of test and control lines within regions of interest (ROIs). LFIST correlated significantly with ELISA (ZEN/Cre: p < 0.001 and τ = 0.35; DON/Cre: p < 0.001 and τ = 0.31) and LC-MS/MS (ZEN/Cre: p = 0.002 and r = 0.35; α-ZOL/Cre: p = 0.013 and r = 0.27; β-ZOL/Cre: p = 0.007 and r = 0.30; ΣZEN/Cre: p = 0.005 and r = 0.31). The relationship between parameters was explored using the Weibull accelerated failure time model analysis. LFIST-ZEN and LFIST-DON were significantly associated with ELISA ZEN/Cre (p = 0.00057) and ELISA DON/Cre (p = 0.00061), respectively. To test whether LFISTs could predict mycotoxin contamination in feed, data from nine other herds (n = 38), with known feed mycotoxin levels, were analyzed. Estimation equations related feed ZEN and DON concentrations to urinary ZEN and DON levels in the herds. Our findings support the potential utility of LFIST as a rapid first-line herd-level screening tool for ZEN and DON exposure, providing screening information with LFIST results obtainable within approximately 15 min after initiation of the assay, while confirmatory laboratory analysis remains necessary when exposure is suspected.
Keywords:
cattle; zearalenone; deoxynivalenol; lateral flow immunochromatographic strip test (LFIST); ELISA; LC-MS/MS; urine; agricultural innovation Key Contribution:
This study evaluates the feasibility of commercially available lateral flow immunochromatographic strip tests (LFISTs) as a rapid first-line screening approach for urinary zearalenone (ZEN) and deoxynivalenol (DON) exposure in cattle. LFIST readouts showed statistically significant, albeit modest-to-moderate, associations with ELISA and LC-MS/MS measurements. LFIST results can be obtained within approximately 15 min after initiation of the assay; however, further validation using freshly collected urine is required before a complete on-farm sample-to-answer procedure can be established. Exploratory prediction models were derived, but external validation is required before quantitative estimation of absolute urinary or feed mycotoxin concentrations can be recommended for routine practice.
1. Introduction
In recent years, the impact of Fusarium mycotoxins has received increasing attention because their prevalence appears to be increasing worldwide, despite the efforts to minimize their concentrations in animal feed. Global warming and climate change have been discussed as possible causes of higher exposure rates, which may increase the risk of adverse effects on both human and animal health [1,2,3,4]. A large-scale global survey of contamination suggested that mycotoxins are nearly universally detected contaminants [5], and the co-occurrence of Fusarium mycotoxins, including the most important combination of zearalenone (ZEN) and deoxynivalenol (DON), needs to be monitored more closely [5]. Co-contamination of ZEN and DON has been shown to be common, occurring in approximately 23.8% of the 400 feed samples tested and 27% of the cattle feed samples evaluated [6]. Mycotoxin contamination in feed within a herd is of crucial importance to herd management. Herd managers must consider the potential harm that mycotoxin contamination can cause to cow health and products. In the worst-case scenario, all contaminated feed must be discarded. Rapid identification of potential mycotoxin contamination, evaluation of cleanup effectiveness, and ongoing herd monitoring are essential.
Recent large-scale surveillance studies confirm that mycotoxin contamination remains a persistent and geographically widespread problem in animal feed. A global multi-mycotoxin survey demonstrated that more than 90% of compound-feed samples contained at least one mycotoxin, with frequent co-occurrence of regulated, modified, and emerging mycotoxins [7]. Similarly, surveillance of 23,003 feed samples collected in China between 2021 and 2024 showed frequent contamination with DON and ZEN and extensive multi-mycotoxin co-contamination [8]. A four-year survey of feed and raw materials in Poland also identified DON and ZEN among the most prevalent contaminants, particularly in maize [9]. Collectively, these observations emphasize the need for rapid, repeated, and field-applicable monitoring strategies rather than exclusive reliance on occasional laboratory analyses.
As fungal growth and mycotoxin production are influenced by multiple factors, including season, geographic location, drought, harvest time, processing, storage and distribution [10], an important first step in mycotoxin control, especially in herds fed home-grown feed, is sub-clinically measuring the level and status of mycotoxin contamination in each herd’s feed. Several analytical methods for measuring mycotoxins have been developed, including ELISA, high-performance liquid chromatography (HPLC), and high-performance liquid chromatography/tandem mass spectrometry (HPLC-MS/MS) [11,12]. However, in farm environments where feed supply changes rapidly, it is often difficult to control animal exposure to mycotoxins. Therefore, monitoring urinary ZEN and DON concentrations in livestock, such as cattle, is an appropriate biomarker for ZEN and DON exposure [11,12,13].
We have previously established a monitoring system for ZEN and DON in bovine urine, comprising an initial screening using commercially available ELISA kits followed by validation via LC-MS/MS for measuring ZEN and its related metabolites α-Zearalenol (α-ZEL) and β-Zearalenol (β-ZEL). Using this monitoring system, we have identified JB cattle herds predominantly contaminated with ZEN and HF cattle herds predominantly contaminated with DON. By implementing countermeasures in the feed, we have reported improvements in reproductive performance and reductions in mastitis incidence rates. Furthermore, we have clarified the relationship with anti-Müllerian hormone (AMH), a potential marker of fertility, ovulatory hyper-response, ovarian dysfunction, and herd longevity, and serum amyloid A (SAA), an acute-phase protein associated with inflammation [14].
Numerous analytical techniques for mycotoxin analysis have been effectively established, including high-performance liquid chromatography (HPLC) and high-performance liquid chromatography/tandem mass spectrometry (HPLC-MS/MS) [15,16]. Despite their accuracy and sensitivity, these methods are complicated, expensive, and time-consuming. This disadvantage makes these approaches unsuitable for on-site mass sample screening. Commercially available immunoassays like enzyme-linked immunosorbent assay (ELISA) [17] and immunofluorescent assay (IFA) [18] address this issue. ELISA sample preparation is laborious and time-consuming, including coating the antigen, blocking, and termination. The lab-independent, high-sensitivity, high-specificity, and low-cost lateral flow immunochromatographic strip test (LFIST) is excellent for on-site assessments, while the very sensitive IFA requires special equipment and is lab-dependent [19,20,21,22,23]. Owing to their easy production, high stability, good mobility in porous membranes, and low aggregation, gold nanoparticles (AuNPs) are a preferred labeling material [24,25,26]. AuNP-based investigations have identified many targets [27,28,29].
Detection systems are extremely useful for identifying contaminated cattle herds; however, from the perspective of animal welfare and the need for practical on-farm monitoring in recent years, a simple and inexpensive monitoring method for assessing mycotoxin concentrations in feed is needed. In mycotoxin concentration measurement systems, the immunochromatographic assays are particularly widely used as a simple detection method for mycotoxins in feed, and kits for various mycotoxins are commercially available and widely used. Commercial LFIST kits for mycotoxin detection are already available and are primarily designed for rapid screening of feed or food matrices. However, their applicability to bovine urine as a biological matrix for herd-level monitoring of mycotoxin exposure has not been sufficiently evaluated. Thus, the specific knowledge gap addressed in the present study is not the development of LFIST technology itself, but whether commercially available LFIST can provide useful first-line screening information when applied to bovine urine and how its readouts relate to established urinary measurements obtained by ELISA and LC-MS/MS. We have previously established ELISA and LC-MS/MS measurement systems using bovine urine samples and accumulated urine samples with known ZEN and DON concentrations. The objective of this study was to evaluate the feasibility and analytical applicability of commercially available LFIST for rapid first-line screening of ZEN and DON exposure using bovine urine samples under on-farm conditions. LFIST was evaluated as a screening approach to identify cattle herds in which further laboratory investigation may be warranted, rather than as a definitive diagnostic or quantitative replacement for established laboratory methods.
2. Results
2.1. Urinary Mycotoxin Contamination Level in JB and HF
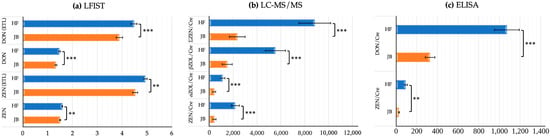
Urinary mycotoxin contamination levels in HF herds (39 samples from 13 herds) were significantly higher than those in JB herds (42 samples from 14 herds). Among the three testing methodologies—LFIST, ELISA, and LC-MS/MS—the contamination levels in HF herds were consistently higher than those in JB herds. Most comparisons were highly significant (p < 0.001), whereas LFIST ZEN and ELISA ZEN/Cre showed significance at the 1% level (p < 0.01). The comparison of mycotoxin contamination levels between JB and HF herds is presented in Figure 1.
Figure 1.
Comparison of mycotoxin contamination levels between Japanese Black (JB) and Holstein Friesian (HF), units: ELISA (pg/mg Cre) and LC-MS/MS (pg/mg Cre). **: p < 0.01 (1% significance level); ***: p < 0.001 (0.1% significance level); Cre: creatinine.
2.2. Experiment 1: LFIST and Laboratory Testing Methods
Table 1 summarizes correlations between LFIST readouts and urinary mycotoxin concentrations measured by LC–MS/MS. Pearson’s correlation coefficient (r) was used for LFIST–LC–MS/MS comparisons. LFIST ZEN was significantly correlated with ΣZEN/Cre using original LFIST data (p = 0.005, r = 0.31). Moreover, LFIST DON was significantly correlated with ΣZEN/Cre (p < 0.001, r = 0.49). The association between LFIST ZEN and LFIST DON was significant (p < 0.05), suggesting that higher ZEN contamination tends to co-occur with higher DON levels.
Table 1.
The correlation results between LFIST ZEN-DON and LC-MS/MS methods.
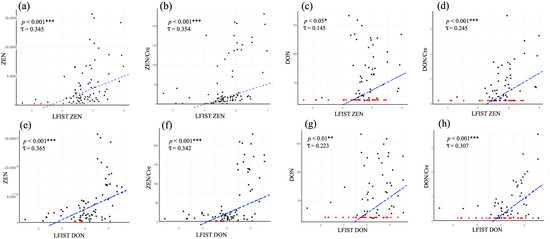
As shown in Figure 2, LFIST readouts were significantly associated with creatinine-adjusted ELISA measurements. Kendall’s rank correlation coefficient (τ) was used for LFIST–ELISA comparisons. Significant associations were observed for LFIST ZEN vs. ZEN/Cre (Figure 2b; p < 0.001, τ = 0.345) and LFIST DON vs. DON/Cre (Figure 2h; p < 0.001, τ = 0.307). Cross-toxin associations were also detected, with LFIST ZEN associated with DON/Cre (Figure 2d; p < 0.001, τ = 0.245) and LFIST DON associated with ZEN/Cre (p < 0.001, τ = 0.342). These results indicate statistically significant associations between LFIST readouts and laboratory measurements of urinary ZEN and DON.
Figure 2.
Correlations between LFIST readouts ((a–d), LFIST ZEN; (e–h), LFIST DON) and creatinine-adjusted ELISA measurements of urinary ZEN and DON. Censored points indicate ELISA values below the detection/quantification limit. Black dots: observed data; Red dots: censored data; Blue dashed: correlation trend line; *: p < 0.05 (5% significance level); **: p < 0.01 (1% significance level); ***: p < 0.001 (0.1% significance level).
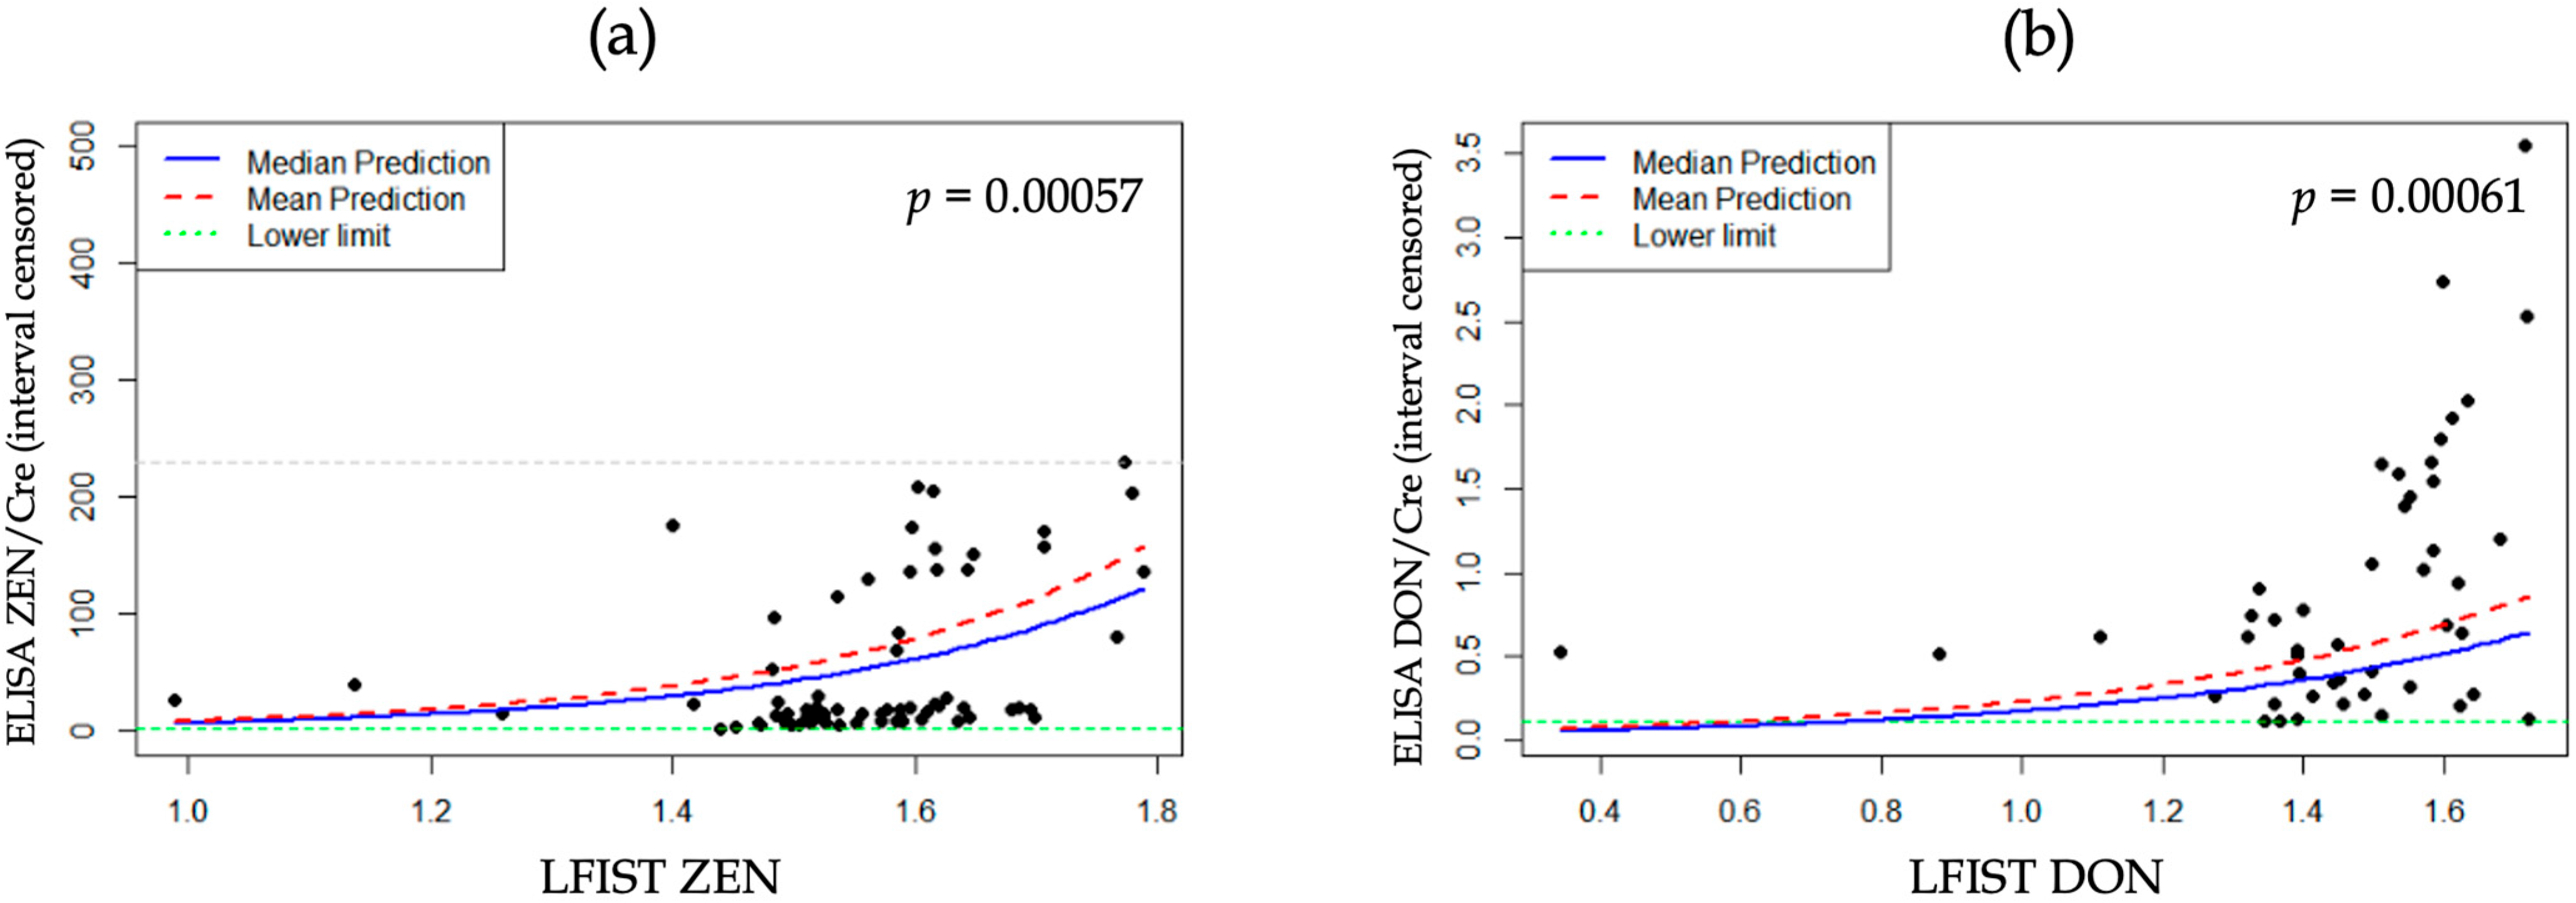
To account for ELISA measurements below the detection/quantification limit, we fitted parametric left-censored regression models (AFT formulation), as shown in Figure 3. Both models—LFIST ZEN predicting ELISA ZEN/Cre and LFIST DON predicting ELISA DON/Cre—were statistically significant (p = 0.00057 and p = 0.00061, respectively). These models were used to derive practical equations to estimate ZEN/Cre and DON/Cre from LFIST readouts. The equation is as follows (exp: Euler’s number ≈ 2.71828; ≈: approximately):
Figure 3.
Parametric left-censored regression (AFT formulation) relating LFIST readouts to creatinine-adjusted ELISA concentrations: (a) LFIST ZEN vs. ELISA ZEN/Cre; (b) LFIST DON vs. ELISA DON/Cre.
- UrinaryZEN/Cre ≈ 11.35 × exp(0.036 × LFISTZEN);
- UrinaryDON/Cre ≈ 1.65 × exp(0.018 × LFISTDON).
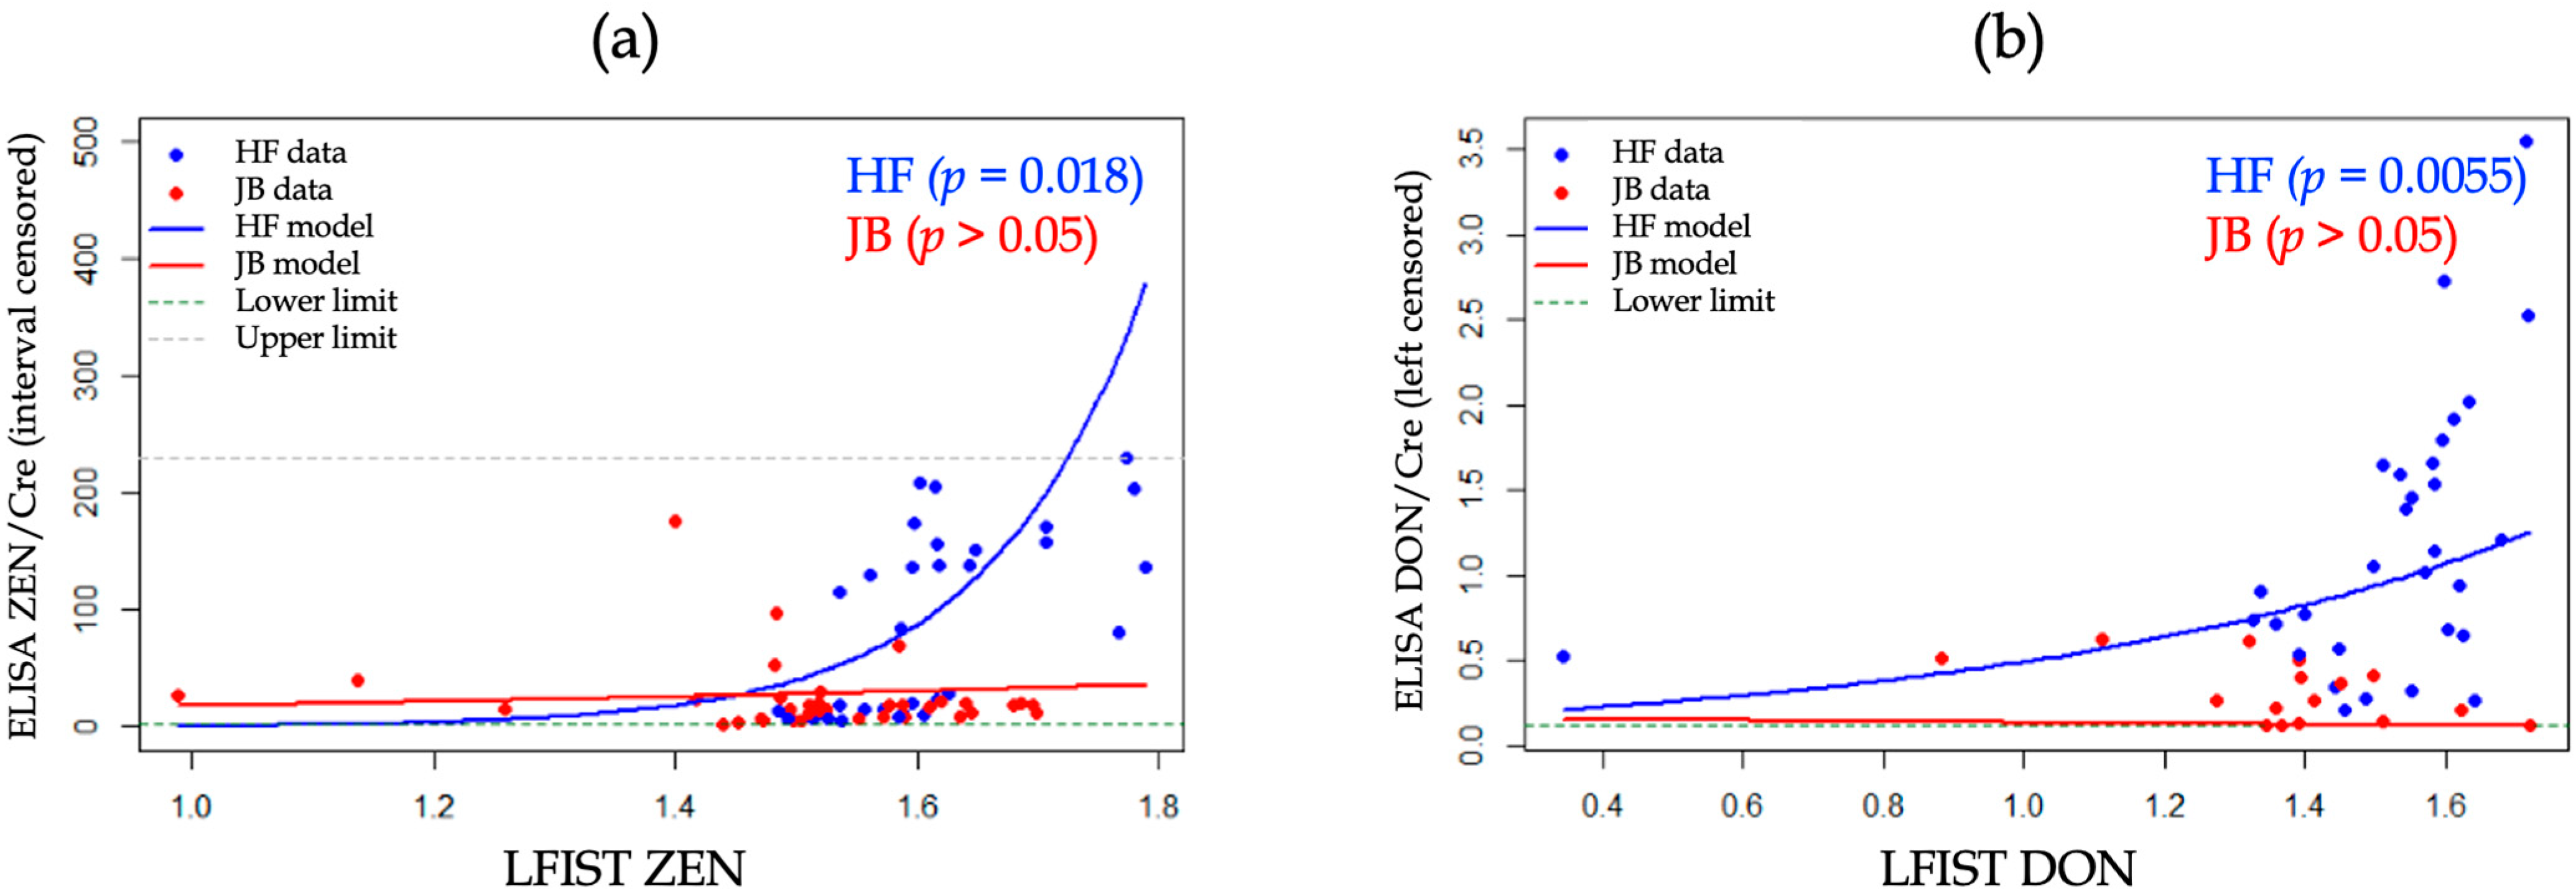
We further stratified the analysis by cattle breed (HF and JB). In HF cattle, the association between LFIST and creatinine-adjusted ELISA concentrations remained statistically significant (LFIST ZEN vs. ZEN/Cre: p = 0.018; LFIST DON vs. DON/Cre: p = 0.0055; Figure 4a,b). In contrast, the corresponding associations in JB cattle were not statistically significant (p > 0.05). These results suggest that the LFIST–ELISA relationship may be more readily detected in HF than in JB under the present study conditions.
Figure 4.
Parametric left-censored regression (AFT formulation) relating LFIST readouts to creatinine-adjusted ELISA concentrations, stratified by cattle breed: (a) LFIST ZEN vs. ELISA ZEN/Cre; (b) LFIST DON vs. ELISA DON/Cre. HF, Holstein Friesian; JB, Japanese Black.
2.3. Experiment 2: Feed and Urinary Mycotoxin Contamination
This study investigated paired feed–urine samples for ZEN (n = 32 pairs) and DON (n = 10 pairs). Correlation analyses were performed to assess the relationship between mycotoxin contamination levels in feed and urinary mycotoxin contamination in cows consuming the feed. As shown in Table 2, feed and urinary ZEN levels were significantly correlated (p < 0.001); however, the corresponding association for DON was not statistically significant (p > 0.05). Given the limited number of paired DON observations, this nonsignificant result should not be interpreted as evidence of the absence of a relationship; rather, the DON finding should be considered preliminary and hypothesis-generating.
Table 2.
Correlation results of feed and urinary contamination.
To derive practical prediction equations for herd monitoring, regression models were fitted using feed contamination levels as predictors of urinary contamination. For ZEN, urinary ZEN/Cre included values below the quantification limit; therefore, a parametric left-censored regression model (AFT formulation) was used. For DON, urinary DON/Cre showed no censoring; therefore, a standard linear regression model was fitted. The resulting equations are shown in Table 3. According to the outcomes of statistical analysis, the subsequent formula is possibly employed to predict mycotoxin contamination levels:
Table 3.
Regression models for the relationships between feed mycotoxin concentrations and urinary mycotoxin concentrations (ZEN: left-censored AFT regression; DON: linear regression).
- UrinaryZEN/Cre ≈ 4302.19 × exp(0.0004 × FeedZEN);
- UrinaryDON/Cre ≈ 275.18 + 0.012 × FeedDON.
Finally, the equations above, which use urinary contamination levels (ZEN/Cre and DON/Cre), provide a practical approach to estimate feed contamination levels using only LFIST readouts. This enables rapid on-farm screening of urinary contamination while supporting routine monitoring of herd feed contamination. The formula is as follows (ln: natural logarithm):
- LFISTZEN ≈ 164.36 + 0.011 × FeedZEN;
- LFISTDON ≈ 55.56 × ln.
3. Discussion
3.1. Experiment 1
In livestock management systems, including cattle herds, the presence of mycotoxins in feed is a critical hazard point that significantly impacts not only herd productivity and farm operations but also the safety of livestock products as food. We have already established a monitoring system for urinary ZEN and DON using urine samples as biological samples, and through long-term monitoring, we have clarified the impact of these mycotoxin uptake dynamics on the reproductive ability and productivity of cattle herds, reporting the usefulness of this monitoring system in cattle herds [14,30,31]. During the process of establishing the urinary mycotoxin monitoring system, we had stored samples with known urinary ZEN and DON concentrations measured by ELISA and ZEN and its metabolites concentrations by LC-MS/MS. The novelty of the present study does not lie in the LFIST technology itself, which is already commercially available for mycotoxin screening, but in evaluating its alternative application to bovine urine within a herd-level mycotoxin monitoring framework. Specifically, we investigated whether LFIST readouts obtained from bovine urine provide useful first-line screening information in relation to established urinary measurements obtained by ELISA and LC-MS/MS.
The results of this study suggest that commercially available LFIST may provide useful first-line screening information on urinary ZEN and DON exposure in cattle within a herd-level mycotoxin monitoring framework. In this study, when applying urine samples to the LFIST, the two bands expected to be obtained were photographed. The intensity of these bands was quantified, and the test band’s intensity was divided by the control band’s intensity to calculate the concentration of the sample on the LFIST. Similar to the urine creatinine-modified values we use as urinary concentrations in our urinary mycotoxin concentration monitoring system, we must account for changes in control band intensity due to urine concentration variations caused by the water intake of each cow. As a result, the intensity of the control band was significantly influenced by the concentration of each urine sample, suggesting that the LFIST concentration determination method is a reasonable approach.
Lateral flow immunoassay (LFIA) is widely recognized as one of the most advanced platforms for point-of-care testing and has found extensive applications in fields such as medical diagnostics, environmental monitoring, and food and feed safety inspection, and indicated that LFIA offers dual signal readout, enables both qualitative and quantitative analyses, significantly enhances detection sensitivity, and reduces assay time [32]. The primary objective of this study was to verify the correlation between known urinary ZEN and DON concentrations—specifically, measured ZEN and DON concentrations by ELISA methods; creatinine-corrected ZEN and DON concentrations by ELISA methods; creatinine-corrected ZEN, α-ZOL, and β-ZOL concentrations via LC-MS/MS; and the total ΣZEN concentration of these three compounds and the values measured by LFIST. As shown in Table 1, statistically significant but modest-to-moderate associations were observed between LFIST readouts and urinary ZEN and DON measurements obtained using the established laboratory methods. These findings support further evaluation of LFIST as a first-line screening approach for bovine urine rather than as a quantitative substitute for ELISA or LC-MS/MS. The proportion of deviating urine samples increased for ZEN or DON measured by ELISA or LC-MS/MS.
In this study, urine samples from 13 JB herds and 14 HF herds were subjected to LFIST measurement, and LFIST values were significantly higher in HF herds. However, the higher urinary and LFIST measurements observed in HF herds should not be interpreted as evidence of an intrinsic breed-specific difference in mycotoxin metabolism or susceptibility. In the present observational dataset, breed was closely associated with production system, feed intake, diet composition, and herd-management practices. The observed differences may therefore reflect differential exposure, physiological characteristics, management conditions, or a combination of these factors. Because these determinants were not independently controlled, the breed-stratified findings should be regarded as exploratory. In addition, LFIST measurements of urinary ZEN and DON were significantly associated, consistent with the frequent co-occurrence of these Fusarium mycotoxins; however, detection of one compound should not be used to infer the presence or concentration of the other without compound-specific testing.
Although LFIST readouts were significantly associated with ELISA and LC-MS/MS measurements, the observed correlations were modest to moderate. These differences should be interpreted in light of the fundamental analytical differences among the three methods. LFIST and ELISA are antibody-based assays, and their responses depend on antibody specificity and potential cross-reactivity with structurally related compounds and urinary metabolites. In contrast, LC-MS/MS provides compound-specific instrumental detection and can distinguish individual analytes and metabolites according to the analytical method employed. Thus, the three methods do not necessarily detect identical analytical fractions of urinary mycotoxins.
Differences in sample preparation may also contribute to the observed discrepancies. In the present study, for LFIST analysis, the stored original urine samples were re-thawed, thoroughly mixed, and centrifuged before the resulting supernatants were applied to the strips, without subsequent solid-phase extraction or enzymatic hydrolysis. In contrast, urine used for ZEN determination by ELISA and LC-MS/MS underwent β-glucuronidase/arylsulfatase treatment and solid-phase extraction. Furthermore, residual differences in the urinary matrix, including specific gravity, ionic composition, pH, and other endogenous components, may influence capillary flow, antigen–antibody interactions, and signal intensity in LFIST. These potential matrix effects were not independently evaluated in the present study.
Taken together, these analytical differences provide plausible explanations for the statistically significant associations observed without close quantitative agreement among LFIST, ELISA, and LC-MS/MS. Therefore, the present findings should not be interpreted as demonstrating analytical equivalence or interchangeability among these methods. Rather, they support the potential role of LFIST as a rapid first-line screening approach for herd-level monitoring, with ELISA and particularly LC-MS/MS remaining important for quantitative confirmation and more specific analytical characterization. Accordingly, the prediction equations derived in the present study should be regarded as exploratory and require external validation before they can be used to estimate absolute urinary or feed mycotoxin concentrations in routine practice.
3.2. Experiment 2
Our previous reports have demonstrated a high correlation between ZEN and DON concentrations in feed and ZEN and DON concentrations in urine [14,30]. As a result of Experiment 1, a significant correlation was observed between ZEN and DON concentrations in bovine urine samples and the values measured by the LFISTs. Therefore, if the relationship between urinary ZEN and DON concentrations measured by the established ELISA assay and feed ZEN and DON concentrations measured by the LC-MS/MS assay can be clarified, estimating mycotoxin concentrations in feed using the LFIST may be possible. Therefore, the LFIST measurement system could enable rapid estimation of mycotoxin concentrations in feed within the relevant cattle herd.
Based on the results of this study, indirectly evaluating urinary mycotoxin concentrations yielded a significant correlation coefficient between feed mycotoxin concentrations and LFIST measurements. This enabled the development of an estimation formula for calculating feed mycotoxin concentrations when using bovine urine samples measured by LFIST. In developing this estimation formula, as mentioned above, feed intake levels—particularly roughage intake—differ significantly between JB and HF breeds. Therefore, this study demonstrated that it is possible to establish estimation equations based on Japanese feeding standards, using 5 kg of roughage for the JB breed and 20 kg for the HF breed as reference values.
Mycotoxins in feed are not distributed uniformly throughout the feed but are present in various concentrations in spots [33], which may lead to inaccuracies in monitoring mycotoxin concentrations in feed. Therefore, we have established a system for measuring urinary mycotoxin concentrations, which are thought to be an indicator of mycotoxin concentrations in feed actually ingested orally, and we are continuing to monitor the dynamics of mycotoxin infiltration at cattle production sites.
The results of this study showed a significant correlation between the results of our previous urine sample measurement system using ELISA and LCMS and the LFIA results, suggesting that the LFIA measurement system using urine samples is a practical and useful method for monitoring mycotoxin infiltration in cattle production sites.
From a practical perspective, the proposed LFIST-based monitoring system is intended to function as a three-step on-farm framework: screen → confirm → manage. First, urine samples from representative cattle within a herd can be tested using LFIST as a rapid first-line screen. Because validated diagnostic cut-off values were not established in the present study, LFIST findings should be interpreted as screening information indicating whether further evaluation of possible mycotoxin exposure is warranted, rather than as definitive negative, suspect, or positive classifications. Second, when LFIST findings suggest possible exposure, testing can be repeated using a second aliquot and, where possible, urine from additional animals in the same herd, followed by quantitative confirmation using ELISA and, when definitive compound identification and quantification are required, LC-MS/MS. Third, when contamination is supported by confirmatory testing, herd managers can investigate suspected feed sources, storage and moisture conditions, feed ingredients, and suppliers; consider feed replacement or other appropriate mitigation measures in consultation with a veterinarian or nutritionist; and repeat urine and/or feed testing after intervention. This screen → confirm → manage framework allows LFIST to support timely on-farm decision-making without implying diagnostic certainty from the strip result alone.
The prediction equations derived in the present study should be evaluated using independent datasets obtained from cattle herds not included in model development. Future external validation should assess the strength and consistency of the relationships between LFIST measurements and urinary mycotoxin concentrations determined by ELISA and LC-MS/MS, as well as the relationships between urinary measurements, with and without creatinine correction, and quantitative mycotoxin concentrations in feed. Predictive accuracy and calibration of the derived equations and their reproducibility across different herds and sampling occasions should also be evaluated. Furthermore, for the intended use of LFIST as a first-line screening method, sufficiently large independent datasets will be required to establish prospective operational screening thresholds and to determine their sensitivity and specificity against predefined reference criteria.
Several limitations should be considered when interpreting the present findings. An important limitation of the present study concerns the pre-analytical condition of the urine samples used for LFIST. The urine samples had been frozen after collection and were centrifuged following thawing before LFIST analysis, as described in the Materials and Methods. Therefore, the present findings do not establish whether freshly collected, non-centrifuged bovine urine would provide equivalent LFIST performance. Particulate matter, turbidity, urine specific gravity, ionic composition, pH, and other matrix characteristics may potentially affect capillary flow, antigen–antibody interactions, and strip signal intensity. These potential matrix effects were not systematically evaluated in the present study. Future validation should therefore directly compare freshly collected non-centrifuged urine with centrifuged urine and systematically assess the effects of relevant urine matrix characteristics. In addition, repeatability and reproducibility of LFIST measurements and potential antibody cross-reactivity with relevant urinary mycotoxin metabolites should be evaluated. These investigations will be necessary to determine the sample-processing requirements and analytical robustness of LFIST for routine herd-level screening. Second, the observed associations between LFIST and laboratory reference methods were modest to moderate; therefore, LFIST should currently be regarded as a rapid screening tool rather than a quantitative substitute for ELISA or LC-MS/MS. Third, the paired feed–urine dataset for DON was small (n = 10), limiting statistical power and generalizability; the nonsignificant DON association should therefore be considered preliminary rather than evidence of the absence of a relationship. The limited number of paired feed–urine observations for DON (n = 10) restricts the generalizability and external validation of the present DON model. Future studies should therefore employ a prospective paired-sampling design involving a larger number of herds across a broader range of DON contamination levels. Concurrent and repeated collection of feed and urine samples, particularly across changes in feed batches or sources, together with urine sampling from multiple representative animals within each herd, would increase both the number and exposure range of paired observations. Quantitative LC-MS/MS analysis of feed combined with LFIST, ELISA, and LC-MS/MS analyses of corresponding urine samples would provide a more robust dataset for evaluating feed–urine relationships and externally validating the DON prediction model. Accordingly, the present DON prediction model should be considered preliminary and requires external validation before practical application. Additionally, breed was not experimentally isolated from production system, feed intake, diet composition, or herd-management practices, and the breed-stratified findings cannot establish an intrinsic biological breed effect. Finally, the prediction equations were derived from the present observational dataset and require external validation, including assessment of predictive accuracy and reproducibility in larger and more balanced cattle populations.
4. Conclusions
Mycotoxin contamination of feed remains an important concern for cattle herd management. The present study provides a feasibility assessment of commercially available LFIST for rapid first-line screening of urinary ZEN and DON exposure at the cattle-herd level. LFIST readouts were significantly associated with urinary ZEN and DON measurements obtained using established laboratory methods, although the strength of these associations was modest to moderate. In the paired feed–urine analysis, feed ZEN concentrations were also significantly associated with urinary ZEN measurements, whereas evaluation of DON was limited by the small number of paired observations. These findings demonstrate statistical associations but do not establish analytical equivalence or interchangeability among LFIST, ELISA, and LC-MS/MS.
Accordingly, LFIST should not currently be regarded as a quantitative replacement for established laboratory methods. Rather, it may have potential as the initial screening step in a screen–confirm–manage framework, in which findings suggesting possible mycotoxin exposure are followed by confirmatory laboratory analysis and, when contamination is supported, investigation and management of suspected feed sources. The prediction equations developed in the present study should be considered exploratory and require independent external validation before quantitative application. Further validation, including evaluation of sample-processing requirements, analytical repeatability and reproducibility, urine matrix effects, and operational screening thresholds, will be required before routine field implementation.
5. Materials and Methods
5.1. Ethical Statement
This study was conducted in accordance with laws and regulations regarding the protection of laboratory animals and the guidelines of the Yamaguchi University Animal Use Review Committee (No. 665, approved on 15 July 2025). Informed consent was obtained from all farmers involved in this study.
5.2. Chemicals and Solvents
ZEN was acquired from MP Biomedicals (Heidelberg, Germany), while metabolites α-ZEL and β-ZEL were sourced from Sigma (St. Louis, MO, USA). Stock solutions of ZEN, α-ZEL, and β-ZEL (1 μg/mL in methanol) were preserved in light-protected conditions at 4 °C. HPLC-grade methanol and acetonitrile were acquired from Fujifilm Wako Pure Chemical Co. (Osaka, Japan) and Sigma-Aldrich, respectively. The β-glucuronidase/arylsulfatase solution was acquired from Merck (Darmstadt, Germany). Sodium acetate was acquired from Kanto Chemical Co., Ltd. (Tokyo, Japan), while Tris was obtained from Nacalai Tesque Inc. (Kyoto, Japan).
5.3. Urine Sample Collection
As part of our ongoing monitoring of urinary ZEN and DON concentrations in a series of cattle herds across Japan, we collected a total of 81 urine samples from three cows each in 13 JB cattle herds and 14 HF cattle herds. Urine samples were collected from cattle in each herd into plastic tubes, frozen after collection, and transported to our laboratory under frozen conditions. For the initial laboratory analyses, the frozen urine samples were thawed, thoroughly mixed, and centrifuged at approximately 2000× g for 5 min at room temperature. Aliquots of the resulting supernatants were used for subsequent ELISA and LC-MS/MS analyses as described below. After aliquoting, the original urine samples remaining in the collection tubes were refrozen and stored at −30 °C. For the subsequent LFIST analysis, these stored urine samples were thawed again, thoroughly mixed, and centrifuged under the same conditions (approximately 2000× g for 5 min at room temperature). Aliquots of the resulting supernatants were then used for LFIST analysis.
5.4. Analytical Methods of ZEN in Urine Samples
We measured urinary ZEN concentrations following our previous report [14]. A 7700 Clinical Analyzer and a commercial kit (Sikarikit-S CRE; Kanto Chemical, Tokyo, Japan) analyzed urinary creatinine concentrations. All urine values were represented as pg/mg creatinine. An ELISA kit (RIDASCREEN Zearalenon; R-Biopharm AG, Garmstadt, Germany) measured urine ZEN levels. Mix 0.5 mL urine sample with 3 mL 50 mM sodium acetate buffer (pH 4.8) and incubate at 37 °C for 12 h with 10 μL β-glucuronidase/arylsulfatase solution. The samples were then deposited on a C18 solid-phase extraction (SPE) column (Strata; Phenomenex, Torrance, CA, USA) preconditioned with 3 mL methanol and 2 mL 20 mM Tris buffer (pH 8.5)/methanol (80:20). The SPE column was rinsed with 2 mL of 20 mM Tris buffer (pH 8.5)/methanol (80:20) and 3 mL of 40% methanol, then centrifuged for 10 min at 500× g to dry. Analytes were gently eluted (15 drops/min) in 1 mL of 80% methanol. Of the 1 mL 80% methanol solution, 0.8 mL was chilled for LC-MS/MS measurements and 0.2 mL for ELISA experiments. The eluate was dried at 60 °C by centrifugal evaporation. To conduct the ELISA, rehydrate the dried residue in 50 μL methanol, add 450 μL sample dilution buffer, and mix carefully. To conduct the ELISA experiment, a 50 μL aliquot was utilized per the kit instructions. A microplate spectrophotometer was used to measure 450 nm absorbance with Ridasoft Win (Version 1,56, R-Biopharm). Using this ELISA kit, cross-reactivity rates for α-ZEL, β-ZEL, and Zeranol were 41.6, 13.8%, and 27.7%, respectively, with a mean recovery rate of 84% ± 14%.
Additional analysis of 0.8 mL refrigerated samples using LC-MS/MS confirmed ELISA results and measured ZEN metabolites, α-ZEL and β-ZEL, as previously described [14]. The reconstituted solution (5 μL) was injected into the LC-MS/MS system (AB Sciex Qtrap 4500, Applied Biosystems, Foster City, CA, USA) using the negative ESI source. The detection limits for ZEN, α-ZEL, and β-ZEL in urine samples were 0.005 ng/mL, with mean recovery rates of 90%, 109%, and 90%, respectively. ZEN and metabolites were separated using an Inert-Sustain C18 column (2.1 i.d. × 100 mm, 2 μm; GL Sciences, Tokyo, Japan) at 40 °C with solvent A (water) and solvent B (methanol). An optimal gradient elution at 200 mL flow rate was 50% to 100% B from 0 to 5 min and 100% B for 9 min. Curtain gas (CUR), 20 psi; ion source (IS) gas 1 and gas 2, 60, 30 psi; ion spray voltage (IS), −4500 V; temperature (TEM), 500 °C; declustering potential (DP), −125 V for ZEN, −120 V for ZEN metabolites; entrance potential (EP), −10 V; collision energy (CE), −32 V for ZEN, −30 V for metabolites; and collision exit potential (CXP), −9 V for ZEN, −11 V for metabolites. ZEN and ZEN metabolites had mass transitions from 317.0 to 175.0 and 319.1 to 275.0.
5.5. Analytical Methods of DON in Urine Samples
The DON concentration in the urine was determined using a commercially available ELISA kit (RIDASCREEN deoxynivalenol; R-Biopharm AG, Darmstadt, Germany) according to the instructions with minor modifications for urine samples as reported previously [14]. Briefly, the urine samples were centrifuged at 3200 rpm for 5 min and then used for ELISA. A 5-fold dilution of 50 μL of urine sample was made by adding 200 μL of Milli-Q water to the sample, and the diluted sample was used for ELISA. RIDA SOFT Win (R-Biopharm) was used to determine absorbance at 450 nm using a microplate spectrophotometer. The cross-reactivity rates using this ELISA kit for 3-Acetyldeoxynivalenol, 15-Acetyldeoxynivalenol, and nivalenol were >100%, approximately 19%, and approximately 4%, respectively, according to the instructions. All urine concentrations were expressed as a ratio of creatinine (pg/mg creatinine), as in the ZEN analysis. In this study, because we had previously confirmed the significant relationship between the results of ELISA assay and LC-MS/MS assay, we did not conduct the LC-MS/MS assay in the present study.
5.6. Analytical Methods of Both ZEN and DON in Feed Samples
We measured the mycotoxin concentration in feed from cattle herds where feed and urine had been sampled simultaneously in the past to verify the relationship between feed mycotoxin concentration and urinary mycotoxin concentration in herds fed that feed. Feed mycotoxin concentration was measured by a private testing agency for each herd, following previous reports [14]. ZEN and DON mycotoxins were measured simultaneously using liquid chromatography–tandem mass spectrometry. These measurements adhered to the feed analysis requirements for multi-component analysis set by the Japanese Food Inspection Center, Ministry of Agriculture, Forestry, and Fisheries.
5.7. Assay Procedure of LFIST
As described in Section 5.3, urine samples used for LFIST analysis were thawed, thoroughly mixed, and centrifuged at approximately 2000× g for 5 min at room temperature. The resulting supernatants were used for LFIST without further filtration, dilution, solid-phase extraction, or enzymatic hydrolysis. For LFIST analysis of urinary samples, commercially available LFIST kits (ZEN and DON Qualitative Rapid Test Kit, Meizheng, Beijing, China) were used according to the manufacturer’s instructions. A 200 µL aliquot of the resulting undiluted supernatant was transferred directly into the conjugate-containing microwell. The microwell contents were mixed by pipetting five to six times and incubated for 4 min at room temperature (20–25 °C). A test strip was then inserted and allowed to develop for 5 min. The strip was removed, and the result was recorded within 1 min. The control and test zones of each strip were photographed for subsequent image-based quantification and comparison with ELISA and LC-MS/MS measurements.
5.8. Methods for Evaluation of LFIST Results
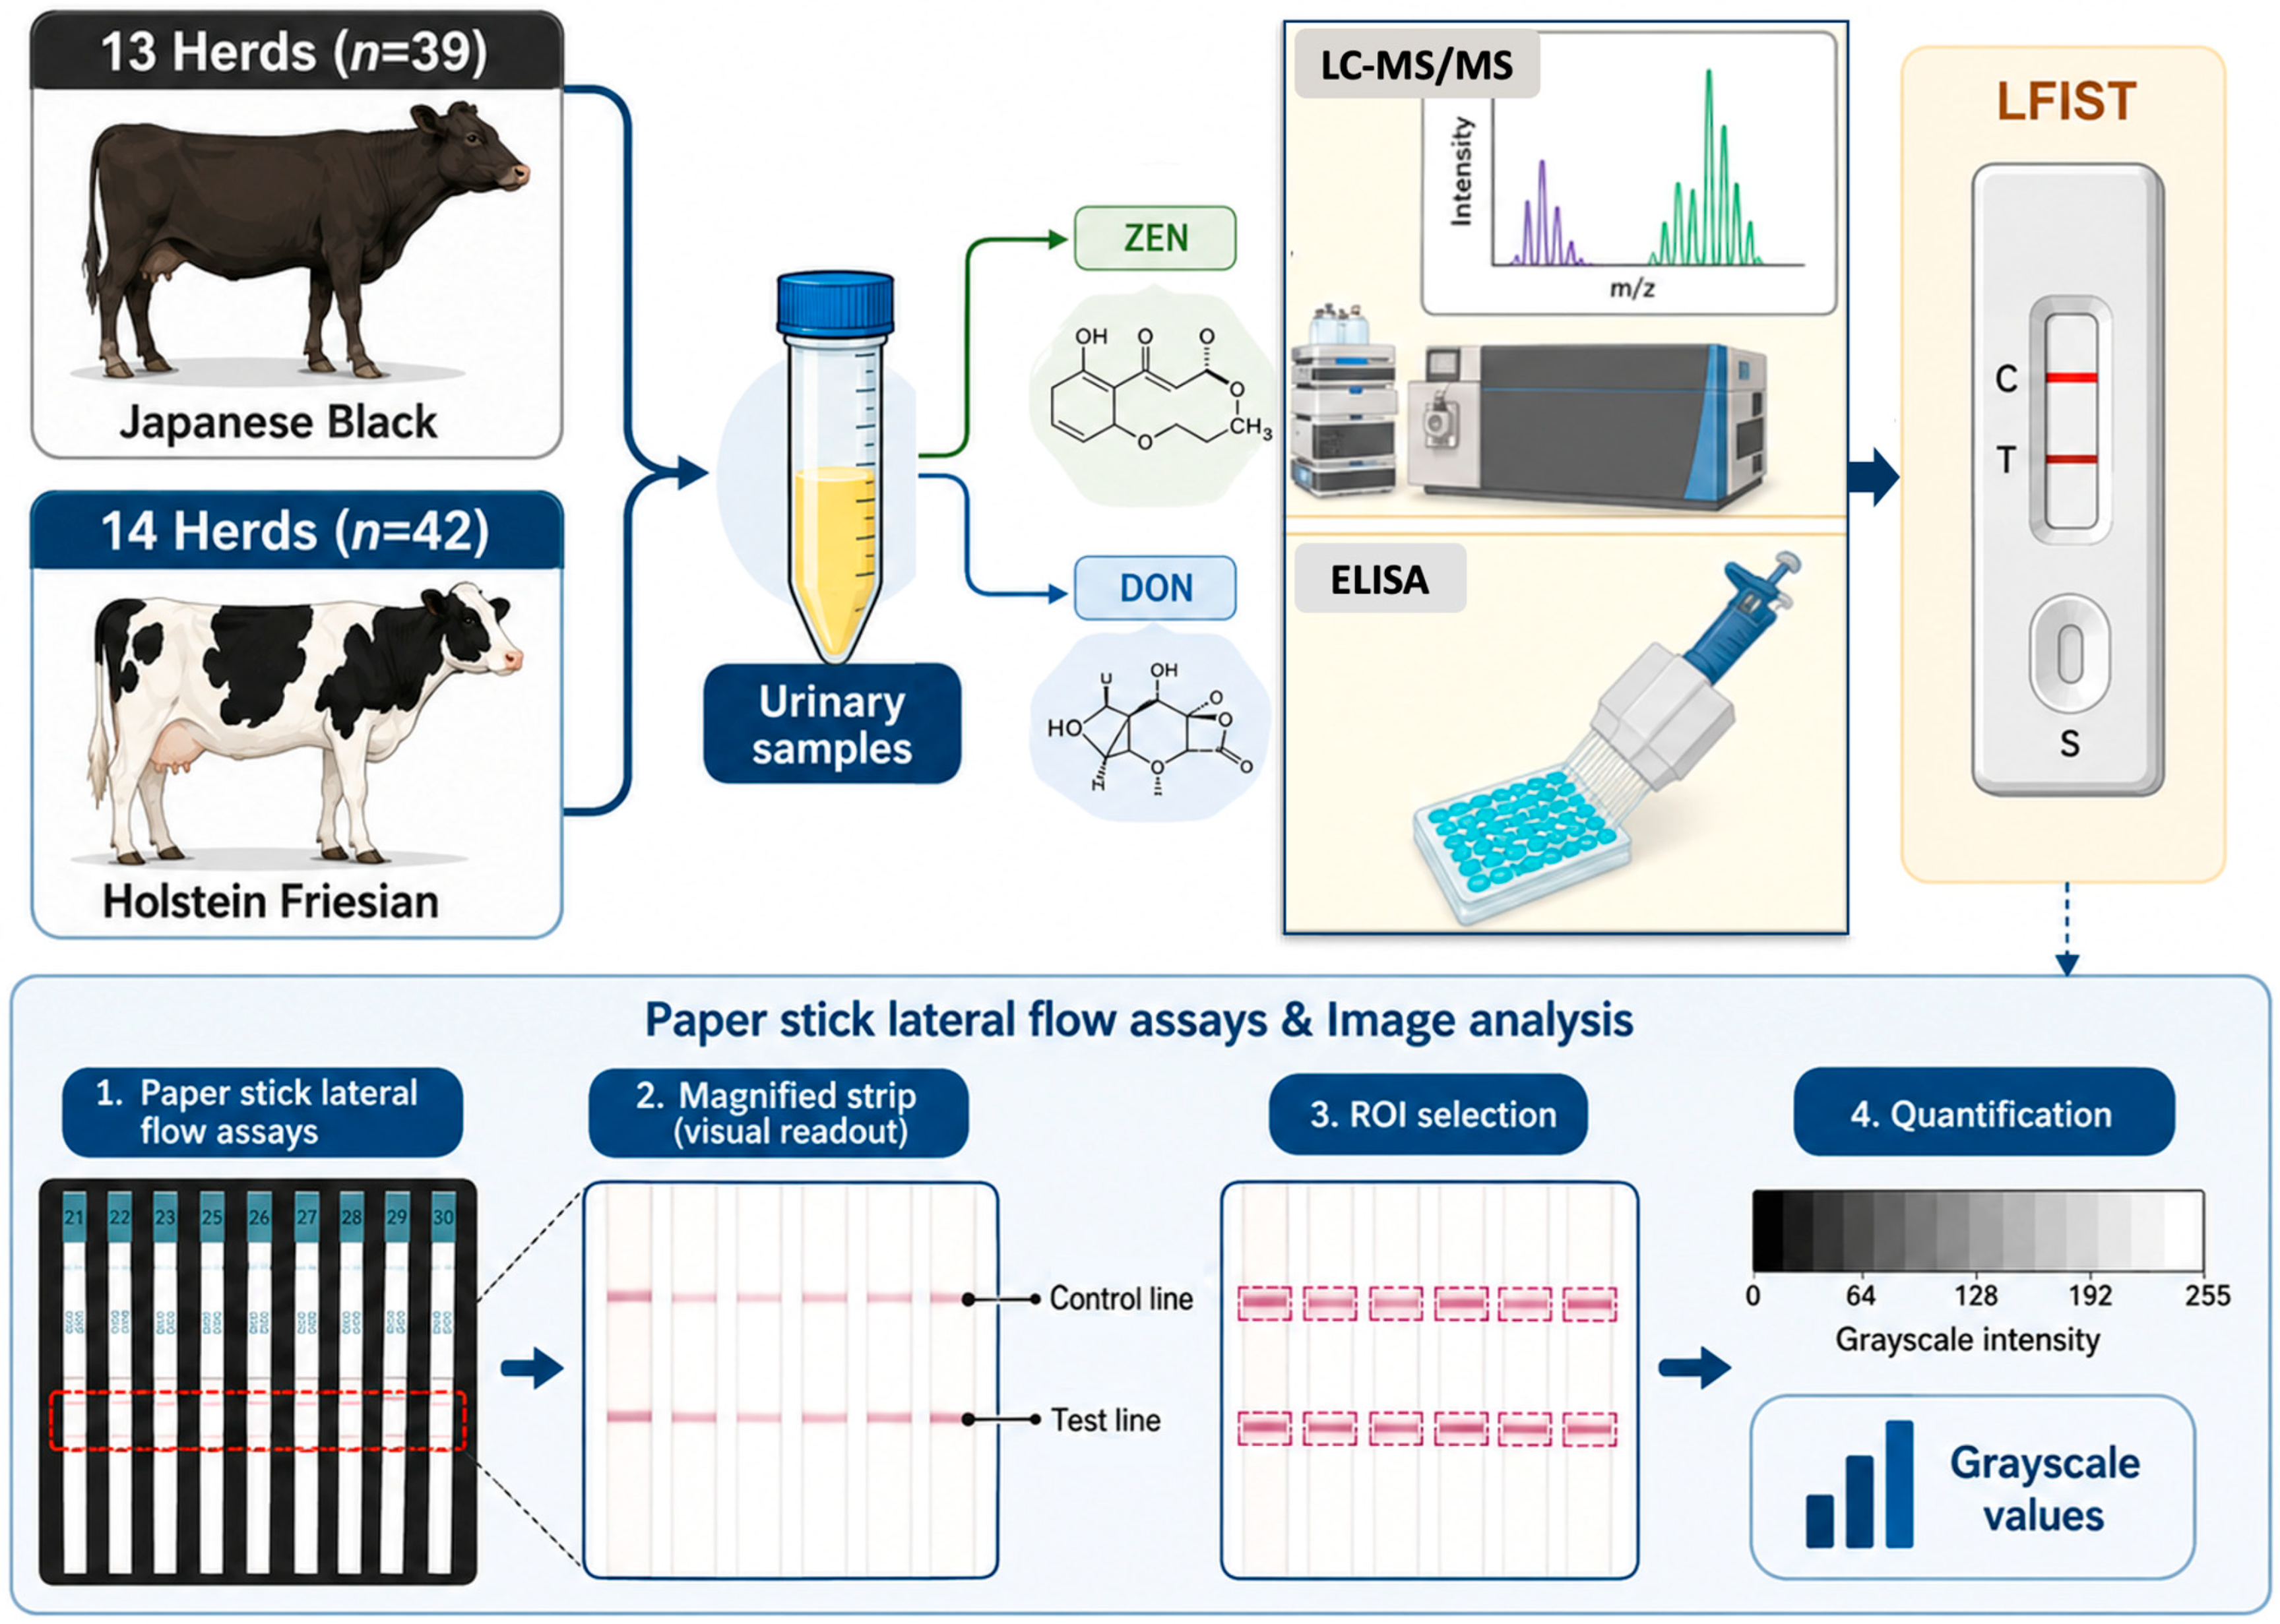
LFIST test results are scanned to create a visual representation. In this study, the strip paper was scanned at 300 DPI (dots per inch), and the image was saved as a JPG file. This step turned the paper strip into image data (pixels). Next, the JPG image was processed using the FIJI image processing application (Fiji version 2.17.0, open-source software ImageJ). In FIJI, the control strip area and measurement results were outlined with ROIs (regions of interest), each shaped as a rectangle. The grayscale values (ranging from 0 to 255) were measured within both ROIs (control ROI and measurement result ROI) to indicate color intensity. As the color intensity increases, the grayscale value decreases. This study extracted the minimum grayscale value from each ROI to produce raw data for both the control strip and the measurement strip. Data normalization was performed by dividing the measurement strip value by the control strip value. The resulting data was then used for statistical analysis.
5.8.1. Experiment 1 (Performance Validation of LFIST Strip Test)
To evaluate the specificity and usefulness of LFIST, the correlation between the results of LFIST for both ZEN and DON assays and each urinary concentrations of the urine samples measured by ELISA (both raw and creatinine-modified data) and LC-MS/MS (ZEN, α-ZOL, β-ZOL, and sum of ZEN, α-ZOL, β-ZOL: Σ) was analyzed. A schematic diagram of the experiment’s design is shown in Figure 5.
Figure 5.
A diagram of the experimental design illustrates the image processing steps based on a paper strip lateral flow assay to generate quantitative numerical data. ZEN: zearalenone; DON: deoxynivalenol; LC-MS/MS: liquid chromatography–tandem mass spectrometry; ELISA: enzyme-linked immunosorbent assay; LFIST: lateral flow immunochromatographic strip test; ROI: region of interest.
5.8.2. Experiment 2 (Relationship Between Feed and Urinary Contamination Levels Detected by LFIST Strip Test)
To evaluate the specificity and utility of LFIST, we analyzed the correlation between LFIST results in ZEN and DON assays and ZEN and DON concentrations in feed samples measured by LC-MS/MS.
5.9. Statistical Analysis
All statistical analyses were conducted in R (version 4.5.2). The significance threshold for this study was p < 0.05 (indicating a significant difference). Continuous variables are presented as mean ± standard deviation (SD). Differences in mycotoxin contamination levels between JB and HF herds were evaluated using Welch’s two-sample t-test.
5.9.1. Experiment 1 (LFIST vs. Laboratory Methods)
Correlations between LFIST readouts and urinary mycotoxin concentrations measured by LC–MS/MS were assessed with Pearson’s correlation coefficient (r). Correlations between LFIST readouts and creatinine-adjusted ELISA measurements were analyzed using Kendall’s rank correlation coefficient (τ) because ELISA results included observations below the detection or quantification limit (censored values).
To model the relationship between LFIST readings and creatinine-adjusted ELISA concentrations while accounting for censored ELISA data, parametric left-censored regression models (accelerated failure time [AFT] formulation) were used (Figure 3). These models generated equations for estimating ZEN/Cre and DON/Cre from LFIST readouts. The same modeling approach was also applied to analyses stratified by cattle breed (HF and JB) (Figure 4).
5.9.2. Experiment 2 (Feed vs. Urine and Derivation of Equations)
Associations between feed contamination levels and urinary contamination levels were examined using Spearman’s rank correlation coefficient (ρ) (Table 2). For deriving prediction equations (Table 3), regression models were fitted with feed contamination levels as predictors for urinary contamination. For ZEN, urinary ZEN/Cre included values below the quantification limit; therefore, a parametric left-censored regression model (AFT formulation) was used. For DON, urinary DON/Cre showed no censoring; thus, a standard linear regression model was applied. Two-sided p-values < 0.05 were considered statistically significant.
Author Contributions
Conceptualization, O.S.W. and M.T. (Mitsuhiro Takagi); methodology, O.S.W., M.T. (Masayasu Taniguchi) and M.T. (Mitsuhiro Takagi); sampling, O.S.W. and M.T. (Mitsuhiro Takagi); formal analysis, O.S.W., D.P., S.U., E.K. and M.T. (Mitsuhiro Takagi); writing—original draft preparation, O.S.W., D.P. and M.T. (Mitsuhiro Takagi); supervision, M.L. and O.Y.; project administration, M.T. (Mitsuhiro Takagi); writing—review and editing, all authors. All authors have read and agreed to the published version of the manuscript.
Funding
This work was partially supported by the Japan Racing Association (R6-no. 4, Mitsuhiro Takagi).
Institutional Review Board Statement
All experiments were conducted according to the guidelines and regulations for the protection of experimental animals and the guidelines stipulated by of Yamaguchi University, Yamaguchi, Japan (No. 665, approved on 15 July 2025).
Informed Consent Statement
Informed consent was obtained from all the farmers involved in this study.
Data Availability Statement
The original contributions presented in this study are included in the article. Further inquiries can be directed to the corresponding author.
Conflicts of Interest
The authors declare no conflicts of interest.
Abbreviations
The following abbreviations are used in this manuscript:
| ZEN | Zearalenone |
| DON | Deoxynivalenol |
| LFIST | Lateral flow immunochromatographic strip test |
| α-ZEL | α-Zearalenol |
| β-ZEL | β-Zearalenol |
| ELISA | Enzyme-linked immunosorbent assay |
| LC-MS/MS | Liquid chromatography–tandem mass spectrometry |
References
- Liew, W.P.P.; Mohd-Redzwan, S. Mycotoxin: Its impact on gut health and microbiota. Front. Cell. Infect. Microbiol. 2018, 8, 60. [Google Scholar] [CrossRef] [Scilit] [PubMed]
- Vandicke, J.; De Visschere, K.; Croubels, S.; De Saeger, S.; Audenaert, K.; Haesaert, G. Mycotoxins in Flanders fields: Occurrence and correlations with Fusarium species in whole-plant harvested maize. Microorganisms 2019, 7, 571. [Google Scholar] [CrossRef] [Scilit] [PubMed]
- Li, P.; Su, R.; Yin, R.; Lai, D.; Wang, M.; Liu, Y.; Zhou, L. Detoxification of mycotoxins through biotransformation. Toxins 2020, 12, 121. [Google Scholar] [CrossRef] [Scilit] [PubMed]
- Ráduly, Z.; Szabó, L.; Madar, A.; Pócsi, I.; Csernoch, L. Toxicological and medical aspects of aspergillus-derived mycotoxins entering the feed and food chain. Front. Microbiol. 2020, 10, 2908. [Google Scholar] [CrossRef] [Scilit] [PubMed]
- Gruber-Dorninger, C.; Jenkins, T.; Schatzmayr, G. Global mycotoxin occurrence in feed: A ten-year survey. Toxins 2019, 11, 375. [Google Scholar] [CrossRef] [Scilit] [PubMed]
- Muñoz-Solano, B.; González-Peñas, E. Co-Occurrence of mycotoxins in feed for cattle, pigs, poultry, and sheep in Navarra, a Region of Northern Spain. Toxins 2023, 15, 172. [Google Scholar] [CrossRef] [Scilit] [PubMed]
- Gruber-Dorninger, C.; Müller, A.; Rosen, R. Multi-mycotoxin contamination of aquaculture feed: A global survey. Toxins 2025, 17, 116. [Google Scholar] [CrossRef] [Scilit] [PubMed]
- Liu, M.; Xia, Z.; Zhang, Y.; Yang, R.; Luo, W.; Guo, L.; Liu, Y.; Lamesgen, D.; Sun, H.; He, J.; et al. Contamination of aflatoxin b1, deoxynivalenol and zearalenone in feeds in China from 2021 to 2024. J. Anim. Sci. Biotechnol. 2025, 16, 66. [Google Scholar] [CrossRef] [Scilit] [PubMed]
- Skrzydlewski, P.; Kosicki, R.; Grajewski, J.; Twarużek, M. Four-year surveillance of mycotoxins in feed and raw materials (2021–2024): Occurrence, co-contamination, and risk implications. Toxicon 2025, 268, 108618. [Google Scholar] [CrossRef] [Scilit] [PubMed]
- Liu, J.; Applegate, T. Zearalenone (ZEN) in livestock and poultry: Dose, toxicokinetics, toxicity and estrogenicity. Toxins 2020, 12, 377. [Google Scholar] [CrossRef] [Scilit] [PubMed]
- Prelusky, D.B.; Warner, R.M.; Trenholm, H.L. Sensitive analysis of the mycotoxin zearalenone and its metabolites in biological fluids by high-performance liquid chromatography. J. Chromatogr. 1989, 494, 267–277. [Google Scholar] [CrossRef] [Scilit] [PubMed]
- Usleber, E.; Renz, V.; Mártlbauer, E.; Terplan, G. Studies on the application of enzyme immunoassays for the Fusarium mycotoxins deoxynivalenol, 3-acetyldeoxynivalenol, and zearalenone. J. Vet. Med. B 1992, 39, 617–627. [Google Scholar] [CrossRef] [Scilit] [PubMed]
- Kleinova, M.; Zöllner, P.; Kahlbacher, H.; Hochsteiner, W.; Lindner, W. Metabolic profiles of the mycotoxin zearalenone and of the growth promoter zeranol in urine, liver, and muscle of heifers. J. Agric. Food Chem. 2002, 50, 4769–4776. [Google Scholar] [CrossRef] [Scilit] [PubMed]
- Widodo, O.S.; Uno, S.; Kokushi, E.; Yamato, O.; Mardianto, M.F.F.; Shinya, U.; Kano, Y.; Kawashima, C.; Fushimi, Y.; Ono, T.; et al. Exposure of cattle breeding herds to naturally co-contaminated zearalenone and deoxynivalenol: The relevance of a urinary mycotoxin monitoring system for herd health and food safety. Toxins 2024, 16, 402. [Google Scholar] [CrossRef] [Scilit] [PubMed]
- Lai, X.-W.; Sun, D.-L.; Ruan, C.-Q.; Zhang, H.; Liu, C.-L. Rapid analysis of aflatoxins B1, B2, and ochratoxin A in rice samples using dispersive liquid-liquid microextraction combined with HPLC. J. Sep. Sci. 2014, 37, 92–98. [Google Scholar] [CrossRef] [Scilit] [PubMed]
- Frenich, A.G.; Vidal, J.L.M.; Romero-González, R.; Aguilera-Luiz, M.M. Simple and high-throughput method for the multi mycotoxin analysis in cereals and related foods by ultra-high performance liquid chromatography/tandem mass spectrometry. Food Chem. 2009, 117, 705–712. [Google Scholar] [CrossRef] [Scilit]
- Leszczyńska, J.; Masłowska, J.; Owczarek, A.; Kucharska, U. Determination of aflatoxins in food products by the ELISA method. Czech. J. Food Sci. 2001, 19, 8–12. [Google Scholar] [CrossRef] [Scilit]
- Wu, S.J.; Duan, N.; Zhu, C.Q.; Ma, X.Y.; Wang, M.; Wang, Z.P. Magnetic nanobead-based immunoassay for the simultaneous detection of aflatoxin B1 and ochratoxin A using upconversion nanoparticles as multicolor labels. Biosens. Bioelectron. 2011, 30, 35–42. [Google Scholar] [CrossRef] [Scilit] [PubMed]
- Ogiso, M.; Morita, T.; Harada, C.; Isagawa, S.; Miyazaki, H.; Shikada, N.; Kimura, A.; Kibune, N.; Watai, M. Investigation of the suitability of immunochemical-based test kits for quantitative analysis of deoxynivalenol in corn-derived feed and feed ingredients. Food Hyg. Saf. Sci. 2013, 54, 351–357. [Google Scholar] [CrossRef] [Scilit] [PubMed]
- Shim, W.B.; Kim, K.Y.; Chung, D.H. Development and validation of a gold nanoparticle immunochromatographic assay (ICG) for the detection of zearalenone. J. Agric. Food Chem. 2009, 57, 4035–4041. [Google Scholar] [CrossRef] [Scilit] [PubMed]
- Sun, Y.; Hu, X.; Zhang, Y.; Yang, J.; Wang, F.; Wang, Y.; Deng, R.; Zhang, G. Development of an immunochromatographic strip test for the rapid detection of zearalenone in corn. J. Agric. Food Chem. 2014, 62, 11116–11121. [Google Scholar] [CrossRef] [Scilit] [PubMed]
- Sun, Y.; Xing, G.; Yang, J.; Wang, F.; Deng, R.; Zhang, G.; Hu, X.; Zhang, Y. Development of an immunochromatographic test strip for simultaneous qualitative and quantitative detection of ochratoxin A and zearalenone in cereal. J. Sci. Food Agric. 2016, 96, 3673–3678. [Google Scholar] [CrossRef] [Scilit] [PubMed]
- Xu, L.; Zhang, Z.; Zhang, Q.; Zhang, W.; Yu, L.; Wang, D.; Li, H.; Li, P. An on-site simultaneous semi-quantification of aflatoxin B1, zearalenone, and T-2 toxin in maize- and cereal-based feed via multicolor immunochromatographic assay. Toxins 2018, 10, 87. [Google Scholar] [CrossRef] [Scilit] [PubMed]
- Moon, J.; Kim, G.; Lee, S. A gold nanoparticle and aflatoxin b1-bsa conjugates based lateral flow assay method for the analysis of aflatoxin B1. Materials 2012, 5, 634–643. [Google Scholar] [CrossRef] [Scilit] [PubMed]
- Chen, Y.Q.; Chen, Q.; Han, M.M.; Zhou, J.Y.; Gong, L.; Niu, Y.M.; Zhang, Y.; He, L.D.; Zhang, L.Y. Development and optimization of a multiplex lateral flow immunoassay for the simultaneous determination of three mycotoxins in corn, rice and peanut. Food Chem. 2016, 213, 478–484. [Google Scholar] [CrossRef] [Scilit] [PubMed]
- Kolosova, A.Y.; De Saeger, S.; Sibanda, L.; Verheijen, R.; Van Peteghem, C. Development of a colloidal gold-based lateral-flow immunoassay for the rapid simultaneous detection of zearalenone and deoxynivalenol. Anal. Bioanal. Chem. 2007, 389, 2103–2107. [Google Scholar] [CrossRef] [Scilit] [PubMed]
- Liu, S.; Li, Y.; Yang, Y.; Li, X.; Wang, L.; Xiao, X.; Li, C.Z. Lateral flow analysis test strips based on aggregation-induced emission technique: Principle, design, and application. Biosens. Bioelectron. 2025, 272, 117058. [Google Scholar] [CrossRef] [Scilit] [PubMed]
- Halberstadt, D.; Giorni, P.; Barato, E.; Bertuzzi, T. Deoxynivalenol Determination Using Innovative Lateral Flow Device Technology. Toxins 2025, 17, 123. [Google Scholar] [CrossRef] [Scilit] [PubMed]
- Wang, J.; Fu, W.; Ma, X.; Chen, L.; Song, W.; Ling, S.; Qian, H.; Wang, S.; Zhuang, Z. Development of latex microsphere-based immunochromatographic strips for detecting key aflatoxins. Toxins 2025, 17, 426. [Google Scholar] [CrossRef] [Scilit] [PubMed]
- Widodo, O.S.; Etoh, M.; Kokushi, E.; Uno, S.; Yamato, O.; Pambudi, D.; Okawa, H.; Taniguchi, M.; Lamid, M.; Takagi, M. Practical application of urinary zearalenone monitoring system for feed hygiene management of a Japanese Black cattle breeding herd—The relationship between monthly anti-müllerian hormone and serum amyloid A concentrations. Toxins 2022, 14, 143. [Google Scholar] [CrossRef] [Scilit] [PubMed]
- Widodo, O.S.; Pambudi, D.; Etoh, M.; Kokushi, E.; Uno, S.; Yamato, O.; Taniguchi, M.; Lamid, M.; Takagi, M. Practical application of a urinary zearalenone monitoring system for feed hygiene management of a Japanese Black Cattle breeding herd—Relevance to anti-müllerian hormone and serum amyloid A clarified from a two-year survey. Toxins 2023, 15, 317. [Google Scholar] [CrossRef] [Scilit] [PubMed]
- Zhang, Y.; Xu, G.; Chen, X.; Hu, Z.; Ding, L.; Huang, X. Core-shell structured gold nanoparticle-AIEgen nanohybrids for enhanced dual-mode lateral flow immunoassay of fumonisin B1. Biosens. Bioelectron. 2025, 282, 117508. [Google Scholar] [CrossRef] [Scilit] [PubMed]
- Bryden, W.L. Mycotoxin contamination of the feed supply chain: Implications for animal productivity and feed security. Anim. Feed Sci. Technol. 2012, 173, 134–158. [Google Scholar] [CrossRef] [Scilit]

Disclaimer/Publisher’s Note: The statements, opinions and data contained in all publications are solely those of the individual author(s) and contributor(s) and not of MDPI and/or the editor(s). MDPI and/or the editor(s) disclaim responsibility for any injury to people or property resulting from any ideas, methods, instructions or products referred to in the content. |
© 2026 by the authors. Licensee MDPI, Basel, Switzerland. This article is an open access article distributed under the terms and conditions of the Creative Commons Attribution (CC BY) license.