


Abstract
Background/Objectives: No nutritional assessment method is accepted as a gold standard in pediatric oncology. We translated and culturally adapted Pediatric PG-SGA and SCAN into Turkish and evaluated content validity, 24-h test–retest reliability, and agreement with STRONGkids, anthropometry, and an AND/ASPEN-based definition of moderate-to-severe malnutrition; this is not a complete validation of all measurement properties. Methods: Cross-sectional study of 163 children aged 2 to <15 years with lymphoma or solid tumors, assessed at diagnosis or during the first three chemotherapy cycles. All instruments were completed within one encounter by the same unblinded dietitian; STRONGkids served as a comparator, not a gold standard. Results: Content validity was high for both instruments. Scores correlated strongly with STRONGkids (Spearman’s rho 0.919, 95% CI 0.885–0.943, and 0.852, 95% CI 0.794–0.895), but shared item content and a single data source mean these coefficients reflect that overlap rather than independent convergent validity. Relative test–retest reliability was high (ICC 0.994 and 0.980), although Pediatric PG-SGA scores rose significantly at retest and its smallest detectable change (1.91 points) exceeded the interval between the thresholds examined. At the externally validated SCAN cutoff of ≥3, agreement with STRONGkids was moderate (kappa 0.516); the higher kappa at ≥5 (0.877) reflects a threshold tuned to that comparator. Agreement with the AND/ASPEN definition was fair to moderate (kappa 0.176–0.447). Conclusions: Both instruments demonstrated content validity and high relative test–retest reliability and are usable for screening, but a positive screen is not a diagnosis of malnutrition, and no outcome benefit was evaluated. The exploratory ≥ 5 and ≥8 thresholds require confirmation in an independent population.
1. Introduction
Although pediatric malignancies (<15 years) are relatively rare, they remain an important cause of childhood morbidity and are among the leading causes of disease-related mortality in children beyond infancy [1,2]. As multimodal treatments have advanced and survival has improved, nutritional care has become an increasingly important component of supportive care and long-term morbidity management in pediatric oncology [3,4,5].
The prevalence of undernutrition in children with cancer varies according to the definition and method employed for nutritional assessment, tumor type and location, disease stage, treatment intensity, and dietary intake [3,6]. Malnutrition may adversely affect treatment tolerance, susceptibility to infection, and overall survival, while organomegaly and tumor masses can complicate weight-based assessment at diagnosis [3,4]. Malnutrition is particularly common in children with advanced disease or metastatic solid tumors and those receiving intensive treatment regimens [4].
Nutritional problems are multifactorial. Systemic inflammation, treatment toxicity, and reduced intake may contribute to sarcopenia and cancer-related malnutrition [7,8], although standardized pediatric sarcopenia criteria and a clearly defined phenotype analogous to adult cancer cachexia remain lacking [7,9]. Food aversion, feeding-related anxiety, and gastrointestinal symptoms—including anorexia, mucositis, constipation, vomiting, diarrhea, and dysgeusia—may further compromise intake and contribute to weight loss [5,10,11,12]. Regular nutritional assessment is therefore important for identifying children who may require intervention or be at risk of treatment-related toxicity [3,7].
Height and weight remain central to assessment, but tumor bulk, ascites, and treatment-related fluid overload can limit the reliability of weight-based indices [4,13,14]. Repeated monitoring is needed because assessment at diagnosis alone cannot capture subsequent nutritional changes [15,16]. Anthropometric indices, including body mass index (BMI) and weight-for-height, use different percentile, Z-score, ratio, or percentage thresholds [17]. However, anthropometry alone inadequately characterizes body composition and dietary intake, while the lack of an accepted reference definition of malnutrition limits comparisons across studies [4,14,18,19].
Most pediatric nutritional screening tools were developed for general populations and may not adequately capture cancer-specific factors [10,20]. The Screening Tool for Risk on Nutritional Status and Growth (STRONGkids), developed for general nutritional risk screening in hospitalized children, has been evaluated in Turkish pediatric populations [21,22] and is used in clinical practice in Türkiye. These considerations supported its selection as the comparator in this study. However, few screening tools have been developed specifically for pediatric oncology [10,23]. For example, the nutrition screening tool for childhood cancer (SCAN) evaluates nutritional risk in pediatric oncology, whereas the Pediatric Patient-Generated Subjective Global Assessment (Pediatric PG-SGA) enables a more comprehensive assessment of current nutritional status in children with cancer. SCAN includes cancer-related risk, treatment intensity, gastrointestinal symptoms, oral intake, weight loss, and clinical signs of undernutrition, whereas Pediatric PG-SGA incorporates medical history, dietary intake, symptoms, functional status, metabolic stress, and physical examination findings [18,20]. These instruments provide information on nutritional risk and clinical nutritional status but do not independently establish a definitive diagnosis of malnutrition.
Although a recent study evaluated the clinical utility of SCAN in Turkish pediatric oncology patients [24], three gaps remain. First, the four-category Pediatric PG-SGA has not been formally translated and culturally adapted into Turkish for this population, to our knowledge. Second, SCAN and Pediatric PG-SGA have not been evaluated concurrently in the same pediatric oncology cohort, leaving uncertainty about whether these instruments identify the same children as nutritionally vulnerable. Third, their relationships with STRONGkids and anthropometric indicators remain insufficiently characterized.
The primary aim of this study was to evaluate the Turkish versions of SCAN and Pediatric PG-SGA in children with cancer through cultural adaptation, assessment of selected measurement properties, and comparison of their nutritional classifications with other screening and anthropometric approaches. Specifically, the objectives were as follows: (i) to translate and culturally adapt Pediatric PG-SGA and SCAN into Turkish and evaluate the content validity and short-term test–retest reliability of the Turkish versions, as well as their agreement with STRONGkids, in children with cancer; (ii) to describe and compare nutritional risk and malnutrition classifications obtained using SCAN, Pediatric PG-SGA, and STRONGkids; and (iii) to compare these classifications with World Health Organization (WHO)-based and other age-appropriate anthropometric indicators, as well as with an Academy of Nutrition and Dietetics/American Society for Parenteral and Enteral Nutrition (AND/ASPEN)-based operational definition of moderate-to-severe malnutrition.
2. Materials and Methods
2.1. Study Design, Setting, and Population
This cross-sectional study was conducted at Hacettepe University Oncology Hospital between March 2020 and August 2021. It included 163 children aged 2 to <15 years (observed range, 2.0–14.9 years) with lymphoma or solid tumors, assessed either before chemotherapy initiation at diagnosis or during the first three chemotherapy cycles. The exclusion criteria were major comorbidities that could independently affect nutritional status (e.g., diabetes mellitus), as documented in medical records; completion of four or more chemotherapy cycles; inability to take oral feeds; and diagnoses other than lymphoma or solid tumors. Patients with leukemia were excluded because they were not followed at Hacettepe University Oncology Hospital, where the study was conducted. Children unable to take oral feeds were excluded because the instruments contain oral intake items that could not be assessed under the study protocol when oral feeding was replaced by enteral or parenteral nutrition. This restriction may have excluded children at particularly high nutritional risk and limits the generalizability of the findings to orally fed patients. The age range of 2 to <15 years was selected to reduce heterogeneity related to growth and nutritional assessment during infancy and to align with the conventional age grouping used in childhood cancer epidemiology.
The study was reported in accordance with the STROBE statement for cross-sectional studies [25]. Where applicable, the COSMIN terminology was used to describe the measurement properties evaluated [26]. The sample size was calculated a priori using G*Power 3.1 for a two-sided correlation test (ρ0 = 0.20, ρ1 = 0.40, α = 0.05, power = 80%), yielding a required sample size of 163 participants, which was achieved. Consecutive enrollment was intended but could not be verified retrospectively because screening logs were not maintained; screening and exclusion counts were therefore unavailable. Supplementary Figure S1 depicts the 163 enrolled children and their assessment timing rather than a complete participant flow diagram. The sample size calculation did not establish statistical power for agreement or threshold analyses.
2.2. Ethical Considerations
The study was conducted in accordance with the principles of the Declaration of Helsinki. Written informed consent was obtained from parents or legal guardians, and verbal assent was obtained from children who were developmentally capable of providing assent before enrollment. The study was approved by the Clinical Research Ethics Committee of Acıbadem Mehmet Ali Aydınlar University (approval date: 27 February 2020; approval no.: 2020-03/29). Institutional permission was obtained from the Directorate of Hacettepe University Oncology Hospital. Permission to use STRONGkids, SCAN, and Pediatric PG-SGA was obtained via email from the respective instrument developers.
2.3. Data Collection and Instrument Procedures
Sociodemographic and clinical data were obtained from caregiver interviews and medical records. Using the Neyzi classification, socioeconomic status was categorized as high (groups 1–3) or low (groups 4–5) based on parental education and paternal occupation [27]. Chemotherapy intensity was classified as low-to-moderate or intensive by the treating pediatric oncologist according to the planned treatment regimen and disease-related risk characteristics. Intensive chemotherapy was planned for patients with a high risk of relapse, locally advanced or metastatic disease, or sarcomas. Albumin, total protein, and hemoglobin values were obtained from routine clinical laboratory records and classified using the hospital laboratory’s pediatric age- and, where applicable, sex-specific reference ranges. The reference ranges used for classification are presented in Supplementary Table S3.
The Turkish versions of SCAN and Pediatric PG-SGA were developed through independent forward translation by three bilingual experts, review by a panel of 10 dietitians, back-translation by an independent bilingual translator unfamiliar with the original instruments, and comparison with the original versions. Experts rated the clarity and relevance of 108 translated elements (99 for Pediatric PG-SGA and 9 for SCAN), including instructions and response options, on a 0–100 scale, where 0 indicated that an element was entirely unclear or irrelevant and 100 indicated that it was completely clear and fully relevant; ratings ≥ 80 were considered acceptable. I-CVI was calculated as the proportion of experts assigning ratings ≥ 80, S-CVI/Ave as the mean I-CVI, and S-CVI/UA as the proportion of elements rated acceptable by all experts. Because this approach differs from the conventional four-point relevance scale, established CVI and modified kappa thresholds were applied by analogy rather than direct equivalence. Item-level results are presented in Supplementary Table S6, with further methodological details in Supplementary File S2 (COSMIN reporting table). The final versions were pilot-tested with 10 children and their caregivers, and no further modifications were required.
For the between-instrument comparisons, STRONGkids, which has previously been evaluated in Turkish children, was concurrently administered with SCAN and Pediatric PG-SGA [21,22]. As no universally accepted diagnostic reference standard exists for nutritional risk or malnutrition in pediatric oncology, STRONGkids was employed as a comparator rather than a diagnostic gold standard. STRONGkids assigns a fixed two points for malignancy, restricting its score range in this exclusively oncological cohort. Furthermore, the instruments share item content (weight loss, oral intake, gastrointestinal symptoms, and clinical impression) and were completed using the same interview and records. Thus, their correlations and agreement cannot be interpreted as independent evidence of convergent validity. Comparisons included correlations, positive and negative percent agreement, and Cohen’s kappa. The percentage agreement measures are numerically equivalent to the corresponding sensitivity, specificity, and predictive value measures, but relabelling does not change their values. ROC areas were reported only as descriptive measures of how well one instrument’s scores distinguished classifications defined by another screening instrument. Without a diagnostic reference standard, these measures cannot establish diagnostic accuracy or criterion validity.
For Pediatric PG-SGA, information was directly obtained from children who were developmentally capable of understanding and answering the questions. For younger children and those unable to independently complete the patient-reported components, the relevant information was provided by a parent or primary caregiver. The trained dietitian assisted with questionnaire completion when needed and completed the clinician-rated components using interview data, medical records, and physical examination findings.
All three instruments were administered during the same encounter by one trained dietitian. Assessors were not blinded to the other instruments, which may have increased the observed agreement. Furthermore, inter-rater reliability was not evaluated as the same dietitian completed all instruments. Test–retest reliability was evaluated in a convenience subgroup of 50 participants reassessed by the same dietitian after 24 h under comparable conditions. The 24-h interval was selected to reduce the likelihood of major clinical change. However, recall effects and short-term fluctuations in symptoms and dietary intake during chemotherapy could not be excluded. The baseline demographic characteristics and instrument scores in this subgroup did not significantly differ from those of the remaining participants.
2.4. Nutritional Assessment Instruments
STRONGkids (Screening Tool for Risk on Nutritional Status and Growth) is a 4-item nutritional-risk screening tool for children aged 1 month to 18 years. Total scores range from 0 to 5 (0 = low risk, 1–3 = moderate risk, 4–5 = high risk) [21].
SCAN (nutrition screening tool for childhood cancer) is a six-item screening instrument specifically developed for pediatric oncology. It assesses the cancer risk category, treatment intensity, gastrointestinal symptoms, oral intake during the previous week, weight loss during the previous month, and clinical signs of undernutrition. Total scores range from 0 to 10, with the original nutritional-risk threshold being ≥3 points [20].
Pediatric PG-SGA (Pediatric Patient-Generated Subjective Global Assessment) is a simplified pediatric adaptation of the adult PG-SGA. It evaluates disease type and stage, weight, food intake, symptoms, activity and function, metabolic stress, and physical examination findings. The version used herein was the four-category pediatric adaptation described by Vázquez de la Torre et al. [18], which classifies nutritional status as A (well-nourished), B (mildly malnourished), C (moderately malnourished), or D (severely malnourished). For descriptive analyses, categories B–D were combined to indicate malnutrition. A total score ≥ 9 indicates a critical need for symptom management and/or nutritional intervention; it was not used as a diagnostic threshold for malnutrition [18,28].
2.5. Anthropometric Measurements
Weight and height were measured using standardized procedures. Mid-upper arm circumference (MUAC) was measured using a nonstretch tape and triceps skinfold thickness (TSF) using a Holtain skinfold caliper (Holtain Ltd., Crymych, UK). Body mass index (BMI) was calculated as weight in kilograms divided by height in meters squared (kg/m2).
BMI-for-age and height-for-age Z-scores were calculated using WHO growth references, with WHO Anthro version 3.2.2 (World Health Organization, Geneva, Switzerland) used for children aged 2–4.9 years and WHO AnthroPlus version 1.0.4 (World Health Organization, Geneva, Switzerland) for those aged 5–14.9 years [29,30]. A BMI-for-age Z-score < −2 SD was used to indicate undernutrition, whereas a height-for-age Z-score < −2 SD was reported separately as an indicator of impaired linear growth [13].
MUAC and TSF were interpreted using published Turkish age- and sex-specific reference data for children and adolescents aged 1–17 years [31,32,33], as the WHO reference data for these measures do not encompass the entire age range of the study population. Participants were classified as below the 10th percentile by directly comparing their MUAC and TSF measurements with the corresponding age- and sex-specific 10th percentile values from the Turkish reference data. The 10th percentile was selected as an operational threshold based on its use in previous pediatric oncology research [13], in the absence of a universally accepted anthropometric definition of malnutrition in this population. Anthropometric undernutrition was defined as a BMI-for-age Z-score < −2 SD and/or MUAC or TSF below the 10th percentile.
2.6. AND/ASPEN-Based Operational Definition of Malnutrition
In a post hoc parallel comparison added during revision, malnutrition severity was classified using an operational approach based on the pediatric AND/ASPEN consensus indicators [34]. BMI-for-age Z-scores and percentage weight loss were separately graded according to the consensus criteria; the operational thresholds used in this study are presented in Supplementary Table S2. Previous body weight for calculating percentage weight loss was obtained from medical records and, when a measured weight from an appropriate time point was unavailable, from a caregiver report. Weight-loss magnitude and duration were recorded for children with reported weight loss. Children without reported weight loss were assigned a weight-loss grade of zero for the operational AND/ASPEN classification. The combined AND/ASPEN grade was determined as the higher of the BMI-for-age Z-score grade and the weight-loss grade. Children with combined grades of moderate or severe malnutrition were classified as having AND/ASPEN-based moderate-to-severe malnutrition. This definition was used as an additional operational comparator and not as a definitive diagnostic gold standard. Because it was based only on BMI-for-age Z-scores and percentage weight loss, it did not encompass the full range of pediatric AND/ASPEN malnutrition indicators.
2.7. Statistical Analysis
Data were analyzed using SPSS version 27.0 (IBM Corp., Armonk, NY, USA), with additional syntax and bootstrap procedures where necessary. Continuous variables were expressed as mean ± standard deviation and categorical variables as frequencies and percentages. Complete instrument, anthropometric, and laboratory data were available for all 163 participants; no variable required imputation, and all analyses were performed on complete cases. Language and content validity were evaluated through expert review, back-translation, item-level content validity indices (I-CVI), and scale-level content validity indices (S-CVI/Ave and S-CVI/UA). Associations between instrument scores were assessed using Spearman’s rank correlation, with 95% confidence intervals calculated using the Bonett–Wright method because of the ordinal nature and extensive ties in STRONGkids scores. SCAN and Pediatric PG-SGA were also compared directly using Spearman correlation for total scores and Cohen’s kappa for categorical classifications. Agreement between categorical classifications was assessed using unweighted Cohen’s kappa for dichotomous comparisons. Test–retest reliability was evaluated using ICC(2,1) (two-way random-effects model, absolute agreement, single measures), Bland–Altman analysis, and paired comparisons using the Wilcoxon signed-rank test. ICC values were interpreted according to Koo and Li [35].
To assess SCAN and Pediatric PG-SGA relative to STRONGkids, statistical analyses focused on correlation and agreement measures, including positive/negative percent agreement and Cohen’s kappa, rather than conventional diagnostic accuracy metrics. Threshold analyses were exploratory and not intended to establish diagnostic cut-offs. Receiver operating characteristic analyses were employed to explore score thresholds exhibiting the closest agreement with STRONGkids-defined high nutritional risk. Bootstrap resampling was used to assess the stability of threshold selection across 1000 participant-level resamples, rather than to obtain optimism-corrected estimates of diagnostic performance. In each bootstrap sample, the evaluated threshold yielding the highest Cohen’s kappa for agreement with STRONGkids-defined high nutritional risk was considered reselected. Candidate thresholds were ≥3, ≥4, and ≥5 for SCAN and ≥8 and ≥9 for Pediatric PG-SGA. When multiple thresholds yielded the same maximum Cohen’s kappa, the lower threshold was selected. For Pediatric PG-SGA, these analyses were based on the total score used for triage and did not replace the A–D global rating used to classify nutritional status. For the ROC analyses against the AND/ASPEN-based operational definition, 95% confidence intervals for the AUCs were estimated using 10,000 stratified bootstrap resamples and the percentile method.
For the AND/ASPEN-based operational definition of moderate-to-severe malnutrition, sensitivity, specificity, predictive values, and Cohen’s kappa were calculated. Diagnostic accuracy terminology was used for this comparison, as the AND/ASPEN-based definition represents an operational definition of malnutrition rather than a screening instrument; comparisons with STRONGkids are reported as measures of agreement throughout. Anthropometric classifications were descriptively compared with those obtained using SCAN, Pediatric PG-SGA, and STRONGkids. The distribution of continuous variables was evaluated using the Shapiro–Wilk test and visual inspection of histograms. McNemar’s test was employed to examine systematic differences between paired classifications. Independent-samples t-tests and chi-squared tests, with Yates’ correction where appropriate, were employed for subgroup comparisons. All tests were two-sided, with p < 0.05 considered to indicate statistical significance. For the main agreement and classification indices, 95% confidence intervals were calculated.
As an exploratory subgroup analysis, agreement between SCAN and STRONGkids and between Pediatric PG-SGA and STRONGkids was assessed separately in children aged 2.0–6.9 and 7.0–14.9 years using Cohen’s kappa coefficients. The analyses included the original SCAN cutoff (≥3), the exploratory cutoff (≥5), and Pediatric PG-SGA categories B–D. Age-stratified agreement estimates were interpreted descriptively, without formal testing of between-group differences.
The completed STROBE checklist and COSMIN-based reporting table are provided as Supplementary Files S1 and S2, respectively. The participant flow diagram and cross-classification tables are presented in Supplementary Figure S1 and Supplementary Table S1, respectively.
3. Results
3.1. Validity and Reliability
Content validity was high for both Turkish instruments. For Pediatric PG-SGA, the I-CVI values ranged from 0.80 to 1.00, with an S-CVI/Ave of 0.996 and an S-CVI/UA of 0.970. For SCAN, the I-CVI values ranged from 0.90 to 1.00, with an S-CVI/Ave of 0.989 and an S-CVI/UA of 0.889. All 108 translated elements met the prespecified I-CVI ≥ 0.80 criterion. Full agreement among all ten experts was reached for 104 elements; the remaining four were rated acceptable by eight or nine experts and retained after minor rewording (Supplementary Table S6).
STRONGkids total scores ranged from 2 to 5. Scores of 2, 3, 4, and 5 were observed in 47 (28.8%), 37 (22.7%), 45 (27.6%), and 34 (20.9%) children, respectively. SCAN and Pediatric PG-SGA scores were strongly correlated with STRONGkids (Spearman’s ρ = 0.919, 95% CI 0.885–0.943, and ρ = 0.852, 95% CI 0.794–0.895, respectively; both p < 0.001; n = 163) (Table 1). These correlations should be interpreted considering the restricted STRONGkids score range and shared item content and data sources.
Table 1.
Spearman’s rank correlations of SCAN and Pediatric PG-SGA scores with STRONGkids scores (n = 163).
SCAN and Pediatric PG-SGA total scores were strongly correlated (Spearman’s ρ = 0.886, 95% bootstrap CI 0.842–0.917; p < 0.001). Agreement between SCAN ≥ 3 and Pediatric PG-SGA categories B–D versus A was moderate (Cohen’s κ = 0.559, 95% bootstrap CI 0.441–0.674).
The agreement of SCAN classifications with STRONGkids-defined high nutritional risk is shown in Table 2. Among the evaluated SCAN thresholds (≥3, ≥4, and ≥5), ≥5 exhibited the closest agreement (κ = 0.877; Table 2) and was reselected in 100% of bootstrap resamples. At this threshold, 83 children (50.9%) were flagged, compared with 119 (73.0%) at the original ≥3 threshold. The area under the ROC curve against STRONGkids-defined high nutritional risk was 0.974 (95% CI 0.950–0.991), reflecting between-instrument concordance rather than diagnostic accuracy because STRONGkids is not a reference standard.
Table 2.
Agreement of SCAN cutoff scores with STRONGkids-defined high nutritional risk.
Among the two evaluated Pediatric PG-SGA total-score thresholds (≥8 and ≥9), ≥8 showed slightly higher agreement with STRONGkids-defined high nutritional risk and was selected in all 1000 bootstrap resamples (Table 3). However, this reselection rate does not provide independent evidence favoring ≥8, as the thresholds differ by only one STRONGkids high-risk child, whose inclusion adds one true positive without increasing false positives. The 396 resamples with tied kappa values occurred when this child was not selected, consistent with the expected probability of approximately 0.37. Thus, the bootstrap procedure cannot meaningfully distinguish between these thresholds. The A–D global classification, with categories B–D combined as malnutrition, showed similar agreement (κ = 0.792). The corresponding ROC area was 0.967 (95% CI 0.941–0.988), describing agreement with the screening comparator rather than diagnostic accuracy. The two ROC areas were not formally compared because no test for correlated ROC curves was performed.
Table 3.
Agreement of pediatric PG-SGA score thresholds with STRONGkids-defined high nutritional risk.
In exploratory age-stratified analyses, agreement with STRONGkids-defined high nutritional risk was numerically higher among children aged 7.0–14.9 years (n = 78) than those aged 2.0–6.9 years (n = 85). Kappa values were 0.472 (95% CI 0.330–0.634) and 0.559 (95% CI 0.378–0.723) for SCAN ≥ 3; 0.834 (95% CI 0.700–0.929) and 0.922 (95% CI 0.819–1.000) for SCAN ≥ 5; and 0.743 (95% CI 0.601–0.878) and 0.845 (95% CI 0.718–0.949) for Pediatric PG-SGA categories B–D, respectively (Supplementary Table S5). Confidence intervals overlapped, and between-group differences were not formally tested.
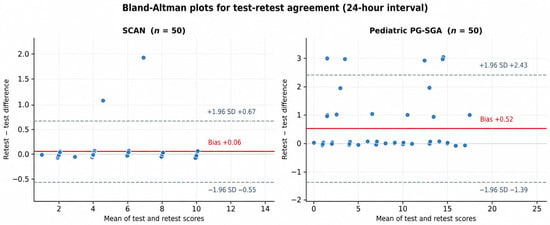
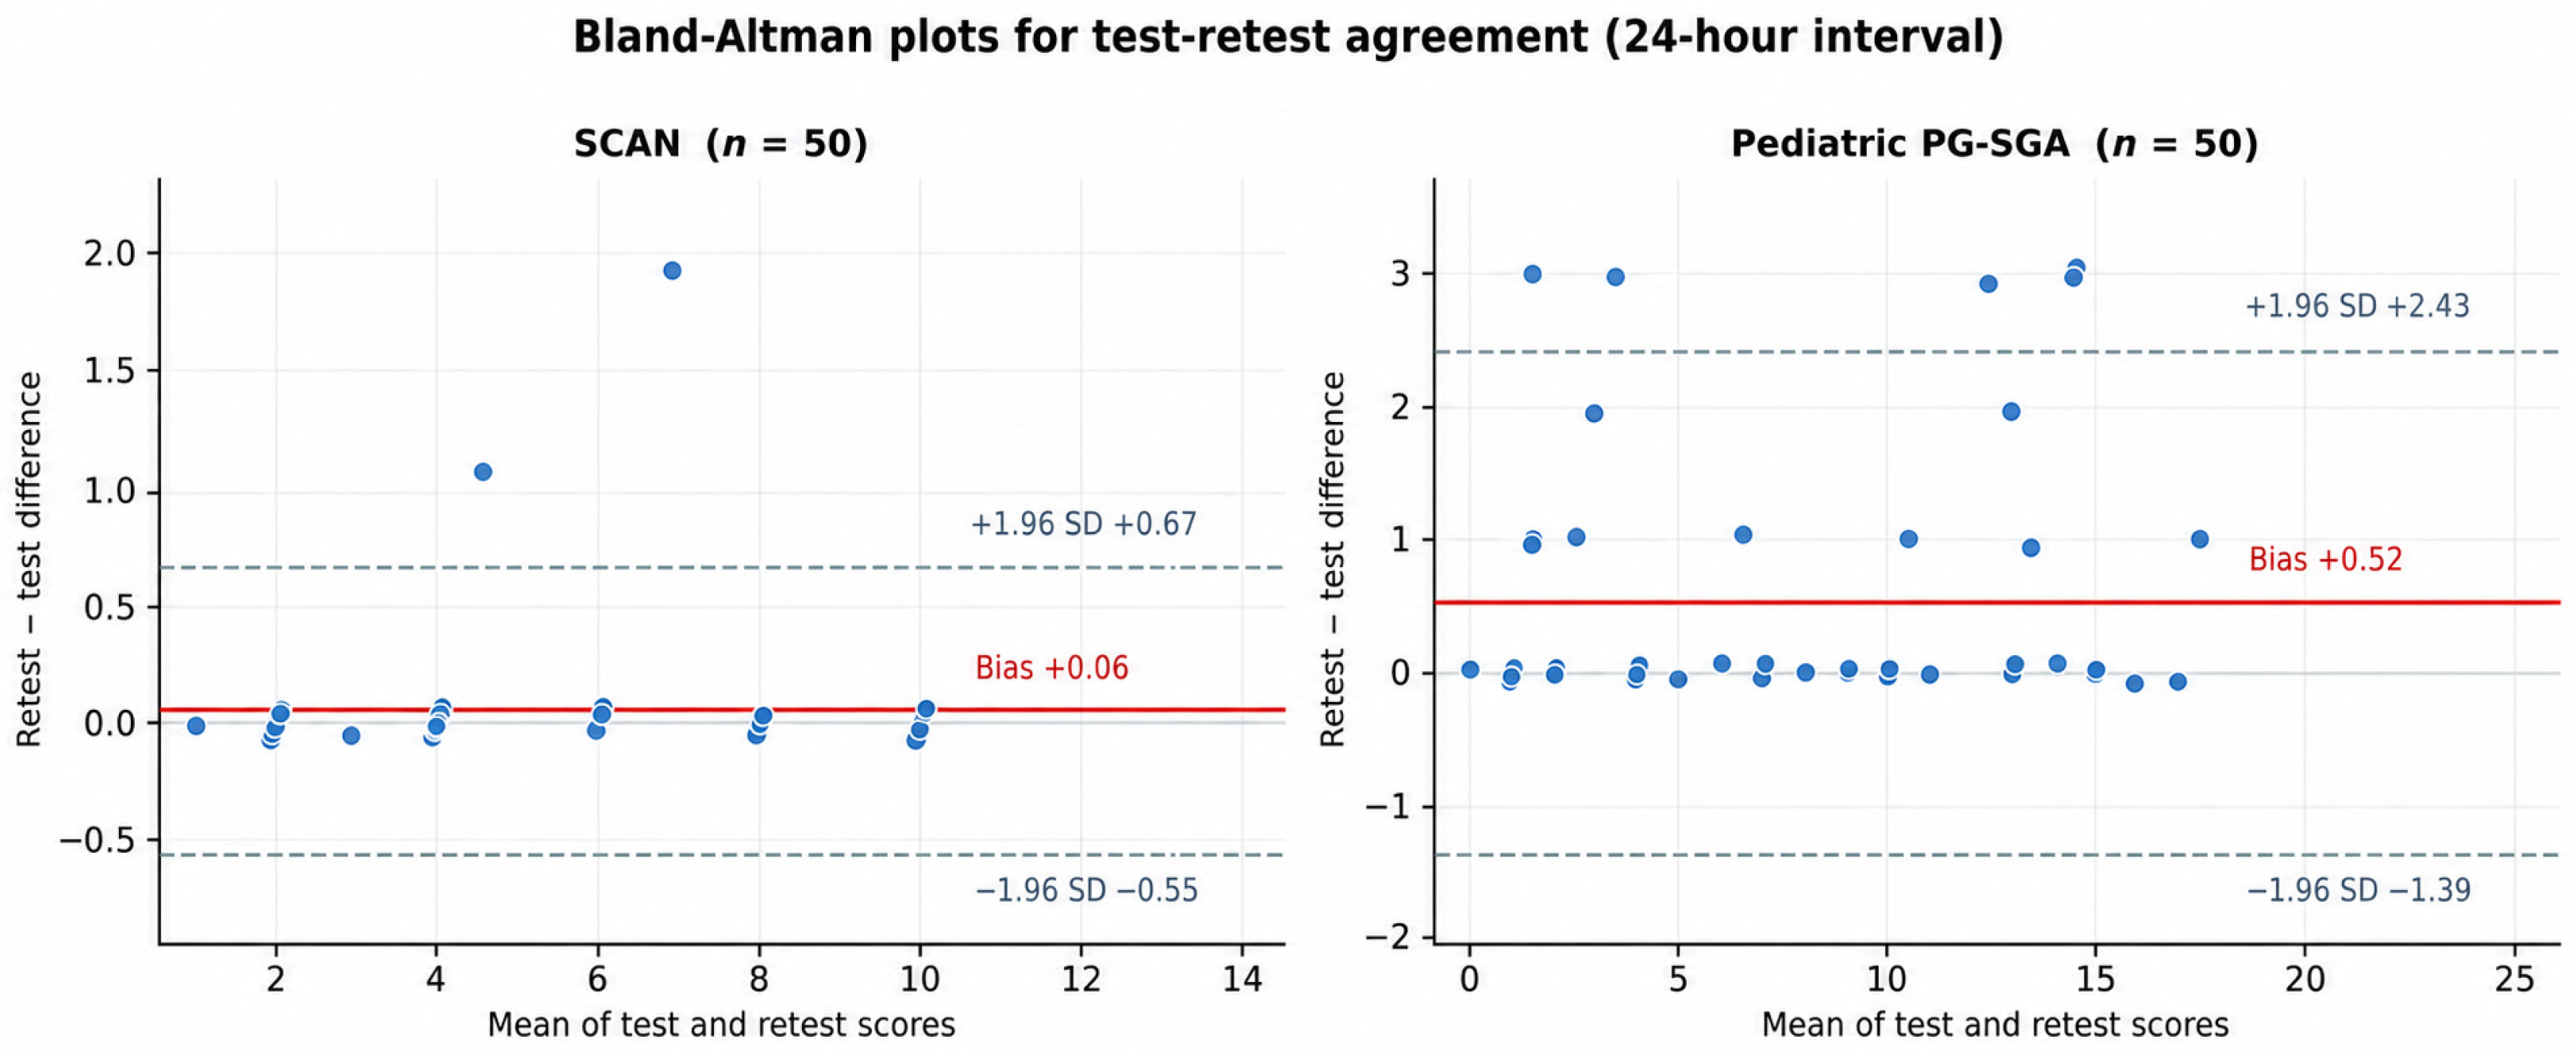
Among 50 participants reassessed after 24 h, test–retest reliability was high for SCAN (ICC = 0.994, 95% CI 0.990–0.997) and Pediatric PG-SGA (ICC = 0.980, 95% CI 0.951–0.990). Bland–Altman mean differences (retest minus test) were 0.06 (95% limits of agreement −0.55 to 0.67) and 0.52 (−1.39 to 2.43), respectively (Figure 1). Wilcoxon tests showed no significant difference for SCAN (p = 0.180), but higher Pediatric PG-SGA scores at retest (p < 0.001). The standard errors of measurement and smallest detectable changes were 0.22 and 0.61 points for SCAN, and 0.69 and 1.91 points for Pediatric PG-SGA, respectively. The latter exceeds the one-point difference between the exploratory ≥ 8 and ≥9 thresholds. STRONGkids test–retest data were unavailable. Classifications remained unchanged in all 50 participants at SCAN ≥3 and across Pediatric PG-SGA global categories (A–D).
Figure 1.
Bland–Altman plots of test–retest agreement for SCAN (left) and Pediatric PG-SGA (right) in 50 children reassessed after 24 h. Differences were calculated as a retest minus test. Solid lines denote the mean difference (bias), whereas dashed lines denote the 95% limits of agreement.
In the parallel analysis, 37 of 163 participants (22.7%) met the combined AND/ASPEN-based operational definition of moderate-to-severe malnutrition. Agreement with this definition ranged from κ = 0.176 to 0.447 (Table 4). At the original ≥3 threshold, SCAN showed high sensitivity (97.3%) but limited specificity (34.1%), whereas Pediatric PG-SGA categories C/D showed lower sensitivity (45.9%) and higher specificity (93.7%). ROC areas were 0.779 (95% CI 0.698–0.850) for SCAN and 0.799 (95% CI 0.715–0.872) for Pediatric PG-SGA (Supplementary File S2), reflecting discrimination against an operational anthropometric definition rather than a diagnostic reference standard. Results using BMI-for-age Z-score < −2 SD alone are presented in Supplementary Table S1.
Table 4.
Classification characteristics of SCAN, Pediatric PG-SGA, and STRONGkids in relation to the combined AND/ASPEN-based operational definition of moderate-to-severe malnutrition (n = 37/163, 22.7%).
In exploratory analyses stratified by treatment status, agreement with STRONGkids-defined high nutritional risk was assessed in treatment-naive children (n = 102) and those who had started chemotherapy (n = 61). Kappa values were 0.597 and 0.370 for SCAN ≥ 3, 0.921 and 0.803 for SCAN ≥ 5, and 0.804 and 0.770 for Pediatric PG-SGA categories B–D, respectively. Among inpatients (n = 98) and outpatients (n = 65), corresponding values were 0.469 and 0.581, 0.898 and 0.846, and 0.816 and 0.755, respectively. These findings were interpreted descriptively without formal between-group comparisons.
3.2. General Characteristics of the Study Population
The study included 163 children with a mean age of 7.55 ± 4.15 years, of whom 96 (58.9%) were boys. Participants were distributed relatively evenly between the 2.0–6.9-year (52.1%) and 7.0–14.9-year (47.9%) age groups, while 55.8% were classified as having low socioeconomic status. Additional demographic characteristics are presented in Table 5. No children were excluded due to major comorbidities.
Table 5.
Sociodemographic characteristics of the study population.
3.3. Disease-Related and Biochemical Findings
At the time of assessment, 98 participants (60.1%) were inpatients. The most common diagnoses were central nervous system tumors (23.3%), lymphoma (21.5%), and soft-tissue sarcomas (15.3%) (Table 6). At assessment, 102 children (62.6%) were treatment-naïve, and 61 (37.4%) had undergone one to three chemotherapy cycles. Among the 61 children who had started chemotherapy, 65.6% had received low-to-moderate-intensity treatment and 34.4% had received intensive treatment.
Table 6.
Distribution of patients by diagnosis.
Albumin, total protein, and hemoglobin measurements were available for all participants. The mean albumin and total protein concentrations were 4.2 ± 0.5 and 7.0 ± 0.6 g/dL, respectively. Using the hospital laboratory’s pediatric age- and, where applicable, sex-specific reference ranges, low albumin, low total protein, and low hemoglobin were observed in 8.6%, 4.9%, and 42.3% of participants, respectively.
3.4. Anthropometric Findings
Anthropometric measurements are shown in Table 7. Impaired linear growth, defined as a height-for-age Z-score < −2 SD, was reported in 12 participants (7.4%). Undernutrition was identified in 17 participants (10.4%) based on a BMI-for-age Z-score < −2 SD, in 34 (20.9%) based on MUAC below the 10th percentile, and in 10 (6.1%) based on TSF below the 10th percentile (Table 8). Overall, 43 participants (26.4%) met the combined anthropometric definition of undernutrition (BMI-for-age Z-score < −2 SD and/or MUAC or TSF below the 10th percentile).
Table 7.
Descriptive anthropometric measurements by sex.
Table 8.
Prevalence of anthropometric indicators of undernutrition and impaired linear growth.
3.5. Findings Related to the Nutritional Screening Instruments
The mean scores and nutritional classifications for each instrument are presented in Table 9. According to STRONGkids, 51.5% of participants were classified as being at moderate risk and 48.5% as being at high risk; none were classified as being at low risk. Using the original threshold of ≥3 points, SCAN classified 119 participants (73.0%) as being at nutritional risk. Pediatric PG-SGA classified 47.2% as well-nourished (category A), 37.4% as mildly malnourished (B), 14.1% as moderately malnourished (C), and 1.2% as severely malnourished (D).
Table 9.
Mean scores and nutritional risk/malnutrition classifications according to STRONGkids, SCAN, and Pediatric PG-SGA (n = 163).
Among the 17 participants with a BMI-for-age Z-score < −2 SD, 16 (94.1%) were classified as being at nutritional risk by SCAN, 14 (82.4%) as being malnourished by Pediatric PG-SGA, and 13 (76.5%) as being at high nutritional risk by STRONGkids.
All three instruments classified more children as nutritionally at risk or malnourished than BMI-for-age Z-score < −2 SD, with significant differences in exact McNemar tests (all p < 0.001). Classification characteristics are presented in Table 10, with the underlying 2 × 2 tables in Supplementary Table S1. All instruments showed high sensitivity but low specificity against this anthropometric criterion, with low kappa values (0.065–0.120), although their confidence intervals excluded zero. These findings should be interpreted considering the substantial prevalence imbalance (10.4% for BMI-for-age Z-score < −2 SD versus 73.0% for SCAN ≥3), which constrains kappa independently of construct differences. The prevalence and bias indices were 0.166 and 0.626 for SCAN ≥ 3, 0.368 and 0.423 for Pediatric PG-SGA categories B–D, and 0.411 and 0.380 for STRONGkids high risk, respectively. Three of the 17 children with BMI-for-age Z-score < −2 SD were classified as well nourished (category A) by Pediatric PG-SGA, indicating that this classification does not necessarily exclude anthropometric undernutrition.
Table 10.
Classification characteristics of SCAN, Pediatric PG-SGA, and STRONGkids in relation to BMI-for-age Z-score < −2 SD (n = 17/163, 10.4%).
PPV, positive predictive value; NPV, negative predictive value; CI, confidence interval. Values were derived from the 2 × 2 cross-classifications in Supplementary Table S1. Confidence intervals for sensitivity, specificity, PPV, and NPV were calculated using the Clopper–Pearson exact method, and those for Cohen’s kappa using the non-null asymptotic standard error, the same estimator applied in Table 2, Table 3 and Table 4. Exact McNemar tests for the discordant pairs are reported in Supplementary Table S1. Diagnostic accuracy terminology is used here because BMI-for-age Z-score < −2 SD is an anthropometric criterion rather than a screening instrument; it does not imply that this criterion is a diagnostic gold standard for malnutrition.
Using published Turkish age- and sex-specific reference values, 34 children (20.9%) had MUAC below the 10th percentile. Against this criterion, sensitivity and specificity were 91.2% (95% CI 76.3–98.1%) and 31.8% (95% CI 23.9–40.6%) for SCAN ≥ 3; 76.5% (95% CI 58.8–89.3%) and 53.5% (95% CI 44.5–62.3%) for Pediatric PG-SGA categories B–D; and 76.5% (95% CI 58.8–89.3%) and 58.9% (95% CI 49.9–67.5%) for STRONGkids-defined high nutritional risk, respectively.
The combined anthropometric definition (BMI-for-age Z-score < −2 SD and/or MUAC or TSF below the 10th percentile) identified 43 children (26.4%). Sensitivity and specificity were 90.7% and 33.3% for SCAN ≥ 3, 76.7% and 55.8% for Pediatric PG-SGA categories B–D, and 74.4% and 60.8% for STRONGkids-defined high nutritional risk, respectively. These descriptive comparisons do not establish diagnostic accuracy against an independent reference standard.
Nutritional classifications were not significantly associated with sex, age group, Neyzi-classified socioeconomic status, or chemotherapy exposure. Among the 61 participants who had initiated chemotherapy, no statistically significant associations were observed between chemotherapy intensity and nutritional classifications (Supplementary Table S4).
4. Discussion
In this study, the Turkish versions of SCAN and Pediatric PG-SGA showed strong score correlations with STRONGkids and high relative test–retest reliability, while categorical agreement varied by instrument and cutoff. Nutritional assessment is essential in pediatric oncology as the disease and its treatment may affect food intake, body weight, and body composition. However, no single method has been established as a gold standard for defining malnutrition in children with cancer [3,15].
4.1. Interpretation of Validity and Reliability Findings
In our cohort, SCAN and Pediatric PG-SGA scores correlated strongly with STRONGkids scores. However, overlapping content, administration during the same encounter by one unblinded dietitian using shared interview and record data, and the restricted STRONGkids score range limit interpretation. These correlations reflect, at least in part, shared content and data sources rather than independent evidence of convergent validity. Previous studies support SCAN as a valid and practical tool for identifying nutritional risk in children with cancer [20,36]. Agreement with STRONGkids was moderate at the original ≥3 cutoff (κ = 0.516) and higher at ≥5 (κ = 0.877), which was selected in all bootstrap resamples. However, ≥5 was optimised against STRONGkids and is not necessarily clinically preferable. Against the AND/ASPEN-based definition, sensitivity was 97.3% at ≥3 and 89.2% at ≥5, with modest agreement at ≥5 (κ = 0.344). The sensitivities were not formally compared using a paired test, and their confidence intervals overlapped widely. Thus, ≥3 remains the threshold supported for practice, whereas ≥5 requires external evaluation. Prospective evidence also supports repeated screening throughout treatment, as assessment at diagnosis alone may miss subsequent malnutrition [19].
Our findings are consistent with those of Kangalgil et al. [24], who reported that SCAN is a sensitive tool for nutritional risk identification in Turkish children with cancer. Our study extends this evidence by concurrently evaluating the translation, cultural adaptation, content validity, and short-term reliability of SCAN and Pediatric PG-SGA. Vázquez de la Torre et al. evaluated a simplified Pediatric PG-SGA in 70 children recently diagnosed with cancer and reported a malnutrition prevalence of 21.4%, with moderate concordance between the global rating and anthropometric indicators [18]. The higher proportion in our cohort—52.8% in categories B–D—may reflect differences in diagnostic composition, assessment at diagnosis or during early chemotherapy, and malnutrition definitions. The incomplete correspondence with anthropometry in both studies supports Pediatric PG-SGA as a complementary assessment rather than a stand-alone diagnostic tool. The exploratory total-score threshold of ≥8 was consistently selected across bootstrap resamples under the prespecified selection rule but requires external validation.
Agreement with the AND/ASPEN-based operational definition of moderate-to-severe malnutrition was fair to moderate [34], indicating that high agreement with STRONGkids should not be interpreted as diagnostic accuracy for malnutrition. Positive screening results should prompt comprehensive nutritional evaluation rather than establish a diagnosis. SCAN’s higher sensitivity and lower specificity at the original ≥3 cutoff were consistent with Murphy et al. [20]. Numerical age-stratified differences in agreement with STRONGkids-defined high nutritional risk were not formally tested and do not establish age-specific validity.
Both instruments showed high relative test–retest reliability, but ICCs and Bland–Altman results should be interpreted together. ICCs reflect relative ranking and depend on between-child variability, whereas Bland–Altman analysis assesses individual-level agreement. SCAN showed negligible systematic bias, while Pediatric PG-SGA scores increased significantly despite unchanged classifications. Mean differences were 0.06 and 0.52 points, respectively; small changes may affect decisions near score thresholds. The 24-h retest interval falls within the interval range identified in a systematic review of instrument-validation studies involving adults with cancer receiving palliative care [37]. Nevertheless, symptoms and dietary intake may change rapidly during pediatric chemotherapy, while the short interval may also allow recall of previous responses and inflate agreement. The observed differences may therefore reflect both measurement variability and genuine clinical change. High ICCs alone should not be taken as evidence of Pediatric PG-SGA score stability.
4.2. General and Disease-Related Characteristics
The present findings should be interpreted in the context of an early-treatment cohort of children with lymphoma or solid tumors, in whom nutritional risk may reflect disease-related factors and the early effects of chemotherapy. This clinical context may also limit the generalizability of the findings to children with leukemia or those undergoing later treatment cycles.
Using the hospital laboratory’s pediatric age- and, where applicable, sex-specific reference ranges, low hemoglobin was observed in 42.3% of participants, whereas low albumin and total protein levels were observed in 8.6% and 4.9%, respectively. Albumin and total protein should be cautiously interpreted as indicators of nutritional status in pediatric oncology as inflammation and disease-related processes can affect circulating visceral protein concentrations independently of nutritional intake or body reserves [38]. Similarly, low hemoglobin may result from multiple cancer- and treatment-related mechanisms, including inflammation-induced alterations in iron metabolism and erythropoiesis, rather than nutritional status alone [3]. Therefore, these laboratory measures should complement, rather than replace, clinical and anthropometric nutritional assessments [14,38,39].
4.3. Interpretation of Anthropometric Findings
Anthropometric measures remain essential for nutritional assessment; however, their interpretation in children with solid tumors may be confounded by tumor mass, ascites, edema, and treatment-related fluid shifts [4,5,14]. The lower prevalence of BMI-for-age-defined undernutrition compared with nutritional risk or malnutrition identified by SCAN, Pediatric PG-SGA, and STRONGkids may reflect their inclusion of dietary intake, gastrointestinal symptoms, treatment burden, weight loss, and clinical signs of nutritional deterioration. These features may precede a low BMI-for-age, particularly at diagnosis or during early chemotherapy; however, the cross-sectional design cannot establish this sequence. An alternative explanation is that disease-related items may increase risk scores irrespective of nutritional status in a cohort composed entirely of children with cancer. Longitudinal follow-up is therefore needed to distinguish early identification of nutritional deterioration from overestimation of risk. Similar discrepancies have been reported previously: Bıçaklı and Kantar [15] found high nutritional-risk classifications using STRONGkids and PYMS, whereas 22.9% of children had a BMI below the 5th percentile; Canedo et al. [36] identified nutritional risk using SCAN in 45% of newly diagnosed children, whereas 8% had moderate undernutrition. Such numerical discrepancies are likely caused by variations in study populations, treatment phases, and operational anthropometric definitions across trials.
In our cohort, each instrument identified most children with BMI-for-age-defined undernutrition. However, children additionally classified as being at risk require clinical follow-up rather than being assumed to have established malnutrition. The fair-to-moderate agreement with the AND/ASPEN-based operational definition likewise suggests that these tools capture overlapping but distinct dimensions of nutritional vulnerability. Using the published age- and sex-specific 10th percentiles from Turkish reference data, MUAC identified a higher proportion of children as undernourished than TSF (20.9% vs. 6.1%). This difference may reflect the tissue compartments assessed, although MUAC alone cannot distinguish muscle from subcutaneous fat depletion. Repeated anthropometric measurements, including MUAC and TSF where feasible, should therefore complement clinical assessment and cancer-specific screening throughout treatment [14,18,20]. Two additional anthropometric limitations warrant consideration. First, the composite definition combined thresholds of unequal severity: the 10th percentile corresponds to approximately −1.3 SD, whereas the BMI-for-age criterion was −2 SD. Thus, the composite category, which included 26.4% of the cohort, combines different degrees of anthropometric deviation rather than a uniform level of undernutrition. The 10th percentile was selected based on previous pediatric oncology work [13] and the percentile-based Turkish reference data; nevertheless, consistent Z-score criteria across all three measures would be preferable, and the AND/ASPEN consensus recommends MUAC Z-scores [34]. Second, neither BMI nor arm anthropometry can directly distinguish fat mass from lean mass. Body composition was not assessed; future studies should include bioelectrical impedance analysis alongside these tools to evaluate treatment-related changes in fat and lean mass, including obesity.
4.4. Comparison of Nutritional Screening Instruments
The different classifications produced by SCAN, STRONGkids, and Pediatric PG-SGA are consistent with their distinct purposes and scoring structures. In the present cohort, 73.0% of children were classified as being at nutritional risk by SCAN using the original ≥3 threshold, compared with 48.5% classified as being at a high risk by STRONGkids and 52.8% as malnourished by Pediatric PG-SGA categories B–D. SCAN is a cancer-specific screening tool that provides substantial weight to symptoms, reduced intake, weight loss, and treatment-related factors; therefore, its original low threshold has been designed to prioritize sensitivity and may identify a broad group requiring nutritional review [20]. The proportion of children classified as being at nutritional risk by SCAN in the present study was higher than that reported in the recent Turkish validation study by Kangalgil et al. [24]. However, direct comparison is limited as the Kangalgil cohort included predominantly children with leukemia, whereas the present study was limited to children with lymphoma and solid tumors and who were assessed both at diagnosis and during early chemotherapy. Contrarily, STRONGkids was developed for general pediatric settings rather than for oncology. As malignancy contributes a fixed score in STRONGkids, its ability to discriminate between lower levels of nutritional risk may be limited in a cohort entirely composed of children with cancer [14,21,23]. Pediatric PG-SGA enables a more comprehensive assessment by incorporating clinical history, symptoms, functional information, and physical examination; however, its completion requires trained personnel and may be less feasible for rapid screening in busy settings [18,28]. Therefore, these tools should be viewed as complementary rather than interchangeable. SCAN may be useful for rapid initial triage, whereas Pediatric PG-SGA may provide a more detailed nutritional assessment once a child is identified as being at risk.
The absence of statistically significant associations between nutritional classifications and demographic or treatment-related characteristics should be interpreted cautiously, given the early-treatment population and potentially limited subgroup power. In particular, the chemotherapy-intensity analysis included only 61 children who had received one to three cycles; its nonsignificant findings do not establish that prolonged or cumulative chemotherapy exposure has no effect on nutritional status.
A positive SCAN result at the original ≥3 threshold should prompt comprehensive nutritional assessment incorporating Pediatric PG-SGA, anthropometry, dietary intake, and clinical findings. Nutritional intervention should be individualized according to nutritional status, intake adequacy, symptoms, and treatment-related needs, rather than determined by a screening score alone. Whether this approach improves nutritional and clinical outcomes requires prospective evaluation.
4.5. Strengths and Limitations
This study has several strengths. It concurrently evaluated two cancer-specific instruments in Turkish children with cancer, compared their classifications with STRONGkids and anthropometric indicators, and included a post hoc parallel analysis using an AND/ASPEN-based operational definition of moderate-to-severe malnutrition. The test–retest analysis also incorporated relative reliability and agreement-based methods, allowing the identification of small systematic upward drifts in Pediatric PG-SGA scores. Nevertheless, the study should be interpreted in light of several limitations. First, using STRONGkids as our primary comparator limits the evaluation of absolute criterion validity, particularly given that active malignancy automatically inflates the baseline score within this instrument. The AND/ASPEN-based operational definition provided an additional comparator; however, in this cohort, it mainly relied on BMI-for-age and percentage weight loss and may not have identified all children with muscle depletion. Furthermore, previous body weights used to calculate percentage weight loss were partly based on caregiver reports and therefore subject to recall errors, and the biochemical classifications entirely depend on the applied laboratory reference ranges. Second, the proposed SCAN and Pediatric PG-SGA thresholds were derived and evaluated in the same single-center sample. Bootstrap resampling assessed threshold-selection stability but did not provide an optimism-corrected estimate of performance. However, neither threshold has been externally validated. Third, test–retest reliability was evaluated in a convenience subgroup of 50 children, all instruments were administered by the same unblinded dietitian, and no repeat assessment was conducted for STRONGkids. These factors may have inflated the observed agreement, thereby precluding the assessment of inter-rater reliability. The broad developmental age range and relatively small age-stratified subgroups limit the interpretation of subgroup agreement estimates and preclude conclusions regarding age-specific validity. Fourth, diagnoses differed in tumor mass, corticosteroid exposure, and expected weight trajectory, while assessments at diagnosis and after up to three chemotherapy cycles were pooled. Approximately 40% of participants were outpatients, although STRONGkids was developed and validated for hospitalized children.
Finally, excluding leukemia, restricting assessment to early treatment, and recruiting during the COVID-19 pandemic limit generalizability. Performance during prolonged exposure to myelosuppressive and mucotoxic treatment remains unknown. Before routine national use can be recommended, larger multicenter studies across Turkish regions should include leukemia and the full treatment course, use an independent clinical malnutrition standard and body composition assessment, prespecify treatment-phase and inpatient-status strata, and evaluate whether screening-triggered intervention improves nutritional and clinical outcomes.
5. Conclusions
The Turkish versions of SCAN and Pediatric PG-SGA showed high content validity and high relative short-term test–retest reliability in children with lymphoma or solid tumors. Agreement with STRONGkids varied by instrument and cutoff, while agreement with the AND/ASPEN-based operational definition was fair to moderate. These findings do not establish diagnostic accuracy for malnutrition or clinical utility. The exploratory SCAN ≥ 5 and Pediatric PG-SGA ≥ 8 thresholds were derived and evaluated in the same sample against a screening comparator and require independent validation before clinical adoption. The original SCAN ≥ 3 threshold remains supported by external evidence, with positive results prompting comprehensive dietetic assessment rather than a diagnosis of malnutrition. Larger multicenter prospective studies should evaluate these instruments against an independent clinical malnutrition standard and assess their predictive value for nutritional and clinical outcomes.
Supplementary Materials
The following supporting information can be downloaded at: https://www.mdpi.com/article/10.3390/nu18223792/s1. Figure S1. Study cohort and timing of nutritional assessment; Table S1. Cross-classification of SCAN, Pediatric PG-SGA, and STRONGkids classifications with BMI-for-age Z-score-defined undernutrition; Table S2. Operational definition of AND/ASPEN-based malnutrition severity used in this study; Table S3. Institutional laboratory reference limits used for biochemical classification; Table S4. Nutritional risk and malnutrition classifications according to demographic and treatment-related characteristics; Table S5. Exploratory age-stratified agreement of nutritional screening and assessment classifications with STRONGkids-defined high nutritional risk; Table S6. Item-level content validity indices for translated assessment elements; File S1. STROBE Statement—checklist of items that should be included in reports of cross-sectional studies; File S2. Measurement properties assessed according to the COSMIN taxonomy.
Author Contributions
Ş.Ö.: Conceptualization, methodology, data curation, formal analysis, investigation, writing—original draft preparation, and visualization. G.B.A.: Clinical supervision, methodology, data interpretation, and writing—review and editing. M.B.: Conceptualization, methodology, supervision, data interpretation, writing—review and editing, and project administration. All authors have read and agreed to the published version of the manuscript.
Funding
This research received no external funding.
Institutional Review Board Statement
The study was conducted in accordance with the Declaration of Helsinki and approved by the Clinical Research Ethics Committee of Acıbadem Mehmet Ali Aydınlar University (approval date, 27 February 2020; approval no. 2020-03/29).
Informed Consent Statement
Written informed consent was obtained from parents or legal guardians. Verbal assent was obtained from children who were developmentally able to assent before enrollment.
Data Availability Statement
The data that support the findings of this study are not publicly available because they contain potentially identifiable clinical information from pediatric participants. De-identified data may be made available by the corresponding author upon reasonable request and subject to ethics committee and institutional approval.
Conflicts of Interest
The authors declare no conflicts of interest.
References
- Schuz, J.; Roman, E. Childhood cancer: A global perspective. Cancer Epidemiol. 2021, 71, 101878. [Google Scholar] [CrossRef] [Scilit] [PubMed]
- World Health Organization. Cancer in Children. Fact Sheet; World Health Organization: Geneva, Switzerland, 2026. [Google Scholar]
- Pedretti, L.; Massa, S.; Leardini, D.; Muratore, E.; Rahman, S.; Pession, A.; Esposito, S.; Masetti, R. Role of Nutrition in Pediatric Patients with Cancer. Nutrients 2023, 15, 710. [Google Scholar] [CrossRef] [Scilit] [PubMed]
- Tripodi, S.I.; Bergami, E.; Panigari, A.; Caissutti, V.; Brovia, C.; de Cicco, M.; Cereda, E.; Caccialanza, R.; Zecca, M. The role of nutrition in children with cancer. Tumori J. 2023, 109, 19–27. [Google Scholar] [CrossRef] [Scilit] [PubMed]
- Bauer, J.; Jurgens, H.; Fruhwald, M.C. Important aspects of nutrition in children with cancer. Adv. Nutr. 2011, 2, 67–77. [Google Scholar] [CrossRef] [Scilit] [PubMed]
- Iniesta, R.R.; Paciarotti, I.; Brougham, M.F.; McKenzie, J.M.; Wilson, D.C. Effects of pediatric cancer and its treatment on nutritional status: A systematic review. Nutr. Rev. 2015, 73, 276–295. [Google Scholar] [CrossRef] [Scilit] [PubMed]
- Triarico, S.; Rinninella, E.; Attina, G.; Romano, A.; Maurizi, P.; Mastrangelo, S.; Ruggiero, A. Nutritional status in the pediatric oncology patients. Front. Biosci. (Elite Ed.) 2022, 14, 4. [Google Scholar] [CrossRef] [Scilit] [PubMed]
- Runco, D.V.; Stanek, J.R.; Yeager, N.D.; Belsky, J.A. Malnutrition identification and management variability: An administrative database study of children with solid tumors. JPEN J. Parenter. Enter. Nutr. 2022, 46, 1559–1567. [Google Scholar] [CrossRef] [Scilit] [PubMed]
- Lewandowski, C.G.; Silveira, T.T.; Moreno, Y.M.F.; Leite, H.P. Sarcopenia in Children and Adolescents with Cancer: A Systematic Review of Diagnostic Assessment Methods. Pediatr. Blood Cancer 2025, 72, e31844. [Google Scholar] [CrossRef] [Scilit] [PubMed]
- Franke, J.; Bishop, C.; Runco, D.V. Malnutrition screening and treatment in pediatric oncology: A scoping review. BMC Nutr. 2022, 8, 150. [Google Scholar] [CrossRef] [Scilit] [PubMed]
- Afonso, W.V.; Peres, W.A.F.; de Pinho, N.B.; Schilithz, A.O.C.; Martucci, R.B.; Rodrigues, V.D.; Braga, J.S.D.N.; da Costa, J.D.; Padilha, P.D.C. Nutritional status at hospital admission and prediction of clinical outcomes in children and adolescents with cancer. J. Hum. Nutr. Diet. 2023, 36, 1290–1302. [Google Scholar] [CrossRef] [Scilit] [PubMed]
- Akdeniz Kudubeş, A.; Bektaş, M. Nutrition in Pediatric Oncology Patients: A Systematic Review. J. Pediatr. Res. 2016, 3, 1–6. [Google Scholar] [CrossRef] [Scilit]
- Pribnow, A.K.; Ortiz, R.; Baez, L.F.; Mendieta, L.; Luna-Fineman, S. Effects of malnutrition on treatment-related morbidity and survival of children with cancer in Nicaragua. Pediatr. Blood Cancer 2017, 64, e26590. [Google Scholar] [CrossRef] [Scilit] [PubMed]
- Suwannaying, K.; Rujkijyanont, P.; Inaba, H. Nutritional Assessment of Children and Adolescents with Cancer in Various Resource Settings. Cancers 2026, 18, 873. [Google Scholar] [CrossRef] [Scilit] [PubMed]
- Bicakli, D.H.; Kantar, M. Comparison of malnutrition and malnutrition screening tools in pediatric oncology patients: A cross-sectional study. Nutrition 2021, 86, 111142. [Google Scholar] [CrossRef] [Scilit] [PubMed]
- Zimmermann, K.; Ammann, R.A.; Kuehni, C.E.; de Geest, S.; Cignacco, E. Malnutrition in pediatric patients with cancer at diagnosis and throughout therapy: A multicenter cohort study. Pediatr. Blood Cancer 2013, 60, 642–649. [Google Scholar] [CrossRef] [Scilit] [PubMed]
- Brinksma, A.; Huizinga, G.; Sulkers, E.; Kamps, W.; Roodbol, P.; Tissing, W. Malnutrition in childhood cancer patients: A review on its prevalence and possible causes. Crit. Rev. Oncol. Hematol. 2012, 83, 249–275. [Google Scholar] [CrossRef] [Scilit] [PubMed]
- Vazquez de la Torre, M.J.; Stein, K.; Vasquez Garibay, E.M.; Ichikawa, M.R.K.; Sanromán, R.T.; Flores, A.G.S.; Zubieta, F.A.S. Patient-Generated Subjective Global Assessment of nutritional status in pediatric patients with recent cancer diagnosis. Nutr. Hosp. 2017, 34, 1050–1058. [Google Scholar] [CrossRef] [Scilit] [PubMed]
- de Oliveira Canedo, G.; Palomino Perez, L.M.; Puerta Macfarland, L.A.; Dominguez, D.R.; Cañedo-Villaroya, E.; Alcolea, B.G.; López, L.M.; Pedrón-Giner, C. Prospective validation of the nutrition screening tool for childhood cancer (SCAN). Clin. Nutr. ESPEN 2024, 63, 304–310. [Google Scholar] [CrossRef] [Scilit] [PubMed]
- Murphy, A.J.; White, M.; Viani, K.; Mosby, T.T. Evaluation of the nutrition screening tool for childhood cancer (SCAN). Clin. Nutr. 2016, 35, 219–224. [Google Scholar] [CrossRef] [Scilit] [PubMed]
- Hulst, J.M.; Zwart, H.; Hop, W.C.; Joosten, K.F. Dutch national survey to test the STRONGkids nutritional risk screening tool in hospitalized children. Clin. Nutr. 2010, 29, 106–111. [Google Scholar] [CrossRef] [Scilit] [PubMed]
- Oruçoğlu, B.; İnanç, N. Assessment of the STRONGkids screening tool: A cross-sectional study in Turkish children. Clin. Sci. Nutr. 2020, 2, 35–42. [Google Scholar] [CrossRef] [Scilit]
- Marcon, C.F.; Santos, C.A.D.; Oliveira, F.L.C. Development and validation of a nutrition risk screening for patients with childhood cancer in Brazil (NUTRICCAN). Nutr. Clin. Pract. 2026, 41, 768–778. [Google Scholar] [CrossRef] [Scilit] [PubMed]
- Kangalgil, M.; Meral, B.; Murphy Alford, A.J.; Erduran, E. Validity of a nutrition screening tool for childhood cancer. Nutr. Clin. Pract. 2025, 40, 690–698. [Google Scholar] [CrossRef] [Scilit] [PubMed]
- von Elm, E.; Altman, D.G.; Egger, M.; Pocock, S.J.; Gøtzsche, P.C.; Vandenbroucke, J.P.; STROBE Initiative. The Strengthening the Reporting of Observational Studies in Epidemiology (STROBE) statement: Guidelines for reporting observational studies. J. Clin. Epidemiol. 2008, 61, 344–349. [Google Scholar] [CrossRef] [Scilit] [PubMed]
- Mokkink, L.B.; Terwee, C.B.; Patrick, D.L.; Alonso, J.; Stratford, P.W.; Knol, D.L.; Bouter, L.M.; de Vet, H.C.W. The COSMIN checklist for assessing the methodological quality of studies on measurement properties of health status measurement instruments. Qual. Life Res. 2010, 19, 539–549. [Google Scholar] [CrossRef] [Scilit] [PubMed]
- Neyzi, O.; Saka, N. Türk Çocuklarında Antropometrik Araştırmalar. Antropoloji 2002, 14, 81–113. [Google Scholar] [CrossRef] [Scilit]
- Jager-Wittenaar, H.; Ottery, F.D. Assessing nutritional status in cancer: Role of the Patient-Generated Subjective Global Assessment. Curr. Opin. Clin. Nutr. Metab. Care 2017, 20, 322–329. [Google Scholar] [PubMed]
- World Health Organization. WHO Anthro for Personal Computers, Version 3.2.2; WHO: Geneva, Switzerland, 2011. [Google Scholar]
- World Health Organization. WHO AnthroPlus for Personal Computers; WHO: Geneva, Switzerland, 2009. [Google Scholar]
- Ozturk, A. Türk Çocuklarında Üst Orta Kol Çevresi Referansları. Turk. Klin. J. Pediatr. Sci. 2012, 8, 52–53. [Google Scholar]
- Cicek, B. Türk Çocuklarında Cilt Kıvrım Kalınlığı Referansları. Turk. Klin. J. Pediatr. Sci. 2012, 8, 54–56. [Google Scholar]
- Ozturk, A.; Budak, N.; Cicek, B.; Mazicioglu, M.M.; Bayram, F.; Kurtoglu, S. Cross-sectional reference values for mid-upper arm circumference, triceps skinfold thickness and arm fat area of Turkish children and adolescents. Int. J. Food Sci. Nutr. 2009, 60, 267–281. [Google Scholar] [CrossRef] [Scilit] [PubMed]
- Becker, P.; Carney, L.N.; Corkins, M.R.; Monczka, J.; Smith, E.; Smith, S.E.; Spear, B.A.; White, J.V. Consensus statement of the Academy of Nutrition and Dietetics/American Society for Parenteral and Enteral Nutrition: Indicators recommended for the identification and documentation of pediatric malnutrition. Nutr. Clin. Pract. 2015, 30, 147–161. [Google Scholar] [PubMed]
- Koo, T.K.; Li, M.Y. A Guideline of Selecting and Reporting Intraclass Correlation Coefficients for Reliability Research. J. Chiropr. Med. 2016, 15, 155–163. [Google Scholar] [CrossRef] [Scilit] [PubMed]
- Canedo, G.; Palomino Perez, L.M.; Puerta Macfarland, L.A.; Dominguez, D.R.; Cañedo-Villaroya, E.; Alcolea, B.G.; López, L.M.; Pedrón-Giner, C. Validity and Reliability of a Nutritional Screening Tool (SCAN) in Children Newly Diagnosed with Cancer. Nutr. Cancer 2022, 74, 1754–1765. [Google Scholar] [CrossRef] [Scilit] [PubMed]
- Paiva, C.E.; Barroso, E.M.; Carneseca, E.C.; Souza, C.d.P.; dos Santos, F.T.; López, R.V.M.; Paiva, S.B.R. A critical analysis of test-retest reliability in instrument validation studies of cancer patients under palliative care. BMC Med. Res. Methodol. 2014, 14, 8. [Google Scholar] [CrossRef] [Scilit] [PubMed]
- McLean, T.W.; Shah, N.S.; Barr, R.D.; Tooze, J.A. Hypoalbuminemia and Nutritional Status in Children With Cancer. Pediatr. Blood Cancer 2025, 72, e31450. [Google Scholar] [CrossRef] [Scilit] [PubMed]
- Avramescu, I.; Boroghina, S.; Parvan, A.; Bălănescu, L.; Negrei, C.; Albu, E.; Jercan, C.G.; Marcu, A.D.; Albu, H.; Coliță, A. Consensus Recommendations for Nutritional Intervention in Pediatric Oncology (Ages 4–18 Years). Nutrients 2026, 18, 1889. [Google Scholar] [CrossRef] [Scilit] [PubMed]

Disclaimer/Publisher’s Note: The statements, opinions and data contained in all publications are solely those of the individual author(s) and contributor(s) and not of MDPI and/or the editor(s). MDPI and/or the editor(s) disclaim responsibility for any injury to people or property resulting from any ideas, methods, instructions or products referred to in the content. |
© 2026 by the authors. Licensee MDPI, Basel, Switzerland. This article is an open access article distributed under the terms and conditions of the Creative Commons Attribution (CC BY) license.