


Highlights
What are the main findings?
- Xi’an exhibits a persistent surface uplift of up to 20 mm/yr, which is strongly coupled with the localized groundwater-level recovery in the shallow confined aquifer.
- Fissures act as major structural and hydrological boundaries that compartmentalize aquifer properties, directly controlling the spatial pattern of surface deformation and groundwater pressure diffusion.
What are the implications of the main findings?
- Rapid groundwater rebound induces distinct urban geohazards, such as severe basement water seepage, posing significant threats to underground infrastructures.
- InSAR-derived vertical land motion provides a crucial quantitative framework for assessing aquifer parameters (e.g., hydraulic diffusivity).
Abstract
Vertical land motion in urban areas is a critical manifestation of groundwater, directly affecting infrastructure stability and groundwater sustainability. While land subsidence caused by groundwater extraction has been widely investigated, the opposite process—surface uplift induced by groundwater recovery—remains poorly documented or understood, particularly regarding its hydrological mechanisms and potential hazards. Here, we integrate InSAR time-series analysis of Sentinel-1 imagery (2017–2025) with groundwater well records to quantify the spatial–temporal characteristics of uplift in Xi’an, China, and to evaluate its hydrogeological drivers. Results reveal a persistent surface uplift zone south of the ancient city in Xi’an, with rates up to 20 mm/yr. The uplift correlates closely with rising groundwater levels in the shallow confined aquifer, indicating a strong coupling between aquifer recharge and surface uplift. Calculated storage coefficients and hydraulic diffusivity values highlight marked spatial variations, constrained by some ground fissures that act as both mechanical discontinuities and hydrological barriers controlling pressure diffusion. Time-series analysis further identifies the eastward propagation of subsidence-to-uplift reversal in Yuhuazhai, an urban village with groundwater injection, which is used to quantify the diffusivity coefficients. Field investigations show that rapid groundwater rebound can lead to uplift-related hazards, such as basement seepage, underscoring that surface uplift must be considered alongside subsidence in urban water management.
1. Introduction
Vertical land motion is a key driver of geological hazards in urban areas, threatening building foundations and causing cracks in roads and other infrastructure [1]. Groundwater, especially that stored in confined aquifer systems, plays a dominant role in causing vertical land motion [2]. A strong correlation between groundwater fluctuations and vertical land motion has been observed, for example, in Mexico City, Mexico [3], Rome, Italy [4], Cangzhou, China [5], and Suzhou, China [6]. In these cities, excessive groundwater extraction has led to severe subsidence, causing considerable damage to urban infrastructure [7,8,9].
Interferometric Synthetic Aperture Radar (InSAR) has been widely employed to investigate vertical land motion in urban areas [10]. It exploits the phase information of microwaves to calculate velocity and time-series deformation along the radar’s line of sight (LOS), which is highly sensitive to vertical displacement [10,11]. Owing to its high spatial resolution, InSAR-derived velocity fields have not only been used for monitoring subsidence due to groundwater overexploitation [12,13,14], but also been utilized to estimate hydrological parameters such as aquifer storage coefficients and variations in total groundwater volume [15,16].
In recent years, surface uplift has been detected in several cities worldwide, including Breisgau, Germany [17], Taiyuan, China [18], and Perth, Australia [16]. These uplift phenomena are likely associated with the implementation of groundwater recharge initiatives in regions historically affected by land subsidence [19]. The land uplift in Breisgau, likely due to the backfilling of the wells, has resulted in severe damage to buildings and some urban infrastructure [17]. Similarly, recent studies reveal surface uplifts in some cities of the North China Plain, along with significant groundwater recharge [18,19,20,21].
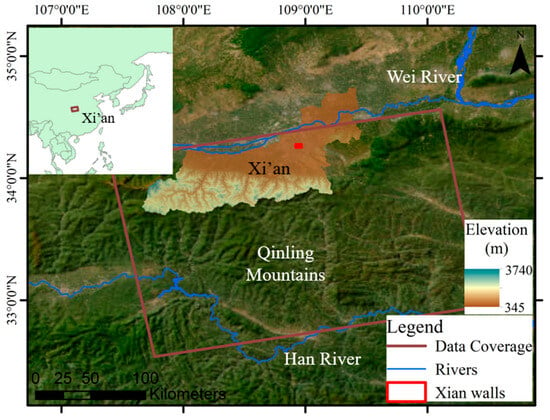
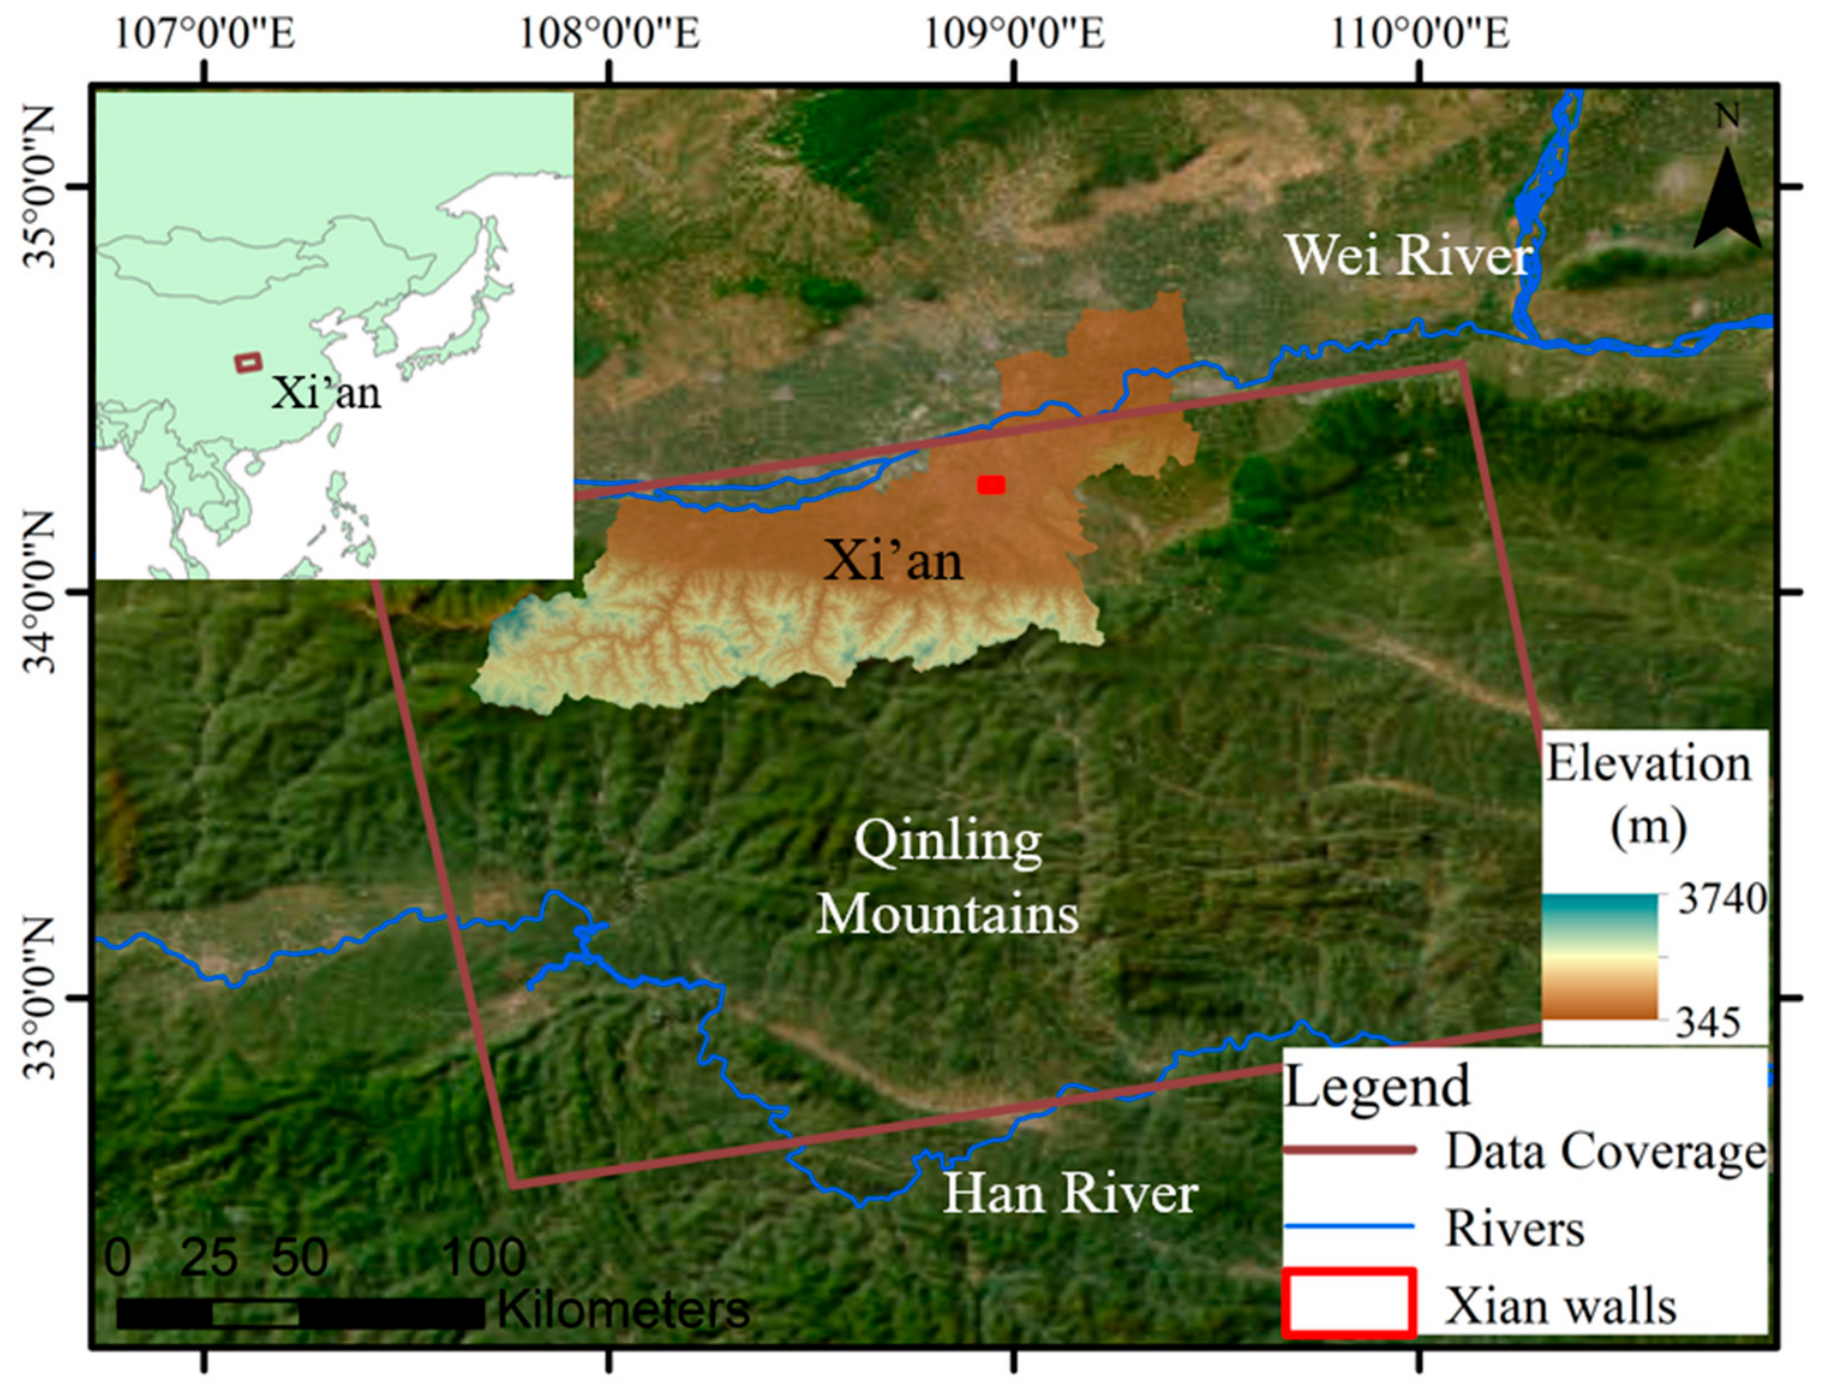
Xi’an, the largest city in central-western China, is characterized by complex geological conditions marked by extensive ground fissures [22] (Figure 1). Since the late 20th century, Xi’an—like many rapidly developing Chinese cities—has undergone substantial economic growth and urban expansion, leading to a sharp rise in water demand. During this period, prolonged groundwater overexploitation has caused severe land subsidence, resulting in considerable economic losses [23,24,25]. Moreover, fourteen major ground fissures, mainly controlled by the Chang’an–Lintong fault [22], pose significant risks to nearby buildings and infrastructures. Previous studies on ground fissures in Xi’an have highlighted several critical areas of concern [26,27]. It has been established that Xi’an has experienced long-term surface subsidence, resulting in an increasingly prominent phenomenon of ground fissures due to uneven surface deformation. Most researchers agree that the formation of ground fissures is jointly governed by tectonic activity and differential settlement [28].
Figure 1.
The location and topography of Xi’an city with Sentinel-1 image coverage. The color-scaled topography is for the entire Xi’an metropolitan area. The red rectangle indicates the location of the ancient Xi’an walls.
The prolonged land subsidence in Xi’an prompted the government to adopt a series of mitigation measures, including a ban on groundwater extraction and the construction of pumping wells in the areas affected by land subsidence [26,29]. In addition, several large-scale water diversion projects—such as the Hei River Diversion Project and the Han-to-Wei River Water Diversion Project—have been implemented to secure an adequate water supply and optimize regional resource distribution [30]. Specifically, the Xi’an municipal government has adopted a cessation of groundwater withdrawal and a water injection strategy since 2018 to alleviate land subsidence caused by groundwater overexploitation [26].
Following the implementation of these measures, surface uplift has been observed in Xi’an after 2018 [29]. A notable example is Yuhuazhai, an urban village that has experienced significant land subsidence since the early 21st century [25,28]. In 2018, local authorities constructed several groundwater recharge wells in this area to mitigate the severe ground subsidence. Previous studies have identified significant subsidence prior to the intervention, followed by a short-term uplift and subsequent stabilization after the measures were taken [24,26]. However, whether the observed uplift represents a temporary rebound or a sustained long-term process remains unclear. Furthermore, such an abrupt reversal of vertical land motion provides a valuable opportunity to investigate the hydrological parameters and the role of ground fissures in controlling groundwater redistribution. The potential hazards associated with ground uplift, which have been far less studied than those related to subsidence, also warrant further investigation.
Here, we process Sentinel-1 SAR images acquired between 2017 and 2025 to produce a detailed deformation–velocity map and time series for Xi’an City. After integrating continuous time-series InSAR observations with hydrological modeling, we bridge the gap between surface deformation phenomena and subsurface aquifer properties, transforming deformation data into constraints for groundwater management. Our analysis reveals that a large area south of Xi’an city has been undergoing uplift since 2017, with no signs of deceleration by 2025. We assess the currently uplifting areas by integrating groundwater level records and the spatial distribution of ground fissures to derive hydrological parameters and reveal the possible mechanisms underlying the observed uplifts. We also discuss possible hazards associated with ground uplifts, underscoring the need to be prepared for such issues in cities with uplift potential. This work advances beyond kinematic observation by integrating these tools into a quantitative hydrogeological framework. We also discuss possible hazards associated with ground uplifts, underscoring the need to be prepared for such issues in cities with uplift potential.
2. Materials and Methods
2.1. Study Area
Xi’an is located north of the Qinling Mountains and adjacent to the Loess Plateau (Figure 1). With a long and rich history, ancient city walls enclose the historical center of Xi’an. Currently, it has evolved into a central city in western China with a total metropolitan area of 1066 km2. A dense river network surrounds the city, with the Wei River being dominant [25]. Xi’an is characterized by a geologically complex environment, where loess ridges and subsiding loess basins are interwoven.
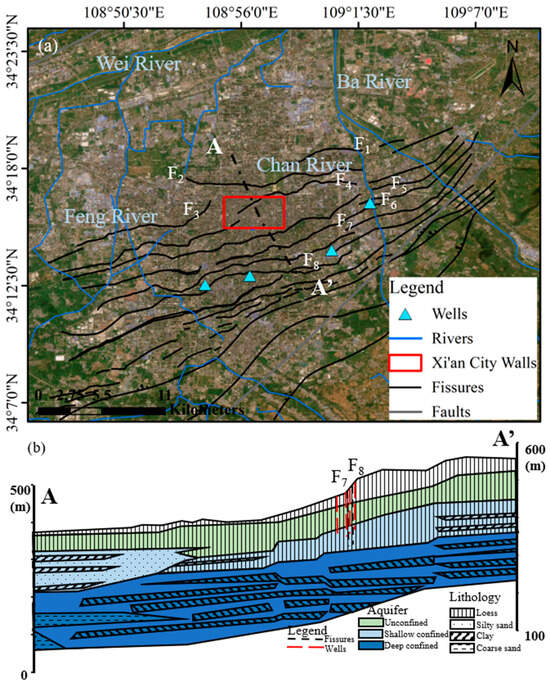
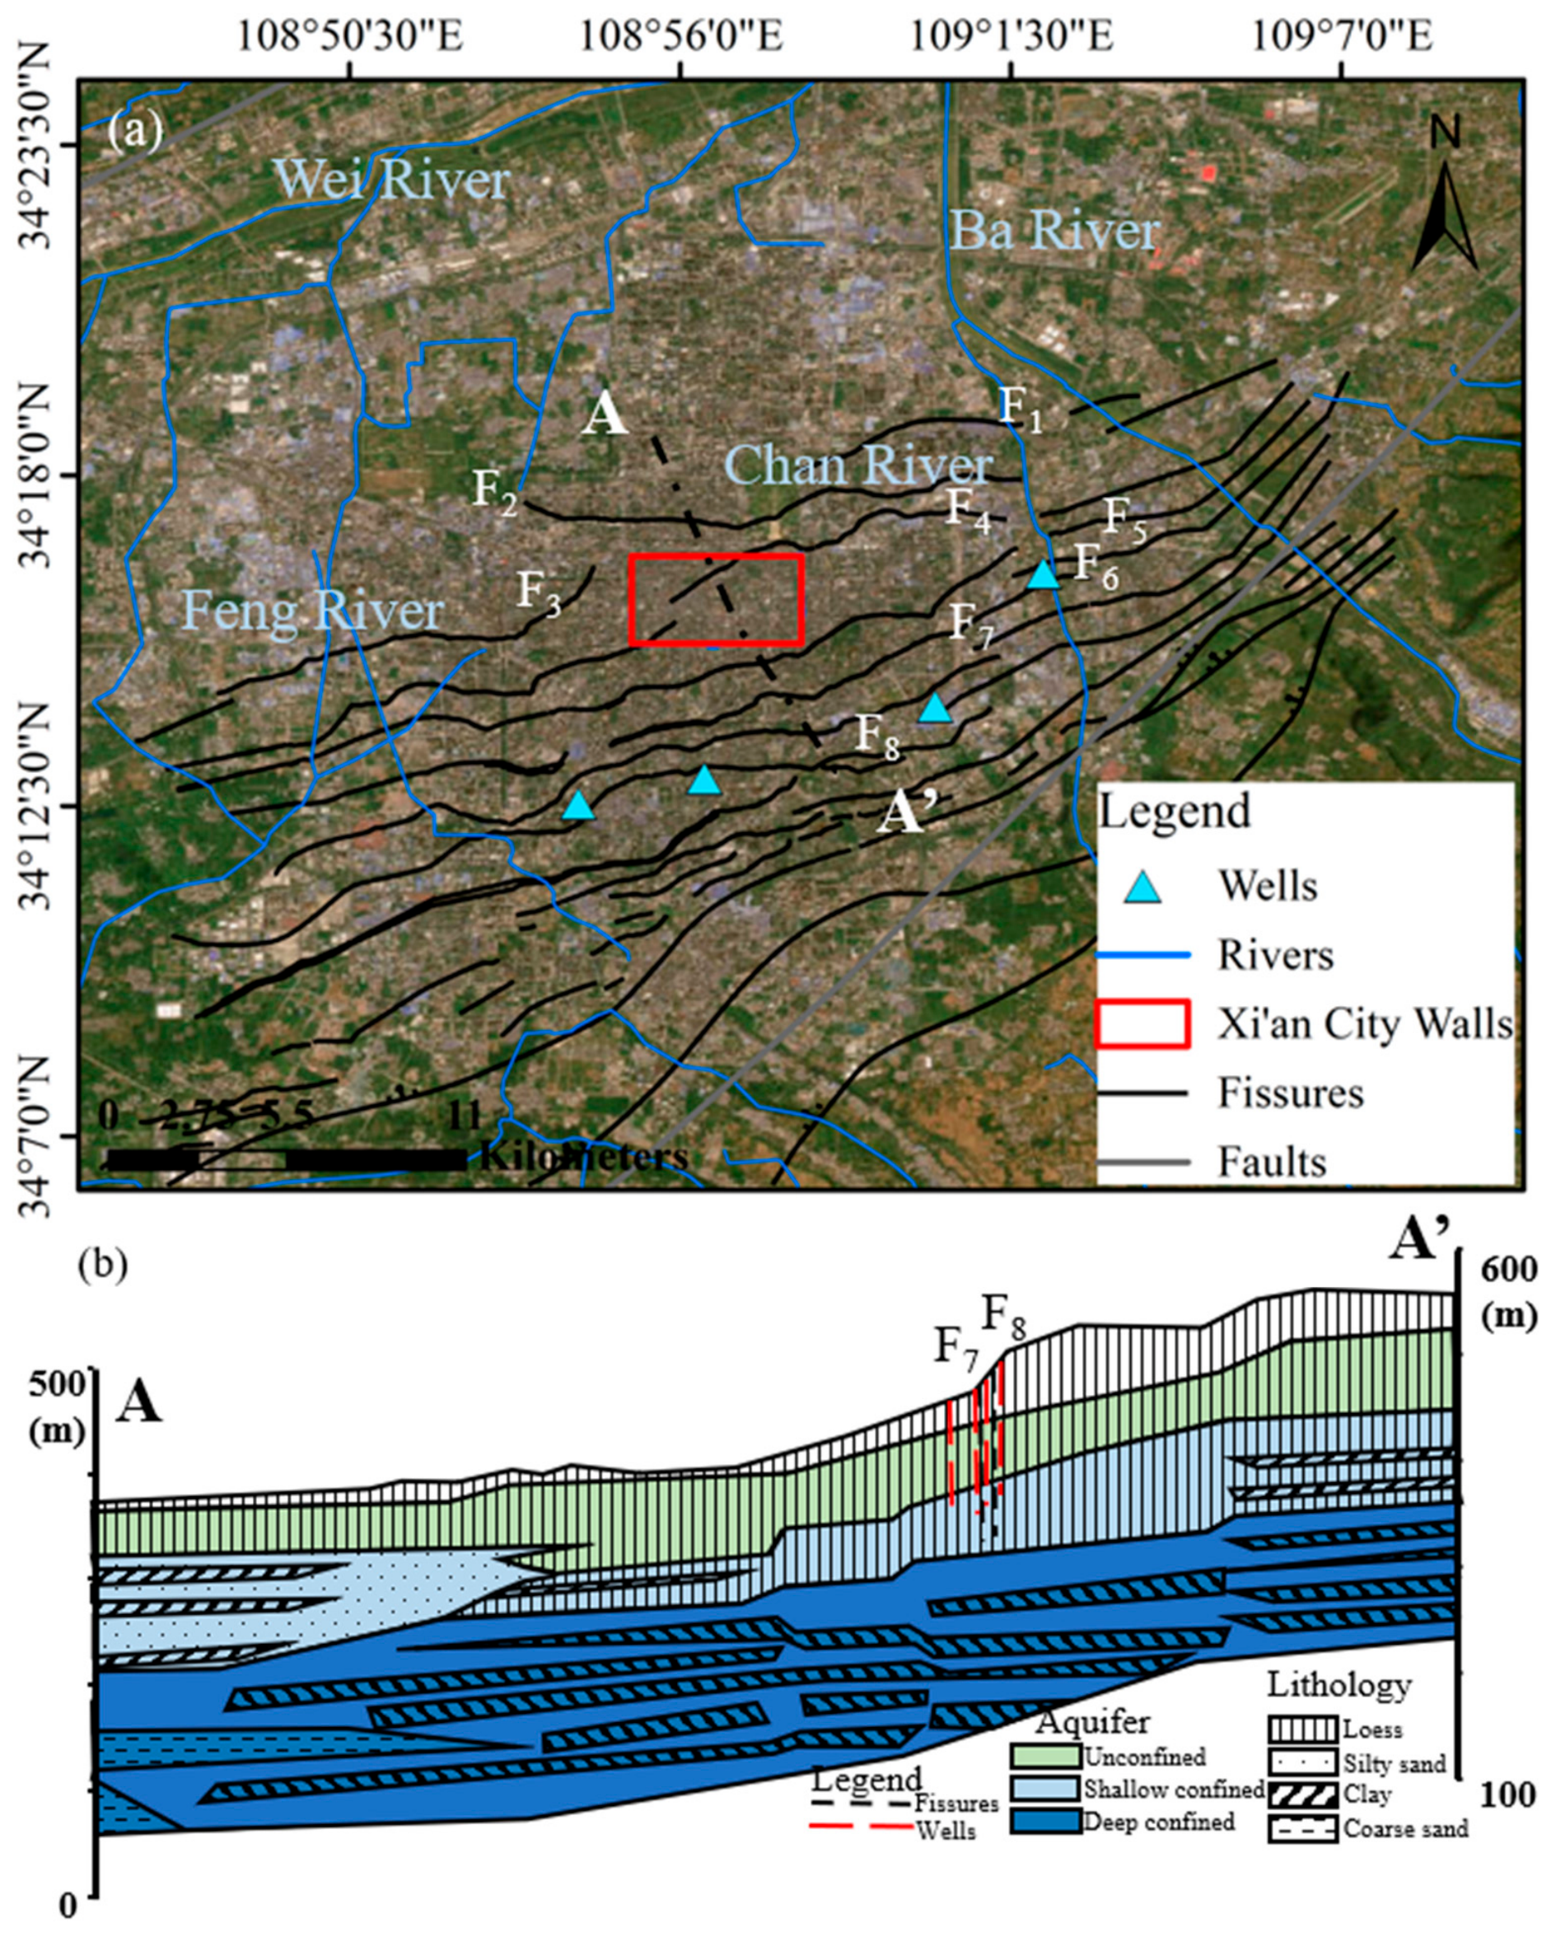
Xi’an has suffered from water scarcity due to high demand from the large industrial and residential sectors since the 1960s [29]. Most rivers in Xi’an belong to the Wei River system, which is the only primary stream in the region [27]. Besides the Wei River itself, other major tributaries include the Chan and Ba Rivers to the east and the Feng River to the west (Figure 2a). The aquifer system in Xi’an can be divided into three layers: an unconfined aquifer, a shallow confined aquifer, and a deep confined aquifer (Figure 2b). The depths of the measurement wells are in the shallow confined aquifer. The lithology at these well locations is characterized by loess, with no clay layers in the shallow confined aquifer [27]. While the land elevation increases from north to south, the aquifer thickness remains relatively consistent across the study area.
Figure 2.
Hydrological background of the Xi’an city (For the broader geographical location of the study area, please refer to the inset in Figure 1). (a) presents the fissures and rivers surrounding the city of Xi’an. Ground fissures are indicated as “F” with the serial numbers defined in reference [25]. (b) presents the aquifer structure along profile AA’ shown in (a) [27], and the background colors indicate the aquifer types, while the overlaid hatch patterns represent the specific lithology, as defined in the legend. The red dotted lines show the depth of the wells in projection. The black dotted lines show the locations of the fissures F7 and F8.
2.2. SAR Dataset and Groundwater Records
We employ time-series InSAR analysis to investigate the spatiotemporal characteristics of the vertical land motion in Xi’an. A total of 197 ascending Sentinel-1 SAR images acquired between 2017 and 2025 were processed. Monitoring wells located within the Xi’an urban area were selected for analysis. We obtained groundwater well records from the China Geological Environment Monitoring Groundwater Level Yearbook and from the Geo-cloud platform in China [31] (https://geocloud.cgs.gov.cn/). The groundwater level measurements generally have observation intervals ranging from three to six months. All the well data presented in the following sections correspond to water levels in a shallow confined aquifer.
2.3. Time-Series InSAR Analysis
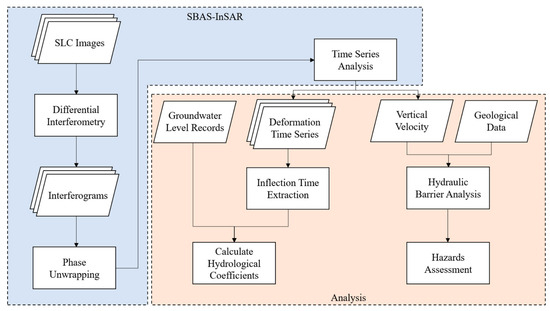
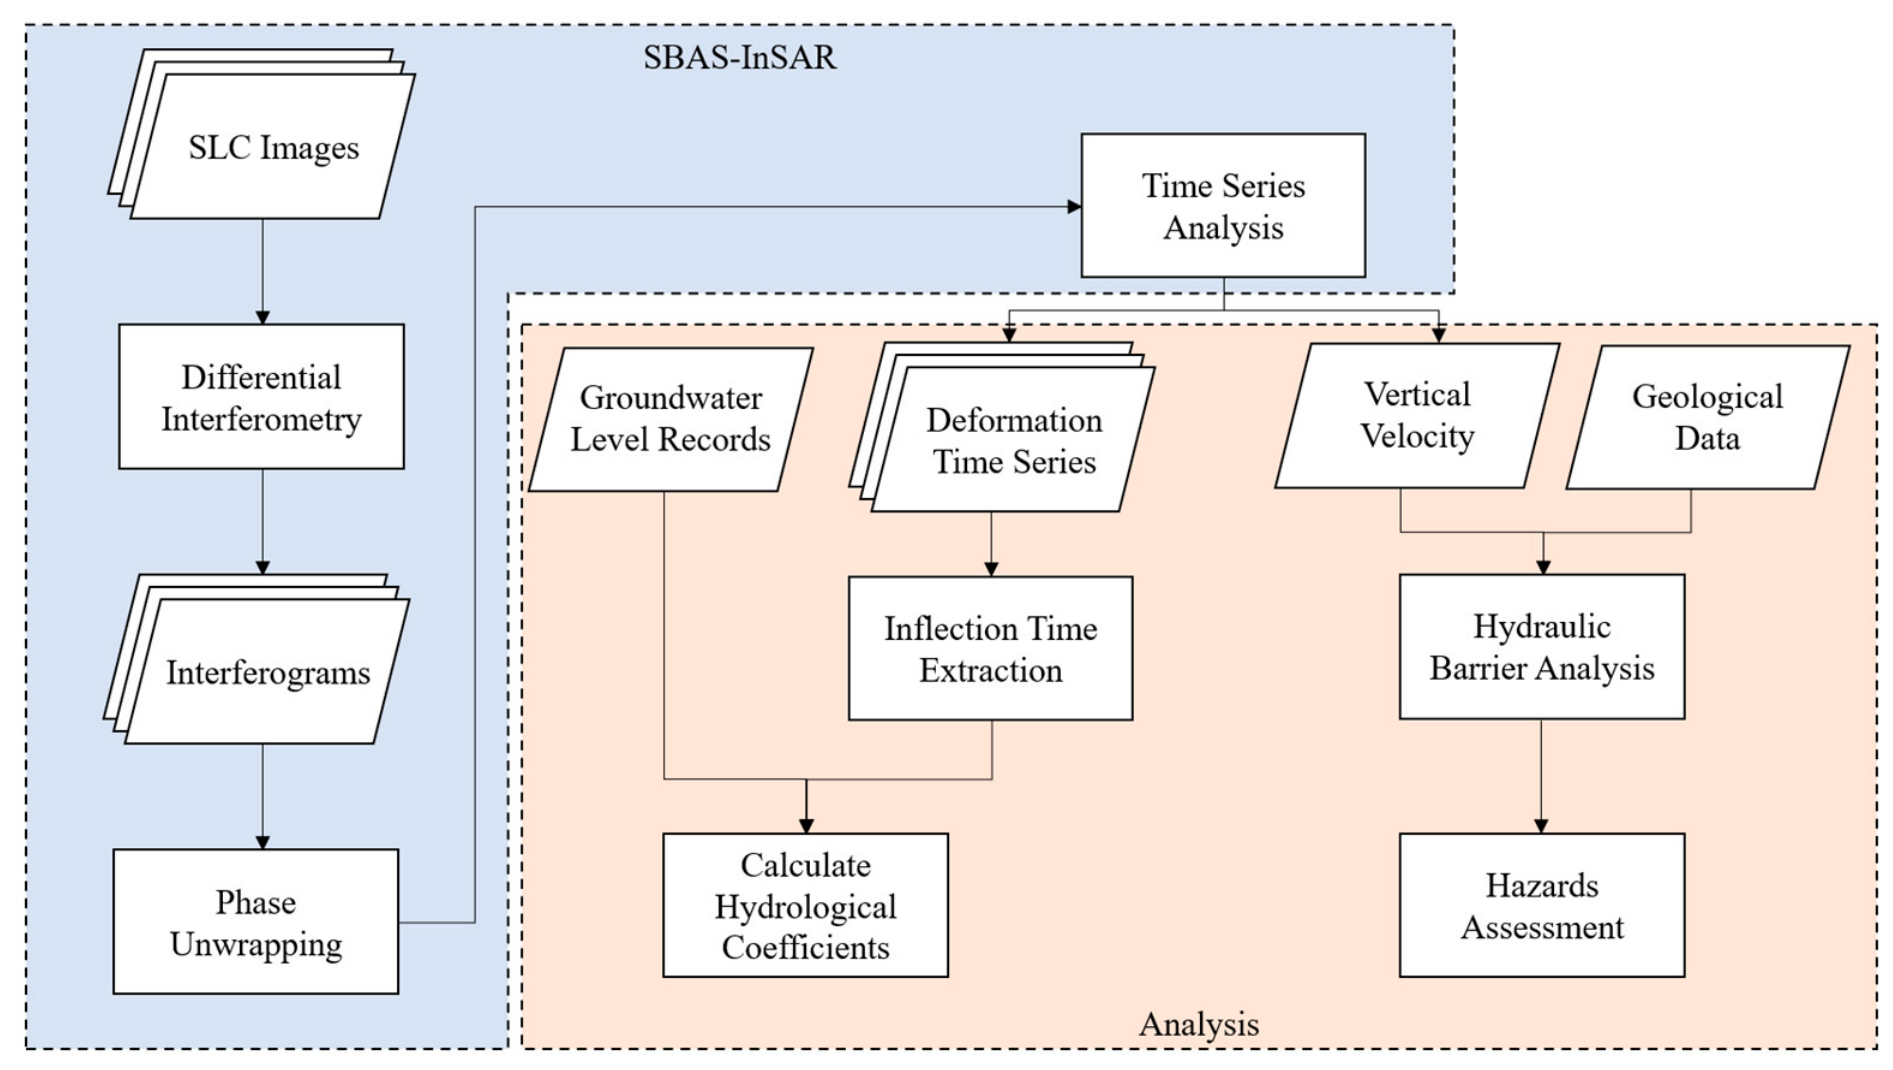
To clearly illustrate the overall research framework, a step-by-step flowchart of the methodology is presented in Figure 3. We map the vertical land motion around Xi’an using the Small Baseline Subset InSAR (SBAS-InSAR) technique [32], which produces a velocity field and time-series deformation with a 12-day temporal resolution. The high coherence in urban areas enables the use of long-term interferograms, which helps mitigate phase loop-closure errors [33]. We select image pairs with temporal baselines of 330–390 days and 60–90 days to construct the interferometric network, yielding 1185 interferograms with both short- and year-term baselines. The time-series analysis was performed using the open-source software LiCSBAS (v1.4.5), which is designed for SBAS-InSAR processing [34]. After obtaining the initial time series, we apply a pixel-wise masking procedure to eliminate outliers. The threshold for the residual root mean square (RMS) is 2.0 mm. This post-processing step improves the quality of the final vertical velocity field and the corresponding displacement time series. Because only the ascending track is available for the study area, we convert the line-of-sight deformation to the vertical direction by dividing the cosine of the radar’s incidence angle of each pixel.
Figure 3.
Flowchart of the methodology adopted in this study. The overall workflow comprises three primary modules: (1) InSAR time-series processing to derive vertical velocity and deformation time-series from SLC images; (2) calculation of hydrogeological coefficients based on the extracted inflection times and groundwater records; and (3) hydraulic barrier analysis and hazard assessment integrating geological data.
2.4. Inflection Detection
To identify pattern changes in the deformation time-series (e.g., from subsidence to uplift, or from subsidence to stability), we apply the Pruned Exact Linear Time (PELT) algorithm to detect change points on a per-pixel basis [35]. Compared to simple piecewise trend analysis, which often requires pre-defining the number of inflection points, the PELT algorithm is highly advantageous for large-scale InSAR datasets. It can efficiently identify an unknown number of multiple change points by minimizing the total cost function:
where is a cost function measuring the fit of the data within each segment, represents the deformation time-series, denotes the subset of data between two consecutive change points, are the change points, is the number of change points, and is a penalty term that controls model complexity. In our implementation, we use the squared residual sum of linear fitting as the cost function and empirically select the penalty value to balance sensitivity and false positives. Specifically, sensitivity testing indicates that lower values tend to falsely identify seasonal fluctuations or noise as change points, whereas excessively high values obscure long-term trend reversals. To reduce computational cost, the algorithm eliminates suboptimal candidates using an inequality-based pruning criterion, ensuring linear-time performance under certain conditions.
2.5. Aquifer Model
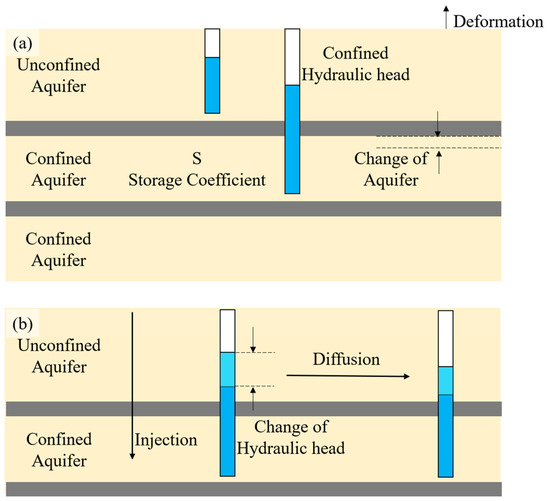
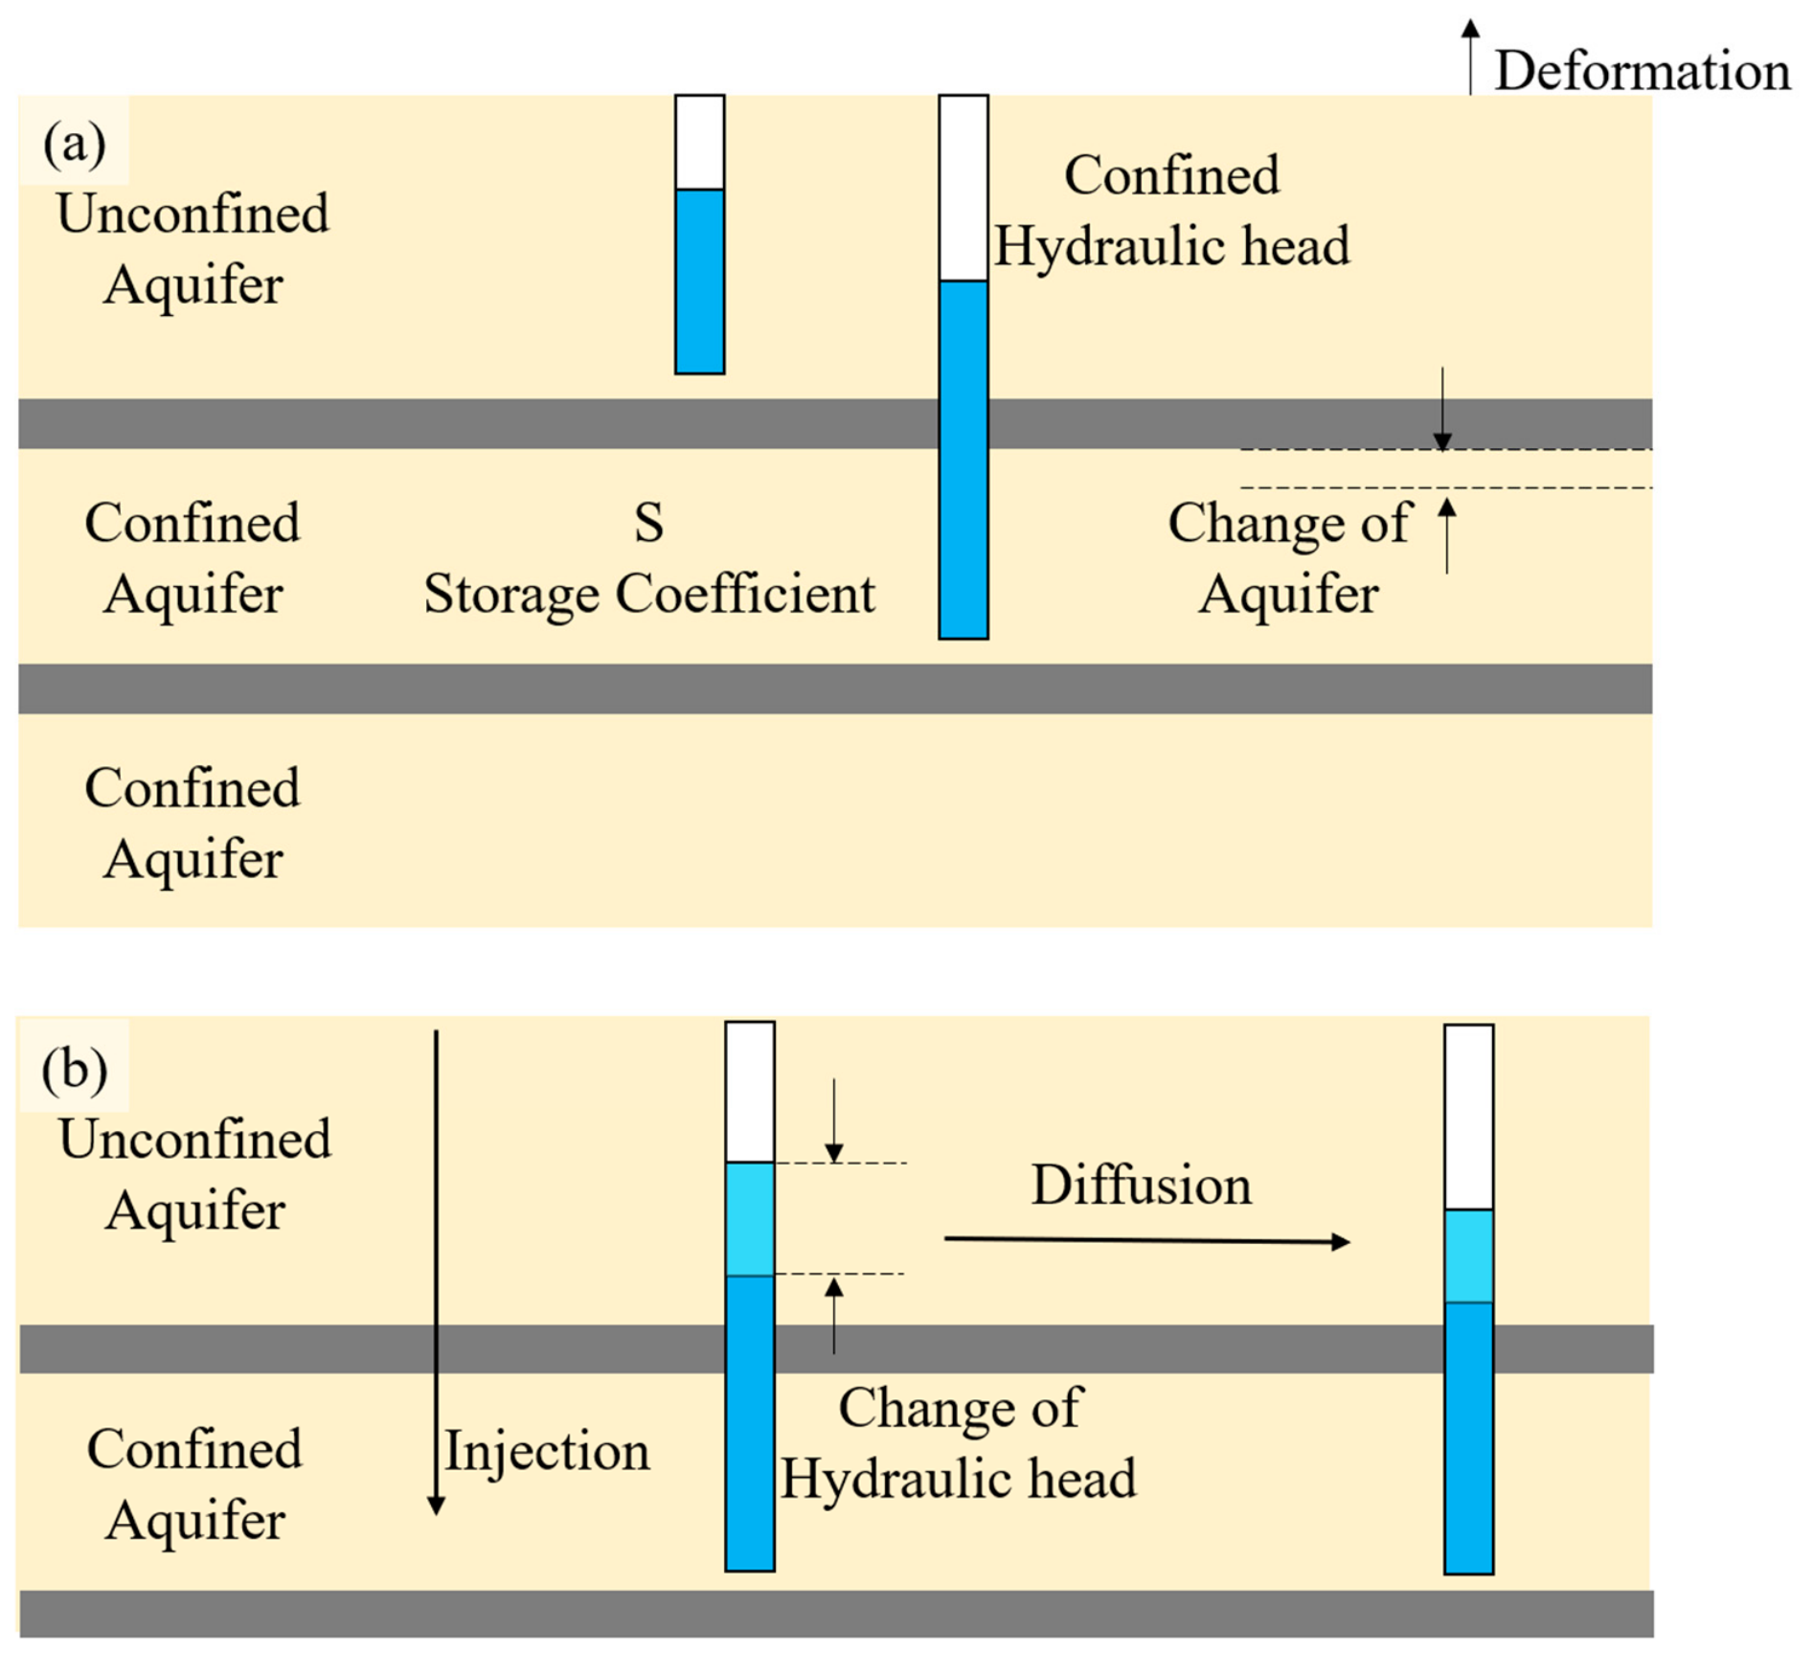
We aim to estimate relevant hydrogeological parameters from vertical land motion and groundwater records. Specifically, two models are employed to estimate the aquifer system’s storage coefficient and hydraulic diffusivity (Figure 4).
Figure 4.
The schematic graph of the aquifer model. (a) the calculation of the storage coefficient, and (b) the diffusion of the hydraulic head. The dark blue color indicates the initial groundwater level (or hydraulic head), while the light blue color represents the change in water level due to injection.
The storage coefficient, which represents the volume of water released or absorbed per unit surface area of the aquifer per unit change in hydraulic head [36]. For confined aquifers, the storage coefficient S is calculated using the following expression:
The parameter denotes the thickness of the aquifer, and represents the specific storage, which is calculated as follows:
Here, is the density of water, is the gravitational acceleration, is the compressibility of the aquifer, is the porosity, and is the compressibility of the fluid. In practical calculations, since the compressibility of porous media in most aquifers is typically two orders of magnitude greater than that of water, is usually considered negligible. The compressibility α of the aquifer is calculated using the following expression [36]:
where is the vertical deformation measured at the surface, and is the change in groundwater level.
We simplify the subsurface system as a hydrogeological model composed of two aquifer layers and lateral aquitards. We assume that horizontal planes remain in a state of stress equilibrium at a given depth. Based on the above equations and the actual calculation conditions, the storage coefficient is calculated as follows:
For groundwater fluctuations within a specific period, if the timing of head changes appears to propagate spatially across the surrounding media, such diffusion behavior can be modeled. We assume that groundwater is incompressible, that flow occurs horizontally in one dimension, and that the porous medium is homogeneous and isotropic. Under these assumptions, the flow behavior follows Darcy’s law [36]:
In this context, denotes the specific discharge (volumetric flow per unit area), is the hydraulic conductivity, and is the height of hydraulic head. The flow process adheres to the mass conservation equation [37]:
In saturated media, the volumetric water content equals the porosity n. Considering the relationship between changes in hydraulic head and moisture content, a linear relationship is assumed, and a proportionality constant is introduced:
substituting this into the mass conservation equation gives
By further substituting Darcy’s law and assuming remains constant in the one-dimensional direction, we can get
where .
This relationship is identical in form to the one-dimensional diffusion equation. Therefore, the propagation of hydraulic head variation can be interpreted as a diffusion process. Based on the obtained diffusion coefficient , we can determine the rate of diffusion in a one-dimensional model. Specifically, a smaller value of indicates slower diffusion along that direction, while a larger corresponds to faster diffusion.
3. Results
3.1. Vertical Velocity Field of Xi’an
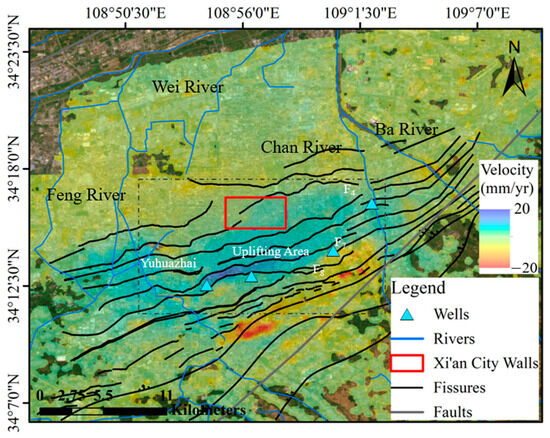
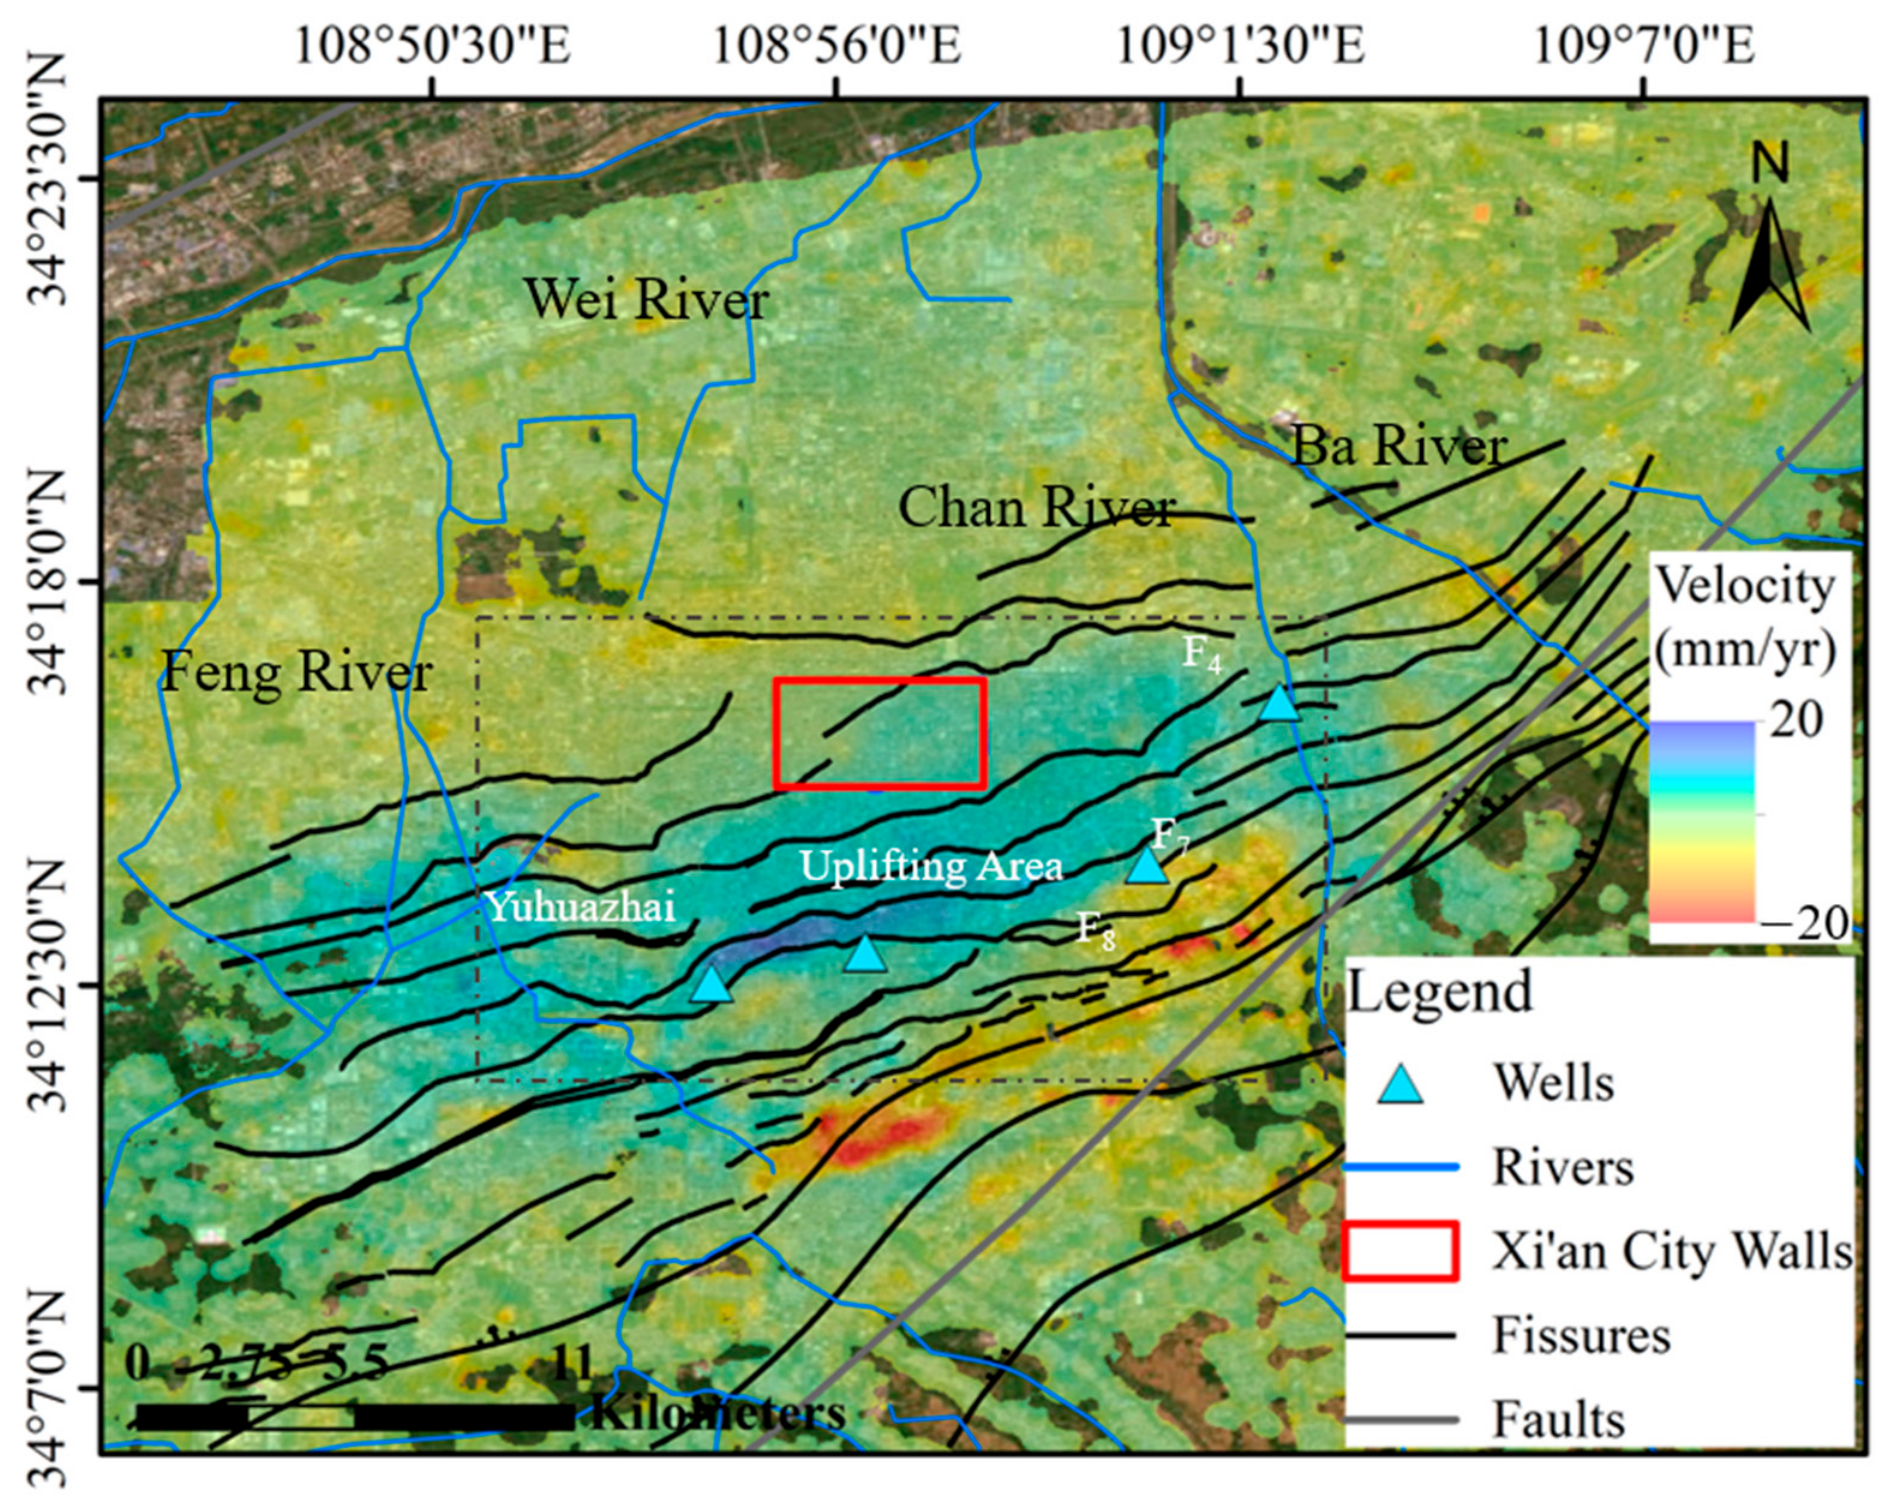
Following the time-series inversion and spatiotemporal filtering, we derived the vertical velocity field of Xi’an (Figure 5), which reveals that certain areas within Xi’an continue to experience localized subsidence at rates of up to −20 mm/year. Compared with the distribution of subsidence documented from the 1990s to the 2010s [24,25], the most prominent subsiding area has shifted further south, approximately 10 km from the city center, and the subsidence area appears smaller.
Figure 5.
The vertical velocity map of Xi’an. The black lines indicate ground fissures in Xi’an, and two fissures are named for further discussion. The blue triangles represent wells that tap a shallow confined aquifer, whose water levels are used in this study. The blue lines represent the rivers in Xi’an. The dashed rectangle shows the location of Figure 6.
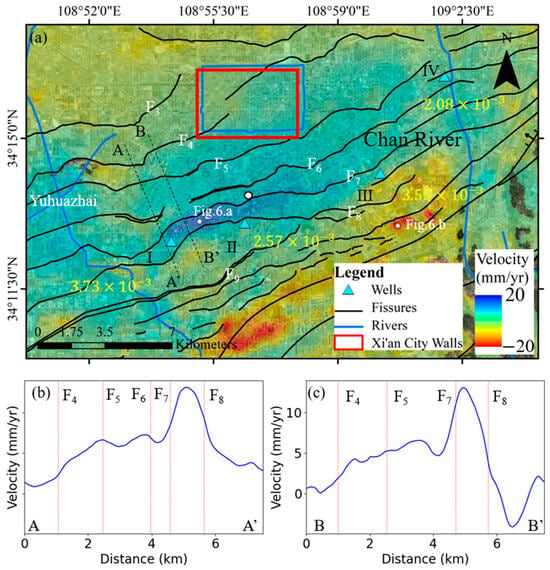
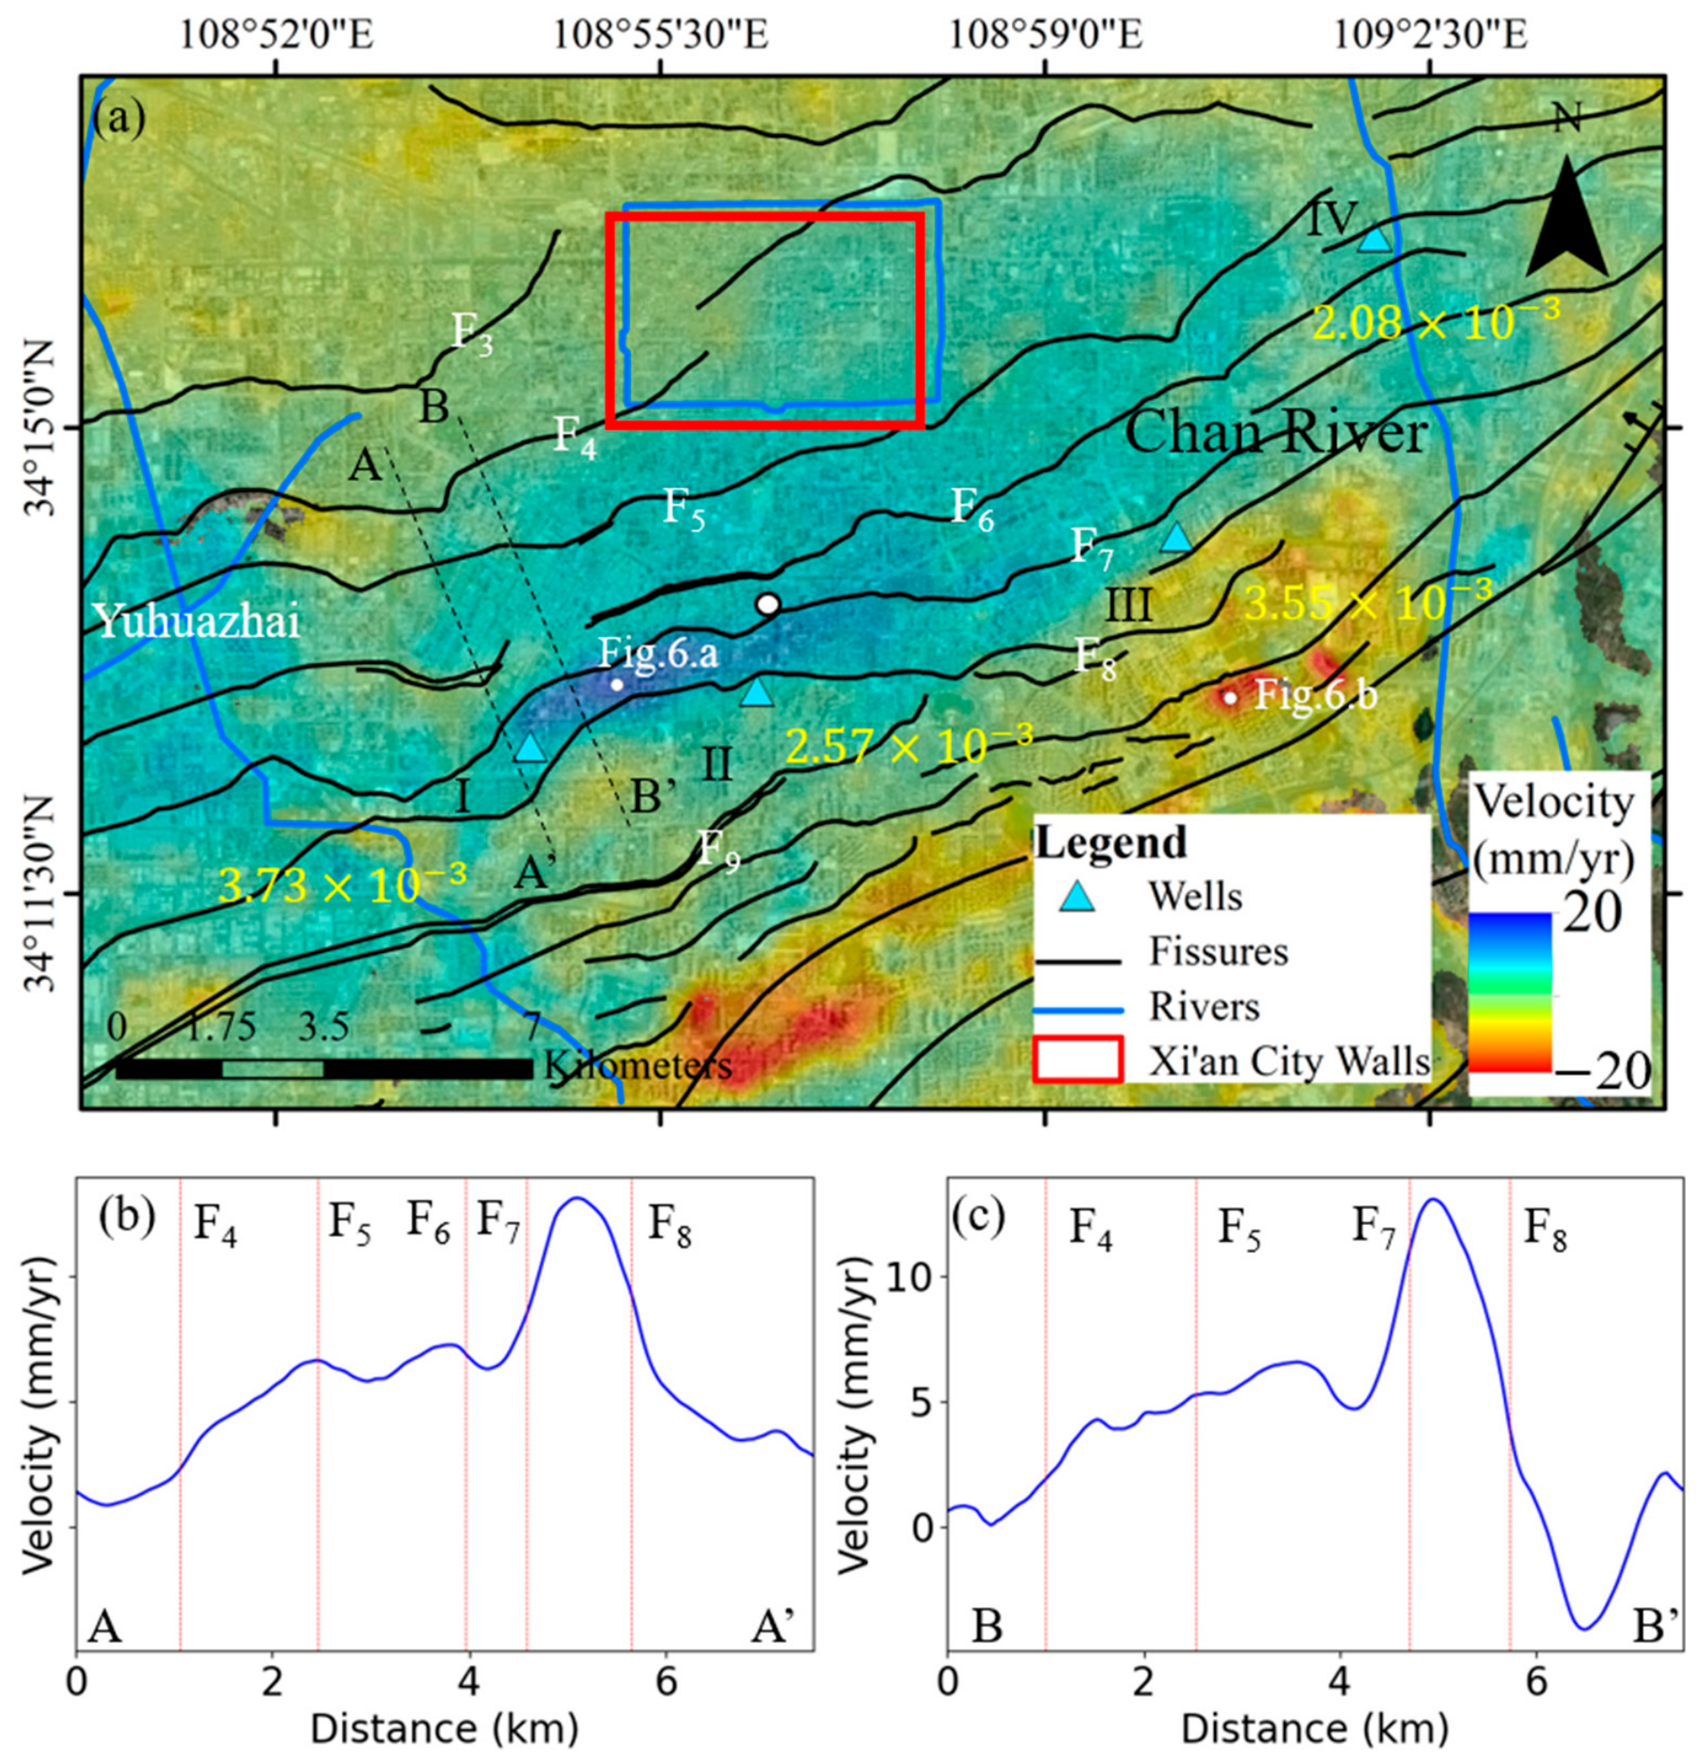
A large-scale uplift zone has emerged south of the Xi’an city wall, dominating the regional pattern of vertical land motion. Quantitatively, over 120 km2 of the region exhibits velocities exceeding 5 mm/year. Notably, most of this currently uplifting region had experienced severe land subsidence from the 1960s to the 2010s, with maximum accumulated subsidence exceeding 2000 mm due to excessive groundwater extraction [24,25]. The boundaries of the uplifted zone are highly correlated with the traces of ground fissures, specifically F4 and F8. This controlling effect is particularly evident near the area of maximum uplift rate. Both the velocity map and cross-sectional profiles clearly demonstrate that ground fissures F7 and F8 demarcate the zone of highest uplift velocities, with sharply contrasting deformation rates observed across these fissures (Figure 6b,c).
Figure 6.
Vertical velocity with ground fissures. (a) Zoomed in view of the uplifting region south of Xi’an city. The Roman numerals I, II, III, and IV indicate the wells. Numbers in yellow are the derived storage coefficients at specific wells indicated as blue triangles. Dotted lines are the velocity profiles across ground fissures shown in (b,c).
3.2. Temporal Characteristics of the Vertical Land Motion and Storage Coefficients
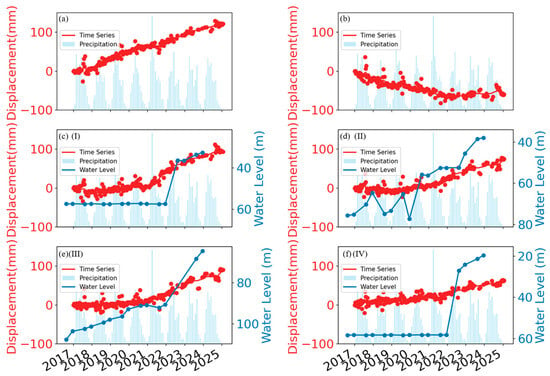
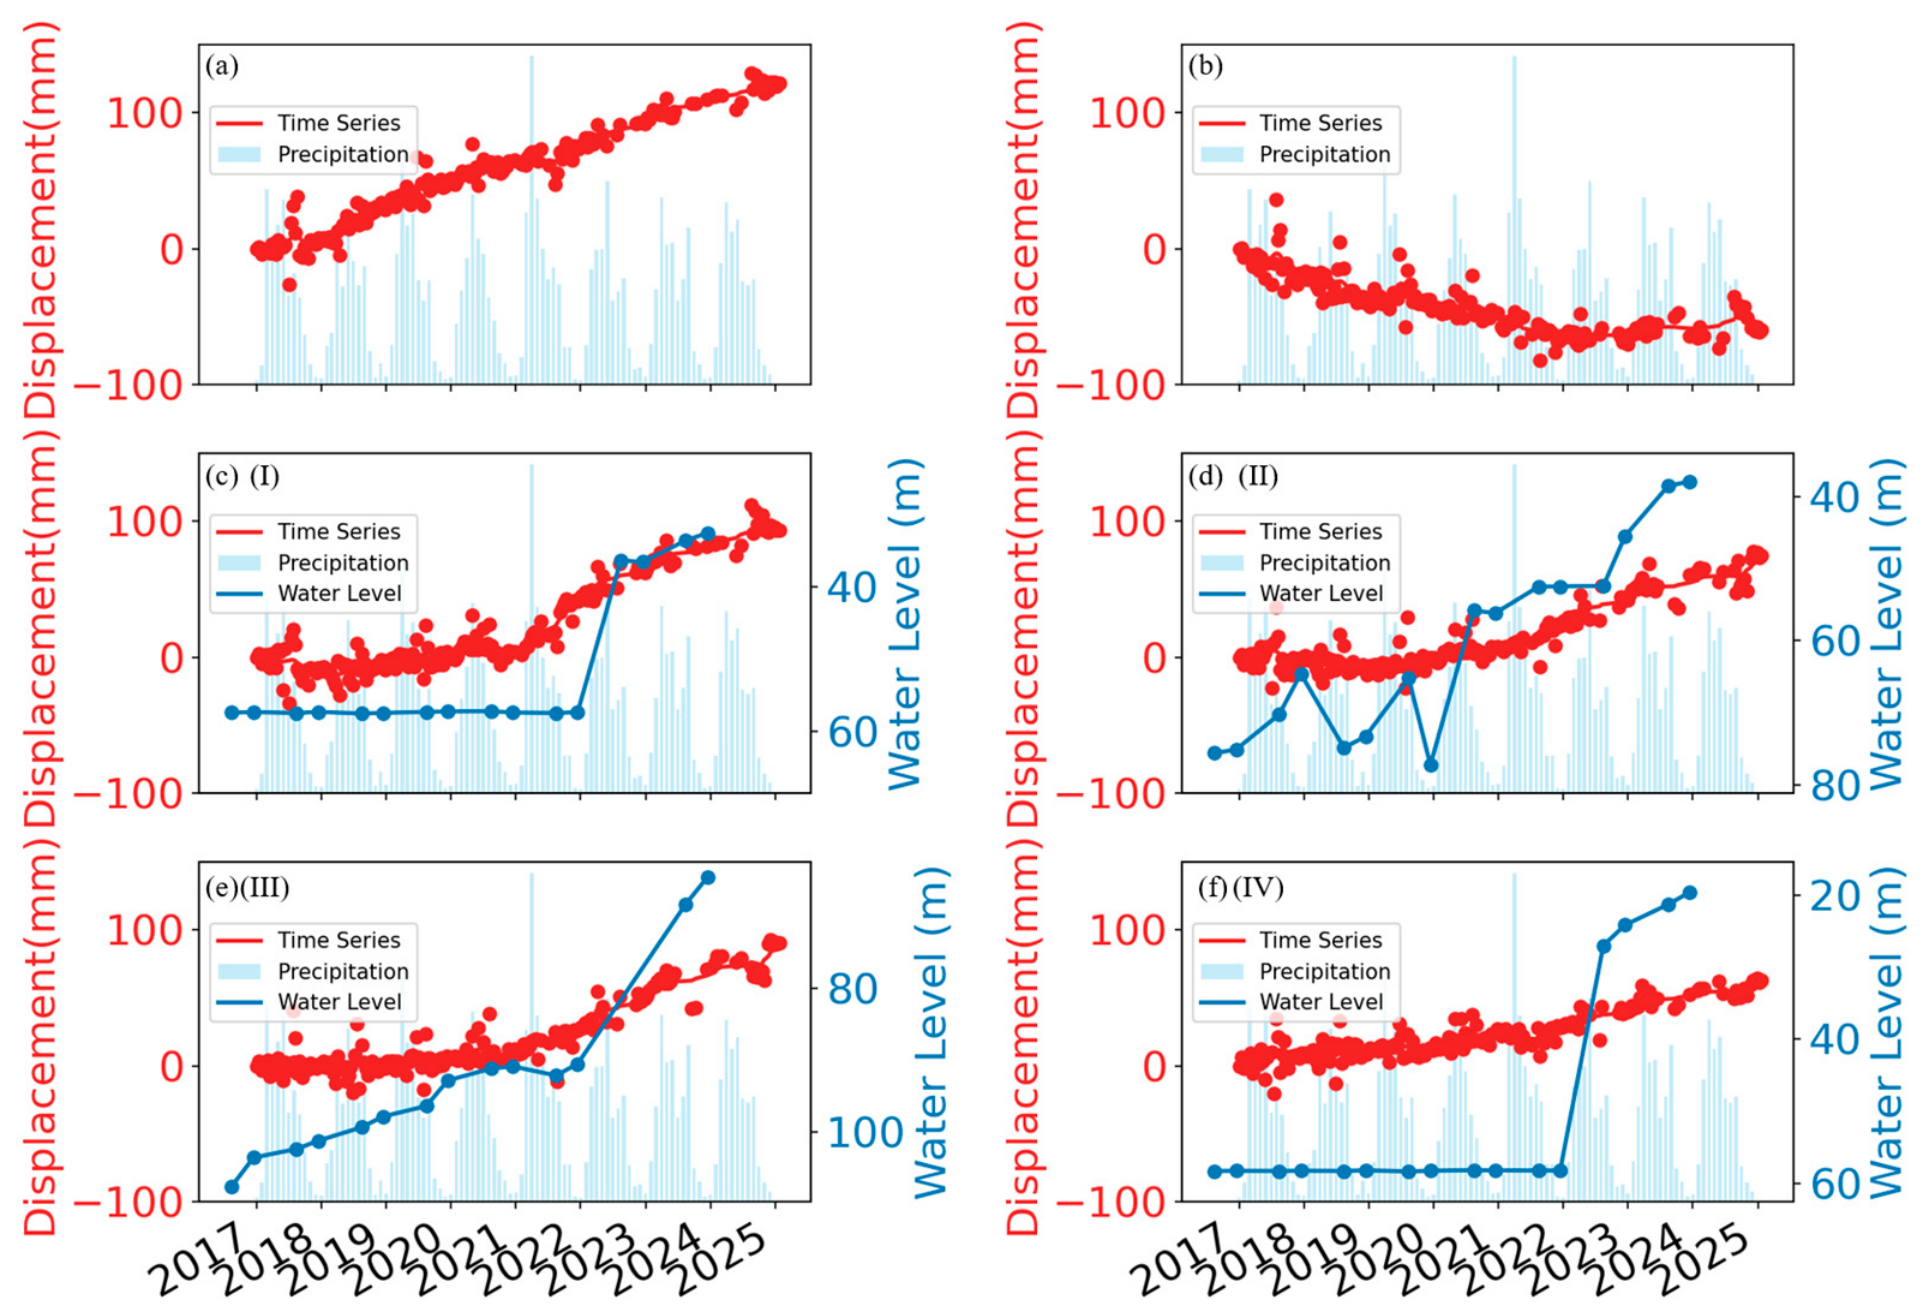
The time-series analysis of areas with the most rapid uplift (~20 mm/year) and subsidence (~−10 mm/year) reveals distinct deformation patterns during our observation period (2017–2025) (Figure 7a,b). The rapidly uplifting area is located between ground fissures F7 and F8, and the boundaries are highly related to these fissures (Figure 6 and Figure 7a). The linear trend observed in the time series indicates that the uplift has persisted for over seven years. This sustained motion appears largely unaffected by seasonal precipitation, even after the summer of 2021, when an extreme rainfall event hit north China [38]. The localized subsidence is in a city village that has been subsiding since the 1990s [28]. However, the time series indicates a notable change after 2019: the subsidence rate has decelerated, and a slight uplift has even commenced (Figure 7b).
Figure 7.
The time series of deformation, precipitation, and groundwater levels on 6 selected sample points shown in Figure 6a. (a,b) are time series with the largest velocities of uplift and subsidence in Figure 6a, respectively. (c–f) are time series from locations of wells I–IV indicated in Figure 6.
To investigate the relationship between vertical motion and groundwater levels, we present the time series of deformation and groundwater levels in the shallow confined aquifer from four wells (I–IV, locations shown in Figure 6) (Figure 7c–f). Notably, the groundwater levels of wells I, III, and IV exhibit abrupt increases of tens of meters following the extreme rainfall event in north China [38], as indicated by significant precipitation in July 2021. This suggests that the subsequent rise in groundwater level is likely attributable to enhanced recharge from this extreme rainfall event. All three wells are located within the uplifting area bounded by ground fissures F4 and F8, indicating that the confined aquifer in this fissure-delineated block experienced rapid recharge after the 2021 extreme rainfall event. In contrast, records of well II, which is close to well I, but south of the bounding fissure F8, exhibit little correlation with the 2021 event, implying that the fissure F8 acts as a constraint to the confined aquifer system.
Although the surface uplift in this area is correlated with the rising water levels in the local confined aquifer, the deformation response to groundwater recharge varies spatially. Using the hydrological model described in Section 3.3, we calculated the storage coefficients at locations of well I to IV, which are and , respectively (Figure 6). Notably, the storage coefficients for Wells I and III are consistently high and significantly larger than those for Wells II and IV. This spatial pattern aligns with the geological structure: Wells I and III are located within the block bounded by fissures F7 and F8, whereas Wells II and IV are situated outside this area. The disparity in storage coefficients suggests that ground fissures differentially influence the groundwater system. Some of them, such as F7 and F8, appear to function as major hydraulic barriers, creating distinct hydrogeological units, whereas others may have only minor effects. The large storage coefficients indicate that the region exhibiting the most rapid uplift is associated with an aquifer system possessing strong groundwater capabilities.
The groundwater levels rose significantly after the 2021 rainfall event, but it is evident that the ground uplifts began before 2017 and became more prominent in 2020 rather than after the 2021 event. Records of wells II and III indicate a steady rise in groundwater levels since 2017, accompanied by continued surface uplift. Because surface uplift can reflect a rise in the water level of the local confined aquifer, the confined aquifer beneath this uplift zone is likely receiving substantial groundwater recharge before 2017, while the confined aquifer on the opposite side of the fissure receives significantly less recharge.
3.3. Aquifer Diffusivity in Yuhuazhai Estimated from Deformation Inflection Points
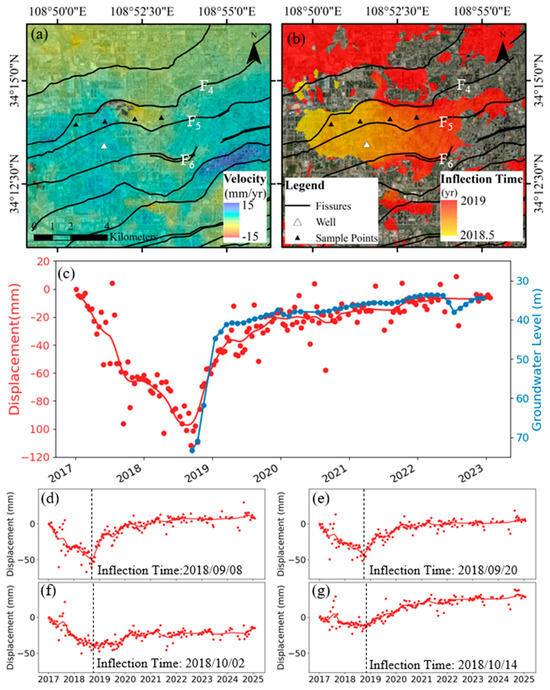
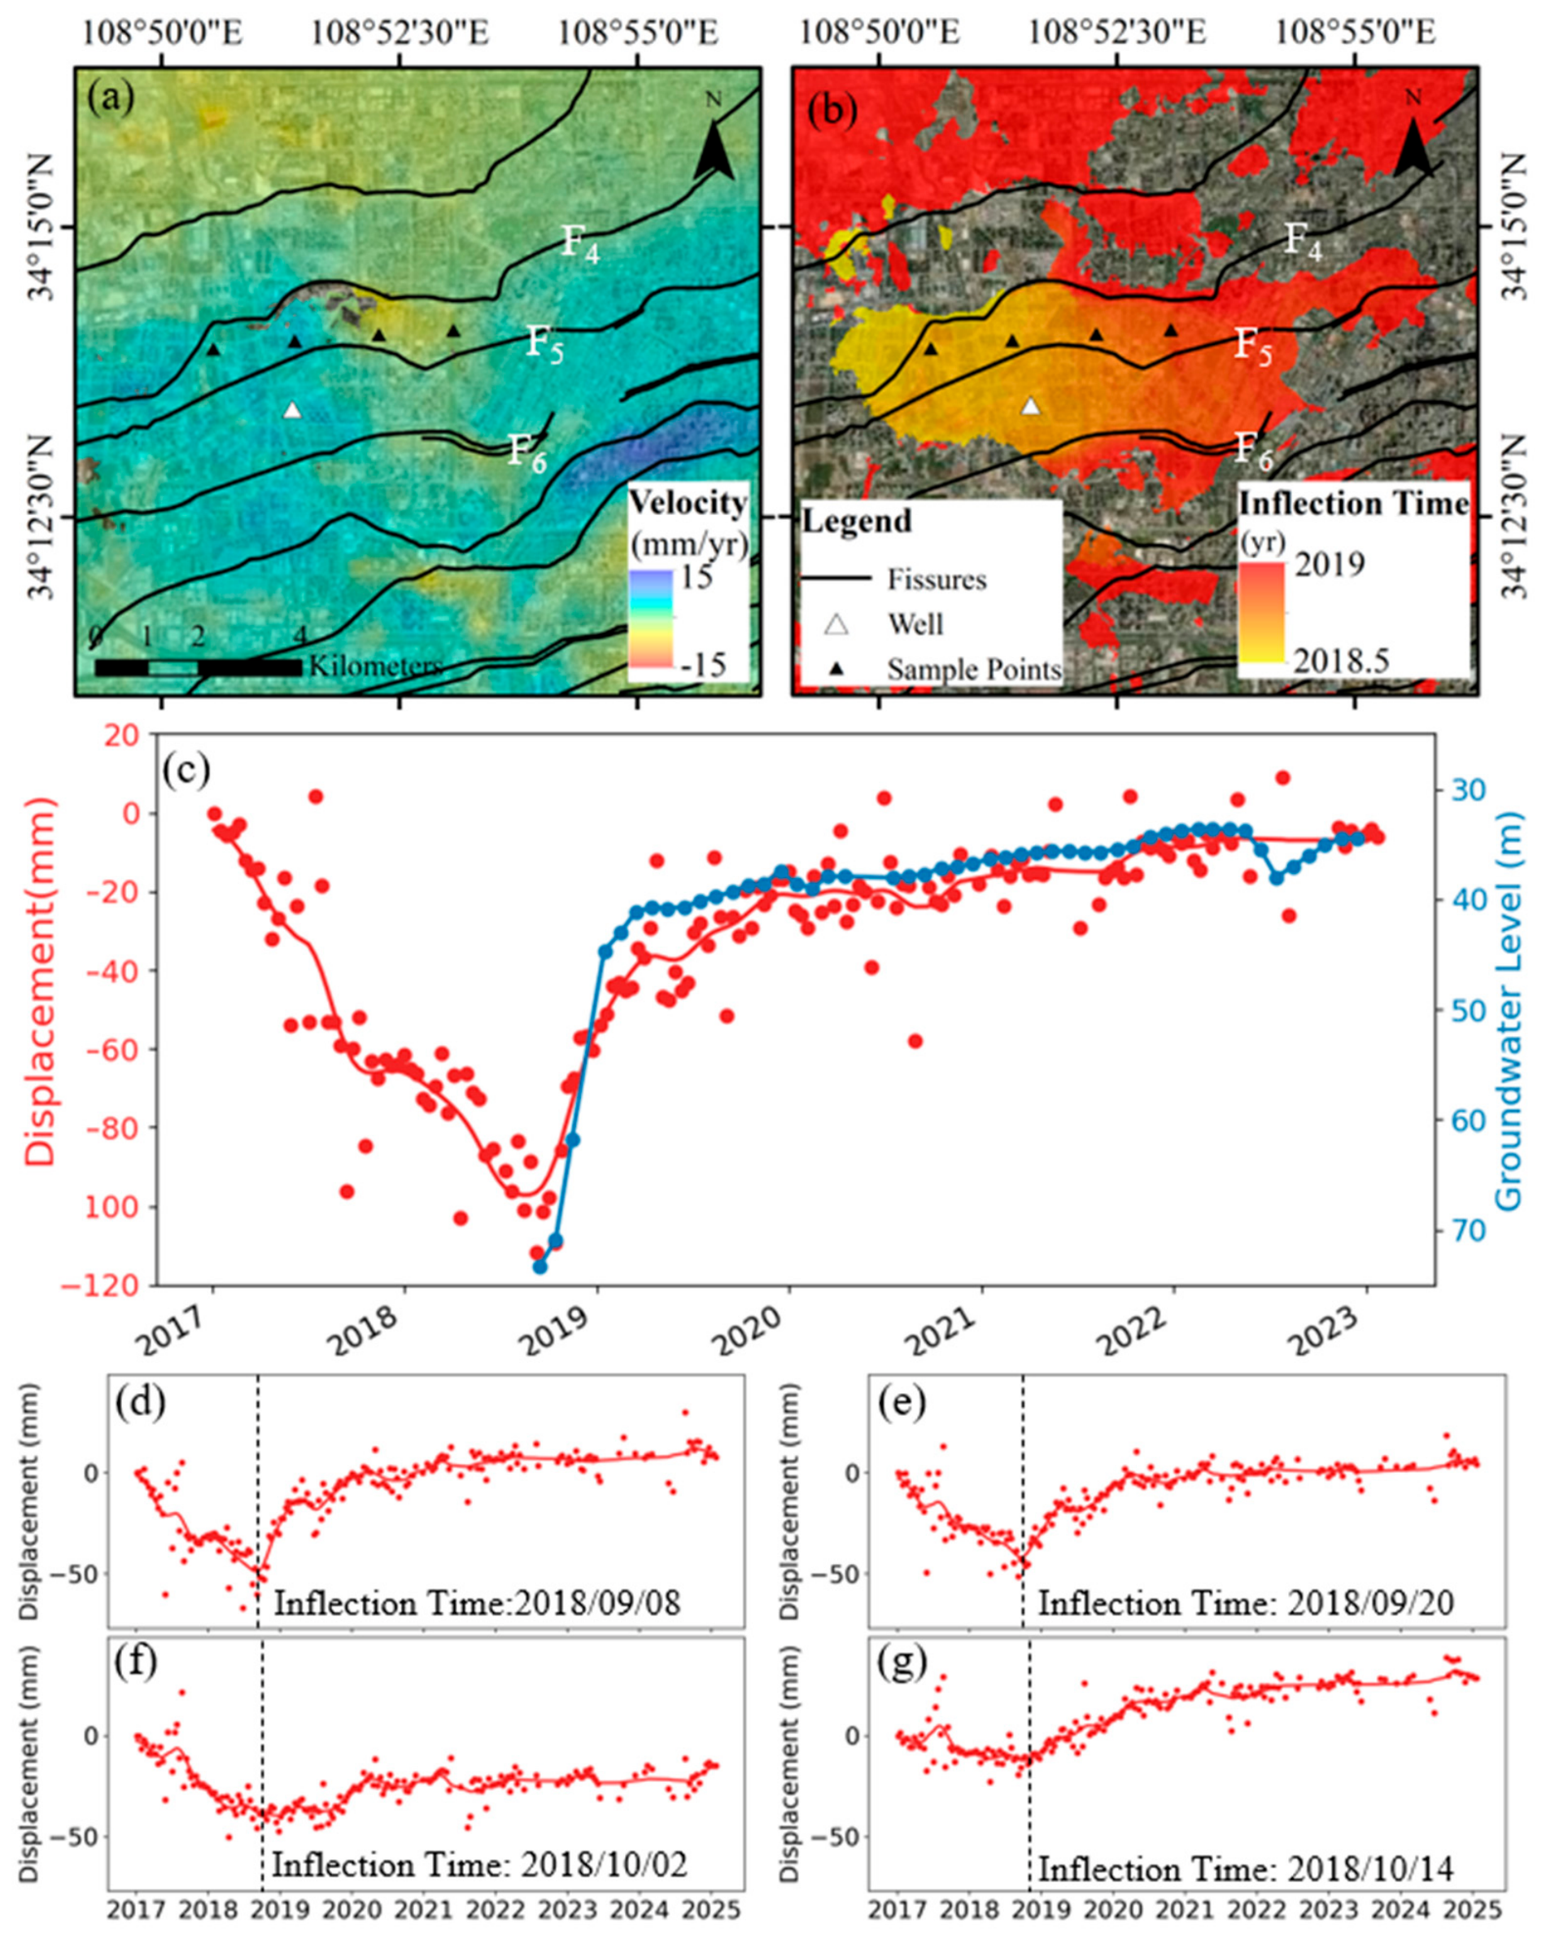
Yuhuazhai, located southwest of the Xi’an city wall, now exhibits a slightly positive velocity (~5 mm/year), in contrast to the significant subsidence observed in the 2000s [26]. Time-series analysis shows an abrupt transition from subsidence to uplift at the end of 2018, with the ground ultimately recovering to a level close to the position in 2017. The groundwater level record from a local well corresponds closely with this deformation time series (Figure 8c). The specific storage coefficient at this well is , similar to that of well II (Figure 6), south of the fissure F4 but across Fissure F5. This implies that Fissure F5 may not play a role in separating the aquifer system, consistent with observations that the deformation field smoothly crosses it.
Figure 8.
The spatial and temporal evolution of deformation of Yuhuazhai. (a) The velocity map around Yuhuazhai. (b) The time of deformation inflection derived from the PELT model. (c) shows the time series and the water level of the well indicated as a white triangle in (a) [29]. (d–g) These are the time series of 4 sampling points from west to east, as indicated by black triangles in (a).
To elucidate the spatiotemporal evolution of the subsidence-to-uplift reversal, we apply the PELT algorithm (Section 3.2) to detect inflection points within the deformation time series for each pixel in Yuhuazhai. We primarily focus on identifying inflection points where the deformation trend shifts from subsidence to uplift. Pixels that show no inflection or multiple inflection points during the observation period are discarded. From the spatial distribution of the deformation reversal timing, it is evident that the reversal of vertical land motion has evolved eastward since the middle of 2018 and has continued for half a year. This timing aligns with the period when managed aquifer recharge projects were implemented in the region (Figure 8b,d–g) [26].
Because the eastward evolution reflects the diffusion of groundwater in the shallow confined aquifer, this spatiotemporal diffusion pattern and the observed time lag provide insight into the confined aquifer’s hydraulic diffusivity. We apply the one-dimensional diffusion equation to model this process and calculate the permeability coefficient based on the diffusion time lag, resulting in a value of = m2/s. Furthermore, we observed a significant difference in the timing of deformation inflection points across fissures F4 and F6. This may indicate that fissures F4 and F6 disrupt the continuity of the confined aquifer, thereby impeding diffusion (Figure 8b), whereas fissure F5 does not. This is consistent with what we observed in the deformation field and in the specific storage coefficients across it.
4. Discussion
4.1. Cross-Validation and Reliability of InSAR Results
Due to access restrictions on continuous GNSS and precise leveling data in the study area during the observation period, we cross-validated our InSAR results with recently published independent studies to ensure data reliability. Zhang et al. (2023) utilized high-resolution TerraSAR-X data (2015–2022) to monitor land subsidence in Xi’an [39]. Their independent multi-sensor observations revealed a highly consistent spatial distribution pattern with our Sentinel-1 results, particularly confirming the location and trend of the significant surface uplift in the Yuhuazhai area. Furthermore, Hao et al. (2025) also independently identified the Yuhuazhai uplift using Sentinel-1 datasets [40]. The extent and the evolutionary trend of the deformation identified in their study align well with our measurements. This cross-validation across both independent processing pipelines and multi-sensor datasets demonstrates the high reliability and accuracy of our time-series InSAR analysis [40].
4.2. Possible Mechanism of the Uplift in Xi’an
The identified sustained uplift within the urban area of Xi’an shows a strong correlation with the rising groundwater levels. This phenomenon can be attributed to several key factors. First, the region experienced severe land subsidence since the 1960s due to groundwater over-exploitation [24]; the current uplift may represent an elastic rebound effect as aquifer pressures recover. Second, the strict enforcement of groundwater management policies after 2015, which prohibited unauthorized extraction, has facilitated the natural recovery of groundwater levels. Third, the extreme precipitation event in 2021 likely enhanced recharge to surface water bodies like rivers and reservoirs, subsequently contributing to groundwater replenishment. Furthermore, we observe that the spatial boundaries of the uplift zone closely correlate with some of the ground fissures. This spatial correspondence suggests that these fissures function as hydraulic barriers within the subsurface hydrological system, thereby providing supporting evidence for interpretations related to their formation mechanisms and hydrogeological function.
When interpreting this spatial correspondence, particularly the pattern of subsidence and uplift across fissure boundaries, it is necessary to consider the potential contribution of active regional tectonics. However, several evidence suggest that active tectonics are not the primary driver of the recently observed rapid uplift. First, from a spatial perspective (Figure 5), the boundaries of the primary uplifting zone align with ground fissures rather than the regional faults, indicating that the deformation is localized and not a tectonic fault-slip response. Second, the Weihe Basin is an extensional graben dominated by normal faulting, which is incompatible with a thrust-faulting regime. Furthermore, the observed rapid uplift rates (orders of magnitude higher than regional tectonic slip rates) and their abrupt temporal coincidence with the 2018 groundwater policy shifts contradict a tectonic origin [27]. Consequently, although pre-existing fissures structurally constrain the deformation extent as hydraulic barriers, the primary forcing mechanism of the recent uplift is definitively anthropogenic hydrogeological recovery rather than tectonic activity.
Our hydrological model incorporates several necessary assumptions. The model assumes a direct correspondence between vertical land motion and the groundwater level variations in the confined aquifer. However, there are inherent limitations in the calculation of storage coefficients. Firstly, hydraulic connectivity exists between unconfined and confined aquifers, which may lead to upward flow from confined to unconfined aquifers. Secondly, the temporal responses of the monitoring wells exhibit clear spatial heterogeneity due to different dominant driving factors (as shown in Figure 7). For instance, Wells II (Figure 7d) show a steady rise prior to the heavy rainfall, which is primarily a response to the long-term groundwater extraction ban [26]. In contrast, two sites (Well I, Well III and Well IV, Figure 7c,e,f) exhibited rapid groundwater level changes within a short period following a lag after the extreme precipitation. Since our initial calculation of the storage coefficient is based on the total deformation and water level change observed from 2017 to 2025, the estimated values in these specific areas may not fully represent the intrinsic hydraulic properties of the shallow confined aquifer, as they might be influenced by transient, non-equilibrium conditions.
4.3. Hydrological and Geological Controls of the Surface Uplift Following the 7.20 Event
In modeling the diffusion behavior, we treat changes in hydraulic head as a one-dimensional diffusion process, assuming homogeneous aquifer parameters along the linear flow path. This simplification may be reasonable for localized areas, particularly within blocks bounded by ground fissures that constrain lateral flow. However, its validity decreases when applied over larger spatial scales or in geologically heterogeneous settings where aquifer properties vary significantly. Under such complex conditions, the model framework would need to be redesigned to incorporate spatial variability and structural complexities. An alternative method for estimating hydraulic diffusivity involves analyzing the time lag between groundwater level changes at two surface points separated by a known distance [41]. It is noteworthy that in areas with similar geological conditions and over relatively short distances, the estimated diffusion coefficients typically exhibit limited variation.
The most direct method to control the groundwater overexploitation is artificial groundwater injection or backfilling [17,42]. The hydraulic diffusivity values quantified for the Yuhuazhai area in this study provide critical parameters for designing such policy measures. These values can inform decisions regarding optimal injection rates and predict the spatial extent of the resulting groundwater mound, thereby helping to manage potential impacts on surrounding areas. Furthermore, they offer scientific guidance for determining the optimal placement and spacing of injection wells to maximize the efficiency and effectiveness of recharge operations. Beyond the local context of Xi’an, the methodological framework demonstrated here is highly transferable. This framework can be applied to other complex aquifer systems globally to provide cost-effective constraints for artificial recharge design and regional groundwater management.
4.4. Hazards Associated with Uplift Regions
Many studies have documented that land subsidence resulting from groundwater over-extraction poses significant risks to urban infrastructure, such as building collapse risks or structural cracking due to uneven ground settlement [16,43]. Rising groundwater levels are beginning to cause an emerging challenge in some regions. In coastal areas, groundwater tables have been observed to rise concurrently with sea-level rise [44]. Elevated groundwater levels can adversely affect the urban environment, leading to issues such as basement seepage and foundation deterioration. Moreover, the increased groundwater may intrude into underground spaces which designed and built when the groundwater level was much lower. For example, well records in Xi’an show as much as a 30 m increase in groundwater level in a very short time. In extreme cases, high groundwater levels may even induce seismicity [45]. These multifaceted risks underscore the necessity for proactive intervention and mitigation strategies.
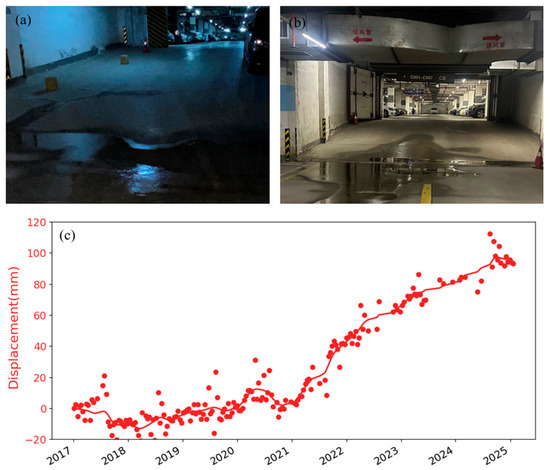
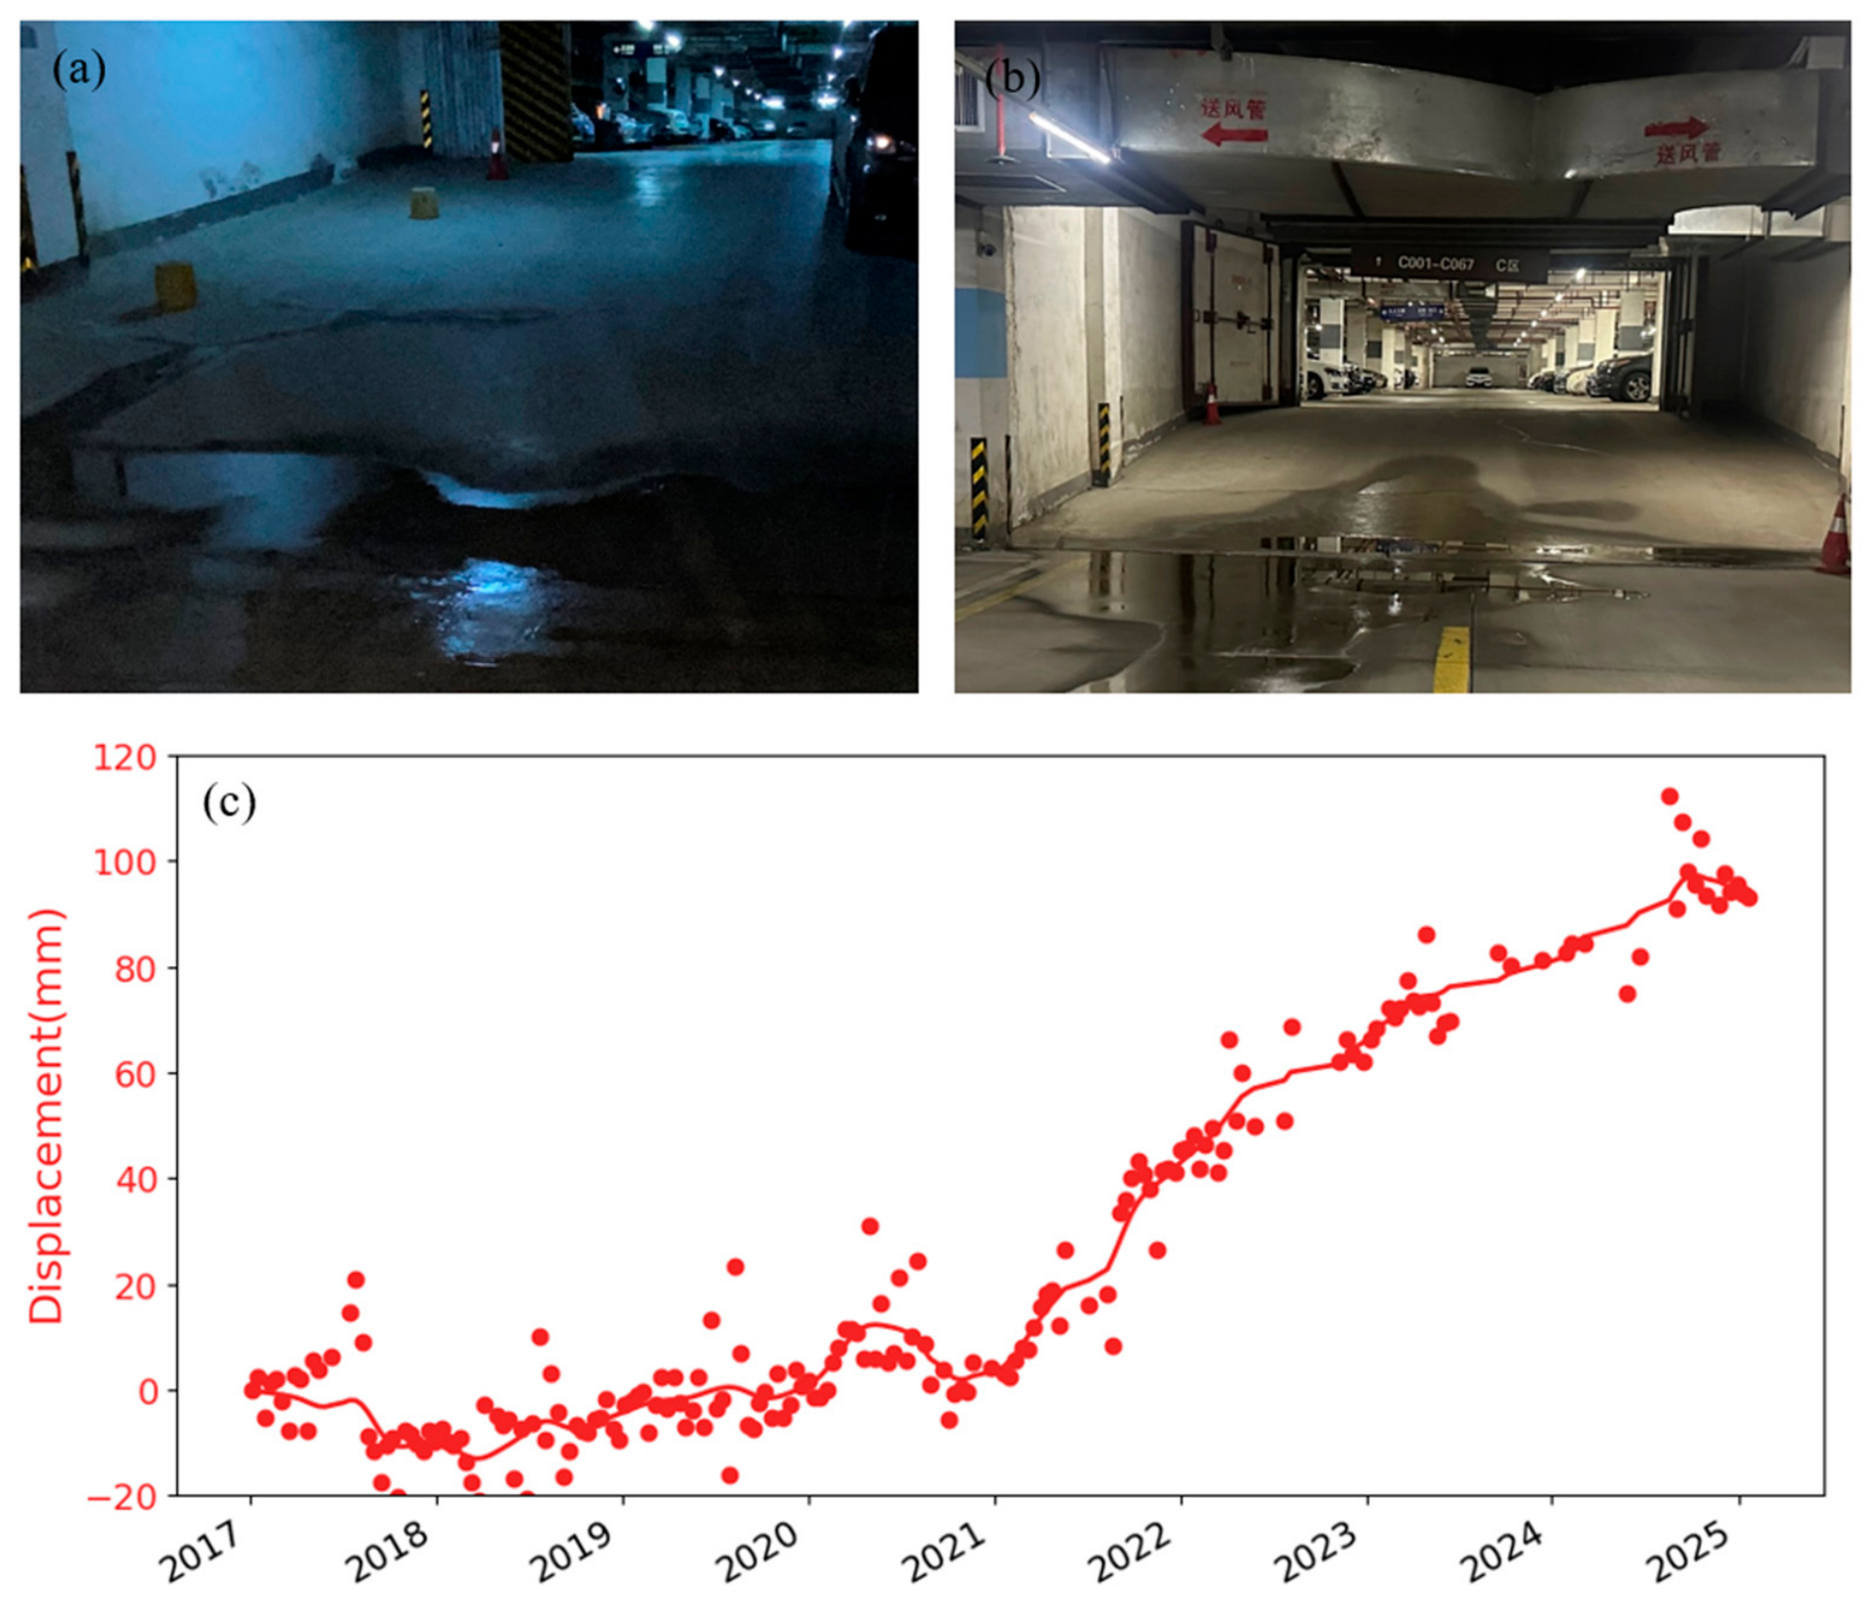
In regions with a history of groundwater over-extraction, surface rebound or uplift observed by time-series InSAR often serves as a direct proxy for local groundwater-level recovery. Meanwhile, surface uplift caused by rising groundwater can pose risks to urban infrastructure and buildings, primarily due to the potential for uneven vertical motion. Time-series InSAR analyses have confirmed that some cities in China have experienced surface uplift due to water management and climate change [18,21]. In regions of Xi’an experiencing noticeable uplift, residents have reported basement water seepage, prompting the implementation of seepage prevention measures in Xi’an’s subway system. Our field investigations within the InSAR-identified uplift zones in Xi’an documented severe water seepage in the underground parking garages of several residential communities (Figure 9). This issue was reported in 2020 and has adversely affected residents’ daily lives. The seepage phenomenon shows a clear correlation with the ongoing ground uplift, which itself is a direct indicator of rising groundwater levels. This case demonstrates that InSAR-derived deformation velocity maps, which indicate increases in groundwater levels, can serve as an effective tool for monitoring and anticipating such geotechnical hazards.
Figure 9.
The hazards and the time series of this observation in Xi’an. (a,b) show the photos of basement water seepage in the underground garage. The non-English text visible in (b) is a background sign for an air supply duct in the garage. (c) shows the time series of this location. Its location is indicated by the white dot with a black outline in Figure 6a.
As multi-level underground construction becomes increasingly large-scale and complex in urban areas, encompassing infrastructure such as pipeline networks and subway systems, the challenge of rising groundwater levels introduces new risks to subsurface engineering integrity. Currently, groundwater recovery has been documented in some cities worldwide [46,47], a trend that, in turn, increases the probability of surface uplift. Therefore, surface uplift is an important indicator of potential geological hazards and should be taken seriously [18,48]. Our findings highlight a critical paradigm shift required in future urban geohazard management. As global climate change and human interventions continue to alter subsurface hydrological balances, urban planners must transition from subsidence to dual-hazard monitoring and management. Based on the findings of this study, we recommend that urban geohazard mitigation strategies incorporate systematic monitoring of vertical land motion, with equal emphasis on both uplift and subsidence areas, to ensure the long-term safety of underground infrastructure and overall risk assessment and management.
5. Conclusions
This study presents a high-resolution assessment of vertical land motion in Xi’an, China, from 2017 to 2025 using SBAS-InSAR time-series analysis combined with groundwater observations. The results reveal a sustained, spatially extensive surface uplift of up to 20 mm/yr, primarily in the southern urban area, where severe subsidence had previously occurred. The correlation between surface uplift and groundwater level rise in the shallow confined aquifer demonstrates that vertical land motion can serve as a sensitive indicator of subsurface hydraulic recovery. The calculated storage and diffusion coefficients further quantify this hydro–mechanical response, showing spatial variability constrained by fissures.
Some of the ground fissures in Xi’an were found to coincide with sharp gradients in vertical velocity and variations in hydraulic parameters, suggesting that they act as structural and hydrological boundaries controlling the groundwater system. This finding emphasizes the dual role of fissures as both mechanical discontinuities and hydrogeological interfaces. The analysis of inflection points of time-series deformation in the Yuhuazhai area also supports this interpretation, revealing eastward-propagating deformation consistent with groundwater diffusion following recharge activities.
The observed uplift highlights the urban geological hazards. Rapid groundwater rebound, while beneficial for subsidence mitigation, can trigger uneven uplift, water seepage in basements, and structural stress on underground facilities. The identification of these uplift-related hazards underscores the necessity for continuous monitoring and integrated groundwater management strategies that account for both subsidence and uplift risks.
Nevertheless, uncertainties remain in quantifying aquifer properties from surface deformation, due to simplified model assumptions and the limited temporal resolution of InSAR and groundwater records. Future research should refine coupled hydro–mechanical models that incorporate fissure geometry and heterogeneous lithology and integrate in situ stress and pore-pressure monitoring. Such efforts will improve our understanding of the feedback between human water management, aquifer mechanics, and vertical land motion—ultimately contributing to safer and more sustainable urban groundwater governance.
Author Contributions
Conceptualization, T.W.; methodology, W.S.; formal analysis, W.S.; investigation, R.Z. and X.W.; writing—original draft preparation, W.S.; writing—review and editing, T.W.; supervision, T.W.; funding acquisition, T.W. All authors have read and agreed to the published version of the manuscript.
Funding
This research is funded by the National Natural Science Foundation of China (42374019).
Data Availability Statement
The Sentinel-1 SAR data were provided by the European Space Agency (ESA) through the Co-pernicus Open Access Hub. The precipitation data can be accessed via the CHIRPS dataset. The link to download the original SBAS-InSAR data, as well as the inflection point detection function in this study, is available at Zenodo [49]. All other data generated during this study are available from the corresponding author upon reasonable request.
Conflicts of Interest
The authors declare no conflicts of interest.
Abbreviations
The following abbreviations are used in this manuscript:
| InSAR | Interferometric Synthetic Aperture Radar |
| SAR | Synthetic Aperture Radar |
| SBAS | Small Baseline Subset |
| RMS | Root Mean Square |
| PELT | Pruned Exact Linear Time |
| CHIRPS | Climate Hazards Group InfraRed Precipitation with Station data |
References
- Ye, S.; Xue, Y.; Wu, J.; Yan, X.; Yu, J. Progression and mitigation of land subsidence in China. Hydrogeol. J. 2016, 24, 685–693. [Google Scholar] [CrossRef] [Scilit]
- de Graaf, I.E.M.; Gleeson, T.; van Beek, L.P.H.; Sutanudjaja, E.H.; Bierkens, M.F.P. Environmental flow limits to global groundwater pumping. Nature 2019, 574, 90–94. [Google Scholar] [CrossRef] [Scilit]
- Osmanoglu, B.; Dixon, T.H.; Wdowinski, S.; Cabral-Cano, E.; Jiang, Y. Mexico City subsidence observed with persistent scatterer InSAR. Int. J. Appl. Earth Obs. Geoinf. 2011, 13, 1–12. [Google Scholar] [CrossRef] [Scilit]
- Stramondo, S.; Bozzano, F.; Marra, F.; Wegmuller, U.; Cinti, F.R.; Moro, M.; Saroli, M. Subsidence induced by urbanisation in the city of Rome detected by advanced InSAR technique and geotechnical investigations. Remote Sens. Environ. 2008, 112, 3160–3172. [Google Scholar] [CrossRef] [Scilit]
- Bai, L.; Jiang, L.; Zhao, Y.; Li, Z.; Cao, G.; Zhao, C.; Liu, R.; Wang, H. Quantifying the influence of long-term overexploitation on deep groundwater resources across Cangzhou in the North China Plain using InSAR measurements. J. Hydrol. 2022, 605, 127368. [Google Scholar] [CrossRef] [Scilit]
- Chen, C.X.; Pei, S.P.; Jiao, J.J. Land subsidence caused by groundwater exploitation in Suzhou City, China. Hydrogeol. J. 2003, 11, 275–287. [Google Scholar] [CrossRef] [Scilit]
- Ao, Z.; Hu, X.; Tao, S.; Hu, X.; Wang, G.; Li, M.; Wang, F.; Hu, L.; Liang, X.; Xiao, J.; et al. A national-scale assessment of land subsidence in China’s major cities. Science 2024, 384, 301–306. [Google Scholar] [CrossRef] [Scilit] [PubMed]
- Galloway, D.L.; Burbey, T.J. Review: Regional land subsidence accompanying groundwater extraction. Hydrogeol. J. 2011, 19, 1459–1486. [Google Scholar] [CrossRef] [Scilit]
- Shirzaei, M.; Freymueller, J.; Törnqvist, T.E.; Galloway, D.L.; Dura, T.; Minderhoud, P.S.J. Measuring, modelling and projecting coastal land subsidence. Nat. Rev. Earth Environ. 2021, 2, 40–58. [Google Scholar] [CrossRef] [Scilit]
- Perissin, D.; Wang, T. Time-Series InSAR Applications Over Urban Areas in China. IEEE J. Sel. Top. Appl. Earth Obs. Remote Sens. 2011, 4, 92–100. [Google Scholar] [CrossRef] [Scilit]
- Li, S.; Xu, W.; Li, Z. Review of the SBAS InSAR Time-series algorithms, applications, and challenges. Geod. Geodyn. 2022, 13, 114–126. [Google Scholar] [CrossRef] [Scilit]
- Massoud, E.C.; Liu, Z.; Shaban, A.; El Hage, M. Groundwater Depletion Signals in the Beqaa Plain, Lebanon: Evidence from GRACE and Sentinel-1 Data. Remote Sens. 2021, 13, 915. [Google Scholar] [CrossRef] [Scilit]
- Medici, C.; Del Soldato, M.; Fibbi, G.; Bini, L.; Confuorto, P.; Mannori, G.; Mucci, A.; Pellegrineschi, V.; Bianchini, S.; Raspini, F.; et al. InSAR data for detection and modelling of overexploitation-induced subsidence: Application in the industrial area of Prato (Italy). Sci. Rep. 2024, 14, 17950. [Google Scholar] [CrossRef] [Scilit] [PubMed]
- Morishita, Y. Nationwide urban ground deformation monitoring in Japan using Sentinel-1 LiCSAR products and LiCSBAS. Prog. Earth Planet. Sci. 2021, 8, 6. [Google Scholar] [CrossRef] [Scilit]
- Neely, W.R.; Borsa, A.A.; Burney, J.A.; Levy, M.C.; Silverii, F.; Sneed, M. Characterization of Groundwater Recharge and Flow in California’s San Joaquin Valley From InSAR-Observed Surface Deformation. Water Resour. Res. 2021, 57, e2020WR028451. [Google Scholar] [CrossRef] [Scilit] [PubMed]
- Parker, A.L.; Pigois, J.P.; Filmer, M.S.; Featherstone, W.E.; Timms, N.E.; Penna, N.T. Land uplift linked to managed aquifer recharge in the Perth Basin, Australia. Int. J. Appl. Earth Obs. Geoinf. 2021, 105, 102637. [Google Scholar] [CrossRef] [Scilit]
- Lubitz, C.; Motagh, M.; Wetzel, H.-U.; Kaufmann, H. Remarkable Urban Uplift in Staufen im Breisgau, Germany: Observations from TerraSAR-X InSAR and Leveling from 2008 to 2011. Remote Sens. 2013, 5, 3082–3100. [Google Scholar] [CrossRef] [Scilit]
- Tang, W.; Zhao, X.; Motagh, M.; Bi, G.; Li, J.; Chen, M.; Chen, H.; Liao, M. Land subsidence and rebound in the Taiyuan basin, northern China, in the context of inter-basin water transfer and groundwater management. Remote Sens. Environ. 2022, 269, 112792. [Google Scholar] [CrossRef] [Scilit]
- Long, D.; Yang, W.; Scanlon, B.R.; Zhao, J.; Liu, D.; Burek, P.; Pan, Y.; You, L.; Wada, Y. South-to-North Water Diversion stabilizing Beijing’s groundwater levels. Nat. Commun. 2020, 11, 3665. [Google Scholar] [CrossRef] [Scilit]
- Xu, H.; Li, M.; Wang, T.; Ge, D.; Pan, Y. Decadal water management measures moderated the subsidence of North China Plain. Sci. Bull. 2025, 70, 1538–1541. [Google Scholar] [CrossRef] [Scilit]
- Zhang, C.; Duan, Q.; Yeh, P.J.F.; Pan, Y.; Gong, H.; Gong, W.; Di, Z.; Lei, X.; Liao, W.; Huang, Z.; et al. The Effectiveness of the South-to-North Water Diversion Middle Route Project on Water Delivery and Groundwater Recovery in North China Plain. Water Resour. Res. 2020, 56, e2019WR026759. [Google Scholar] [CrossRef] [Scilit]
- Zhang, L.; Deng, Y.; Xue, J.; Wang, H.; Liu, Q.; Yang, Y. Preliminary research on dynamic response characteristics of microtremor at ground fissure sites illustrated with F_6 ground fissure in Xi’an. J. Eng. Geol. 2017, 25, 784–793. [Google Scholar]
- Gleeson, T.; Wada, Y.; Bierkens, M.F.P.; van Beek, L.P.H. Water balance of global aquifers revealed by groundwater footprint. Nature 2012, 488, 197–200. [Google Scholar] [CrossRef] [Scilit] [PubMed]
- Li, G.; Zhao, C.; Wang, B.; Peng, M.; Bai, L. Evolution of spatiotemporal ground deformation over 30 years in Xi’an, China, with multi-sensor SAR interferometry. J. Hydrol. 2023, 616, 128764. [Google Scholar] [CrossRef] [Scilit]
- Zhang, Q.; Zhao, C.-Y.; Ding, X.-L.; Chen, Y.-Q.; Wang, L.; Huang, G.-W.; Yang, C.-S.; Ding, X.-G.; Ma, J. Research on recent characteristics of spatio-temporal evolution and mechanism of Xi’an land subsidence and ground fissure by using GPS and InSAR techniques. Chin. J. Geophys. Ed. 2009, 52, 1214–1222. [Google Scholar] [CrossRef]
- Guo, X.; Zhao, C.; Li, G.; Peng, M.; Zhang, Q. A Multifactor-Based Random Forest Regression Model to Reconstruct a Continuous Deformation Map in Xi’an, China. Remote Sens. 2023, 15, 4795. [Google Scholar] [CrossRef] [Scilit]
- Yao, Y.; Zhang, M.; Deng, Y.; Dong, Y.; Wu, X.; Kuang, X. Evaluation of environmental engineering geology issues caused by rising groundwater levels in Xi’an, China. Eng. Geol. 2021, 294, 106350. [Google Scholar] [CrossRef] [Scilit]
- Wang, B.; Zhao, C.; Zhang, Q.; Lu, Z.; Pepe, A. Long-Term Continuously Updated Deformation Time Series From Multisensor InSAR in Xi’an, China From 2007 to 2021. IEEE J. Sel. Top. Appl. Earth Obs. Remote Sens. 2021, 14, 7297–7309. [Google Scholar] [CrossRef] [Scilit]
- Wang, B.; Zhao, C.; Zhang, Q.; Peng, M. Sequential InSAR Time Series Deformation Monitoring of Land Subsidence and Rebound in Xi’an, China. Remote Sens. 2019, 11, 2854. [Google Scholar] [CrossRef] [Scilit]
- Chang, J.; Jiang, J. Water Dispatch of the South-to-North Water Transfer Project in Shaanxi Province. J. Nat. Resour. 2011, 26, 110–118. [Google Scholar] [CrossRef]
- Zhou, Z.; Hu, J.; Wang, J.; Wang, L.; Qiao, T.; Li, Z.; Cheng, S. Identifying spatiotemporal pattern and trend prediction of land subsidence in Zhengzhou combining MT-InSAR, XGBoost and hydrogeological analysis. Sci. Rep. 2025, 15, 3848. [Google Scholar] [CrossRef] [Scilit] [PubMed]
- Berardino, P.; Fornaro, G.; Lanari, R.; Sansosti, E. A new algorithm for surface deformation monitoring based on small baseline differential SAR interferograms. IEEE Trans. Geosci. Remote Sens. 2002, 40, 2375–2383. [Google Scholar] [CrossRef] [Scilit]
- Maghsoudi, Y.; Hooper, A.J.; Wright, T.J.; Lazecky, M.; Ansari, H. Characterizing and correcting phase biases in short-term, multilooked interferograms. Remote Sens. Environ. 2022, 275, 113022. [Google Scholar] [CrossRef] [Scilit]
- Morishita, Y.; Lazecky, M.; Wright, T.J.; Weiss, J.R.; Elliott, J.R.; Hooper, A. LiCSBAS: An Open-Source InSAR Time Series Analysis Package Integrated with the LiCSAR Automated Sentinel-1 InSAR Processor. Remote Sens. 2020, 12, 424. [Google Scholar] [CrossRef] [Scilit]
- Killick, R.; Fearnhead, P.; Eckley, I.A. Optimal Detection of Changepoints With a Linear Computational Cost. J. Am. Stat. Assoc. 2012, 107, 1590–1598. [Google Scholar] [CrossRef] [Scilit]
- Freeze, R.A.; Cherry, J.A. Groundwater; Prentice-Hall: Englewood Cliffs, NJ, USA, 1979. [Google Scholar]
- Turcotte, D.; Schubert, G. Geodynamics, 3rd ed.; Cambridge University Press: Cambridge, UK, 2014. [Google Scholar]
- Zhang, M.; Liu, D.; Wang, S.; Xiang, H.; Zhang, W. Multisource Remote Sensing Data-Based Flood Monitoring and Crop Damage Assessment: A Case Study on the 20 July 2021 Extraordinary Rainfall Event in Henan, China. Remote Sens. 2022, 14, 5771. [Google Scholar] [CrossRef] [Scilit]
- Zhang, X.; Cheng, Z.; Xu, B.; Gui, R.; Hu, J.; Yang, C.; Yang, Q.; Xiong, T. Coupling the Relationship between Land Subsidence and Groundwater Level, Ground Fissures in Xi’an City Using Multi-Orbit and Multi-Temporal InSAR. Remote Sens. 2023, 15, 3567. [Google Scholar] [CrossRef] [Scilit]
- Hao, G.; Chen, F.; Lu, Q.; Sun, Y.; Qiang, F.; Zhang, S. Characteristics of Rebound Deformation Caused by Groundwater Level Recovery: A Case Study of the Yuhuazhai Area in Xi’an, China. Appl. Sci. 2025, 15, 9470. [Google Scholar] [CrossRef] [Scilit]
- Attar, A.; Muggeridge, A. Low salinity water injection: Impact of physical diffusion, an aquifer and geological heterogeneity on slug size. J. Pet. Sci. Eng. 2018, 166, 1055–1070. [Google Scholar] [CrossRef] [Scilit]
- Buzzanga, B.; Bekaert, D.P.S.; Hamlington, B.D.; Kopp, R.E.; Govorcin, M.; Miller, K.G. Localized uplift, widespread subsidence, and implications for sea level rise in the New York City metropolitan area. Sci. Adv. 2023, 9, eadi8259. [Google Scholar] [CrossRef] [Scilit]
- Wu, S.; Zhang, B.; Liang, H.; Wang, C.; Ding, X.; Zhang, L. Detecting the Deformation Anomalies Induced by Underground Construction Using Multiplatform MT-InSAR: A Case Study in To Kwa Wan Station, Hong Kong. IEEE J. Sel. Top. Appl. Earth Obs. Remote Sens. 2021, 14, 9803–9814. [Google Scholar] [CrossRef] [Scilit]
- Cox, S.C.; Ettema, M.H.J.; Chambers, L.A.; Stephens, S.A.; Bodeker, G.E.; Nguyen, Q.; Diaz-Rainey, I.; Moore, A.B. Empirical Models of Shallow Groundwater and Multi-Hazard Flood Forecasts as Sea-Levels Rise. Earths Future 2025, 13, e2024EF004977. [Google Scholar] [CrossRef] [Scilit]
- Deng, F.; Dixon, T.H.; Xie, S. Surface Deformation and Induced Seismicity Due to Fluid Injection and Oil and Gas Extraction in Western Texas. J. Geophys. Res. Solid Earth 2020, 125, e2019JB018962. [Google Scholar] [CrossRef] [Scilit]
- Jasechko, S.; Seybold, H.; Perrone, D.; Fan, Y.; Shamsudduha, M.; Taylor, R.G.; Fallatah, O.; Kirchner, J.W. Rapid groundwater decline and some cases of recovery in aquifers globally. Nature 2024, 625, 715–721. [Google Scholar] [CrossRef] [Scilit]
- Nan, T.; Cao, W.; Wang, Z.; Gao, Y.; Zhao, L.; Sun, X.; Na, J. Evaluation of shallow groundwater dynamics after water supplement in North China Plain based on attention-GRU model. J. Hydrol. 2023, 625, 130085. [Google Scholar] [CrossRef] [Scilit]
- Saraswat, A.; Tsai, Y.-L.S.; Chen, F.-C.; Han, J.-Y. 3D deformation analysis in a metropolitan area during ongoing subway construction using time series InSAR. Tunn. Undergr. Space Technol. 2025, 155, 106190. [Google Scholar] [CrossRef] [Scilit]
- Sun, W.; Wang, T. InSAR Reveals Groundwater-Induced Surface Uplift and Aquifer Properties with Associated Hazards in Xi’an, China. Zenodo 2025. [Google Scholar] [CrossRef]
Disclaimer/Publisher’s Note: The statements, opinions and data contained in all publications are solely those of the individual author(s) and contributor(s) and not of MDPI and/or the editor(s). MDPI and/or the editor(s) disclaim responsibility for any injury to people or property resulting from any ideas, methods, instructions or products referred to in the content. |
© 2026 by the authors. Licensee MDPI, Basel, Switzerland. This article is an open access article distributed under the terms and conditions of the Creative Commons Attribution (CC BY) license.