


Highlights
What are the main findings?
- Earlier soil thawing advances the start of the growing season in wet areas but delays it in dry regions, with alpine meadows showing higher sensitivity than grasslands.
- Active layer thickening advances the end of the growing season by draining water and nutrients away from shallow roots, affecting alpine meadows more significantly than grasslands.
What are the implications of the main findings?
- Downward movement of water and nutrients from shallow soil may offset the potential lengthening of growing seasons under climate warming, because deeper drainage limits resources for shallow-rooted plants.
- Soil moisture is the key factor linking permafrost degradation to vegetation phenology, meaning future models should consider these subsurface processes when predicting ecosystem responses.
Abstract
The Source Region of the Yangtze River is a high-altitude area with extensive permafrost on the Tibetan Plateau. While temperature, precipitation, and radiation significantly affect vegetation phenology, the influence of permafrost changes remains unclear. Using the daily Long-term Seamless NOAA AVHRR NDVI Dataset of China (2003–2022), we extracted the start (SOS) and end (EOS) of the growing season in the Source Region of the Yangtze River (SRYR). Soil thawing date (SOT) was obtained from freeze–thaw state products, while active layer thickness (ALT) was estimated using the Stefan model based on MODIS land surface temperature (LST). Partial least squares regression and mediation analysis quantified the direct and indirect effects of permafrost degradation. Results show: (1) The end of the growing season (EOS) became significantly earlier in 64.33% of the region, while the start of the growing season (SOS) showed little change. (2) The effect of SOT on SOS depends on moisture conditions. Earlier SOT leads to earlier SOS in wetter areas by supplying meltwater, but delays SOS in cold–dry areas by increasing soil water loss. (3) Thicker ALT strongly promotes earlier EOS, accounting for up to 42.61% of EOS variation in cold–dry zones, because a deeper active layer potentially promotes downward movement of water, which may further lead to the potential leaching of nutrients from the shallow root zone, limiting resources for shallow-rooted plants. (4) Alpine meadows respond more strongly to permafrost changes than alpine grasslands. Overall, water loss caused by permafrost degradation may reduce the potential lengthening of the growing season under climate warming, highlighting the key role of soil water in linking permafrost and vegetation dynamics.
1. Introduction
Global warming has driven the widespread and systemic degradation of permafrost across the Northern Hemisphere [1,2,3]. This process profoundly affects the structural and functional stability of alpine ecosystems by altering surface energy balances, hydrological pathways, and soil nutrient availability [4,5,6,7]. As a sensitive region, the Tibetan Plateau shows significant permafrost thinning, a thicker active layer (ALT), and earlier thawing [8,9]. These changes have become central issues in land surface research. The Source Region of the Yangtze River (SRYR), located in the heart of the plateau, is a typical high-altitude area with continuous permafrost. Due to its complex terrain and unique water–heat interactions, the response of vegetation to permafrost degradation in this region remains to be further clarified.
Vegetation phenology is a sensitive indicator of how ecosystems respond to environmental changes [10,11,12,13,14]. In permafrost regions, pre-season temperature and precipitation directly drive the start of the growing season (SOS) [15,16,17]. However, since the soil freeze–thaw process primarily controls liquid water availability in the root zone [18,19], it often has a greater influence on vegetation than standard meteorological factors. The change in soil thawing date (SOT) is a key sign of permafrost degradation, reflecting yearly changes in underground thermal conditions. The advancement in SOT is physically linked to the thickening of the active layer (ALT) and regulates the seasonal start of water and heat movement within the soil. SOT affects SOS by removing physical barriers to water uptake [6,20] and influencing soil microbial activity [21,22]. Due to extreme elevation and a thin atmosphere, the SRYR experiences intense solar radiation and high potential evapotranspiration (PET) [23]. This context creates a trade-off for SOT impacts: while earlier SOT provides liquid water, it also increases the time that soil moisture can be lost to the air. In the SRYR, the earlier onset of spring thawing increases the duration of soil moisture exposure to intense solar radiation and wind, leading to rapid evaporative loss. If evaporative loss exceeds the combined moisture supplied by soil ice melt and insufficient precipitation, the resulting soil moisture deficit [19,20,24] leads to a delay in the SOS.
Compared to spring phenology, the response of the autumn end of the growing season (EOS) to permafrost degradation remains less understood. Active layer thickness (ALT) thickening reshapes subsurface hydrology, potentially affecting EOS in two opposing ways. On one hand, as the permafrost table lowers with increasing ALT, water drains more easily into deeper soil [25,26,27]. This reduces root zone moisture [25,28] and advances EOS [29]. On the other hand, a thicker ALT may expand the potential soil water storage capacity [30,31], relieving late-season water stress and delaying EOS. This asymmetric response, driven by the dynamic balance between water supply and loss, reflects the complex phenological shifts in permafrost environments.
Therefore, focusing on the permafrost regions of the Source Region of the Yangtze River (SRYR), this study integrates multi-source remote sensing with Stefan model calculations to address the following objectives: (1) quantify the contributions of SOT and ALT to vegetation phenology from 2003 to 2022 using partial least squares (PLS) and analyze the model coefficients for dominant vegetation types across elevation and hydrothermal gradients; and (2) calculate the direct, indirect through soil moisture, and total effects of SOT on the SOS and ALT for the EOS using mediation models. By analyzing these asymmetric effects of permafrost degradation, this study aims to reveal the response patterns of alpine ecosystems to changing subsurface thermal conditions.
2. Materials and Methods
2.1. Study Area
The Source Region of the Yangtze River (SRYR) is located in the hinterland of the Tibetan Plateau (32°30′–35°50′N, 90°30′–97°10′E), covering a total area of approximately 1.37 × 10⁵ km2 (Figure 1). It serves as a representative area for high-altitude permafrost research [32]. The terrain slopes from west to east, with elevations ranging from 3500 m to over 6500 m and a mean elevation exceeding 4500 m. The steep elevational gradient shapes complex local topography and creates significant spatial heterogeneity in surface hydrothermal distribution. The mean annual air temperature in the region ranges from −9 °C to 4.3 °C. Permafrost is extensive and highly continuous, making the SRYR a core zone for permafrost development on the Tibetan Plateau. Precipitation is highly seasonal, concentrated between June and September. The annual precipitation increases from less than 500 mm in the northwest to 800 mm in the southeast. The dominant vegetation type is alpine grassland, primarily distributed across the high-altitude, arid west and central parts of the study area. The spatial heterogeneities of hydrothermal distribution and vegetation types were characterized based on multi-source remote sensing products and meteorological forcing datasets (see Section 2.2 for details).
Figure 1.
Geographical location, permafrost distribution, and hydrothermal climate characteristics of the Source Region of the Yangtze River (SRYR). (a) Location of the SRYR on the Tibetan Plateau and its permafrost distribution. (b) Digital Elevation Model (DEM), major rivers, lakes, and glacier distribution within the study area. (c) Spatial distribution of vegetation types. (d) Spatial distribution of mean annual air temperature (Temp). (e) Spatial distribution of mean annual precipitation (Prec).
2.2. Data
2.2.1. Vegetation Dataset
Vegetation phenology was characterized using the “Long-term Seamless Daily NDVI Dataset of China (1981–2023)” [33] (https://doi.org/10.1038/s41597-024-03364-3). By fusing AVHRR and MODIS observations to remove systematic sensor differences, this dataset provides a continuous, gap-free time series with a daily 0.05° spatial resolution, making it suitable for capturing phenological changes in the SRYR.
Vegetation type data were obtained from the 500 m annual vegetation maps of the Qinghai–Tibet Plateau (2000–2022) [34] (https://doi.org/10.5194/essd-17-773-2025). This GEE-based dataset has an overall accuracy of 83.27% and a Kappa coefficient of 0.82, providing a reliable representation of vegetation distribution in the study area.
2.2.2. Meteorological Dataset
Daily precipitation and near-surface air temperature were obtained from the “Multi-source Data Fusion of China’s High-resolution Multi-element Meteorological Driving Product (ChinaMet)” [35] (https://doi.org/10.1016/j.jhydrol.2024.132214), which has a spatial resolution of 0.01°.
Surface net solar radiation data were sourced from the “Long-term High-resolution Ground Meteorological Forcing Dataset for the Third Pole (TPMFD, 1979–2023)” [36] (https://doi.org/10.1007/s11430-024-1507-6) with a spatial resolution of 1/30°.
The 1 km resolution soil moisture dataset for the Tibetan Plateau (2003–2022) was obtained from the Tibetan Plateau/Third Pole Environment Data Center (Beijing, China) [37] (https://doi.org/10.5194/essd-13-3239-2021). Validation shows that the product is highly consistent with field measurements (R > 0.78, ubRMSE < 0.05 m3/m3).
2.2.3. Soil Freeze–Thaw Datasets
Daily all-weather land surface temperature (LST) data were sourced from the “All-weather Land Surface Temperature Dataset for Western China (TRIMS LST-TP V2)” [38] (https://doi.org/10.5194/essd-16-387-2024). This dataset effectively addresses the missing data issues in thermal infrared remote sensing caused by cloud cover, providing seamless LST inputs for ALT modeling.
The permafrost distribution map was obtained from the ‘Mean annual ground temperature (MAGT) and permafrost thermal stability dataset over the Tibetan Plateau (2005–2015)’ [39] (https://doi.org/10.1007/s11430-020-9685-3) to define the ALT simulation scope. Soil type data were sourced from [40].
The “Global 0.05° Near-Surface Freeze-Thaw Status Dataset v2.0 (2002–2023)” [41] (https://doi.org/10.5194/essd-17-6273-2025) was used to determine the soil thawing date (SOT).
2.2.4. Topographic Dataset
Elevation data were obtained from the SRTM V3 dataset at a 30 m spatial resolution, provided by NASA (Goddard Space Flight Center, Greenbelt, MD, USA) via the EarthData platform (https://earthdata.nasa.gov/ (accessed on 22 April 2026)) and processed using the Google Earth Engine (GEE) platform (Google LLC, Mountain View, CA, USA). To ensure consistency in spatial analysis, all datasets were resampled to a uniform 1 km resolution to align with the native spatial scale of the primary driving factors and maintain physical consistency in the estimation of ALT. Specifically, we employed bilinear interpolation for continuous variables, including NDVI, SOT, elevation, and meteorological data, while nearest neighbor interpolation was used for categorical data such as vegetation types. The detailed data sources and information are provided in Table 1.
Table 1.
Detailed information and sources of the datasets (all links accessed on 22 April 2026).
2.3. Methods
2.3.1. Estimation of the ALT
- (1)
- ALT Estimation Based on the Stefan Model
In this study, the Stefan model [42,43] was used to calculate the ALT in the SRYR from 2003 to 2022. This calculation integrated data on permafrost extent, soil types, all-weather LST, and high-resolution meteorological forcing. The specific calculation formulas are as follows:
where ALTi is the active layer thickness in year i; DDTi is the surface thawing index in year I; E is the edaphic factor, which represents the thermal properties of the soil profile. To account for the energy exchange between the atmosphere and the ground surface, the edaphic factor E is determined as follows:
where is the thermal conductivity of the thawed soil; represents the ratio of degree–day sums of the ground surface to air temperatures; represents the time conversion factor; represents the latent heat of ice melting; represents the soil bulk density; represents the moisture content; and represents the unfrozen water content. Detailed information is provided in Table 2. Five primary soil types are distributed across the SRYR: Aridisols, Entisols, Gelisols, Inceptisols, and Mollisols. The thermal parameters for these soil types are detailed in Table 3, with specific values adapted from [44].
Table 2.
Acronym used in the equations.
Table 3.
Soil thermal parameters of each type.
- (2)
- Degree–Days of Thaw (DDT) Calculation
Degree–days of thaw (DDT) are defined as the annual cumulative sum of daily mean ground surface temperatures (GST) exceeding 0 °C at a depth of 0 cm. Satellite-based thermal infrared observations capture the radiance emitted from the surface skin layer (including bare soil or vegetation canopy) rather than the ground surface temperature (GST) at a depth of 0 cm. We converted satellite-based LST observations into GST through the implementation of an empirical formula [45]. The empirical formula is as follows:
where and are the daytime and nighttime LST observations from the TRIMS product corresponding to Terra overpass times, respectively; and represent the daytime and nighttime LST observations for Aqua overpass times. Based on the calculated daily GST sequence, the annual DDT values were obtained by calculating the cumulative sum of all daily values exceeding 0 °C within a calendar year.
2.3.2. Determination of the SOT
Annual SOT at the pixel level was extracted from the near-surface soil freeze–thaw status dataset. The extraction followed two primary criteria. First, non-soil pixels—including water bodies, urban areas, glaciers, and snow cover—were masked and excluded from the analysis. Additionally, stable pixels with no freeze–thaw transitions were excluded. Second, the annual SOT was defined as the first day when the state code transitioned from frozen (code 1) to thawed (code 2) and subsequently remained in a thawed state for at least seven consecutive days [46].
2.3.3. Determination of Vegetation Phenology
To quantify the spatiotemporal evolution of vegetation phenology, pixel-level NDVI time series from the “Long-term Seamless Daily NDVI Dataset of China (1981–2023)” were processed. The double-logistic curve-fitting algorithm was used to reconstruct continuous seasonal dynamics [47,48,49,50]. The fitting function is expressed as follows:
where is the simulated NDVI value for a given day of year (DOY); is the annual background NDVI; and represent the amplitude parameters for the early and late growing seasons; and are the dates for the midpoints of these two phases. and are the slope coefficients (curvature) for the green-up and senescence phases; based on the reconstructed NDVI curves, specific phenological nodes were identified using the curvature change rate method. SOS was defined as the DOY when the curvature change rate of the spring growth curve reached its local maximum. Similarly, EOS was defined as the DOY when the curvature change rate of the autumn curve reached its local maximum.
2.3.4. Analysis of Long-Term Trends
In this study, Theil–Sen Median slope estimation combined with the Mann–Kendall (M-K) test was employed to evaluate the pixel-level spatiotemporal trends of vegetation phenology (SOS, EOS) and permafrost factors (SOT, ALT) in the SRYR from 2003 to 2022. The formula for the slope β is as follows:
where represents the trend slope, indicating the annual rate of change; and are the variable values for years i and j, respectively; and n is the length of the time series. > 0 indicates a delay in phenological dates or an increase in the variable value, whereas < 0 signifies earlier phenology or a decrease in the variable value. We assessed the statistical significance of these trends using the Mann–Kendall Z-test. Values of |Z| > 1.96 indicate significant trends at the 95% confidence level (p < 0.05).
2.3.5. Determination of the Optimal Pre-Season Window for Meteorological Factors
Alpine vegetation phenology exhibits significant cumulative and lagging effects in response to environmental changes [51,52]. To isolate climate impacts, we calculated the correlations between phenology and temperature, precipitation, and radiation for each pixel across four time scales (30, 60, 90, and 120 days) [16,53,54]. The window with the highest absolute correlation was selected as the optimal scale to define the pre-season temperature (Pre-Temp), precipitation (Pre-Prec), and radiation (Pre-Srad). The calculation formula is as follows:
where P represents the phenological metric (SOS or EOS); and denotes the statistical value of the environmental factor within the corresponding k-day pre-season window.
We then applied partial correlation analysis to quantify the independent effects of permafrost factors and the selected pre-season factors on phenology while controlling for all other variables [52,55]. Statistical significance was determined at the p < 0.05 level.
2.3.6. Partial Least Squares Regression
To quantify the independent contributions of permafrost and climate factors to phenological variability, we used pixel-level partial least squares (PLS) regression [56]. PLS effectively addresses high collinearity among explanatory variables. Following [57], all variables were linearly detrended and standardized before modeling. This ensures the model identifies how year-to-year fluctuations—rather than long-term warming trends—drive phenological shifts. We identified significant drivers using the Variable Importance in Projection (VIP ≥ 1) and evaluated the direction of impact using model coefficients (MC).
2.3.7. Path Analysis and Contribution Partitioning
We used causal mediation analysis [58] to identify the pathways through which permafrost impacts vegetation phenology. Soil moisture (SM) was selected as the mediator because changes in permafrost control soil water availability, which directly affects vegetation growth [59,60].
The analysis was implemented using the mediation package within the R software environment (version 4.5.1, R Foundation for Statistical Computing, Vienna, Austria). All variables were Z-score-standardized via the scale function to ensure coefficient comparability. For each pixel, we built a mediator model for the effect of permafrost on soil moisture, and an outcome model for the effects of both permafrost and soil moisture on phenology. We used 500 bootstrap iterations to calculate two metrics. The indirect effect represents the impact of permafrost on phenology that is mediated by SM, while the direct effect represents the remaining impact of permafrost directly on phenology. To avoid the cancelation of opposing effects, the relative importance of each path was determined by comparing the absolute values of the direct and indirect effects. This analysis was repeated for each temperature and precipitation interval in the matrix to reveal how these effects change across environmental gradients.
Figure 2 shows the research steps from data inputs to permafrost derivation and statistical methods (PLS, gradient, and mediation).
Figure 2.
Research workflow from data inputs to statistical methods. The background colors represent different datasets, and the arrows indicate the logical flow of data and analysis.
3. Results
3.1. Spatiotemporal Trends of Vegetation Phenology
SOS ranged from DOY 160 to 180 across 94.08% of the region. Spatially, SOS was later in the central region (after DOY 172) and earlier in the southeastern and southern areas (Figure 3a). The Theil–Sen slope estimator revealed that SOS remained largely stable over the past 20 years. Advancing trends covered 49.57% of the region, with rates between −0.5 and 0 d/yr accounting for 37.29% of the area. Significant advancement occurred in 3.96% of the region (p < 0.05, Figure 3b). Delaying trends occupied 50.43% of the region, with rates between 0 and 0.5 d/yr at 36.35% and significant delays at only 2.21% (p < 0.05). EOS occurred earlier in the central region (before DOY 273) and later in the southeastern, southern, and northern parts (Figure 3c). The Theil–Sen slope estimator revealed a widespread advancing trend for EOS (Figure 3d). Advancing trends covered 70.65% of the region, with 45.69% of the area showing rates between −0.5 and 0 d/yr and 20.78% at −1.0 to −0.5 d/yr. Significant advancement occupied 64.33% of the region (p < 0.05). In contrast, significant delays appeared in only 19.04% of the area (p < 0.05).
Figure 3.
Multiyear average vegetation SOS and EOS and trend changes in the SRYR (2003–2022). (a,c) Spatial distribution of average SOS and EOS. (b,d) Spatial trends in SOS and EOS changes, where significant changes pass the p < 0.05 significance test.
3.2. Permafrost Degradation Trends
The mean annual SOT follows a clear spatial gradient, with earlier thawing in the southeast and later thawing toward the northwest (Figure 4a). Earlier SOT (before DOY 130) was primarily concentrated in the lower-elevation southeastern and central river valleys, whereas SOT was gradually delayed toward the northwestern interior. SOT ranged from DOY 120 to 150 across 56.75% of the region. The Theil–Sen slope estimator revealed that 73.10% of the region experienced an advancing trend in SOT from 2003 to 2022 (Figure 4b). Advancing rates were primarily concentrated between −2.0 and 0 d/yr. Significant advancement occurred in 22.74% of the region (p < 0.05), while significant delays occupied only 2.40% (p < 0.05).
Figure 4.
Spatial distribution of multiyear average SOT and ALT (a,c) and spatial trends of SOT and ALT (b,d) in the SRYR from 2003 to 2022, with significance set at p < 0.05.
The multiyear average ALT exhibited a distribution pattern characterized by thinner layers in the northwest and thicker layers in the southeast (Figure 4c). ALT ranged from 2.2 to 2.8 m across 87.76% of the region, where the 2.4–2.6 m interval was the most dominant at 40.18% of the area. The Theil–Sen slope estimator revealed a widespread thickening trend in ALT between 2003 and 2022, covering 90.22% of the region (Figure 4d). Thickening rates primarily ranged from 0 to 0.6 cm/yr. Statistically significant thickening occurred in 4.03% of the region (p < 0.05).
3.3. Correlation Between Grassland Phenology and Permafrost Degradation
SOS and SOT showed significant positive correlations in 7.07% of the area (p < 0.05). Significant negative correlations between SOS and SOT covered 2.96% of the area (Figure 5a). Significant correlations between SOS and Pre-Prec occurred in 15.68% of the area (Figure 5b), followed by Pre-Temp at 12.73% (Figure 5c) and Pre-Srad at 11.83% (Figure 5d). EOS and ALT showed significant negative correlations in 13.29% of the area (p < 0.05). Significant positive correlations between EOS and ALT appeared in only 3.87% of the area (Figure 6a). Significant correlations between EOS and Pre-Prec occurred in 20.22% of the area (Figure 6b), with Pre-Temp at 17.82% (Figure 6c) and Pre-Srad at 14.93% (Figure 6d) (Table 4).
Figure 5.
Spatial distribution of partial correlations between the SOS and environmental drivers. Spatial distribution of partial correlations between SOS and SOT (a), Pre-Temp (b), Pre-Prec (c), and Pre-Srad (d). Significant correlations are determined at the p < 0.05 level.
Figure 6.
Spatial distribution of partial correlations between the EOS and environmental drivers. Spatial distribution of partial correlations between EOS and ALT (a), Pre-Temp (b), Pre-Prec (c), and Pre-Srad (d). Significant correlations are determined at the p < 0.05 level.
Table 4.
Partial correlation between vegetation phenology and environmental drivers in the SRYR (2003–2022).
3.4. Interannual Sensitivity of Phenology to Permafrost and Climate Factors
For SOS, the regional mean model coefficients for Pre-Temp, Pre-Prec, Pre-Srad, and SOT were −0.15, −0.08, −0.05, and 0.07, respectively (Table 5). SOT showed a significant positive correlation with SOS in 20.95% of the region (VIP ≥ 1), indicating that earlier SOT directly drives earlier SOS. Conversely, 6.7% of the area exhibited a significant negative correlation, where earlier SOT led to a delayed SOS (Figure 7a). Temperature remained the primary factor, with significant negative correlations observed in 47.83% of the region (VIP ≥ 1, Figure 7b). Precipitation (Figure 7c) and radiation (Figure 7d) significantly influenced SOS across 47.33% and 44.64% of the area, respectively (VIP ≥ 1).
Table 5.
PLS regression statistics between vegetation SOS and the interannual variability of environmental factors (2003–2022).
Figure 7.
Spatial distribution of dominant factors and regression coefficients for SOS changes. (a–d) Spatial distribution of standardized regression coefficients for SOT, Pre-Temp, Pre-Prec, and Pre-Srad; significance is indicated by VIP ≥ 1. (e) Spatial distribution of the dominant driving factor for SOS changes determined by maximum absolute coefficients.
For EOS, the regional mean model coefficients for Pre-Temp, Pre-Prec, Pre-Srad, and ALT were 0.04, 0.19, −0.16, and −0.1, respectively (Table 6). ALT exhibited a significant negative correlation with the EOS across 27.32% of the study area. In contrast, significant positive correlations accounted for only 1.11% of the region. These results indicate that interannual thickening of the active layer primarily advances the EOS (Figure 8a). Among climate factors, Pre-Prec was the dominant driver, showing significant positive correlations with EOS in 67.19% of the region (VIP ≥ 1, Figure 8c). Within these significant areas, positive correlations occupied 92.35% of the pixels. In contrast, Pre-Srad showed significant negative correlations in 59.76% of the area (VIP ≥ 1, Figure 8d).
Table 6.
PLS regression statistics between vegetation EOS and the interannual variability of environmental factors (2003–2022).
Figure 8.
Spatial distribution of dominant factors and regression coefficients for EOS changes. (a–d) Spatial distribution of standardized regression coefficients for ALT, Pre-Temp, Pre-Prec, and Pre-Srad; significance is indicated by VIP ≥1. (e) Spatial distribution of the dominant driving factor for EOS changes determined by maximum absolute coefficients.
In summary, detrended analysis indicates that interannual changes in vegetation phenology in the SRYR are jointly influenced by meteorological factors and the permafrost environment.
3.5. Phenological Responses Along Environmental Gradients
3.5.1. Response of Phenology to Climate and Permafrost Across Hydrothermal Gradients
We calculated the multiyear average temperature and cumulative precipitation during the growing season (May–September), setting 0.3 °C and 384 mm as baseline values, respectively. A hydrothermal gradient matrix was constructed using intervals of 0.7 °C for temperature and 34 mm for precipitation.
Regarding climate factors, Pre-Temp was primarily negatively correlated with SOS but shifted to positive values between −0.10 and 0.08 in arid regions where precipitation was below 418 mm (Figure 9a). The positive effect of Pre-Prec on SOS advancement peaked at −0.26 in arid regions (418–452 mm) and weakened toward wet–warm zones (Figure 9b). Pre-Srad was negatively correlated with SOS in regions with precipitation below 554 mm, reaching a negative maximum of −0.23, but showed consistently positive correlations reaching 0.12 when precipitation exceeded 554 mm (Figure 9d).
Figure 9.
Distribution of vegetation SOS response coefficients along temperature and precipitation gradients. (a–d) Partial least squares (PLS) regression coefficients between SOS and Pre-Temp, Pre-Prec, SOT, and Pre-Srad.
The SOT-SOS relationship shifted from a positive to a negative correlation as the region moved from moist to arid conditions (Figure 9c). SOT was generally positively correlated with SOS in relatively moist regions where precipitation was above 452 mm. This promoting effect reached a maximum coefficient of 0.23 under cold–wet conditions with precipitation between 486 and 520 mm and temperature below 1.0 °C. For the precipitation interval between 418 and 452 mm, the correlation turned positive at 0.15 once temperatures exceeded 4.7 °C. In contrast, SOT was negatively correlated with SOS in arid regions with precipitation below 418 mm, where the coefficient reached −0.15 for the temperature range between 2.5 and 3.2 °C. This indicates that earlier soil thawing in water-limited environments may delay vegetation green-up.
For EOS, the correlation with Pre-Prec shifted from negative in cold–dry environments to positive in warm–wet regions (Figure 10b). Pre-Temp and EOS reached a maximum positive value of 0.37 in wet–cold environments with precipitation between 588 and 622 mm and temperature between 0.3 and 1.0 °C, but this promoting effect weakened significantly as temperature increased, while the influence of Pre-Temp shifted from positive in wet–cold environments to negative in warm regions where temperatures exceeded 3.2 °C (Figure 10a). Pre-Srad was primarily negatively correlated with EOS across most gradients, with positive correlations limited to cold–wet regions and hot–dry environments (Figure 10d).
Figure 10.
Distribution of vegetation EOS response coefficients along temperature and precipitation gradients. (a–d) Partial least squares (PLS) regression coefficients between EOS and Pre-Temp, Pre-Prec, ALT, and Pre-Srad.
ALT was generally negatively correlated with EOS across most hydrothermal conditions (Figure 10c). The model coefficient reached a negative maximum of −0.37 for the driest interval with precipitation below 418 mm and temperature between 1.7 and 2.5 °C. A similar negative effect of −0.36 occurred under cold–wet conditions where precipitation was between 452 and 486 mm and temperature was between 0.3 and 1.0 °C. However, the regulatory direction of ALT on EOS shifted in warm–dry regions. When the temperature exceeded 3.2 °C and precipitation was below 486 mm, the correlation between ALT and EOS shifted from negative to positive. Specifically, the model coefficient turned positive at 0.05 for the interval with precipitation between 418 and 452 mm and temperature between 3.9 and 4.7 °C.
The VIP2 analysis quantified the importance of drivers across zones, showing that the driving mechanisms for the SOS varied spatially. In the cold–dry zone, Pre-Prec was the primary factor with a 41.13% contribution, and SOT changes caused a delay in the SOS. In this region, the alpine meadow was more sensitive to SOT changes than the alpine grassland, with mean PLS model coefficients of −0.14 and −0.01, respectively. In the cold–wet and warm–wet zones, Pre-Temp was the primary factor, with contributions of 31.50% and 29.57% (Figure 11a). In these two wet zones, the impact of SOT changes on alpine meadow remained consistently higher than on alpine grassland; the PLS model coefficient for meadow reached 0.09 in the warm–wet zone, while it was 0.08 for grassland (Figure 11c). In the warm–dry zone, the contribution of SOT was 20.28%, the highest level among all zones. Elevation analysis indicated that the effect of SOT changes on the SOS was most significant at 3900 m with a PLS model coefficient of 0.19, followed by a negative fluctuation of −0.03 at 4100 m. Across the range from 4300 m to 5500 m, the positive impact strengthened with altitude, as model coefficients increased from 0.06 to 0.10 (Figure 11e).
Figure 11.
Spatial and elevational heterogeneity of vegetation phenological responses to permafrost degradation in the SRYR. (a) Relative contributions of environmental drivers to SOS across four hydrothermal zones based on PLS-VIP2 analysis. (b) Relative contributions of environmental drivers to EOS across four hydrothermal zones based on PLS-VIP2 analysis. (c) Comparison of PLS model coefficients (MC) between alpine grassland and alpine meadow for SOT changes across hydrothermal zones. (d) Comparison of PLS model coefficients (MC) between alpine grassland and alpine meadow for ALT changes across hydrothermal zones. (e) Elevational distribution of PLS model coefficients (MC) for the SOS-SOT relationship. (f) Elevational distribution of PLS model coefficients (MC) for the EOS-ALT relationship. MC represents the model coefficients calculated using the partial least squares regression method.
For the EOS, ALT was the most important factor in cold and dry environments. In the cold–dry zone, the contribution of ALT was 42.61%, which was higher than the 26.91% contribution of Pre-Temp (Figure 11b). In this zone, ALT changes caused the EOS of alpine meadow and alpine grassland to advance, with mean PLS model coefficients of −0.38 and −0.30 (Figure 11d), respectively. In the warm–wet zone, the contribution of ALT decreased to 14.35%, while Pre-Prec and Pre-Srad became the primary factors with contributions of 37.06% and 33.25%. In this environment, response patterns diverged between the two vegetation types: ALT changes caused the EOS of alpine meadow to advance with a PLS model coefficient of −0.09, while they caused the EOS of alpine grassland to delay with a coefficient of 0.02. Along the elevation gradient, the negative effect of ALT on the EOS weakened from −0.25 to −0.07 between 3900 m and 4700 m, but then strengthened again with increasing altitude, reaching −0.23 at 5500 m and a peak of −0.43 at 6100 m (Figure 11f).
3.5.2. Direct and Indirect Effects of Permafrost Degradation on SOS and EOS
The effects of SOT on SOS change with growing season (May–September) precipitation and temperature (Figure 12). In cold areas, where growing season average temperatures are between 0.3 and 1.0 °C, both the direct and total effects are negative when growing season total precipitation is below 452 mm, with the total effect reaching a minimum of −0.19 in the 418 to 452 mm interval. In this range, indirect effect coefficients vary between −0.05 and −0.09, while direct effect MC values shift from −0.10 to 0.22 with increasing precipitation. As growing season precipitation increases, the total effect becomes positive and reaches a maximum of 0.28 in the 486 to 520 mm interval (Figure 12a). In the wet interval of 520 to 554 mm, indirect effect values turn to weak-positive or near-zero, but their contribution rises to 71.1%, becoming the most important pathway (Figure 12c). In mid-temperature areas, where growing season average temperatures are between 2.5 and 3.2 °C, the direct effect is the most significant factor, with its contribution exceeding 88% across all precipitation levels, while indirect effect values remain close to zero (absolute values < 0.007). In the driest interval of 384 to 418 mm, the direct effect is −0.20, and the total effect reaches −0.21. In warm areas, where growing season average temperatures are between 4.7 and 5.4 °C, the total effect is positive in most intervals, reaching 0.141 in the 418 to 452 mm range. In this zone, indirect effect values are positive in most intervals (Figure 12b), while direct effect values are relatively small and fluctuate between positive and negative. In the wettest interval, where growing season precipitation is above 588 mm, the indirect effect is 0.05 with a contribution of 60.0%, which is greater than the impact of the direct effect.
Figure 12.
Direct and indirect effects of soil thawing on SOS across hydrothermal gradients. (a) Line plots of the direct effects of SOT on SOS in cold, mid-temperature, and warm zones. (b) Line plots of the indirect effects of SOT on SOS mediated by soil moisture (SM). (c) Proportional contributions of direct and indirect pathways to SOS changes within different temperature and precipitation intervals. (d) Bar plots showing the total effects of SOT on SOS, illustrating the net impact across diverse hydrothermal conditions.
The effects of ALT on EOS show significant differences across various hydrothermal conditions (Figure 13). In cold areas, where growing season average temperatures are between 0.3 and 1.0 °C, both the direct and total effects of ALT on EOS are negative across all growing season precipitation levels, with total effect values ranging from −0.24 to −0.35 (Figure 13a). In this area, the indirect effect coefficients have absolute values less than 0.04 with inconsistent directions (Figure 13b). In contrast, the direct effect MC values range from −0.25 to −0.34. The direct effect proportion generally exceeds 87% and reaches 99.8% in the wet interval of 588 to 622 mm (Figure 13c). In mid-temperature areas, where growing season average temperatures are between 2.5 and 3.2 °C, the total effect remains negative and peaks at −0.41 in the driest interval of 384 to 418 mm. In this region, indirect effect MC values strengthen into consistent negative values ranging from −0.01 to −0.09, with the proportion rising to 35.0% in the 520 to 554 mm interval. In warm areas, where average growing season temperatures are between 4.7 and 5.4 °C, the impact pattern undergoes a transition. When growing season precipitation is below 486 mm, the total effect fluctuates between −0.01 and 0.03; direct effect values are weakly positive, ranging from 0.01 to 0.04, while indirect effect values are consistently negative, between −0.01 and −0.03, accounting for 80.1% and 68.3% of the impact in the 452–486 mm and 418–452 mm ranges, respectively. Once growing season precipitation exceeds 486 mm, indirect effect values decrease further to −0.10, and direct effect values also turn negative, ranging from −0.11 to −0.35. This shift causes the total effect to revert to negative and strengthen as precipitation rises.
Figure 13.
Direct and indirect effects of ALT on EOS across hydrothermal gradients. (a) Line plots of the direct effects of ALT on EOS in cold, mid-temperature, and warm zones. (b) Line plots of the indirect effects of ALT on EOS mediated by soil moisture (SM). (c) Proportional contributions of direct and indirect pathways to EOS change within different temperature and precipitation intervals. (d) Bar plots showing the total effects of ALT on EOS across diverse hydrothermal conditions.
4. Discussion
4.1. Evolutionary Characteristics of Vegetation Phenology in the SRYR
The vegetation of the Source Region of the Yangtze River (SRYR) is dominated by shallow-rooted alpine grasslands and meadows. From 2003 to 2022, vegetation phenology exhibited a distinct seasonal asymmetry. The SOS was spatially concentrated, with 94.08% of the region occurring between DOY 160 and 180. Temporally, the SOS remained largely stable, with advancing and delaying areas being nearly equal. This result may stem from the fact that the SOS initially exhibited an advancing trend, which subsequently weakened or even shifted toward delay in certain periods [61,62,63].
In contrast, a significant advancement in the EOS emerged as a clear trend across the study area. Approximately 79.95% of the study area showed EOS dates between DOY 264 and 276, with significant advancing trends in 64.33% of the area. This finding is consistent with existing studies on phenological responses in the permafrost regions of the Qinghai–Tibet Plateau [16,63].
4.2. Response of Grassland Phenology to Permafrost Degradation
Although temperature and precipitation are the primary drivers of spring green-up, the SOT, as a critical environmental regulator, exhibits distinct patterns across various hydrothermal gradients. In this study, direct effects represent the immediate feedback of heat release or physical state changes during thawing on vegetation, while indirect effects characterize the regulatory role of permafrost in phenology by modulating soil moisture (SM) conditions.
In environments where the average growing season temperature is between 0.3 and 1.0 °C and total growing season precipitation is below 452 mm, SOT exerts a negative total effect on the SOS. In such cold and arid environments, an earlier SOT significantly extends the time interval between the onset of thawing and the SOS. In the SRYR, the earlier onset of SOT extends the duration of soil moisture exposure to intense solar radiation and strong winds. This enhanced evaporation exacerbates surface water loss and reduces the net ecosystem CO2 exchange (NEE) [64]. Combined with limited precipitation, this severe moisture deficit suppresses the carbon assimilation capacity of vegetation, thereby retarding the SOS [28,65]. Furthermore, the melting of soil ice is a typical endothermic process that consumes substantial latent heat. This energy consumption limits the rate of surface soil warming, making it difficult for vegetation to reach the required heat accumulation threshold to trigger green-up in early spring, thereby causing the direct thermal feedback to manifest as a negative delay [66,67].
In addition, this process is potentially modulated by the lag effect of hydrothermal conditions from the previous year. As observed on the Tibetan Plateau, factors such as snow depth exhibit a significant time-lag in influencing spring phenology [68]. A deeper frozen layer from the preceding winter increases the thermal inertia and latent heat required for thawing, which can further suppress shallow soil warming and prevent the SOS from advancing synchronously with the SOT.
In contrast, as moisture availability increases, the influence of SOT shifts from inhibition to promotion. Specifically, in wet intervals with precipitation between 520 and 554 mm, the indirect pathway contributes 71.1% to the total effect, becoming the dominant factor. In these moisture-sufficient environments, earlier SOT triggers the release of liquid water from frozen soil earlier in the season. This timely replenishment of water resources effectively alleviates early-spring physiological drought for shallow-rooted species, thereby promoting an earlier SOS [20,46,69]. In warm environments where the average growing season temperature is 4.7 to 5.4 °C and precipitation exceeds 588 mm, the indirect contribution reaches 60.0%, exerting a significant impact on phenology. At this stage, permafrost thawing not only improves moisture availability but also enhances soil microbial activity [70,71,72]. As the active layer thaws, organic matter stored in the permafrost decomposes and releases available nitrogen [22]. This increased nutrient and water supply drives an earlier SOS [73,74,75]. In mid-temperature environments, where the average growing season temperature is 2.5 to 3.2 °C, the direct effect consistently accounts for over 88% of the contribution, indicating that vegetation is more sensitive to thermal signals released during thawing.
The increase in ALT alters the boundary conditions for subsurface hydrothermal transport, thereby significantly influencing autumn phenology [76]. In cold environments where the average growing season temperature is between 0.3 and 1.0 °C, the total effect of ALT on the EOS is consistently negative across all precipitation levels, with direct effects accounting for over 87%. This dominance suggests that vegetation in these extreme regions is primarily controlled by the direct thermal impact within the active layer. Physically, the deepening permafrost table represents a downward shift in the impermeable floor [77,78], which directly alters the space and environment of the soil profile. Shallow-rooted species in these cold environments are highly sensitive to these changes, leading to an earlier EOS [6].
In warm environments where the average growing season temperature is between 4.7 and 5.4 °C, the role of ALT in phenology shows distinct stages as the precipitation gradient changes. In the extremely arid interval where growing season precipitation is between 384 and 418 mm, moderate ALT thickening may exert a slight delaying effect on EOS, potentially by releasing ground ice meltwater [79] and partially improving the supply of heat and nutrients to the root zone [75]. However, when the growing season precipitation exceeds 418 mm, the total effect turns negative. Specifically, in intervals where precipitation is below 486 mm, indirect effects dominate, with contribution rates ranging from 68.3% to 80.1%. This strong indirect driving force stems from the physical properties of the permafrost table acting as an impermeable barrier [2] that intercepts moisture and nutrients in the topsoil [75,80]. As ALT increases, the downward shift in this physical boundary reshapes subsurface hydrological pathways by increasing the vertical drainage capacity. This process allows moisture previously trapped in the upper layers to percolate deeper under gravity [19]. Our mediation analysis statistically confirms that this downward migration likely causes surface soil moisture loss and root zone moisture deficit [81], which potentially reduces the water-use efficiency (WUE) [82]. Furthermore, this vertical movement could potentially cause dissolved nutrients to move to deeper layers, which might lead to a deficit of available nutrients in the shallow root zone [78,83,84,85]. Since most vegetation in the SRYR is shallow-rooted, their roots cannot reach the moisture and nutrients that have migrated deeper [86], potentially slowing down carbon assimilation and reducing metabolic energy, thereby forcing vegetation into early dormancy for survival, leading to a significantly earlier EOS.
Once growing season precipitation exceeds 486 mm, external precipitation partially offsets the moisture deficit caused by downward migration. At this point, the soil warming and heat conduction resulting from ALT deepening increase plant respiration costs [6,87]. When the energy consumed by metabolism exceeds the organic matter accumulation from photosynthesis, the resulting negative carbon balance may trigger earlier senescence [64].
4.3. Differential Responses of Vegetation Types to Permafrost Changes
Alpine meadows exhibited greater overall sensitivity to permafrost changes than alpine grasslands. This divergence stems primarily from their fundamentally different water adaptation strategies [64,82]. Alpine meadows typically exhibit higher evapotranspiration (ET) rates and employ more flexible water-use strategies, making them highly dependent on the stability of surface soil moisture [82]. Therefore, an earlier spring thaw that exacerbates moisture loss through evaporation can significantly delay their green-up. In contrast, alpine grasslands often employ a more conservative water-use strategy to maintain physiological stability in arid environments [82]. This allows them to maintain growth even under moisture stress, showing high resilience to changes in the thaw date [88,89]. Correspondingly, in cold–dry zones, the end of the growing season for alpine meadows also showed a stronger negative response to active layer thickening. Furthermore, along the elevation gradient, the negative effect of active layer thickening on phenology strengthened again at elevations exceeding 5500 m, indicating that vegetation in harsh environments is particularly sensitive to changes in the active layer.
4.4. Reliability and Uncertainty
This study assessed the reliability of ALT simulations in the SRYR by combining point-scale and pixel-scale methods. At the point scale, we compared the calculated 2003–2016 mean values with field data from 34 undisturbed sites in the SRYR, sourced from [90]. Results show an R2 of 0.49 and an RMSE of 0.75 m between the calculated and observed values (Figure 14a). These statistics suggest that the calculation is reasonable at the regional scale, despite some local bias. This bias is mainly due to scale mismatch and limited site distribution. Most of the 34 sites are located along the G109 and G214 highways, making it difficult to fully validate the model in remote and complex terrain [91]. To complement this validation, we conducted a pixel-scale analysis by comparing the calculated ALT dataset pixel-by-pixel with the “Frozen ground change data set on the Qinghai–Tibet Plateau (1961–2020)” (Figure 14b). The results show highly consistent spatial patterns (R2 = 0.53, RMSE = 0.65 m), proving that our model captures the spatial variation in permafrost in this region. Additionally, the multiyear mean ALT in the SRYR is 2.45 m. This value was comparable to previously reported values of 2.41 m for the Three-River Source Region [92,93] and 2.28 m for the Tibetan Plateau [94].
Figure 14.
Validation of active layer thickness (ALT) simulations. (a) Point-scale comparison between simulated and measured values at 34 sites. (b) Pixel-scale comparison between simulated results and the reference dataset. The colors indicate data density, as shown in the colorbars.
Nevertheless, these uncertainties are localized and mainly affect specific boundaries or extreme environments. For hydrothermal zonation and elevational gradients, simulation offsets may cause minor variations near environmental thresholds or in remote high-altitude areas. However, these local uncertainties do not alter the large-scale spatial patterns identified in this study. Furthermore, since VIP analysis identifies dominant factors based on the relative contribution to spatial variance rather than absolute magnitudes, the reported dominance of ALT remains statistically reliable despite minor simulation offsets. Additionally, we note that the pixel-level statistical significance is influenced by spatial dependence and scale-related constraints. Since neighboring pixels after resampling are not fully independent, the fine-scale p-values should be interpreted with caution. However, these constraints do not alter the large-scale spatial patterns and core findings identified in this study. Overall, these uncertainties remain within an acceptable range for regional permafrost modeling and do not compromise the core scientific findings.
However, this analysis has certain limitations. First, the freeze–thaw dataset and the vegetation index product we used have an original resolution of 0.05°. Although resampling these to 1 km does not add more spatial details in the complex topography of the SRYR, it could lead to uncertainties when evaluating how permafrost dynamics and vegetation traits interact at finer topographic levels. Specifically, permafrost degradation and vegetation response may differ, or even be the opposite, between shady and sunny slopes due to variations in radiation and moisture. Therefore, the 1 km resolution may overlook these sub-pixel details. Future work should use higher-resolution datasets to analyze the regulatory effects of terrain factors like slope and aspect.
Second, the ratio of degree–day sums of the ground surface-to-air temperatures in the Stefan model was treated as a constant. Although research indicates that this ratio on the QTP has spatial and temporal variations driven by surface conditions [95], constant parameterization remains a widely used and practical approach for long-term regional studies when dynamic, high-resolution data are limited. Future work should consider using dynamic parameters to better reflect the changing surface conditions.
Third, although the vegetation classification accuracy is 83.27%, it may still cause some errors, especially in areas where meadows and grasslands transition. However, our study focuses on regional patterns and long-term changes over 20 years rather than the exact type of every single pixel. Therefore, these classification issues are unlikely to change our main conclusions. Future studies should use more precise vegetation data to reduce these errors.
Regarding the eco-hydrological processes, the moisture provided by permafrost thawing may overlap with snowmelt in alpine ecosystems. While SOT is a key driver of water availability in wet areas, separating the effects of snowmelt from active layer thawing is difficult due to their close interactions. Separating these effects is difficult due to their close interactions, and future studies should incorporate multi-source remote sensing data to better distinguish these water sources and improve our understanding of permafrost–phenology coupling.
Furthermore, the current analysis does not fully reveal the specific processes through which active layer thickening drives the downward movement of water and nutrients. Thus, future work should use soil profile observations or process-based models to better understand these leaching processes. Last, our study primarily focused on shallow-rooted alpine meadows and grasslands. Future research should analyze how deep-rooted plants and different plant types respond to permafrost changes to improve the understanding of how plant traits regulate the ecosystem.
5. Conclusions
This study quantified the asymmetric responses of spring and autumn vegetation phenology to permafrost degradation in the SRYR (2003–2022). The main conclusions are as follows:
(1) Seasonal asymmetry in phenological trends: Permafrost degradation drove a significant seasonal asymmetry in phenology. Autumn phenology (EOS) showed a widespread and significant advancing trend (70.65% of the area, with 64.33% being significant), while spring phenology (SOS) remained relatively stable with spatially balanced trends. This indicates that autumn senescence is more sensitive to permafrost changes than spring green-up in this region.
(2) Dual role of SOT on SOS: The impact of SOT on SOS is regulated by soil moisture dynamics across a hydrothermal gradient. In relatively wet areas, earlier SOT advances SOS by providing meltwater. Conversely, in dry areas, earlier SOT delays SOS by increasing evaporative water loss. Soil moisture is the key mediator in this switch.
(3) ALT as a key driver of earlier EOS: ALT is thickening across most of the region (~0.29 cm/yr). This thickening is a primary driver of earlier EOS, especially in cold environments. The mechanism involves ALT-induced vertical drainage of water and nutrients away from the shallow root zone, exacerbating late-season resource limitation.
(4) Modulation by vegetation type and elevation: Alpine meadows consistently showed greater sensitivity to both SOT and ALT changes compared to alpine grasslands. Phenological responses to permafrost variables also exhibited non-linear patterns across elevation gradients, highlighting the important regulatory role of local topography and associated microclimates.
Author Contributions
Conceptualization, M.X., T.L. and Q.L.; methodology, M.X., S.T. and T.L.; software, M.X., X.Z. and R.F.; data curation, M.X., X.Z. and R.F.; visualization, M.X., X.Z. and R.F.; writing—original draft preparation, M.X.; writing—review and editing, Q.L., T.L. and S.T.; supervision, Q.L., T.L. and S.T. All authors have read and agreed to the published version of the manuscript.
Funding
This research was funded by the China Geological Survey, grant number DD202405011 (National Glacier Water Resources Survey).
Data Availability Statement
The data that support the findings of this study are available from the first author upon reasonable request.
Acknowledgments
The meteorological datasets used in this study were provided by the National Cryosphere Desert Data Center (https://www.ncdc.ac.cn (accessed on 22 April 2026)). The vegetation maps, TPMFD meteorological forcing dataset, 1 km resolution soil moisture dataset, and TRIMS LST-TP V2 land surface temperature data were provided by the National Tibetan Plateau/Third Pole Environment Data Center (http://data.tpdc.ac.cn (accessed on 22 April 2026)).
Conflicts of Interest
The authors declare that they have no known competing financial interests or personal relationships that could have appeared to influence the work reported in this paper.
References
- Smith, S.L.; O’Neill, H.B.; Isaksen, K.; Noetzli, J.; Romanovsky, V.E. The Changing Thermal State of Permafrost. Nat. Rev. Earth Environ. 2022, 3, 10–23. [Google Scholar] [CrossRef] [Scilit]
- Wang, X.; Ran, Y.; Pang, G.; Chen, D.; Su, B.; Chen, R.; Li, X.; Chen, H.W.; Yang, M.; Gou, X.; et al. Contrasting Characteristics, Changes, and Linkages of Permafrost between the Arctic and the Third Pole. Earth-Sci. Rev. 2022, 230, 104042. [Google Scholar] [CrossRef] [Scilit]
- Hu, G.; Zhao, L.; Zou, D.; Wu, X.; Li, R.; Zhu, X.; Su, Y.; Wu, T.; Wu, Y.; Ni, J. Large Variability in Permafrost Degradation over the Northern Hemisphere. Catena 2024, 246, 108440. [Google Scholar] [CrossRef] [Scilit]
- Wang, G.; Bai, W.; Li, N.; Hu, H. Climate Changes and Its Impact on Tundra Ecosystem in Qinghai-Tibet Plateau, China. Clim. Change 2011, 106, 463–482. [Google Scholar] [CrossRef] [Scilit]
- Yi, S.; Wang, X.; Qin, Y.; Xiang, B.; Ding, Y. Responses of Alpine Grassland on Qinghai–Tibetan Plateau to Climate Warming and Permafrost Degradation: A Modeling Perspective. Environ. Res. Lett. 2014, 9, 074014. [Google Scholar] [CrossRef] [Scilit]
- Jin, X.-Y.; Jin, H.-J.; Iwahana, G.; Marchenko, S.S.; Luo, D.-L.; Li, X.-Y.; Liang, S.-H. Impacts of Climate-Induced Permafrost Degradation on Vegetation: A Review. Adv. Clim. Change Res. 2021, 12, 29–47. [Google Scholar] [CrossRef] [Scilit]
- Chen, S.-Y.; Wei, P.-J.; Wu, T.-H.; Wu, Q.-B.; Luo, F.-D. Effect of Permafrost Degradation on Carbon Sequestration of Alpine Ecosystems. Sci. Total Environ. 2023, 899, 165642. [Google Scholar] [CrossRef] [Scilit]
- Zhao, Y.; Yao, Y.; Jin, H.; Cao, B.; Hu, Y.; Ran, Y.; Zhang, Y. Characterizing the Changes in Permafrost Thickness across Tibetan Plateau. Remote Sens. 2022, 15, 206. [Google Scholar] [CrossRef] [Scilit]
- Shen, T.; Jiang, P.; Ju, Q.; Yu, Z.; Chen, X.; Lin, H.; Zhang, Y. Changes in Permafrost Spatial Distribution and Active Layer Thickness from 1980 to 2020 on the Tibet Plateau. Sci. Total Environ. 2023, 859, 160381. [Google Scholar] [CrossRef] [Scilit] [PubMed]
- Richardson, A.D.; Keenan, T.F.; Migliavacca, M.; Ryu, Y.; Sonnentag, O.; Toomey, M. Climate Change, Phenology, and Phenological Control of Vegetation Feedbacks to the Climate System. Agric. For. Meteorol. 2013, 169, 156–173. [Google Scholar] [CrossRef] [Scilit]
- Buitenwerf, R.; Rose, L.; Higgins, S.I. Three Decades of Multi-Dimensional Change in Global Leaf Phenology. Nat. Clim. Change 2015, 5, 364–368. [Google Scholar] [CrossRef] [Scilit]
- Kuang, X.; Jiao, J.J. Review on Climate Change on the Tibetan Plateau during the Last Half Century. J. Geophys. Res. Atmos. 2016, 121, 3979–4007. [Google Scholar] [CrossRef] [Scilit]
- Yuan, H.; Wang, X.; Wu, C.; Wang, H. Satellite Observed Strong Relationship Between Nighttime Surface Temperature and Leaf Coloring Dates of Terrestrial Ecosystems in East China. IEEE J. Sel. Top. Appl. Earth Obs. Remote Sens. 2020, 13, 717–725. [Google Scholar] [CrossRef] [Scilit]
- Ontel, I.; Avram, S.; Gheorghe, C.A.; Niculae, M.I.; Pascu, I.S.; Rodino, S. Shifting Vegetation Phenology in Protected Areas: A Response to Climate Change. Ecol. Inform. 2025, 85, 102962. [Google Scholar] [CrossRef] [Scilit]
- Shen, M.; Piao, S.; Cong, N.; Zhang, G.; Jassens, I.A. Precipitation Impacts on Vegetation Spring Phenology on the T Ibetan P Lateau. Glob. Change Biol. 2015, 21, 3647–3656. [Google Scholar] [CrossRef] [Scilit]
- Li, P.; Zhu, Q.; Peng, C.; Zhang, J.; Wang, M.; Zhang, J.; Ding, J.; Zhou, X. Change in Autumn Vegetation Phenology and the Climate Controls From 1982 to 2012 on the Qinghai–Tibet Plateau. Front. Plant Sci. 2020, 10, 1677. [Google Scholar] [CrossRef] [Scilit]
- Wang, C.-P.; Huang, M.-T.; Zhai, P.-M. Co-Influence of the Start of Thermal Growing Season and Precipitation on Vegetation Spring Green-up on the Tibetan Plateau. Adv. Clim. Change Res. 2024, 15, 327–337. [Google Scholar] [CrossRef] [Scilit]
- Fu, W.; Zhang, X.; Zhao, J.; Du, S.; Horton, R.; Hou, M. Artificial Warming-Mediated Soil Freezing and Thawing Processes Can Regulate Soybean Production in Northeast China. Agric. For. Meteorol. 2018, 262, 249–257. [Google Scholar] [CrossRef] [Scilit]
- Li, T.; Fu, B.; Lü, Y.; Du, C.; Zhao, Z.; Wang, F.; Gao, G.; Wu, X. Soil Freeze–Thaw Cycles Affect Spring Phenology by Changing Phenological Sensitivity in the Northern Hemisphere. Sci. Total Environ. 2024, 914, 169963. [Google Scholar] [CrossRef] [Scilit]
- Gao, B.; Li, J.; Wang, X. Impact of Frozen Soil Changes on Vegetation Phenology in the Source Region of the Yellow River from 2003 to 2015. Theor. Appl. Climatol. 2020, 141, 1219–1234. [Google Scholar] [CrossRef] [Scilit]
- Van Der Heijden, M.G.A.; Bardgett, R.D.; Van Straalen, N.M. The Unseen Majority: Soil Microbes as Drivers of Plant Diversity and Productivity in Terrestrial Ecosystems. Ecol. Lett. 2008, 11, 296–310. [Google Scholar] [CrossRef] [Scilit]
- Keuper, F.; Van Bodegom, P.M.; Dorrepaal, E.; Weedon, J.T.; Van Hal, J.; Van Logtestijn, R.S.P.; Aerts, R. A Frozen Feast: Thawing Permafrost Increases Plant-available Nitrogen in Subarctic Peatlands. Glob. Change Biol. 2012, 18, 1998–2007. [Google Scholar] [CrossRef] [Scilit]
- Zhang, F.; Li, H.; Wang, W.; Li, Y.; Lin, L.; Guo, X.; Du, Y.; Li, Q.; Yang, Y.; Cao, G.; et al. Net Radiation Rather than Surface Moisture Limits Evapotranspiration over a Humid Alpine Meadow on the Northeastern Qinghai-Tibetan Plateau. Ecohydrology 2018, 11, e1925. [Google Scholar] [CrossRef] [Scilit]
- Zhao, H.; Yi, P.; Pan, X.; Wan, C. The Role of Root Zone Soil Moisture Return on Vegetation Green-up: A Comparison of Two Degrading Permafrost Sites. Sci. Total Environ. 2023, 905, 167049. [Google Scholar] [CrossRef] [Scilit] [PubMed]
- Bense, V.F.; Ferguson, G.; Kooi, H. Evolution of Shallow Groundwater Flow Systems in Areas of Degrading Permafrost. Geophys. Res. Lett. 2009, 36, 2009GL039225. [Google Scholar] [CrossRef] [Scilit]
- Lv, M.; Wang, Y.; Gao, Z. The Change Process of Soil Hydrological Properties in the Permafrost Active Layer of the Qinghai–Tibet Plateau. Catena 2022, 210, 105938. [Google Scholar] [CrossRef] [Scilit]
- Zastruzny, S.F.; Ingeman-Nielsen, T.; Zhang, W.; Elberling, B. Accelerated Permafrost Thaw and Increased Drainage in the Active Layer: Responses from Experimental Surface Alteration. Cold Reg. Sci. Technol. 2023, 212, 103899. [Google Scholar] [CrossRef] [Scilit]
- Liang, S.; Ge, S.; Wan, L.; Zhang, J. Can Climate Change Cause the Yellow River to Dry Up? Water Resour. Res. 2010, 46, 2009WR007971. [Google Scholar] [CrossRef] [Scilit]
- Finger, R.A.; Turetsky, M.R.; Kielland, K.; Ruess, R.W.; Mack, M.C.; Euskirchen, E.S. Effects of Permafrost Thaw on Nitrogen Availability and Plant–Soil Interactions in a Boreal Alaskan Lowland. J. Ecol. 2016, 104, 1542–1554. [Google Scholar] [CrossRef] [Scilit]
- Clayton, L.K.; Schaefer, K.; Battaglia, M.J.; Bourgeau-Chavez, L.; Chen, J.; Chen, R.H.; Chen, A.; Bakian-Dogaheh, K.; Grelik, S.; Jafarov, E.; et al. Active Layer Thickness as a Function of Soil Water Content. Environ. Res. Lett. 2021, 16, 055028. [Google Scholar] [CrossRef] [Scilit]
- Ogden, E.L.; Cumming, S.G.; Smith, S.L.; Turetsky, M.R.; Baltzer, J.L. Permafrost Thaw Induces Short-term Increase in Vegetation Productivity in Northwestern Canada. Glob. Change Biol. 2023, 29, 5352–5366. [Google Scholar] [CrossRef] [Scilit]
- Ding, Y.; Yang, J.; Liu, S.; Chen, R.; Wang, G.; Shen, Y.; Wang, J.; Xie, C.; Zhang, S. Eco-Environment Range in the Source Regions of the Yangtze and Yellow Rivers. J. Geogr. Sci. 2003, 13, 172–180. [Google Scholar] [CrossRef] [Scilit]
- Li, H.; Cao, Y.; Xiao, J.; Yuan, Z.; Hao, Z.; Bai, X.; Wu, Y.; Liu, Y. A Daily Gap-Free Normalized Difference Vegetation Index Dataset from 1981 to 2023 in China. Sci. Data 2024, 11, 527. [Google Scholar] [CrossRef] [Scilit] [PubMed]
- Zhou, G.; Ren, H.; Zhang, L.; Lv, X.; Zhou, M. Annual Vegetation Maps in the Qinghai–Tibet Plateau (QTP) from 2000 to 2022 Based on MODIS Series Satellite Imagery. Earth Syst. Sci. Data 2025, 17, 773–797. [Google Scholar] [CrossRef] [Scilit]
- Hu, Y.; Zhang, L. Added Value of Merging Techniques in Precipitation Estimates Relative to Gauge-Interpolation Algorithms of Varying Complexity. J. Hydrol. 2024, 645, 132214. [Google Scholar] [CrossRef] [Scilit]
- Jiang, Y.; Tang, W.; Yang, K.; He, J.; Shao, C.; Zhou, X.; Lu, H.; Chen, Y.; Li, X.; Shi, J. Development of a High-Resolution near-Surface Meteorological Forcing Dataset for the Third Pole Region. Sci. China Earth Sci. 2025, 68, 1274–1290. [Google Scholar] [CrossRef] [Scilit]
- National Tibet Plateau Data Center. MAO Kebiao Soil Moisture Dataset of the Tibetan Plateau Region, China (2003–2022); National Tibet Plateau Data Center: Beijing, China, 2025. [Google Scholar]
- Tang, W.; Zhou, J.; Ma, J.; Wang, Z.; Ding, L.; Zhang, X.; Zhang, X. TRIMS LST: A Daily 1 Km All-Weather Land Surface Temperature Dataset for China’s Landmass and Surrounding Areas (2000–2022). Earth Syst. Sci. Data 2024, 16, 387–419. [Google Scholar] [CrossRef] [Scilit]
- Ran, Y.; Li, X.; Cheng, G.; Nan, Z.; Che, J.; Sheng, Y.; Wu, Q.; Jin, H.; Luo, D.; Tang, Z.; et al. Mapping the Permafrost Stability on the Tibetan Plateau for 2005–2015. Sci. China Earth Sci. 2021, 64, 62–79. [Google Scholar] [CrossRef] [Scilit]
- Food and Agriculture Organization of the United Nations (FAO). International Institute for Applied Systems Analysis China Soil Map Based Harmonized World Soil Database (HWSD) (v1.1) (2009); Food and Agriculture Organization of the United Nations (FAO): Rome, Italy, 2021. [Google Scholar]
- Zhao, T.; Pei, Y.; Feng, D.; Zhang, Z. Global 0.05° Near-Surface Freeze/Thaw State Dataset V2.0 (2002–2023); National Tibet Plateau Data Center: Beijing, China, 2025. [Google Scholar]
- Nelson, F.E.; Outcalt, S.I. A Computational Method for Prediction and Regionalization of Permafrost. Arct. Alp. Res. 1987, 19, 279–288. [Google Scholar] [CrossRef] [Scilit]
- Zhang, T.; Frauenfeld, O.W.; Serreze, M.C.; Etringer, A.; Oelke, C.; McCreight, J.; Barry, R.G.; Gilichinsky, D.; Yang, D.; Ye, H.; et al. Spatial and Temporal Variability in Active Layer Thickness over the Russian Arctic Drainage Basin. J. Geophys. Res. Atmos. 2005, 110, 2004JD005642. [Google Scholar] [CrossRef] [Scilit]
- Zou, D.; Zhao, L.; Sheng, Y.; Chen, J.; Hu, G.; Wu, T.; Wu, J.; Xie, C.; Wu, X.; Pang, Q.; et al. A New Map of Permafrost Distribution on the Tibetan Plateau. Cryosphere 2017, 11, 2527–2542. [Google Scholar] [CrossRef] [Scilit]
- Zou, D.; Zhao, L.; Wu, T.; Wu, X.; Pang, Q.; Wang, Z. Modeling Ground Surface Temperature by Means of Remote Sensing Data in High-Altitude Areas: Test in the Central Tibetan Plateau with Application of Moderate-Resolution Imaging Spectroradiometer Terra/Aqua Land Surface Temperature and Ground-Based Infrared Radiometer. J. Appl. Remote Sens. 2014, 8, 083516. [Google Scholar] [CrossRef] [Scilit]
- Wang, J.; Liu, D. Vegetation Green-up Date Is More Sensitive to Permafrost Degradation than Climate Change in Spring across the Northern Permafrost Region. Glob. Change Biol. 2022, 28, 1569–1582. [Google Scholar] [CrossRef] [Scilit]
- Beck, P.S.A.; Atzberger, C.; Høgda, K.A.; Johansen, B.; Skidmore, A.K. Improved Monitoring of Vegetation Dynamics at Very High Latitudes: A New Method Using MODIS NDVI. Remote Sens. Environ. 2006, 100, 321–334. [Google Scholar] [CrossRef] [Scilit]
- Elmore, A.J.; Guinn, S.M.; Minsley, B.J.; Richardson, A.D. Landscape Controls on the Timing of Spring, Autumn, and Growing Season Length in Mid—A Tlantic Forests. Glob. Change Biol. 2012, 18, 656–674. [Google Scholar] [CrossRef] [Scilit]
- Gonsamo, A.; Chen, J.M.; D’Odorico, P. Deriving Land Surface Phenology Indicators from CO2 Eddy Covariance Measurements. Ecol. Indic. 2013, 29, 203–207. [Google Scholar] [CrossRef] [Scilit]
- Li, J.; Wu, C.; Wu, M.; Zhang, Y.; Ran, Y. Modeling the Start of Frozen Dates with Leaf Senescence over Tibetan Plateau. Remote Sens. Environ. 2022, 281, 113258. [Google Scholar] [CrossRef] [Scilit]
- Shen, M.; Piao, S.; Dorji, T.; Liu, Q.; Cong, N.; Chen, X.; An, S.; Wang, S.; Wang, T.; Zhang, G. Plant Phenological Responses to Climate Change on the Tibetan Plateau: Research Status and Challenges. Natl. Sci. Rev. 2015, 2, 454–467. [Google Scholar] [CrossRef] [Scilit]
- Li, X.; Yu, K.; Xu, G.; Li, P.; Li, Z.; Jia, L. Spatiotemporal Evolution of Vegetation Phenology and Its Response to Environmental Factors in the Upper and Middle Reaches of the Yellow River Basin. J. Environ. Manag. 2025, 380, 124970. [Google Scholar] [CrossRef] [Scilit]
- Liu, Q.; Fu, Y.H.; Zhu, Z.; Liu, Y.; Liu, Z.; Huang, M.; Janssens, I.A.; Piao, S. Delayed Autumn Phenology in the Northern Hemisphere Is Related to Change in Both Climate and Spring Phenology. Glob. Change Biol. 2016, 22, 3702–3711. [Google Scholar] [CrossRef] [Scilit]
- Huang, Y.; Jiang, N.; Shen, M.; Guo, L. Effect of Preseason Diurnal Temperature Range on the Start of Vegetation Growing Season in the Northern Hemisphere. Ecol. Indic. 2020, 112, 106161. [Google Scholar] [CrossRef] [Scilit]
- Yin, P.; Li, X.; Pellikka, P. Asymmetrical Impact of Daytime and Nighttime Warming on the Interannual Variation of Urban Spring Vegetation Phenology. Earths Future 2024, 12, e2023EF004127. [Google Scholar] [CrossRef] [Scilit]
- Zhang, Q.; Kong, D.; Shi, P.; Singh, V.P.; Sun, P. Vegetation Phenology on the Qinghai-Tibetan Plateau and Its Response to Climate Change (1982–2013). Agric. For. Meteorol. 2018, 248, 408–417. [Google Scholar] [CrossRef] [Scilit]
- Pan, Y.; Liu, L. Impact of Permafrost Degradation on Alpine Grasslands in the Three-Rivers Headwater Region. Catena 2026, 262, 109631. [Google Scholar] [CrossRef] [Scilit]
- Luo, W.; Yang, J.; Wang, Y.; Cui, X.; Zhang, L.; Zhao, T.; Xue, K.; Du, J.; Song, X.; Hao, Y. Causal Analysis Reveals That Ecosystem Structure and Function Are Temperature-Dominated but Relatively Independent. Ecol. Indic. 2024, 165, 112188. [Google Scholar] [CrossRef] [Scilit]
- Liu, H.; Tian, F.; Hu, H.C.; Hu, H.P.; Sivapalan, M. Soil Moisture Controls on Patterns of Grass Green-up in Inner Mongolia: An Index Based Approach. Hydrol. Earth Syst. Sci. 2013, 17, 805–815. [Google Scholar] [CrossRef] [Scilit]
- Cui, X.; Xu, G.; He, X.; Luo, D. Influences of Seasonal Soil Moisture and Temperature on Vegetation Phenology in the Qilian Mountains. Remote Sens. 2022, 14, 3645. [Google Scholar] [CrossRef] [Scilit]
- Yang, B.; He, M.; Shishov, V.; Tychkov, I.; Vaganov, E.; Rossi, S.; Ljungqvist, F.C.; Bräuning, A.; Grießinger, J. New Perspective on Spring Vegetation Phenology and Global Climate Change Based on Tibetan Plateau Tree-Ring Data. Proc. Natl. Acad. Sci. USA 2017, 114, 6966–6971. [Google Scholar] [CrossRef] [Scilit]
- Wang, T.; Yang, D.; Zheng, G.; Shi, R. Possible Negative Effects of Earlier Thaw Onset and Longer Thaw Duration on Vegetation Greenness over the Tibetan Plateau. Agric. For. Meteorol. 2022, 326, 109192. [Google Scholar] [CrossRef] [Scilit]
- Fan, T.; Zhong, X.; Wang, C.; Zhou, L.; Zhou, Z. Phenological Shifts of Vegetation in Seasonally Frozen Ground and Permafrost Zones of the Qinghai–Tibet Plateau. Remote Sens. 2025, 17, 3391. [Google Scholar] [CrossRef] [Scilit]
- Wang, Y.; Zhu, Z.; Ma, Y.; Yuan, L. Carbon and Water Fluxes in an Alpine Steppe Ecosystem in the Nam Co Area of the Tibetan Plateau during Two Years with Contrasting Amounts of Precipitation. Int. J. Biometeorol. 2020, 64, 1183–1196. [Google Scholar] [CrossRef] [Scilit]
- Lian, X.; Piao, S.; Li, L.Z.X.; Li, Y.; Huntingford, C.; Ciais, P.; Cescatti, A.; Janssens, I.A.; Peñuelas, J.; Buermann, W.; et al. Summer Soil Drying Exacerbated by Earlier Spring Greening of Northern Vegetation. Sci. Adv. 2020, 6, eaax0255. [Google Scholar] [CrossRef] [Scilit]
- Guo, D.; Yang, M.; Wang, H. Sensible and Latent Heat Flux Response to Diurnal Variation in Soil Surface Temperature and Moisture under Different Freeze/Thaw Soil Conditions in the Seasonal Frozen Soil Region of the Central Tibetan Plateau. Environ. Earth Sci. 2011, 63, 97–107. [Google Scholar] [CrossRef] [Scilit]
- Piao, S.; Tan, J.; Chen, A.; Fu, Y.H.; Ciais, P.; Liu, Q.; Janssens, I.A.; Vicca, S.; Zeng, Z.; Jeong, S.-J.; et al. Leaf Onset in the Northern Hemisphere Triggered by Daytime Temperature. Nat. Commun. 2015, 6, 6911. [Google Scholar] [CrossRef] [Scilit]
- Ma, Q.; Liu, J.; Li, X.; Li, Y.; Zeng, F.; Guo, X.; Keyimu, M. Snow Depth and Spring Temperature Dominate the Spring Phenological Shifts and Control Growing Season Dynamics on the Tibetan Plateau. Agric. For. Meteorol. 2025, 363, 110435. [Google Scholar] [CrossRef] [Scilit]
- Jiang, H.; Zhang, W.; Yi, Y.; Yang, K.; Li, G.; Wang, G. The Impacts of Soil Freeze/Thaw Dynamics on Soil Water Transfer and Spring Phenology in the Tibetan Plateau. Arct. Antarct. Alp. Res. 2018, 50, e1439155. [Google Scholar] [CrossRef] [Scilit]
- Lipson, D.A.; Raab, T.K.; Parker, M.; Kelley, S.T.; Brislawn, C.J.; Jansson, J. Changes in Microbial Communities along Redox Gradients in Polygonized A Rctic Wet Tundra Soils. Environ. Microbiol. Rep. 2015, 7, 649–657. [Google Scholar] [CrossRef] [Scilit]
- Feng, J.; Wang, C.; Lei, J.; Yang, Y.; Yan, Q.; Zhou, X.; Tao, X.; Ning, D.; Yuan, M.M.; Qin, Y.; et al. Warming-Induced Permafrost Thaw Exacerbates Tundra Soil Carbon Decomposition Mediated by Microbial Community. Microbiome 2020, 8, 3. [Google Scholar] [CrossRef] [Scilit] [PubMed]
- Chen, S.; Gu, Y.; Liu, E.; Wu, M.; Cheng, X.; Yang, P.; Bahadur, A.; Bai, R.; Chen, J.; Zhang, M.; et al. Freeze-Thaw Strength Increases Microbial Stability to Enhance Diversity-Soil Multifunctionality Relationship. Commun. Earth Environ. 2024, 5, 578. [Google Scholar] [CrossRef] [Scilit]
- Natali, S.M.; Schuur, E.A.G.; Rubin, R.L. Increased Plant Productivity in Alaskan Tundra as a Result of Experimental Warming of Soil and Permafrost. J. Ecol. 2012, 100, 488–498. [Google Scholar] [CrossRef] [Scilit]
- Descals, A.; Verger, A.; Yin, G.; Filella, I.; Fu, Y.H.; Piao, S.; Janssens, I.A.; Peñuelas, J. Radiation-constrained Boundaries Cause Nonuniform Responses of the Carbon Uptake Phenology to Climatic Warming in the Northern Hemisphere. Glob. Change Biol. 2023, 29, 719–730. [Google Scholar] [CrossRef] [Scilit] [PubMed]
- Yang, H.; Xing, Y.; Chang, X.; Wang, J.; Li, Y.; Tang, J.; Wang, D. Internal Response of Vegetation Growth to Degrees of Permafrost Degradation in Northeast China from 2001 to 2020. Geo-Spat. Inf. Sci. 2025, 28, 265–283. [Google Scholar] [CrossRef] [Scilit]
- Park, H.; Kim, Y.; Kimball, J.S. Widespread Permafrost Vulnerability and Soil Active Layer Increases over the High Northern Latitudes Inferred from Satellite Remote Sensing and Process Model Assessments. Remote Sens. Environ. 2016, 175, 349–358. [Google Scholar] [CrossRef] [Scilit]
- Wrona, F.J.; Johansson, M.; Culp, J.M.; Jenkins, A.; Mård, J.; Myers-Smith, I.H.; Prowse, T.D.; Vincent, W.F.; Wookey, P.A. Transitions in Arctic Ecosystems: Ecological Implications of a Changing Hydrological Regime. J. Geophys. Res. Biogeosciences 2016, 121, 650–674. [Google Scholar] [CrossRef] [Scilit]
- Chang, J.; Ye, R.; Wang, G. Review: Progress in Permafrost Hydrogeology in China. Hydrogeol. J. 2018, 26, 1387–1399. [Google Scholar] [CrossRef] [Scilit]
- Jorgenson, M.T.; Racine, C.H.; Walters, J.C.; Osterkamp, T.E. Permafrost Degradation and Ecological Changes Associated with a Warming Climate in Central Alaska. Clim. Change 2001, 48, 551–579. [Google Scholar] [CrossRef] [Scilit]
- Keuper, F.; Dorrepaal, E.; Van Bodegom, P.M.; Van Logtestijn, R.; Venhuizen, G.; Van Hal, J.; Aerts, R. Experimentally Increased Nutrient Availability at the Permafrost Thaw Front Selectively Enhances Biomass Production of Deep-rooting Subarctic Peatland Species. Glob. Change Biol. 2017, 23, 4257–4266. [Google Scholar] [CrossRef] [Scilit]
- Wang, R.; Dong, Z.; Zhou, Z. Effect of Decreasing Soil Frozen Depth on Vegetation Growth in the Source Region of the Yellow River for 1982–2015. Theor. Appl. Climatol. 2020, 140, 1185–1197. [Google Scholar] [CrossRef] [Scilit]
- Lin, S.; Wang, G.; Hu, Z.; Sun, X.; Song, C.; Huang, K.; Sun, J.; Yang, Y. Contrasting Response of Growing Season Water Use Efficiency to Precipitation Changes between Alpine Meadows and Alpine Steppes over the Tibetan Plateau. Agric. Water Manag. 2023, 289, 108571. [Google Scholar] [CrossRef] [Scilit]
- Wang, T.; Yang, D.; Yang, Y.; Zheng, G.; Jin, H.; Li, X.; Yao, T.; Cheng, G. Unsustainable Water Supply from Thawing Permafrost on the Tibetan Plateau in a Changing Climate. Sci. Bull. 2023, 68, 1105–1108. [Google Scholar] [CrossRef] [Scilit]
- Wu, X.; Zhao, L.; Hu, G.; Liu, G.; Li, W.; Ding, Y. Permafrost and Land Cover as Controlling Factors for Light Fraction Organic Matter on the Southern Qinghai-Tibetan Plateau. Sci. Total Environ. 2018, 613–614, 1165–1174. [Google Scholar] [CrossRef] [Scilit]
- Yang, Z.; Gao, J.; Zhao, L.; Xu, X.; Ouyang, H. Linking Thaw Depth with Soil Moisture and Plant Community Composition: Effects of Permafrost Degradation on Alpine Ecosystems on the Qinghai-Tibet Plateau. Plant Soil 2013, 367, 687–700. [Google Scholar] [CrossRef] [Scilit]
- Li, T.; Fu, B.; Lü, Y.; Ran, Y.; Du, C.; Zhao, Z.; Sun, C.; Wang, H.; Huang, B.; Wu, X. The Thickening of the Active Layer Will Negate the Promoting Effect on Vegetation Productivity in Permafrost Regions. Environ. Res. Lett. 2025, 20, 054042. [Google Scholar] [CrossRef] [Scilit]
- Piao, S.; Liu, Q.; Chen, A.; Janssens, I.A.; Fu, Y.; Dai, J.; Liu, L.; Lian, X.; Shen, M.; Zhu, X. Plant Phenology and Global Climate Change: Current Progresses and Challenges. Glob. Change Biol. 2019, 25, 1922–1940. [Google Scholar] [CrossRef] [Scilit] [PubMed]
- Ma, N.; Zhang, Y. Contrasting Trends in Water Use Efficiency of the Alpine Grassland in Tibetan Plateau. J. Geophys. Res. Atmos. 2022, 127, e2022JD036919. [Google Scholar] [CrossRef] [Scilit]
- Liu, W.; Mo, X.; Liu, S.; Lin, Z.; Lv, C. Attributing the Changes of Grass Growth, Water Consumed and Water Use Efficiency over the Tibetan Plateau. J. Hydrol. 2021, 598, 126464. [Google Scholar] [CrossRef] [Scilit]
- Ran, Y.; Li, X.; Che, T.; Wang, B.; Cheng, G. Current State and Past Changes in Frozen Ground at the Third Pole; National Tibet Plateau Data Center: Beijing, China, 2022. [Google Scholar]
- Ni, J.; Wu, T.; Zhu, X.; Hu, G.; Zou, D.; Wu, X.; Li, R.; Xie, C.; Qiao, Y.; Pang, Q.; et al. Simulation of the Present and Future Projection of Permafrost on the Qinghai-Tibet Plateau with Statistical and Machine Learning Models. J. Geophys. Res. Atmos. 2021, 126, e2020JD033402. [Google Scholar] [CrossRef] [Scilit]
- Yan, D.; Zheng, X.; Feng, M.; Liang, S.; Hu, Z.; Kuang, X.; Feng, Y. Frozen Ground Change Data Set in the Tibetan Plateau (1961–2020); National Tibet Plateau Data Center: Beijing, China, 2024. [Google Scholar]
- Xu, X.; Wu, Q. Active Layer Thickness Variation on the Qinghai-Tibetan Plateau: Historical and Projected Trends. J. Geophys. Res. Atmos. 2021, 126, e2021JD034841. [Google Scholar] [CrossRef] [Scilit]
- Huang, J.; Li, C.; Jia, B.; Gao, C.; Li, R. Variation in the Permafrost Active Layer over the Tibetan Plateau during 1980–2020. Atmos. Ocean. Sci. Lett. 2024, 17, 100536. [Google Scholar] [CrossRef] [Scilit]
- Chen, F.; Luo, D.; Dai, L.; Gao, Y.; Lei, W.; Huang, Y. Spatial and Temporal Characteristics of the Site-Specific N-Factor over the Qinghai-Tibet Plateau. Cold Reg. Sci. Technol. 2023, 205, 103684. [Google Scholar] [CrossRef] [Scilit]
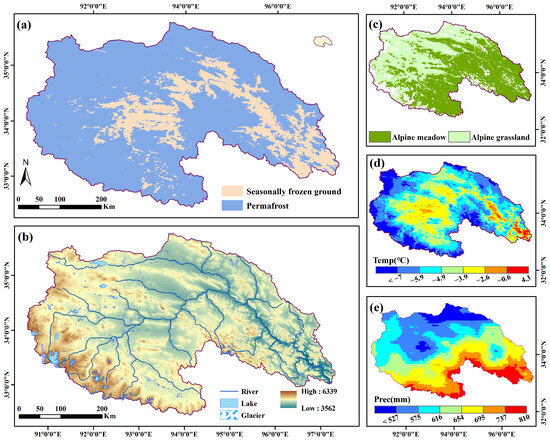
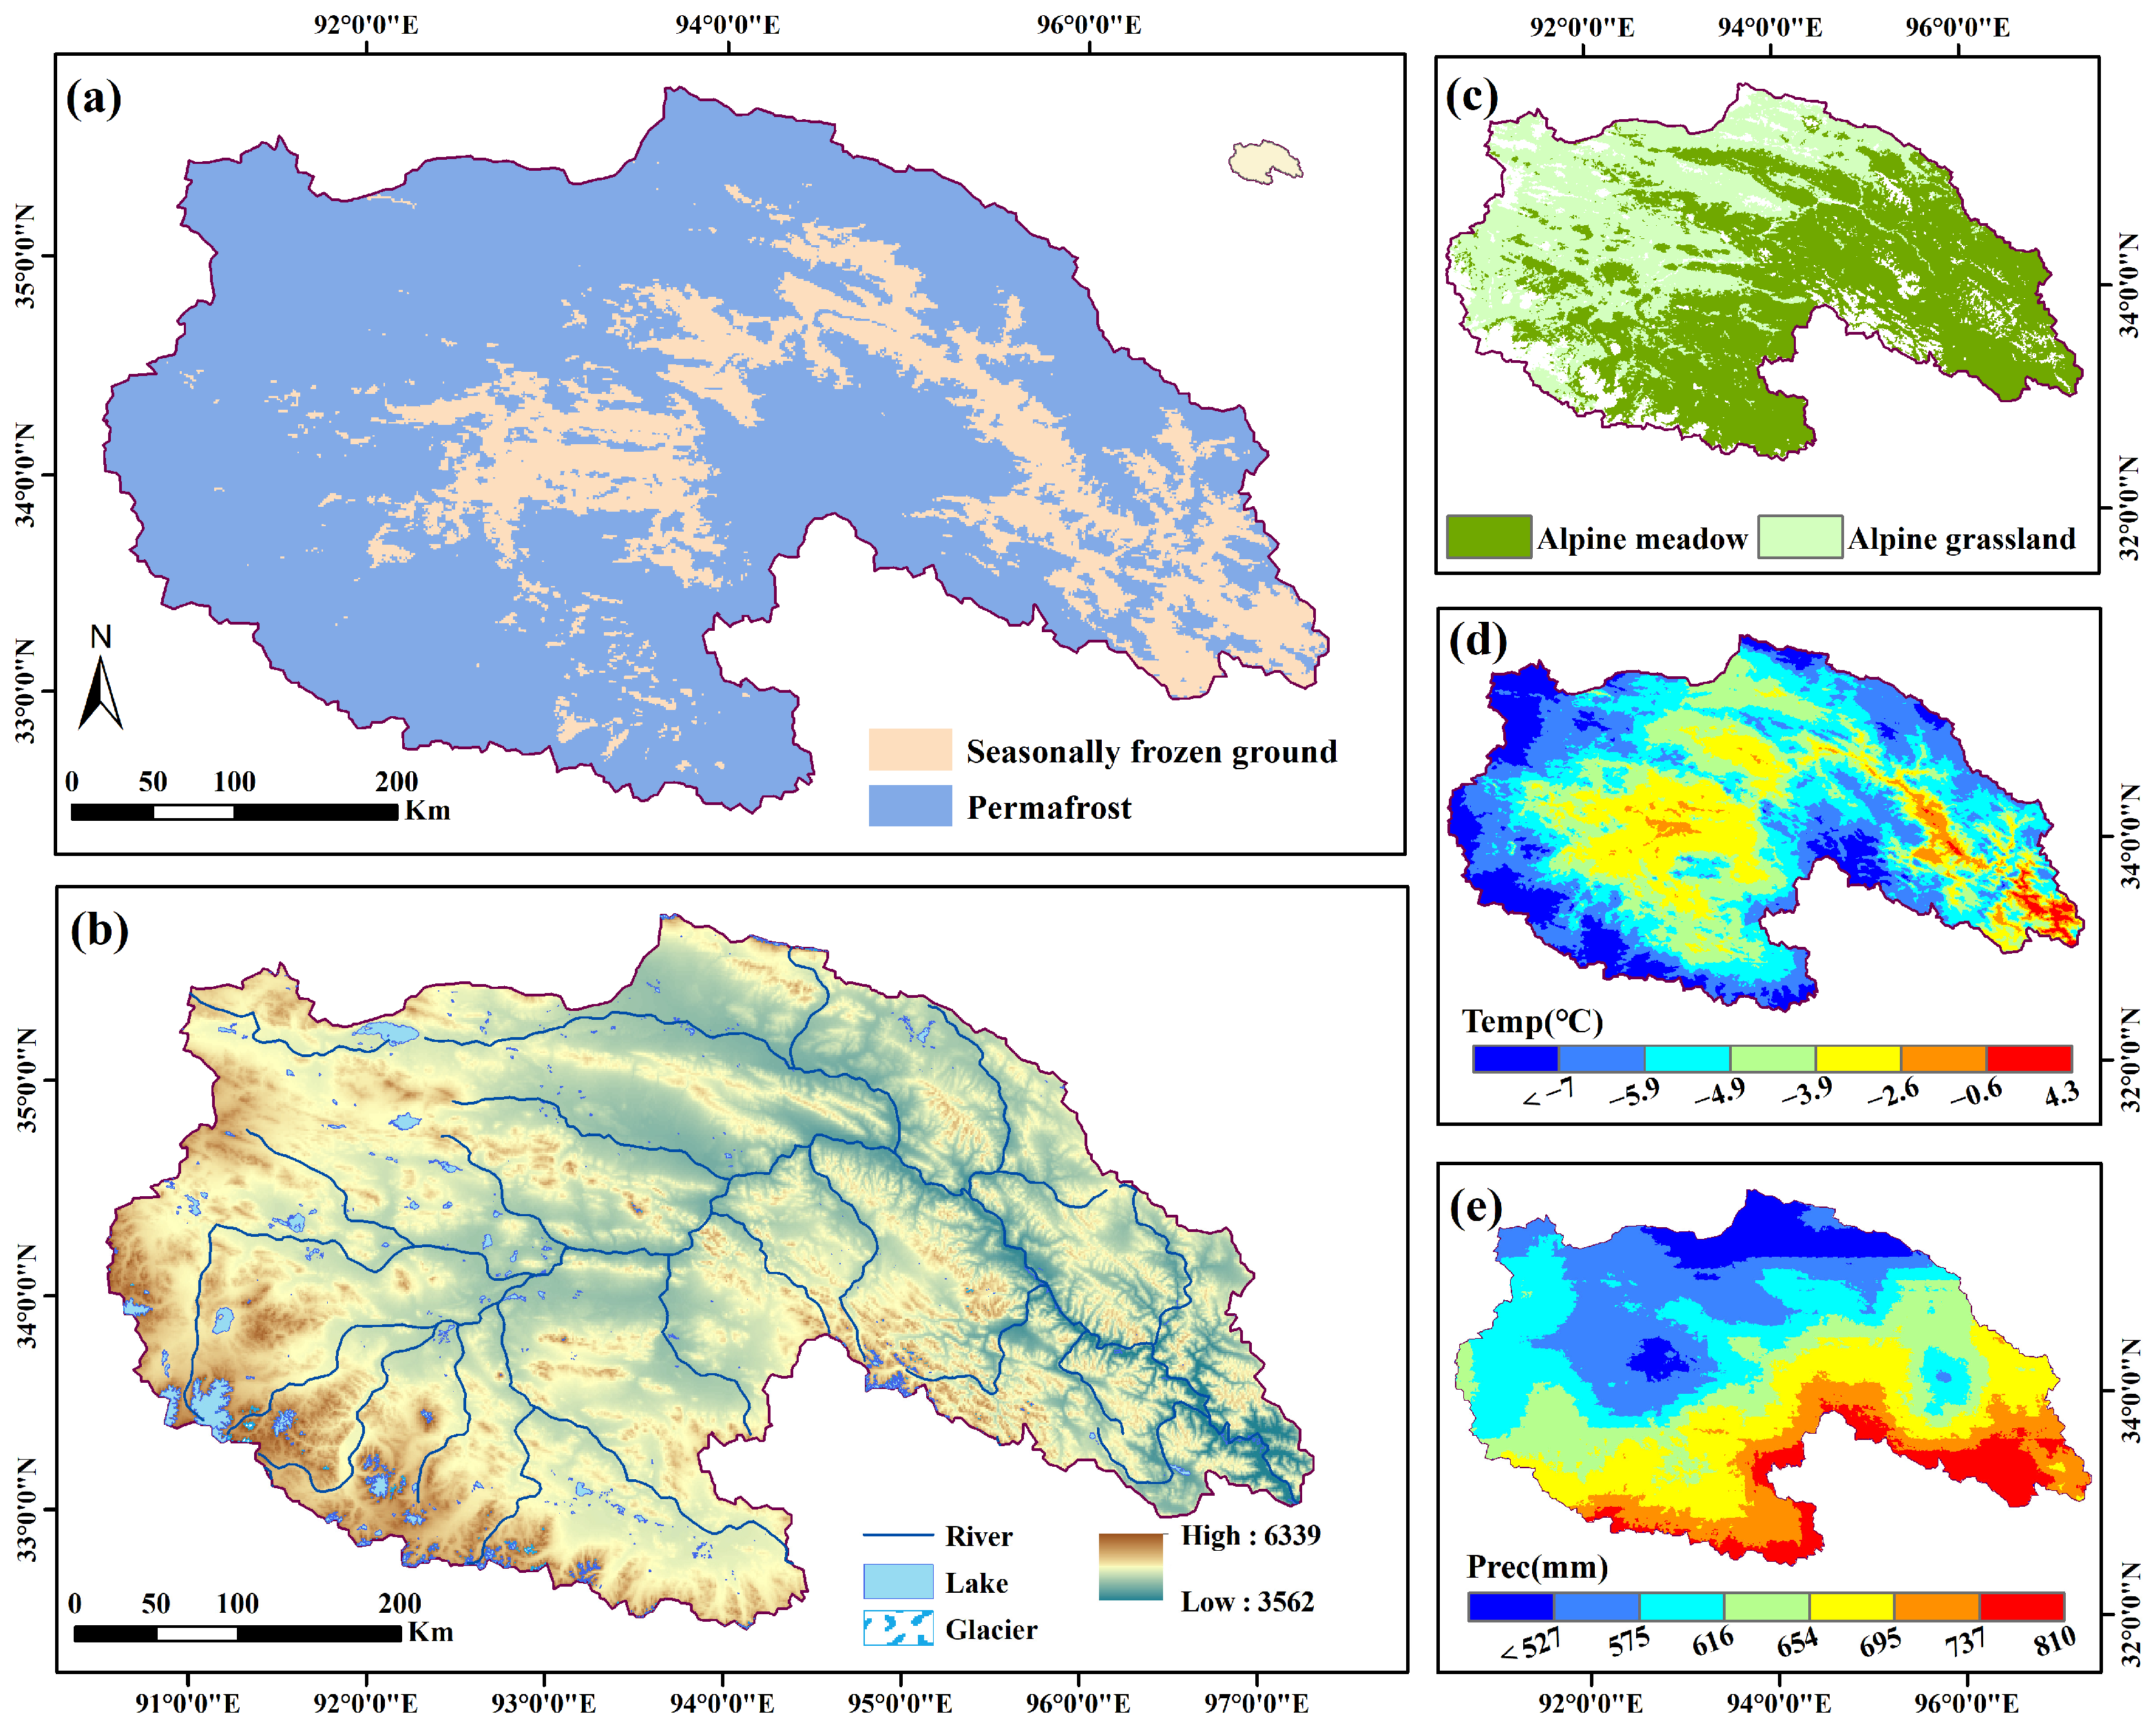
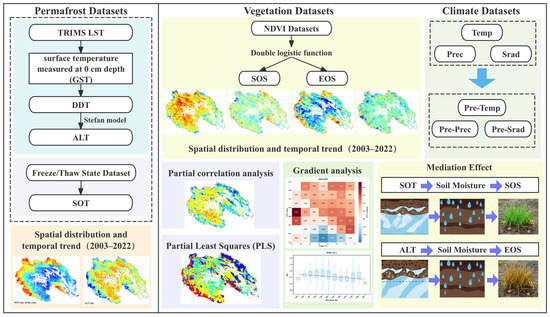
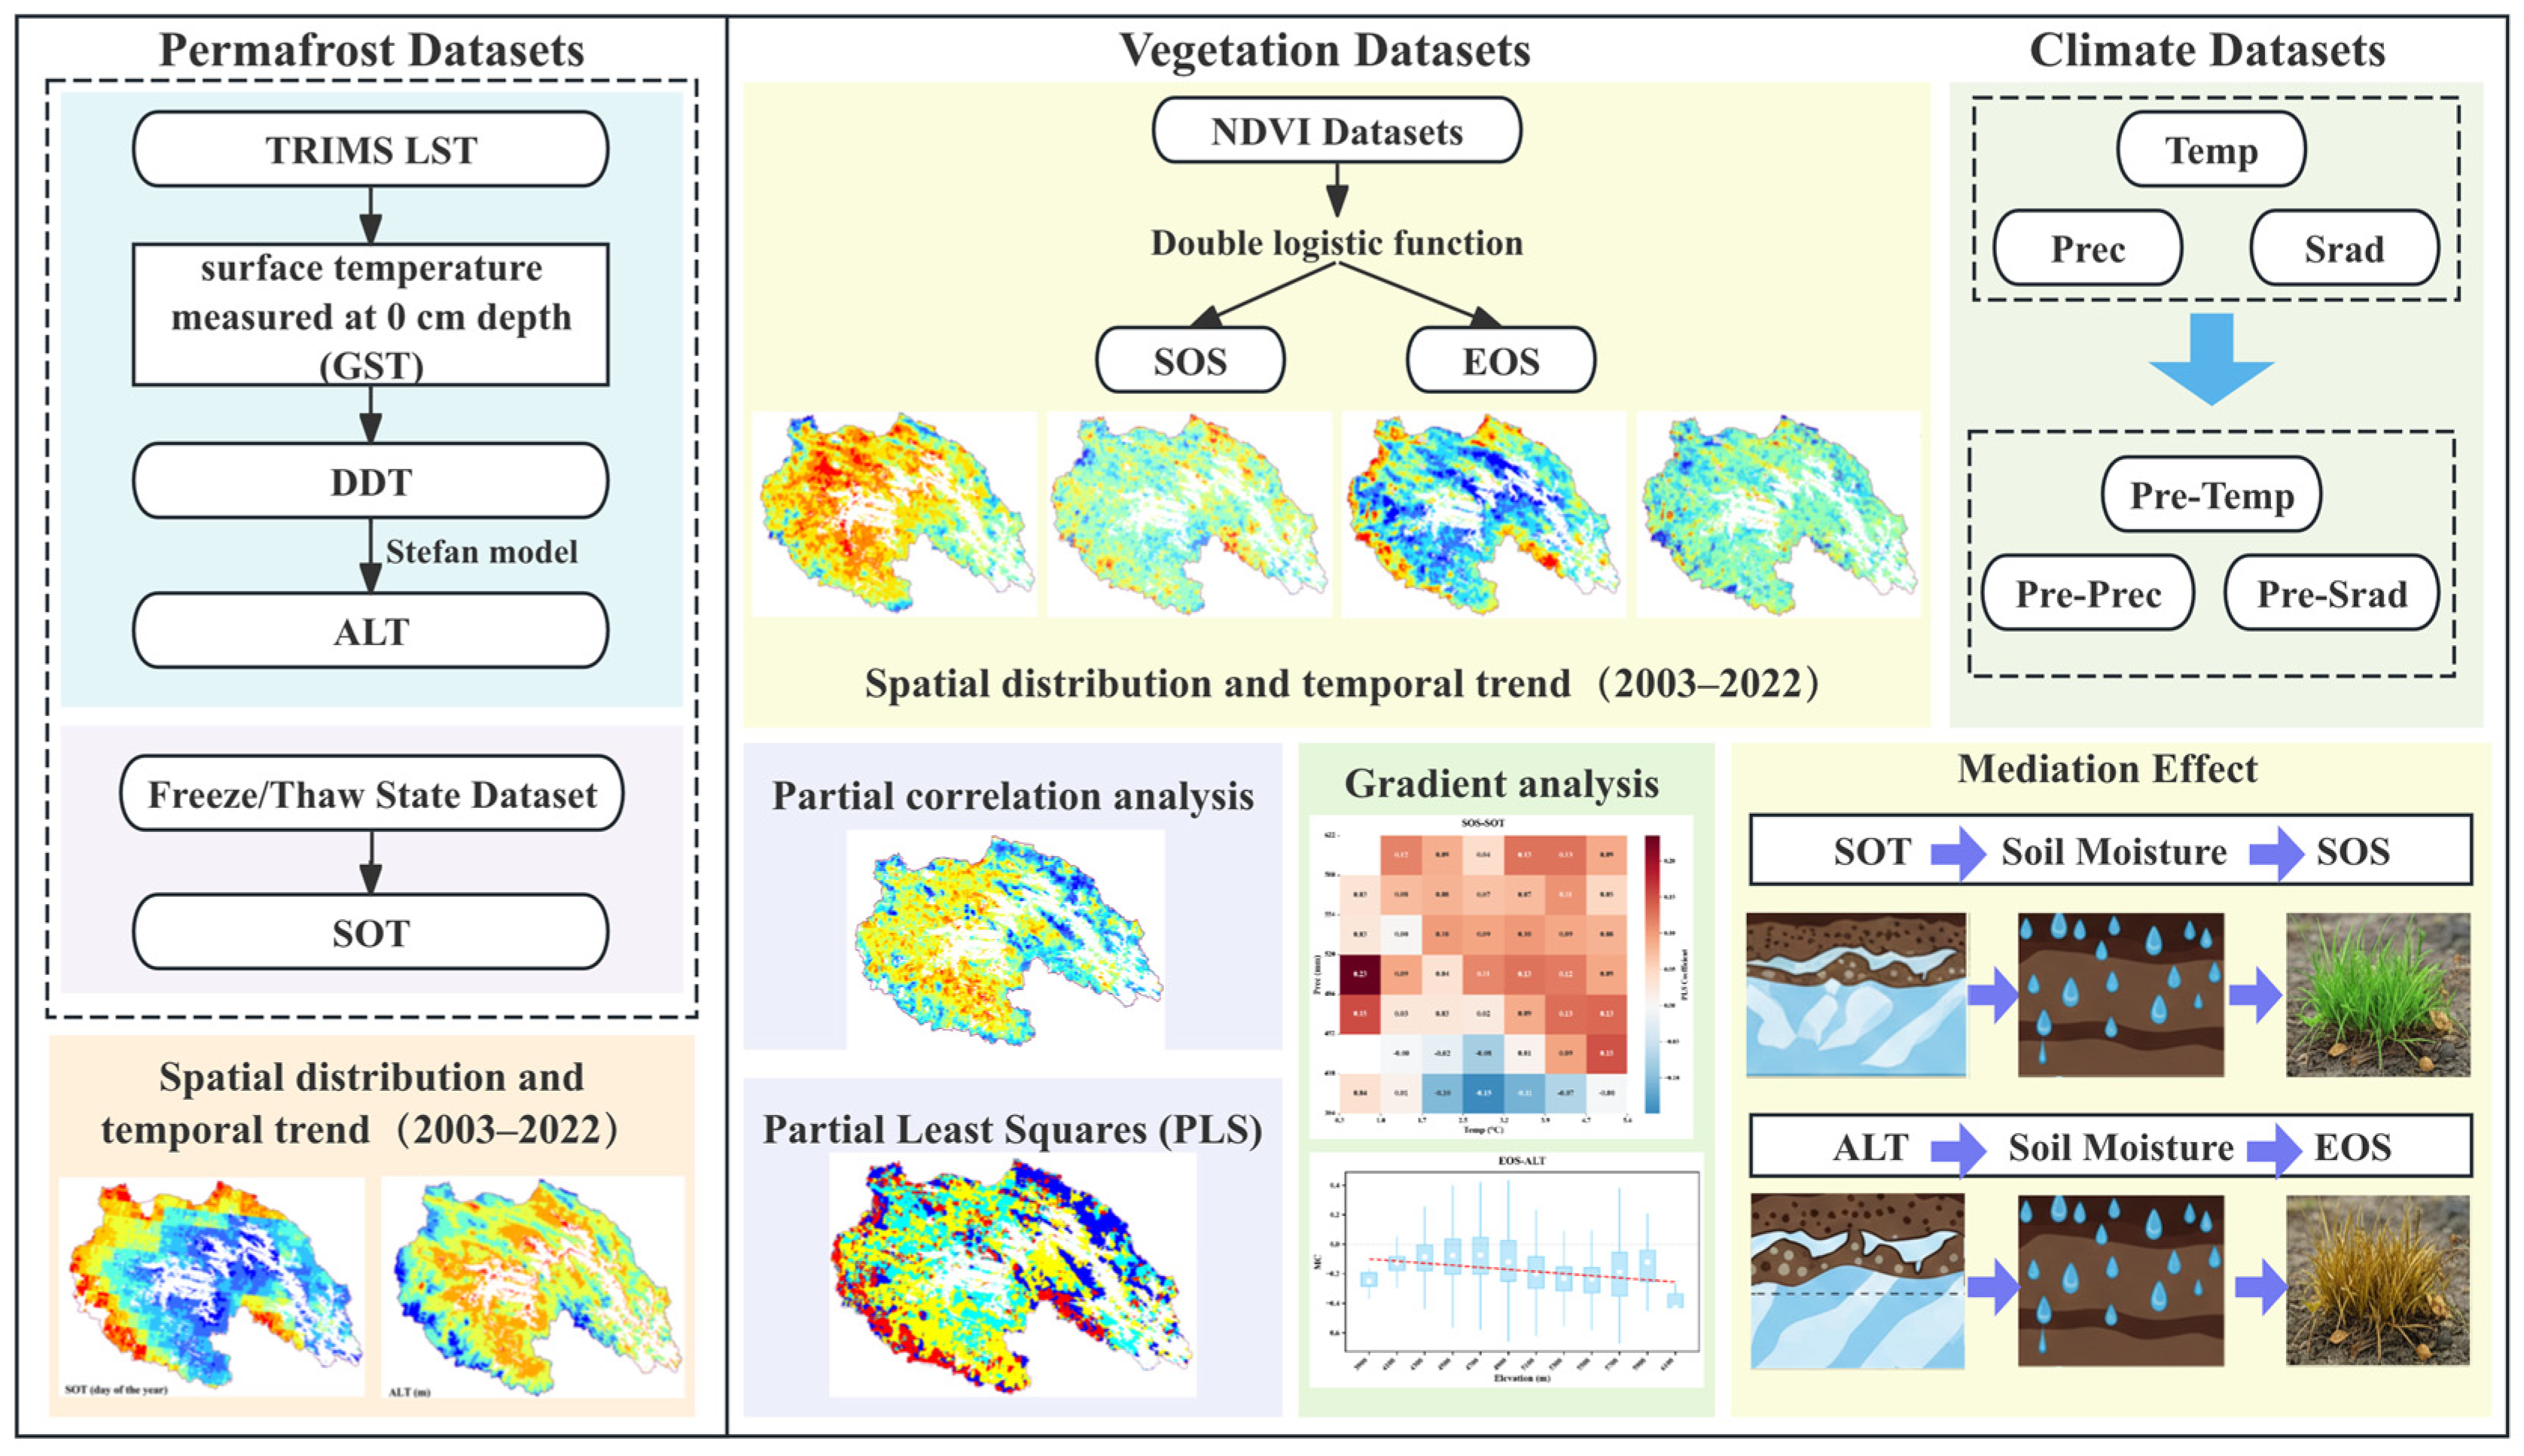
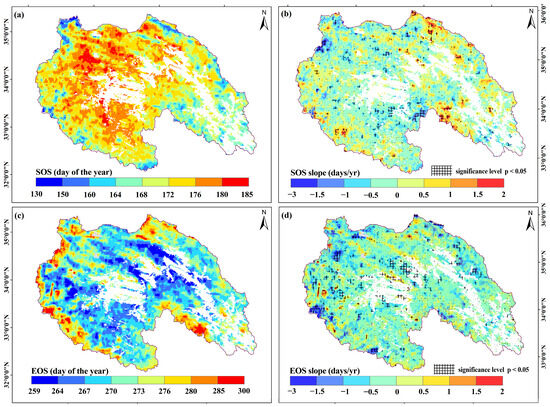
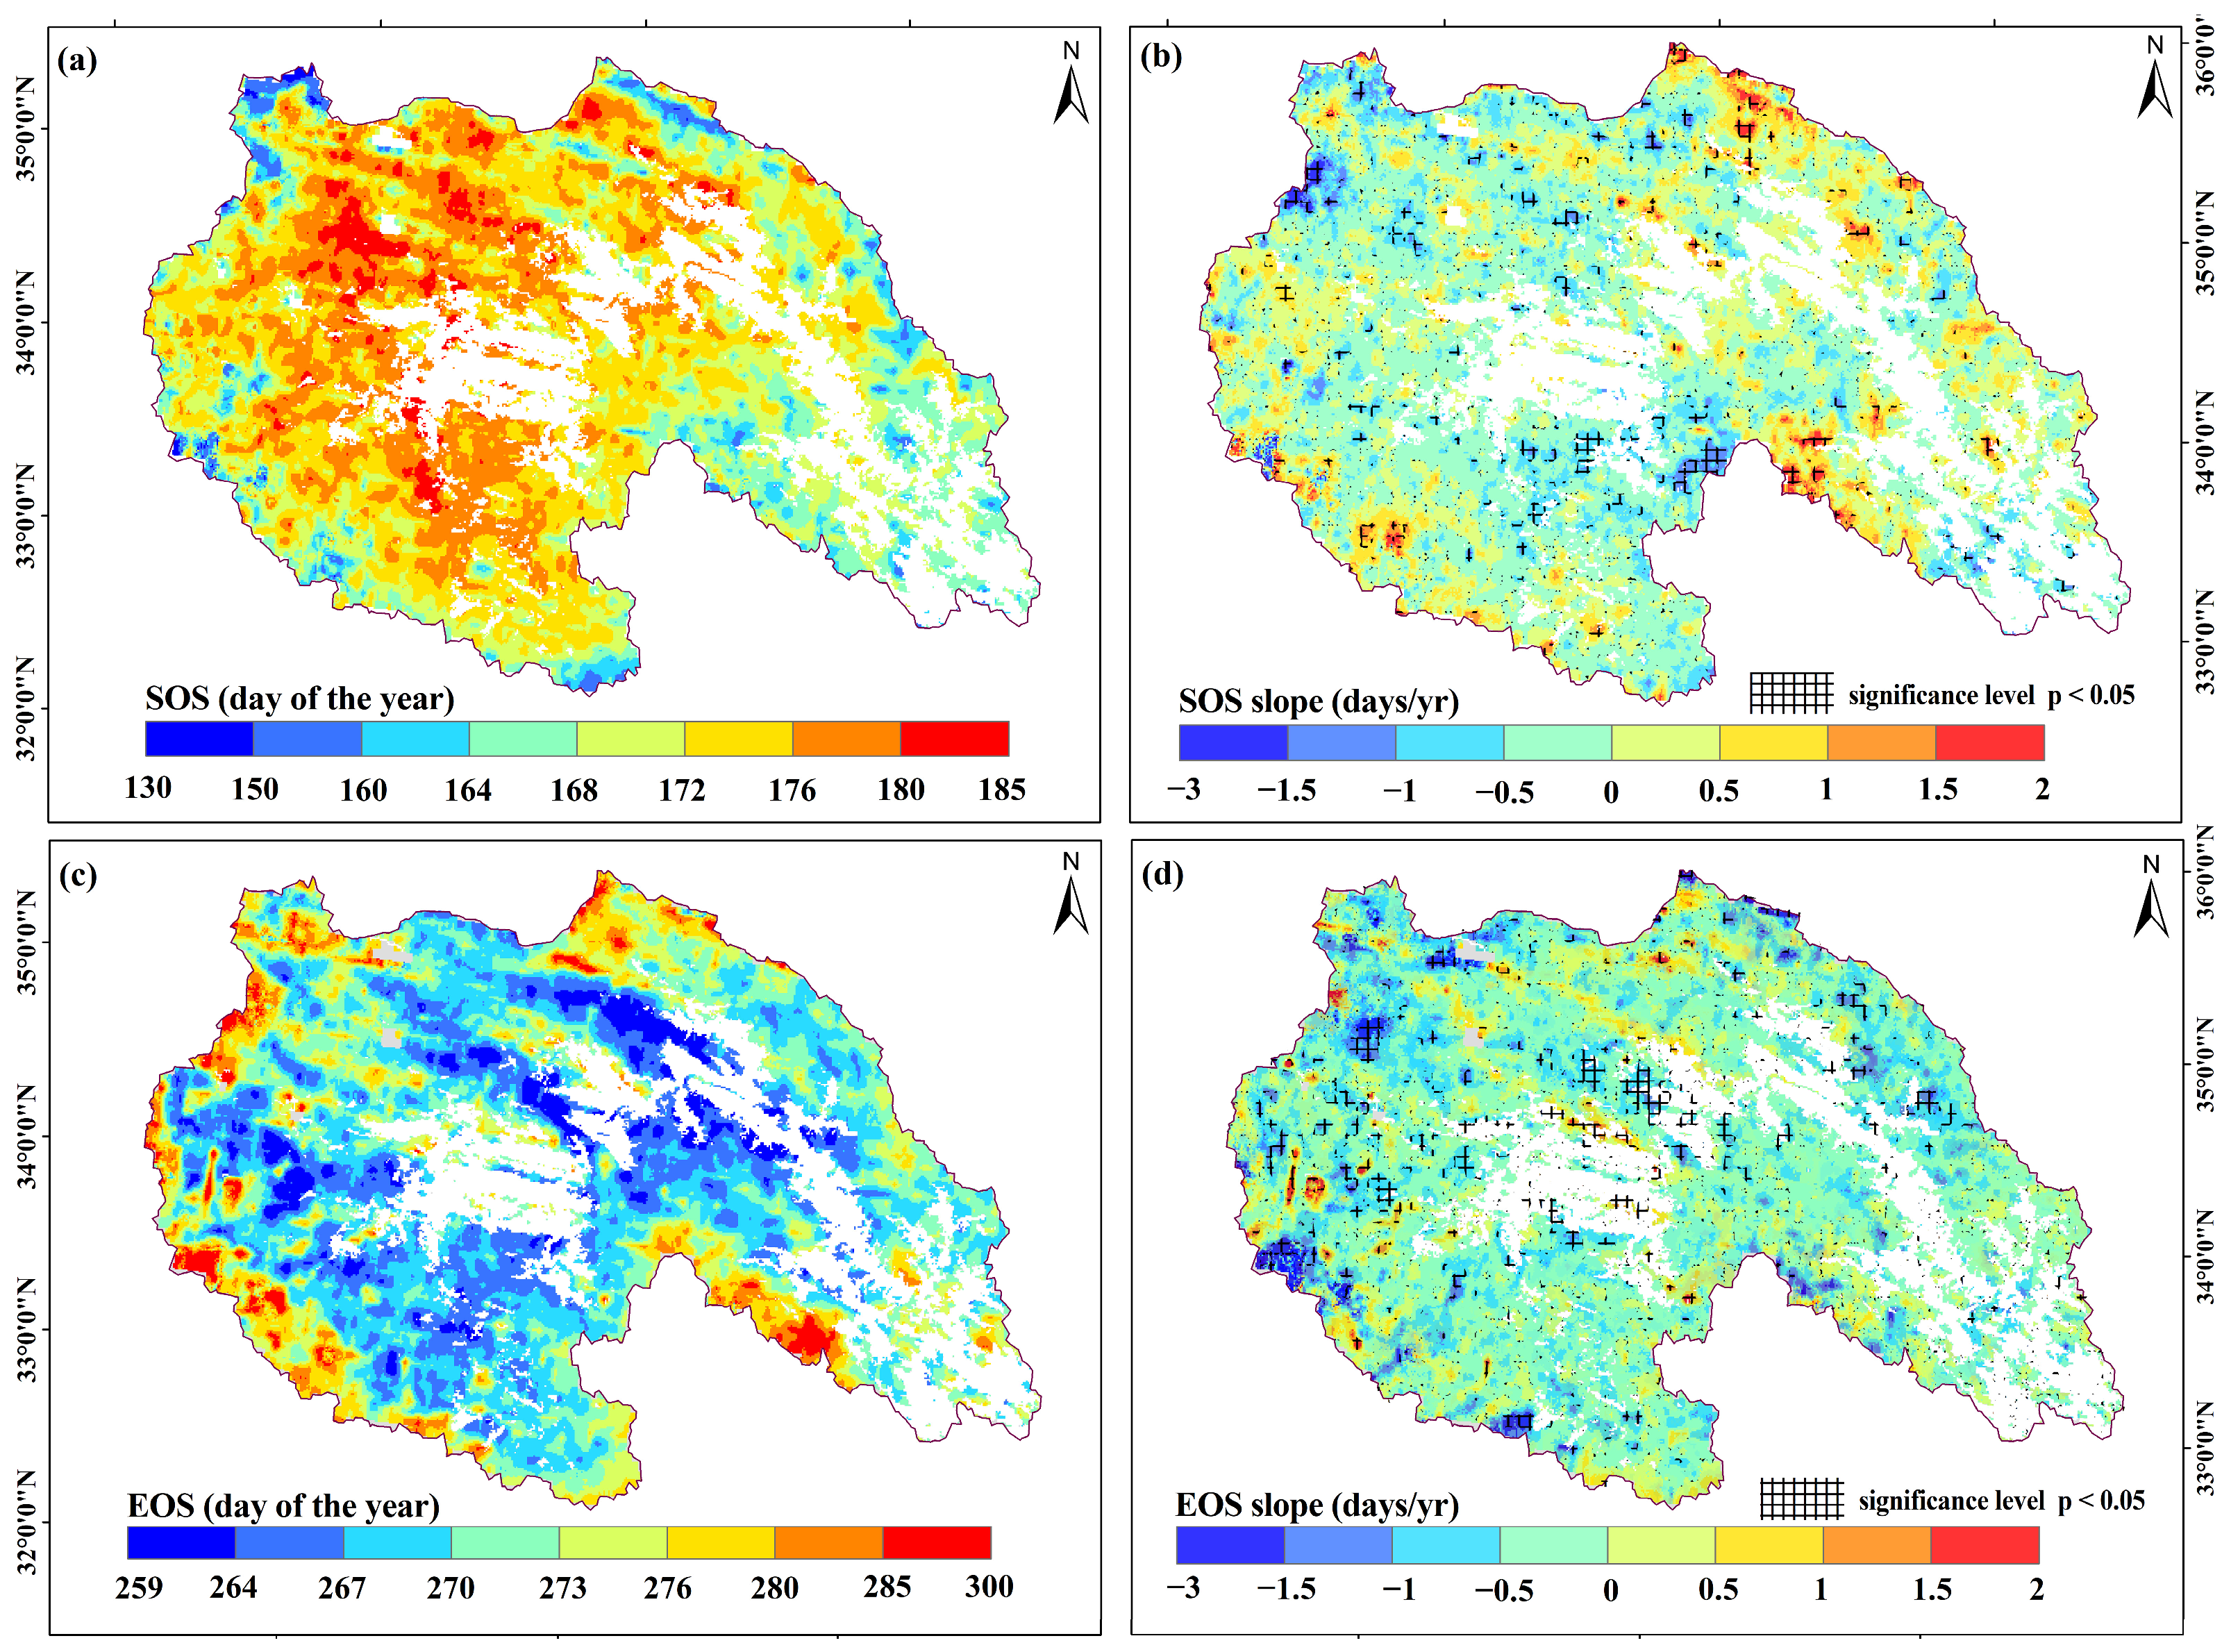
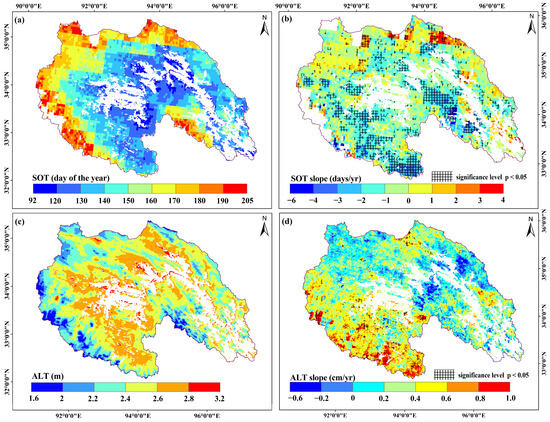
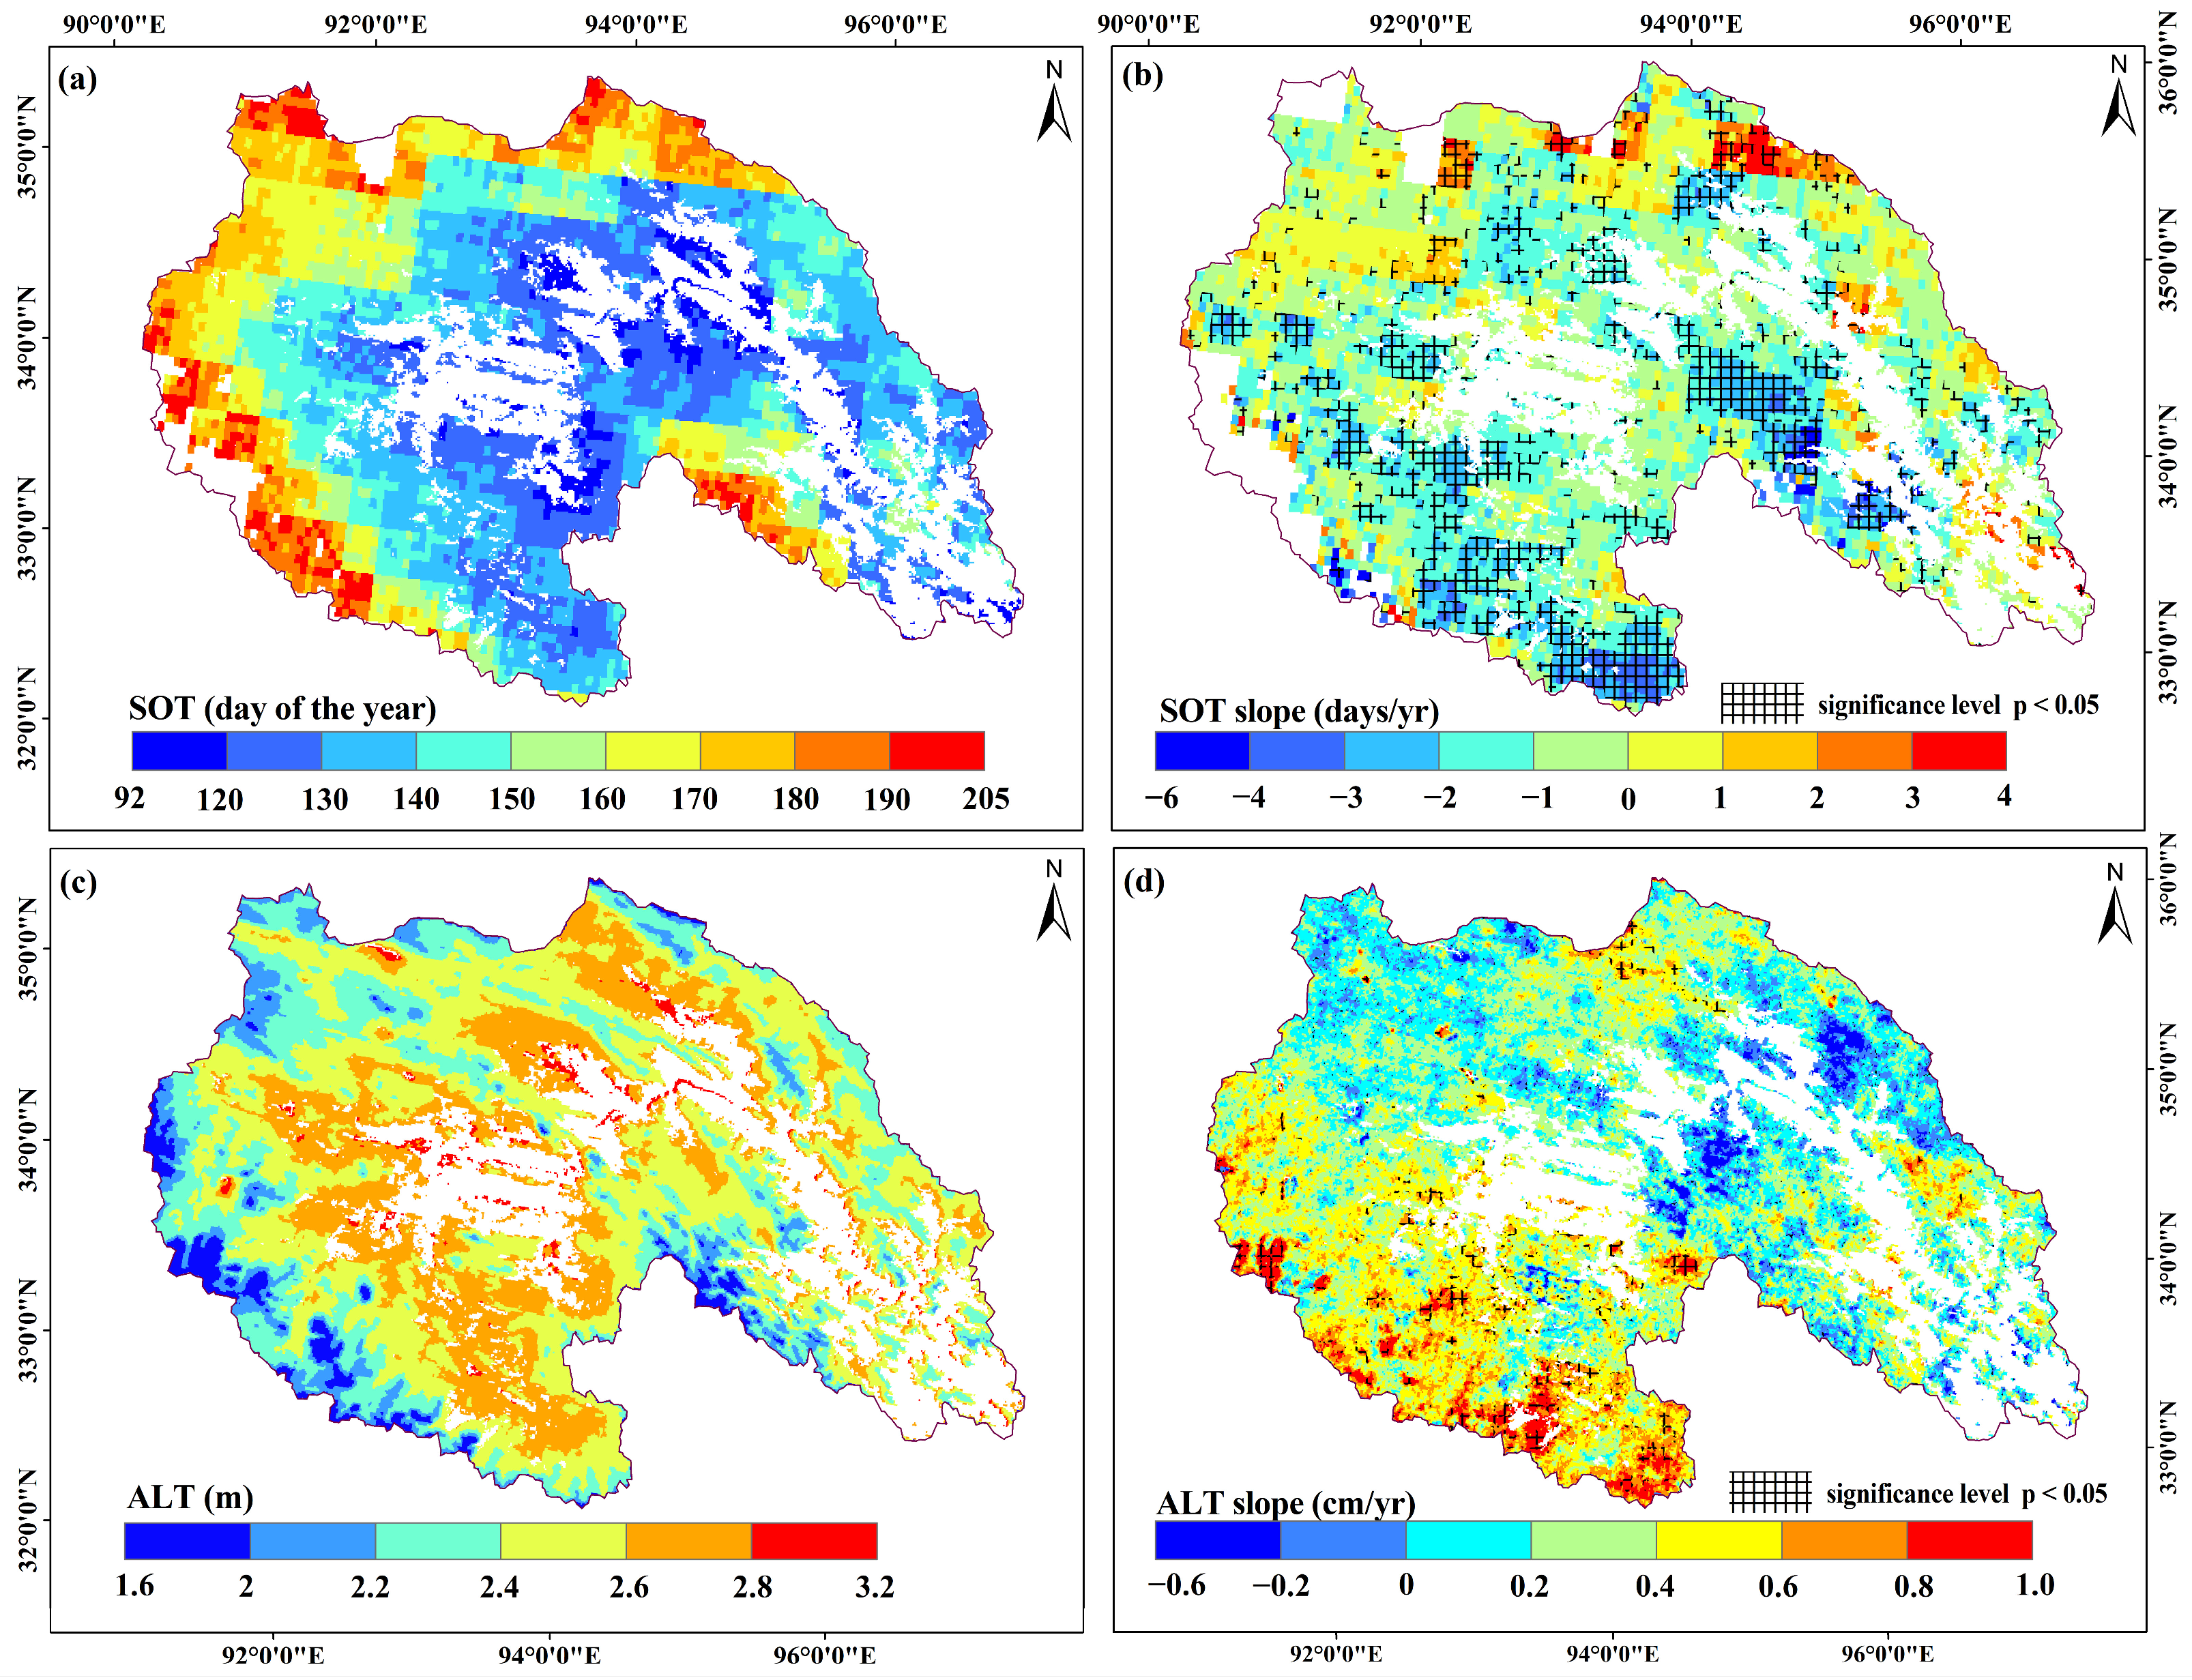
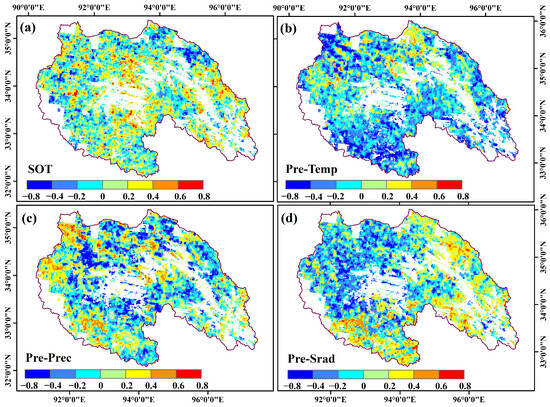
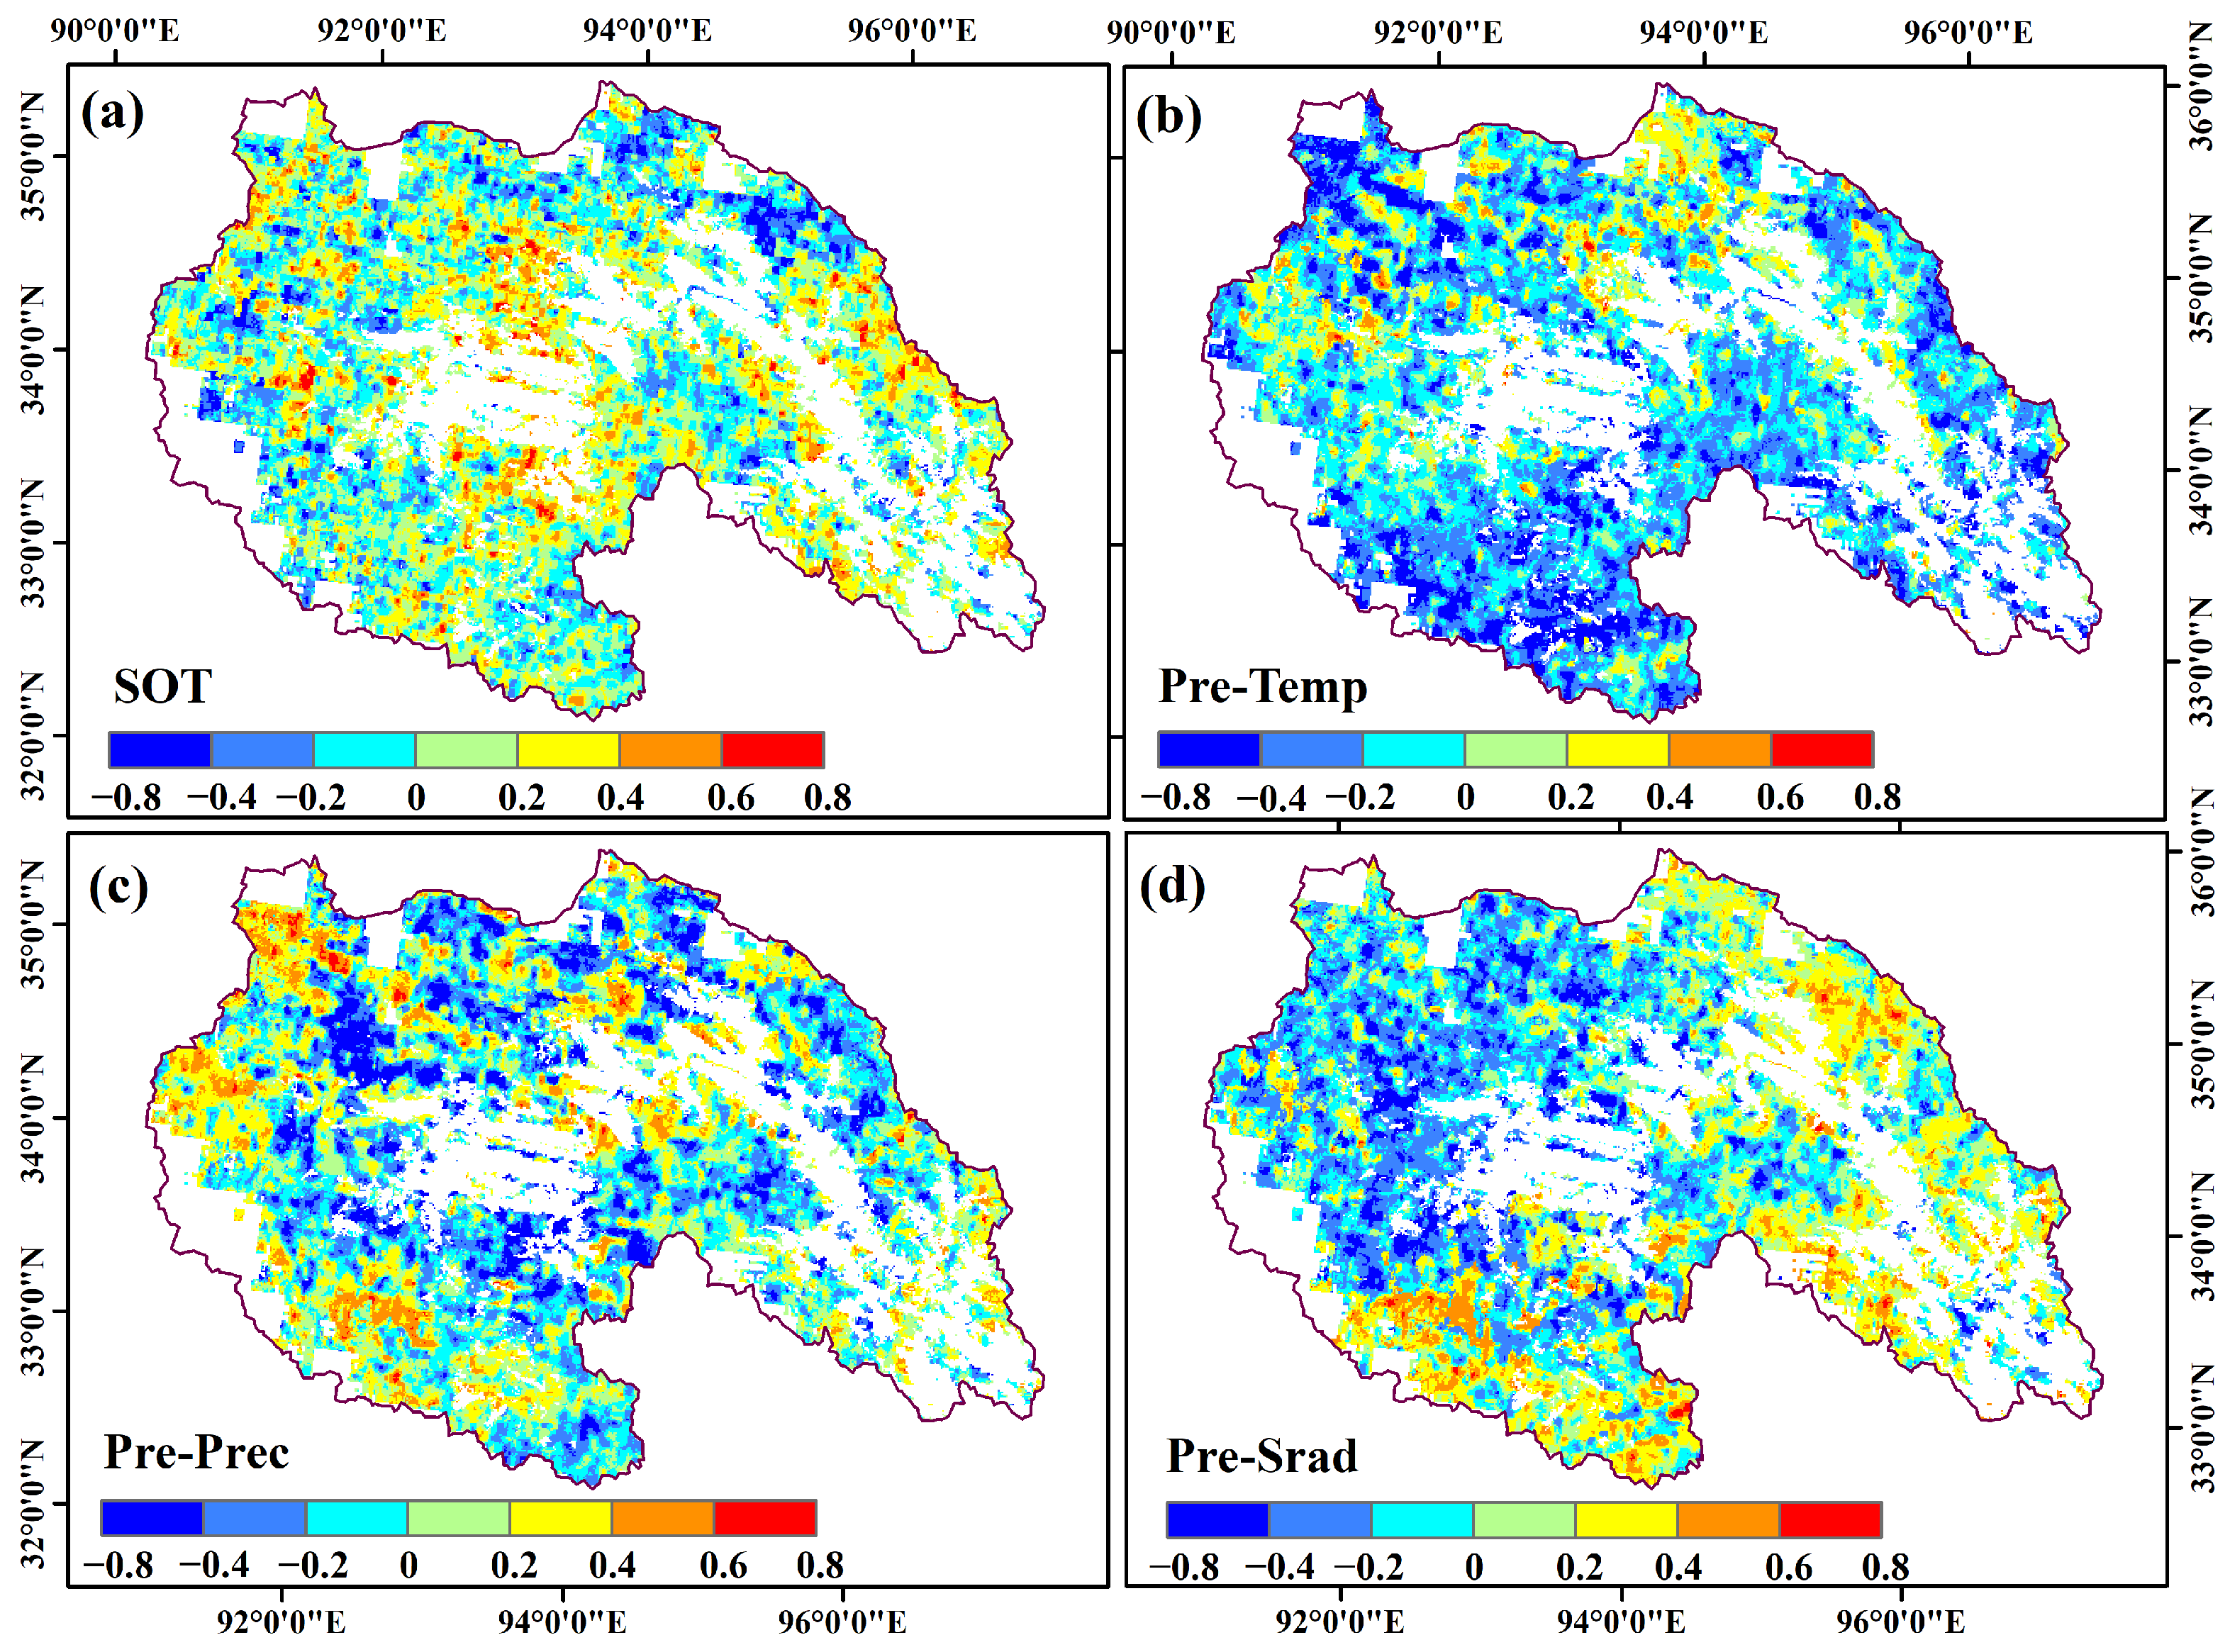
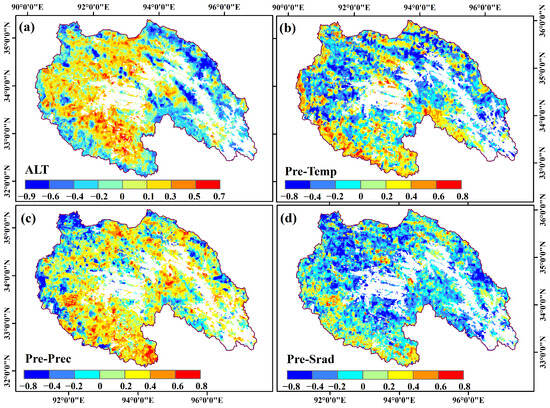
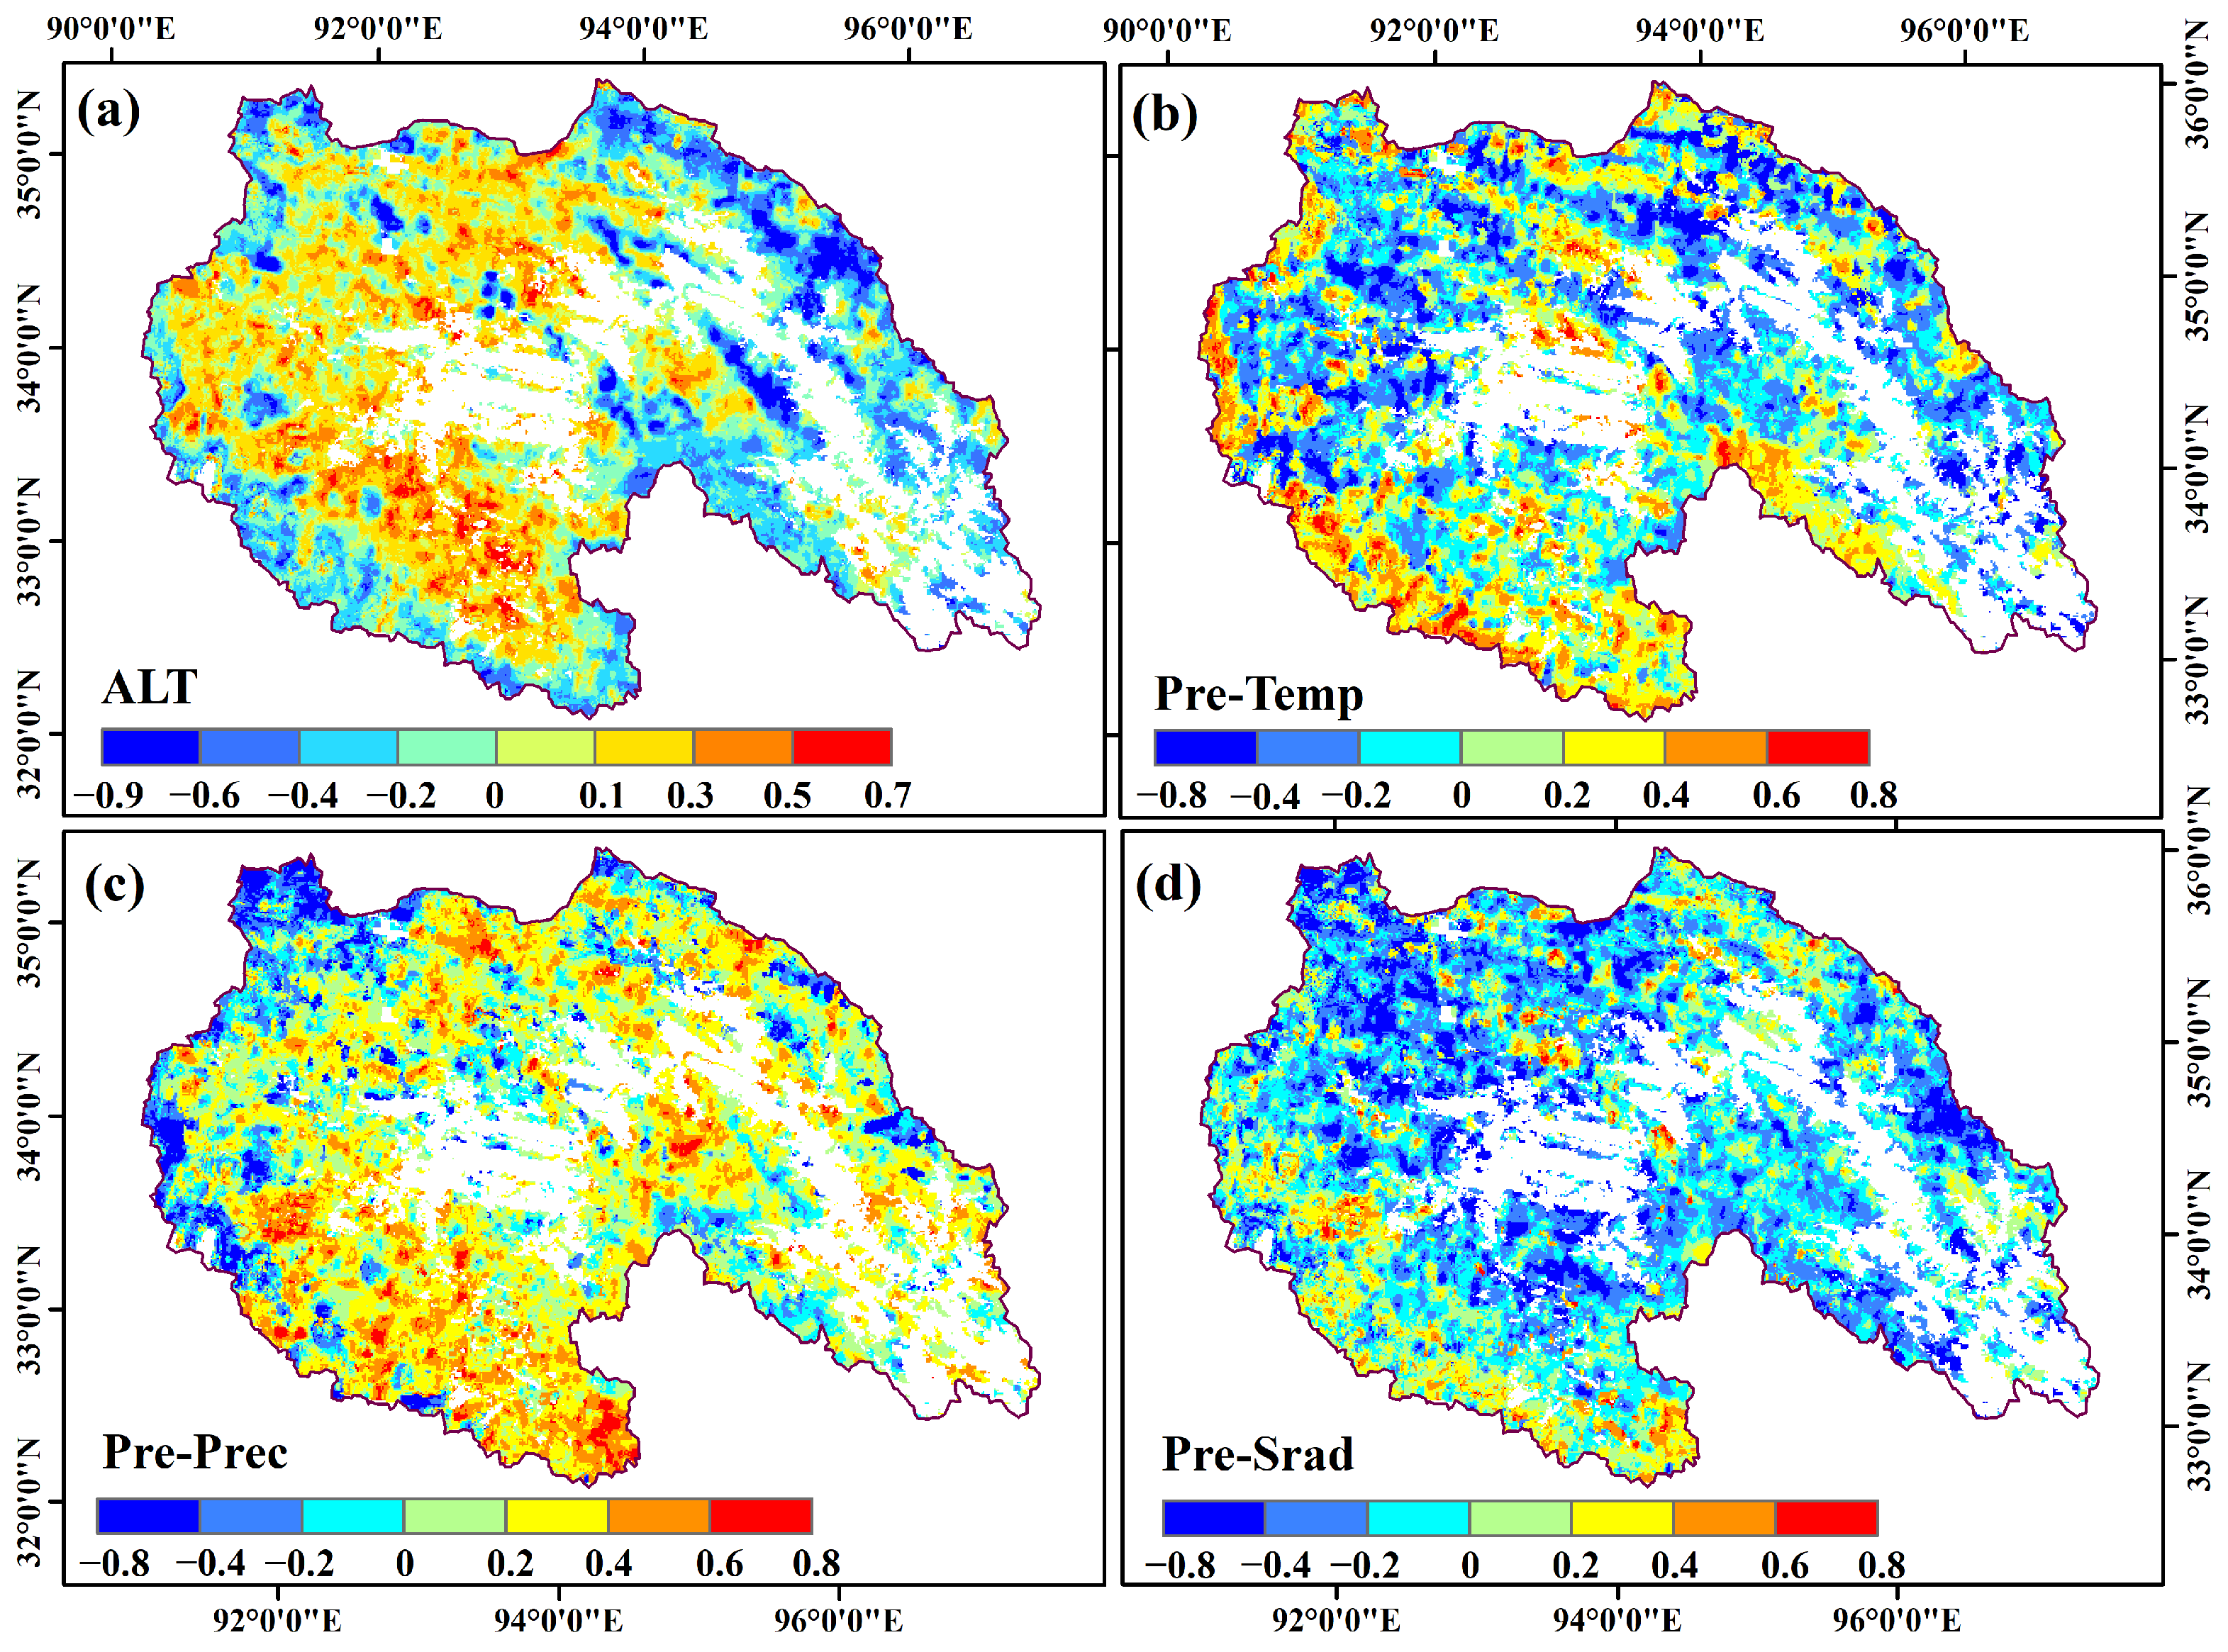
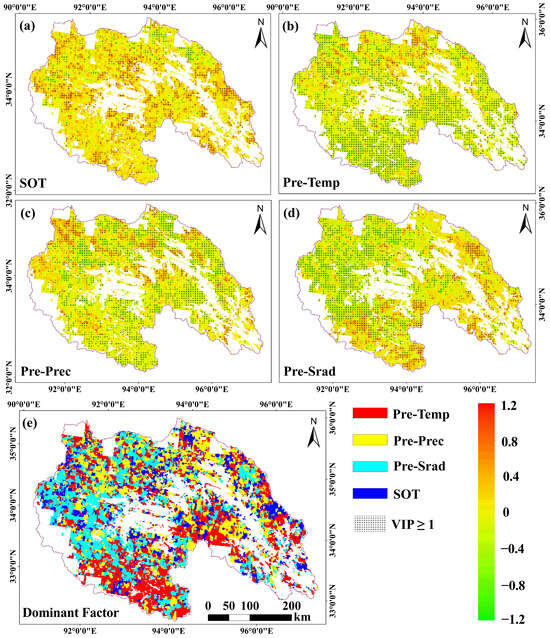
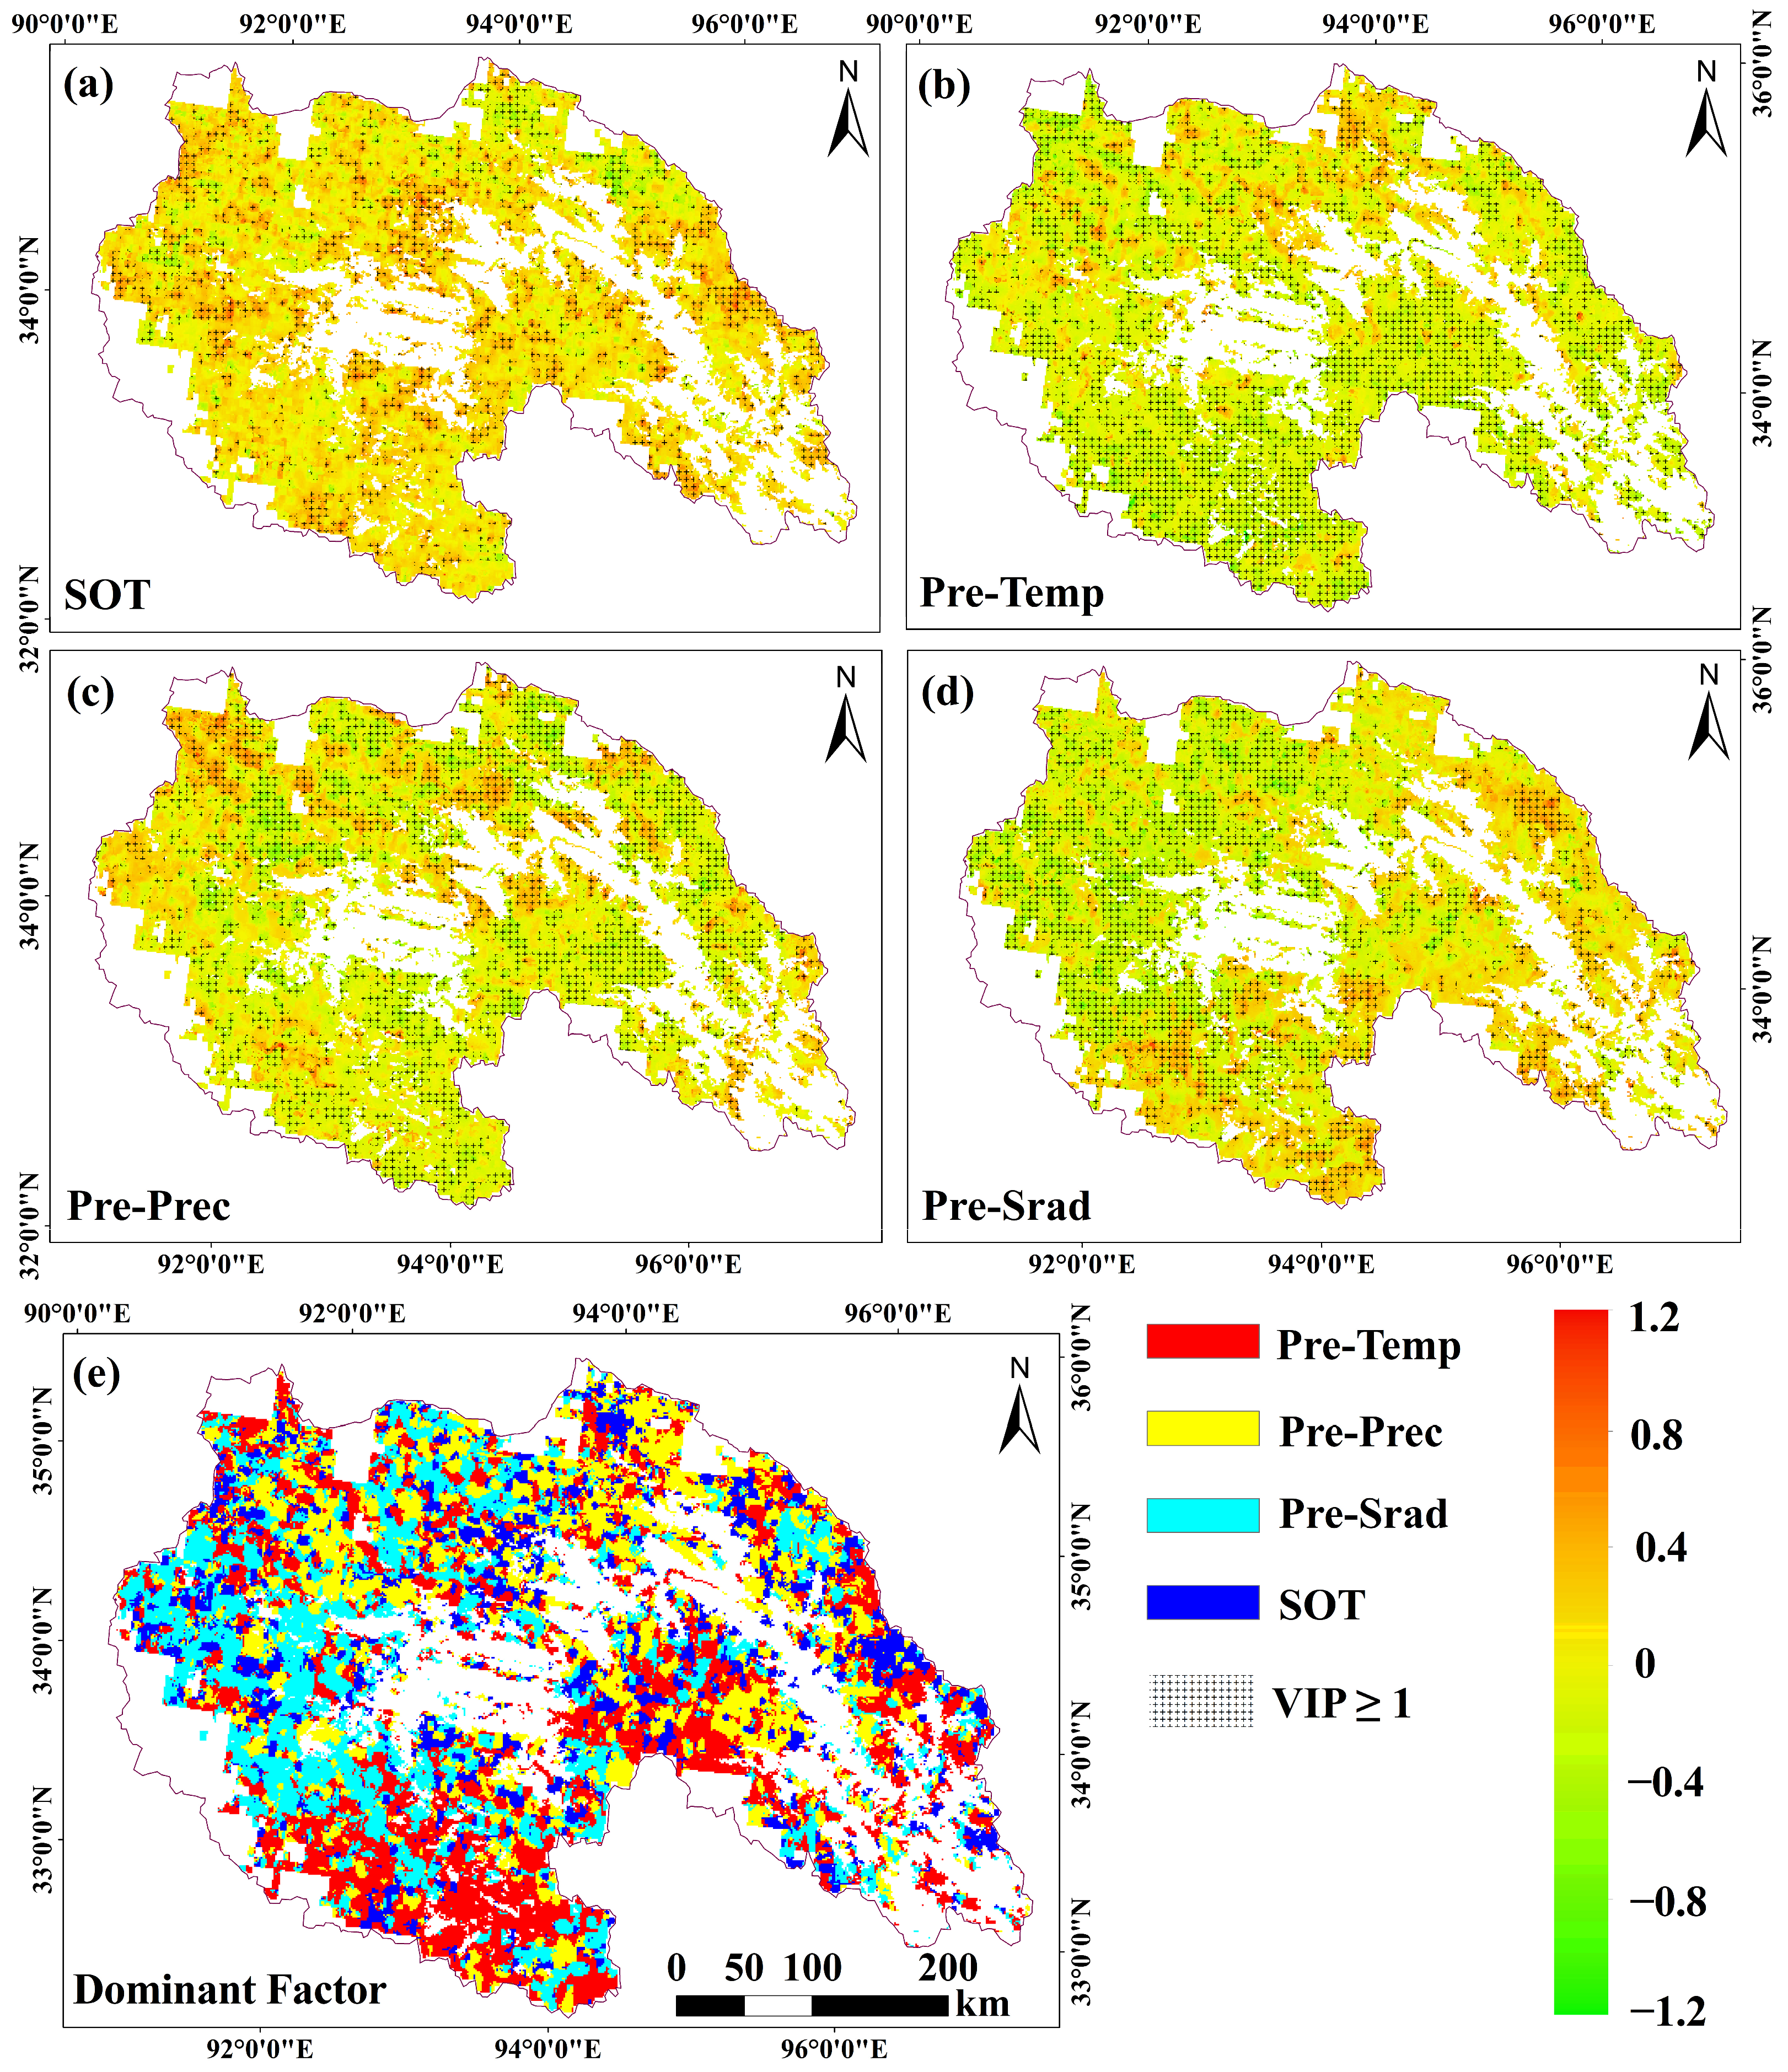
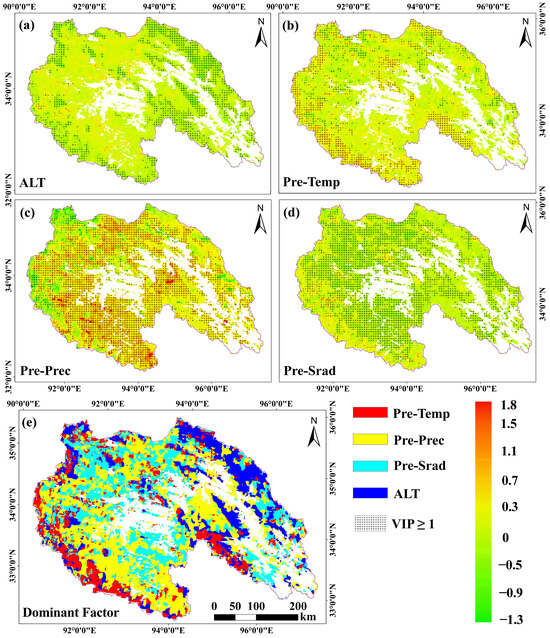
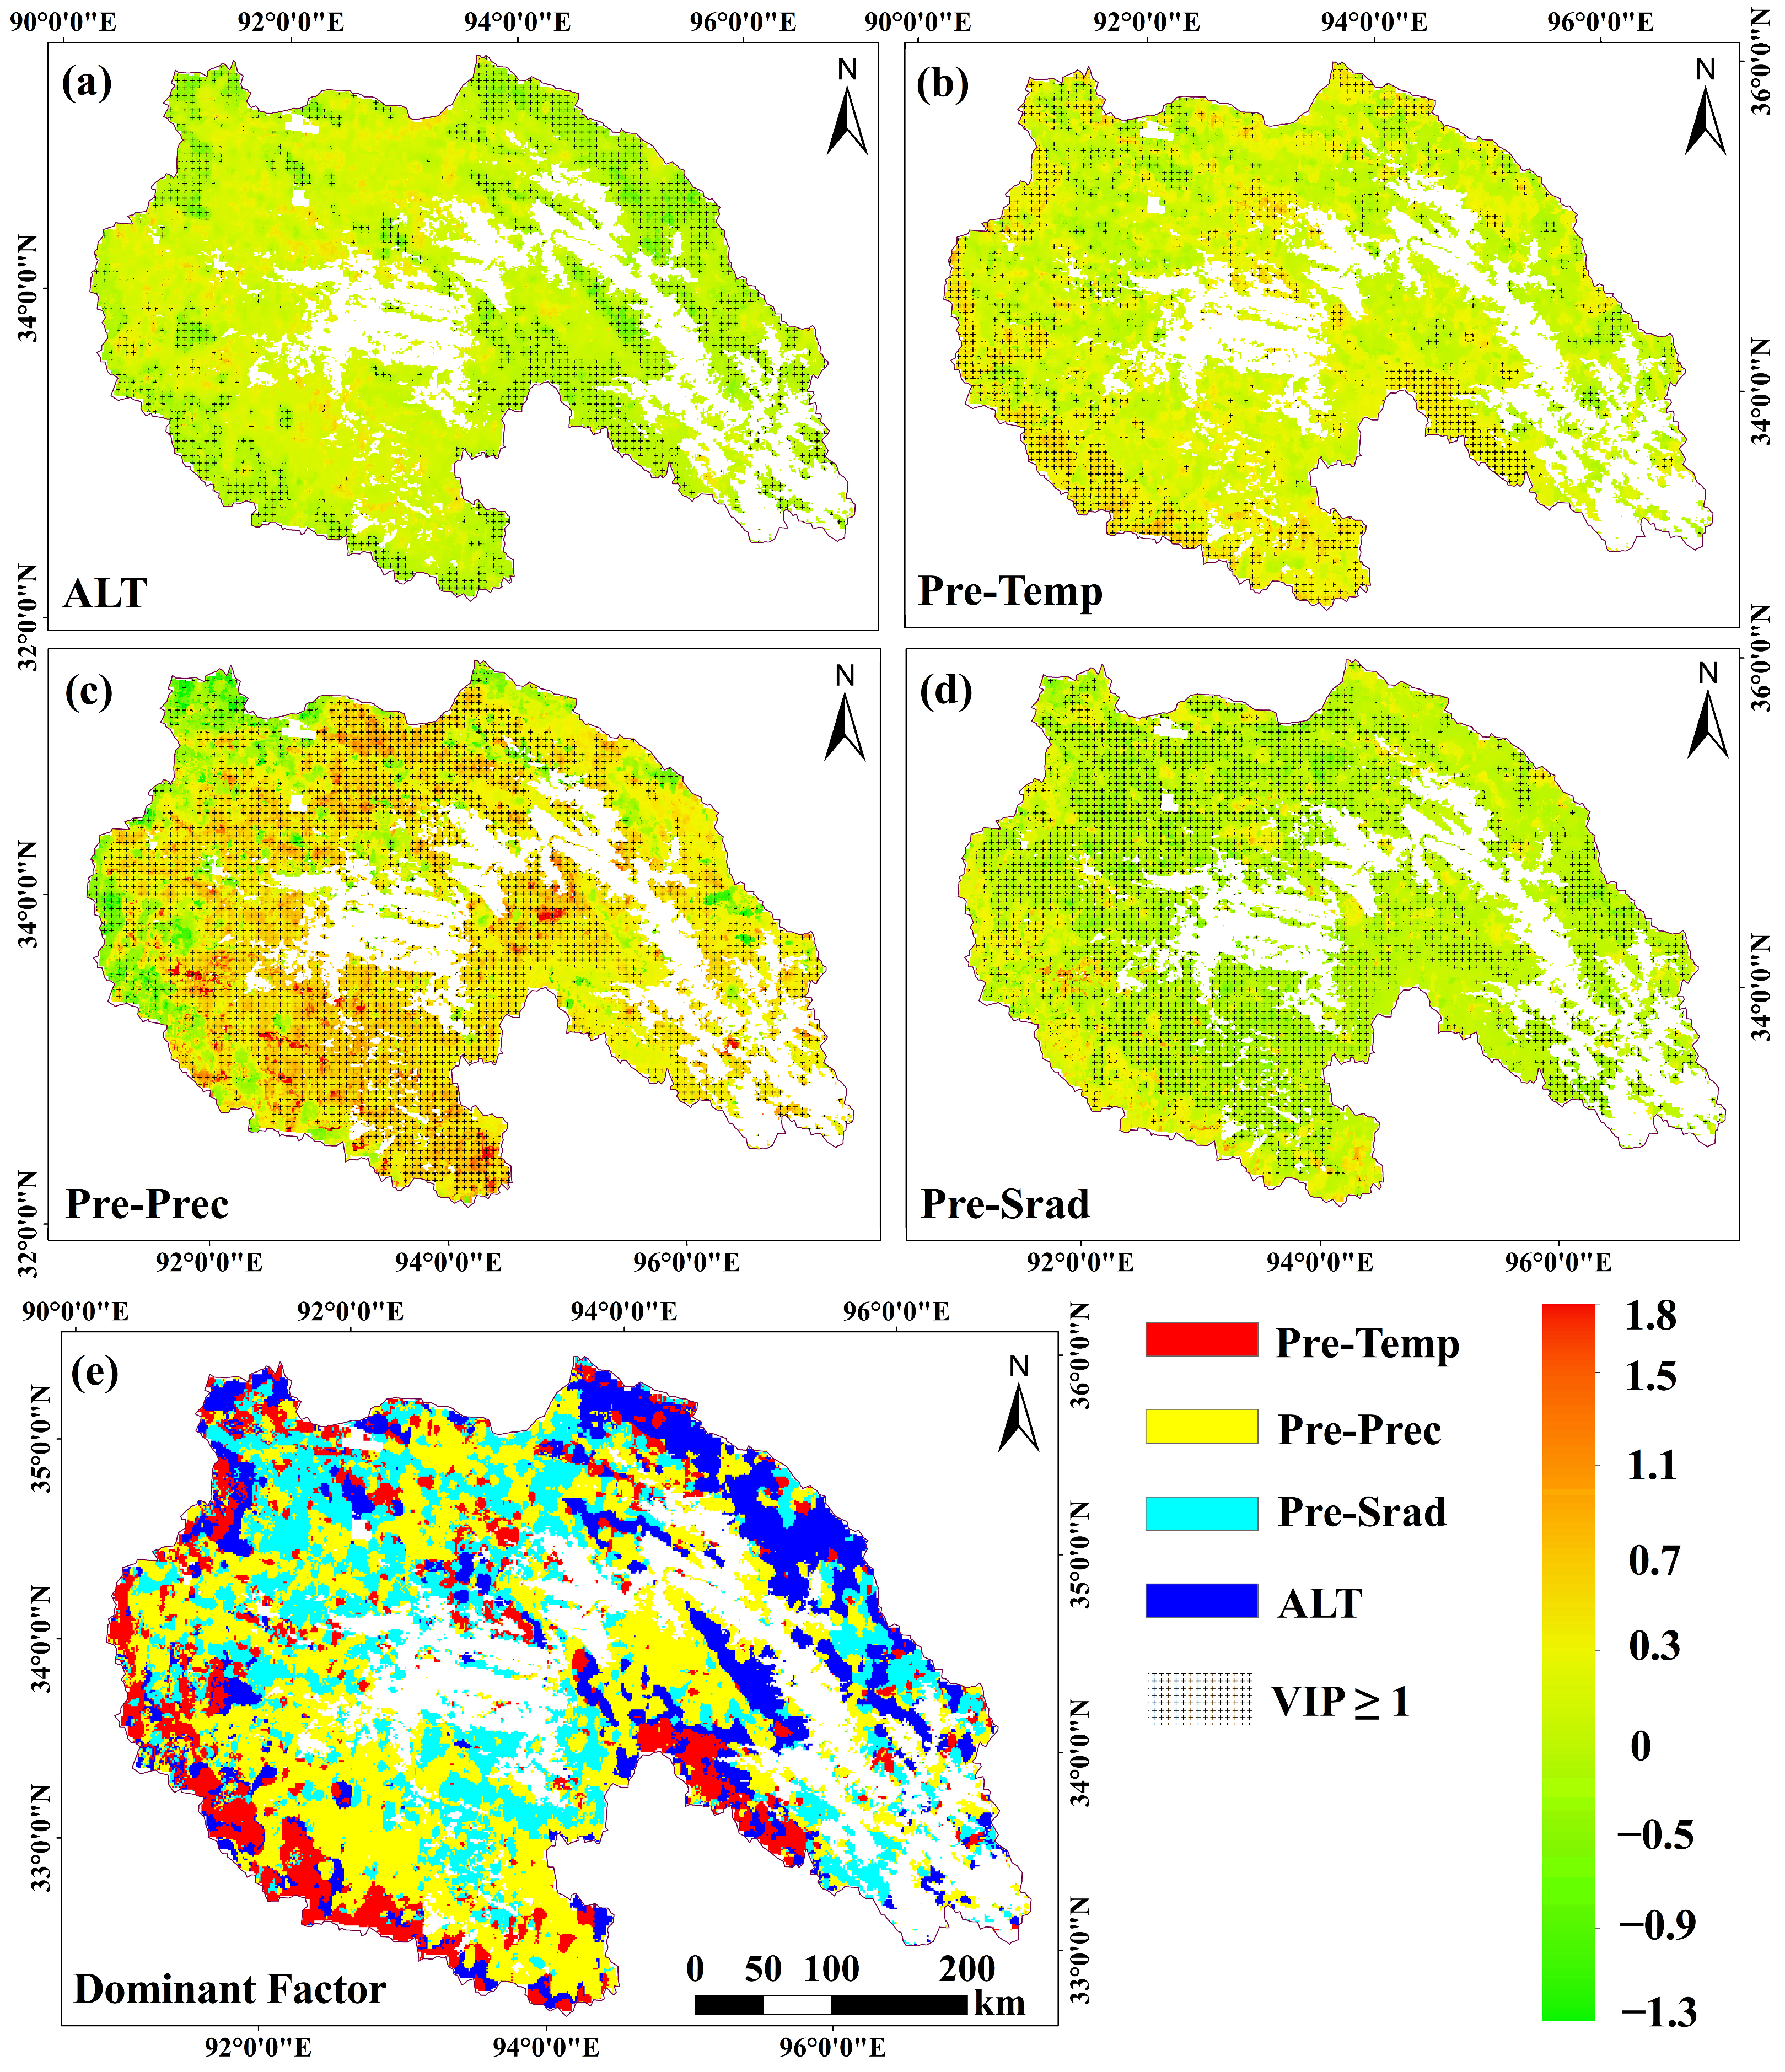
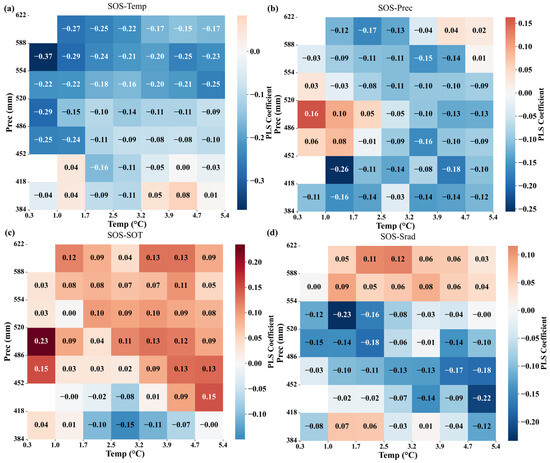
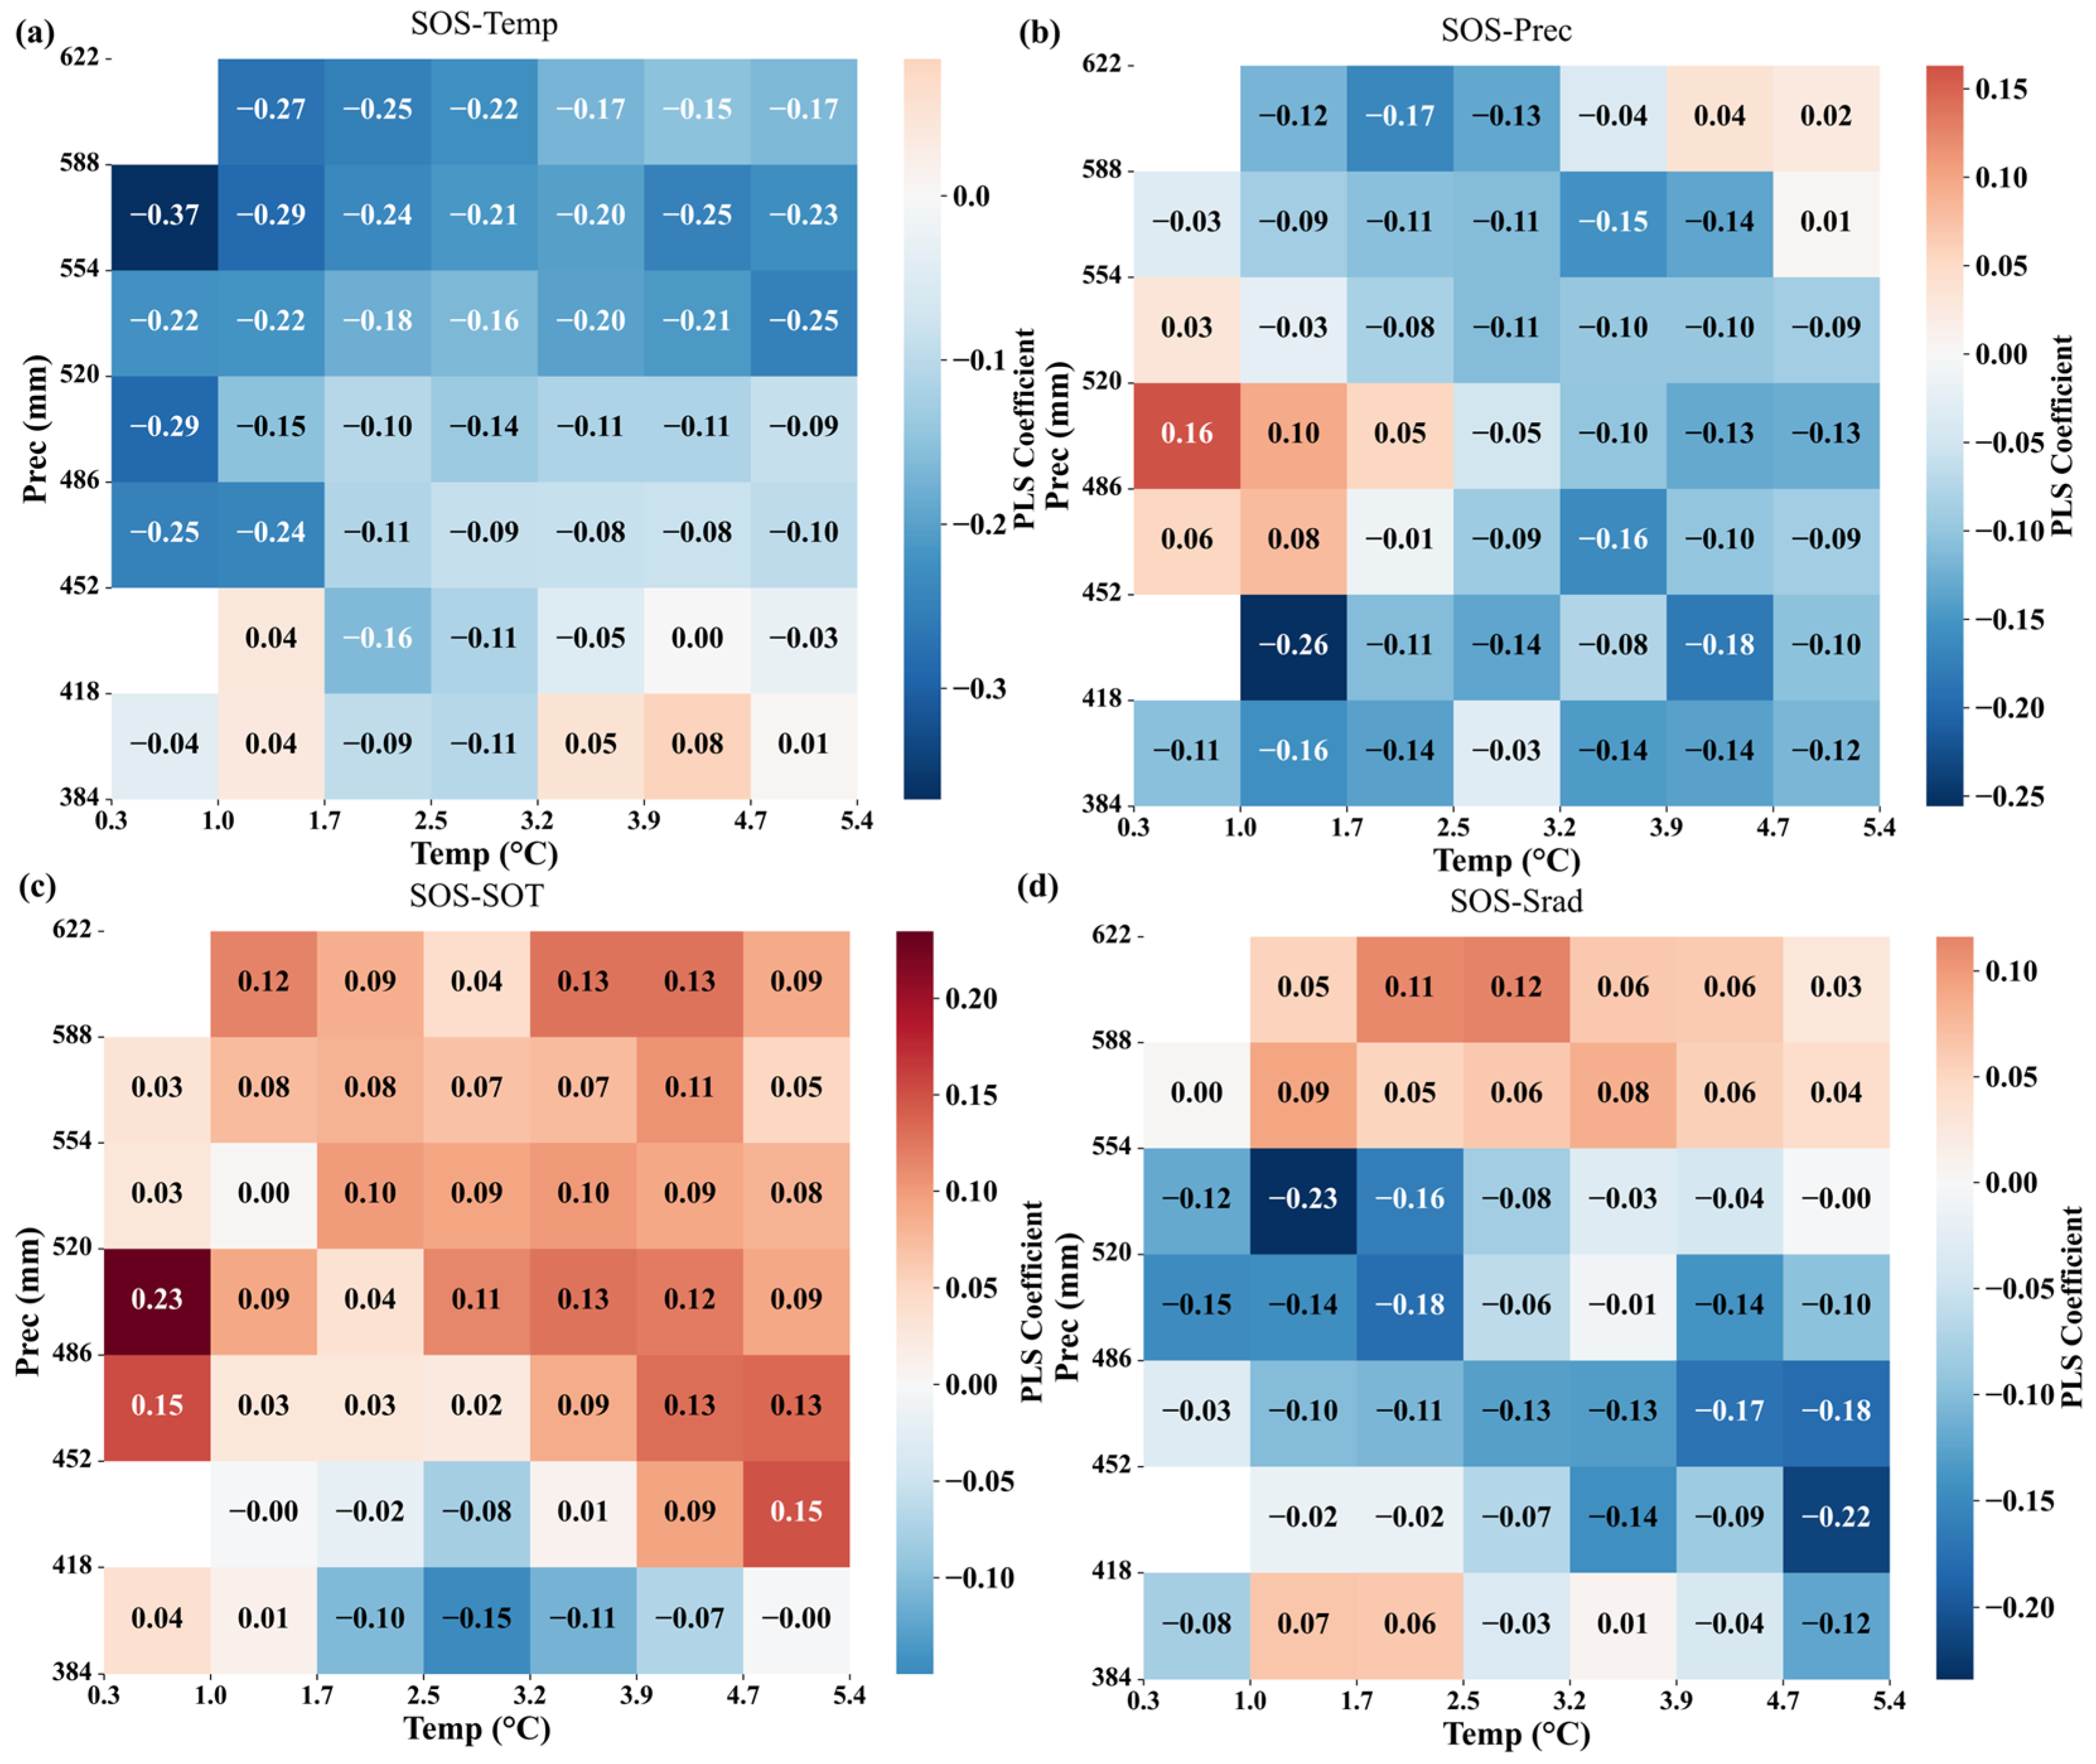
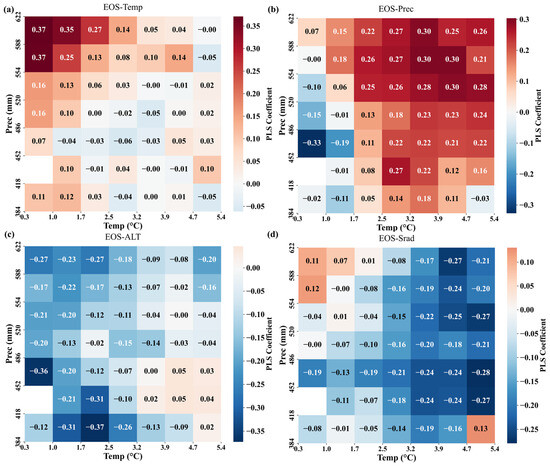
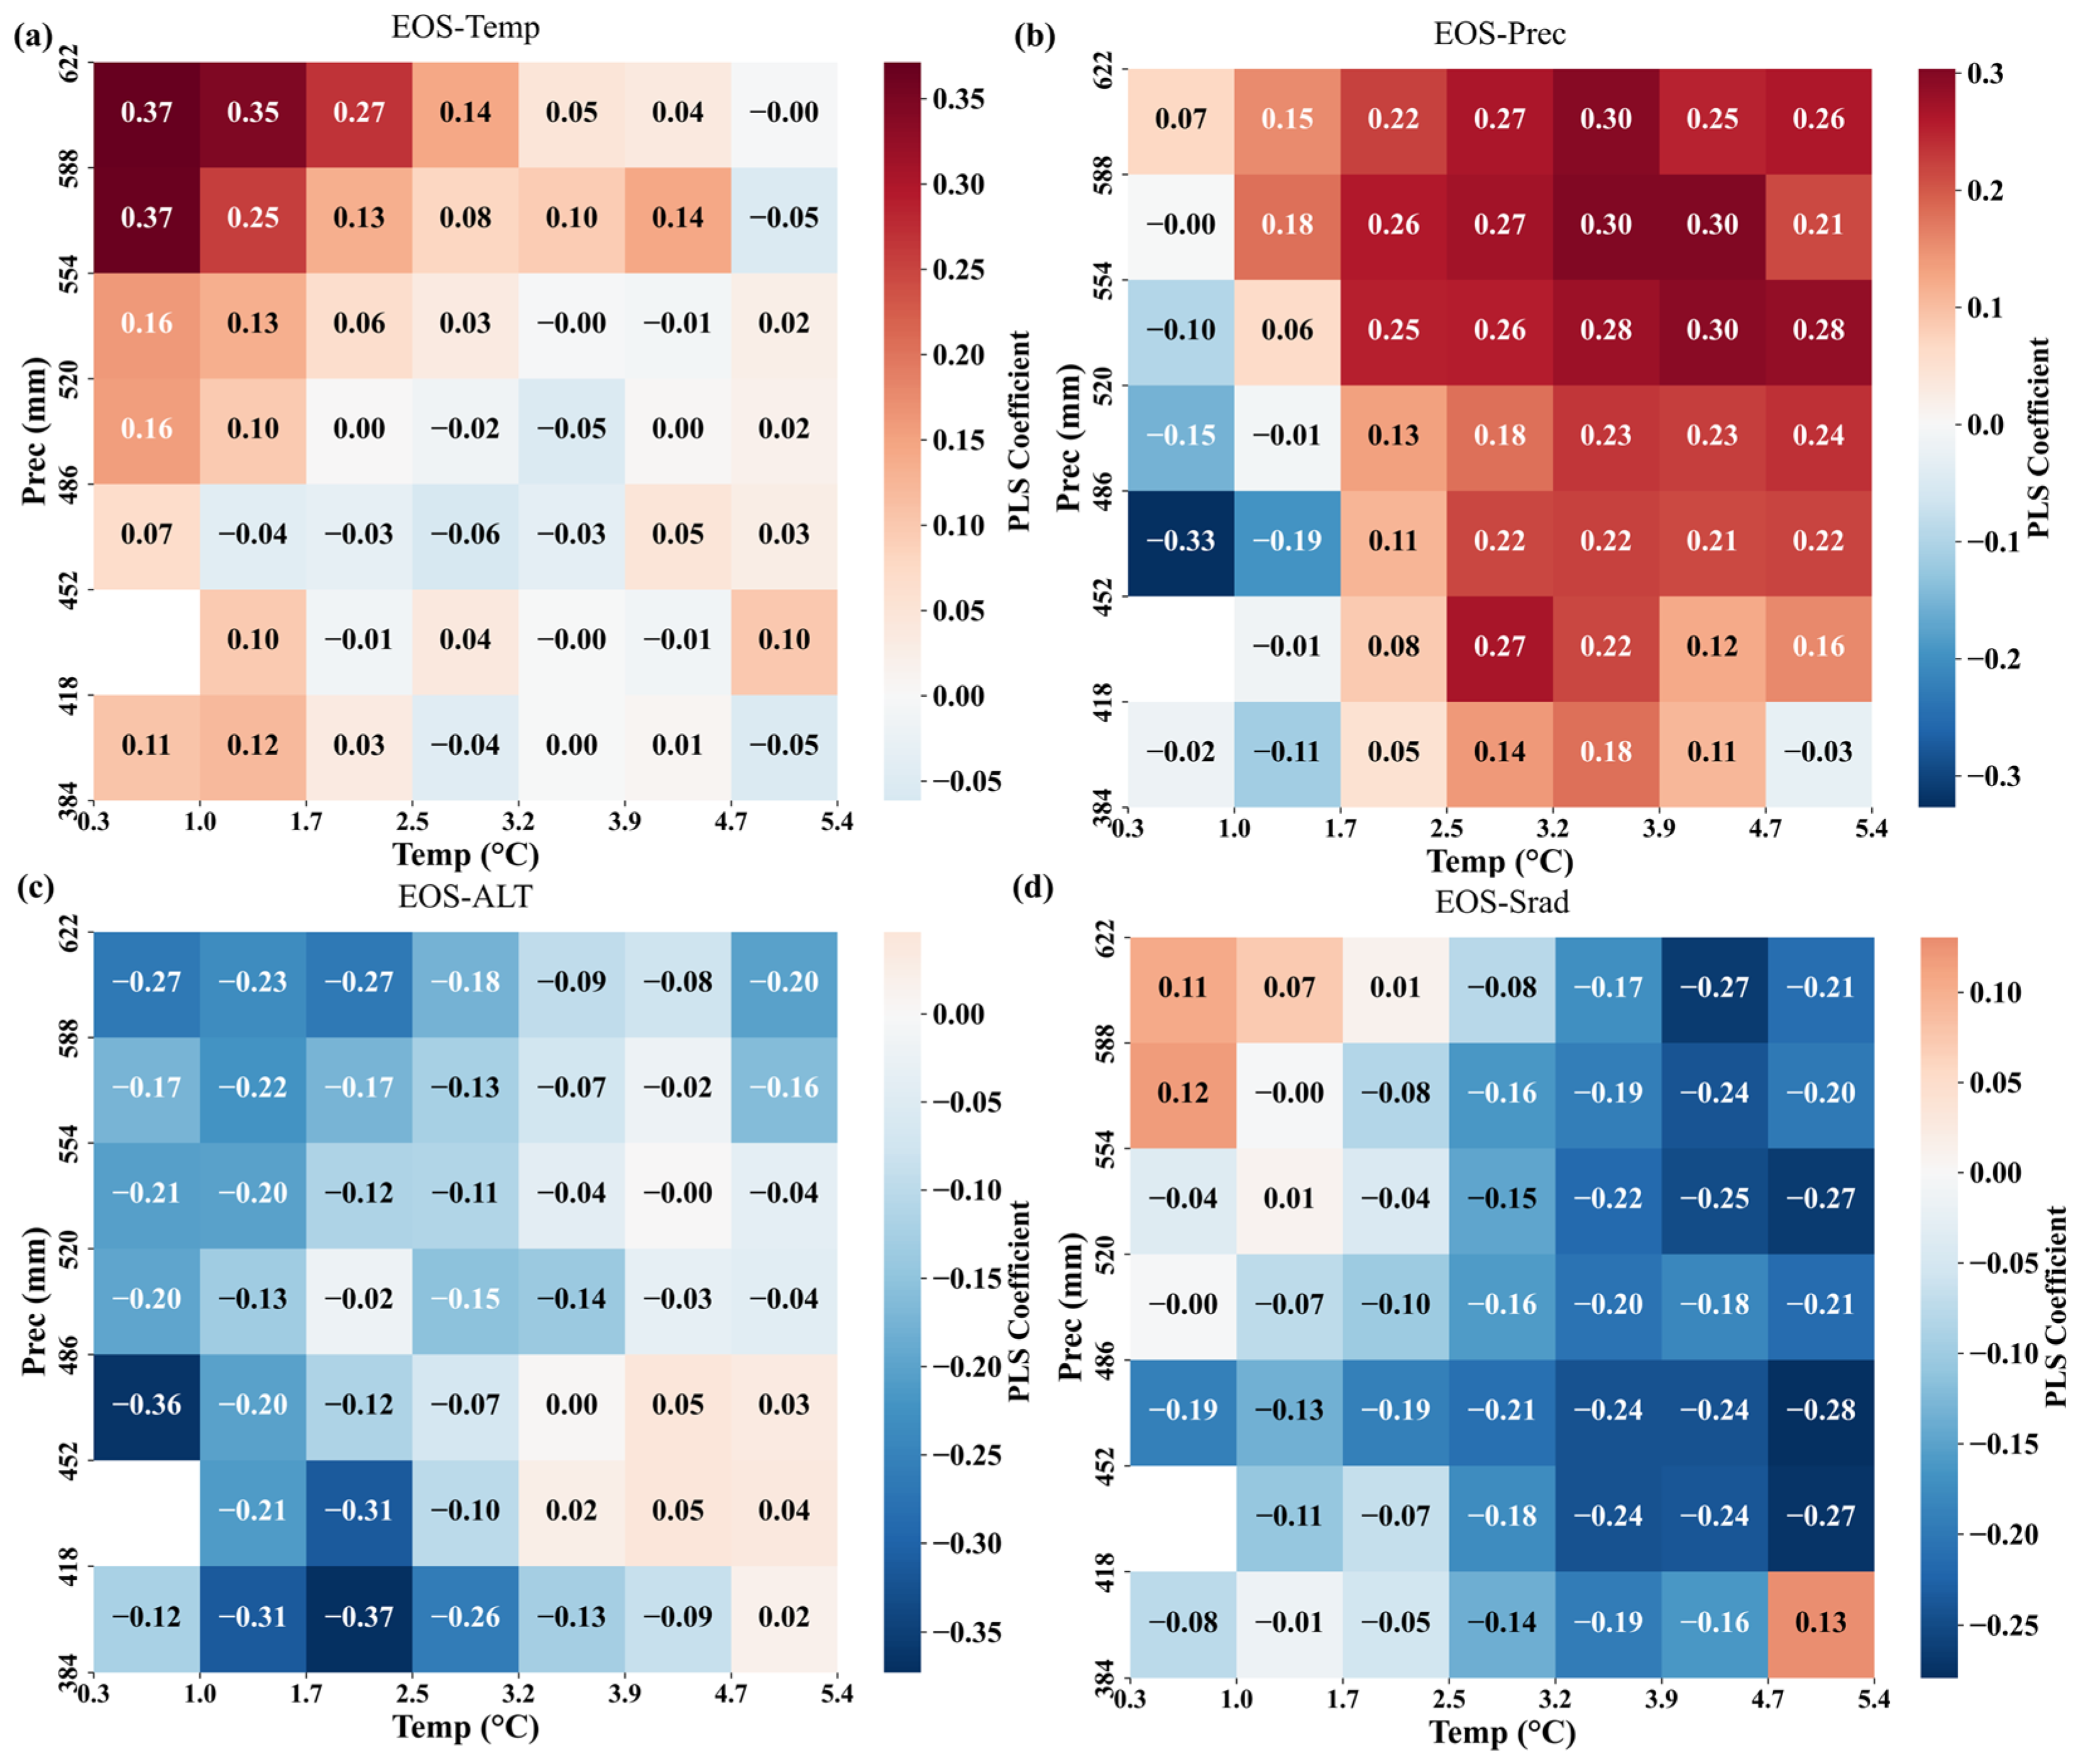
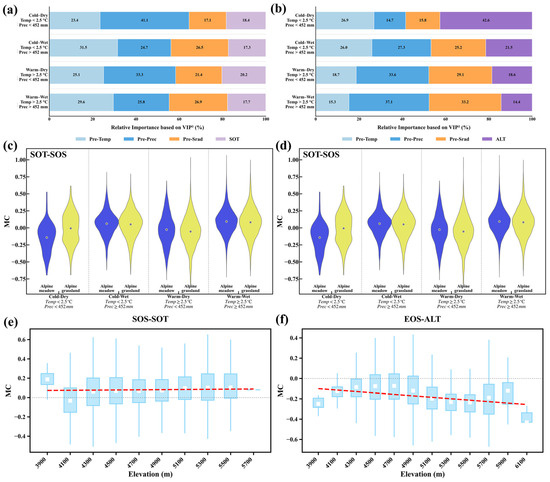
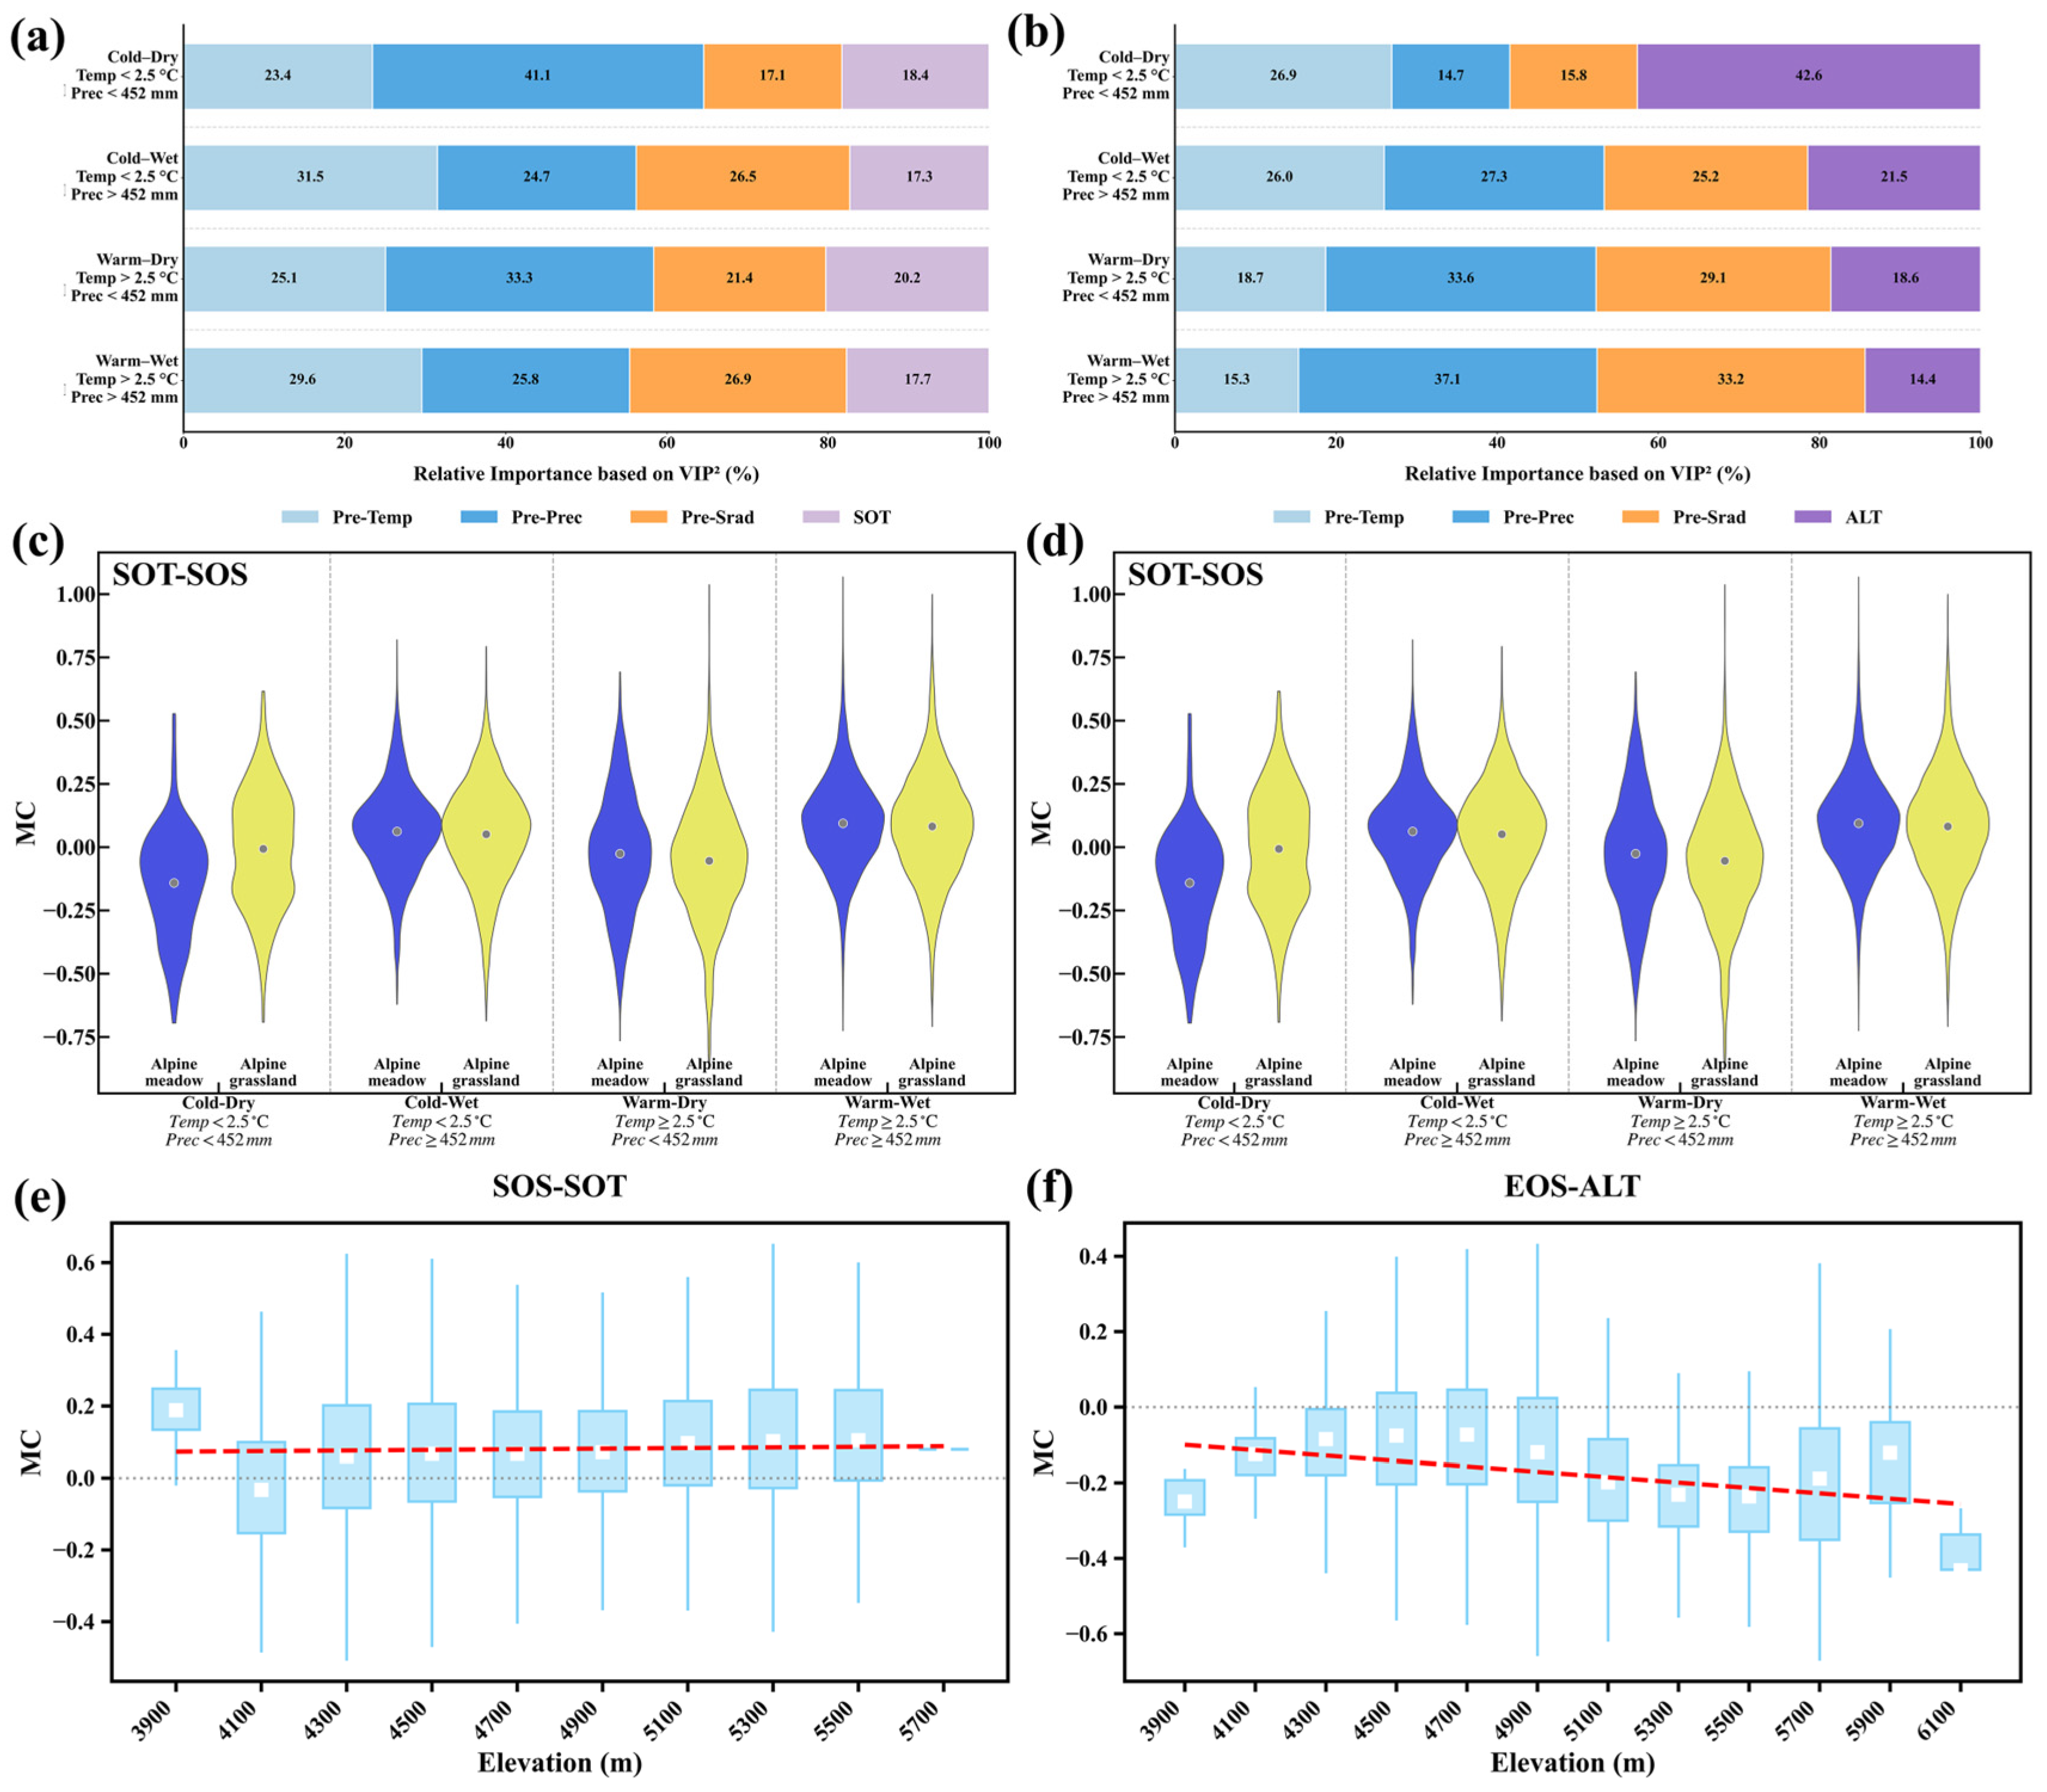
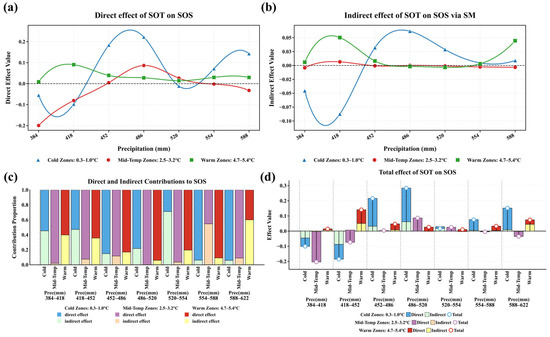
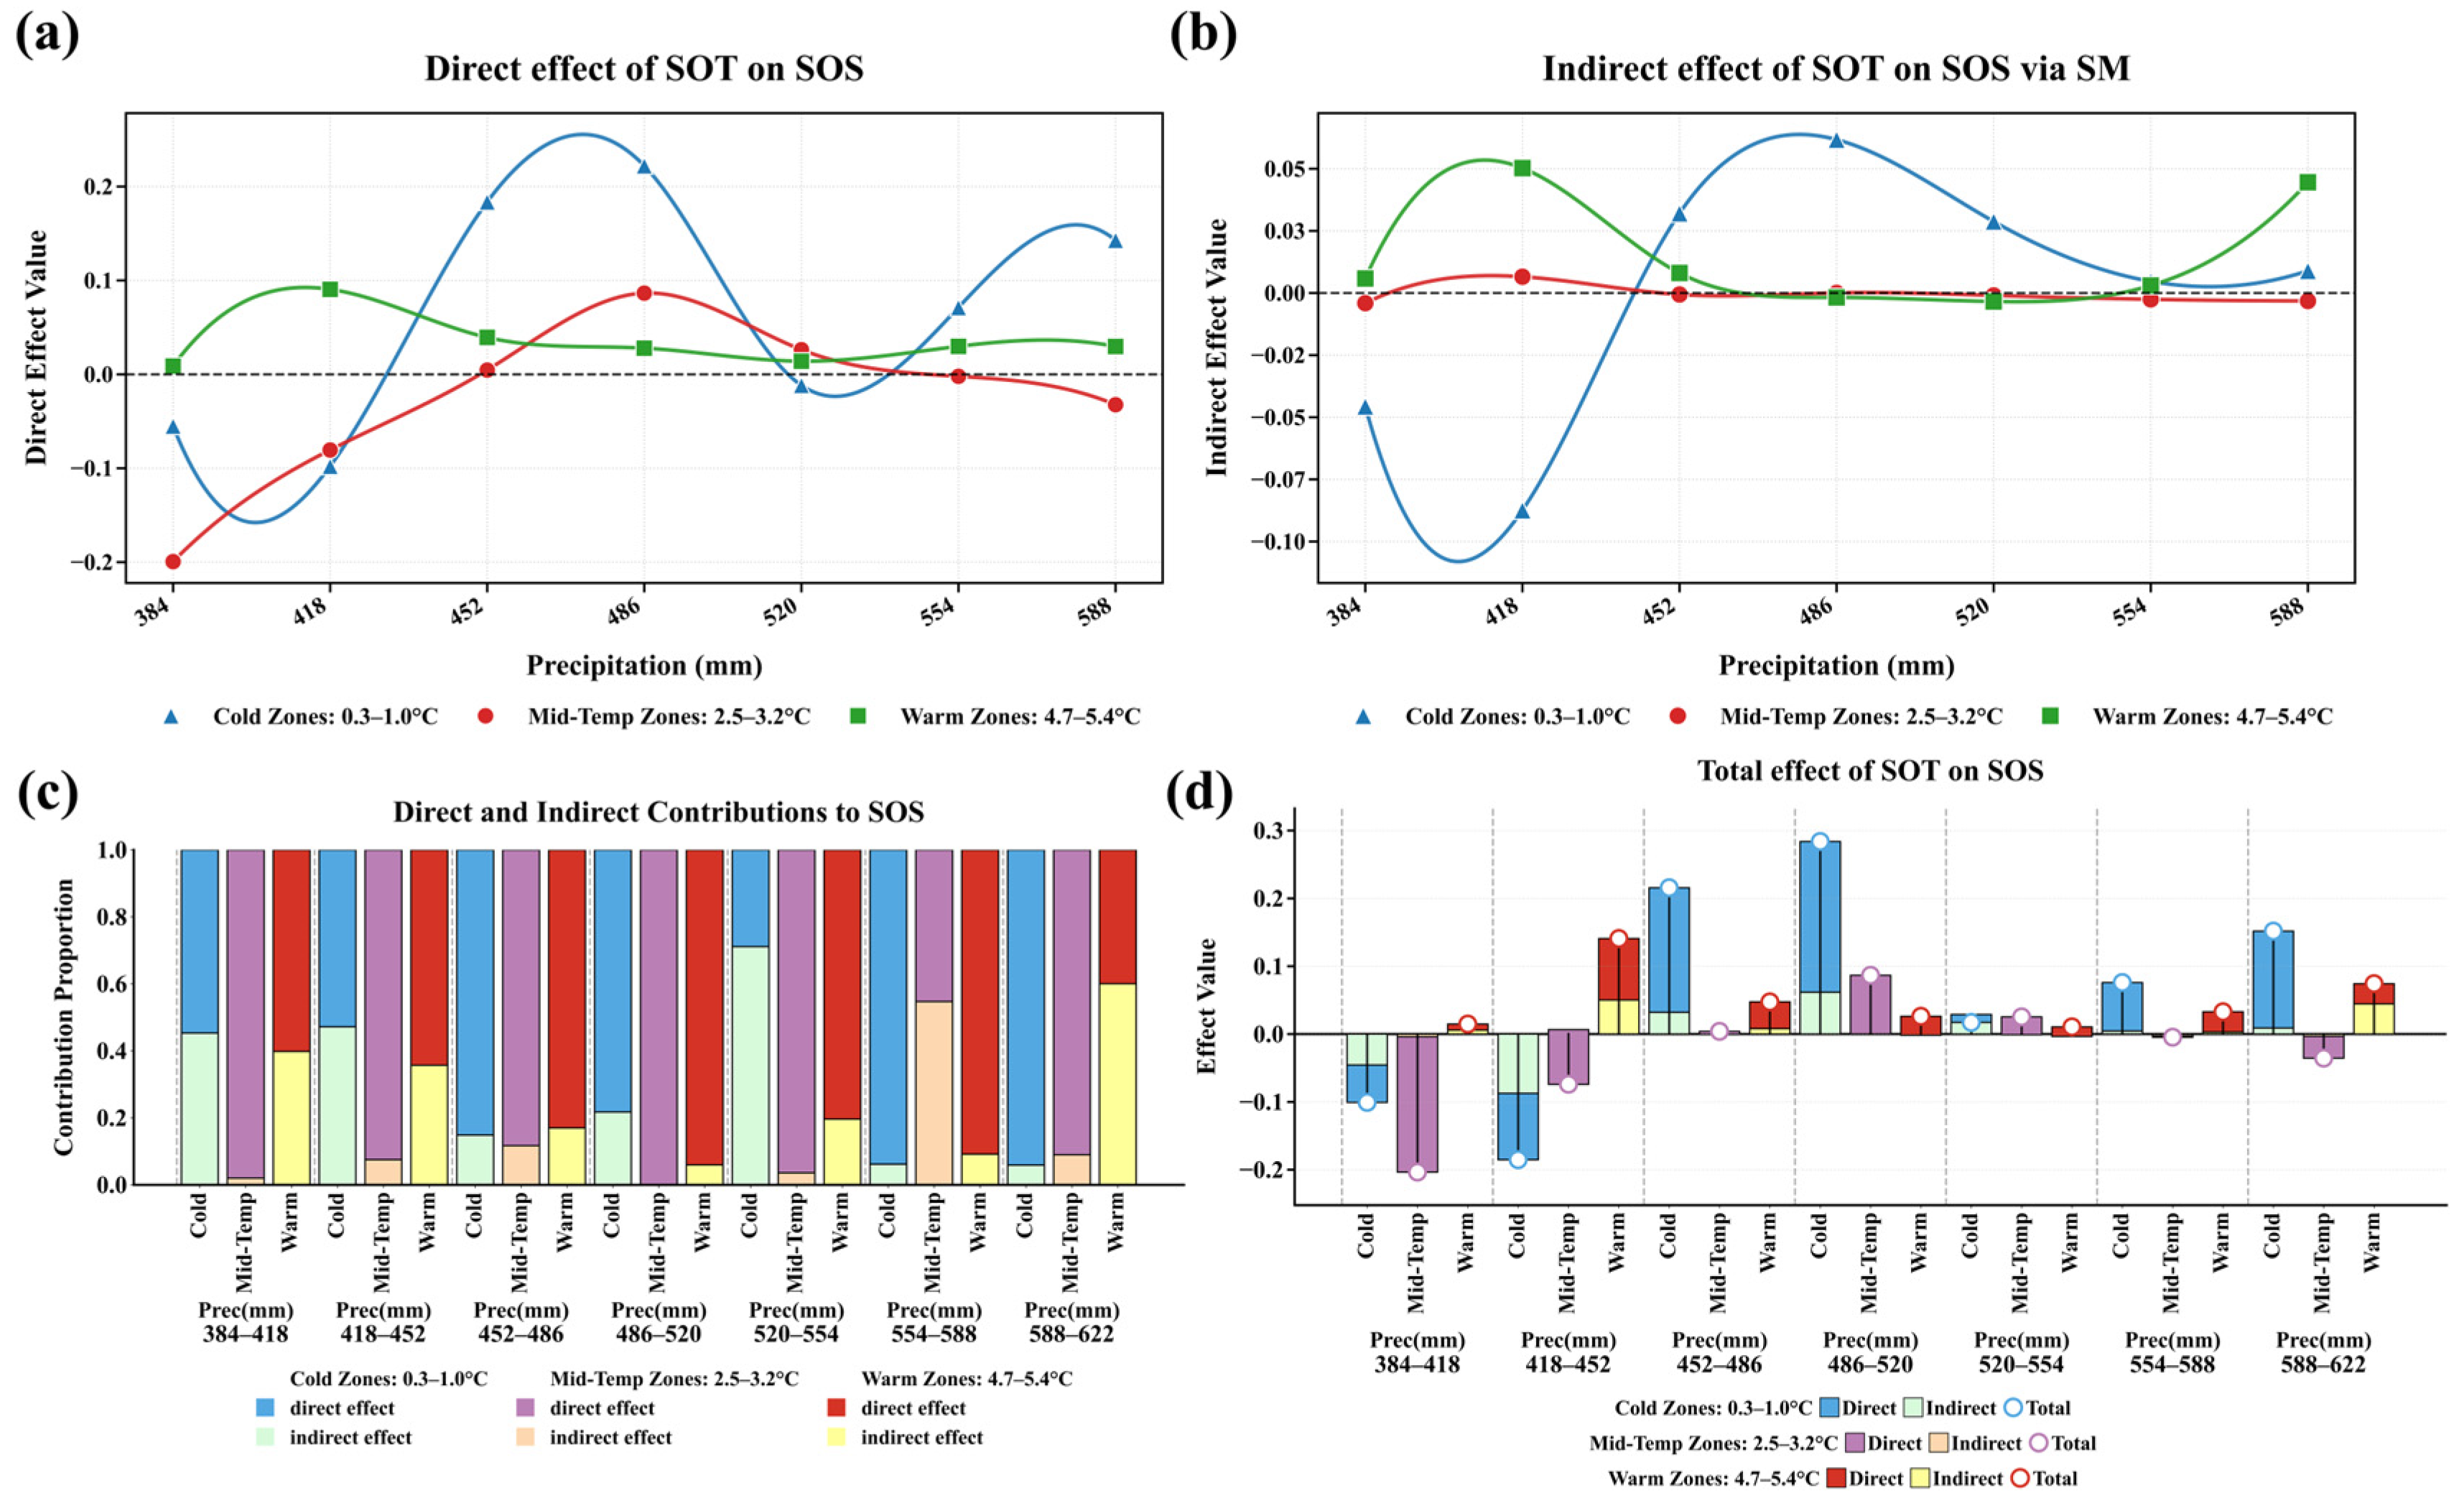
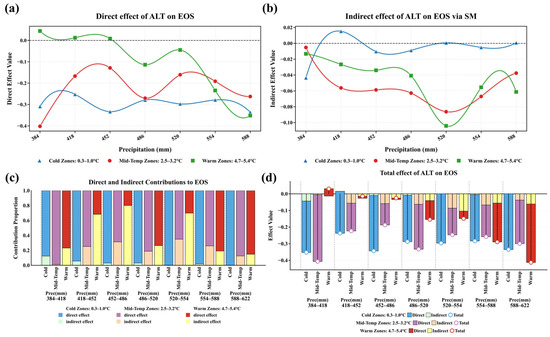
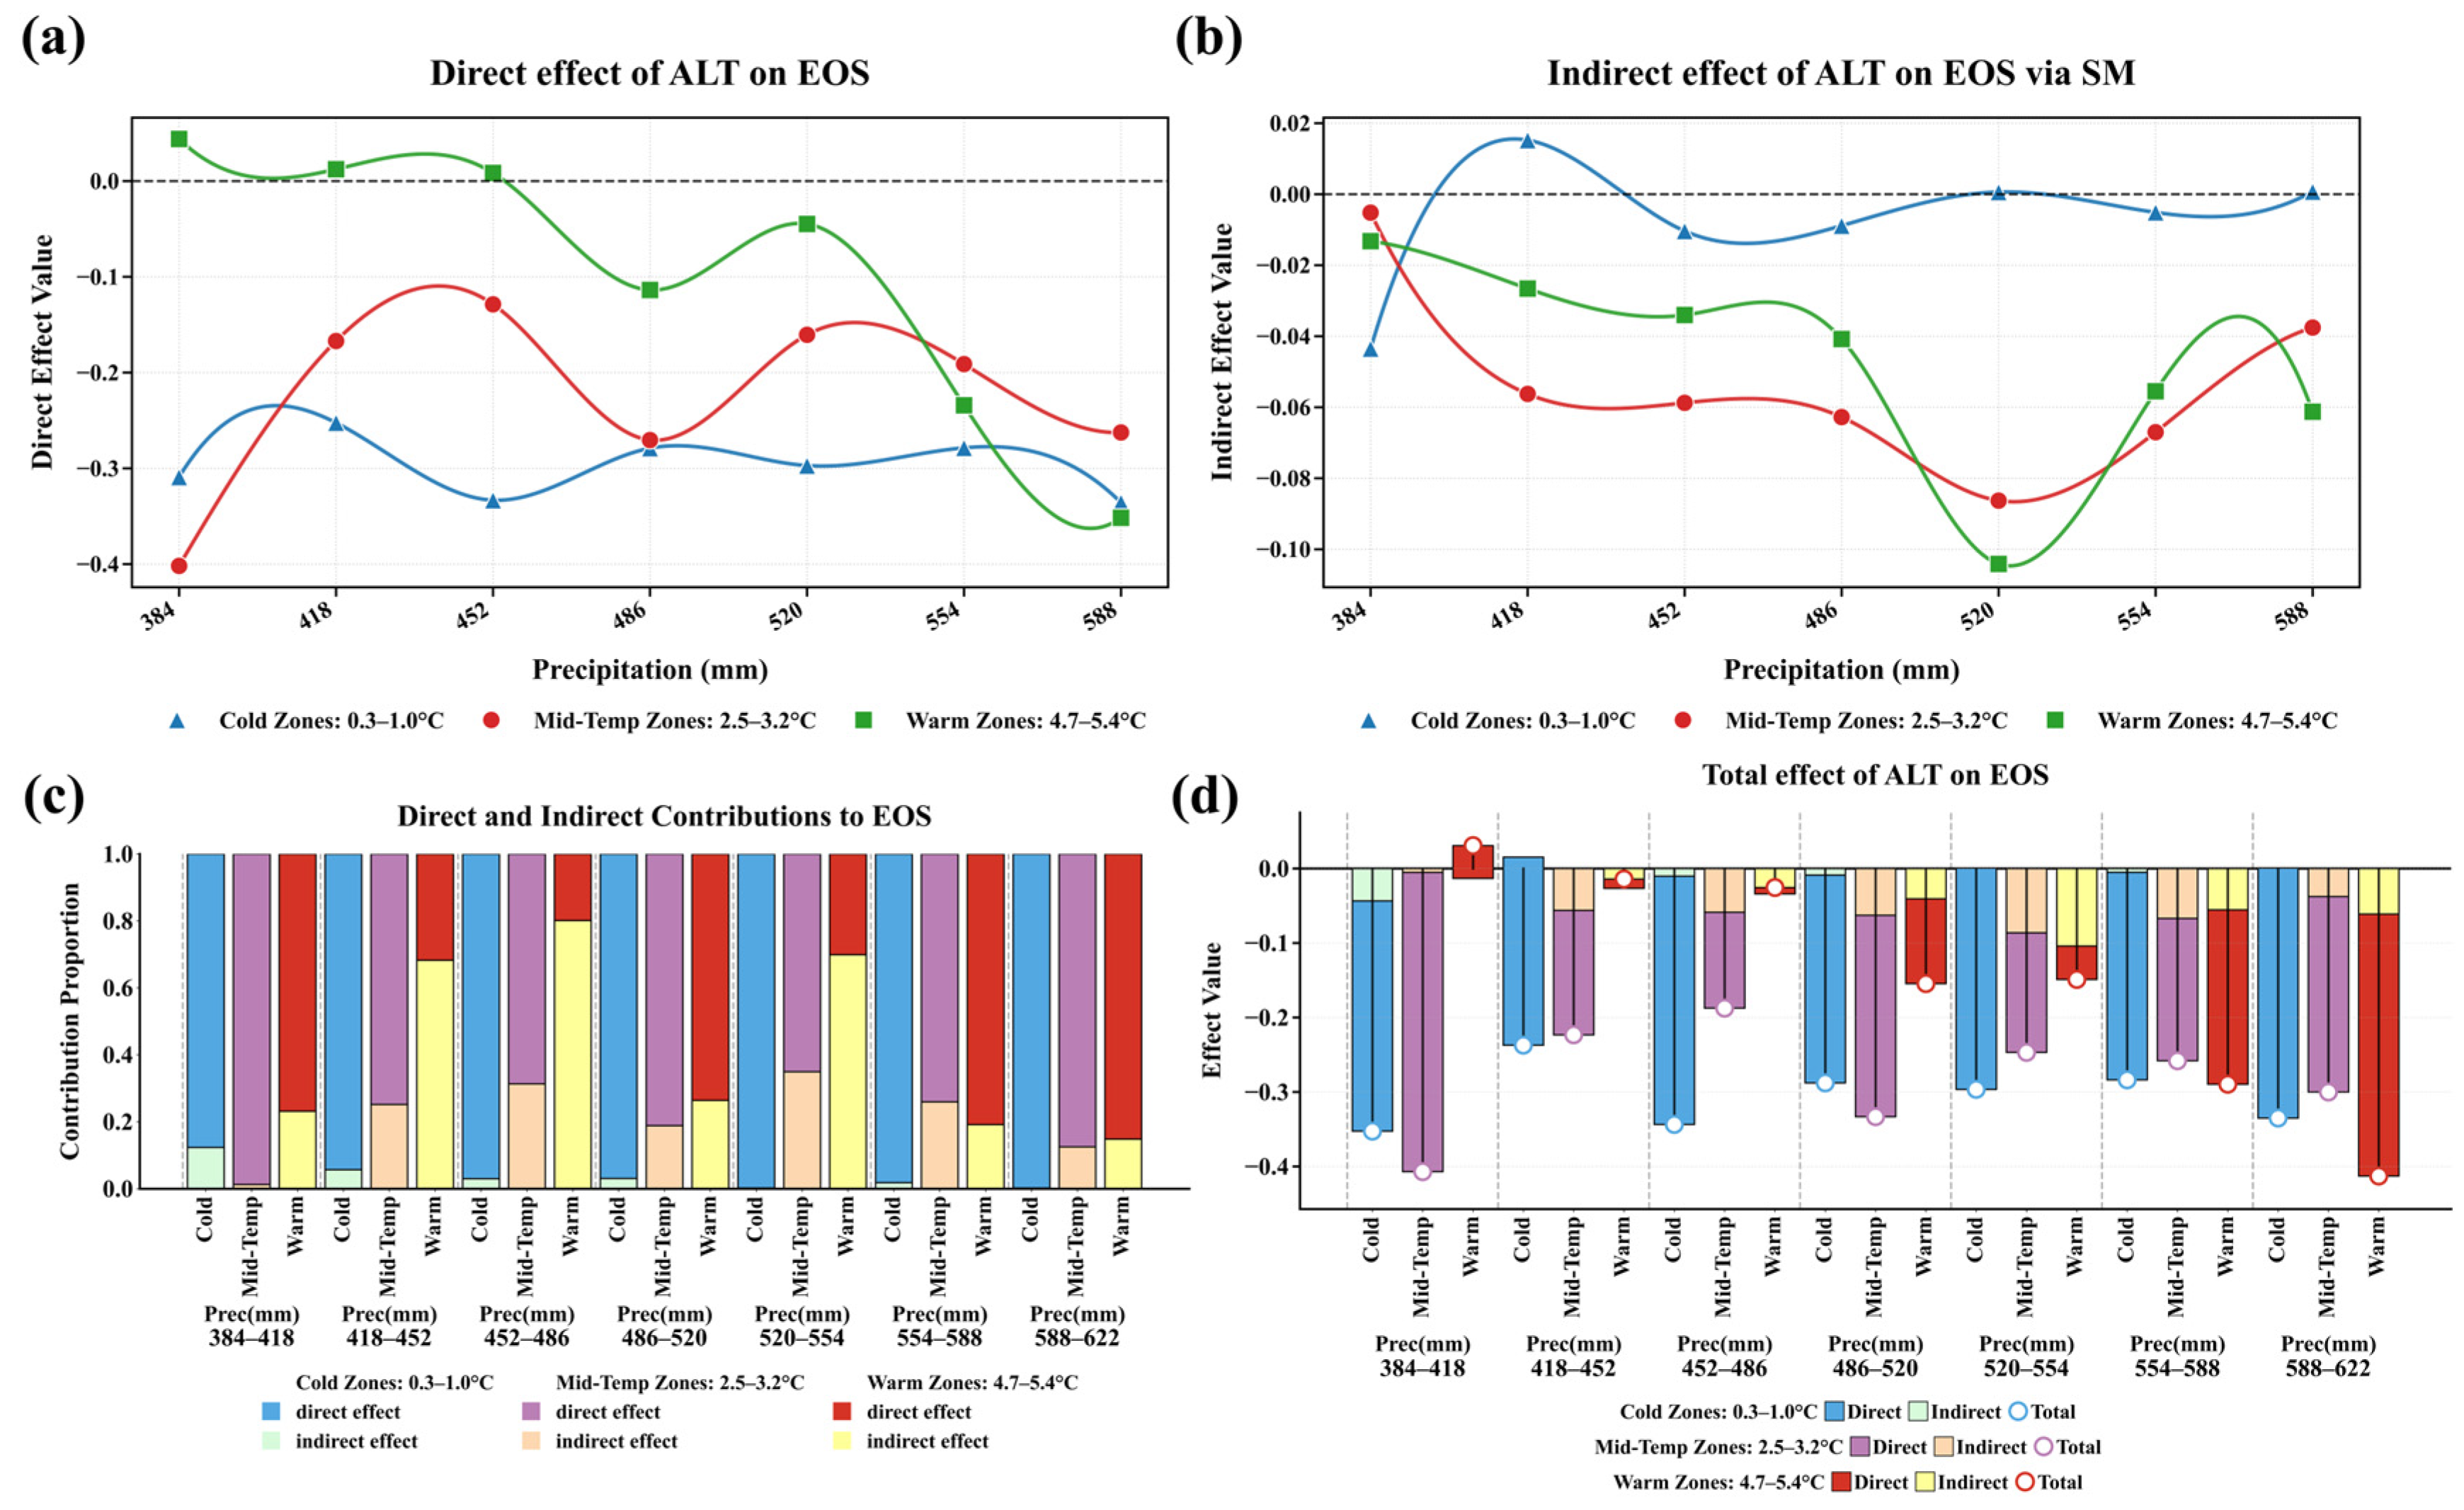
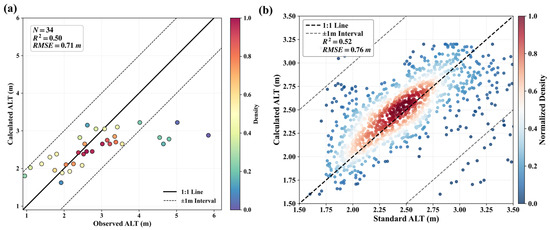
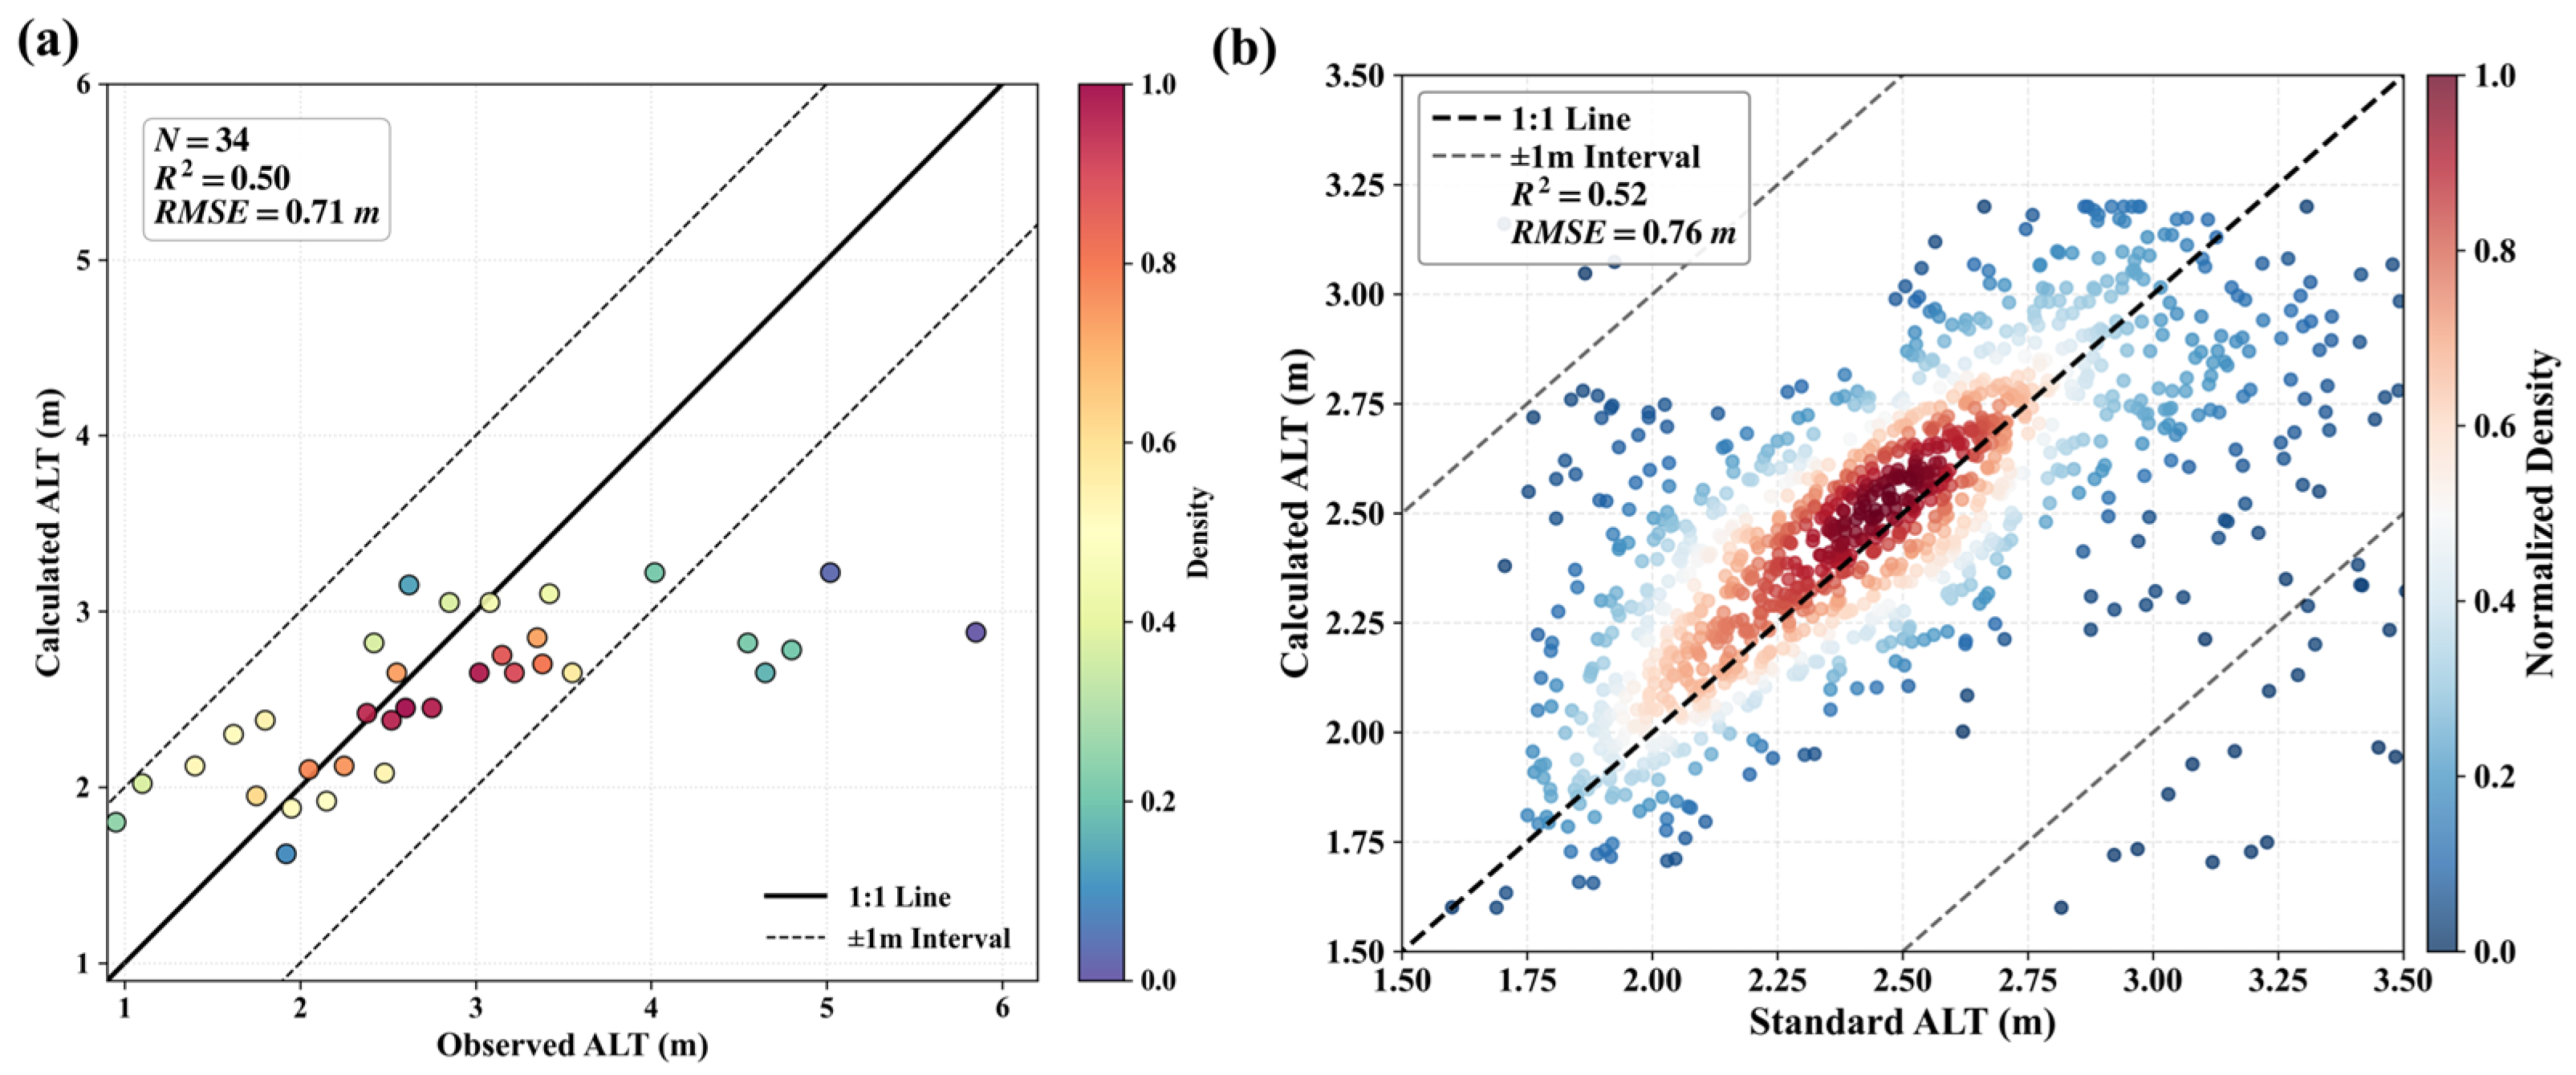

Disclaimer/Publisher’s Note: The statements, opinions and data contained in all publications are solely those of the individual author(s) and contributor(s) and not of MDPI and/or the editor(s). MDPI and/or the editor(s) disclaim responsibility for any injury to people or property resulting from any ideas, methods, instructions or products referred to in the content. |
© 2026 by the authors. Licensee MDPI, Basel, Switzerland. This article is an open access article distributed under the terms and conditions of the Creative Commons Attribution (CC BY) license.