


Highlights
What are the main findings?
- A feature decoupling and differentiated window-based remote sensing image super-resolution network (DW-SRNet) is proposed, which effectively improves global semantic consistency and local texture reconstruction in complex scenes.
- The AECS module introduces an adaptive energy-driven channel selection strategy, significantly reducing redundant features and improving feature representation efficiency.
- The MGSD module achieves explicit semantic–texture decoupling via multi-directional gradient energy, alleviating the conflict between structure preservation and detail recovery.
- The DWCI module enables region-adaptive cross-scale interaction by dynamically adjusting attention window sizes according to texture complexity.
What is the implication of the main finding?
- This work provides a new perspective for addressing spatial heterogeneity in remote sensing images through differentiated and adaptive modeling.
- The combination of feature decoupling and dynamic attention mechanism provides a new solution for balancing global structure and local detail reconstruction.
- The proposed channel selection and semantic–texture decoupling mechanisms help reduce feature redundancy and enhance the representation of critical information, thereby improving the stability and reliability of reconstruction results.
- The texture complexity-driven dynamic window modeling strategy provides an effective approach for adaptive multi-scale feature representation, enhancing the model’s ability to handle complex remote sensing scenes.
Abstract
Super-resolution reconstruction of remote sensing images has significant application value in fields such as smart cities, land monitoring, and traffic management. However, current super-resolution methods often overlook the differences between semantic and texture feature representations. This limitation makes it difficult to collaboratively preserve semantic structures and fine details during reconstruction, thereby affecting overall reconstruction quality. To address these challenges, this paper proposes a novel remote sensing image super-resolution network based on feature decoupling and differential window design, termed FDWD-Net. Specifically, we introduce an Adaptive Energy-driven Channel Selection module and a Multi-Directional Gradient-based Semantic–Texture Decoupling module to identify informative channels from the feature maps and decouple them into semantic and texture representations for independent optimization. Furthermore, we design a Differential Window-based Cross-scale Interaction module that dynamically adjusts window sizes based on local texture complexity, enabling adaptive feature modeling and effective multi-scale information interaction. Experimental results confirm that our method surpasses existing mainstream models on several remote sensing datasets. It also performs better in preserving structures and restoring detailed information.
1. Introduction
Urban transportation systems are an essential component of the functioning of modern cities. They exert a substantial impact on economic growth, public management, and the daily lives of residents. With the development of artificial intelligence, the perception and understanding of urban traffic scenarios [1] have gradually expanded from traditional ground monitoring to high-altitude remote sensing perspectives. By identifying and analyzing elements [2] including vehicles and roads in remote sensing images, it is possible to achieve dynamic monitoring and intelligent management of large-scale traffic conditions [3]. However, due to the limitations of the hardware performance, imaging distance and transmission bandwidth of remote sensing imaging systems, obtaining high-resolution images still faces significant challenges. This largely limits the performance of downstream tasks, including object detection [4], change detection [5], and land cover classification [6]. Therefore, recovering high-quality detailed information [7] from existing low-resolution (LR) images has become an urgent issue.
Image super-resolution (SR) technology, as an effective means of enhancing spatial resolution, has demonstrated great potential in remote sensing image applications. Through learning the mapping from LR images to HR outputs, SR can effectively compensate for information loss during image acquisition and enhance spatial details. However, remote sensing images typically exhibit complex scenes, significant cross-scale variations, and diverse types of noise, which pose considerable challenges for traditional SR methods in detail reconstruction and edge preservation. To advance the development of SR techniques, researchers have begun to explore more effective strategies.
The rapid progress of deep learning has facilitated the extensive use of convolutional neural networks (CNNs) in SR applications [8,9,10,11]. A CNN performs layer-by-layer feature extraction on images through sliding convolution kernels, which has the advantages of a simple structure and stable training. It also demonstrates excellent performance in image detail restoration and edge information retention. However, the limited receptive field of convolution operations makes it difficult for CNNs to capture the global semantic relations of images, thereby affecting the improvement of SR performance.
To compensate for the shortcomings of CNNs, some studies have begun to introduce the Transformer structure. Transformer utilizes the self-attention mechanism to model long-distance dependencies in images, thereby integrating global information more comprehensively and enhancing the accuracy of reconstructed images. In recent years, several SR models based on Transformers, including SRConvNet [12], ESTNet [13], and CFAT [14], have achieved remarkable performance across various benchmark datasets. This demonstrates the great potential of Transformer architectures in image reconstruction tasks. Nevertheless, existing approaches still face two key challenges. First, feature extraction lacks an effective information screening mechanism and is prone to generating redundant features. This limits the model’s ability to express key information. Second, current models generally apply a unified strategy to process both semantic and texture features, failing to account for their differing modeling requirements. This often results in a trade-off between fine detail restoration and structural integrity, affecting the final image reconstruction effect.
To address the above issues, this paper proposes a novel remote sensing image super-resolution reconstruction network based on feature decoupling and differentiated windows (FDWD-Net). FDWD-Net mainly includes three key components which are the Adaptive Energy-driven Channel Selection module (AECS), the Multi-directional Gradient-guided Semantic–Texture Decoupling module (MGSD), and the Differentiated Window-based Cross-scale Interaction module (DWCI). In order to overcome the issue of non-selective channel processing and the introduction of redundant features in existing methods, we leverage a learnable weighting mechanism within the AECS module to fuse local statistical information for assessing channel importance scores, thereby selecting the top-k most important channels. Subsequently, we introduce MGSD, which performs channel division based on multi-directional gradient energy estimation, effectively separating semantic and texture features. Moreover, to better accommodate the differing demands of structural preservation and detail restoration across various image regions, we propose DWCI. This module adaptively configures attention windows guided by local texture complexity, enabling the receptive field of attention to adjust dynamically based on content.
Overall, the contributions of this paper are as follows:
- We propose a Feature-Decoupled and Window-Differentiated Network for Remote Sensing Image Super-Resolution. This framework enhances the model’s feature representation capability and high-quality image reconstruction performance in complex remote sensing scenarios.
- We design an Adaptive Energy-driven Channel Selection module to effectively identify key feature channels, reducing redundant interference and improving model efficiency.
- We introduce a Multi-Directional Gradient-guided Semantic–Texture Decoupling module, which leverages gradient energy to separate features into semantic and texture components, enabling independent optimization.
- We construct a Differential Window-based Cross-scale Interaction module, which adaptively selects window sizes for semantic and texture features based on local texture complexity, and enhances feature representation through cross-scale fusion.
2. Related Work
2.1. Natural Image Super-Resolution
Recent progress in deep learning, especially with the development of CNN-based models, has greatly improved the effectiveness of single-image super-resolution (SISR). Dong et al. [15] pioneered SRCNN, one of the earliest CNN-based approaches for SR. The model employs a simple three-layer network to learn an end-to-end transformation from LR patches to HR outputs. Although this method outperformed traditional interpolation techniques in performance, its shallow architecture limited the model’s representation and learning capacity.
To overcome this limitation, VDSR [16] introduced a deep network with 20 layers and adopted a residual learning strategy, significantly improving reconstruction performance. Nevertheless, it still suffered from high computational costs and limited inference speed. Subsequently, FSRCNN [17] proposed a lightweight architecture that performed feature extraction in the LR space and used deconvolution for upsampling, achieving a balance between speed and accuracy. Based on this, subsequent research attempts to combine CNNs with Transformer to enhance model performance. For example, methods such as ESRT [18] and SAFM [19] utilize CNNs for local feature extraction and incorporate efficient Transformer architectures to model long-range dependencies, achieving richer feature representations and improved image reconstruction quality.
2.2. Remote Sensing Image Super-Resolution
Remote sensing imagery differs from natural images in that it features more elaborate textures, larger variations in scale, and a broader range of spectral information. Early works mostly transferred SR methods from natural images directly to the remote sensing domain. Nevertheless, the specific characteristics inherent to remote sensing data have hindered further improvement in reconstruction performance. In response to this limitation, various network architectures tailored to the characteristics of remote sensing images have been proposed. LGCNet [20] adopts a multi-branch structure, where low-level convolutions extract local detail information and high-level convolutions learn global contextual features, achieving multi-level feature fusion for remote sensing images. TransENet [21] introduces a multi-stage enhancement structure after the upsampling layers, which effectively strengthens high-dimensional feature representation through progressive feature reconstruction. HSENet [22] leverages feature self-similarity by designing a hybrid-scale self-similarity mining module to jointly model information across both single and multiple scales. In addition, HAUNet [23] integrates a hybrid attention mechanism with a U-shaped structure to effectively extract spatial features at different scales. TTST [24] employs a residual token selection grouping strategy to dynamically select the most informative key tokens for each query, and further enhances feature representation and reconstruction quality by incorporating a global context attention mechanism. CSCT [25] combines channel–spatial collaborative attention with a frequency gating mechanism to enhance the reconstruction quality of edges and high-frequency details. Meanwhile, with the continuous expansion of remote sensing image applications, images in complex scenarios often suffer from non-negligible noise interference. To address this issue, some studies explore the frequency domain by decomposing images into different frequency components via Fourier transform or wavelet decomposition, and modeling each component separately to enhance the representation of high-frequency details. FreDNet [26] improves the representation of high-frequency features through a multi-stage frequency-aware module, thereby enhancing boundary detail preservation. PDDFormer [27] adaptively adjusts the denoising strength via spatially gated differential attention, effectively suppressing redundant background responses while preserving key structural details. SSCBNet [28] jointly models spectral and spatial information through collaborative attention and cross-fusion modules, significantly improving the discriminative capability of feature representations and detail preservation.
2.3. Application of Transformer in Super-Resolution
Recently, with the breakthrough success of Vision Transformer (ViT) [29] in image classification tasks, Transformer architectures have gradually been applied to image SR tasks. Transformers use self-attention mechanisms to model long-range dependencies. Compared with traditional CNNs, they excel at capturing global contextual information and have demonstrated strong capabilities across various vision tasks. For example, Transformer-based methods have shown impressive performance in object detection [30], image classification [31,32,33], and image segmentation [34].
One of the earliest works to apply ViT to the SISR task is IPT (Image Processing Transformer) [35], which achieved excellent results across multiple low-level vision tasks through a unified ViT architecture pretrained on large-scale datasets, showcasing the potential of Transformers in image reconstruction. Utilizing the Swin Transformer’s hierarchical structure, SwinIR [36] captures local and global information through windowed attention while maintaining efficiency in computation. Omni-SR [37] adopts an omnidimensional self-attention mechanism that fully explores correlations across all dimensions and enlarges the effective receptive field through pixel-level interactions in both spatial and channel dimensions as well as multi-scale feature fusion. SRFormer [38] proposes a permutation self-attention mechanism that reduces computational cost while achieving a larger receptive field and better performance. Additionally, SCAT [39] enhances cross-head communication through an improved shifted channel strategy, expanding the receptive field and improving inter-channel collaborative modeling. HAT-L [40] integrates channel and overlapping cross-attention to effectively activate more input pixel information and enable interaction across windows. Although Transformer-based SR reconstruction for remote sensing images has made significant progress, existing methods often overlook the spatial heterogeneity of remote sensing images. The use of fixed-scale attention windows struggles to meet the diverse feature representation needs of different regions, which can lead to imbalanced feature extraction capability and ultimately affect overall model performance.
2.4. SimAM Channel Attention
The SimAM [41] channel attention mechanism is inspired by neural activity in visual neuroscience. By simulating the physical model of neuronal activation energy, it evaluates the importance of each neuron in a feature map based on the relationship between the target neuron (i.e., pixel) and the mean and variance of the entire channel. In a given channel, the energy function of neuron t is defined as:
where, and represent the channel-level mean and variance calculated from all neurons excluding the target neuron t, and is a regularization term.
SimAM is a novel attention mechanism. With its simple and efficient design, SimAM can be flexibly integrated into various CNN or Transformer architectures to enhance feature representation capability. In recent years, SimAM has been applied to various computer vision tasks [42,43,44,45] and has demonstrated promising performance.
3. Method
To address the spatial heterogeneity in remote sensing images, this paper proposes a differential modeling framework, FDWD-Net. The framework follows a progressive pipeline of feature selection, feature decoupling, and differential modeling. First, the AECS module is employed to evaluate channel importance, selecting high-information features while suppressing redundant interference. Then, the MGSD module is introduced to decouple semantic and texture features based on multi-directional gradient energy. Finally, the DWCI module is designed to perform differential modeling on the decoupled features. Through global semantic modeling, a local adaptive window mechanism, and cross-window interaction, multi-level feature fusion is achieved.
3.1. Overall Architecture
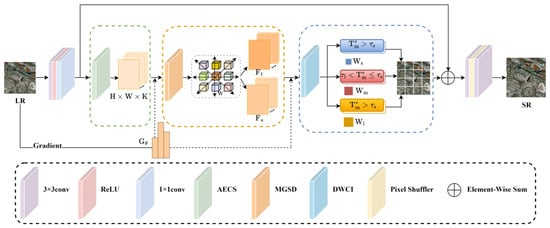
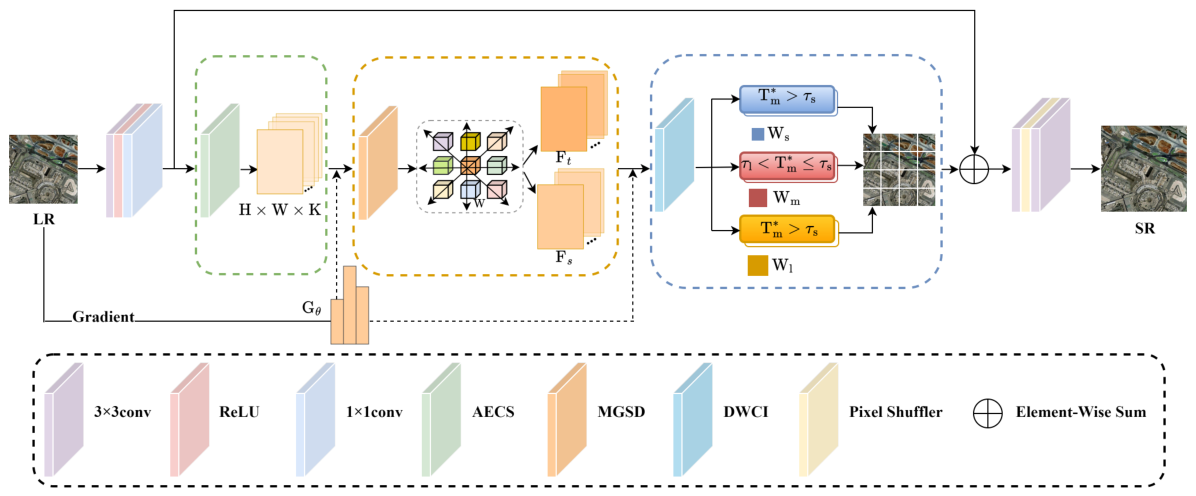
We propose a novel network architecture, FDWD-Net, as illustrated in Figure 1. Given an input image , shallow feature extraction is first performed to obtain the initial feature :
where denotes a 3 × 3 convolution operation, denotes the ReLU activation function, and denotes a 1 × 1 convolution. This process maps the spatial dimensions of the feature map to the channel dimension, forming a compact channel representation , where H, W, and C represent the height, width, and number of channels of the input image, respectively.
Figure 1.
Overview of the FDWD-Net Network Framework.
Then, the initial feature is fed into the AECS module, which selects the top k channels based on their contribution:
Next, the selected k channels are input to the MGSD module, where they are divided into semantic features and texture features based on a predefined gradient energy threshold , enabling feature decoupling:
Subsequently, the DWCI module performs differential modeling on the semantic and texture features and enables efficient interaction and fusion within cross-scale windows, generating the final fused feature :
Finally, we introduce a global residual connection that fuses the initial features with the current features , and the resulting representation is fed into an upsampling module to generate the image .
where denotes a 3 × 3 convolution operation, and denotes sub-pixel convolution.
3.2. Adaptive Energy-Driven Channel Selection Module
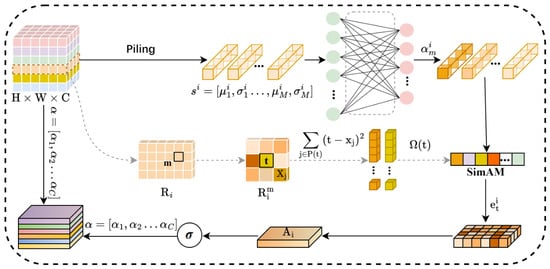
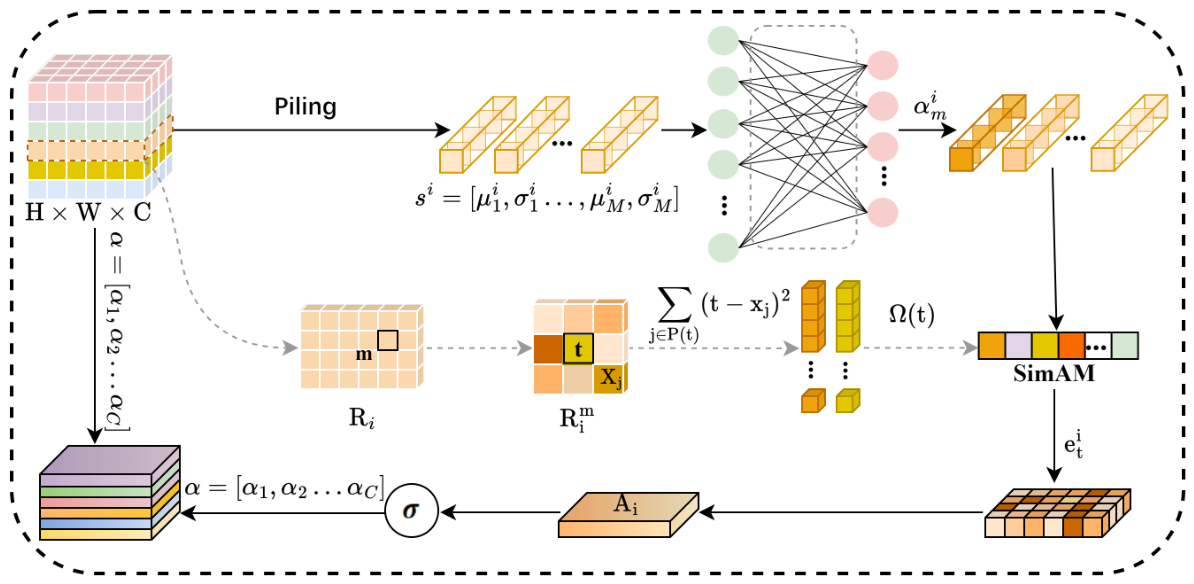
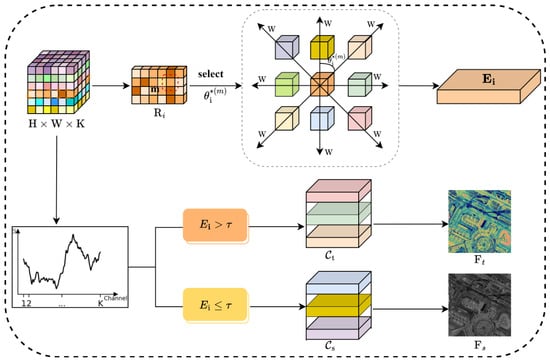
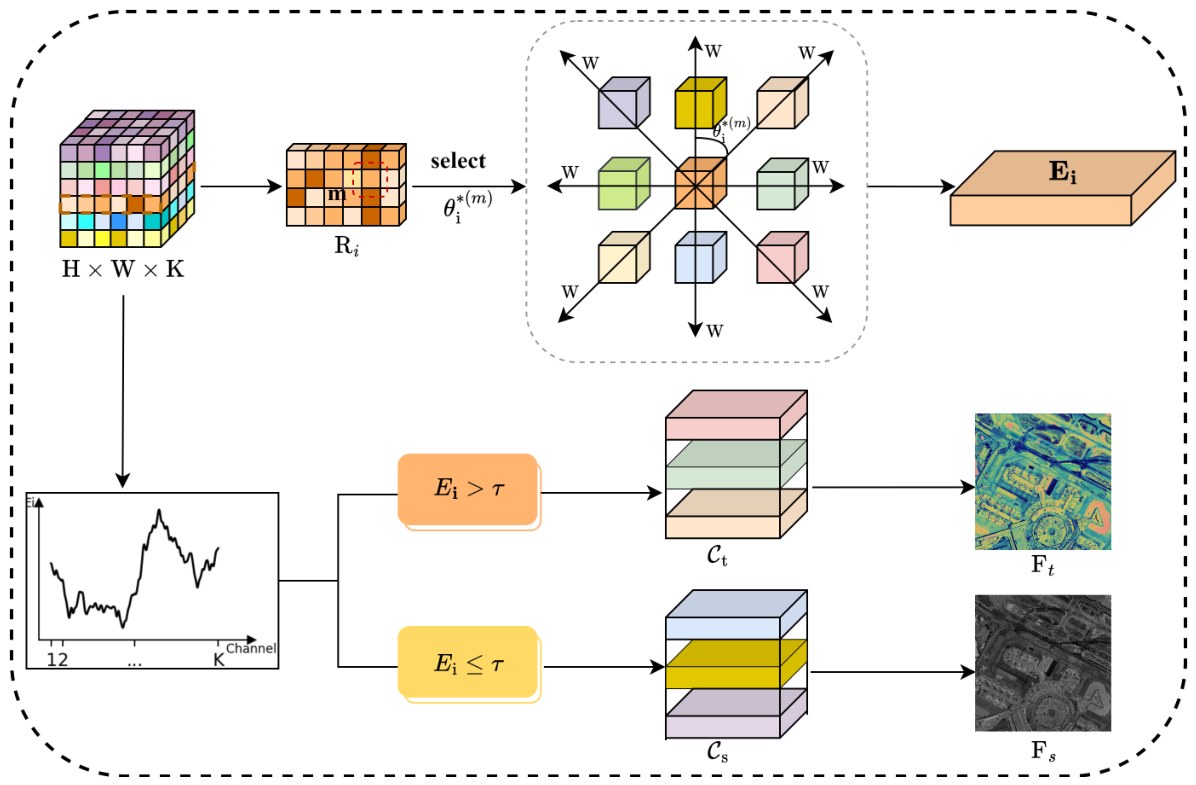
In feature maps, different channels carry diverse types of information, exhibiting significant differences in information density and contribution to reconstruction. Therefore, effectively identifying and enhancing high-information channels is a key issue for improving feature representation quality. However, mainstream channel attention methods, such as SE-based networks, typically rely on global statistics for channel compression and modeling, which tend to overlook fine-grained local spatial structural information, thereby limiting the precision of channel importance evaluation. To address this issue, we propose the AECS module, as illustrated in Figure 2. From a region-aware perspective, this module introduces regional weights and a learnable weighting mechanism to adaptively fuse statistical information for characterizing channel importance. In addition, a structural regularization term is incorporated into the energy function to suppress high-frequency noise interference, thereby improving the stability and structural awareness of channel selection.
Figure 2.
The structure of the adaptive energy-driven channel selection module (AECS). denotes the Sigmoid activation function.
Specifically, for the input , each channel feature map is uniformly divided into non-overlapping regions of size , with each region containing pixels. A total of local regions are obtained, denoted as , where represents the m-th local region of the i-th channel. Taking the i-th channel as an example, each region is first flattened into a one-dimensional vector and then stacked to form the channel feature representation :
In contrast, the traditional SimAM channel attention mechanism shares the same mean and variance across all neurons in a channel, which ignores local detail information and cannot accurately capture variations in features at different locations. Therefore, we use a fully connected layer to learn each region and output the corresponding region weight distribution. In this way, the global statistical information can adaptively integrate with local information, more accurately reflecting the features of different regions in the image. The statistical vector is passed through the fully connected layer, producing M weights :
where W is the weight matrix of the fully connected layer, and b is the bias. Softmax normalization is applied to ensure training stability.
Then, the mean and variance of each region are computed and fused through the weights, resulting in the channel-level weighted mean and variance :
where are the learnable weights that control how much the local means and variances contribute. and are the mean and variance of region m. This allows the model to prioritize spatial regions with notable statistical patterns, thereby improving channel discrimination.
Next, to evaluate the significance of each neuron t within the channel, we add a structural regularization term into SimAM to describe the spatial structural complexity of the neuron. The energy function is defined as:
where is the basic balancing term, is the weight of the structural regularization factor, and denotes the structural regularization term.
This structural term effectively suppresses local high-frequency noise responses and guides attention toward key regions with spatial consistency. We define the structural complexity of neuron t as the difference between it and its neighboring neurons:
where denotes the local neighborhood pixels of neuron t, and is the value of the neighboring neuron.
Then, we estimate the overall importance score of channel i by aggregating the energy scores of all neurons in this channel:
where represents the total number of pixels in channel i. To ensure numerical stability and prevent excessively large or small values, we apply Sigmoid normalization to obtain the final importance score of channel i:
Similarly, the importance scores for all channels are obtained as:
Finally, we sort the importance scores of all channels and select the top k most representative channels as the effective subset of input features for subsequent channel classification.
3.3. Multi-Directional Gradient-Based Semantic–Texture Decoupling Module
Remote sensing images exhibit significant spatial heterogeneity, typically containing both large-scale smooth semantic structures and complex, highly variable high-frequency texture details. Most existing SR methods adopt a unified feature extraction strategy to jointly model these components, overlooking their fundamental differences in modeling requirements. This discrepancy makes it difficult for a unified modeling strategy to achieve an effective balance between the two. Emphasizing structural consistency often leads to over-smoothed textures, while focusing on detail restoration may introduce artifacts that disrupt global semantics. Furthermore, since remote sensing images are usually captured from a high-altitude top-down perspective, objects appear with arbitrary orientations and complex spatial structures, which further increases the difficulty of modeling. However, in existing methods, frequency-domain feature decoupling often relies on fixed filter designs, lacking adaptive characterization of structural information. Meanwhile, traditional gradient-based methods are mostly limited to the horizontal and vertical directions, making it difficult to fully capture texture variations in all directions. To address these issues, as shown in Figure 3, this paper proposes the MGSD module. This module evaluates the gradient energy distribution of each channel in the feature map and sets an energy threshold to divide feature groups containing rich high-frequency edge information into texture features while grouping those with smooth variations into semantic features. Based on this, the decoupled features are fed into independent pathways for targeted modeling, thereby fundamentally alleviating the feature modeling conflict in SR reconstruction.
Figure 3.
The structure of Multi-directional Gradient Semantic–Texture Decoupling Module (MGSD).
Specifically, for the input with k channels, take the i-th channel as an example. Based on the previously partitioned regions, the Sobel operator is first used to compute the gradients in 8 directions and the regional gradient energy of channel i in region m:
Here, and represent the horizontal and vertical gradients, respectively, and . represents the m-th local region in channel i. The primary reason for constructing gradient energy for feature measurement lies in the fact that gradient operators can characterize local image properties from the perspective of spatial structural variations. In remote sensing images, semantic structural regions typically exhibit smooth, low-frequency responses, whereas texture regions correspond to significant abrupt changes and high-frequency details. Therefore, compared with variance-based statistics, which only reflect the dispersion of numerical distributions but lack the ability to describe spatial structures, gradient energy can more directly capture the intensity of variations in the spatial domain, making it more consistent with the intrinsic differences between semantic and texture features. Moreover, gradient energy inherently possesses directional sensitivity, enabling it to effectively represent the geometric characteristics of edges and structures. This property endows gradient energy with stronger expressive capability in describing complex object boundaries and fine-grained texture structures, thereby facilitating more precise feature partitioning.
Since the gradients in different regions of the channel often have their own dominant directions, we adopt a method that takes the main direction as the core and supplements it with other directions to calculate the gradients. By determining the contribution degree of different directions to the overall gradient and adaptively allocating weights, the gradient of each region can be calculated more accurately. The dominant direction of each region is determined by the direction of the maximum gradient. We select the direction with the maximum gradient energy as the dominant direction , and the other directions are regarded as auxiliary directions.
Then, based on the dominant direction , weights are assigned to different directions. The dominant direction receives the highest weight, while other directions are weighted according to their angular deviation from the dominant direction:
where is the weight of channel i in region m along direction , and is a hyperparameter controlling directional sensitivity (typically ranging from 0.1 to 1). The angular difference ensures that the dominant direction receives the maximum weight, while directions farther from it contribute less. Notably, this multi-directional weighting strategy endows the module with an implicit noise suppression capability. Since genuine texture edges typically exhibit pronounced and coherent directional characteristics, whereas the high-frequency gradient responses of random noise are often irregular and disordered, this mechanism can implicitly amplify true structural textures while effectively suppressing directionless random high-frequency noise, thereby laying a foundation for subsequent reconstruction.
Next, the directional weights are used to compute the weighted gradient of region m and the gradient energy of channel i.
To distinguish between texture feature channels and semantic feature channels, a threshold is set:
where and represent the mean and standard deviation of the gradient energy across all channels, k denotes the total number of channels, and is a hyperparameter that controls the sensitivity of the threshold. It is worth noting that the threshold is not a fixed constant, but is adaptively determined based on the statistical properties of the features themselves. Therefore, regardless of differences in overall contrast, sensor noise distribution, or scene complexity across datasets, can dynamically scale according to the intrinsic characteristics of the input image. The hyperparameter serves only as a relative bias factor to control the proportion of high- and low-frequency feature partitioning. This design helps improve the robustness of the model across different datasets and, to some extent, enhances its generalization capability.
Then, channels are classified based on the gradient energy threshold:
where and denote the texture feature channels and semantic feature channels.
Finally, to avoid the information weakening caused by simple averaging, we use the channel importance scores obtained from the AECS module as weighting factors for channel-wise weighted fusion.Let the semantic feature channels and texture feature channels be represented as and , respectively. Then, the semantic feature maps and texture feature maps are computed as:
Traditional frequency-domain decomposition methods can explicitly separate low-frequency semantics and high-frequency textures; however, their global transformation nature often leads to the loss of spatial positional information. In contrast, the proposed MGSD module operates in the spatial domain, where multi-directional gradient energy is computed over local patches for channel partitioning. This approach not only achieves the goal of distinguishing high- and low-frequency content, but more importantly preserves the spatial coordinate alignment of features. As a result, the decoupled feature maps can be directly fed into the subsequent DWCI module, providing precise local spatial guidance. Furthermore, MGSD is guided by the dominant gradient direction, while the weights of other directions decay exponentially with angular deviation. This mechanism implicitly amplifies structurally consistent and genuine texture features, while significantly suppressing directionless random high-frequency noise.
3.4. Differentiated Window Cross-Scale Interaction Module
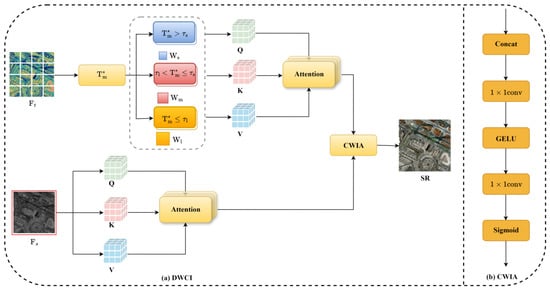
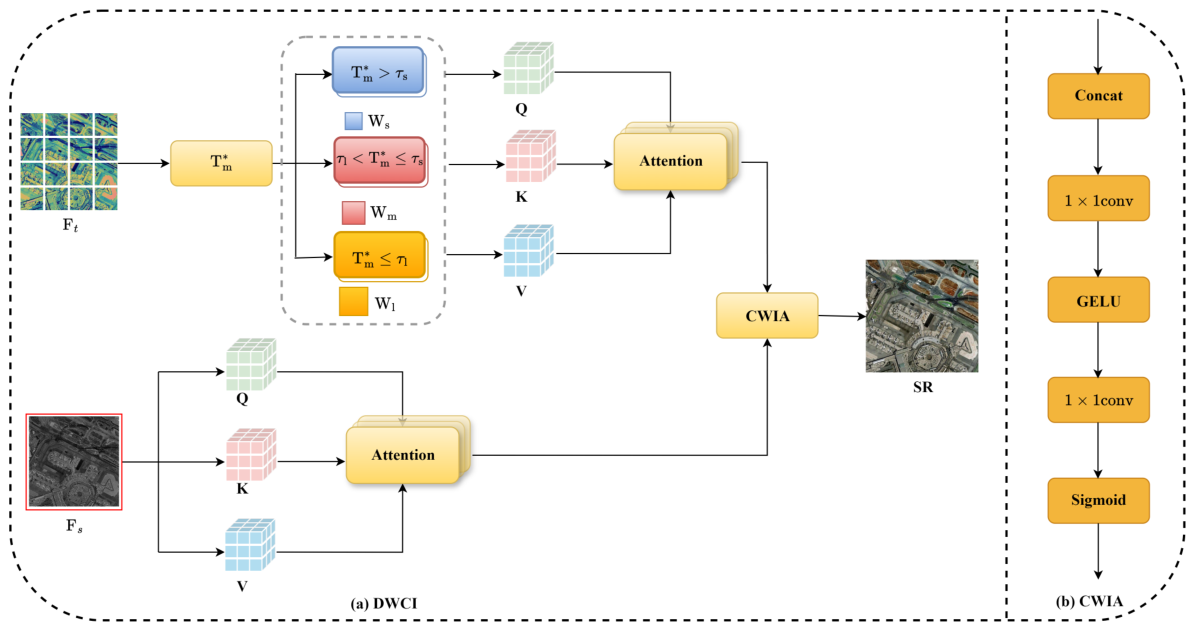
Considering the significant spatial heterogeneity between semantic structures and texture details in remote sensing images, fixed-scale attention windows are insufficient to simultaneously satisfy the modeling requirements of different feature types. However, existing SR methods typically adopt fixed-size windows or employ multi-branch parallel structures for multi-scale modeling. Such approaches lack adaptive adjustment capabilities for different regional structures, making it difficult to balance semantic consistency and texture detail representation. To address these issues, we first utilize the MGSD module to decouple features into semantic and texture components, thereby alleviating the modeling conflicts between different feature types. On this basis, we further propose the DWCI module, which introduces a differential window modeling strategy for the decoupled features. The semantic branch focuses on global context modeling, while the texture branch adaptively adjusts window sizes according to local structural complexity and employs cross-window interaction to break window boundaries. This enables deep complementarity and fusion between global semantics and local texture details. The detailed architecture is illustrated in Figure 4.
Figure 4.
The structure of Differentiated Window Cross-scale Interaction Module (DWCI).
3.4.1. Semantic Features
Semantic features focus on global structures, such as building layouts, river paths, and road networks in remote sensing images. These features change smoothly at large scales. Therefore, we calculate the global attention across the entire semantic feature map. This can not only reduce unnecessary computational overhead but also ensure the effective capture of global structural information. Semantic feature calculation is defined by the following equations:
3.4.2. Texture Features
Compared with semantic features, texture information is often local, and the texture complexity varies in different regions. Since gradients can characterize the degree of change in image pixel intensities, they serve as an important indicator of texture complexity. In regions with high texture complexity, pixel values change rapidly, resulting in large gradient magnitudes; in flat regions, pixel changes are mild and gradient magnitudes are small. Therefore, we compute gradients to evaluate texture complexity and dynamically select window sizes for the texture feature map based on the computed values. Specifically, the texture complexity of region m is calculated from the gradients of texture feature channels as follows:
where and denote the gradient intensity and weight of channel i in region m and are obtained from the MGSD and AECS modules, respectively.
To make the texture complexity suitable for dynamic window adjustment, we normalize it as
where and represent the minimum and maximum texture complexity values.
Then, we predefined three fixed-scale windows: 3 × 3, 7 × 7 and 11 × 11. The small window (3 × 3) is suitable for regions with high texture complexity, such as traffic-dense intersections or vehicle edges. The medium window (7 × 7) is appropriate for transitional areas, such as roadsides or parts of background regions. The large window (11 × 11) is used for regions with low texture variation, such as flat highways or wide open spaces. Based on the texture complexity of each region in the feature map, the most appropriate receptive field is automatically selected to ensure that critical details are preserved while reducing redundant computation in smooth areas.
where denotes the window size of region m. The thresholds and are determined through data-driven statistical analysis and can be adjusted experimentally.
However, due to varying window sizes across different regions, some areas may suffer from information loss and generate pseudo-features caused by incomplete window edges. To ensure the authenticity and completeness of boundary information, as well as better preserve the original image’s statistical properties, we adopt a mirror padding strategy on the feature map to reduce information loss and improve reconstruction quality:
where and represent the pixel values at position in the padded and original images respectively, and H and W denote the height and width of the original image.
Next, within each window, we compute the Query, Key, and Value using a self-attention mechanism, and obtain the attention output through a Softmax-weighted aggregation:
Here, is the window smoothing regularization term, and is used to control the strength of the window regularization, typically set between and .
Additionally, the image gradient information reflects edge and detail features, and measuring gradient distribution differences helps evaluate the local complexity of the texture feature map. To address this, we propose the DWCI module, which uses windows of different sizes for local feature extraction in the texture feature map. To ensure smooth transitions of window sizes across the image and avoid abrupt changes between adjacent regions, we introduce a window smoothness regularization term . Nevertheless, using the norm penalizes large differences heavily due to squaring, which may overly suppress variations. To allow adaptive adjustment of window sizes and improve robustness to local abrupt changes, we adopt an window regularization instead:
where, , and denote the window sizes of region m, the horizontally adjacent region of m, and the vertically adjacent region of m.
3.4.3. Cross-Window Interactive Attention Mechanism
For texture feature maps, we allocate different Windows based on the complexity of the texture. However, since the attention calculation for each window is local, the information exchange between Windows is restricted. This may lead to a break in key information and affect the expression of the overall texture structure. To address this issue, we propose a cross-window interactive attention mechanism (CWIA). Specifically, we calculate global attention on the semantic feature map and local attention within the adaptive window of the texture feature map. Then, the adaptive fusion of the two types of attention is achieved through CWIA. This can enable global and local attention to break through the window limitations and achieve effective interaction.
Here, denotes concatenation along the channel dimension, represents a 1 × 1 convolution, GELU provides a nonlinear mapping to enhance the model’s expressive capability, and denotes the Sigmoid activation function.
This fusion strategy preserves the strengths of both global and local modeling while enabling complementary interaction between them. Global attention can convey information across Windows, thereby enhancing the context consistency among different texture regions. This makes the features more coherent as a whole and the semantic expression more complete. In contrast, the local attention focuses on fine-grained texture structure modeling, reinforcing the model’s ability to perceive and represent complex local details. The interactive integration of the two effectively alleviates the expression bias of the attention mechanism under a fixed receptive field. Thus, the model’s ability to jointly model texture and semantics has been enhanced.
4. Experiment
4.1. Implementation Details
4.1.1. Datasets
We evaluated the proposed approach using two representative remote sensing datasets: AID [46] and UC Merced [47]. Table 1 provides a detailed overview of the datasets used. Each dataset is partitioned into training and test sets. For each type of image, 80% are randomly selected for training and the remaining 20% are used for testing. To construct SR tasks, LR images are generated by downsampling the original images with bicubic interpolation at scaling factors of ×2, ×3, and ×4.
Table 1.
Detailed information about the AID and UC Merced datasets.
4.1.2. Experimental Settings
During the experiments, the channel number C was chosen as 64, and k was fixed at 32. The input image has a size of 256 × 256, with P, , and M set to 16, 256 and 256, respectively. The parameters are , , , and . All experimental procedures were implemented in PyTorch 1.10.0 (Meta, Menlo Park, CA, USA) on a system featuring an NVIDIA RTX 3090 GPU (NVIDIA Corporation, Santa Clara, CA, USA). This work utilizes the Adam [48] optimizer, initializing it with a learning rate of and setting the parameters and . To enhance training stability and convergence efficiency, a cosine annealing learning rate scheduler is adopted, and the model is trained for 250,000 iterations. To reduce overfitting, the model is trained with augmented data using operations like random horizontal flipping, rotation, and cropping. The L1 loss is adopted as the primary objective function to decrease pixel-wise discrepancies between the model’s predictions and the ground-truth images, facilitating more accurate recovery of structural features. In addition, to evaluate the model’s performance, we used four evaluation metrics during the testing phase. These indicators include peak signal-to-noise ratio (PSNR) [49], Structural Similarity Index (SSIM) [50], Learning-aware image block similarity (LPIPS), and Feature similarity index (FSIM).
4.2. Comparison with Other Methods
4.2.1. Quantitative Results
To verify the effectiveness of FDWD-Net, we conducted a comparative experiment with the current representative SR methods.
Firstly, as shown in Table 2, we provide quantitative comparisons on 30 typical AID dataset scene categories. We compared the proposed method with models such as Bicubic, TransENet [21], ESRT [18], HAT-L [40] and TTST [24]. The experimental results show that the method proposed in this paper performs stably in various scenarios, with an average PSNR reaching 30.94 dB. It demonstrates a stronger ability in restoring the structure of ground objects and maintaining the texture edges. TTST is one of the recently proposed methods with better performance. It enhances the expressive power of images by introducing global context attention. However, its average PSNR was 30.83 dB, still lower than that of the method proposed in this paper. This gap shows that FDWD-Net has stronger capability of feature representation and detail recovery in remote sensing scenarios.
Table 2.
Quantitative comparison of different methods on the AID dataset for different land-cover classes. We mark the best-performing ones in red and the second-best ones in blue.
Secondly, we conducted quantitative comparisons across both the AID and UC Merced remote sensing datasets using scaling factors of ×2, ×3, and ×4. The compared models include Bicubic, TransENet [21], ESRT [18], OmniSR [37], HAT-L [40], HAUNet [23], SRFormer [38], ACT [19], TTST [24] and CSCT [25]. As shown in Table 3, our proposed method overall outperforms existing mainstream approaches in terms of both SSIM and PSNR. On the UC Merced dataset, a more pronounced improvement is observed at ×4 scaling, with a PSNR of 28.19 dB achieved by our method, surpassing CSCT’s 27.86 dB by 0.13 dB. This improvement comes from the channel selection mechanism and decoupling strategy introduced in the network, which effectively improves the responsiveness of the model to key features. Meanwhile, the combination of differentiated Windows has achieved the joint optimization of the global structure and local details.
Table 3.
Quantitative results of different models on the AID and UCMerced datasets at ×2, ×3, and ×4 scales. We mark the best-performing ones in red and the second-best ones in blue.
To verify the stability of the model performance, we conducted three independent trainings of FDWD-Net on the UC Merced ×4 scale using different random seeds. The experimental results, as shown in Table 4, demonstrate that our method achieves an average PSNR of 28.17 ± 0.04 and an average SSIM of 0.7814 ± 0.002. The results across multiple independent runs show small performance variations, indicating that the proposed method has good stability and robustness.
Table 4.
Statistical validation results of the UC Merced dataset from 3 independent runs at ×4 scales.
Meanwhile, to provide a more complete evaluation, additional indicators—such as model parameters (Params), memory usage, inference time, LPIPS, and FSIM—are included for assessment on the AID dataset. The comparison involves five representative approaches, namely Bicubic, TransENet [21], HAT-L [40], TTST [24] and CSCT [25]. The experimental results are shown in Table 5. Our method achieves a favorable balance between computational cost and performance. In terms of image reconstruction quality, the proposed method attains the lowest LPIPS score of 0.3041 and the highest FSIM score of 0.8287, outperforming the other compared methods. This indicates that the super-resolved images generated by our method are closer to real images in perceptual quality and exhibit stronger structural restoration capability. Regarding computational cost, the inference time of our method is 162.43 ms, which is faster than HAT-L, TTST, and CSCT but slower than TransENet. Although TransENet has an extremely low computational cost, its performance on LPIPS and FSIM is relatively weaker, reflecting its limitations in perceptual quality. In addition, from the perspective of overall model complexity, our method maintains both FLOPs and parameter size within a reasonable range. Therefore, considering overall performance, FDWD-Net still demonstrates clear advantages in SR tasks.
Table 5.
Comparison of FDWD-Net and other networks in terms of model parameters, inference time, FLOPs, LPIPS, and FSIM. We mark the best-performing ones in red and the second-best ones in blue.
To verify the generalization ability of the model, we conducted cross-dataset evaluation. The model weights trained only on the AID dataset at the ×4 scale were directly applied to the UC Merced test set, which has significantly different feature distributions. Meanwhile, representative methods including TransENet [21], TTST [24], and CSCT [25] were selected as references. As shown in Table 6, when the models are trained on the AID dataset and directly transferred to the UC Merced dataset for testing, the performance of all methods declines to some extent, mainly due to the significant distribution differences between the training and testing data. However, our method still achieves the best performance under this setting, outperforming existing mainstream models. Compared with the second-best TTST, our model improves PSNR by 0.34 dB and SSIM by 0.007. This demonstrates that the proposed method can still maintain good reconstruction quality in cross-domain scenarios.
Table 6.
Quantitative comparison results of cross-dataset generalization performance. We mark the best performing ones in red and the second-best ones in blue.
4.2.2. Visual Results
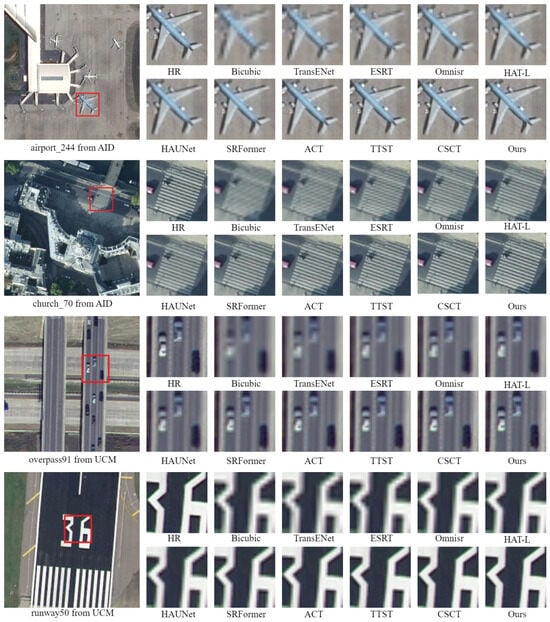
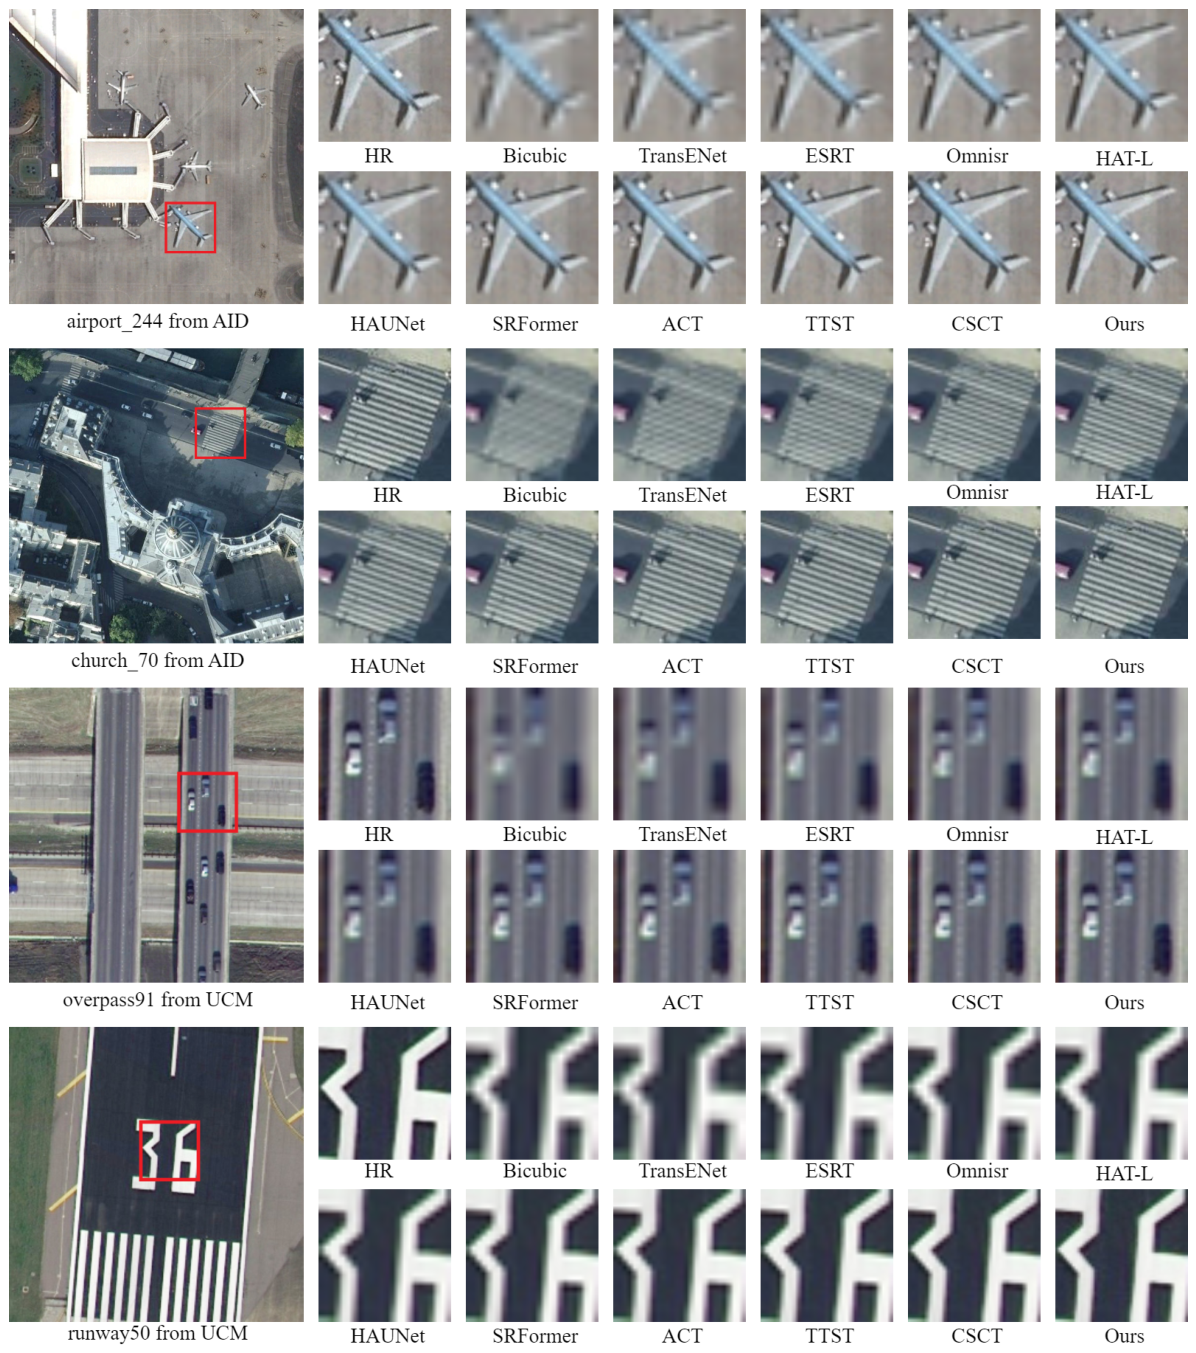
As shown in Figure 5, we present visual comparison results between our proposed method and other methods, including Bicubic, TransENet [21], ESRT [18], Omni-SR [37], HAT-L [40], HAUNet [23], SRFormer [38], ACT [19], TTST [24] and CSCT [25]. Figure 5 demonstrates that our method outperforms existing mainstream approaches in terms of texture detail and structural restoration. In terms of visual perception, compared with traditional methods whose generated images often suffer from edge blurring and texture loss, our method can more clearly reconstruct key structural details. Specifically, in the image “church_70” from AID, the zebra stripes within the region show jagged edges, artifacts, and blurring in most other methods, while our method is able to restore the continuous stripes and maintain directional consistency. In the image “runway50” from UCMerced, the number “36” on the runway appears blurry or partially missing in several methods, whereas our method not only accurately restores the shape of the digits but also clearly presents their contour structure. These improvements in visual quality are mainly attributed to the effective decoupling of global semantic and local texture modeling paths in our network architecture, thereby achieving a better balance between perceptual quality and accuracy.
Figure 5.
Compare the visual results of FDWD-Net with other models on AID (×4) and UCMerced (×4) datasets.
4.3. Ablation Study
To verify the effectiveness of the key modules proposed in this paper for remote sensing image SR, we design and conduct a series of ablation experiments on the AID dataset. The complete model, , serves as the performance reference and includes the AECS, MGSD, and DWCI modules. The baseline model, , has all these modules removed. All models were tested under a unified setting and evaluated using two indicators, PSNR and SSIM. These indicators can measure the contribution of each module to the restoration of image structure and texture details.
4.3.1. Performance Evaluation of AECS
The AECS module enhances key channel responses by integrating local statistical information through a learnable weighting mechanism. We remove the AECS module to construct a new model, , in order to evaluate its impact on the performance of FDWD-Net. As shown in Table 7, compared with the complete model , the PSNR and SSIM metrics of decreased by 0.33 dB and 0.017. The results show that the channel screening mechanism plays a positive role in enhancing the feature expression ability. Further analysis reveals that unfiltered channels include a certain proportion of low-contribution channels, which are particularly prone to introducing background interference. This can result in issues such as structural blurring, boundary distortion, or detail loss.
Table 7.
Ablation study. (×: Indicates that the module is not used. ✓: Indicates that the module is used).
4.3.2. Performance Evaluation of MGSD
To evaluate the impact of separating semantic and texture modeling on structural preservation and detail recovery, we further construct a model without MGSD, denoted as , and compare its performance with the complete model, . As shown in Table 7, in the absence of this module, PSNR and SSIM decreased by 0.49 dB and 0.0296. This indicates that this module plays a significant role in improving image quality. This is because MGSD can effectively alleviate the conflict between semantic structure preservation and detail texture restoration, making the model perform more stably in complex scenes.
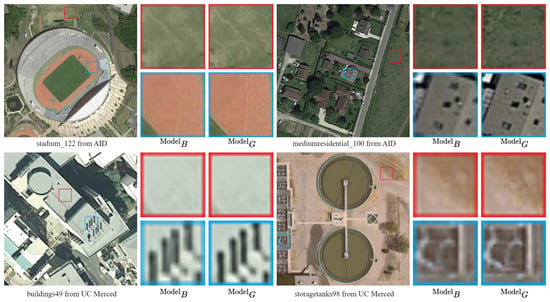
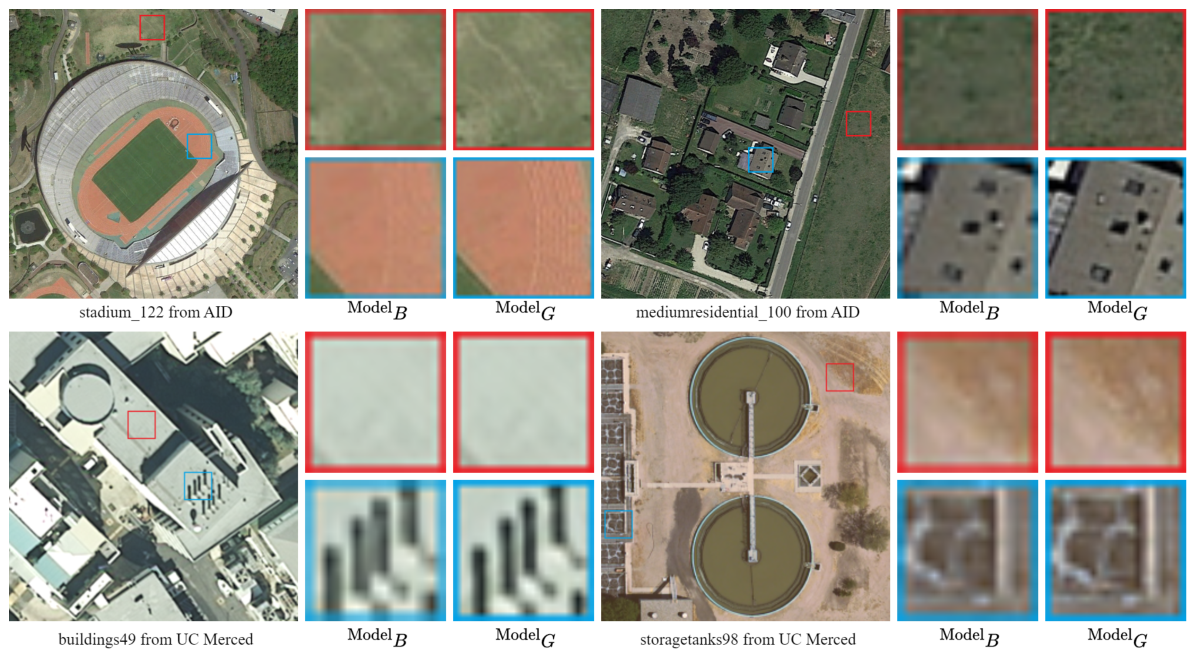
Meanwhile, to visually verify the effectiveness of the MGSD module, we compare the qualitative reconstruction results of and . As shown in Figure 6, typical scenes are selected for local zoom-in analysis, where the red boxes represent smooth semantic regions within objects, and the blue boxes represent non-smooth texture regions containing high-frequency information. Specifically, in the stadium_122 scene, the smooth lawn region indicated by the red box shows that produces unnatural texture noise and granular artifacts, mainly due to the interference between texture features and semantic features during the modeling process. In contrast, the reconstruction result of is cleaner and better preserves the visual consistency of semantic regions. In addition, in non-smooth regions, exhibits obvious grid-like artifacts and structural distortions, whereas suppresses high-frequency aliasing interference through effective feature decoupling, thereby restoring more natural texture edges. In summary, the MGSD module can effectively coordinate the modeling of global structure and local details through feature decoupling, enabling to maintain structural stability in smooth regions and achieve high-quality detail reconstruction in non-smooth texture regions.
Figure 6.
Qualitative visual comparison of the effectiveness of semantic texture feature decoupling. (The red box indicates smooth regions, and the blue box corresponds to non-smooth texture regions. The left highlights the visual results of with MGSD removed, while the right shows the results of the complete ).
4.3.3. Performance Evaluation of DWCI
The DWCI module is composed of two key components, namely differentiated windows () and cross-window interactive attention (CWIA). First, we construct a comparative model, , in which the window size of the texture map is fixed to 7 × 7, to verify the necessity of the texture-complexity-guided differentiated window design. The experimental results are shown in Table 7. Compared with , exhibits decreases of 0.67 dB in PSNR and 0.0355 in SSIM. This indicates that fixed windows limit the model’s adaptability to multi-scale features, leading to insufficient texture responses or the loss of local information. In contrast, the differentiated window mechanism dynamically perceives texture complexity, thereby enhancing local sensitivity and structural coherence. Next, we construct another comparative model, , which preserves the differentiated window design but removes the CWIA module. The enhanced semantic and texture features are fused only at the feature level via convolution before the reconstruction stage in order to verify the importance of CWIA in achieving adaptive interactive fusion across different windows. As shown in Table 7, shows reductions of 0.41 dB in PSNR and 0.0217 in SSIM compared with , demonstrating that CWIA can overcome window boundaries to enable adaptive information interaction and improve the robustness of feature fusion.
4.3.4. Hyperparameter Sensitivity Analysis
To evaluate the robustness of FDWD-Net to key hyperparameters, we conducted sensitivity analysis experiments. We mainly investigated the impact of the selected key channel number k in the AECS module and the coefficient that controls the gradient energy threshold in the MGSD module on the final performance of the model.
First, for the channel number k, we conducted sensitivity analysis experiments on the AID dataset. We set the total number of channels C to 64 and tested . The experimental results are shown in Table 8. As k increases, PSNR exhibits a trend of first increasing and then decreasing. When k varies within the range , PSNR fluctuates only slightly between 29.98 dB and 30.07 dB, indicating that the model is not sensitive to changes in k and demonstrates good robustness. Only when k takes extreme values does the performance degrade significantly. This is mainly because an excessively small k leads to the loss of key information, while an excessively large k weakens the suppression of redundant features.
Table 8.
Hyperparameter sensitivity analysis for k on the AID dataset. (k represents the number of channels).
Second, for the coefficient of the gradient energy threshold , we conducted sensitivity analysis experiments on both the AID and UC Merced datasets, with for comparative evaluation. As shown in Table 9, the hyperparameter , which controls the decoupling ratio, exhibits a highly consistent performance trend across the two remote sensing datasets with significantly different characteristics, and achieves the highest PSNR at . This indicates that the threshold exhibits very low sensitivity to variations in the dataset. Notably, within the range , the fluctuation in PSNR is relatively small: the maximum variation is 0.13 dB on the AID dataset and 0.09 dB on the UC Merced dataset, further validating the stability of the model with respect to this parameter.
Table 9.
Hyperparameter sensitivity analysis for on the AID and UC Merced datasets. ( is a hyperparameter that controls the sensitivity of the threshold).
In summary, FDWD-Net demonstrates stable performance across a wide range of key hyperparameters (k and ), indicating that the proposed method is not sensitive to parameter selection and possesses good stability and robustness.
5. Discussion
The proposed DW-SRNet framework effectively addresses the problem of significant spatial heterogeneity in remote sensing images and the difficulty of balancing semantic and texture features during reconstruction. By performing key information selection and feature decoupling along the channel dimension, the proposed method effectively alleviates the mutual interference between these two types of features in the reconstruction process. In addition, the design of differentiated windows enables the network to adaptively adjust the receptive field according to the complexity of local content, thereby achieving a better balance between global structure preservation and local detail restoration. Both quantitative and qualitative experimental results demonstrate that the proposed method significantly outperforms existing mainstream models in reconstruction quality on datasets such as AID and UC Merced.
Despite the performance improvements achieved by the proposed method, several limitations remain. First, the collaborative design of multiple modules increases the model complexity and computational cost to some extent. Second, the current method is mainly trained based on standard degradation models, and its robustness under real-world complex degradations still requires further validation. Future work can explore lightweight architecture designs and blind SR modeling for real-world degradations to further improve the applicability and stability of the model in complex practical scenarios.
6. Conclusions
This paper addresses the challenges in the SR of remote sensing images, including the conflict between global semantic and local texture modeling, as well as the lack of adaptive strategies for complex texture regions. To address these aforementioned challenges, we propose a novel network framework, FDWD-Net. Specifically, the AECS module is designed to suppress redundant information and enhance the responses of critical channels. The MGSD module enables separate modeling of semantic and texture features, enhancing the representation of different types of information. And the DWCI module dynamically adjusts window sizes to adapt to regions with varying texture complexity. These components collectively enhance the overall modeling capability and reconstruction quality. Experiments on diverse remote sensing datasets verify the strong performance of the proposed method. From the perspectives of quantitative evaluation and visual quality, our method consistently outperforms mainstream approaches, demonstrating superior structural preservation and detail restoration capabilities.
Author Contributions
Conceptualization, Y.Z.; Methodology, Y.L. and T.F.; Software, T.F. and Y.Z.; Validation, T.F., Y.Z. and X.Y.; Data curation, K.C.; Writing—original draft preparation, Y.L. and T.F.; Writing—review and editing, J.X.; Supervision, Y.L., X.Y. and J.X.; Funding acquisition, Y.L. All authors have read and agreed to the published version of the manuscript.
Funding
This work was supported by the National Natural Science Foundation of China under Grant No. 62577044, the Natural Science Basic Research Program of Shaanxi Province under Grant No. 2025JC-YBQN-906, the Key Projects for Research and Development of Shaanxi Province under Grant No. 2025CY-YBXM-067, the Education Department of Shaanxi Province under Grant No. 24JK0651 and the Key Scientific Research Projects of the Shaanxi Provincial Education Department under Grant No. 24JR152.
Data Availability Statement
The datasets used in this study are publicly available. The AID dataset used in this study is accessible from https://captain-whu.github.io/AID/ (accessed on 19 April 2026), and the UC Merced Land Use Dataset can be obtained from https://academictorrents.com/details/e9ac5edf285a43309e57e1289e8816a4e78a937c (accessed on 19 April 2026).
Conflicts of Interest
The authors declare no conflicts of interest.
References
- Khalifa, M.A.B.; El Koundi, M.; Farah, I.R. Urban Remote Sensing Image Super Resolution based on Denoising Diffusion Probabilistic Models and Generative Adversarial Networks. In Proceedings of the 2025 Joint Urban Remote Sensing Event (JURSE); IEEE: New York, NY, USA, 2025; pp. 1–4. [Google Scholar]
- Li, H.L.; Chen, S.W. General polarimetric correlation pattern: A visualization and characterization tool for target joint-domain scattering mechanisms investigation. IEEE Trans. Geosci. Remote Sens. 2025, 64, 5200417. [Google Scholar] [CrossRef] [Scilit]
- Li, H.L.; Chen, S.W. Polyhedral corner reflectors multi-domain joint characterization with fully polarimetric radar. IEEE Trans. Antennas Propag. 2025, 73, 10679–10693. [Google Scholar] [CrossRef] [Scilit]
- Liu, B.; Xu, C.; Cui, Z.; Yang, J. Progressive context-dependent inference for object detection in remote sensing imagery. IEEE Trans. Image Process. 2022, 32, 580–590. [Google Scholar] [CrossRef] [Scilit]
- Zhang, X.; Zhang, S.; Sun, Z.; Liu, C.; Sun, Y.; Ji, K.; Kuang, G. Cross-sensor SAR image target detection based on dynamic feature discrimination and center-aware calibration. IEEE Trans. Geosci. Remote Sens. 2025, 63, 5209417. [Google Scholar] [CrossRef] [Scilit]
- Yang, Y.; Tang, X.; Cheung, Y.M.; Zhang, X.; Jiao, L. SAGN: Semantic-aware graph network for remote sensing scene classification. IEEE Trans. Image Process. 2023, 32, 1011–1025. [Google Scholar] [CrossRef] [Scilit]
- Zhang, Q.; Yuan, Q.; Song, M.; Yu, H.; Zhang, L. Cooperated spectral low-rankness prior and deep spatial prior for HSI unsupervised denoising. IEEE Trans. Image Process. 2022, 31, 6356–6368. [Google Scholar] [CrossRef] [Scilit] [PubMed]
- Liu, Y.; Jia, Q.; Fan, X.; Wang, S.; Ma, S.; Gao, W. Cross-SRN: Structure-preserving super-resolution network with cross convolution. IEEE Trans. Circuits Syst. Video Technol. 2021, 32, 4927–4939. [Google Scholar] [CrossRef] [Scilit]
- Wu, G.; Jiang, J.; Jiang, K.; Liu, X. Fully 1 × 1 convolutional network for lightweight image super-resolution. Mach. Intell. Res. 2024, 21, 1062–1076. [Google Scholar] [CrossRef] [Scilit]
- Fang, C.; Fu, B.; Cheng, D.; Cheng, L.; Zhang, D. High-frequency structure transformer for magnetic resonance image super-resolution. Pattern Recognit. 2026, 170, 112037. [Google Scholar] [CrossRef] [Scilit]
- Wu, Z.; Lu, T.; Zhang, Y.; Chai, X. CMANet: A CNN-Mamba aggregation network for face super-resolution. Pattern Recognit. 2025, 168, 111859. [Google Scholar] [CrossRef] [Scilit]
- Li, F.; Cong, R.; Wu, J.; Bai, H.; Wang, M.; Zhao, Y. Srconvnet: A transformer-style convnet for lightweight image super-resolution. Int. J. Comput. Vis. 2025, 133, 173–189. [Google Scholar] [CrossRef] [Scilit]
- Kang, X.; Duan, P.; Li, J.; Li, S. Efficient swin transformer for remote sensing image super-resolution. IEEE Trans. Image Process. 2024, 33, 6367–6379. [Google Scholar] [CrossRef] [Scilit]
- Ray, A.; Kumar, G.; Kolekar, M.H. Cfat: Unleashing triangular windows for image super-resolution. In Proceedings of the IEEE/CVF Conference on Computer Vision and Pattern Recognition, Seattle, WA, USA, 16–22 June 2024; pp. 26120–26129. [Google Scholar]
- Dong, C.; Loy, C.C.; He, K.; Tang, X. Image super-resolution using deep convolutional networks. IEEE Trans. Pattern Anal. Mach. Intell. 2015, 38, 295–307. [Google Scholar] [CrossRef] [Scilit]
- Kim, J.; Lee, J.K.; Lee, K.M. Accurate image super-resolution using very deep convolutional networks. In Proceedings of the IEEE Conference on Computer Vision and Pattern Recognition, Las Vegas, NV, USA, 27–30 June 2016; pp. 1646–1654. [Google Scholar]
- Dong, C.; Loy, C.C.; Tang, X. Accelerating the super-resolution convolutional neural network. In Proceedings of the Computer Vision–ECCV 2016: 14th European Conference, Amsterdam, The Netherlands, 11–14 October 2016; Proceedings, Part II 14; Springer: Berlin/Heidelberg, Germany, 2016; pp. 391–407. [Google Scholar]
- Lu, Z.; Li, J.; Liu, H.; Huang, C.; Zhang, L.; Zeng, T. Transformer for single image super-resolution. In Proceedings of the IEEE/CVF Conference on Computer Vision and Pattern Recognition, New Orleans, LA, USA, 18–24 June 2022; pp. 457–466. [Google Scholar]
- Sun, L.; Dong, J.; Tang, J.; Pan, J. Spatially-adaptive feature modulation for efficient image super-resolution. In Proceedings of the IEEE/CVF International Conference on Computer Vision, Paris, France, 2–3 October 2023; pp. 13190–13199. [Google Scholar]
- Lei, S.; Shi, Z.; Zou, Z. Super-resolution for remote sensing images via local–global combined network. IEEE Geosci. Remote Sens. Lett. 2017, 14, 1243–1247. [Google Scholar] [CrossRef] [Scilit]
- Lei, S.; Shi, Z.; Mo, W. Transformer-based multistage enhancement for remote sensing image super-resolution. IEEE Trans. Geosci. Remote Sens. 2021, 60, 5615611. [Google Scholar] [CrossRef] [Scilit]
- Lei, S.; Shi, Z. Hybrid-scale self-similarity exploitation for remote sensing image super-resolution. IEEE Trans. Geosci. Remote Sens. 2021, 60, 5401410. [Google Scholar] [CrossRef] [Scilit]
- Wang, J.; Wang, B.; Wang, X.; Zhao, Y.; Long, T. Hybrid attention-based U-shaped network for remote sensing image super-resolution. IEEE Trans. Geosci. Remote Sens. 2023, 61, 5612515. [Google Scholar] [CrossRef] [Scilit]
- Xiao, Y.; Yuan, Q.; Jiang, K.; He, J.; Lin, C.W.; Zhang, L. TTST: A top-k token selective transformer for remote sensing image super-resolution. IEEE Trans. Image Process. 2024, 33, 738–752. [Google Scholar] [CrossRef] [Scilit]
- Zhang, K.; Li, L.; Jiao, L.; Liu, X.; Ma, W.; Liu, F.; Yang, S. CSCT: Channel-Spatial Coherent Transformer for Remote Sensing Image Super-Resolution. IEEE Trans. Geosci. Remote Sens. 2025, 63, 5611014. [Google Scholar] [CrossRef] [Scilit]
- Li, X.; Xu, F.; Zhang, J.; Zhang, H.; Lyu, X.; Liu, F.; Gao, H.; Kaup, A. Frequency-Guided Denoising Network for Semantic Segmentation of Remote Sensing Images. IEEE Trans. Geosci. Remote Sens. 2026, 64, 5400217. [Google Scholar] [CrossRef] [Scilit]
- Li, X.; Shi, C.; Xu, N.; Su, Y.; Kaup, A.; Liu, D.; Li, X. Position-Aware Differential Denoising Transformer for Semantic Segmentation of Remote Sensing Images. IEEE Geosci. Remote Sens. Lett. 2025, 23, 5000405. [Google Scholar] [CrossRef] [Scilit]
- Li, X.; Yong, X.; Li, T.; Tong, Y.; Gao, H.; Wang, X.; Xu, Z.; Fang, Y.; You, Q.; Lyu, X. A spectral–spatial context-boosted network for semantic segmentation of remote sensing images. Remote Sens. 2024, 16, 1214. [Google Scholar] [CrossRef] [Scilit]
- Dosovitskiy, A. An image is worth 16 ×16 words: Transformers for image recognition at scale. arXiv 2020, arXiv:2010.11929. [Google Scholar]
- Huang, S.; Sirejiding, S.; Lu, Y.; Ding, Y.; Liu, L.; Zhou, H.; Lu, H. Yolo-med: Multi-task interaction network for biomedical images. In Proceedings of the ICASSP 2024–2024 IEEE International Conference on Acoustics, Speech and Signal Processing (ICASSP); IEEE: New York, NY, USA, 2024; pp. 2175–2179. [Google Scholar]
- Liang, J.; Cui, Y.; Wang, Q.; Geng, T.; Wang, W.; Liu, D. Clusterfomer: Clustering as a universal visual learner. Adv. Neural Inf. Process. Syst. 2023, 36, 64029–64042. [Google Scholar]
- Zhang, W.T.; Bai, Y.; Zheng, S.D.; Cui, J.; Huang, Z.Z. Tensor Transformer for hyperspectral image classification. Pattern Recognit. 2025, 163, 111470. [Google Scholar] [CrossRef] [Scilit]
- Gao, Y.; Sun, Y.; Ding, X.; Zhao, C.; Liu, S. Ease-detr: Easing the competition among object queries. In Proceedings of the IEEE/CVF Conference on Computer Vision and Pattern Recognition, Seattle, WA, USA, 16–22 June 2024; pp. 17282–17291. [Google Scholar]
- Feng, C.; Zhong, Y.; Jie, Z.; Xie, W.; Ma, L. Instagen: Enhancing object detection by training on synthetic dataset. In Proceedings of the IEEE/CVF Conference on Computer Vision and Pattern Recognition, Seattle, WA, USA, 16–22 June 2024; pp. 14121–14130. [Google Scholar]
- Chen, H.; Wang, Y.; Guo, T.; Xu, C.; Deng, Y.; Liu, Z.; Ma, S.; Xu, C.; Gao, W. Pre-trained Image Processing Transformer. In Proceedings of the IEEE/CVF Conference on Computer Vision and Pattern Recognition (CVPR), Nashville, TN, USA, 20–25 June 2021; pp. 12299–12310. [Google Scholar]
- Liang, J.; Cao, J.; Sun, G.; Zhang, K.; Van Gool, L.; Timofte, R. Swinir: Image restoration using swin transformer. In Proceedings of the IEEE/CVF International Conference on Computer Vision, Montreal, QC, Canada, 10–17 October 2021; pp. 1833–1844. [Google Scholar]
- Wang, H.; Chen, X.; Ni, B.; Liu, Y.; Liu, J. Omni aggregation networks for lightweight image super-resolution. In Proceedings of the IEEE/CVF Conference on Computer Vision and Pattern Recognition, Vancouver, BC, Canada, 17–24 June 2023; pp. 22378–22387. [Google Scholar]
- Zhou, Y.; Li, Z.; Guo, C.L.; Bai, S.; Cheng, M.M.; Hou, Q. Srformer: Permuted self-attention for single image super-resolution. In Proceedings of the IEEE/CVF International Conference on Computer Vision, Paris, France, 1–6 October 2023; pp. 12780–12791. [Google Scholar]
- Kang, Y.; Zhang, X.; Wang, S.; Jin, G. SCAT: Shift Channel Attention Transformer for Remote Sensing Image Super-Resolution. IEEE J. Sel. Top. Appl. Earth Obs. Remote Sens. 2025, 18, 10337–10347. [Google Scholar] [CrossRef] [Scilit]
- Chen, X.; Wang, X.; Zhou, J.; Qiao, Y.; Dong, C. Activating more pixels in image super-resolution transformer. In Proceedings of the IEEE/CVF Conference on Computer Vision and Pattern Recognition, Vancouver, BC, Canada, 17–24 June 2023; pp. 22367–22377. [Google Scholar]
- Yang, L.; Zhang, R.Y.; Li, L.; Xie, X. Simam: A simple, parameter-free attention module for convolutional neural networks. In Proceedings of the International Conference on Machine Learning PMLR, Virtual Event, 18–24 July 2021; pp. 11863–11874. [Google Scholar]
- Xu, Y.; Du, W.; Deng, L.; Zhang, Y.; Wen, W. Ship target detection in SAR images based on SimAM attention YOLOv8. IET Commun. 2024, 18, 1428–1436. [Google Scholar] [CrossRef] [Scilit]
- Guo, H.; Bao, Y.; Hu, S.; Luan, C.; Fu, J.; Li, L.; Zhang, Y.; Sun, Y.; Nie, Z. AFCN: An attention-directed feature-fusion ConvNeXt network for low-voltage apparatus assembly quality inspection. IET Image Process. 2024, 18, 2093–2104. [Google Scholar] [CrossRef] [Scilit]
- Rezaie, S.; Saberitabar, N.; Salehi, E. Improving dental diagnostics: Enhanced convolution with spatial attention mechanism. arXiv 2024, arXiv:2407.08114. [Google Scholar] [CrossRef] [Scilit]
- Qu, J.y.; Li, Y.l.; Li, H.h.; Liu, S.l. SimAM-based optimization algorithm for small target detection. In Proceedings of the Third International Conference on Advanced Algorithms and Neural Networks (AANN 2023) SPIE, Qingdao, China, 5–7 May 2023; Volume 12791, pp. 170–175. [Google Scholar]
- Xia, G.S.; Hu, J.; Hu, F.; Shi, B.; Bai, X.; Zhong, Y.; Zhang, L.; Lu, X. AID: A benchmark data set for performance evaluation of aerial scene classification. IEEE Trans. Geosci. Remote Sens. 2017, 55, 3965–3981. [Google Scholar] [CrossRef] [Scilit]
- Yang, Y.; Newsam, S. Bag-of-visual-words and spatial extensions for land-use classification. In Proceedings of the 18th SIGSPATIAL international Conference on Advances in Geographic Information Systems, San Jose, CA, USA, 2–5 November 2010; pp. 270–279. [Google Scholar]
- Kingma, D.P. Adam: A method for stochastic optimization. arXiv 2014, arXiv:1412.6980. [Google Scholar]
- Dong, C.; Loy, C.C.; He, K.; Tang, X. Learning a deep convolutional network for image super-resolution. In Proceedings of the Computer Vision–ECCV 2014: 13th European Conference, Zurich, Switzerland, 6–12 September 2014; Proceedings, Part IV 13; Springer: Berlin/Heidelberg, Germany, 2014; pp. 184–199. [Google Scholar]
- Wang, Z. Image quality assessment: Form error visibility to structural similarity. IEEE Trans. Image Process. 2004, 13, 604–606. [Google Scholar]

Disclaimer/Publisher’s Note: The statements, opinions and data contained in all publications are solely those of the individual author(s) and contributor(s) and not of MDPI and/or the editor(s). MDPI and/or the editor(s) disclaim responsibility for any injury to people or property resulting from any ideas, methods, instructions or products referred to in the content. |
© 2026 by the authors. Licensee MDPI, Basel, Switzerland. This article is an open access article distributed under the terms and conditions of the Creative Commons Attribution (CC BY) license.