


Highlights
What are the main findings?
- The proposed Geometry-Enhanced Transformer (FA-CTNet) significantly outperforms massive state-of-the-art models in point cloud classification by mathematically embedding explicit biological priors, such as Manhattan Positional Encoding and vertical distribution ratios.
- FA-CTNet achieved a leading Macro-F1 score of 73.21% and an Overall Accuracy of 78.20% on the heavily imbalanced ForSpecial20K dataset, demonstrating exceptional discriminative capability for minority and morphologically similar species.
What are the implications of the main findings?
- Integrating domain-specific macro-morphological constraints into deep learning architectures effectively overcomes the performance bottlenecks of purely data-driven models, ensuring robust generalization across long-tailed forest distributions.
- The parameter-efficient framework provides a highly reliable and structurally interpretable solution for precision forestry applications, including single-tree inventories and multi-source LiDAR data fusion.
Abstract
Accurate identification of tree species is important for forest management, biodiversity studies, and precision forestry. Near-range LiDAR point clouds provide detailed three-dimensional information about individual trees. However, the complex structure of the point clouds and the unbalanced distribution of species make automatic classification difficult. To address these issues, this study presents a Transformer model with geometric enhancement. The model combines local geometric features and global attention to improve species recognition in forest environments. It uses geometric information with biological meaning, including point cloud normals, local density, vertical structure, and growth direction. A focal loss with class balance is also introduced to reduce the impact of species distributions with long tails. Experiments on the ForSpecial20K dataset show that the proposed method performs better than representative models based on convolution, graph methods, and Transformer architectures. It achieves higher overall accuracy (78.20%), higher mean class accuracy (73.48%), and a higher Macro-F1 score (73.21%). Results from confusion matrices and visual analysis of similar species further verify the effectiveness of the geometric features and the loss design. These results suggest that modeling structural information of forests helps improve robustness and generalization. The proposed method offers a practical solution for tree-level species mapping, fusion of LiDAR data from multiple sources, and fine-scale forest inventory. It also shows the value of combining high-resolution LiDAR data with deep learning for forestry applications.
1. Introduction
Three-dimensional (3D) point clouds, acquired via LiDAR or photogrammetry, have emerged as a premier data source in remote sensing, offering explicit encoding of spatial geometry and vertical structure that 2D imagery lacks [1]. Recent studies highlight that terrestrial laser scanning (TLS) is expanding the frontiers of forest research by enabling precise quantification of tree architecture [2]. However, fully exploiting this potential for automated species classification remains challenging as scans in dense or unmanaged forests frequently suffer from severe inter-crown occlusions, irregular densities, and background clutter [3,4].
Point cloud data have become indispensable for forest inventory and ecological monitoring, serving as a fundamental baseline for sustainable management [5,6]. However, acquiring clean data in unmanaged forests is notoriously difficult. Scans frequently suffer from irregular densities and substantial background clutter [5,7], artifacts that are further amplified in complex robotic mapping scenarios [8]. Recent studies in top-tier remote sensing journals have repeatedly emphasized that automated tree species classification is severely bottlenecked by complex morphological overlaps. Furthermore, significant intraspecific morphological variations caused by foliage plasticity and environmental competition often make distinguishing species based solely on global appearance unreliable [3,4,9]. Conversely, taxonomically related species frequently share nearly identical macro-structural traits in terrestrial laser scanning (TLS) data, rendering purely geometry-based differentiation highly susceptible to inter-class confusion [10]. To facilitate data-driven solutions, large-scale benchmarks such as SegmentedForests [6] and the FOR-species20K dataset [5] have recently been introduced, marking a pivotal transition from small-scale plots to diverse, multi-species scanning campaigns.
Early point cloud analysis primarily relied on PointNet-based architectures [11,12], Convolutional Neural Networks (CNNs) [13], and Graph Neural Networks (GNNs) [14], often combined in hybrid designs [15]. In forestry, researchers have adapted these backbone models for tree species classification. For example, some studies improve PointNet++ for airborne laser scanning data [16]. Others use dynamic spatial–spectral feature optimization to classify common tree species [17,18]. While foundational, these methods focus on aggregating local neighborhood features, limiting their ability to capture the global structural context required for complex forest scenes. To address this, Transformer models, originally designed for sequence modeling [19], have been adapted to point clouds, leveraging self-attention [20,21] to capture long-range dependencies [22]. However, standard Transformers suffer from quadratic complexity, limiting their scalability. Very recently, State Space Models (SSMs) like Mamba have emerged as a linear-complexity alternative [23,24,25], showing great potential for large-scale remote sensing tasks [26]. Despite these advances, effectively coupling these data-driven backbones with the specific needs of forestry applications remains an open research question.
A critical limitation of existing Transformers is their underutilization of intrinsic geometric attributes [27,28] and reliance on raw coordinates or learned embeddings [21,29,30]. This approach treats points as dimensionless tokens. It ignores explicit geometric priors, such as branching skeletons [31,32] and Quantitative Structure Models (QSM) [33]. Previous forestry studies have shown that these priors are important for describing internal crown structures [34,35]. Unlike explicit reconstruction methods that optimize skeleton paths [36], standard end-to-end models face clear limitations. They often struggle to capture multi-scale geometric features [37]. They also have difficulty accurately separating wood and leaf components (i.e., wood filtering) using morphological analysis, which is a critical prerequisite for extracting reliable species-specific architectural traits [38,39,40]. As a result, these models often fail to distinguish species with similar local foliage. However, these species may have different overall growth patterns. Such differences are best described using geometric cues like surface normals and local curvature [41]. Furthermore, point clouds are naturally unordered and irregular, making spatial modeling highly dependent on positional encoding schemes [42,43]. Although different distance metrics capture distinct spatial signatures [44,45], their impact on forestry classification has not been systematically optimized.
Beyond architecture, data characteristics pose significant hurdles. Pure Transformers are data-hungry, creating a bottleneck in forestry where labeled 3D data is scarce and expensive to obtain [20,46,47]. To mitigate this, recent advances have explored generative diffusion models, such as Diff-Tree [48], to synthesize diversified tree point clouds with high realism. Self-supervised paradigms [43,49] are emerging, but domain-specific adaptation remains challenging. Addressing the inherent long-tailed distribution and classifier bias in forest datasets [50,51,52,53] requires specialized solutions that integrate geometric awareness with robust imbalance handling [54].
Motivated by these challenges, this study focuses on developing a point cloud classification framework tailored for forestry tree species classification. The main idea is to improve geometric representation while keeping the global modeling benefits of Transformer architectures. The design is inspired by the architecture as proposed by Lu et al. (2022) [1]. It applies to the idea of combining local neighborhood information with global contextual reasoning. Specifically, we explicitly integrate biologically meaningful geometric cues to enhance local structural awareness. Furthermore, different distance metrics for positional encoding are carefully evaluated to identify spatial representations that match forestry point cloud characteristics. To deal with the imbalance in tree species datasets, a class-aware optimization strategy is introduced to improve recognition performance for species that are underrepresented.
The effectiveness of the proposed approach is tested through extensive experiments on representative point cloud datasets, including tree species data focused on forestry. The experimental results show that the proposed method consistently performs better than existing approaches in classification accuracy and robustness, especially under complex structural conditions and imbalanced class distributions. These findings show the potential of Transformer models that use geometric information for practical forestry remote sensing applications.
In summary, the main contributions of our work are as follows:
- (1)
- We propose a Transformer framework with geometric enhancement for forestry tree species classification. It explicitly includes geometric attributes with multiple dimensions to improve local structural discrimination in complex forest environments.
- (2)
- A hybrid CTBlock module is designed by combining local feature extraction based on PointCNN with global dependency modeling based on Transformers. This allows effective combination of local geometric details and global semantic context.
- (3)
- We conduct a systematic study of spatial distance metrics and strategies for handling class imbalance in forestry point cloud classification. This leads to better performance on minority species and improved model robustness in real-world scenarios.
2. Materials and Methods
2.1. Dataset Source and Usage
The experiments use the publicly available ForSpecial20K dataset. This dataset is designed for classifying single tree species under close-range laser scanning conditions. The dataset is openly available on Zenodo (https://zenodo.org/records/13255198 (accessed on 15 October 2025)). It provides annotated point cloud samples for training.
ForSpecial20K combines individual tree point clouds collected from 25 public and collaborative datasets. It mainly covers European forest environments, with some additional samples from North America and Oceania. The dataset contains 20,158 individual trees from 19 genera and 33 tree species. It shows considerable variability in tree height, crown structure, and overall geometric shape across different growth stages [5].
The point clouds were collected using several close-range laser scanning platforms, including TLS, unmanned aerial laser scanning (ULS), and mobile laser scanning (MLS). These platforms create noticeable differences in point density, viewing angles, and occlusion patterns. This results in complex and incomplete point cloud structures that reflect real forest survey conditions. These multi-source characteristics create major challenges for learning robust geometric representations and generalizing across platforms.
Only the labeled training portion of the dataset is utilized. To facilitate model development and evaluation, the dataset is randomly partitioned at the individual tree level into training, validation, and test subsets following a 9:1 split between training and test sets, with an additional 4:1 split of the training set into training and validation subsets. The original class distribution is preserved during splitting to reflect the inherent species imbalance present in natural forest environments. To clearly illustrate this class distribution and address the inherent species imbalance, we provided the exact number of trees for each class in a sorted horizontal bar chart (Figure 1). As shown in the figure, the dataset exhibits a pronounced long-tailed distribution, where dominant species (e.g., Pinus sylvestris, Picea abies) contain thousands of individuals, whereas rare species are represented by significantly fewer samples.
Figure 1.
Species-wise distribution of the number of trees in the ForSpecial20K train dataset, sorted in descending order. The figure highlights a pronounced long-tailed distribution, with exact sample sizes annotated at the end of each bar. Scientific names are italicized.
2.2. Data Preprocessing and Feature Construction
To ensure data consistency and prepare the raw LiDAR data for network ingestion, the pre-processing pipeline is structured into three sequential steps:
First, Data Parsing and Initialization: Raw LAS files are parsed to extract 3D coordinates and per-point normal vectors. If normals are absent in the raw data, they are zero-padded initially and dynamically re-estimated during the network’s forward pass to ensure feature completeness.
Second, Spatial Resampling: To unify the input dimensions, each point cloud is resampled to a fixed size of 4096 points. Unlike simple synthetic objects, individual tree point clouds exhibit highly complex and irregular topologies, including intricate branching architectures and foliage distributions. Empirical studies in forestry point cloud analysis indicate that aggressive downsampling (e.g., to 1024 points) severely degrades these fine-grained morphological traits, leading to significant structural information loss [3,5]. Therefore, 4096 points were selected to maintain an optimal balance between preserving essential geometric fidelity and ensuring computational efficiency.
For point clouds smaller than this target, random sampling with replacement is applied to guarantee a fixed tensor size for batch processing, which is a standard procedure in point-based deep learning [5,11,12]. Although this introduces duplicated points, it does not alter the macroscopic geometric boundaries or the topological structure of the tree. Furthermore, because the Forest-Aware Convolution Transformer Network (FA-CTNet) relies on permutation-invariant operators (such as global max pooling) and attention mechanisms, the redundant identical points are naturally filtered during feature aggregation, minimizing any potential adverse influence on the geometric representation. For larger point clouds, farthest point sampling (FPS) is used to ensure uniform spatial coverage.
Third, Coordinate Normalization: After resampling, coordinates are centered by the centroid and scaled by the maximum Euclidean distance, normalizing all point clouds within a unit sphere. This normalization stabilizes training and reduces scale variability.
Dataset splits are controlled by text files mapping LAS filenames to class indices. The test set is explicitly defined, while training and validation sets are generated by per-class random partitioning, preserving class distributions and reproducibility.
Beyond coordinates and normals, additional geometry-aware descriptors are explicitly computed on normalized point clouds to enrich the network’s structural awareness. The rationale for selecting these specific attributes is deeply rooted in established forestry taxonomy and structural modeling principles [3,33]. Specifically, local point density, normal variance, and Principal Component Analysis (PCA)-based curvature were selected to capture fine-grained micro-morphological traits, such as foliage density, branch thickness, and crown surface roughness [32,35]. Conversely, macroscopic descriptors like the vertical distribution ratio and growth direction were designed to explicitly model species-specific stem-to-crown allometry and phototropic canopy expansion patterns [3]. Together, these multi-scale features provide a comprehensive geometric representation that purely data-driven coordinates often fail to capture.
During training, conservative on-the-fly data augmentation is applied. The primary rationale for these specific augmentations is to simulate realistic forestry scanning artifacts while strictly preserving the biological realism of the trees. For instance, arbitrary 3D rotations were intentionally excluded; instead, only rotations around the vertical (Z) axis were applied. This simulates different sensor viewing angles (e.g., varying TLS scan positions) while maintaining the gravity-aligned upright growth topology essential for tree identification. Meanwhile, weak Gaussian jittering, point dropout, and isotropic scaling were utilized to mathematically emulate variable scanning densities, sensor noise, and partial inter-crown occlusions typical in complex forest environments [12,16]. Coordinate rotations are applied consistently to normals when available. Augmentation strength is scheduled across epochs, starting mild to stabilize convergence and gradually increasing to improve generalization.
Class imbalance is addressed via per-class loss weighting. Weights are inversely proportional to class frequency, clipped to avoid extreme values, and incorporated into the loss function to encourage the model to focus on underrepresented species.
FA-CTNet integrates a set of biologically meaningful geometric descriptors to capture complex tree structures. It does not rely on pre-computed normals from raw LAS files. These normals are often noisy or incomplete. Instead, all normal vectors and related geometric features are re-estimated during the forward pass. Furthermore, within the Global Transformer modules, the neighborhood size for geometric computation dynamically matches the downsampled point resolution of the current stage (i.e., in Stage 1 and in Stage 2), enabling global receptive fields.
The core geometric descriptors injected into the attention mechanism are mathematically formulated as follows:
Growth Direction () encodes the growth tendency of the canopy relative to its neighborhood centroid . For a target point relative to the representative point , the direction is normalized as:
Vertical Distribution Ratio () is used to describe the relative vertical placement of a point within its local structure (from trunk base to canopy apex), the vertical distribution ratio normalizes the coordinate relative to the local vertical bounds :
where is a small constant to prevent division by zero.
PCA-based Curvature () and Local Density ():
2.3. Network Architecture
In this study, we propose a novel geometry-enhanced architecture termed the FA-CTNet for single-tree species classification from 3D point clouds (Figure 2). From a macro-architectural perspective, the hierarchical local-global feature extraction paradigm (combining local convolution with global attention) is inspired by the foundational hybrid framework 3DCTN [1]. However, the core innovation of FA-CTNet lies in its newly proposed geometry-enhanced attention mechanism and the integration of biological priors.
Figure 2.
Architecture of the FA-CTNet. The framework comprises three main stages: ① Data Preparation with dual-stream decoupling, ② Hierarchical Feature Encoding using stacked CTBlocks (detailed in the central panel), ③ PointCNN with X-Conv Modeling and ④ Global Aggregation. The bottom-left panel illustrates the Geometry-Enhanced Difference Attention mechanism.
Unlike existing baseline architectures that treat points as dimensionless tokens, FA-CTNet is newly designed to explicitly integrate tree-specific macro-morphological constraints (e.g., vertical distribution ratio, growth direction) and dimension-decoupled Manhattan spatial encodings. As illustrated in the “Input Dual-stream Decoupling” module of Figure 2, the network explicitly separates spatial coordinates from semantic features to preserve geometric integrity and directly feed these biological priors into the attention energy function. The network aims to jointly model fine-grained local geometric structures and long-range global contextual relationships inherent in complex forest point clouds, thereby improving discriminative capability under realistic scanning conditions.
FA-CTNet follows a three-stage hierarchical architecture, inspired by the design philosophy of convolution–Transformer hybrid models such as 3DCTN. The first two stages are responsible for progressive feature learning at different spatial resolutions, while the third stage performs global feature aggregation and classification.
Each of the first two stages consists of a unified Convolution–Transformer Block (CTBlock), which serves as the fundamental feature extraction unit across the network. Figure 2 (middle panel) details the internal flow of the CTBlock, highlighting the transition from local neighborhood construction to the “Feature Lifting” operation, which expands geometric depth before global attention modeling.
2.3.1. Convolution–Transformer Block
Each CTBlock sequentially integrates two complementary modules:
- (1)
- a local feature extraction module based on PointCNN for neighborhood-level geometric encoding.
- (2)
- a global Transformer module for modeling long-range dependencies among points.
The preprocessed input point cloud is represented as , where is the batch size, is the number of points per sample, and is the initial feature dimension, typically including spatial coordinates . Each point feature vector is denoted as . Geometric attributes such as normals, local density, and curvature are explicitly computed in subsequent local and global feature modeling stages.
The core unit of FA-CTNet is the Convolution–Transformer Block (CTBlock), designed to jointly model local geometric structure and global semantic relationships. For input , CTBlock first applies a PointCNN-based local feature extraction operator :
where represents K-Nearest Neighbors (KNN)-based local neighborhoods. XConv encodes both coordinates and features of neighboring points, supporting downsampling and feature dimension expansion, yielding . This local encoding preserves permutation invariance while progressively enhancing spatial structure representation.
The CTBlock then applies to a global Transformer module to model long-range dependencies, augmented by geometry-enhanced attention. For each query point and key-value pair , the attention score is computed as:
where is a learnable weight matrix, and encodes relative spatial positions and local geometric features (e.g., normal differences, curvature, growth direction). The global output is combined with residual connections and nonlinear transformations, enhancing point-level discriminability while preserving local structure. CTBlocks are applied at different point resolutions: high-resolution stages capture fine local details, while downsampled stages focus on global morphological semantics.
2.3.2. Three-Stage Progressive Architecture
FA-CTNet follows a three-stage progressive architecture. Stages one and two consist of stacked CTBlocks, extracting basic geometric features from high-resolution points and then higher-level biologically meaningful morphological representations. Let the outputs of stage one and stage two be and , respectively. Global max pooling over the point dimension produces a permutation-invariant global feature vector:
This vector is then projected via a fully connected layer , batch normalization BN, and nonlinear activation :
where is fed into a multilayer perceptron classifier with Dropout and ReLU activations to predict the tree species probabilities. This design preserves local convolutional modeling capabilities while leveraging geometry-enhanced Transformer attention to capture global spatial and structural dependencies, improving discrimination of fine-grained morphological differences in tree point clouds.
Table 1 quantitatively details the hierarchical evolution of the network architecture. It demonstrates the progressive trade-off between spatial resolution and feature depth: point density is systematically reduced (from 4096 to 64 points) to broaden the receptive field, while feature channels are expanded (up to 640 dimensions) to encode richer semantic information.
Table 1.
Feature dimension and point number evolution across the FA-CTNet architecture.
2.3.3. Mathematical Formalization of Geometry-Enhanced Attention
While existing architectures like 3DCTN and 3DGTN have demonstrated the efficacy of subtraction-based attention and coordinate-based positional encodings, they inherently treat point clouds as dimensionless spatial graphs, neglecting the explicit topological structures of trees. The fundamental architectural contribution of FA-CTNet lies in generalizing the self-attention mechanism to incorporate multi-dimensional biological geometric priorities as an additive bias.
Formally, traditional self-attention relies on the scaled dot product to compute the similarity between a query and a key :
In contrast, the CTBlock in FA-CTNet formulates a Generalized Geometry-Aware Self-Attention. Instead of using dot products, it utilizes a learnable non-linear mapping of the feature differences , structurally inheriting the properties of 3DCTN. However, FA-CTNet significantly extends this by explicitly injecting a spatial positional encoding and a biological geometric encoding .
To explicitly formalize the Manhattan Positional Encoding (M-PE) introduced in Figure 2, let the relative physical coordinates between two points within a local neighborhood be denoted as . The M-PE computes the positional encoding as follows:
Unlike the Euclidean metric, which involves squared operations that blend spatial gradients, the Manhattan distance linearly accumulates absolute values across independent dimensions. This computational mechanism effectively avoids the cross-mixing and smoothing contamination of features across different dimensions, successfully decoupling the vertical trunk growth information from the horizontal canopy expansion. In the forward propagation, a scalar Manhattan distance matrix is obtained by summing the absolute deviations along the coordinate axes. This 1D distance tensor is then flattened and passed through a two-layer MLP equipped with a ReLU activation function, which maps it into a high-dimensional feature space matching the attention head dimension (). This explicitly preserves the independent geometric gradients on each coordinate axis, providing a highly tailored spatial inductive bias for the attention mechanism to distinguish complex tree morphologies.
Moreover, we define the and the Geometry-Enhanced Transformer can be set as:
Here, acts as the feature transformation function, and represents the Local Geometry Encoder, which maps the raw geometric feature set into the attention dimension . The geometric feature set is constructed from biologically meaningful descriptors specific to tree morphology, including normal difference , local curvature , vertical angle , point density , and growth direction :
By introducing as an additive bias, the geometric traits act as a dynamic soft constraint within the attention energy function. Under this formulation, the model is not forced to rely solely on the semantic differences or absolute coordinates to determine point affinities. If and the geometric/positional terms are ablated , the mechanism strictly degenerates into standard self-attention. This mathematical design allows fine-grained structural anomalies to directly influence attention weight. These anomalies include irregular branching and specific leaf cluster densities. As a result, FA-CTNet has a clear advantage in distinguishing taxonomically similar but structurally different tree species.
2.4. Training Strategy and Loss Function
2.4.1. Loss Function Design
Cross-entropy loss (CE) is widely adopted in point cloud classification models based on PointNet, PointCNN, and Transformer architectures due to its simplicity and numerical stability. For datasets with relatively balanced class distributions, CE typically provides effective supervision. However, the ForSpecial20K dataset exhibits a pronounced long-tailed distribution across tree species, where dominant species such as Pinus sylvestris and Picea abies are represented by substantially more samples than minority species. Preserving the original class distribution without aggressive resampling increases the risk of model bias toward majority classes and degrades recognition performance for rare species.
To address this issue, Focal Loss is adopted as the primary classification objective. Focal Loss introduces a modulation factor to the standard cross-entropy formulation, suppressing the loss contribution of easily classified samples and encouraging the model to focus on hard and underrepresented classes. It is defined as
where denotes the predicted probability of the ground-truth class, is a class-balancing factor, and is the focusing parameter controlling the emphasis on hard samples. When , Focal Loss reduces to standard cross-entropy loss. In our network optimization, the focusing parameter is explicitly set to , which is higher than the conventional default value of 2.0. The motivation for adopting a larger is deeply rooted in the extreme long-tailed distribution and the highly challenging nature of “hard samples” within realistic forestry point clouds. In mixed forest scenarios, these hard samples typically consist of individual trees suffering from severe canopy occlusion, extremely sparse point densities, or exceptionally high phenotypic similarity to other species (e.g., morphological variants within the Quercus genus). By setting , the non-linear decay effect is further amplified. During backpropagation, this setting more aggressively suppresses the gradient contributions from dominant, easily recognizable species. By significantly weakening the gradient dominance of majority classes, the model sustains robust gradient updates for structurally ambiguous and data-scarce minority species during the middle and late stages of training, thereby effectively improving the decision boundary discriminability for complex tree species.
By down-weighting gradients from abundant and easily separable samples, Focal Loss maintains effective optimization pressure on similar structure and data-scarce tree species, which is well aligned with the high inter-class similarity and large intra-class variability commonly observed in forestry point cloud classification.
2.4.2. Class Imbalance Handling and Weighting Strategy
Beyond the intrinsic focusing mechanism of Focal Loss, explicit class weighting is further introduced to mitigate severe sample imbalance. Let denote the frequency of class in the training set. The corresponding class weight is defined as
with an upper bound of 10 applied to prevent extreme gradient amplification for rare classes. The square inverse formulation moderates excessive weight growth for extremely low-frequency classes while preserving sufficient inter-class discrimination. This weighting strategy improves numerical stability and works well for multi-class point cloud classification when class sizes vary widely.
In the algorithmic implementation, the class-aware weighting and the Focal Loss mechanism are seamlessly integrated to provide a dual-level calibration for the long-tailed distribution. Specifically, the pre-computed class weights () are first passed directly into the standard cross-entropy function to generate a statically weighted base loss. This ensures that the global gradient contribution is strictly scaled by the inverse square root of the class frequencies. Subsequently, the dynamic focal modulation factor is applied to this weighted base loss. This two-stage implementation guarantees that the network is statically penalized for ignoring rare classes (via ) while simultaneously being dynamically forced to focus on hard-to-classify samples (via the focusing parameter) during backpropagation, without causing numerical precision loss.
2.4.3. Optimization Strategy and Training Configuration
The model is optimized using the Adam optimizer. Adam provides adaptive estimates of first- and second-order gradient moments and shows robust convergence in high-dimensional parameter spaces. To further stabilize training and improve convergence, a learning rate schedule that combines linear warm-up and cosine annealing is used. During the initial training phase, the learning rate is gradually increased to reduce gradient instability caused by random initialization. After the warmup phase, cosine annealing gradually lowers the learning rate. This allows stable convergence in later epochs and reduces performance fluctuations. Specifically, the network was trained for a total of 300 epochs with a batch size of 28.
Moderate on-the-fly data augmentation is applied exclusively during training to enhance robustness to geometric variability inherent in forestry point clouds. Augmentations include small random rotations around the vertical axis, minor translations, and weak perturbations that preserve the overall tree structure. Validation and test sets remain unaltered to ensure objective performance evaluation.
Additionally, features enhanced with geometric information, such as point normals, local point density, and curvature descriptors, are included in the training pipeline. Normal vectors are transformed together with coordinates to keep geometric consistency. Density and curvature features provide additional structural information beyond the raw spatial data. Relative positional encoding is constructed using Manhattan distance, which better captures axis-aligned and vertically stratified structures typical of tree point clouds compared to Euclidean distance.
Collectively, the combination of a focal loss formulation with class-aware weighting, a stabilized optimization strategy, and geometry-consistent training design provides a robust foundation for learning discriminative tree species representations under realistic forestry remote sensing conditions.
2.4.4. Implementation Details
All experiments were conducted on a workstation equipped with a single NVIDIA GeForce RTX 4090D GPU with 24 GB of VRAM. The deep learning models were implemented using the PyTorch (2.0.0+cu118) framework. In the data processing pipeline, the Laspy library (2.5.4) was employed for efficient reading and writing of large-scale LAS/LAZ point cloud data, while the Scikit-learn library (1.3.2) [55] was utilized to implement the DBSCAN algorithm for individual tree segmentation. For qualitative evaluation and visualization of the classification results, we utilized the Open3D library (0.18.0) [56]. Its high-performance 3D rendering engine and viewpoint control capabilities facilitated the detailed display of structures ranging from macroscopic plots to individual trees.
2.5. Evaluation Metrics
To comprehensively assess both the overall classification performance and the class-level discrimination capability in tree species classification from point clouds, three complementary evaluation metrics are adopted: Overall Accuracy (OA), mean Accuracy (mAcc), and Macro-averaged F1 score (Macro-F1).
Overall Accuracy (OA) measures the proportion of correctly classified samples in the test set and reflects the global classification performance of the model. It is defined as
where denotes the total number of test samples, and represent the ground-truth label and predicted label of the i-th sample, respectively, and is the indicator function. While OA provides an intuitive measure of overall correctness, it is inherently biased toward dominant classes in imbalanced datasets.
To alleviate this limitation, the mean Accuracy (mAcc) is employed to evaluate the average classification accuracy across all tree species. It is computed as
where denotes the total number of classes, is the number of correctly classified samples in class , and is the total number of samples belonging to that class. By assigning equal importance to each class, mAcc is more sensitive to the performance of minority classes and is therefore more suitable for evaluating models under class imbalance conditions.
To provide a detailed assessment of the model’s performance on individual tree species, particularly under imbalanced conditions, we utilize per-class Precision (), Recall (), and F1-score (). These are defined based on the number of True Positives (), False Positives (), and False Negatives () for each class :
Furthermore, the Macro-averaged F1 score (Macro-F1) is adopted as a key evaluation metric to measure overall performance evenly across all classes regardless of their sample sizes. It is obtained by averaging the individual F1 scores:
By treating all classes equally regardless of their sample sizes, Macro-F1 provides a balanced assessment of model performance and is particularly effective in revealing classification behavior on rare and structurally similar tree species. Additionally, a normalized Confusion Matrix is employed to visually analyze inter-species misclassification patterns and structurally related prediction errors.
Overall, OA is used to quantify the global classification accuracy, while mAcc and Macro-F1 emphasize class-level balance and robustness under severe class imbalance. Among these metrics, Macro-F1 is selected as the primary criterion for model selection and checkpoint saving during training, ensuring reliable and stable performance in complex forestry point cloud classification scenarios. Furthermore, to rigorously verify whether the overall accuracy improvements of the proposed model over the baselines are statistically significant, a two-proportion Z-test was employed based on the classification results. A p-value of less than 0.05 is considered to indicate a statistically significant difference in predictive performance.
2.6. Experimental Setup for Ablation Studies
To comprehensively assess the contribution of individual components and design choices, a series of ablation experiments was conducted. All ablation models were trained and evaluated using the identical data splits, training protocols, and evaluation settings as the main experiments. The complete FA-CTNet served as the baseline, and classification performance was evaluated using the metrics defined in Section 2.5, with a particular emphasis on the Macro-F1 score to account for class imbalance.
The experimental design for the ablation studies focuses on three primary dimensions. First, to identify the optimal spatial representation for forestry point clouds, we systematically evaluated eight distinct distance metrics within the positional encoding module. This was further supported by a statistical analysis comparing the Manhattan and Euclidean metrics, where 999,047-point pairs were randomly sampled from the ForSpecial20K dataset to compute their relative spatial deviations along the vertical axis and horizontal plane. Second, to validate the structural effectiveness of our network, the proposed FA-CTNet was compared against two representative point-based architectures: a purely local convolutional model (PointCNN) and a hybrid GNN-Transformer model (3DCTN). Finally, to quantitatively transparentize the contribution of each geometric descriptor, we designed a fine-grained progressive ablation study. This involved incrementally injecting geometric features into a coordinate-only baseline to evaluate their individual impact on resolving structural variability.
3. Results
3.1. Overall Classification Performance
Table 2 presents a comprehensive benchmark of the proposed method against representative baselines on the ForSpecial20K dataset. Performance is evaluated using Overall Accuracy (OA), Mean Accuracy (mAcc), and Macro-F1 on the independent test set, alongside peak validation metrics to assess model generalization capability.
Table 2.
Comparative performance benchmarks of various point cloud classification models on the ForSpecial20K dataset, reporting metrics for both the best validation epoch and the final independent test set. Bold and underlined values indicate the best performance in each category.
Regarding Overall Accuracy, the proposed method achieves a leading test OA of 78.20%, outperforming both convolution-based architectures (e.g., PointNet++, PointCNN) and Transformer-based models (e.g., 3DGTN, 3DCTN). To statistically validate these results, a two-proportion Z-test was conducted to compare the Overall Accuracy of FA-CTNet against the representative baseline model (3DCTN). The statistical test yielded a Z-statistic of 4.1168 and a highly significant p-value (), confirming that the accuracy improvement achieved by the proposed geometry-enhanced architecture is statistically significant and definitively not a result of random sample variance.
Crucially, the proposed method secures the highest Macro-F1 score of 73.21%. In contrast, several baseline models show a clear gap between OA and Macro-F1. The proposed approach consistently reduces this discrepancy, achieving simultaneous improvements in OA, mAcc, and Macro-F1.
3.2. Class-Wise Performance and Confusion Analysis
Figure 3 shows the confusion matrix of the proposed method on the ForSpecial20K test set. The rows and columns represent the ground truth and predicted tree species, respectively. To intuitively visualize the classification behavior, a white-to-orange gradient is employed in Figure 3, where darker orange indicates higher prediction confidence. The explicit colored bounding boxes further demarcate the two major functional groups: conifers (top-left, green border) and broadleaves (bottom-right, blue border). As visually reinforced by the matrix layout, the off-diagonal regions outside the colored bounding boxes are predominantly white (near-zero values). This stark visual contrast confirms that the model has successfully learned robust high-level semantic features, effectively eliminating confusion between taxonomically distant coniferous and broadleaved species.
Figure 3.
Normalized confusion matrix (%) of tree species classification on the ForSpecial20K test set. The matrix employs a white-to-orange gradient, where darker orange indicates higher prediction confidence. Explicit colored bounding boxes delineate the two major functional groups: conifers (top-left, green border) and broadleaves (bottom-right, blue border).
Several tree species achieve very high classification accuracy, with recognition rates that are near perfect or perfect. These include Picea glauca, Pinus radiata, Pinus resinosa, Populus deltoides, and Populus tremuloides. All of them show strong diagonal responses with almost no off-diagonal confusion.
For major coniferous species with many samples, such as Pinus sylvestris and Picea abies, the proposed method also shows strong classification performance. The diagonal accuracies exceed 85%. Minor confusion is mainly observed among conifers that are taxonomically or morphologically related, including Pinus nigra, Pinus pinaster, and Pinus contorta. These misclassifications are small and mostly occur within the same genus.
Among broadleaf species, most classes show clear diagonal patterns as well. Species such as Acer saccharum, Betula pendula, Fagus sylvatica, and Quercus ilex reach high class-wise accuracies. This shows that the model effectively captures canopy shape, branching structure, and vertical distribution cues. However, moderate confusion is seen between closely related or structurally similar deciduous species, especially within the Acer and Quercus genera. For example, Acer campestre and Acer pseudoplatanus, along with Quercus robur, Quercus petraea, and Quercus rubra, show partial overlap in their prediction distributions.
As quantitatively detailed in Table 2, the classification performance exhibits significant variance across the 33 species. While the proposed FA-CTNet demonstrates substantial F1-score improvements over baseline models for several structurally complex species (e.g., Pseudotsuga menziesii and Quercus rubra), certain minority classes with severe sample scarcity (e.g., Fraxinus excelsior and Euonymus europaeus) still exhibit extremely low performance and dispersed confusion patterns. A detailed mechanistic discussion regarding the underlying biological and statistical causes of these extreme performance disparities is provided in Section 4.2.
Beyond the quantitative confusion matrix, Figure 4 provides a qualitative evaluation of the classification results on the ForSpecial20K test set. The visualizations demonstrate the FA-CTNet predictions in complex, multi-species forest scenes, specifically highlighting a generated deciduous plot (Figure 4a) and a generated coniferous plot (Figure 4b). The clear and precise delineation of different species in these highly diverse environments corroborates the model’s robust feature extraction capabilities and its effectiveness in identifying individual tree species within dense, overlapping canopy structures in the source domain.
Figure 4.
Qualitative visualization of tree species classification on the ForSpecial20K test set. (a) Generated deciduous plot with predicted labels. (b) Generated coniferous plot with predicted labels. Scientific names in the legend are italicized.
To further visually investigate the misclassifications observed in the confusion matrix, Figure 5 presents downsampled point cloud visualizations (4096 points) of three tree species that exhibit the highest mutual confusion: Fagus sylvatica, Carpinus betulus, and Acer campestre. From a crown morphology perspective, all three species display relatively compact and rounded crown shapes with limited anisotropy. In terms of branching structure, these visual samples show similar branch density and branch angle patterns, with primary and secondary branches exhibiting similar spatial arrangements. No clear directional branching patterns are visible that could reliably distinguish the species. Furthermore, all three tree species show similar height distributions and vertical point density patterns.
Figure 5.
Downsampled point clouds (4096 points) of three frequently confused broadleaved species (Fagus sylvatica, Carpinus betulus, Acer campestre). Samples illustrate structural similarities in morphology and branching that cause classification ambiguity.
3.3. Ablation Studies
3.3.1. Ablation on Position Encoding Distance
As summarized in Table 3, the Manhattan distance consistently achieves superior performance across all metrics, yielding the highest Macro-F1 score of 73.21%.
Table 3.
Impact of different spatial distance metrics on classification performance. The comparison highlights the effectiveness of Manhattan distance in capturing the anisotropic structural features of tree point clouds compared to other geometric formulations. The bolded and underlined values indicate the best performance for each metric.
This advantage can be attributed to the inherent anisotropy of tree structures. Unlike the isotropic Euclidean distance, Manhattan distance explicitly decouples vertical height differences from horizontal spread. This separation aligns well with the biological reality of tree morphology (e.g., vertical trunks versus horizontal branching), providing a stronger inductive bias for the attention mechanism than complex learned or spherical encodings.
The Euclidean distance yields the lowest Macro-F1 (69.81%) because its isotropic nature smooths out the anisotropic vertical and horizontal structural differences inherent in trees. The Cosine encoding, formulated to measure the local angular and directional alignment , performs reasonably well (71.14% Macro-F1) as it captures branching angles and crown expansion trends. However, because Cosine similarity is scale-invariant and discards absolute physical distance magnitudes, it fails to distinguish structures with similar angles but different sizes. In contrast, the Manhattan distance (73.21% Macro-F1) achieves the optimal balance by preserving absolute spatial scales while explicitly decoupling the vertical trunk axis from the horizontal canopy spread.
As illustrated in Figure 6, the spatial distribution of tree point clouds exhibits severe structural anisotropy. The variance in the vertical direction is 0.118 m2. The variance in the horizontal direction is 0.031 m2. The vertical variance is about 3.80 times larger than the horizontal variance.
Figure 6.
Statistical validation of spatial anisotropy in tree point clouds. (Left) Scatter plot of relative vertical distances () versus horizontal distances (), showing a strong distribution bias towards the vertical axis. The red dashed line represents the 1:1 reference line. (Middle) Density histograms highlighting the longer tail of vertical expansions. The red and teal dashed lines indicate the mean values of the respective distributions. (Right) Variance comparison demonstrates that the vertical variance is 3.80 times larger than the horizontal variance, empirically justifying the use of the dimension-decoupled Manhattan distance.
The Euclidean distance ( norm) inherently acts as an isotropic smoothing operator, disproportionately compressing the impact of large linear variations through its squaring operation. Conversely, the Manhattan distance ( norm) linearly preserves the independent coordinate differences. By preventing cross-dimensional blending, it explicitly decouples the highly variant vertical trunk axis from the horizontal canopy spread, thereby providing a biologically aligned spatial prior for the attention mechanism.
3.3.2. Ablation on FA-CTNet Architecture
The final test performance and the best validation performance during training are reported in Table 4.
Table 4.
Ablation study comparing the structural effectiveness, parameter efficiency, and classification performance of FA-CTNet against representative point-based architectures. FLOPs: Floating Point Operations. The bolded and underlined values indicate the best performance for each metric.
Compared to early lightweight architectures like PointNet and FoldingNet, FA-CTNet achieves a massive performance leap (+27.78% and +12.69% in OA, respectively), justifying its moderate increase in computational cost for the sake of high-precision forestry mapping.
Against mainstream deep learning baselines such as PointNet++ and PointCNN, our method demonstrates superior feature extraction capabilities, improving Macro-F1 by over 7% through enhanced global context modeling.
Finally, relative to recent hybrid models like 3DCTN and 3DGTN, FA-CTNet not only secures the highest classification accuracy (78.20% OA) but also offers a more favorable efficiency-accuracy trade-off. Notably, it outperforms the parameter-heavy 3DGTN (5.98 M params) while using fewer parameters (5.04 M) and significantly lower FLOPs (2.34 G vs. 3.32 G), proving that the proposed geometric enhancement is a more effective strategy than simply increasing model size.
To ensure a rigorous evaluation against contemporary state-of-the-art architectures, it is worth noting that our established baselines already include the highly recent 3DGTN (published in 2024). Furthermore, we newly integrated PointNeXt [57], which is a highly acclaimed modern point cloud network, into our comparative analysis. As detailed in Table 4, despite its massive parameter size (19.63 M, nearly four times larger than FA-CTNet’s 5.04 M), PointNeXt yielded an OA of 69.60% and a Macro-F1 of 59.36% on the ForSpecial20K dataset. It should be noted that due to current hardware constraints and the primary focus of this study on geometry-enhanced interpretable modeling, we conducted a standard reproduction of PointNeXt without exhaustive hyperparameter tuning. A detailed mechanistic discussion regarding the performance gap between purely data-driven massive models and our geometry-enhanced approach is provided in Section 4.1.
3.3.3. Ablation of Geometry Enhancement Strategy
As shown in Table 5, starting from a coordinate-only baseline (Macro-F1 70.06%), the explicit injection of normal vectors yields the most significant initial performance leap, increasing the Macro-F1 score by 2.53%. This confirms that the fundamental surface orientation is the primary driving factor for local geometric awareness.
Table 5.
Fine-grained progressive ablation study of geometric enhancements.
However, adding traditional local point statistics leads to performance fluctuations. These statistics include density and PCA-based curvature. While mAcc exhibits spikes (e.g., reaching 73.75% with density), the OA and Macro-F1 experience slight declines. This pattern reveals an important property of forestry point clouds. Complex, occluded, and irregularly sampled canopies make generic micro-geometric descriptors prone to high-frequency noise. The localized growth direction further increases mAcc to 74.60%. This indicates better recognition of some minority species with distinct branching habits. However, it also reduces the stability of the overall prediction. The OA drops to 76.63%.
The final model includes a macroscopic biological prior called the Vertical Distribution Ratio. This feature is designed for tree morphology. It helps the model overcome local geometric ambiguities. It also shows where each local structure lies along the vertical trunk-to-canopy axis. With this design, the model achieves the best performance on the main metrics. The OA reaches 78.20%. The Macro-F1 reaches 73.21%. These results show a clear trend. Geometry enhancement does not rely on simply stacking traditional point cloud statistics. Instead, it depends on integrating macro-morphological traits to reduce local structural noise.
3.4. Cross-Dataset Zero-Shot Generalization Evaluation
The practical utility of any forest perception model hinges on its transferability across disparate forest stands and variable sensor configurations. To evaluate this, we conducted an independent validation using the BioDiv-3DTrees dataset (https://data.goettingen-research-online.de/dataset.xhtml?persistentId=doi:10.25625/8PB1IF (accessed on 1 April 2025)), which presents a significant domain shift from the ForSpecial20K training environment in terms of point density, scanning protocols (TLS), and local forest structure. We deployed the pre-trained FA-CTNet in a zero-shot manner on this unseen TLS test scene to generate both qualitative spatial predictions (Figure 7) and quantitative performance metrics.
Figure 7.
Zero-shot generalization results on the independent BioDiv-3DTrees TLS dataset. (a) Ground truth species labels within the test scene. (b) Spatial distribution of FA-CTNet prediction results. This comparison highlights the model’s ability to maintain structural coherence across different LiDAR scanning environments. Scientific names in the legend are italicized.
As specified in Table 6, we focused our quantitative analysis on the eight species that overlap between the two datasets. Given the 33-class taxonomy of our model versus the 12-class environment of BioDiv-3DTrees, exact species matching is inherently constrained by label space mismatch and morphological variability across different geographical regions. While the exact species OA reached 38.69%, a deeper investigation into functional group coherence reveals the model’s structural robustness. Specifically, the model achieved a broad-class accuracy of 96.88% for broadleaved trees and 79.74% for conifers, successfully preserving the overarching geometric distinction between these two primary functional groups despite fine-grained species-level confusion.
Table 6.
Quantitative zero-shot classification performance on the 8 overlapping species from the unseen BioDiv-3DTrees dataset.
4. Discussion
4.1. Interpretation of Overall Performance Gains
The proposed method shows consistent improvements in OA, mAcc, and Macro-F1 on the ForSpecial20K dataset. This demonstrates its superior capability in capturing distinctive geometric patterns from high-resolution point clouds, which is critical for complex forest environments with irregular canopy structures. This indicates not only higher overall accuracy but also better class-wise balance and more robustness under severe species imbalance. These gains come from the combined effects of architectural design, feature representation, and optimization objectives. Together, they make the proposed approach different from existing methods.
From a metric point of view, OA mainly shows performance on dominant species. In contrast, mAcc and Macro-F1 are more sensitive to minority classes and confusion between classes. The improvement across all three metrics shows that the proposed model does not just favor common species. It learns more discriminative and transferable representations for rare and structurally ambiguous tree classes. This behavior is especially important in large forest inventories, where species distributions naturally have a long tail. For baseline models, the performance gap between OA and Macro-F1 indicates that their overall accuracy is mostly driven by majority species, while their performance on underrepresented classes is limited. Conversely, for FA-CTNet, this significant improvement indicates a balanced classification performance across diverse species. As Macro-F1 treats all classes equally, this result confirms the model’s robustness in handling the long-tailed class distributions inherent in forestry datasets. As quantitatively reported in Section 3.3.2 (Table 4), the massive modern baseline PointNeXt (19.63 M parameters) struggled significantly on the realistic forestry dataset compared to our FA-CTNet (5.04 M parameters). This striking performance gap effectively validates our core working hypothesis: blindly scaling up network parameters is suboptimal when dealing with the severe structural irregularity and long-tailed distributions inherent in realistic forestry TLS data. Purely data-driven models, even with advanced architecture, often fail to capture species-specific morphological traits when underrepresented classes are heavily occluded. In stark contrast, FA-CTNet explicitly mitigates these bottlenecks by integrating macro-morphological biological priors (e.g., M-PE and vertical distribution ratios). This integration empowers the model to achieve superior class-wise balance and structural interpretability with merely a quarter of the parameters. Overall, these results confirm that the proposed framework is robust and effective for large-scale tree species classification under realistic and imbalanced forestry point cloud conditions.
When interpreted in the context of previous studies [4,18,40,49], our findings reveal both important similarities and critical differences. Similarly to the previous purely data-driven studies (e.g., PointNet++ [12], PointCNN [13]), our results confirm that hierarchical spatial feature extraction excels at identifying dominant species when abundant training data is available. However, a structural difference emerges when addressing structurally complex species. The proposed CTBlock clearly separates local geometric modeling from global semantic aggregation, whereas conventional point-based networks mainly rely on local receptive fields. These networks have difficulty capturing long-range structural dependencies that exist in tree crowns and branching patterns [21,22,42]. In contrast, GNN-based approaches can encode relational information. However, they often rely on hand-crafted graph constructions, which may simplify complex three-dimensional shapes too much. The CTBlock combines continuous local convolution using PointCNN with a geometry-enhanced Transformer. This allows complementary learning of detailed local structures and global contextual relationships. This combination helps the model better match local geometric cues with global species-level semantics.
Beyond geometric attributes, the adoption of Manhattan distance for positional encoding proves critical. By explicitly decoupling vertical and horizontal spatial discrepancies, it aligns with the natural anisotropy of tree growth, offering a stronger inductive bias than isotropic Euclidean measures used in standard Transformers. At the feature level, adding geometry-aware enhancement plays an important role in improving performance. Instead of simply stacking traditional geometric statistics, the proposed approach selectively adds structure-aware features. These features capture biologically meaningful information, such as growth direction and relative height distribution. These features give high-level inductive bias that matches tree morphology. They help the attention model stay more stable and reduce sensitivity to changes in point density and acquisition noise. As a result, the learned representations show stronger class separability. This is especially true for species that have similar crown shapes but different vertical structures.
For loss design and optimization, using Macro-F1 as the main evaluation target implicitly guides the model to achieve balanced performance across categories. Although the training objective is still based on cross-entropy, the architectural choices and feature encoding strategy together reduce dominance by majority classes. This leads to better recall and precision for underrepresented species. This effect is reflected in the observed reduction in confusion among closely related taxa in the confusion matrix analysis.
Compared with existing methods that focus either on local geometry or global context alone, the proposed model uses a more holistic design approach. By optimizing local continuity, global semantic reasoning, and structure-aware geometric priors together, the model gets consistent improvements across complementary performance metrics. These improvements indicate that effective tree species classification requires not only a larger model capacity but also careful integration of domain-specific geometric knowledge with modern attention-based architectures.
4.2. Analysis of Inter-Species Confusion
The confusion matrix shows that most classification errors are not random. Instead, they are concentrated among species that are taxonomically or structurally similar. This reflects the natural structural similarity of these species rather than random prediction errors. Conversely, this behavior shows that species with distinctive geometric structures or growth patterns can be reliably identified from individual tree point clouds. Furthermore, for minority species with limited samples, misclassifications tend to happen toward ecologically or structurally similar broadleaf species rather than dominant classes. This suggests that the model keeps some class awareness even under severe data imbalance. As visually reinforced by the matrix layout, the off-diagonal regions outside the bounding boxes are predominantly white (near-zero values). This stark contrast confirms that the model has successfully learned robust high-level semantic features, effectively eliminating confusion between taxonomically distant coniferous and broadleaved species. This observation shows that inter-species confusion is mainly caused by intrinsic morphological similarity, not by model instability. It also provides useful insight into the remaining challenges of classifying tree species from point clouds. Specifically, the extremely low performance observed in certain minority classes (e.g., Fraxinus excelsior, F1 = 26.09%) can be attributed to the compounding effects of the long-tailed data distribution and high inter-class morphological similarity. Trees belonging to the same genus often share nearly identical branching topologies, making them inherently difficult to distinguish using solely geometric point clouds when training samples are critically insufficient. Conversely, the substantial improvements achieved by FA-CTNet in specific classes (e.g., Quercus rubra, where the F1-score improved from 70.59% in 3DCTN to 86.67%) validate the effectiveness of our geometry-enhanced modules. By explicitly feeding macro-morphological priors (such as the vertical distribution ratio) into the attention mechanism, the model successfully captures species-specific stem-to-crown allometry and gravity-aligned growth patterns, effectively overcoming the limitations of purely data-driven baselines on these structurally complex trees.
The remaining misclassifications are strictly confined within the respective functional blocks. For instance, the dense clusters of light orange cells within the broadleaf block (e.g., among Quercus and Acer genera) highlight the challenge of distinguishing fine-grained morphological variations when high-level canopy structures are similar. Looking at crown morphology, species with similar crown shapes tend to be confused more often. For example, several broadleaf species with rounded or irregular crowns are noticeably misclassified among each other. In these cases, the overall shape of the canopy, shown by the medium-resolution point cloud, gives only limited discriminative information. When crown extent, compactness, and surface roughness are similar, the model needs to rely on more subtle geometric cues. These cues can be partly hidden by changes in sampling density or occlusion. This explains why confusion persists even when global context modeling is introduced.
Branching structure also adds to ambiguity between some species pairs. Species with similar branching angles, bifurcation frequencies, or branch thickness tend to produce overlapping local geometric patterns. In the confusion matrix, this is reflected by asymmetric off-diagonal entries between structurally related taxa. This confusion is especially clear for species with similar branching architectures, where local point neighborhoods are hard to distinguish using only geometric descriptors. Although the proposed CTBlock improves the integration of the local and global features, fine-grained branch structures are still hard to resolve when point sampling is sparse or uneven.
From a vertical distribution standpoint, species with analogous height profiles and vertical biomass allocation are more prone to confusion. When highly standardized processing diminishes differences in absolute dimensions, coniferous species with trunks and vertical crowns often become easily confused with one another. Similarly, broadleaf tree species with layered canopy structures and similar crown height ratios may exhibit overlapping vertical point density distributions. These similarities reduce the ability of features based only on relative height statistics to discriminate between species. This becomes particularly evident when different growth stages or environmental conditions add extra variability.
Importantly, the confusion matrix also shows that misclassifications mostly occur within functional or morphological groups, rather than between them. Confusion between coniferous and broadleaf tree species is still relatively rare. This indicates that the model successfully captures higher-level structural patterns. This model shows that geometry-enhanced Transformer architectures can effectively capture coarse-grained biological differences. Residual errors mainly come from fine-grained variation within groups.
Overall, the observed confusion between species shows the inherent difficulty of distinguishing tree species that have overlapping crown shapes, branching patterns, and vertical structures. This is especially true when using only point cloud data. These findings suggest that reducing confusion further may need either higher-resolution point sampling or the use of additional cues, such as intensity, multispectral data, or phenology-aware features. Nonetheless, the structured nature of the remaining errors demonstrates that the proposed model has already learned biologically meaningful representations, and that its limitations align with known challenges in forest morphology analysis.
4.3. Interpretation of Species Confusion and Cross-Dataset Generalization
As visually observed in Figure 3 (Section 3.2), the highly confused species (Fagus sylvatica, Carpinus betulus, and Acer campestre) represent a typical group of broadleaved trees with closely related growth forms and overlapping structural characteristics, making them particularly challenging to distinguish using geometry-only point cloud representations.
After point sampling and normalization, differences in crown width and surface roughness become smaller. This leads to fewer overall shape features available for distinguishing species. This similarity is especially clear in downsampled representations, where fine geometric details are partly smoothed out.
Under such conditions, local neighborhood features extracted by the network often overlap across classes. This increases the chance of misclassification.
The vertical distribution of sampling points further increased the observed confusion. Variations in harvesting patterns, canopy effects, and stand density can easily mask species-specific vertical features, particularly when only standardized height data are available.
These visual observations match the confusion patterns seen in the normalized confusion matrix. They highlight a key challenge of tree species classification using remote sensing. Botanically distinct species can look structurally similar in point cloud form. This is especially true in mixed and dense forest environments. This difficulty will be further exacerbated when aggressive downsampling is required to maintain computational efficiency.
Despite these challenges, the proposed model shows better discrimination among these very similar species. This improvement is partly due to the use of global context modeling and class-aware loss design. During training, the model focuses on hard and minority-class samples. This encourages it to use subtle geometric cues that might be hidden by dominant structural similarities. As a result, the model achieves more balanced performance across confusing species pairs within the source domain.
However, the challenge of morphological similarity becomes even more pronounced when extending the model to entirely unseen environments. Regarding the cross-dataset zero-shot evaluation, a notable discrepancy exists between the high functional group accuracy (96.88% for Broadleaf and 79.74% for Conifer) and the relatively lower species-level OA (38.69%). This discrepancy can be fundamentally attributed to the hierarchical nature of tree morphology. Functional group classification relies on macro-structural traits (e.g., overall crown shape and primary branching architectures), which generalize robustly across different geographical regions and forest types. Conversely, fine-grained species-level classification depends on micro-structural variations. These micro-traits are highly sensitive to local environmental factors, stand density, and dataset-specific scanning configurations, creating a significant domain gap. Therefore, this highlights a critical insight for operational forestry: while geometry-enhanced features successfully capture invariant macro-structures for broad functional grouping, local fine-tuning on target datasets remains an essential step for adapting to local morphological shifts and achieving high precision in granular species identification tasks.
4.4. Implications for Forestry Remote Sensing Applications
The observed performance gains have important implications for practical forestry remote sensing. They are especially relevant in cases where fine-scale structural information is needed to accurately distinguish tree species. The ability to accurately classify individual trees from point cloud data directly supports important forestry tasks. These tasks include individual tree detection, forest inventory, and integration of multi-source LiDAR data.
For analyses of individual trees, precise species classification is essential. This is a basic requirement for precision forestry. The improved Macro-F1 system shows better ability to identify non-dominant tree species. This ability is important in mixed-species and mixed-age forests, where a few species often have high ecological or economic value. This feature allows for more reliable species-level tree inventories. It also supports applications such as biomass estimation, growth modeling, and habitat assessment.
For forest resource inventory and assessment, this method works well with high-resolution point cloud data. These data can come from ground-based or near-ground platforms, such as TLS, MLS, and backpack-mounted LiDAR systems. Compared with traditional airborne LiDAR, these close-range sensing methods can capture more detailed canopy geometry and branch structure [2,10,35]. Moreover, considering the favorable efficiency-accuracy trade-off highlighted in Table 4, FA-CTNet is particularly well suited for resource-constrained edge computing devices, such as onboard processors for UAVs or mobile forestry backpacks, enabling real-time species identification. When used with deep learning models that include global context modeling and category-aware optimization, this data can greatly improve the accuracy of species-level forest mapping. This is especially true in structurally complex forest stands.
Furthermore, this method is robust to species-specific structural similarities. This shows it has important practical value for fusing multi-source LiDAR data. In operational forestry, point clouds from different platforms often vary in point density, sampling geometry, and noise characteristics. The model keeps stable performance even when data are downsampled. This shows it has strong potential to integrate different data sources. It can also help maintain consistent species classification across datasets collected at different spatial scales or times.
4.5. Limitations and Future Work
Despite the encouraging results, this approach has some limitations. These limitations also suggest important directions for future research.
First, the current model uses only geometric information from point clouds. It does not include spectral or radiometric features. While close-range LiDAR captures detailed structural characteristics, certain tree species exhibit highly similar crown and branching geometries, making them difficult to distinguish based on geometry alone. The absence of spectral cues limits the discriminative capacity in such cases, particularly for taxonomically related broadleaved species with comparable growth patterns.
As discussed in Section 1, occlusion and incomplete observations remain challenging. These issues are common in overlapping canopies and complex understory environments. Partial crowns and missing lower-branch structures can still introduce ambiguity even with global context modeling, especially when point clouds are acquired under complex understory or overlapping canopy conditions.
Third, extremely low-sample classes remain challenging. Although class-weighted loss and Focal Loss effectively mitigate class imbalance and contribute to the observed Macro-F1 improvements, they also lead to relatively higher loss values during training and may introduce optimization instability. For species with very limited training samples, classification performance can still fluctuate, indicating that loss reweighting alone is insufficient to fully address data scarcity.
Looking forward, several research directions could further enhance the robustness and applicability of the model. Multi-modal learning combines geometric features with spectral information from hyperspectral or RGB data. This approach is a promising way to improve species separability. Additionally, cross-region generalization needs systematic study. Forest structure, species composition, and data acquisition conditions can vary greatly across geographic regions. Domain adaptation and self-supervised pretraining strategies may help alleviate this issue.
Finally, while the current study primarily focuses on the interpretable geometric modeling of point clouds within specific computational constraints, the rapid evolution of foundational deep learning models presents new opportunities. Future work will explore the exhaustive hyperparameter optimization and adaptation of massive modern architectures (e.g., PointNeXt or State-Space Models) for large-scale, complex forestry applications under expanded computational budgets.
5. Conclusions
This study proposes FA-CTNet, a geometry-enhanced Transformer. It effectively addresses the structural complexity and severe class imbalance in forest point clouds. Our model achieves highly competitive performance, significantly outperforming several representative baselines on the ForSpecial20K dataset. This validates the necessity of explicitly incorporating biologically meaningful priors. Detailed analyses reveal the key drivers of this success. The dimension-decoupled Manhattan distance provides a superior spatial encoding. Additionally, macro-morphological features (such as growth direction and vertical distribution ratio) effectively filter out local point noise. Together, these elements are crucial for fine-grained species discrimination. Furthermore, cross-dataset evaluations indicate that while fine-grained species transferability remains challenging, the model maintains robust morphological coherence at the broad-class functional group level in unseen zero-shot scenarios. It demonstrates promising potential in mitigating domain shifts caused by different LiDAR scanning environments. Overall, combining high-resolution LiDAR with deep geometric learning shows immense practical potential. Our approach offers a scalable and robust solution for tree-level inventory, complex species mapping, and multi-source data integration.
Author Contributions
S.S. devised the project, wrote the programs, drafted the initial manuscript and contributed to the data analysis and accuracy assessment; Q.L. contributed to the baseline experiments, cross-dataset quantitative analysis, and critical manuscript revisions; Y.Z. and T.Y. contributed to overall guidance and polishing. All authors have read and agreed to the published version of the manuscript.
Funding
This research was funded by the National Natural Science Foundation of China, grant numbers 32371876 and 32271877; the Natural Science Foundation of Jiangsu Province, grant number BK20221337; the Open Project Program of Rubber Research Institute, Chinese Academy of Tropical Agricultural Sciences, grant number RRI-KLOF202502; and the Innovation and Entrepreneurship Training Project for Undergraduates in Jiangsu Province (202410298062Z).
Data Availability Statement
Publicly available datasets were analyzed in this study. The ForSpecial20K dataset can be found here: https://zenodo.org/records/13255198 (accessed on 15 October 2025). The BioDiv-3DTrees dataset analyzed in the cross-dataset evaluation can be found here: https://data.goettingen-research-online.de/dataset.xhtml?persistentId=doi:10.25625/8PB1IF (accessed on 1 April 2025).
Acknowledgments
The authors would like to thank the National Natural Science Foundation of China (32371876, 32271877), Natural Science Foundation of Jiangsu Province (BK20221337), Open Project Program of Rubber Research Institute, Chinese Academy of Tropical Agricultural Sciences (No. RRI-KLOF202502) and the Innovation and Entrepreneurship Training Project for Undergraduates in Jiangsu Province (202410298062Z) for support. In additional, we thank Stefano Puliti et al. for releasing the ForSpecial20K dataset and thank to Denning Lu et al. for providing the model reference in their paper. During the preparation of this work authors used DeepL 26.3.1 for initial translation and used ChatGPT 5.3 and Gemini 3 Flash to improve language. After using these tools, the authors reviewed and edited the content as needed and take full responsibility for the content of the publication.
Conflicts of Interest
The authors declare no conflicts of interest.
References
- Lu, D.; Xie, Q.; Xu, L.; Li, J. 3DCTN: 3D Convolution-Transformer Network for Point Cloud Classification. IEEE Trans. Intell. Transp. Syst. 2022, 23, 24854–24865. [Google Scholar] [CrossRef] [Scilit]
- Maeda, E.E.; Brede, B.; Calders, K.; Disney, M.; Herold, M.; Lines, E.R.; Nunes, M.H.; Raumonen, P.; Rautiainen, M.; Saarinen, N.; et al. Expanding Forest Research with Terrestrial LiDAR Technology. Nat. Commun. 2025, 16, 8853. [Google Scholar] [CrossRef] [Scilit] [PubMed]
- McGaughey, R.J.; Kruper, A.; Bobsin, C.R.; Bormann, B.T. Tree Species Classification Based on Upper Crown Morphology Captured by Uncrewed Aircraft System Lidar Data. Remote Sens. 2024, 16, 603. [Google Scholar] [CrossRef] [Scilit]
- Marinelli, D.; Paris, C.; Bruzzone, L. An Approach Based on Deep Learning for Tree Species Classification in LiDAR Data Acquired in Mixed Forest. IEEE Geosci. Remote Sens. Lett. 2022, 19, 7004305. [Google Scholar] [CrossRef] [Scilit]
- Puliti, S.; Lines, E.R.; Müllerová, J.; Frey, J.; Schindler, Z.; Straker, A.; Allen, M.J.; Winiwarter, L.; Rehush, N.; Hristova, H.; et al. Benchmarking Tree Species Classification from Proximally-Sensed Laser Scanning Data: Introducing the FOR-species20K Dataset. Methods Ecol. Evol. 2025, 16, 801–818. [Google Scholar] [CrossRef] [Scilit]
- Laino, D.; Cabo, C.; Ordóñez, C.; Bolanos, R.; Janvier, R.; Giulioni, F.; Herrmann, M.; Hudak, A.; Parsons, R.; Santin, C. SegmentedForests: A Labelled Dataset of Terrestrial LiDAR Point Clouds for Semantic Segmentation of Forests. For. Int. J. For. Res. 2025, 99, cpaf062. [Google Scholar] [CrossRef] [Scilit]
- Cheng, D.; Ojeda, F.C.; Prabhu, A.; Liu, X.; Zhu, A.; Green, P.C.; Ehsani, R.; Chaudhari, P.; Kumar, V. TreeScope: An Agricultural Robotics Dataset for LiDAR-Based Mapping of Trees in Forests and Orchards. In Proceedings of the 2024 IEEE International Conference on Robotics and Automation (ICRA); IEEE: Piscataway, NJ, USA, 2024; pp. 14860–14866. [Google Scholar]
- Zhang, H.; Liu, B.; Yang, B.; Guo, J.; Hu, Z.; Zhang, M.; Yang, Z.; Zhang, J. Efficient Tree Species Classification Using Machine and Deep Learning Algorithms Based on UAV-LiDAR Data in North China. Front. For. Glob. Change 2025, 8, 1431603. [Google Scholar] [CrossRef] [Scilit]
- Zheng, Z.; Zeng, Y.; Schneider, F.D.; Zhao, Y.; Zhao, D.; Schmid, B.; Schaepman, M.E.; Morsdorf, F. Mapping Functional Diversity Using Individual Tree-Based Morphological and Physiological Traits in a Subtropical Forest. Remote Sens. Environ. 2021, 252, 112170. [Google Scholar] [CrossRef] [Scilit]
- Terryn, L.; Calders, K.; Disney, M.; Origo, N.; Malhi, Y.; Newnham, G.; Raumonen, P.; Å Kerblom, M.; Verbeeck, H. Tree Species Classification Using Structural Features Derived from Terrestrial Laser Scanning. ISPRS J. Photogramm. Remote Sens. 2020, 168, 170–181. [Google Scholar] [CrossRef] [Scilit]
- Qi, C.R.; Su, H.; Mo, K.; Guibas, L.J. PointNet: Deep Learning on Point Sets for 3D Classification and Segmentation. In Proceedings of the IEEE Conference on Computer Vision and Pattern Recognition; IEEE: Piscataway, NJ, USA, 2017; pp. 652–660. [Google Scholar]
- Qi, C.R.; Yi, L.; Su, H.; Guibas, L.J. PointNet++: Deep Hierarchical Feature Learning on Point Sets in a Metric Space. Adv. Neural Inf. Process. Syst. 2017, 30, 5105–5114. [Google Scholar]
- Li, Y.; Bu, R.; Sun, M.; Wu, W.; Di, X.; Chen, B. PointCNN: Convolution On X-Transformed Points. Adv. Neural Inf. Process. Syst. 2018, 31, 828–838. [Google Scholar]
- Wang, Y.; Sun, Y.; Liu, Z.; Sarma, S.E.; Bronstein, M.M.; Solomon, J.M. Dynamic Graph CNN for Learning on Point Clouds. ACM Trans. Graph. 2019, 38, 146. [Google Scholar] [CrossRef] [Scilit]
- Zheng, Q.; Zhang, C.; Sun, J. PointMT: Efficient Point Cloud Analysis with Hybrid MLP-Transformer Architecture. IEEE Trans. Multimed. 2025, 27, 6382–6396. [Google Scholar] [CrossRef] [Scilit]
- Fan, Z.; Wei, J.; Zhang, R.; Zhang, W. Tree Species Classification Based on PointNet++ and Airborne Laser Survey Point Cloud Data Enhancement. Forests 2023, 14, 1246. [Google Scholar] [CrossRef] [Scilit]
- Zhang, Y.; Feng, W.; Quan, Y.; Ye, G.; Dauphin, G. Dynamic Spatial–Spectral Feature Optimization-Based Point Cloud Classification. Remote Sens. 2024, 16, 575. [Google Scholar] [CrossRef] [Scilit]
- Chen, J.; Chen, Y.; Liu, Z. Classification of Typical Tree Species in Laser Point Cloud Based on Deep Learning. Remote Sens. 2021, 13, 4750. [Google Scholar] [CrossRef] [Scilit]
- Vaswani, A.; Shazeer, N.; Parmar, N.; Uszkoreit, J.; Jones, L.; Gomez, A.N.; Kaiser, L.; Polosukhin, I. Attention Is All You Need. Adv. Neural Inf. Process. Syst. 2017, 30, 6000–6010. [Google Scholar]
- Han, K.; Wang, Y.; Chen, H.; Chen, X.; Guo, J.; Liu, Z.; Tang, Y.; Xiao, A.; Xu, C.; Xu, Y.; et al. A Survey on Vision Transformer. IEEE Trans. Pattern Anal. Mach. Intell. 2023, 45, 87–110. [Google Scholar] [CrossRef] [Scilit] [PubMed]
- Zhao, H.; Jiang, L.; Jia, J.; Torr, P.; Koltun, V. Point Transformer. In Proceedings of the IEEE/CVF International Conference on Computer Vision; IEEE: Piscataway, NJ, USA, 2021; pp. 16259–16268. [Google Scholar]
- Guo, M.-H.; Cai, J.-X.; Liu, Z.-N.; Mu, T.-J.; Martin, R.R.; Hu, S.-M. PCT: Point Cloud Transformer. Comput. Vis. Media 2021, 7, 187–199. [Google Scholar] [CrossRef] [Scilit]
- Han, X.; Tang, Y.; Wang, Z.; Li, X. Mamba3D: Enhancing Local Features for 3D Point Cloud Analysis via State Space Model. In Proceedings of the 32nd ACM International Conference on Multimedia, Melbourne, VIC, Australia, 28 October 2024; ACM: New York, NY, USA, 2024; pp. 4995–5004. [Google Scholar]
- Bai, X.; Liang, D.; Tan, X.; Xu, W.; Ye, X.; Zhou, X.; Zhu, X.; Zou, Z. PointMamba: A Simple State Space Model for Point Cloud Analysis. In Proceedings of the Advances in Neural Information Processing Systems 37, Vancouver, BC, Canada, 10–15 December 2024; Neural Information Processing Systems Foundation, Inc. (NeurIPS): San Diego, CA, USA, 2024; pp. 32653–32677. [Google Scholar]
- Gu, A.; Dao, T. Mamba: Linear-Time Sequence Modeling with Selective State Spaces. In Proceedings of the COLM 2024, Philadelphia, PA, USA, 7–9 October 2024. [Google Scholar]
- Chen, K.; Chen, B.; Liu, C.; Li, W.; Zou, Z.; Shi, Z. RSMamba: Remote Sensing Image Classification with State Space Model. IEEE Geosci. Remote Sens. Lett. 2024, 21, 8002605. [Google Scholar] [CrossRef] [Scilit]
- Xu, X.; Wang, J.; Zhu, Q.; Zhou, P.; Geng, G.; Li, K.; Su, L.; Cao, X. EIDU-Net: Edge-Preserved Inception DenseGCN U-Net for LiDAR Point Cloud Segmentation. Sci. Rep. 2024, 14, 24620. [Google Scholar] [CrossRef] [Scilit]
- Qu, X.; Qin, K.; Li, Y.; Zhang, S.; Li, Y.; Shen, S.; Gao, Y. Semantic-Enhanced and Temporally Refined Bidirectional BEV Fusion for LiDAR–Camera 3D Object Detection. J. Imaging 2025, 11, 319. [Google Scholar] [CrossRef] [Scilit] [PubMed]
- Li, X.; Tan, X.; Zhang, Z.; Xie, Y.; Ma, L. Point Mask Transformer for Outdoor Point Cloud Semantic Segmentation. Comput. Vis. Media 2025, 11, 497–511. [Google Scholar] [CrossRef] [Scilit]
- Zheng, Q.; Zhang, C.; Sun, J. PMT-MAE: Dual-Branch Self-Supervised Learning with Distillation for Efficient Point Cloud Classification. arXiv 2024, arXiv:2409.02007. [Google Scholar]
- Yang, J.; Wen, X.; Wang, Q.; Ye, J.-S.; Zhang, Y.; Sun, Y. A Novel Algorithm Based on Geometric Characteristics for Tree Branch Skeleton Extraction from LiDAR Point Cloud. Forests 2022, 13, 1534. [Google Scholar] [CrossRef] [Scilit]
- Zhang, W.; Peng, X.; Cui, G.; Wang, H.; Takata, D.; Guo, W. Tree Branch Skeleton Extraction from Drone-Based Photogrammetric Point Cloud. Drones 2023, 7, 65. [Google Scholar] [CrossRef] [Scilit]
- Hui, Z.; Cai, Z.; Xu, P.; Xia, Y.; Cheng, P. Tree Species Classification Using Optimized Features Derived from Light Detection and Ranging Point Clouds Based on Fractal Geometry and Quantitative Structure Model. Forests 2023, 14, 1265. [Google Scholar] [CrossRef] [Scilit]
- Harikumar, A.; Bovolo, F.; Bruzzone, L. An Internal Crown Geometric Model for Conifer Species Classification with High-Density LiDAR Data. IEEE Trans. Geosci. Remote Sens. 2017, 55, 2924–2940. [Google Scholar] [CrossRef] [Scilit]
- Hartley, R.J.L.; Jayathunga, S.; Morgenroth, J.; Pearse, G.D. Tree Branch Characterisation from Point Clouds: A Comprehensive Review. Curr. For. Rep. 2024, 10, 360–385. [Google Scholar] [CrossRef] [Scilit]
- Li, X.; Zhou, X.; Xu, S. Three Dimensional Tree Modeling Based on the Skeleton Path Optimization and Geometrical Shapes. Int. J. Interact. Multimed. Artif. Intell. 2024, 9, 69–77. [Google Scholar] [CrossRef] [Scilit]
- Atik, M.E.; Duran, Z.; Seker, D.Z. Machine Learning-Based Supervised Classification of Point Clouds Using Multiscale Geometric Features. IJGI 2021, 10, 187. [Google Scholar] [CrossRef] [Scilit]
- Wang, W.; Fan, Y.; Li, Y.; Li, X.; Tang, S. An Individual Tree Segmentation Method From Mobile Mapping Point Clouds Based on Improved 3-D Morphological Analysis. IEEE J. Sel. Top. Appl. Earth Obs. Remote Sens. 2023, 16, 2777–2790. [Google Scholar] [CrossRef] [Scilit]
- Krishna Moorthy, S.M.; Calders, K.; Vicari, M.B.; Verbeeck, H. Improved Supervised Learning-Based Approach for Leaf and Wood Classification from LiDAR Point Clouds of Forests. IEEE Trans. Geosci. Remote Sens. 2020, 58, 3057–3070. [Google Scholar] [CrossRef] [Scilit]
- Xi, Z.; Hopkinson, C.; Rood, S.B.; Peddle, D.R. See the Forest and the Trees: Effective Machine and Deep Learning Algorithms for Wood Filtering and Tree Species Classification from Terrestrial Laser Scanning. ISPRS J. Photogramm. Remote Sens. 2020, 168, 1–16. [Google Scholar] [CrossRef] [Scilit]
- He, Y.; Liang, B.; Yang, J.; Li, S.; He, J. An Iterative Closest Points Algorithm for Registration of 3D Laser Scanner Point Clouds with Geometric Features. Sensors 2017, 17, 1862. [Google Scholar] [CrossRef] [Scilit]
- Lu, D.; Gao, K.; Xie, Q.; Xu, L.; Li, J. 3DGTN: 3D Dual-Attention GLocal Transformer Network for Point Cloud Classification and Segmentation. IEEE Trans. Geosci. Remote Sens. 2024, 62, 5704313. [Google Scholar] [CrossRef] [Scilit]
- Fei, B.; Yang, W.; Liu, L.; Luo, T.; Zhang, R.; Li, Y.; He, Y. Self-Supervised Learning for Pre-Training 3D Point Clouds: A Survey. arXiv 2023, arXiv:2305.04691. [Google Scholar] [CrossRef] [Scilit]
- Chen, G.; Wang, X.; Sun, Q.; Tang, Z.-Z. Multidimensional Scaling Improves Distance-Based Clustering for Microbiome Data. Bioinformatics 2025, 41, btaf042. [Google Scholar] [CrossRef] [Scilit]
- Jing, S.; Wang, H.; Lin, P.; Yuan, J.; Tang, Z.; Li, H. Quantifying and Interpreting Biologically Meaningful Spatial Signatures within Tumor Microenvironments. npj Precis. Onc. 2025, 9, 68. [Google Scholar] [CrossRef] [Scilit]
- Saito, A.; Kudeshia, P.; Poovvancheri, J. Point-JEPA: A Joint Embedding Predictive Architecture for Self-Supervised Learning on Point Cloud. In Proceedings of the 2025 IEEE/CVF Winter Conference on Applications of Computer Vision (WACV); IEEE: Piscataway, NJ, USA, 2025; pp. 7348–7357. [Google Scholar]
- Chen, S.; Fang, Z.; Wan, S.; Zhou, T.; Chen, C.; Wang, M.; Li, Q. Geometrically Aware Transformer for Point Cloud Analysis. Sci. Rep. 2025, 15, 16545. [Google Scholar] [CrossRef] [Scilit]
- Xu, H.; Huai, Y.; Nie, X.; Meng, Q.; Zhao, X.; Pei, X.; Lu, H. Diff-Tree: A Diffusion Model for Diversified Tree Point Cloud Generation with High Realism. Remote Sens. 2025, 17, 923. [Google Scholar] [CrossRef] [Scilit]
- Zhang, H.; Wang, C.; Tian, S.; Lu, B.; Zhang, L.; Ning, X.; Bai, X. Deep Learning-Based 3D Point Cloud Classification: A Systematic Survey and Outlook. Displays 2023, 79, 102456. [Google Scholar] [CrossRef] [Scilit]
- Muhammad, D.; Wang, L.; Hagenbuchner, M. Enhancing Robustness in Long-Tailed Image Classification with Angular Approaches and Balanced Learning. Data Sci. Eng. 2025, 10, 480–494. [Google Scholar] [CrossRef] [Scilit]
- Chen, P.; Liu, Y.; Ren, Y.; Zhang, B.; Zhao, Y. A Deep Learning-Based Solution to the Class Imbalance Problem in High-Resolution Land Cover Classification. Remote Sens. 2025, 17, 1845. [Google Scholar] [CrossRef] [Scilit]
- Jiang, F.; Xun, Y.; Cai, H.; Jin, G. Functional Traits Can Improve Our Understanding of Niche- and Dispersal-Based Processes. Oecologia 2018, 186, 783–792. [Google Scholar] [CrossRef] [Scilit]
- Hendy, A.; Ibrahim, R.K.; Abdelaliem, S.M.F.; Zaher, A.; Alkubati, S.A.; El-kader, R.G.A.; Hendy, A. Supervised Machine Learning for Classification and Prediction of Stunting among Under-Five Egyptian Children. BMC Pediatr. 2025, 25, 681. [Google Scholar] [CrossRef] [Scilit]
- Ma, Y.; Luan, P.; Zhang, Y.; Liu, B.; Zhang, L. Efficient Urban Tree Species Classification via Multirepresentation Fusion of Mobile Laser Scanning Data. IEEE J. Sel. Top. Appl. Earth Obs. Remote Sens. 2025, 18, 11451–11468. [Google Scholar] [CrossRef] [Scilit]
- Pedregosa, F.; Pedregosa, F.; Varoquaux, G.; Varoquaux, G.; Org, N.; Gramfort, A.; Gramfort, A.; Michel, V.; Michel, V.; Fr, L.; et al. Scikit-Learn: Machine Learning in Python. J. Mach. Learn. Res. 2011, 12, 2825–2830. [Google Scholar]
- Zhou, Q.-Y.; Park, J.; Koltun, V. Open3D: A Modern Library for 3D Data Processing. arXiv 2018, arXiv:1801.09847. [Google Scholar] [CrossRef] [Scilit]
- Qian, G.; Li, Y.; Peng, H.; Mai, J.; Hammoud, H.A.A.K.; Elhoseiny, M.; Ghanem, B. PointNeXt: Revisiting PointNet++ with Improved Training and Scaling Strategies. Adv. Neural Inf. Process. Syst. 2022, 35, 23192–23204. [Google Scholar] [CrossRef] [Scilit]
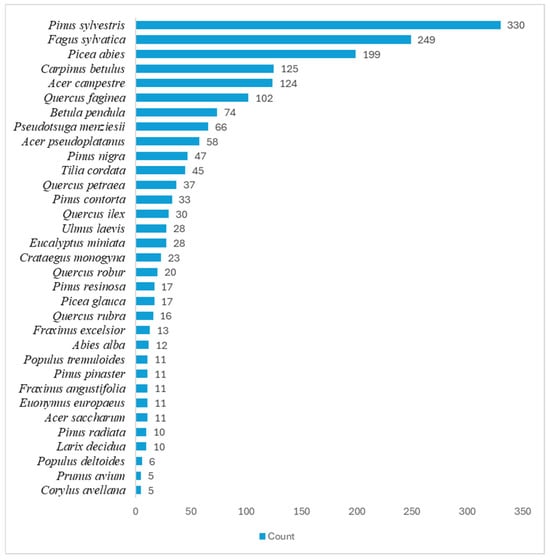
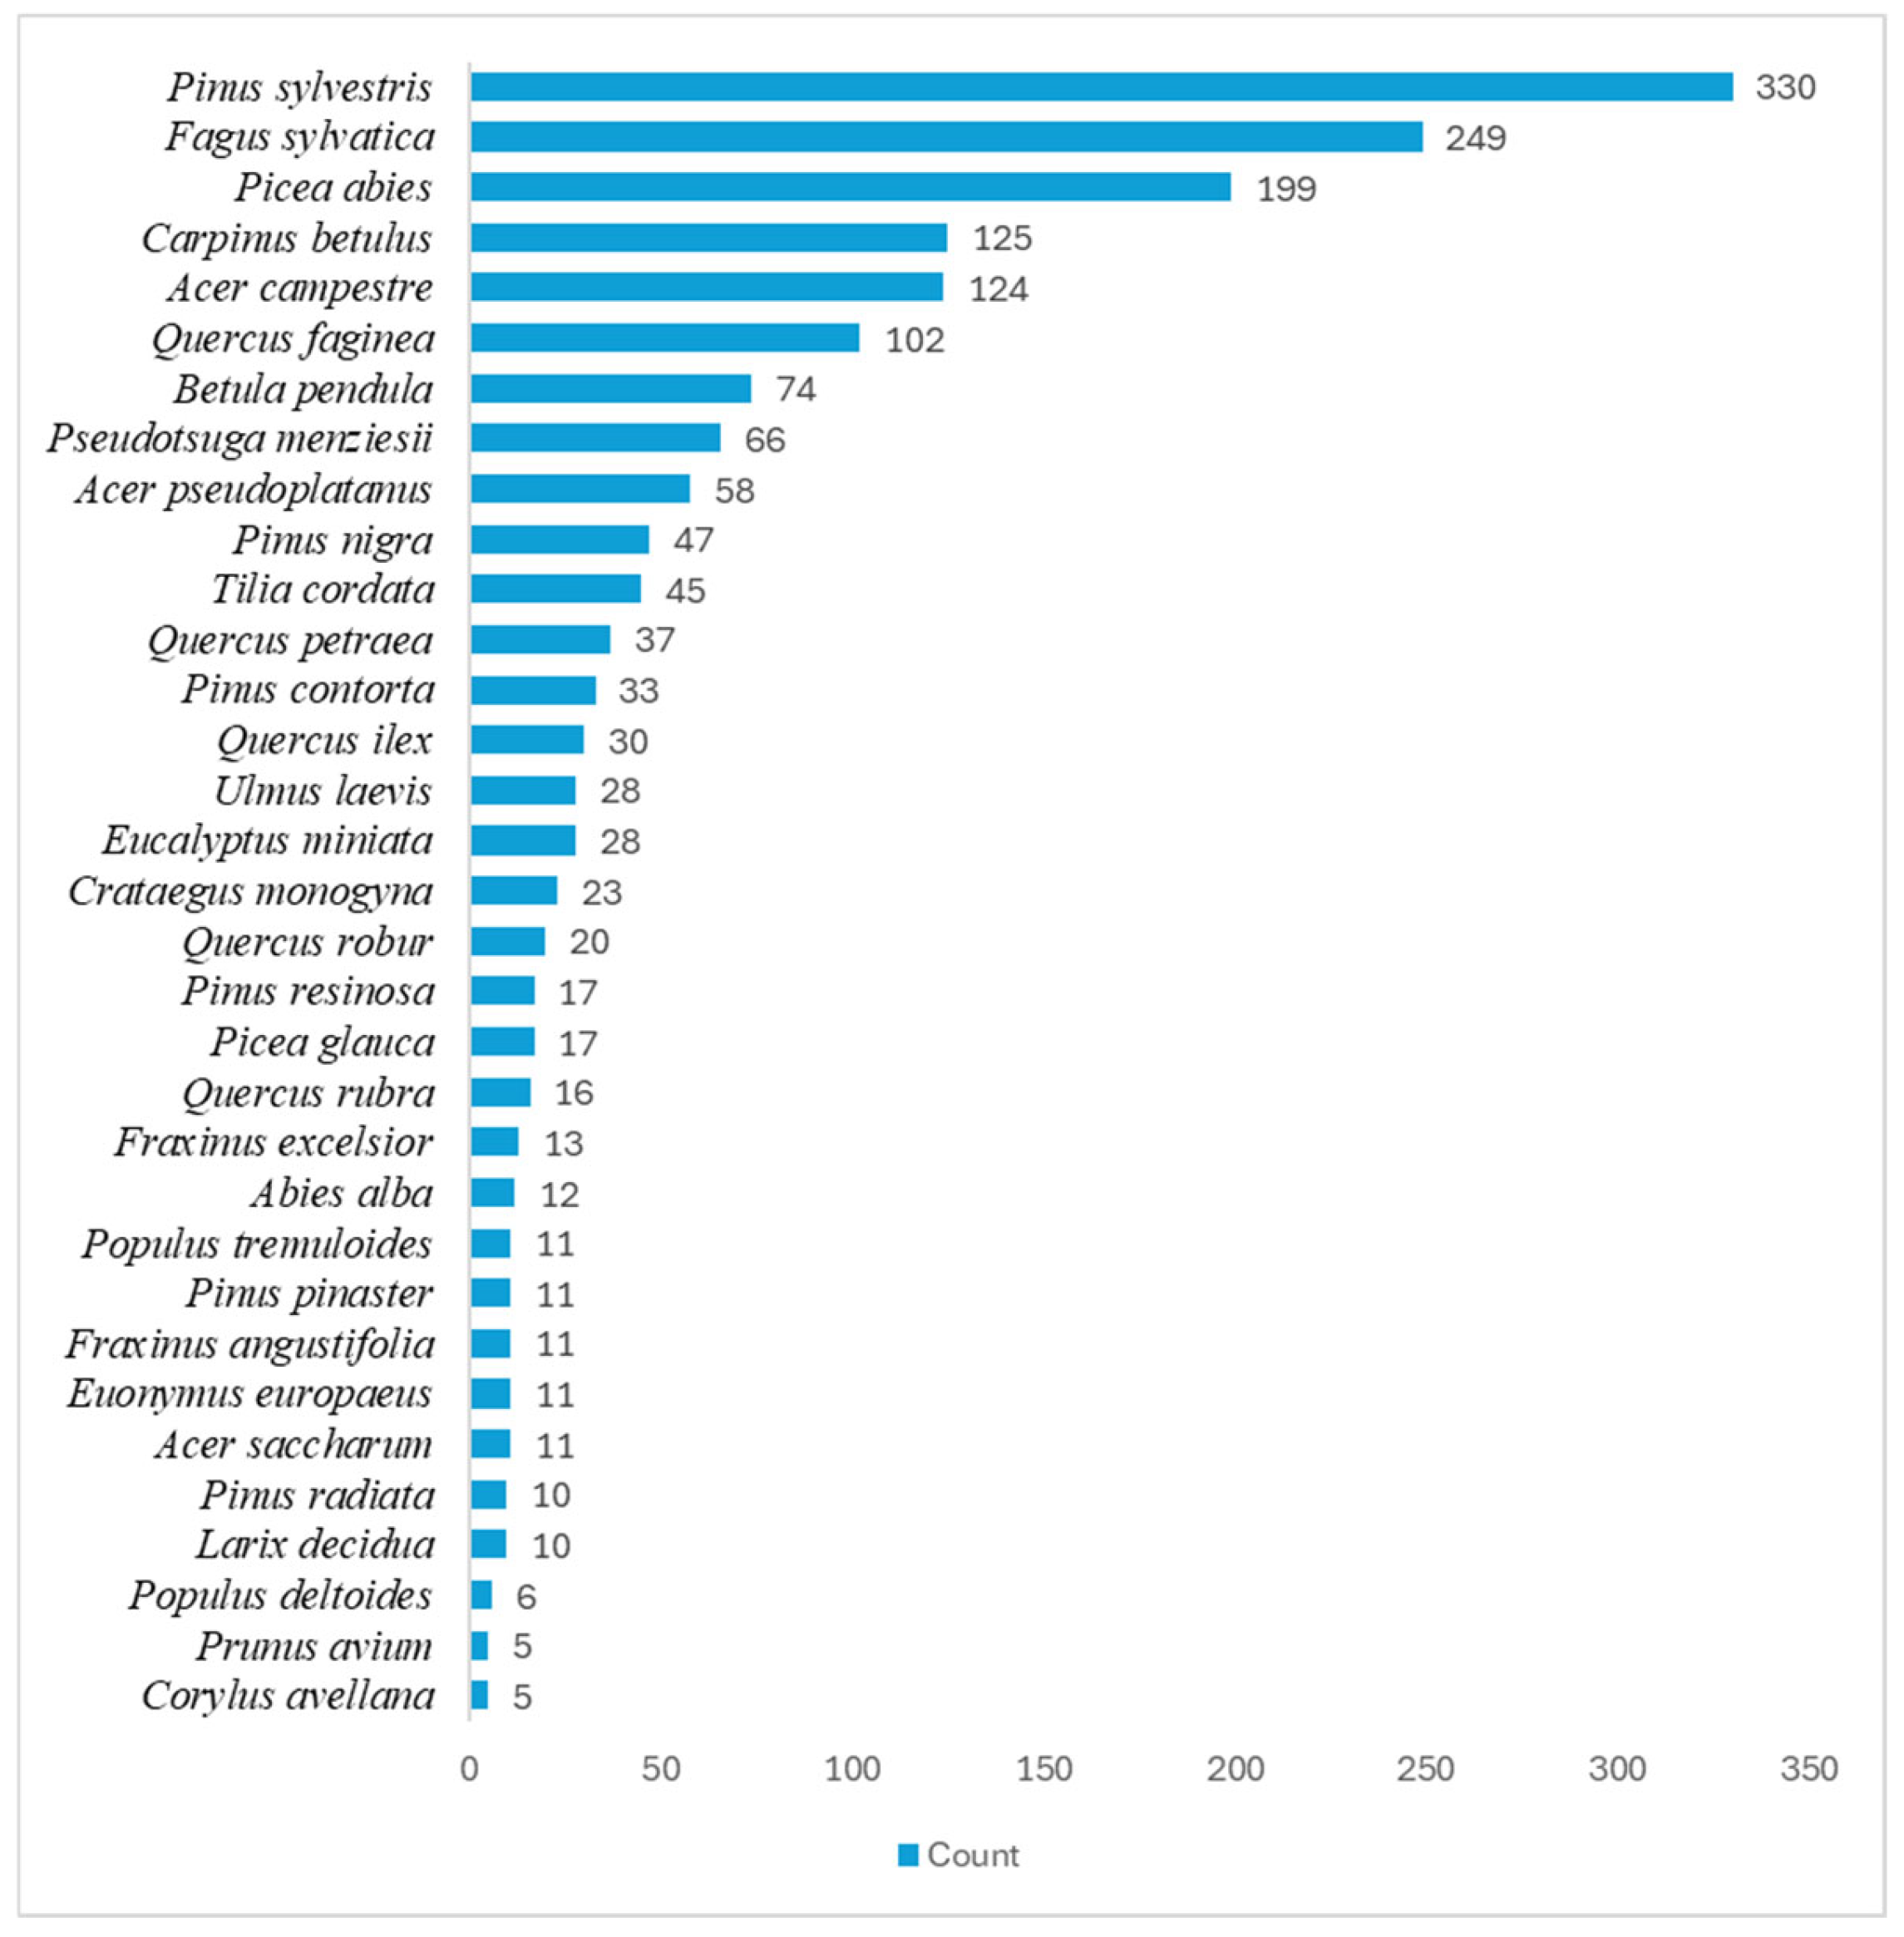
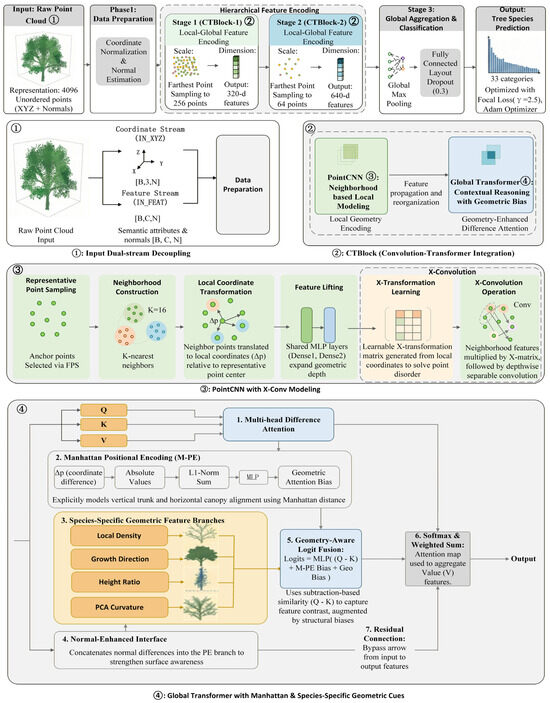
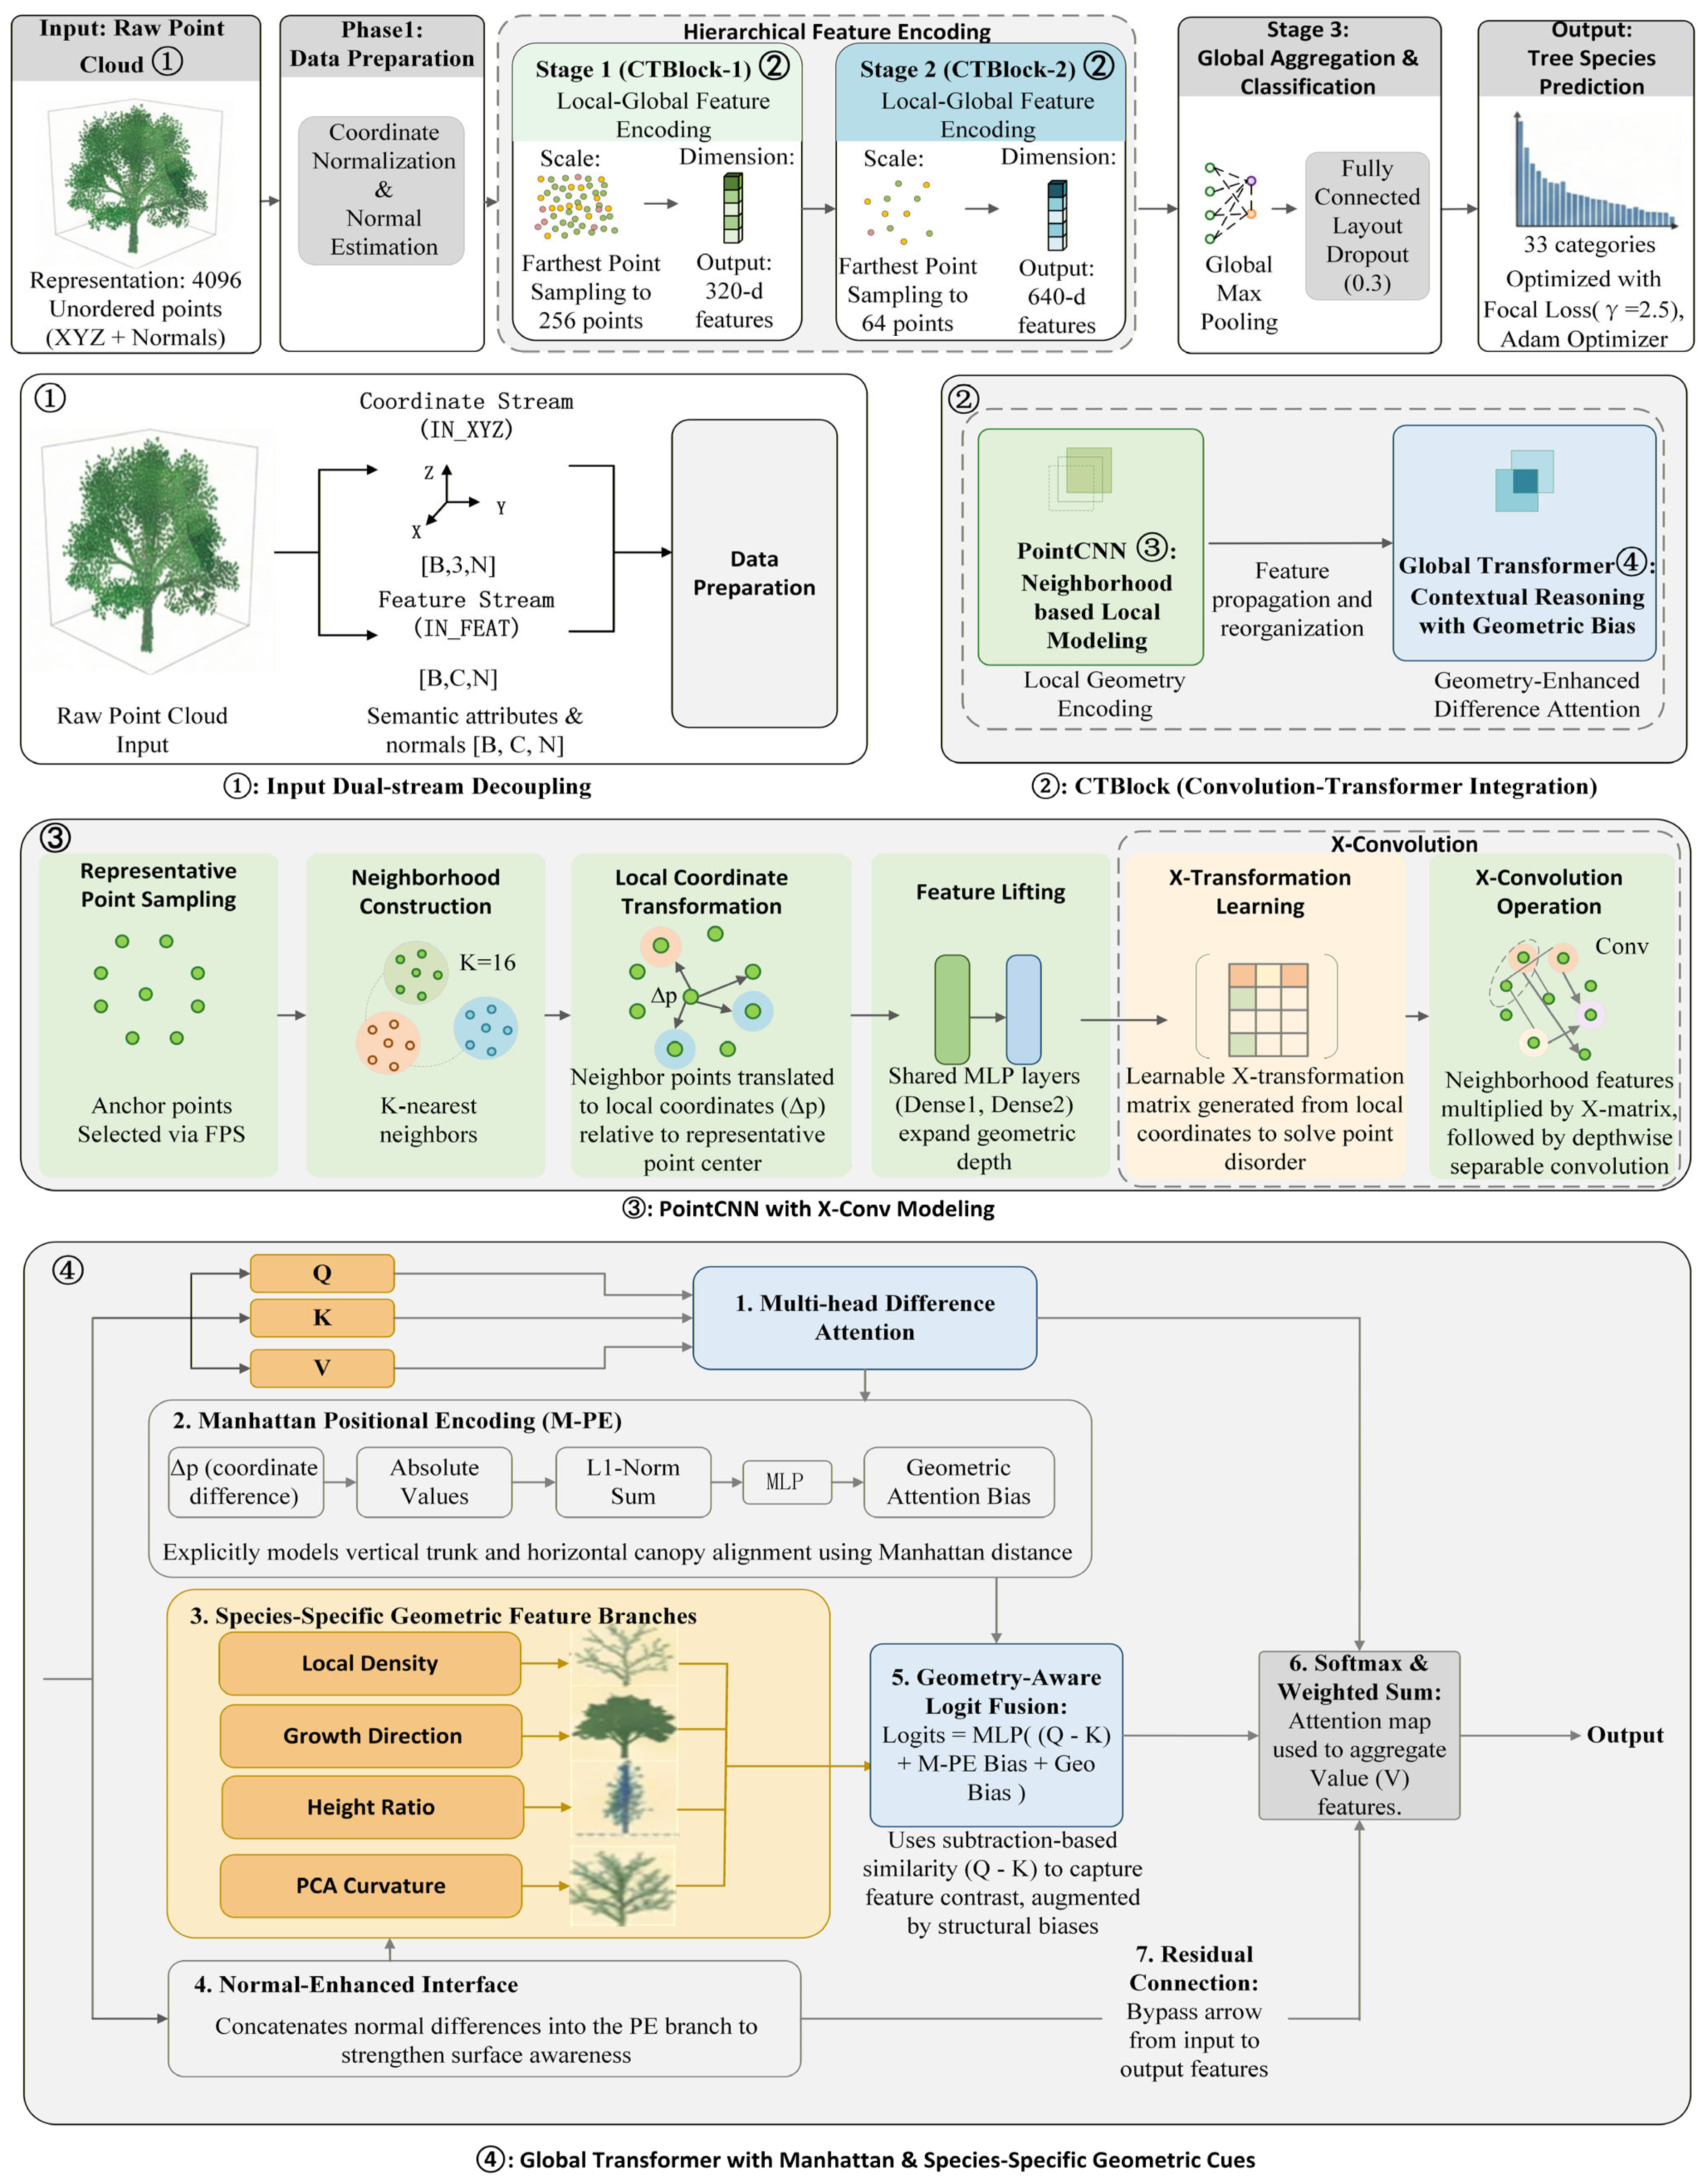
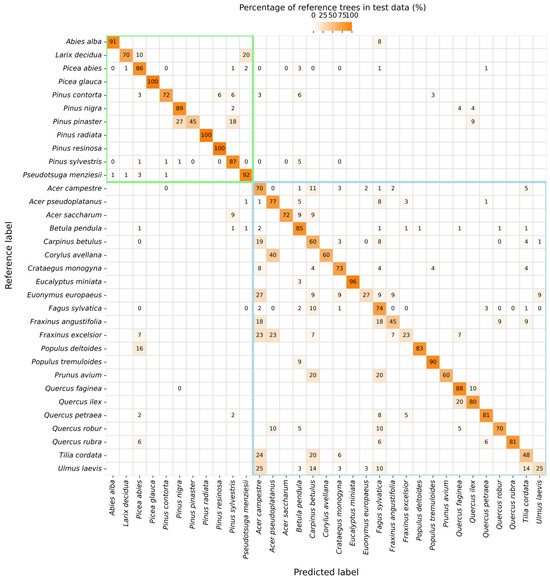
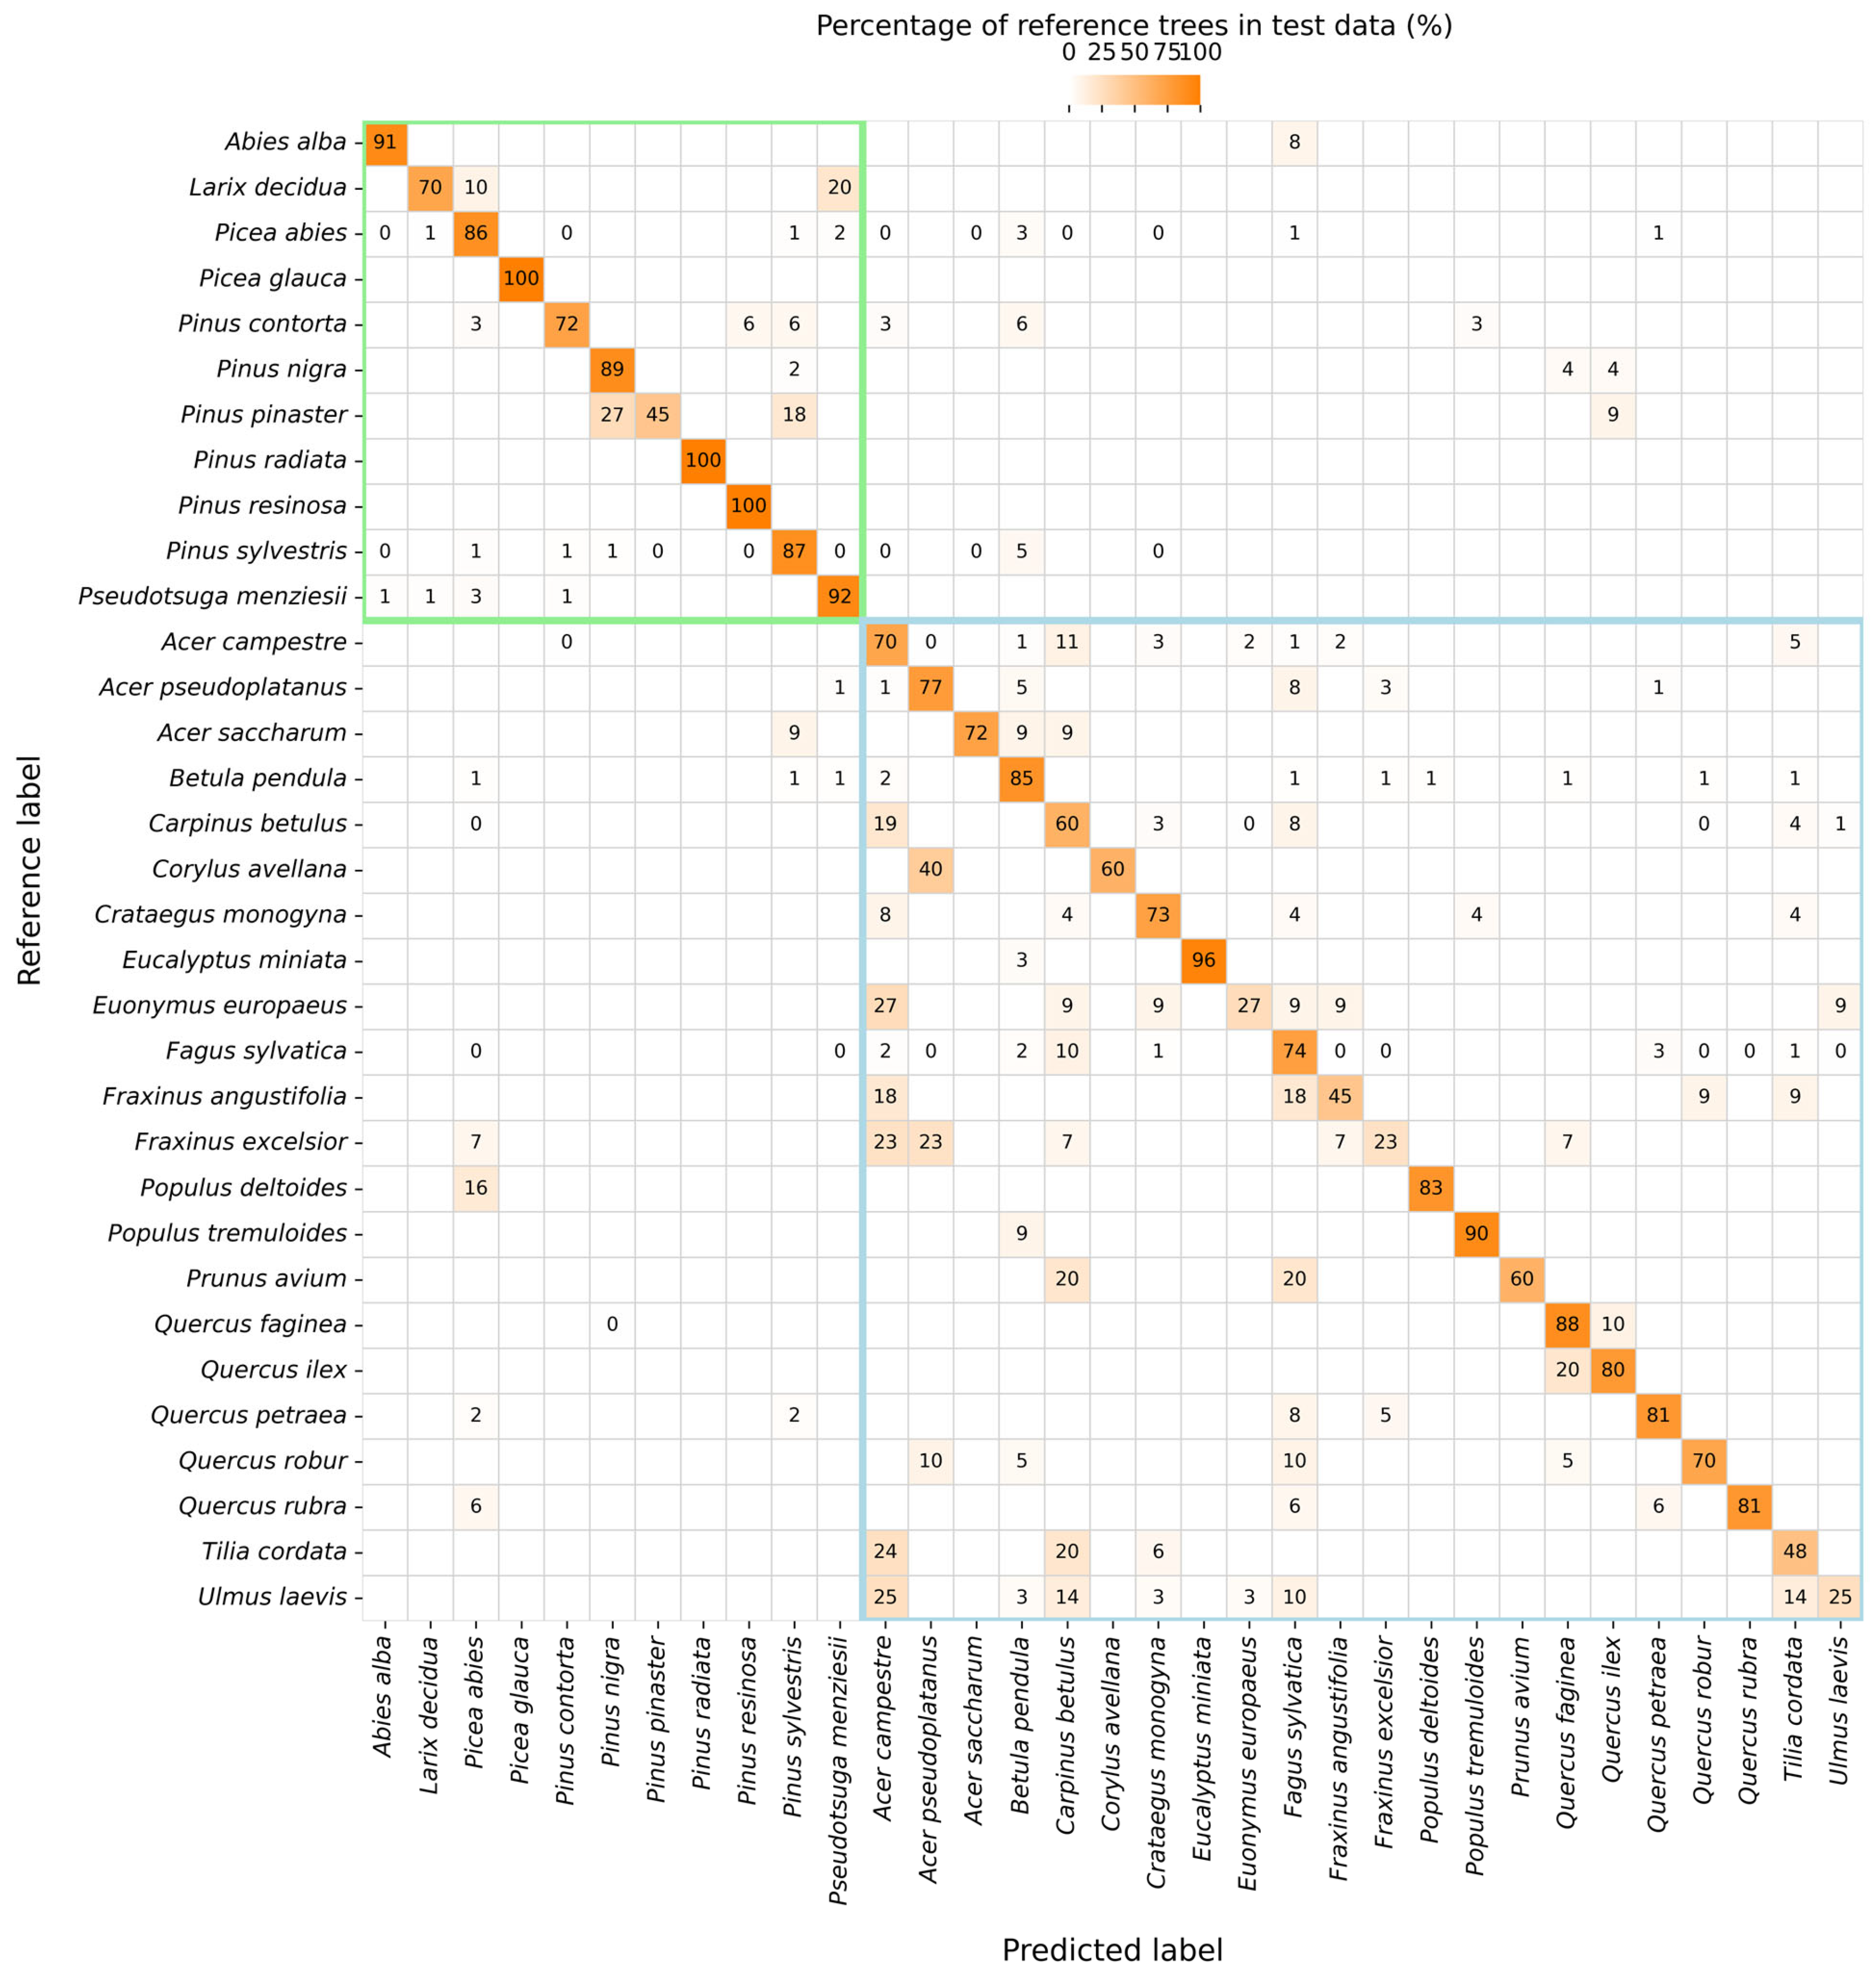
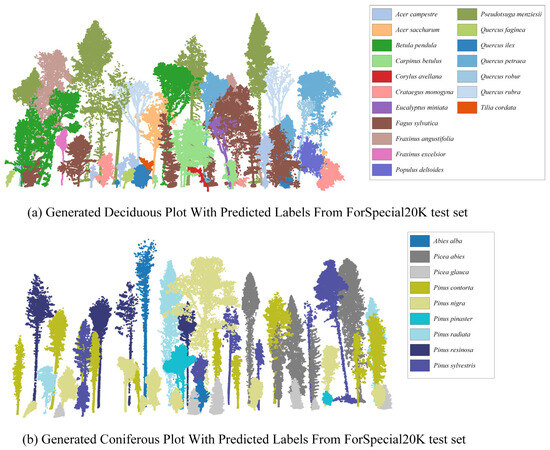
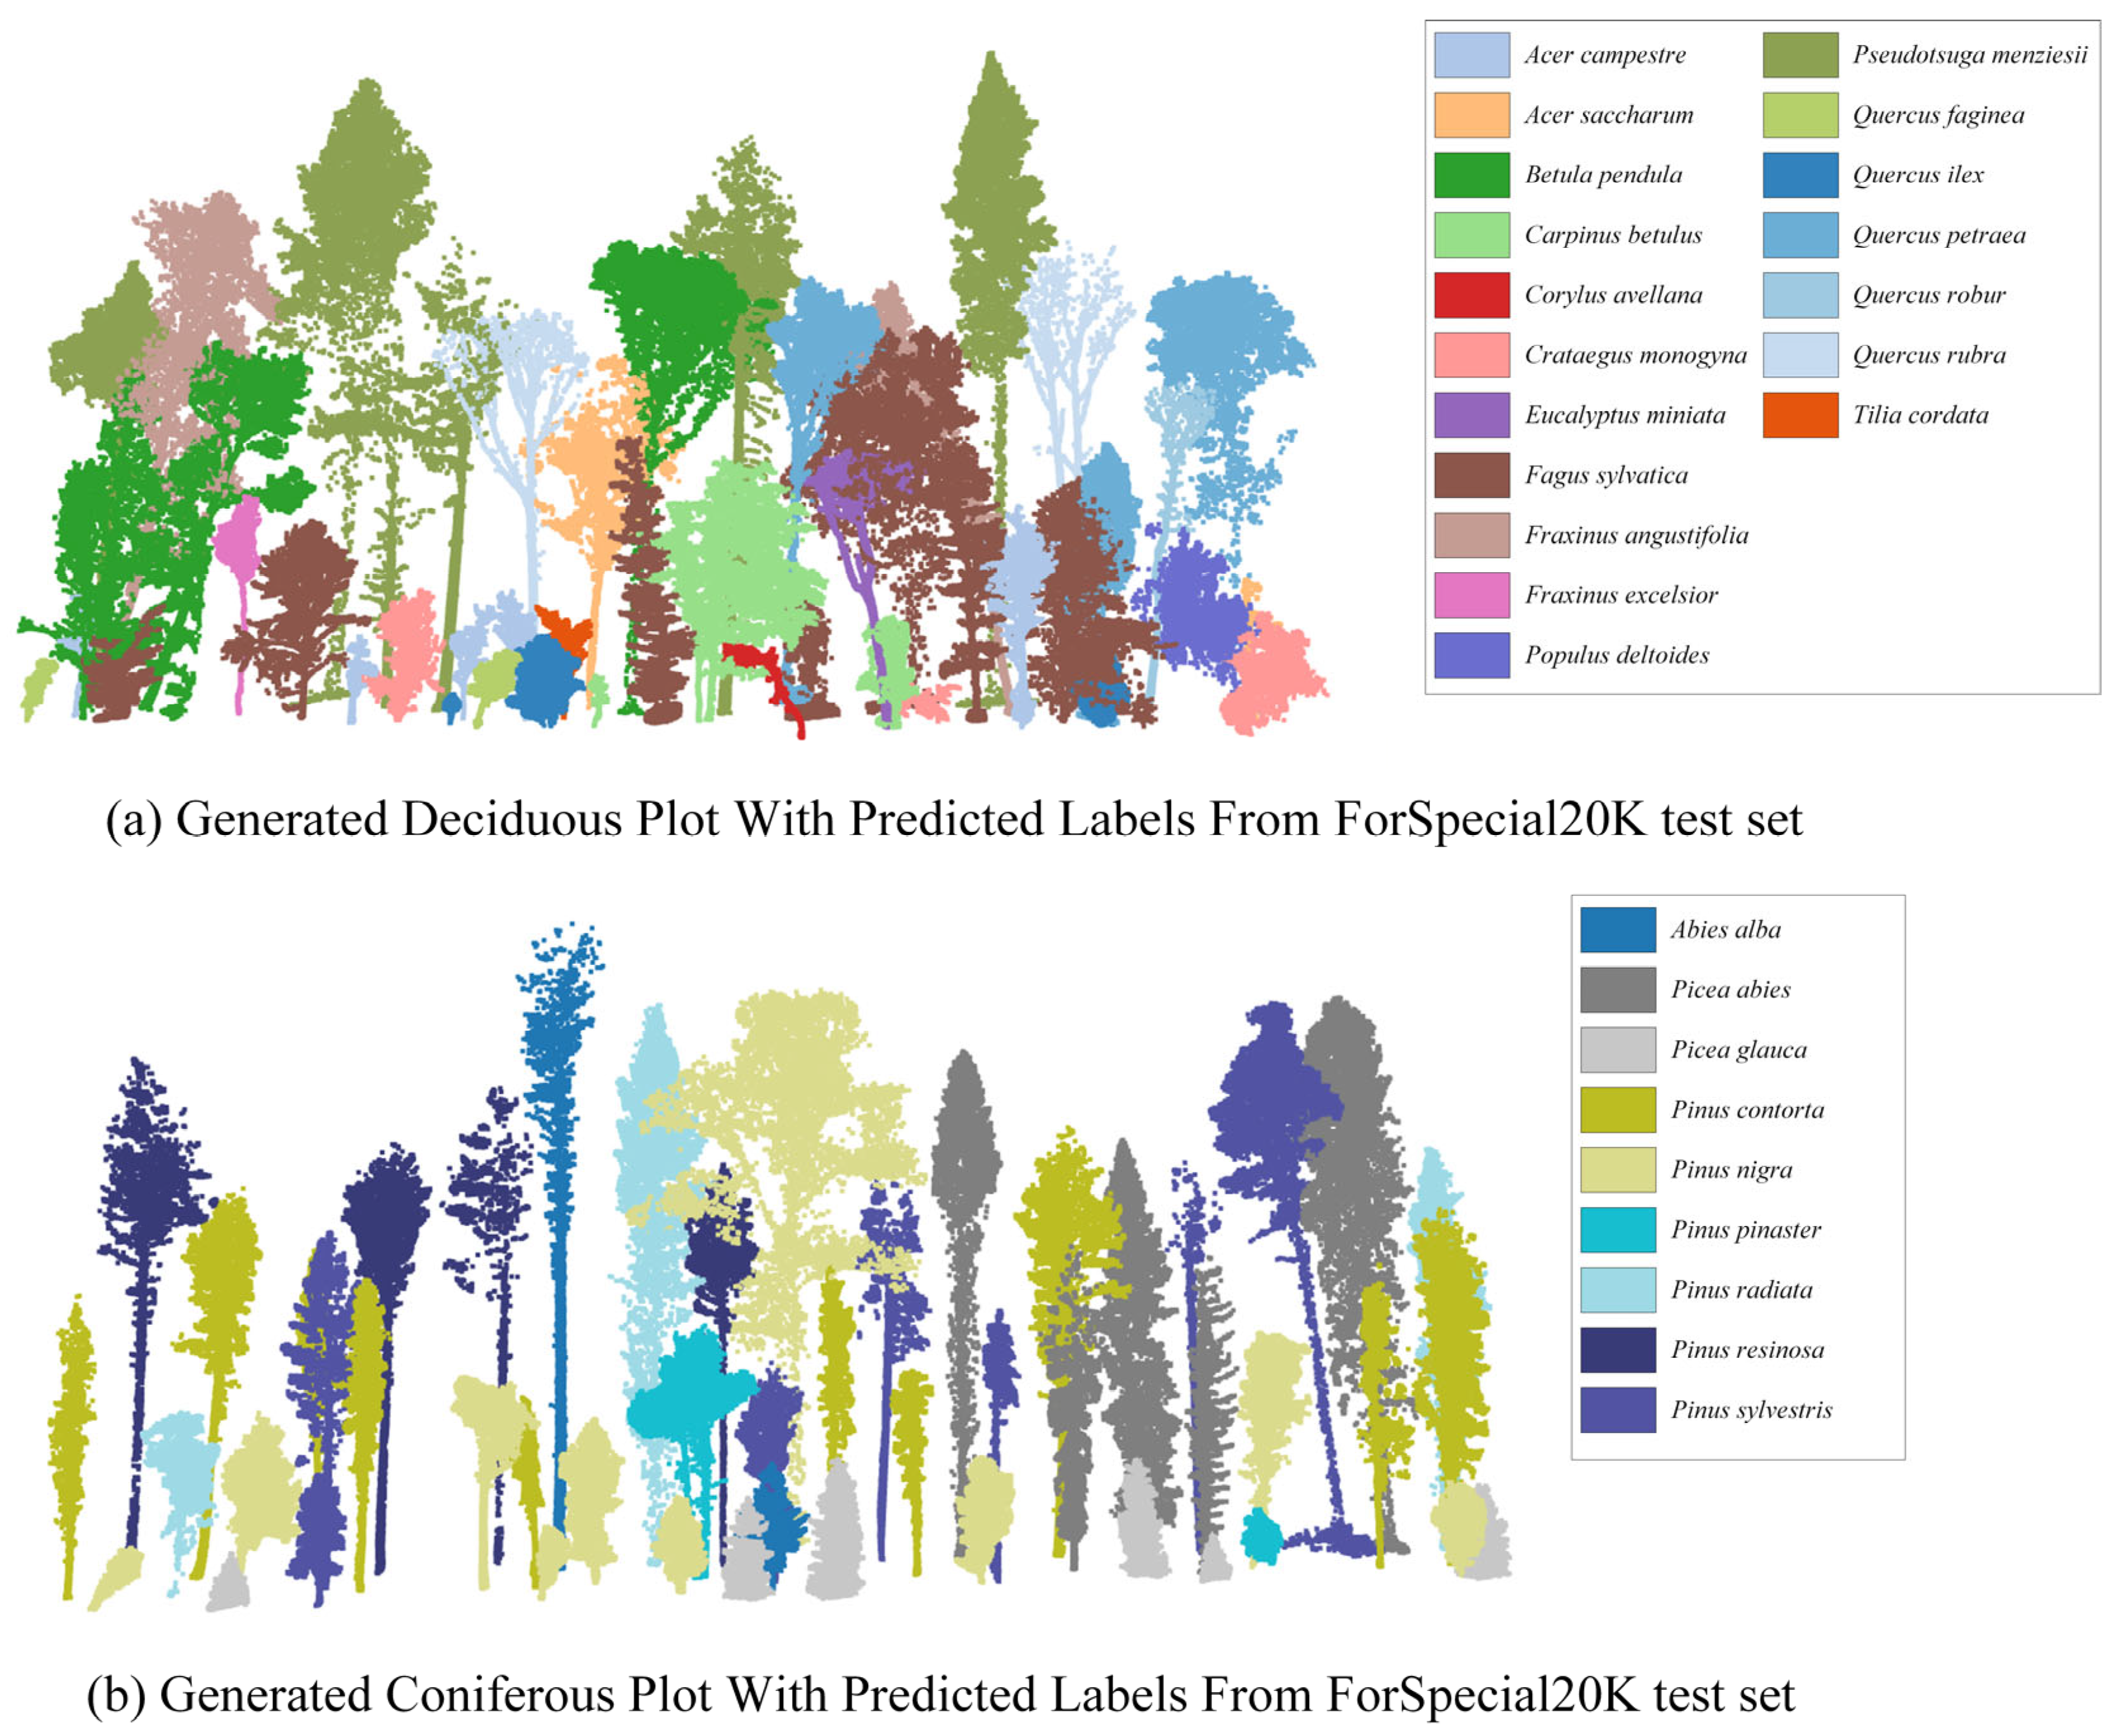
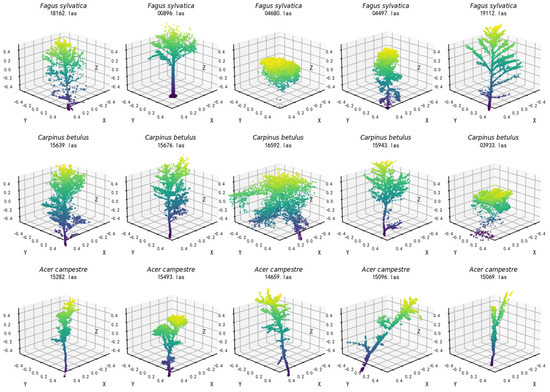
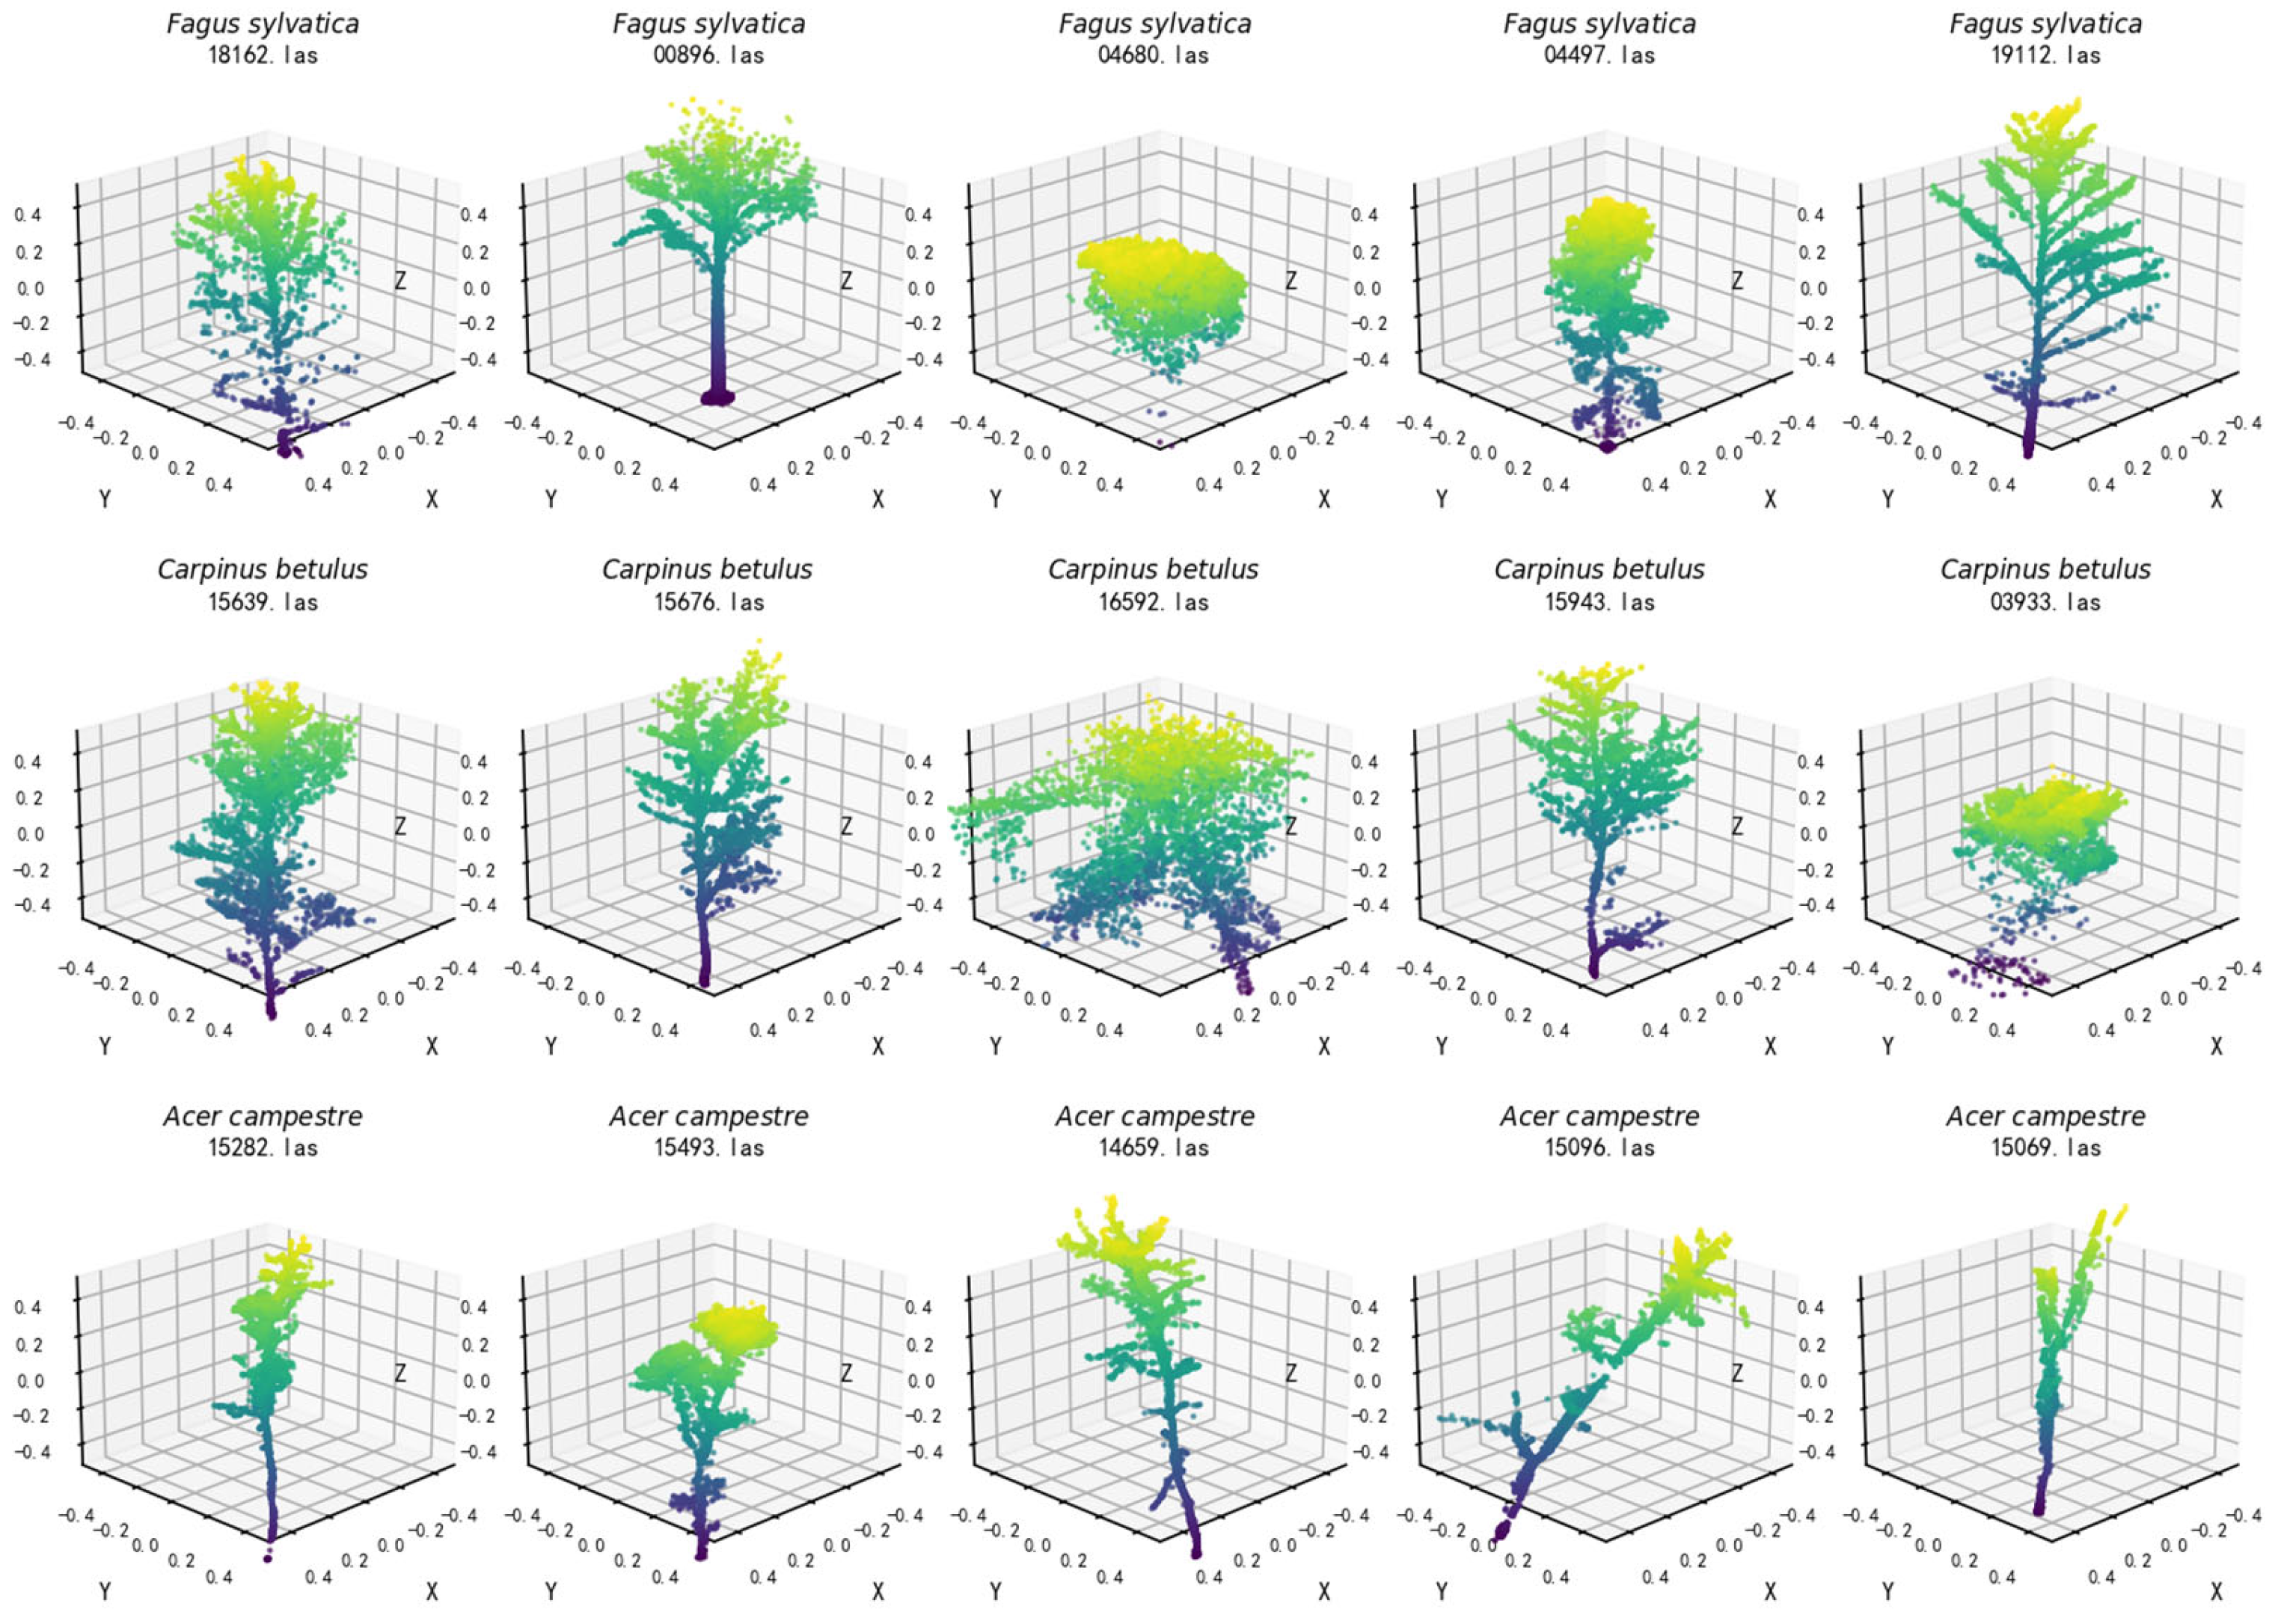
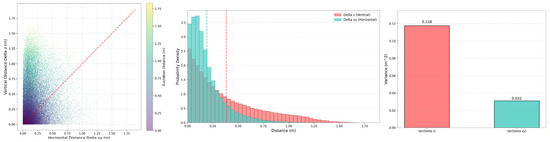
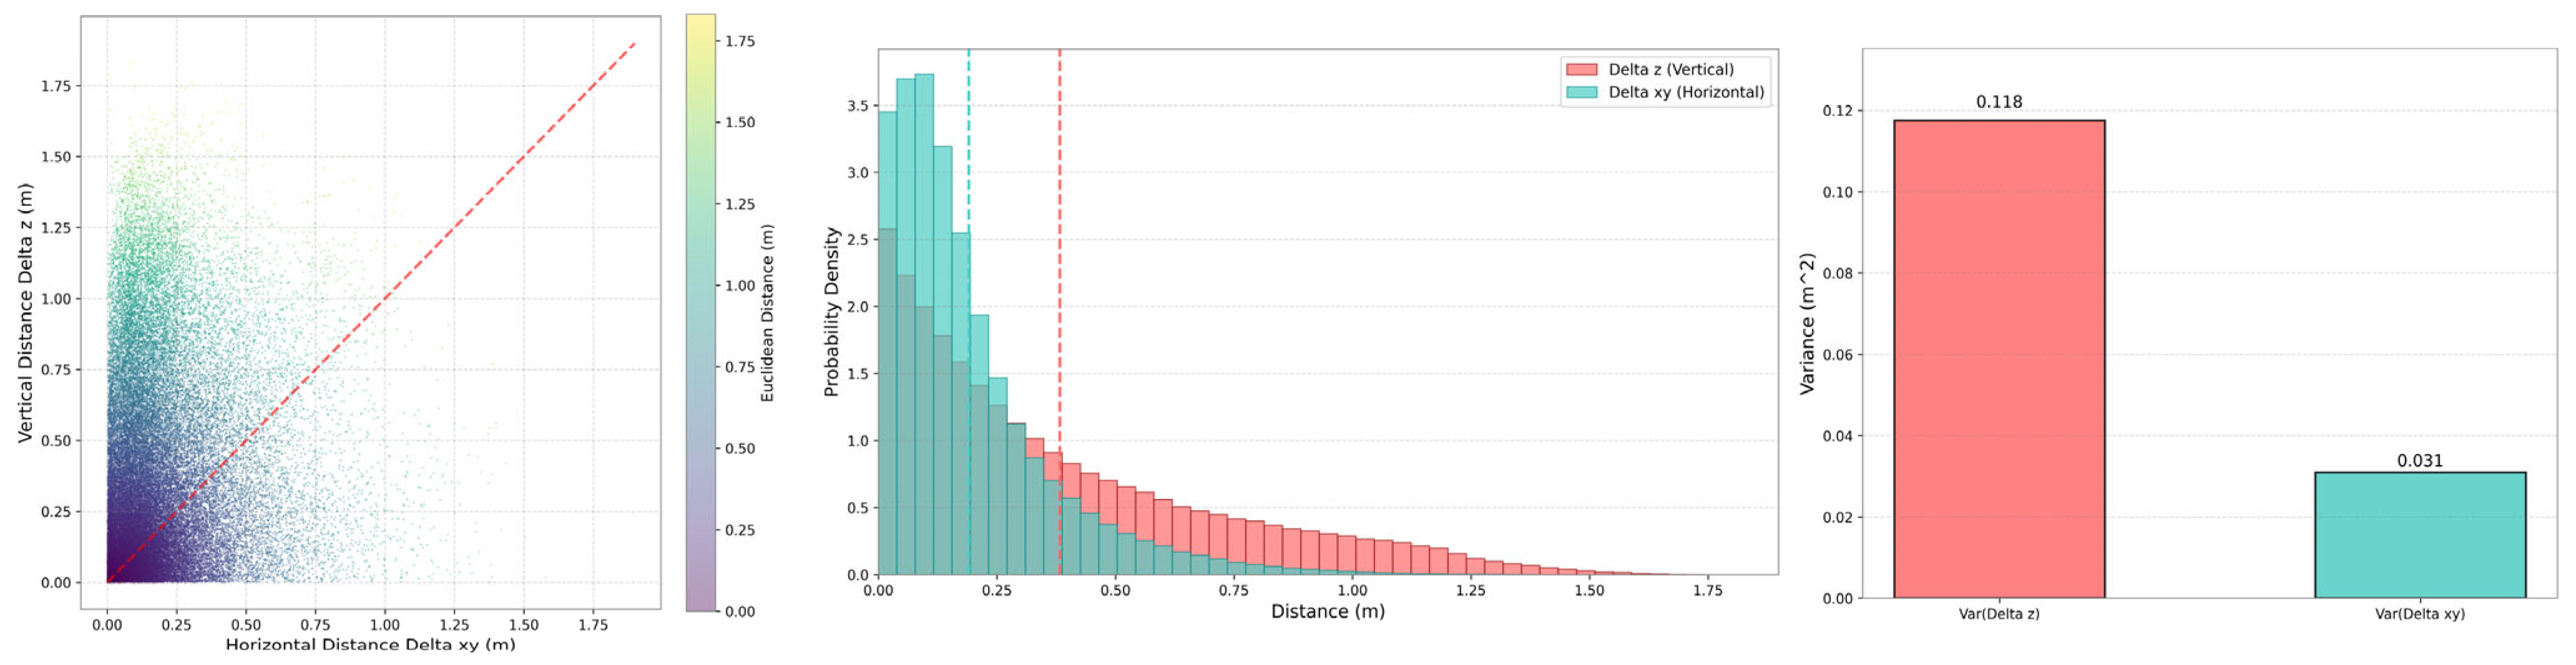
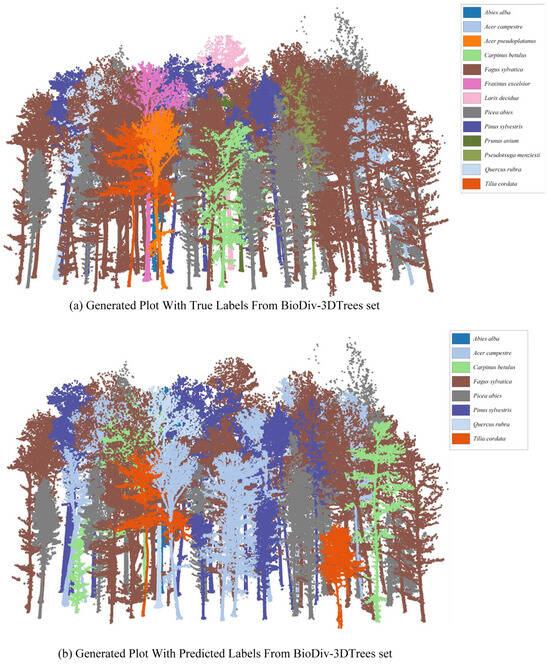
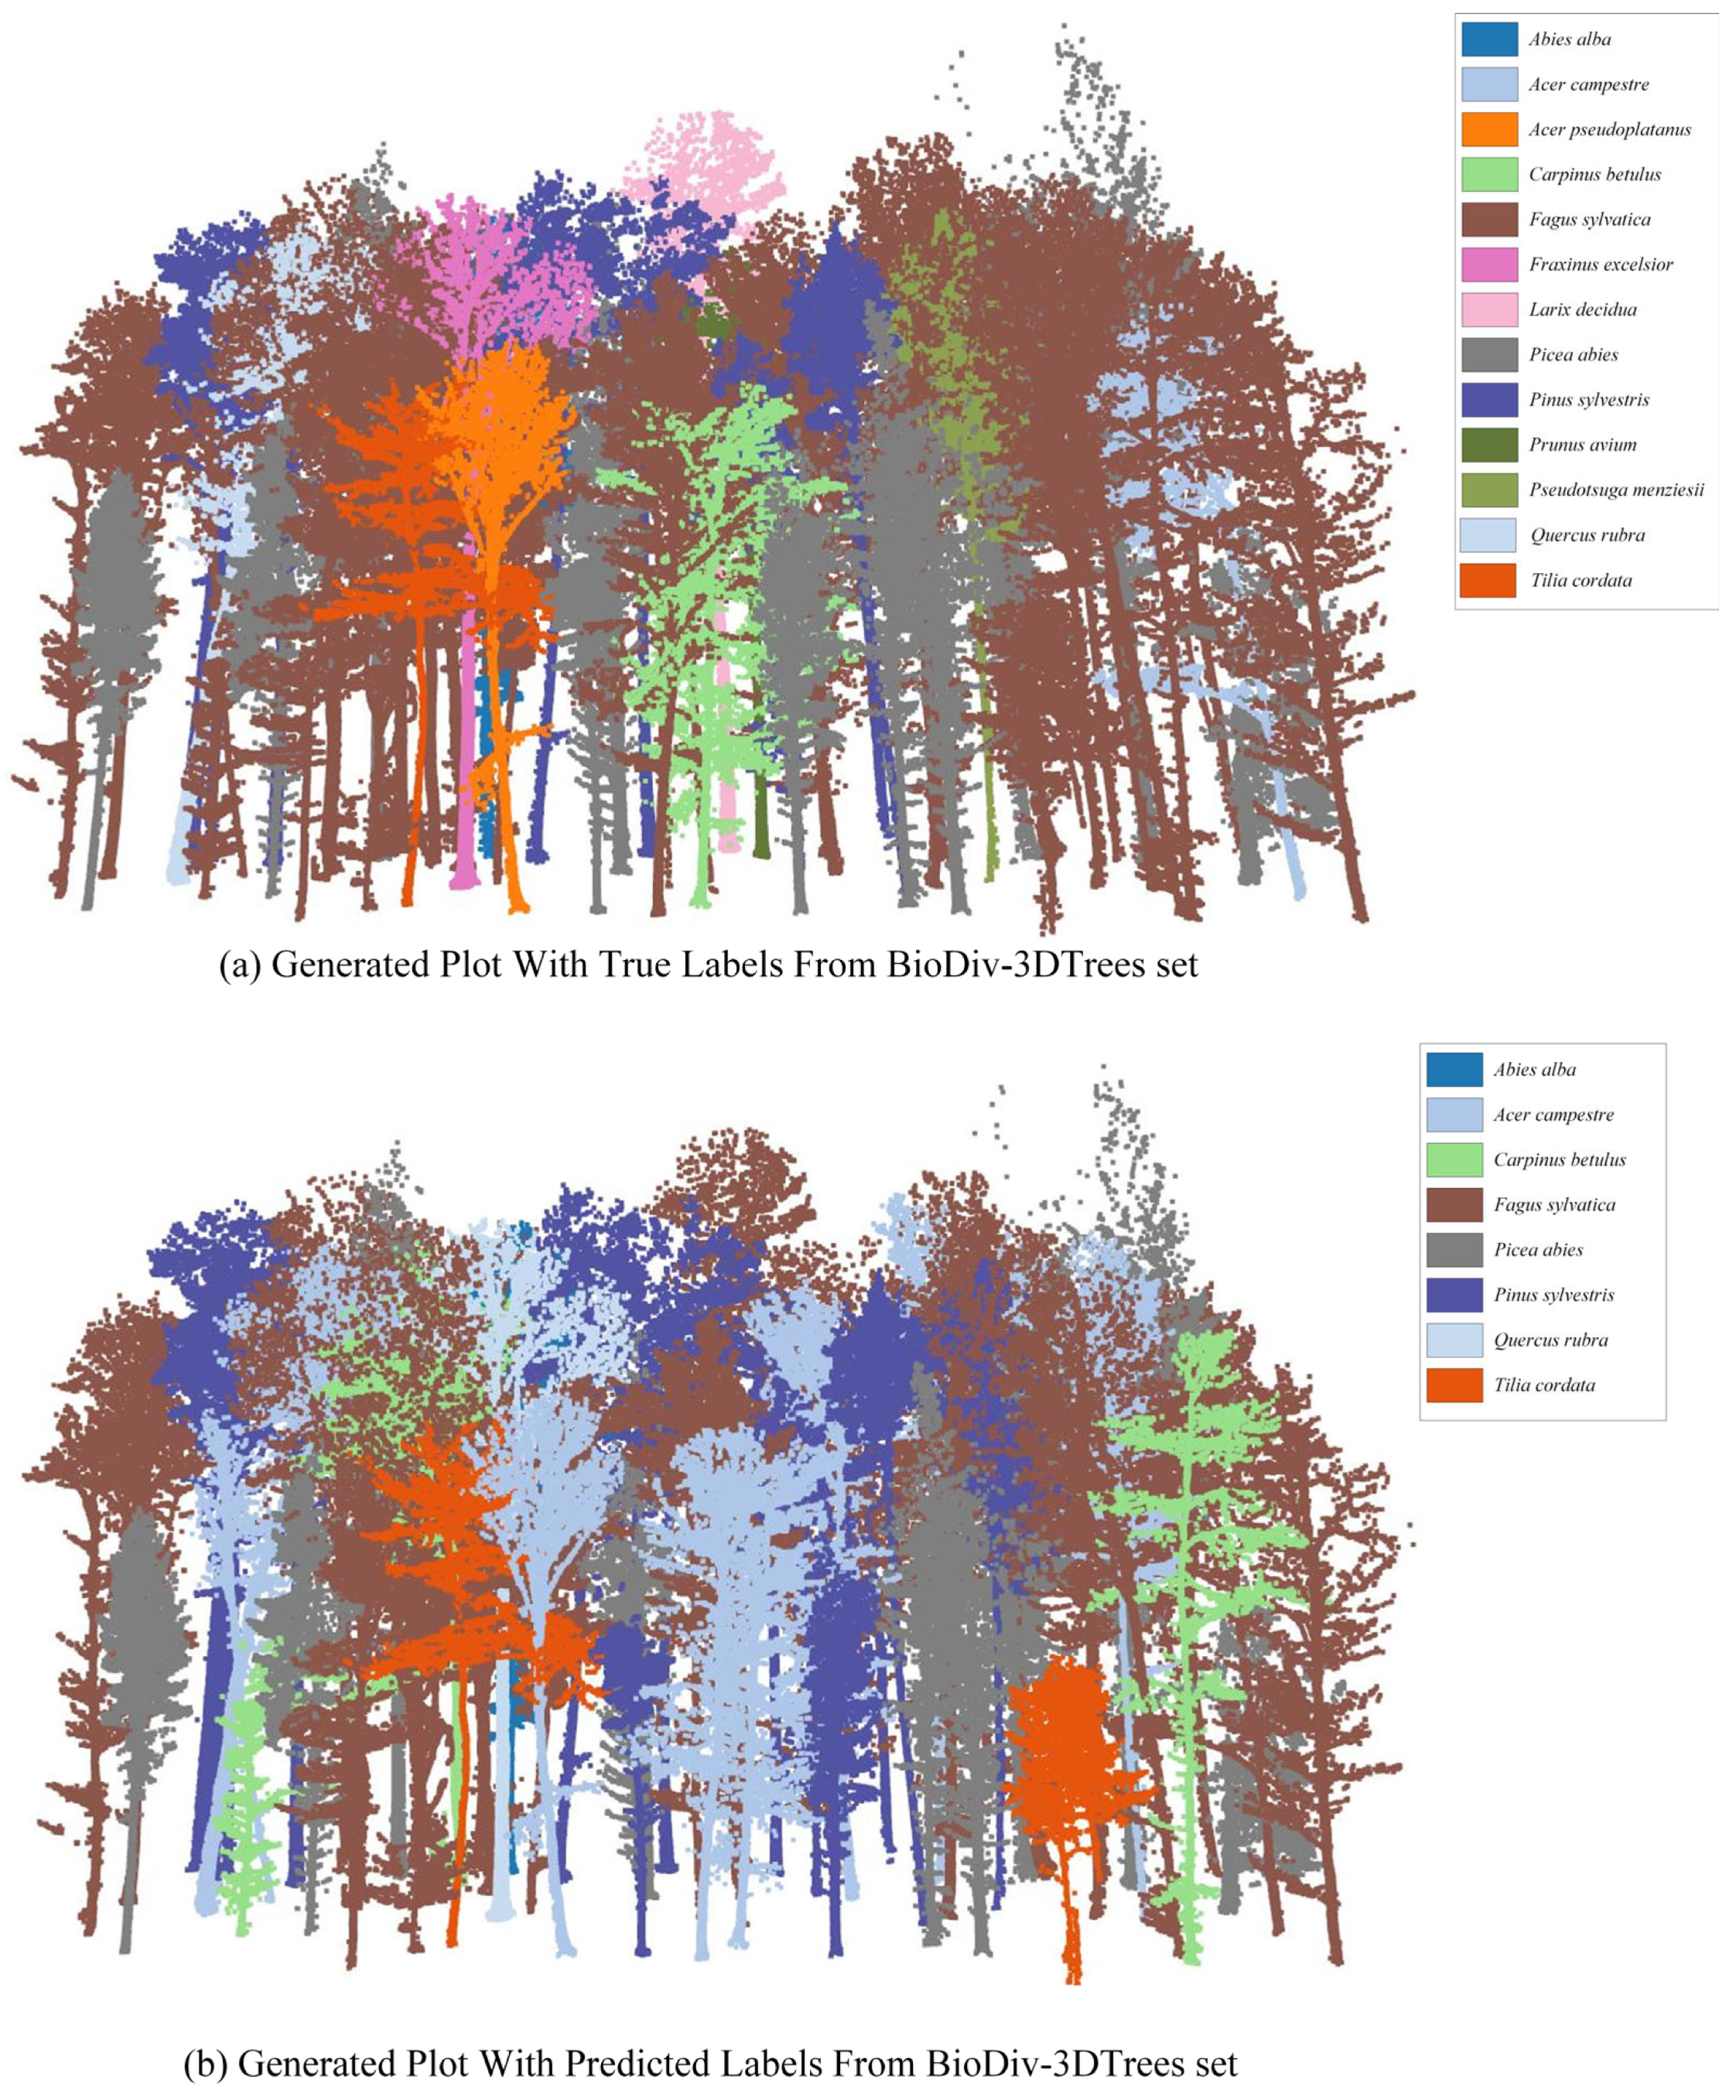

Disclaimer/Publisher’s Note: The statements, opinions and data contained in all publications are solely those of the individual author(s) and contributor(s) and not of MDPI and/or the editor(s). MDPI and/or the editor(s) disclaim responsibility for any injury to people or property resulting from any ideas, methods, instructions or products referred to in the content. |
© 2026 by the authors. Licensee MDPI, Basel, Switzerland. This article is an open access article distributed under the terms and conditions of the Creative Commons Attribution (CC BY) license.