Article

On the Concurrence of the Atmospheric and Marine Heatwaves in the Red Sea

1
Center of Excellence for Climate Change Research, King Abdulaziz University, Jeddah 21589, Saudi Arabia
2
Oceanography Department, Faculty of Science, Alexandria University, Alexandria 21500, Egypt
3
Marine Institute, Rinville, Co. Galway H91 R673, Ireland
4
Department of Meteorology, Faculty of Environmental Sciences, King Abdulaziz University, Jeddah 21589, Saudi Arabia
5
Department of Geography and Geographical Information Systems, Faculty of Arts, Tanta University, Tanta 31527, Egypt
*
Author to whom correspondence should be addressed.
Remote Sens. 2026, 18(9), 1302; https://doi.org/10.3390/rs18091302
Submission received: 11 February 2026 / Revised: 21 April 2026 / Accepted: 22 April 2026 / Published: 24 April 2026

Highlights

What are the main findings?
  • Near-surface air temperature over the Red Sea increased at 0.4 ± 0.07 °C/decade during 1990–2024, exceeding basin mean SST warming (0.31 ± 0.05 °C/decade).
  • Atmospheric and marine heatwaves in the Red Sea became more frequent and lasted longer over the last three decades, with about 66% of marine heatwaves occurring during atmospheric heatwaves.
What are the implications of the main findings?
  • Concurrent atmospheric–marine heatwaves represent the dominant events in the central Red Sea, increasing ecological and socio-economic vulnerability.
  • Accounting for coupling atmospheric–marine heatwaves is essential to improve regional heatwave monitoring, prediction, and impact assessments under ongoing climate change.

Abstract

Atmospheric heatwaves (AHWs) and marine heatwaves (MHWs) are intensifying under climate change, yet their coupled behavior in the Red Sea remains insufficiently quantified. This study investigates the spatial and temporal characteristics of AHWs, MHWs, and their concurrent occurrence across the Red Sea from 1990 to 2024 using ERA5 surface air temperature (SAT) and NOAA OISST v2.1 satellite-derived sea surface temperature (SST). Remote-sensing daily satellite-derived Level-4 (L4) OISST products were used in this study to enable spatially complete and temporally consistent detection of MHWs in this narrow, semi-enclosed basin despite contamination and coastal sampling constraints. Both SAT and SST exhibit statistically significant warming trends (p < 0.05), with basin mean increases of 0.40 ± 0.07 °C/decade and 0.31 ± 0.05 °C/decade, respectively. The strongest warming was observed in the central and northern Red Sea. This warming is accompanied by significant increases in the frequency and duration of AHWs, MHWs, and their concurrent AHW-MHW events, particularly after 2010, indicating a shift toward more frequent heatwave conditions. AHWs occur more frequently than MHWs across the Red Sea, whereas MHWs exhibit long duration, particularly in the northern Red Sea, where annual durations exceed 45–50 days/year. Concurrent AHW-MHW events account for about 66% of MHWs in the Red Sea, and their characteristics show a significant increasing trend across the entire basin. These findings identify the Red Sea as a regional hotspot of increasing concurrent heatwave events and highlight the importance of satellite-based monitoring for assessing evolving climate risks in semi-enclosed basins.

1. Introduction

Extreme heat has emerged as one of the most consequential manifestations of contemporary climate change, exerting profound impacts on natural ecosystems, human health, and socio-economic systems [1]. While long-term increases in global mean temperature provide the background climate signal, mounting evidence indicates that changes in the frequency, duration, and intensity of extreme heat events are the dominant drivers of climate-related impacts at regional and local scales [1,2,3]. Previous work has shown that extreme heat events are intensifying more rapidly than mean temperatures, highlighting both thermodynamic warming and changes in atmospheric circulation and variability [4,5].
Atmospheric heatwaves (AHWs) are generally defined as prolonged periods of anomalously high near-surface air temperature relative to local climatology, and they have increased in frequency, intensity, and duration since the mid-twentieth century [6,7,8]. These trends are significantly detectable in arid and subtropical regions, where persistent high-pressure systems, clear-sky conditions, and strong radiative forcing amplify surface warming [9,10,11,12]. The growing availability of satellite observations assimilated into atmospheric reanalysis products, such as ERA5, has substantially improved the spatial characterization of AHWs, particularly over data-sparse regions. Reanalysis datasets such as ERA5 integrate satellite radiances, in situ observations, and numerical weather prediction models into dynamically consistent atmospheric fields [13].
Along with atmospheric warming, the global ocean has absorbed more than 90% of the excess heat accumulated in the climate system, leading to pronounced increases in sea surface temperature (SST) and the emergence of marine heatwaves (MHWs) as a dominant mode of ocean thermal variability [14,15]. MHWs are defined as discrete periods of abnormally warm SST persisting from days to months relative to a seasonally varying climatology [16,17]. Although different methodological approaches exist for defining MHWs [18], two principal frameworks are commonly applied. The first is the fixed climatological percentile approach introduced by Hobday et al. [16], in which thresholds are calculated relative to a fixed baseline climatology and therefore incorporate both long-term warming and internal variability. This framework underpins most global observational assessments of MHW trends [19,20]. The second approach removes the long-term warming trend prior to percentile calculation, thereby isolating variability-driven extremes from the background thermodynamic warming signal [21,22]. Long-term satellite-derived SST records have enabled systematic global detection of MHWs, revealing robust increases in their frequency, duration, and cumulative intensity since the early 1980s [19,20]. These trends are primarily attributed to anthropogenic forcing, while local variability modulates their expression and regional impacts [15,23,24].
Satellite remote sensing plays a central role in MHW detection, as consistent, basin-wide SST observations are required to resolve spatially coherent extremes. In particular, Level-4 (L4) SST products, generated through optimal interpolation of multiple infrared and microwave satellite sensors blended with in situ measurements, provide gap-free daily coverage [25,26,27]. Meanwhile, Level-3 (L3) products may contain data gaps associated with cloud contamination or sensor limitations. Accordingly, L4 datasets are generally preferred for heatwave detection due to their spatial completeness, particularly in semi-enclosed and cloud-prone basins such as the Red Sea. However, the interpolation inherent in L4 products can smooth sharp thermal gradients and damp short-lived anomalies, which should be considered when interpreting extreme statistics [25,28]. MHWs exhibit widespread impacts on marine ecosystems, biogeochemical processes, and ecosystem services. Increasing SST can disrupt physiological performance, shift species distributions, and increase the likelihood of mass mortality events [29,30,31,32]. Habitat-forming ecosystems such as coral reefs, kelp forests, and seagrass meadows are particularly vulnerable to prolonged thermal stress, with repeated exposure reducing ecosystem resilience and increasing the likelihood of long-term degradation [33,34,35,36]. As a result, MHWs have become a central focus of satellite-based ocean monitoring and climate impact research [37].
Despite extensive research on AHWs and MHWs individually, these phenomena are still commonly investigated as separate components of the climate system. This separation persists even though the same large-scale atmospheric circulation anomalies frequently drive both extremes, and they are physically coupled through air–sea interactions. Persistent blocking high-pressure systems or intensified subtropical anticyclones can simultaneously increase near-surface air temperatures and suppress ocean surface cooling [12,21,38]. Under such conditions, weakened surface winds reduce evaporative heat loss and vertical mixing, while enhanced downward longwave and sensible heat fluxes promote the accumulation and persistence of SST anomalies [20,21]. Although SST represents the lower boundary condition for near-surface air temperature, the temporal concurrence between AHWs and MHWs is not guaranteed. Ocean thermal inertia, mixed-layer depth variability, vertical mixing, and synoptic-scale atmospheric fluctuations can decouple SST anomalies from near-surface air temperature extremes on short timescales [21,38]. Consequently, understanding when and where AHWs and MHWs occur simultaneously, and when they do not, provides insight into the strength and spatial heterogeneity of air–sea coupling processes. In this context, it is important to distinguish between compound heatwave events and co-occurring heatwaves. Compound events are typically defined using more rigid criteria, such as substantial temporal overlap, event-based matching, or joint probability frameworks, and are intended to quantify interacting hazards and their combined impacts [39]. In this study, we focus on co-occurring AHW-MHW events, defined as instances of temporal overlap at the daily scale [40,41]. This definition is aligned with the temporal resolution of the datasets and is designed to capture synoptic-scale co-variability rather than strict compound-event dynamics. While less restrictive, this approach enables a consistent, grid-based assessment of concurrent extremes across the basin.
The simultaneous occurrence of AHWs and MHWs gives rise to concurrent AHW-MHW events, representing a distinct class of compound climate extremes [39]. Compound events have attracted increasing attention because interacting hazards can generate impacts that exceed those associated with individual extremes occurring in isolation [40,41]. While compound heat drought events over land have been widely studied, concurrent AHWs-MHWs remain comparatively understudied, particularly at regional scales, largely due to the need for consistent observations across land and ocean domains [29,35,42]. Satellite remote sensing, in combination with atmospheric reanalysis products, provides a powerful framework for addressing this limitation. Satellite observations deliver spatially continuous SST fields with high temporal resolution. At the same time, reanalysis datasets integrate satellite and in situ measurements within physically consistent climate models to provide coherent representations of atmospheric variables such as air temperature, wind speed, and surface heat fluxes [13,29,42]. Together, these datasets enable integrated assessments of extreme heat across the coupled atmosphere–ocean system and are uniquely suited for detecting and analyzing concurrent heatwaves.
Semi-enclosed seas are particularly sensitive to concurrent heat extremes due to restricted circulation, strong stratification, and intense air–sea heat exchange. The Red Sea is characterized by exceptionally high evaporation rates, negligible freshwater input, strong radiative forcing, and limited exchange with the open Indian Ocean through the Bab El-Mandeb Strait [43,44]. Satellite observations indicate that the Red Sea has warmed faster than the global ocean average, with pronounced spatial variability and especially strong SST increases in the central and northern basin [45,46,47,48]. This warming has been accompanied by increasing MHW activity and thermal stress on coral reef ecosystems of high ecological and socio-economic importance [31,49]. At the same time, the surrounding land regions of the Arabian Peninsula experience frequent and intense AHWs driven by persistent subtropical circulation, clear-sky conditions, and strong radiative forcing [9,50]. Reanalysis-based studies revealed significant upward trends in extreme air temperature indices across the region, consistent with satellite observations and climate model projections [51,52]. These conditions suggest a strong potential for concurrent AHW and MHW events; however, their temporal concurrence and spatial variability have not yet been systematically quantified for the Red Sea. Existing studies in the region have largely focused on long-term SST trends, MHWs, or coral bleaching impacts in isolation [45,49,53]. To the best of our knowledge, no basin-scale, multi-decadal assessment has explicitly quantified the cooccurrence of AHWs and MHWs in the Red Sea using consistent satellite and reanalysis datasets. Consequently, fundamental questions remain regarding how frequently MHWs occur under AHW conditions, whether the concurrence of these extremes is intensifying, and which regions of the basin exhibit the strongest atmosphere–ocean coupling.
The aims of this study are therefore to: (i) quantify long-term trends in surface air temperature and SST across the Red Sea over the period 1990–2024; (ii) analyze the spatiotemporal distribution of AHW and MHW characteristics; and (iii) identify and quantify concurrent AHW-MHW events and their temporal evolution. The key contributions of this study are to provide the first basin-scale, multi-decadal quantification of concurrent AHW-MHW events in the Red Sea, and to demonstrate the value of integrated satellite-based approaches for advancing the monitoring and understanding of concurrent thermal extremes in semi-enclosed marine systems.

2. Datasets and Methods

2.1. Study Area

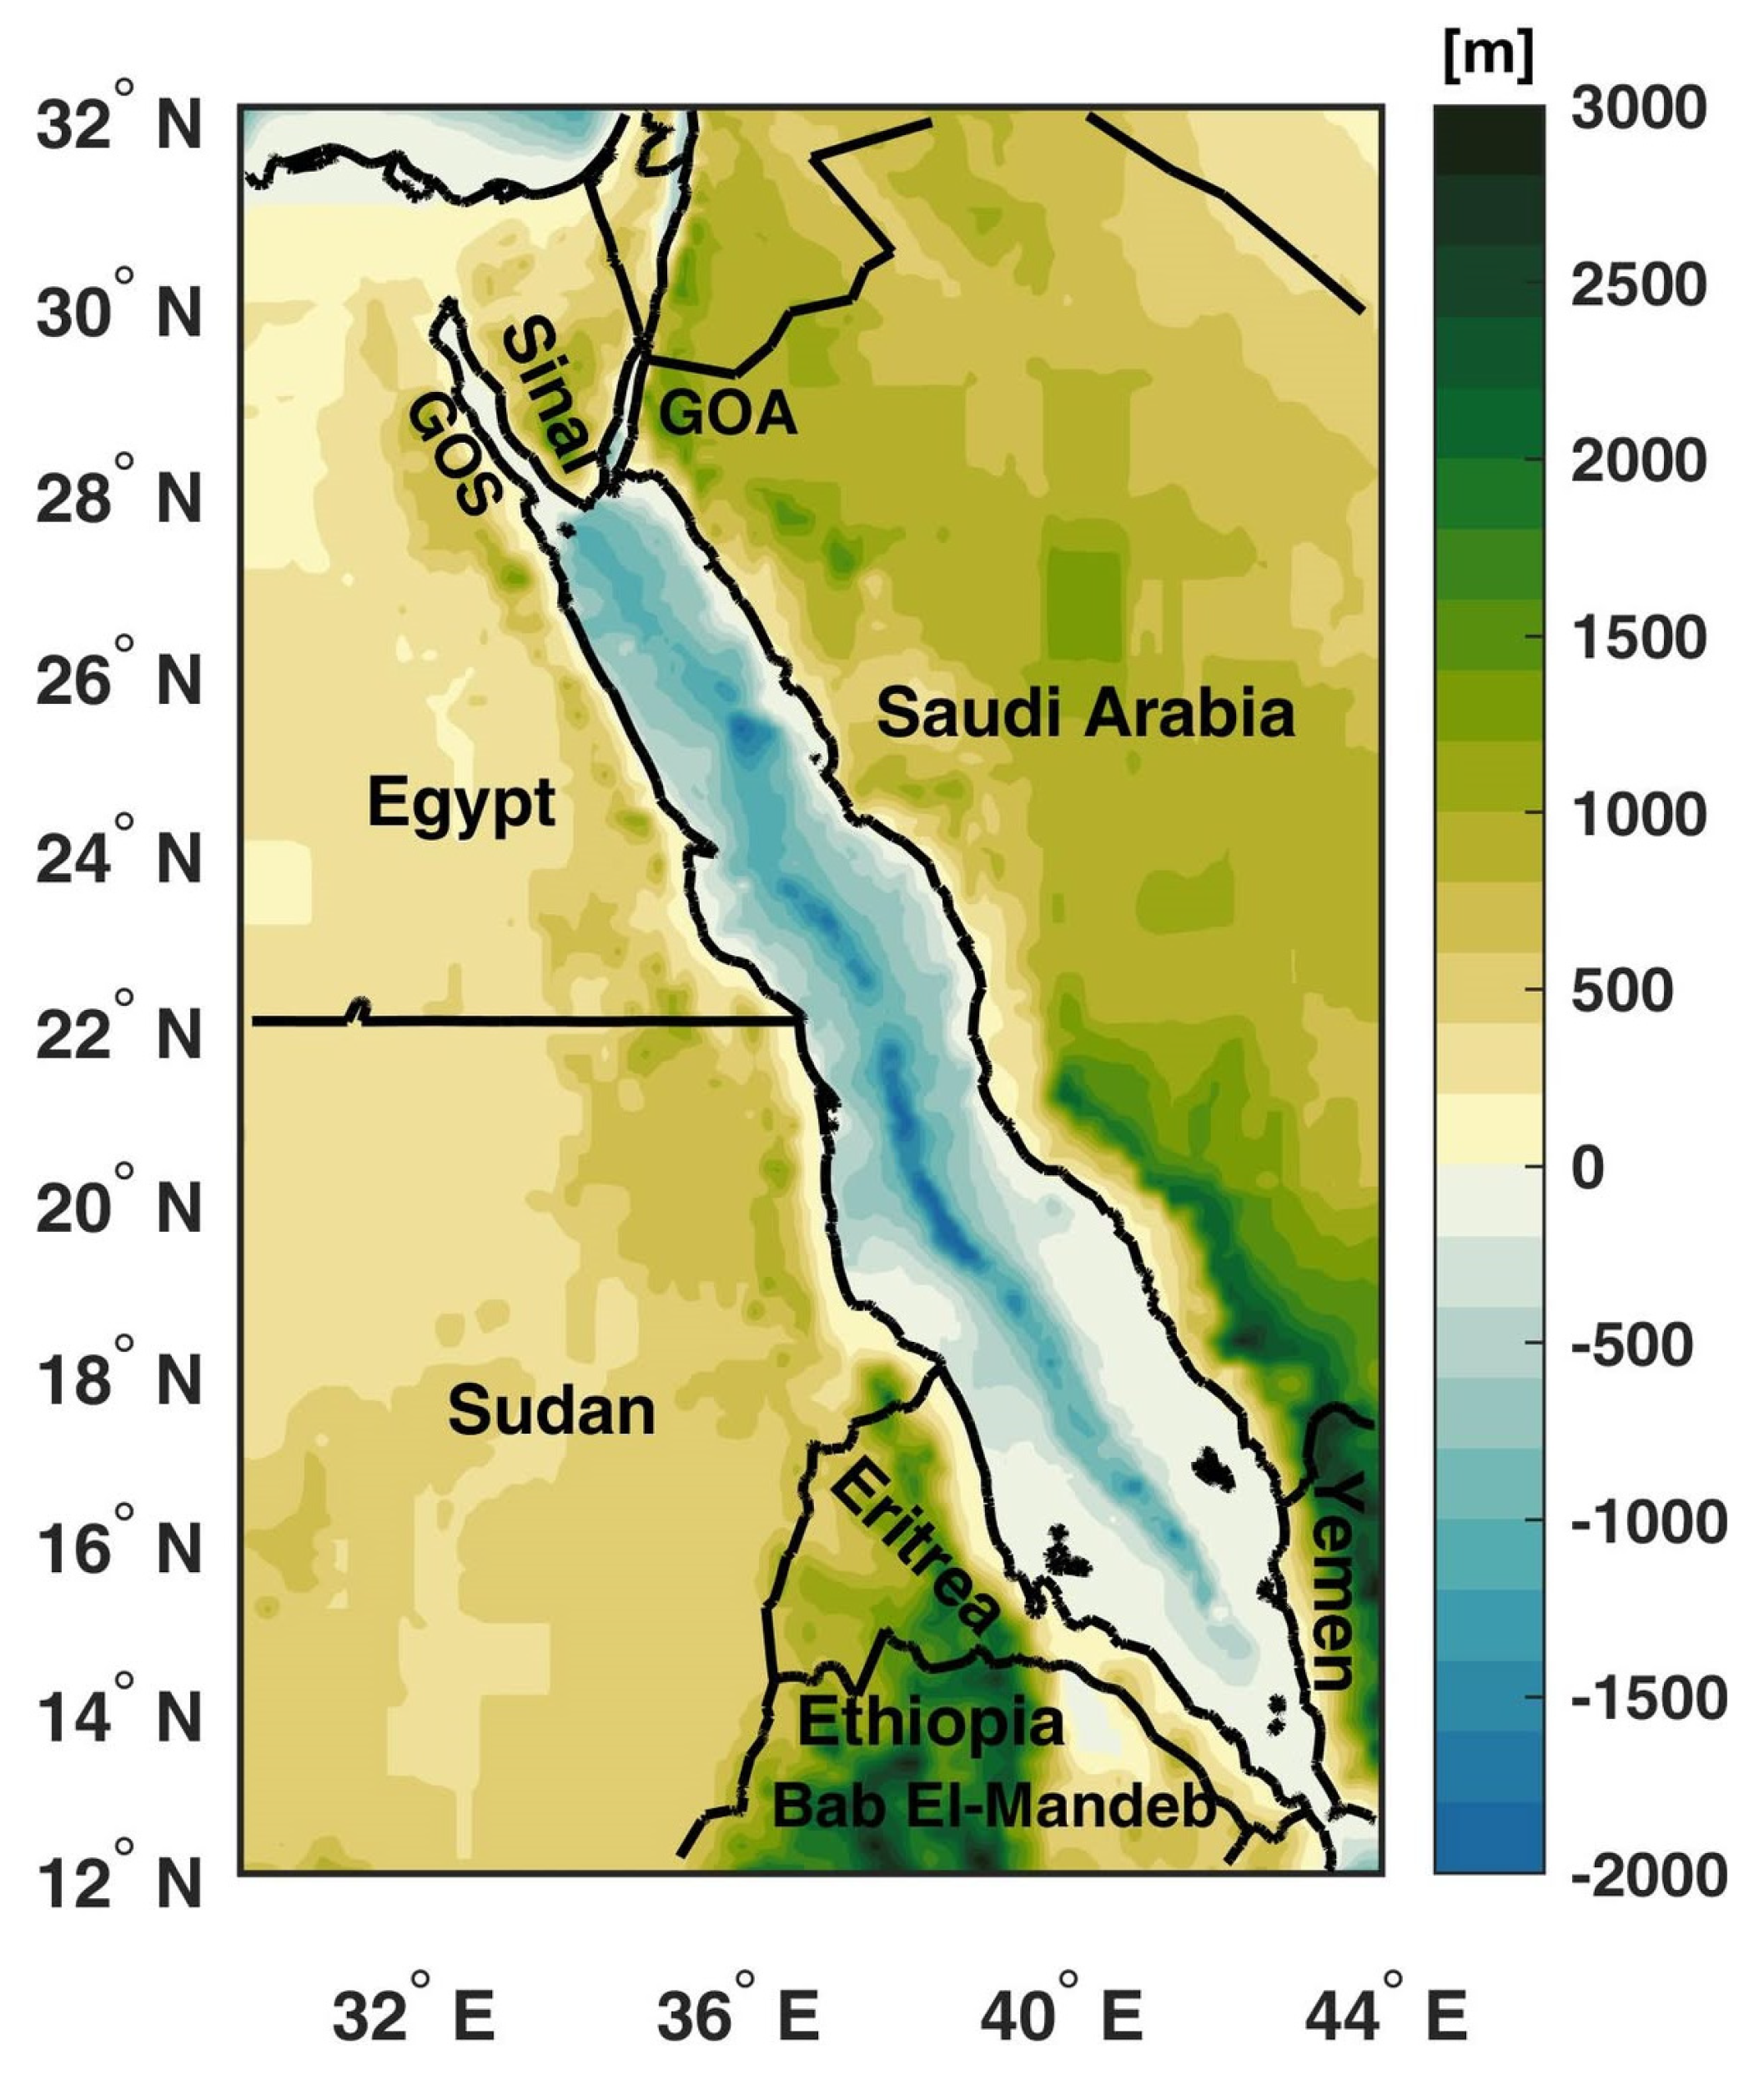
The Red Sea is a narrow, elongated semi-enclosed basin extending approximately from 12°N to 30°N and bordered by northeastern Africa to the west and the Arabian Peninsula to the east (Figure 1). With a total length of nearly 2000 km and an average width of approximately 280 km, the Red Sea is one of the most distinctive marginal seas in the world. The basin is connected to the Indian Ocean through the Bab El-Mandeb Strait. This narrow and elongated passage substantially restricts water exchange and limits large-scale ventilation, thereby exerting a dominant control on regional circulation and water-mass properties [43,44].
The Red Sea is characterized by extremely high evaporation rates, negligible freshwater input, and intense air–sea heat fluxes, resulting in high salinity and persistently warm surface waters throughout the year [43,45,46]. Owing to these extreme thermodynamic conditions, the basin is among the warmest marine regions worldwide, with mean sea surface temperatures frequently exceeding 30 °C during summer, particularly in the central and northern Red Sea [45,48].
Pronounced spatial heterogeneity exists along the basin, driven primarily by differences in circulation, stratification, and air–sea interactions. The southern Red Sea is influenced by relatively cooler, fresher inflows from the Gulf of Aden, particularly during winter, which enhance vertical mixing and moderate surface temperatures [44,46]. In contrast, the central and northern Red Sea are more isolated from open-ocean exchange and experience stronger surface heating, reduced ventilation, and enhanced vertical stratification [43,45]. These conditions favor the persistence of surface thermal anomalies and increase sensitivity to atmospheric forcing, making the Red Sea a suitable natural basin for investigating atmospheric and marine heatwaves and their concurrent occurrence.

2.2. Data Sources

Daily SST data from the National Oceanic and Atmospheric Administration (NOAA) Optimum Interpolation SST, version 2.1 (OISST v2.1) Level-4 (L4) product, covering the period 1990–2024, are used to identify MHW characteristics. OISST provides global, gap-free daily SST at a grid spacing of 0.25° × 0.25°, using optimal interpolation of multi-sensor satellite observations from the Advanced Very High Resolution Radiometer (AVHRR) and microwave radiometers blended with in situ observations from buoys and ships [25,26]. The L4 framework produces spatially complete (gap-free) fields by filling missing observations present in Level-2 (L2) swath data and Level-3 (L3) gridded products. Gaps in L2 data primarily arise from cloud contamination affecting infrared sensors, atmospheric water vapor and aerosol interference, limitations in satellite overpass frequency, and retrieval uncertainties near coastlines or under high-humidity conditions. While the underlying causes of these gaps have remained generally consistent over time, their frequency and spatial extent have decreased due to the integration of multiple satellite sensors (infrared and microwave), improved orbital coverage, and advances in retrieval algorithms. The OISST L4 product represents a foundation SST rather than instantaneous skin temperature, providing a temporally stable lower boundary condition for air–sea interaction studies. This reduces sensitivity to unresolved diurnal variability, which is typically smaller than multi-day MHW anomalies. Compared with Level-3 products, which may contain data gaps due to cloud contamination, the L4 product provides complete spatial coverage and reduced high-frequency retrieval noise [27], making it particularly suitable for climate-scale variability and MHW detection. The gap-filling in L4 products is achieved through optimal interpolation, which combines satellite and in situ observations using prescribed spatial and temporal co-variance functions to estimate missing values. While this approach ensures spatial continuity, it introduces a degree of spatial smoothing that may dampen sharp thermal gradients and short-lived anomalies. This makes L4 particularly suitable for climate-scale variability and heatwave detection in semi-enclosed basins such as the Red Sea. Although optimal interpolation may dampen fine-scale coastal variability [27], multi-day percentile-based MHW detection has been shown to remain robust under L4 smoothing because event identification requires persistent threshold exceedance over several consecutive days rather than single-day extremes [28,29]. To minimize potential land contamination in narrow coastal regions and semi-enclosed basins, coastal grid cells adjacent to land are carefully inspected. Coastal pixels with evident interpolation artifacts are excluded from spatial statistics to avoid artificial warming signals associated with mixed land–sea retrievals. The effective spatial coverage, therefore, represents open-water grid cells between about 12°N–30°N across the Red Sea basin.
Daily near-surface (2 m) air temperature (SAT) from the European Centre for Medium-Range Weather Forecasts (ECMWF) ERA5 reanalysis dataset is used to quantify AHW characteristics during the study period. ERA5 provides hourly atmospheric variables at a grid spacing of 0.25° × 0.25°, through a state-of-the-art data assimilation system that integrates satellite radiances, radiosonde observations, and surface station measurements within a physically consistent numerical weather prediction framework [13]. Hourly SAT data is aggregated to daily mean values prior to heatwave detection to ensure consistency with daily SST analysis. ERA5 has been shown to reliably represent temperature extremes and heatwave characteristics over arid and semi-arid regions, including the Middle East and the Arabian Peninsula [51,52], where conventional observations are sparse. ERA5 temperature uncertainty over arid regions is typically on the order of 0.3–0.5 °C [13], again smaller than identified AHW anomalies. To ensure spatial consistency in concurrent event analysis, SAT data is bilinearly interpolated to match the OISST grid prior to analysis.

2.3. Atmospheric and Marine Heatwave Detection

Heatwave detection is implemented using MATLAB R2020b through the Marine Heatwaves toolbox (M_MHW, https://github.com/ZijieZhaoMMHW/m_mhw1.0; accessed on 28 June 2025), which follows the standardized framework of Hobday et al. [16]. The toolbox is applied consistently to both SAT and SST time series to ensure methodological coherence between AHW and MHW identification. The use of a unified detection framework minimizes methodological inconsistencies and allows direct comparison between AHW and MHW characteristics across the study domain.
MHWs are identified following Hobday et al. [16]. For each grid cell, a 30-year baseline period (1991–2020) is used to compute a seasonally varying climatology. An 11-day moving window is applied following Hobday et al. [16] to reduce synoptic-scale noise and sampling variability while preserving multi-day extreme events. Sensitivity analysis in previous methodological evaluations demonstrates that such smoothing does not materially alter MHW frequency or duration statistics when events are defined using a minimum 5-day persistence criterion [28]. Spatial patterns and decadal trends in MHW frequency and duration remain statistically consistent with and without smoothing, indicating that the 11-day filter enhances robustness without biasing long-duration event statistics. A corresponding 90th percentile threshold is computed for each calendar day using the same baseline period, and MHW is defined as a period of at least five consecutive days during which daily SST exceeds this threshold [16,19]. Two principal methodological approaches are commonly used for MHW detection: (i) a fixed climatological percentile threshold [16] and (ii) a trend-adjusted baseline in which long-term warming is removed prior to event detection [17,22]. In this study, we adopted the fixed baseline approach because it captures both climate warming and short-term variability, allowing assessment of the combined influence of climate change and natural variability on concurrent heatwaves. This methodology preserves the long-term warming signal and is widely used in global and regional MHW assessments [19,37]. The trend-adjusted approach removes the long-term warming trend before computing percentile thresholds, thereby isolating variability-driven extremes from background climate warming [21,22]. While the trend-adjusted method is useful for attribution studies, it may underestimate the thermodynamic contribution of ongoing climate change. The AHWs are detected using the same percentile-based framework applied to the daily SAT dataset [6,7,8], with a minimum duration of three consecutive days to reflect the shorter atmospheric response timescale relative to the ocean.
Concurrent AHW-MHW events are defined as periods during which AHW and MHW events occur simultaneously at the same grid cell, with at least one day of temporal overlap. This day-based definition ensures consistency with the daily resolution of the datasets and allows identification of synchronous air–sea extreme conditions occurring on synoptic timescales. Similar cooccurrence approaches based on temporal overlap have been adopted in previous studies investigating concurrent heat extremes and air–sea interactions (e.g., [41,54]). Such definitions are particularly appropriate for exploratory assessments of concurrent events in regions where atmospheric forcing can rapidly influence ocean surface conditions. However, it is acknowledged that this definition represents a relatively inclusive criterion, which may capture short-lived or transient overlaps in addition to more persistent concurrent events. Accordingly, the results are interpreted as representing co-occurring heatwave conditions, rather than strictly defined high-intensity concurrent extremes. More restrictive definitions (e.g., requiring substantial fractional overlap or joint exceedance probability frameworks) may yield lower concurrent event frequencies but are not adopted here in order to preserve sensitivity to transient air–sea interactions. To provide a more comprehensive analysis of cooccurrence, the frequency of overlapping events and the total number of overlapping days (duration) metrics are assessed, allowing differentiation between frequent short-lived and more persistent cooccurrence events. In addition, standalone AHWs and standalone MHWs are identified as events that do not temporally overlap with their respective counterpart, allowing separation of independent and co-occurring extremes. Finally, two relative cooccurrence metrics are also computed: (i) the percentage of MHWs occurring during AHWs (concurrent/MHW, %), and (ii) the percentage of AHWs occurring during MHWs (concurrent/AHW, %). These metrics provide additional insight into the relative dependence and asymmetry of AHW and MHW interactions.

2.4. Statistical Analysis

Long-term trends are assessed for SAT, SST, and derived heatwave metrics using non-parametric statistical methods to ensure robustness against non-normality and outliers commonly present in climate time series. Trend magnitudes are estimated using Sen’s slope estimator [55], which provides a median-based measure of the rate of change and is less sensitive to extreme values. The statistical significance of all trends is assessed using the modified Mann–Kendall (MK) test [56,57], a widely used non-parametric method for detecting monotonic trends in hydroclimatic time series datasets.
Because climate time series often exhibit serial autocorrelation, which can inflate the significance of trend tests if not properly accounted for, the MK test is applied using an autocorrelation-adjusted variance following the approach described in Wilks [56,58]. This adjusted sample size is used to correct the variance of the MK test statistic and ensure a more reliable estimation of trend significance. This procedure reduces the likelihood of false detection of significant trends associated with persistence in climate data. The standardized MK test statistic (Z) is computed using the corrected variance, and corresponding two-sided p-values are derived assuming asymptotic normality, consistent with Wilks. Trend significance is evaluated at the 95% confidence level (α = 0.05). In addition to Sen’s slope, the Z-statistic, p-values, and effective sample sizes are retained and used to assess the robustness of detected trends. The correlation between AHW and MHW metrics at each grid cell is assessed using Spearman’s rank correlation [59]. This non-parametric metric evaluates monotonic relationships between variables and is less sensitive to non-normal distributions, outliers, and non-Gaussian behavior commonly observed in climate datasets [60,61]. The adjusted degrees of freedom are then used to compute p-values for the Spearman correlation coefficients. Statistical significance of correlations is assessed at the 95% confidence level (p < 0.05), and only correlations exceeding this threshold are interpreted as statistically meaningful. This approach ensures that the reported relationships are not artificially inflated due to persistence or serial dependence in the underlying climate time series.

3. Results and Discussion

3.1. Decadal Trends of SAT and SST

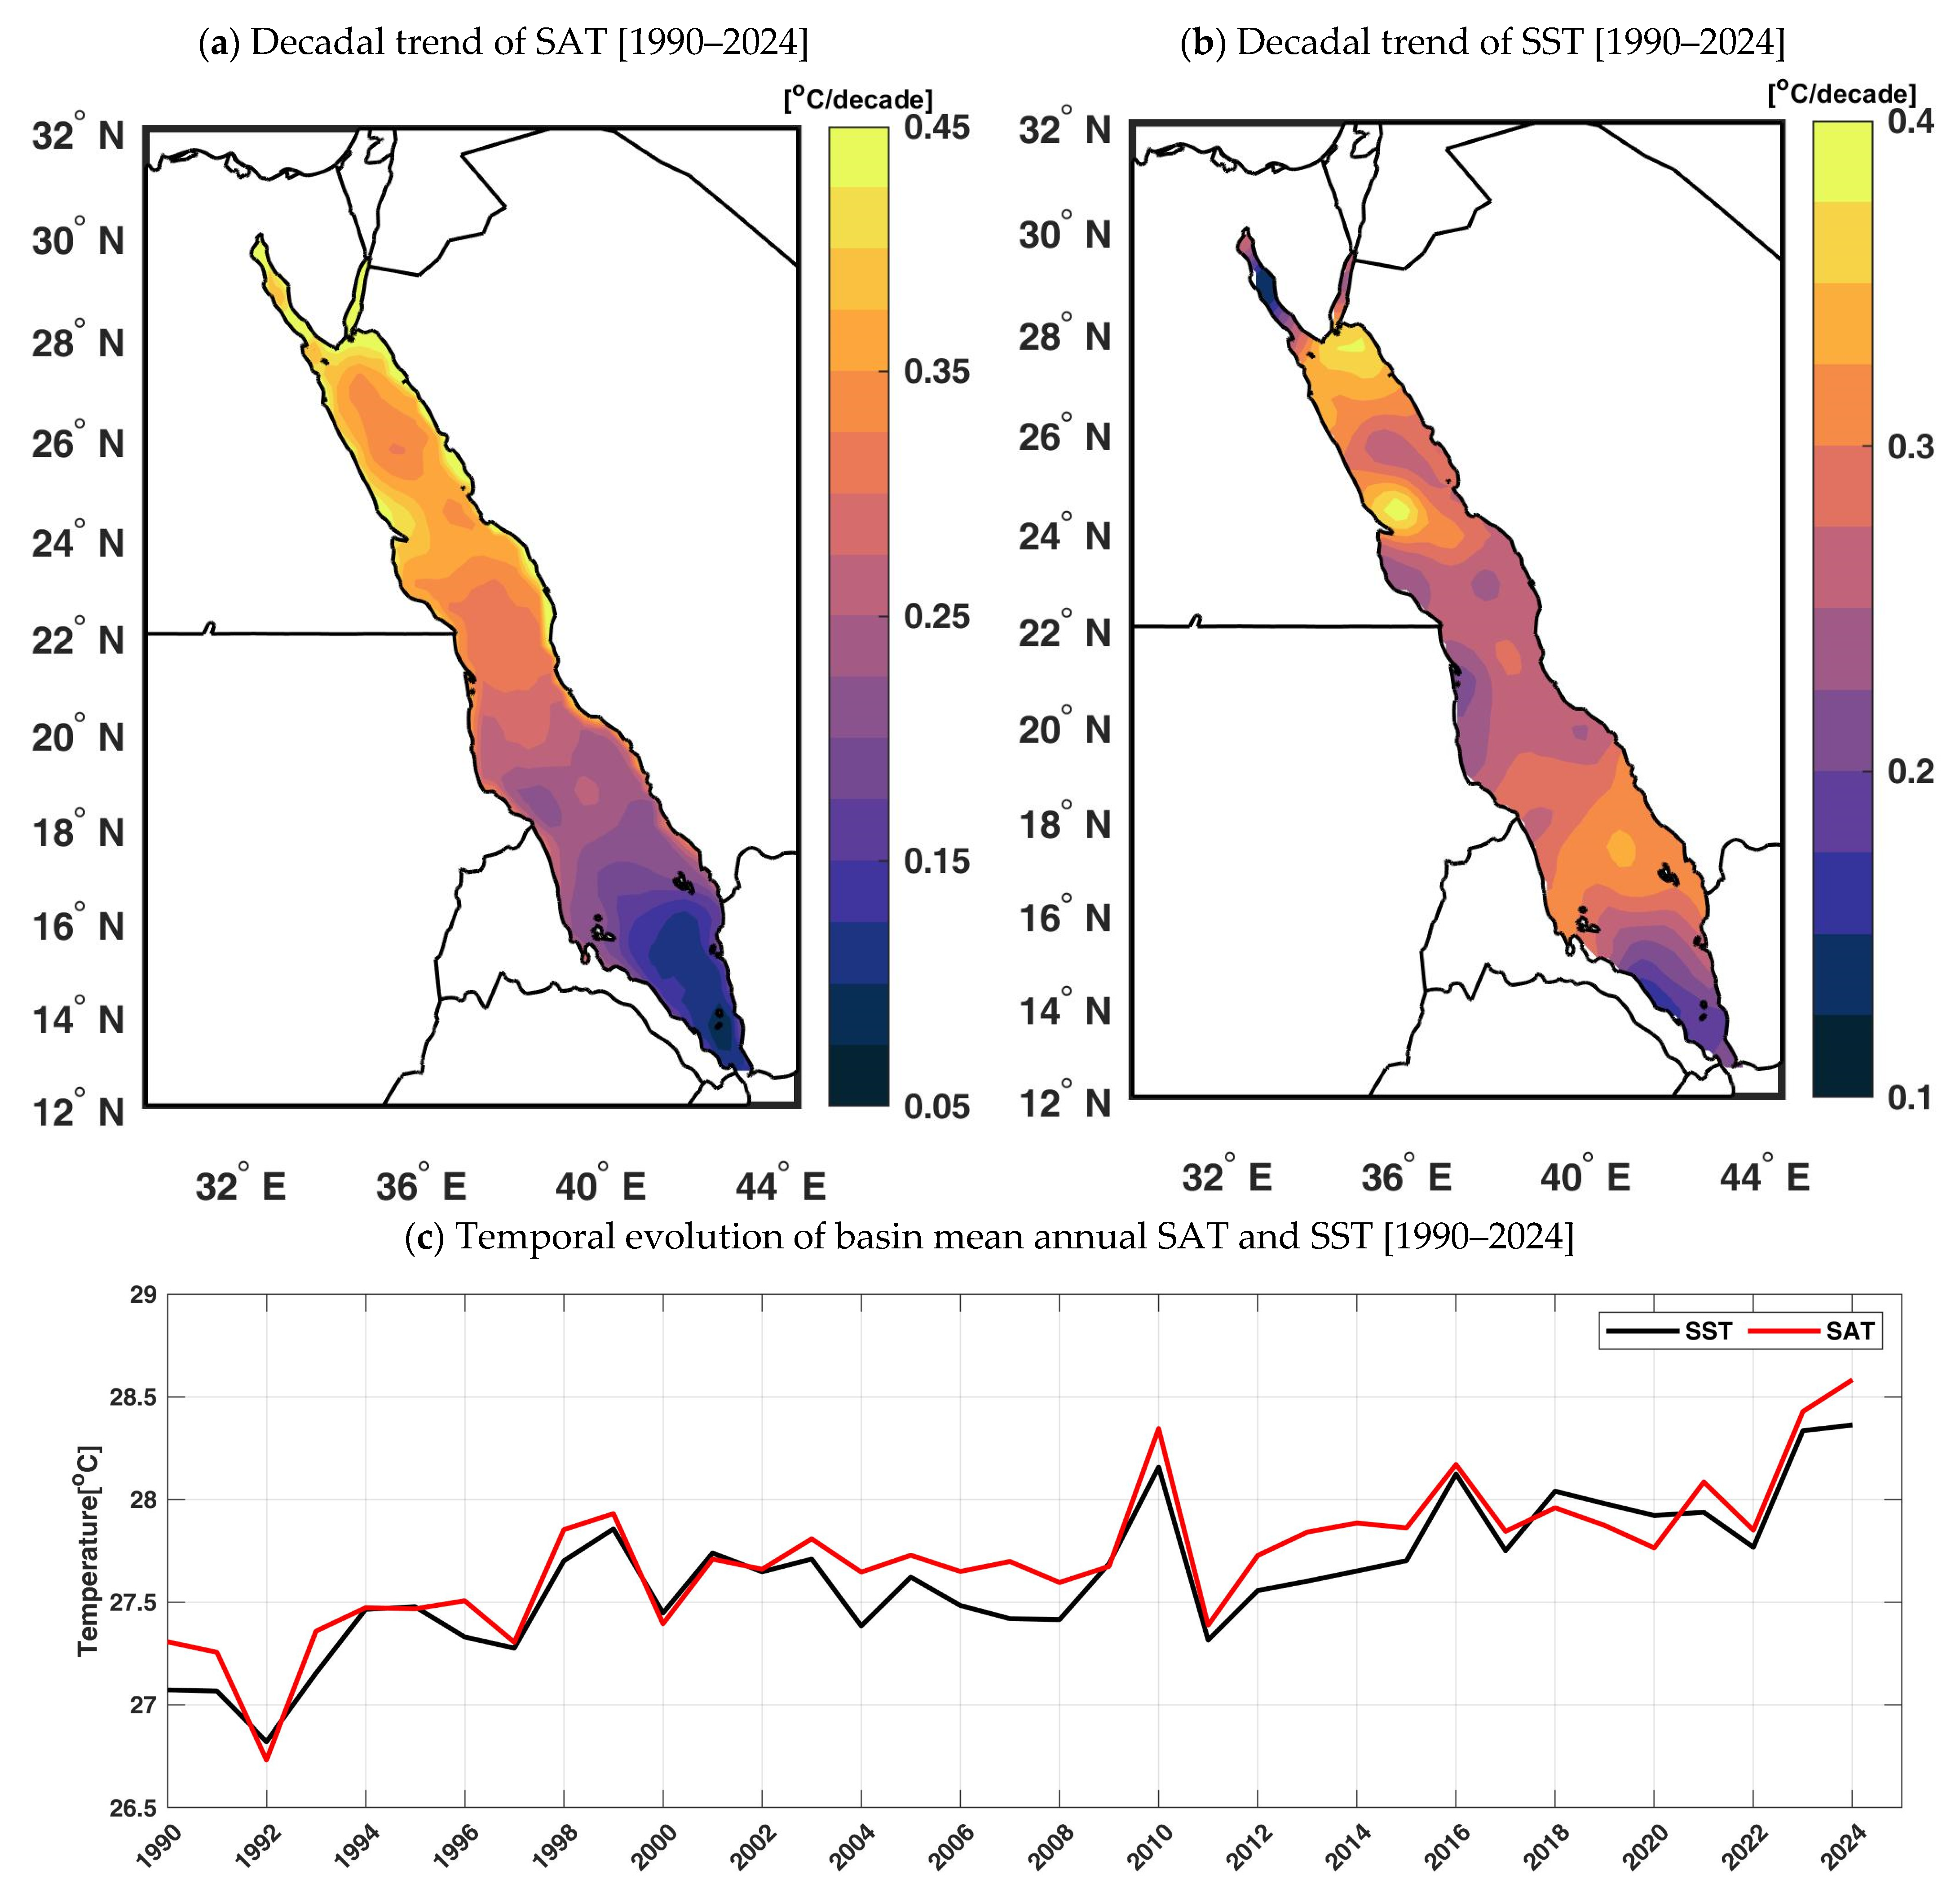
The Red Sea has experienced pronounced warming in both SAT and SST over the period 1990–2024 (Figure 2), with statistical significance assessed using Sen’s slope estimator in combination with an autocorrelation-corrected Mann–Kendall test (p < 0.05). The spatial patterns of these trends exhibit coherent basin-scale warming, accompanied by strong meridional gradients. Statistically significant (p < 0.05) positive decadal SAT trends are observed over the whole Red Sea, indicating persistent atmospheric warming during the study period (Figure 2a). The magnitude of SAT trends ranges from about 0.05 to 0.45 °C/decade, with a pronounced northward increasing trend gradient. The southern Red Sea (south of 16°N) shows the lowest SAT trends (<0.15 °C/decade), while the central and northern Red Sea basins exhibit the highest positive trends (>0.30 °C/decade), with maximum north of 23°N. The basin mean SAT trend over the Red Sea basin is 0.4 ± 0.07 °C/decade. These results are consistent with amplified atmospheric warming observed globally in arid and semi-arid regions, where reduced cloud cover and strong radiative forcing amplify near-surface temperature increases [2,62,63]. The spatial distribution of SAT trends reflects the influence of large-scale atmospheric circulation. Persistent subtropical high-pressure systems increasingly influence the northern Red Sea, reducing synoptic variability and enhancing subsidence, which favors strong radiative heating and suppressed convective cooling [2,5,11]. In contrast, the southern Red Sea remains partially moderated by monsoon-related circulation, episodic ventilation through the Bab El-Mandeb Strait, and enhanced atmospheric mixing, which collectively limit long-term accumulation of near-surface air temperature [39].
The decadal SST trends indicate basin-wide warming across the Red Sea, ranging from 0.1 to 0.4 °C/decade (Figure 2b), with greater spatial heterogeneity compared to SAT. The lowest SST warming trends (<0.2 °C/decade) are found in the southern Red Sea, particularly near the Bab El-Mandeb Strait. This region is strongly influenced by the persistent inflow of relatively cooler waters from the Gulf of Aden, which enhances upper-ocean ventilation and enhances lateral and vertical heat redistribution, thereby limiting long-term surface heat accumulation [43,46,64]. Previous studies have demonstrated that advective processes at the southern boundary exert a dominant control on mixed-layer thermal variability, effectively buffering SST trends in this region [48,65]. The central and northern Red Sea exhibit the highest SST warming trends (>0.30 °C/decade), with up to 0.4 °C/decade in the region north of 23°N along the western coast, exceeding the global mean ocean warming rate [2,45]. The basin mean SST trend over the Red Sea is about 0.31 ± 0.05 °C/decade, consistent with previous regional assessments and indicative of accelerated surface warming over recent decades [48,64].
The temporal evolution of the annual SAT and SST over the Red Sea for 1990–2024 (Figure 2c) shows statistically significant (p < 0.05) upward trends superimposed on pronounced interannual variability. SST transitioned from predominantly low values in the early 1990s to persistently high values after the mid-2000s, with particularly high temperatures observed since 2015. SAT shows a similar temporal evolution but exhibits greater interannual variability, reflecting a more rapid atmospheric response to radiative forcing. Notably, the highest SAT periods frequently coincide with SST peaks, highlighting the strong co-variability between atmospheric and oceanic warming at the basin scale.
This co-evolution of SAT and SST is consistent with enhanced downward longwave radiation, reduced evaporative cooling under weak wind conditions, and increased background greenhouse forcing, which collectively amplify surface heat accumulation in semi-enclosed basins [5,19,20]. In warming climates, increases in mean temperature shift the entire distribution of daily temperature anomalies toward higher values, thereby increasing the likelihood that moderate synoptic variability produces extreme threshold exceedances [17,19]. Consequently, the observed strengthening of both SAT and SST trends provides a thermodynamic foundation for the intensification of both AHWs and MHWs documented in subsequent sections.

3.2. Temporal Variability of AHWs and MHWs and Their Cooccurrence

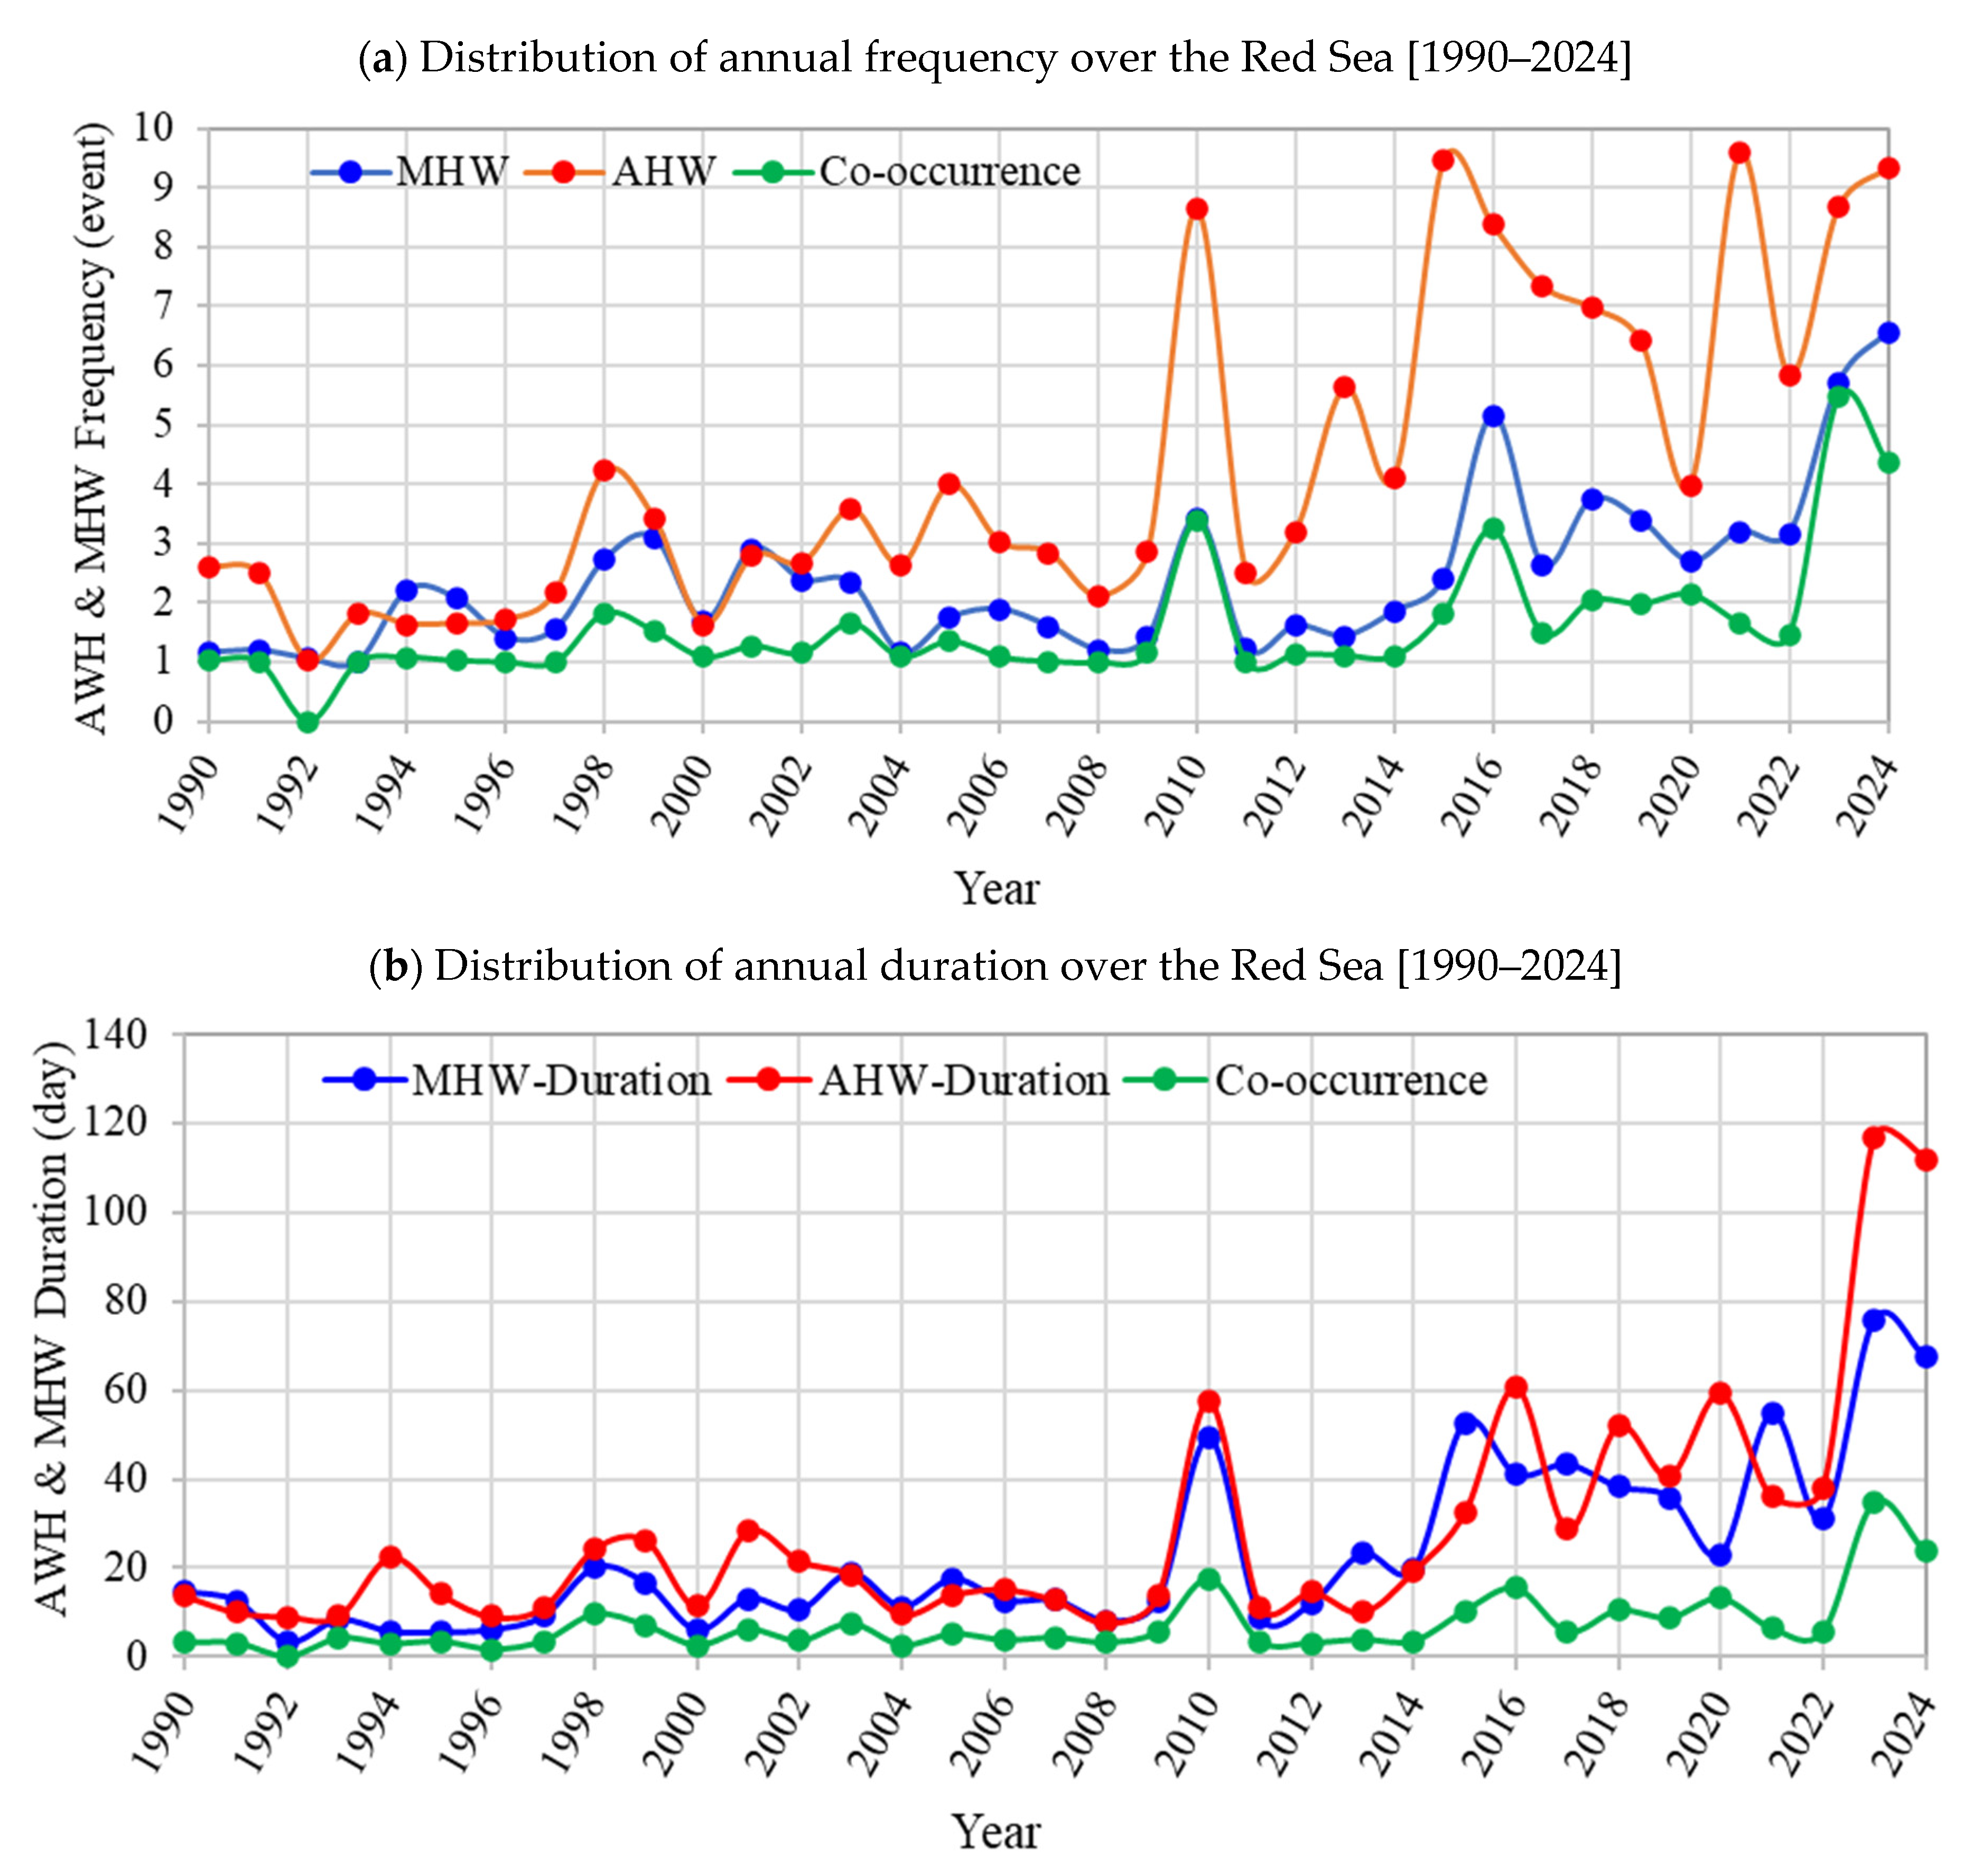
The temporal evolution of AHWs and MHWs and their cooccurrence over the Red Sea during 1990–2024 exhibit marked interannual variation, resulting in a clear long-term increase in both frequency and duration (Figure 3). All metrics shown in Figure 3 represent basin-averaged annual values derived from the spatial average of heatwave metrics across all Red Sea grid cells during each year. The pattern of these metrics captures the large-scale coherence of extreme thermal conditions and highlights basin-wide responses of the coupled atmosphere–ocean system to ongoing climate warming [5,16].
Throughout the study period, the Red Sea basin average AHW frequency consistently exceeded that of MHW frequency (Figure 3a). Over 1990–2024, the Red Sea experienced a mean basin of 151 AHW events, compared to 84 MHW events, indicating substantially more frequent atmospheric extremes. During the early 1990s, basin-averaged AHW frequency typically ranged from 1 to 3 events/year, while MHW frequency remained near 1 event/year. After 2010, both AHW and MHW frequencies increased markedly, with basin-averaged AHW frequency exceeding 8 events/year in several years, including 2010, 2015, 2016, 2021, 2023, and 2024 [12,32]. This systematic difference reflects the contrasting thermal response times of the atmosphere and ocean [5,37]. This vital difference explains why AHWs occur more frequently, while MHWs tend to be fewer but often more persistent once established.
Despite the lower overall frequency of MHWs, a substantial fraction of MHW activity occurs concurrently with AHWs. A total basin average of 56 concurrent AHW-MHW events is detected over the study period, corresponding to about 66% of all basin-averaged MHW occurrences under concurrent AHW conditions. In contrast, only about 37% of basin-averaged AHW occurrences coincide with MHWs. This asymmetry indicates that while AHWs frequently provide favorable thermodynamic conditions for MHW development, oceanic preconditioning, such as stratification strength, mixed-layer depth, and climate SST anomalies, remains a critical requirement for the manifestation of MHWs [19,20]. The incomplete concurrence between AHWs and MHWs reflects fundamental differences in the timescales of atmospheric and oceanic thermal responses. The atmosphere responds rapidly to radiative forcing and synoptic variability due to its low heat capacity, while the ocean integrates surface heat flux anomalies over longer periods due to heat storage in the mixed layer and advective processes [20,38]. Consequently, sea surface temperature anomalies may persist after extreme weather events have subsided, or they may occur under a pre-existing thermal gradient without simultaneously exceeding the atmospheric threshold.
Consistent with the frequency analysis, basin average durations of AHWs, MHWs, and concurrent events show a considerable increase over the study period (Figure 3b). Total basin average AHW duration increased from about 10–15 days/year in the early 1990s to more than 110 days/year in 2023 and 2024. MHW duration follows a similar but less pronounced behavior, rising from <15 days/year to about 75 days/year during extreme years (2023 and 2024).
The basin average duration of concurrent AHW-MHW events is generally below 5 days/year before 2000, while after 2010, it often exceeds 10–15 days/year, reaching a maximum of 35 days in 2023. Over the full period, the basin average concurrent duration of AHWs-MHWs is 249 days, highlighting the growing persistence of concurrent heatwaves across the basin. The marked increase in duration relative to frequency indicates a shift toward longer-lasting heatwave events, rather than simply more frequent ones. This behavior is consistent with global observations showing that climate warming extends the persistence of heatwaves by increasing baseline temperatures and reducing recovery periods between events [17,19]. Notably, Hobday [16] defined heatwaves using a seasonally varying threshold to detect both summer and winter heatwaves, as winter heatwaves can have a greater ecological impact on the marine ecosystem [30].
Both the frequency and duration of concurrent AHW-MHW events exhibit statistically significant positive trends over the period 1990–2024 (Figure 3a,b). The frequency of concurrent events increases at a rate of +0.6 ± 0.03 events/decade, while the total duration increases by about +5.5 ± 1.1 days/decade. These results indicate not only that concurrent heatwaves are becoming more common, but also that they are persisting for longer periods.
Several years stand out as exhibiting particularly increased concurrent heatwave activity, notably 2010, 2016, and 2023. These years coincide with strong positive anomalies in both SAT and SST (see Figure 2c). Similar clustering of extreme AHW and MHW events during these years has been reported in global assessments of heatwaves [17,19,41]. These peak years also coincide with major large-scale climate modes, including strong El Niño events (e.g., 2010 and 2016), which have been shown to modulate regional atmospheric circulation and upper-ocean heat content in semi-enclosed basins through teleconnected adjustments in wind stress and heat flux patterns [19,41]. Although the Red Sea is not directly within the Pacific ENSO domain, remote forcing may modulate background conditions that favor concurrent heatwaves.

3.3. Spatial Analysis of Mean AHWs, MHWs, and Their Cooccurrence

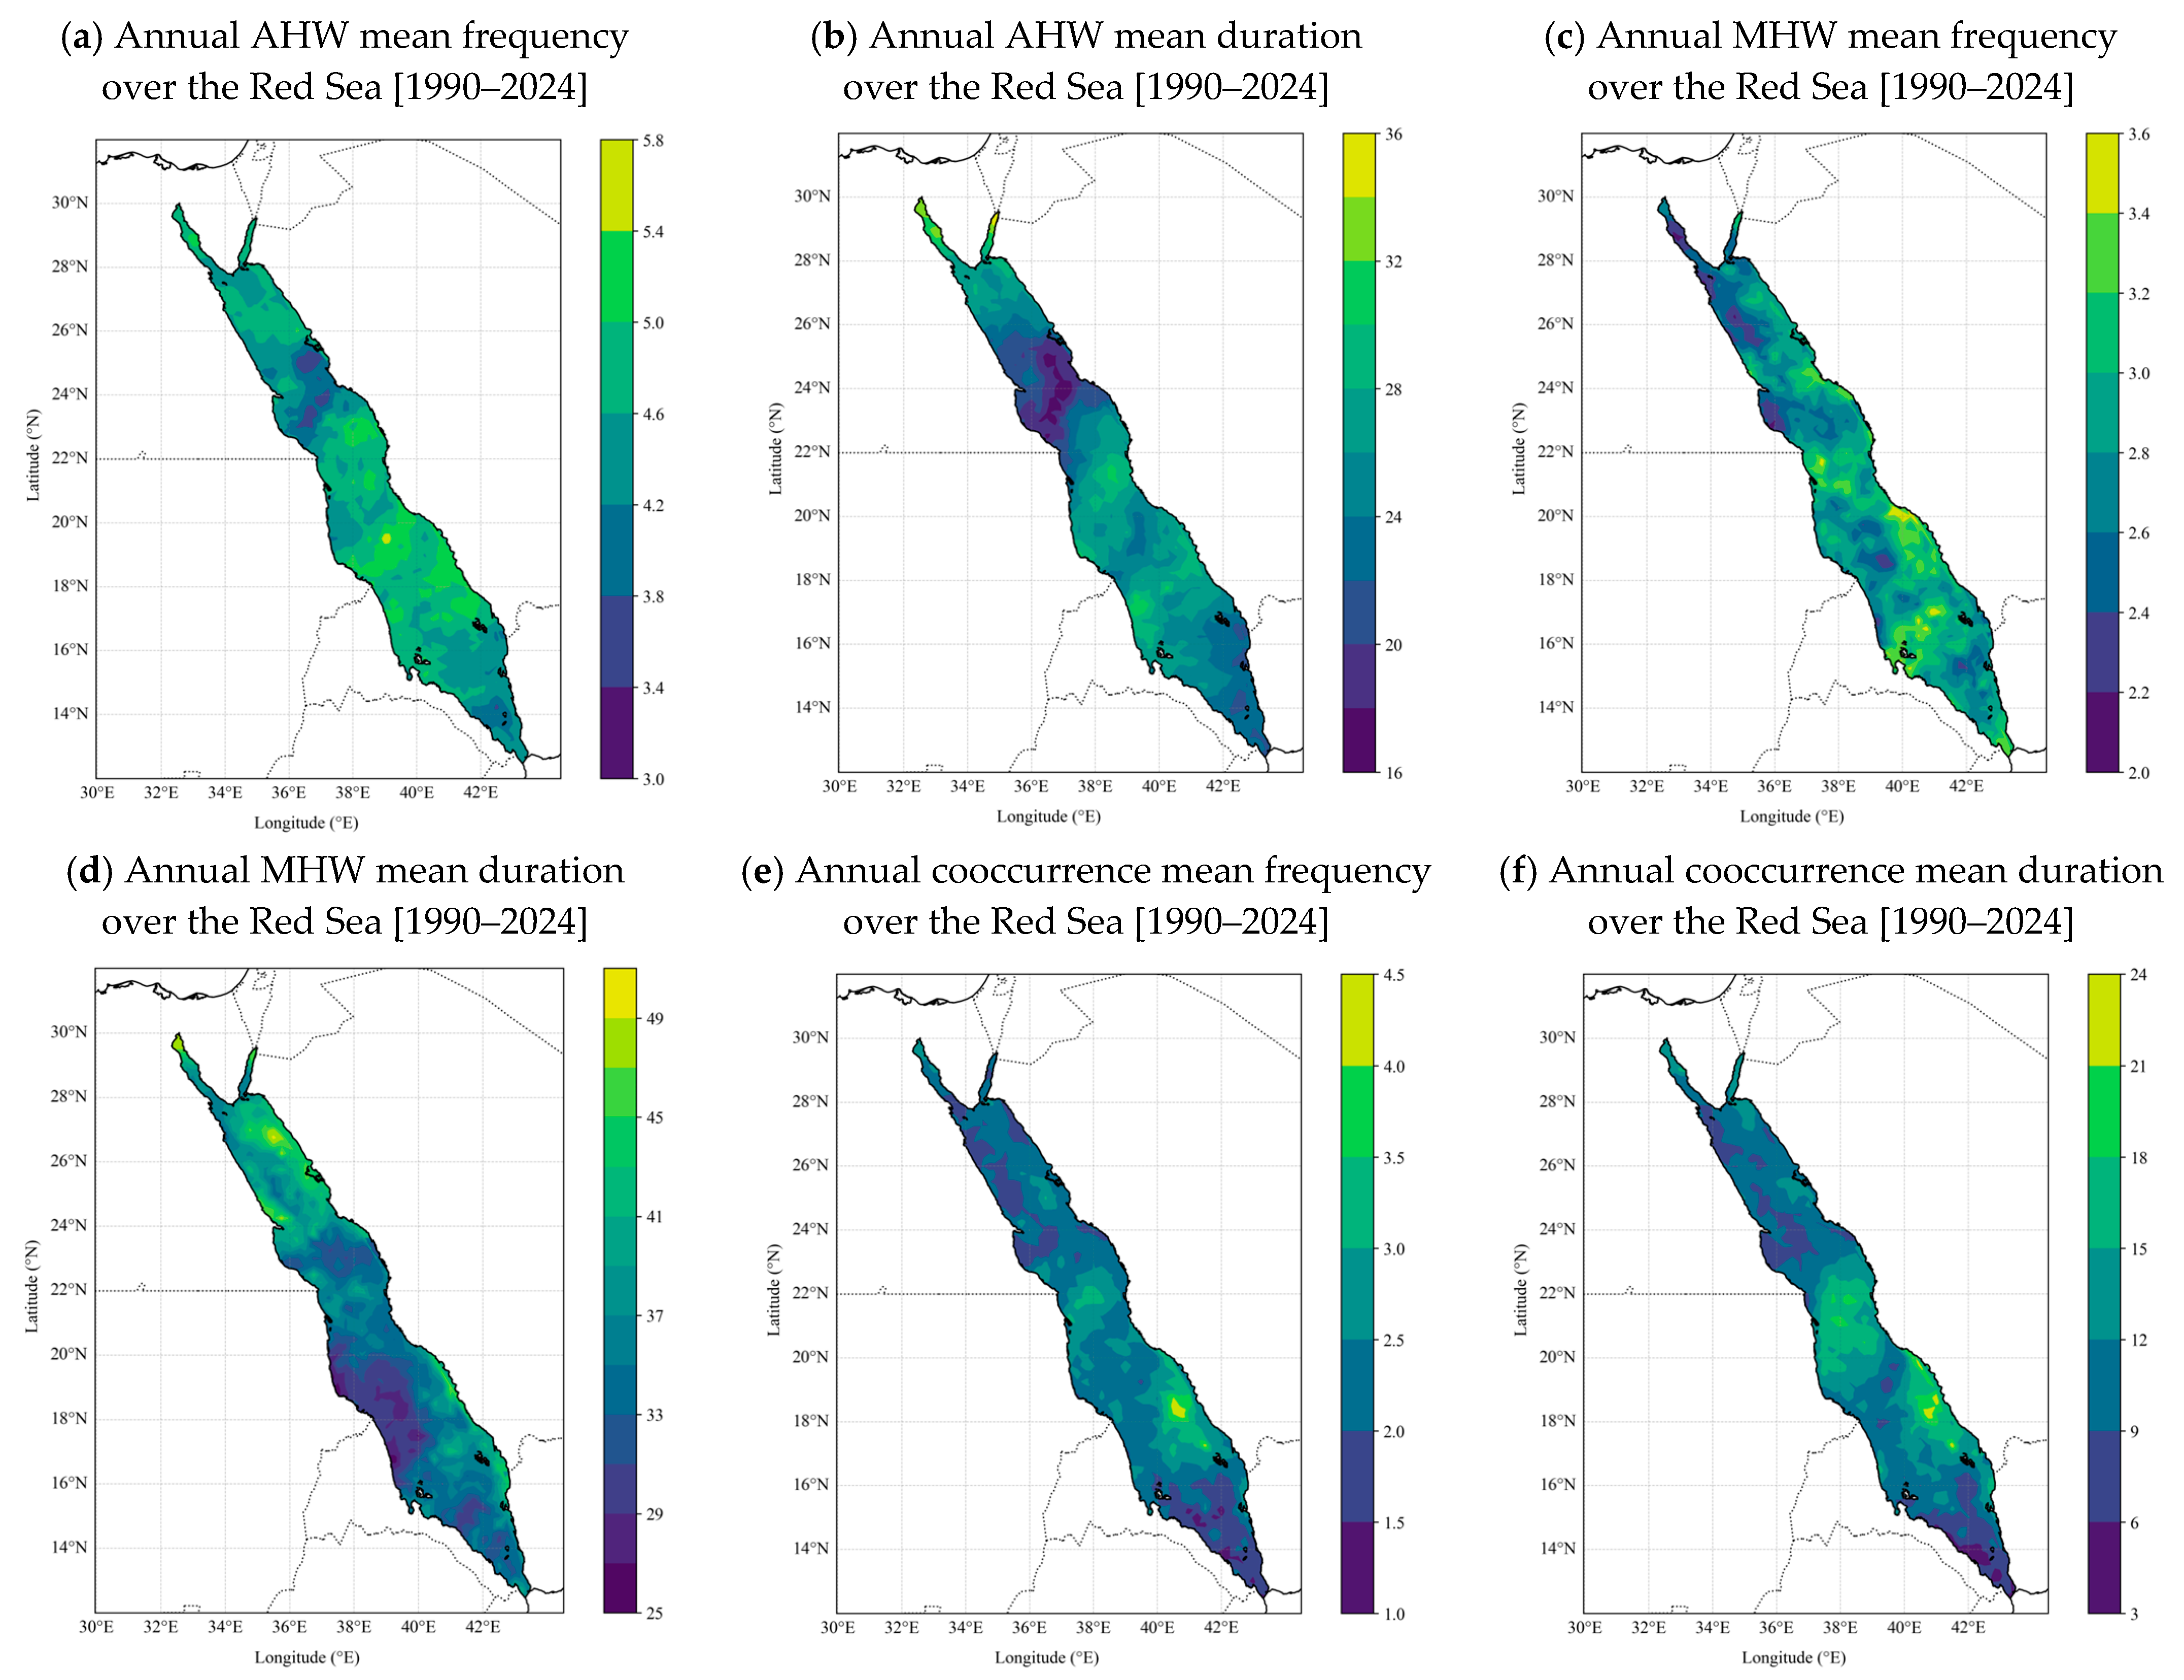
The annual mean AHW frequency exhibits a clear spatial heterogeneity across the Red Sea (Figure 4a), with values ranging from 3 to 5.8 events/year. The highest AHW frequencies (5–5.8 events/year) are detected in the central and south-central Red Sea (18–23°N), while lower frequencies (3–3.6 events/year) characterize the northern and north-central basin and parts of the far southern Red Sea near the Bab El-Mandeb Strait (Figure 4a). This distribution indicates that AHWs are most recurrent in the central basin, where persistent subsidence, clear-sky conditions, and regional circulation patterns favor repeated near-surface warming [5,11]. In contrast, the southern Red Sea is more strongly influenced by seasonal circulation and enhanced synoptic variability associated with the Gulf of Aden, which disrupts the persistence of atmospheric blocking and limits the recurrence of heatwave events [65,66].
The spatial pattern of AHW duration differs from that of frequency (Figure 4b). Annual mean durations range from about 16 to 36 days/year, with the longest AHWs (30–36 days/year) occurring in the southern and south-central Red Sea (16–22°N) and a secondary maximum in the far northern basin. In contrast, shorter durations (16–20 days/year) dominate the central Red Sea (22–26°N).
The annual mean MHW frequency ranges from 2 to 3.6 events/year across the Red Sea basin (Figure 4c). The highest MHW frequencies (3.2–3.6 events/year) occur primarily in the southern Red Sea between 15 and 18°N, with a secondary maximum in the central eastern basin (20–22°N), as indicated in the previous studies [36,47]. The lowest frequencies (2–2.4 events/year) are detected in the northern Red Sea (22–30°N), particularly in the western basin along the Egyptian coast. This spatial pattern indicates a southward enhancement of MHW occurrence and highlights strong spatial heterogeneity rather than a simple latitudinal gradient [39].
In contrast, MHW duration displays a clear northward intensification (Figure 4d). Annual mean MHW durations range from 25 to 50 days/year, with the longest duration (45–50 days/year) occurring in the northern Red Sea (north of 24°N), while the shortest durations (25–30 days/year) dominate the southern Red Sea (south of 18°N). This inverse pattern between frequency and duration indicates that MHWs in the north are fewer but substantially longer-lived. The longer MHW durations in the northern Red Sea are likely linked to deeper mixed layers, reduced wind-driven mixing variability, and weaker lateral heat exchange, which allow sustained heat storage and persistence of SST anomalies [35,46].
The spatial map of AHW-MHW cooccurrence reveals patterns that more closely resemble MHW frequency than AHW frequency (Figure 4e,f). Cooccurrence frequency ranges from about 1 to 4.5 events/year, with the highest values (3.5–4.5 events/year) concentrated in the southern Red Sea (17–19°N). The lowest frequencies (1–1.5 events/year) characterize both northern (north of 22°N) and southern (south of 17°N) parts of the Red Sea basin. This correspondence indicates that concurrent events are more likely to occur in regions where MHWs are more frequent. Similarly, the AHW-MHW cooccurrence duration ranges from about 3 to 24 days/year, with the longest concurrent events (18–24 days/year) observed in the southern and southeastern Red Sea (17–23°N). The shorter cooccurrence durations (3–8 days/year) dominate the northern basin (north of 23°N) and southern parts (south of 17°N). The spatial alignment of cooccurrence frequency and duration with AHW rather than MHW suggests that AHW persistence plays a primary role in prolonged concurrent events across the Red Sea basin [20,39,67]. The spatial mismatch between AHW and MHW cooccurrence metrics, particularly in the southern basin, reflects the dominant role of ocean dynamics (e.g., horizontal advection and exchange with the Gulf of Aden), which can decouple SST variability from local atmospheric forcing.

3.4. Correlation Patterns Between AHW and MHW

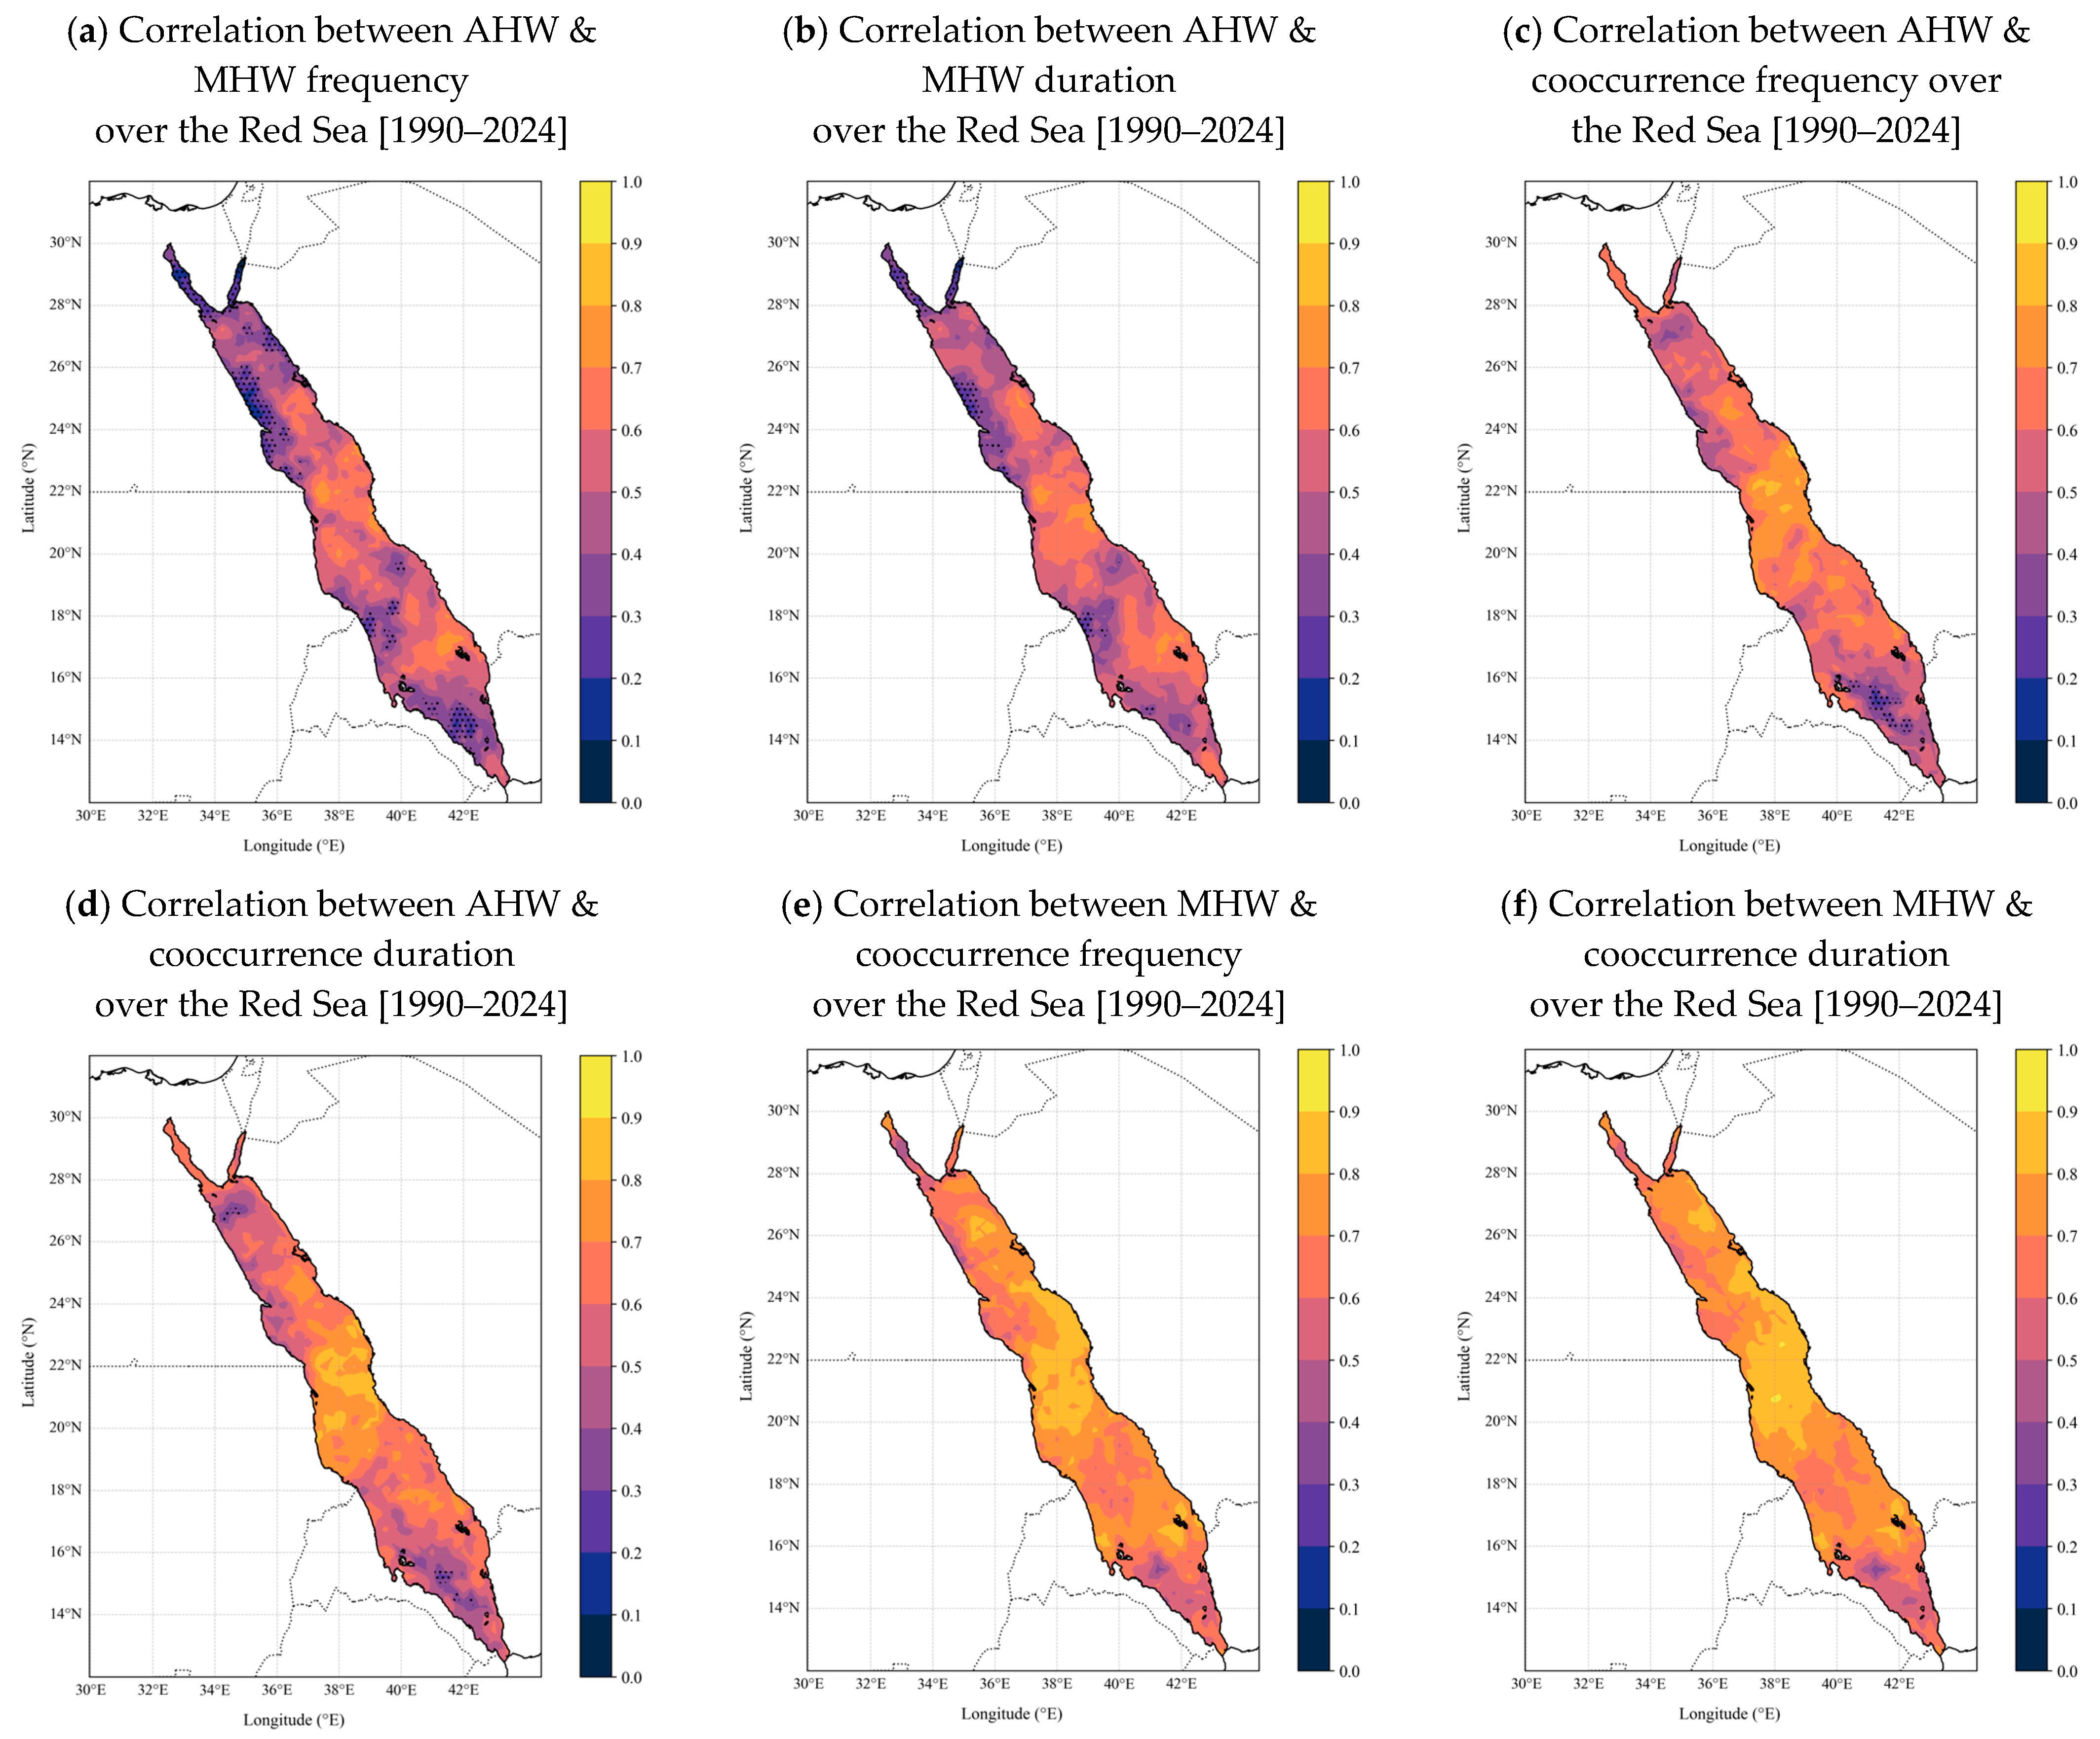
Spatial correlation analysis is used to quantify statistical relationships between AHW and MHW metrics across the Red Sea. Spearman rank correlation coefficients are computed at each grid point using annual time series (1990–2024), as this non-parametric method is more robust for non-normal, non-linear, and autocorrelated climate data. Statistical significance (p < 0.05) is estimated using effective sample sizes that account for temporal autocorrelation. Positive significant (p < 0.05) correlations are detected between AHW and MHW frequency across most of the Red Sea basin (Figure 5a), with coefficients generally ranging from about 0.2 to 0.9. The strong correlations (r ≈ 0.6–0.9) occur in the central Red Sea (18–23°N), while the nonsignificant (p ≥ 0.05) correlations are mostly found south of 18°N and north of 23°N along the Egyptian coast.
A similar, but more coherent, pattern is evident in the correlations between AHW and MHW duration (Figure 5b). Positive significant (p < 0.05) correlations dominate most of the basin, with values typically ranging from 0.4 to 0.9, and the highest correlations occur in the central Red Sea (18–23°N). This indicates that prolonged AHWs are statistically associated with longer MHW duration, although this relationship does not establish a causal mechanism. The lowest correlations (r ≈ 0.2–0.4) are detected in the northern parts (north of 23°N) and in the southern basin (south of 18°N).
Correlations between AHW and AHW-MHW cooccurrence metrics are consistently higher than those between AHWs and MHWs alone (Figure 5c,d). The correlation between AHW frequency and cooccurrence frequency (Figure 5c) exhibits widespread significant (p < 0.05) high correlations, typically ranging from 0.5 to 0.9, with peak correlations in the most central parts of the Red Sea (18–23°N). In contrast, the lowest correlations (r < 0.5) are found in the rest of the basin. This result highlights the strong statistical association of atmospheric forcing in the formation of concurrent heatwaves, but does not provide evidence of physical causality. Additionally, strong correlations are detected between AHW duration and cooccurrence duration (Figure 5d). Correlation coefficients are mostly significant (p < 0.05) and have a range between 0.2 and 0.8, with high values in the central Red Sea and slightly lower but still positive values (r ≈ 0.4–0.7) toward the north of 23°N and south of 18°N.
Correlations between MHW and cooccurrence metrics also reveal statistically strong coupling but with high spatial variability (Figure 5e,f). The correlation between MHW frequency and cooccurrence frequency (Figure 5e) and duration (Figure 5f) remains high and significant (p < 0.05) over the Red Sea, particularly in the central region (r ≈ 0.4–0.9). These correlations weaken toward the southern basin (south of 18°N), where the ocean processes (e.g., horizontal advection, ventilation, and exchange with the Gulf of Aden) could have an impact on the SST variability [65,66].
Overall, the central Red Sea (18–23°N) consistently appears as the region with the strongest statistical correlation between AHWs, MHWs, and concurrent metrics. Whereas, the southern (south of 18°N) and the northern (north of 23°N) Red Sea exhibit comparatively low correlations, indicating a significant role for oceanic dynamics independent of direct atmospheric forcing [39]. This reduced coupling in the southern basin is consistent with stronger horizontal advection and seasonal exchange through the Bab El-Mandeb Strait, which can introduce thermal anomalies independent of local atmospheric forcing [46,65,66]. Such dynamical processes could weaken the correlations between AHW and MHW metrics and explain the spatial heterogeneity observed in the correlation maps. These correlation patterns indicate strong statistical co-variability between AHWs and MHWs, particularly in the central Red Sea. Notably, correlation alone does not necessarily imply physical atmosphere–ocean coupling or causality, so observed correlations should therefore be interpreted as indicative of statistical relationships rather than direct atmospheric control of MHWs.

3.5. Concurrent Percentage of AHWs and MHWs

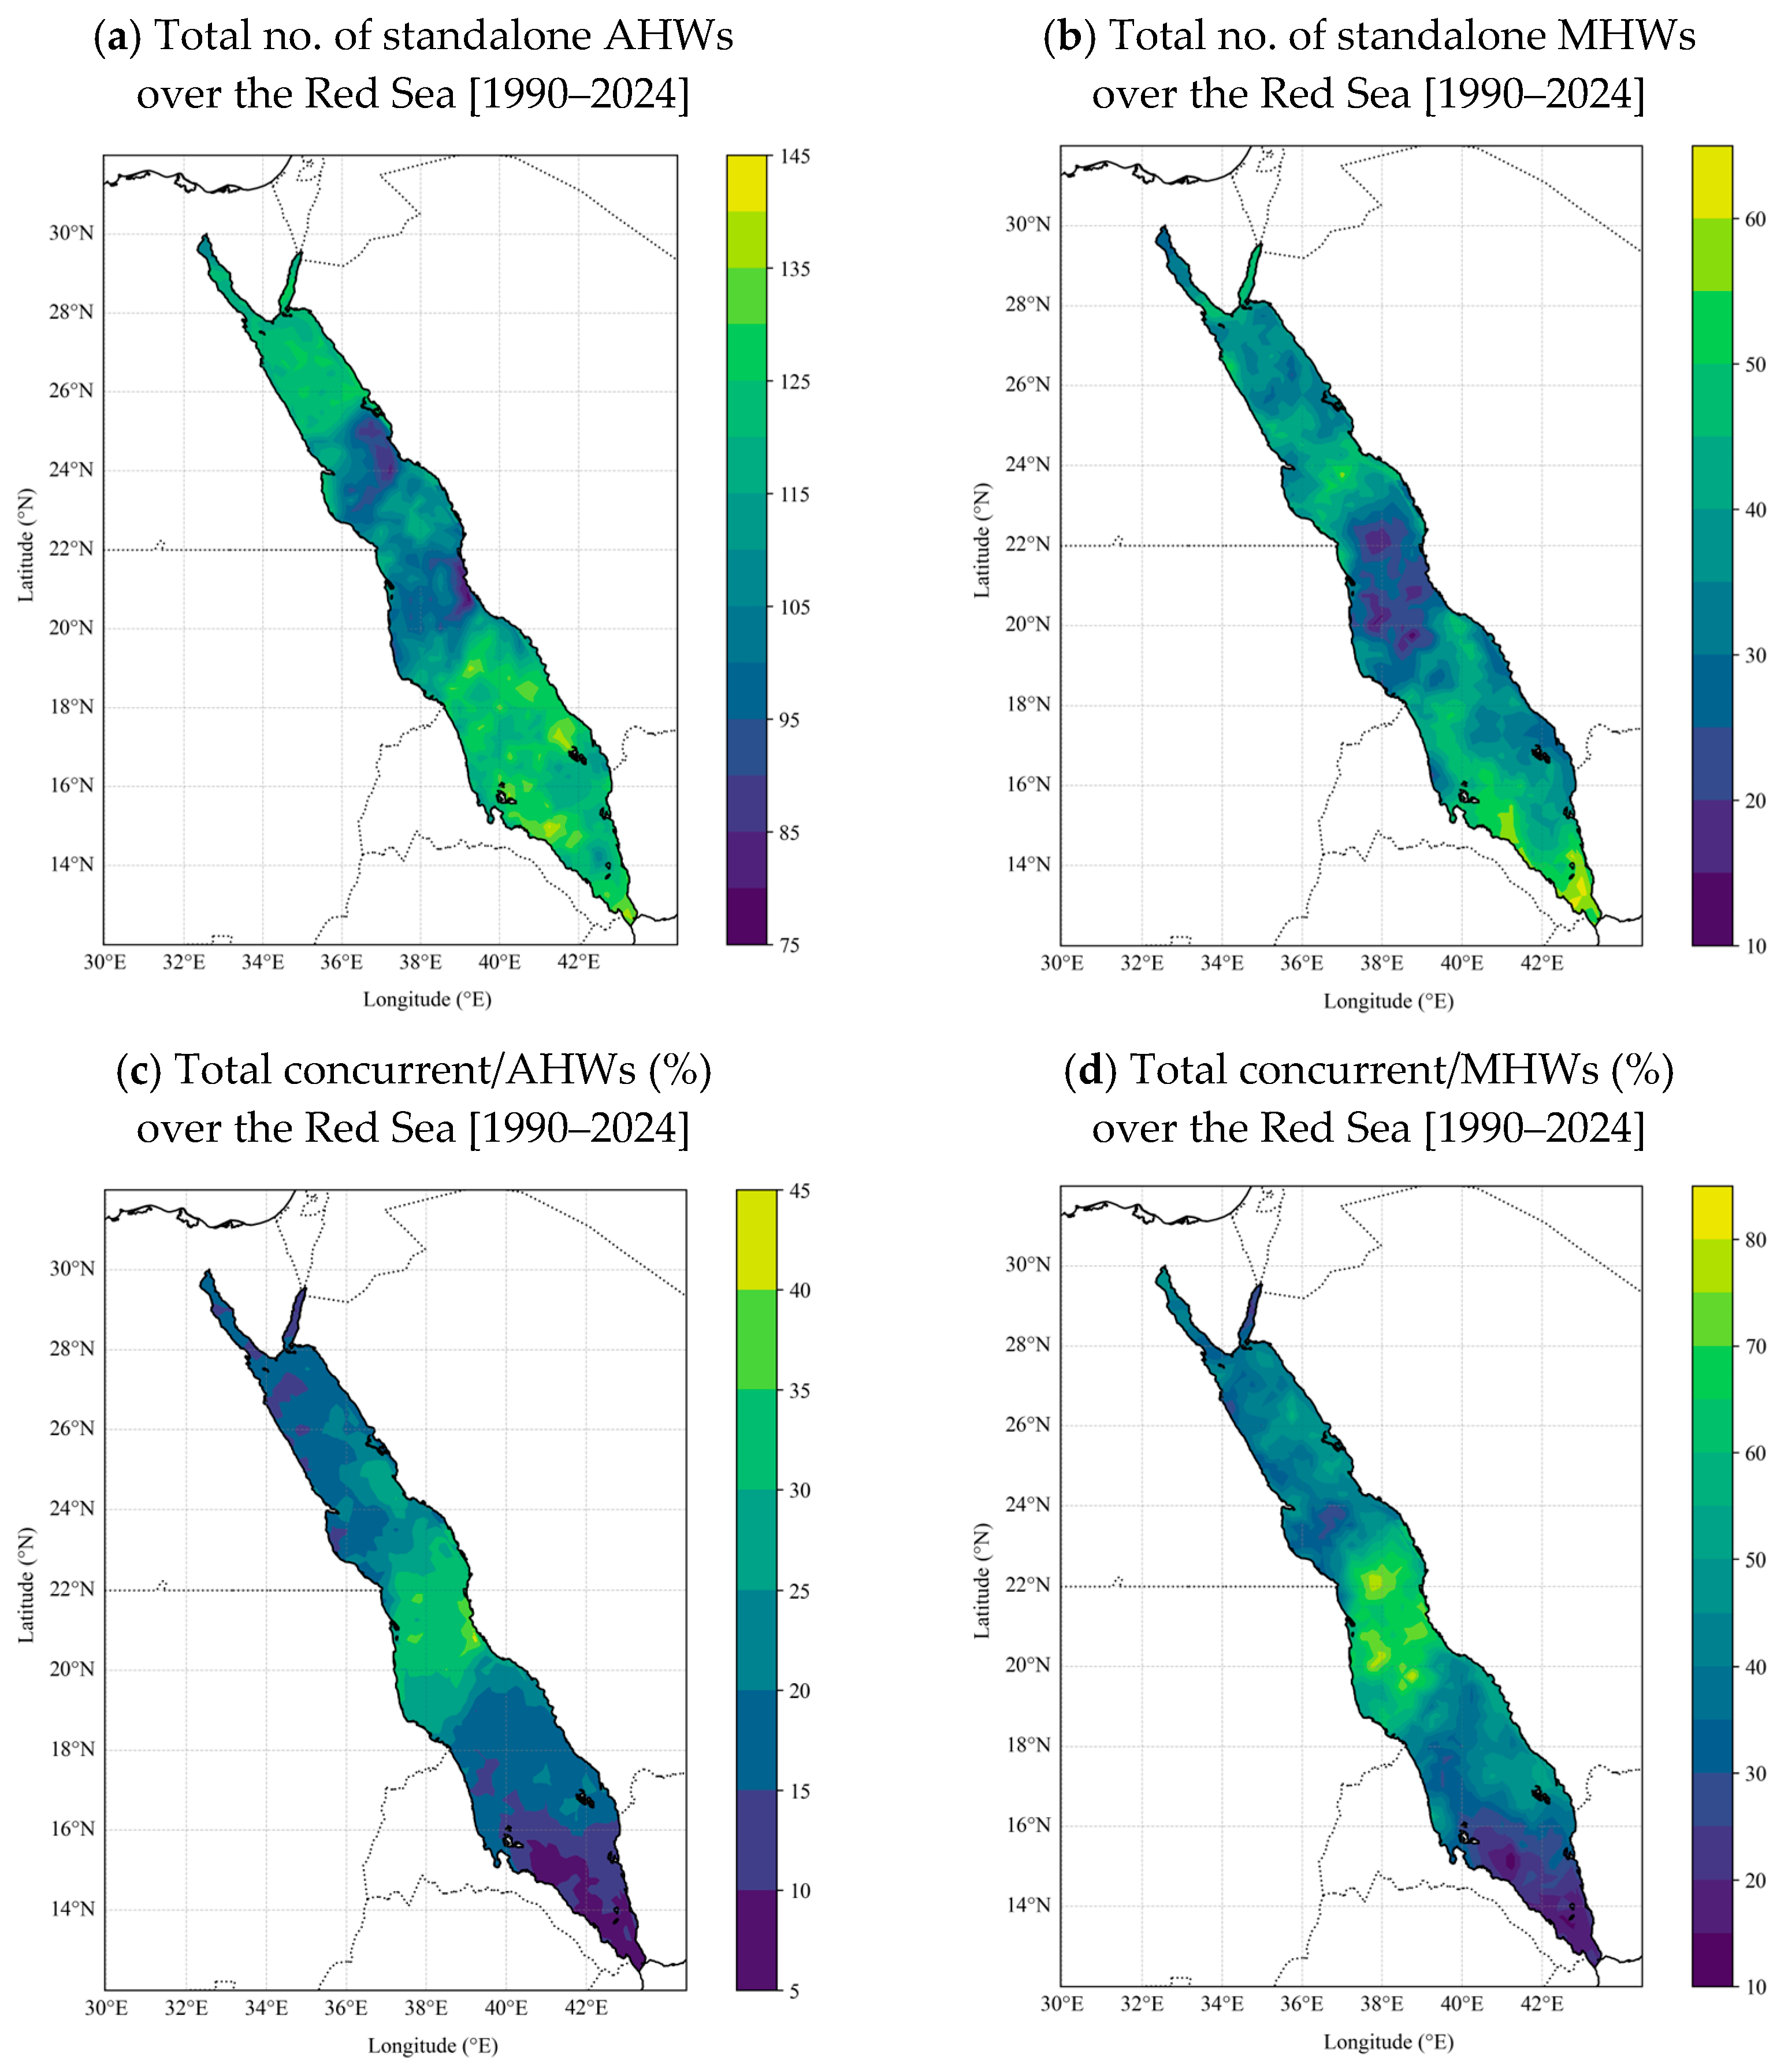
In this section, we will investigate the spatial distributions of standalone AHWs and standalone MHWs, the conditional percentages of concurrent events relative to each heatwave type during the period 1990–2024. The spatial distribution of standalone and concurrent heatwave events provides additional insight into the relative dependence between AHW and MHW events (Figure 6). The total number of standalone AHW events ranges from about 75 to 145 over the 1990–2024 period (Figure 6a). The highest standalone AHWs are most frequent in the southern and northern Red Sea, with about 115–130 events (Figure 6a). In contrast, the central Red Sea exhibits lower standalone AHW events, typically below 100 events. These findings highlight that the standalone AHWs are not always sufficient to generate MHWs, particularly in regions where oceanic heat redistribution mechanisms remain effective [46,65,66].
Total standalone MHW events range from about 10 to 65 events (Figure 6b). The highest standalone MHW frequencies are most common in the southern Red Sea, especially near the Bab El-Mandeb Strait (south of 18°N), where values commonly exceed 50 events. Low standalone MHW (35–50) events also appear in parts of the northern basin, while the central Red Sea (18–23°N) exhibits the lowest occurrence, typically below 15–35 events. The occurrence of standalone MHWs emphasizes that ocean dynamics can independently govern SST extremes, particularly in regions characterized by strong circulation variability and external oceanic influences [20,37]. The occurrence of the standalone MHWs (about 34%) indicates that oceanic processes can independently generate MHWs without requiring concurrent AHWs. Oceanic heat storage within a stratified mixed layer allows accumulated subsurface thermal anomalies to re-emerge at the surface under weak mixing conditions [19,44]. In addition, horizontal advection from the Gulf of Aden and eddy-driven variability in the southern Red Sea can create SST anomalies independently of local concurrent AHWs [65,66]. These dynamical processes weaken the linear dependence between AHWs and MHWs and explain the reduced coupling observed in the southern Red Sea basin.
The percentages of relative cooccurrence of MHWs (concurrent/MHW, %) and AHWs (concurrent/AHW, %) are shown in Figure 6. Across the basin, the concurrent/AHW percentage ranges from 5% to 40% (Figure 6c), whereas the concurrent/MHW percentage covers a broader range from 10% to 80% (Figure 6d). High concurrent/AHW values (30–40%) are located in the central Red Sea (18–23°N), indicating that MHWs are associated with a significant fraction of AHWs in this region. In contrast, the southern Red Sea exhibits much lower concurrent/AHW values (5–20%), implying that most AHWs do not induce a sustained oceanic response. The concurrent/MHW percentage generally exceeds the concurrent/AHW percentage across the basin, indicating that MHWs are more conditionally associated with AHWs than vice versa. In the central Red Sea, the concurrent/MHW values frequently exceed 60%, which is the consistent with the stronger statistical correlations identified in the correlation analysis (Figure 5). Toward the southern basin, concurrent/MHW values decrease to below 30%, indicating that MHWs often develop as standalone events due to the greater role of ocean dynamics independent of atmospheric forcing.

3.6. Decadal Trends in the Frequency and Duration of Heatwaves

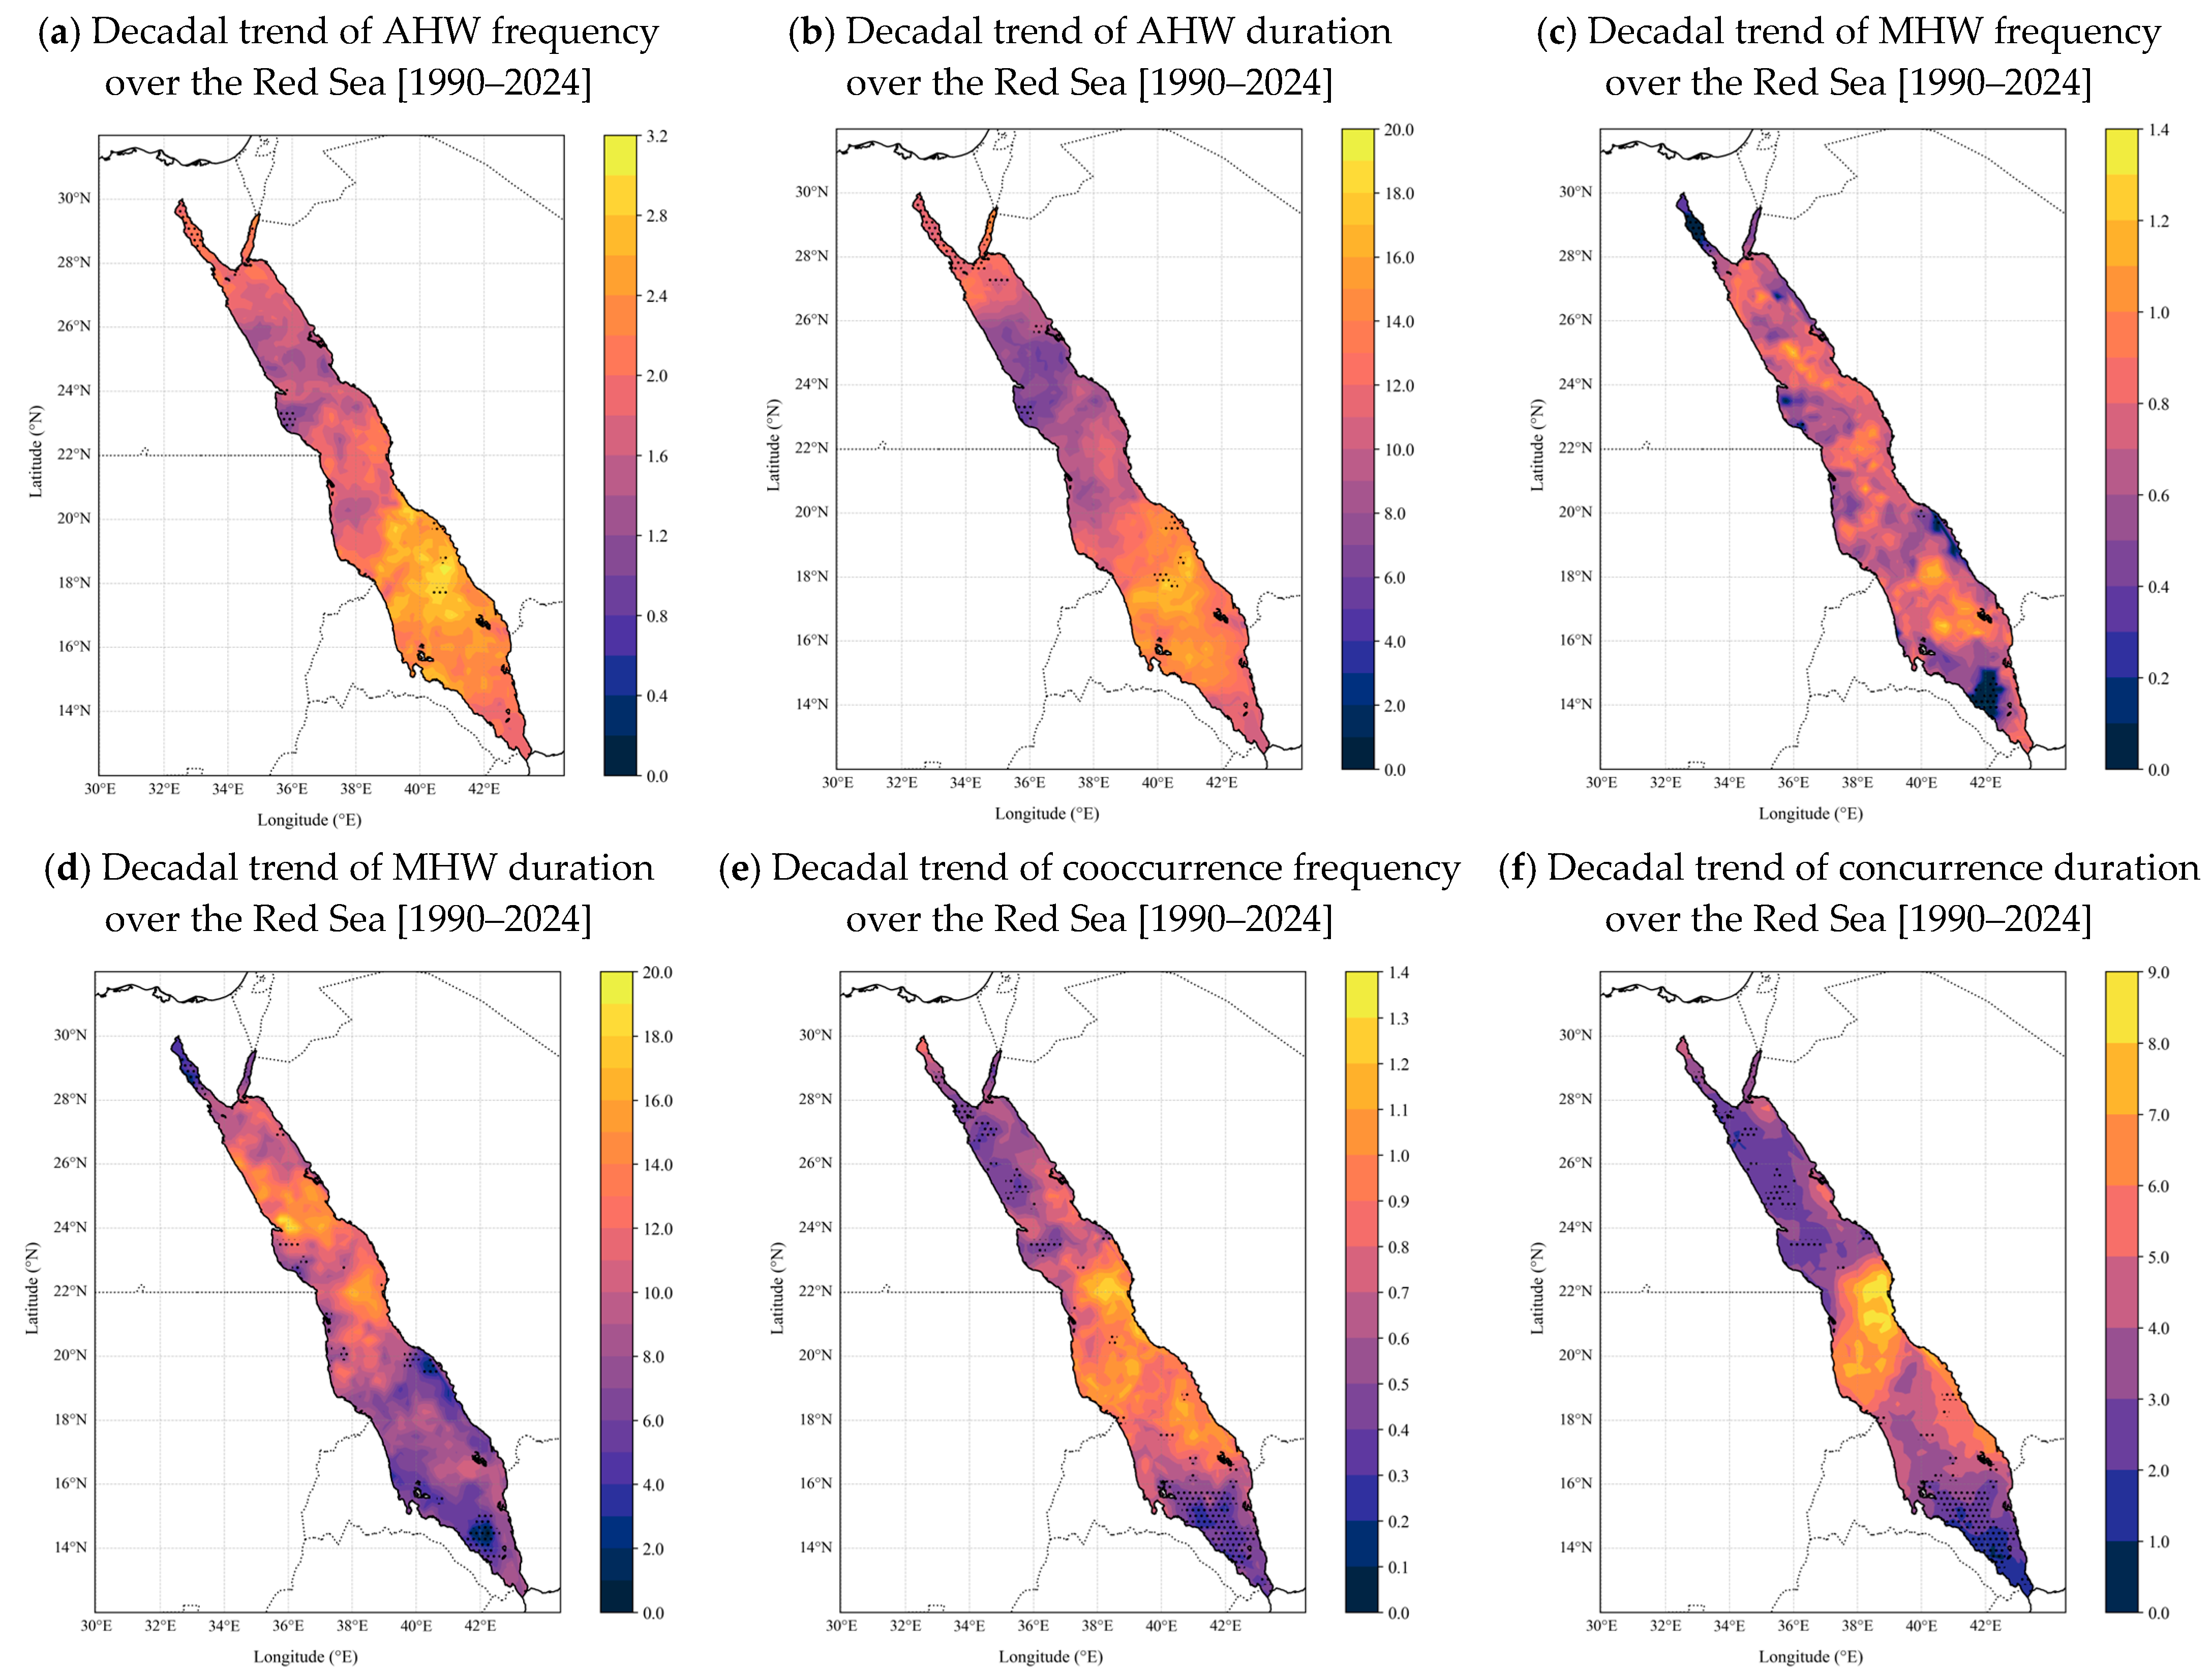
The spatial distribution of the decadal trends in all heatwave metrics reveals significant (p < 0.05) increasing trends across the Red Sea (Figure 7). The decadal trends in AHW frequency show basin-wide statistically significant positive trends (Figure 7a), as determined using Sen’s slope and modified Mann–Kendall testing. The highest positive trends, exceeding 3 events/decade, are located in the southern Red Sea, while the lowest positive trends (<1 event/decade) dominate the central Red Sea, particularly along the coasts of southern Egypt and northern Sudan, and some part of the northern Saudi Arabian shoreline. Trends in AHW duration exhibit widespread statistically significant (p < 0.05) positive values across the Red Sea basin (Figure 7b), demonstrating that AHWs are not only occurring more frequently but are also lasting longer. The highest increasing-duration trends are detected in the southern and northern Red Sea, where trends locally exceed 15 days/decade, while the lowest positive trends are detected in the central Red Sea basin.
Decadal trends in MHW frequency are statistically significant positive across the Red Sea, ranging from about 0.3 to 1.3 events/decade (Figure 7c) as revealed by Mohamed et al. [47]. The central region between western Saudi Arabia and Eritrea exhibits the strongest positive trend in MHW frequency (>0.5 events/decade). In contrast, the lowest MHW frequency positive trends (<0.2 events/decade) occur toward the southern basin. Trends in MHW duration reveal a clear basin-wide statistically significant trend toward longer-lasting MHW events, with durations ranging from 1 to 20 days/decade (Figure 7d). The highest positive MHW duration trends (>10 days/decade) are found in the northern basin (north of 23°N). The southern Red Sea region displays lower positive MHW duration trends of less than 14 days/decade (Figure 7d).
The trend of concurrent AHW-MHW events is shown in Figure 7e,f. Both the frequency and duration of concurrent events exhibit spatially coherent, significant (p < 0.05) positive trends across most of the Red Sea. The central Red Sea (18–23°N) shows high-frequency trends exceeding 0.5–1.4 events/decade and duration trends locally exceeding 3 days/decade, highlighting this region as a hotspot of intensifying concurrent heatwaves. The spatial coherence of these increasing concurrent trends suggests that background warming is progressively increasing the probability of simultaneous AHW and MHW exceedances. As mean SAT and SST rise, fewer anomalous synoptic conditions are required to trigger concurrent heatwaves, thereby increasing both frequency and duration [17,19,40]. This non-linear amplification mechanism has been identified as a defining characteristic of compound climate extremes under continued anthropogenic warming.

4. Conclusions

This study provides a comprehensive assessment of the spatial and temporal characteristics of atmospheric heatwaves (AHWs), marine heatwaves (MHWs), and their concurrent occurrence across the Red Sea during 1990–2024, based on satellite-derived sea surface temperature (SST) from NOAA OISST v2.1 and reanalysis surface air temperature (SAT) from ERA5. By explicitly leveraging satellite-derived foundation OISST Level-4 (L4) products and satellite-constrained atmospheric reanalysis, this study demonstrates the value of integrated remote sensing frameworks for detecting concurrent AHW-MHW events in data-sparse and semi-enclosed basins.
Both SAT and SST exhibit statistically significant (p < 0.05) basin-wide increasing (warming) trends, with SAT increasing at 0.4 ± 0.07 °C/decade and SST at 0.31 ± 0.05 °C/decade. The highest statistically significant (p < 0.05) trends are observed in the central and northern Red Sea, based on the modified Mann–Kendall test and Sen’s slope estimation. The observed warming was accompanied by significant increases in both the frequency and duration of AHWs and MHWs, particularly after 2010. The concurrent AHW-MHW frequency and duration exhibit significant increasing trends, with the central Red Sea showing the most pronounced intensification of concurrent events.
A key finding of this study is that about 66% of MHWs occur concurrently with AHWs, highlighting the dominant influence of atmospheric forcing in driving MHWs. The remaining fraction (34%) of standalone MHWs could be due to oceanic processes, such as stratification, horizontal advection, and exchange through the Bab El-Mandeb Strait. This highlights the crucial role of both atmospheric forcing and oceanic processes in the development of MHWs. The central Red Sea emerges as a hotspot of strong statistical co-variability, likely resulting from the combined influence of persistent atmospheric subsidence, reduced wind-driven mixing, shallow mixed-layer variability, and enhanced radiative heating. Conversely, the southern Red Sea shows less cooccurrence, consistent with the dominant role of ocean dynamics, including ventilation and lateral heat transport from the Gulf of Aden. These different regimes suggest that the risk of concurrent heatwaves is spatially heterogeneous across the Red Sea basin and governed by regionally distinct physical mechanisms. Overall, this study highlights the necessity of integrating atmospheric and oceanic perspectives when assessing heatwave variability and compound extreme risk in the Red Sea. The increasing frequency and duration of both standalone and concurrent heatwaves highlight growing climate risks for this ecologically and socio-economically important basin. Accounting explicitly for the concurrent events’ behavior is critical for improving heatwave monitoring, forecasting, and climate adaptation strategies in the Red Sea basin. Future work should further investigate the relative contributions of surface heat fluxes, wind stress variability, mixed-layer depth, and large-scale climate modes, as well as explore lagged and causal relationships, to enhance a more mechanistic understanding and improve predictive capability of concurrent heatwave dynamics.

Author Contributions

Conceptualization, H.N. and B.M.; methodology, M.M.; software, H.A.; validation, A.E.S., A.A. and H.A.; formal analysis, B.M.; investigation, H.N.; resources, H.N. and M.M.; data curation, M.M. and H.A.; writing—original draft preparation, M.M. and A.A.; writing—review and editing, H.A., B.M. and A.E.S.; visualization, M.M.; supervision, H.N. All authors have read and agreed to the published version of the manuscript.

Funding

The project was funded by KAU Endowment (WAQF) at King Abdulaziz University, Jeddah, Saudi Arabia. The authors, therefore, acknowledge with thanks WAQF and the Deanship of Scientific Research (DSR) for technical and financial support.

Data Availability Statement

The sea surface temperature dataset used in this work is publicly available online through the National Oceanic and Atmospheric Administration (NOAA; https://www.ncei.noaa.gov/data/sea-surface-temperature-optimum-interpolation/v2.1/access/avhrr/; accessed on 25 June 2025); the near-surface air temperature dataset was obtained from the European Centre for Medium-Range Weather Forecasts (ECMWF) ERA5 (https://cds.climate.copernicus.eu/cdsapp#!/dataset/reanalysis-era5-single-levels; accessed on 30 June 2025).

Conflicts of Interest

The authors declare no conflicts of interest.

References

  1. IPCC. Annex II: Acronyms, Chemical Symbols and Scientific Units. In Climate Change 2023: Synthesis Report. Contribution of Working Groups I, II and III to the Sixth Assessment Report of the Intergovernmental Panel on Climate Change; Fischlin, A., Jung, Y., Leprince-Ringuet, N., Ludden, C., Péan, C., Romero, J., Eds.; IPCC: Geneva, Switzerland, 2023; pp. 131–133. [Google Scholar] [CrossRef]
  2. IPCC. Climate Change 2021: The Physical Science Basis. Contribution of Working Group I to the Sixth Assessment Report of the Intergovernmental Panel on Climate Change; Masson-Delmotte, V., Zhai, P., Pirani, A., Connors, S.L., Péan, C., Berger, S., Caud, N., Chen, Y., Goldfarb, L., Gomis, M.I., et al., Eds.; Cambridge University Press: Cambridge, UK; New York, NY, USA, 2021. [Google Scholar] [CrossRef]
  3. Seneviratne, S.I.; Zhang, X.; Adnan, M.; Badi, W.; Dereczynski, C.; Di Luca, A.; Ghosh, S.; Iskandar, I.; Kossin, J.; Lewis, S.; et al. Weather and climate extreme events in a changing climate. In Climate Change 2021: The Physical Science Basis; Masson-Delmotte, V., Zhai, P., Pirani, A., Connors, S.L., Eds.; Cambridge University Press: Cambridge, UK, 2021; pp. 1513–1766. [Google Scholar] [CrossRef]
  4. Fischer, E.M.; Knutti, R. Anthropogenic contribution to global occurrence of heavy-precipitation and high-temperature extremes. Nat. Clim. Change 2015, 5, 560–564. [Google Scholar] [CrossRef]
  5. Perkins-Kirkpatrick, S.E.; Lewis, S.C. Increasing trends in regional heatwaves. Nat. Commun. 2020, 11, 3357. [Google Scholar] [CrossRef]
  6. Perkins, S.E.; Alexander, L.V. On the measurement of heat waves. J. Clim. 2013, 26, 4500–4517. [Google Scholar] [CrossRef]
  7. Vogel, M.M.; Orth, R.; Cheruy, F.; Hagemann, S.; Lorenz, R.; van den Hurk, B.J.; Seneviratne, S.I. Regional amplification of projected changes in extreme temperatures strongly controlled by soil moisture–temperature feedbacks. Geophys. Res. Lett. 2017, 44, 1511–1519. [Google Scholar] [CrossRef]
  8. Raymond, C.; Matthews, T.; Horton, R.M. The emergence of heat and humidity too severe for human tolerance. Sci. Adv. 2020, 6, eaaw1838. [Google Scholar] [CrossRef]
  9. Lelieveld, J.; Hadjinicolaou, P.; Kostopoulou, E.; Chenoweth, J.; El Maayar, M.; Giannakopoulos, C.; Hannides, C.; Lange, M.A.; Tanarhte, M.; Tyrlis, E.; et al. Climate change and impacts in the Eastern Mediterranean and the Middle East. Clim. Change 2012, 114, 667–687. [Google Scholar] [CrossRef] [PubMed]
  10. Miralles, D.G.; Teuling, A.J.; van Heerwaarden, C.C.; Vilà-Guerau de Arellano, J. Mega-heatwave temperatures due to combined soil desiccation and atmospheric heat accumulation. Nat. Geosci. 2014, 7, 345–349. [Google Scholar] [CrossRef]
  11. Horton, R.M.; Mankin, J.S.; Lesk, C.; Coffel, E.; Raymond, C. A review of recent advances in research on extreme heat events. Curr. Clim. Change Rep. 2016, 2, 242–259. [Google Scholar] [CrossRef]
  12. Hamdeno, M.; Alvera-Azcárate, A.; Krokos, G.; Hoteit, I. Investigating the long-term variability of the Red Sea marine heatwaves and their relationship to different climate modes: Focus on 2010 events in the northern basin. Ocean Science 2024, 20(5), 1087–1107. [Google Scholar] [CrossRef]
  13. Hersbach, H.; Bell, B.; Berrisford, P.; Hirahara, S.; Horányi, A.; Muñoz-Sabater, J.; Nicolas, J.; Peubey, C.; Radu, R.; Schepers, D.; et al. The ERA5 global reanalysis. Q. J. R. Meteorol. Soc. 2020, 146, 1999–2049. [Google Scholar] [CrossRef]
  14. IPCC. IPCC Special Report on the Ocean and Cryosphere in a Changing Climate; Pörtner, H.-O., Roberts, D.C., Masson-Delmotte, V., Zhai, P., Tignor, M., Poloczanska, E., Mintenbeck, K., Alegría, A., Nicolai, M., Okem, A., et al., Eds.; Cambridge University Press: Cambridge, UK; New York, NY, USA, 2019. [Google Scholar] [CrossRef]
  15. Frölicher, T.L.; Fischer, E.M.; Gruber, N. Marine heatwaves under global warming. Nature 2018, 560, 360–364. [Google Scholar] [CrossRef] [PubMed]
  16. Hobday, A.J.; Alexander, L.V.; Perkins, S.E.; Smale, D.A.; Straub, S.C.; Oliver, E.C.; Benthuysen, J.A.; Burrows, M.T.; Donat, M.G.; Feng, M.; et al. A hierarchical approach to defining marine heatwaves. Prog. Oceanogr. 2016, 141, 227–238. [Google Scholar] [CrossRef]
  17. Hobday, A.J.; Oliver, E.C.; Sen Gupta, A.; Benthuysen, J.A.; Burrows, M.T.; Donat, M.G.; Holbrook, N.J.; Moore, P.J.; Thomsen, M.S.; Wernberg, T.; et al. Categorizing and naming marine heatwaves. Oceanography 2018, 31, 162–173. [Google Scholar] [CrossRef]
  18. Fernández-Álvarez, B.; Barceló-Llull, B.; Pascual, A. Tracking marine heatwaves in the Balearic Sea: Temperature trends and the role of detection methods. Ocean Sci. 2025, 21, 1987–1999. [Google Scholar] [CrossRef]
  19. Oliver, E.C.; Donat, M.G.; Burrows, M.T.; Moore, P.J.; Smale, D.A.; Alexander, L.V.; Benthuysen, J.A.; Feng, M.; Sen Gupta, A.; Hobday, A.J.; et al. Longer and more frequent marine heatwaves over the past century. Nat. Commun. 2018, 9, 1324. [Google Scholar] [CrossRef]
  20. Holbrook, N.J.; Scannell, H.A.; Sen Gupta, A.; Benthuysen, J.A.; Feng, M.; Oliver, E.C.; Alexander, L.V.; Burrows, M.T.; Donat, M.G.; Hobday, A.J.; et al. A global assessment of marine heatwaves and their drivers. Nat. Commun. 2019, 10, 2624. [Google Scholar] [CrossRef]
  21. Amaya, D.J.; Miller, A.J.; Xie, S.-P.; Kosaka, Y. Physical drivers of the summer 2019 North Pacific marine heatwave. Nat. Commun. 2020, 11, 1903. [Google Scholar] [CrossRef] [PubMed]
  22. Martínez, J.; Leonelli, F.E.; García-Ladona, E.; Garrabou, J.; Kersting, D.K.; Bensoussan, N.; Pisano, A. Evolution of marine heatwaves in warming seas: The Mediterranean Sea case study. Front. Mar. Sci. 2023, 10, 1193164. [Google Scholar] [CrossRef]
  23. Laufkötter, C.; Zscheischler, J.; Frölicher, T.L. High-impact marine heatwaves attributable to human-induced global warming. Science 2020, 369, 1621–1625. [Google Scholar] [CrossRef] [PubMed]
  24. Mohamed, B.; Barth, A.; Van Der Zande, D.; Alvera-Azcárate, A. Amplified warming and marine heatwaves in the North Sea under a warming climate and their impacts. Ocean Sci. 2025, 21, 2505–2525. [Google Scholar] [CrossRef]
  25. Reynolds, R.W.; Smith, T.M.; Liu, C.; Chelton, D.B.; Casey, K.S.; Schlax, M.G. Daily high-resolution-blended analysis for sea surface temperature. J. Clim. 2007, 20, 5473–5496. [Google Scholar] [CrossRef]
  26. Huang, B.; Liu, C.; Banzon, V.; Freeman, E.; Graham, G.; Hankins, B.; Smith, T.; Zhang, H.-M. Improvements of the daily optimum interpolation sea surface temperature (DOISST) version 2.1. J. Clim. 2021, 34, 2923–2939. [Google Scholar] [CrossRef]
  27. Minnett, P.J.; Alvera-Azcárate, A.; Chin, T.M.; Corlett, G.K.; Gentemann, C.L.; Karagali, I.; Li, X.; Marsouin, A.; Marullo, S.; Maturi, E.; et al. Half a century of satellite remote sensing of sea-surface temperature. Remote Sens. Environ. 2019, 233, 111366. [Google Scholar] [CrossRef]
  28. Liu, Y.; Chin, T.M.; Minnett, P.J. Sampling errors in satellite-derived infrared sea-surface temperatures. Part II: Sensitivity and parameterization. Remote Sens. Environ. 2017, 198, 297–309. [Google Scholar] [CrossRef]
  29. Schlegel, R.W.; Oliver, E.C.; Hobday, A.J.; Smit, A.J. Detecting marine heatwaves with sub-optimal data. Front. Mar. Sci. 2019, 6, 737. [Google Scholar] [CrossRef]
  30. Smale, D.A.; Wernberg, T.; Oliver, E.C.; Thomsen, M.; Harvey, B.P.; Straub, S.C.; Burrows, M.T.; Alexander, L.V.; Benthuysen, J.A.; Donat, M.G.; et al. Marine heatwaves threaten global biodiversity and the provision of ecosystem services. Nat. Clim. Change 2019, 9, 306–312. [Google Scholar] [CrossRef]
  31. Holbrook, N.J.; Sen Gupta, A.; Oliver, E.C.; Hobday, A.J.; Benthuysen, J.A.; Scannell, H.A.; Smale, D.A.; Wernberg, T. Keeping pace with marine heatwaves. Nat. Rev. Earth Environ. 2020, 1, 482–493. [Google Scholar] [CrossRef]
  32. Tietbohl, M.D.; Genevier, L.G.; Krieger, E.C.; Kattan, A.; Wang, Y.; Gokul, E.A.; Bravo, L.M.R.; Palm, L.; Mele, G.; Hoteit, I.; et al. Extreme marine heatwave linked to mass fish kill in the Red Sea. Sci. Total Environ. 2025, 975, 179073. [Google Scholar] [CrossRef]
  33. Hoegh-Guldberg, O.; Poloczanska, E.S.; Skirving, W.; Dove, S. Coral reef ecosystems under climate change and ocean acidification. Front. Mar. Sci. 2017, 4, 158. [Google Scholar] [CrossRef]
  34. Hughes, T.P.; Anderson, K.D.; Connolly, S.R.; Heron, S.F.; Kerry, J.T.; Lough, J.M.; Baird, A.H.; Baum, J.K.; Berumen, M.L.; Bridge, T.C.; et al. Spatial and temporal patterns of mass bleaching of corals in the Anthropocene. Science 2018, 359, 80–83. [Google Scholar] [CrossRef] [PubMed]
  35. Nadimpalli, J.R.; Sanikommu, S.; Subramanian, A.C.; Giglio, D.; Hoteit, I. Subsurface marine heat waves and coral bleaching in the southern red sea linked to remote forcing. Weather. Clim. Extrem. 2025, 48, 100771. [Google Scholar] [CrossRef]
  36. Genevier, L.G.; Jamil, T.; Raitsos, D.E.; Krokos, G.; Hoteit, I. Marine heatwaves reveal coral reef zones susceptible to bleaching in the Red Sea. Glob. Change Biol. 2019, 25, 2338–2351. [Google Scholar] [CrossRef]
  37. Oliver, E.C.; Benthuysen, J.A.; Darmaraki, S.; Donat, M.G.; Hobday, A.J.; Holbrook, N.J.; Schlegel, R.W.; Sen Gupta, A. Marine heatwaves. Annu. Rev. Mar. Sci. 2021, 13, 313–342. [Google Scholar] [CrossRef]
  38. Marshall, J.; Scott, J.R.; Armour, K.C.; Campin, J.M.; Kelley, M.; Romanou, A. The ocean’s role in the transient response of climate to abrupt greenhouse gas forcing. Clim. Dyn. 2015, 44, 2287–2299. [Google Scholar] [CrossRef]
  39. Darmaraki, S.; Krokos, G.; Genevier, L.; Hoteit, I.; Raitsos, D.E. Drivers of marine heatwaves in coral bleaching regions of the Red Sea. Commun. Earth Environ. 2025, 6, 120. [Google Scholar] [CrossRef]
  40. Zscheischler, J.; Westra, S.; van den Hurk, B.J.; Seneviratne, S.I.; Ward, P.J.; Pitman, A.; AghaKouchak, A.; Bresch, D.N.; Leonard, M.; Wahl, T.; et al. Future climate risk from compound events. Nat. Clim. Change 2018, 8, 469–477. [Google Scholar] [CrossRef]
  41. Aboelkhair, H.; Mohamed, B.; Morsy, M.; Nagy, H. Cooccurrence of atmospheric and oceanic heatwaves in the eastern mediterranean over the last four decades. Remote Sens. 2023, 15, 1841. [Google Scholar] [CrossRef]
  42. Schlegel, R.W.; Smit, A.J. heatwaveR: A central algorithm for the detection of heatwaves and cold-spells. J. Open Source Softw. 2018, 3, 821. [Google Scholar] [CrossRef]
  43. Sofianos, S.S.; Johns, W.E. An oceanic general circulation model investigation of the Red Sea circulation: 2. Three-dimensional circulation in the Red Sea. J. Geophys. Res. Oceans 2003, 108, 3066. [Google Scholar] [CrossRef]
  44. Yao, F.; Hoteit, I.; Pratt, L.J.; Bower, A.S.; Zhai, P.; Köhl, A.; Gopalakrishnan, G. Seasonal overturning circulation in the Red Sea: 1. Model validation and summer circulation. J. Geophys. Res. Oceans 2014, 119, 2238–2262. [Google Scholar] [CrossRef]
  45. Nagy, H.; Mohamed, B.; Ibrahim, O. Variability of Heat and Water Fluxes in the Red Sea Using ERA5 Data (1981–2020). J. Mar. Sci. Eng. 2021, 9, 1276. [Google Scholar] [CrossRef]
  46. Krokos, G.; Cerovečki, I.; Papadopoulos, V.P.; Hendershott, M.C.; Hoteit, I. Processes governing the seasonal evolution of mixed layers in the Red Sea. J. Geophys. Res. Oceans 2022, 127, e2021JC017369. [Google Scholar] [CrossRef]
  47. Mohamed, B.; Nagy, H.; Ibrahim, O. Spatiotemporal variability and trends of marine heatwaves in the Red Sea over 38 years. J. Mar. Sci. Eng. 2021, 9, 842. [Google Scholar] [CrossRef]
  48. Raitsos, D.E.; Pradhan, Y.; Brewin, R.J.W.; Stenchikov, G.; Hoteit, I. Remote sensing the phytoplankton seasonal succession of the Red Sea. PLoS ONE 2013, 8, e64909. [Google Scholar] [CrossRef] [PubMed]
  49. Osman, E.O.; Smith, D.J.; Ziegler, M.; Kürten, B.; Conrad, C.; El-Haddad, K.M.; Voolstra, C.R.; Suggett, D.J. Thermal refugia against coral bleaching throughout the northern Red Sea. Glob. Change Biol. 2018, 24, e474–e484. [Google Scholar] [CrossRef] [PubMed]
  50. Pal, J.S.; Eltahir, E.A.B. Future temperature in southwest Asia projected to exceed a threshold for human adaptability. Nat. Clim. Change 2016, 6, 197–200. [Google Scholar] [CrossRef]
  51. Almazroui, M.; Islam, M.N.; Dambul, R.; Jones, P.D. Trends of temperature extremes in Saudi Arabia. Int. J. Climatol. 2014, 34, 808–826. [Google Scholar] [CrossRef]
  52. Malik, A.; Stenchikov, G.; Mostamandi, S.; Parajuli, S.; Lelieveld, J.; Zittis, G.; Ahsan, M.S.; Atique, L.; Usman, M. Accelerated historical and future warming in the Middle East and North Africa. J. Geophys. Res. Atmos. 2024, 129, e2024JD041625. [Google Scholar] [CrossRef]
  53. Ismail, H.; Zakaria, S.; Hanafy, M. Thermal Resilience of Corals in the Southern Egyptian Red Sea Reefs. Egypt. J. Aquat. Biol. Fish. 2025, 29, 15. [Google Scholar] [CrossRef]
  54. Barkhordarian, A.; Brunet, E.; Baehr, J. Compound coastal marine-terrestrial heatwaves associated with humid-heat stress in Europe. Sci. Rep. 2025, 15, 43810. [Google Scholar] [CrossRef]
  55. Sen, P.K. Estimates of the regression coefficient based on Kendall’s tau. J. Am. Stat. Association. 1968, 63, 1379–1389. [Google Scholar] [CrossRef]
  56. Hamed, K.H.; Rao, A.R. A modified Mann-Kendall trend test for autocorrelated data. J. Hydrol. 1998, 204, 182–196. [Google Scholar] [CrossRef]
  57. Wang, F.; Shao, W.; Yu, H.; Kan, G.; He, X.; Zhang, D.; Ren, M.; Wang, G. Re-evaluation of the Power of the Mann-Kendall Test for Detecting Monotonic Trends in Hydrometeorological Time Series. Front. Earth Sci. 2020, 8, 14. [Google Scholar] [CrossRef]
  58. Wilks, D.S. Statistical Methods in the Atmospheric Sciences, 3rd ed.; Academic Press: Oxford, UK, 2011; Volume 100, p. 676. [Google Scholar]
  59. Spearman, C. The Proof and Measurement of Association between Two Things. Am. J. Psychol. 1904, 15, 72–101. [Google Scholar] [CrossRef]
  60. Sedgwick, P. Spearman’s rank correlation coefficient. BMJ 2014, 349, g7327. [Google Scholar] [CrossRef]
  61. Zar, J.H. Significance Testing of the Spearman Rank Correlation Coefficient. J. Am. Stat. Assoc. 1972, 67, 578–580. [Google Scholar] [CrossRef]
  62. Perkins, S.E.; Alexander, L.V.; Nairn, J.R. Increasing frequency, intensity and duration of observed global heatwaves and warm spells. Geophys. Res. Lett. 2012, 39, L20714. [Google Scholar] [CrossRef]
  63. Almazroui, M.; Islam, M.N.; Saeed, S.; Saeed, F.; Ismail, M. Future changes in climate over the Arabian Peninsula based on CMIP6 multimodel simulations. Earth Syst. Environ. 2020, 4, 611–630. [Google Scholar] [CrossRef]
  64. Mohamed, B.; Skliris, N. Recent sea level changes in the Red Sea: Thermosteric and halosteric contributions and impacts of natural climate variability. Prog. Oceanogr. 2025, 231, 103416. [Google Scholar] [CrossRef]
  65. Zhan, P.; Subramanian, A.C.; Yao, F.; Hoteit, I. Eddies in the Red Sea: A statistical and dynamical study. J. Geophys. Res. Oceans 2014, 119, 3909–3925. [Google Scholar] [CrossRef]
  66. Sofianos, S.S.; Johns, W.E. Water mass formation, overturning circulation, and the exchange of the Red Sea with adjacent basins. In The Red Sea: The Formation, Morphology, Oceanography and Environment of a Young Ocean Basin; Rasul, N.M.A., Stewart, I.C.F., Eds.; Springer: Berlin/Heidelberg, Germany, 2015; pp. 343–353. [Google Scholar]
  67. Sen Gupta, A.; Thomsen, M.; Benthuysen, J.A.; Hobday, A.J.; Oliver, E.; Alexander, L.V.; Burrows, M.T.; Donat, M.G.; Feng, M.; Holbrook, N.J.; et al. Drivers and impacts of the most extreme marine heatwave events. Sci. Rep. 2020, 10, 19359. [Google Scholar] [CrossRef] [PubMed]
Figure 1. The bathymetric map of the Red Sea basin, obtained from the General Bathymetric Chart of the Oceans GEBCO dataset (www.gebco.net) (accessed on 20 June 2025).
Remotesensing 18 01302 g001
Figure 2. Spatial distribution of decadal trends (1990–2024) in (a) sea surface temperature (SST), (b) surface air temperature (SAT), and (c) time series of basin mean annual SAT (red line) and SST (black line). Both SAT and SST showed significant trends over the whole Red Sea basin based on the modified MK test at the 95% confidence interval (p < 0.05).
Remotesensing 18 01302 g002
Figure 3. Temporal variability of AHWs (red), MHWs (blue), and their cooccurrence (green) for (a) annual frequency and (b) annual total duration during 1990–2024.
Remotesensing 18 01302 g003
Figure 4. Spatial climatological map (1990–2024) of the annual mean AHW (a) frequency and (b) duration; annual mean MHW (c) frequency and (d) duration; and annual mean AHW-MHW cooccurrence (e) frequency and (f) duration.
Remotesensing 18 01302 g004
Figure 5. Spatial distribution of Spearman correlation coefficients between (a) AHW/MHW frequency, (b) AHW/MHW duration, (c) AHW/concurrent frequency, (d) AHW/concurrent duration, (e) MHW/concurrent frequency, and (f) MHW/concurrent duration with statistically significant correlation at p < 0.05; hatched areas indicate non-significant values.
Remotesensing 18 01302 g005
Figure 6. Spatial distribution of (a) standalone AHWs, (b) standalone MHWs, (c) percent of concurrent/MHWs (%), and (d) percent of concurrent/AHWs (%).
Remotesensing 18 01302 g006
Figure 7. Spatial patterns of decadal trend (1990–2024) with statistical significance at p < 0.05 in (a) AHW frequency, (b) AHW duration, (c) MHW frequency, (d) MHW duration, (e) concurrent MHW/AHW frequency, and (f) concurrent MHW/AHW duration; hatched areas indicate non-significant values.
Remotesensing 18 01302 g007
Disclaimer/Publisher’s Note: The statements, opinions and data contained in all publications are solely those of the individual author(s) and contributor(s) and not of MDPI and/or the editor(s). MDPI and/or the editor(s) disclaim responsibility for any injury to people or property resulting from any ideas, methods, instructions or products referred to in the content.