Article

AutoUAVFormer: Neural Architecture Search with Implicit Super-Resolution for Real-Time UAV Aerial Object Detection

1
38th Research Institute of China Electronics Technology Group Corporation, Hefei 230088, China
2
The State Key Laboratory of Opto-Electronic Information Acquisition and Protection Technology, Anhui University, Hefei 230601, China
3
Anhui Sun Create Electronics Co., Ltd., Hefei 230031, China
*
Author to whom correspondence should be addressed.
These authors contributed equally to this work.
Remote Sens. 2026, 18(9), 1268; https://doi.org/10.3390/rs18091268
Submission received: 5 March 2026 / Revised: 7 April 2026 / Accepted: 15 April 2026 / Published: 22 April 2026

Highlights

What are the main findings?
  • This paper introduces AutoUAVFormer, an NAS framework that incorporates super-resolution guidance into Transformer-based detection. By co-optimizing the detection architecture and the super-resolution reconstruction mechanisms in a unified search space, the method enables adaptive and computationally efficient Anti-UAV detection across diverse low-altitude environments.
  • AutoUAVFormer demonstrates state-of-the-art performance with unprecedented mAP@0.5 scores of 98.6% (DetFly), 95.5% (DUT Anti-UAV), and 89.9% (UAV Swarm), while maintaining real-time inference. Its superiority over existing methods is attributed to multi-scale feature fusion via evolutionary search strategies.
What are the implications of the main findings?
  • AutoUAVFormer integrates neural architecture search (NAS) with a super-resolution auxiliary branch to deliver a practical, resource-efficient and robust solution for Anti-UAV detection, enabling safety in civilian airspace, airports, and urban management.
  • AutoUAVFormer validates the potential of an NAS-integrated Transformer for small target detection, offering a scalable framework applicable to diverse low-altitude vision scenarios.

Abstract

The widespread deployment of unmanned aerial vehicles (UAVs) in civil and commercial airspace has raised significant safety concerns, driving the demand for reliable and real-time Anti-UAV visual detection systems. However, existing deep learning-based detectors face substantial challenges in complex low-altitude environments, including drastic scale variations, severe background clutter, and weak feature representation of small UAV targets. Moreover, handcrafted Transformer-based architectures often lack adaptability across diverse scenarios and struggle to balance detection accuracy with computational efficiency. To address these limitations, this paper proposes AutoUAVFormer, a super-resolution guided neural architecture search framework for Anti-UAV detection. In contrast to conventional manually designed approaches, AutoUAVFormer leverages joint optimization of a Transformer-based detection objective and a super-resolution reconstruction objective to automatically identify a task-specific optimal network architecture for detecting UAV targets. Specifically, a unified search space is formulated by jointly embedding Transformer hyperparameters and Feature Pyramid Network (FPN) structures, facilitating end-to-end co-optimization of multi-scale feature fusion and global context modeling. To efficiently locate architectures that balance accuracy and computational cost, a three-stage pipeline, combining supernetwork training with evolutionary search, is employed. Additionally, we design a super-resolution auxiliary branch that operates only during training to enhance the model’s ability to learn fine-grained textures and sharpen edge representations of small targets, without introducing any inference overhead. Extensive experiments on three challenging Anti-UAV detection benchmarks, namely DetFly, DUT Anti-UAV, and UAV Swarm, confirm the superiority of AutoUAVFormer over current state-of-the-art methods, with mAP@0.5 scores reaching 98.6%, 95.5%, and 89.9% on the respective datasets while sustaining real-time inference speed. These results demonstrate that AutoUAVFormer achieves strong generalization and maintains robust Anti-UAV detection performance under challenging low-altitude conditions.

1. Introduction

Driven by the rapid growth of the low-altitude economy, drones have become increasingly prevalent in logistics operations, agricultural surveillance, and emergency response missions [1]. The widespread adoption of these systems has triggered significant concerns regarding airspace safety, particularly owing to frequent unauthorized access into restricted zones [2]. Against this backdrop, the task of effectively detecting and monitoring unauthorized UAVs, which is formally referred to as Anti-UAV detection, has become both critically important and urgent for safeguarding low-altitude safety.
In recent years, the industry has introduced various drone monitoring methods based on radar, radio frequency, and other signals. However, existing monitoring approaches all suffer from inherent limitations: While radar systems offer all-weather detection capabilities, the extremely low radar cross-section of miniature drones (RCS ≈ 0.01–0.1 m2) results in weak echoes, making stable identification difficult [3]. In complex terrains, micro-Doppler-based approaches often exhibit insufficient robustness. In urban environments, radio frequency (RF) analysis is significantly impaired by spectral interference from common civilian communication signals, including Wi-Fi and Bluetooth, which leads to elevated false alarm rates and positioning inaccuracies caused by multipath propagation [4]. Likewise, acoustic detection methods encounter substantial challenges: urban background noise exceeding 60 dB obscures drone acoustic signatures in the 100–500 Hz band, and the highly variable acoustic patterns generated by multirotor kinematics further impede stable tracking [5]. Monitoring methods based on radar and RF technologies generally suffer from high costs and susceptibility to environmental interference, making it difficult to meet the high-precision monitoring requirements in complex scenarios [6].
Vision-based detection systems have become a key research direction in drone monitoring due to their controllable costs and rich information dimensions [7]. Driven by deep learning technologies, detection paradigms centered on convolutional neural networks (CNNs) have achieved significant progress. However, existing methods still face a fundamental trade-off between accuracy and efficiency: Single-stage detectors such as YOLO [8], SSD [9], RetinaNet [10], and RT-DETR [11] prioritize inference efficiency while neglecting the modeling of interactions between local and global features. This limitation results in degraded detection accuracy when confronted with motion blur or heavily cluttered backgrounds. In contrast, two-stage models including the R-CNN series [12,13,14] leverage region proposal mechanisms to achieve higher accuracy; however, they typically struggle to maintain effective feature representation under the stringent latency requirements of real-time monitoring systems.
Recent advances in vision Transformers, exemplified by Deformable DETR [15], offer a promising direction for reconciling accuracy with inference efficiency by harnessing their strong capacity for global context modeling. However, directly applying these models to UAV detection presents dual challenges: First, drones exhibit extreme scale variations and speeds reaching 20 m/s, which current Transformer models struggle to handle due to insufficient spatio-temporal modeling capabilities. Second, the manual design process heavily relies on expert knowledge, hindering rapid adaptation to complex, dynamic low-altitude monitoring scenarios.
Neural architecture search (NAS) [16] offers an automated solution to overcome the limitations of traditional manual network design. Unlike expert-driven manual tuning, NAS autonomously searches for optimal network structures under specific task constraints. Recent advances in NAS, including evolutionary architecture search [17] and differentiable formulations [18], have substantially reduced search costs while delivering performance that matches or surpasses hand-designed networks, thus enabling an adaptive balance among detection accuracy, inference speed, and model complexity. In complex low-altitude environments, where Anti-UAV detection poses significant challenges, this paradigm can effectively balance recognition capability with real-time requirements, alleviating the trade-off dilemma between accuracy and efficiency faced by traditional methods. It offers a new technical pathway for constructing high-performance visual monitoring systems.
Currently, numerous exploratory works based on NAS exist, such as DetNAS [19] designed for general object detection, single-path NAS [20] for real-time mobile applications, Autoformer [21] optimized specifically for Transformer architectures, NAS-FPN [22] for scalable feature pyramid architecture search, and EfficientDet [23] for compound-scaled efficient detection. However, most of these approaches are designed for general vision tasks or conventional scenarios, targeting benchmark datasets such as COCO and ImageNet. They do not account for the unique and compounding challenges inherent to low-altitude Anti-UAV detection, such as dramatic variations in target scale induced by altitude and distance fluctuations [24,25,26], spatio-temporal feature degradation caused by high-speed UAV motion [27,28], the inherent trade-off between input resolution and fine-grained detail preservation for small targets [29,30], and stringent latency constraints imposed by real-time airspace monitoring requirements [31]. These compounding factors make it difficult for existing methods to achieve a balanced trade-off between accuracy and efficiency in intricate low-altitude Anti-UAV scenarios.
To mitigate these limitations, this paper presents AutoUAVFormer, a Transformer architecture search framework tailored specifically for UAV detection tasks in challenging low-altitude scenarios. The key contributions are outlined as follows:
  • We propose AutoUAVFormer, a unified NAS framework that jointly optimizes Transformer encoder hyperparameters and the structural parameters of the FPN within a single search space, enabling automated discovery of task-specific architectures for Anti-UAV detection. Unlike prior NAS approaches that optimize backbone or encoder in isolation, our joint co-evolution eliminates suboptimal solutions arising from a sequential design pipeline.
  • We design a Multi-Kernel Center-Decoupled FPN (MKCD-FPN) that integrates multi-scale parallel convolutions with progressive depth fusion and center-aggregation at the P4 scale. This module is an incremental improvement over conventional FPN topologies, specifically engineered to mitigate small target feature suppression in cluttered low-altitude backgrounds. Its structural parameters are incorporated into the joint NAS search space for co-optimization with the Transformer encoder.
  • Inspired by the training-only auxiliary branch paradigm [32], we adapt and integrate a super-resolution auxiliary branch into the AutoUAVFormer framework. This branch reconstructs high-resolution spatial details from shallow backbone features during training, thereby enhancing fine-grained texture and edge representations critical for small UAV target discrimination, while introducing zero inference overhead. Within the joint NAS framework, the SR-augmented training objective acts as a structural regularizer that encourages the evolutionary search to discover architectures with improved feature discriminability under the given parameter budget constraints.

2. Related Works

The methods presented in this paper involve object detection based on deep learning, super-resolution reconstruction, and neural architecture search techniques. Therefore, we introduce related work from these three aspects.

2.1. Anti-UAV Methods Based on Deep Learning

Object detection frameworks leveraging deep learning are conventionally classified into two principal paradigms: single-stage and two-stage approaches. Owing to their high inference speed and strong real-time capabilities, single-stage detectors, particularly those in the YOLO family, have become a dominant choice for UAV detection. Recent years have seen a surge of YOLO-based enhancements tailored specifically to the challenges of detecting unmanned aerial vehicles. ATA-YOLOv8 [27] incorporates an adaptive feature fusion strategy and an attention augmentation block to improve multi-scale UAV detection, especially under complex background conditions. Designed for deployment on edge devices, EDGS-YOLOv8 [33] reduces computational overhead through architectural refinements and optimized feature extraction, all while preserving high accuracy. In DCR-YOLO [34], depthwise separable convolutions and residual connections are integrated into the backbone, complemented by a dynamic feature fusion strategy to strengthen representations of tiny UAVs. DRF-YOLO [35] adopts a dual-path residual feature-fusion design that processes multi-scale features in parallel, effectively mitigating issues arising from large-scale variations and background-induced occlusion. By embedding Ghost modules and channel shuffling operations into YOLOv7, YOLOv7-GS [36] minimizes redundant computations and enriches feature interactions, striking an effective balance between speed and accuracy. Further advancing model compactness, lightweight-YOLO11 offers a lightweight architecture suited for resource-constrained environments [37].
Since Meta (formerly Facebook) introduced DETR, a Transformer-based detector that re-framed object detection as a set of prediction tasks in 2020 [38], the field has witnessed a paradigm shift toward anchor-free, end-to-end detection. This new framework has since been progressively adapted to UAV detection as the underlying Transformer-based methodology continues to evolve. ALDNet [39] proposes an adaptive local–global feature-fusion mechanism integrated with attention mechanisms to improve the model’s capability in recognizing multiscale UAV targets, thereby achieving enhanced detection accuracy in visually cluttered environments. DACG-Net [40] introduces a dual-attention cross-guidance architecture, which jointly leverages spatial and channel attention mechanisms to reinforce the extraction of discriminative features from UAV targets. Furthermore, it incorporates a cross-scale feature fusion method to significantly enhance detection performance on tiny objects. VDTNet [28] tackles dual-model UAV detection under visible-light and infrared imaging by introducing a vision-depth Transformer framework, enabling robust detection in challenging scenarios through effective multimodal feature integration and cross-modal attention interactions. D-FINE [41] redefines the bounding box regression task within the DETR paradigm by integrating fine-grained distributed refinement (FDR) with global optimal self-distillation (GO-LSD). FDR models localization uncertainty via iterative optimization of probability distributions, enabling precise localization adjustments. In parallel, GO-LSD propagates high-level positional knowledge, which is derived from deeply refined distributions, to shallower network layers, thereby accelerating convergence. Additionally, D-FINE applies lightweight optimizations to computationally demanding components, improving overall model efficiency. The proposed framework establishes an optimal trade-off between computational efficiency and detection accuracy for real-time object detection, while consistently boosting performance across various DETR-based architectures.
Despite attaining a reasonable trade-off between detection accuracy and computational efficiency, their cross-scenario generalization capabilities remain intrinsically limited by optimization objectives that prioritize specific UAV types and operational scenarios. This limitation is particularly pronounced in low-altitude UAV detection within complex environments, where the domain is fundamentally distinct from conventional tiny object detection in controlled settings. Such tasks confront multifaceted challenges, including complex background clutter, high susceptibility of UAV features to occlusion, pronounced scale variations, and diverse flight attitudes. Consequently, manually engineered fixed-architecture models, as previously reviewed, exhibit fundamental physical mismatches when deployed under these intricate low-altitude conditions.
The deployment of low-altitude UAV detection systems requires careful consideration of computational efficiency, as sustained monitoring applications demand consistent inference throughput under practical hardware constraints. Consequently, alongside detection accuracy, the deployment of lightweight architectures and efficient parameter optimization strategies constitutes a critical research imperative. Existing methodologies predominantly pursue deployment efficiency through deliberate performance trade-off, leveraging techniques such as network streamlining, model compression, and feature enhancement. Li et al. [42] substituted selected C2f modules with the lightweight GhostblockV2 structure, employing cost-effective pointwise and depthwise convolutions to suppress redundant feature representations and alleviate computational burden. F-YOLOv7 [31] mitigates YOLOv7’s parameter redundancy and computational complexity by synergistically integrating partial convolutions (PConv) with depthwise-separable convolutions (DWConv), substantially reducing both parameter volume and inference cost. EDGS-YOLOv8 [33] substitutes standard convolution layers with ghost modules to alleviate computational overhead, while residual feature representations are synthesized through linear mapping operations to enhance parameter efficiency, and eliminates detection heads insensitive to tiny objects to streamline model complexity. VDTNet [28] implements sparse training on YOLOv4 by quantifying channel importance through the L1 norm of batch normalization layers and iteratively pruning less significant channels, achieving marked parameter compression. Drone-DETR [43] embeds mixed pooling-based down-sampling (MPD) and FasterNet block into residual structures to enhance feature extraction efficiency, progressively discarding deep-level features to curtail computational cost. DFS-DETR [44] integrates a reparameterized dilated residual module (RDRM) within a residual framework to encoder multiscale contextual features while minimizing superfluous convolutions; concurrently, it adopts the MPDIoU (minimum point distance-based intersection over union) to accelerate convergence and reduce computational load. PHSI-RTDETR [45] fuses partial convolution (PConv) with RepConv to construct a lightweight RPConv module for the feature capturing of the backbone network, significantly diminishing parameter count and memory footprint, and leverages Inner-GIoU loss with auxiliary boxes for scale-aware optimization to expedite training convergence. Collectively, these lightweight strategies entail an inherent trade-off, universally manifesting as quantifiable compromises in detection accuracy. In contrast to these post hoc compression approaches, NAS offers a fundamentally different pathway to automatically discovering architectures that are inherently compact under explicit parameter budget constraints, potentially circumventing the accuracy penalties associated with manual model simplification.

2.2. Super-Resolution Reconstruction Methods

The strategic incorporation of image super-resolution techniques to counteract the intrinsic performance degradation associated with lightweight neural network architectures is increasingly acknowledged as a viable and promising research trajectory. Wang et al. [29] propose a feature super-resolution block that leverages up-sampling to transform low-resolution features into high-fidelity representations, thereby preserving and enhancing fine-grained details of tiny targets. By replacing the conventional FPN up-sampling component, this module establishes an information integration-driven up-sampling mechanism, significantly strengthening the model’s capacity for detecting tiny UAVs against complex backgrounds. Luo et al. [30] employs a shared backbone across detection and super-resolution streams to attain instance-level alignment and feature fusion; gradient backpropagation through this shared pathway reinforces detailed instance representations within the backbone, improving tiny target detection accuracy without parameter inflation. DSRL [32] adopts a dual-stream architecture integrating semantic segmentation and super-resolution, utilizing a shared encoder and an auxiliary super-resolution reconstruction branch to enhance high-resolution feature learning. Critically, this branch is deactivated during inference, yielding boosted segmentation performance without additional computational cost.

2.3. Neural Architecture Search

Automated machine learning (AutoML) addresses the inefficiency and substantial resource demands inherent in manual neural architecture design by optimizing model development workflows. Within this paradigm, NAS constitutes a foundational methodology for the automated construction of deep learning models [16]. NAS systematically delineates a well-defined search space of candidate architectures and implements tailored search methods to identify optimal network configurations. Its core objective is to autonomously find architectures that obtain superior validation results following comprehensive training. This optimization goal is formally formulated as follows:
w a = a r g w m i n L train ( N ( a , w ) )
a * = a r g a A m a x A C C val N a , w a
Here, A denotes the architectural search space and a represents a candidate neural architecture sampled therefrom. The notation N ( a , w ) designates a neural network instantiated with architecture a and parameterized by weight tensor w . The symbol L train (·) signifies the training loss computed over the training dataset, and A C C v a l (·) quantifies the architectural performance assessed on the validation set. It is important to note that Equations (1) and (2) collectively constitute a bilevel optimization formulation, rather than a single simultaneous objective. Equation (1) defines the inner-level optimization, determining the optimal weights w a for a given architecture α by minimizing the training loss; Equation (2) defines the outer-level optimization, selecting the best architecture a * by evaluating validation accuracy under the weights obtained from Equation (1). The two equations are therefore sequential and non-conflicting: Equation (2) is conditioned on the solution of Equation (1). Unlike differentiable NAS approaches (e.g., DARTS [18]) that approximate bilevel optimization through alternating gradient descent on continuous architecture parameters, AutoUAVFormer adopts the Autoformer-style one-shot paradigm [21], in which the two levels are completely decoupled into separate temporal stages. The inner-level optimization is realized through weight-sharing supernet training, and the outer-level optimization is subsequently conducted via evolutionary search over the discrete search space using inherited supernet weights without retraining. This temporal decoupling eliminates the discretization gap and optimization instabilities associated with continuous relaxation-based methods.
Despite its ability to automate neural network design, NAS is still computationally infeasible under the conventional implementation framework. To address this limitation, substantial research efforts have been focusing on enhancing search efficiency and mitigating resource demands. One-shot NAS frameworks have proven particularly effective, accelerating architecture discovery while substantially reducing computational expenditure [21,46,47]. These approaches train a single hypernetwork embedding numerous candidate subnetworks, wherein weight sharing across architectures minimizes redundant computations and enables diverse search strategies, predominantly evolutionary algorithms and reinforcement learning. The growing prevalence of Transformer architectures has further catalyzed the development of Transformer-specific NAS methodologies. Autoformer [21] integrates a weight entanglement mechanism within its hypernetwork training process and applies evolutionary search to identify optimal Transformer configurations. Complementing this, TF-TAS [46] and AZ-NAS [47] utilize various distinct cost-free proxies for architecture evaluation, facilitating training-free searches of Transformer structures without full retraining.
Beyond generic architecture design, NAS has been successfully adapted to domain-specific tasks such as object detection, significantly promoting AutoML applications. NAS-FOCS [48] leverages reinforcement learning for decoder architecture optimization through a progressively implemented search methodology that eliminates the requirement for backbone fine-tuning, thereby achieving a substantial reduction in computational burden. SAR-NAS [49] embeds NAS into YOLOv10 through centralized channel configurations optimization in the backbone, coupled with hardware constrained evolutionary search to derive Pareto-optimal architectures. YOLO-NAS [50] targets real-time tiny UAV detection by synergistically integrating supergradient optimization, quantization-aware neural components, and adaptive network design, thereby establishing a favorable trade-off between inference speed and detection accuracy.

3. Methodology

3.1. Overall Structure

The overall architecture of AutoUAVFormer is illustrated in Figure 1. The general workflow of AutoUAVFormer follows a structure similar to common object detection frameworks, comprising: a backbone network, an encoder (with joint search of Transformer hyperparameters and FPN), a decoder, and a super-resolution (SR) auxiliary branch that participates only during the training phase. Within AutoUAVFormer, the backbone network processes input UAV imagery through hierarchical feature extraction to generate multi-scale feature maps. These extracted features (P3, P4, P5) are subsequently routed to the encoder, where Transformer encoding is exclusively applied to the P5-layer feature (this design decision is rigorously substantiated by RT-DETR’s empirical validation, which confirms P5-layer features to be the favorable input for Transformer encoding in real-time detectors [11]), and subsequently, together with P3- and P4-layer features, are input into the Multi-Kernel Center-Decoupled FPN (MKCD-FPN) for multi-scale fusion. The fused features are then passed to the subsequent decoder to complete object classification and bounding box regression. Finally, a joint loss (comprising detection loss and super-resolution reconstruction loss) is computed and propagated back through the entire network to guide weight updates.
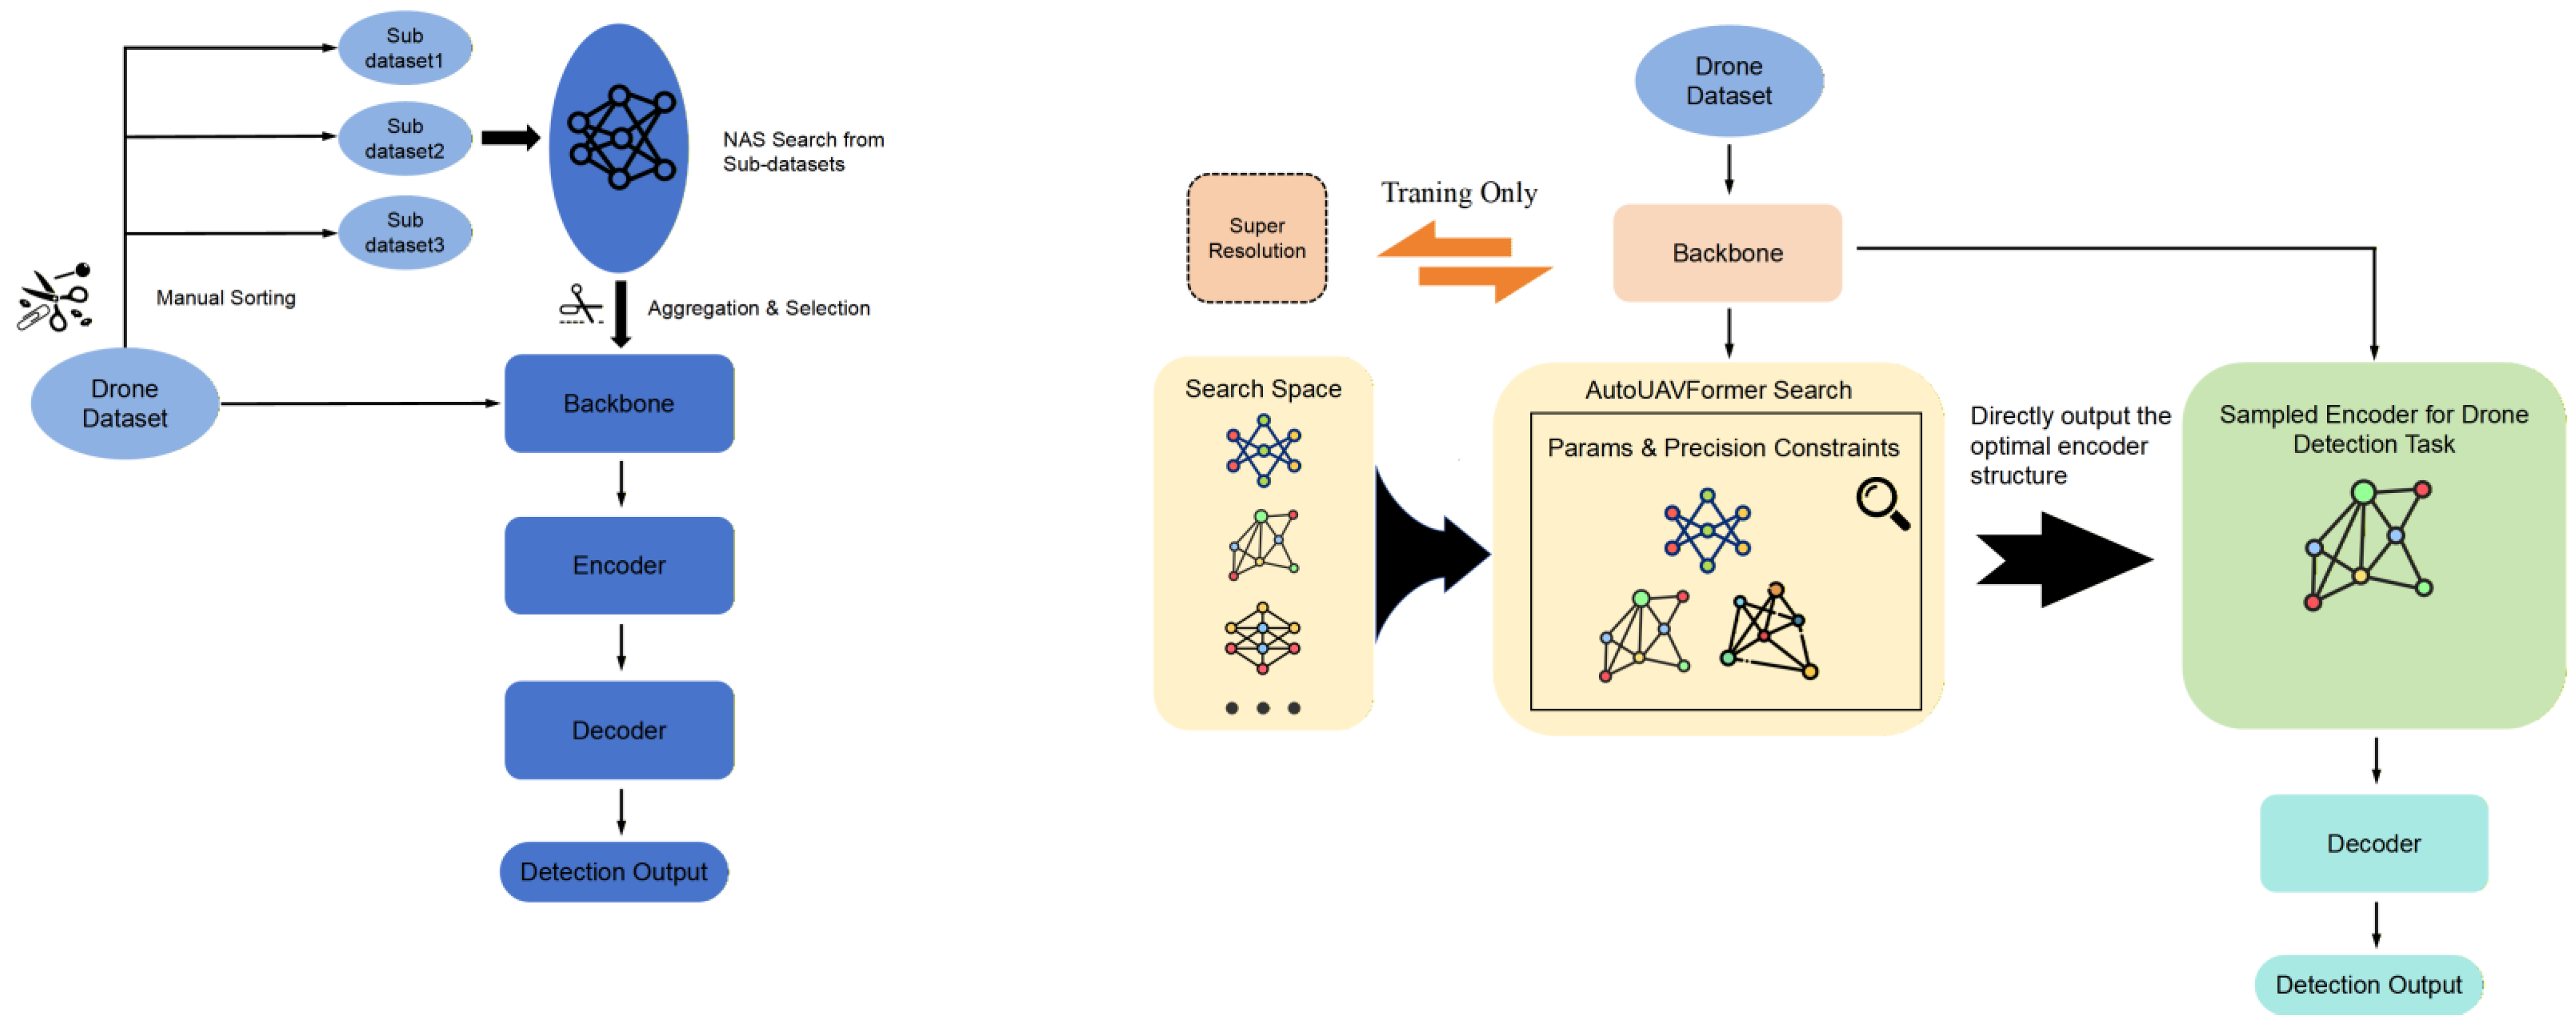
As shown in the left panel of Figure 2, in some previous NAS methods employed for object detection, the search process for the backbone network or encoder is conducted separately from the training process of the object detection model, meaning that a proxy dataset is used to train a search network independently, and the network identified through this approach is subsequently manually incorporated into the object detection pipeline for further adjustment. In contrast, as illustrated in the right panel of Figure 2, the rationale behind the AutoUAVFormer method proposed in this paper is to construct a supernetwork responsible for the encoder search task, encompassing both Transformer hyperparameters and FPN structural parameters, and integrate it with the backbone network enhanced by SR auxiliary branch features and a fixed decoder, forming a holistic search network for end-to-end training. To reduce NAS computational overhead and search time, we draw upon the design philosophy of Autoformer and adopt a one-shot NAS strategy for the overall framework design. During the search process, the UAV detection dataset is directly utilized to train the supernetwork in a weight-sharing manner; upon completion of supernetwork training, an evolutionary search strategy is leveraged to explore the supernetwork, thereby facilitating the identification of the optimal subnetwork subject to the two-fold constraints of detection efficacy and parameter budget. The selected optimal architecture subsequently undergoes convergence training to fully unlock its capabilities.
It is worth noting that the AutoUAVFormer supernetwork is composed of multiple searchable Transformer layers stacked together with the searchable fusion depth of the jointly optimized MKCD-FPN. AutoUAVFormer is a search network that can be directly trained using object detection datasets, similar to conventional object detection networks. Therefore, compared to the traditional approach depicted on the left side of Figure 2 that separates search from detection training, the additional work of identifying and constructing sub-datasets can be avoided, and UAV datasets can be directly employed for supernetwork training and architecture evaluation. The final sampled output encoder can be directly combined with the same backbone network and decoder to form the optimal object detection network without requiring additional structural modifications.
When executing NAS tasks, AutoUAVFormer is capable of directly guiding model weight updates based on the joint loss, which is analogous to the training process of typical object detection networks. The distinction lies in the fact that the parameters of the AutoUAVFormer search network include those corresponding to the sought-after Transformer architecture and FPN architecture, meaning that upon completion of supernetwork training, the evolutionary search, through loss minimization, identifies the optimal architecture suitable for the current UAV object detection task according to the given constraints, and conducts convergence training on the selected architecture during the final fine-tuning stage. After determining the optimal encoder architecture and completing convergence training, only the fixed sub-network is utilized during the inference phase, with the SR branch silenced, thereby incurring no additional computational cost. A comprehensive elaboration of its procedural specifics is presented in Section 3.2, Section 3.3 and Section 3.4.

3.2. Multikernel Center-Decoupled FPN

The proposed MKCD-FPN module establishes a unified framework for multiscale feature aggregation. Diverging from conventional top-down or bottom-up fusion strategies, this architecture anchors hierarchical feature integration at the P4 scale, where parallel feature decomposition employs three convolutional kernels of heterogeneous sizes to capture multiscale contextual information. As depicted in Figure 3, the center-decoupled unit processes features across P5, P4, and P3 scales through a cohesive computational pipeline that incorporates spatial feature calibration, concurrent multikernel convolutional operations, and residual shortcut pathways, ultimately yielding consolidated feature representations at a consistent spatial resolution.
Multi-scale feature alignment is performed with the P4 scale features designated as the reference resolution. The coarser P5 features are upscaled to the P4 resolution through a cascaded upscaling pipeline that employs two complementary interpolation strategies followed by a learnable channel projection. Specifically, nearest-neighbor interpolation first performs the primary integer-ratio spatial upscaling (2×) of P5 features, preserving exact learned feature values without introducing artificial intermediate values through linear blending and maintaining sharp feature boundaries critical for discriminative spatial patterns. Subsequently, bilinear interpolation performs fine-grained spatial alignment to ensure exact dimensional correspondence with the P4 reference resolution, addressing any residual fractional-pixel misalignment arising from non-integer feature map dimensions. This two-stage interpolation design ensures that the bulk of spatial upscaling is handled by the value-preserving nearest-neighbor method, while bilinear interpolation provides sub-pixel precision exclusively for the final alignment step. A pointwise (1 × 1) convolution then performs learnable channel projection to adapt the upscaled P5 features to the target channel dimensionality. It is important to emphasize that the entire P5 processing pathway is strictly an upscaling pipeline: at no point are P5 features upscaled beyond the P4 resolution and subsequently down-sampled, thereby guaranteeing exact spatial alignment with P4 features without introducing any dimensional inconsistency. Conversely, the finer P3 features are downscaled to the P4 resolution via bilinear interpolation followed by a dedicated down-sampling module (ADown), which jointly performs spatial reduction and channel-wise feature adaptation. The three aligned feature maps are concatenated along the channel dimension to form a composite feature containing multi-scale information, denoted as F c o n c a t . A multi-kernel parallel fusion strategy is subsequently adopted, which uses three depthwise separable convolutions with distinct kernel sizes (3 × 3, 5 × 5, 7 × 7) to process F c o n c a t in parallel. Each convolutional kernel focuses on capturing spatial information at a different scale. The outputs of these parallel operations are fused with F c o n c a t through channel stacking to generate the enhanced feature F i m p r o v e , which effectively increases the diversity of receptive fields while reducing feature loss and information bottlenecks. The specific formulation is given in Equation (3).
F i m p o r v e = S u m ( S t a c k ( k = 0 2 D W C o n v ( F c o n c a t , 3 + 2 k ) , F c o n c a t ) , d i m = 0 )
Building upon the above, pointwise convolution is applied to F i m p r o v e to model inter-channel interactions and learn channel-wise weighting relationships, thereby refining feature representations. Residual connections are subsequently established between F c o n c a t and F i m p r o v e to ensure the integrity of all information while boosting feature representation capability. Subsequently, channel dimension reduction is applied to generate the final fused features of P4-layer. To align channel dimensions for subsequent processing, the Spatial-Channel Decoupled Downsampling (SCDown) module and a bilinear interpolation module are, respectively, deployed for the P5 and P3 pathways. As shown in Figure 1a, phase 1, the Cross-Stage Feature Fusion (C2f) module fuses the refined feature representation with the corresponding original feature maps, yielding enhanced composite feature maps at P5 and P3 scales.
To optimize multi-scale feature exploitation within the FPN framework, a two-stage progressive fusion scheme is formulated for the entire architecture, as shown in Figure 1a, phase 2. A joint NAS with parallel exploration mechanisms is employed to dynamically identify the optimal FPN fusion depth, designated as phase1_number. In the initial fusion stage, MKCD modules are arranged sequentially. The P3, P4, and P5 feature maps produced by the preceding Phase1 component serve as a triplet input to the subsequent MKCD unit, which synthesizes incrementally refined feature representations across the P3, P4, and P5 resolution scales.
Deep integration of the feature set produced during the initial processing stage is accomplished through an adaptive spatially weighted fusion mechanism, wherein the constituent features maintain uniform scale levels while exhibiting heterogeneous fusion depths. Specifically, within each scale, features from different fusion depths are aligned and concatenated. A lightweight weight network then predicts a pixel-wise spatial weight map to dynamically weight features originating from different depths, which are subsequently convolved and fused to produce the final output. As detailed in Equations (4)–(7), after obtaining k sets of same-scale features { F i } i = 1 k (where k = phase1_number + 1), they are first concatenated along the channel dimension. A two-layer 1 × 1 convolutional network combined with a sigmoid function then predicts the pixel-wise spatial weight map W. This weight map performs spatial gating and weighting on each feature stream, which are then re-concatenated and convolved to yield the final fused output F o u t .
F c o n c a t = C o n c a t ( F 1 , , F k )  
W = S i g m o i d ( c o n v ( c o n v ( F c o n c a t ) ) ) ϵ   R B × k × H × W  
F ~ i = F i W [ : , i , : , : ] ,             i = 1 , , k
F o u t = C o n v ( C o n c a t ( F ~ 1 , , F ~ k ) )  
The proposed MKCD-FPN leverages the above strategy to effectively boost feature interactions, guarantee information richness and integrity, optimize multi-level feature fusion, and deliver more accurate feature representations for low-altitude UAV target detection in complex environments. This strategy aims to adaptively select and reassign more effective fusion-depth information, thereby alleviating semantic discrepancies caused by varying fusion depths and improving the representational consistency and detection robustness of the final features.

3.3. Neural Architecture Search

3.3.1. Search Space

To overcome the drawbacks of single-layer Transformer structures in capturing the detailed information and contextual dependencies embedded within complex scenes, as well as the insufficient adaptability of fixed FPN structures across diverse settings, we propose a joint search space designed to simultaneously carry out optimization on both the Transformer encoder and the FPN structure. The search space, denoted as A, encompasses all feasible architectural configurations.
A = α = d , e , h i d , m i d , p d D , e E , h i H , m i M , p P
Within the joint search space, five parameterized candidate sets are defined: d for network depth, e for embedding dimension, h i for attention head candidates, m i for MLP expansion ratio candidates, and p for FPN expansion layer candidates. Comprehensive specifications of these candidate sets are presented in Table 1. A deliberate design choice sets the embed_dim to vary in increments of 32, diverging from the conventional practice of using 256 as the step size. This selection stems from the observation that 32 serves as the greatest common divisor across all candidate embedding dimensions and attention head counts. As a result, every valid pairing of embed_dim and head_dim inherently satisfies the divisibility requirement (head_dim = embed_dim/num_heads Ζ + ), thereby eliminating the need for runtime dimension adjustments during training. The finer granularity afforded by this step size further enables more precise architectural exploration, contributing to heightened search efficiency. The total cardinality of the joint search space is
A r c h i t e c t u r e _ S U M = [ n = 1 d m a x m m a x n × h m a x n ] × e m a x × p m a x
The joint search space encompasses 9   × 10 9 distinct architectural configurations, parameterized by d m a x , m m a x , h m a x , e m a x , and p m a x , which, respectively, represent the upper bounds of candidate values for depth, embedding dimension, attention head count, MLP expansion ratio, and FPN expansion layer count.
Moving beyond conventional Transformer architecture searches limited to depth and embedding dimension, this framework explicitly integrates layer-wise attention head count optimization. This design directly addresses a structural constraint in standard Multi-Head Self-Attention (MHSA): the uniform allocation of attention heads across layers, which may restrict the model’s capacity to represent layer-specific semantic content. By enabling adaptive head count assignment, the search procedure simultaneously addresses representational limitations and prunes redundant heads in selected layers to improve computational efficiency. Within each Transformer layer, the feedforward neural network (FFN) is structured as two sequentially connected fully connected layers. The first layer projects self-attention outputs into an expanded hidden dimension, thereby enriching the model’s ability to encode complex feature interactions and higher-order patterns. This dimensional expansion enhances representational flexibility, allowing the network to model intricate intra-layer dependencies. Subsequently, the second layer maps features back to the original dimension, preserving compatibility with downstream components and ensuring the integrity of residual pathways throughout the architecture. However, traditional Transformers typically set the hidden dimension of each layer to four times the input dimension (mlp_ratio = 4.0) to provide enhanced expressiveness. Nevertheless, the heterogeneous feature extraction demands inherent to distinct network layers render uniformly structured MLP blocks inherently suboptimal. The optimal ratio of the expansion dimension to the input dimension within each MLP block is determined through NAS and formally designated as the MLP ratio. The optimization strengthens residual connectivity and ensures interlayer consistency, outcomes that collectively yield a more flexible and adaptable block architecture. A schematic depiction of the Transformer architecture search procedure appears in Figure 1b. The joint search space is further extended to encompass the count of expansion layers in the initial stage of the MKCD-FPN, a scope that surpasses conventional Transformer encoder parameter optimization. This refinement permits fine-grained adjustment of both the operational complexity of feature procedures and the hierarchical extent of multiscale feature interactions. Deployment of the coordinated search framework endows the model with superior adaptability across heterogeneous application contexts, thereby significantly enhancing generalization capability while sustaining an optimal trade-off between computational resource utilization and feature representation efficacy. To enable systematic exploration and evaluation of all candidate architectures, every parameter spanning the search space is formally encoded into a structured tuple representation as follows:
d , m 1 , m 2 , , m d , h 1 , h 2 , , h d , e , p
The architectural encoding tuple commences with the scalar d, which encodes the Transformer depth, and proceeds to the sequence m 1 through m d , wherein each element m i specifies the MLP ratio assigned to layer i. Thereafter, the tuple integrates h 2 to h d , which denote the attention head count for layer 2 through d, while e represents the shared embedding size, and p indicates the number of stacked layers within the center decoupling stage. The encoding methodology constructs a bijective mapping that uniquely associates each candidate architecture with its corresponding parameter configuration, while simultaneously delivering an optimized framework for decoding and slicing operations essential to the evolutionary search process. As a direct consequence of this design, the evolutionary search procedure attains marked improvements in both computational efficiency and solution fidelity.

3.3.2. Supernet Training

NAS confronts a fundamental computational bottleneck during the screening of candidate architectures, a limitation rooted in the exponentially escalating computational cost associated with conventional evaluation protocols that mandate independent training of every candidate solely for performance validation. This challenge is especially pronounced in UAV detection applications operating within complicated low-altitude environments, where prohibitive computational demands critically undermine the practical feasibility and operational efficiency of architecture search procedures. To tackle this problem, we introduce a three-stage training method. The initial stage involves developing and optimizing a supernet that comprehensively spans the entire search space. Through adoption of a maximum-capacity training paradigm, this framework enables concurrent optimization of all embedded subnetworks. The theoretical foundation of this approach resides in the structural property wherein the subnetwork’s weight matrix inherently embeds every feasible subnetwork configuration, with each subnetwork corresponding to a contiguous subregion of the weight matrix. Consequently, during joint optimization, gradient updates propagate across the full extent of the weight matrix. As a direct outcome, sampled subnetworks in subsequent evolutionary search iterations undergo immediate performance evaluation using their pretrained weight slices, thereby eliminating the requirement for independent retraining. This mechanism inherently circumvents redundant computations associated with iterative training of numerous candidate architectures across expansive search spaces, yielding substantial reductions in computational expenditure while preserving evaluation fidelity. The detailed mechanism governing gradient propagation within the supernetwork weights is presented below:
W super L super = E ( x , y ) D W super L total f x ; W super , α max , y
W s u p e r t + 1 = W s u p e r t η × W super L super
where η signifies the learning rate, L super represents the aggregate training loss of the supernet, and E ( x , y ) D stands for the mathematical expectation over sample pairs (x,y) drawn from the training set D, with x corresponding to the input image and y to the associated detection label, a formulation that guarantees statistical consistency of the loss function across the entire dataset. The supernet’s forward propagation is characterized by the function f x ; W super , α max , which maps the input image x through parameters comprising the shared supernet weights W super and the maximum configuration α max . As specified in Equation (13), α max defines the upper bounds for critical architectural dimensions, including network depth, MLP expansion ratio, embedding dimension, attention head count, and FPN expansion layer count. The composite loss L total is formulated to jointly optimize object detection and super-resolution objectives. Aligning with established practices in the D-FINE model, the detection loss component integrates multiple terms: a varifocal loss weighted at 1.0 to mitigate class imbalance, an L1 regression loss with coefficient 5.0 for precise bounding box location, a GIoU Loss-assigned weight of 2.0 to model spatial overlap between predictions and ground truth, a fine-grained localization loss weighted at 0.15 to refine boundary accuracy, and a decoupled distillation focal loss with weight 1.5 to facilitate inter-layer knowledge transfer. For the super-resolution auxiliary task, an L1 regression loss weighted at 1.0 is incorporated to concurrently enhance detection fidelity and image reconstruction quality. Equation (14) formalizes that detection loss coefficients adhere to D-FINE conventions while super-resolution operates as a supporting objective. To prioritize detection performance during joint optimizations, the loss ratio between detection and SR tasks is calibrated to approximately 7.5:1, a value empirically validated through ablation studies documented in Section 4.3.3. Consequently, this unified loss formulation not only evaluates regression precision for tiny object bounding boxes but also strengthens the model’s resilience against complex background clutter.
α m a x = d m a x = 6 , e m a x = 352 , h m a x = 16 , m m a x = 5.0 , p m a x = 2
L total = λ vfl   L vfl   + λ bbox   L bbox   + λ giou   L giou   + λ fgl   L fgl   + λ ddf   L ddf   + λ sr   L sr  
During joint loss optimization, forward propagation and backward gradient computation for each training mini-batch are performed across the full network architecture, denoted as α max . Consequently, sufficient signals propagate across all weight regions of the supernet, a condition that inherently preserves global weight consistency and enhances the generalization capability of the shared parameters. Furthermore, all candidate subnetwork architectures are implicitly embedded into the supernet through a weight sharing mechanism that is integral to the maximum-capacity training strategy and the specific formula is as follows.
W super = W m a x ( l ) l = 1 d m a x
The symbol W super represents the complete weight set of the supernet, while W m a x ( l ) denotes the weight matrix with maximum capacity for layer l, which corresponds to the architectural configuration of maximal scale supported by that layer. The supernet’s full parameterization is thereby constituted through the aggregation of these maximum capacity weight matrices across all layers. Subnetworks are derived by slicing weight matrices that have been fully optimized during supernet training. Specifically, the procedure extracts a leading submatrix from each maximum capacity weight matrix, where the dimensions of this submatrix are precisely determined by the target subnetwork configuration. This extracted submatrix encompasses all weight parameters essential for the operational functionality of the subnetwork. In the following subsequent evolutionary search stage, each candidate subnetwork inherits its weights directly from the supernet via the weight-slicing mechanism and undergoes immediate performance evaluation on the validation set without any retraining, a feature that inherently eliminates the computational burden associated with training from initialization. As a result, the computational expenditure required for architecture evaluation is substantially reduced. The experimental framework adheres to the established one-shot NAS protocol employed in Autoformer and related studies. Within this framework, candidate architectures are ranked according to a weight-sharing proxy metric, which is defined as the validation mAP@0.5:0.95 computed without retraining. Empirical evidence from prior research confirms that this proxy metric exhibits a strong correlation with the final performance of fully trained models under the condition that the supernet has undergone sufficient optimization. In the final stage, the architecture parameters identified as optimal through evolutionary search are integrated with the pretrained weights, and a dedicated fine-tuning procedure is executed to ensure complete convergence and to maximize overall performance.

3.3.3. Evolutionary Search

The NAS procedure is formulated to identify the architectural configuration that maximizes performance on the validation set while simultaneously satisfying a predefined set of parameter constraints, which are explicitly delineated as follows:
W s u p e r = a r g m i n W super E ( x , y ) D L total f x ; W super , α max , y
Specifically, during evolutionary search, when sampling subnetworks from the search space, any given subnetwork configuration is treated as follows.
A s u b = ( d s u b , e s u b , ( h s u b i ) d s u b , ( m s u b i ) d s u b , p s u b )
Herein, d s u b , e s u b , h s u b i , m s u b i and p s u b specify the network depth, embedding dimension, attention head count and MLP expansion ratio of layer i, and FPN expansion layer count, respectively. Configuration parameters are hierarchically allocated to individual modules, and subnetwork weights are subsequently derived from the supernetwork weights through slicing operations. Front submatrix slicing is applied to inherit weights from the supernetwork for the linear projection components within the attention mechanism, which encompass the query, key, and value projection matrices, as well as for the MLP layers. The mathematical formulations that govern this weight inheritance procedure are explicitly delineated in Equations (18)–(21).
W _ p r o j s u b = W _ p r o j m a x [ : e s u b , : e s u b ]
W _ q k v s u b = W _ q k v m a x [ : 3 × e s u b , : e s u b ]
W _ m l p 1 s u b = W _ m l p 1 m a x [ : ( e s u b × m s u b ) , : e s u b ]
W _ m l p 2 s u b = W _ m l p 2 m a x [ : e s u b , : ( e s u b × m s u b ) ]
P E s u b = P E m a x [ : , : h e a d _ d i m s u b ]
The implementation of position encoding entails partitioning the feature dimension allocated to each attention head. In this context, the head dimension is derived from the ratio of the embedding dimension to the number of attention heads (head_dim = embed_dim/num_heads), and the partitioning operation is executed via front-end subtable slicing, as elaborated in Equation (22). The maximum capacity position encoding table, denoted as P E m a x , resides in the real-valued matrix space R h e a d _ d i m m a x × s p a t i a l _ s i z e . For any layer whose depth exceeds the predefined threshold, an identity mapping is enforced so that feature propagation predominantly inherits representations from its immediate predecessor. To preserve architectural coherence across the entire network, integer divisibility constraints are imposed on both the embedding dimension and the attention head count. Accordingly, the dimensional configurations of LayerNorm modules and the feedforward network (FFN) are synchronously revised, which guarantees that the head count remains an integer and that dimensional alignment is maintained consistently throughout all network components.
Population-based evolutionary search algorithms constitute the core optimization strategy adopted in this study for adaptively refining the supernet’s critical architectural elements and hyperparameters. This refinement process operates under dual constraints that encompass computational resource budgets and target performance metrics. The overarching objective of this methodology is to enhance both the aggregate efficacy and operational robustness of the unified framework that concurrently addresses object detection and super-resolution tasks. Subnetworks selected for evaluation are strictly confined to those whose total parameter count satisfies the inequality P a r a n s m i n <   P a r a m s   < P a r a m s m a x , and the corresponding evaluation protocol is formally specified as follows:
P e r f o r m a n c e c a n d i d a t e = m A P @ 0.5 : 0.95 ( f ( D v a l ; W s u p e r , c a n d i d a t e ) )
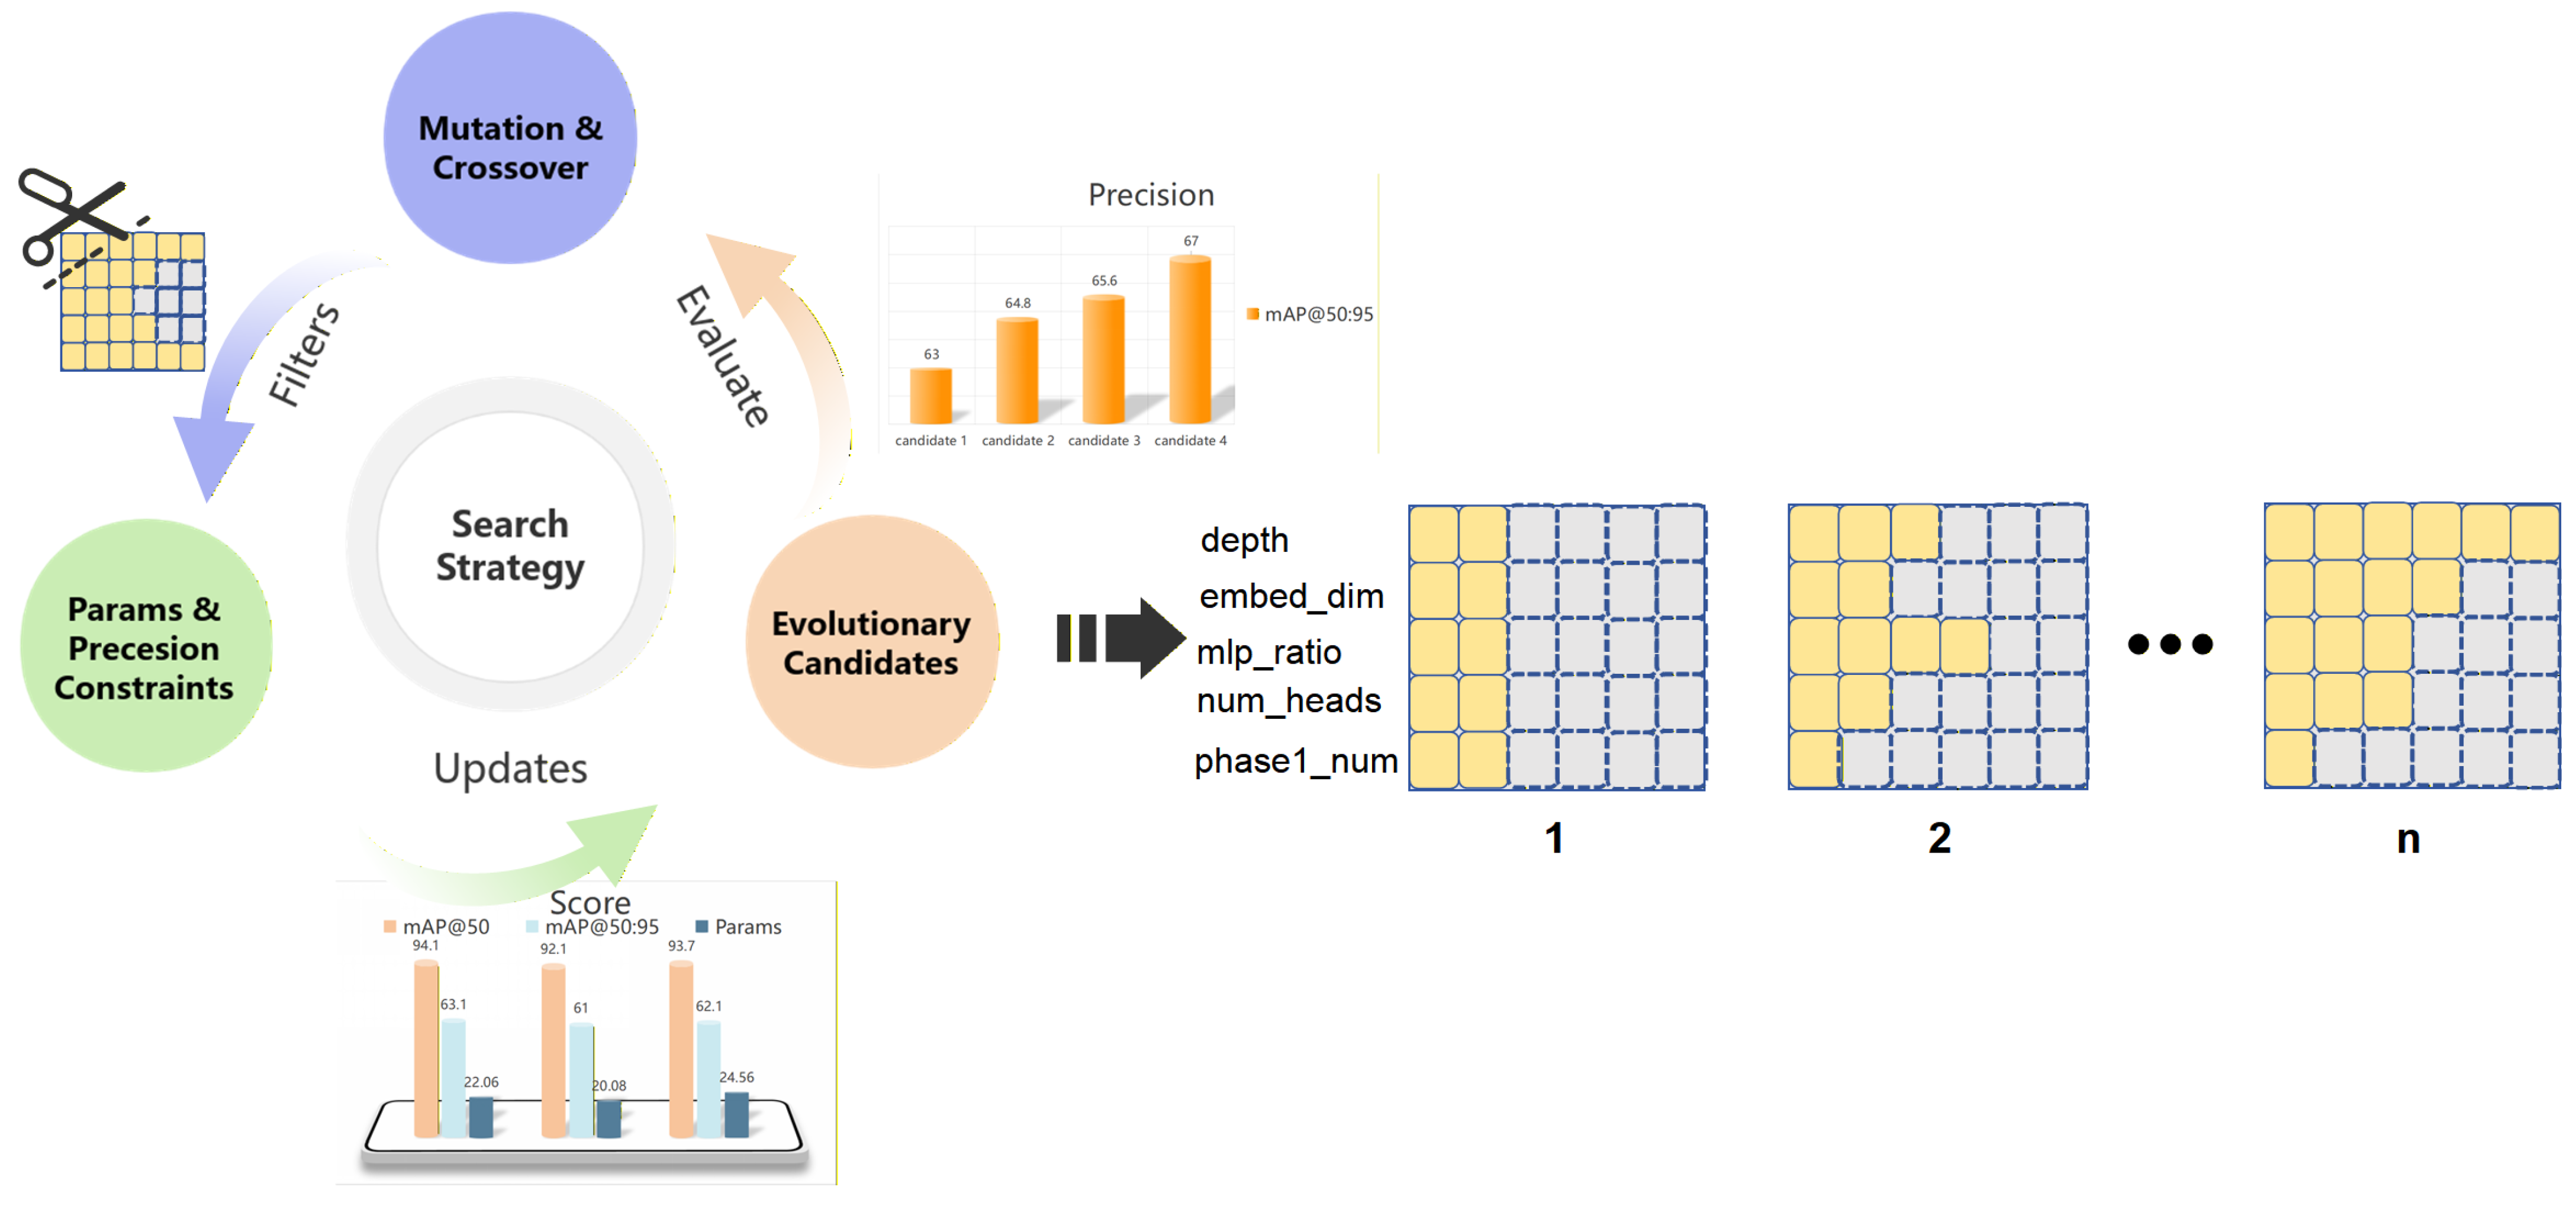
The validation subset of the dataset is formally designated as D v a l . Each candidate neural architecture is encoded by a five-dimensional parameter vector [mlp_ratio, num_head, depth, embed_dim, phase1_number], wherein the fitness metric is defined as the mean mAP@0.5:0.95 computed across IoU thresholds ranging from 0.5 to 0.95 on D v a l . This constraint interval encompasses the parameter scales characteristic of mainstream lightweight object detection models, which ensures that architectures identified through the search process exhibit computational complexity comparable to established benchmarks. Prior to initiating the evolutionary procedure, the initial population P 0 is constructed by uniformly sampling p candidate architectures from the predefined search space. For each evolutionary generation, the algorithm performs a predefined sequence of procedural steps. First, an elite subset P t o p is formed by selecting the top-k individuals that achieve the highest fitness values in the current population. Second, P 2 offspring individuals (denoted P cross ) are generated through crossover, which involves randomly selecting two parent architectures from P t o p and stochastically inheriting parameter values for each dimension from either parent. Third, mutation produces P 2 mutated individuals (designated P m u t ) by randomly choosing parents from P t o p ; structural parameters such as the depth d or embedding dimension e are altered with probability P m u t , whereas intralayer parameters including the MLP ratio or per-layer attention head count are modified with probability P d . Fourth, should the combined count of valid offspring from crossover and mutation fall below the target population size p , the deficit is compensated by uniformly sampling additional architectures (termed P rand ) until the population is restored to size p . Fifth, the offspring sets P rand , P mut , and P c r o s s are amalgamated to constitute the population for the subsequent generation, denoted P t o p + 1 . The population update rules are delineated in Equation (24). This evolutionary cycle is repeated for 20 consecutive generations. Fitness evaluation for each candidate architecture is performed by extracting the corresponding weight slices from the pretrained supernet and computing the mAP metric via a single forward propagation on D v a l , a procedure that eliminates the need for additional training. The elite retention mechanism prioritizes architectures that achieve superior accuracy while satisfying parameter scale constraints, thereby preserving the top-k performing candidates. A schematic illustration of the complete search methodology is provided in Figure 4.
P t o p + 1 = P mut P cross P rand
In alignment with the methodology of Autoformer, the evolutionary algorithm is configured with a population size p of 50, allocating 25 individuals to crossover operations and 25 to mutation operations. The elite preservation count k is fixed at 10, while mutation probabilities are configured as P m = 0.4 for structural parameters and P d = 0.2 for intralayer parameters. These parameter settings facilitate precise exploration in the vicinity of high-fitness solutions and concurrently enforce rigorous selection pressure against low-performing candidates. The evolutionary procedure iterates through a cyclic workflow that encompasses elite merging, selection, crossover and mutation, constraint repair, proxy evaluation, and candidate architecture refinement, terminating only upon satisfaction of convergence criteria. To assess the robustness of the search process, two independent evolutionary runs were executed on the DUT Anti-UAV dataset using distinct random seeds. The top-performing architectures derived from these runs exhibited mAP@0.5:0.95 scores with a deviation below 0.2%, which substantiates the insensitivity of the search outcome to initialization conditions. Notably, while the exact per-layer hyperparameters (e.g., individual mlp_ratio and num_heads assignments) differed between the two runs, the macro-level structural properties exhibited clear convergence: both runs selected architectures within the same depth range, similar embedding dimension bands, and comparable phase1_number values, yielding parameter counts within 2% of each other. This convergence pattern is consistent with the theoretical understanding of evolutionary optimization over high-dimensional search spaces: the fitness landscape contains a performance plateau comprising multiple architectures with near-equivalent detection accuracy, and different evolutionary trajectories converge to distinct but functionally equivalent configurations within this plateau. The consistency in macro-structural properties, combined with the negligible mAP deviation, demonstrates that the search space is well-designed and the evolutionary algorithm reliably identifies high-quality architectural regions regardless of random initialization. The architecture yielding the highest proxy evaluation score during the search phase was subsequently adopted to initialize the model training stage. During this stage, supplementary procedures for stability enhancement and performance consolidation were implemented to optimize the trade-off among prediction accuracy, parameter efficiency, and deployment feasibility. Central to computational efficiency is the weight-sharing mechanism established during hypernetwork pretraining, which enables accurate performance estimation of any candidate architecture via targeted weight-slicing operations on pretrained weights without requiring independent subnetwork retraining. Consequently, this methodology eliminates the computational overhead associated with repeated subnetwork training, thereby substantially accelerating the overall architecture search process.

3.4. Super Resolution

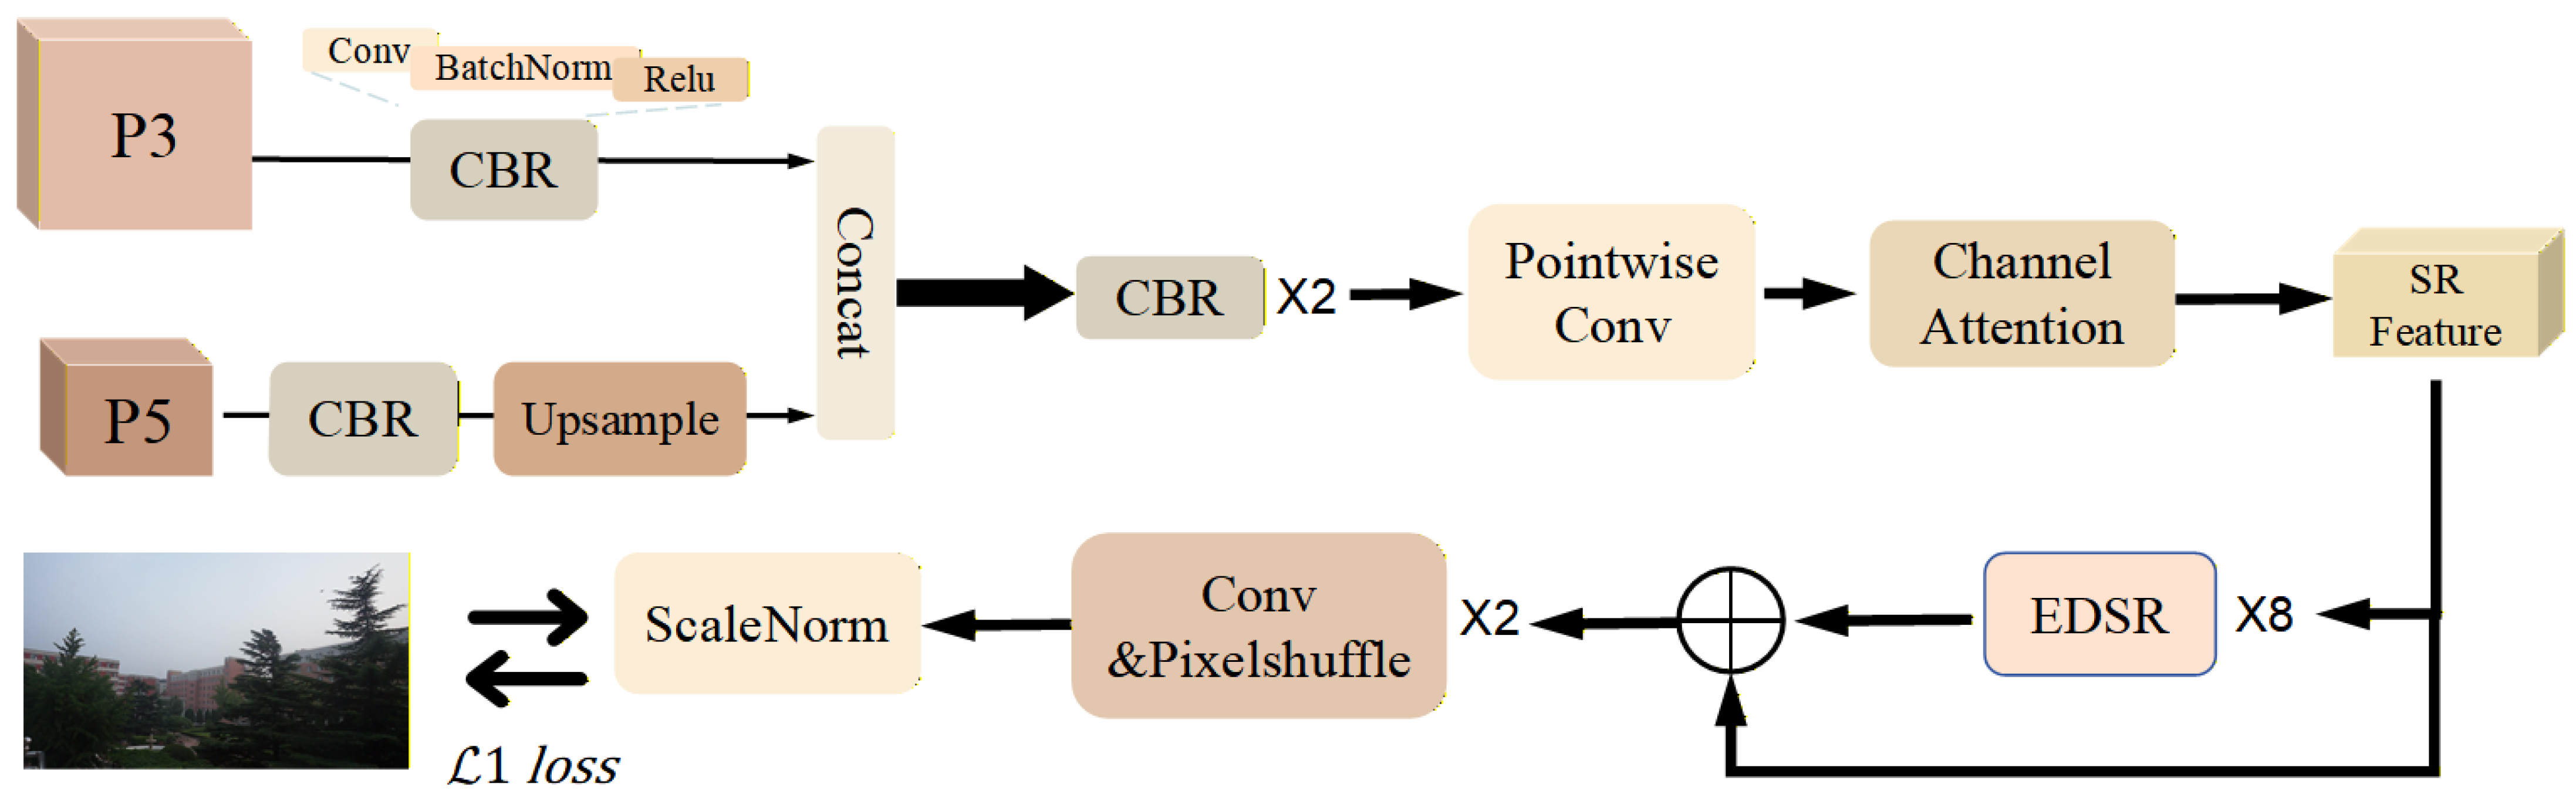
Shallow backbone features preserve the spatial details needed for tiny objects but are rarely used end-to-end because full-resolution feature maps are costly and background-dominated attention dilutes instance-level information. Inspired by [29,44,45], we introduce a super-resolution (SR) auxiliary branch so that the reconstruction loss back-propagates into the shared backbone, encouraging it to retain high-resolution information that benefits both pixel reconstruction and detection, without increasing inference cost. Lightweight SR methods underuse multi-scale complementarity; heavy networks (e.g., SRCNN, RCAN) are too costly for an auxiliary branch. We therefore adopt a compact encoder–decoder for multi-scale fusion and an EDSR-style reconstruction head to balance reconstruction quality and computational cost.
The reconstruction supervision is pixel-level L1 loss between the SR branch output and the input image (resized to match the SR output when resolutions differ), weighted relative to the detection loss so the primary task remains dominant. The high-resolution (HR) reference is thus the same image as that fed to the detector, requiring no separate HR dataset. This self-supervised objective encourages the backbone to preserve fine structure (edges and textures) necessary for reconstructing the image, which aligns with the goal of improving small-object detection.
As illustrated in Figure 5, the SR branch takes features from backbone stages P3 (256 channels, detail-rich) and P5 (1024 channels, semantics-rich). The encoder reduces each stream to 128 channels via 1 × 1 convolution, up-samples the P5 stream to the P3 spatial size, and concatenates to 256 channels. This dual-path design avoids direct fusion of 1280 channels and prevents semantic features from overwhelming local detail. The decoder applies a fusion convolution (two 3 × 3 convolutions followed by a 1 × 1 projection) to 64 channels, with channel attention, then feeds the result into an EDSR module: a 3 × 3 head, 8 residual blocks (each with two 3 × 3 convolutions and ReLU, no Batch Normalization to avoid a feature distribution shift that harms pixel-level reconstruction), a global residual connection, and an up-sampling tail with two 2× pixel-shuffle stages for 4× spatial up-sampling. Scale normalization (1 × 1 conv, BatchNorm, Tanh) is applied so the SR output matches the detection-loss scale. The residual blocks enable learning of high-frequency detail important for edges and textures; we omit RCAN-style attention to keep the branch lightweight for training-only use. The SR branch participates only in training and is removed at inference, so it contributes no parameters to the deployed model. Evolutionary search evaluates backbone/encoder/decoder configurations on the shared weights and does not incorporate the SR branch, so search complexity is unchanged. The auxiliary reconstruction task improves the backbone and encoder’s discriminability for edges, textures, and tiny objects; under the same accuracy constraint, the search tends to select smaller embed_dim, depth, and phase1_number, yielding a more compact final architecture. This yields better training-time feature quality at no inference cost.

4. Experiments

4.1. Datasets

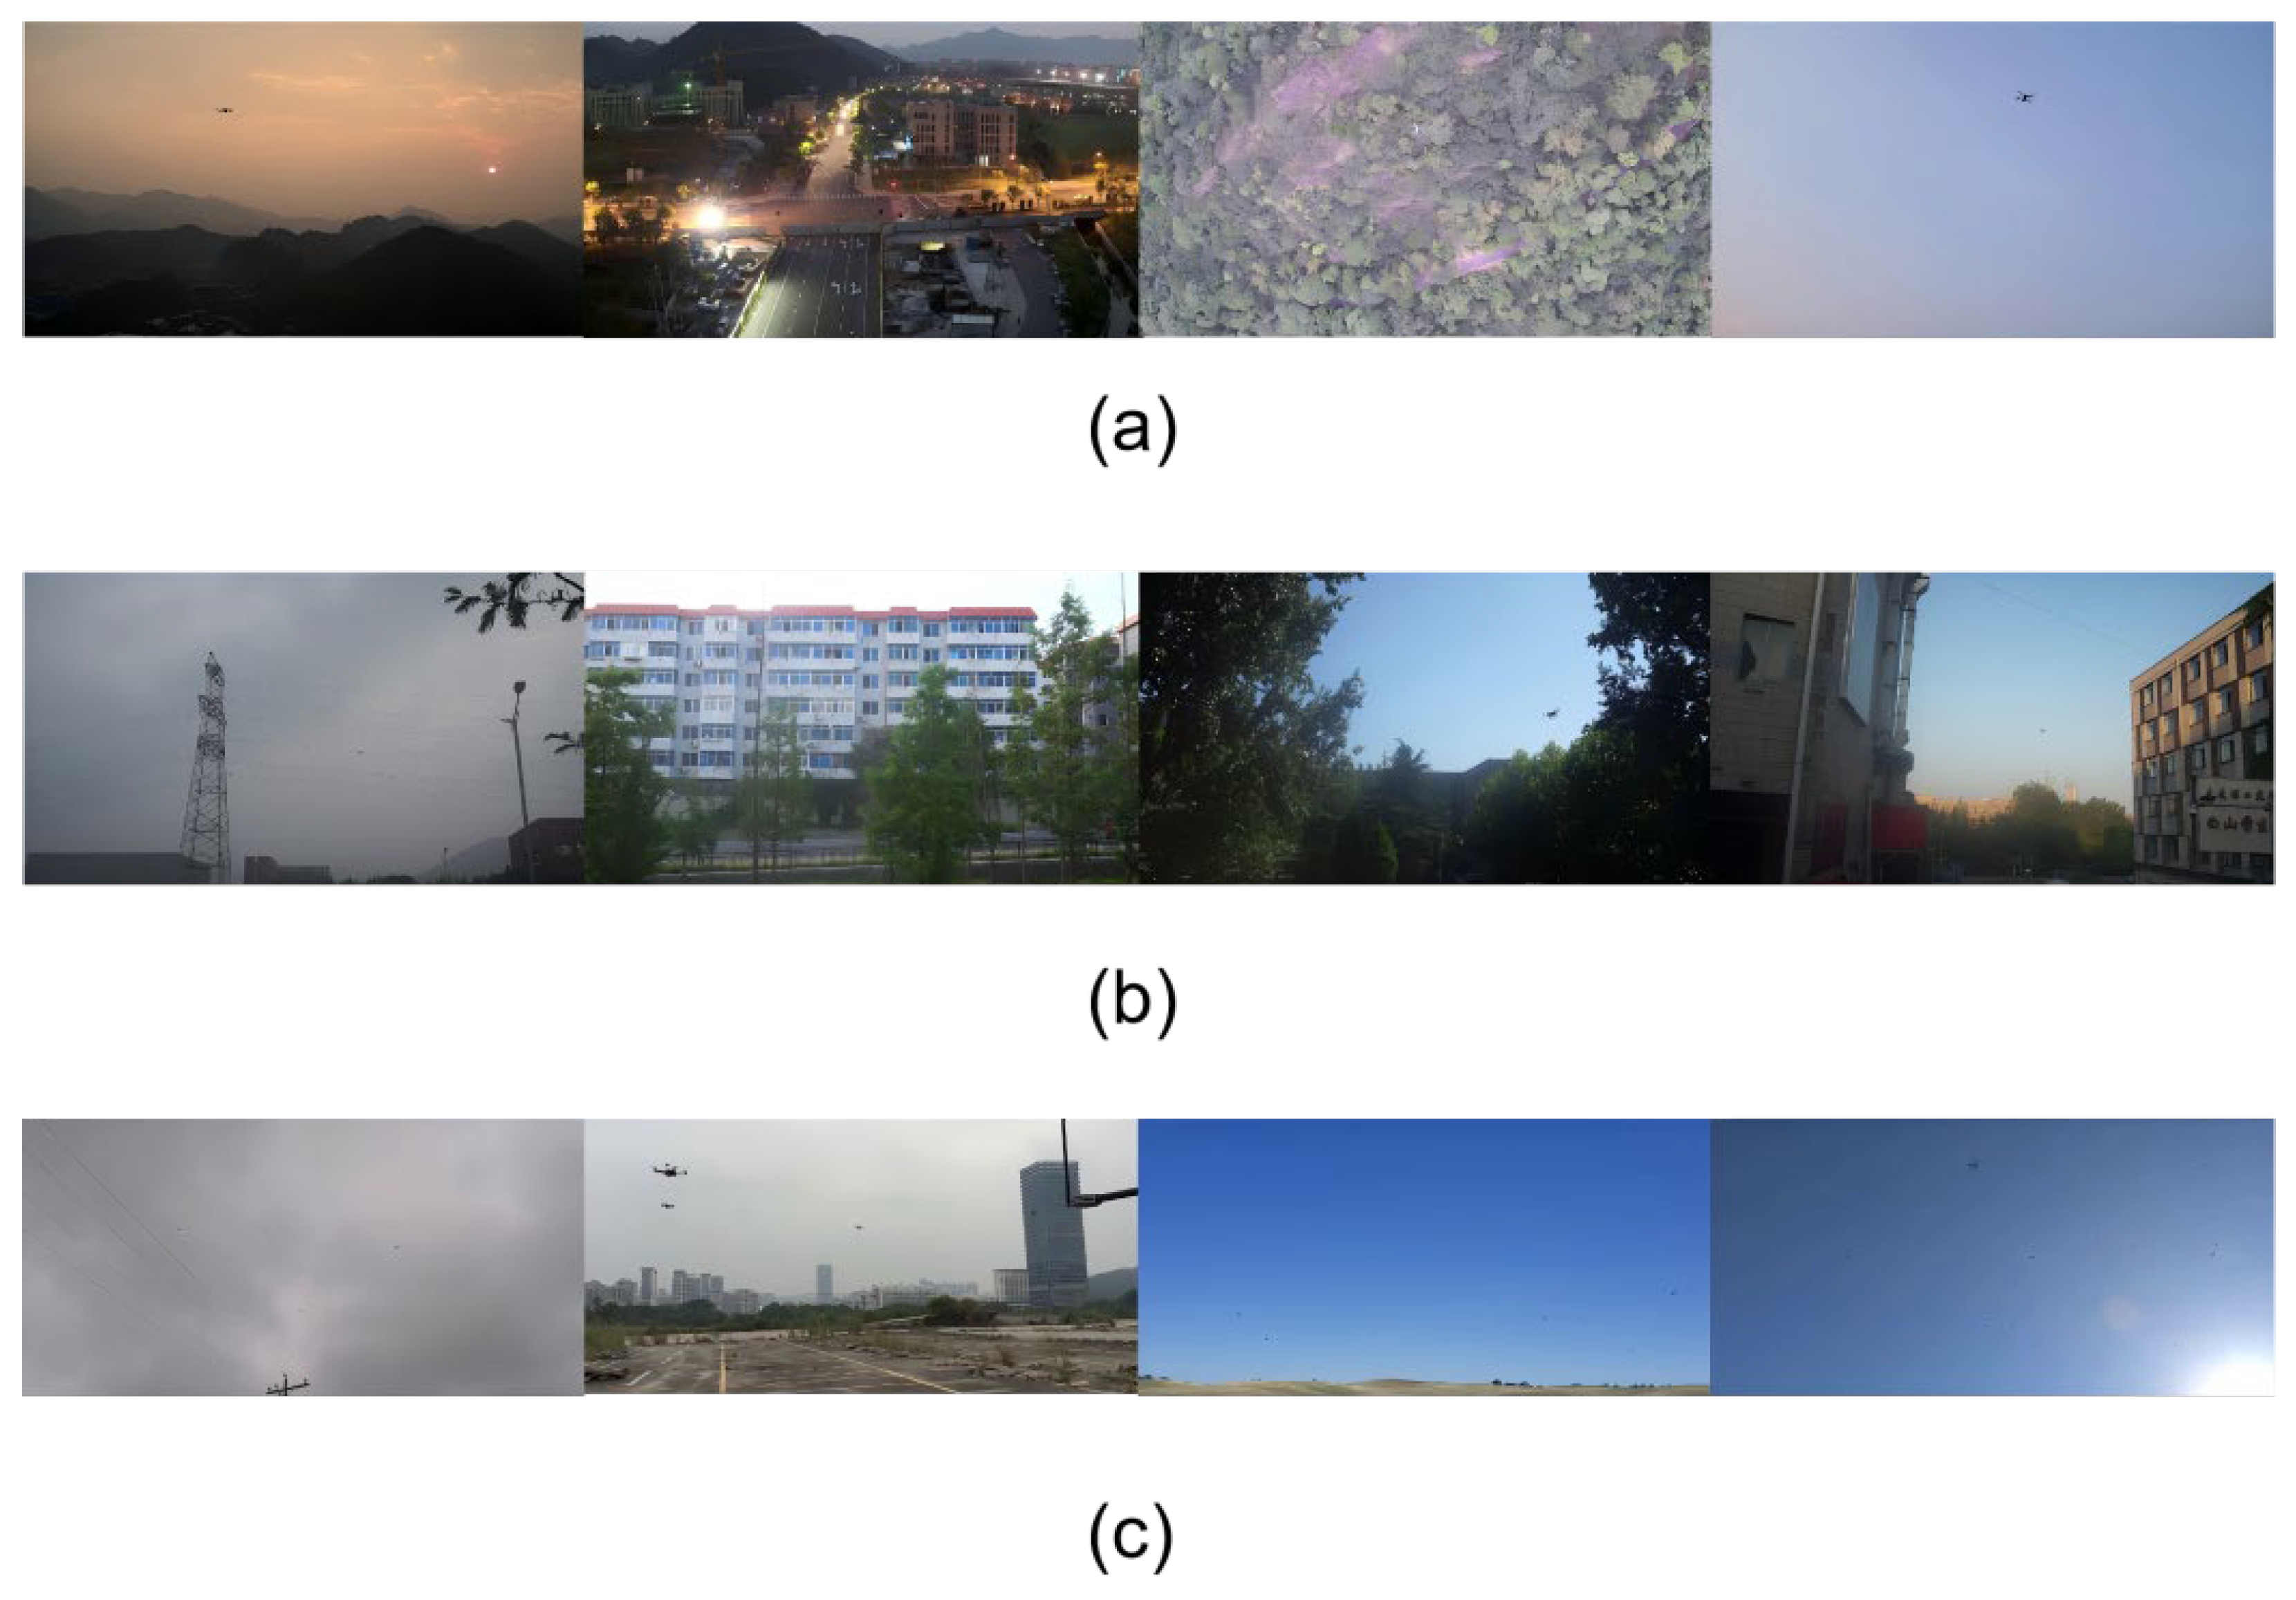
For a thorough evaluation of our method, we employ three publicly UAV datasets, namely DetFly [24], DUT Anti-UAV [25], and UAV Swarm [26].
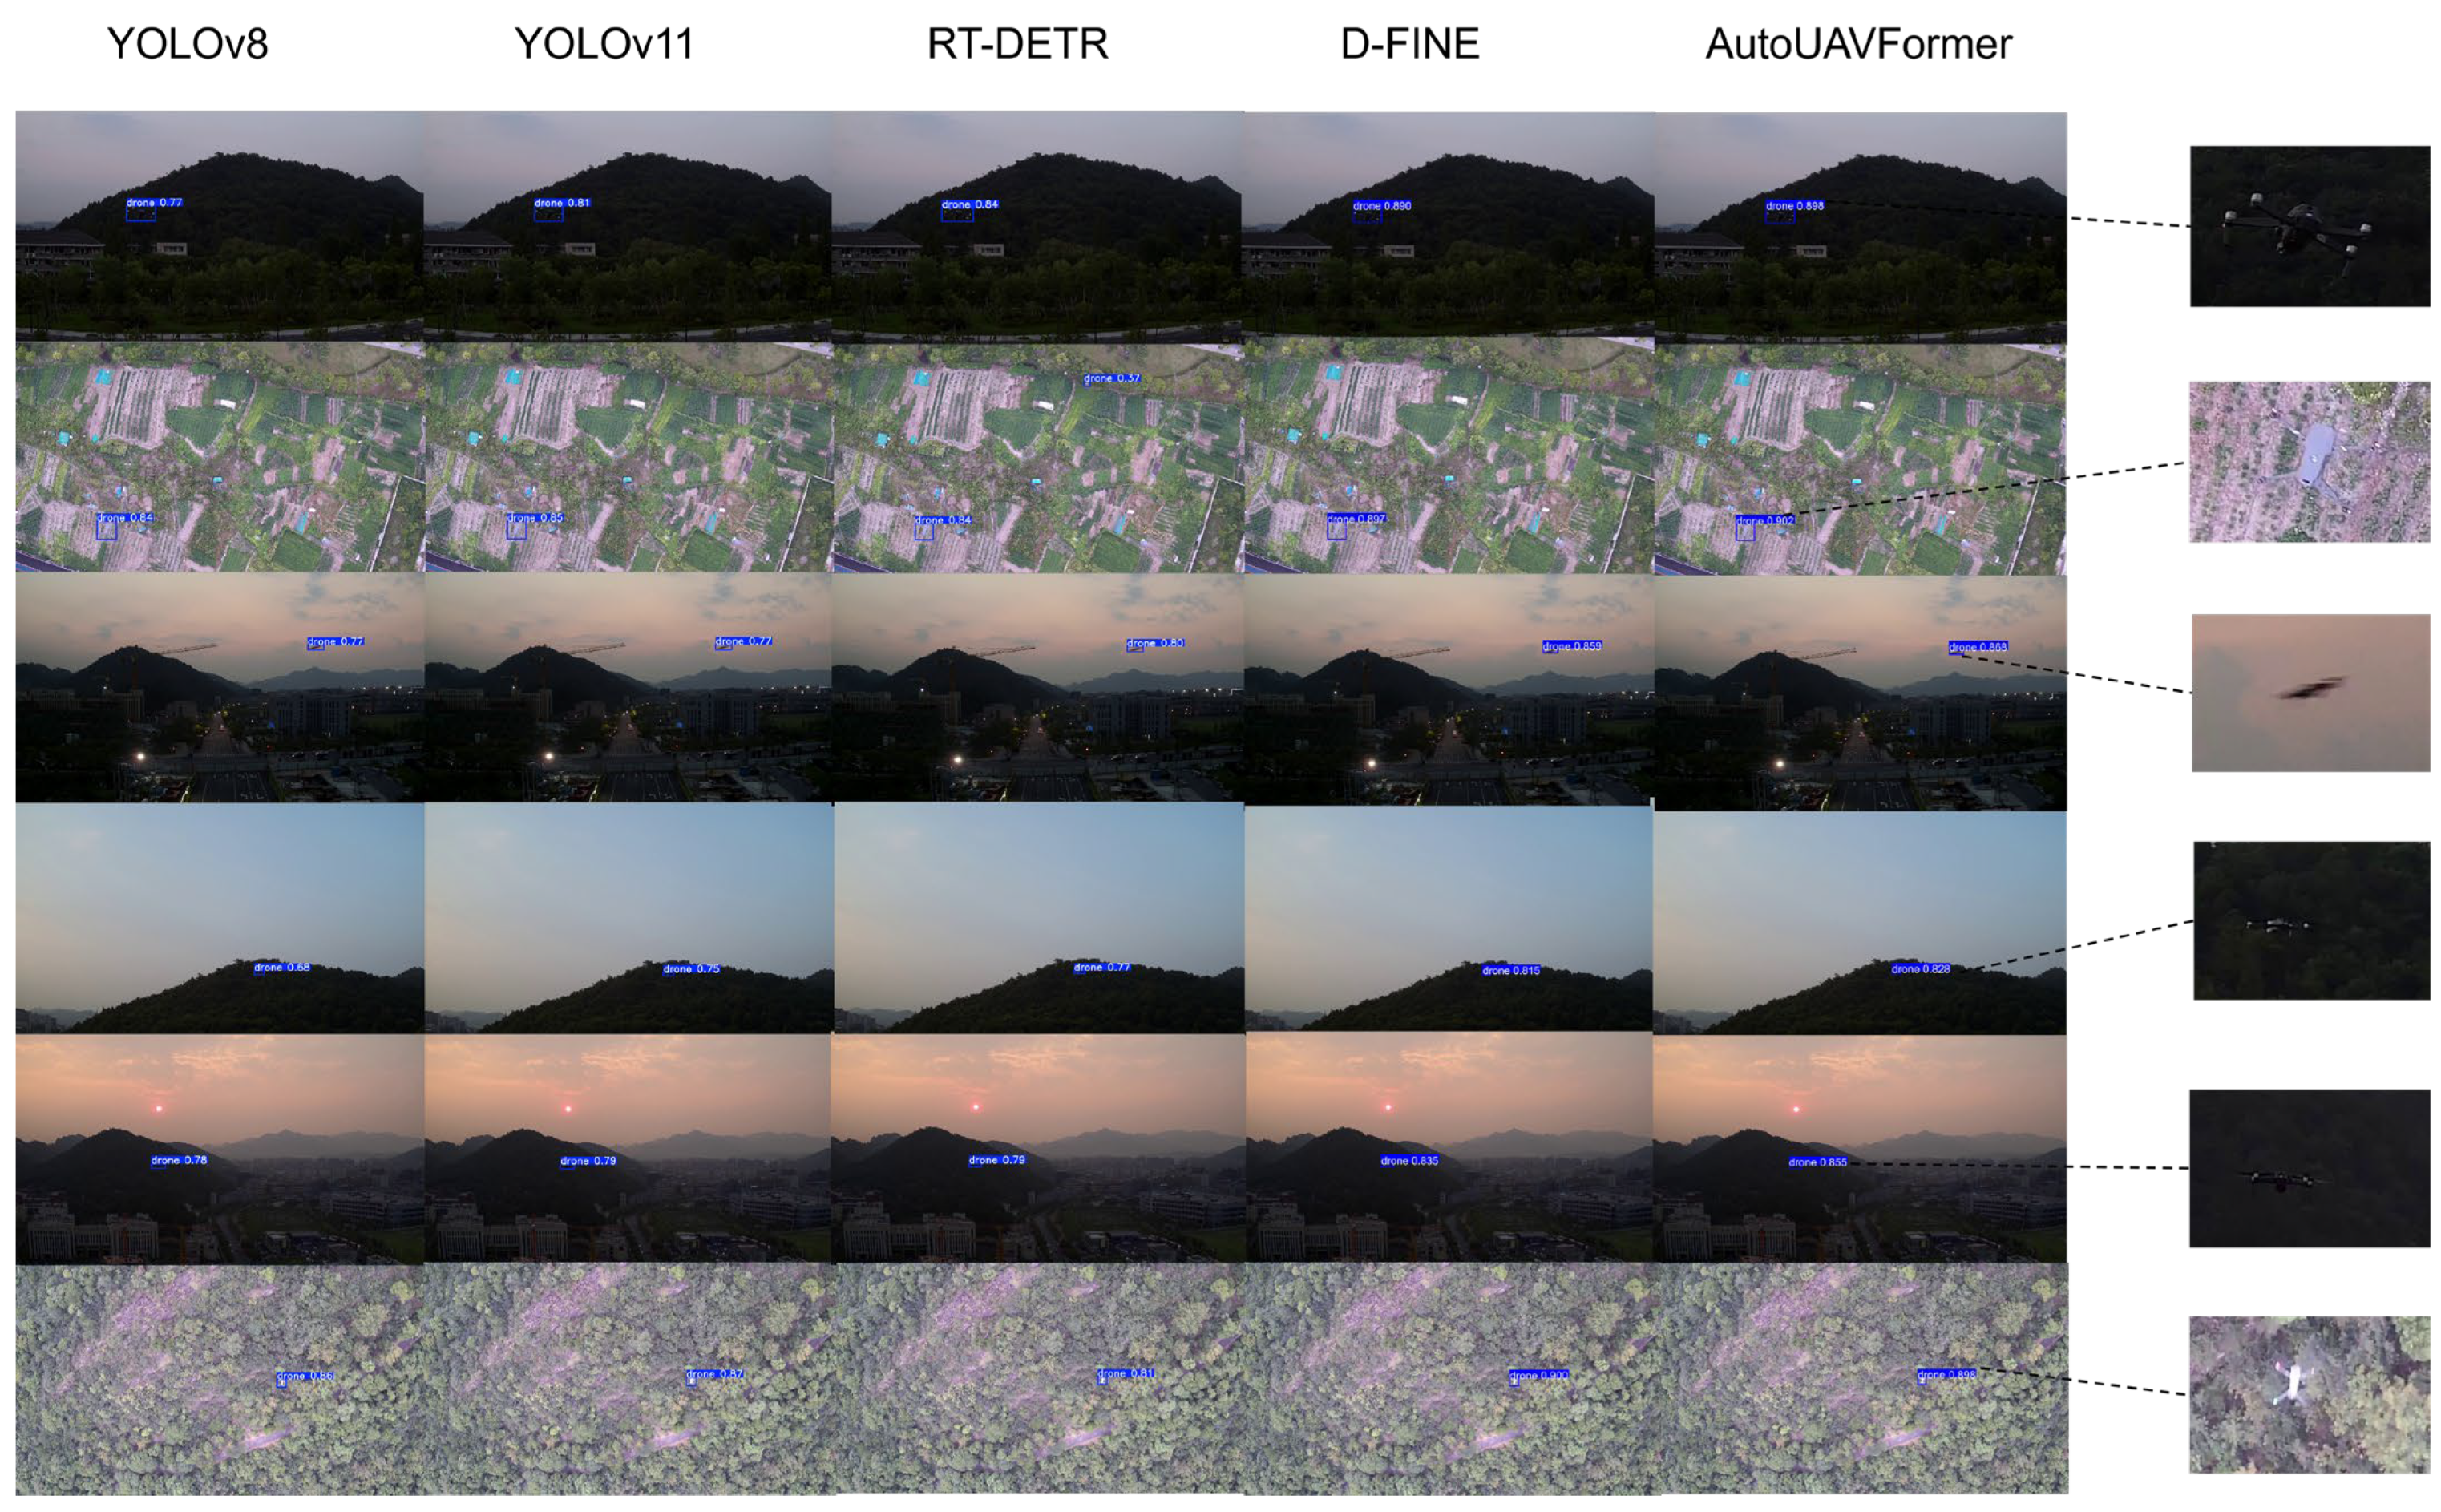
DetFly: Illustrated in Figure 6a, the DetFly dataset functions as an air-to-air UAV detection benchmark containing 13,271 high-resolution images. The dataset encompasses diverse operational scenarios, including mountainous terrain, urban landscapes, ground-level scenes, and aerial backgrounds. Image acquisition was conducted from three distinct viewpoints, which are defined as top-down, eye-level, and bottom-up perspectives. To replicate authentic UAV detection challenges, deliberate variations were introduced across illumination intensity, target occlusion levels, and motion blur severity. Every image maintains a resolution of 3840 × 2160 pixels, wherein target UAVs are positioned at altitudes ranging from 20 to 110 m and exhibit relative distances spanning from 10 to 100 m; this configuration collectively supplies rich multiscale contextual information that is critical for detection tasks. Adhering strictly to experimental protocols, the dataset underwent random partitioning into training, validation, and testing subsets according to a 7:2:1 ratio, a division that yielded 9289 training images, 1327 validation images, and 2655 testing images.
DUT Anti-UAV: As presented in Figure 6b, the DUT Anti-UAV dataset integrates both detection and tracking parts. For this study, only the detection part was adopted, with dataset allocation conforming precisely to the official partitioning protocol: 5200 for training, 2200 for testing, and 2600 for validation. This benchmark encompasses visual samples of 35 distinct UAV models and leverages heterogeneous image resolutions to foster multiscale adaptability in detection architectures.
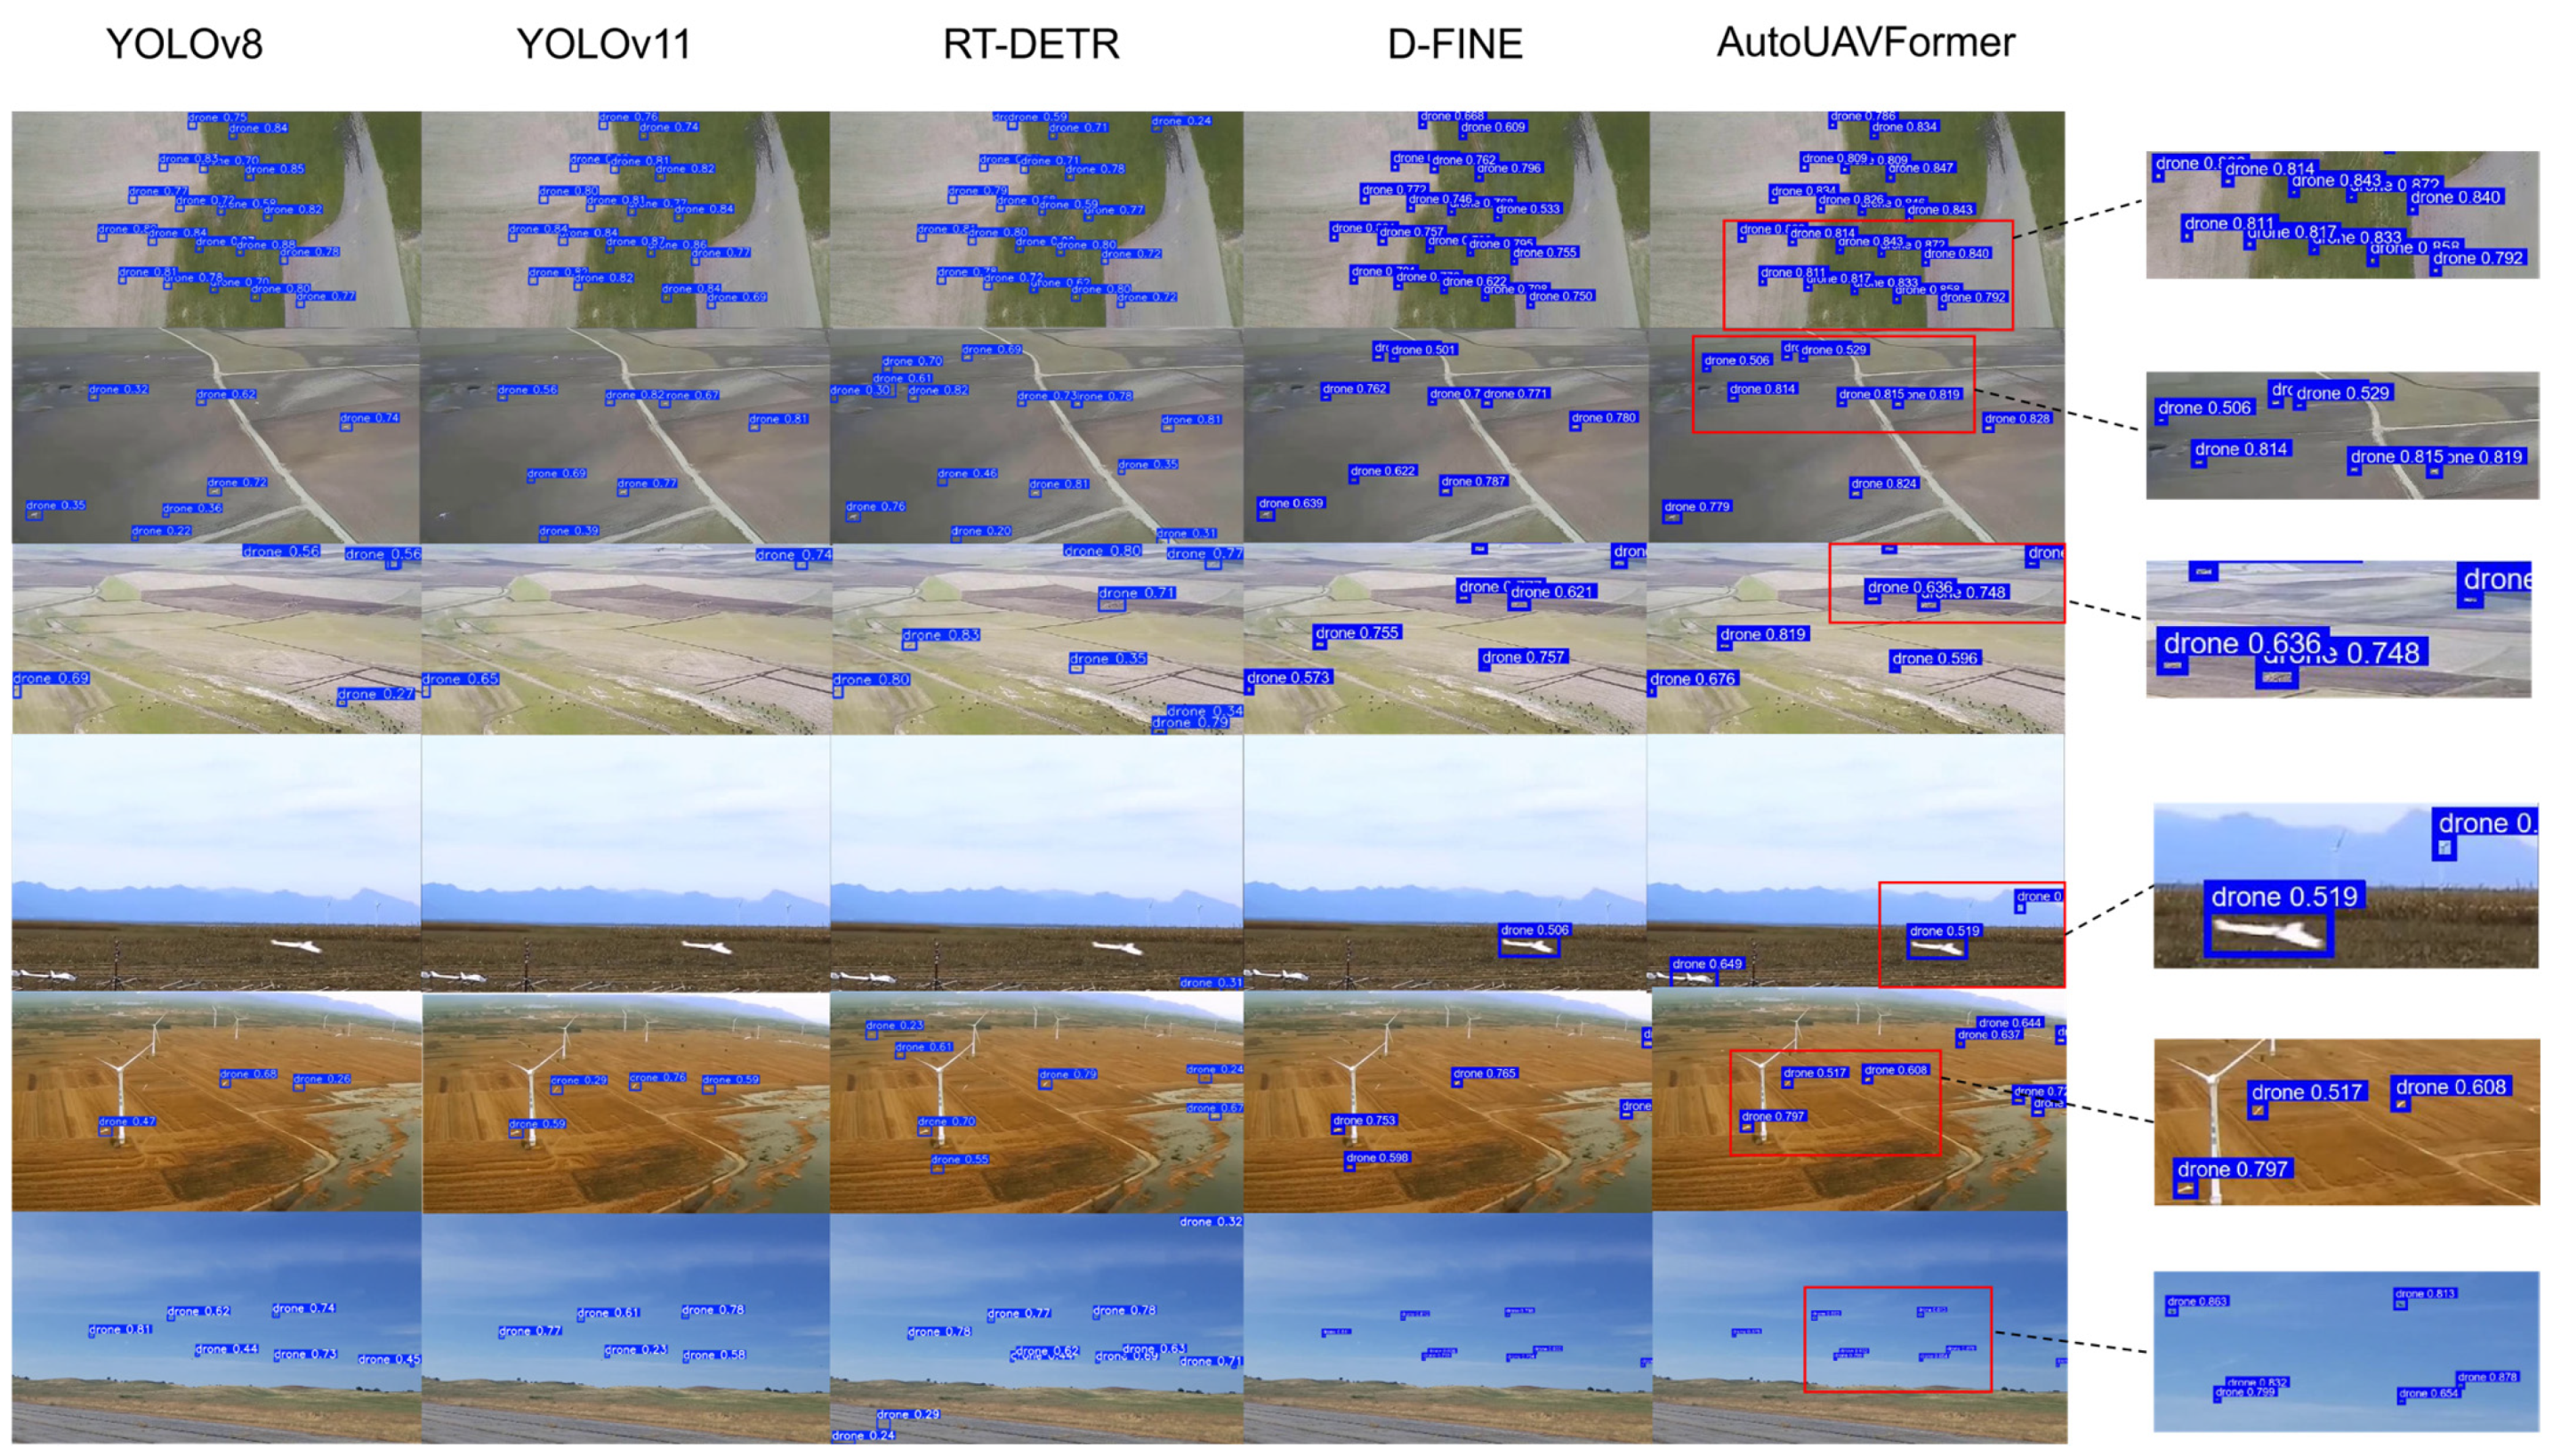
UAV Swarm: Depicted in Figure 6c, the UAV Swarm dataset documents 13 operational scenarios and over 19 unique UAV models across 12,598 images. Heterogeneous resolutions are incorporated specifically to enhance model robustness under varying imaging conditions. A salient distinction of this benchmark, relative to the other two datasets, lies in its markedly elevated UAV density, wherein each frame contains between 3 and 23 UAV instances. Experimental execution followed the official partitioning scheme, assigning 6844 images to the training subset and 5754 to validation.
Owing to their extensive scenario diversity, heterogeneous environmental conditions, and varied UAV configurations, these three benchmarks collectively establish a rigorous evaluation framework for thoroughly assessing the stability, generalizability, and deployment readiness of AutoUAVFormer in low-altitude, complex UAV detection scenarios.

4.2. Training Settings and Evaluation Metrics

All experimental procedures described in our paper were executed within a computational environment operating on a Linux-based system. The software stack, which comprised Python 3.11.9, PyTorch 2.0.1, and CUDA 11.8, was uniformly deployed to maintain environmental consistency. For model training, the hardware configuration consisted of a single NVIDIA GeForce RTX 4080 GPU that featured 16 GB of dedicated video memory. To guarantee methodological equivalence across evaluation, identical experimental protocols were rigorously applied during the training phase of all baseline and comparative models. Specifically, all models were trained for 200 epochs with the same batch size of 2, using the AdamW optimizer with a base learning rate of 10 4 , betas (0.9, 0.999), and weight decay of 10 4 (zero for normalization layers). The input image size was 640 × 640, and the same data augmentation strategies (Mosaic, RandomIoU, RandomZoomOut) were applied. All models were evaluated on the same validation and test sets under identical evaluation protocols. The reported results for baseline models were obtained using their default architectures and official implementations, without any additional hyperparameter tuning or architectural modifications.
In the domain of object detection, quantitative assessment of model efficacy is systematically performed with reference to three foundational evaluation criteria that are formally designated as precision (P), recall (R), and mean average precision (mAP). The numerical computation of each criterion adheres strictly to the mathematical formulations that are explicitly delineated as follows:
P = T P T P + F P
R = T P T P + F N
m A P = 1 c j = 1 c A P j
A P = 0 1 P ( R ) d R
As shown above, true positives (TP) are defined as the count of predictions that correctly identify positive instances, false positives (FP) correspond to the count of negative instances that are erroneously classified as positive, and false negatives (FN) denote the count of actual positive instances that the model fails to detect. Precision (P) is mathematically formulated as the ratio of true positives to the sum of true positives and false positives, which quantifies the reliability of positive predictions, whereas recall (R) is expressed as the ratio of true positives to the sum of true positives and false negatives, thereby reflecting the model’s capacity to capture all relevant targets. The average precision (AP) is computed by integrating the area under the curve that characterizes the precision-recall trade-off across varying detection thresholds, and the mean average precision (mAP) is subsequently derived as the arithmetic mean of AP values that are individually calculated for each object category. To holistically assess inference efficiency and runtime characteristics of the evaluated architectures, supplementary evaluation metrics were incorporated into the protocol, which encompass the total parameter count (Params), computational complexity quantified in gigaflops (GFLOPs), and inference throughput measured in frames per second (FPS).

4.3. Ablation Experiments

The efficacy of AutoUAVFormer network architecture was rigorously assessed through systematic ablation studies performed on DUT Anti-UAV, wherein all quantitative results were derived as the arithmetic mean of three independent experimental repetitions. A standardized evaluation protocol was implemented, incorporating a metric suite that is conventionally adopted in object detection benchmarks, which encompasses mAP@0.5, mAP@0.5:0.95, R, P, Params, GFLOPs, and FPS. The ablation methodology was organized across three distinct analytical dimensions, which are defined as overall architectural innovations, core module design, and hyperparameters configuration, and the individual contribution of each component to model performance was systematically quantified.

4.3.1. Ablation on the Overall Architecture

To verify the effectiveness of the three core innovations, this study adopts D-FINE M as the baseline and conducts progressive ablation experiments by sequentially introducing Neural Architecture Search (NAS), Multi-Kernel Center Decouple FPN (MKCD-FPN), and the super-resolution (SR) branch. As shown in Table 2 below, the experimental results on DUT Anti-UAV clearly present the cumulative contribution of each component to the model performance.
As can be seen from Table 2, the baseline (Model 0) yields 93.1% mAP@0.5 and 63.0% mAP@0.5:0.95 with 19.8 M parameters and 59.8 GFLOPs. Adopting the NAS strategy (Model 1) achieves 94.1% and 64.8% in mAP@0.5 and mAP@0.5:0.95, respectively, with a comparable parameter count (20.42 M) but notably lower GFLOPs (35.9). This decrease in GFLOPs is expected: the fixed D-FINE-M uses a single hand-crafted Transformer/decoder configuration that is computationally heavier, whereas NAS explores the joint search space under the same parameter budget (8–25 M) and selects a sub-architecture that is more efficient in FLOPs while improving accuracy. Thus, NAS here jointly optimizes for both accuracy and efficiency rather than simply adding capacity. After introducing the MKCD-FPN module (Model 2), the model achieves significant improvements in core detection metrics with a moderate decrease in inference speed: mAP@0.5 and mAP@0.5:0.95 are increased to 94.2% and 65.6%, respectively, and recall and precision are both improved by 1.2%. Notably, despite the increase in parameters from 20.42 M to 21.87 M (a 7.1% increase), the model effectively enhances the representation capability of multi-scale features through multi-kernel parallel convolution and progressive depth fusion mechanisms, laying a solid foundation for subsequent performance gains. Upon further introducing the SR branch (Model 3), the model performance achieves a qualitative leap. By incorporating the SR mechanism, the model tends to search for more compact architectures under the multi-task learning framework. With a slight decrease in parameters (from 21.87 M to 20.80 M, a 4.9% reduction), mAP@0.5 and mAP@0.5:0.95 are boosted to 95.5% and 67.0%, respectively, representing improvements of 2.4% and 4.0% over the baseline (Model 0) and 1.4% and 2.2% over Model 1. More importantly, the precision is significantly increased to 98.4%, a 3.1% improvement over Model 1, fully validating the significant contribution of the SR branch to detection accuracy by recovering high-resolution spatial details. After the introduction of the SR branch, the evolutionary search strategy automatically explored more compact and efficient architectural configurations (the number of layers is optimized from 8 to 5, and the parameter count is optimized from 20.42 M to 20.80 M), reflecting the adaptive optimization capability of architecture search under the multi-task learning framework.

4.3.2. MKCD-FPN Module

Multi-Kernel Size Selection
The core innovation of the MKCD-FPN module proposed in this study lies in the adoption of multi-kernel depthwise separable convolutions for parallel processing of multi-scale features, where the selection of different convolution kernel sizes directly affects the model’s perception capability for objects of various scales. To determine the optimal convolution kernel combination, this study designed ablation experiments for multi-kernel size selection, as shown in Table 3.
Experimental results show that the single 3 × 3 convolution kernel (Model 1) yields the most limited performance, with only 92.6% mAP@0.5 and 63.0% mAP@0.5:0.95. The dual-kernel parallel architecture of Model 2, which was established through the integration of a 5 × 5 convolution kernel, yields comprehensive enhancements across all evaluation metrics. Within this framework, mAP@0.5 and mAP@0.5:0.95 were elevated to 94.0% and 65.6%, respectively, and concurrent reductions were attained in both parameter count and computational complexity. Upon further introducing the 7 × 7 convolution kernel to form a triple-kernel parallel structure (Model 3), the model achieves the optimal performance: mAP@0.5 is boosted to 95.5%, mAP@0.5:0.95 to 67.0%, and the precision reaches 98.4%. However, when the 9 × 9 convolution kernel is introduced to form a four-kernel parallel structure (Model 4), the model performance slightly degrades instead, with mAP@0.5 dropping to 93.8% and mAP@0.5:0.95 to 64.6%. This phenomenon indicates that an excessively large receptive field may introduce excessive background noise, which exerts a negative impact on fine-grained object detection. Therefore, the triple-kernel parallel configuration of 3 × 3, 5 × 5, and 7 × 7 is finally selected, achieving the best trade-off between performance and efficiency.
Feature Aggregation Layer Selection
The MKCD-FPN module aggregates features at different levels through a progressive depth fusion mechanism. To explore the optimal feature aggregation strategy, this study compared the effects of performing final aggregation on different feature layers (P3, P4, P5), and the experimental results are shown in Table 4.
As can be seen from Table 4, aggregation at the P3 layer (Model 1) achieves a high recall (92.2%) and the fastest inference speed (214 FPS), but is slightly lower than the P4 aggregation strategy in terms of mAP@0.5 and mAP@0.5:0.95. Aggregation at the P4 layer (Model 2) achieves the best overall performance: mAP@0.5 reaches 95.5%, mAP@0.5:0.95 reaches 67.0%, and the precision is as high as 98.4%. This result indicates that the P4 layer, as a middle-scale feature, retains sufficient high-resolution spatial details while containing rich semantic information, making it the optimal layer for multi-scale feature aggregation. In contrast, aggregation at the P5 layer (Model 3) achieves a high recall (93.6%) but suffers from reduced overall accuracy due to the lack of high-resolution details. Based on the above analysis, the P4 layer is finally selected as the feature aggregation layer.

4.3.3. Weight Ratio of the Multi-Task Loss Function

In our multi-task setup, the balance between the detection loss and the SR reconstruction loss strongly influences the final behaviour: if SR dominates, the model can overfit to reconstruction and learn textures that do not help, or even hinder, detection. We therefore conduct a sensitivity analysis over the detection–SR loss ratio. Ablation experiments were designed using a dichotomy over the ratio, and the results are given in Table 5.
As can be seen from Table 5, when the ratio of detection loss to super-resolution loss is 1:1 (Model 1), the loss weights of the two tasks are equal, which may cause the model to focus excessively on the super-resolution task and thus impair detection performance, resulting in only 94.1% mAP@0.5. When the ratio is adjusted to 10:1 (Model 2), the model tends to prioritize the detection task, and the performance is slightly improved with mAP@0.5 reaching 94.3%, but the auxiliary role of the super-resolution task is weakened. When the ratio is adjusted to 5:1 (Model 3), mAP@0.5:0.95 decreases again, indicating that this ratio setting is not conducive to the overall performance of the model. Finally, when the ratio is set to 7.5:1 (Model 4), the model achieves the best overall performance: mAP@0.5 reaches 95.5%, mAP@0.5:0.95 reaches 67.0%, and precision reaches 98.4%. This result demonstrates that, while maintaining the dominance of the detection task, appropriately introducing the supervision signal from the super-resolution task can effectively promote the model to learn more discriminative feature representations, thereby achieving optimal performance.

4.3.4. Super Resolution Branch

Ablation studies were systematically executed across three datasets to rigorously assess the efficacy and generalizability of performance enhancements conferred by the SR branch upon backbone feature representations. The comprehensive outcomes of these experiments are documented in Table 6.
Deployment on the DetFly dataset revealed that incorporating the SR branch necessitated adjustments to the architectural parameters previously optimized through evolutionary search. Operating under strict and consistent parameter bounds and performance objectives, the SR branch induced a parameter size increment from 20.05 M to 21.17 M while yielding a discernible improvement in detection capability. Evaluation metrics encompassing mAP@0.5, mAP@0.5:0.95 and accuracy each demonstrated an enhancement of approximately 1 percentage point. This performance gain was attained with only a marginal increase in model scale. Although a slight elevation in computational complexity was observed, the SR branch substantially augmented the primary network’s capacity to discern high-resolution features through the reconstruction of fine-grained spatial details, a mechanism that directly translated into quantifiable performance improvements. Even as evaluation metrics neared saturation, AutoUAVFormer consistently realized incremental performance improvements, which were directly attributable to its superior outcomes in the comprehensive assessment encompassing both detection precision and computational efficiency.
Systematic evaluation of the SR branch on DUT Anti-UAV, which is defined by the prevalence of low-altitude civilian drones within campus settings, and on UAV Swarm, which encompasses complex multi-target long-range drone scenarios, confirmed its efficacy in enabling the model to acquire features that preserve enriched high-resolution information. On DUT Anti-UAV, the SR branch maintained a comparable parameter count while improving mAP@0.5 by 1.3 percentage points and mAP@0.5:0.95 by 1.4 percentage points, with precision increasing notably from 94.5% to 98.4%. On UAV Swarm, the SR branch reduced the parameter count by 7.5% while improving mAP@0.5 by 2.2 percentage points and mAP@0.5:0.95 by 1.5 percentage points. Unlike the DetFly case where the SR branch guided the search toward a deeper architecture with a modest parameter increase, the SR branch on DUT Anti-UAV and UAV Swarm directed the search toward more compact configurations, indicating that the interaction between SR-guided feature learning and evolutionary search is dataset-dependent and adapts to the specific complexity of each domain.
All in all, two persistent challenges in UAV detection, which specifically involve the accurate identification of minute objects and the mitigation of computational burden inherent in processing spatially detailed shallow features, are effectively resolved by the super-resolution branch through an innovative methodological framework. The activation of this branch is strictly restricted to the training phase, a constraint that guarantees all supplementary computational expenditure remains entirely confined to training and exerts no measurable impact on inference efficiency. The explicit reconstruction of high-resolution spatial details enables the branch to function as a structural regularizer, which systematically enhances feature representation learning while preserving the inference complexity of the core architecture. Consequently, this architectural paradigm consistently delivers superior detection performance without compromising deployment efficiency. An additional observation from Table 6 is that the searched architectures exhibit notable structural variation across the three datasets, e.g., depth ranges from 5 (DUT Anti-UAV) to 8 (DetFly) and the embedding dimension varies between 256 and 320. This divergence reflects the capacity of NAS to adapt network topology to each domain’s distributional characteristics: DetFly’s high-resolution diverse-terrain scenes favor deeper, wider networks; DUT Anti-UAV’s moderate-complexity urban scenarios benefit from compact architectures; and UAV Swarm’s dense multi-target setting requires diversified attention head configurations. For practical deployment: (1) if the target scenario closely resembles a benchmark setting, the corresponding architecture should be directly adopted; (2) if resources permit, evolutionary search on a domain-specific sample is recommended, as the complete pipeline requires approximately 80 GPU-hours on a single RTX 4080; (3) otherwise, the DUT Anti-UAV architecture is recommended as a generalizable default owing to its broadest intra-class UAV diversity and favorable efficiency profile.

4.4. Comparison Experiments

4.4.1. Comparison and Analysis of Experiments with General Object Detection Methods

The evolution of object detection methods in recent years has been defined by the proliferation of sophisticated algorithms, among which the YOLO and Transformer families are widely recognized as predominant paradigms. To facilitate rigorous comparative analysis against AutoUAVFormer, multiple baseline models were selected, all of which conform to a uniform M size configuration while incorporating architecturally distinct backbones. Comprehensive experimental outcomes, derived from evaluations performed across the three datasets under the evaluation protocol specified in Section 4.2, are systematically documented in Table 7.
From the quantitative results reported in Table 7, two additional explanatory conclusions can be drawn beyond merely identifying the best indicators. Firstly, AutoUAVFormer achieved the highest mAP@0.5 and mAP@0.5:0.95 across all three datasets, with its advantage being particularly pronounced under the stricter mAP@0.5:0.95 metric. This indicates that the performance gain does not stem solely from improved detection of “easy samples” at high confidence thresholds, but rather reflects a systematic enhancement in localization accuracy and multi-scale feature matching capability. Secondly, the magnitude of improvement varies across the three datasets, which correlates with their dominant challenges. DetFly features relatively lower illumination variation, camouflage effects, and background texture interference. DUT Anti-UAV exhibits more structural clutter and occlusion in urban and campus environments. UAV Swarm, by contrast, is primarily challenged by dense multi-object scenarios and large scale variations. AutoUAVFormer’s multi-layer Transformer encoder provides stronger global context modeling, MKCD-FPN enhances cross-scale interaction and center alignment, and the SR auxiliary branch during training reinforces texture and edge cues for small targets. Together, these design elements account for its consistent superiority across diverse dataset conditions.
Optimal performance across the core evaluation metrics, which encompass mAP@0.5, mAP@0.5:0.95, R, and P, was attained by AutoUAVFormer on DetFly. When benchmarked against D-FINE, the approach that secured the second highest ranking among all evaluated methods, measurable enhancements of 1.5% in mAP@0.5, 2.0% in mAP@0.5:0.95, and 2.5% in P were documented for the proposed architecture. This dataset contains a high proportion of challenging samples characterized by strong background textures, low target contrast, and tiny object sizes. Without sufficient global semantic constraints, models tend to misinterpret mountain silhouettes, tree canopy textures, and similar structures as potential detection regions. AutoUAVFormer’s enhanced global context modeling and multi-scale feature fusion effectively suppress high-frequency background noise while emphasizing structural cues of UAVs. As illustrated in Figure 7, under conditions of low illumination and complex background textures in the DetFly dataset, YOLOv8, YOLOv11, and RT-DETR are more prone to low-confidence predictions or false positives/negatives. Although D-FINE can localize targets, it suffers from suboptimal confidence calibration and bounding box instability. In contrast, AutoUAVFormer generates tighter, more consistent bounding boxes across samples, demonstrating superior discriminative capability for camouflaged and low-contrast small targets.
Superior performance across the same metrics was attained by AutoUAVFormer on DUT Anti-UAV, despite a recall value that was approximately 2 percentage points below that of D-FINE. This performance characteristic indicates that a deliberately conservative detection strategy is implemented for extremely tiny or heavily occluded targets, a design decision that originates from the model’s objective to achieve more compact and accurate bounding box regression coupled with robust background suppression capabilities, thereby yielding a marginal reduction in recall. Notwithstanding this minor deficit, pronounced superiority of AutoUAVFormer over D-FINE was evidenced by metric enhancements of 2.4% in mAP@0.5, 4.0% in mAP@0.5:0.95, and 4.7% in P, a behavioral profile that primarily reflects the model’s efficacy in minimizing false positives and refining localization precision. Visual evidence presented in Figure 8 demonstrates that structural backgrounds, which include building edges and occlusion induced by branches, consistently trigger centroid drift and false positive detections in conventional baseline models under the DUT Anti-UAV evaluation protocol. In contrast, bounding boxes generated by AutoUAVFormer exhibit markedly enhanced centroid stability and precise alignment with target contours, whereas certain baseline architectures manifest attenuated detection response or substantial localization deviations when processing distant and diminutive targets.
In UAV Swarm scenarios characterized by densely packed objects and pronounced scale variations, AutoUAVFormer consistently surpassed all comparative methods across the core evaluation metrics. This superior performance was attained despite employing a parameter count marginally lower than that of D-FINE, with measurable gains of 1.4% in mAP@0.5 and 2.1% in mAP@0.5:0.95. The cross-scale fusion and center alignment mechanism embedded within AutoUAVFormer effectively resolves recurrent difficulties in crowded scenes, which include redundant detection, bounding box localization drift, and interference induced by occlusion. Figure 9 illustrates that detection frameworks such as YOLOv8, YOLOv11, RT-DETR frequently manifest both omission errors and duplicated bounding box predictions under dense multi-scale UAV Swarm conditions. Although D-FINE achieves a higher recall value, it remains susceptible to misclassifying non-target elements, which encompass wind turbine blades and highly reflective terrain features, as UAVs. In contrast, AutoUAVFormer generates bounding boxes that exhibit enhanced spatial uniformity and reduced overlap within densely populated regions, and the model concurrently demonstrates diminished false activation in areas where genuine targets are absent.
A broader examination of the precision-recall characteristics across all three benchmarks reveals that the enhanced false positive suppression visually observed in Figure 7 and Figure 8 represents only one aspect of AutoUAVFormer’s improved detection capability. On DetFly and UAV Swarm, AutoUAVFormer simultaneously achieves the highest recall (97.2% and 86.4%) and the highest precision (99.1% and 91.8%) among all evaluated methods in Table 7, providing direct evidence that false negative reduction and false positive suppression are concurrently achieved rather than traded against each other. On DUT Anti-UAV, the recall of 90.4% at the default confidence threshold is 2.4 percentage points below D-FINE’s 92.8%, yet this value remains the second highest among all twelve general-purpose methods in Table 7 and the highest among all domain-specific Anti-UAV methods in Table 8, surpassing YOLOv7-GS (90.3%), Lightweight YOLO11 (89.8%), and DACG-Net (85.1%). The 4.0 percentage point advantage in mAP@0.5:0.95 (67.0% vs. 63.0%) further confirms superior detection fidelity across all ten IoU thresholds from 0.50 to 0.95, where strict IoU criteria reclassify localization-imprecise detections as missed targets, thereby demonstrating measurable false negative reduction that the single-threshold recall metric alone cannot capture. The minor recall difference on DUT Anti-UAV reflects a more conservative confidence calibration consistent with the SR-enhanced feature learning producing more discriminative representations that assign higher confidence to genuine predictions. In operational Anti-UAV deployment, the confidence threshold can be adjusted to prioritize recall in mission-critical scenarios, while the model’s enhanced feature discriminability ensures that precision remains above competing methods. These observations collectively confirm that the synergistic effect of SR-guided feature learning, MKCD-FPN multi-scale fusion, and Transformer global context modeling enhances inter-class feature separability between UAV targets and background structures, fundamentally benefiting both false positive suppression and false negative reduction.

4.4.2. Comparison and Analysis of Experiments with Anti-UAV Detection Methods

To rigorously assess the effectiveness of the proposed methodology, comparative evaluations were conducted on DetFly and DUT Anti-UAV, wherein AutoUAVFormer was benchmarked against prominent UAV detection frameworks introduced within the preceding two years. Table 8 consolidates the corresponding experimental outcomes.
On DetFly, AutoUAVFormer achieved an mAP@0.5 of 98.6%, outperforming ALDNet (98.3%) and ATA-YOLOv8 (96.4%). Meanwhile, it attained the highest mAP@0.5:0.95 (68.1%) and precision (99.1%) on this dataset, demonstrating its ability to maintain superior localization accuracy even under stricter IoU thresholds. Notably, AutoUAVFormer also achieved a recall of 97.2%, surpassing VDTNet’s reported 94.9%, thereby maintaining a clear advantage across comprehensive metrics. On DUT Anti-UAV, AutoUAVFormer obtained an mAP@0.5 of 95.5%, comparable to that of Lightweight YOLO11 (95.2%). However, it consistently outperformed Lightweight YOLO11 in mAP@0.5:0.95 (67.0% vs. 65.7%), precision (98.4% vs. 96.9%), and recall (90.4% vs. 89.8%). This indicates that, while matching state-of-the-art performance at standard detection thresholds, AutoUAVFormer delivers more robust gains under stringent localization criteria and exhibits better-balanced overall detection capabilities compared to algorithms such as DACG-Net and YOLOv7-GS. From an efficiency standpoint, although AutoUAVFormer did not always have the fewest parameters or the lowest computational complexity, it consistently achieved real-time inference speeds of approximately 185–215 FPS across repeated trials on all three datasets, generally superior to most RT-DETR variants (around 110–190 FPS).
Table 8. Comparison between AutoUAVFormer and the Mainstream Models on DetFly and DUT Anti-UAV Datasets (Bold Values Indicate Optimal Accuracy Results).
DatasetModelPublisher & YearmAP@0.5mAP@0.5:0.95PR
DetFlyATA-YOLOv8 [27]Drones 202596.4-98.092.4
EDGS-YOLOv8 [33]Drones 202493.4-91.491.9
DRF-YOLO [35]Appl. Syst. Innov. 202591.155.495.086.5
ALDNet [39]Meas. Sci. Technol. 202598.367.398.397.9
VDTNet [28]T-ITS 202494.8-92.194.9
AutoUAVFormer-98.668.199.197.2
DUT Anti-UAVDCR-YOLO [34]Aerosp. Sci. Technol. 202588.858.695.081.3
DRF-YOLO [35]Appl. Syst. Innov. 202586.954.893.980.3
YOLOv7-GS [36]Drones 202493.2-96.890.3
Lightweight YOLO11 [37]Drones 202495.265.796.989.8
DACG-Net [40]T-AES 202592.862.696.385.1
AutoUAVFormer-95.567.098.490.4
Collectively, these findings confirm that AutoUAVFormer establishes a favorable balance between detection precision and computational efficiency for UAV identification in complex low-altitude environments without compromising real-time operational requirements. This capability arises from the synergistic integration of three core architectural components, which comprise a multi-layer Transformer encoder designed to extract comprehensive global contextual features, a novel MKCD-FPN module engineered to enable robust cross-scale feature fusion, and a super-resolution auxiliary branch implemented to refine textural details during the training phase.

4.5. Feature Visualization Analysis

To move beyond reliance solely on quantitative metrics in tables, we select representative samples from each of the three datasets (including scenarios such as low illumination, occlusion by campus buildings, and dense drone swarms), and employ attention heatmaps to visualize the models’ regions of interest and assess their localization stability. Figure 10 compares attention heatmaps to illustrate why certain baseline methods are prone to background distraction. The detection outputs of YOLOv8, YOLOv11, RT-DETR consistently manifest scattered high-response regions that frequently coincide with non-target areas, which encompass mountain silhouettes, building edges, and textured ground surfaces. Despite exhibiting enhanced localization precision around true targets, D-FINE concurrently generates a considerable number of spurious high-response points within background regions. In contrast, AutoUAVFormer concentrates its high responses tightly on UAVs and their immediate surroundings, while effectively suppressing widespread background activations. This is consistent with its multi-layer Transformer encoder enhancing global semantic constraints and improving localization consistency through more robust cross-scale fusion.
On the whole, qualitative visualization and heatmap comparisons offer mechanistic insights that corroborate the quantitative advantages presented in Table 7 and Table 8. AutoUAVFormer demonstrates a superior ability to direct attention toward structurally salient regions of targets while suppressing interference from complex background textures, thereby achieving more stable localization and significantly fewer false or duplicate detections under challenging conditions, including low illumination, small targets, and dense multi-object scenes.

5. Conclusions

This study systematically tackles the main challenges of Anti-UAV visual detection in complex low-altitude scenarios, characterized by significant scale fluctuations, diminished discriminative capabilities for small-scale UAV targets, and the requirement for computationally efficient inference. AutoUAVFormer is introduced as an NAS-driven detection framework that integrates super-resolution guidance into its core design. Dataset-adaptive architecture optimization is realized through a unified search space, which fuses critical Transformer hyperparameters with the novel MKCD-FPN structure, coupled with a three-stage training and search protocol that incorporates weight-sharing mechanisms. Comprehensive evaluation across three large-scale benchmarks, which include DetFly, DUT Anti-UAV, and UAV Swarm, verifies that AutoUAVFormer not only exceeds contemporary methods in detection accuracy but also maintains low computational overhead. Qualitative visual assessments further corroborate the model’s resilience to background clutter and its precision in localizing densely distributed targets. Despite the demonstrated equilibrium between detection fidelity and computational efficiency, multiple research avenues remain open for exploration. First, advanced model compression methodologies, which encompass knowledge distillation and quantization-aware training, will be investigated to further optimize the architecture for deployment on resource-constrained platforms. Second, to strengthen all-weather perception capabilities under dynamically varying low-altitude conditions, the incorporation of multimodal sensing streams, which include infrared thermal imaging modalities, will be pursued with particular emphasis on nighttime operations and adverse meteorological scenarios. Finally, subsequent efforts will concentrate on exploiting temporal context extracted from sequential video frames to mitigate false positives induced by motion blur artifacts.

Author Contributions

Conceptualization, L.P. and J.C.; methodology, L.P.; software, L.P.; data curation, L.P.; writing—original draft preparation, L.P.; writing—review and editing, J.C., H.W., P.N., L.S., Z.H., Y.C., S.W. and Y.L.; supervision, J.C., L.S. and Z.H.; funding acquisition, J.C. and L.S. All authors have read and agreed to the published version of the manuscript.

Funding

This research was funded by the National Natural Science Foundation of China under Grant U23B2007, National Natural Science Foundation of China under Grant 62471006 and Anhui Provincial Science and Technology Tackling Key Problems Project, Low-Altitude Intelligent Connected Safety Technology Research and Development and Industrialization K120336030.

Data Availability Statement

No new data were created in this manuscript.

Conflicts of Interest

Author Long Sun was employed by the company Anhui Sun Create Electronics Co., Ltd. The remaining authors declare that the research was conducted in the absence of any commercial or financial relationships that could be construed as a potential conflict of interest.

References

  1. Alzahrani, B.; Oubbati, O.S.; Barnawi, A.; Atiquzzaman, M.; Alghazzawi, D. UAV assistance paradigm: State-of-the-art in applications and challenges. J. Netw. Comput. Appl. 2020, 166, 102706. [Google Scholar] [CrossRef] [Scilit]
  2. Zhou, Y.; Rao, B.; Wang, W. UAV swarm intelligence: Recent advances and future trends. IEEE Access 2020, 8, 183856–183878. [Google Scholar] [CrossRef] [Scilit]
  3. Hu, C.; Wang, Y.; Wang, R.; Zhang, T.; Cai, J.; Liu, M. An improved radar detection and tracking method for small UAV under clutter environment. Sci. China Inf. Sci. 2019, 62, 29306. [Google Scholar] [CrossRef] [Scilit]
  4. Xie, Y.; Jiang, P.; Gu, Y.; Xiao, X. Dual-source detection and identification system based on UAV radio frequency signal. IEEE Trans. Instrum. Meas. 2021, 70, 2006215. [Google Scholar] [CrossRef] [Scilit]
  5. Fang, J.; Finn, A.; Wyber, R.; Brinkworth, R.S. Acoustic detection of unmanned aerial vehicles using biologically inspired vision processing. J. Acoust. Soc. Am. 2022, 151, 968–981. [Google Scholar] [CrossRef] [Scilit]
  6. Medaiyese, O.O.; Ezuma, M.; Lauf, A.P.; Guvenc, I. Wavelet transform analytics for RF-based UAV detection and identification system using machine learning. Pervasive Mob. Comput. 2022, 82, 101569. [Google Scholar] [CrossRef] [Scilit]
  7. Yan, X.; Fu, T.; Lin, H.; Xuan, F.; Huang, Y.; Cao, Y.; Hu, H.; Liu, P. UAV detection and tracking in urban environments using passive sensors: A survey. Appl. Sci. 2023, 13, 11320. [Google Scholar] [CrossRef] [Scilit]
  8. Chen, C.; Zheng, Z.; Xu, T.; Guo, S.; Feng, S.; Yao, W.; Lan, Y. Yolo-based UAV technology: A review of the research and its applications. Drones 2023, 7, 190. [Google Scholar] [CrossRef] [Scilit]
  9. Liu, W.; Anguelov, D.; Erhan, D.; Szegedy, C.; Reed, S.; Fu, C.-Y.; Berg, A.C. SSD: Single shot multibox detector. In Proceedings of the European Conference on Computer Vision, Amsterdam, The Netherlands, 11–14 October 2016; pp. 21–37. [Google Scholar]
  10. Lin, T.-Y.; Goyal, P.; Girshick, R.; He, K.; Dollár, P. Focal loss for dense object detection. In Proceedings of the IEEE International Conference on Computer Vision, Venice, Italy, 22–29 October 2017; pp. 2980–2988. [Google Scholar]
  11. Zhao, Y.; Lv, W.; Xu, S.; Wei, J.; Wang, G.; Dang, Q.; Liu, Y.; Chen, J. DETRs beat YOLOs on real-time object detection. In Proceedings of the IEEE/CVF Conference on Computer Vision and Pattern Recognition, Seattle, WA, USA, 17–21 June 2024; pp. 16965–16974. [Google Scholar]
  12. Chen, C.; Liu, M.-Y.; Tuzel, O.; Xiao, J. R-CNN for small object detection. In Proceedings of the Asian Conference on Computer Vision, Taipei, Taiwan, 20–24 November 2016; pp. 214–230. [Google Scholar]
  13. Ren, S.; He, K.; Girshick, R.; Sun, J. Faster R-CNN: Towards real-time object detection with region proposal networks. Adv. Neural Inf. Process. Syst. 2015, 28, 1137–1149. [Google Scholar] [CrossRef] [Scilit]
  14. He, K.; Gkioxari, G.; Dollár, P.; Girshick, R. Mask R-CNN. In Proceedings of the IEEE International Conference on Computer Vision, Venice, Italy, 22–29 October 2017; pp. 2961–2969. [Google Scholar]
  15. Zhu, X.; Su, W.; Lu, L.; Li, B.; Wang, X.; Dai, J. Deformable DETR: Deformable transformers for end-to-end object detection. arXiv 2020, arXiv:2010.04159. [Google Scholar]
  16. Zoph, B.; Le, Q.V. Neural architecture search with reinforcement learning. arXiv 2016, arXiv:1611.01578. [Google Scholar]
  17. Real, E.; Aggarwal, A.; Huang, Y.; Le, Q.V. Regularized evolution for image classifier architecture search. In Proceedings of the AAAI Conference on Artificial Intelligence, Honolulu, HI, USA, 27 January–1 February 2019; pp. 4780–4789. [Google Scholar]
  18. Liu, H.; Simonyan, K.; Yang, Y. Darts: Differentiable architecture search. arXiv 2018, arXiv:1806.09055. [Google Scholar]
  19. Chen, Y.; Yang, T.; Zhang, X.; Meng, G.; Xiao, X.; Sun, J. DetNAS: Backbone search for object detection. Adv. Neural Inf. Process. Syst. 2019, 32, 6642–6652. [Google Scholar]
  20. Stamoulis, D.; Ding, R.; Wang, D.; Lymberopoulos, D.; Priyantha, B.; Liu, J.; Marculescu, D. Single-path NAS: Designing hardware-efficient convnets in less than 4 hours. In Proceedings of the Joint European Conference on Machine Learning and Knowledge Discovery in Databases, Würzburg, Germany, 16–20 September 2019; pp. 481–497. [Google Scholar]
  21. Chen, M.; Peng, H.; Fu, J.; Ling, H. Autoformer: Searching transformers for visual recognition. In Proceedings of the IEEE/CVF International Conference on Computer Vision, Virtual, 11–17 October 2021; pp. 12270–12280. [Google Scholar]
  22. Ghiasi, G.; Lin, T.-Y.; Le, Q.V. NAS-FPN: Learning scalable feature pyramid architecture for object detection. In Proceedings of the IEEE/CVF Conference on Computer Vision and Pattern Recognition, Long Beach, CA, USA, 16–17 June 2019; pp. 7036–7045. [Google Scholar]
  23. Tan, M.; Pang, R.; Le, Q.V. Efficientdet: Scalable and efficient object detection. In Proceedings of the IEEE/CVF Conference on Computer Vision and Pattern Recognition, Virtual, 13–19 June 2020; pp. 10781–10790. [Google Scholar]
  24. Zheng, Y.; Chen, Z.; Lv, D.; Li, Z.; Lan, Z.; Zhao, S. Air-to-air visual detection of micro-UAVs: An experimental evaluation of deep learning. IEEE Robot. Autom. Lett. 2021, 6, 1020–1027. [Google Scholar] [CrossRef] [Scilit]
  25. Zhao, J.; Zhang, J.; Li, D.; Wang, D. Vision-based anti-UAV detection and tracking. IEEE Trans. Intell. Transp. Syst. 2022, 23, 25323–25334. [Google Scholar] [CrossRef] [Scilit]
  26. Wang, C.; Su, Y.; Wang, J.; Wang, T.; Gao, Q. UAVSwarm dataset: An unmanned aerial vehicle swarm dataset for multiple object tracking. Remote Sens. 2022, 14, 2601. [Google Scholar] [CrossRef] [Scilit]
  27. Hao, H.; Peng, Y.; Ye, Z.; Han, B.; Zhang, X.; Tang, W.; Kang, W.; Li, Q. A high performance air-to-air unmanned aerial vehicle target detection model. Drones 2025, 9, 154. [Google Scholar] [CrossRef] [Scilit]
  28. Zhou, X.; Yang, G.; Chen, Y.; Li, L.; Chen, B.M. VDTNet: A high-performance visual network for detecting and tracking of intruding drones. IEEE Trans. Intell. Transp. Syst. 2024, 25, 9828–9839. [Google Scholar] [CrossRef] [Scilit]
  29. Wang, H.; Wang, X.; Zhou, C.; Meng, W.; Shi, Z. Low in resolution, high in precision: UAV detection with super-resolution and motion information extraction. In Proceedings of the ICASSP 2023—2023 IEEE International Conference on Acoustics, Speech and Signal Processing (ICASSP), Rhodes Island, Greece, 4–10 June 2023; pp. 1–5. [Google Scholar]
  30. Luo, A.; Hu, K.; Jiang, K. Rethinking Dual-Stream Super-Resolution for Enhancing Remote Sensing Object Detection. In Proceedings of the ICASSP 2025—2025 IEEE International Conference on Acoustics, Speech and Signal Processing (ICASSP), Hyderabad, India, 6–11 April 2025; pp. 1–5. [Google Scholar]
  31. Du, Y.; Wu, T.; Dai, Z.; Xie, H.; Hu, C.; Wei, S. F-yolov7: Fast and robust real-time UAV detection. Computing 2025, 107, 50. [Google Scholar] [CrossRef] [Scilit]
  32. Wang, L.; Li, D.; Zhu, Y.; Tian, L.; Shan, Y. Dual super-resolution learning for semantic segmentation. In Proceedings of the IEEE/CVF Conference on Computer Vision and Pattern Recognition, Virtual, 13–19 June 2020; pp. 3774–3783. [Google Scholar]
  33. Huang, M.; Mi, W.; Wang, Y. EDGS-YOLOv8: An improved YOLOv8 lightweight UAV detection model. Drones 2024, 8, 337. [Google Scholar] [CrossRef] [Scilit]
  34. Ding, S.; Zhang, M.; Liu, D.; Liang, J. DCR-YOLO: An enhanced anti-UAV detection method based on triple collaborative optimization strategy. Aerosp. Sci. Technol. 2025, 168, 111319. [Google Scholar] [CrossRef] [Scilit]
  35. Wang, S.; Shuai, J.; Yang, Y.; Hu, X.; Yang, C.; Zhou, Y. DRF-YOLO Model for Small UAV Detection Through Multi-Scale Residual Enhancement and Progressive Feature Fusion. Appl. Syst. Innov. 2025, 8, 179. [Google Scholar] [CrossRef] [Scilit]
  36. Bo, C.; Wei, Y.; Wang, X.; Shi, Z.; Xiao, Y. Vision-based anti-UAV detection based on YOLOv7-GS in complex backgrounds. Drones 2024, 8, 331. [Google Scholar] [CrossRef] [Scilit]
  37. Gao, Y.; Xin, Y.; Yang, H.; Wang, Y. A lightweight anti-unmanned aerial vehicle detection method based on improved YOLOv11. Drones 2024, 9, 11. [Google Scholar] [CrossRef] [Scilit]
  38. Carion, N.; Massa, F.; Synnaeve, G.; Usunier, N.; Kirillov, A.; Zagoruyko, S. End-to-end object detection with transformers. In Proceedings of the European Conference on Computer Vision, Virtual, 23–28 August 2020; pp. 213–229. [Google Scholar]
  39. Cai, H.; Zhang, J.; Xu, J. ALDNet: A lightweight and efficient drone detection network. Meas. Sci. Technol. 2025, 36, 025402. [Google Scholar] [CrossRef] [Scilit]
  40. Li, W.; Xiao, L.; Li, H.; Yao, S.; Wan, B.; Ren, D. DACG-Net: A dual-backbone and context-guided fusion network for aerial UAV detection. IEEE Trans. Aerosp. Electron. Syst. 2025, 61, 17109–17123. [Google Scholar] [CrossRef] [Scilit]
  41. Peng, Y.; Li, H.; Wu, P.; Zhang, Y.; Sun, X.; Wu, F. D-FINE: Redefine regression task in DETRs as fine-grained distribution refinement. arXiv 2024, arXiv:2410.13842. [Google Scholar]
  42. Li, Y.; Fan, Q.; Huang, H.; Han, Z.; Gu, Q. A modified YOLOv8 detection network for UAV aerial image recognition. Drones 2023, 7, 304. [Google Scholar] [CrossRef] [Scilit]
  43. Kong, Y.; Shang, X.; Jia, S. Drone-DETR: Efficient small object detection for remote sensing image using enhanced RT-DETR model. Sensors 2024, 24, 5496. [Google Scholar] [CrossRef] [Scilit]
  44. Cao, X.; Wang, H.; Wang, X.; Hu, B. DFS-DETR: Detailed-feature-sensitive detector for small object detection in aerial images using transformer. Electronics 2024, 13, 3404. [Google Scholar] [CrossRef] [Scilit]
  45. Wang, S.; Jiang, H.; Li, Z.; Yang, J.; Ma, X.; Chen, J.; Tang, X. PHSI-RTDETR: A lightweight infrared small target detection algorithm based on UAV aerial photography. Drones 2024, 8, 240. [Google Scholar] [CrossRef] [Scilit]
  46. Zhou, Q.; Sheng, K.; Zheng, X.; Li, K.; Sun, X.; Tian, Y.; Chen, J.; Ji, R. Training-free transformer architecture search. In Proceedings of the IEEE/CVF Conference on Computer Vision and Pattern Recognition, New Orleans, LA, USA, 19–24 June 2022; pp. 10894–10903. [Google Scholar]
  47. Lee, J.; Ham, B. AZ-NAS: Assembling zero-cost proxies for network architecture search. In Proceedings of the IEEE/CVF Conference on Computer Vision and Pattern Recognition, Seattle, WA, USA, 17–21 June 2024; pp. 5893–5903. [Google Scholar]
  48. Wang, N.; Gao, Y.; Chen, H.; Wang, P.; Tian, Z.; Shen, C.; Zhang, Y. NAS-FCOS: Fast neural architecture search for object detection. In Proceedings of the IEEE/CVF Conference on Computer Vision and Pattern Recognition, Virtual, 14–19 June 2020; pp. 11943–11951. [Google Scholar]
  49. Yu, X.; Lin, Z.; Wang, Y. SAR-NAS: Lightweight SAR Object Detection with Neural Architecture Search. In Proceedings of the Chinese Conference on Pattern Recognition and Computer Vision (PRCV), Shanghai, China, 15–18 October 2025; pp. 232–244. [Google Scholar]
  50. Gupta, C.; Gill, N.S.; Gulia, P.; Kumar, A.; Karamti, H.; Moges, D.M. An optimized YOLO NAS based framework for realtime object detection. Sci. Rep. 2025, 15, 32903. [Google Scholar] [CrossRef] [Scilit]
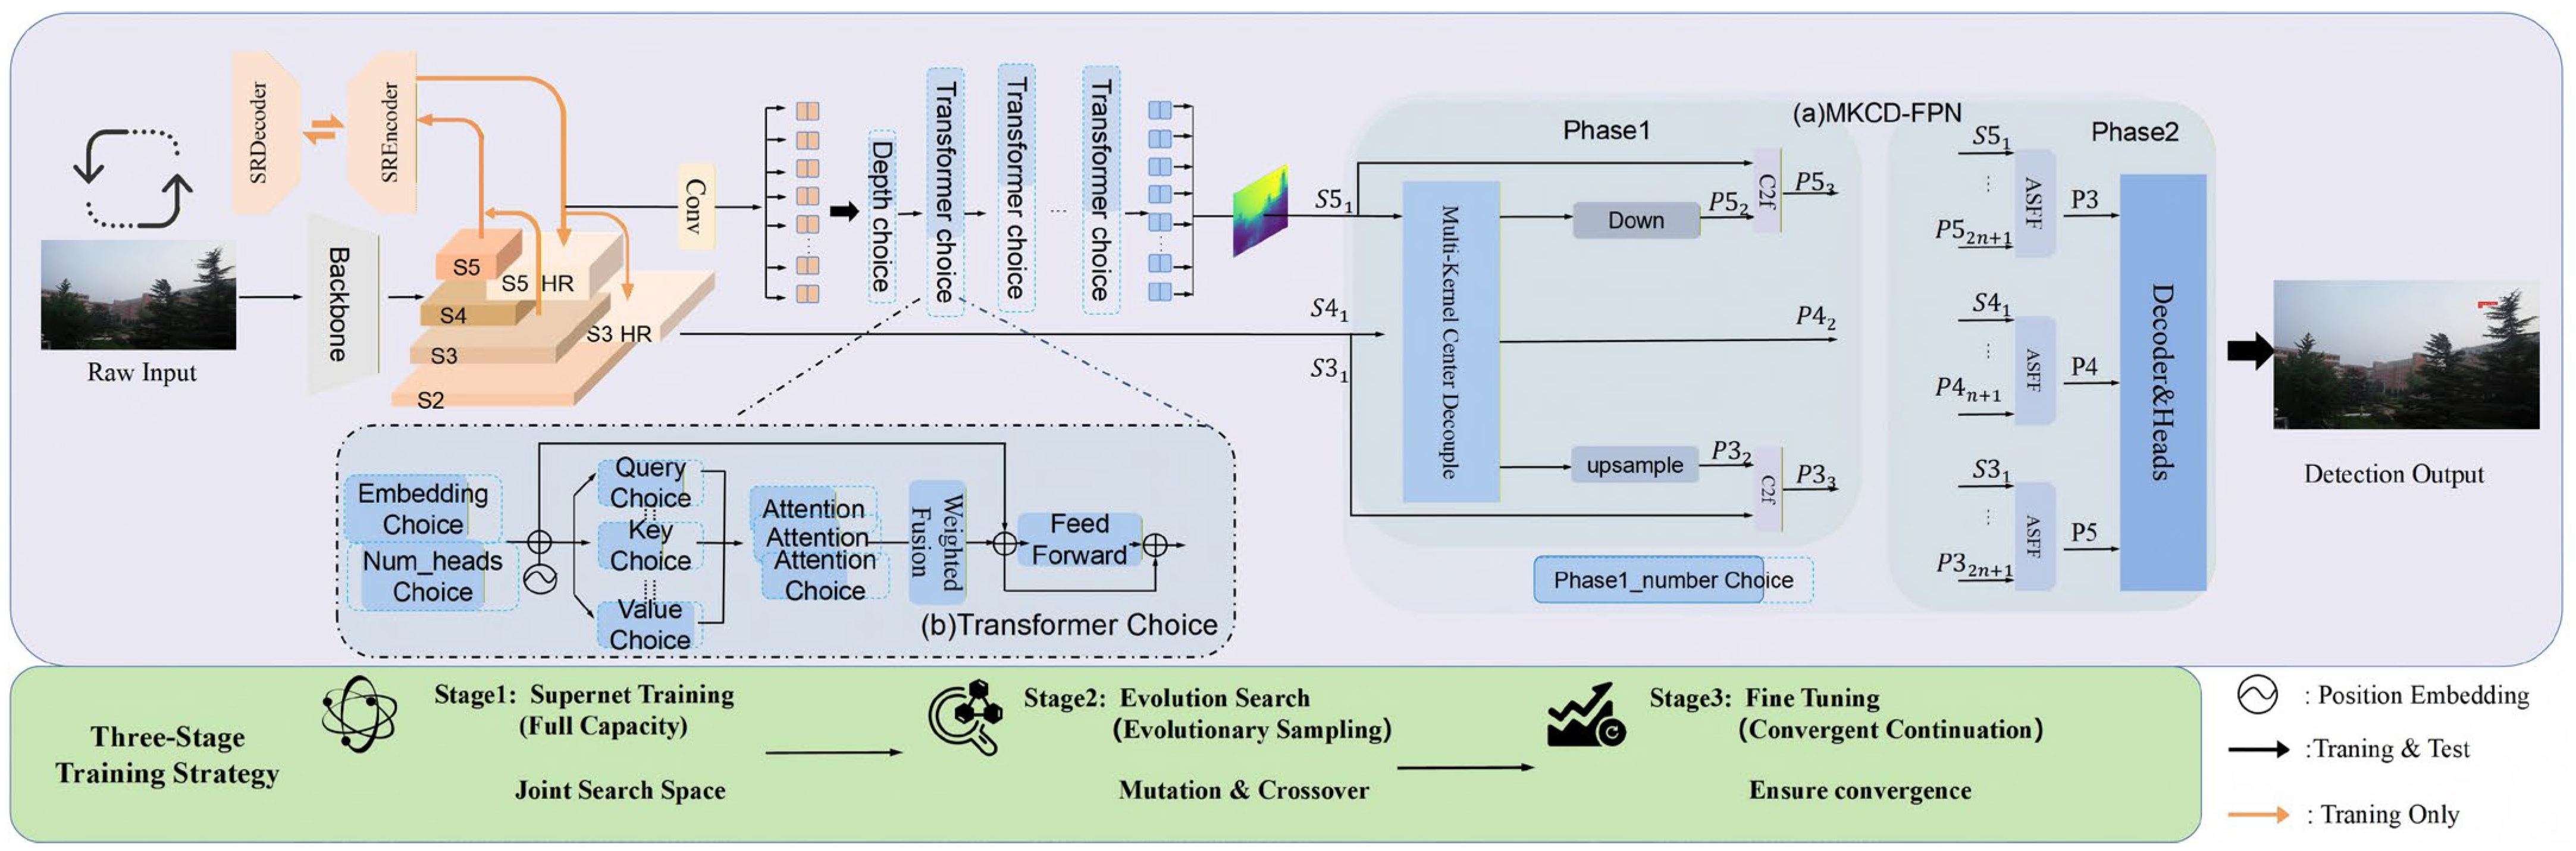
Figure 1. Overall Process of AutoUAVFormer. (a) The structutal diagram of MKCD-FPN; (b) The structural diagram of the searchable Transformer module.
Remotesensing 18 01268 g001
Figure 2. Process comparison of traditional NAS application mode (left) and our proposed NAS method AutoUAVFormer (right).
Remotesensing 18 01268 g002
Figure 3. Architecture Diagram of the Multikernel Center-Decoupled FPN.
Remotesensing 18 01268 g003
Figure 4. Search Strategy Diagram of Evolutionary Search.
Remotesensing 18 01268 g004
Figure 5. Principle Diagram of Super Resolution Branch.
Remotesensing 18 01268 g005
Figure 6. Sample Diagrams of the Three Utilized Datasets. (a) DetFly. (b) DUT Anti-UAV. (c) UAV Swarm.
Remotesensing 18 01268 g006
Figure 7. Comparison Among the Visualization Results Produced for the DetFly Dataset.
Remotesensing 18 01268 g007
Figure 8. Comparison Among the Visualization Results Produced for DUT Anti-UAV.
Remotesensing 18 01268 g008
Figure 9. Comparison Among the Visualization Results Produced for UAV Swarm.
Remotesensing 18 01268 g009
Figure 10. Comparison Among the Heatmap Visualization Results.
Remotesensing 18 01268 g010
Table 1. Complete Configuration of the Search Space.
Search Space Configuration
mlp_rationum_headsdepthembed_dimphase1_number
[1, 2, 3, 4, 5][1, 2, 4, 8, 16, 32][1, 2, 3, 4, 5, 6][256, 288, 320, 352, 384, 416][1, 2]
Table 2. Ablation experiments on the overall architecture evaluated on the DUT Anti-UAV dataset.
Model (ID)NASMKCD FPNSRSearch ResultsmAP@0.5mAP@0.5:0.95RPParamsGFLOPSFPS
0 -93.163.092.893.719.859.8241
1 {8;3.0,4.0,4.0,1.0,1.0,1.0,2.0,4.0;
16,32,8,16,16,8,16,4;288;1}
94.164.892.195.320.4235.9221
2 {8;3.0,4.0,4.0,1.0,1.0,1.0,2.0,4.0;
16,32,8,16,16,8,16,4;288;1}
94.265.693.396.521.8736.8188
3{5;5.0,4.0,4.0,3.0,5.0;
8,8,8,4,4;256;1}
95.567.090.498.420.8036.6193
Table 3. Ablation experiments on kernel size selection for MKCD-FPN evaluated on the DUT Anti-UAV dataset.
Model (ID)KernelSearch ResultsmAP@0.5mAP@0.5:0.95RPParamsGFLOPSFPS
13 × 3 [3;4.0,3.0,1.0;4,8,4;256;2]92.663.092.294.822.0738.3177
23 × 35 × 5 [8;5.0,3.0,2.0,4.0,5.0,1.0,5.0,5.0;
16,8,4,4,8,4,8,4;256;1]
94.065.693.196.821.4037.2181
33 × 35 × 57 × 7 [5;5.0,4.0,4.0,3.0,5.0;
8,8,8,4,4;256;1]
95.567.090.498.420.8036.6193
43 × 35 × 57 × 79 × 9[5;5.0,4.0,4.0,3.0,5.0;
8,8,8,4,4;256;1]
93.864.693.095.721.1036.8188
Table 4. Ablation experiments on feature aggregation layer selection for MKCD-FPN evaluated on the DUT Anti-UAV dataset.
Model (ID)Aggregation LayerSearch ResultsmAP@0.5mAP@0.5:0.95RPParamsGFLOPSFPS
1P3[6;1.0,3.0,2.0,4.0,1.0,1.0;
8,8,4,1,2,16;256;1]
95.266.792.297.519.9836.1214
2P4[5;5.0,4.0,4.0,3.0,5.0;
8,8,8,4,4;256;1]
95.567.090.498.420.8036.6193
3P5[8;4.0,4.0,3.0,2.0,1.0,1.0,1.0,1.0;
4,8,8,4,4,4,16,1;256;1]
94.365.493.696.120.9736.6210
Table 5. Ablation experiments on the task loss ratio of AutoUAVFormer evaluated on the DUT Anti-UAV dataset.
Model (ID)Loss Ratio
(Detection:SR)
Search ResultsmAP@0.5mAP@0.5:0.95RPParamsGFLOPSFPS
11:1[8;5.0,5.0,3.0,3.0,2.0,1.0,2.0,5.0;
16,4,4,4,4,8,32,32;288;1]
94.163.192.494.622.0637.7184
210:1[5;4.0,4.0,2.0,2.0,4.0;
4,4,4,8,16;288;1]
94.365.693.596.821.2637.1196
35:1[8;3.0,4.0,4.0,1.0,4.0,2.0,1.0,4.0;8,8,4,16,4,2,4,4;288;1]94.165.192.896.022.0437.5188
47.5:1[5;5.0,4.0,4.0,3.0,5.0;
8,8,8,4,4;256;1]
95.567.090.498.420.8036.6193
Table 6. Ablation Experiments Concerning the super-resolution Branch evaluated on three public datasets.
DatasetModelSearch ResultsmAP@0.5mAP@0.5:0.95RPParamsGFLOPSFPS
DetFlyAutoUAVFormer without SR[4;4.0,1.0,3.0,5.0;8,8,4,8;320;1]97.767.297.598.520.0536.1212
AutoUAVFormer[8;3.0,5.0,3.0,3.0,1.0,1.0,5.0,5.0;
16,4,4,4,4,2,8,4;320;1]
98.668.197.299.121.1736.6196
DUT Anti-UAVAutoUAVFormer without SR[8;1.0,4.0,4.0,4.0,5.0,5.0,2.0,4.0;
8,8,8,8,2,8,8,32;256;1]
94.265.693.394.520.8736.8188
AutoUAVFormer[5;5.0,4.0,4.0,3.0,5.0;
8,8,8,4,4;256;1]
95.567.090.498.420.8036.6193
UAV SwarmAutoUAVFormer without SR[2;5.0,1.0;4,1;352;2]87.743.987.289.621.0036.7180
AutoUAVFormer[6;2.0,2.0,2.0,1.0,1.0,2.0;
16,4,4,16,2,4;256;1]
89.945.486.491.819.4336.2204
Table 7. Comparison Between AutoUAVFormer and Mainstream Baseline Models on Three Public Datasets (Bold Values Indicate Optimal Results).
DatasetModelBackbonemAP@0.5mAP@0.5:0.95RPParamsGFLOPSFPS
DetFlyYOLOv3Darknet5387.858.974.688.461.5154.7100
YOLOv5CSPNet94.263.676.791.725.064.0249
YOLOv7EfficientRep94.163.476.392.137.0104.8142
YOLOv8CSPNet96.265.777.993.225.878.7228
YOLOv9CSPNet96.466.278.593.520.076.5198
YOLOv10CSPNet95.462.979.192.316.563.4262
YOLOv11CSPNet96.865.579.995.420.168.2221
RT-DETRHGNetv295.364.083.794.834.3108.3174
RT-DETRResNet3495.563.881.194.331.491.8165
RT-DETRResNet5096.865.985.295.643.0134.8116
D-FINEHGNetv297.166.196.196.619.859.8236
AutoUAVFormerHGNetv298.668.197.299.121.236.6196
DUT Anti-UAVYOLOv3Darknet5378.947.670.380.861.5154.7113
YOLOv5CSPNet84.352.773.691.325.064.0252
YOLOv7EfficientRep87.156.879.689.237.0104.8148
YOLOv8CSPNet86.455.376.793.525.878.7232
YOLOv9CSPNet87.256.879.493.720.076.5207
YOLOv10CSPNet88.657.781.993.416.563.4265
YOLOv11CSPNet88.357.581.293.520.168.2218
RT-DETRHGNetv290.560.982.294.534.3108.3180
RT-DETRResNet3488.757.681.793.531.491.8166
RT-DETRResNet5092.562.584.596.143.0134.8112
D-FINEHGNetv293.163.092.893.719.859.8241
AutoUAVFormerHGNetv295.567.090.498.420.836.6193
UAV SwarmYOLOv3Darknet5374.030.667.376.561.5154.799
YOLOv5CSPNet76.230.468.177.925.064.0244
YOLOv7EfficientRep80.634.474.682.137.0104.8133
YOLOv8CSPNet81.836.377.387.725.878.7220
YOLOv9CSPNet82.637.478.487.220.076.5196
YOLOv10CSPNet82.137.877.988.616.563.4252
YOLOv11CSPNet83.438.579.789.120.168.2213
RT-DETRHGNetv286.939.979.890.334.3108.3172
RT-DETRResNet3483.739.179.188.231.491.8150
RT-DETRResNet5087.641.779.589.443.0134.892
D-FINEHGNetv288.543.386.391.019.859.8230
AutoUAVFormerHGNetv289.945.486.491.819.436.2204
Disclaimer/Publisher’s Note: The statements, opinions and data contained in all publications are solely those of the individual author(s) and contributor(s) and not of MDPI and/or the editor(s). MDPI and/or the editor(s) disclaim responsibility for any injury to people or property resulting from any ideas, methods, instructions or products referred to in the content.