Article

SemGeoFrame: A Visual Matching Framework for Aircraft Based on Surface Semantic Information

1
Rocket Force University of Engineering, Xi’an 710025, China
2
Beijing Satellite Navigation Center, Beijing 100094, China
3
School of Mathematics and Statistics, Xi’an Jiaotong University, Xi’an 710049, China
*
Author to whom correspondence should be addressed.
Remote Sens. 2026, 18(9), 1267; https://doi.org/10.3390/rs18091267
Submission received: 21 March 2026 / Revised: 19 April 2026 / Accepted: 20 April 2026 / Published: 22 April 2026

Highlights

What are the main findings?
  • We propose SemGeoFrame, a visual matching framework based on surface semantic information. Unlike conventional geometric-only methods, it effectively improves robustness by integrating semantic consistency filtering and semantic-guided spatial sampling.
  • The framework ensures the balanced distribution and reliability of matching points in space and semantics through semantic consistency filtering, confidence-guided partition sampling, and multiple constraint optimization.
What are the implications of the main findings?
  • SemGeoFrame adopts a plug-and-play design, which can adapt to and continuously improve the performance of mainstream matching algorithms, such as ORB, Superpoint, LoFTR, etc., providing a practical solution for UAV autonomous positioning in complex environments.
  • It provides a universal paradigm for utilizing semantic information in geometric vision tasks and promotes research on cross-perspective visual localization to break through the limitations of low-level feature matching.

Abstract

In GNSS-denied environments, UAV visual positioning faces the critical bottleneck of low matching accuracy between heterogeneous images. To address this, we propose SemGeoFrame, a visual matching framework that leverages surface semantic information to enhance robustness. The key innovations are threefold: First, we construct a semantic prior from the probability distributions of image semantic segmentation and design a consistency screening mechanism based on Jensen–Shannon divergence to eliminate false matches by leveraging pixel-level semantic consistency for cross-view image matching. Second, a confidence-guided partition sampling strategy ensures balanced distribution of matches in both spatial and semantic categories, overcoming the limitations of conventional spatial-only sampling. Third, geometric, semantic, and confidence constraints are jointly optimized to achieve robust homography estimation. SemGeoFrame adopts a plug-and-play design and consistently improves the performance of mainstream matching algorithms (e.g., ORB, SuperPoint, LoFTR) on multiple heterogeneous datasets. The experimental results demonstrate that our framework significantly enhances matching accuracy and robustness across diverse scenarios.

1. Introduction

In recent years, UAVs have been widely used in precision agriculture, urban surveying and mapping, disaster emergency, national defense and security, and other fields with their advantages of high flexibility, low cost, and simple operation [1,2,3]. The traditional UAV navigation and positioning system relies heavily on the global navigation satellite system (GNSS). However, in the complex environment where the GNSS signal is blocked, interfered with, or deceived, such as urban canyons, indoors, dense forests, or electromagnetic countermeasure scenes, its positioning reliability will decline sharply, or even completely fail, which greatly limits the application of UAVs in key tasks. At the same time, with the rapid development of computer vision technology and the continuous reduction in sensor costs, visual navigation technology that does not rely on external signals has become a hot spot and an important breakthrough in the field of navigation research [4].
UAV visual positioning technology mainly covers two directions: visual odometry [5] and image-based positioning methods [6]. Although the visual odometry method can provide high-frequency local motion estimation through an image sequence, it will lead to error accumulation due to its dependence on incremental calculation, which makes it difficult to avoid the positioning drift with the increase in distance, and it cannot independently support long-term accurate positioning [7].
In order to solve the cumulative error problem of VO, the image-based localization method provides an effective solution. Lindeberg et al. [8] proposed a scale-invariant feature transformation method (SIFT), which generates a descriptor with scale and rotation invariance at each key point, so that it can match features in different images. E. Rublee et al. [9] proposed a fast directional brief feature descriptor algorithm (ORB), which combines a fast corner detector and a brief descriptor, and it is suitable for real-time image matching. Hisham et al. proposed a template matching algorithm [10] by sliding a small template image in the large image and calculating the matching degree to find a similar region in the image. In recent years, deep learning technology has provided a new solution for cross-view image matching. S. Hu et al. [11] proposed the CVM-Net method, which uses the weighted soft interval triple loss for training, reducing the feature differences between different perspectives. Wang et al. [12] proposed the local pattern network (LPN) method to enhance the scalability of rotation changes. Di et al. [13] proposed a visual positioning system (AS-VPS) based on aerial satellite remote sensing image matching to obtain better matching performance without GNSS. R. Wu et al. [14] proposed a geometric transformation method that uses large vocabulary datasets for UAV positioning. Combined with the geometric transformation coding module, it integrates multi-view transformation features to generate a transformation-invariant global descriptor. Fushan Yao et al. [15] proposed a visual odometry measurement method combining terrain weighted constraint optimization and image matching, which realized the night positioning ability of the system.
At the same time, the application of semantic information in visual localization has also been widely studied. Liang et al. [16] combined semantic information and structural constraints to reduce the matching error of heterogeneous images through Dirichlet distribution modeling. Pengyu et al. [17] proposed a semantic-driven navigation method to align UAV images with satellite images and optimize the navigation path. Ren et al. [18] proposed a template matching network 2chadcnn based on deep learning, which uses semantic information to process image differences caused by seasonal changes, so as to improve the accuracy of matching. Zhang et al. [19] proposed a hierarchical cross-source image matching method that integrates semantic and structural constraints, achieving absolute visual localization of unmanned aerial vehicles through a combination of coarse and fine matching. He et al. [20] proposed a drone localization method based on semantic topological feature matching, which utilizes the relative topological position relationship between semantic visual references for matching and localization.
However, there are still challenges in reality. The differences between UAV images and satellite remote sensing images in illumination, scale, seasonal change, shooting angle, and so on have brought great difficulties to achieving high-precision matching. Existing feature-based matching methods rely solely on geometric consistency, which often fails under weak texture, repetitive patterns, or large viewpoint changes. To overcome these limitations, we propose a visual matching framework that introduces high-level semantic priors into the matching pipeline. Specifically, SemGeoFrame leverages semantic consistency filtering and semantic-guided spatial sampling to significantly improve the matching accuracy of cross-view heterogeneous remote sensing images. Unlike conventional approaches, our framework integrates semantic information throughout the entire process—from consistency screening to spatial distribution optimization—providing a principled way to enhance robustness.
The main contributions of this paper are as follows:
(1) A visual matching framework, SemGeoFrame, based on surface semantic information, is proposed and applied to UAV visual navigation and positioning.
(2) A confidence evaluation mechanism of matching points based on semantic consistency is designed, which uses the semantic distribution consistency of UAV images and satellite images in the same geographical location to effectively filter out the false matching points in the initial matching.
(3) A two-stage sampling strategy combining semantic confidence and spatial distribution constraints is proposed. Firstly, the initial region sampling is carried out according to semantic confidence, and then the farthest point sampling (FPS) is used to optimize the spatial uniformity of matching points so as to further improve the matching accuracy and robustness.

2. Materials and Methods

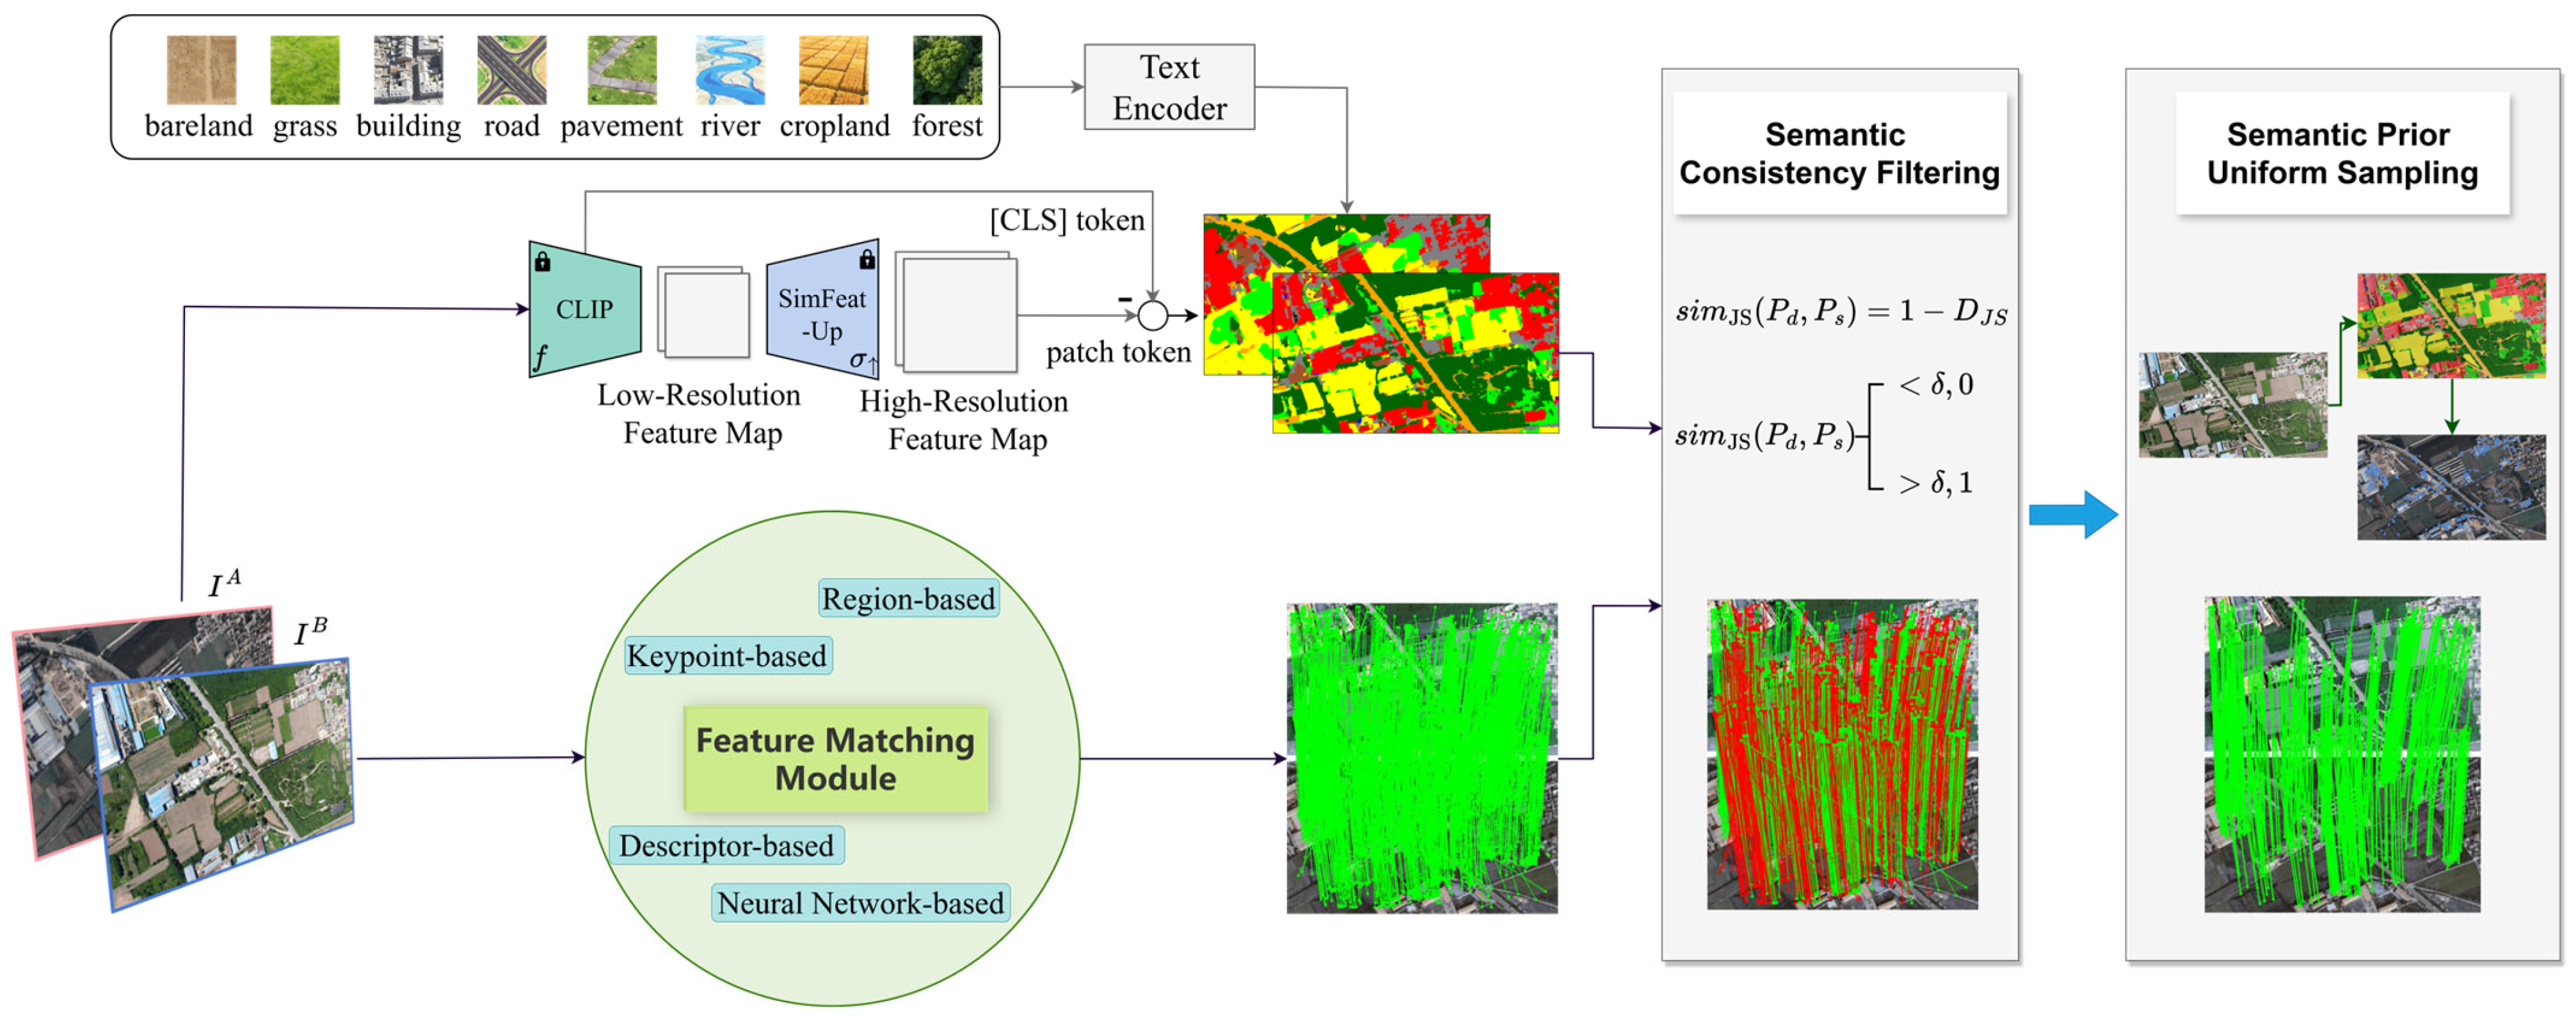
In this paper, we propose a heterogeneous remote sensing image matching framework named SemGeoFrame. The specific implementation is as follows: First, the SegEarth-OV [21] model is employed to perform semantic segmentation on both UAVs and satellite images, generating pixel-level semantic soft labels. Then, an interchangeable feature matching module (e.g., LoFTR or SuperGlue) is used to obtain initial point correspondences. The Jensen–Shannon divergence is adopted to quantify the semantic consistency of each candidate match, thereby selecting high-confidence matches. Furthermore, by incorporating a semantic confidence prior, we design an FPS strategy based on semantic confidence to ensure uniform distribution of matches in both spatial and semantic dimensions. Finally, a multi-objective optimization function integrating geometric, semantic, and confidence constraints is constructed to achieve robust homography estimation, significantly improving the accuracy and stability of cross-view image matching for UAV localization. The overall framework is illustrated in Figure 1.
As shown in Figure 1, I A and I B denote the UAV image and satellite image, respectively. CLIP is short for Contrastive Language–Image Pre-training. S i m J S ( P i , P j ) represents the Jensen–Shannon (JS) divergence similarity between the matched point pair P i and P j . δ is the threshold for semantic consistency filtering, and CLS token refers to the classification token.

2.1. Semantic Segmentation

In order to improve the accuracy of heterogeneous image matching, this paper proposes a framework of semantic information fusion. Its goal is to introduce and apply the semantic segmentation results of UAV and satellite remote sensing images. Among them, the semantic extraction task is completed by the zero-shot segmentation model based on SegEarth-OV to achieve high accuracy requirements. This model requires no task-specific fine-tuning and has achieved state-of-the-art performance on 17 public remote sensing benchmarks, providing high-quality semantic priors for our task. The SegEarth-OV model extracts rough semantic features through the CLIP encoder and uses SimFeat-Up to conduct feature upsampling to enhance spatial details so as to significantly improve the accuracy of the segmentation boundary while ensuring semantic understanding and finally strengthen the zero-sample migration ability of the model. The model is pre-trained on the Million-Aid dataset and has excellent zero-sample migration ability. In the experiment, we keep the original training configuration and only adjust the image size adaptively according to the input data scale.
In the process of semantic segmentation of the UAV image and the satellite remote sensing image using the SegEarth-OV algorithm, first, input the image to be segmented I , sample CLIP visual features on SimFeat-Up, and reduce the global deviation to obtain the adjusted high-resolution feature F ^ a d j . At the same time, enter the division category name, format it, and get the text embedding vector T k through the clip text encoder, where k represents the category index. Next, calculate the cosine similarity between the pixel feature f ^ i j (the vector of F ^ a d j at position i , j ) and the text embedded T k :
s i j k = f ^ i j T k f ^ i j T k
Normalize the similarity of all categories of each pixel position to obtain the probability distribution vector of the pixel belonging to each category:
P i j = Softmax ( [ s i j 1 , s i j 2 , , s i j k ] )
where P i j = P i j 1 , P i j 2 , , P i j K is a k dimensional probability vector that satisfies k = 1 K P i j k = 1 .

2.2. Heterogeneous Image Matching

To verify the replaceability of the feature matching module, we selected five representative algorithms for application verification: ORB [9] based on traditional hand-crafted features, SuperPoint+SuperGlue based on deep learning feature point detection and the description method [22,23], ASLFeat based on deformable convolution to enhance geometric adaptability [24], LoFTR based on the attention mechanism [25], and its accelerated version Efficient LoFTR [26], as shown in Table 1.
In our framework, the feature matching module uses the LoFTR algorithm by default. The algorithm is stable when dealing with a large angle of view and texture differences, so it is widely used as the baseline for cross-view image matching tasks. The framework supports replacing the matching module with other algorithms in Table 1 to meet different application requirements.

2.3. Semantic Consistency Filtering Module

For UAV and satellite remote sensing image matching, to evaluate semantic consistency, this paper designs an information theory-based measurement process with the Jensen–Shannon divergence as the core metric. This divergence is symmetric and bounded between 0 and 1, allowing it to quantitatively measure the similarity between two probability distributions, which makes it suitable for comparing the soft labels output by semantic segmentation models.
After matching UAVs and satellite images, we obtain a set of candidate matching point pairs ( p d i , p s i ) i = 1 N , where N represents the number of initial matching point pairs, p d i represents the i feature point on the UAV image, and p s i represents the i feature point on the satellite remote sensing image.
For each candidate matching point pair ( p d i , p s i ) , we extract its probability distribution output in the semantic segmentation model. Specifically, the semantic probability distribution of the UAV image feature point p d i is expressed as:
P d i = [ P d ( c 1 p d i ) , P d ( c 2 p d i ) , , P d ( c K | p d i ) ]
where K is the total number of semantic categories, and P d ( c k | p d i ) is the probability that the point p d i belongs to category c k . Similarly, the semantic probability distribution of p s i in satellite remote sensing image feature points is expressed as:
P s i = [ P s ( c 1 p s i ) , P s ( c 2 p s i ) , , P s ( c K | p s i ) ]
In order to quantify the semantic consistency between the two points, we use JS divergence to calculate their semantic similarity. The steps are as follows. Firstly, the average distribution M of the semantic probability distribution of corresponding matching points in cross-source images is constructed:
M = 1 2 ( P d + P s )
Then, calculate the KL divergence of the probability distribution P d of UAV image points and the probability distribution P s of satellite remote sensing image points relative to the average distribution M , which measures the difference between a probability distribution and the reference distribution:
D K L ( P d M ) = c = 1 K P d ( c ) log P d ( c ) M ( c )
D K L ( P s M ) = c = 1 K P s ( c ) log P s ( c ) M ( c )
Then, JS divergence is calculated based on the above two KL divergences:
D J S ( P d P s ) = 1 2 D K L ( P d M ) + 1 2 D K L ( P s M )
Finally, JS divergence is transformed into semantic similarity:
s i m JS ( P d , P s ) = 1 D J S ( P d P s )
Among them, the semantic similarity is s i m JS ( P d , P s ) 0 , 1 . When the semantic distribution of two feature points is exactly the same, the similarity is 1; when the two distributions are completely different, the similarity is 0. By setting an appropriate similarity threshold δ , if the semantic similarity of the matching point pair is lower than the threshold, it will be eliminated. This step can screen out matching point pairs with high semantic consistency and provide high-quality candidate matching sets for subsequent geometric verification.

2.4. Spatial Uniform Sampling Module Based on Semantic Prior

When using UAV images and satellite remote sensing images for matching positioning, the spatial distribution uniformity of matching points has an important impact on the positioning accuracy. The matching points with uniform distribution can provide more comprehensive spatial constraints for geometric estimation, so as to improve the accuracy and robustness of the solution; on the contrary, if the matching points are excessively clustered, it will lead to estimation bias.
Thus, we further propose a differentiated sampling strategy based on semantic prior. After obtaining initial matching points through heterogeneous image matching and semantic consistency screening, we adopt a semantic partition-based FPS method: high-confidence points are prioritized based on the confidence scores of each semantic region, while FPS is used to improve spatial uniformity. Between matching accuracy and matching quantity, the former has a more critical impact on estimation accuracy. Therefore, FPS improves the overall quality of the matching set while reducing the number of matching points.
Specifically, this method dynamically assigns different numbers of sampling points to different semantic regions based on their confidence and geometric importance. For example, areas with relatively stable and significant geometric structures, such as buildings, will be given higher sampling weights, so that matching points with high confidence and a high amount of information will be retained first. This strategy not only helps to optimize the spatial distribution of matching points but also improves the overall quality of the matching set.
Let the semantic category set be C = { c 1 , c 2 , , c M } , the total point set be P = { p 1 , p 2 , , p N } , and the semantic label function L ( p ) represent the semantic category of point p .
The point set divided by semantic category is defined as P c = p P L ( p ) = c , c C , and the FPS algorithm is applied independently to each semantic category for sampling: for each category c C , S c = F P S ( P c , K c ) is obtained by sampling, where K c represents the target sampling points of semantic category c .
In order to reasonably determine the size of K c , it is necessary to fully consider the matching reliability differences of different semantic categories. Therefore, we introduce the confidence score r ( c ) for different semantic categories of c as its reliability basis.
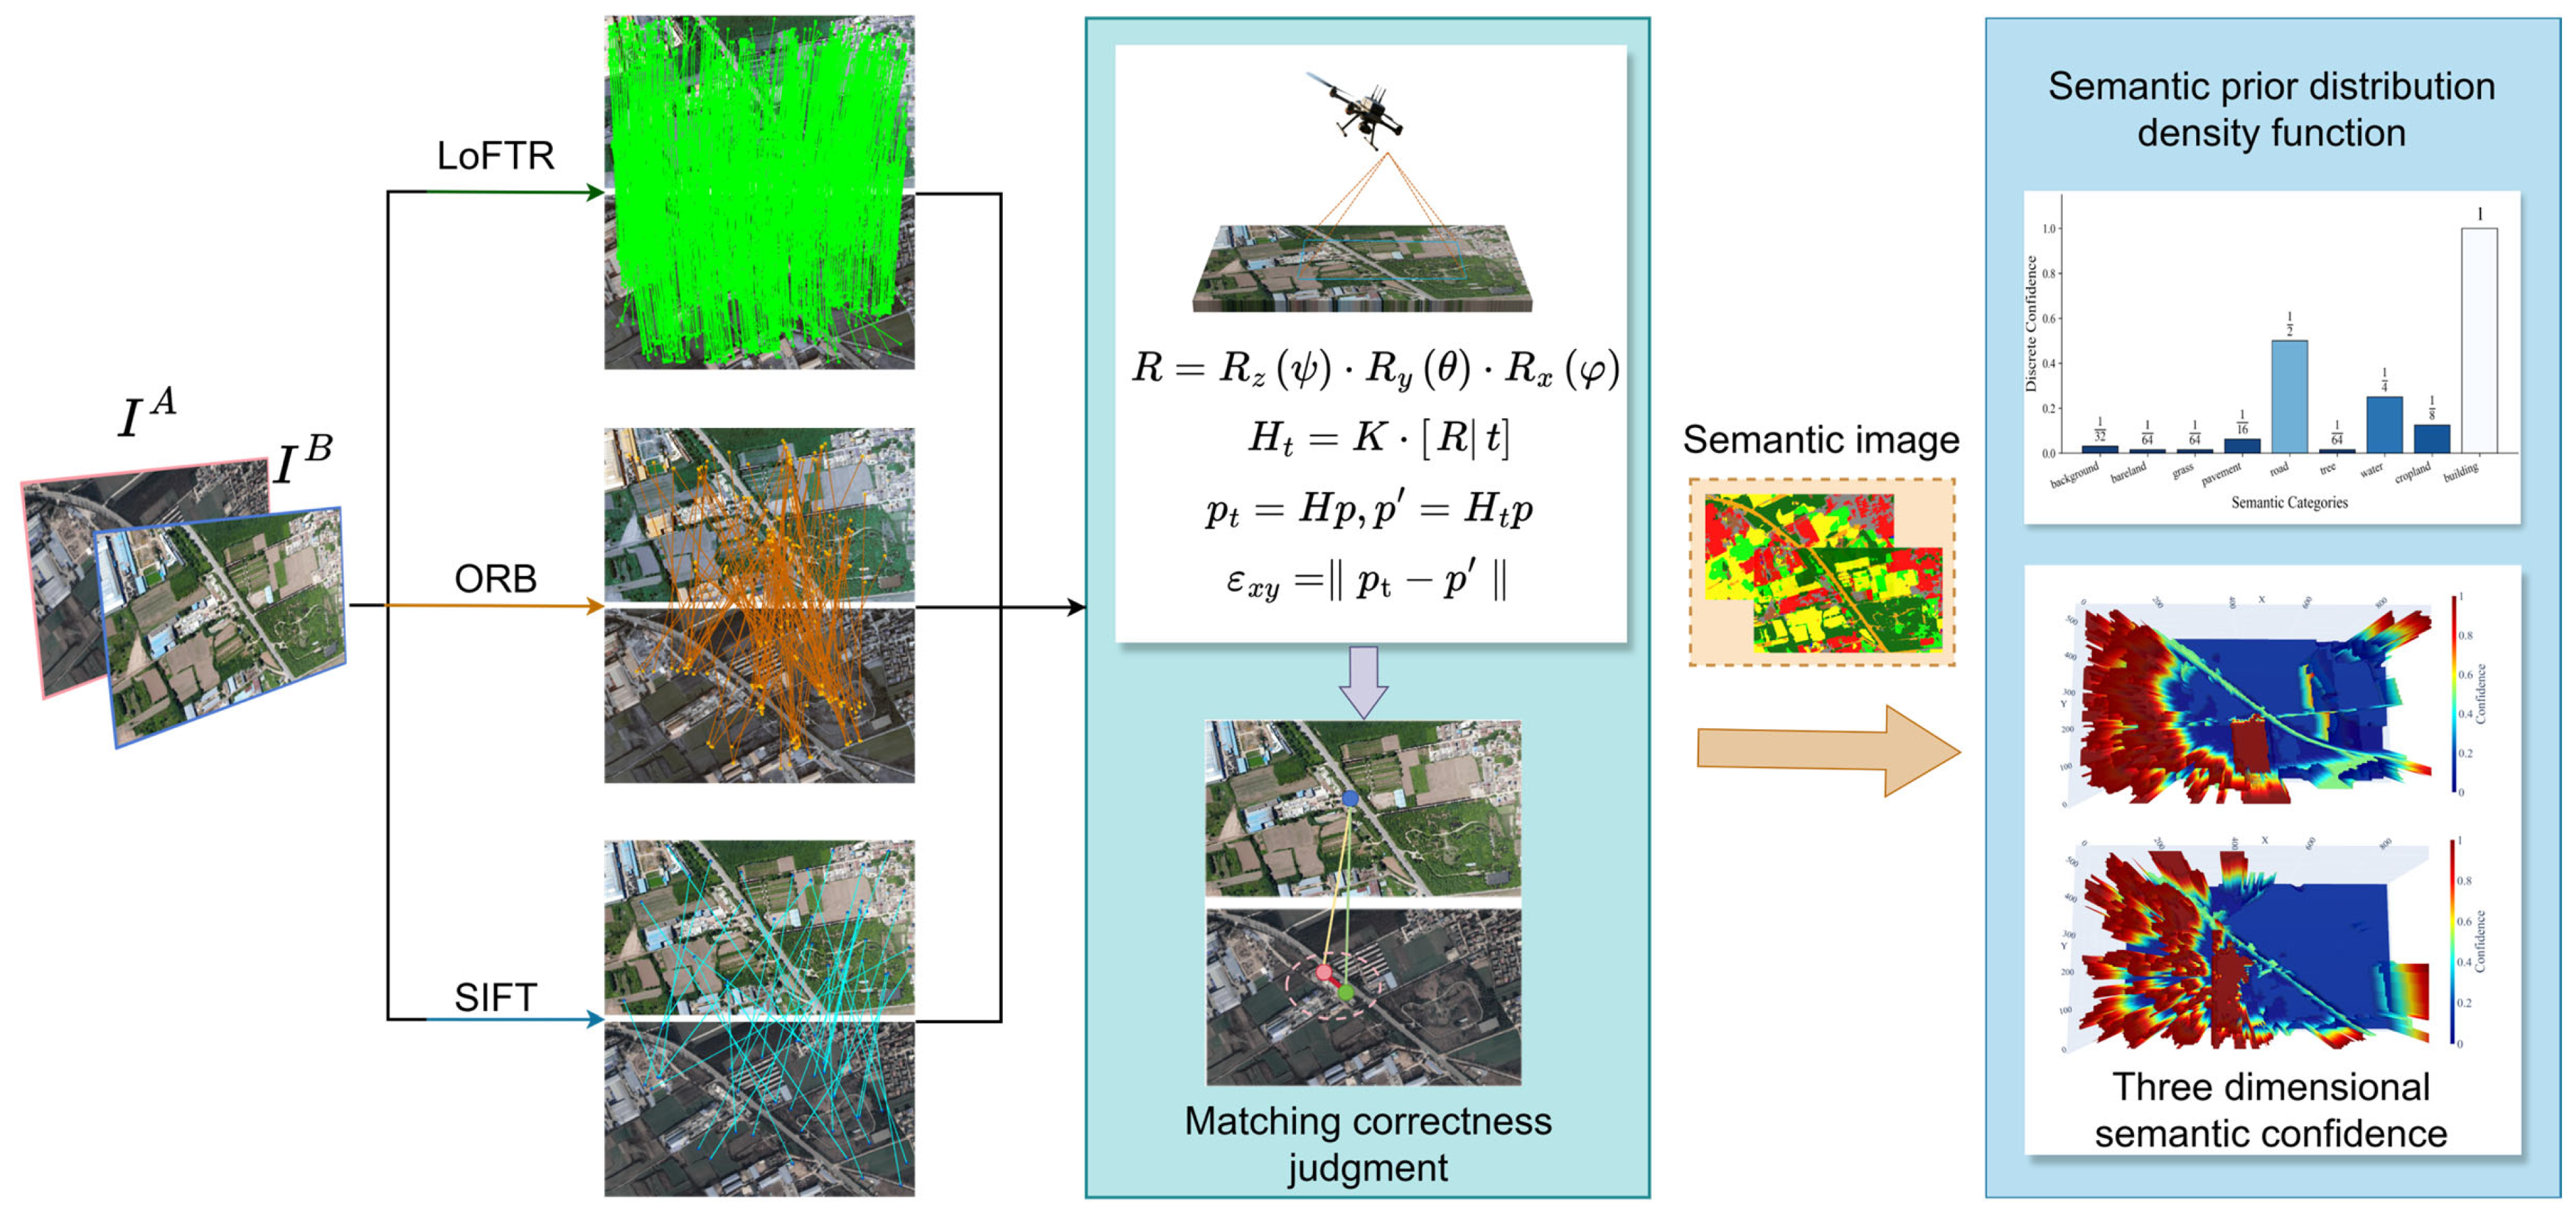
To determine confidence scores experimentally, we constructed a robust pairing dataset based on multi-temporal satellite remote sensing images to systematically evaluate the matching reliability of different semantic features. The specific process is shown in Figure 2. Firstly, ORB, SIFT, LoFTR, and other feature matching methods are used to extract the initial matching point pairs and retain all the results not eliminated by the RANSAC algorithm, including false matching, to fully cover all kinds of matching behavior. Then, using the pose information recorded by the high-precision RTK system carried by the UAV, the homography matrix is calculated as the geometric truth value, which is used to determine the correctness of the matching point pair. When the reprojection error of the matching point is less than 3.0 pixels, it is regarded as a correct match. Then, according to the semantic segmentation results, the proportion of correct matching points in different semantic categories is counted, and the original confidence of each category is obtained. Finally, the original confidence of all categories is normalized to obtain the statistical confidence of each semantic category.
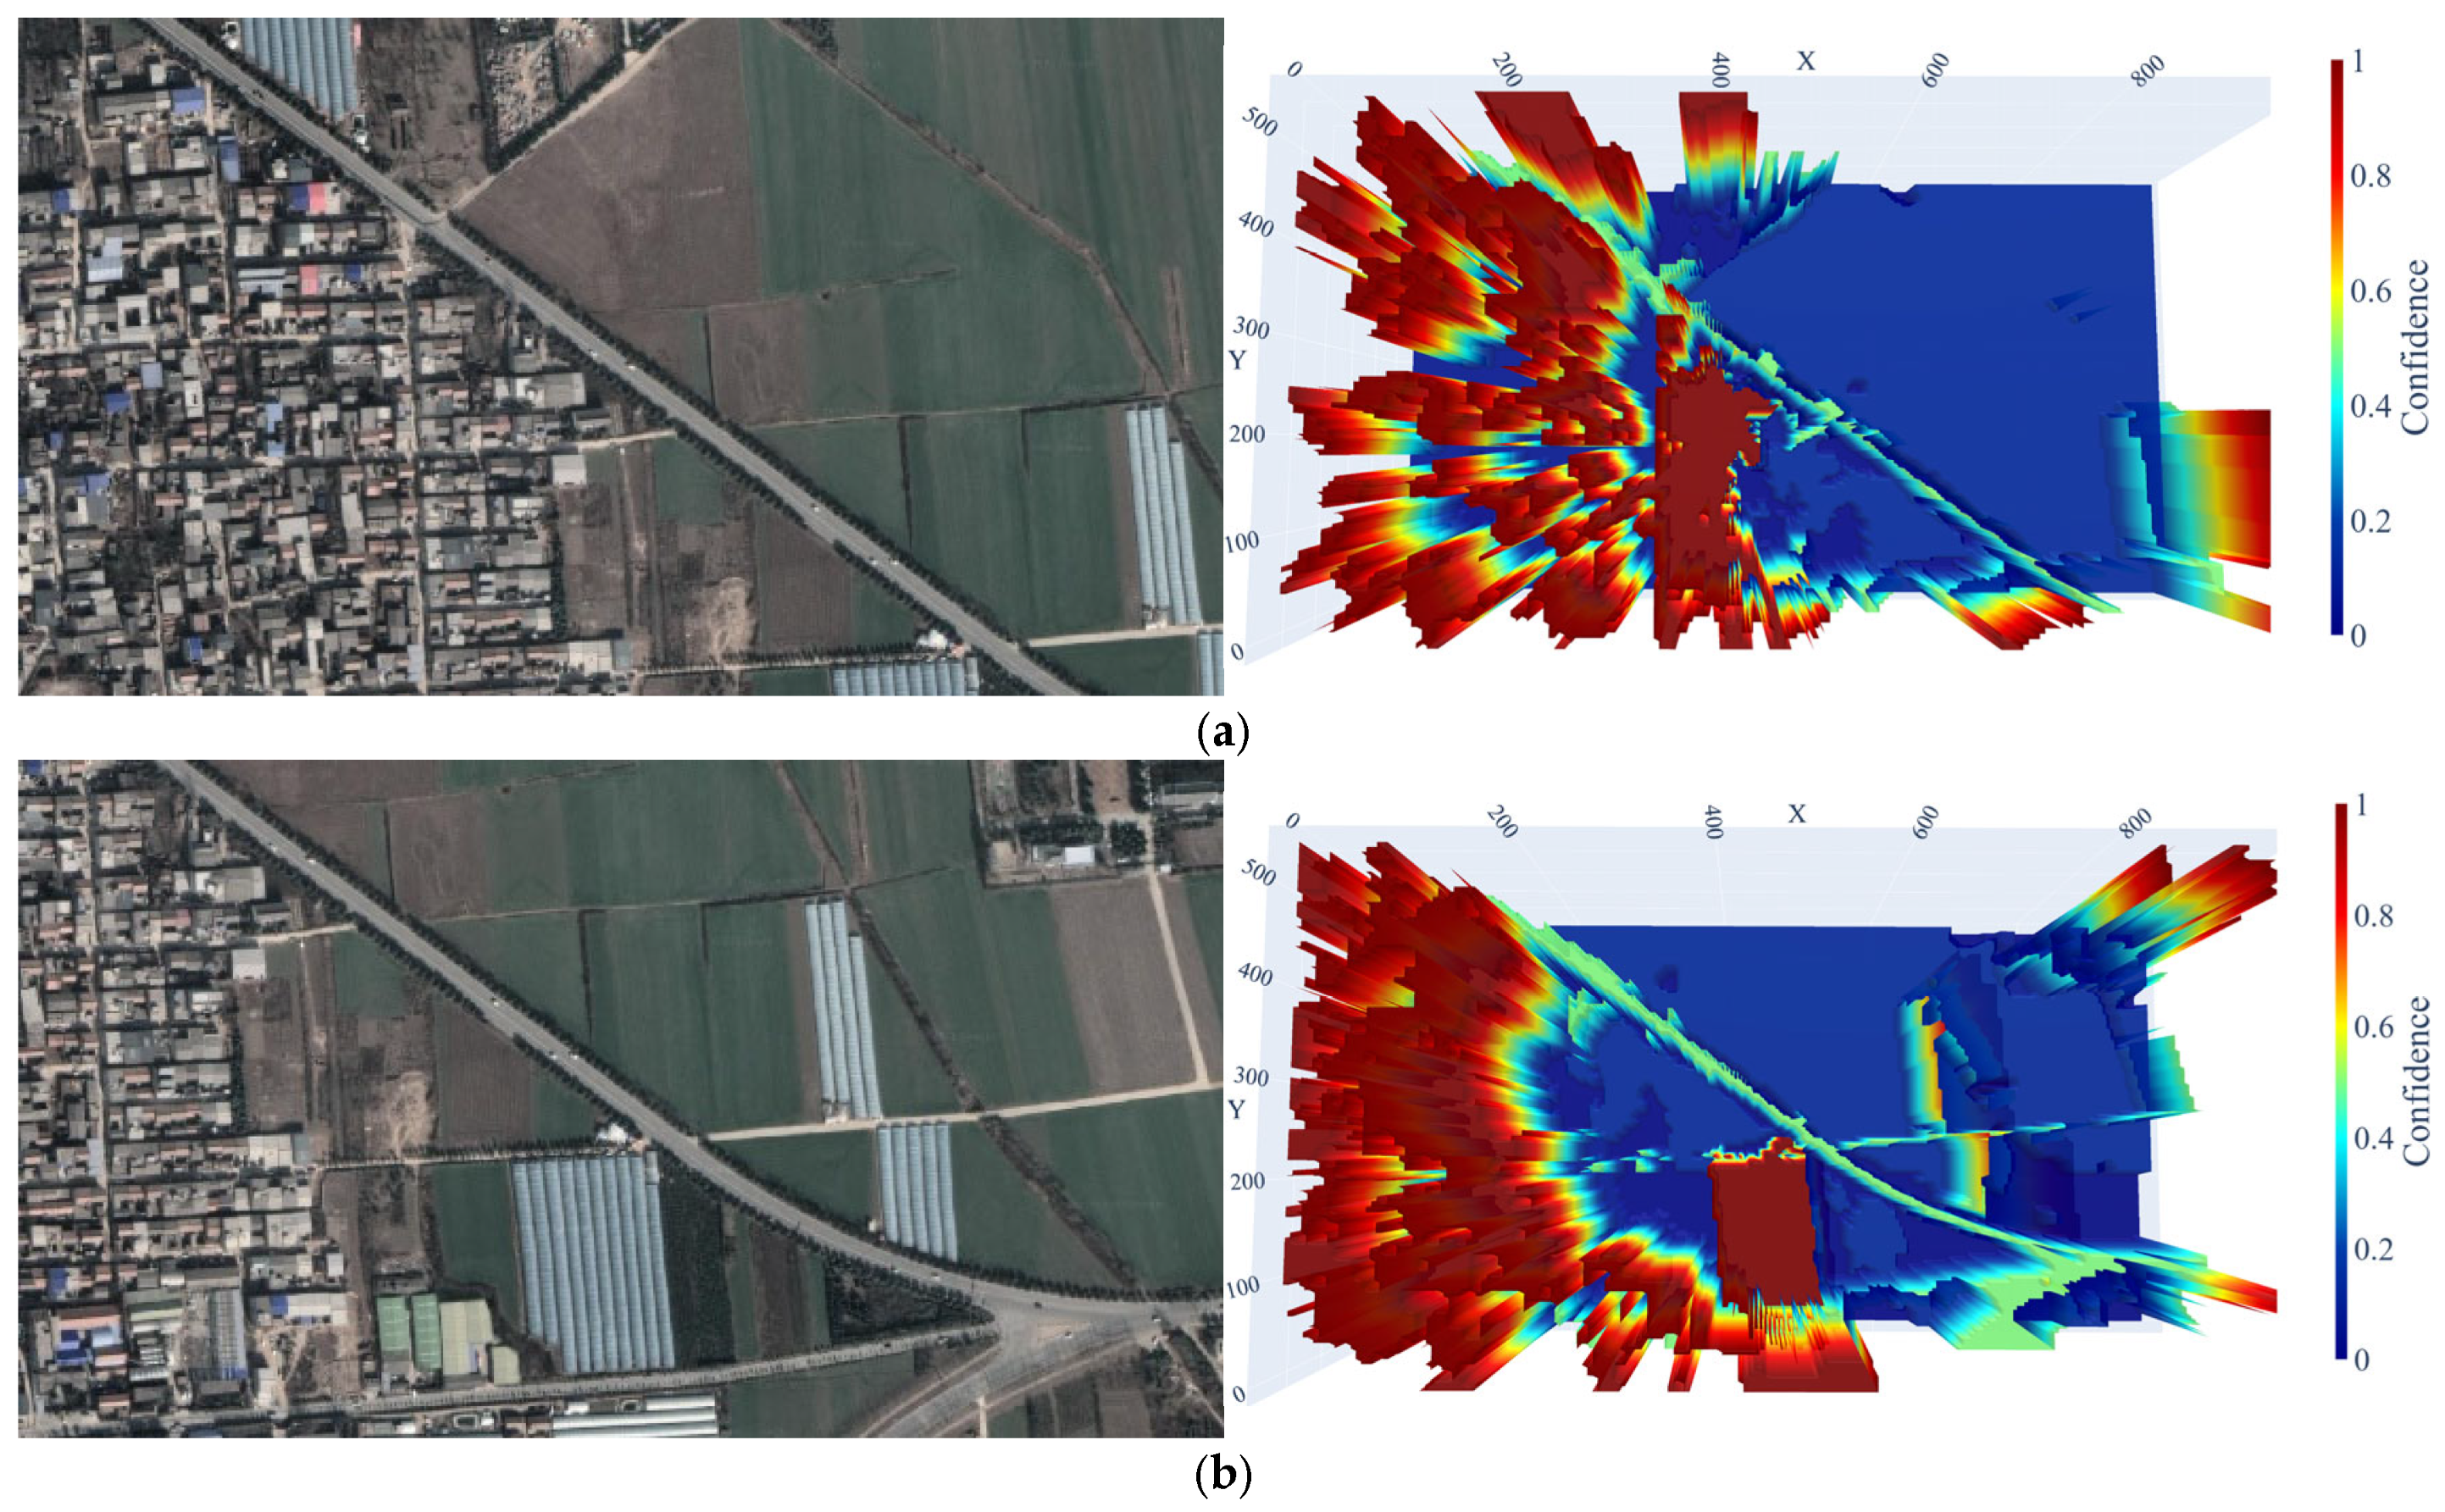
To ensure the independence of statistical samples, we constructed a subset by extracting images from the dataset at intervals of 180 frames for the aforementioned statistical modeling. Based on this statistical analysis, a hierarchical scoring method is adopted to determine the confidence score of each semantic category. The category with the highest matching accuracy is assigned a value of 1, the second highest 0.5, and the confidence scores of subsequent categories decrease in a geometric progression with a common ratio of 1/2. We employ a discretized ranking assignment instead of directly using statistical confidence to prevent the overall confidence degradation and insufficient sampling caused by the absence of high-confidence categories (e.g., buildings), thereby ensuring stable sampling across different scenarios. Table 2 shows the statistical confidence, actual accuracy ranking, and corresponding discretized confidence of each semantic category. Based on the confidence score in Table 2, we further drew a three-dimensional visualization diagram of semantic confidence (as shown in Figure 3).
Based on the confidence score r ( c ) of the semantic category, the number of sampling points for each category is calculated as follows, K c = [ T c r ( c ) ] , where T c represents the original number of matching points for semantic category c .
After obtaining the sampling points K c of each category, FPS sampling is performed for each semantic category c . For semantic category c , set its point set as P c , and the sampling process is as follows:
First, randomly select the initial point p i 0 c P c and make S c ( 1 ) = p i 0 c to calculate the distance from the initial point to each point in the category:
d i c , ( 1 ) = p i c p i 0 c 2 , i = 1 , , N c
In the k iteration, select the k point farthest from the point set S c ( k 1 ) :
i k c = arg max i S c ( k 1 ) d i c , ( k 1 )
Next, update the selected point set and distance array:
S c ( k ) = S c ( k 1 ) p i k c c d i c , ( k ) = min d i c , ( k 1 ) , p i c p i k c c 2 , i = 1 , , N c
Repeat the above process until the point set S c contains K c points; that is, complete the sampling of semantic category C .
Merge the sample point sets of all categories into the total sample point set S :
S = c C S c

2.5. Homography Matrix Solution Based on Semantic Information Fusion

When using RANSAC to solve the homography matrix H from the pixel coordinate system of aerial images to the Mercator coordinate system, we hope that each pair of matching points p i and p i in the point set S meets the projection relationship:
p i H p i
In order to solve H , the direct linear transformation (DLT) method can be used to transform it into the problem of solving the system of linear equations A h = 0 . Where A is a matrix and h is a 9-dimensional vector obtained by expanding H in rows.
In order to improve the robustness of the estimation, we define a weighting error for each matching point pair ( p i , p i ) . This error combines geometric reprojection error e i , semantic similarity s i m JS ( p i , p i ) , and semantic confidence r ( L ( p i ) ) :
E i = r ( L ( p i ) ) e i s i m JS ( p i , p i )
Finally, by minimizing the sum of squares of weighted errors, the least squares solution h of H is obtained:
h = arg min h i = 1 N E i 2
The objective function can be solved by the weighted least squares method under the DLT framework, so that the high confidence point pair carries a greater weight in the estimation so as to improve the estimation accuracy and robustness of the homography matrix.


3. Results

3.1. Experimental Setup

3.1.1. Preparation and Processing of Self-Collected Datasets

In the experiment, we used the DJI Matrice 300 RTK UAV (manufactured by SZ DJI Technology Co., Ltd., Shenzhen, China) to take aerial photos in a suburb of China. The video was taken with an overhead lens, and the stable flight altitude was between 500 m and 610 m. During the flight, the position of each frame of the UAV is measured by the RTK positioning system, and the high-precision attitude and geographical position information are obtained. The final aerial photography covers an area of about 189.2 km2. The aerial photography area involves typical landforms such as fields, roads, vegetation, and buildings. The camera captured 30 images per second, and a total of 34,252 images were obtained. The original resolution of the image is 1920 × 1080, which is adjusted to 960 × 540 for processing in the experiment.
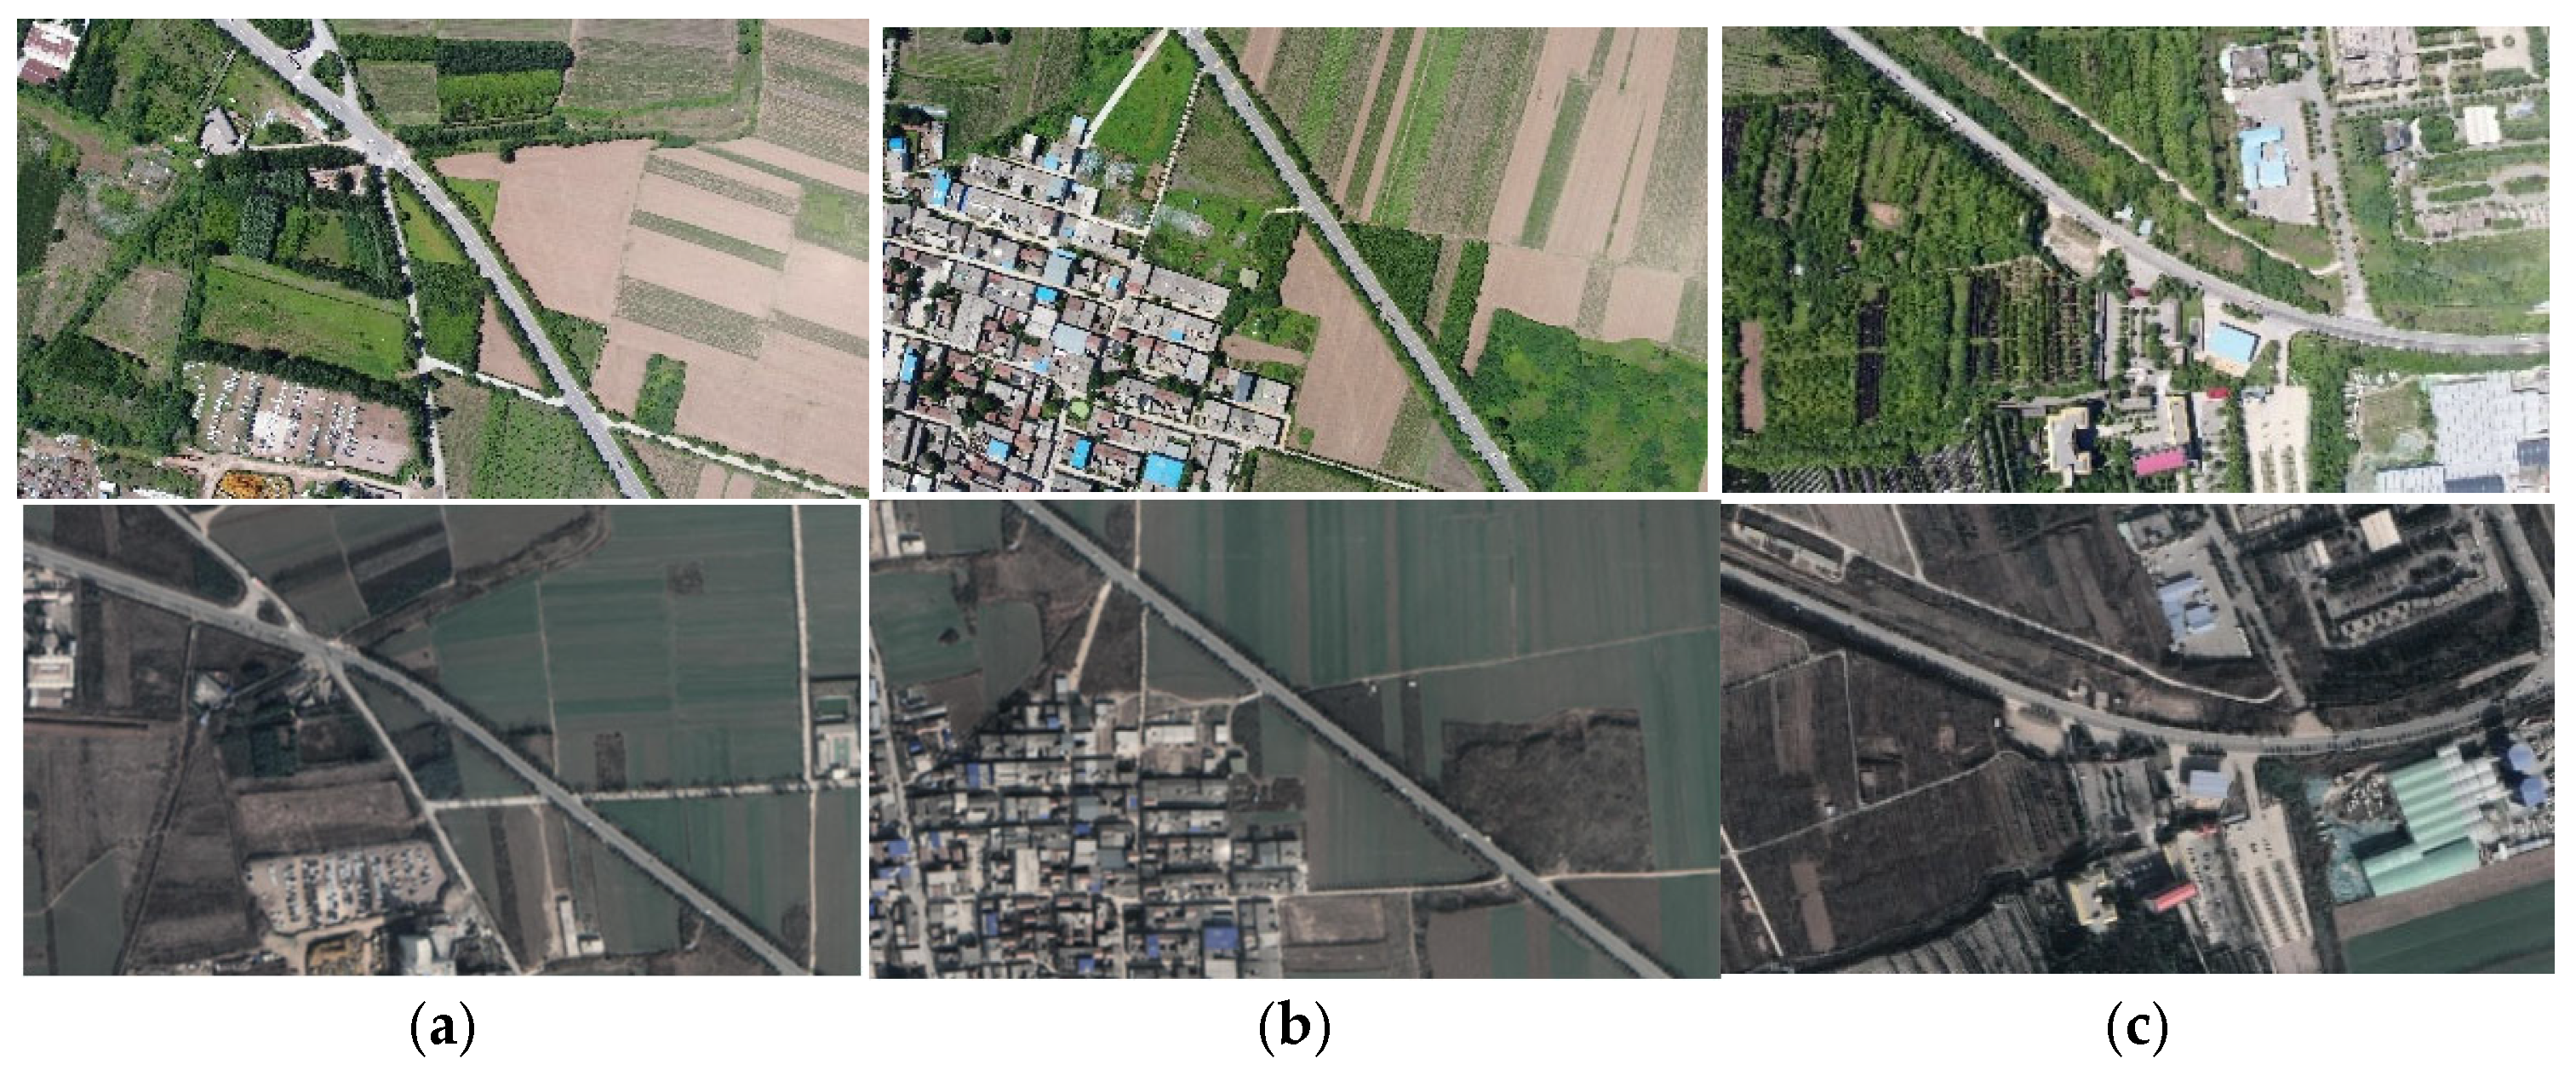
The satellite remote sensing data used in this paper to match the UAV image was downloaded from Google Maps v4.5.0. The original image resolution is 26,905 × 7032 pixels. We divide the original satellite remote sensing image into several image blocks and cut out the corresponding satellite image area consistent with the size of the aerial image. The image adopts the WGS-84 coordinate system, and the ground sampling distance (GSD) is 1.0 m/pixel, according to the geographical location recorded during the UAV flight. As shown in Figure 4, the first line shows the UAV aerial image, and the second line is the corresponding matching satellite image block.

3.1.2. Public Dataset UAV-VisLoc

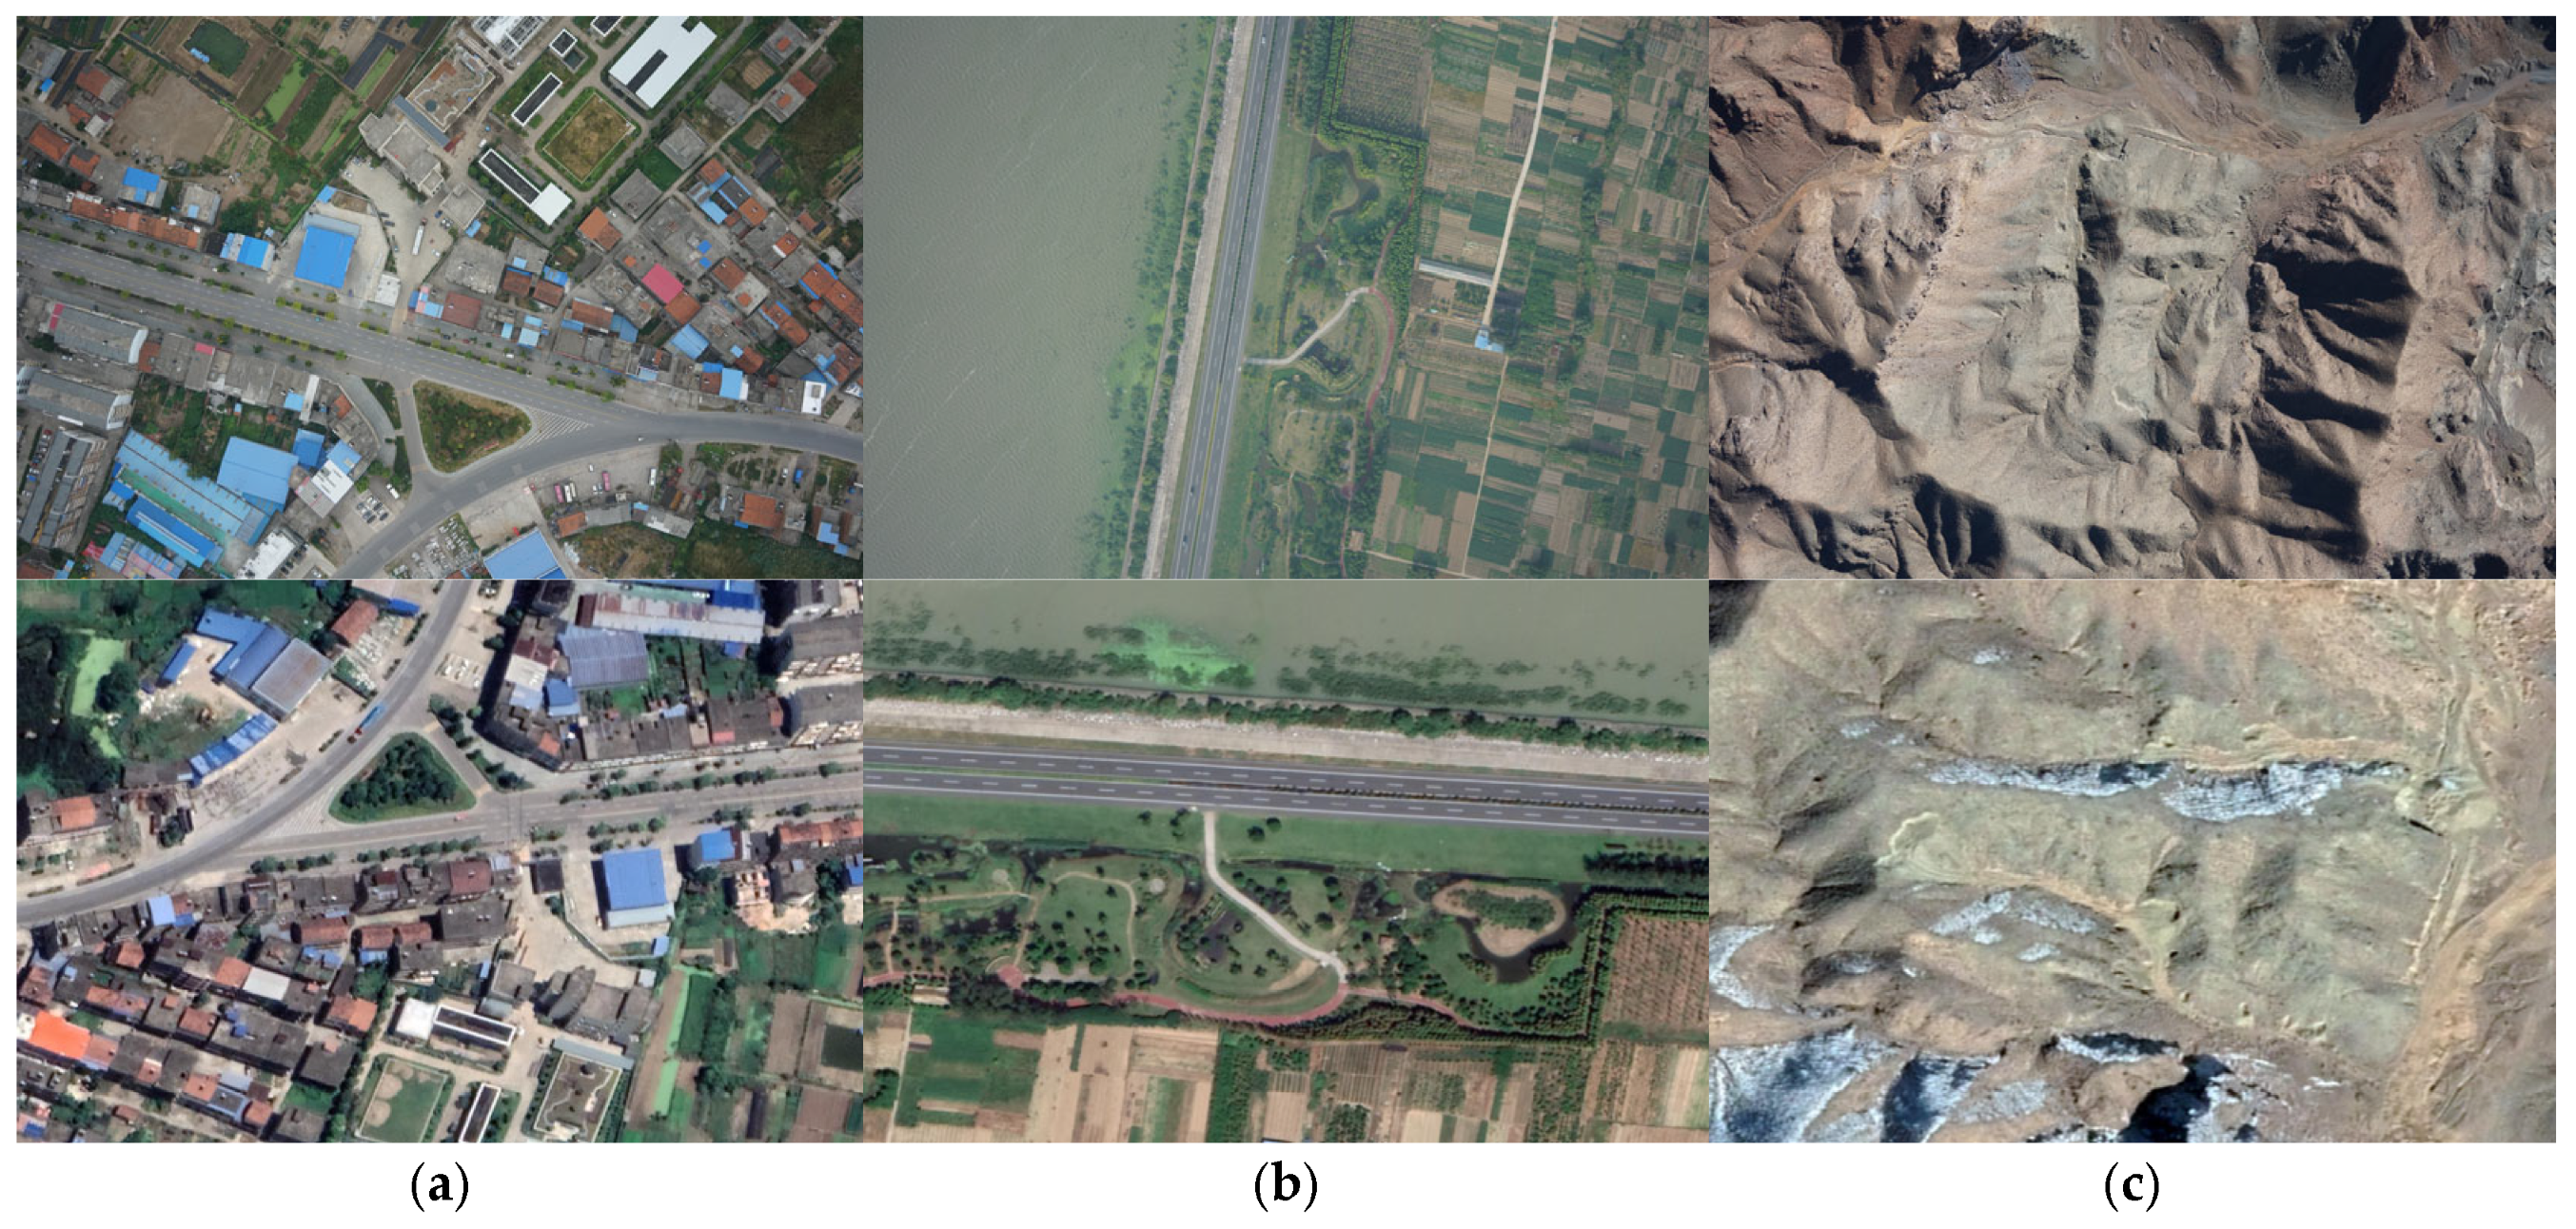
To further verify the generalization ability of SemGeoFrame, the UAV-VisLoc public dataset is introduced [27]. The dataset contains UAV and satellite images from 11 locations in China, covering urban canyons, mountains, rivers, and other landforms. The scene is rich and diverse, which can effectively make up for the lack of a single scene in the self-collected dataset. Each UAV image provides metadata, such as longitude and latitude, altitude, heading angle, etc., from which the homography matrix can be calculated, which is consistent with the main experimental evaluation index. Using a simple random sampling method, we randomly selected 80 image pairs for testing for the generalization analysis in Section 3.3. Figure 5 shows an example dataset.

3.1.3. Experimental Environment

The experimental environment for this study is configured as follows: the processor is an Intel Core i7-12700KF (3.60 GHz), the graphics card is an NVIDIA GeForce RTX 3060, the memory is 16.0 GB, the operating system is Ubuntu 18.04, and the programming language is Python 3.8.

3.1.4. Experimental Evaluation Index

This paper compares the real homography matrix H t with the homography matrix H obtained by the matching algorithm to determine the accuracy of the matching algorithm; that is, the reprojection error. Firstly, the real homography matrix H t is calculated according to the real pose data [ x , y , z , ϕ , θ , ψ ] recorded by the RTK on the UAV. Due to the fact that the flight area of the drone can be approximated as a plane, the calculation process of H t is shown in Equation (17):
H t = K R t n T d K 1
where K is the camera intrinsic parameter matrix, R and t are the rotation matrix and translation vector from the camera coordinate system to the world coordinate system, n is the unit normal vector of the ground plane, and d is the vertical distance from the camera center to the plane. For the scenario of unmanned aerial vehicles flying on flat terrain, the ground plane can be regarded as a horizontal plane, so n = [ 0 , 0 , 1 ] and d is equal to the flight altitude.
For each pair of matching points, the projection coordinates are calculated using the real matrix H t and the estimation matrix H , respectively:
p t = H p , p = H t p
The calculation formula of reprojection error is as follows:
ϵ x y = p t p
The error ϵ x y reflects the deviation between the estimated homography transform H mapping the point to the target image position and the real position.

3.2. Matching Results

3.2.1. Semantic Segmentation Results

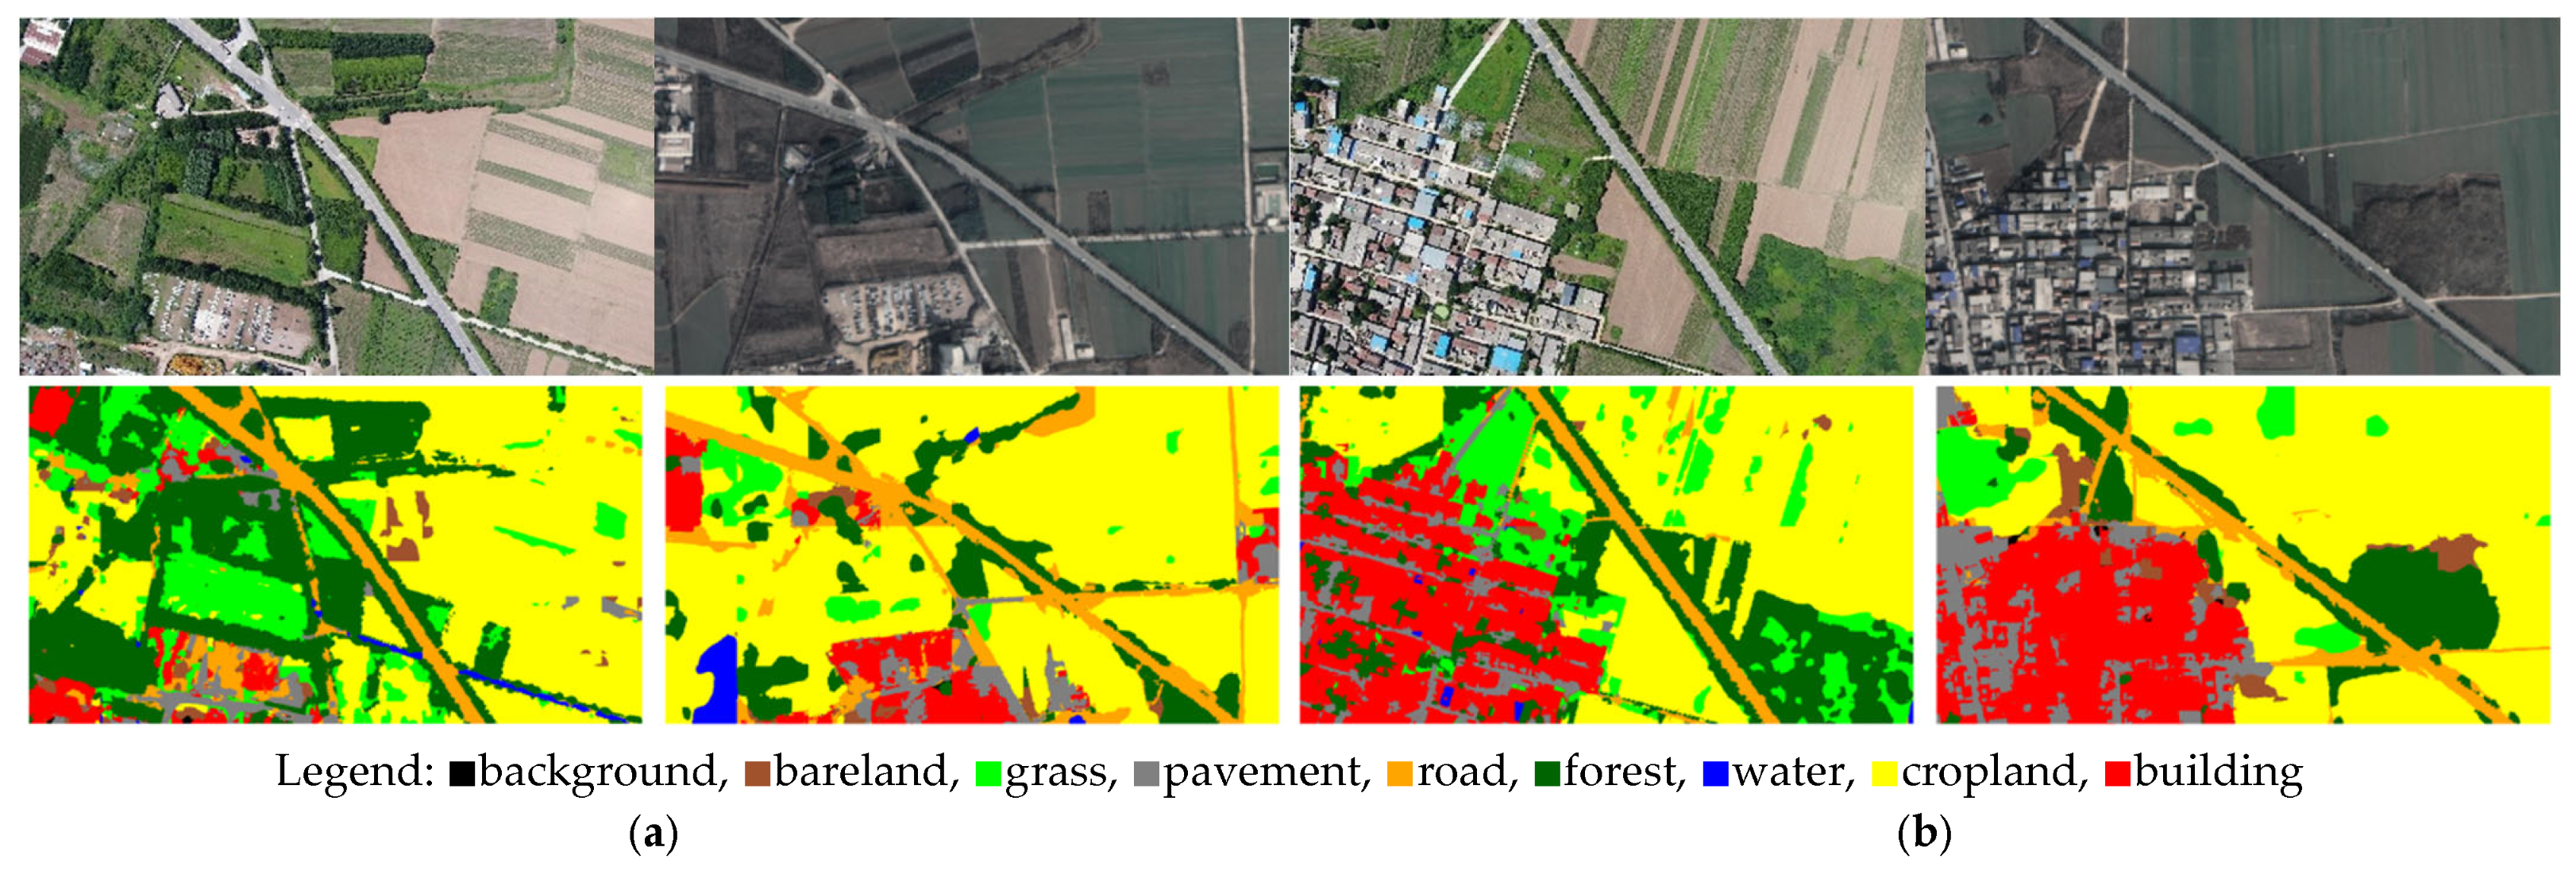
The aerial image is processed by SegEarth OV to obtain its semantic image. As shown in Figure 6a, two frames, Frame_0108 and Frame_0142, are selected to display the segmentation effect. In the semantic image, black represents “background”, brown represents “bareland”, light green represents “grass”, gray represents “pavement”, orange represents “road”, dark green represents “forest”, blue represents “water”, yellow represents “cropland”, and red represents “building”. As shown in Figure 6b, the satellite remote sensing image is similarly processed to obtain its semantic image.

3.2.2. Validation of Semantic Consistency Screening

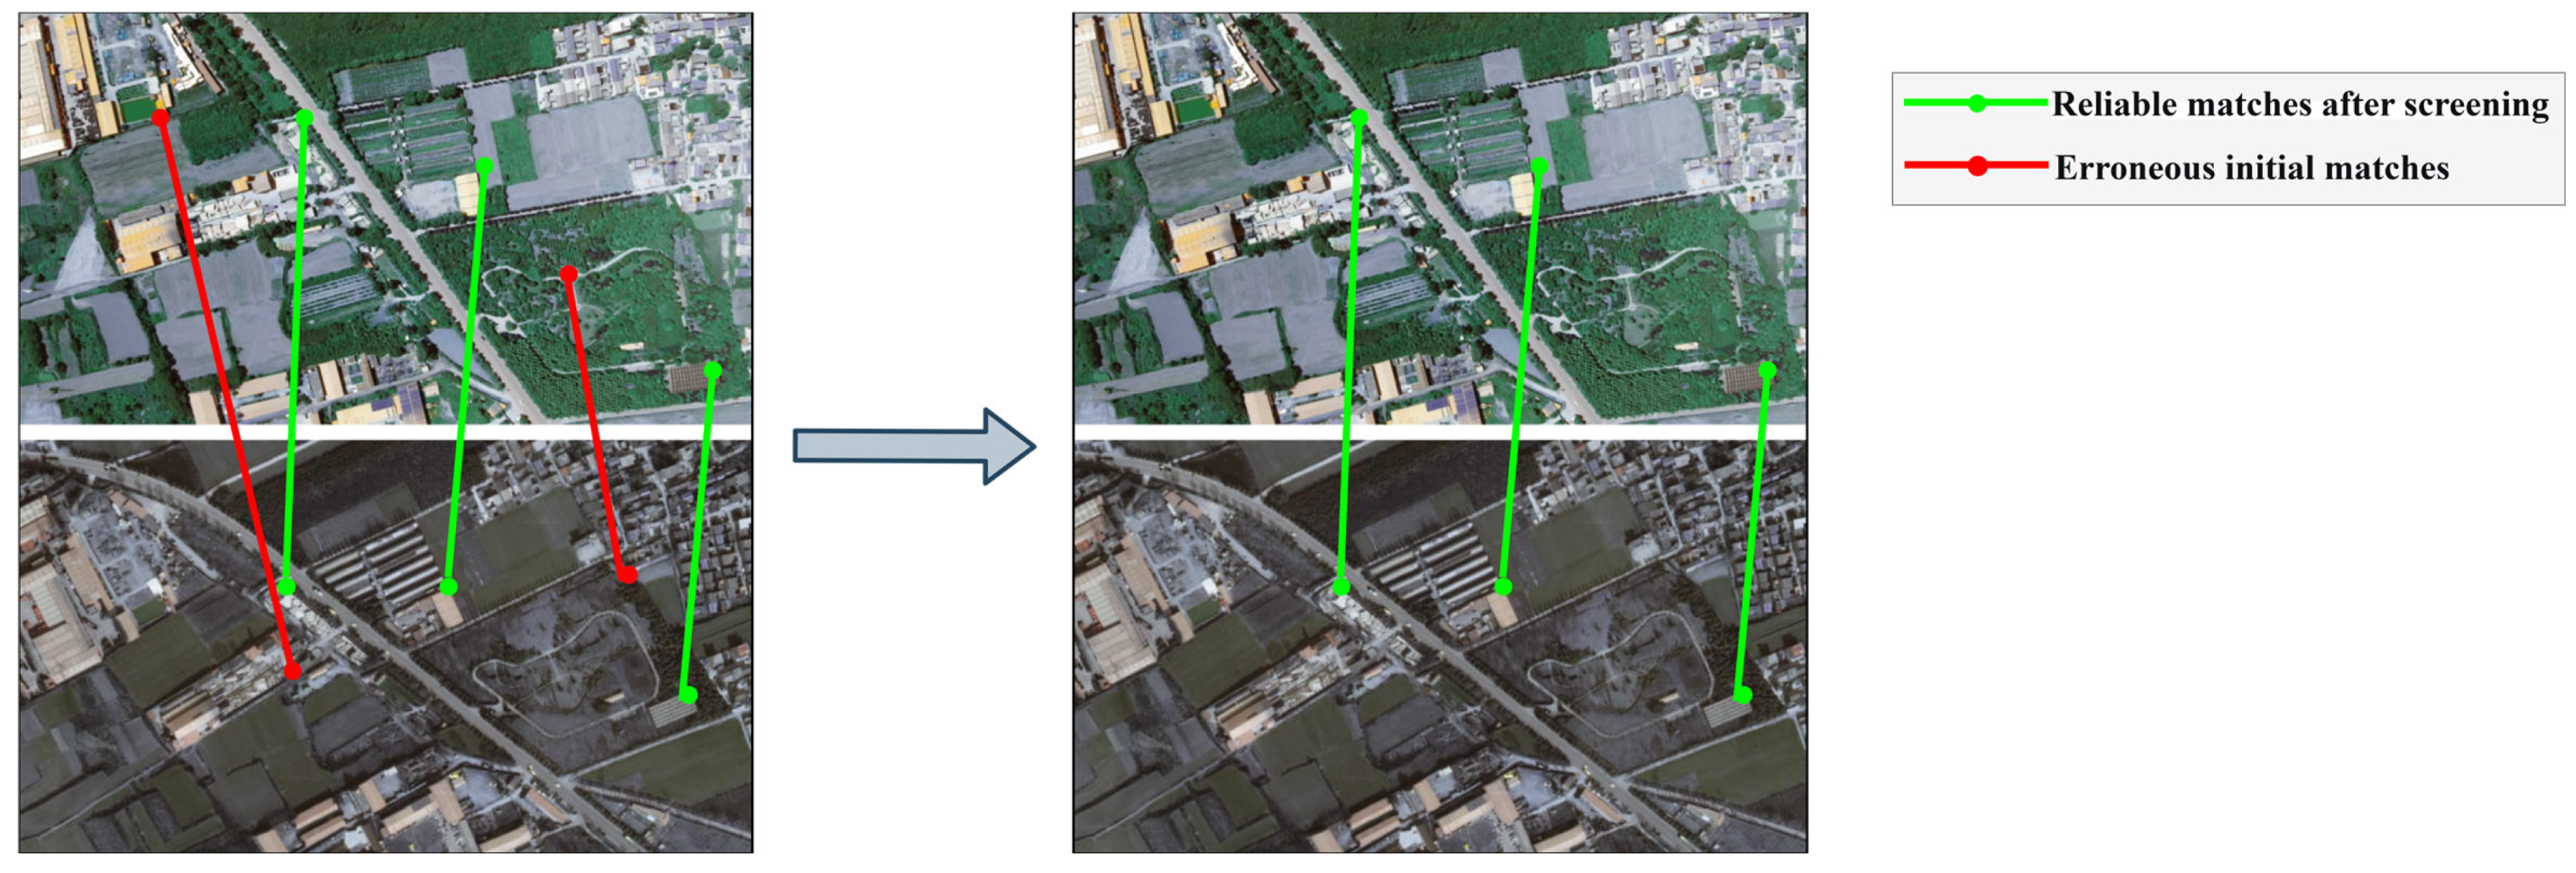
After obtaining the semantic segmentation map of aerial images and satellite remote sensing images, we use the semantic information of the images to perform semantic consistency screening on the matching points (as shown in Figure 7) and select Frame_0532 to demonstrate the semantic segmentation effect. As can be seen from Figure 7, after semantic consistency screening, some mismatched matching pairs are eliminated, which effectively improves the matching accuracy.

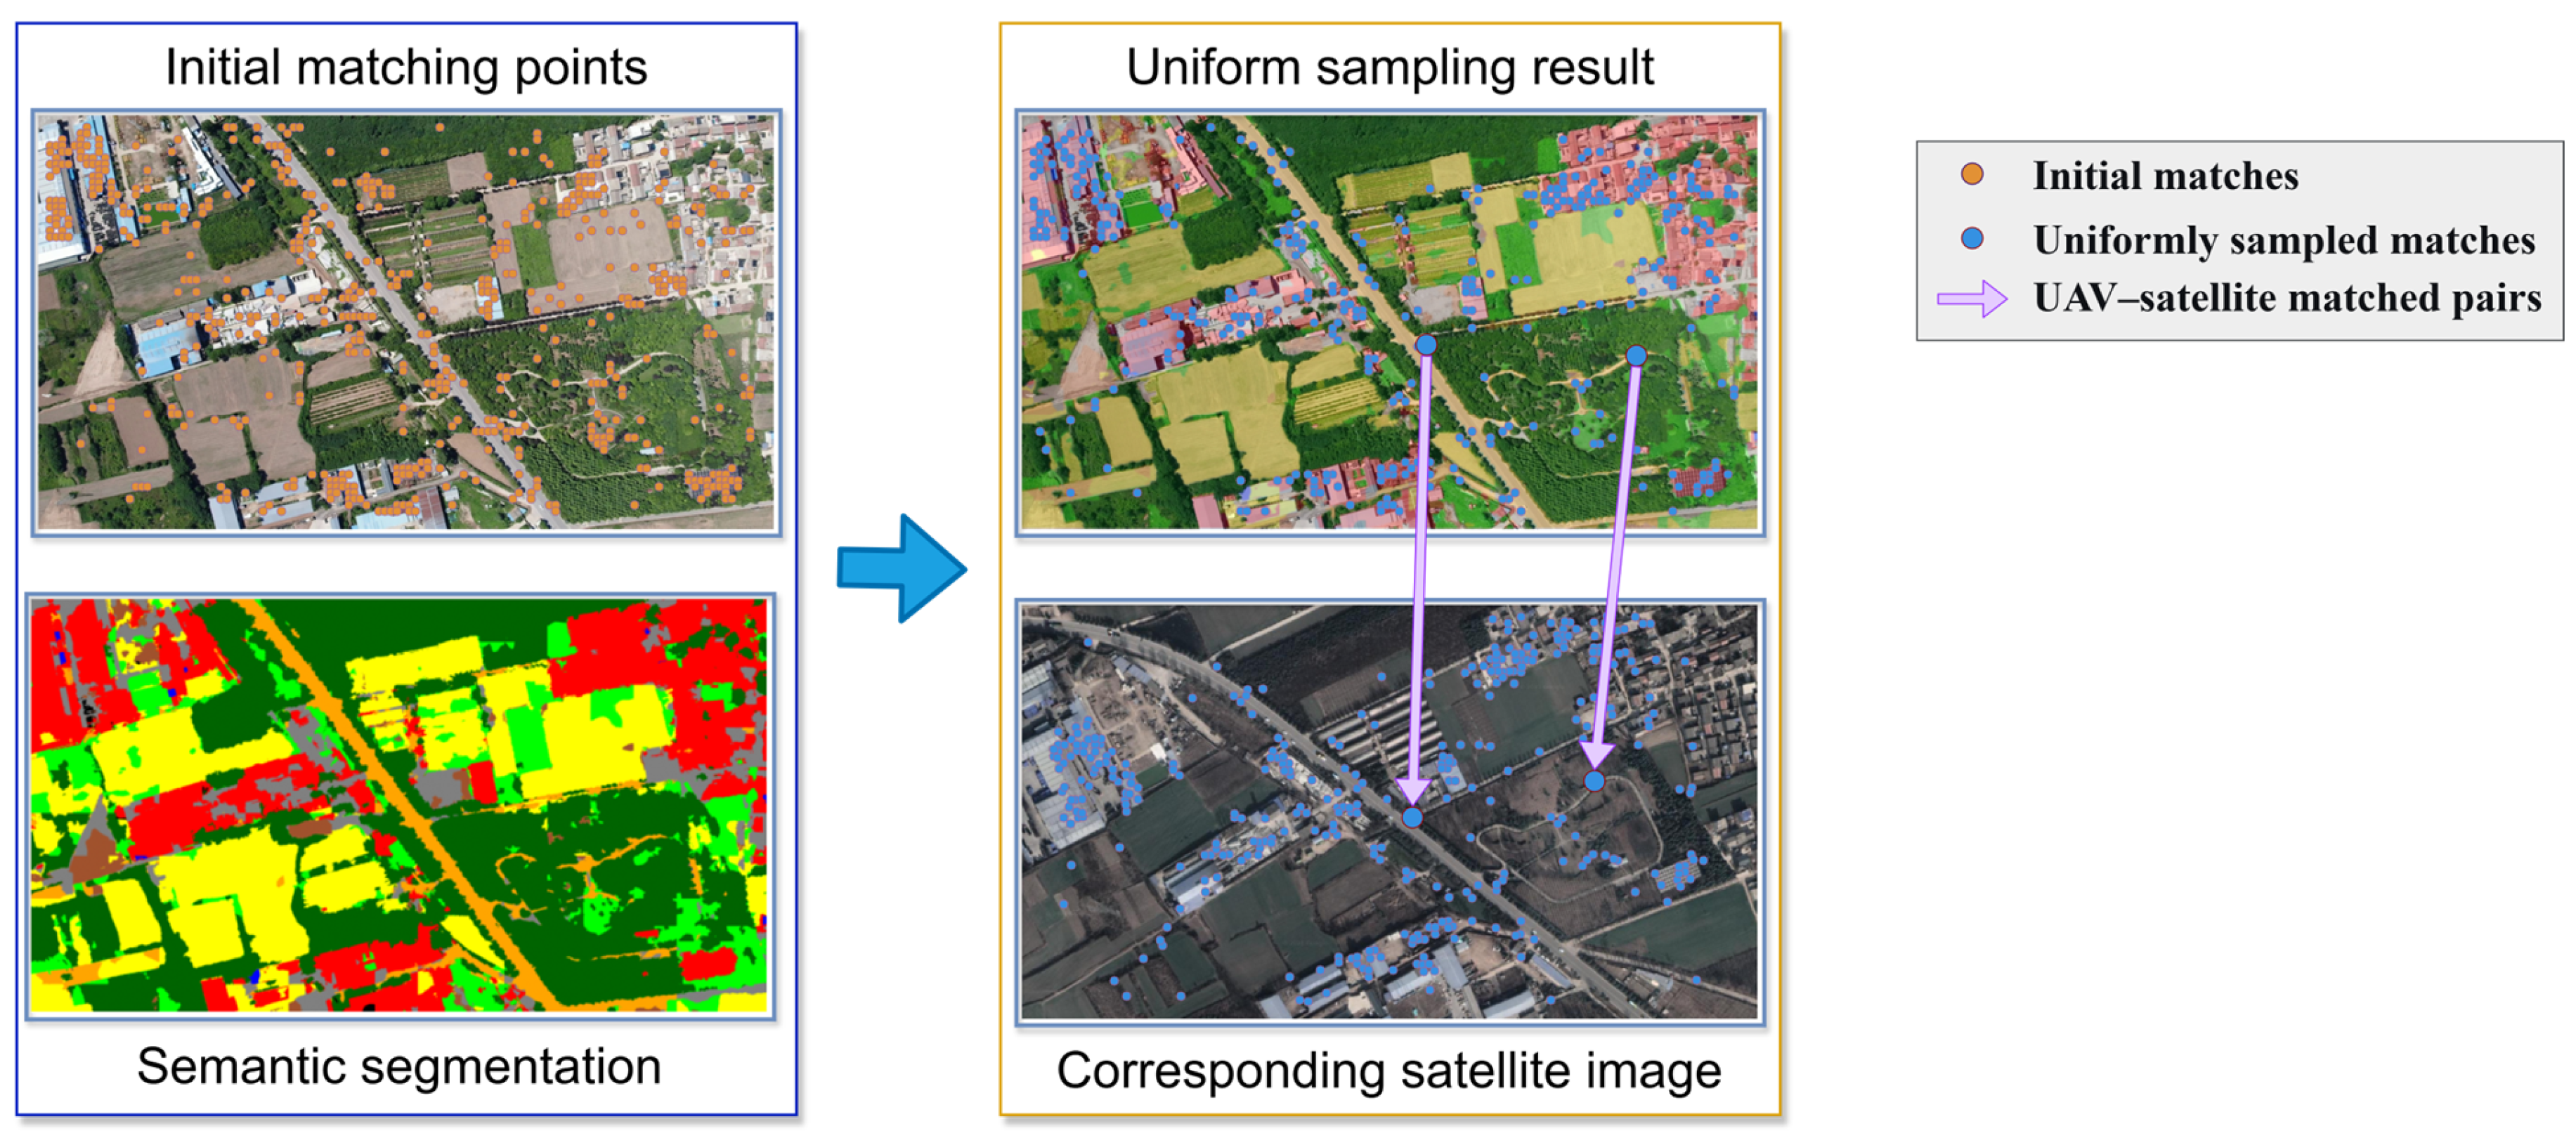
3.2.3. Validation of Spatial Uniform Sampling Based on Semantic Prior

After completing the semantic consistency screening, in order to further optimize the spatial distribution of matching points, we uniformly sample the matching points on aerial images based on semantic prior. The selected matching point pair is based on the points on the aerial image, and the corresponding points in the satellite remote sensing image will be automatically determined. The schematic diagram of this process is shown in Figure 8.

3.2.4. Comparative Experiment

To verify the effectiveness of the proposed SemGeoFrame framework in heterogeneous remote sensing image matching, a comparative experiment is designed on the self-built UAV satellite remote sensing image dataset. Five representative feature matching algorithms (ORB, SuperPoint+SuperGlue, ASLFeat, LoFTR, Efficient LoFTR) were selected as baseline methods to compare the performance of the original version of each algorithm with that of SemGeoFrame.
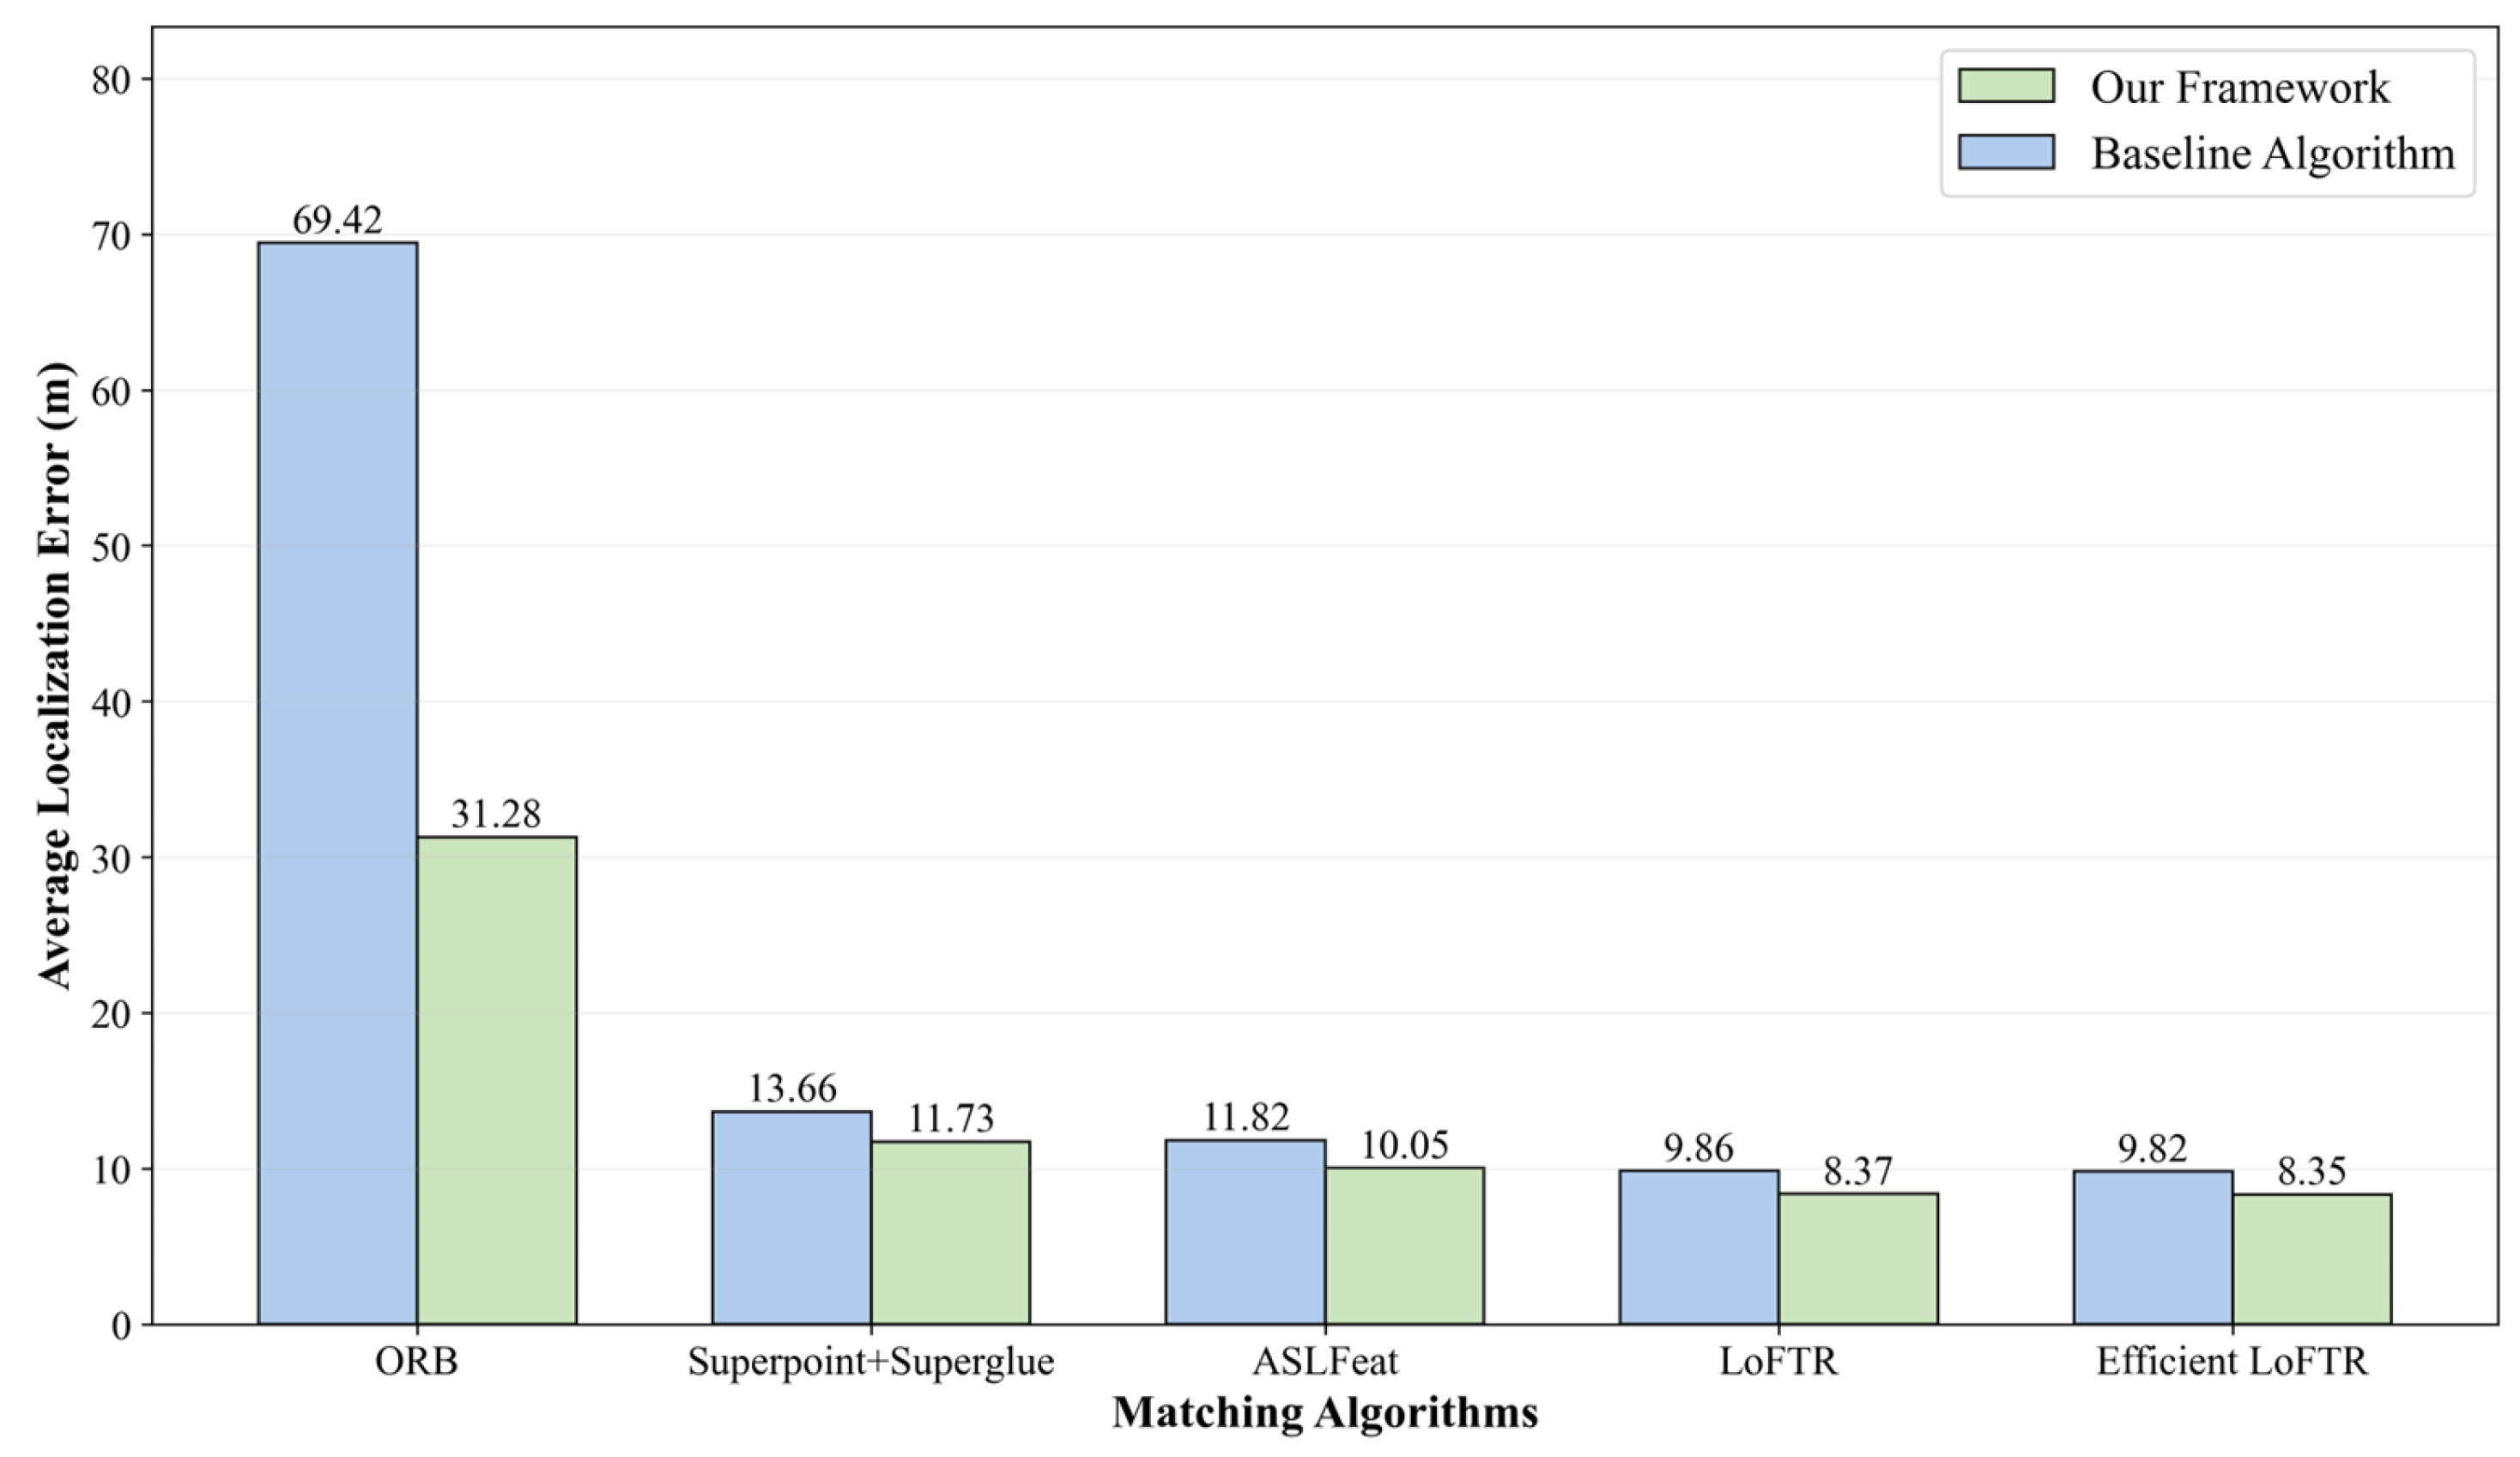
Figure 9 shows the performance comparison of the five algorithms in the baseline version and combined with SemGeoFrame. The experiment was evaluated by four indexes: minimum error (min), maximum error (max), average error (AVG), and standard deviation (STD). The results are shown in Table 3. After the introduction of the SemGeoFrame framework, the errors of all methods are significantly reduced.
Specifically, after the ORB method is combined with SemGeoFrame, the average error is reduced from 69.422 to 31.28, and the standard deviation is also reduced from 38.17 to 12.60, indicating that its performance is more stable. After adding SemGeoFrame, the average error of the SuperPoint+SuperGlue combination decreased from 13.66 to 11.73, and all indicators improved. ASLFeat and LoFTR have performed well in the baseline, with average errors of 11.82 and 9.86, respectively. After the introduction of SemGeoFrame, they further decreased to 10.05 and 8.37. Efficient LoFTR, as an accelerated and improved version of LoFTR, has achieved baseline accuracy equivalent to LoFTR on self-collected datasets. After adding SemGeoFrame, it fell to 8.35, a decrease of about 15%. Experiments show that SemGeoFrame can bring stable performance improvement to all test algorithms.

3.2.5. Parameter Experiment

In order to deeply study the sensitivity of the core parameters of the framework and its impact on performance, we select the LoFTR algorithm as a representative carrier for parameter analysis. LoFTR is an advanced deep learning matcher at present. The analysis of its parameters can effectively reflect the optimization and adaptation ability of the framework to modern algorithms.
This paper focuses on analyzing a key design parameter of the framework: the semantic similarity threshold δ . We systematically adjusted the parameter and recorded the corresponding localization error ϵ x y on the representative scene Frame_0257. As shown in Table 4, the experimental results clearly demonstrate that the system performance is sensitive to parameter selection but follows a clear pattern: the localization error initially decreases and then increases as δ grows, achieving optimal performance at δ   = 0 . 7 , where the localization error is minimized (9.86 m). When the parameter deviate from this optimal value, performance declines to varying degrees.

3.2.6. Ablation Experiment

In order to evaluate the effectiveness of the screening strategy proposed in this paper, we systematically designed ablation experiments. We choose the LoFTR algorithm as the evaluation basis of this experiment. The selection of this algorithm is mainly based on two points: first, its wide acceptance ensures the reference value of the experimental results, and second, LoFTR itself has a strong matching ability. If our framework can still significantly improve its performance, it can more effectively prove the effectiveness of the framework design, rather than just optimizing a weak baseline model.
We analyze two modules: one is semantic consistency, and in the filtering module, the matching point pairs with low confidence are eliminated by evaluating the consistency of the semantic segmentation results of the corresponding positions of the two images; the second is a spatial uniform sampling module based on semantic prior. The module first determines the differentiated sampling points for different regions according to semantic confidence and then optimizes the sampling by the FPS method based on semantic partition to improve the spatial distribution uniformity of matching points so as to improve the matching accuracy.
The ablation experimental results on the representative scene Frame_0257 are shown in Table 5. It can be seen that semantic consistency filtering reduces the reprojection error from 15.17 m to 12.53 m, which verifies the effectiveness of the strategy in screening high-quality matching point pairs; after adding the spatial distribution optimization strategy, the reprojection error is further reduced to 9.86 m, which confirms its effectiveness in improving the spatial distribution uniformity of matching points. When only the spatial distribution optimization is used, the error is reduced to 11.26 m, indicating that the strategy also has an independent contribution. When the two modules are used together, the optimal performance is obtained, which improves the baseline by 35.0%, reflecting the synergy between modules.

3.3. Generalization and Robustness Analysis

In order to further verify the applicable boundary of the framework in this paper, we use the UAV-VisLoc public dataset introduced in Section 3.1.2 to conduct cross-scenario generalization tests. This section aims to explore the ability of SemGeoFrame to maintain positioning accuracy when facing the complex environment of a non-specific acquisition area and the fluctuation of front-end semantic segmentation quality.

3.3.1. Cross-Scenario Generalization Verification

To verify the generalization performance of SemGeoFrame, five matching algorithms, ORB, SuperPoint+SuperGlue, ASLFeat, LoFTR, and Efficient LoFTR, were tested on the UAV-VisLoc dataset. The performance before and after integration of SemGeoFrame was compared, and the results are shown in Table 6.
The experimental results show that SemGeoFrame can stably improve the matching accuracy of all algorithms. Taking ORB as an example, its average error decreased from 53.12 m to 39.84 m (decreased by 25.0%); SuperPoint+SuperGlue decreased from 8.27 m to 7.60 m (decreased by 8.1%); ASLFeat decreased from 9.27 m to 8.53 m (decreased by 8.0%); LoFTR decreased from 8.51 m to 7.72 m (decreased by 9.3%); and Efficient LoFTR decreased from 8.45 m to 7.75 m (decreased by 8.3%). After adding SemGeoFrame to all algorithms, the minimum error and maximum error show a synchronous downward trend, and the standard deviation of most algorithms decreases synchronously, which verifies the effectiveness and robustness of the framework in complex geographical environments. It is worth noting that the standard deviation of Efficient LoFTR+SemGeo increased slightly from 2.38 to 2.72, but its average error still decreased significantly. This small fluctuation is within the normal range of the test subset and does not affect the overall conclusion.

3.3.2. Sensitivity Analysis of Semantic Segmentation Accuracy

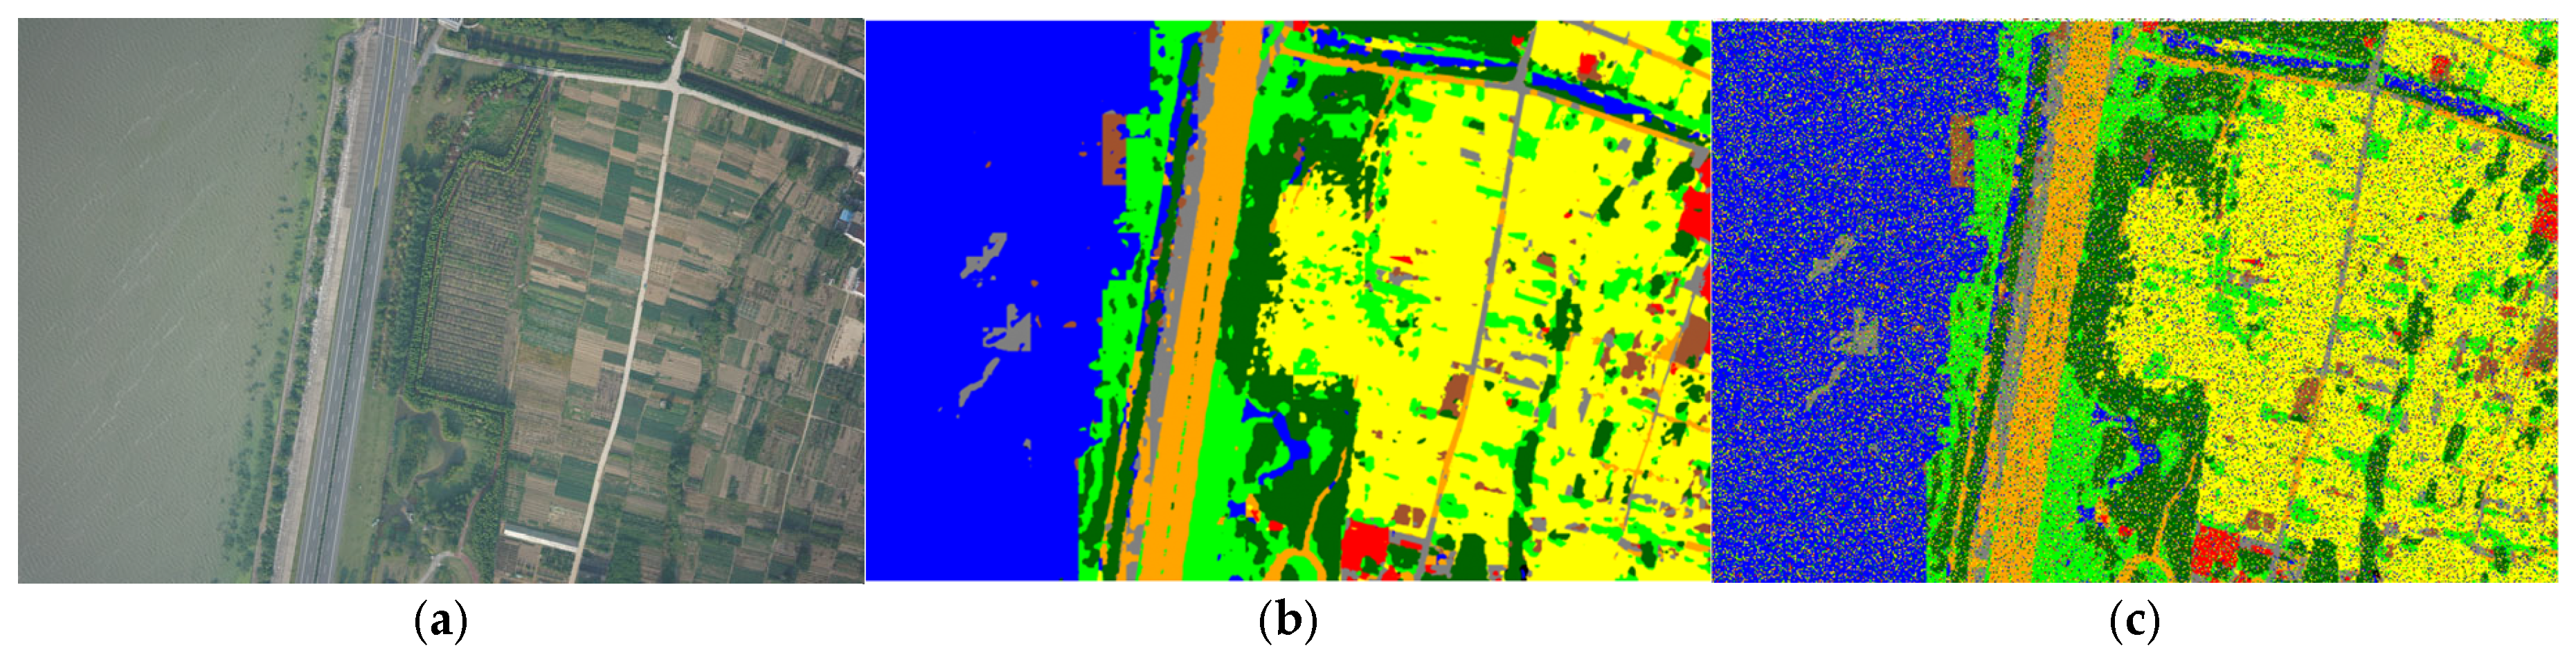
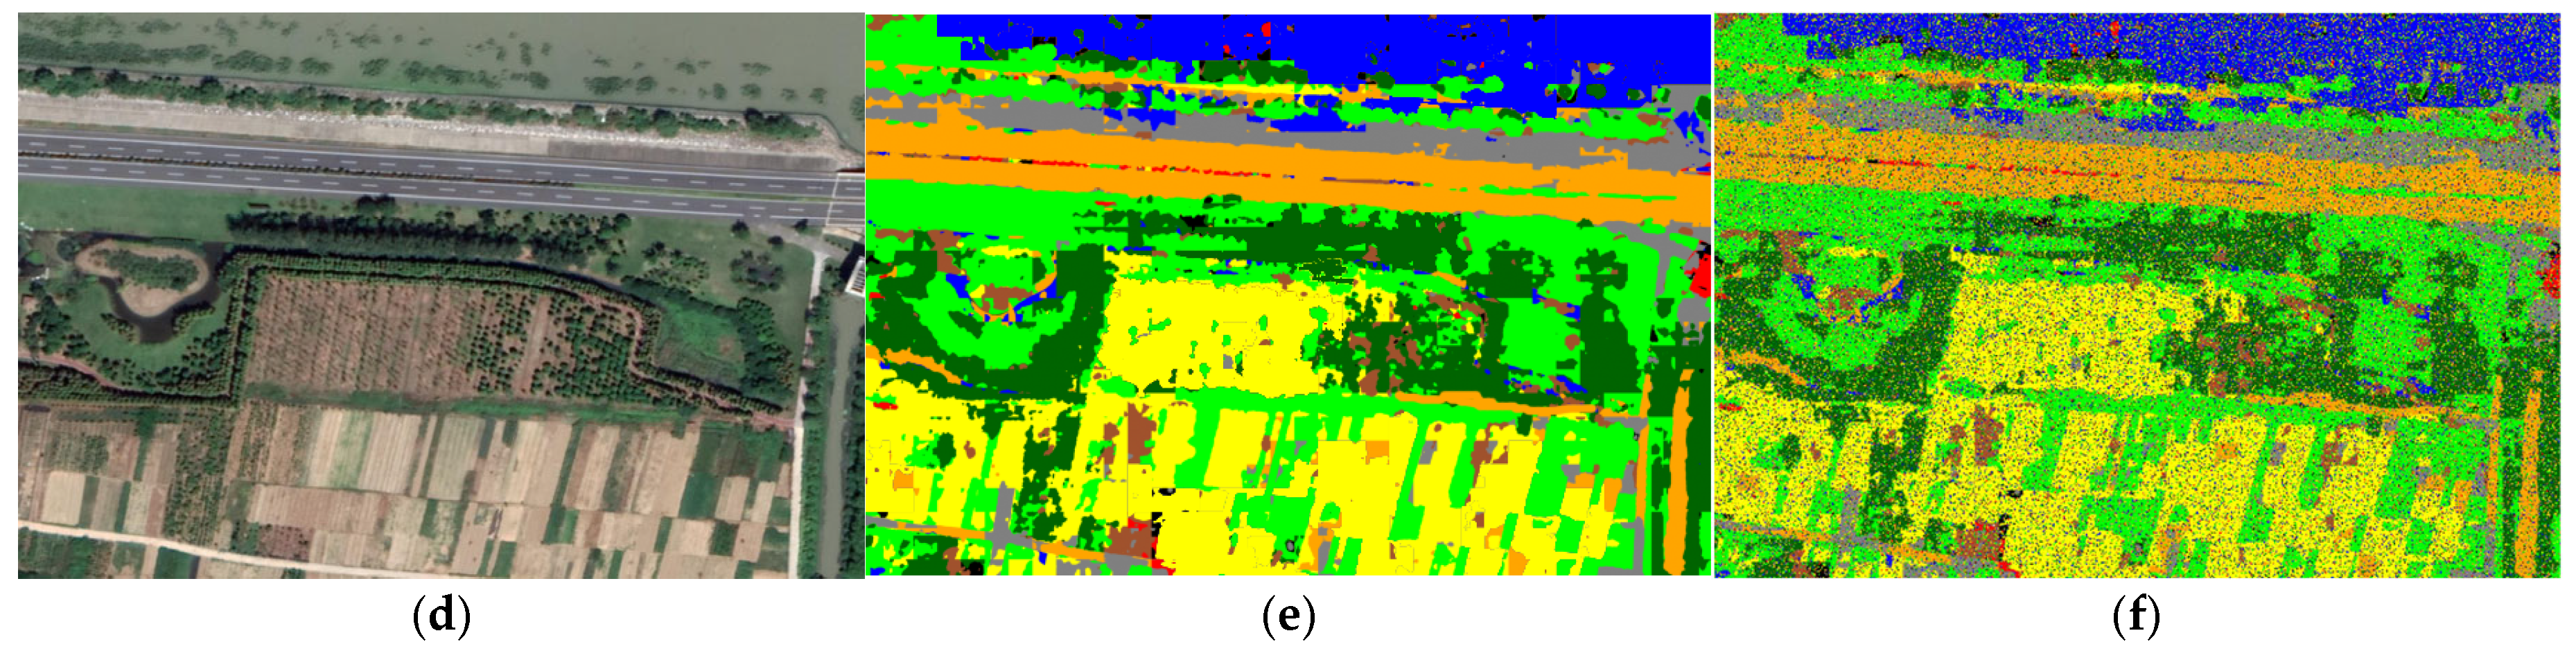
In order to quantitatively evaluate the impact of semantic segmentation quality on the performance of SemGeoFrame, a simulated degradation experiment was conducted with LoFTR+SemGeo as the object. The semantic segmentation images of UAVs and satellite images are synchronously injected with random category noise with the same ratio of p to simulate the extreme situation of simultaneous damage of two terminal inputs. Three degradation levels of p = 0.00 , p = 0.15 , and p = 0.30 were selected and tested on the representative images of the UAV-VisLoc dataset. Figure 10 shows an example of semantic degradation.
As shown in Table 7, the experimental results show that when the degradation ratio is p = 0.15 , the average error of LoFTR+SemGeo is slightly higher than the original LoFTR baseline but still remains at the same level. At p = 0.30 , the average error rose to 9.80 m, significantly exceeding the baseline. This shows that SemGeoFrame has a certain dependence on segmentation accuracy, but it can still maintain the same performance as the original matcher under moderate degradation. The above results verify that the framework is dependent on the segmentation accuracy and clarify the applicable boundary under which it can still work effectively under medium-quality segmentation.

3.4. Calculation Efficiency Analysis

In order to evaluate the feasibility of SemGeoFrame in UAV real-time positioning tasks, this section analyzes the inference time of its airborne module. The configuration of the experimental platform is consistent with Section 3.1.3 (Intel i7-12700kf, NVIDIA RTX 3060), and all time indicators are the average value of 100 reasoning. It should be noted that the semantic segmentation of satellite images can be completed on the ground in advance, and the results can be loaded into the UAV for storage, so it is not included in the airborne real-time cost; semantic segmentation of UAV images needs to be carried out in real time during flight. In order to maximize the real-time performance of the system, Efficient LoFTR, with the best comprehensive efficiency in the comparative experiment, is selected as the basic matching algorithm in this section.
The detailed computational cost is summarized in Table 8. The cumulative delay of the above modules is about 1385 ms, corresponding to approximately 0.72 FPS. The semantic guidance core logic accounts for only 18.4 ms, about 1.3% of the total system delay, confirming its lightweight nature. Currently, the main time consumption lies in the semantic segmentation module; a more efficient segmentation network could further improve the overall performance of SemGeoFrame.

4. Discussion

Experiments show that SemGeoFrame can steadily improve the matching accuracy of ORB, SuperPoint, ASLFeat, LoFTR, and Efficient LoFTR algorithms. The traditional algorithm (such as ORB) has the most significant improvement, because its manual features are more sensitive to semantic noise. Although the gain of the deep learning method is small, the trend is consistent, which verifies the universality of semantic priors.
The generalization verification on the UAV-VisLoc open dataset further confirmed the effectiveness of the framework in complex landforms. The sensitivity analysis of semantic segmentation shows that when the degradation ratio p ≤ 0.15, the performance of the framework is equal to the baseline, and when p = 0.3, it is obviously invalid, which reveals the boundary of its dependence on segmentation quality. To sum up, SemGeoFrame effectively improves the accuracy and robustness of heterogeneous image matching by introducing high-level semantic priors. In the future, we will explore a more robust semantic fusion mechanism to reduce the dependence of the framework on the front-end segmentation accuracy.

5. Conclusions

Aiming at the problems of illumination, scale, season, and perspective differences in the heterogeneous matching of UAV and satellite remote sensing images, this paper proposes a semantic-assisted visual matching framework, SemGeoFrame. Its core is to integrate the high-level semantic prior system into the feature matching process and form the matching scheme through semantic consistency measurement, partition sampling, and multi-objective optimization. Experiments show that the framework, as a plug-and-play module, can effectively improve the performance of different matching algorithms on multiple heterogeneous datasets and verify the effectiveness of semantic information, which provides a reference for the semantic fusion of UAV high-precision positioning and cross-modal matching in GNSS-denied environments. In the future, we will focus on optimizing the robustness and lightweight level of the framework to adapt to practical engineering applications.

Author Contributions

Conceptualization, Z.L. and Y.L.; methodology, Z.L. and C.L.; software, Z.L. and D.Y.; validation, Z.L., Y.L., and M.K.; formal analysis, Z.L.; investigation, Y.L. and C.L.; resources, Y.L. and C.A.; data curation, Z.L. and M.Z.; writing—original draft preparation, Z.L.; writing—review and editing, Y.L., M.K., and C.A.; visualization, Z.L. and D.Y.; supervision, Y.L.; project administration, Y.L.; funding acquisition, Y.L. All authors have read and agreed to the published version of the manuscript.

Funding

This paper is supported by the National Natural Science Foundation of China and other research grants (Grant Nos. 42301535, 61673017, and 2025-QYCX-ZD-02-009).

Data Availability Statement

The data that have been used are confidential.

Conflicts of Interest

The authors declare no conflicts of interest.

References

  1. Mozaffari, M.; Saad, W.; Bennis, M.; Nam, Y.H.; Debbah, M. A Tutorial on UAVs for Wireless Networks: Applications, Challenges, and Open Problems. IEEE Commun. Surv. Tutor. 2019, 21, 3. [Google Scholar] [CrossRef] [Scilit]
  2. Maddikunta, P.K.R.; Hakak, S.; Alazab, M.; Bhattacharya, S.; Gadekallu, T.R.; Khan, W.Z.; Pham, Q.V. Unmanned Aerial Vehicles in Smart Agriculture: Applications, Requirements, and Challenges. IEEE Sens. J. 2021, 21, 17608–17619. [Google Scholar] [CrossRef] [Scilit]
  3. Granados-Bolaños, S.; Quesada-Román, A.; Alvarado, G.E. Low-cost UAV applications in dynamic tropical volcanic landforms. J. Volcanol. Geotherm. Res. 2021, 410, 107143. [Google Scholar] [CrossRef] [Scilit]
  4. Lin, H.Y.; Zhan, J.R. GNSS-denied UAV indoor navigation with UWB incorporated visual inertial odometry. Measurement 2023, 206, 112256. [Google Scholar] [CrossRef] [Scilit]
  5. Elamin, A.; El-Rabbany, A.; Jacob, S. Event-Based Visual/Inertial Odometry for UAV Indoor Navigation. Sensors 2025, 25, 61. [Google Scholar] [CrossRef] [Scilit] [PubMed]
  6. Cao, Y.; Ren, K.; Chen, Q. Template matching based on convolution neural network for UAV visual localization. Optik 2023, 283, 170920. [Google Scholar] [CrossRef] [Scilit]
  7. Couturier, A.; Akhloufi, M.A. A review on absolute visual localization for UAV. Robot. Auton. Syst. 2021, 135, 103666. [Google Scholar] [CrossRef] [Scilit]
  8. Lindeberg, T. Scale Invariant Feature Transform. Scholarpedia 2012, 7, 10491. [Google Scholar] [CrossRef] [Scilit]
  9. Rublee, E.; Rabaud, V.; Konolige, K.; Bradski, G. ORB: An efficient alternative to SIFT or SURF. In Proceedings of the 2011 International Conference on Computer Vision, Barcelona, Spain, 6–13 November 2011; IEEE: New York, NY, USA, 2012; pp. 2564–2571. [Google Scholar] [CrossRef] [Scilit]
  10. Hisham, M.B.; Yaakob, S.N.; Raof, R.A.A.; Nazren, A.A.; Wafi, N.M. Template Matching using Sum of Squared Difference and Normalized Cross Correlation. In Proceedings of the 2015 IEEE Student Conference on Research and Development (SCOReD), Kuala Lumpur, Malaysia, 13–14 December 2015; IEEE: New York, NY, USA, 2015; pp. 100–104. [Google Scholar] [CrossRef] [Scilit]
  11. Hu, S.; Feng, M.; Nguyen, R.M.; Lee, G.H. CVM-Net: Cross-View Matching Network for Image-Based Ground-to-Aerial Geo-Localization. In Proceedings of the 2018 IEEE/CVF Conference on Computer Vision and Pattern Recognition, Salt Lake City, UT, USA, 18–23 June 2018; IEEE: New York, NY, USA, 2018; pp. 7258–7267. [Google Scholar] [CrossRef] [Scilit]
  12. Wang, T.; Zheng, Z.; Yan, C.; Zhang, J.; Sun, Y.; Zheng, B.; Yang, Y. Each Part Matters: Local Patterns Facilitate Cross-View Geo-Localization. IEEE Trans. Circuits Syst. Video Technol. 2022, 32, 867–879. [Google Scholar] [CrossRef] [Scilit]
  13. Di, Y.; Jiang, C.; Li, C.; Wang, X.; Su, Z.; Chen, S.; Liu, Z.; Wu, X.; Chen, Y. A UAV location method based on aerial-satellite image matching and factor graph optimization in GNSS-denied area. Meas. Sci. Technol. 2025, 36, 116302. [Google Scholar] [CrossRef] [Scilit]
  14. Wu, R.; Deng, J.; Mou, M.; He, X.; Zhang, M.; Liu, Y.; Yan, S. UAV-GeoLoc: A Large-Vocabulary Dataset and Geometry-Transformed Method for UAV Geo-Localization. IEEE Robot. Autom. Lett. 2025, 10, 8978–8985. [Google Scholar] [CrossRef] [Scilit]
  15. Yao, F.; Lan, C.; Wang, L.; Wan, H.; Gao, T.; Wei, Z. GNSS-denied geolocalization of UAVs using terrain-weighted constraint optimization. Int. J. Appl. Earth Obs. Geoinf. 2024, 135, 104277. [Google Scholar] [CrossRef] [Scilit]
  16. Liang, S.; Zhang, Y.; Tian, R.; Zhu, D.; Yang, L.; Cao, Z. SemLoc: Accurate and Robust Visual Localization with Semantic and Structural Constraints from Prior Maps. In Proceedings of the 2022 International Conference on Robotics and Automation (ICRA), Philadelphia, PA, USA, 23–27 May 2022; IEEE: New York, NY, USA, 2022; pp. 4135–4141. [Google Scholar] [CrossRef] [Scilit]
  17. Yue, P.; Xin, J.; Zhang, Y.; Lu, Y.; Shan, M. Semantic-Driven Autonomous Visual Navigation for Unmanned Aerial Vehicles. IEEE Trans. Ind. Electron. 2024, 71, 14853–14863. [Google Scholar] [CrossRef] [Scilit]
  18. Ren, Y.; Liu, Y.; Huang, Z.; Liu, W.; Wang, W. 2chADCNN: A Template Matching Network for Season-Changing UAV Aerial Images and Satellite Imagery. Drones 2023, 7, 558. [Google Scholar] [CrossRef] [Scilit]
  19. Zhang, X.; Zhou, X.; Chen, M.; Lu, Y.; Yang, X.; Liu, Z. Hierarchical Image Matching for UAV Absolute Visual Localization via Semantic and Structural Constraints. arXiv 2025, arXiv:2506.09748. [Google Scholar] [CrossRef] [Scilit]
  20. He, J.; Wu, Q. A Localization Method for UAV Aerial Images Based on Semantic Topological Feature Matching. Remote Sens. 2025, 17, 1671. [Google Scholar] [CrossRef] [Scilit]
  21. Li, K.; Liu, R.; Cao, X.; Bai, X.; Zhou, F.; Meng, D.; Wang, Z. SegEarth-OV: Towards Training-Free Open-Vocabulary Segmentation for Remote Sensing Images. In Proceedings of the IEEE/CVF Conference on Computer Vision and Pattern Recognition, Nashville, TN, USA, 10–17 June 2025; IEEE: New York, NY, USA, 2025; pp. 10545–10556. [Google Scholar]
  22. DeTone, D.; Malisiewicz, T.; Rabinovich, A. Superpoint: Self-Supervised Interest Point Detection and Description. In Proceedings of the Conference on Computer Vision and Pattern Recognition Workshops (CVPRW), Salt Lake City, UT, USA, 18–22 June 2018; IEEE: New York, NY, USA, 2018. [Google Scholar]
  23. Sarlin, P.-E.; DeTone, D.; Malisiewicz, T.; Rabinovich, A. Superglue: Learning Feature Matching with Graph Neural Networks. In Proceedings of the Conference on Computer Vision and Pattern Recognition (CVPR), Seattle, WA, USA, 13–19 June 2020; IEEE: New York, NY, USA, 2020; pp. 4938–4947. [Google Scholar]
  24. Luo, Z.; Shen, T.; Zhou, L.; Zhu, S.; Zhang, R.; Yao, Y.; Fang, T.; Quan, L. ASLFeat: Learning Local Features of Accurate Shape and Localization. In Proceedings of the Conference on Computer Vision and Pattern Recognition (CVPR), Seattle, WA, USA, 13–19 June 2020; IEEE: New York, NY, USA, 2020; pp. 6589–6598. [Google Scholar]
  25. Sun, J.; Shen, Z.; Wang, Y.; Bao, H.; Zhou, X. LoFTR: Detector-Free Local Feature Matching with Transformers. In Proceedings of the Conference on Computer Vision and Pattern Recognition (CVPR), Nashville, TN, USA, 20–25 June 2021; IEEE: New York, NY, USA, 2021; pp. 8922–8931. [Google Scholar]
  26. Wang, Y.F.; He, X.Y.; Peng, S.D.; Tan, D.L.; Zhou, X.W. Efficient LoFTR: Semi-Dense Local Feature Matching with Sparse-Like Speed. In Proceedings of the Conference on Computer Vision and Pattern Recognition (CVPR), Seattle, WA, USA, 16–22 June 2024; IEEE: New York, NY, USA, 2024. [Google Scholar]
  27. Xu, W.; Yao, Y.; Cao, J.; Wei, Z.; Liu, C.; Wang, J.; Peng, M. UAV-VisLoc: A Large-scale Dataset for UAV Visual Localization. arXiv 2024, arXiv:2405.11936. [Google Scholar]
Figure 1. Basic framework of SemGeoFrame.
Remotesensing 18 01267 g001
Figure 2. Semantic confidence generation process.
Remotesensing 18 01267 g002
Figure 3. Three-dimensional schematic diagram of semantic confidence. (a) Schematic diagram of the confidence of Frame_0257. (b) Schematic diagram of the confidence of Frame_0276.
Remotesensing 18 01267 g003
Figure 4. Sample image pairs from the self-collected dataset. (a) Frame_0108. (b) Frame_0142. (c) Frame_0384.
Remotesensing 18 01267 g004
Figure 5. UAV-VisLoc public dataset sample image pair. (a) 01_0016. (b) 08_0296. (c) 11_0043.
Remotesensing 18 01267 g005
Figure 6. Semantic segmentation results of two representative image pairs. (a) Frame_0108. (b) Frame_0142.
Remotesensing 18 01267 g006
Figure 7. Comparison before and after semantic consistency screening. (Red lines: erroneous initial matches; green lines: reliable matches after screening).
Remotesensing 18 01267 g007
Figure 8. Schematic diagram of spatial uniform sampling based on semantic prior. (Orange dots are the initial dense matching points, blue dots represent the complete set of matches retained after our sampling strategy, and purple arrows illustrate example correspondences between matched pairs for cross-image reference).
Remotesensing 18 01267 g008
Figure 9. Error comparison of the five methods.
Remotesensing 18 01267 g009
Figure 10. Example of the semantic segmentation degradation effect. (a) Original UAV image. (b) Original semantic segmentation of the UAV image. (c) Degraded semantic segmentation of the UAV image. (d) Original satellite images. (e) Original semantic segmentation of satellite images. (f) Degraded semantic segmentation of satellite images.
Remotesensing 18 01267 g010aRemotesensing 18 01267 g010b
Table 1. Image matching algorithms used to verify the framework of this paper.
AlgorithmAlgorithm TypeKey Characteristics
ORBTraditional Feature-BasedVery fast; suitable for real-time systems; no training required
SuperPoint+SuperGlueDeep Learning MatchingHigh accuracy; robust to illumination/viewpoint changes; computationally intensive
ASLFeatAdaptive Feature LearningDeformable convolution with adaptive scale selection; strong generalization
LoFTRTransformer-Based MatchingGlobal feature matching with Transformer; robust to texture-less regions
Efficient LoFTRTransformer-Based MatchingAbout 2.5 times faster than LoFTR; higher accuracy; suitable for real-time/large-scale application
Table 2. Correspondence between semantic categories, actual accuracy rankings, and discretized confidence scores.
Semantic CategoryStatistical ConfidenceActual Accuracy RankDiscretized Confidence
background0.089660.03125
bareland0.000070.015625
grass0.000070.015625
pavement0.160250.0625
road0.178730.25
forest0.000070.015625
water0.192320.5
cropland0.168840.125
building0.210411
Table 3. Error comparison of the five methods on the self-collected dataset.
Methods ϵ x y / m
MinMaxAvgStd
ORB8.26111.5669.42238.17
ORB+SemGeo7.1242.7331.2812.60
SuperPoint+SuperGlue3.8818.2413.663.16
SuperPoint+SuperGlue+SemGeo3.4515.6211.732.74
ASLFeat4.1317.4711.822.75
ASLFeat+SemGeo3.7214.8610.052.34
LoFTR3.5814.319.861.83
LoFTR+SemGeo3.2112.048.371.52
Efficient LoFTR3.5314.169.821.80
Efficient LoFTR+SemGeo3.1511.908.351.51
Table 4. Positioning error pair under different parameter configurations.
δ ϵ x y / m
0.414.24
0.512.47
0.611.12
0.79.86
0.812.53
0.915.89
Table 5. Comparison of experimental results under different parameters.
ConsistencyUniformity#Matched e x y / m
××73115.17
×51812.53
×37311.26
2169.86
Table 6. Error comparison of five methods on the UAV-VisLoc dataset.
Methods ϵ x y / m
MinMaxAvgStd
ORB5.8988.2553.1229.21
ORB+SemGeo4.4266.1939.8421.91
SuperPoint+SuperGlue2.8014.028.272.36
SuperPoint+SuperGlue+SemGeo2.6112.937.602.12
ASLFeat3.1413.589.272.11
ASLFeat+SemGeo2.8912.498.531.94
LoFTR2.9514.558.512.49
LoFTR+SemGeo2.7313.427.722.20
Efficient LoFTR2.9214.308.452.38
Efficient LoFTR+SemGeo2.6813.207.752.72
Table 7. Comparison of matching errors under different proportions of segmentation degradation.
Degradation Level p ϵ x y / m
MinMaxAvgStd
LoFTR2.9514.558.512.49
p = 0.00 2.7313.427.722.20
p = 0.15 3.1014.808.602.55
p = 0.30 3.6016.509.803.07
Table 8. Computational cost analysis.
ModuleTime (ms)
SegEarth-OV front-end UAV image segmentation1275
Efficient LoFTR matching92.0
Semantic consistency screening16.5
Prior-based spatial uniform sampling1.2
Homography matrix solving0.7
Total for semantic guidance core logic18.4
Overall pipeline latency≈1385
Disclaimer/Publisher’s Note: The statements, opinions and data contained in all publications are solely those of the individual author(s) and contributor(s) and not of MDPI and/or the editor(s). MDPI and/or the editor(s) disclaim responsibility for any injury to people or property resulting from any ideas, methods, instructions or products referred to in the content.