


Highlights
What are the main findings?
- Data augmentation significantly improves building extraction under cross-domain conditions, increasing mIoU by up to 20% when training data are limited.
- Geometric augmentation consistently outperforms radiometric and occlusion transforms, indicating that structural invariance plays a dominant role in building segmentation robustness.
What are the implications of the main findings?
- Augmented datasets using only 20% of training samples can outperform models trained on the full non-augmented dataset under resolution and geographic shifts.
- Data-centric strategies can reduce annotation requirements and improve cross-region transferability for high-resolution urban mapping.
Abstract
Automatic building extraction from high-resolution imagery remains constrained by limited training data and domain shifts across geographic regions and spatial resolutions. Although data augmentation is widely applied in semantic segmentation, its capacity to compensate for scarce labeled samples under varying domain conditions remains insufficiently quantified in remotely sensed data. Here, we present a controlled data-centric evaluation to quantify how explicit, label-preserving augmentation influences model generalization under varying domain shifts, rather than proposing a new augmentation algorithm. The experimental design integrates DeepLabV3+ (CNN) and SegFormer (transformer) architectures to assess whether augmentation effects persist across distinct feature-learning paradigms. Four scenarios are constructed, including two intra-domain settings, a resolution shift (0.3 m to 0.1 m), and a geographic shift across heterogeneous urban environments. Training subsets are progressively sampled from 20% to 100% to isolate the interaction between data volume and distributional variability. Geometric, radiometric, and occlusion-based transformations are evaluated individually and in combination. Under cross-domain and low-data regimes, augmentation substantially increases predictive performance. Combined transformations increase mIoU from 0.572 to 0.688 at 20% training data in the resolution shift scenario, while geometric augmentation improves mIoU from 0.444 to 0.533 under geographic transfer. Models trained on 20% augmented data exceed the performance of 100% non-augmented configurations under pronounced domain discrepancies, establishing an operational threshold of data efficiency. Computational analysis indicates negligible overhead (approximately 1 s per epoch) through asynchronous data pipelines. Augmentation functions as a regularization mechanism in intra-domain settings and transitions to a distribution bridging mechanism under cross-domain conditions. Geometric invariance and engineered data diversity partially substitute for manual annotation, enabling improved cross-domain building extraction performance.
1. Introduction
High-resolution remote sensing imagery plays a central role in urban monitoring, infrastructure assessment, and digital city modeling [1,2,3]. Building extraction from such imagery provides a foundational layer for land use/land cover analysis, disaster response, and spatial planning [4]. Deep learning architectures have substantially improved semantic segmentation accuracy [5], yet segmentation performance remains highly dependent on large volumes of accurately annotated data [6]. In operational unmanned aerial vehicle (UAV) and aerial mapping workflows, annotation effort frequently becomes the dominant constraint [7,8]. Limited geographic diversity in training samples often results in discrepancies between training and deployment environments, leading to overfitting and reduced transferability across regions and sensor resolutions [9,10]. Data scarcity, therefore, constrains the scalability and transferability of building extraction in applied Earth observation.
Methodological progress in remote sensing has traditionally emphasized architectural refinement, including deeper networks and multi-scale feature integration. Recent developments in data-centric artificial intelligence suggest that improvements in data quality and representativeness may influence performance as strongly as architectural modifications [11,12]. Within this perspective, multiple strategies have emerged to address data limitations. Generative approaches, such as Generative Adversarial Networks (GAN)-based synthesis, aim to expand distributional support through learned image generation [9,13,14]. Interactive segmentation methods, including Adaptive-Radius Encoding Networks (ARE-Net), address data scarcity by reducing annotation effort through human-in-the-loop optimization of user input [15]. These approaches target different stages of the learning pipeline, either by increasing data diversity or by improving label acquisition efficiency, but often introduce additional model complexity or workflow dependencies.
Data augmentation provides a complementary strategy that operates directly on existing annotated data. Geometric, radiometric, and occlusion-based transformations introduce controlled variability during training while preserving label consistency, structural integrity, and embedded spatial knowledge of object geometry [16,17]. Unlike generative approaches, augmentation does not require additional model training, and unlike interactive methods, it does not depend on human intervention during data preparation. In building extraction, where rectilinear geometry and boundary continuity define object identity, preservation of structural invariants is critical. These invariants encode domain-specific knowledge of built environments and guide the model toward physically consistent representations. Augmentation, therefore, functions as a controlled mechanism for expanding distributional support while preserving domain-specific structural invariants.
Performance degradation under resolution shifts and geographic variability reflects distributional misalignment between training and deployment conditions, indicating insufficient coverage of structural and spectral variability in the training data [18,19]. Introducing structured perturbations may partially reduce this misalignment by broadening the range of plausible structural configurations encountered during training. Despite this conceptual implication, most remote sensing studies evaluate augmentation within single datasets or under fixed training scales. Comparative analysis across intra-domain settings, resolution shifts, and geographic differences remains limited [20,21]. Augmentation is frequently characterized as a regularization technique, yet its role in mediating domain discrepancies has not been systematically quantified [22]. Interaction between network capacity and augmentation-induced diversity also remains insufficiently examined under incremental data regimes. In addition, no operational criterion has been established to determine when augmented sparse data can achieve performance comparable to or exceeding larger non-augmented datasets [17,23]. Existing studies also rarely isolate dominant sources of domain shift (e.g., resolution versus geographic variability), limiting attribution of performance changes to specific factors.
The present study addresses these gaps through a controlled and comparative evaluation of augmentation under multiple types of distribution shift. Four experimental conditions are examined: two intra-domain tasks, one resolution shift task, and one geographic shift task. Although domain shift is inherently multi-dimensional, the experimental design isolates dominant sources of variation, where the resolution shift scenario emphasizes spatial scale differences and the geographic shift scenario captures variation in architectural morphology and spectral characteristics. Training subsets are incrementally sampled from 20% to 100% to isolate the interaction between data volume and augmentation-induced diversity. Rather than reporting absolute accuracy improvements alone, the analysis introduces performance parity between sparse augmented data and full non-augmented data as a measurable indicator of label-substitution capacity. To ensure the generalizability of our findings, we validate the results across both DeepLabV3+ (CNN) and SegFormer (transformer) architectures. The study is designed as a controlled data-focused evaluation rather than a methodological innovation, quantifying how far explicit, label-preserving augmentation alone can reduce domain discrepancies before applying more complex adaptation strategies.
Three research questions guide the study: (i) How does explicit augmentation influence segmentation performance under different domain shift types? (ii) How does network depth interact with augmentation-induced diversity across incremental training scales? (iii) At what training proportion can augmented data achieve performance comparable to or exceeding full non-augmented datasets? These questions are sequentially structured, progressing from performance evaluation (RQ1) to model–data interaction (RQ2), and to operational thresholds for data efficiency (RQ3). By integrating multi-domain evaluation with incremental data sampling, the study provides quantitative evidence on how controlled augmentation reshapes empirical training distributions and contributes to data-efficient building extraction in high-resolution remotely sensed data.
2. Materials and Methods
2.1. Model Architecture
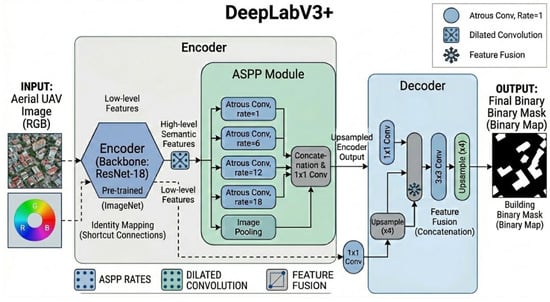
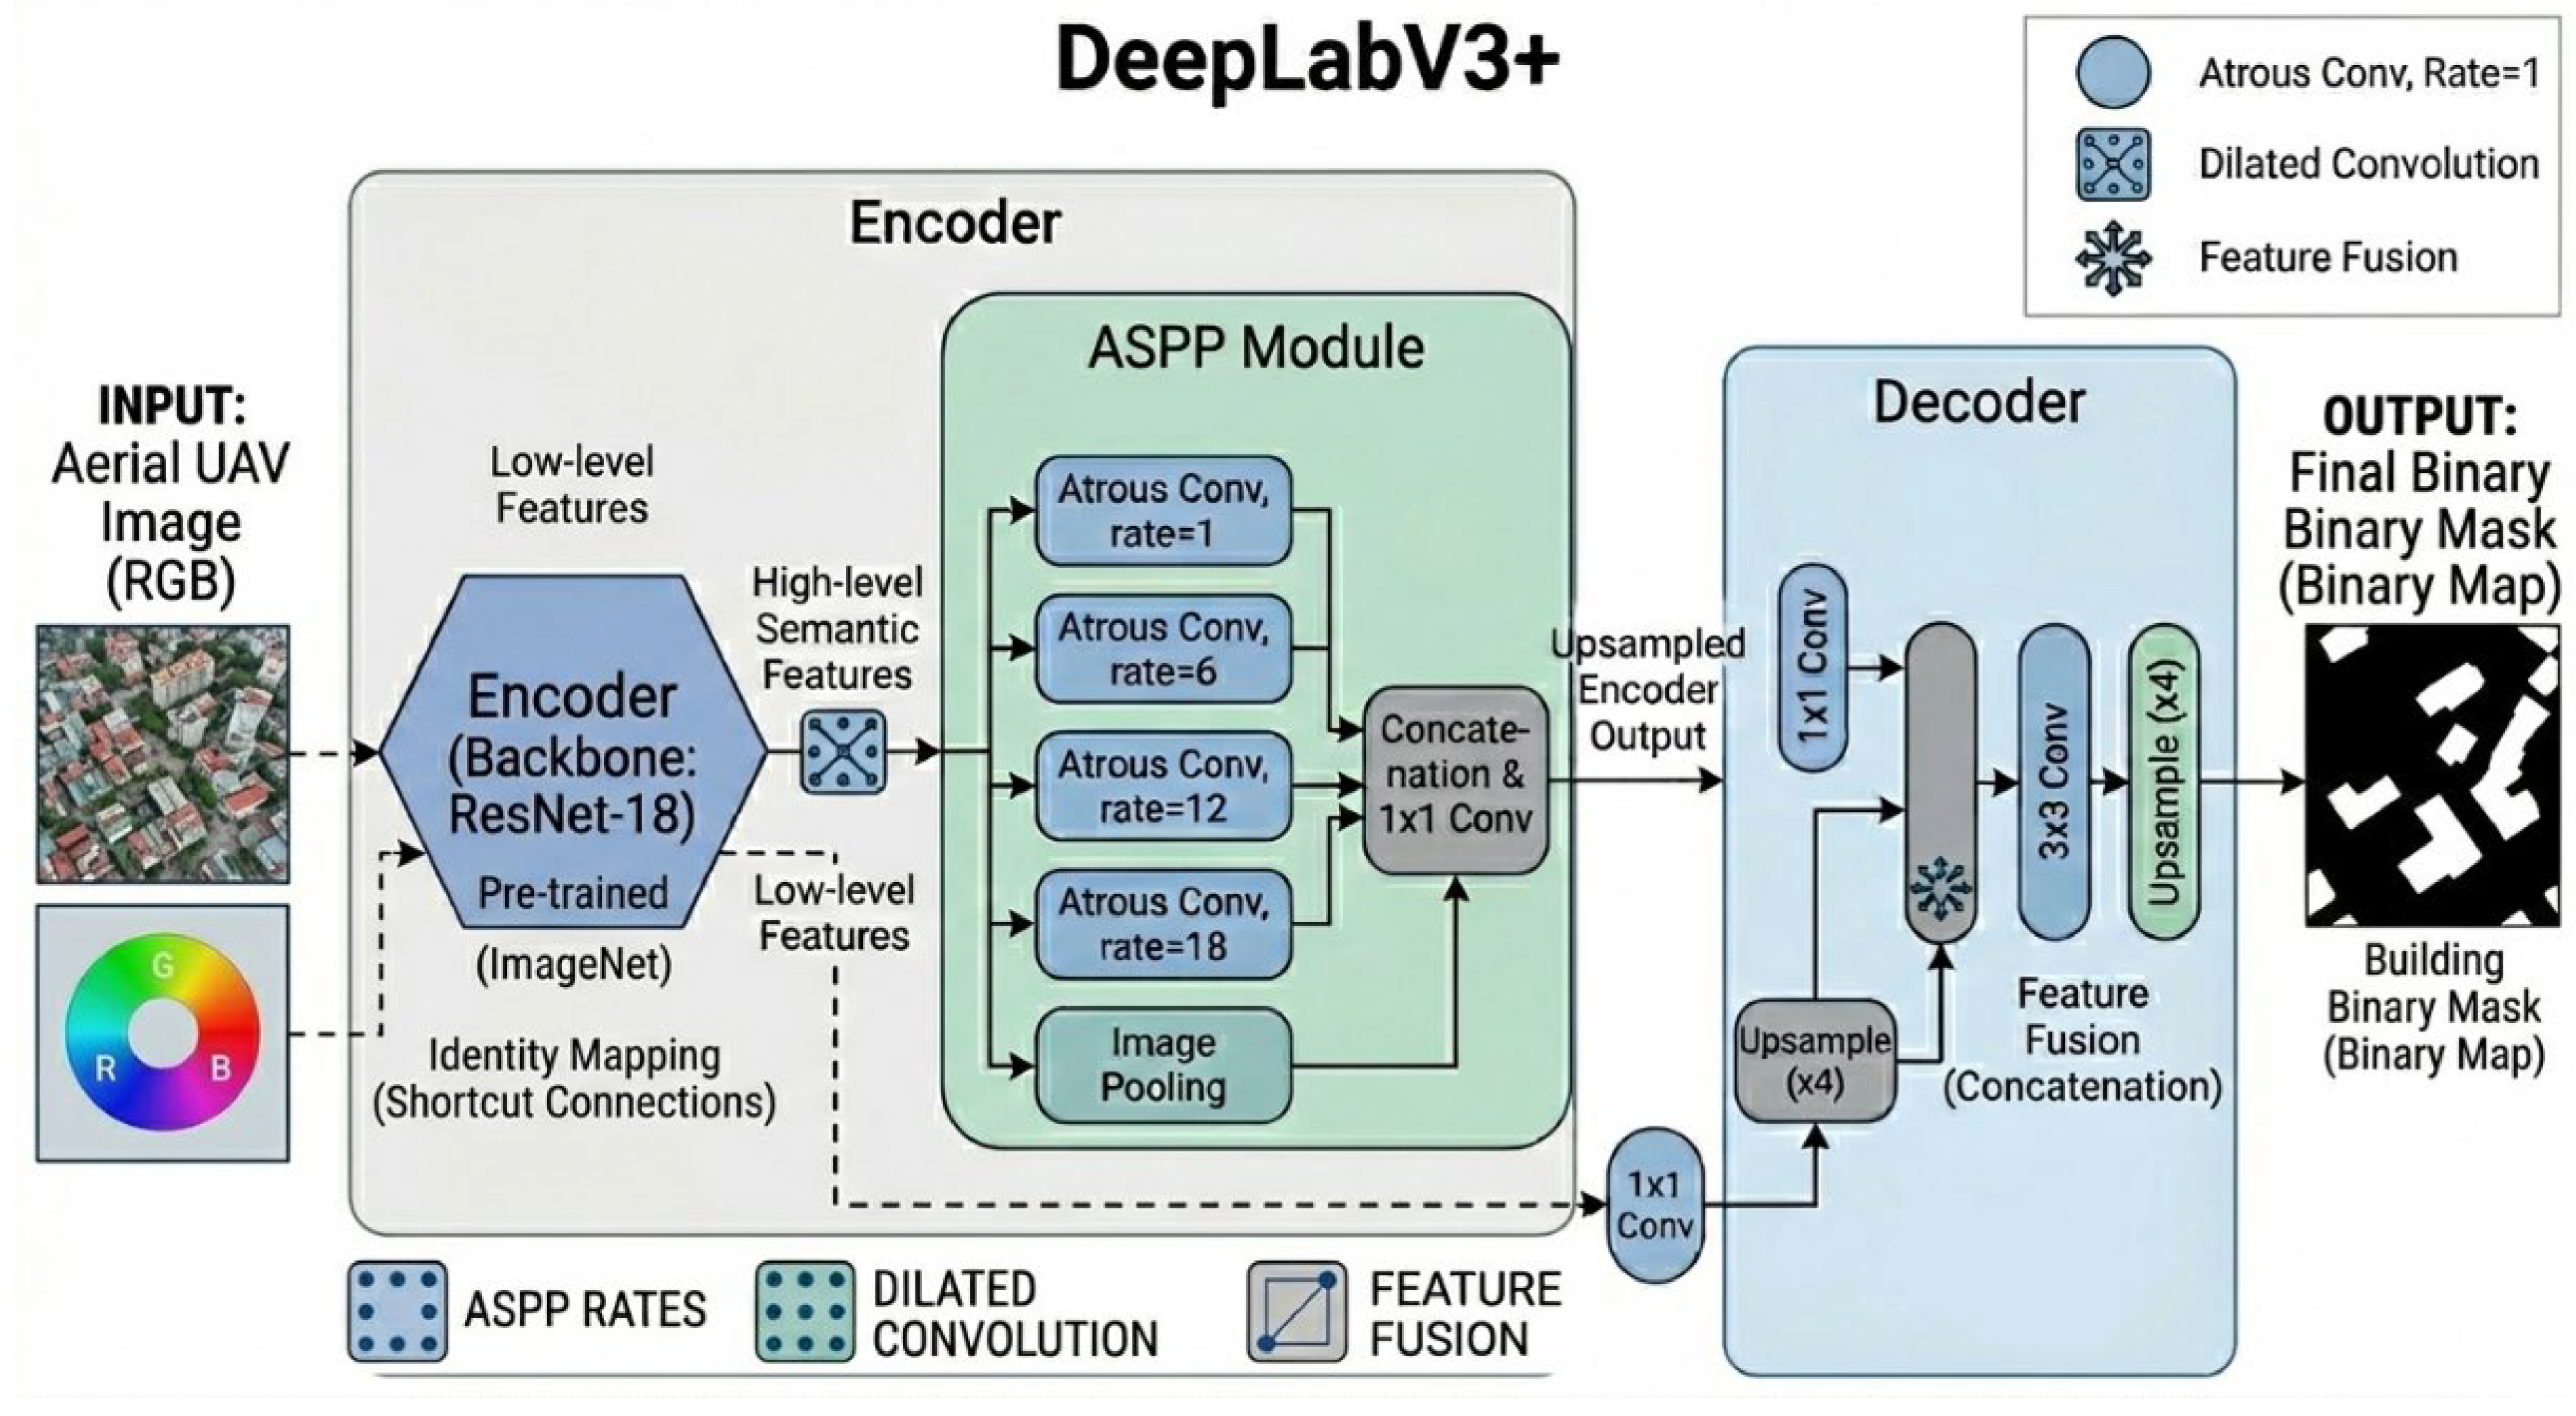
The building extraction model in this study is based on the DeepLabV3+ architecture [24], which integrates an encoder–decoder structure with Atrous Spatial Pyramid Pooling (ASPP) to capture multi-scale contextual information [25]. A widely adopted segmentation architecture is selected to minimize architectural variability and isolate the influence of training data modifications rather than model design (Figure 1). The encoder utilizes a ResNet backbone [5], specifically ResNet-18 and ResNet-152, representing shallow and deep residual configurations with contrasting model capacities. ResNet-18 provides lower parameter complexity, whereas ResNet-152 offers substantially higher representational capacity. This configuration isolates the interaction between model capacity and augmentation-induced data diversity across varying training scales.
Figure 1.
DeepLabV3+ architecture with ResNet backbone used for building extraction. The network consists of an encoder with a ResNet backbone and Atrous Spatial Pyramid Pooling (ASPP) module (1 × 1 convolution, 3 × 3 atrous convolutions with rates 1, 6, 12, and 18, and image-level pooling), followed by a decoder that integrates low-level features and performs successive up-sampling to generate the final segmentation mask.
The ASPP module enhances feature extraction through parallel atrous convolutions with multiple dilation rates, allowing contextual information to be captured at different spatial scales. The decoder recovers spatial details by fusing high-level semantic features with low-level encoder features, improving boundary delineation in dense urban environments. The final output consists of binary building masks, and segmentation performance is evaluated using Intersection over Union (IoU). Boundary-based metrics, including BF1, B-Precision, and B-Recall, are incorporated to quantify the geometric integrity and structural characteristics of building outlines, providing a complementary assessment of edge accuracy beyond area-based overlap metrics [26,27].
To assess the architectural invariance of data augmentation effects beyond convolutional neural networks (CNNs), the framework also incorporates SegFormer, a transformer-based architecture for semantic segmentation [27]. Unlike CNNs, which rely on local receptive fields and fixed convolutional kernels, SegFormer employs a hierarchical mix transformer (MiT) encoder to capture multi-scale features and long-range dependencies without positional encoding. The MiT-b0 backbone is selected to ensure computational efficiency and comparability with the ResNet-18 configuration while retaining representative transformer characteristics. The inclusion of SegFormer is intended to evaluate whether the effects of structured data augmentation are consistent across fundamentally different feature-learning mechanisms, rather than benchmark absolute model performance. This design enables an assessment of whether geometric and structural diversity can reduce domain discrepancies across both local feature extraction (CNNs) and global self-attention mechanisms (transformers).
2.2. Dataset and Experimental Scenarios
To ensure representation of diverse building morphologies and environmental conditions, we utilize four high-resolution aerial imagery datasets: Wuhan University (WHU) [6], Japan [28], Thailand [29], and a custom Hanoi University of Mining and Geology (HUMG) dataset [30]. The WHU Building Dataset consists of 8189 image patches with a 0.3 m ground sampling distance (GSD), partitioned into standard training and validation subsets [6]. The Japan and Thailand datasets contain 767 and 830 image tiles, respectively, and are incorporated to evaluate cross-geographic generalization [28,29]. The HUMG dataset, collected using unmanned aerial vehicle (UAV) imagery at 0.1 m GSD, is introduced to assess model behavior under substantial spatial resolution differences [30]. The HUMG dataset was manually annotated by trained operators following consistent building delineation guidelines [30]. A two-stage quality control protocol was applied, including independent annotation verification and cross-checking among annotators to ensure boundary consistency and label reliability. To mitigate potential evaluation bias arising from the integration of public and private datasets, strict separation between training and validation domains is enforced. In the resolution shift scenario, HUMG is used exclusively as an unseen validation domain, ensuring that no data leakage occurs between training and evaluation sets. A supplementary cross-resolution experiment was conducted using the HUMG dataset to isolate the effect of spatial resolution independent of geographic variability. The dataset includes imagery at both 10 cm and 30 cm GSD from the same geographic region, enabling controlled evaluation of resolution mismatch without confounding differences in urban morphology. Performance metrics for this experiment are reported in (Table A1).
In accordance with the data-centric AI (DCAI) pillars of training data development, four experimental scenarios are designed to evaluate augmentation under controlled domain conditions [11]. Scenario 1 (S1) and Scenario 2 (S2) are intra-domain experiments conducted independently on WHU and Japan datasets to establish reference performance under consistent geographic and sensor conditions. Scenario 3 (S3) evaluates resolution shift adaptability by training on 0.3 m WHU data and validating on 0.1 m HUMG imagery. Scenario 4 (S4) investigates geographic domain shift by training on Japanese urban data and validating on Thai imagery, where architectural patterns and spectral characteristics differ. To quantify data efficiency, training data are incrementally sampled at 20%, 40%, 60%, 80%, and 100% proportions (Table 1). This incremental design isolates the interaction between data volume and augmentation-induced diversity across all scenarios. Validation set sizes remain constant at 1036 samples for WHU and 153 samples for Japan to ensure consistent evaluation. Maintaining fixed validation sets allows performance comparison across data regimes without introducing validation bias.
Table 1.
Number of training and validation samples under incremental data proportions for the WHU and Japan building datasets. Training subsets were constructed at 20%, 40%, 60%, 80%, and 100% of the available training data, while validation set sizes remained constant for each dataset.
2.3. Systematic Data Development
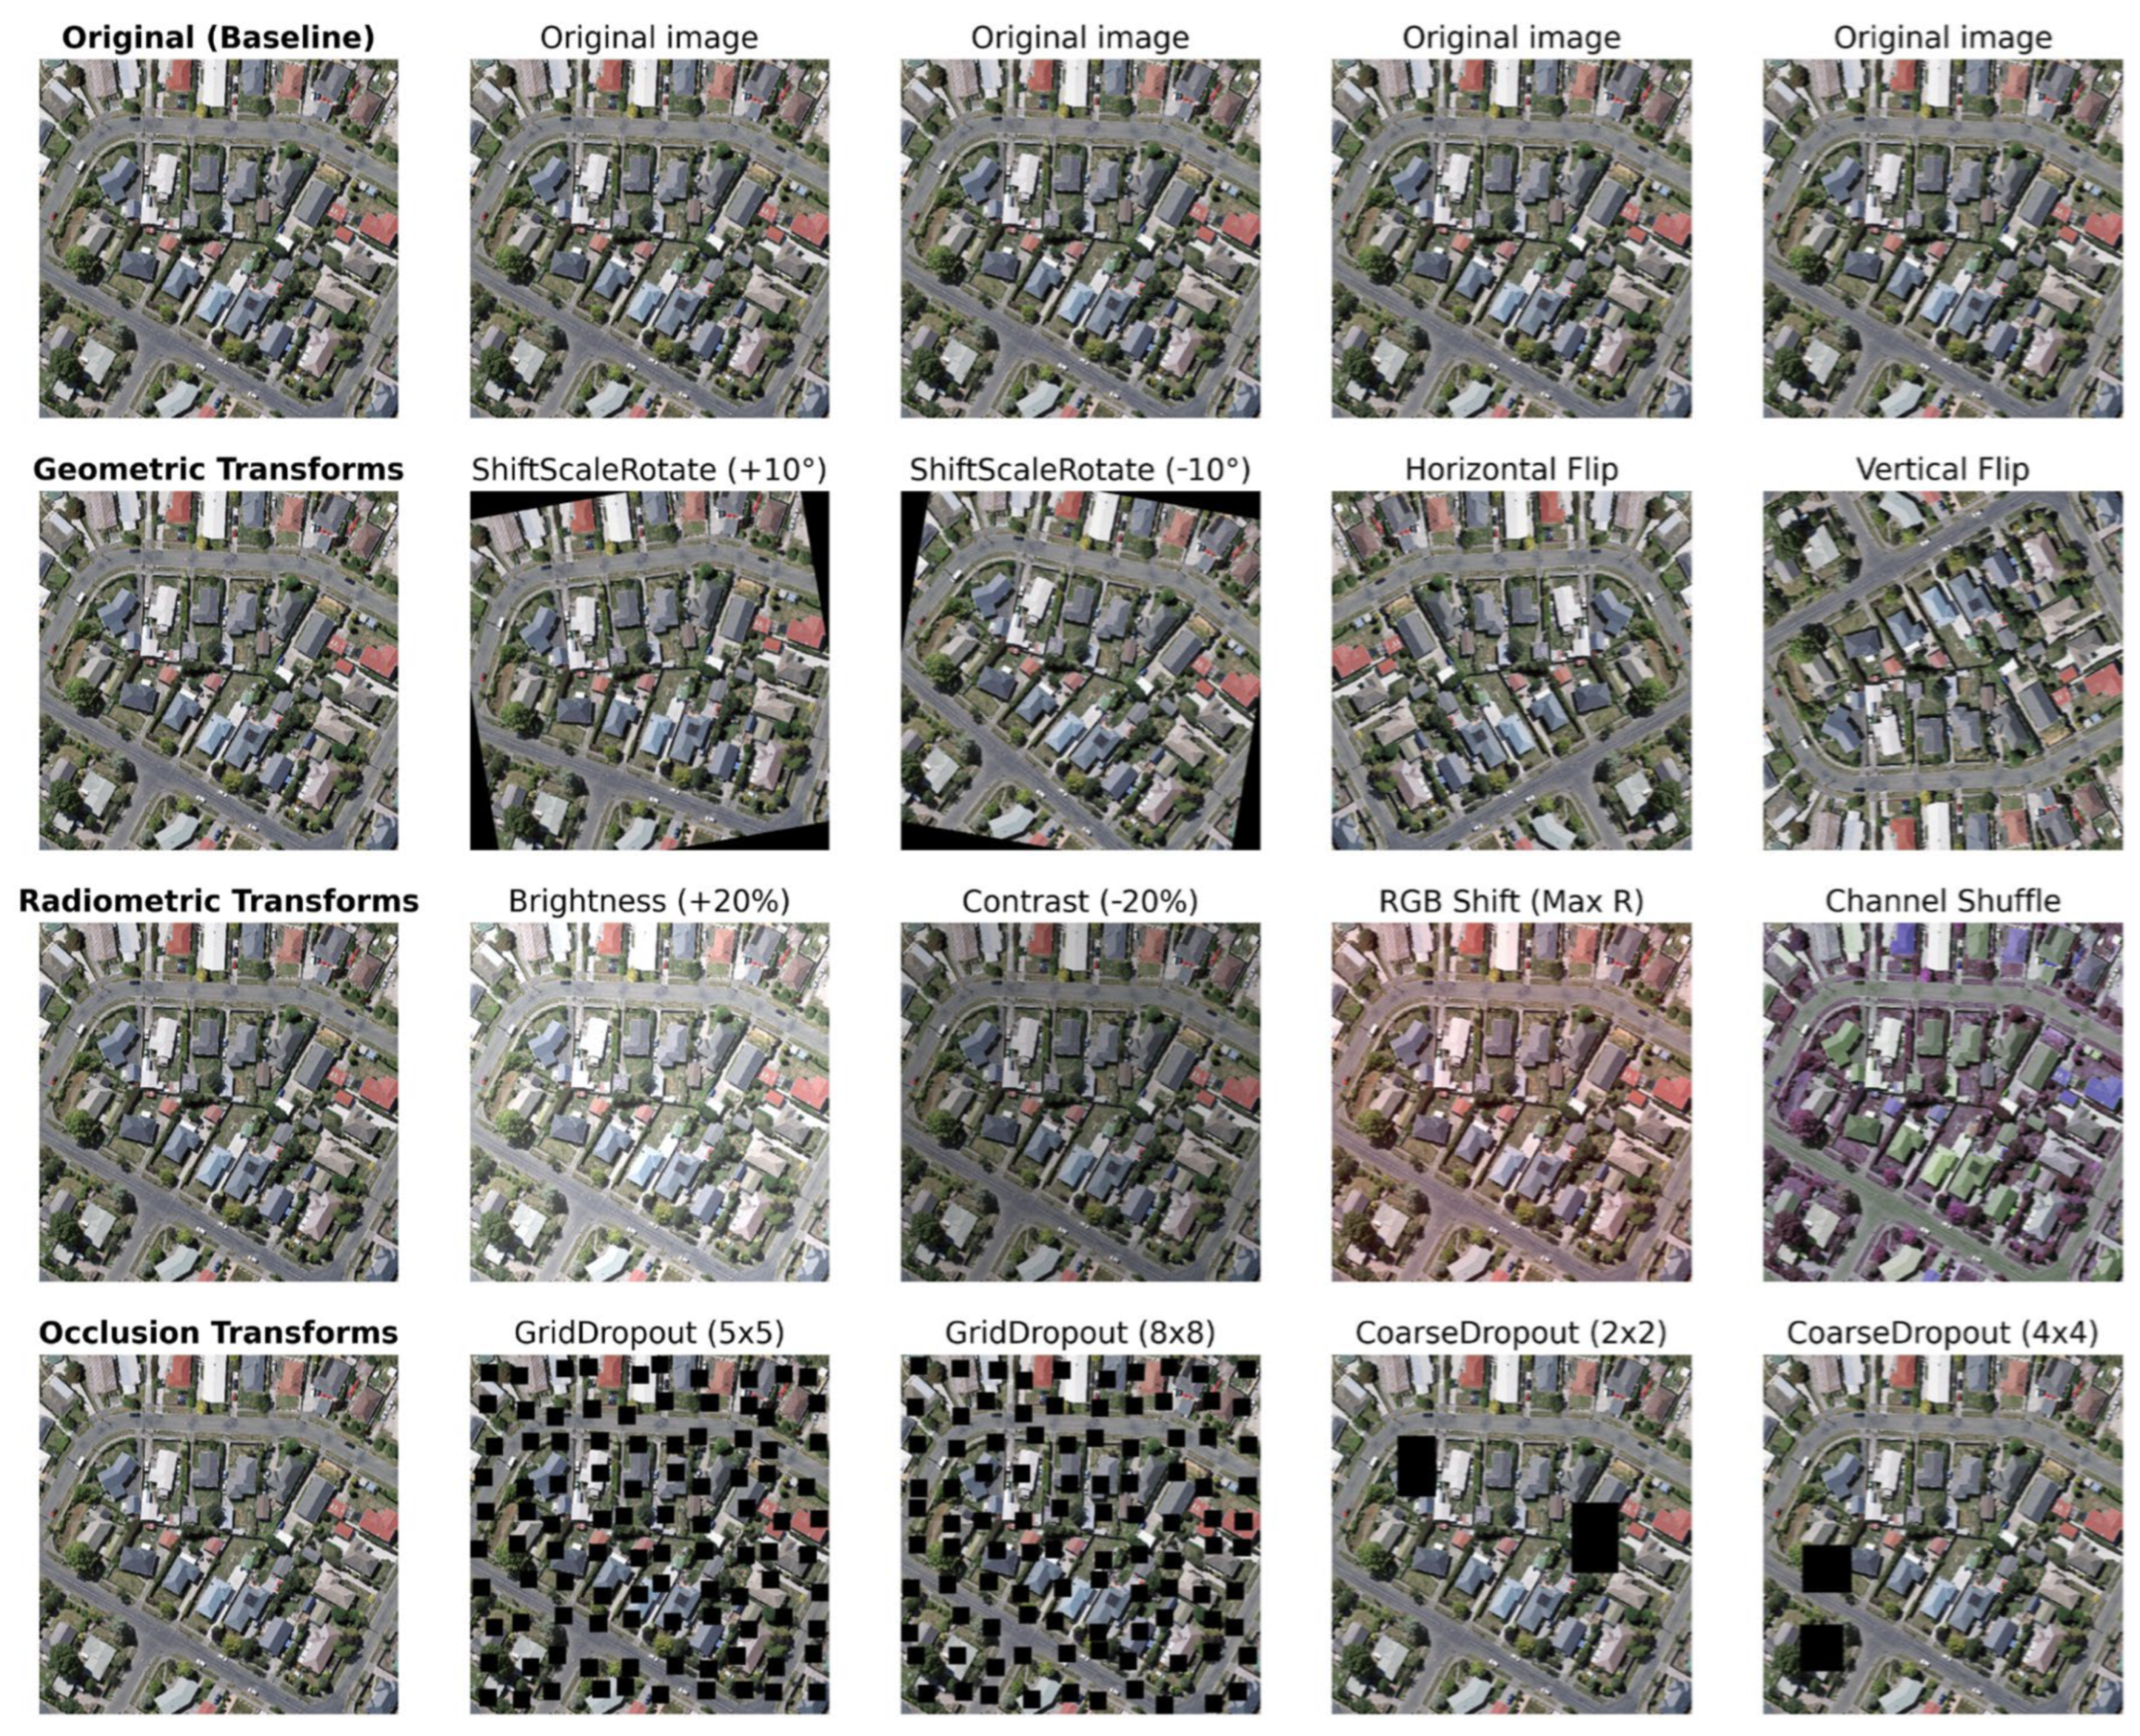
Data augmentation (DA) is implemented to increase variability within the training distribution [11]. Three categories of transformations are applied: geometric, radiometric, and occlusion-based operations (Table 2). These transformations are selected to introduce controlled variability while preserving label consistency in high-resolution building segmentation tasks. Geometric transforms include shifting, scaling, and rotation (±15°). Shifting and scaling are applied within limits of ±5% and ±10%, respectively, to simulate moderate spatial displacement and size variation. The rotation limit of ±15° is selected to introduce structural variation without distorting the dominant rectangular orientation typical of urban buildings. Horizontal and vertical flips are additionally applied with predefined probabilities. All geometric operations are applied identically to images and corresponding masks to maintain spatial alignment. Radiometric transforms are implemented through adjustments in brightness and contrast (±20%) and RGB channel shifts [31]. Brightness and contrast limits are constrained to moderate ranges to simulate illumination variability without altering rooftop–background separability. RGB shifts are applied within intensity ranges defined in Table 2 to account for sensor and atmospheric variability. Channel shuffle is introduced with low probability to increase spectral variability while preserving spatial structure. Occlusion transforms are implemented using a GridDropout mechanism with a 5 × 5 grid configuration [32,33]. Randomized spatial masking encourages the model to rely on broader structural cues rather than localized texture patterns. The mask ratio is controlled to prevent excessive information loss. Augmentation parameters are defined within constrained ranges to balance variability and physical plausibility (Table 2). Representative augmented samples are provided for visual inspection (Figure 2). Parameter selection is informed by preliminary sensitivity testing and established practice in high-resolution remote sensing applications, ensuring consistency with real-world building imagery.
Table 2.
Parameter settings and application probabilities for geometric, radiometric, and occlusion augmentation strategies. Augmentation operations were implemented using the Albumentations library. The table reports parameter names, selected value ranges, and probability of application (p) for each transformation. “N/A” denotes parameters not applicable to a given operation.
Figure 2.
Examples of geometric, radiometric, and occlusion data augmentation transformations applied to high-resolution urban imagery. The figure presents the original image and representative outputs of ShiftScaleRotate, horizontal and vertical flipping, brightness and contrast adjustments, RGB shift, channel shuffle, and dropout-based occlusion strategies (GridDropout and CoarseDropout) with different grid configurations. Black patches denote masked regions introduced by occlusion-based augmentation, simulating real-world obstructions (e.g., shadows or vegetation) and encouraging the model to learn global structural features.
2.4. Training Protocol and Analytical Framework
Training is conducted using the Adam optimizer with an initial learning rate of 1 × 10⁻⁴ [34]. A step learning rate scheduler reduces the learning rate by a factor of 0.1 every 30 epochs. The maximum number of training epochs is set to 150 to ensure convergence across all incremental data regimes. Model performance is monitored using the Jaccard Index (IoU) and binary cross-entropy loss. Early stopping with a patience of 15 epochs is applied based on validation IoU to prevent overfitting and unnecessary computation. Each experimental configuration is repeated three times using different random seeds for weight initialization and data shuffling. The reported IoU values represent mean performance with corresponding standard deviations (STDs). Standard deviation values are used to assess stability across repeated runs. Implementation details, hyperparameter settings, and calculation logs are publicly available at https://github.com/trungdungtdct/Data-augmentation/ (accessed on 26 February 2026) to support reproducibility.
In addition to reporting absolute accuracy, comparative analysis is conducted to evaluate data efficiency. Models trained on augmented subsets (e.g., 20%, 40%) are compared with non-augmented models trained at larger data proportions to identify performance parity thresholds. Performance parity is defined as the training proportion at which augmented data achieve IoU equal to or exceeding that of the full non-augmented dataset. This definition provides an operational measure of label-substitution capacity. Architectural depth effects are examined by comparing ResNet-18 and ResNet-152 backbones under identical sampling and augmentation conditions. The generalization gap is computed as the difference between training and validation IoU to quantify robustness under domain shift, with detailed training parameters and hardware configurations reported in Table 3.
Table 3.
Experimental training protocol and system configuration. The table summarizes computational hardware, data loading parameters, optimization strategy (optimizer, learning rate, scheduler), convergence controls (maximum epochs and early stopping), and performance metrics used for model evaluation.
3. Results
3.1. Quantitative Performance Analysis of Data Augmentation
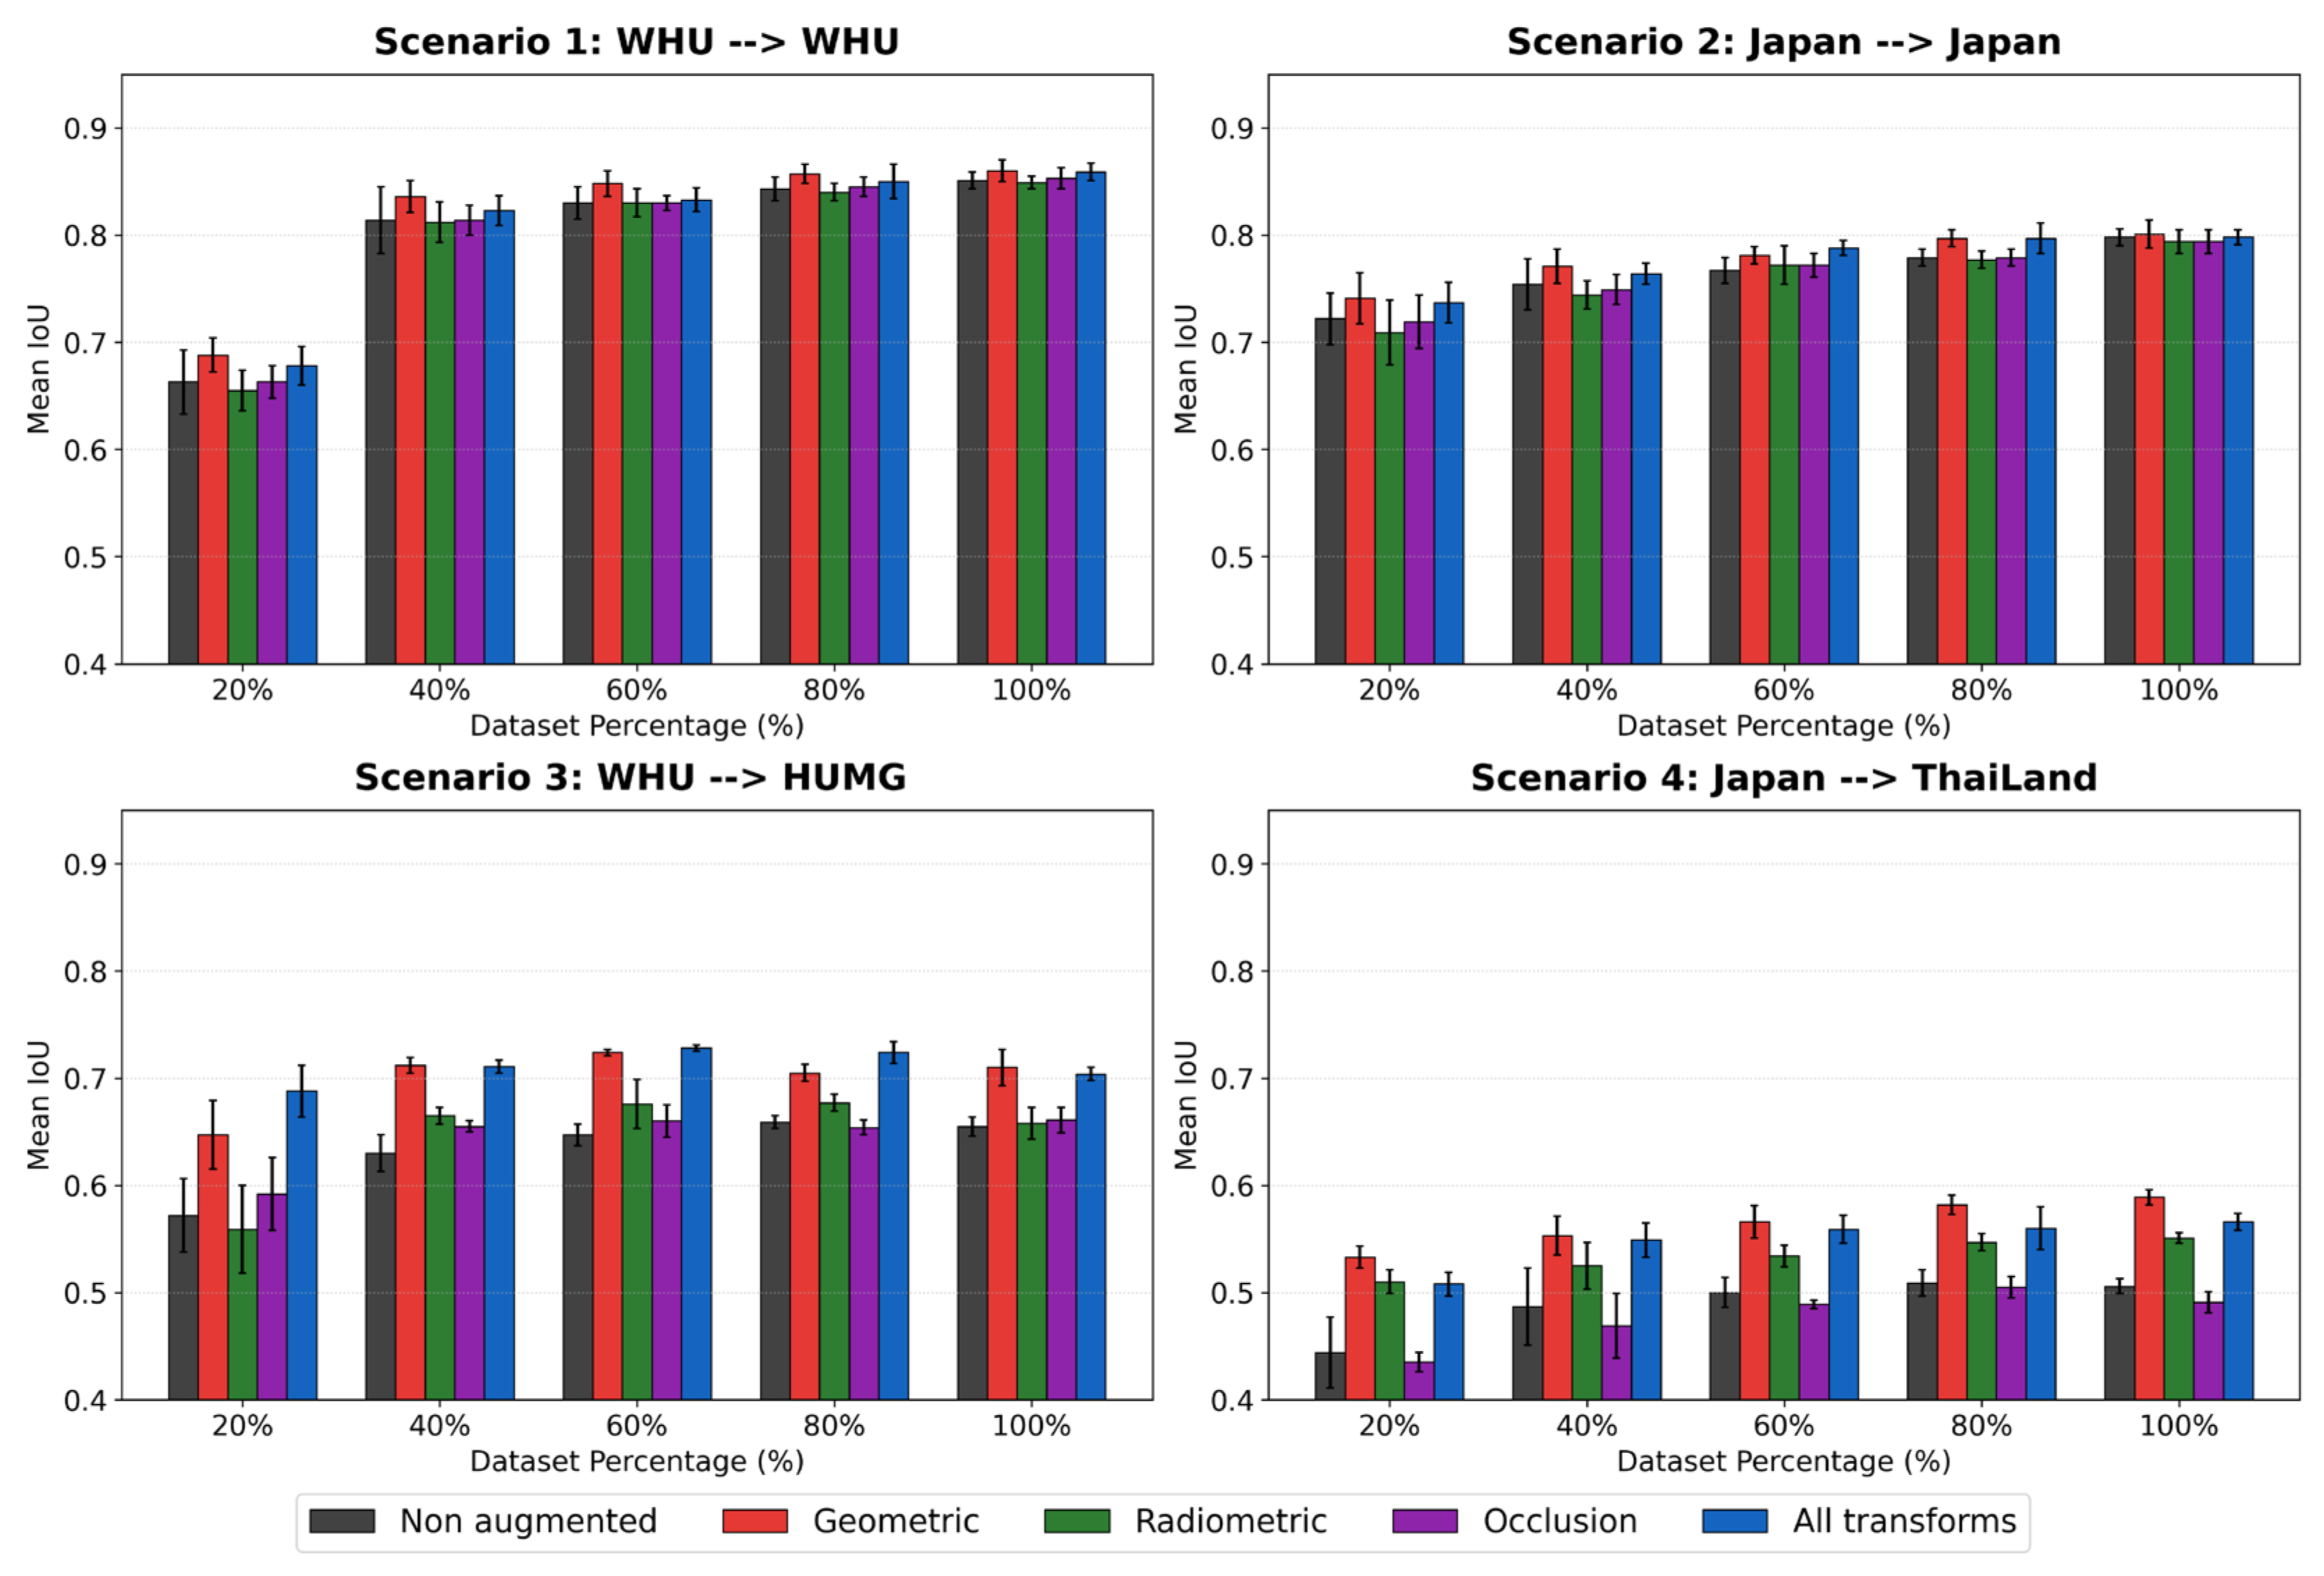
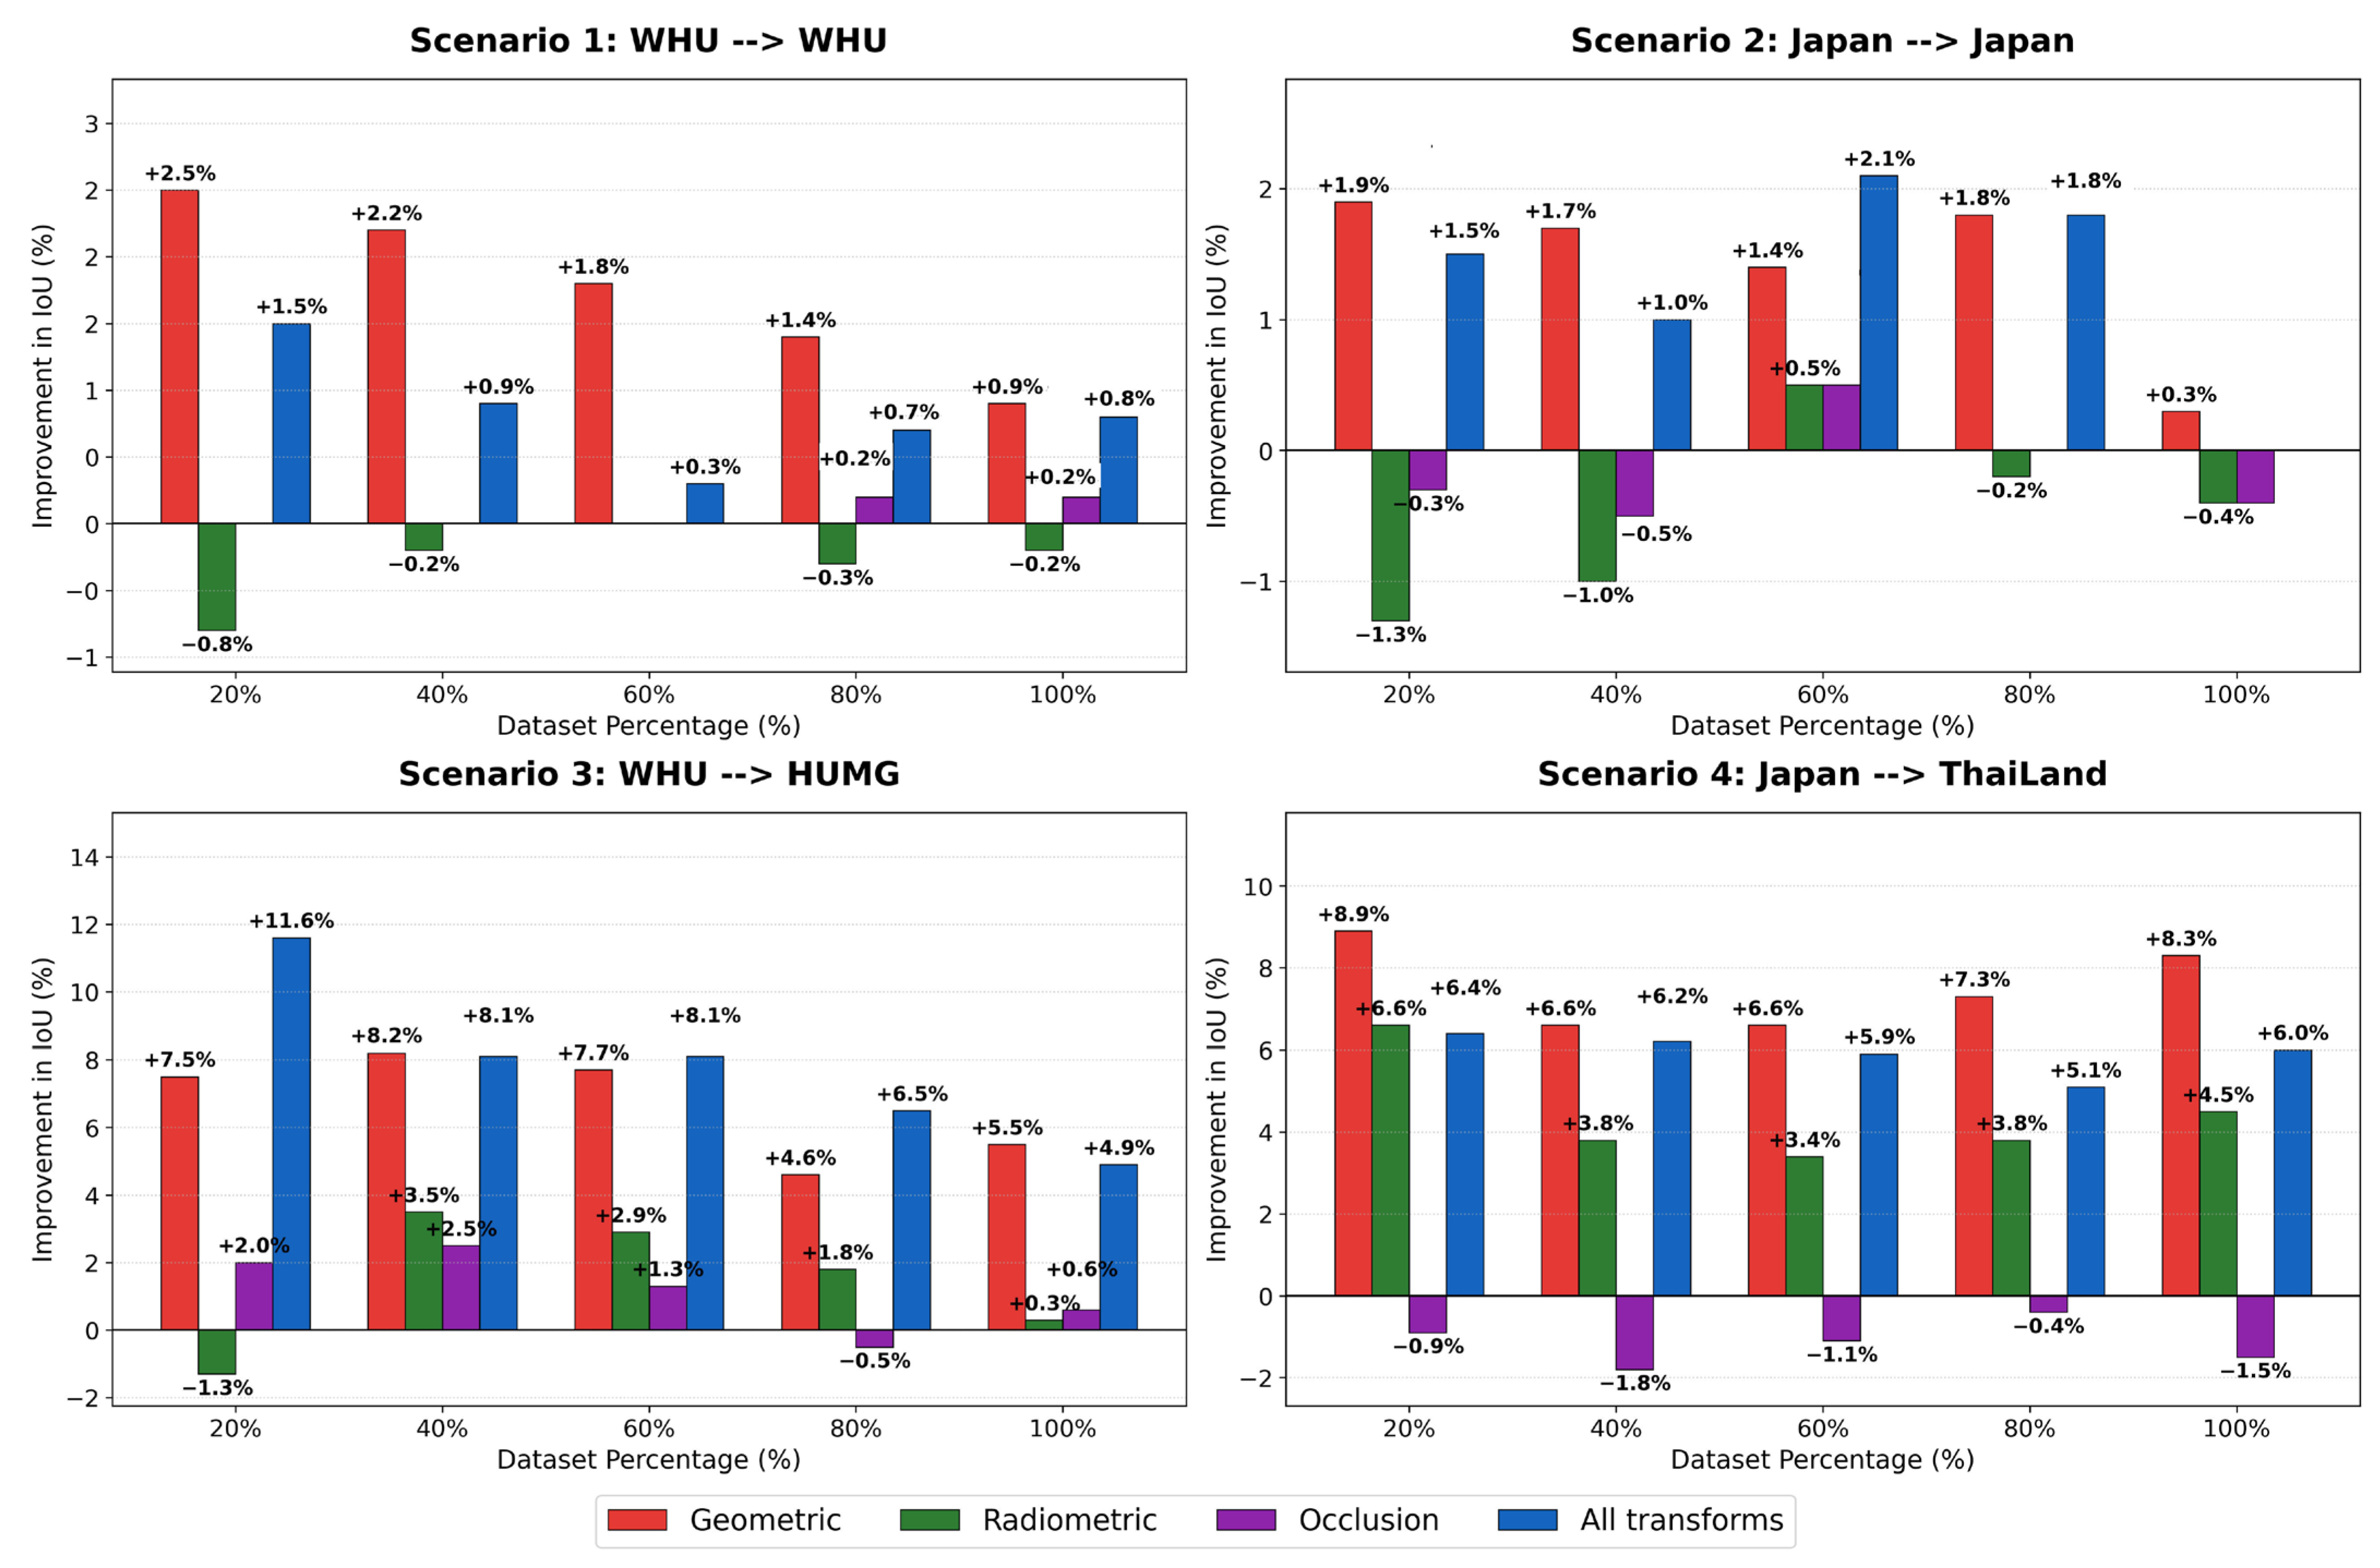
Validation performance for the ResNet-18 backbone across all scenarios at the 20% and 100% training proportions is summarized in Table 4. Detailed results for all incremental training stages (20–100%) are provided in Table A2, Table A3, Table A4 and Table A5 of the Appendix A. Absolute performance trends across increasing dataset proportions are illustrated in Figure 3, with relative improvements compared with the non-augmented baseline shown in Figure 4. Across all scenarios, data augmentation improves segmentation performance relative to the non-augmented baseline, with the largest gains observed at the 20% training proportion. As training data increase, the magnitude of improvement decreases progressively.
Table 4.
Validation performance (mIoU ± standard deviation) of ResNet-18 for intra-domain, resolution shift, and geographic shift scenarios at 20% and 100% training data levels. Performance is compared across non-augmented and augmented configurations, including geometric, radiometric, occlusion, and combined transformations.
Figure 3.
Absolute IoU performance across four experimental scenarios. Validation mIoU is shown for five training proportions (20–100%) under five augmentation strategies: non-augmented, geometric, radiometric, occlusion, and combined transforms. Scenarios include intra-domain conditions (S1: WHU → WHU; S2: Japan → Japan), resolution shift (S3: WHU → HUMG), and geographic shift (S4: Japan → Thailand). Error bars indicate standard deviation across three independent runs.
Figure 4.
Relative IoU improvement (%) compared with the non-augmented baseline. Bars represent percentage improvement in validation mIoU under geometric, radiometric, occlusion, and combined augmentation strategies at incremental training proportions (20–100%). Positive values indicate performance gains relative to the non-augmented model within each scenario.
In Scenario 1 (WHU → WHU), the baseline mIoU at the 20% training level is 0.663. Geometric augmentation increases performance to 0.688, corresponding to a relative improvement of +3.8%. At the 100% training level, baseline performance increases from 0.851 to 0.860 under geometric augmentation (+1.1%). Performance differences among augmentation strategies remain below 0.01 mIoU at the full-data scale (Figure 3). In Scenario 2 (Japan → Japan), the baseline mIoU at 20% training data is 0.722. Geometric augmentation increases performance to 0.741 (+2.6%). At the 100% training level, baseline performance increases slightly from 0.798 to 0.801 (+0.4%). Relative gains are smaller than those observed in cross-domain scenarios (Figure 4). In Scenario 3 (WHU → HUMG), the baseline mIoU at 20% training data is 0.572. Combined augmentation increases performance to 0.688 (+20.3%). The augmented 20% configuration (0.688) exceeds the non-augmented 100% baseline (0.655), indicating substantial data efficiency gains. At the full training scale, geometric augmentation improves performance from 0.655 to 0.710 (+8.4%) (Figure 3). In Scenario 4 (Japan → Thailand), the baseline mIoU at 20% training data is 0.444. Geometric augmentation increases performance to 0.533 (+20.0%). At the 100% training level, baseline performance increases from 0.506 to 0.589 (+16.4%). Relative improvements remain consistently higher than those observed in intra-domain scenarios across all dataset proportions (Figure 4). Across all scenarios, performance differences between augmentation strategies decrease as dataset proportion increases, whereas cross-domain settings (Scenarios 3 and 4) exhibit pronounced gains at lower training proportions (20–40%). Relative improvements diminish progressively with increasing data availability, indicating that augmentation primarily benefits low-data regimes, with diminishing returns as training distribution coverage increases.
3.2. Qualitative Performance Analysis of Data-Centric Interventions
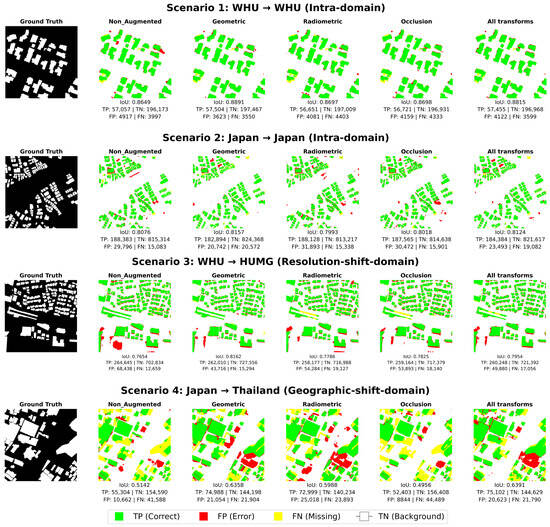
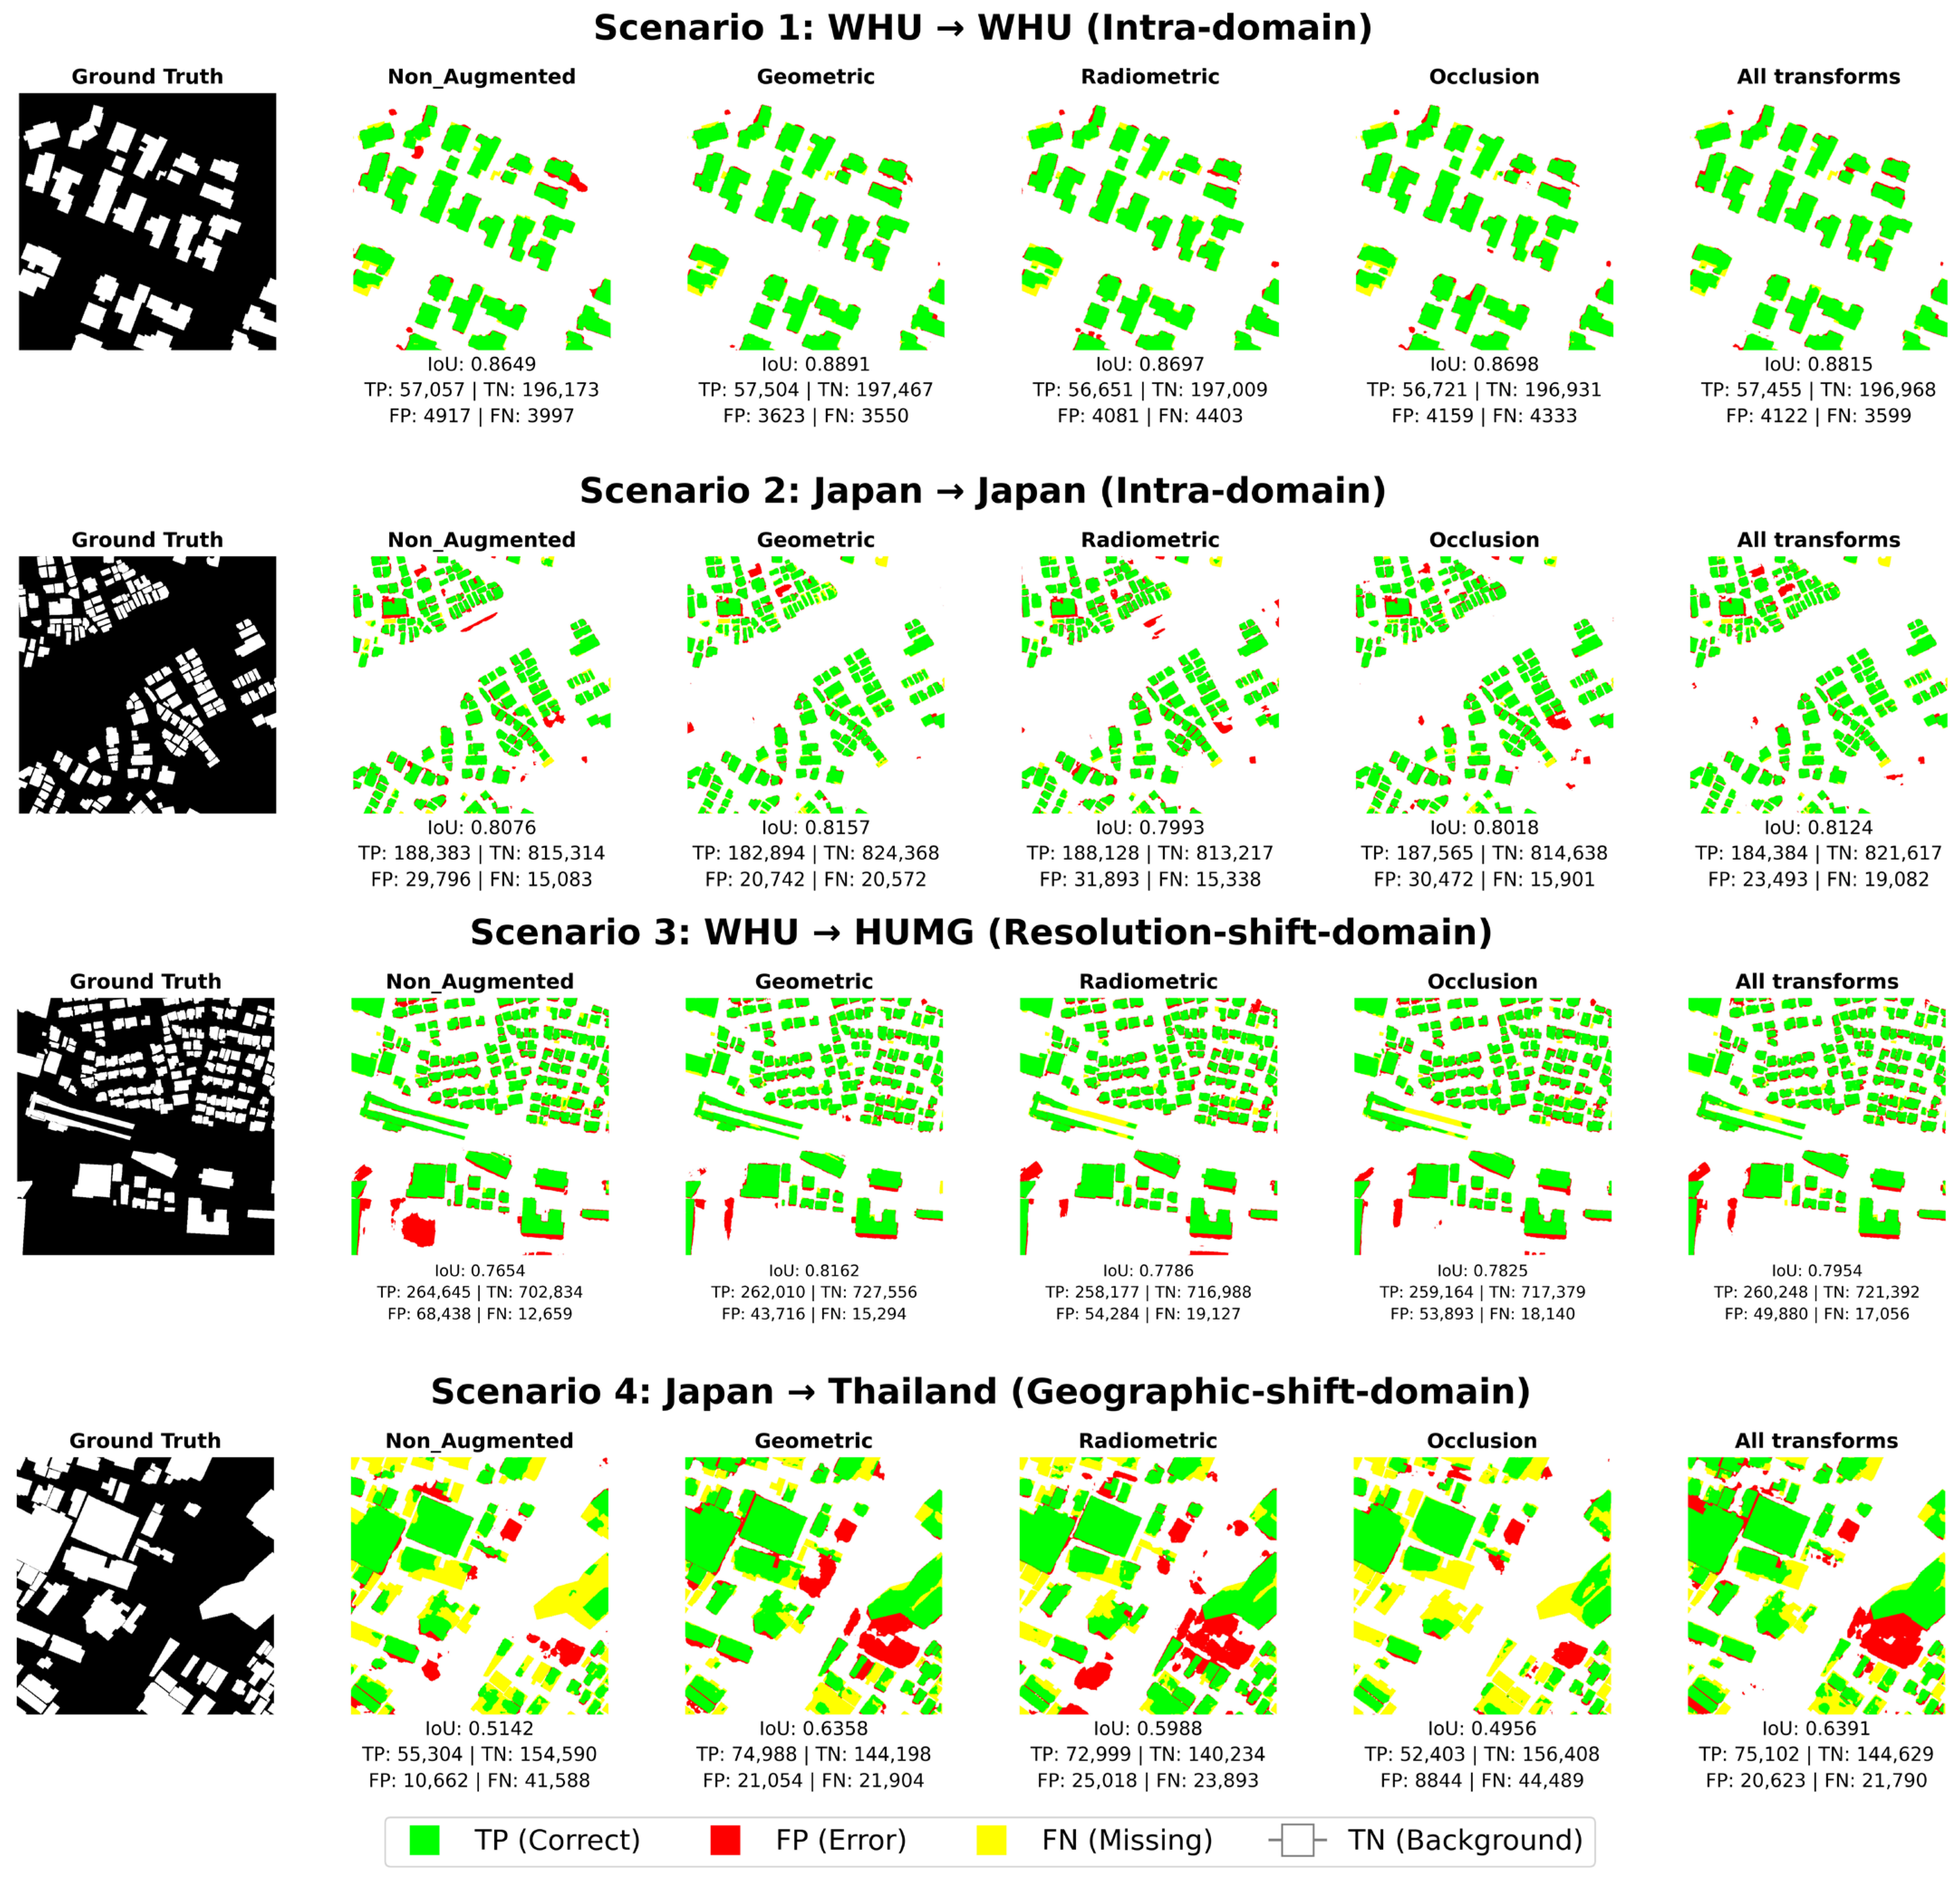
Qualitative comparisons of predicted building masks across the four experimental scenarios are presented in Figure 5. True Positive (TP), False Positive (FP), and False Negative (FN) regions are visualized to illustrate spatial error patterns under different augmentation strategies. In Scenario 1 (WHU → WHU), geometric and combined augmentation produce more continuous building boundaries compared with the non-augmented baseline. Boundary-related FN regions are reduced, particularly along roof edges and compact structures. Radiometric transforms introduce minor inconsistencies in boundary delineation, while occlusion-based augmentation leads to fragmented predictions for small buildings. In Scenario 2 (Japan → Japan), building outlines remain largely consistent across augmentation strategies, with only marginal improvements observed under geometric transformations. Error patterns remain structurally similar to the baseline, indicating limited modification of spatial representation under distribution-consistent conditions. In Scenario 3 (WHU → HUMG), resolution differences introduce additional fine-scale texture variations in the validation imagery. The non-augmented model exhibits scattered FP detections on non-building surfaces and discontinuities along narrow structures. Combined augmentation reduces FP noise and improves continuity of elongated buildings, while geometric augmentation decreases boundary fragmentation. In Scenario 4 (Japan → Thailand), baseline predictions omit complex roof geometries and produce irregular boundaries. Geometric and combined augmentation recovers larger portions of building footprints and reduces FN regions in multi-faceted structures. Radiometric augmentation alleviates some spectral confusion but does not fully resolve structural omissions, whereas occlusion introduces additional fragmentation. Qualitative improvements are primarily expressed through enhanced boundary continuity, reduced fragmentation, and improved reconstruction of rectilinear structures. These patterns prove that topology-preserving transformations enhance the model’s sensitivity to spatial configuration rather than local texture cues. Differences between augmentation strategies are more pronounced under cross-domain conditions (Scenarios 3 and 4), where structural variability and resolution mismatch introduce greater challenges to spatial consistency.
Figure 5.
Qualitative comparison of building segmentation results across four experimental scenarios. Visual comparison of predicted building masks under five configurations: non-augmented, geometric, radiometric, occlusion, and combined transformations. Results are shown for Scenario 1 (WHU → WHU), Scenario 2 (Japan → Japan), Scenario 3 (WHU → HUMG), and Scenario 4 (Japan → Thailand). TP regions are shown in green, FP regions in red, and FN regions in yellow. Differences in boundary continuity, omission errors, and spurious detections can be observed across augmentation strategies and domain conditions.
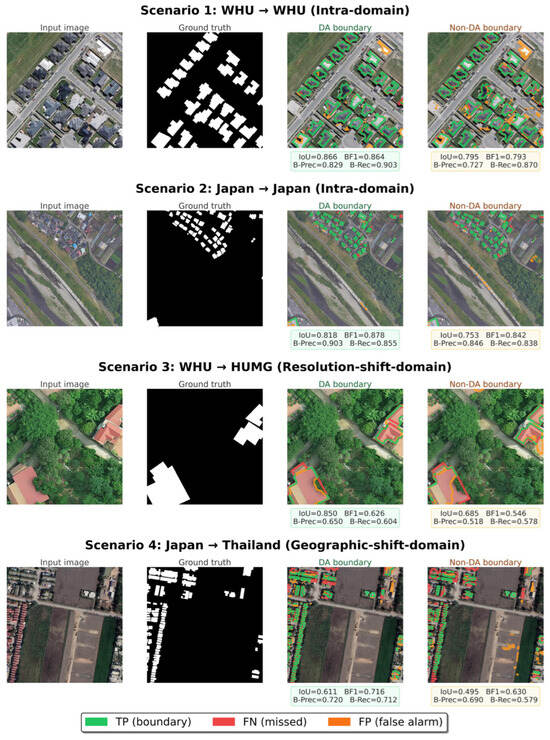
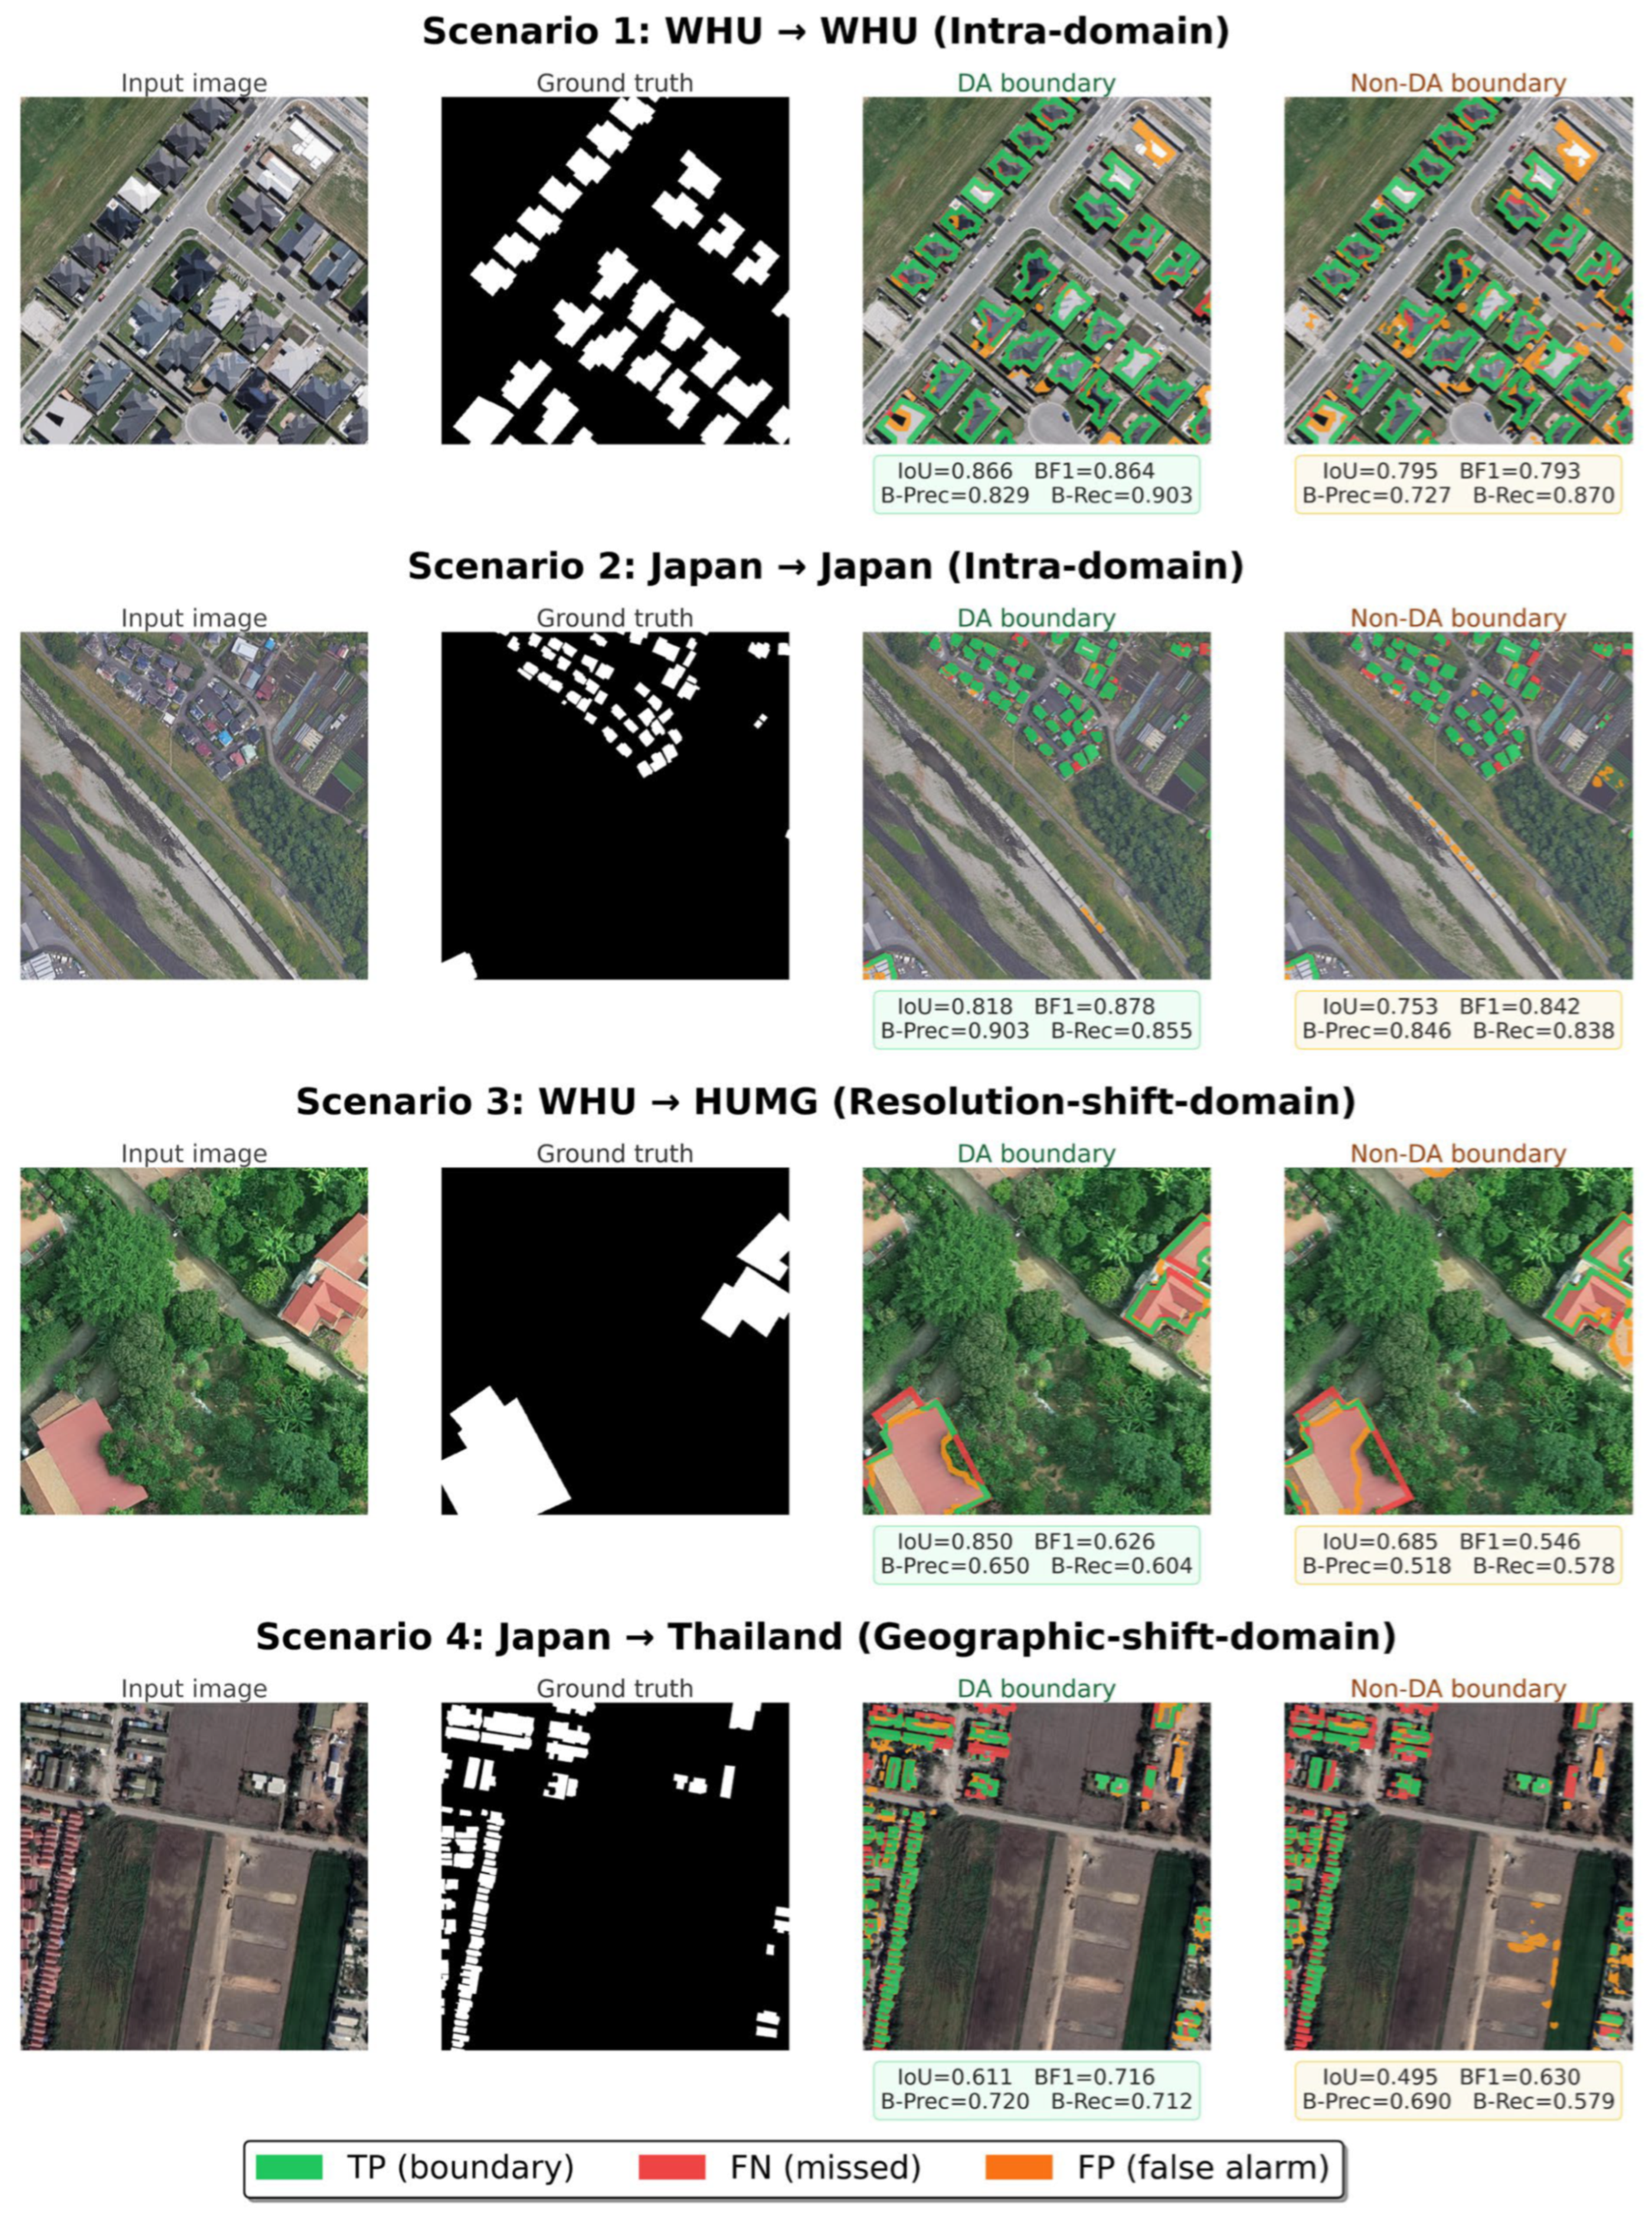
To further assess structural integrity, a boundary-focused error analysis is conducted using object-based metrics and visual inspection (Figure 6). Color-coded TP, FP, and FN maps reveal consistent improvements in edge delineation under geometric and combined augmentation. In intra-domain scenarios (S1 and S2), improvements are concentrated along building boundaries, where FN regions are reduced while maintaining rectilinear geometry. In cross-domain scenarios (S3 and S4), augmentation reduces fragmentation and suppresses spurious FP detections caused by resolution-induced noise and spectral ambiguity. These observations demonstrate that augmentation improves not only pixel-level accuracy but also the preservation of geometric structure, which is critical for reliable building extraction. Visual and metric-based assessments confirm that topology-preserving perturbations enhance the reconstruction of fine-scale structural details, resulting in more coherent and geometrically consistent building representations across varying domain conditions.
Figure 6.
Qualitative error analysis and structural integrity assessment across four experimental scenarios. The visualization employs color-coded maps (Green: TP, Red: FN, Orange: FP) to contrast the proposed data augmentation (DA) strategies against the non-augmented baseline. Below each sample, pixel-wise IoU is reported alongside object-based boundary metrics (BF1, B-Precision, and B-Recall) to quantify edge delineation accuracy.
3.3. Analysis of Overfitting Dynamics and Generalization Gap
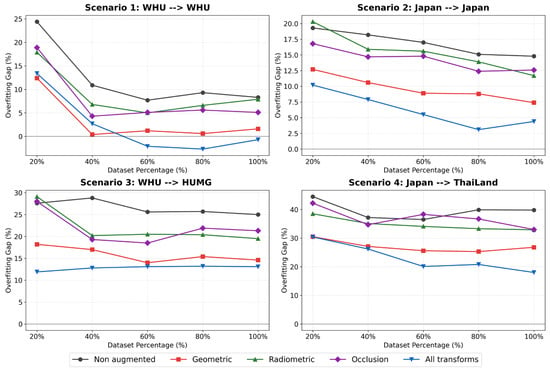
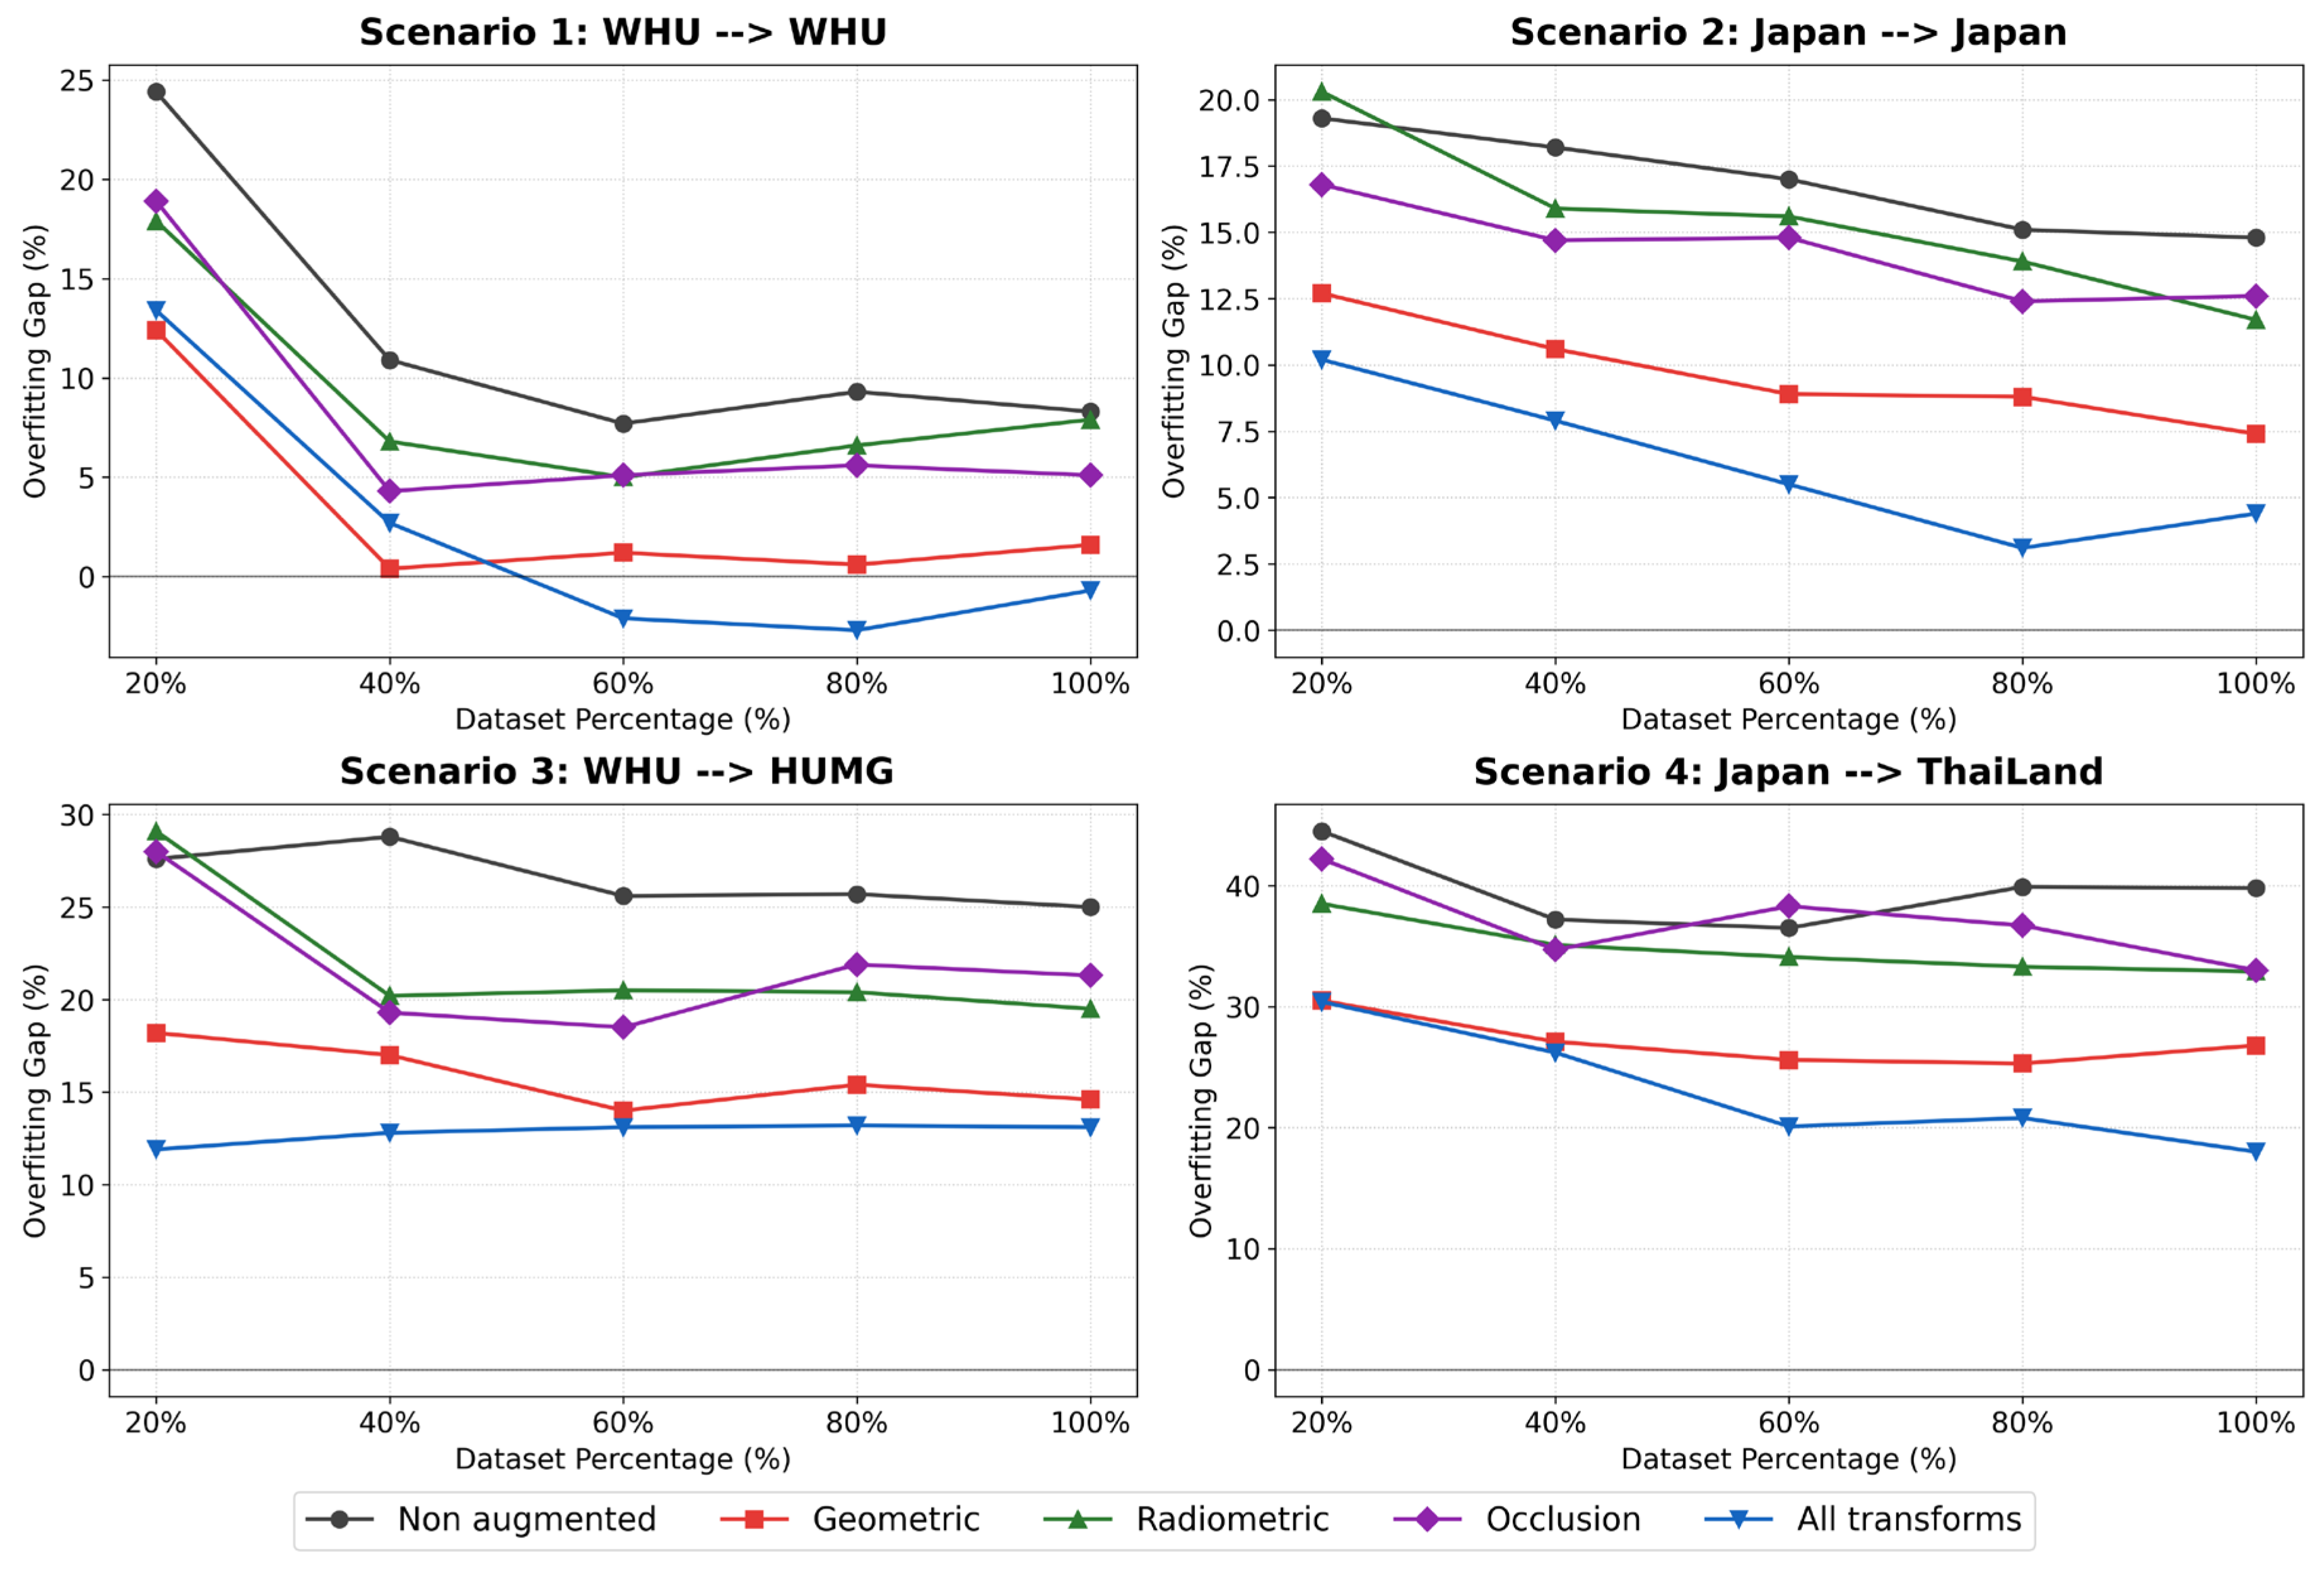
The generalization gap, defined as the difference between training and validation mIoU, is summarized in Figure 7, with detailed epoch-wise values provided in Table A6, Table A7, Table A8 and Table A9 of the Appendix A. Gap magnitude increases under stronger domain shifts and limited training data, indicating reduced generalization capacity under distribution mismatch. Data augmentation reduces this gap under all experimental conditions, although the magnitude of reduction varies with domain type and dataset scale.
Figure 7.
Generalization gap (training mIoU minus validation mIoU) across four experimental scenarios under varying training data proportions and augmentation strategies. Line plots show the gap values for non-augmented, geometric, radiometric, occlusion, and combined transforms in Scenario 1 (WHU → WHU), Scenario 2 (Japan → Japan), Scenario 3 (WHU → HUMG), and Scenario 4 (Japan → Thailand).
In Scenario 1 (WHU → WHU), the non-augmented baseline exhibits a generalization gap of 24.4% at the 20% training proportion. Geometric augmentation reduces this value to 12.4%, while combined augmentation results in a gap of 13.4%. At the 60% and 80% training proportions under combined augmentation, the gap becomes negative (−2.1% and −2.7%, respectively; Table A6), indicating improved validation performance relative to training. At 100% training data, the baseline gap decreases to 8.2%, compared to 7.6% under geometric augmentation and 5.1% under combined augmentation. In Scenario 2 (Japan → Japan), the baseline gap of 19.3% at the 20% training proportion decreases to 10.2% under combined augmentation. At the full training scale, the gap is 7.0% for the baseline and 4.4% for the combined strategy (Table A7), indicating a consistent reduction in overfitting under augmentation. In Scenario 3 (WHU → HUMG), the baseline generalization gap reaches 27.6% at the 20% training proportion. Combined augmentation reduces this value to 11.9%. At 100% training data, the baseline gap remains high at 25.0%, whereas combined augmentation reduces it to 13.1% (Table A8), demonstrating persistent domain-induced overfitting despite increased data volume. In Scenario 4 (Japan → Thailand), the baseline gap reaches 44.5% at the 20% training level. Geometric and combined augmentation reduces this value to approximately 30.5%. At 100% training data, the baseline gap remains elevated at 39.7%, compared with 18.0% under combined augmentation (Table A9).
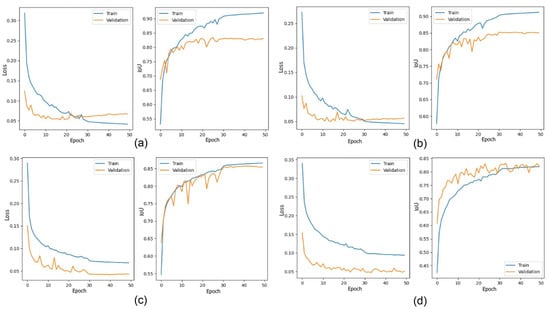
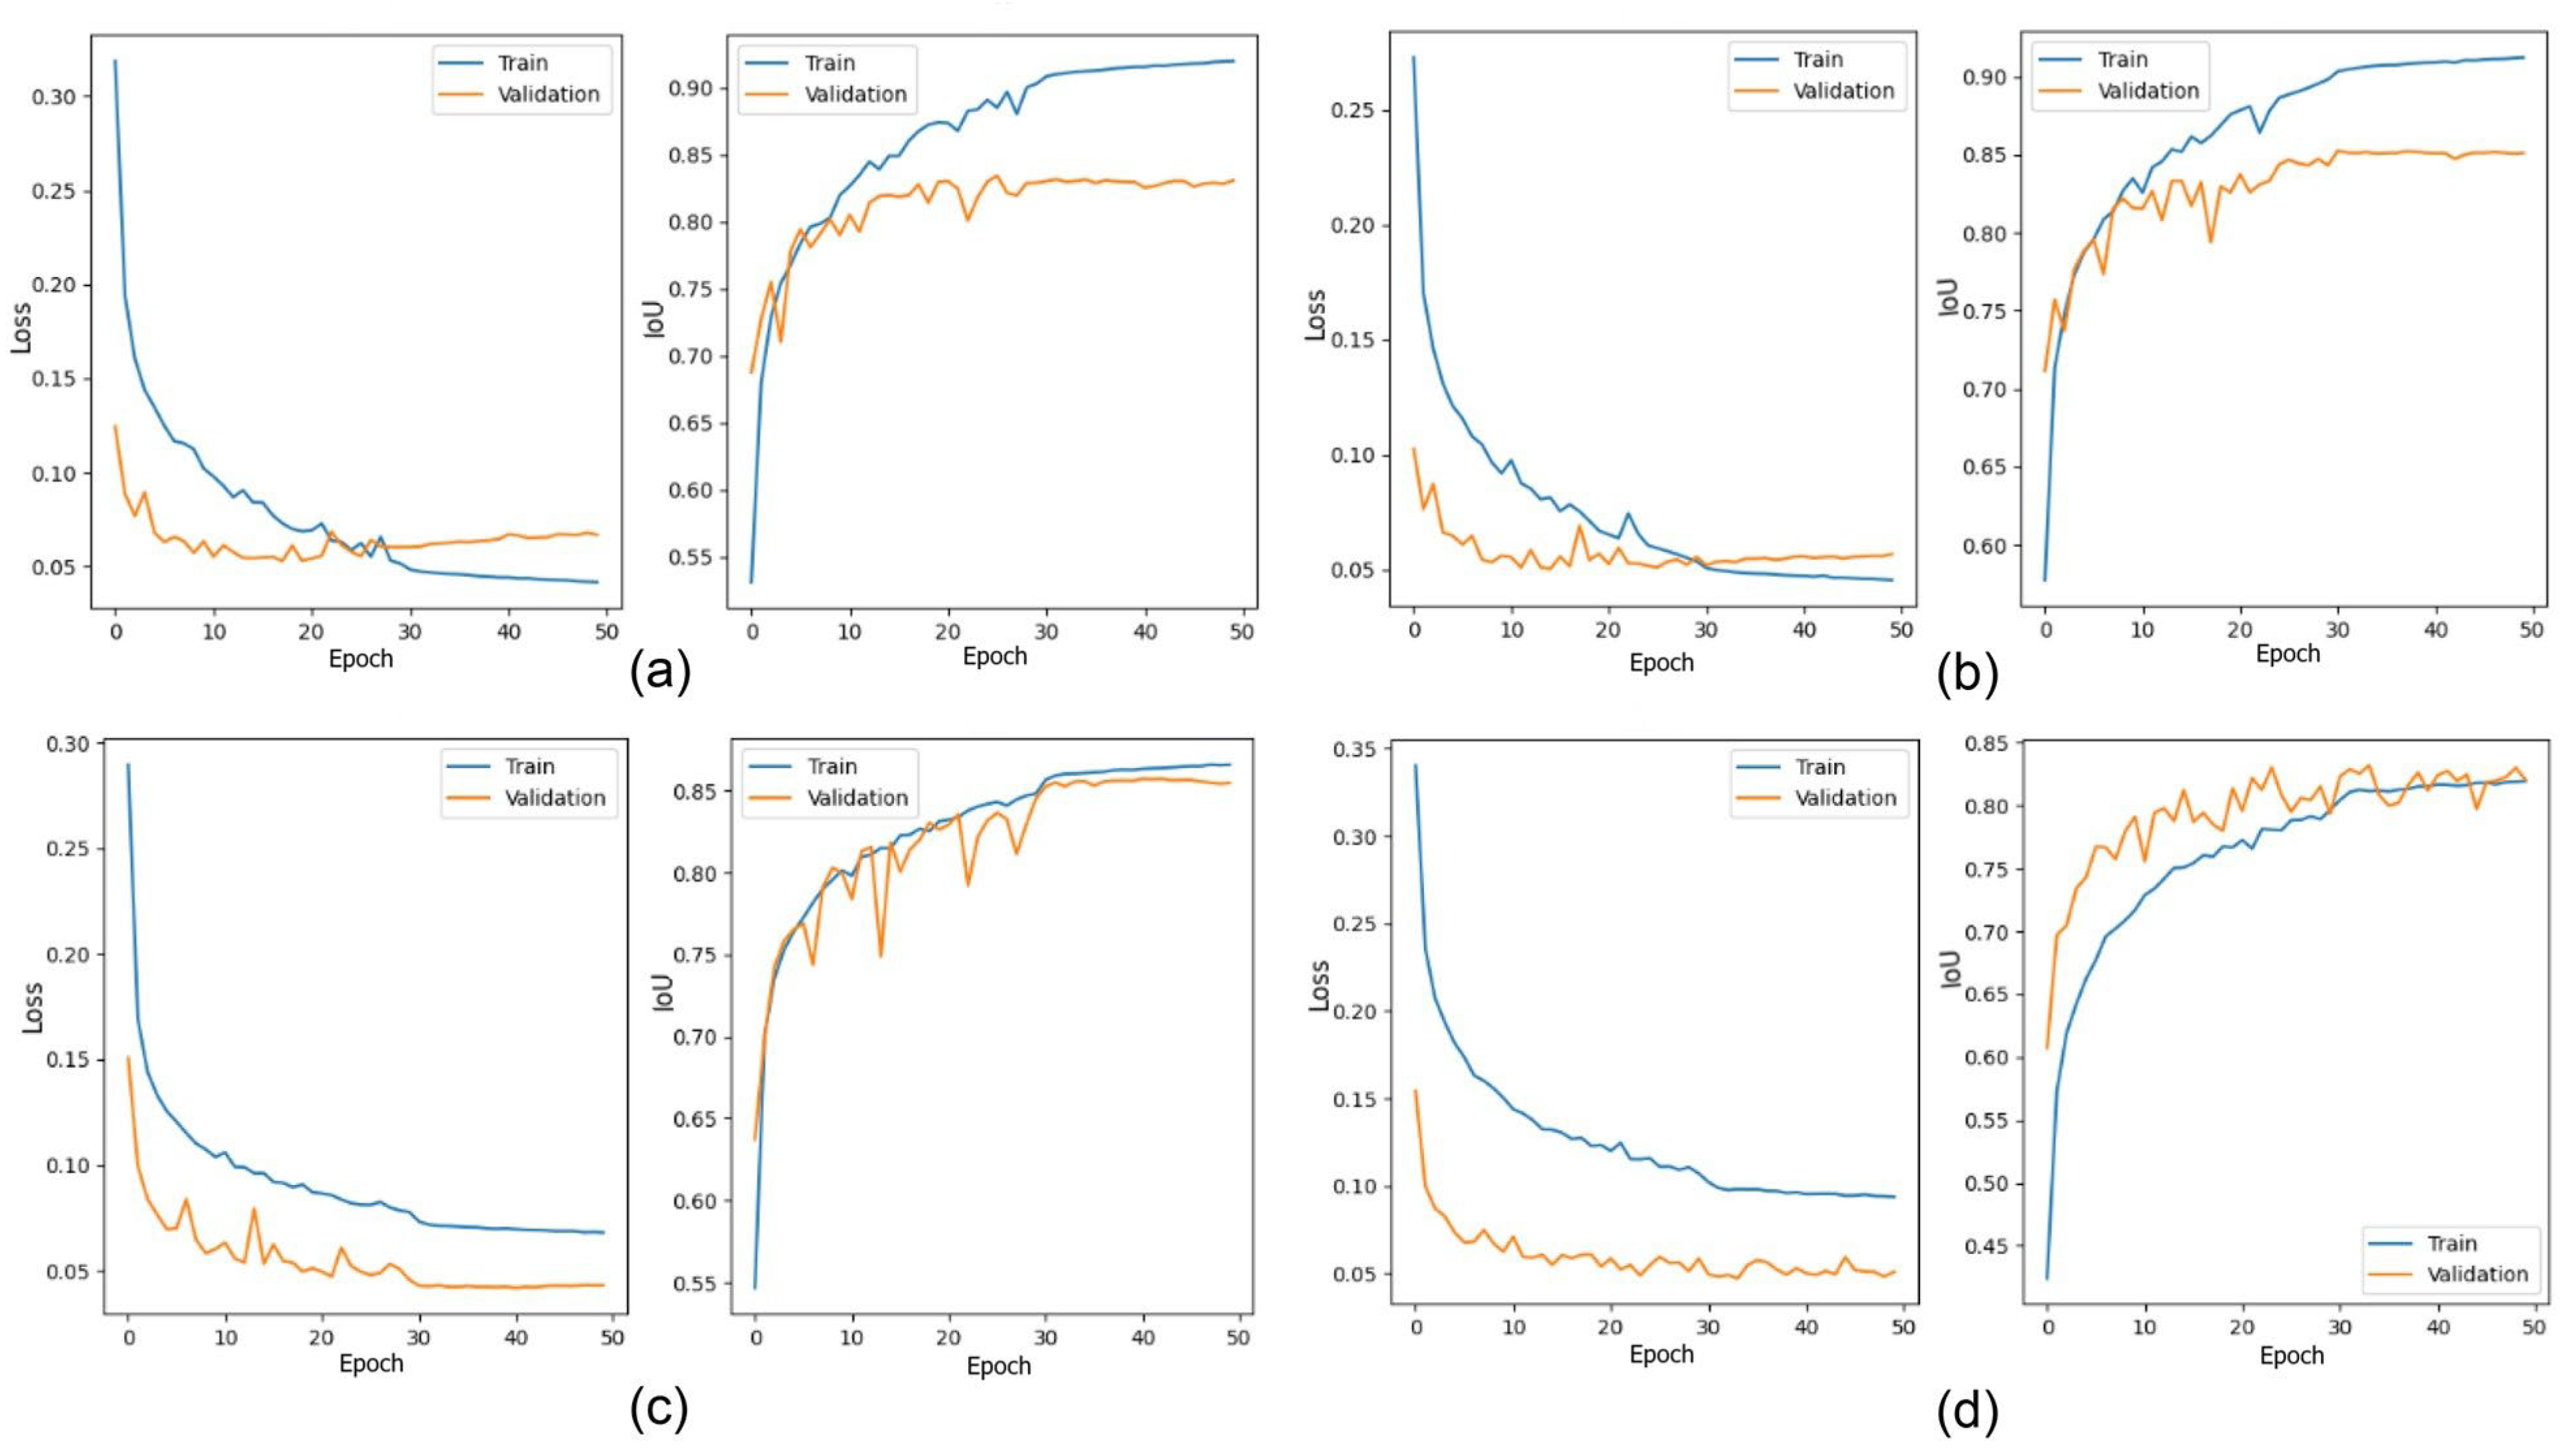
Training variations shown in Figure 7 and summarized in Figure 8 further reflect these gap patterns. In intra-domain settings (Scenarios 1 and 2), gap values decrease with increasing training proportion, reflecting improved model convergence. Under cross-domain conditions (Scenarios 3 and 4), a larger separation between training and validation performance persists, indicating sustained distributional mismatch. Augmentation consistently reduces this separation, demonstrating its role in improving generalization under both data-limited and domain shift conditions.
Figure 8.
Overfitting analysis under different data augmentation (DA) strategies based on training and validation loss and IoU metrics: (a) radiometric transforms; (b) occlusion transforms; (c) geometric transforms; and (d) combined transforms. The curves illustrate convergence behavior and the generalization gap between training and validation performance across augmentation strategies.
3.4. Interaction Between Model Capacity and Data Augmentation Efficacy
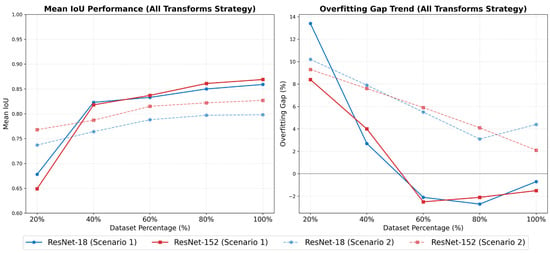
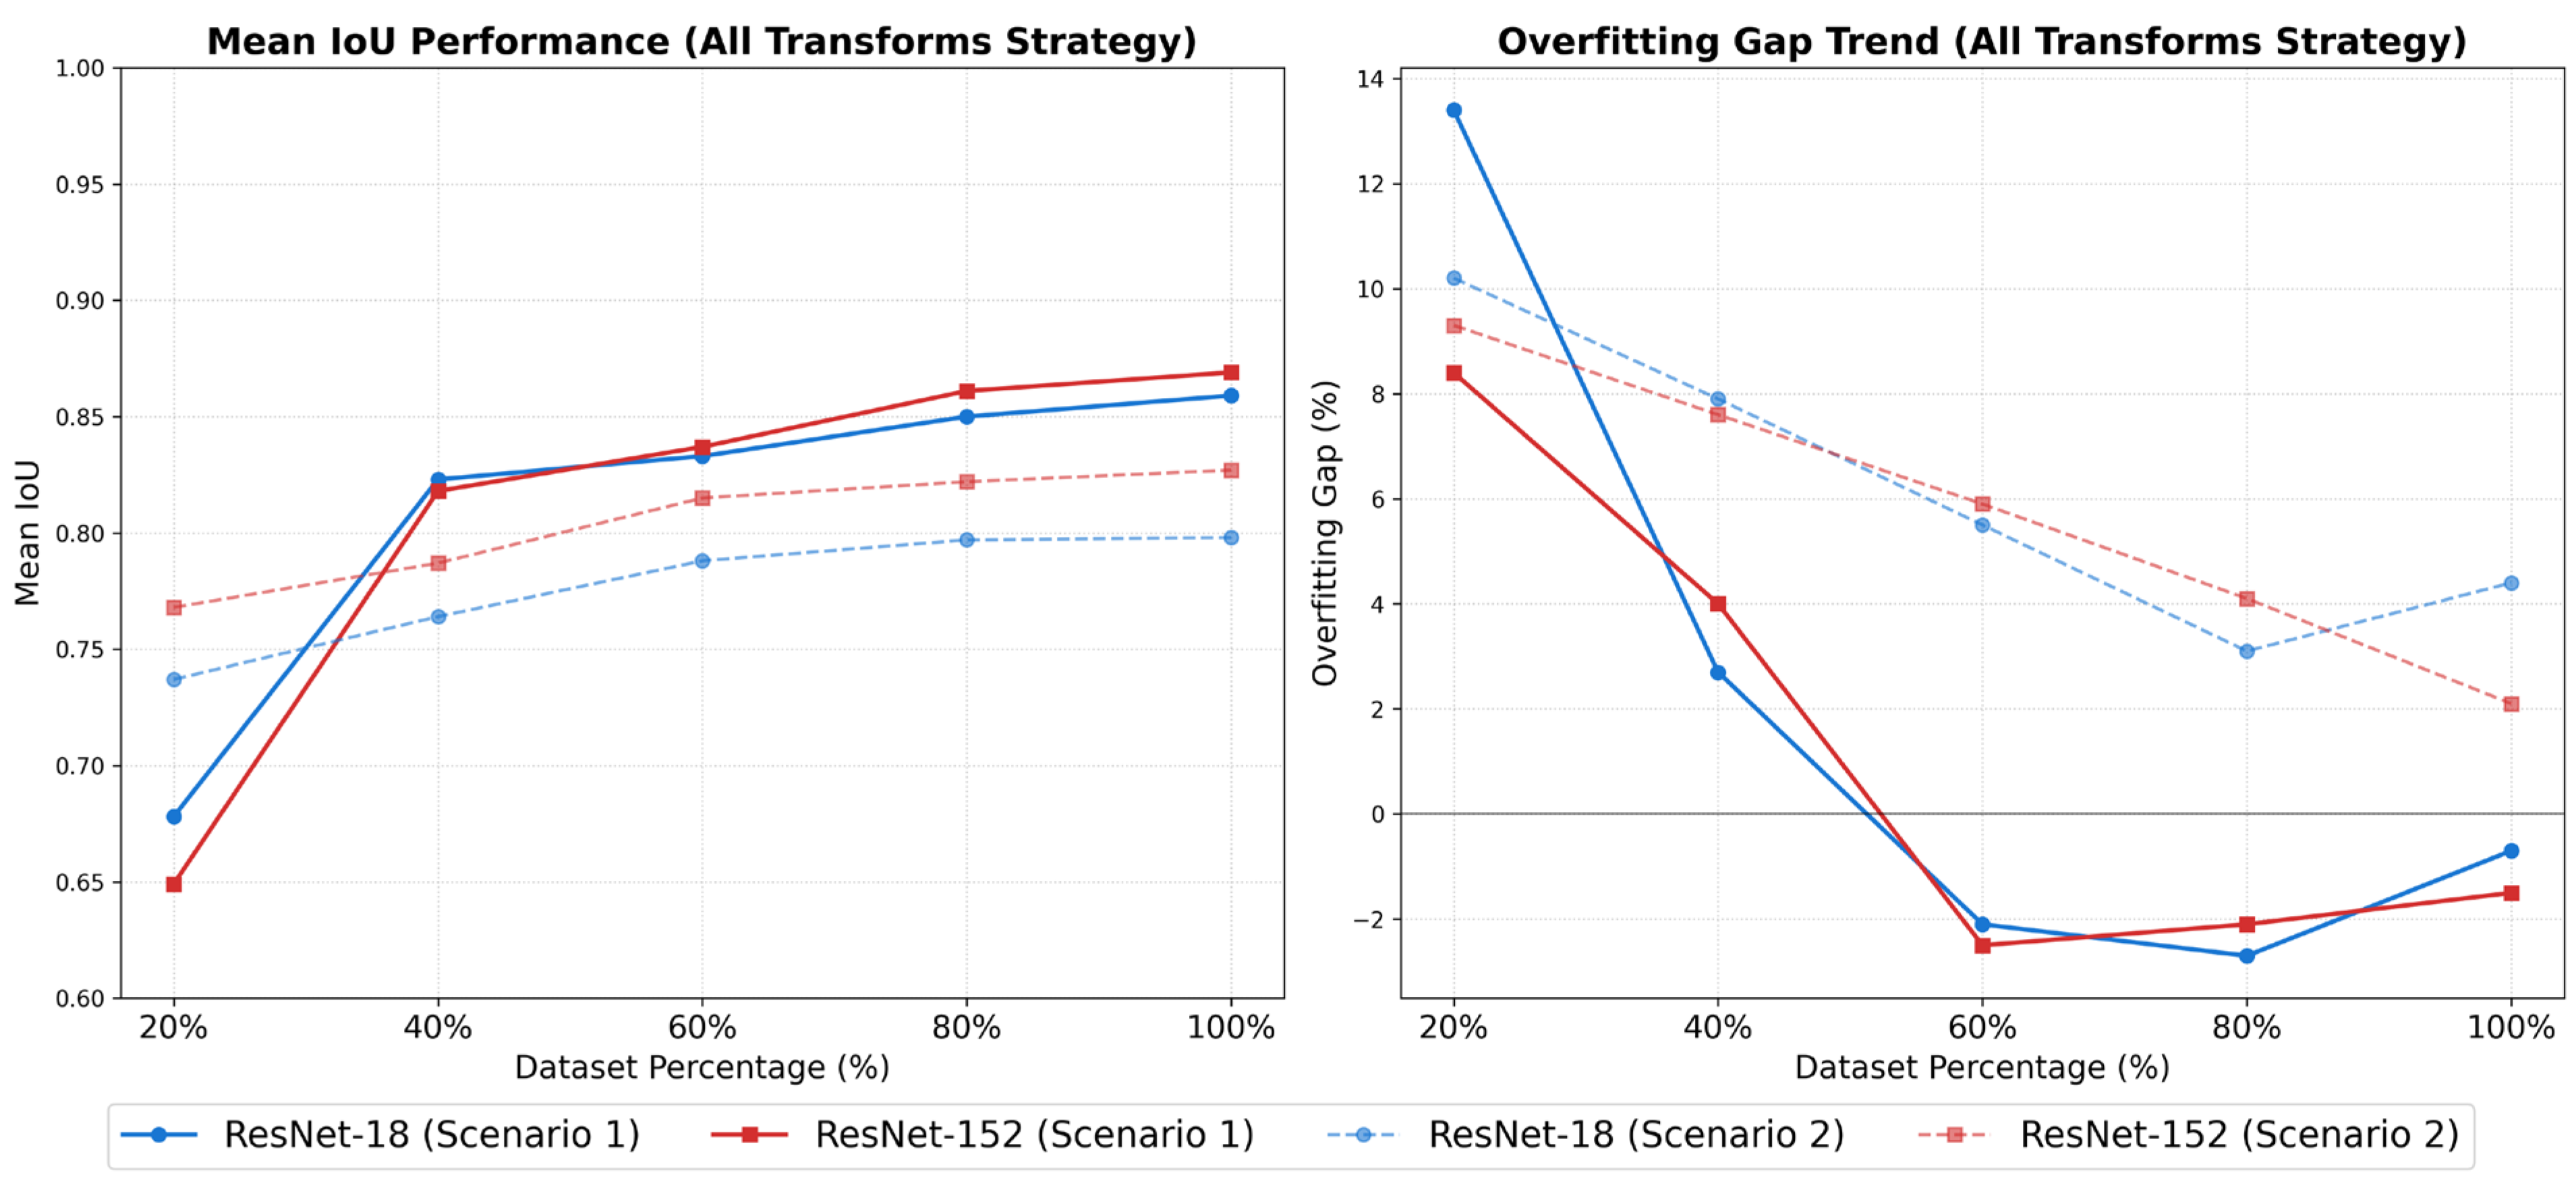
The interaction between model depth and data augmentation is evaluated by comparing ResNet-18 and ResNet-152 backbones under identical training regimes. Validation mIoU and generalization gap values are reported in Table 4 and Table 5, with detailed results provided in Table A2, Table A3, Table A4, Table A5, Table A10, Table A11, Table A12 and Table A13, and comparative trends illustrated in Figure 9.
Table 5.
Comparison of ResNet-18 and ResNet-152 validation mIoU (mean ± STD) for intra-domain experiments at low (20%) and full (100%) training data levels. Performance is evaluated under non-augmented and combined augmentation (all transforms) settings.
Figure 9.
Comparison of validation mIoU and generalization gap between ResNet-18 and ResNet-152 across training data proportions and augmentation strategies. Line plots show performance trends for the two backbones under non-augmented, geometric, radiometric, occlusion, and combined transform configurations in Scenario 1 (WHU → WHU) and Scenario 2 (Japan → Japan).
In Scenario 1 (WHU → WHU), ResNet-18 achieves higher mIoU at lower training proportions (20% and 40%) across augmentation strategies. Under the combined transformation configuration, ResNet-18 records an mIoU of 0.678 compared to 0.649 for ResNet-152 at the 20% training proportion, and 0.823 versus 0.818 at the 40% level. At 20% training data, the generalization gap under combined augmentation is 13.4% for ResNet-18 and 8.4% for ResNet-152. At 40%, the gap decreases to 2.7% for ResNet-18 and 4.0% for ResNet-152. From the 60% training proportion onward, ResNet-152 achieves higher validation mIoU and lower or comparable generalization gaps. At 100% training data, ResNet-152 reaches 0.869 mIoU under combined augmentation, compared with 0.859 for ResNet-18. In Scenario 2 (Japan → Japan), ResNet-152 consistently achieves higher validation mIoU across all dataset proportions. Under combined augmentation at the 20% training level, ResNet-152 records 0.768 mIoU compared with 0.737 for ResNet-18. At 40%, the corresponding values are 0.787 and 0.764. Generalization gaps are also lower for ResNet-152; at 20% training data, the gap is 9.3% compared with 10.2% for ResNet-18. At 100% training data, ResNet-152 achieves 0.827 mIoU with a 2.1% gap, compared to 0.798 mIoU and a 4.4% gap for ResNet-18.
Performance differences between backbones vary systematically with training proportion. At lower data regimes, ResNet-18 attains competitive or higher mIoU, indicating more efficient learning under limited variability. As training data increase, ResNet-152 achieves higher validation performance and reduced generalization gaps, reflecting improved utilization of its greater representational capacity. These patterns reveal that model capacity interacts with augmentation-induced diversity in a scale-dependent manner: shallow networks converge more efficiently under constrained data conditions, whereas deeper networks benefit more strongly from increased data diversity and exhibit superior generalization when sufficient variability is available. Detailed comparisons of mean IoU and overfitting gap trends under individual augmentation strategies are provided in the Appendix A (Figure A1, Figure A2 and Figure A3).
3.5. Data Efficiency Analysis and Augmentation Equivalence
The effect of augmentation under reduced training proportions is assessed by comparing validation mIoU across dataset scales. Augmentation equivalence is defined as the condition in which a model trained on a reduced augmented dataset achieves performance equal to or greater than that of a model trained on the full non-augmented dataset. Validation results are reported in Table 5, with detailed values provided in Table A4 and Table A5 (Appendix A) and relative improvements illustrated in Figure 4. In Scenario 3 (WHU → HUMG), the non-augmented model achieves 0.572 mIoU at the 20% training proportion. Under the combined augmentation strategy, performance increases to 0.688 (Table A4), exceeding the non-augmented 100% baseline (0.655). At the 40% training proportion, combined augmentation reaches 0.703 mIoU, remaining above the full-data baseline.
A comparable pattern is observed in Scenario 4 (Japan → Thailand). The baseline mIoU at 20% training data is 0.444. Geometric augmentation increases performance to 0.533 (Table A5), surpassing the non-augmented 100% baseline (0.506). At the 40% training proportion, geometric augmentation achieves 0.562 mIoU, also exceeding the full-data baseline. In contrast, intra-domain scenarios do not exhibit augmentation equivalence at reduced training proportions. In Scenarios 1 and 2, augmented models trained at 20% remain below the performance of the non-augmented 100% configuration, indicating that increased data volume remains the dominant factor under distribution-consistent conditions. Standard deviation values reported in Table 5, Table A4 and Table A5 indicate lower variability under geometric and combined augmentation compared with radiometric or occlusion-only strategies. Greater relative improvements at lower training proportions are observed under cross-domain conditions (Figure 4), highlighting the role of augmentation in compensating for distributional mismatch rather than simply increasing data volume.
3.6. Cross-Architecture Validation with Transformer-Based SegFormer
To evaluate whether augmentation effects persist across different deep learning paradigms, the proposed strategies are further validated using the transformer-based SegFormer model with an MiT-b0 backbone. This experiment is designed to assess the generality of data-driven effects rather than to benchmark state-of-the-art performance. Results at the 20% training proportion are reported in Table A14 (Appendix A). Geometric and combined augmentation (All transforms) consistently outperform the non-augmented baseline for the SegFormer architecture, mirroring the trends observed in the ResNet-18 experiments. In Scenario 3 (resolution shift), the model achieves an mIoU of 0.671 under the combined augmentation strategy, exceeding the non-augmented ResNet-18 baseline at full training scale (0.655). In Scenario 4 (geographic shift), geometric augmentation increases mIoU from 0.469 to 0.518, indicating substantial improvement under domain mismatch. In addition to accuracy gains, structured augmentation reduces overfitting in the transformer architecture. As reported in Table A15 (Appendix A), the generalization gap in Scenario 3 decreases from 30.3% to 14.6% under the combined augmentation strategy. These results suggest that augmentation benefits arise from increased distributional coverage rather than architecture-specific inductive biases. The observed improvements across both CNN-based and transformer-based models suggest that geometric and structural diversity enhances the model’s ability to generalize under domain shift by improving the representation of spatial configurations.
4. Discussion
4.1. Data Augmentation as Regularization and Distribution Bridging
The function of data augmentation depends on the degree of alignment between training and validation distributions. In intra-domain scenarios (S1 and S2), augmentation primarily constrains the memorization of site-specific textures and noise. The occurrence of negative generalization gaps at intermediate training proportions indicates reduced sensitivity to superficial pixel correlations, suggesting that perturbation-based training promotes reliance on stable structural features rather than local intensity patterns. This behavior is consistent with previous findings that controlled spatial perturbations encourage models to prioritize semantic structure over pixel-level coincidences [37]. Under cross-domain conditions (S3 and S4), augmentation operates under different constraints. Resolution and geographic shifts introduce structural and spectral discrepancies between source and target domains. Substantial performance gains under reduced training proportions (e.g., ~20% in Scenario 3) indicate that augmentation increases overlap between source and target feature representations. Rather than acting solely as a regularization mechanism, geometric diversity expands the effective support of the training distribution. Studies on distribution alignment suggest that such perturbations smooth high-dimensional feature manifolds and reduce sensitivity to domain-specific artifacts [11,13,38]. Unlike preprocessing operations that modify intensity or contrast without altering spatial configuration, structured augmentation introduces controlled geometric variability. This variability improves distributional coverage and reduces misalignment between training and validation domains by exposing the model to a broader range of plausible spatial configurations [9]. However, persistent generalization gaps in Scenarios 3 and 4 indicate that augmentation reduces but does not eliminate distribution mismatch.
4.2. Structural Invariance in Building Extraction
Geometric transformations produce more stable performance improvements than radiometric perturbations. Modifications in orientation, scale, and aspect ratio preserve building topology while increasing spatial variability within the training distribution. Buildings are characterized by rectilinear geometry, consistent edge alignment, and well-defined boundary structure, making structural cues the dominant source of discrimination. Transformations that preserve geometric constraints while varying spatial configuration increase invariance to orientation and scale without altering object topology. This behavior is consistent with evidence that spatial configuration plays a central role in the segmentation of rigid urban objects [16].
Radiometric transformations alter pixel intensity distributions but do not modify boundary topology. When structural cues dominate the discriminative signal, intensity variation contributes less to representation transferability. Preservation and controlled variation in geometric structure, therefore, support more stable feature representations than spectral modification. Previous studies have noted that geometric transformations are computationally simple and preserve semantic annotation consistency, although they may introduce limited additional information due to repeated spatial patterns [39,40,41]. The present results indicate that even constrained geometric perturbations substantially improve generalization when domain discrepancies arise primarily from spatial configuration rather than spectral variation.
The cross-domain setting in Scenario 4 further supports this interpretation. Architectural forms differ between Japanese and Thai urban environments, particularly in roof materials, texture, and spectral response. Rectilinear geometry, by contrast, remains largely conserved. Higher validation performance under geometric augmentation, therefore, reflects the transferability of structural priorities across regions. Radiometric attributes vary with illumination, atmospheric conditions, and sensor configuration, resulting in reduced cross-domain consistency [2]. These observations suggest that augmentation strategies should be aligned with object characteristics. For rigid built structures, topology-preserving spatial perturbations provide more reliable gains in cross-domain generalization than intensity-based transformations [14].
4.3. Implications of Augmentation Equivalence
Augmentation equivalence refers to the condition in which a model trained on a reduced augmented dataset achieves performance comparable to or exceeding that of a model trained on the full non-augmented dataset. In cross-domain scenarios, this condition is observed when 20% augmented configurations outperform 100% non-augmented baselines. Such behavior reflects the role of distributional diversity in improving generalization through the expansion of feature support rather than the reduction in estimation variance. Increasing data volume within a narrow distribution primarily reduces variance but does not expand feature coverage. Augmentation, by contrast, introduces controlled variability that broadens the effective support of the training distribution. This broader support increases overlap between the source and target feature spaces, thereby reducing distributional misalignment under domain shift.
When source and target domains differ in resolution or geographic characteristics, expanded distribution support becomes more influential than density within a restricted feature space. These findings align with recent discussions in data-centric learning, which emphasize data representativeness and distribution coverage alongside model capacity [13,38]. Controlled augmentation strategies increase representation diversity without proportionally increasing annotation effort [11,17]. Augmentation improves data efficiency by expanding distributional coverage, enabling sparse datasets to approximate the representational capacity of larger datasets. Augmentation equivalence does not occur in intra-domain scenarios, where reduced augmented datasets remain below full non-augmented baselines. Under distribution-aligned conditions, variance reduction dominates, making increased sample density more effective than diversity expansion. The relative contribution of augmentation, therefore, depends on the magnitude of distribution shift [23]. Data volume and data diversity play distinct roles: volume stabilizes estimation within a distribution, whereas augmentation expands distribution breadth under cross-domain conditions.
Explicit transformations used in this study preserve geometric topology. Generative models (e.g., GANs) provide alternative pathways for distribution expansion but require strict control to avoid distortion of rectilinear building structures. Automated augmentation policies (e.g., RandAugment) introduce additional optimization complexity and reduce the interpretability of transformation effects. Human-in-the-loop interactive methods address data scarcity at a different stage of the workflow. ARE-Net demonstrates that optimized interactive encoding (e.g., adaptive-radius) reduces annotation effort [15]. Integrating efficient label acquisition with topology-preserving augmentation provides a complementary strategy for reducing annotation cost while improving generalization performance.
4.4. Interaction Between Architecture Depth and Diversity Internalization
Model capacity and inductive bias interact with augmentation differently across data regimes and architectural paradigms. At lower training proportions, shallower architectures such as ResNet-18 often achieve comparable or higher validation accuracy in intra-domain settings. Limited feature variability constrains the learning problem, allowing simpler models to converge efficiently without requiring high representational capacity. As training proportion increases or when structured augmentation is introduced, deeper networks such as ResNet-152 achieve higher peak performance and reduced generalization gaps. The greater representational capacity of deeper residual networks enables modeling of more complex feature interactions [42] but effective utilization of this capacity depends on sufficient variability within the training distribution.
To evaluate whether these effects depend on convolutional inductive bias, the analysis is extended to the transformer-based SegFormer (MiT-b0). Despite fundamental differences between local connectivity in CNNs and global self-attention in transformers, the effect of geometric and structural diversity remains consistent. In Scenario 3 (resolution shift), the SegFormer model trained on 20% augmented data achieves an IoU of 0.671, exceeding the 100% non-augmented ResNet-18 baseline of 0.655. In Scenario 4 (geographic shift), the 20% augmented SegFormer (0.559 IoU) surpasses its full-data non-augmented baseline of 0.469 IoU.
Consistency across architectures demonstrates that augmentation modifies the structure of the input distribution rather than relying on architecture-specific inductive biases. Expansion of effective distribution support enables both CNNs and transformers to access a broader range of spatial configurations during training. Local feature extractors benefit through improved invariance to orientation and scale, whereas self-attention mechanisms benefit from more diverse global contextual relationships. Reduction in generalization gaps across architectures further suggests that increased model capacity alone does not guarantee robustness under domain shift. Robust performance emerges when representational capacity is matched with sufficient diversity in spatial structure. Architecture defines the potential representational range, whereas augmentation governs the diversity of patterns available for internalization.
4.5. Computational Efficiency and Pipeline Optimization
The computational overhead of the data augmentation (DA) pipeline remains minimal relative to model training cost. As reported in Table A16 (Appendix A), theoretical augmentation latency increases linearly with dataset size (approximately 20 ms per image), yet training time per epoch remains effectively unchanged between augmented and non-augmented configurations. At the full training scale (4736 samples), the difference in epoch duration is limited to 1 s (247 s versus 248 s). Parallel execution of CPU-bound augmentation and GPU-based model training enables this behavior, preventing augmentation from becoming a computational bottleneck. The asynchronous multi-threaded pipeline (num_workers = 2) ensures that data transformations are completed concurrently with forward and backward propagation steps. The negligible computational overhead demonstrates that improvements in generalization arise from modification of the training distribution rather than increased computational complexity. This characteristic is particularly important for large-scale urban mapping applications, where annotation effort, rather than computational cost, represents the primary constraint on large-scale deployment.
5. Limitations and Future Directions
Persistent generalization gaps remain under severe cross-domain conditions despite measurable improvements from structured augmentation. In Scenario 4, an 18.0% generalization gap at full training proportion indicates that pixel-level geometric and radiometric perturbations do not fully resolve semantic discrepancies between source and target domains. These discrepancies arise from higher-level structural variations, including differences in urban density, roof typology, construction materials, and spatial organization, which extend beyond the representational capacity of input-level transformations. Such differences highlight the limitations of augmentation strategies that operate exclusively at the pixel or patch scale [9]. Failure cases are explicitly observed in domain shift scenarios where critical visual cues are either ambiguous or absent. These include regions with complex or non-rectilinear roof geometries, dense informal settlements with irregular spatial layouts, and strong shadow occlusion that obscures building boundaries. In addition, performance degradation is evident in areas where rooftops exhibit high spectral similarity to surrounding surfaces (e.g., unpaved roads or bare soil), leading to misclassification despite geometric perturbations. Under these conditions, topology-preserving transformations provide limited benefit, as augmentation cannot recover missing structural information or resolve semantic ambiguity when discriminative features are not present in the input data.
Evaluation across the transformer-based SegFormer architecture confirms that geometric diversity improves generalization beyond convolutional inductive biases. However, extension to higher-capacity vision transformers (ViTs) remains necessary to assess how large-scale self-attention mechanisms interact with structured augmentation under varying data regimes. CNN architectures emphasize local spatial patterns and translation invariance, whereas self-attention models capture long-range dependencies; the interaction between augmentation-induced diversity and these distinct feature-learning mechanisms remains insufficiently characterized. Parallel data pipelines effectively mitigate computational overhead, yet scalability to more complex settings remains uncertain. Application to multi-sensor fusion, multi-temporal analysis, or tasks requiring topological continuity (e.g., road network extraction) may introduce additional constraints that are not captured in the current experimental design. These limitations suggest that augmentation alone is insufficient for scenarios requiring semantic reasoning beyond geometric structure. Establishing standardized evaluation protocols for data-centric interventions, therefore, remains necessary to enable consistent comparison across datasets, tasks, and model families [22]. Future work should examine multi-scale structural augmentation, feature-level adaptation, and integration with domain adaptation techniques to better capture semantic variability across domains. Particularly, combining topology-preserving augmentation with multi-sensor inputs (e.g., LiDAR or SAR) or semantic-aware learning frameworks may help address the identified failure modes. Systematic exploration of the boundary conditions under which augmentation improves or fails to improve generalization is required to guide its application in large-scale Earth observation workflows.
6. Conclusions
Interactions between structured data augmentation (DA), training volume, domain shifts, and architectural paradigms govern generalization performance in high-resolution building extraction. Results demonstrate that the functional role of DA shifts from a regularization mechanism in intra-domain settings to a distribution bridging mechanism under cross-domain conditions. Geometric perturbations exert the strongest influence, yielding relative mIoU improvements of approximately 20% in scenarios involving resolution and geographic shifts. Augmented datasets using only 20% of samples can exceed the performance of models trained on 100% non-augmented data under pronounced source–target discrepancies, indicating that spatial diversity contributes more to cross-domain generalization than raw sample volume. Structural variability produces consistent benefits across both CNN and transformer-based architectures, including SegFormer, indicating that augmentation effects arise from the modification of training distribution rather than architecture-specific inductive biases. Higher representational capacity only translates into improved performance when sufficient spatial diversity is present within the training data. Augmentation, therefore, acts as an enabling condition that allows model capacity to be effectively utilized. Implementation of an asynchronous multi-threaded pipeline ensures that these accuracy gains are achieved without increasing computational time, maintaining high training throughput for operational workflows. Improvement in generalization is, therefore, achieved through data-centric modification rather than increased computational cost. Pixel-level perturbations do not fully resolve high-level semantic discrepancies under extreme domain shifts. However, topology-preserving spatial transformations provide an efficient mechanism for reducing annotation requirements while maintaining structural fidelity. For rigid built structures, geometric consistency aligns closely with urban form, establishing data-centric augmentation as a practical and scalable strategy for robust, cross-domain urban mapping.
Author Contributions
Conceptualization, D.T.P. and T.V.T.; methodology, D.T.P.; validation, D.T.P., T.V.T. and N.Q.M.; formal analysis, D.T.P.; investigation, D.T.P. and T.V.T.; data curation, D.T.P. and N.Q.M.; writing—original draft preparation, D.T.P., T.V.T., N.Q.M., J.L. and X.Z.; writing—review and editing, D.T.P., T.V.T., J.L. and X.Z.; visualization, D.T.P. and T.V.T.; supervision, T.V.T.; project administration, D.T.P. and N.Q.M. All authors have read and agreed to the published version of the manuscript.
Funding
This research received no external funding.
Data Availability Statement
The datasets used in this study are publicly available. The WHU Building Dataset is available at https://gpcv.whu.edu.cn/data/building_dataset.html (accessed on 26 February 2026). The Japan and Thailand building datasets are available from their respective original sources cited in the manuscript. The HUMG UAV dataset generated for this study is available from the corresponding author upon reasonable request. The source code and implementation details are publicly available at https://github.com/trungdungtdct/Data-augmentation (accessed on 26 February 2026).
Acknowledgments
The authors would like to thank the providers of the public datasets used in this study, including the WHU Building Dataset and other open remote sensing datasets referenced in the manuscript. The authors also acknowledge the developers of open-source software and libraries that supported this research. During the preparation of this manuscript, the authors used ChatGPT (OpenAI, GPT-5.3) for language editing and improvement in academic writing clarity. The authors reviewed and edited the generated text and took full responsibility for the content of this publication.
Conflicts of Interest
The authors declare no conflicts of interest.
Appendix A
Figure A1.
Comparison of segmentation accuracy and overfitting dynamics between ResNet-18 and ResNet-152 under geometric augmentation for Scenarios 1 and 2. The left panel presents mean IoU across training data proportions (20–100%), and the right panel shows the overfitting gap (training IoU minus validation IoU). Solid lines correspond to Scenario 1 (WHU → WHU), while dashed lines correspond to Scenario 2 (Japan → Japan).
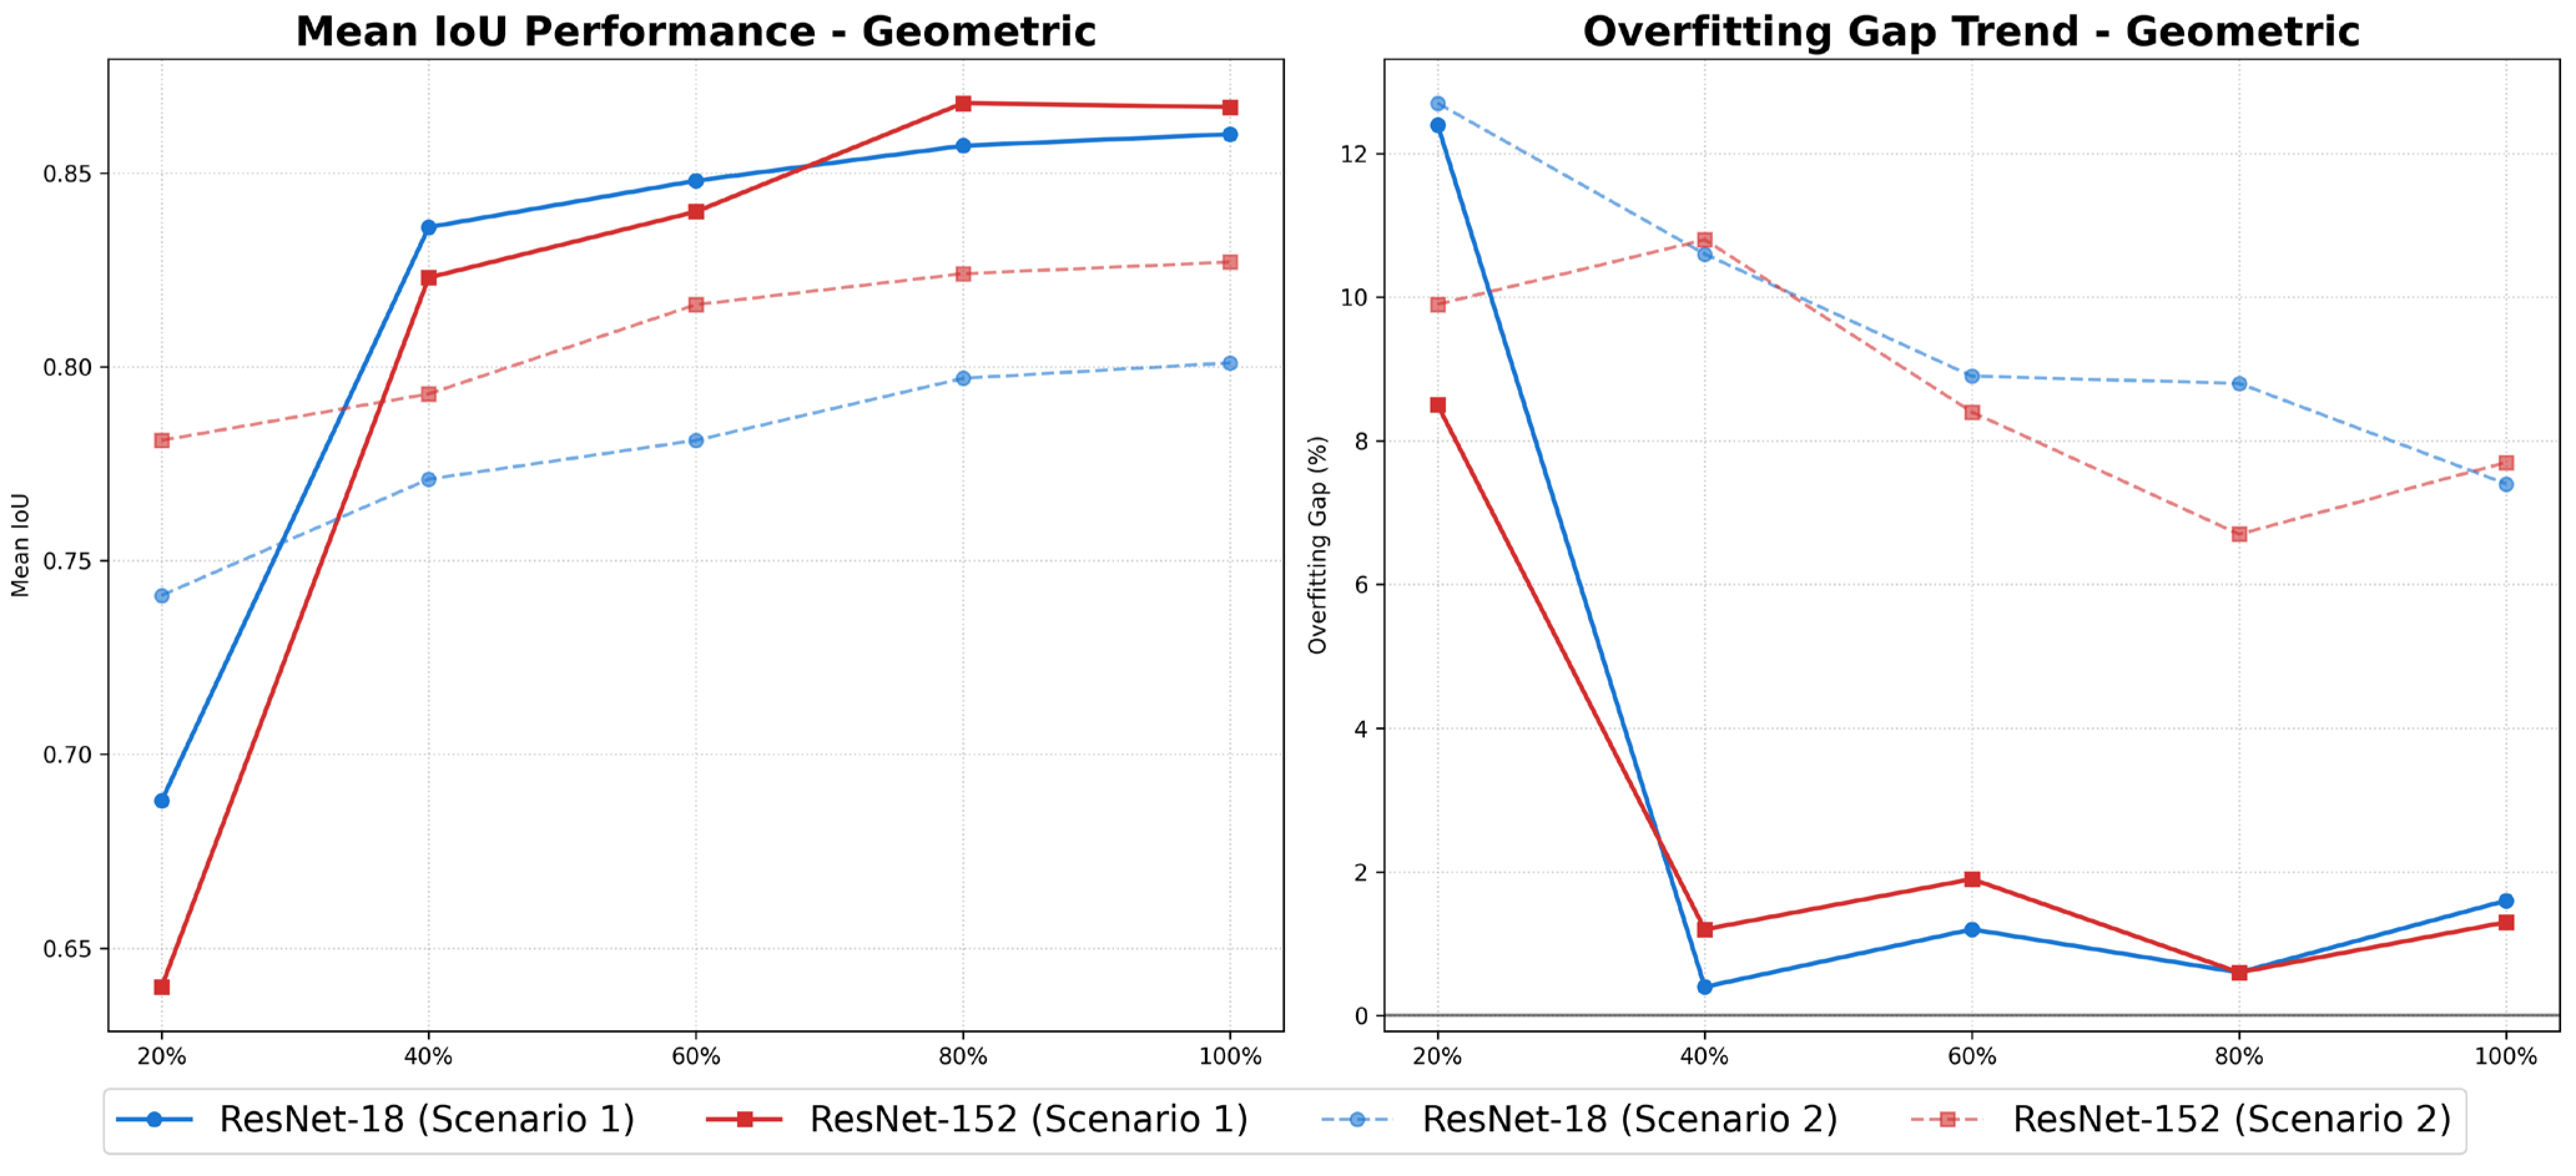
Figure A2.
Segmentation accuracy and overfitting dynamics of ResNet-18 and ResNet-152 under the radiometric augmentation strategy in Scenarios 1 and 2. The left panel shows mean IoU across training data proportions (20–100%), and the right panel illustrates the overfitting gap between training and validation performance. Solid lines correspond to Scenario 1 (WHU → WHU), while dashed lines correspond to Scenario 2 (Japan → Japan).
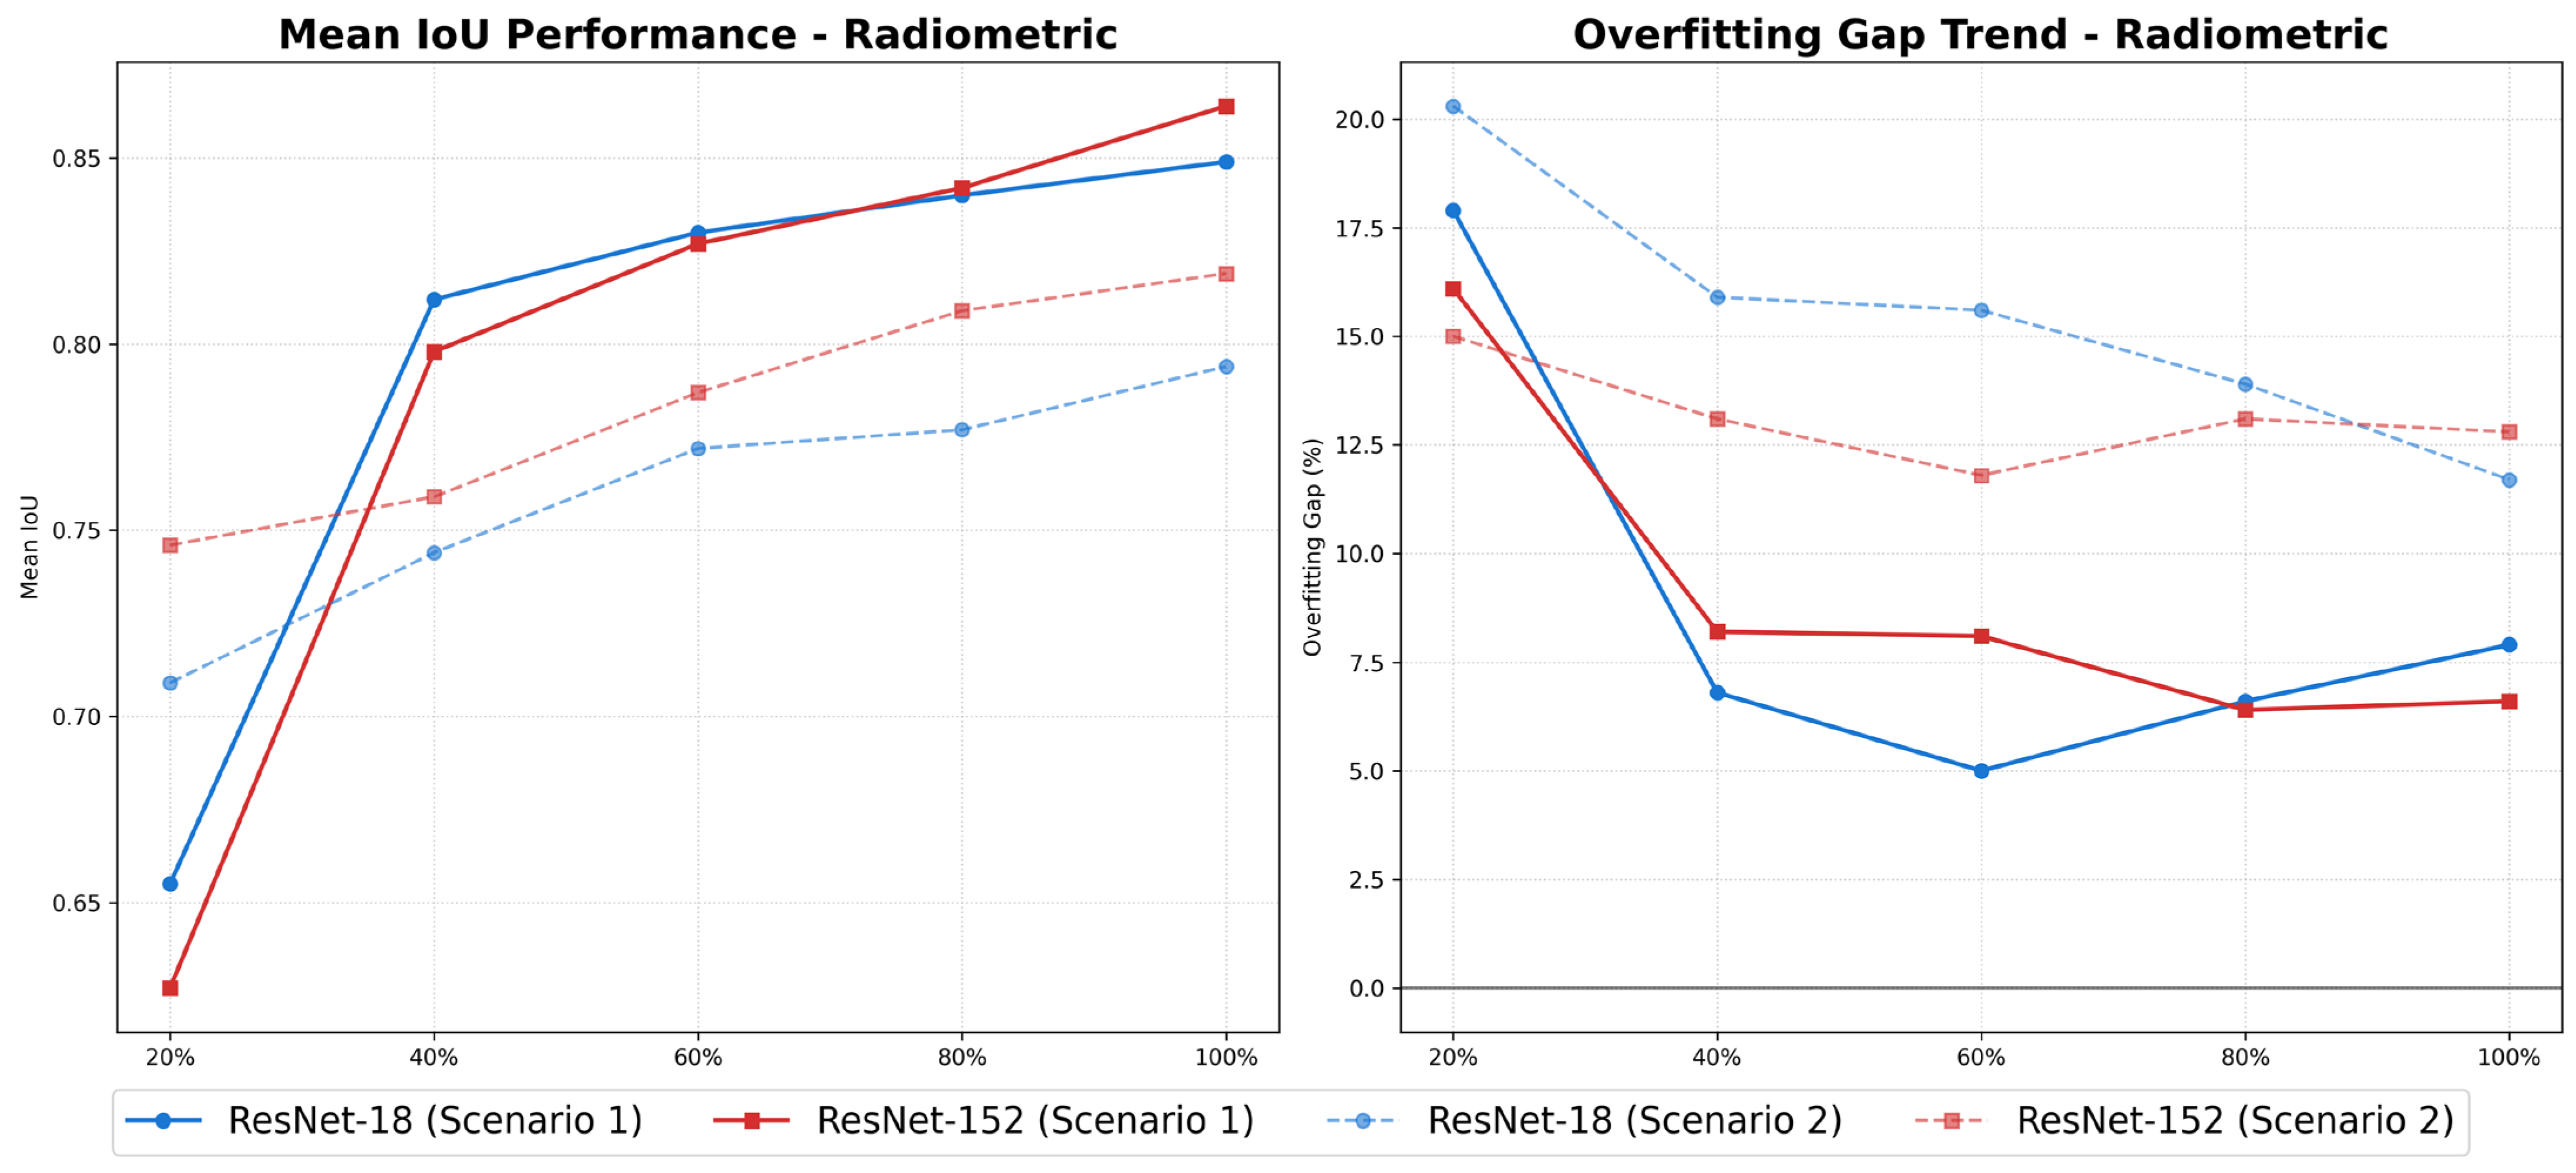
Figure A3.
Segmentation accuracy and overfitting dynamics of ResNet-18 and ResNet-152 under the occlusion augmentation strategy in Scenarios 1 and 2. The left panel shows mean IoU across training data proportions (20–100%), while the right panel illustrates the overfitting gap between training and validation performance. Solid lines correspond to Scenario 1 (WHU → WHU), and dashed lines correspond to Scenario 2 (Japan → Japan).
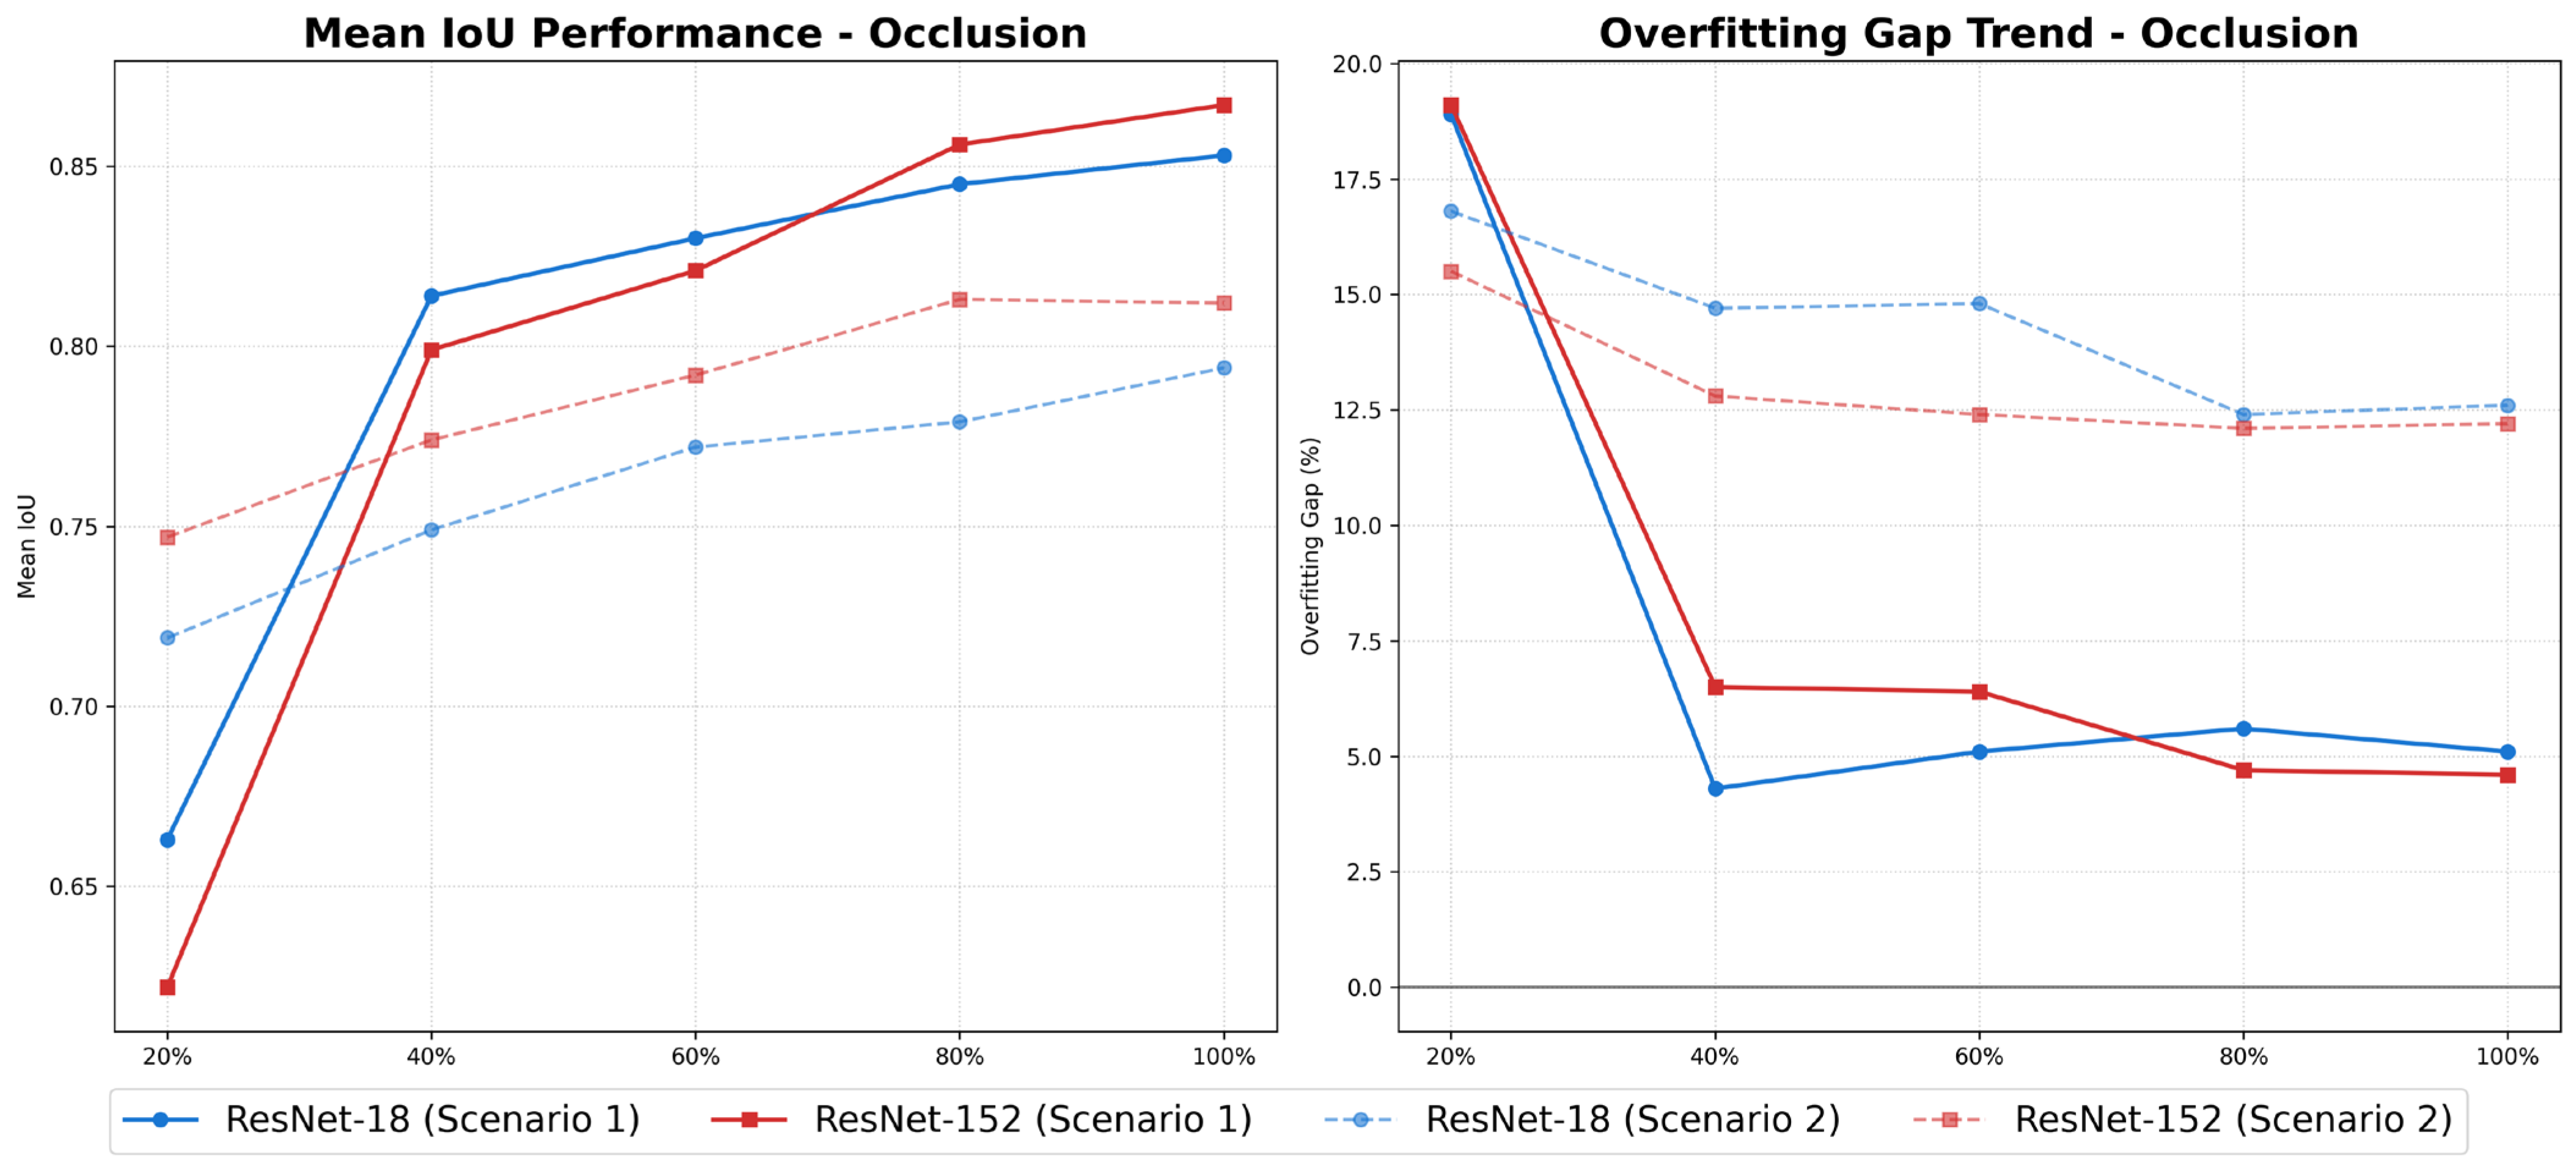
Table A1.
Cross-resolution evaluation of building extraction performance on the HUMG dataset using DeepLabV3+ (ResNet-18). The dataset comprises 6500 UAV-derived patches (512 × 512 pixels) at 10 cm and 30 cm GSD.
Table A2.
Performance validation (mIoU ± STD) across various augmentation strategies using DeepLabV3+ with ResNet-18 backbone under intra-domain conditions (Scenario 1: WHU 30 cm to WHU 30 cm).
Table A3.
Performance validation (mIoU ± STD) across various data augmentation techniques using DeepLabV3+ with ResNet-18 backbone under intra-domain conditions (Scenario 2: Japan 30 cm to Japan 30 cm).
Table A4.
Performance evaluation (mIoU ± STD) across different augmentation strategies using DeepLabV3+ with ResNet-18 backbone under resolution shift conditions (Scenario 3: WHU 30 cm to HUMG 10 cm).
Table A5.
Performance evaluation (mIoU ± STD) across various augmentation strategies using DeepLabV3+ with ResNet-18 backbone under cross-geographic conditions (Scenario 4: Japan 30 cm to Thailand 30 cm).
Table A6.
Overfitting by IoU (%) across various augmentation strategies using DeepLabV3+ with ResNet-18 backbone under intra-domain conditions (Scenario 1: WHU 30 cm to WHU 30 cm).
Table A7.
Overfitting by IoU (%) across various data augmentation techniques using DeepLabV3+ with ResNet-18 backbone under intra-domain conditions (Scenario 2: Japan 30 cm to Japan 30 cm).
Table A8.
Overfitting by IoU (%) across various augmentation strategies using DeepLabV3+ with ResNet-18 backbone under resolution shift conditions (Scenario 3: WHU 30 cm to HUMG 10 cm).
Table A9.
Overfitting by IoU (%) across various augmentation strategies using DeepLabV3+ with ResNet-18 backbone under cross-geographic conditions (Scenario 4: Japan 30 cm to Thailand 30 cm).
Table A10.
Performance validation (mIoU ± STD) across different augmentation strategies using DeepLabV3+ with ResNet-152 backbone under intra-domain conditions (Scenario 1: WHU 30 cm to WHU 30 cm).
Table A11.
Performance validation (mIoU ± STD) across various data augmentation techniques using DeepLabV3+ with ResNet-152 backbone under intra-domain conditions (Scenario 2: Japan 30 cm to Japan 30 cm).
Table A12.
Overfitting by IoU (%) across different augmentation strategies using DeepLabV3+ with ResNet-152 backbone under intra-domain conditions (Scenario 1: WHU 30 cm to WHU 30 cm).
Table A13.
Overfitting by IoU (%) across various data augmentation techniques using DeepLabV3+ with ResNet-152 backbone under intra-domain conditions (Scenario 2: Japan 30 cm to Japan 30 cm).
Table A14.
Performance evaluation (mIoU ± STD) across various augmentation strategies using SegFormer with the MiT-b0 backbone on the 20% dataset for four experimental scenarios.
Table A15.
Overfitting by IoU (%) across various data augmentation techniques using Segformer with MiT-b0 backbone on the 20% dataset for four experimental scenarios.
Table A16.
Computational overhead and training efficiency comparison: non-augmented vs. augmented data on the WHU building dataset using DeepLabV3+ with ResNet-18 backbone.
References
- Song, Y.; Shan, J. Building Extraction from High Resolution Color Imagery Based on Edge Flow Driven Active Contour and JSEG. In Proceedings of the International Archives of the Photogrammetry, Remote Sensing and Spatial Information Sciences (IAPRSIS), Beijing, China, 3–11 July 2008; Volume 37, pp. 185–190. [Google Scholar]
- Xu, Y.; Wu, L.; Xie, Z.; Chen, Z. Building Extraction in Very High Resolution Remote Sensing Imagery Using Deep Learning and Guided Filters. Remote Sens. 2018, 10, 144. [Google Scholar] [CrossRef] [Scilit]
- Yang, D.; Gao, X.; Yang, Y.; Guo, K.; Han, K.; Xu, L. Advances and Future Prospects in Building Extraction from High-Resolution Remote Sensing Images. IEEE J. Sel. Top. Appl. Earth Obs. Remote Sens. 2025, 18, 6994–7016. [Google Scholar] [CrossRef] [Scilit]
- Shetty, A.R.; Krishna Mohan, B. Building Extraction in High Spatial Resolution Images Using Deep Learning Techniques. In Proceedings of the International Conference on Computational Science and Its Applications; Springer: Berlin/Heidelberg, Germany, 2018; pp. 327–338. [Google Scholar]
- He, K.; Zhang, X.; Ren, S.; Sun, J. Spatial Pyramid Pooling in Deep Convolutional Networks for Visual Recognition. IEEE Trans. Pattern Anal. Mach. Intell. 2015, 37, 1904–1916. [Google Scholar] [CrossRef] [Scilit]
- Ji, S.; Wei, S.; Lu, M. Fully Convolutional Networks for Multisource Building Extraction from an Open Aerial and Satellite Imagery Data Set. IEEE Trans. Geosci. Remote Sens. 2018, 57, 574–586. [Google Scholar] [CrossRef] [Scilit]
- Stiller, D.; Stark, T.; Wurm, M.; Dech, S.; Taubenböck, H. Large-Scale Building Extraction in Very High-Resolution Aerial Imagery Using Mask R-CNN. In Proceedings of the 2019 Joint Urban Remote Sensing Event (JURSE); IEEE: New York, NY, USA, 2019; pp. 1–4. [Google Scholar]
- Wang, J.; Yang, X.; Qin, X.; Ye, X.; Qin, Q. An Efficient Approach for Automatic Rectangular Building Extraction from Very High Resolution Optical Satellite Imagery. IEEE Geosci. Remote Sens. Lett. 2014, 12, 487–491. [Google Scholar] [CrossRef] [Scilit]
- Jarrahi, M.H.; Memariani, A.; Guha, S. The Principles of Data-Centric AI (DCAI). arXiv 2022, arXiv:2211.14611. [Google Scholar]
- Ying, X. An Overview of Overfitting and Its Solutions. J. Phys. Conf. Ser. 2019, 1168, 022022. [Google Scholar] [CrossRef] [Scilit]
- Malerba, D.; Pasquadibisceglie, V. Data-Centric AI. J. Intell. Inf. Syst. 2024, 62, 1493–1502. [Google Scholar] [CrossRef] [Scilit]
- Zha, D.; Bhat, Z.P.; Lai, K.-H.; Yang, F.; Jiang, Z.; Zhong, S.; Hu, X. Data-Centric Artificial Intelligence: A Survey. ACM Comput. Surv. 2025, 57, 1–42. [Google Scholar] [CrossRef] [Scilit]
- Kumar, S.; Datta, S.; Singh, V.; Singh, S.K.; Sharma, R. Opportunities and Challenges in Data-Centric AI. IEEE Access 2024, 12, 33173–33189. [Google Scholar] [CrossRef] [Scilit]
- Jakubik, J.; Vössing, M.; Kühl, N.; Walk, J.; Satzger, G. Data-Centric Artificial Intelligence. Bus. Inf. Syst. Eng. 2024, 66, 507–515. [Google Scholar] [CrossRef] [Scilit]
- Weng, Q.; Wang, Q.; Lin, Y.; Lin, J. Are-Net: An Improved Interactive Model for Accurate Building Extraction in High-Resolution Remote Sensing Imagery. Remote Sens. 2023, 15, 4457. [Google Scholar] [CrossRef] [Scilit]
- Alomar, K.; Aysel, H.I.; Cai, X. Data Augmentation in Classification and Segmentation: A Survey and New Strategies. J. Imaging 2023, 9, 46. [Google Scholar] [CrossRef] [Scilit] [PubMed]
- Singh, P. Systematic Review of Data-Centric Approaches in Artificial Intelligence and Machine Learning. Data Sci. Manag. 2023, 6, 144–157. [Google Scholar] [CrossRef] [Scilit]
- Cai, Y.; Yang, Y.; Shang, Y.; Chen, Z.; Shen, Z.; Yin, J. IterDANet: Iterative Intra-Domain Adaptation for Semantic Segmentation of Remote Sensing Images. IEEE Trans. Geosci. Remote Sens. 2022, 60, 5629517. [Google Scholar] [CrossRef] [Scilit]
- Wang, S.; Zang, Q.; Zhao, D.; Fang, C.; Quan, D.; Wan, Y.; Guo, Y.; Jiao, L. Select, Purify, and Exchange: A Multisource Unsupervised Domain Adaptation Method for Building Extraction. IEEE Trans. Neural Netw. Learn. Syst. 2023, 35, 16091–16105. [Google Scholar] [CrossRef] [Scilit]
- Hu, J.; Qi, L.; Zhang, J.; Shi, Y. Domain Generalization via Inter-Domain Alignment and Intra-Domain Expansion. Pattern Recognit. 2024, 146, 110029. [Google Scholar] [CrossRef] [Scilit]
- Xie, S.; Niu, Z.; Huang, H.; Sun, H.; Qin, R.; Chen, Y.-W.; Lin, L. IS2Net: Intra-Domain Semantic and Inter-Domain Style Enhancement for Semi-Supervised Medical Domain Generalization. In Proceedings of the 31st ACM International Conference on Multimedia, Ottawa, ON, Canada, 29 October–3 November 2023; pp. 8285–8293. [Google Scholar]
- Mazumder, M.; Banbury, C.; Yao, X.; Karlaš, B.; Gaviria Rojas, W.; Diamos, S.; Diamos, G.; He, L.; Parrish, A.; Kirk, H.R. Dataperf: Benchmarks for Data-Centric Ai Development. Adv. Neural Inf. Process. Syst. 2023, 36, 5320–5347. [Google Scholar]
- Moulya, B.M.; Nandini, N.S. Opportunities and Challenges Shaping the Future of Data-Centric AI. Int. J. Eng. Dev. Res. 2025, 13, 616–619. [Google Scholar] [CrossRef] [Scilit]
- Chen, L.-C.; Papandreou, G.; Schroff, F.; Adam, H. Rethinking Atrous Convolution for Semantic Image Segmentation. arXiv 2017, arXiv:1706.05587. [Google Scholar] [CrossRef] [Scilit]
- Liu, W.; Yue, A.; Shi, W.; Ji, J.; Deng, R. An Automatic Extraction Architecture of Urban Green Space Based on DeepLabv3plus Semantic Segmentation Model; IEEE: New York, NY, USA, 2019; pp. 311–315. [Google Scholar]
- Dey, E.K.; Awrangjeb, M. A Robust Performance Evaluation Metric for Extracted Building Boundaries from Remote Sensing Data. IEEE J. Sel. Top. Appl. Earth Obs. Remote Sens. 2020, 13, 4030–4043. [Google Scholar] [CrossRef] [Scilit]
- Jung, H.; Choi, H.-S.; Kang, M. Boundary Enhancement Semantic Segmentation for Building Extraction from Remote Sensed Image. IEEE Trans. Geosci. Remote Sens. 2021, 60, 5215512. [Google Scholar] [CrossRef] [Scilit]
- Chen, S.; Ogawa, Y.; Zhao, C.; Sekimoto, Y. Large-Scale Individual Building Extraction from Open-Source Satellite Imagery via Super-Resolution-Based Instance Segmentation Approach. ISPRS J. Photogramm. Remote Sens. 2023, 195, 129–152. [Google Scholar] [CrossRef] [Scilit]
- Taniguchi, T.; Ueda, Y.; Muramatsu, A.; Hashimoto, K.; Yagi, R.; Ochiai, H.; Aswakul, C. University Building Recognition Dataset in Thailand for the Mission-Oriented IoT Sensor System. arXiv 2025, arXiv:2512.05468. [Google Scholar]
- Pham, D.T.; Tran, T.V.; Zhu, X.; Pham, H.N. Optimising Deep Learning for Building Extraction: Dataset Efficiency and Model Backbones under Data Constraints. Remote Sens. Appl. Soc. Environ. 2026, 41, 101876. [Google Scholar] [CrossRef] [Scilit]
- Sierra, S.; Ramo, R.; Padilla, M.; Cobo, A. Optimizing Deep Neural Networks for High-Resolution Land Cover Classification through Data Augmentation. Environ. Monit. Assess. 2025, 197, 423. [Google Scholar] [CrossRef] [Scilit]
- Fong, R.; Vedaldi, A. Occlusions for Effective Data Augmentation in Image Classification. In Proceedings of the 2019 IEEE/CVF International Conference on Computer Vision Workshop (ICCVW); IEEE: New York, NY, USA, 2019; pp. 4158–4166. [Google Scholar]
- Kaur, P.; Khehra, B.S.; Mavi, E.B.S. Data Augmentation for Object Detection: A Review. In Proceedings of the 2021 IEEE International Midwest Symposium on Circuits and Systems (MWSCAS); IEEE: New York, NY, USA, 2021; pp. 537–543. [Google Scholar]
- Reyad, M.; Sarhan, A.M.; Arafa, M. A Modified Adam Algorithm for Deep Neural Network Optimization. Neural Comput. Appl. 2023, 35, 17095–17112. [Google Scholar] [CrossRef] [Scilit]
- Bertels, J.; Eelbode, T.; Berman, M.; Vandermeulen, D.; Maes, F.; Bisschops, R.; Blaschko, M.B. Optimizing the Dice Score and Jaccard Index for Medical Image Segmentation: Theory and Practice. In Proceedings of the International Conference on Medical Image Computing and Computer-Assisted Intervention; Springer: Berlin/Heidelberg, Germany, 2019; pp. 92–100. [Google Scholar]
- Csurka, G.; Larlus, D.; Perronnin, F.; Meylan, F. What Is a Good Evaluation Measure for Semantic Segmentation? In Proceedings of the BMVC, Bristol, UK, 9–13 September 2013; BMVA: Bristol, UK, 2013; Volume 27, pp. 10–5244. [Google Scholar]
- Volpi, R.; Namkoong, H.; Sener, O.; Duchi, J.C.; Murino, V.; Savarese, S. Generalizing to Unseen Domains via Adversarial Data Augmentation. In Advances in Neural Information Processing Systems, Proceedings of the NeurIPS 2018, Montreal, QC, Canada, 3–8 December 2018; Neural Information Processing Systems Foundation, Inc.: San Diego, CA, USA, 2018; Volume 31. [Google Scholar]
- Zha, D.; Bhat, Z.P.; Lai, K.-H.; Yang, F.; Hu, X. Data-Centric Ai: Perspectives and Challenges. In Proceedings of the 2023 SIAM International Conference on Data Mining (SDM); SIAM: Philadelphia, PA, USA, 2023; pp. 945–948. [Google Scholar]
- Hao, X.; Liu, L.; Yang, R.; Yin, L.; Zhang, L.; Li, X. A Review of Data Augmentation Methods of Remote Sensing Image Target Recognition. Remote Sens. 2023, 15, 827. [Google Scholar] [CrossRef] [Scilit]
- Yan, Y.; Zhang, Y.; Su, N. A Novel Data Augmentation Method for Detection of Specific Aircraft in Remote Sensing RGB Images. IEEE Access 2019, 7, 56051–56061. [Google Scholar] [CrossRef] [Scilit]
- Lalitha, V.; Latha, B. A Review on Remote Sensing Imagery Augmentation Using Deep Learning. Mater. Today Proc. 2022, 62, 4772–4778. [Google Scholar] [CrossRef] [Scilit]
- He, K.; Zhang, X.; Ren, S.; Sun, J. Deep Residual Learning for Image Recognition; IEEE: New York, NY, USA, 2016; pp. 770–778. [Google Scholar]

Disclaimer/Publisher’s Note: The statements, opinions and data contained in all publications are solely those of the individual author(s) and contributor(s) and not of MDPI and/or the editor(s). MDPI and/or the editor(s) disclaim responsibility for any injury to people or property resulting from any ideas, methods, instructions or products referred to in the content. |
© 2026 by the authors. Licensee MDPI, Basel, Switzerland. This article is an open access article distributed under the terms and conditions of the Creative Commons Attribution (CC BY) license.