


Highlights
What are the main findings?
- Compound drought and heatwaves suppressed gross primary productivity in water-limited northern regions but generally enhanced it in energy-limited southern areas.
- Vegetation type mediates resilience: northern structurally simple vegetation (e.g., shrublands) is more vulnerable, whereas southern forests better buffer against compound drought and heatwave stress.
What are the implications of the main findings?
- Temperate and subtropical ecosystems exhibit divergent sensitivities to compound extremes, highlighting the need for region-specific management.
- Quantifying gross primary productivity responses provides critical benchmarks for ecosystem carbon management and climate adaptation strategies.
Abstract
Compound Drought and Heatwave (CDH) events increasingly threaten terrestrial carbon uptake, yet the spatiotemporal heterogeneity of Gross Primary Productivity (GPP) responses in urban agglomerations remains unclear. This study analyzed CDH impacts in China’s three major urban agglomerations, namely the Beijing–Tianjin–Hebei (BTH), Yangtze River Delta (YRD), and Pearl River Delta (PRD) regions, using ERA5 and satellite GPP data (GOSIF and FluxSat) for representative CDH years (2007 for BTH; 2022 for YRD and PRD). CDH conditions exhibited a coherent hot–dry coupling, with temperature anomalies of 0.46–1.26 K and soil moisture deficits of −0.042 to −0.169 m3 m−3, accompanied by enhanced atmospheric dryness. Pronounced spatial heterogeneity in GPP responses aligned with regional climatic regimes and ecosystem types. The water-limited BTH region exhibited significant GPP deficits, with anomalies of −1.13 Standard Deviations (STD) and −0.96 STD for GPPFluxSat and GPPGOSIF, respectively. Conversely, the energy-limited regions showed positive anomalies: the YRD recorded +0.32 and +1.79 STD, while the PRD reached +1.86 and +1.06 STD for GPPFluxSat and GPPGOSIF, respectively. Mechanistically, the north–south contrast suggests a transition from water-limited vulnerability to energy-limited resilience, with vegetation traits and management (e.g., potential irrigation buffering in croplands and deeper water access in forests) modulating sensitivity to atmospheric dryness. These findings provide quantitative benchmarks for improving regional carbon-cycle assessments and adaptation planning under increasing compound extremes.
1. Introduction
Compound Drought and Heatwave (CDH) events represent a distinct type of extreme climate phenomenon driven by climate change and characterized by amplified synergistic impacts [1,2,3,4]. In recent years, such events have occurred with increasing frequency worldwide and, under continued global warming, are expected to severely impact carbon uptake by terrestrial ecosystems [5,6,7]. As a key indicator of ecosystem carbon sequestration, Gross Primary Productivity (GPP) responds sensitively to environmental stressors and thus provides a robust measure of vegetation responses and adaptive capacity [8].
Extensive research has demonstrated that concurrent heatwaves and droughts exert compound impacts that exceed the sum of their individual effects. These events accelerate soil moisture depletion and elevate evapotranspiration, triggering stomatal closure that severely constrains photosynthesis and reduces GPP [9,10,11]. While elevated Vapor Pressure Deficit (VPD) and reduced Soil Moisture (SM) are identified as primary drivers, their relative importance varies regionally [1,11,12,13,14,15]. For instance, Wang et al. (2025) found that both diminished SM and elevated VPD drove GPP decline in southwestern China [16], whereas Zhao et al. (2023) identified SM depletion as the dominant factor in southern China during the 2022 CDH event, with VPD playing a minor role [12]. These findings underscore the complexity of the physical driving mechanisms underlying CDH events.
In China, the ecological consequences of these climatic drivers are further modulated by vegetation structure and background climate zones. Regarding vegetation type, structurally simpler ecosystems often show higher sensitivity. Chen et al. (2024) systematically compared responses between crops and forests, finding that managed ecosystems (e.g., crops) exhibited greater vulnerability than forests [14], while Zhu et al. (2025) similarly observed notably higher vulnerability in shrubs compared to other types in the Yangtze River Basin [17]. Beyond vegetation structure, the response is also contingent on the climate zone. Liu et al. (2025) demonstrated that in mid-latitude regions (especially temperate zones), the ecosystem response diverges sharply based on the event nature: while ‘compound dry–hot’ events significantly reduce GPP due to water stress, ‘compound humid–hot’ events in the same zones often lead to increased productivity [18]. Despite this growing understanding of how natural vegetation and climate zones modulate GPP anomalies [19,20,21], comprehensive evaluations within major urban agglomerations remain limited. Specifically, how the unique mosaic of vegetation types within these anthropogenically intense regions responds to CDH events remains poorly understood.
Therefore, this study focuses on China’s three major urban agglomerations, namely Beijing–Tianjin–Hebei (BTH), the Yangtze River Delta (YRD), and the Pearl River Delta (PRD). Spanning a climatic gradient from the semi-humid temperate north (BTH) to the humid subtropical south (YRD and PRD) [22,23,24,25,26], these regions offer a unique natural laboratory to investigate how distinct hydro-thermal backgrounds and vegetation mosaics modulate ecosystem carbon sensitivity to CDH events. By focusing on historically extreme CDH years (e.g., 2007 for BTH and 2022 for YRD/PRD), this paper integrates meteorological reanalysis data with multi-source GPP products to ensure robust cross-validation of carbon flux anomalies. We hypothesized that ecosystems in the Temperate North and Subtropical South would exhibit divergent sensitivities to CDH events, primarily driven by differences in background water availability and vegetation structure. The main objectives of this study are to: (1) characterize the spatiotemporal intensity of CDH events and associated climatic anomalies (temperature, soil moisture, VPD, and radiation); (2) reveal the dominant physical drivers controlling GPP across different climatic zones; and (3) evaluate the differential vulnerability and resistance of diverse vegetation types within these anthropogenically intense regions.
2. Materials and Methods
2.1. Study Area
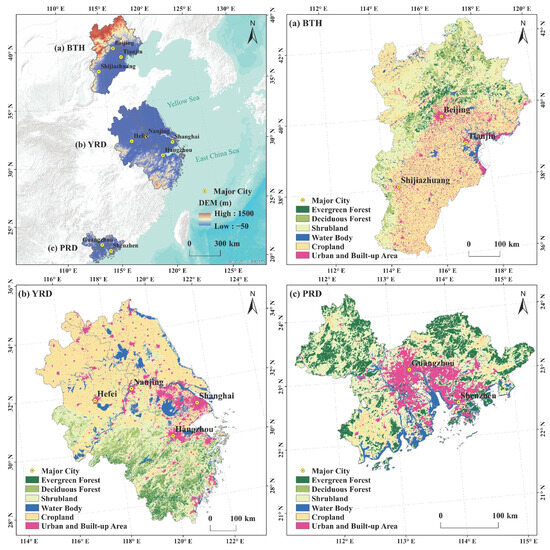
This study focuses on three strategic regions geographically distributed along the distinct climatic gradient of eastern China: BTH, YRD, and PRD (Figure 1). The BTH region (113°04′–119°53′E, 36°01′–42°37′N) is characterized by a typical temperate monsoon climate, with an annual mean temperature of approximately 10–12 °C and an average annual precipitation of 350–700 mm [23]. Transitioning southward, the YRD region (114°54′–122°12′E, 27°12′–35°20′N) exhibits a typical subtropical monsoon climate [27]. This region serves as a climatic transition zone with relatively higher moisture availability (annual precipitation: 1100–1400 mm) and moderate temperatures (14–18 °C) [28]. The southernmost PRD region (111°21′–115°25′E, 21°34′–24°24′N) belongs to the south subtropical humid zone [23]. Characterized by abundant heat and rainfall, it maintains an annual mean temperature above 21 °C and precipitation ranging from 1600 to 2300 mm [29]. This latitudinal transect encompasses a wide array of ecosystem types—including forests, shrubs, and extensive croplands—allowing for a comprehensive assessment of vegetation vulnerability across diverse hydro-thermal backgrounds.
Figure 1.
Location and land use/land cover (LULC) characteristics of three major urban agglomerations in China. The upper-left panel shows the geographic locations and digital elevation model (DEM) of (a) Beijing-Tianjin-Hebei (BTH), (b) Yangtze River Delta (YRD), and (c) Pearl River Delta (PRD) regions. The corresponding LULC classification maps for (a) BTH, (b) YRD, and (c) PRD are presented, with six land cover types identified: evergreen forest, deciduous forest, shrubland, water body, cropland, and urban and built-up area. Major cities within each urban agglomeration are marked with yellow dots. The scale bars represent 100 km for the LULC maps and 300 km for the location map.
2.2. Datasets
2.2.1. Climate Data
Meteorological drivers, including 2 m air temperature (T2m), volumetric soil moisture (SM) in three layers (0–7 cm, 7–28 cm, and 28–100 cm), Downward Solar Radiation (DSR), and dew point temperature (Td), were derived from the ERA5-Land monthly averaged dataset. These data, spanning from 2002 to 2022 with a spatial resolution of 0.1° × 0.1°, were retrieved from the Copernicus Climate Data Store (https://cds.climate.copernicus.eu, accessed on 12 June 2025). The Vapor Pressure Deficit (VPD, kPa) was subsequently calculated based on T2m and Td using the following equation [30]:
2.2.2. GPP Data
GPP represents the total carbon fixed by terrestrial ecosystems via photosynthesis and serves as a critical metric for vegetation productivity. To ensure robust analysis, this study utilized two independent global GPP products: GPPGOSIF and GPPFluxSat. The GPPGOSIF product is derived from OCO-2 Solar-Induced chlorophyll Fluorescence (SIF) data. Validated against flux tower observations, it demonstrates high accuracy in capturing global spatiotemporal GPP patterns and seasonal cycles. The dataset is available at http://data.globalecology.unh.edu/data/GOSIF-GPP_v2/ (accessed on 1 October 2025). The GPPFluxSat product (Version 2.2) integrates MODIS reflectance with machine learning algorithms trained on FLUXNET 2015 and OneFlux datasets. These data can be accessed via https://avdc.gsfc.nasa.gov/pub/tmp/FluxSat_GPP/ (accessed on 12 June 2025). Both datasets provide global coverage at a 0.05° resolution starting from March 2000. For this study, data for the July–August–September (JAS) season were extracted and spatially resampled to 0.1° to align with other environmental variables.
2.2.3. Data on Land Cover and Vegetation Indices
Land cover data were derived from the MODIS MCD12Q1 V6.1 product (https://modis.gsfc.nasa.gov/data/dataprod/mod12.php, accessed on 12 June 2025) [31], which classifies global land cover into 17 types based on the International Geosphere–Biosphere Programme (IGBP) scheme [32]. Annual maps from 2002 to 2022 were acquired via Google Earth Engine (GEE), clipped to the study area, and resampled to a 0.1° resolution.
Additionally, the Enhanced Vegetation Index (EVI) was obtained from the MODIS Vegetation Indices Monthly L3 Global 0.05° CMG product (MOD13C2; https://lpdaac.usgs.gov/products/mod13c2v061/, accessed on 12 June 2025), which served as a proxy for vegetation greenness and activity [33]. Monthly EVI data at 0.05° resolution covering the 2002–2022 period were downloaded and subsequently aggregated to a 0.1° spatial resolution to match the GPP datasets.
2.3. Methods
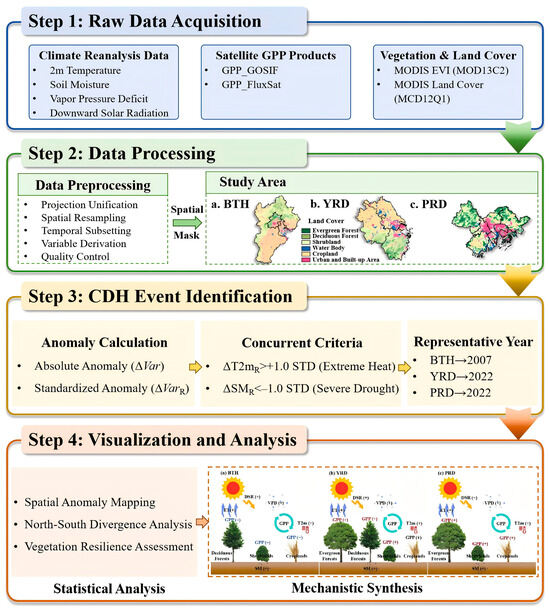
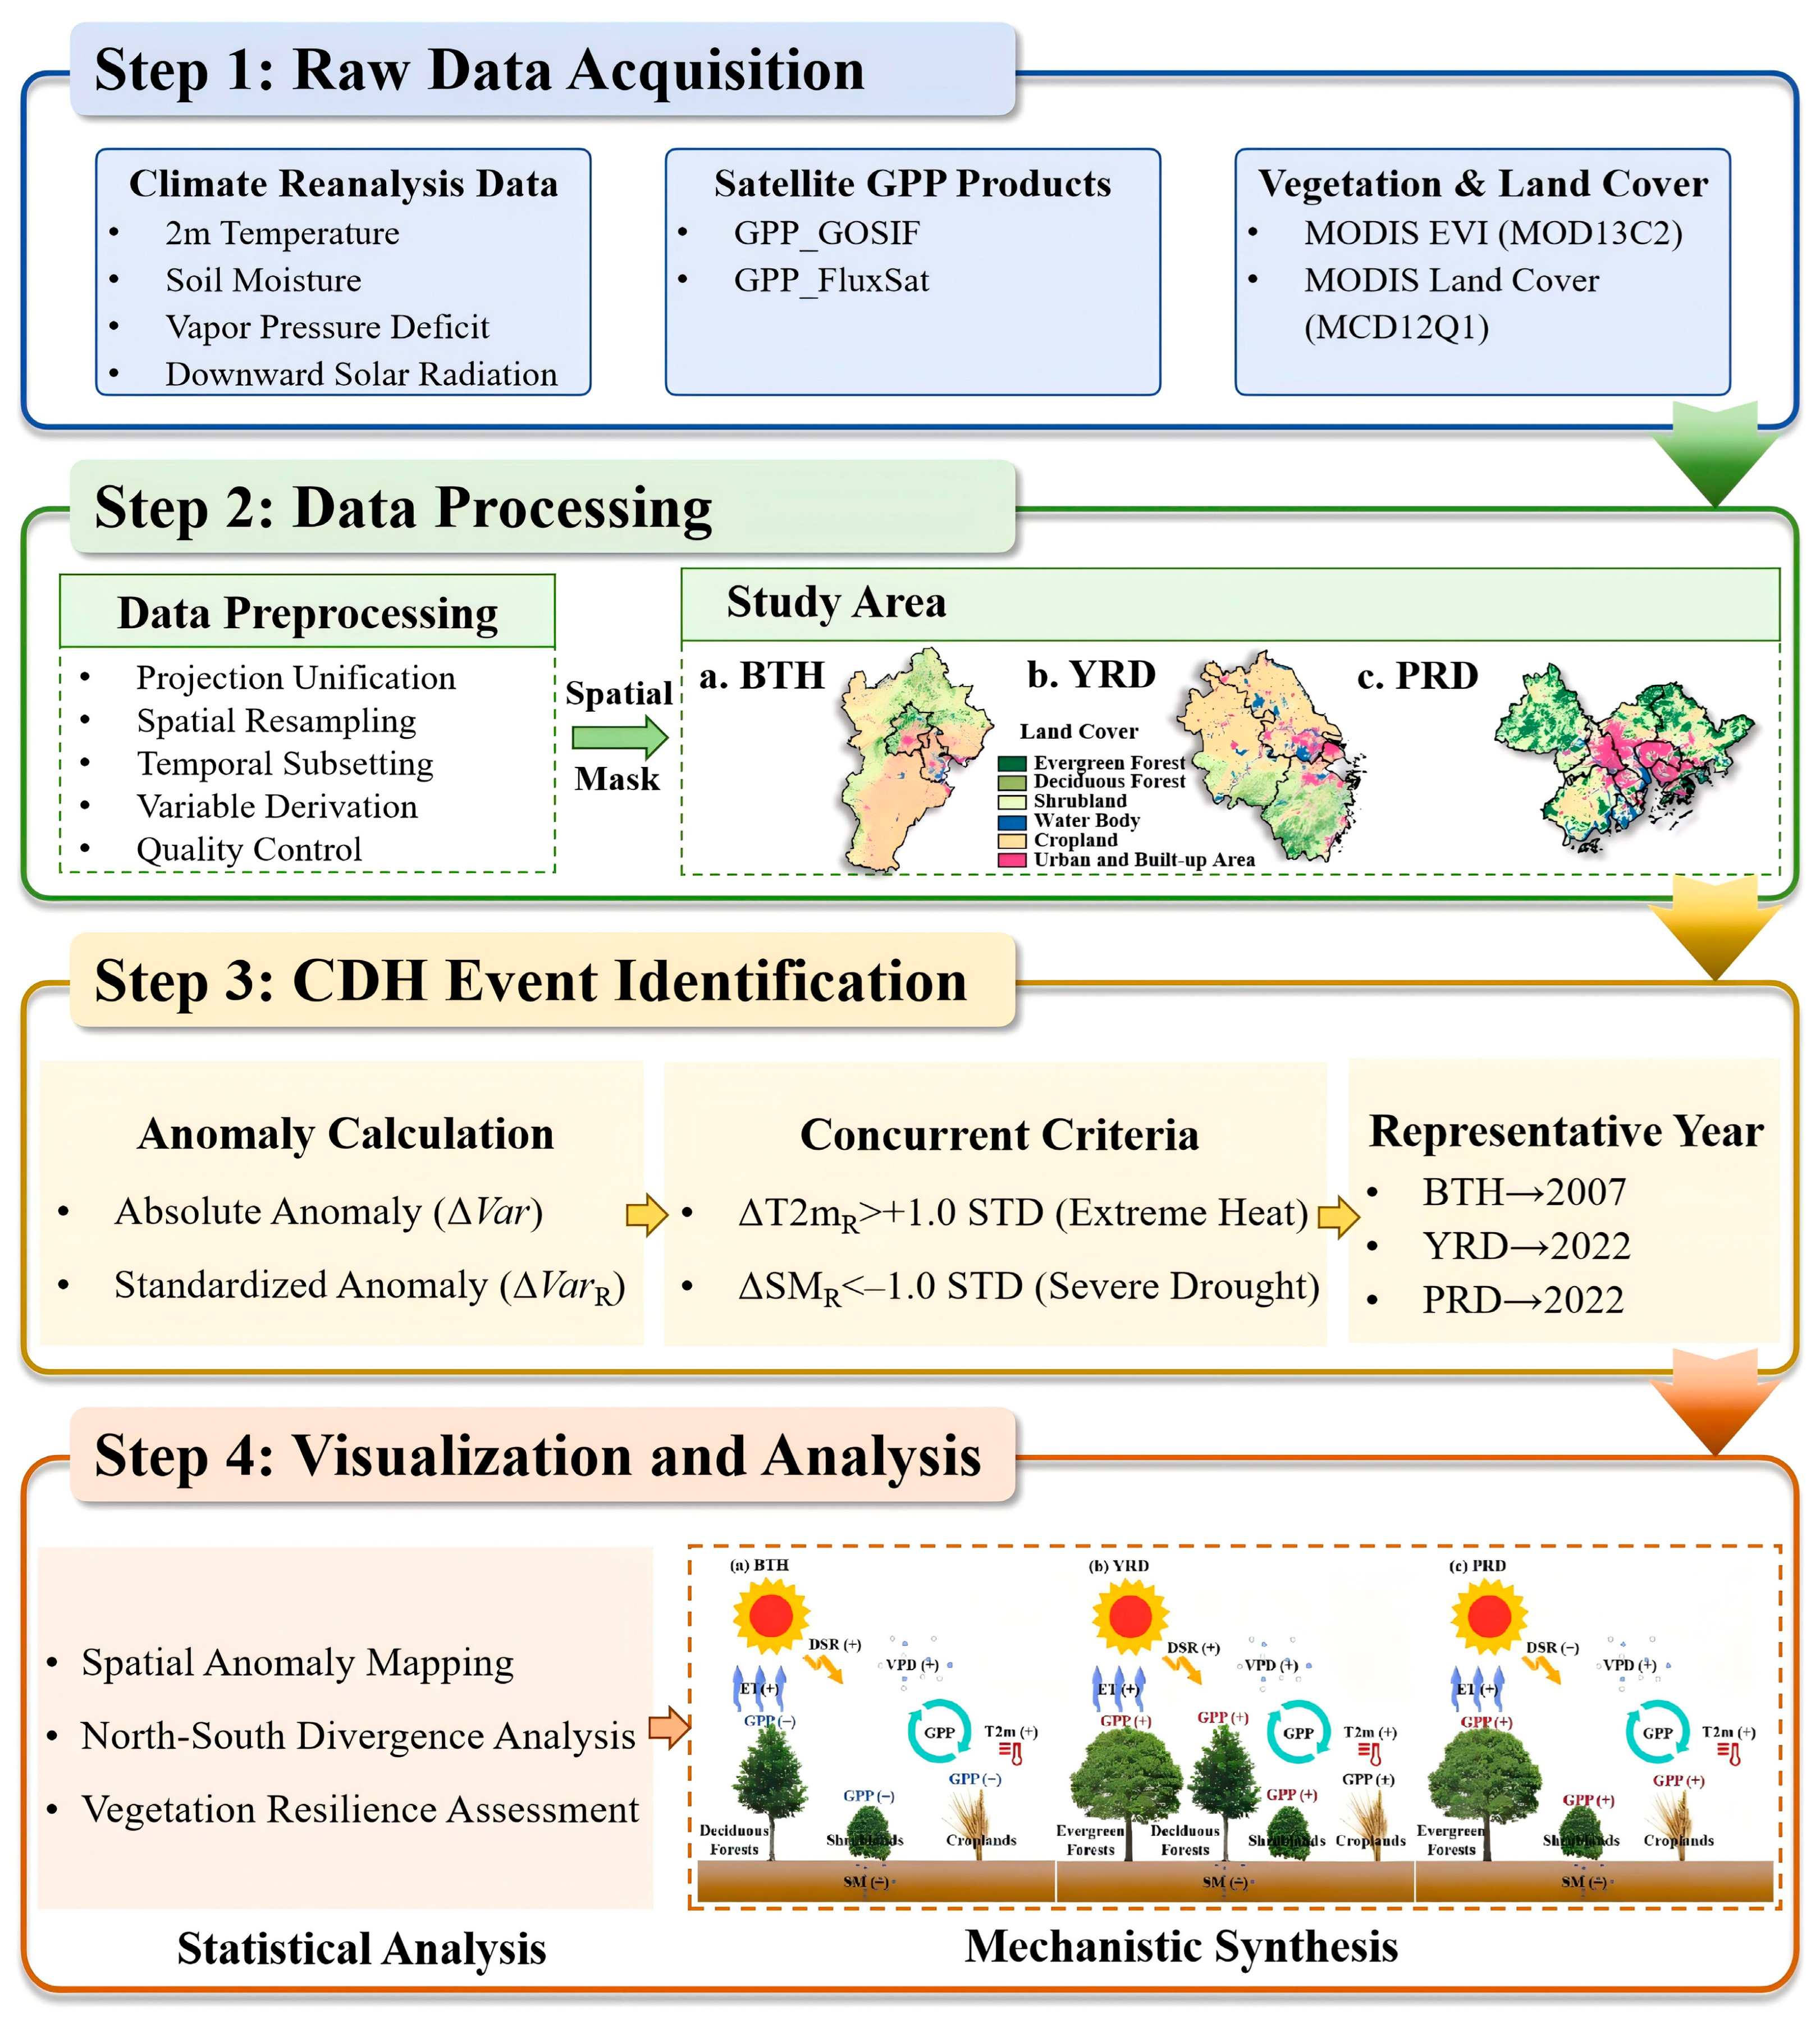
The overall analytical framework of this study is summarized in Figure 2. The methodology comprises four main steps: (1) multi-source data acquisition, including ERA5-Land climate reanalysis data, two independent satellite-based GPP products (GOSIF and FluxSat), and MODIS-derived land cover and vegetation index data; (2) data preprocessing, which involves projection unification, spatial resampling to a common 0.1° grid, temporal subsetting to the July–August–September (JAS) growing season, derived variable computation (e.g., VPD from temperature and dew point), and the application of region-specific spatial masks to extract data for the BTH, YRD, and PRD urban agglomerations; (3) identification of representative CDH years based on concurrent standardized anomaly thresholds; and (4) comprehensive analysis of climate–vegetation interactions through spatial anomaly mapping, statistical assessment, and mechanistic interpretation. The detailed procedures for each step are described in the following subsections.
Figure 2.
Methodological flowchart illustrating the analytical framework of this study.
2.3.1. Calculation of Anomalies
To characterize deviations in climate and vegetation dynamics, absolute anomalies (ΔVar) were computed for a suite of key variables, including T2m, SM, VPD, DSR, GPP, and EVI. These anomalies were initially calculated relative to the climatological mean of the baseline period from 2002 to 2022 [34], as expressed in Equation (2):
where Var is the value of a given variable during the identified CDH events, and is the climatological mean over the baseline period (2002–2022).
To facilitate comparison across variables with different units and magnitudes, standardized anomalies (ΔVarR) were derived by dividing the absolute anomalies by their respective Standard Deviations (STD) [34,35], as shown in Equation (3):
where ΔVar refers to the absolute anomaly, and STD represents the standard deviation over the observation period (2002–2022). This standardization process ensures that the resulting indices reflect relative deviations from normal conditions, thereby enabling a robust statistical assessment of climate-vegetation interactions.
2.3.2. Identification of CDH Events and Statistical Analysis
To identify representative CDH events, we adopted a threshold-based approach using standardized anomalies. A year was defined as a CDH year for a specific region if it met the following concurrent criteria during the summer season (July–September): (1) the standardized anomaly of T2m exceeded +1.0 STD, indicating extreme heat; and (2) the standardized anomaly of SM was below −1.0 STD, indicating severe water deficit. Based on these criteria, we screened the time series from 2002 to 2022. In cases where multiple years met the criteria, the event with the highest combined intensity of heat and drought anomalies was selected as the representative year for the urban agglomeration.
To evaluate the impacts on vegetation, we employed two statistical methods. First, we utilized Probability Density Functions (PDFs) based on Kernel Density Estimation (KDE) to visualize the shift in the distribution of GPP and EVI anomalies across different vegetation types under CDH conditions relative to the climatological baseline. Second, boxplots were generated to quantify the dispersion and central tendency of vegetation responses, allowing for the identification of outliers and the comparison of resilience between simple ecosystems (crops/shrubs) and complex ecosystems (forests).
3. Results
3.1. Spatiotemporal Characteristics of Climate Anomalies
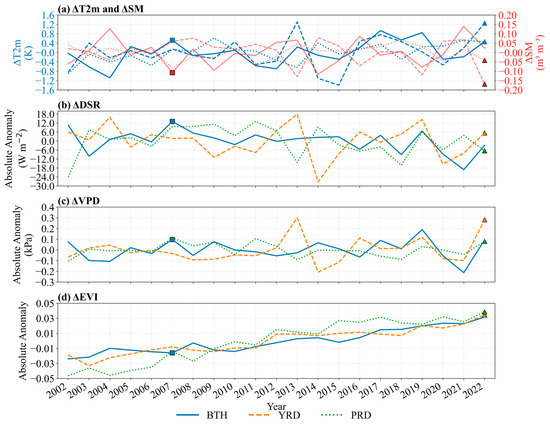
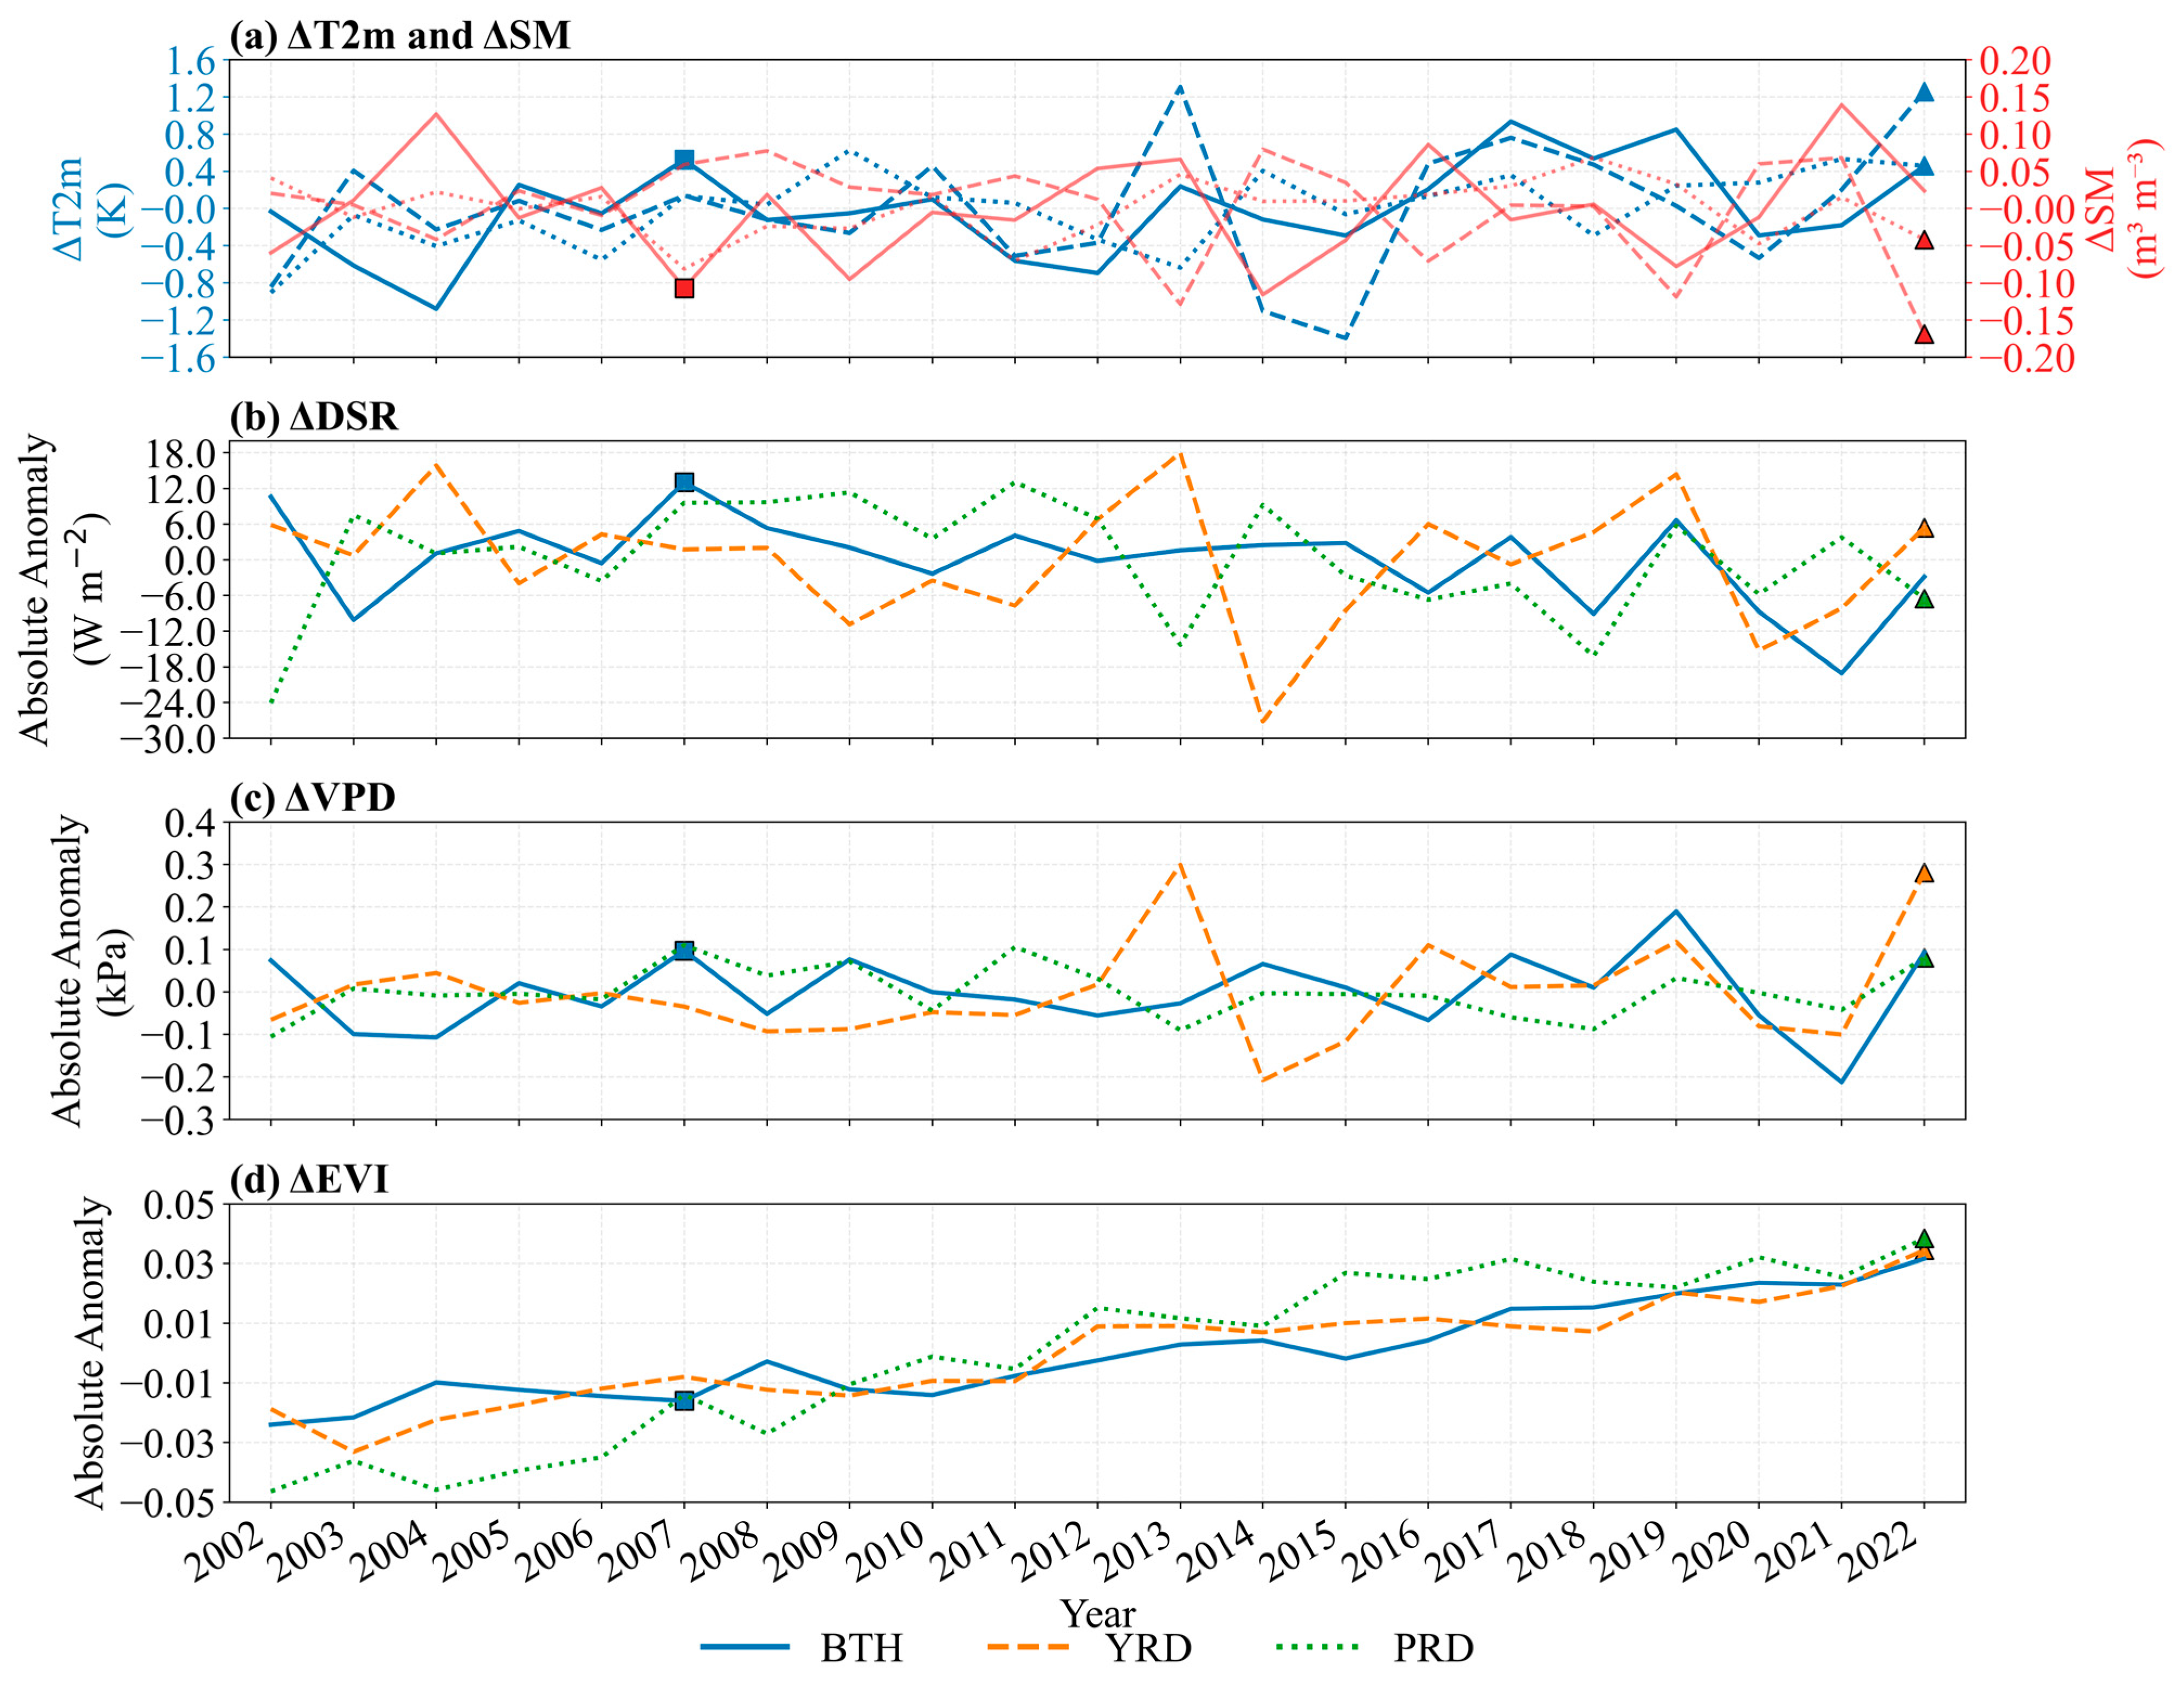
From a temporal perspective, specific CDH years were identified for each region by applying the threshold-based criteria. In the BTH region, both 2007 and 2019 emerged as candidates (Table 1). However, 2007 was selected as the representative year due to its pronounced compound structure. While 2019 exhibited a higher temperature anomaly (+0.85 K), it lacked a severe hydrological deficit (SM: −0.078 m3 m−3). In contrast, 2007 was characterized by a critical soil moisture deficit (−0.107 m3 m−3) coupled with significant positive anomalies in T2m (+0.52 K), VPD (0.097 kPa), and notably, DSR (13.04 W m−2), indicating a radiation-driven compound event. In the YRD region, the 2022 event was prioritized over 2013. Although 2013 recorded a marginally higher thermal anomaly (+1.31 K), 2022 represented a more severe compound stress, driven by the region’s most extreme negative SM anomaly (−0.169 m3 m−3) alongside a comparable high temperature (+1.26 K). Finally, for the PRD region, 2022 emerged as the sole year meeting the strict CDH criteria, recording concurrent anomalies in T2m (+0.46 K), SM (−0.042 m3 m−3), and VPD (0.080 kPa). Consequently, 2007 (BTH), 2022 (YRD), and 2022 (PRD) were designated as the representative years for subsequent analysis (Figure 3).
Table 1.
Absolute anomalies of climate and vegetation variables during CDH years in the three major urban agglomerations. Representative years are 2007 for Beijing–Tianjin–Hebei (BTH), and 2022 for both the Yangtze River Delta (YRD) and the Pearl River Delta (PRD). Climate variables include 2 m air temperature (T2m), soil moisture (SM), vapor pressure deficit (VPD), and downward solar radiation (DSR). Vegetation variables include gross primary productivity derived from GOSIF (GPPGOSIF) and FluxSat (GPPFluxSat), and the Enhanced Vegetation Index (EVI).
Figure 3.
Time series of July–August–September (JAS) absolute anomalies in climate and vegetation variables across the Beijing–Tianjin–Hebei (BTH), Yangtze River Delta (YRD), and Pearl River Delta (PRD) urban agglomerations (2002–2022). Variables include (a) 2 m air temperature (ΔT2m) and soil moisture (ΔSM); (b) downward shortwave radiation (ΔDSR); (c) vapor pressure deficit (ΔVPD); and (d) Enhanced Vegetation Index (ΔEVI). In panel (a), blue and red lines denote ΔT2m and ΔSM, respectively, while solid, dashed, and dotted line styles represent the BTH, YRD, and PRD regions, respectively. Squares and triangles indicate the compound drought and heatwave (CDH) events in 2007 and 2022, respectively.
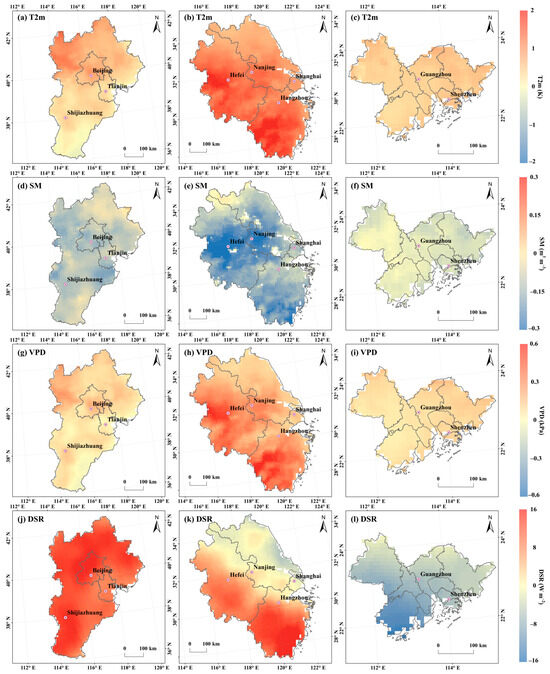
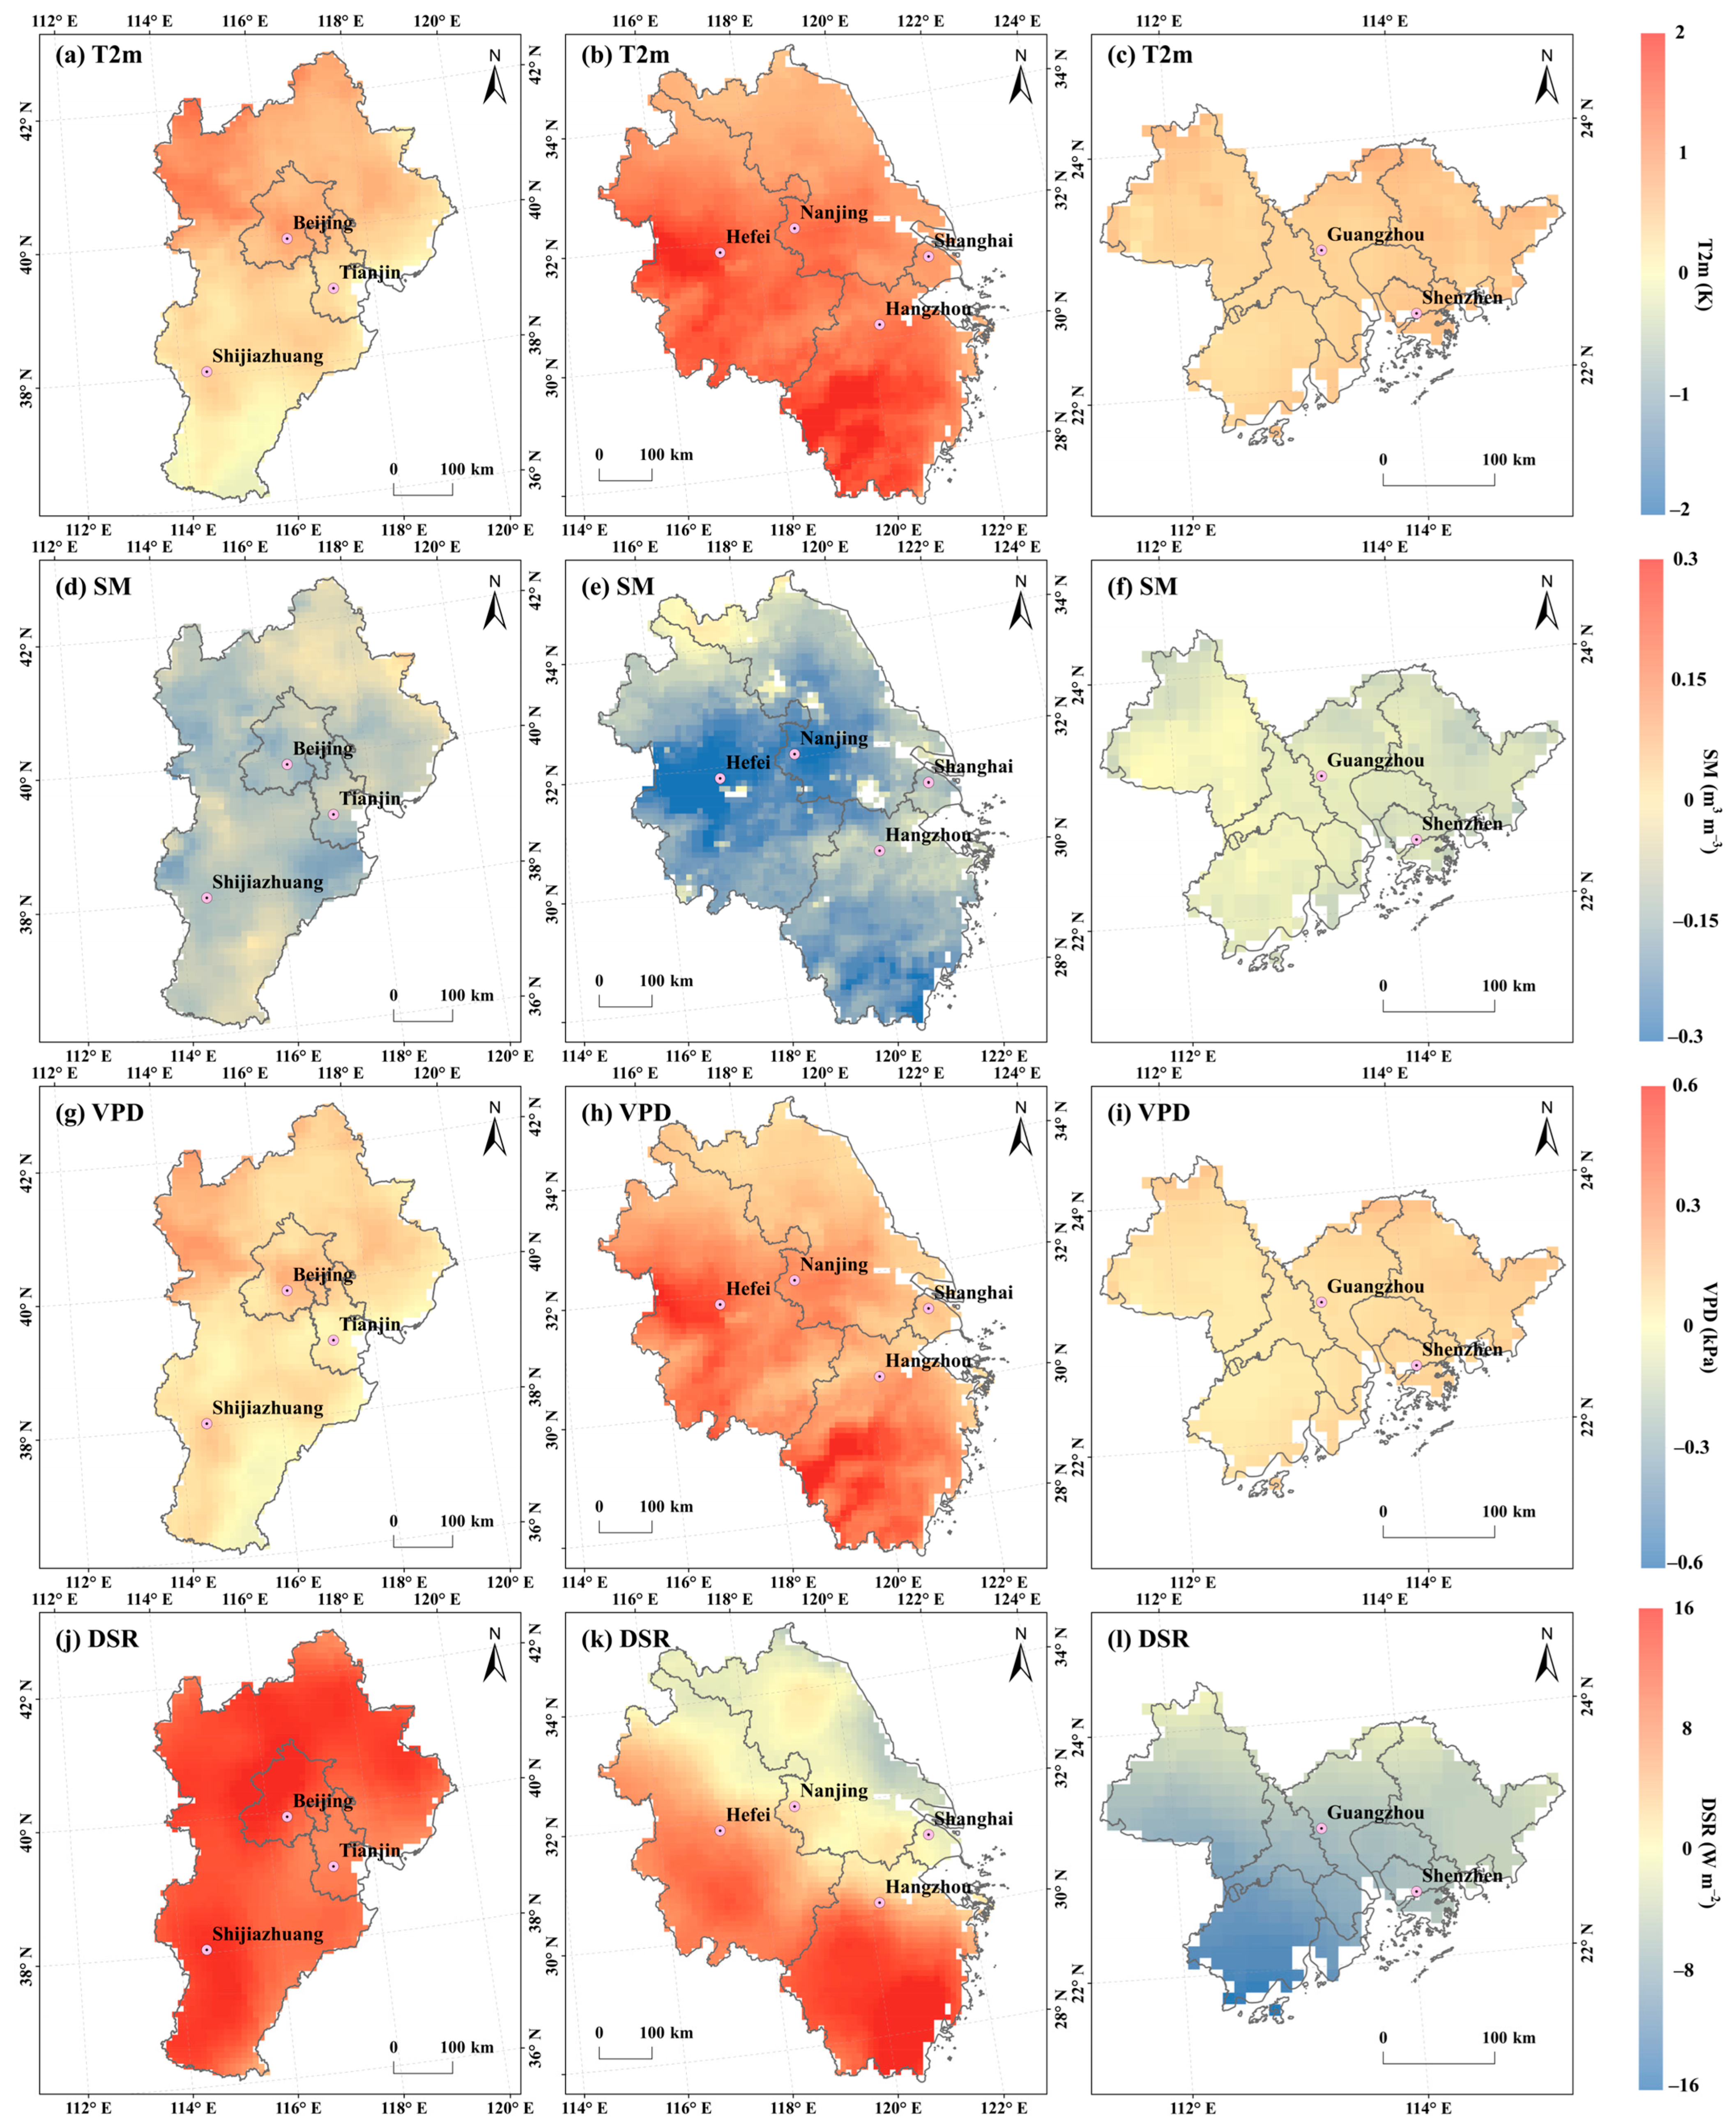
Spatially, the distribution of climate anomalies in these representative years exhibited distinct regional heterogeneity (Figure 4). A consistent “high temperature–atmospheric dryness–soil drought” coupling pattern was evident across all regions, where T2m showed a strong positive correlation with VPD, while SM was negatively correlated with VPD. In the BTH region, anomalies were clustered in the northwest, featuring high T2m, low SM, and elevated VPD. This pattern is likely driven by abundant solar radiation at higher altitudes, compounded by limited evaporative cooling from moisture-depleted soils, facilitating rapid surface warming. In the YRD, anomalies were concentrated in the western and southern areas, manifesting as severe soil moisture deficits coupled with high VPD and DSR. Conversely, the PRD region displayed distinct east–west spatial gradients in climate anomalies, with ΔT2m, ΔDSR, and ΔVPD increasing eastward, while ΔSM declined. These variations across latitudes and climatic zones suggest that the unique spatiotemporal configurations of CDH events may drive divergent GPP responses across the three urban agglomerations.
Figure 4.
Spatial patterns of absolute anomalies for key climate variables during CDH years across three urban agglomerations. Columns from left to right represent the Beijing–Tianjin–Hebei (a,d,g,j), Yangtze River Delta (b,e,h,k), and Pearl River Delta (c,f,i,l) regions. Rows from top to bottom display absolute anomalies in 2 m air temperature (T2m, K), (a–c); soil moisture (SM, m3 m−3), (d–f); Vapor Pressure Deficit (VPD, kPa), (g–i); and downward shortwave radiation (DSR, W m−2), (j–l).
3.2. Response of GPP to CDH Events
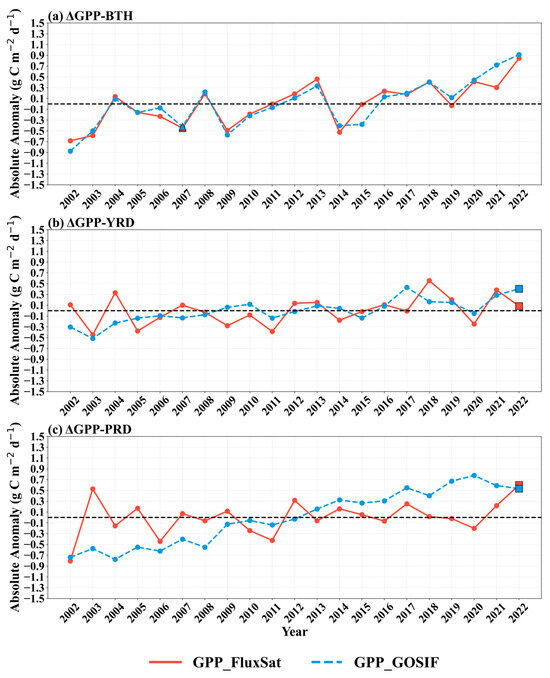
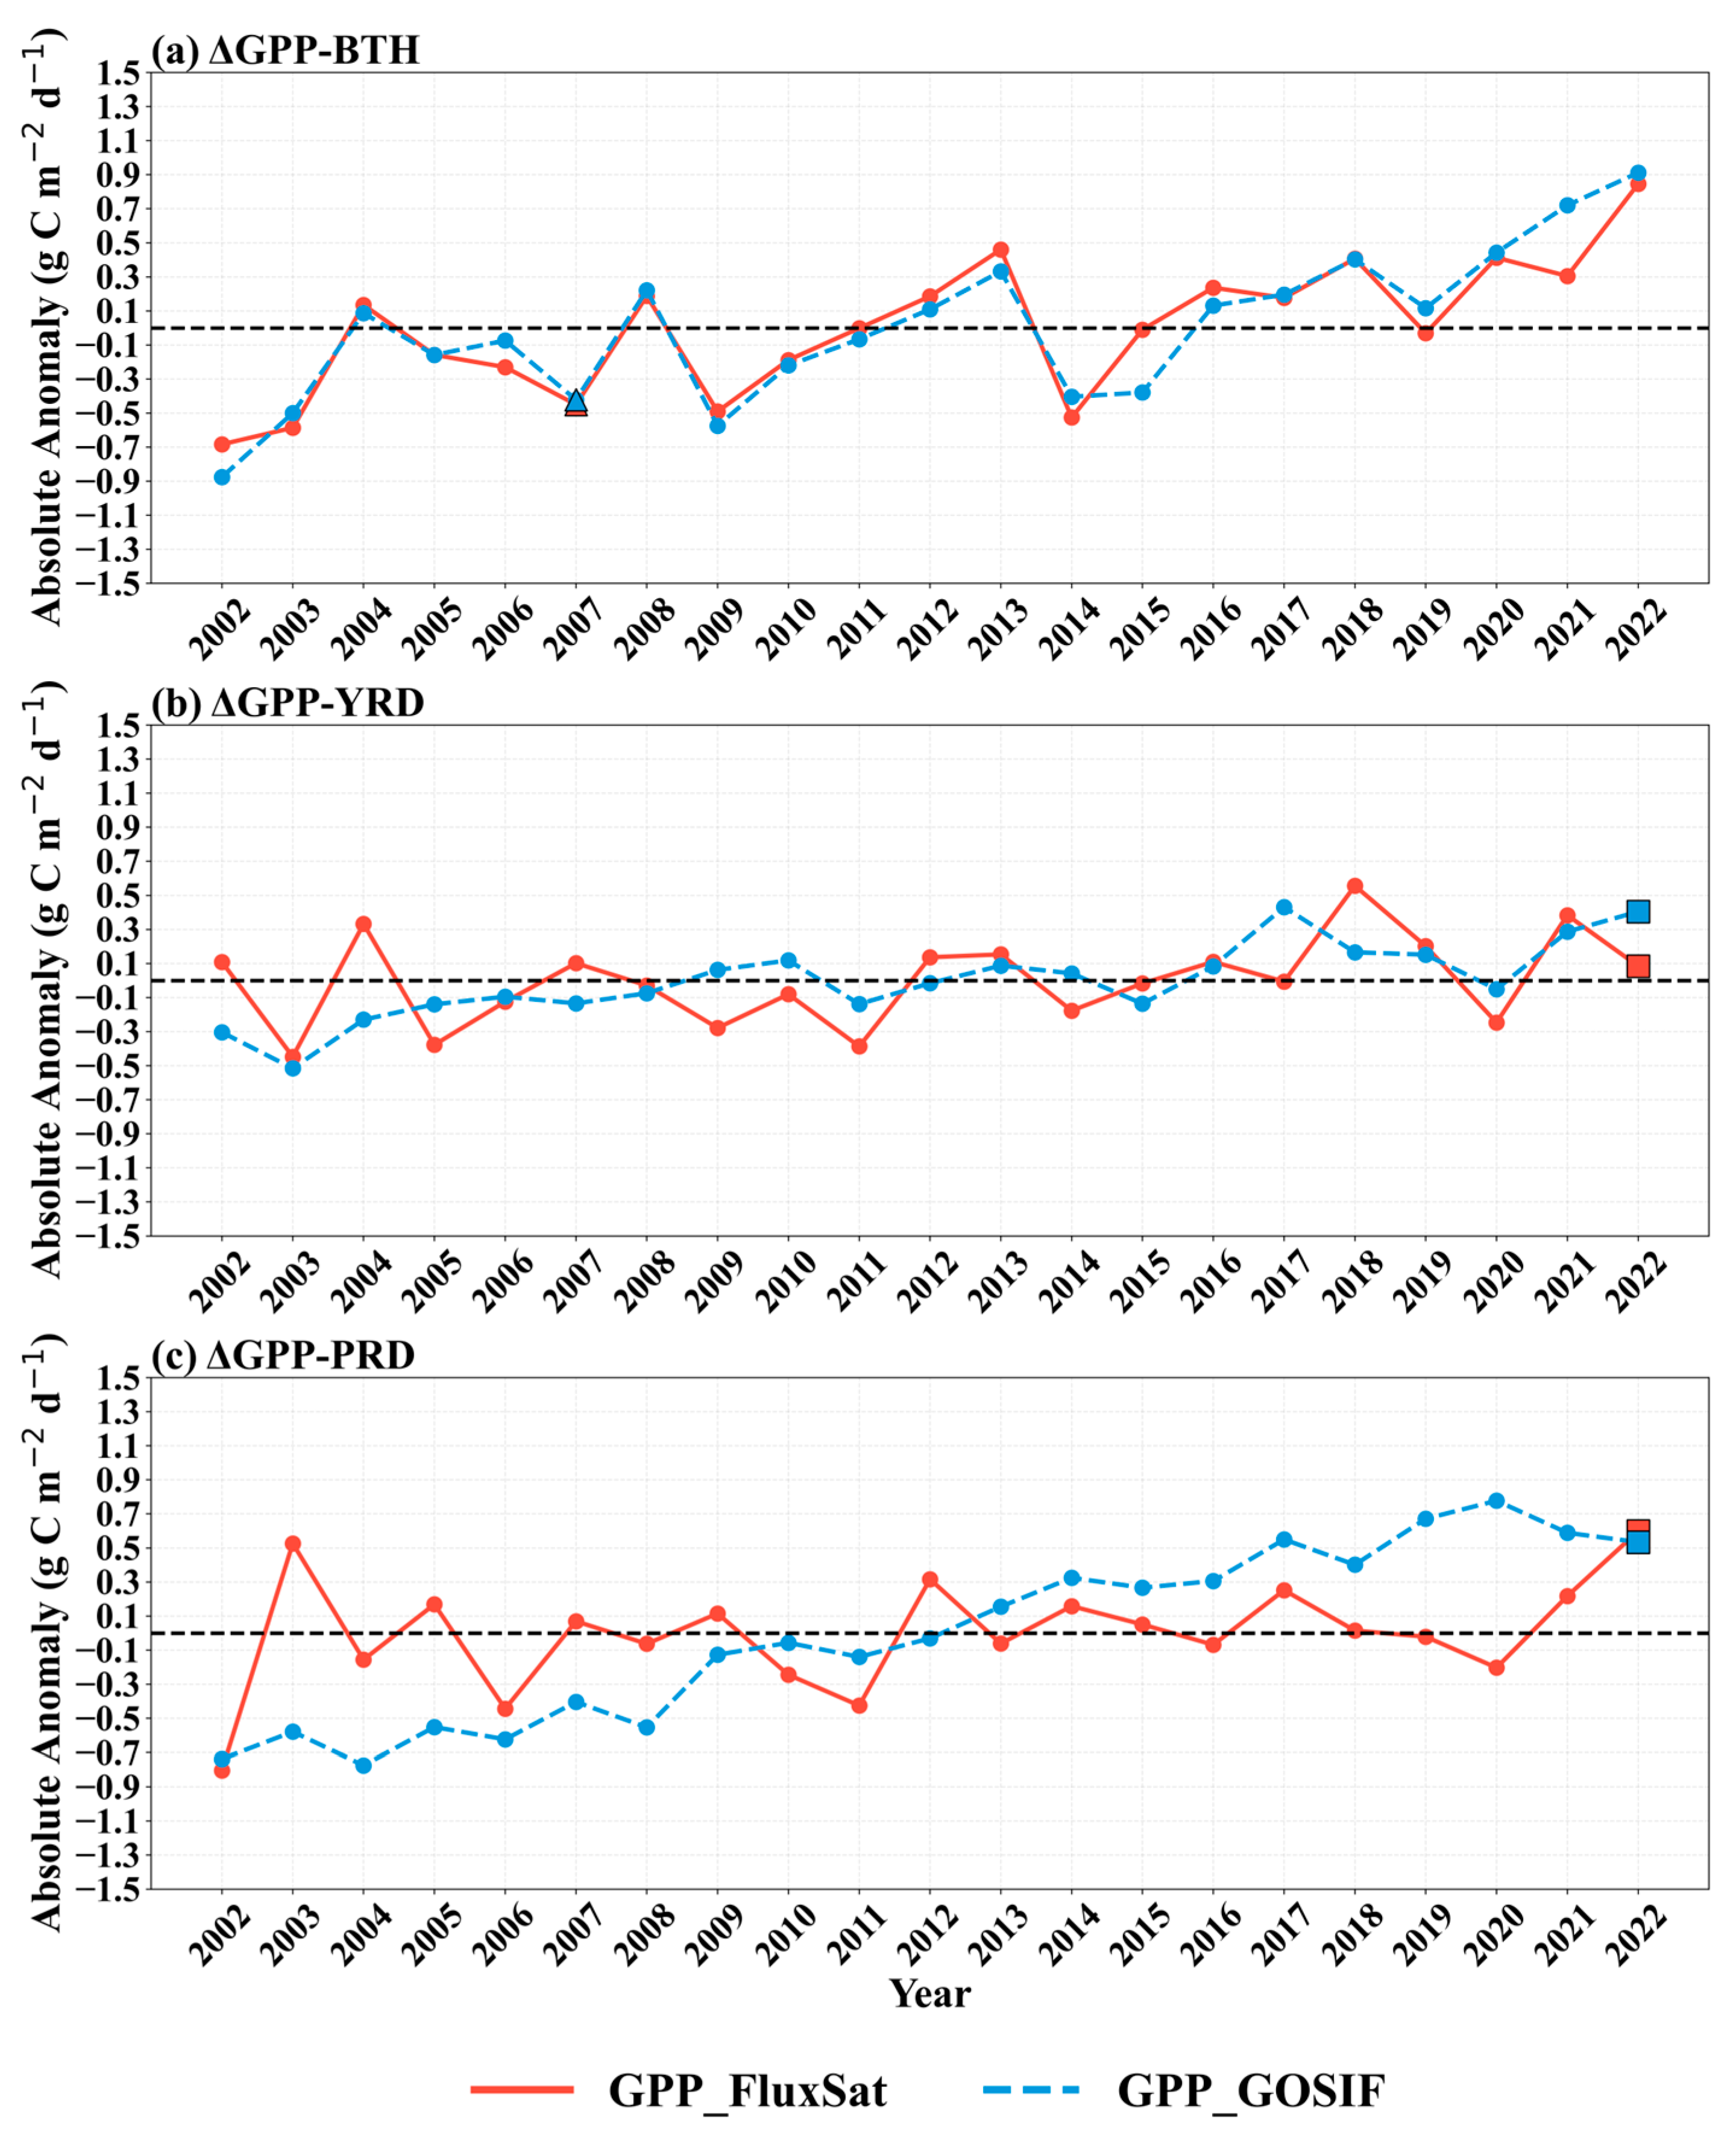
Figure 5 illustrates the absolute anomalies in regional mean GPP across the three study regions during JAS from 2002 to 2022. In 2007, BTH exhibited a decrease in GPP relative to the long-term average; GPPGOSIF and GPPFluxSat recorded anomalies of −0.42 g C m−2 d−1 and −0.45 g C m−2 d−1, respectively. Conversely, during the 2022 event, the YRD region showed significant increases, with GPPGOSIF and GPPFluxSat increasing by 0.40 g C m−2 d−1 and 0.08 g C m−2 d−1, respectively. The PRD region also showed significant increases in 2022, with GPPGOSIF and GPPFluxSat increasing by 0.53 g C m−2 d−1 and 0.60 g C m−2 d−1, respectively.
Figure 5.
Time series of absolute anomalies in GPP derived from two satellite-based products—GPPGOSIF and GPPFluxSat (g C m−2 d−1)—across three urban agglomerations: (a) Beijing–Tianjin–Hebei, (b) Yangtze River Delta, and (c) Pearl River Delta (2002–2022). GPPGOSIF and GPPFluxSat are represented by blue dashed and red solid curves, respectively. The triangle and squares indicate the CDH events in 2007 and 2022, respectively. The horizontal black dashed line represents the zero-anomaly reference level.
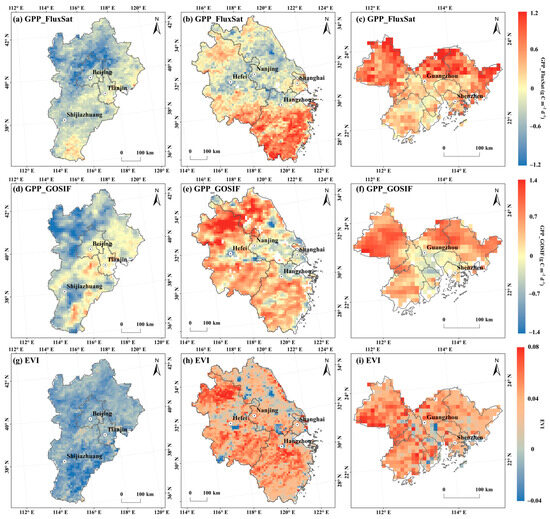
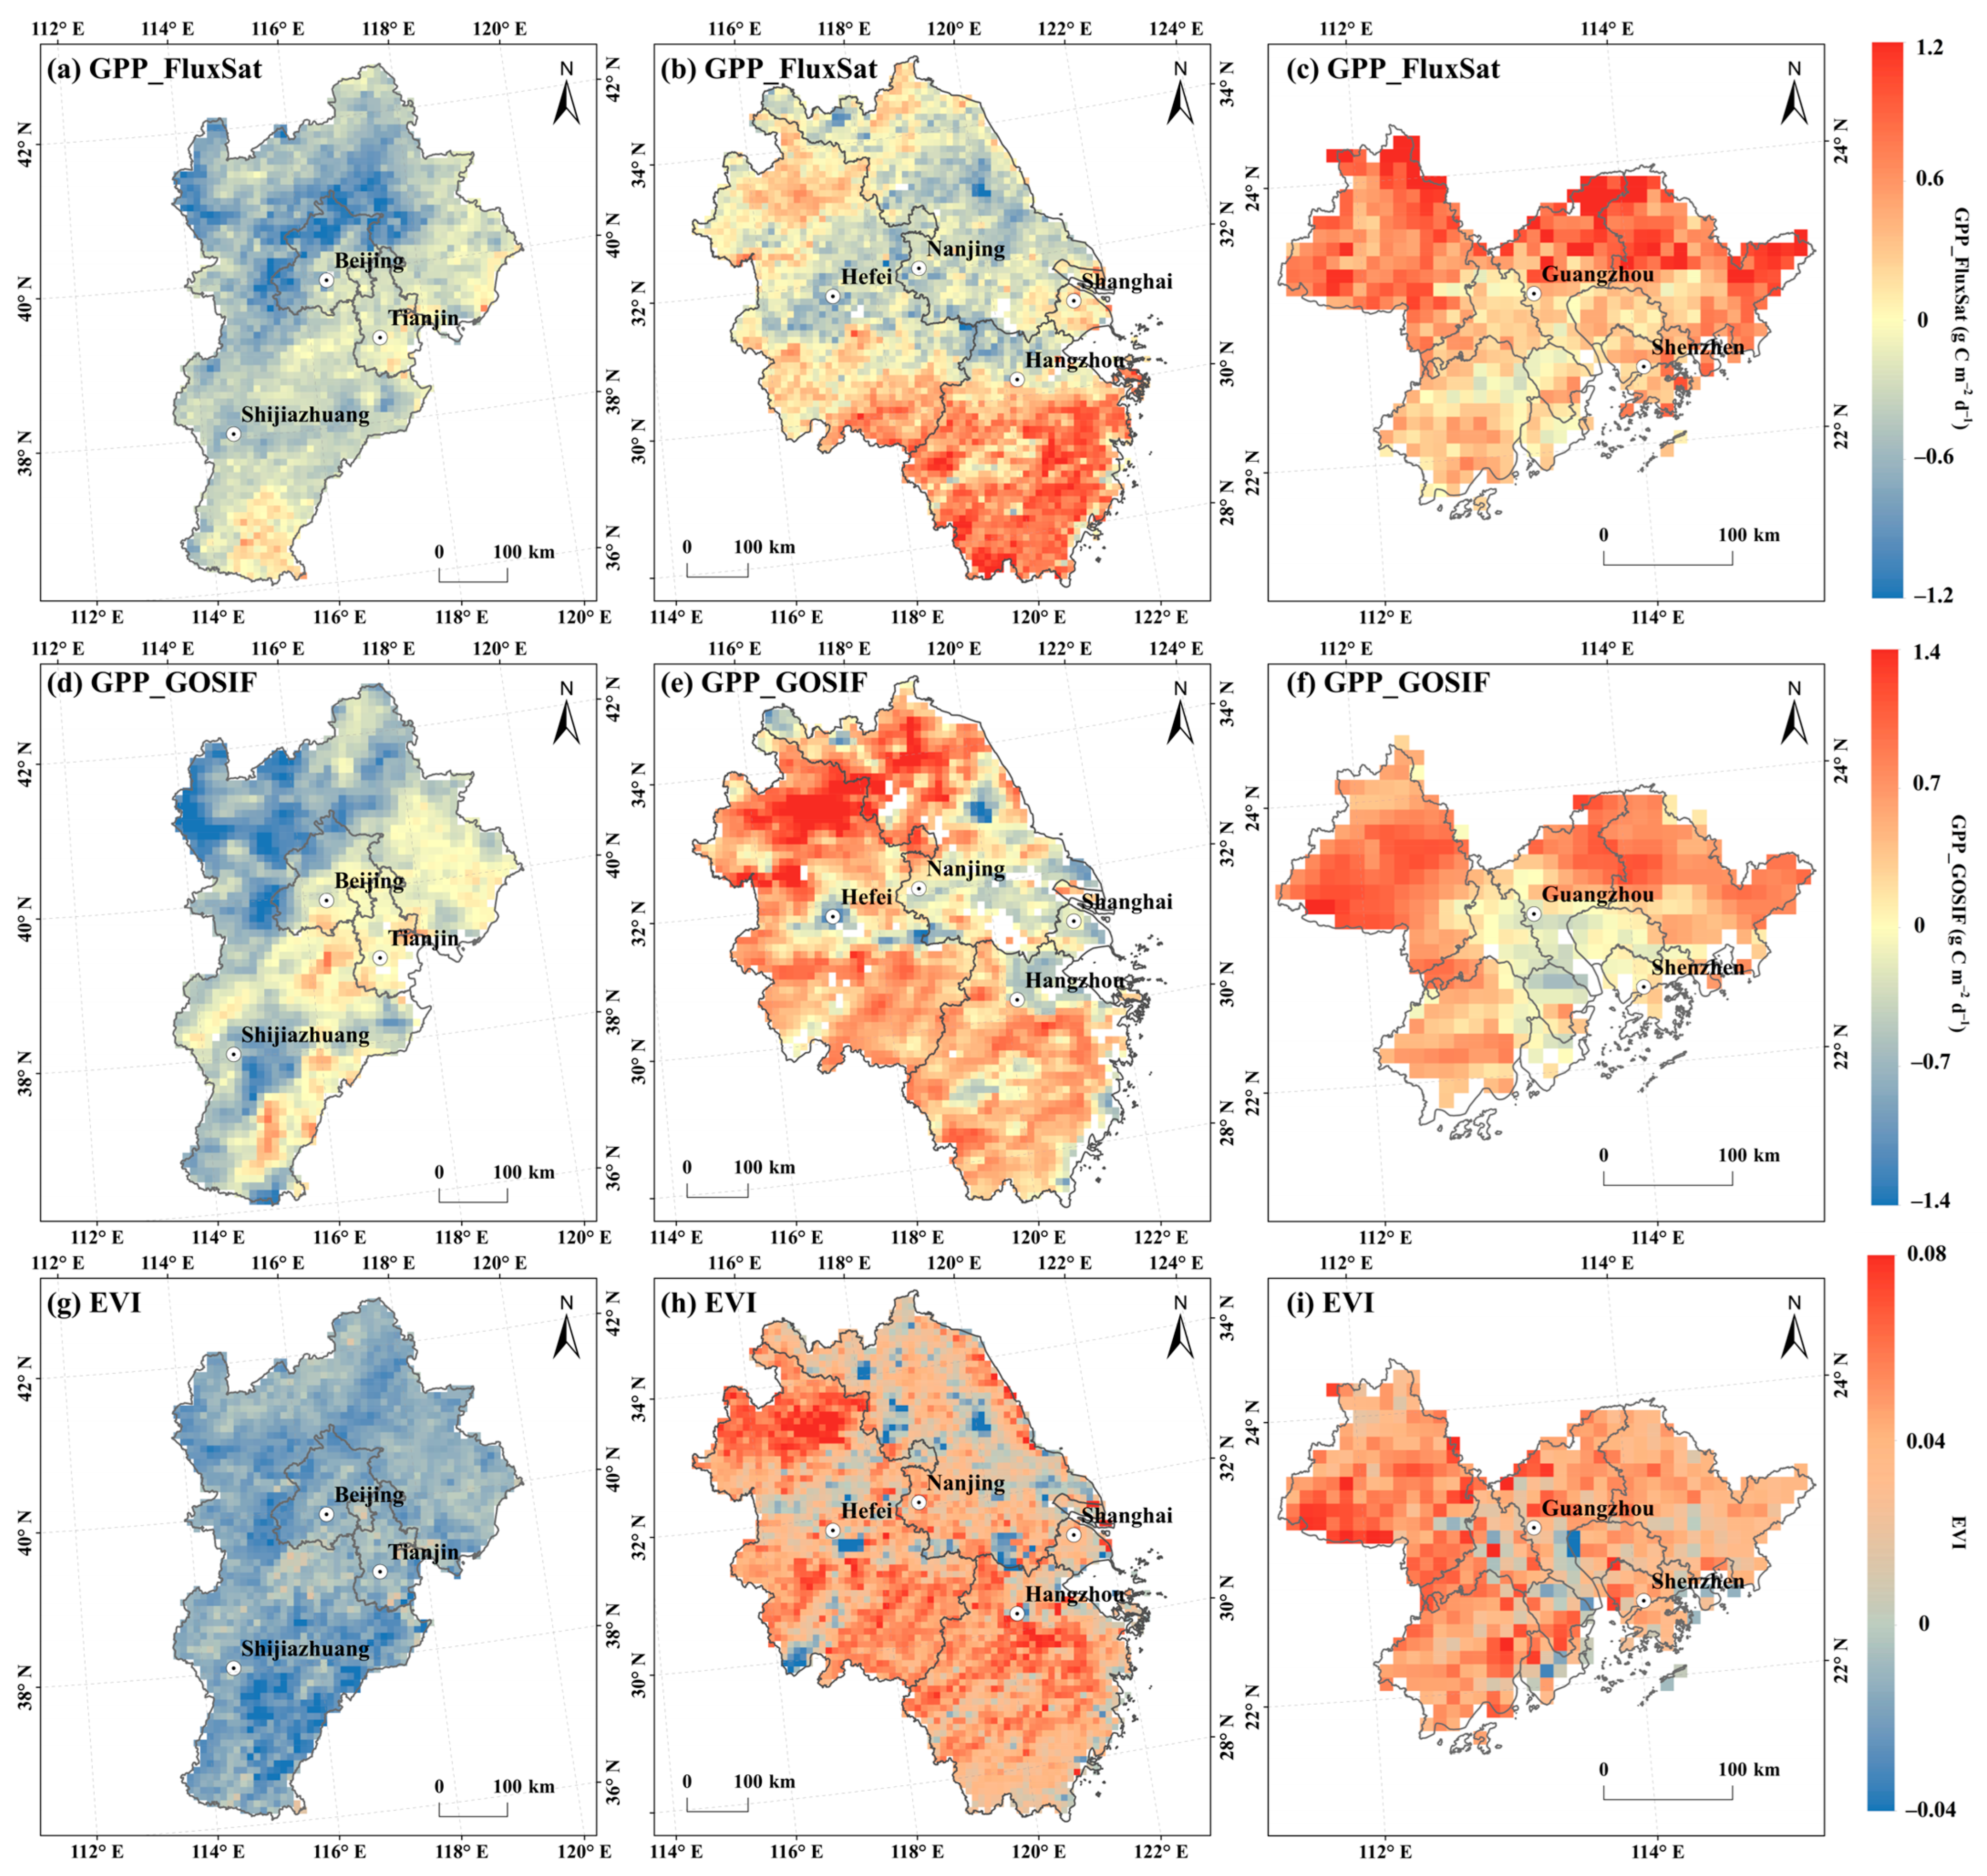
Figure 6 illustrates the spatial distribution of absolute anomalies for GPP—derived from FluxSat and GOSIF datasets—and the MODIS-derived EVI across three major urban agglomerations. In the BTH region (2007), a distinct spatial divergence is evident, characterized by widespread negative GPP anomalies in the northern and northwestern mountainous areas, contrasted with positive anomalies across the southern plains; this pattern is largely mirrored by the EVI distribution. In the YRD (2022), a pronounced inland–coastal contrast is observed. Specifically, the western and southern regions of the YRD exhibit strong positive anomalies, whereas the eastern coastal areas display distinct negative anomalies in both productivity and greenness. Similarly, the PRD (2022) is characterized by widespread positive GPP absolute anomalies, particularly dominating the western, northern, and eastern sectors, whereas the central core shows distinct negative values. Throughout all regions, the FluxSat and GOSIF datasets demonstrate a high degree of spatial consistency, mutually validating the observed anomaly patterns.
Figure 6.
Spatial patterns of vegetation-related absolute anomalies during CDH years across three urban agglomerations. Columns from left to right represent the Beijing–Tianjin–Hebei (a,d,g), Yangtze River Delta (b,e,h), and Pearl River Delta (c,f,i) regions. Rows from top to bottom display absolute anomalies in GPPFluxSat (g C m−2 d−1), (a–c); GPPGOSIF (g C m−2 d−1), (d–f); and MODIS-derived EVI (g–i).
3.3. Vegetation Adaptability to CDH Events Across Regions
3.3.1. Spatial Heterogeneity and North–South Divergence
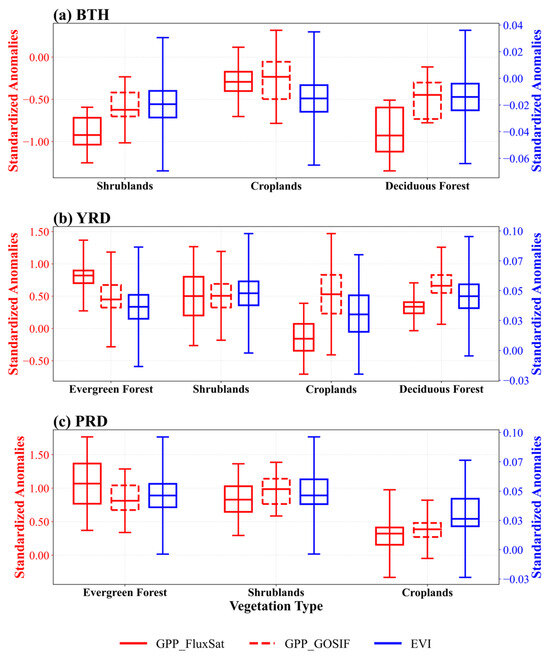
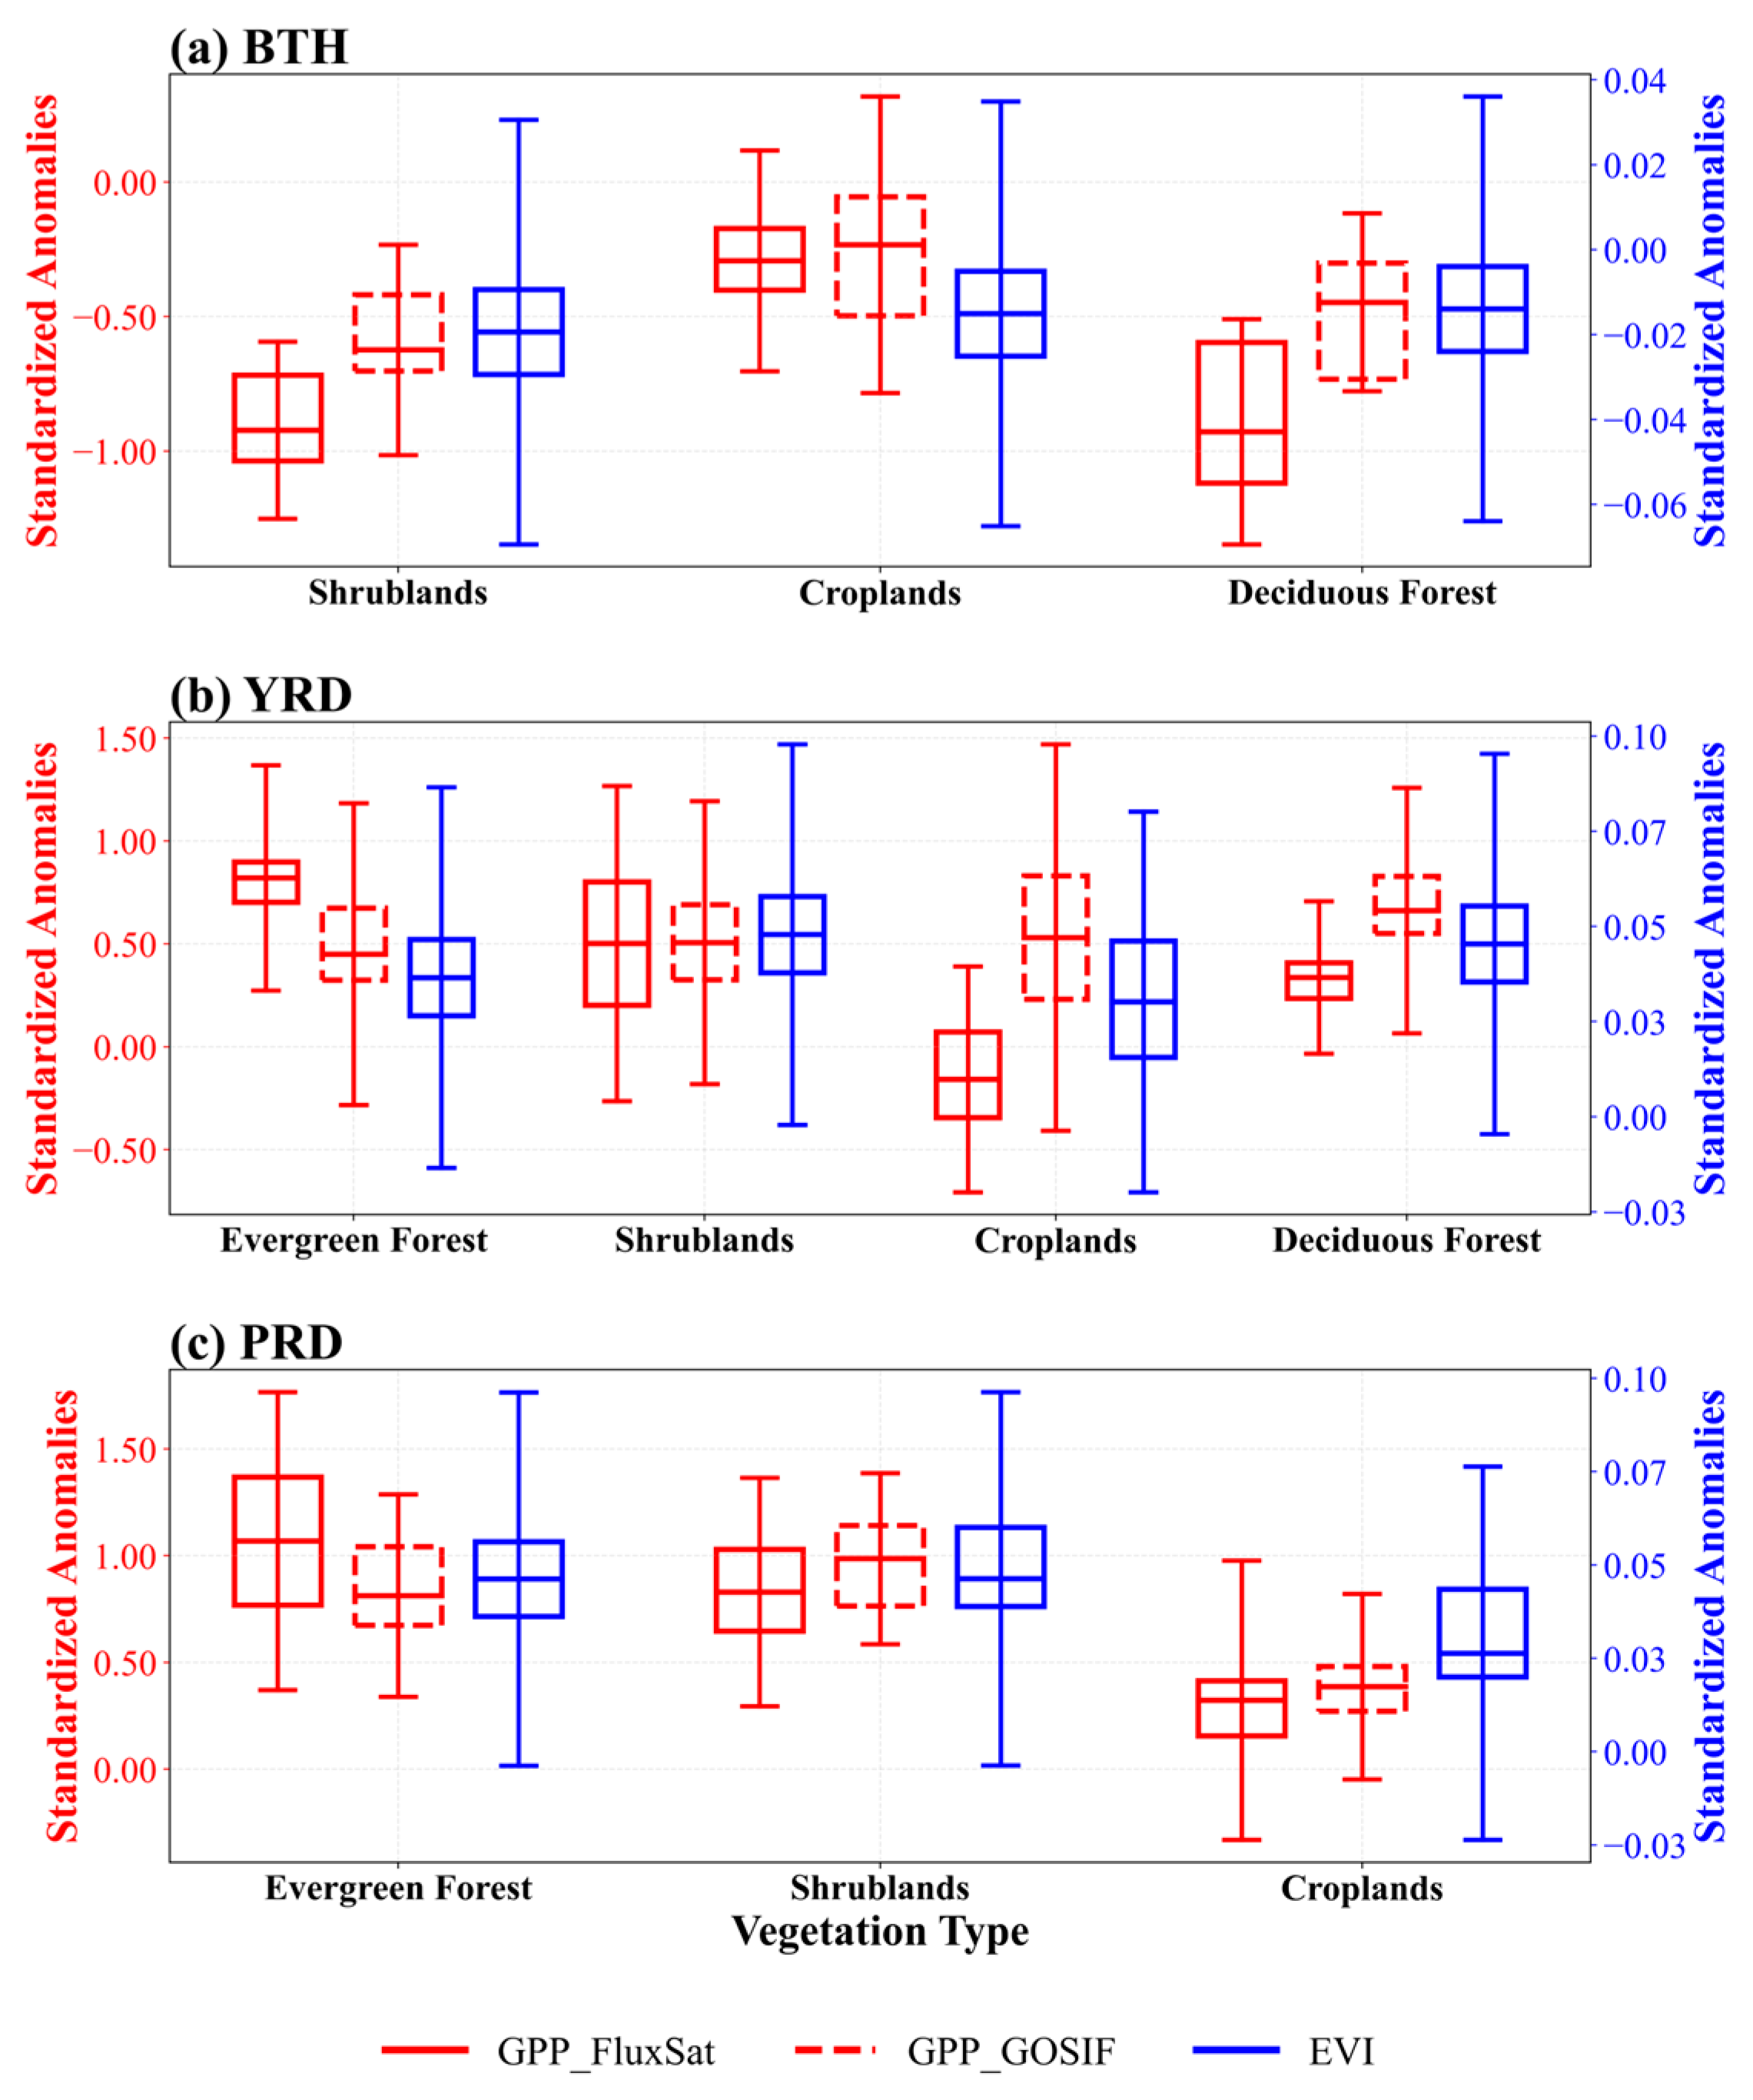
The adaptability of vegetation to CDH events exhibited significant spatial heterogeneity and vegetation-type dependence across the three urban agglomerations (Figure 7). A distinct north–south divergence was observed in the standardized anomalies of vegetation indices. In the BTH region, GPP and EVI anomalies were predominantly negative, indicating that the synergistic stress of water deficit and heatwaves inhibited photosynthetic activity. Notably, natural vegetation (shrublands and deciduous forests) exhibited the most pronounced negative anomalies, suggesting a high vulnerability to water stress in these rain-fed ecosystems. In contrast, croplands in BTH displayed relatively milder negative anomalies compared to forests and shrublands, likely reflecting the buffering effect of anthropogenic irrigation practices common in the North China Plain. Conversely, vegetation in the humid YRD and PRD regions demonstrated remarkable resilience, characterized by generally positive anomalies. This suggests that in these humid regions, the compound heat and dryness alleviated the dominant energy limitations (thermal and/or radiative), thereby promoting vegetation growth. Specifically, evergreen forests in the YRD and PRD regions showed the highest adaptability with consistently high positive anomalies, attributable to their deeper root systems and physiological tolerance. These patterns were robust across GPPFluxSat, GPPGOSIF, and EVI datasets, reinforcing the conclusion that CDH events act as a destructive stressor primarily for natural vegetation in the northern BTH region, while potentially functioning as a growth promoter in the southern urban agglomerations.
Figure 7.
Boxplots of standardized anomalies for GPP (red, left axis) and EVI (blue, right axis) across different vegetation types in the (a) Beijing-Tianjin-Hebei (BTH), (b) Yangtze River Delta (YRD), and (c) Pearl River Delta (PRD) urban agglomerations. Boxes show the 25th–75th percentiles with the median as the central line. Solid red, dashed red, and solid blue boxes represent GPPFluxSat, GPPGOSIF, and EVI, respectively.
3.3.2. Climatic Drivers and Physiological Mechanisms
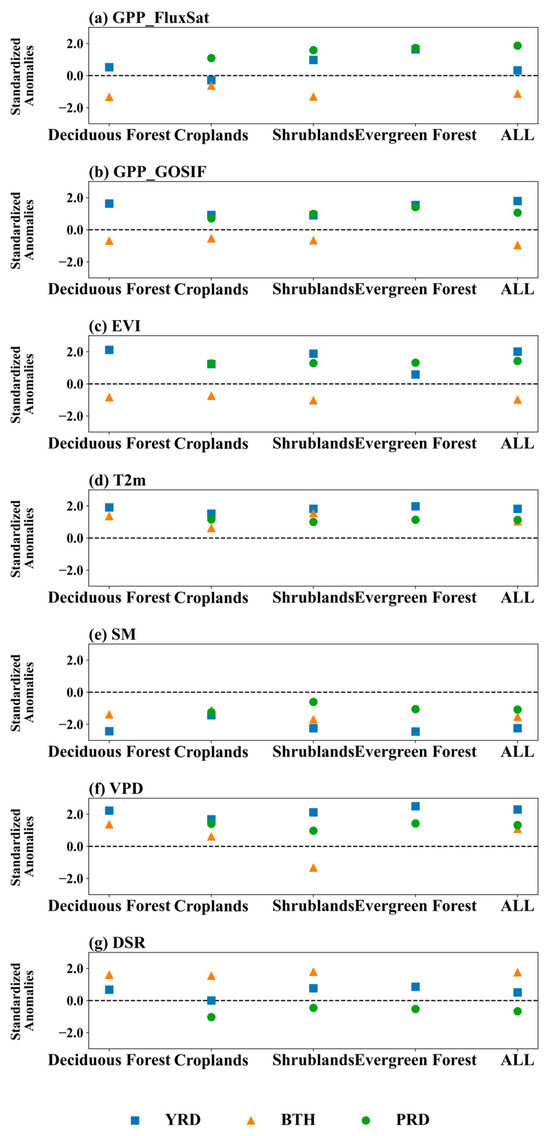
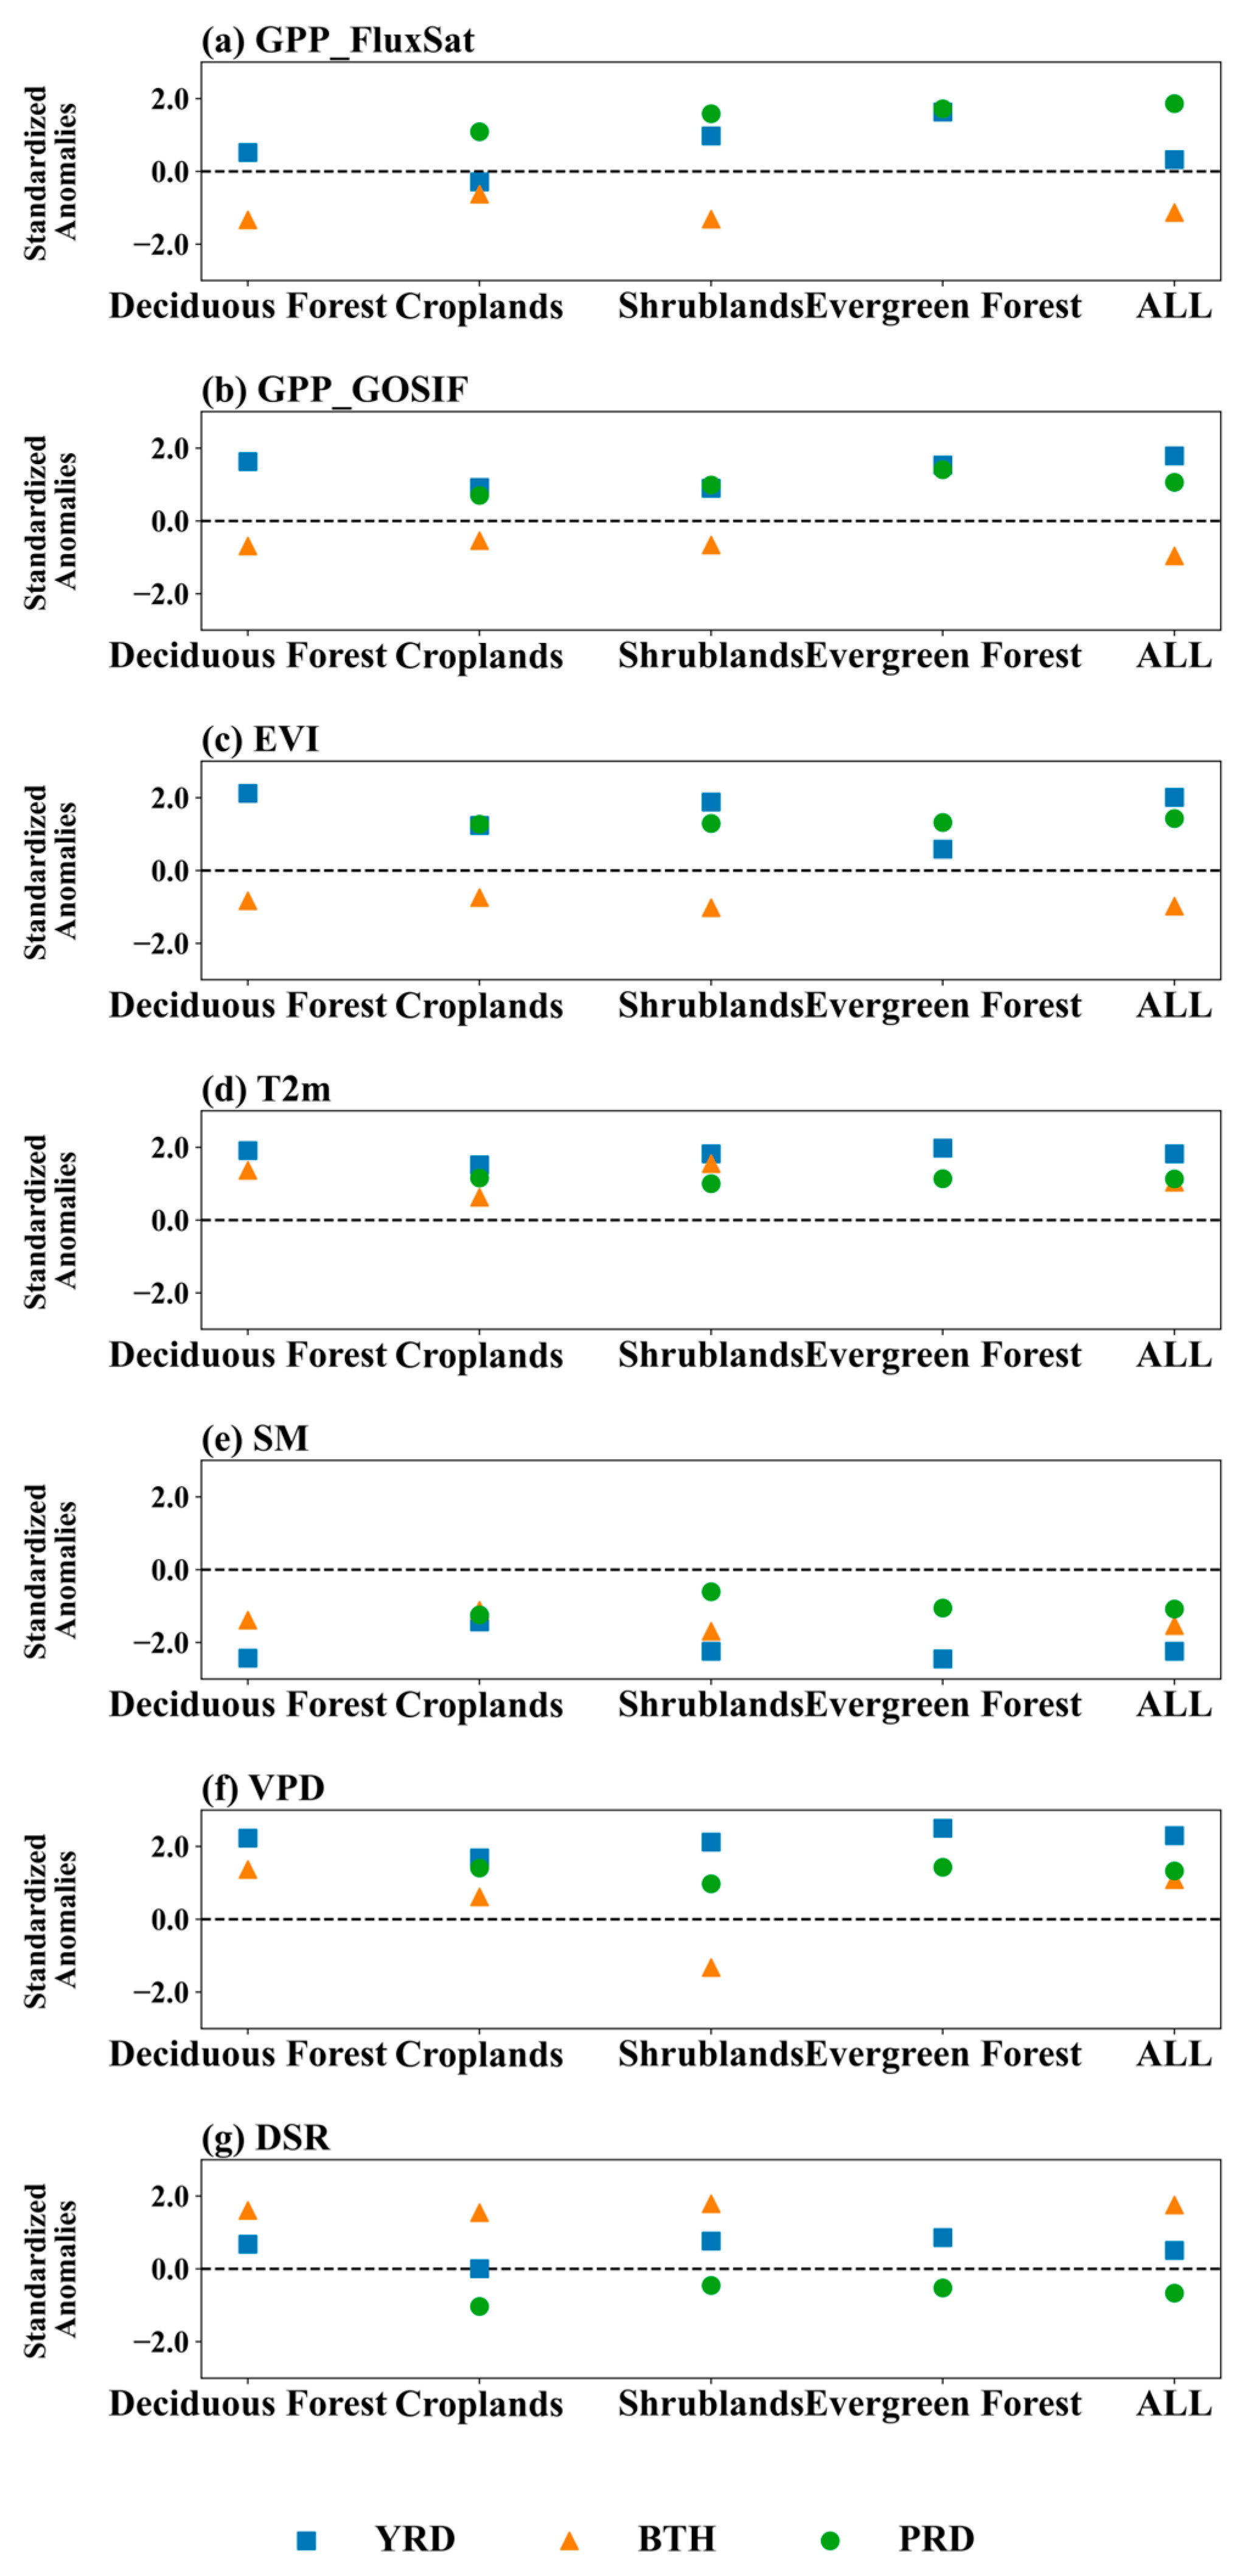
The divergence in vegetation adaptability is further elucidated by quantifying the intensity of climate anomalies during CDH years (Table 2 and Figure 8). Although all three urban agglomerations experienced significant heat stress, the humid southern regions (YRD and PRD) demonstrated remarkable resilience compared to the north. The YRD confronted the most extreme compound conditions, characterized by the highest temperature standardized anomalies (T2m of 1.82 STD) and atmospheric dryness (VPD of 2.30 STD), coupled with the lowest soil moisture availability (SM of −2.44 STD). Paradoxically, the YRD exhibited the most robust vegetation growth (EVI of 2.01 STD), driven by the alleviation of energy limitations via both thermal and radiative enhancement. This resilience is further corroborated by GPP metrics. In the YRD, GPP showed positive anomalies at the regional level, with GPPGOSIF and GPPFluxSat reaching 1.79 STD and 0.32 STD, respectively. Evergreen forests were particularly productive, recording high anomalies in both GPPGOSIF (1.54 STD) and GPPFluxSat (1.63 STD).
Table 2.
Standardized anomalies of climate and vegetation variables during CDH years in the three major urban agglomerations. Representative years are 2007 for Beijing–Tianjin–Hebei (BTH), and 2022 for both the Yangtze River Delta (YRD) and the Pearl River Delta (PRD). Columns denote different vegetation types: “ALL” for all grid cells, “EF” for evergreen forest, “DF” for deciduous forest, “Shrubs” for shrublands, and “Crops” for croplands. Climate variables include T2m, SM, VPD, and DSR. Vegetation variables include GPP derived from GOSIF (GPPGOSIF) and FluxSat (GPPFluxSat), and EVI.
Figure 8.
Mean standardized anomalies of climate and vegetation variables at corresponding grid cells for different vegetation types during CDH years. Blue squares, orange triangles, and green circles denote the Yangtze River Delta (YRD), Beijing–Tianjin–Hebei (BTH), and Pearl River Delta (PRD) urban agglomerations, respectively. Panels (a–g) show GPPFluxSat, GPPGOSIF, EVI, T2m, SM, VPD, and DSR, respectively. The horizontal black dashed lines indicate the zero anomaly baseline. All values are expressed in units of standard deviation.
Similarly, the PRD maintained high productivity (EVI of 1.43 STD) despite moderate drought. However, a distinct mechanism was observed here: unlike the YRD, the PRD sustained growth under a negative radiation anomaly (DSR of −0.66 STD), suggesting that thermal enhancement (T2m of 1.13 STD) alone was sufficient to override hydraulic limitations in this tropical ecosystem. Consistent with EVI, the PRD exhibited enhancement in carbon uptake, with GPPGOSIF and GPPFluxSat showing anomalies of 1.06 STD and 1.86 STD, respectively. Evergreen forests in the PRD maintained robust growth (GPPGOSIF: 1.41 STD; GPPFluxSat: 1.72 STD), reinforcing the finding that these humid ecosystems can sustain carbon sequestration during compound events.
In contrast, the BTH region demonstrated a tight coupling between water deficit and productivity loss. Despite receiving the highest positive anomaly in DSR (1.76 STD)—which theoretically promotes photosynthesis—the concurrent soil moisture deficit (SM of −1.53 STD) and high atmospheric demand (VPD of 1.09 STD) resulted in consistent negative anomalies across all vegetation metrics (e.g., GPPGOSIF of −0.96 STD and GPPFluxSat of -1.13 STD). This confirms that in the water-limited northern ecosystem, radiation inputs cannot compensate for water scarcity during CDH events.
Furthermore, the statistical disparity between vegetation types validates the buffering hypothesis of anthropogenic management. In the BTH region, croplands experienced mitigated heat stress (T2m anomaly of 0.63 STD) likely due to irrigation cooling, and consequently showed lower productivity losses (EVI anomaly of −0.74 STD) compared to natural ecosystems, where shrublands and deciduous forests suffered steeper declines (EVI anomalies of −1.02 STD for shrublands and −0.83 STD for deciduous forests, respectively). Conversely, in the southern regions (YRD and PRD), natural forests (evergreen forests and deciduous forests) generally outperformed croplands, highlighting the superior physiological resilience of established forest ecosystems when water is not the primary limiting factor.
3.3.3. Probability Distribution of Ecosystem Shifts
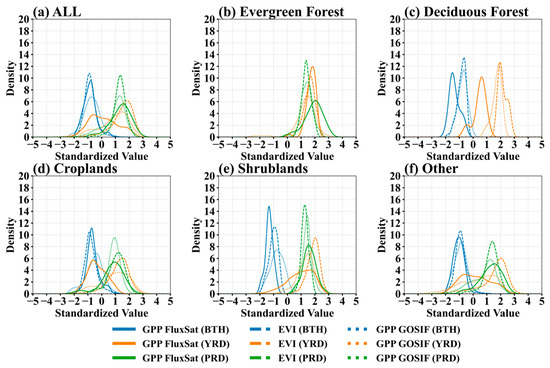
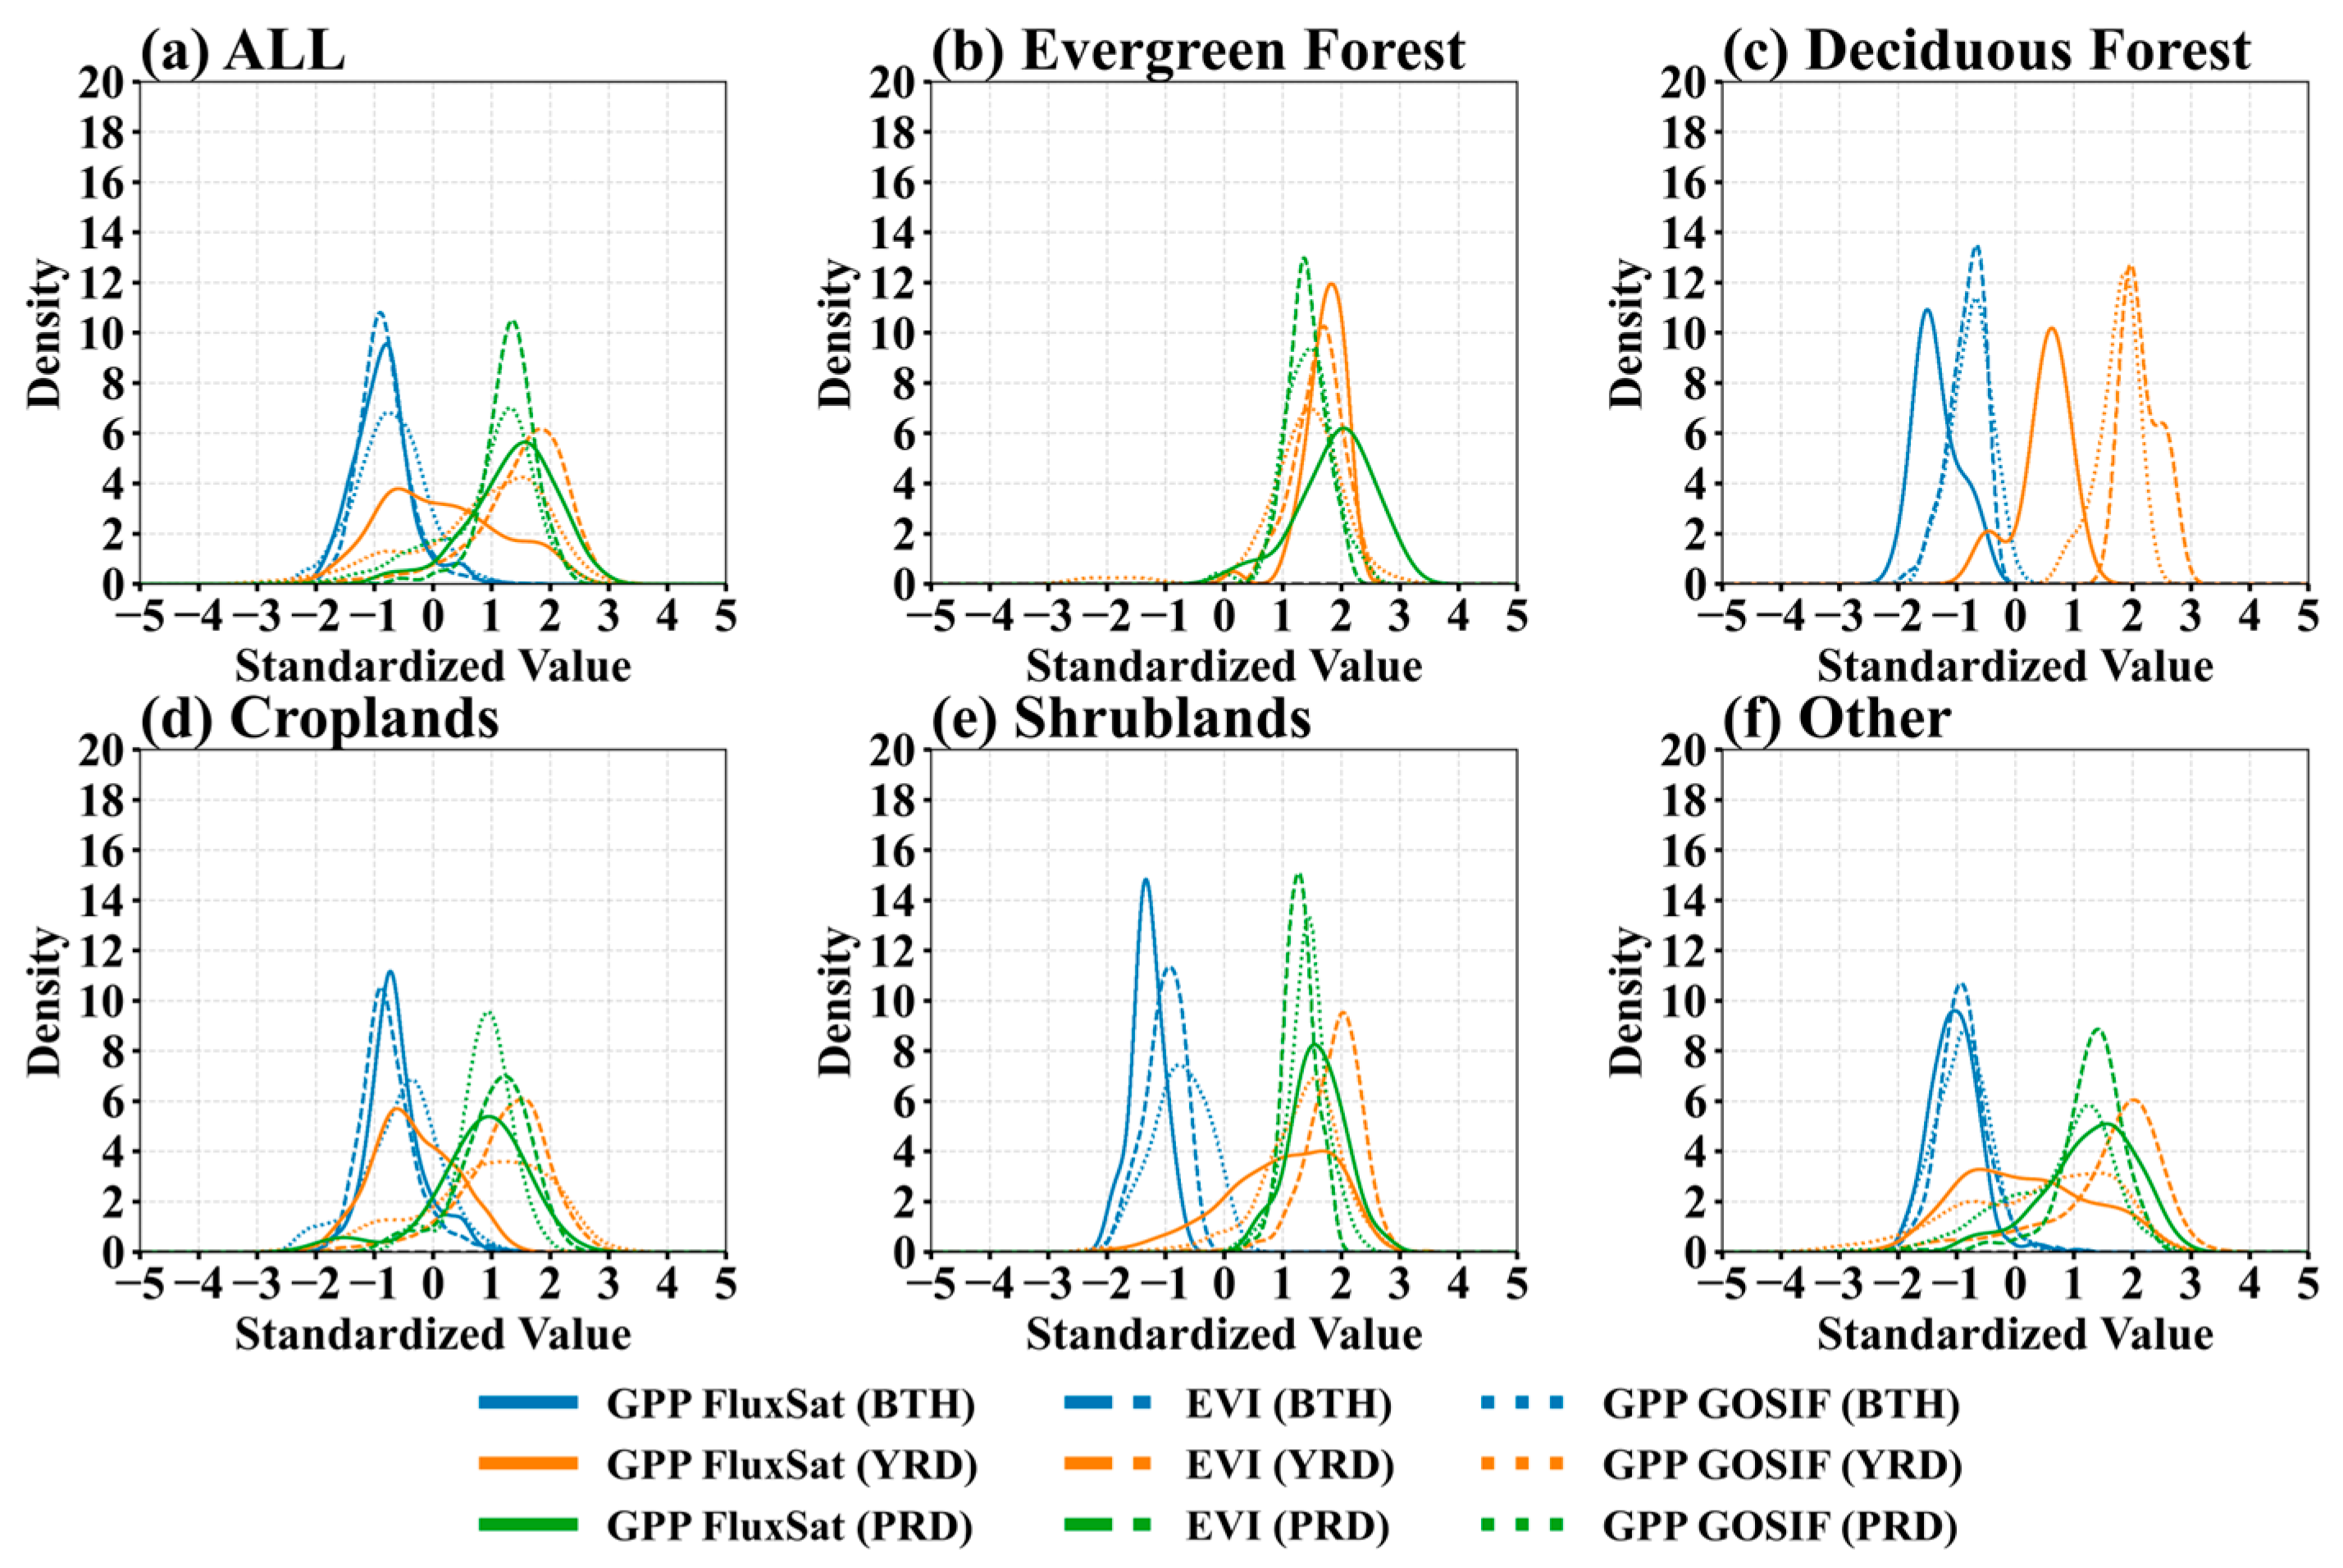
To assess the pervasiveness of the observed impacts beyond mean-state statistics, we analyzed the probability density functions (PDFs) of standardized anomalies for both vegetation (Figure 9) and climatic drivers (Figure 10). The PDFs of vegetation indices reveal that the divergent responses identified in the spatial analysis represent a systemic shift in the entire ecosystem state rather than localized outliers. In the BTH region, the PDFs for GPP and EVI exhibit a pervasive leftward shift across all land cover types (Figure 9a), with the distribution peaks centered deeply in negative territory. This indicates that the suppression of productivity was a spatially uniform phenomenon, affecting the vast majority of grid cells regardless of vegetation type. Conversely, the YRD and PRD regions display a robust rightward shift (Figure 9b,c,e), where the distributions are skewed toward positive values. This distributional pattern confirms that in these humid southern regions, extreme positive growth anomalies were the norm during the compound dry-hot events.
Figure 9.
Probability Density Functions (PDF, unit: %) of standardized vegetation-related anomalies during CDH years. Blue, orange, and green curves correspond to the Beijing–Tianjin–Hebei, Yangtze River Delta, and Pearl River Delta urban agglomerations, respectively. Solid, short-dashed, and long-dashed lines denote GPPFluxSat, GPPGOSIF, and EVI, respectively. Panels show (a) all grid cells, (b) evergreen forest (EF), (c) deciduous forest (DF), (d) croplands, (e) shrublands, and (f) other vegetation types.
Figure 10.
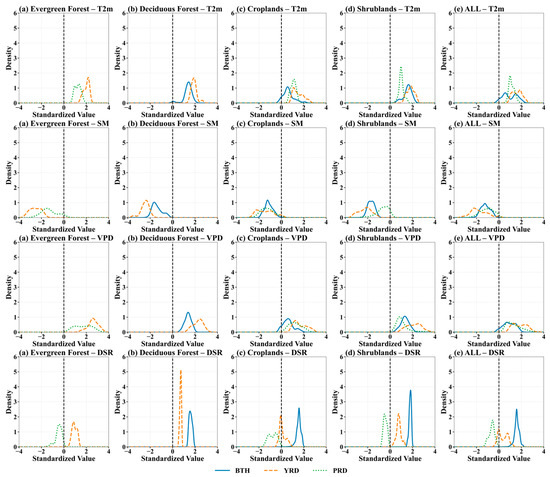
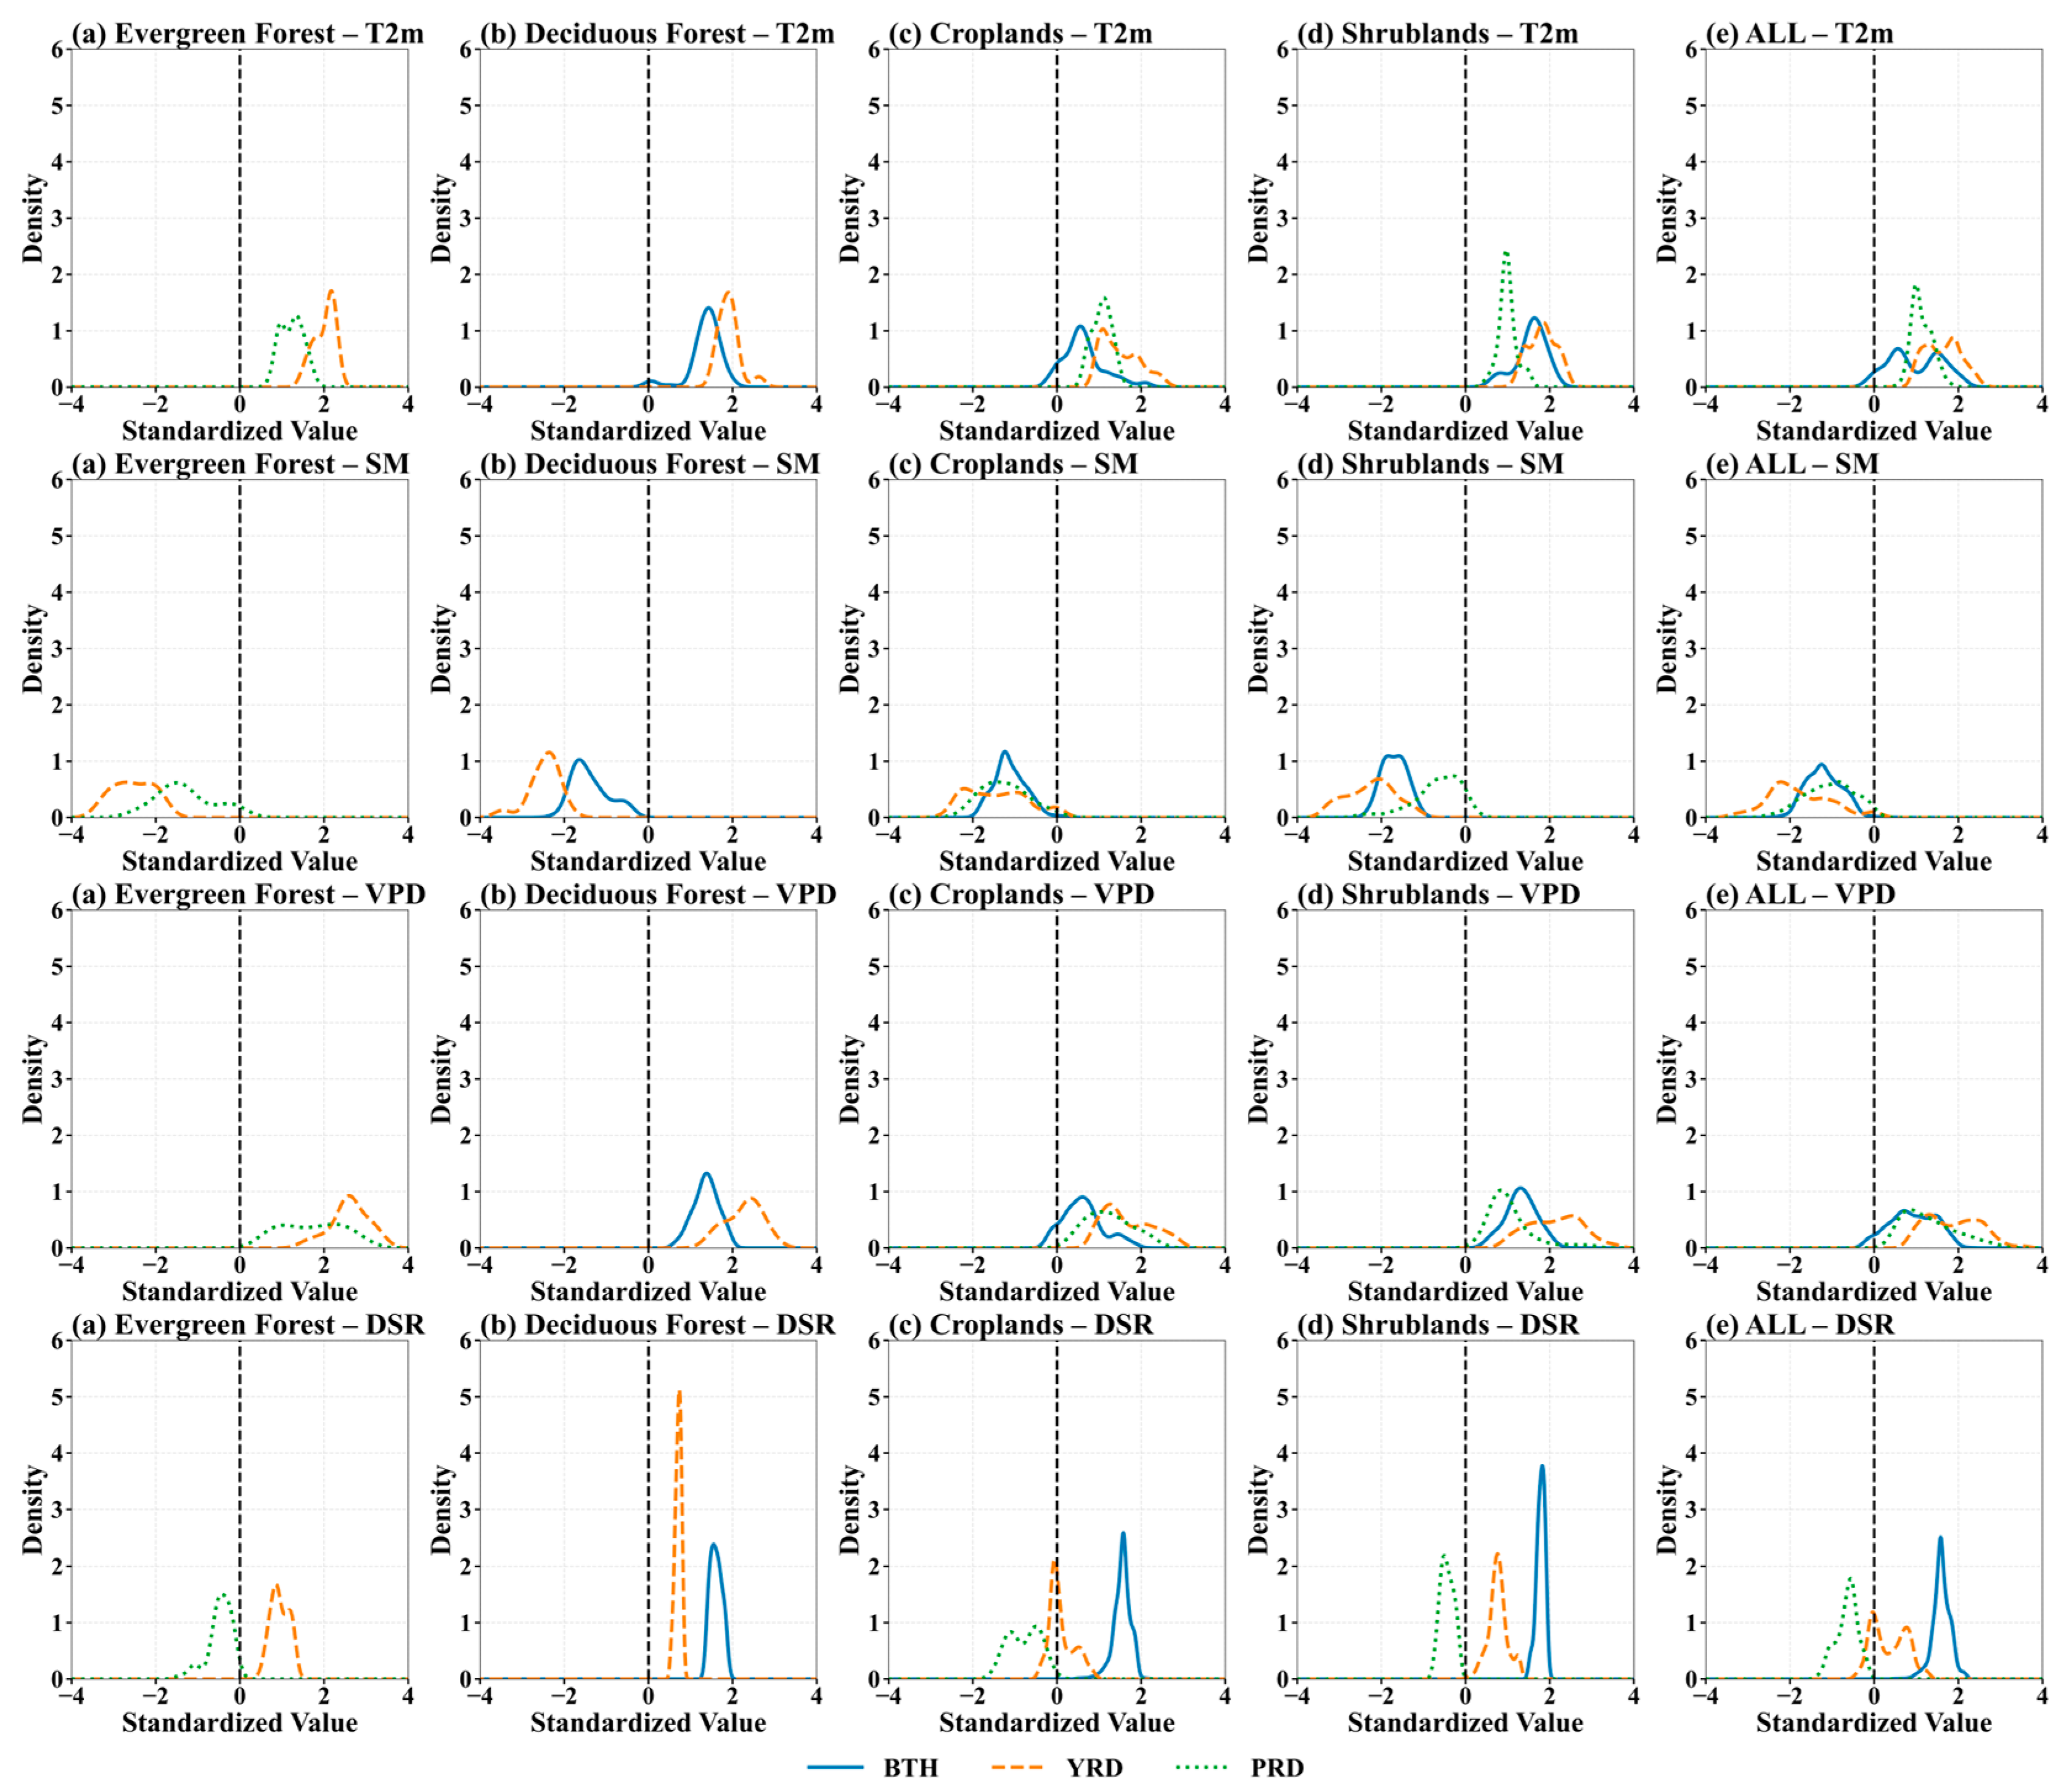
PDF of standardized climate anomalies. The blue solid, orange dashed, and green dotted curves represent the Beijing–Tianjin–Hebei (BTH), Yangtze River Delta (YRD), and Pearl River Delta (PRD) urban agglomerations, respectively. Columns (a–e) represent different vegetation types: (a) Evergreen Forest, (b) Deciduous Forest, (c) Croplands, (d) Shrublands, and (e) All vegetation types. Rows from top to bottom represent different climate variables: T2m, SM, VPD, and DSR. The vertical black dashed line represents the zero-anomaly reference level.
The physical mechanisms driving these systemic vegetation shifts are corroborated by the distributional changes in climatic drivers shown in Figure 10. A consistent positive shift in T2m and VPD was observed across all regions, signifying a general trend of warming and increased atmospheric dryness. This signal is accompanied by a marked drying tendency in SM, as evidenced by predominantly negative shifts in the SM PDFs for BTH, YRD, and PRD. In contrast, the response of DSR exhibits pronounced regional heterogeneity: BTH shows an evident positive shift (enhanced radiation), PRD is characterized by a negative shift (reduced radiation), whereas YRD generally presents weaker or mixed shifts with distributions closer to the reference state. Notably, these patterns are largely consistent across vegetation types (evergreen forest, deciduous forest, croplands, and shrublands) and are also reflected in the aggregated “ALL” category. Collectively, the results indicate that the observed vegetation transitions are primarily associated with concurrent warming, heightened atmospheric water demand, and soil drying, while changes in radiative forcing vary substantially among regions.
4. Discussion
4.1. Mechanisms of Divergent Vegetation Responses
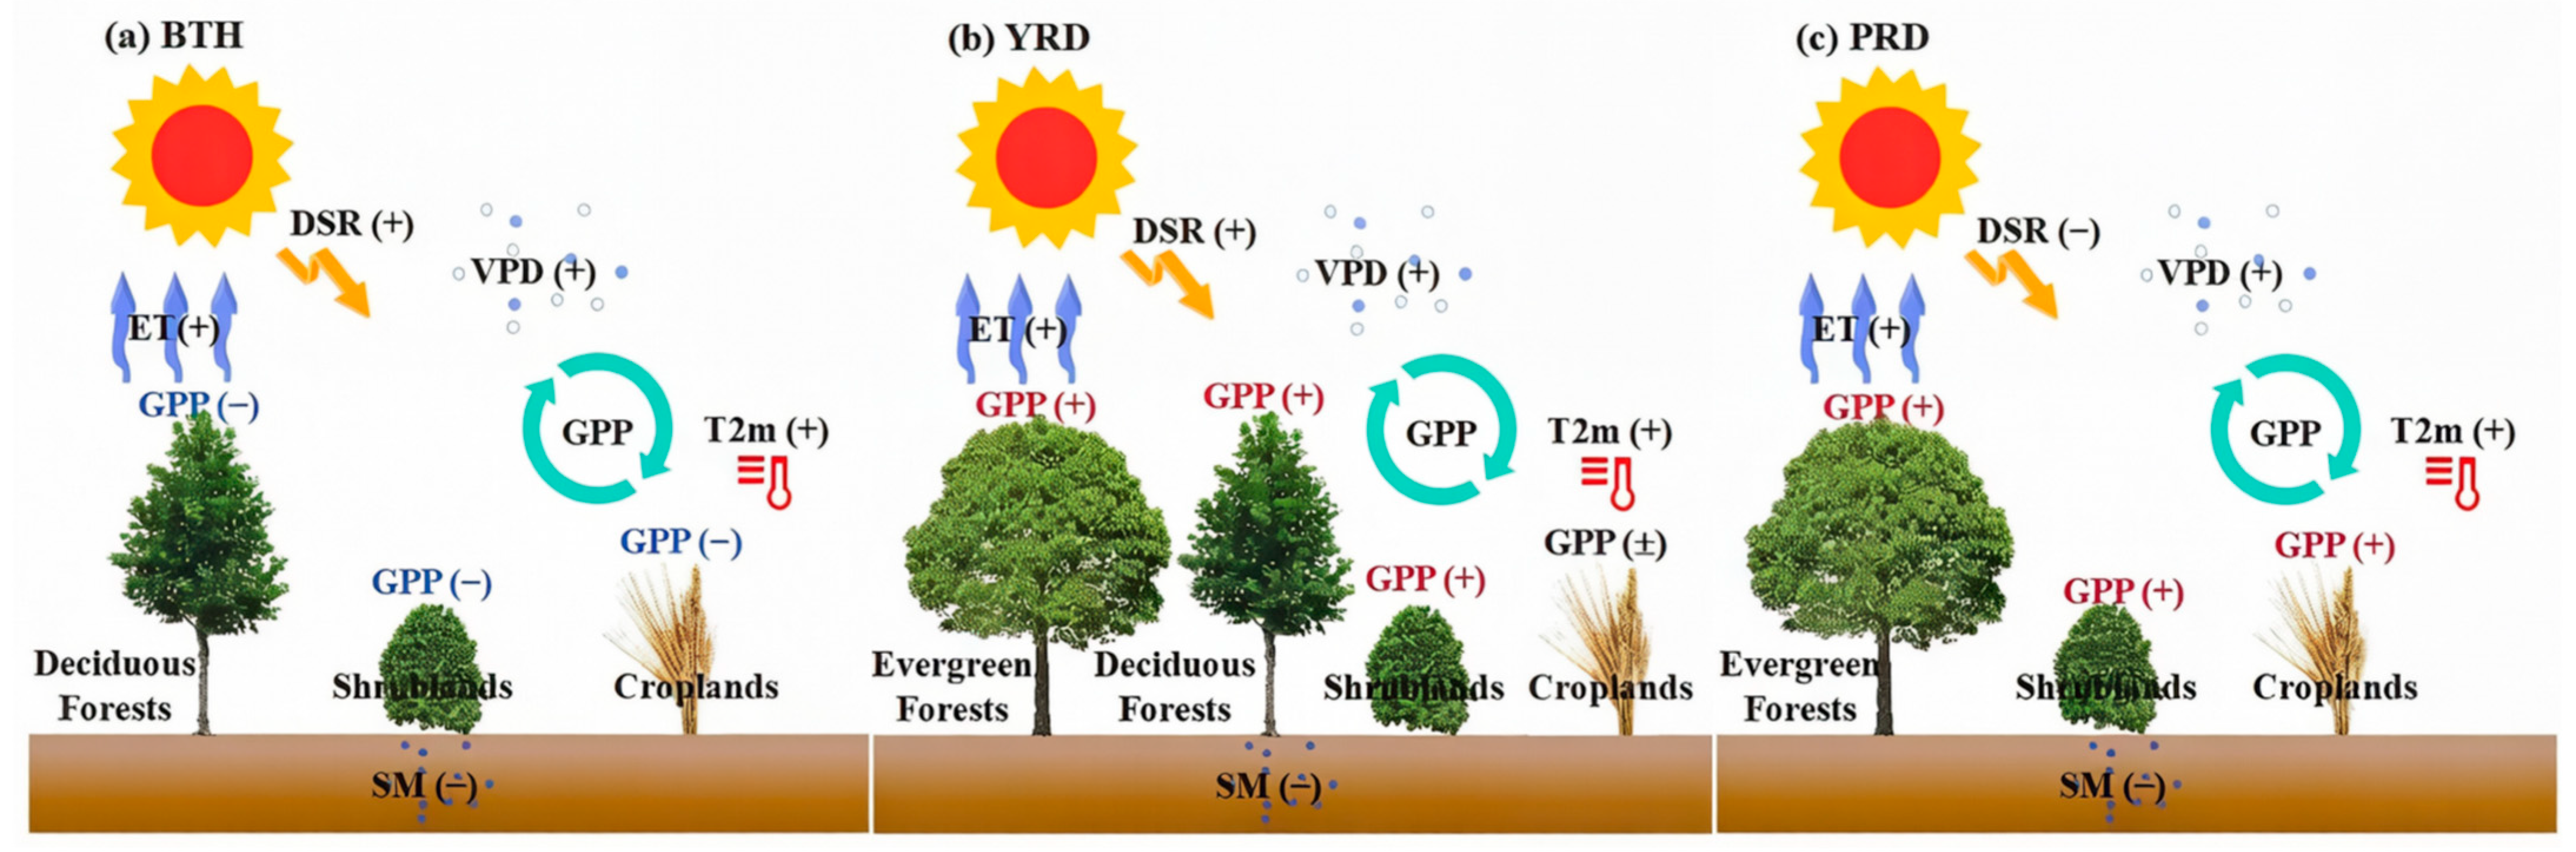
The divergent sensitivity of GPP to CDH events across China’s three major urban agglomerations reveals a fundamental transition from water-limited to energy-limited ecosystem control mechanisms (Figure 11). Our results demonstrate that while the physical coupling of “high temperature–atmospheric dryness–soil drought” is consistent across all regions, the biological response is dictated by the background climatic state and the specific configuration of radiative and thermal anomalies.
Figure 11.
Conceptual mechanism diagram illustrating the coupled responses of climate variables and vegetation carbon dynamics (GPP) to CDH events in the three urban agglomerations. The plus sign (+) indicates an increase, the minus sign (−) indicates a decrease, and the plus-minus sign (±) denotes uncertainty or inconsistency between the GPPFluxSat and GPPGOSIF products regarding the direction of change.
In the BTH region, the ecosystem functions as a classic water-limited system. As illustrated in Figure 11a, the CDH event is characterized by a “radiation-driven” stress mechanism. Although the positive anomaly in downward shortwave radiation (DSR+) theoretically increases the energy available for photosynthesis, it concurrently drives a surge in vapor pressure deficit (VPD+). In this semi-arid environment, the severe soil moisture deficit (SM−) creates a hydraulic bottleneck. Vegetation, particularly natural types like deciduous forests and shrublands, likely adopts an isohydric strategy, closing stomata to prevent hydraulic failure under high atmospheric demand. Consequently, the potential carbon gain from enhanced radiation is negated by stomatal limitations, leading to a net decline in GPP (GPP−). The GPP reduction (GPP−) observed in croplands suggests that high atmospheric evaporative demand dominated the ecosystem response, overriding the decoupling effect of anthropogenic irrigation. Although irrigation artificially mitigates SM deficits, it was insufficient to prevent productivity loss under such severe compound stress.
Conversely, the YRD region exhibits a resilience typical of energy-limited ecosystems, where CDH events paradoxically act as productivity boosters (Figure 11b). Despite experiencing the most severe soil moisture deficit among the three regions, the YRD vegetation showed a positive GPP response (GPP+). This suggests that in this humid, subtropical zone, cloud cover is often a limiting factor for photosynthesis. The CDH event, characterized by high DSR (+) and elevated temperatures (T2m+), effectively alleviates these energy constraints. The robust performance of evergreen and deciduous forests implies a mechanism of “hydraulic decoupling,” where deep root systems access sub-surface water reserves, allowing the canopy to maintain gas exchange and capitalize on the enhanced radiation and thermal conditions despite surface drying.
The PRD region presents a distinct “thermal-driven” enhancement mechanism (Figure 11c). Unlike the BTH and YRD regions, the PRD event occurred under negative radiation anomalies (DSR−). However, GPP still exhibited a significant increase (GPP+). This finding indicates that in this tropical monsoon climate, thermal enhancement (T2m+) alone can override the limitations of reduced radiation and moderate soil drought (SM−). The warming likely pushed temperatures closer to the optimal range for photosynthetic enzymatic activity in these evergreen broadleaf forests, promoting carbon uptake without the requisite boost in solar radiation seen in the YRD.
Collectively, these mechanisms underscore a latitudinal shift in CDH impacts: in the water-limited North (BTH), the compound stress of heat and drought amplifies evapotranspirative demand beyond soil supply, suppressing GPP; in the energy-limited South (YRD and PRD), the associated thermal and radiative anomalies relieve climatic constraints, turning potential stressors into drivers of enhanced vegetation growth.
4.2. Uncertainty Between Two GPP Products
This study analyzed the response of terrestrial ecosystem photosynthesis to CDH events using two commonly employed GPP products: GPPGOSIF and GPPFluxSat. Overall, both datasets exhibited generally consistent patterns, albeit with some notable discrepancies. These discrepancies are likely attributable to the distinct retrieval mechanisms of the two products. GPPGOSIF is derived from Solar-Induced Chlorophyll Fluorescence (SIF), which serves as a direct proxy for actual photosynthetic activity and is highly sensitive to physiological stress even before canopy greenness changes. In contrast, GPPFluxSat relies on reflectance data and Light Use Efficiency (LUE) algorithms, which may be more sensitive to structural changes (e.g., Leaf Area Index) and might lag in capturing immediate physiological downregulation caused by stomatal closure during short-term heatwaves. Future research should prioritize validating these satellite-derived products against ground-based eddy covariance flux tower data, specifically under extreme CDH conditions. This will help determine which retrieval algorithm more accurately captures the physiological downregulation, thereby further reducing uncertainties in quantifying regional carbon losses.
4.3. Limitations and Perspective
Although this study reveals the differences in GPP responses among the BTH, YRD, and PRD regions during CDH events, several limitations remain that should be addressed in future research. First, this study analyzed only one typical CDH event per year from each of the three urban agglomerations, with relatively limited spatial and temporal coverage, potentially affecting the representativeness of the findings. Second, the regions lack long-term, continuous ground station observation data for validation. Third, the analysis primarily focused on qualitative assessments of anomalous meteorological conditions without quantitatively disentangling the relative contributions of individual climatic drivers to GPP reductions during CDH events. Furthermore, this study focused exclusively on GPP, which represents the gross carbon uptake, without extending the analysis to Net Primary Productivity (NPP). While GPP reflects the immediate photosynthetic response to water and heat stress, CDH events are also known to exponentially increase autotrophic respiration due to elevated temperatures. Therefore, it is possible that even in regions where GPP remained stable or increased (e.g., YRD and PRD), the net carbon sink (NPP) could have declined if respiratory losses outweighed photosynthetic gains. Future research should integrate respiration models to provide a more holistic assessment of the net ecosystem carbon balance under compound extremes.
Several key research directions remain for future work. First, the research scale should be expanded to analyze response mechanisms to CDH across different global latitudes [36,37]. China exhibits a latitudinal gradient in GPP decline during CDH events between northern and southern regions. Future studies should extend globally to systematically explore differential responses in the low-latitude, mid-latitude, and high-latitude ecosystems [38,39,40]. Meanwhile, more typical drought years should be selected to enhance research accuracy [41]. Second, establishing a long-term, continuous global network of observation sites is essential. Advancing CDH event research requires building ecological observation networks covering the entire globe, particularly in data-scarce regions like the tropics and high-latitude areas [42]. A more comprehensive observation system will not only deepen our understanding of key terrestrial carbon cycle processes but also provide reliable data support for model evaluation and parameter optimization [43]. Finally, developing high-resolution terrestrial ecosystem models to enhance CDH response prediction capabilities is essential. Integrating multi-source data with new technologies like machine learning into model development can improve prediction accuracy and interpretability [44]. Analyzing different climate factors to determine GPP critical points and thresholds will quantify sensitivity differences between structurally simple and complex ecosystems under extreme climate stress [45].
5. Conclusions
This study assessed the spatiotemporal impacts of CDH events on ecosystem productivity across three major urban agglomerations in eastern China: Beijing–Tianjin–Hebei (BTH), the Yangtze River Delta (YRD), and the Pearl River Delta (PRD). Representative CDH years were identified as 2007 (for BTH) and 2022 (for YRD and PRD) based on concurrent standardized anomalies of temperature and soil moisture in July–September. By integrating ERA5-Land meteorological reanalysis with multi-source satellite products (GPPFluxSat, GPPGOSIF, and MODIS EVI), we revealed robust regional contrasts in vegetation responses and underlying drivers.
Consistent with our hypothesis of divergent ecosystem sensitivities, CDH events in all regions exhibited a coherent hydro-thermal coupling pattern characterized by high temperature, enhanced atmospheric dryness (VPD), and soil moisture deficits. However, the ecosystem carbon uptake response diverged markedly across the north–south climatic gradient, indicating that the net effect of CDH events is strongly conditioned by background hydro-climatic regime and vegetation functional traits. The BTH region, located in a water-limited temperate zone, showed the highest vulnerability, with widespread negative GPP anomalies (−1.13 STD in GPPFluxSat and −0.96 STD in GPPGOSIF). This decline is mechanistically consistent with a water-constraint–dominated response, in which soil moisture depletion together with elevated VPD increases plant water stress, promotes stomatal closure, and ultimately suppresses photosynthesis—effects that can outweigh any potential fertilization from enhanced energy supply during hot conditions. Importantly, productivity losses in BTH reflect heterogeneous ecosystem regulation capacity: managed croplands may be partially buffered (e.g., via irrigation), whereas natural vegetation types (e.g., shrublands and forests) tend to exhibit stronger sensitivity under sustained atmospheric and soil water stress. In contrast, the humid subtropical YRD and PRD generally displayed resilience and, in some areas, enhanced productivity during CDH years, implying an energy-limited baseline state in which warming and/or radiative conditions can temporarily alleviate constraints on photosynthesis, provided that drought stress does not exceed physiological thresholds. In the YRD, positive GPP anomalies (0.32 STD in GPPFluxSat and 1.79 STD in GPPGOSIF) occurred under pronounced warming (+1.82 STD in T2m) and are most consistent with a mechanism of energy-limitation alleviation (thermal and radiative enhancement) combined with vegetation access to deeper water reserves and/or stronger physiological buffering in forests, allowing canopy carbon uptake to be maintained despite surface drying. In the PRD, GPPFluxSat indicated a pronounced increase (+1.86 STD) while GPPGOSIF showed a moderate positive anomaly (+1.06 STD), supporting a thermal-driven enhancement pathway in which warming can raise photosynthesis toward more favorable thermal conditions even when concurrent drought and radiation anomalies do not uniformly favor productivity.
Overall, these findings highlight a critical north–south climatic gradient in ecosystem sensitivity: northern ecosystems are predominantly water-constrained and vulnerable to compound extremes, whereas central and southern ecosystems function as energy-limited systems that may temporarily benefit from the increased radiation or thermal enhancement associated with heatwaves, provided soil moisture depletion does not exceed physiological thresholds. This study underscores the necessity of incorporating vegetation-specific adaptive mechanisms and regional climatic heterogeneity into carbon cycle models to accurately predict terrestrial carbon dynamics under a warming climate. Future urban planning and ecosystem management strategies should prioritize water conservation in northern agglomerations while leveraging the resilience of forest ecosystems in southern regions to mitigate climate risks.
Author Contributions
H.M. and Y.C.: Writing—review & editing, Writing—original draft, Visualization, Validation, Methodology, Investigation, Formal analysis, Data curation. Y.Z.: Writing—review & editing, Supervision, Resources, Project administration, Funding acquisition. T.J.: Writing—review & editing, Supervision, Resources, Funding acquisition. X.Y.: Writing—review & editing, Supervision, Resources, Funding acquisition. Z.D.: Writing—review & editing, Supervision, Resources, Funding acquisition. All authors have read and agreed to the published version of the manuscript.
Funding
This work was supported by the China Meteorological Administration Xiong’an Atmospheric Boundary Layer Key Laboratory (No. 2023LABL-B14), the Natural Science Research Project of Colleges and Universities of Jiangsu Province (No. 25KJB170026), China Meteorological Administration Aerosol-Cloud and Precipitation Key Laboratory (No. KDW2401), the College Students’ Innovation and Entrepreneurship Training Project (No. 2025207) and the Startup Foundation in Nantong University (No. 135423612053).
Data Availability Statement
The datasets used in this study are publicly available from the following sources. ERA5-Land monthly averaged climate data, including 2 m air temperature, volumetric soil moisture, downward solar radiation, and dew-point temperature, were obtained from the Copernicus Climate Data Store (https://cds.climate.copernicus.eu, accessed on 12 June 2025). The GPPGOSIF product derived from OCO-2 Solar-Induced chlorophyll Fluorescence is available at http://data.globalecology.unh.edu/data/GOSIF-GPP_v2/, accessed on 1 October 2025. The GPPFluxSat Version 2.2 product can be accessed via https://avdc.gsfc.nasa.gov/pub/tmp/FluxSat_GPP/, accessed on 12 June 2025. Land cover data (MCD12Q1 V6.1) and Enhanced Vegetation Index (EVI) products (MOD13C2 V6.1) were retrieved from NASA’s MODIS data portal (https://modis.gsfc.nasa.gov/data/dataprod/, accessed on 12 June 2025).
Conflicts of Interest
The authors declare that they have no known competing financial interests or personal relationships that could have appeared to influence the work reported in this paper.
References
- Zhu, X.; Zhang, S.; Liu, T.; Liu, Y. Impacts of Heat and Drought on Gross Primary Productivity in China. Remote Sens. 2021, 13, 378. [Google Scholar] [CrossRef] [Scilit]
- Dannenberg, M.P.; Yan, D.; Barnes, M.L.; Smith, W.K.; Johnston, M.R.; Scott, R.L.; Biederman, J.A.; Knowles, J.F.; Wang, X.; Duman, T.; et al. Exceptional heat and atmospheric dryness amplified losses of primary production during the 2020 U.S. Southwest hot drought. Glob. Change Biol. 2022, 28, 4794–4806. [Google Scholar] [CrossRef] [Scilit]
- Li, K.; Wang, M.; Liu, K. The Study on Compound Drought and Heatwave Events in China Using Complex Networks. Sustainability 2021, 13, 12774. [Google Scholar] [CrossRef] [Scilit]
- Liu, Z.; Hu, S.; Mo, X. Spatiotemporal Variation of Compound Drought and Heatwave Events in Semi-Arid and Semi-Humid Regions of China. Atmosphere 2025, 16, 568. [Google Scholar] [CrossRef] [Scilit]
- Fan, X.; Zhang, Y.; Shi, K.; Peng, J.; Liu, Y.; Zhou, Y.; Liu, Y.; Zhu, Q.; Song, C.; Wan, R.; et al. Surging compound drought-heatwaves underrated in global soils. Proc. Natl. Acad. Sci. USA 2024, 121, e2410294121. [Google Scholar] [CrossRef] [Scilit]
- Kang, J.; Yu, M.; Xia, Y.; Sun, S.; Zhou, B. Impacts of Compound Hot–Dry Events on Vegetation Productivity over Northern East Asia. Forests 2024, 15, 549. [Google Scholar] [CrossRef] [Scilit]
- Li, J.; Zhang, Y.; Bevacqua, E.; Zscheischler, J.; Keenan, T.F.; Lian, X.; Zhou, S.; Zhang, H.; He, M.; Piao, S. Future increase in compound soil drought-heat extremes exacerbated by vegetation greening. Nat. Commun. 2024, 15, 10875. [Google Scholar] [CrossRef] [Scilit]
- Piao, S.; Sitch, S.; Ciais, P.; Friedlingstein, P.; Peylin, P.; Wang, X.; Ahlström, A.; Anav, A.; Canadell, J.G.; Cong, N.; et al. Evaluation of terrestrial carbon cycle models for their response to climate variability and to CO2 trends. Glob. Change Biol. 2013, 19, 2117–2132. [Google Scholar] [CrossRef] [Scilit] [PubMed]
- Xu, Z.; Tian, Y.; Liu, Z.; Xia, X. Comprehensive Effects of Atmosphere and Soil Drying on Stomatal Behavior of Different Plant Types. Water 2023, 15, 1675. [Google Scholar] [CrossRef] [Scilit]
- Buitink, J.; Swank, A.M.; van der Ploeg, M.; Smith, N.E.; Benninga, H.-J.F.; van der Bolt, F.; Carranza, C.D.U.; Koren, G.; van der Velde, R.; Teuling, A.J. Anatomy of the 2018 agricultural drought in The Netherlands using in situ soil moisture and satellite vegetation indices. Hydrol. Earth Syst. Sci. 2020, 24, 6021–6031. [Google Scholar] [CrossRef] [Scilit]
- Fu, Z.; Ciais, P.; Prentice, I.C.; Gentine, P.; Makowski, D.; Bastos, A.; Luo, X.; Green, J.K.; Stoy, P.C.; Yang, H.; et al. Atmospheric dryness reduces photosynthesis along a large range of soil water deficits. Nat. Commun. 2022, 13, 989. [Google Scholar] [CrossRef] [Scilit]
- Zhao, D.; Zhang, Z.; Zhang, Y. Soil Moisture Dominates the Forest Productivity Decline During the 2022 China Compound Drought-Heatwave Event. Geophys. Res. Lett. 2023, 50, e2023GL104539. [Google Scholar] [CrossRef] [Scilit]
- Wang, M.; Wang, Y.; Liu, X.; Hou, W.; Wang, J.; Li, S.; Zhao, L.; Hu, Z. Vapor pressure deficit dominates vegetation productivity during compound drought and heatwave events in China’s arid and semi-arid regions: Evidence from multiple vegetation parameters. Ecol. Inform. 2025, 88, 103144. [Google Scholar] [CrossRef] [Scilit]
- Chen, S.; Qiu, R.; Chen, Y.; Gong, W.; Han, G. Impacts of Drought and Heatwave on the Vegetation and Ecosystem in the Yangtze River Basin in 2022. Remote Sens. 2024, 16, 2889. [Google Scholar] [CrossRef] [Scilit]
- Yan, W.; Zhou, J.; Wang, X.; Luo, J.; Yang, F.; Wu, R. Vegetation resistance to compound drought and heatwave events buffers the spatial shift velocities of vegetation vulnerability. Commun. Earth Environ. 2025, 6, 320. [Google Scholar] [CrossRef] [Scilit]
- Wang, Z.; Chen, W.; Piao, J.; Cai, Q.; Chen, S.; Xue, X.; Ma, T. Synergistic effects of high atmospheric and soil dryness on record-breaking decreases in vegetation productivity over Southwest China in 2023. npj Clim. Atmos. Sci. 2025, 8, 6. [Google Scholar] [CrossRef] [Scilit]
- Zhu, J.; Guo, H.; Sun, Y. Responses of Terrestrial GPP to Extreme Compound Heatwave and Drought Events of Different Intensities in the Yangtze River Basin. Remote Sens. 2025, 17, 848. [Google Scholar] [CrossRef] [Scilit]
- Liu, M.; Yu, H.; Duan, W.; Wu, M. Differential impacts of compound dry- and humid-hot events on global vegetation productivity. Front. Environ. Sci. 2025, 13, 1597553. [Google Scholar] [CrossRef] [Scilit]
- Samat, A.T.; Soltabayeva, A.; Bekturova, A.; Zhanassova, K.; Auganova, D.; Masalimov, Z.; Srivastava, S.; Satkanov, M.; Kurmanbayeva, A. Plant responses to heat stress and advances in mitigation strategies. Front. Plant Sci. 2025, 16, 1638213. [Google Scholar] [CrossRef] [Scilit] [PubMed]
- Hofmann, T.A.; Atkinson, W.; Fan, M.; Simkin, A.J.; Jindal, P.; Lawson, T. Impact of climate-driven changes in temperature on stomatal anatomy and physiology. Philos. Trans. R. Soc. Lond. B. Biol. Sci. 2025, 380, 20240244. [Google Scholar] [CrossRef] [Scilit] [PubMed]
- Moore, C.E.; Meacham-Hensold, K.; Lemonnier, P.; Slattery, R.A.; Benjamin, C.; Bernacchi, C.J.; Lawson, T.; Cavanagh, A.P. The effect of increasing temperature on crop photosynthesis: From enzymes to ecosystems. J. Exp. Bot. 2021, 72, 2822–2844. [Google Scholar] [CrossRef] [Scilit]
- Wang, H.; Ge, Q. Ecological resilience of three major urban agglomerations in China from the “environment–society” coupling perspective. Ecol. Indic. 2024, 169, 112944. [Google Scholar] [CrossRef] [Scilit]
- Guo, Y.; Zhao, S.; Zhao, X.; Wang, H.; Shi, W. Evaluation of the Spatiotemporal Change of Ecological Quality under the Context of Urban Expansion—A Case Study of Typical Urban Agglomerations in China. Remote Sens. 2024, 16, 45. [Google Scholar] [CrossRef] [Scilit]
- Tong, R.; Sun, W.; Han, Q.; Yu, J.; Tian, Z. Spatial and Temporal Variations in Extreme Precipitation and Temperature Events in the Beijing–Tianjin–Hebei Region of China over the Past Six Decades. Sustainability 2020, 12, 1415. [Google Scholar] [CrossRef] [Scilit]
- Zhang, Q.; Zheng, Y.; Singh, V.P.; Luo, M.; Xie, Z. Summer extreme precipitation in eastern China: Mechanisms and impacts. J. Geophys. Res. Atmos. 2017, 122, 2766–2778. [Google Scholar] [CrossRef] [Scilit]
- Deng, F.; Yang, Y.; Zhao, E.; Xu, N.; Li, Z.; Zheng, P.; Han, Y.; Gong, J. Urban Heat Island Intensity Changes in Guangdong-Hong Kong-Macao Greater Bay Area of China Revealed by Downscaling MODIS LST with Deep Learning. Int. J. Environ. Res. Public Health 2022, 19, 17001. [Google Scholar] [CrossRef] [Scilit]
- Ye, A.; Li, X.; Cai, J.; Deng, Y. Evaluation of water ecological security and diagnosis of Obstacles in the Yangtze river delta, China. Sci. Rep. 2025, 15, 30981. [Google Scholar] [CrossRef] [Scilit] [PubMed]
- Chen, F.; Ke, X.; Yang, T.; Zhang, Z.; Jiang, R.; Yu, J.; Xie, J.; Li, J. Quantitative paleoclimate reconstruction in the Yangtze River Delta since the Last Glacial Maximum based on pollen records. Sci. Rep. 2026, 16, 3421. [Google Scholar] [CrossRef] [Scilit]
- Chen, S.; Zhu, Z.; Liu, X.; Yang, L. Variation in Vegetation and Its Driving Force in the Pearl River Delta Region of China. Int. J. Environ. Res. Public Health 2022, 19, 10343. [Google Scholar] [CrossRef] [Scilit]
- Liu, Y.Y.; van Dijk, A.I.J.M.; Meir, P.; McVicar, T.R. Drought and radiation explain fluctuations in Amazon rainforest greenness during the 2015–2016 drought. Biogeosciences 2024, 21, 2273–2295. [Google Scholar] [CrossRef] [Scilit]
- Friedl, M.; Sulla-Menashe, D. MODIS/Terra + Aqua Land Cover Type Yearly L3 Global 500m SIN Grid V061 [MCD12Q1]. NASA Land Processes Distributed Active Archive Center. 2022. Available online: https://www.earthdata.nasa.gov/data/catalog/lpcloud-mcd12q1-061 (accessed on 12 June 2025).
- Liang, D.; Zuo, Y.; Huang, L.; Zhao, J.; Teng, L.; Yang, F. Evaluation of the Consistency of MODIS Land Cover Product (MCD12Q1) Based on Chinese 30 m GlobeLand30 Datasets: A Case Study in Anhui Province, China. ISPRS Int. J. Geo-Inf. 2015, 4, 2519–2541. [Google Scholar] [CrossRef] [Scilit]
- Didan, K. MODIS/Terra Vegetation Indices Monthly L3 Global 0.05Deg CMG V061 [MOD13C2]. NASA Land Processes Distributed Active Archive Center. 2021. Available online: https://www.earthdata.nasa.gov/data/catalog/lpcloud-mod13c2-061 (accessed on 12 June 2025).
- Wang, J.; Yan, R.; Wu, G.; Liu, Y.; Wang, M.; Zeng, N.; Jiang, F.; Wang, H.; He, W.; Wu, M.; et al. Unprecedented decline in photosynthesis caused by summer 2022 record-breaking compound drought-heatwave over Yangtze River Basin. Sci. Bull. 2023, 68, 2160–2163. [Google Scholar] [CrossRef] [Scilit]
- Li, T.; Wang, S.; Chen, B.; Wang, Y.; Chen, S.; Chen, J.; Xiao, Y.; Xia, Y.; Zhao, Z.; Chen, X.; et al. Widespread reduction in gross primary productivity caused by the compound heat and drought in Yangtze River Basin in 2022. Environ. Res. Lett. 2024, 19, 034048. [Google Scholar] [CrossRef] [Scilit]
- Flach, M.; Brenning, A.; Gans, F.; Reichstein, M.; Sippel, S.; Mahecha, M.D. Vegetation modulates the impact of climate extremes on gross primary production. Biogeosciences 2021, 18, 39–53. [Google Scholar] [CrossRef] [Scilit]
- Li, X.; Piao, S.; Huntingford, C.; Peñuelas, J.; Yang, H.; Xu, H.; Chen, A.; Friedlingstein, P.; Keenan, T.F.; Sitch, S.; et al. Global variations in critical drought thresholds that impact vegetation. Natl. Sci. Rev. 2023, 10, nwad049. [Google Scholar] [CrossRef] [Scilit]
- Crame, J.A.; McGowan, A.J. Origin of the tropical–polar biodiversity contrast. Glob. Ecol. Biogeogr. 2022, 31, 1207–1227. [Google Scholar] [CrossRef] [Scilit]
- Flach, M.; Sippel, S.; Gans, F.; Bastos, A.; Brenning, A.; Reichstein, M.; Mahecha, M.D. Contrasting biosphere responses to hydrometeorological extremes: Revisiting the 2010 western Russian heatwave. Biogeosciences 2018, 15, 6067–6085. [Google Scholar] [CrossRef] [Scilit]
- von Buttlar, J.; Zscheischler, J.; Rammig, A.; Sippel, S.; Reichstein, M.; Knohl, A.; Jung, M.; Menzer, O.; Arain, M.A.; Buchmann, N.; et al. Impacts of droughts and extreme-temperature events on gross primary production and ecosystem respiration: A systematic assessment across ecosystems and climate zones. Biogeosciences 2018, 15, 1293–1318. [Google Scholar] [CrossRef] [Scilit]
- Lisonbee, J.; Parker, B.; Fleishman, E.; Ford, T.W.; Bocinsky, R.K.; Follingstad, G.; Frazier, A.G.; Hoylman, Z.H.; Hudson, A.R.; Nielsen-Gammon, J.W.; et al. Prioritization of Research on Drought Assessment in a Changing Climate. Earth’s Future 2025, 13, e2024EF005276. [Google Scholar] [CrossRef] [Scilit]
- Mirtl, M.; T Borer, E.; Djukic, I.; Forsius, M.; Haubold, H.; Hugo, W.; Jourdan, J.; Lindenmayer, D.; McDowell, W.H.; Muraoka, H.; et al. Genesis, goals and achievements of Long-Term Ecological Research at the global scale: A critical review of ILTER and future directions. Sci. Total Environ. 2018, 626, 1439–1462. [Google Scholar] [CrossRef] [Scilit]
- Mahmud, K.; Scott, R.L.; Biederman, J.A.; Litvak, M.E.; Kolb, T.; Meyers, T.P.; Krishnan, P.; Bastrikov, V.; MacBean, N. Optimizing Carbon Cycle Parameters Drastically Improves Terrestrial Biosphere Model Underestimates of Dryland Mean Net CO2 Flux and its Inter-Annual Variability. J. Geophys. Res. Biogeosci. 2021, 126, e2021JG006400. [Google Scholar] [CrossRef] [Scilit]
- Reichstein, M.; Camps-Valls, G.; Stevens, B.; Jung, M.; Denzler, J.; Carvalhais, N.; Prabhat. Deep learning and process understanding for data-driven Earth system science. Nature 2019, 566, 195–204. [Google Scholar] [CrossRef] [Scilit] [PubMed]
- Bao, S.; Wutzler, T.; Koirala, S.; Cuntz, M.; Ibrom, A.; Besnard, S.; Walther, S.; Šigut, L.; Moreno, A.; Weber, U.; et al. Environment-sensitivity functions for gross primary productivity in light use efficiency models. Agric. For. Meteorol. 2022, 312, 108708. [Google Scholar] [CrossRef] [Scilit]

Disclaimer/Publisher’s Note: The statements, opinions and data contained in all publications are solely those of the individual author(s) and contributor(s) and not of MDPI and/or the editor(s). MDPI and/or the editor(s) disclaim responsibility for any injury to people or property resulting from any ideas, methods, instructions or products referred to in the content. |
© 2026 by the authors. Licensee MDPI, Basel, Switzerland. This article is an open access article distributed under the terms and conditions of the Creative Commons Attribution (CC BY) license.