


Highlights
What are the main findings?
- Tree crop conversion increased evapotranspiration and slightly increased seasonal water balance deficit compared to maize.
- Slope-based interventions reduced mean soil loss from 15.52 to 11.51 t/ha/year.
What are the implications of the main findings?
- The joint evaluation of hydrological and erosion processes is required to minimise unintended impacts on water balance resulting from erosion control strategies.
- The framework supports targeted, slope-specific land-use planning to reduce soil loss while managing hydrological constraints.
Abstract
Chieng Hac in northern Vietnam is expanding maize cultivation, intensifying water competition and soil erosion. This study mapped regional water balance and erosion using remote sensing and GISs by coupling the Thornthwaite–Mather (TM) water balance model with the Revised Universal Soil Loss Equation (RUSLE) at 12.5 m resolution. Land cover was classified into maize, tree crops, paddy, forest, and other types using Random Forest. The TM model used 2021 precipitation and temperature measurements to estimate evapotranspiration, surplus, and deficit, while the RUSLE quantified soil loss. Two scenarios were evaluated: a baseline reflecting existing land use and an adjusted case applying strip cropping on 10–20° maize slopes and converting maize to tree crops on slopes > 20°. Tree crop conversion increased evapotranspiration and prolonged seasonal deficits relative to maize, increasing water deficit from 1013.6 to 1022.2 mm/year. In contrast, the interventions reduced mean soil loss from 15.52 to 11.51 t/ha/year, with the largest decline in the 5–25 t/ha/year class. Residual hotspots persisted on steep slopes and near drainage lines. The integrated framework highlights trade-offs between erosion control and seasonal water availability, supporting slope-based land-use planning in upland agricultural systems. These findings offer guidance for slope-based land-use planning by indicating that intervention priorities should vary depending on slope conditions and local water availability.
1. Introduction
Water and land resources are essential for sustaining life and ecosystems, playing a crucial role in agriculture, industry, and human consumption. With the global population continuously growing, freshwater resources are becoming increasingly scarce, and land degradation from unsustainable agricultural practice impairs water retention and increases erosion risk. This scarcity of water and decline in land quality intensifies competition for water, particularly in agriculture, which already accounts for 85% of global freshwater use [1]. At the same time, land resource management is challenged by widespread degradation, including soil erosion, which undermines soil function [2]. The agricultural freshwater consumption is even higher in the Asia and Pacific region, reaching 90% [3], with many countries also experiencing accelerated soil loss [4]. These combined pressures are especially critical in regions with complex topography, such as the mountainous areas of Vietnam, where steep slopes, fragile soils, and variable rainfall require integrated approaches to water and land resource management [5].
Chieng Hac, located in Moc Chau district, Son La province, is a key maize-producing region in Vietnam. However, much of its agricultural land lies on steep slopes, making water management a significant challenge [6]. Despite this, maize cultivation has expanded into areas with poor suitability for agriculture, increasing vulnerability to water shortages and soil degradation [7]. The cultivation of maize is done through monoculture practices, with upland regions as the main area for cultivation. The practice also involves the act of deforestation for agricultural expansion, which deteriorates the soil health. Such land clearing for monoculture not only promotes flood and drought risk but also accelerate soil erosion [8,9]. Accordingly, addressing sloping-farmland sustainability in regions like Chieng Hac requires spatially explicit methods that can jointly characterise seasonal water availability and erosion susceptibility to support targeted interventions.
Hydrological modelling has evolved from site-specific assessments using graphs, tables, and simple mathematical operations to spatially explicit analyses supported by Geographic Information Systems (GISs). GISs enable the processing of large volumes of attribute data and provide tools for analysis, manipulation, and visualisation that support both hydrological and erosion modelling [10]. Within this framework, water balance methods calculate soil moisture deficit, surplus, and recharge from rainfall and radiation, while GISs turn these point-based calculations into maps that account for topography and land use [11,12]. Erosion modelling has followed a parallel trajectory, advancing from empirical plot-scale equations to widely applied regional tools, with the Universal Soil Loss Equation (USLE) refined into the Revised Universal Soil Loss Equation (RUSLE) to estimate average annual soil loss [13,14].
Within this integrated framework, the Thornthwaite and Mather (TM) hydrological model is used to quantify monthly deficits, surpluses, and potential runoff from limited inputs, making it suitable for seasonal water management assessment in data-limited settings [15]. The TM model has been integrated with GISs and remote sensing to simulate basin-scale water balance in the Prrachia and Ukanc watershed [16]. In contrast, more data-intensive models such as the Soil and Water Assessment Tool (SWAT) or Variable Infiltration Capacity (VIC) simulate additional hydrological processes but require greater calibration, which can be difficult in mountainous regions with sparse observations [17,18].
The runoff term in the TM model represents water surplus rather than the erosive energy that detaches and transports soil on slopes. A complementary erosion-focused model is therefore required to quantify soil loss risk [19]. For this purpose, the RUSLE provides a widely applied method for estimating long-term average annual soil loss using rainfall erosivity, soil erodibility, slope length and steepness, cover management, and conservation practices [14]. Recent research has integrated RUSLE with geospatial analysis for land management in Southern Punjab, Pakistan, demonstrating that it remains a robust tool for estimating soil loss at the regional scale [20].
As both TM and RUSLE outputs are sensitive to land-cover characterisation, recent studies increasingly use Random Forest (RF) to generate crop and land-cover maps and derive water- or erosion-related variables [21]. Together, RF-supported land-cover mapping, TM water balance analysis, and RUSLE erosion modelling provide a practical workflow for assessing water and land resource management in data-limited upland areas.
While these modelling approaches provide important tools for analysing water balance and soil erosion processes, their combined interpretation is particularly important in sloping agricultural systems. In such landscapes, water availability and soil erosion are closely interconnected processes [22,23]. Seasonal water deficits influence vegetation cover and soil moisture, while runoff generated during rainfall events contributes to both erosion and the redistribution of water across the landscape [24]. Evaluating water balance and soil erosion together therefore provides a more comprehensive understanding of land degradation risks and supports the development of more effective slope-based land management strategies [25].
Persistent gaps remain in understanding the spatial and temporal dynamics of both water balance and soil erosion at a regional scale, particularly in sloping agricultural landscapes where rainfall variability interacts with land management [6,8]. Existing studies often focus on soil erosion alone [26], while integrated hydrology–erosion approaches require extensive data and parameterization, limiting their applicability in data-constrained upland regions [27]. This study addresses those gaps by integrating the TM water balance model and RUSLE within a GIS framework to assess spatial and temporal variability in water balance components and soil erosion rates in Chieng Hac commune. Specifically, the study quantifies monthly precipitation, evapotranspiration, and water surplus or deficit patterns, alongside annual soil loss estimates for the existing maize monoculture and land-use intervention scenario. Because the approach uses widely available remote sensing products, it is transparent, transferable, and suitable for data-limited settings. The findings support more climate-resilient water and land management in Chieng Hac and offer a template for similar upland regions.
2. Materials and Methods
2.1. Study Area Description
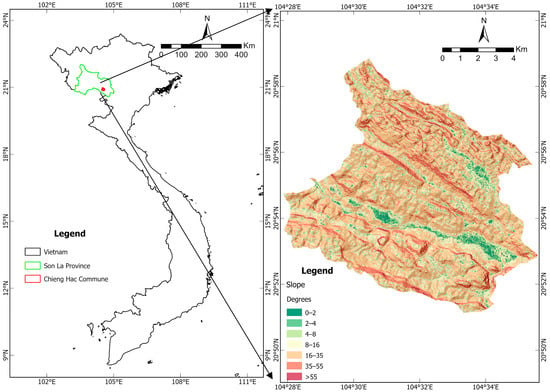
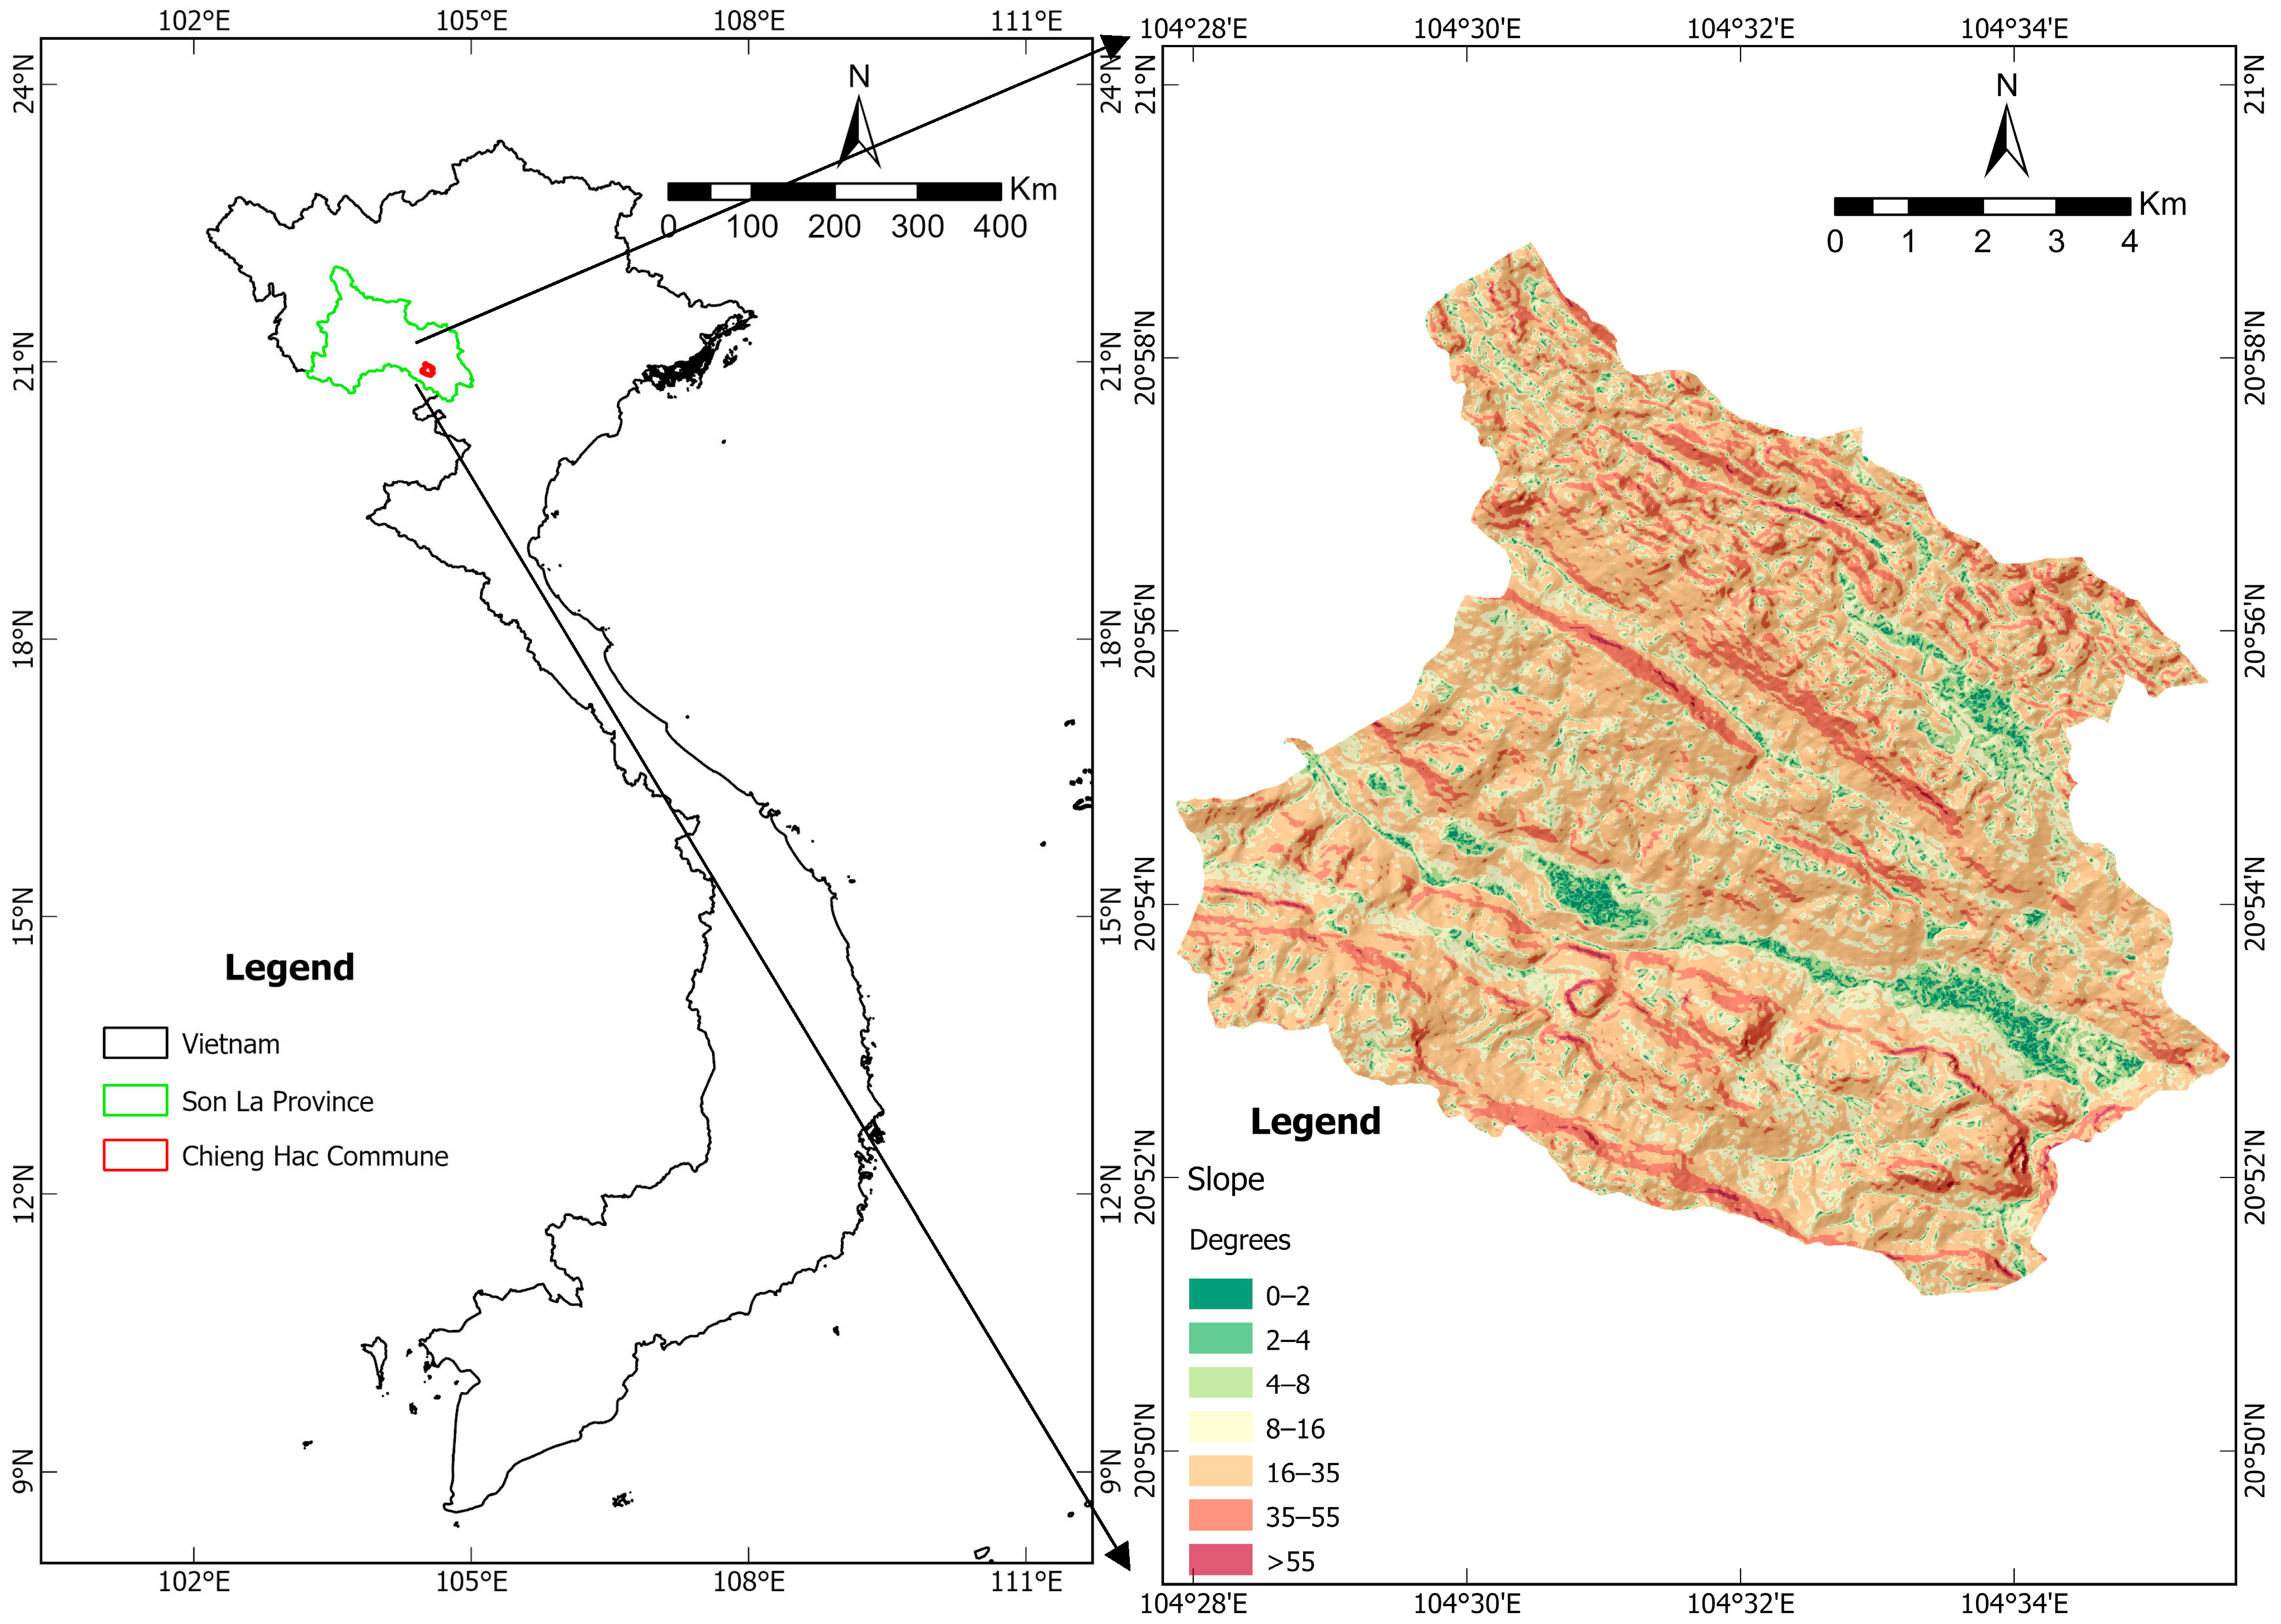
Chieng Hac commune is located in northern Vietnam, near the border with Laos. Chieng Hac commune is a mountainous region with extreme sloping characteristics. The region has a topographical elevation difference of 1093 m, with the lowest elevation being 279 and the highest being 1372 m above mean sea level. According to the Van Zuidam [28] classification, the slope conditions range from gentle (0–2 degrees) to very steep (72 degrees). While the area has a wide range of slope angles, the majority of the slopes fall into the category of steep (15–35 degrees) with medium hilly relief (Figure 1). The topographic characteristics were taken from the GIS analytical tool (slope) in ArcGIS Pro 3.5.0 software (ESRI, Redlands, CA, USA). The slope data was generated from raster data with 12.5 m of spatial resolution, which is considered to be a high raster resolution.
Figure 1.
Chieng Hac commune location map.
Chieng Hac commune is characterised by a tropical monsoon climate with pronounced seasonal variability in precipitation. The climate of northern Vietnam is influenced by air masses originating from the Bay of Bengal and the Western North Pacific (WNP), which interact to produce significant seasonal fluctuations in rainfall [29]. Chieng Hac’s complex topography further modifies precipitation distribution and intensity across elevation gradients. In 2021, rainfall was concentrated between April and September, representing the wet season, while January–March and October–December constituted the dry period. Annual precipitation ranged from 1415 to 1496 mm depending on elevation. On average, monthly precipitation during the dry season was approximately 29.8 mm, whereas the wet season averaged 213.8 mm. Climate change may further amplify rainfall variability in the region, as rising sea surface temperatures (SSTs) influence precipitation intensity and distribution [30]. On steep mountainous landscapes where vegetation cover has been reduced, intense seasonal rainfall and tropical cyclone events can accelerate soil loss and reduce soil water-holding capacity through the removal of fertile topsoil [31,32].
Maize cropping has been the major agricultural activity in Chieng Hac commune from 2018 to 2021, although observations have been made about the decreasing maize production area from 2015 to 2018 in Moc Chau district [6]. Aside from maize, the arable lands in Chieng Hac commune are used to cultivate paddy and tree crops.
2.2. Data Type and Source
Various spatial data from multiple sources are needed to analyse water balance and erosion in Chieng Hac commune. The study used secondary data that was obtained by means of remote sensing and open-source spatial databases. All data were processed with the World Universal Transverse Mercator (UTM) projection. The water balance was analysed for the year 2021. The detailed list of data used in this research is shown in Table 1.
Table 1.
Data used for research.
2.3. Land-Cover Analysis
Land-use classification was performed using PlanetScope imagery for the year 2021. PlanetScope data is suitable for land-use analysis as it has high spatial and temporal resolution. It captured the earth surface phenomenon daily with a raster resolution of 3 m. While it has limited spectral resolution, which only consists of four bands (blue (B), green (G), red (R), and near-infrared (NIR)), it is adequate to produce detailed land-use maps [34]. The PlanetScope images used in this study were the surface reflectance product, which had been atmospherically corrected to Bottom-of-Atmosphere (BOA) reflectance. The images were clipped to the study area, stacked, and processed to remove atmospheric disturbances such as clouds, smoke, fog, and shadows. The different vegetation indices extracted from the PlanetScope bands and used to produce the land-use map are listed in Table 2.
Table 2.
List of used vegetation indices for land-cover analysis.
The indices listed in Table 2, together with spectral band information and texture features derived from the imagery, were used as input variables for the Random Forest feature analysis. Texture information was extracted using the Grey Level Co-occurrence Matrix (GLCM) method, which measures the spatial relationship between neighbouring pixels to capture surface pattern variability in the imagery. Eight GLCM texture features—mean, variance, homogeneity, contrast, dissimilarity, entropy, second moment, and correlation—were extracted for each spectral band using ENVI 5.3 (Harris Geospatial Solutions, Broomfield, CO, USA) with a 3 × 3 kernel window and a 45° direction. These texture layers, together with the spectral bands and vegetation indices listed in Table 2, were used as predictor variables in the Random Forest classification. Random Forest was used to train the satellite data and produce the land-use classification maps. The method works by generating an ensemble of decision trees that individually assess the class assignment for each pixel based on the input variables [43]. In this study, the classifier was trained to identify five major land-cover types: maize, tree crops, paddy fields, forests, and non-agricultural areas. The Random Forest model was implemented using the Python version 3.10 and the scikit-learn library version 1.0.2 (Python Software Foundation, Wilmington, DE, USA) with the number of decision trees (n_estimators) set to 100 to reduce model variance. The training samples were randomly divided into 70% training data and 30% testing data to evaluate the model performance. Random Forest was selected due to its high classification accuracy and robustness in remote sensing applications [43,44,45,46].
2.4. TM Model Water Balance Analysis
The TM model uses the input parameters of precipitation, temperature, soil, and land-use data to determine the surplus, deficit, and storage dynamics of water resources in an area [47]. The computation of water balance in Chieng Hac commune was done based on the steps from Singh, Prasad and Bhatt [12]. Equation (1) was used to compute the monthly potential evapotranspiration (PET), as shown below:
where C is the monthly correction factor that can be obtain from , m is the number of days the corresponding month has, and d is the monthly average of solar insulation duration. The value of d was obtained from the [47] table of solar insulation duration. T is the monthly average temperature (°C) obtained from MODIS satellite imagery, and I is the sum of monthly heat index (i) in a year. i is obtained from . As for a, it is obtained from .
The next step was to calculate the Accumulated Potential Water Loss (APWL), which is the sum of monthly Potential Water Loss (PWL). PWL can be described as the subtraction of PET from precipitation for the corresponding month.
The water storage (STOR) component in water balance analysis was calculated for each month with the following equation:
where the Available Water Capacity (AWC) is the soil water-holding capacity with the current land use. The value was determined from the number suggested by [47] by considering the soil texture and land-use type. The difference in STOR between months is calculated by .
The component is used for both determining the formula to compute Actual Evapotranspiration (AET) and computing AET. If < 0, then the equation for AET is . When > 0, the equation used is .
The next water balance to be computed was the monthly deficit (DEF). In the TM model, DEF is used to express the loss of water through crop evapotranspiration. It was computed by the following equation:
The surplus (SUR) component also considers the soil water storage condition. In a saturated condition, SUR was computed by the following equation:
However, in a non-saturated condition, no surplus of water exists as it will be used to replenish the soil moisture. The equation to compute SUR in such a condition was as follows:
The surface runoff analysis was done based on the SUR result. Thornthwaite and Mather [47] suggest that for a large area, the runoff value is approximately 50% of the surplus in that particular area for each month.
2.5. Soil Erosion Rate Using Revised Universal Soil Loss Equation (RUSLE)
The assessment of land management suitability was done by looking at the potential impact of land-use changes on soil erosion risk. The analysis was done using the Integrated Valuation of Ecosystem Services and Tradeoffs (InVEST) 3.16.1 (Natural Capital Project, Stanford University, Stanford, CA, USA) [48]. The RUSLE is an empirical model developed by Wischmeier and Smith [13] to estimate average annual soil loss resulting from sheet and rill erosion. The RUSLE model was applied in a GIS environment. To estimate the erosion rate, the RUSLE used the following equation:
where A is the computed soil erosion (t/ha/year), R is the erosivity factor (MJ.mm/(ha.hr.yr)), K is the erodibility factor (ton.ha.hr/(MJ.ha.mm)), LS is the topographic factor (representing slope length steepness), C is the land-use factor, and P is the support-practice factor.
The R factor was computed from the annual rainfall depth data and the constant value of a, which has a different value depending on the location of the study. For Chieng Hac, which is located in northern Vietnam, we used an a of 0.25 [49]. The K factor was assigned using the global soil erodibility from [33], which also considers the effects of saturated hydraulic conductivity. The LS factor was computed using slope and flow accumulation derived from the DEM build from ALOS Palsar satellite imagery. The value was computed by employing the formula of Desmet and Govers [50]. The equation for LS is as below:
where Si is the value of the slope factor in raster grid I. The value of Si is calculated by considering the slope steepness in percentage (s) and degrees (θ), as expressed in the following equation:
while Ai-in is a value that was calculated by estimating the specific catchment area with the formula of . The value D is the linear dimension of the pixel in metres and xi is the length of pixel I aspect, which is calculated by using with α equal to the slope angle in radians. Lastly, m is the exponent factor of RUSLE length, which is calculated using the equation below:
And β is calculated by .
The C and P factors were determined based on land use and land conservation management practices. For the baseline scenario, the C and P values were assigned according to the dominant crop type and typical slope management for each land-use category. In the adjusted scenario, revised values were assigned to reflect the introduction of conservation practices. Specifically, strip cropping with grass in maize fields on 10–20° slopes significantly reduced the P factor due to biological land conservation. Similarly, converting maize fields on slopes > 20° to tree crops reduced the C factors, as trees provide continuous canopy cover and have minimal tillage disturbance.
RUSLE analysis was implemented in raster format. Data preparation was done by using ArcGIS Pro 3.5.0. Soil erosion rate analysis was done by using InVEST 3.16.1. Soil loss maps were produced for both the baseline and modified land-use scenarios. The difference between the two maps was analysed to quantify the potential reduction in erosion rates due to the implemented interventions. This analysis provided spatial insight into erosion-prone areas and the effectiveness of the conservation strategies under consideration.
2.6. Water Balance and Soil Erosion Analysis on Modified Land Use
A predictive, GIS-based workflow was used to evaluate joint impacts of land-use change on water balance and soil erosion in Chieng Hac. All rasters were resampled to a 12.5 m cell size to match the DEM data, while both precipitation and soil erodibility grids were interpolated to the same 12.5 m resolution. Two scenarios were analysed on a common grid. Scenario 1 is the baseline, reflecting existing land use and management. Scenario 2 applies slope-triggered interventions: maize on slopes greater than 20 degrees is converted to tree crops, and maize on slopes between 10 and 20 degrees adopts strip cropping with grass. Slope classes were derived from the DEM and used to reclassify the land-use map that feeds both the TM water balance model and the RUSLE soil loss model.
For the water balance component, the Thornthwaite and Mather model was implemented in a GIS environment to estimate monthly precipitation inputs, evapotranspiration, soil moisture storage, surplus, and deficit. Climate forcing (precipitation and temperature) was held constant at observed 2021 values to isolate the effects of land use and management change. Land-use-dependent soil storage parameters were updated through the AWC value (Table 3). The “other” land-cover class was assigned the value of shallow-rooted crops as it behaves similarly in terms of its water retention. In the strip-cropping zone (10–20 degrees), AWC was set to the average of grass (shallow-rooted crops) and maize values to represent alternating vegetative strips. In the >20-degree zone converted to tree crops, AWC was updated to the tree crop value. Outputs were spatially interpolated and mapped to assess changes in seasonal water availability under Scenario 2 relative to the baseline.
Table 3.
Values of Available Water Capacity based on soil texture and land-cover classification [47].
For the erosion component, under Scenario 2, maize fields on 10–20° slopes were assigned P = 0.72 as a conservative contouring-based support-practice value, adapted from the farmland contouring subfactor [51], reduced from P = 1 in the baseline. Because this value was not locally calibrated for Chieng Hac, it should be interpreted as a scenario parameter for comparable sloping agricultural conditions rather than a site-specific estimate. Areas converted from maize to tree crops (>20 degrees) were reclassified to the tree crop C factor; P was kept at 1.0 unless a specific structural practice was present (Table 4). All other factors followed the baseline assignments. Scenario outputs were compared using area-weighted mean soil loss (t/ha/yr) and spatial hotspot maps to identify where reduction in soil erosion rate was happening.
Table 4.
C-values for each land-cover classification [52].
3. Results
3.1. Land-Use Modelling
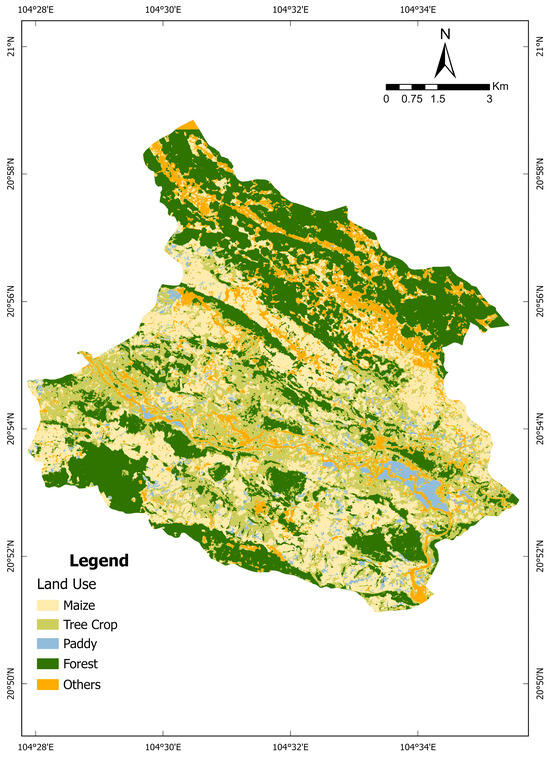
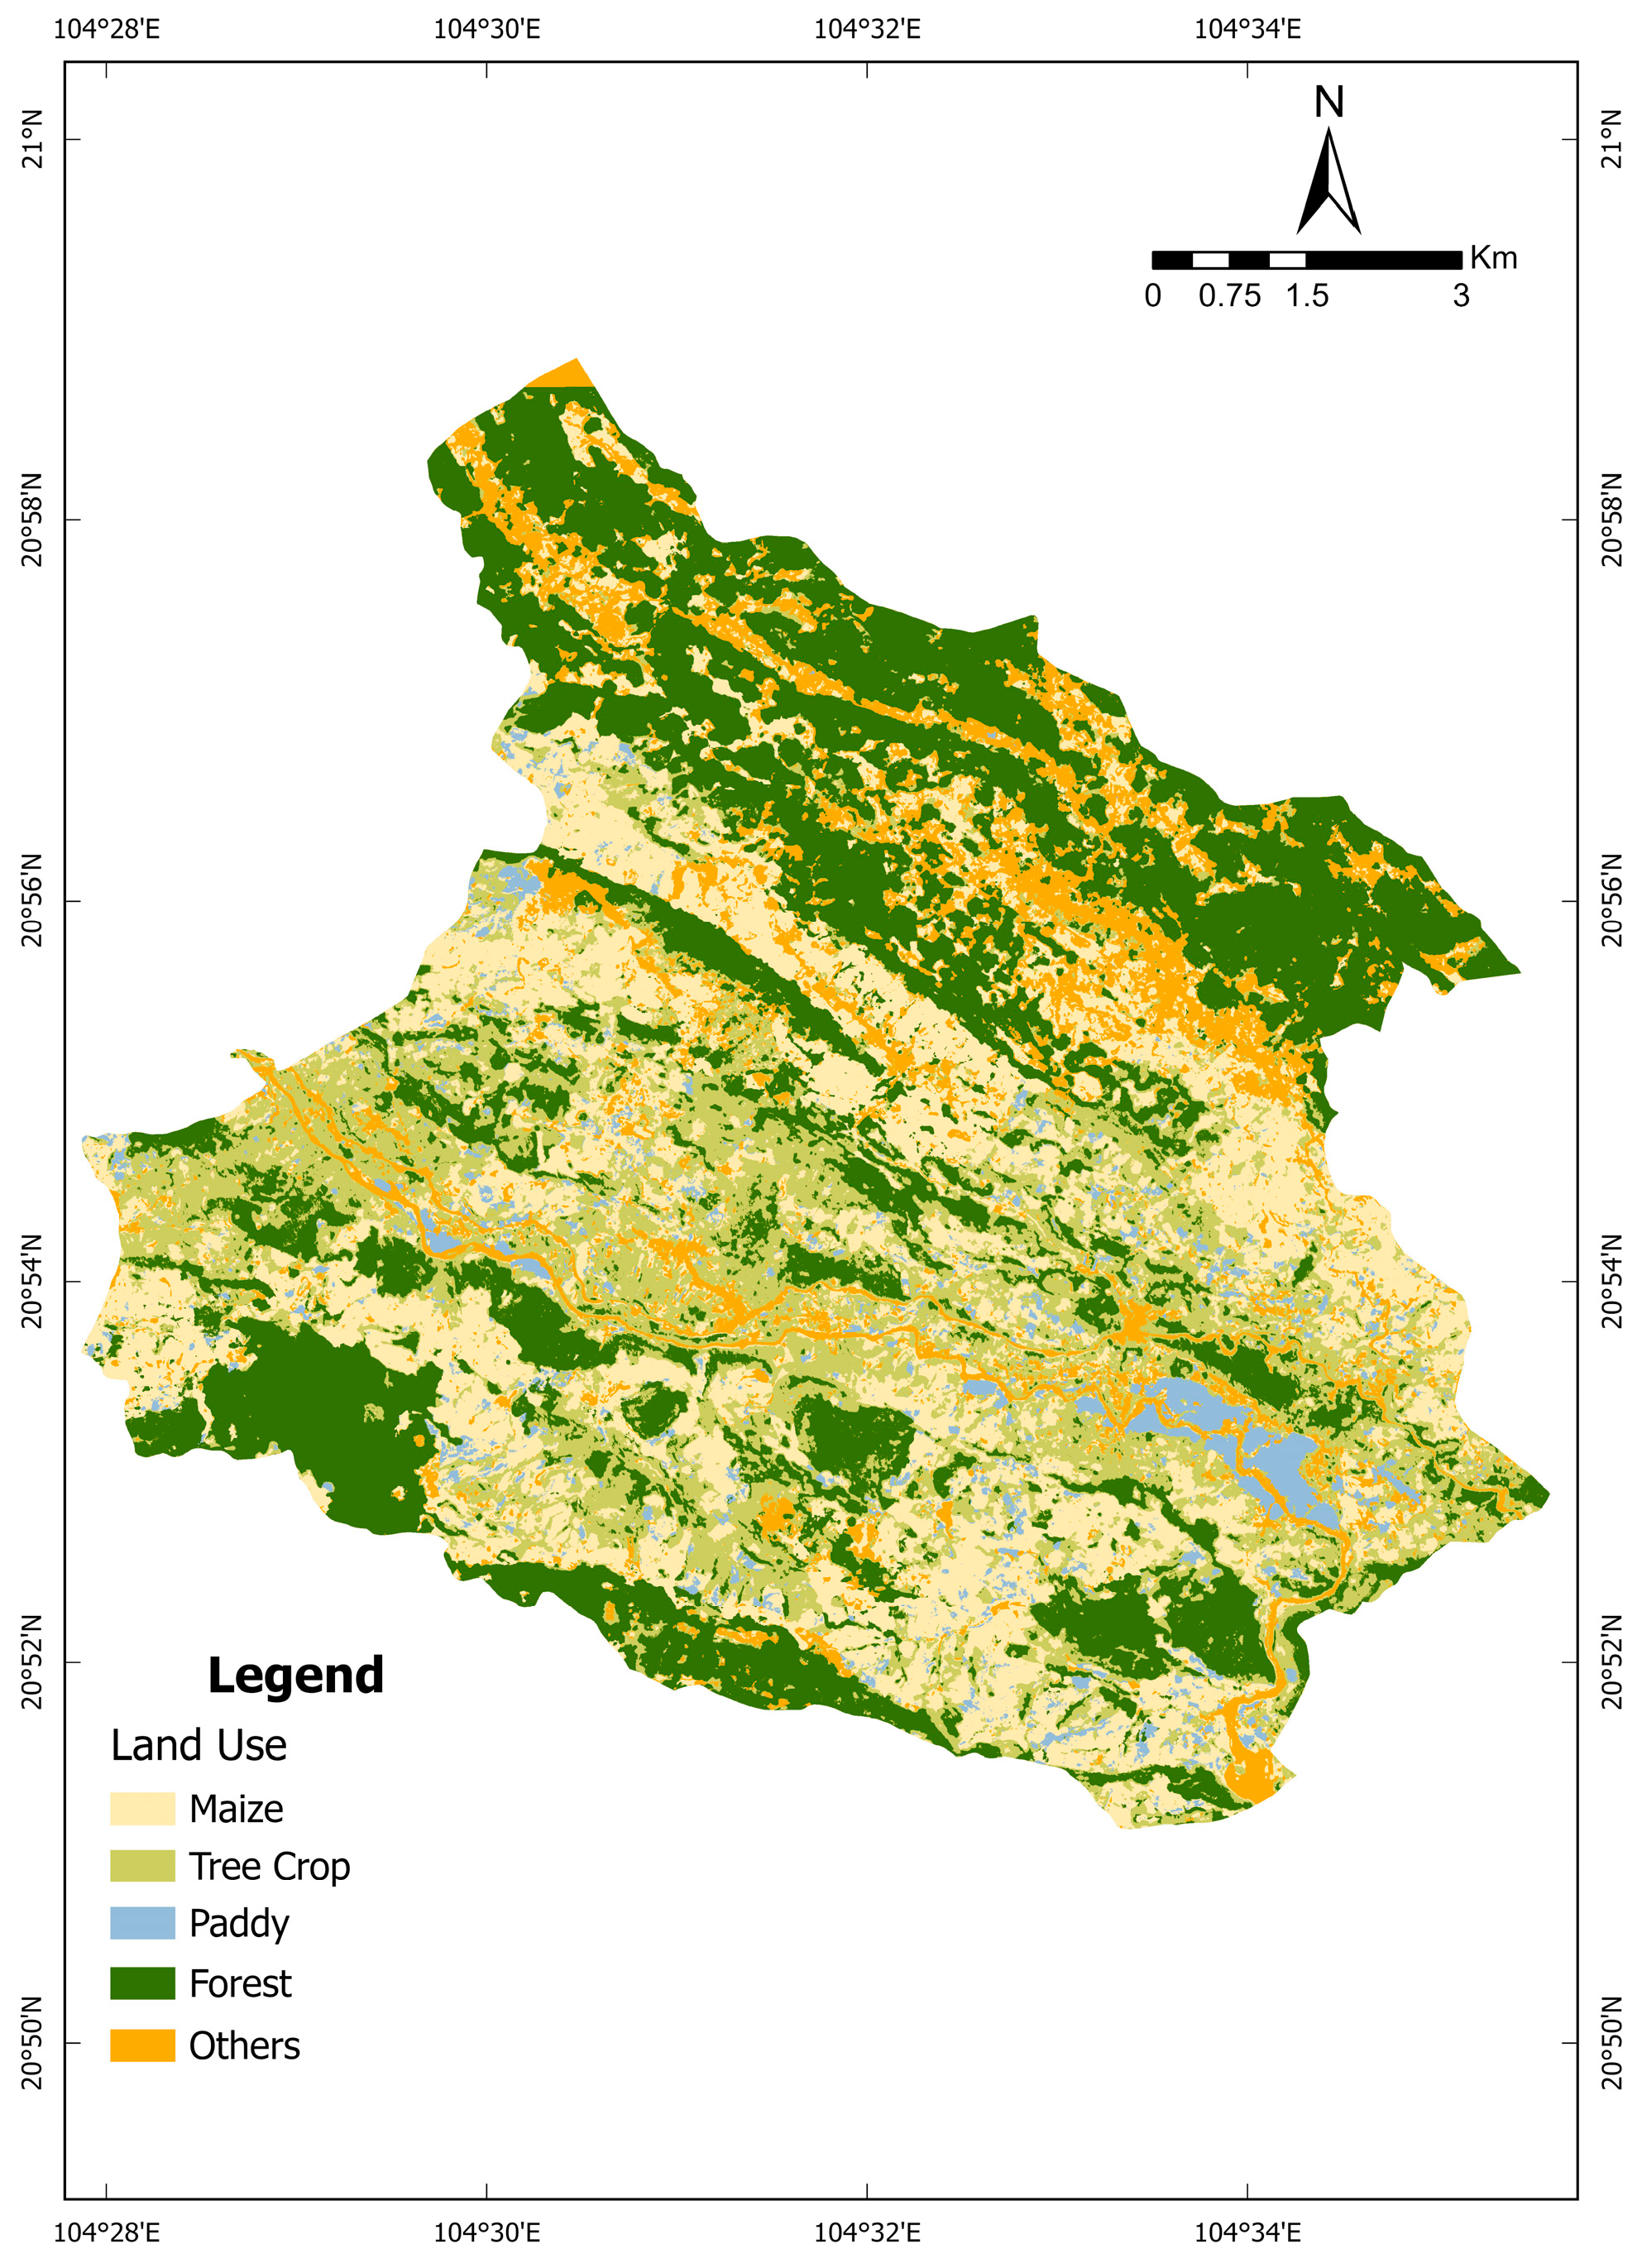
The Random Forest method was applied by classifying land use into five brackets, maize, tree crop, paddy, forest, and others, as the study focused on agricultural area. The “others” bracket consists of, but is not limited to, settlement area, river, and open area, with a total area of 12.37 km2. Forest has the largest area with 35.32 km2 and is mainly located in the northern and southern part of Chieng Hac (Figure 2). Maize occupies 28.22 km2 and is located throughout Chieng Hac with the exception of the northern and southern areas, which are dominated by forests. In contrast to maize and forest areas, tree crops and paddies only appear sparsely inside the study area. The tree crop area totals 24.58 km2 and appears as small patches inside the maize area, while paddy fields cover 3.77 km2 and can be found nucleated around the flat area in the southeast part of Chieng Hac. The classification accuracy was evaluated using a confusion matrix, resulting in an overall accuracy of 0.9048 and a Kappa coefficient of 0.8679, indicating a reliable classification for subsequent spatial analyses.
Figure 2.
Land use of Chieng Hac commune area.
3.2. Temporal Water Balance in Chieng Hac
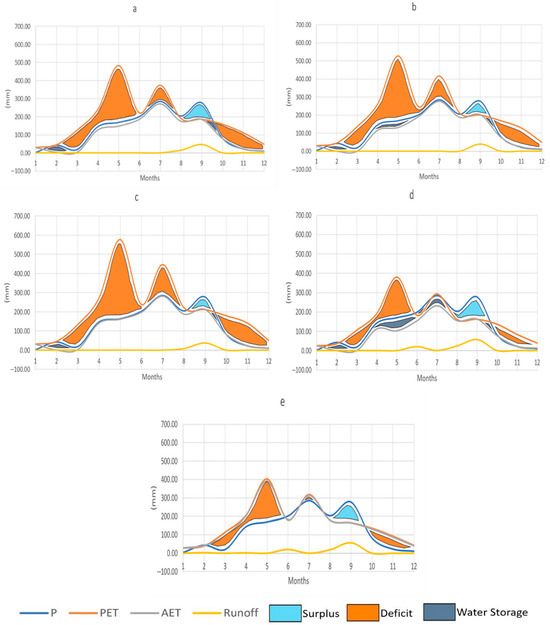
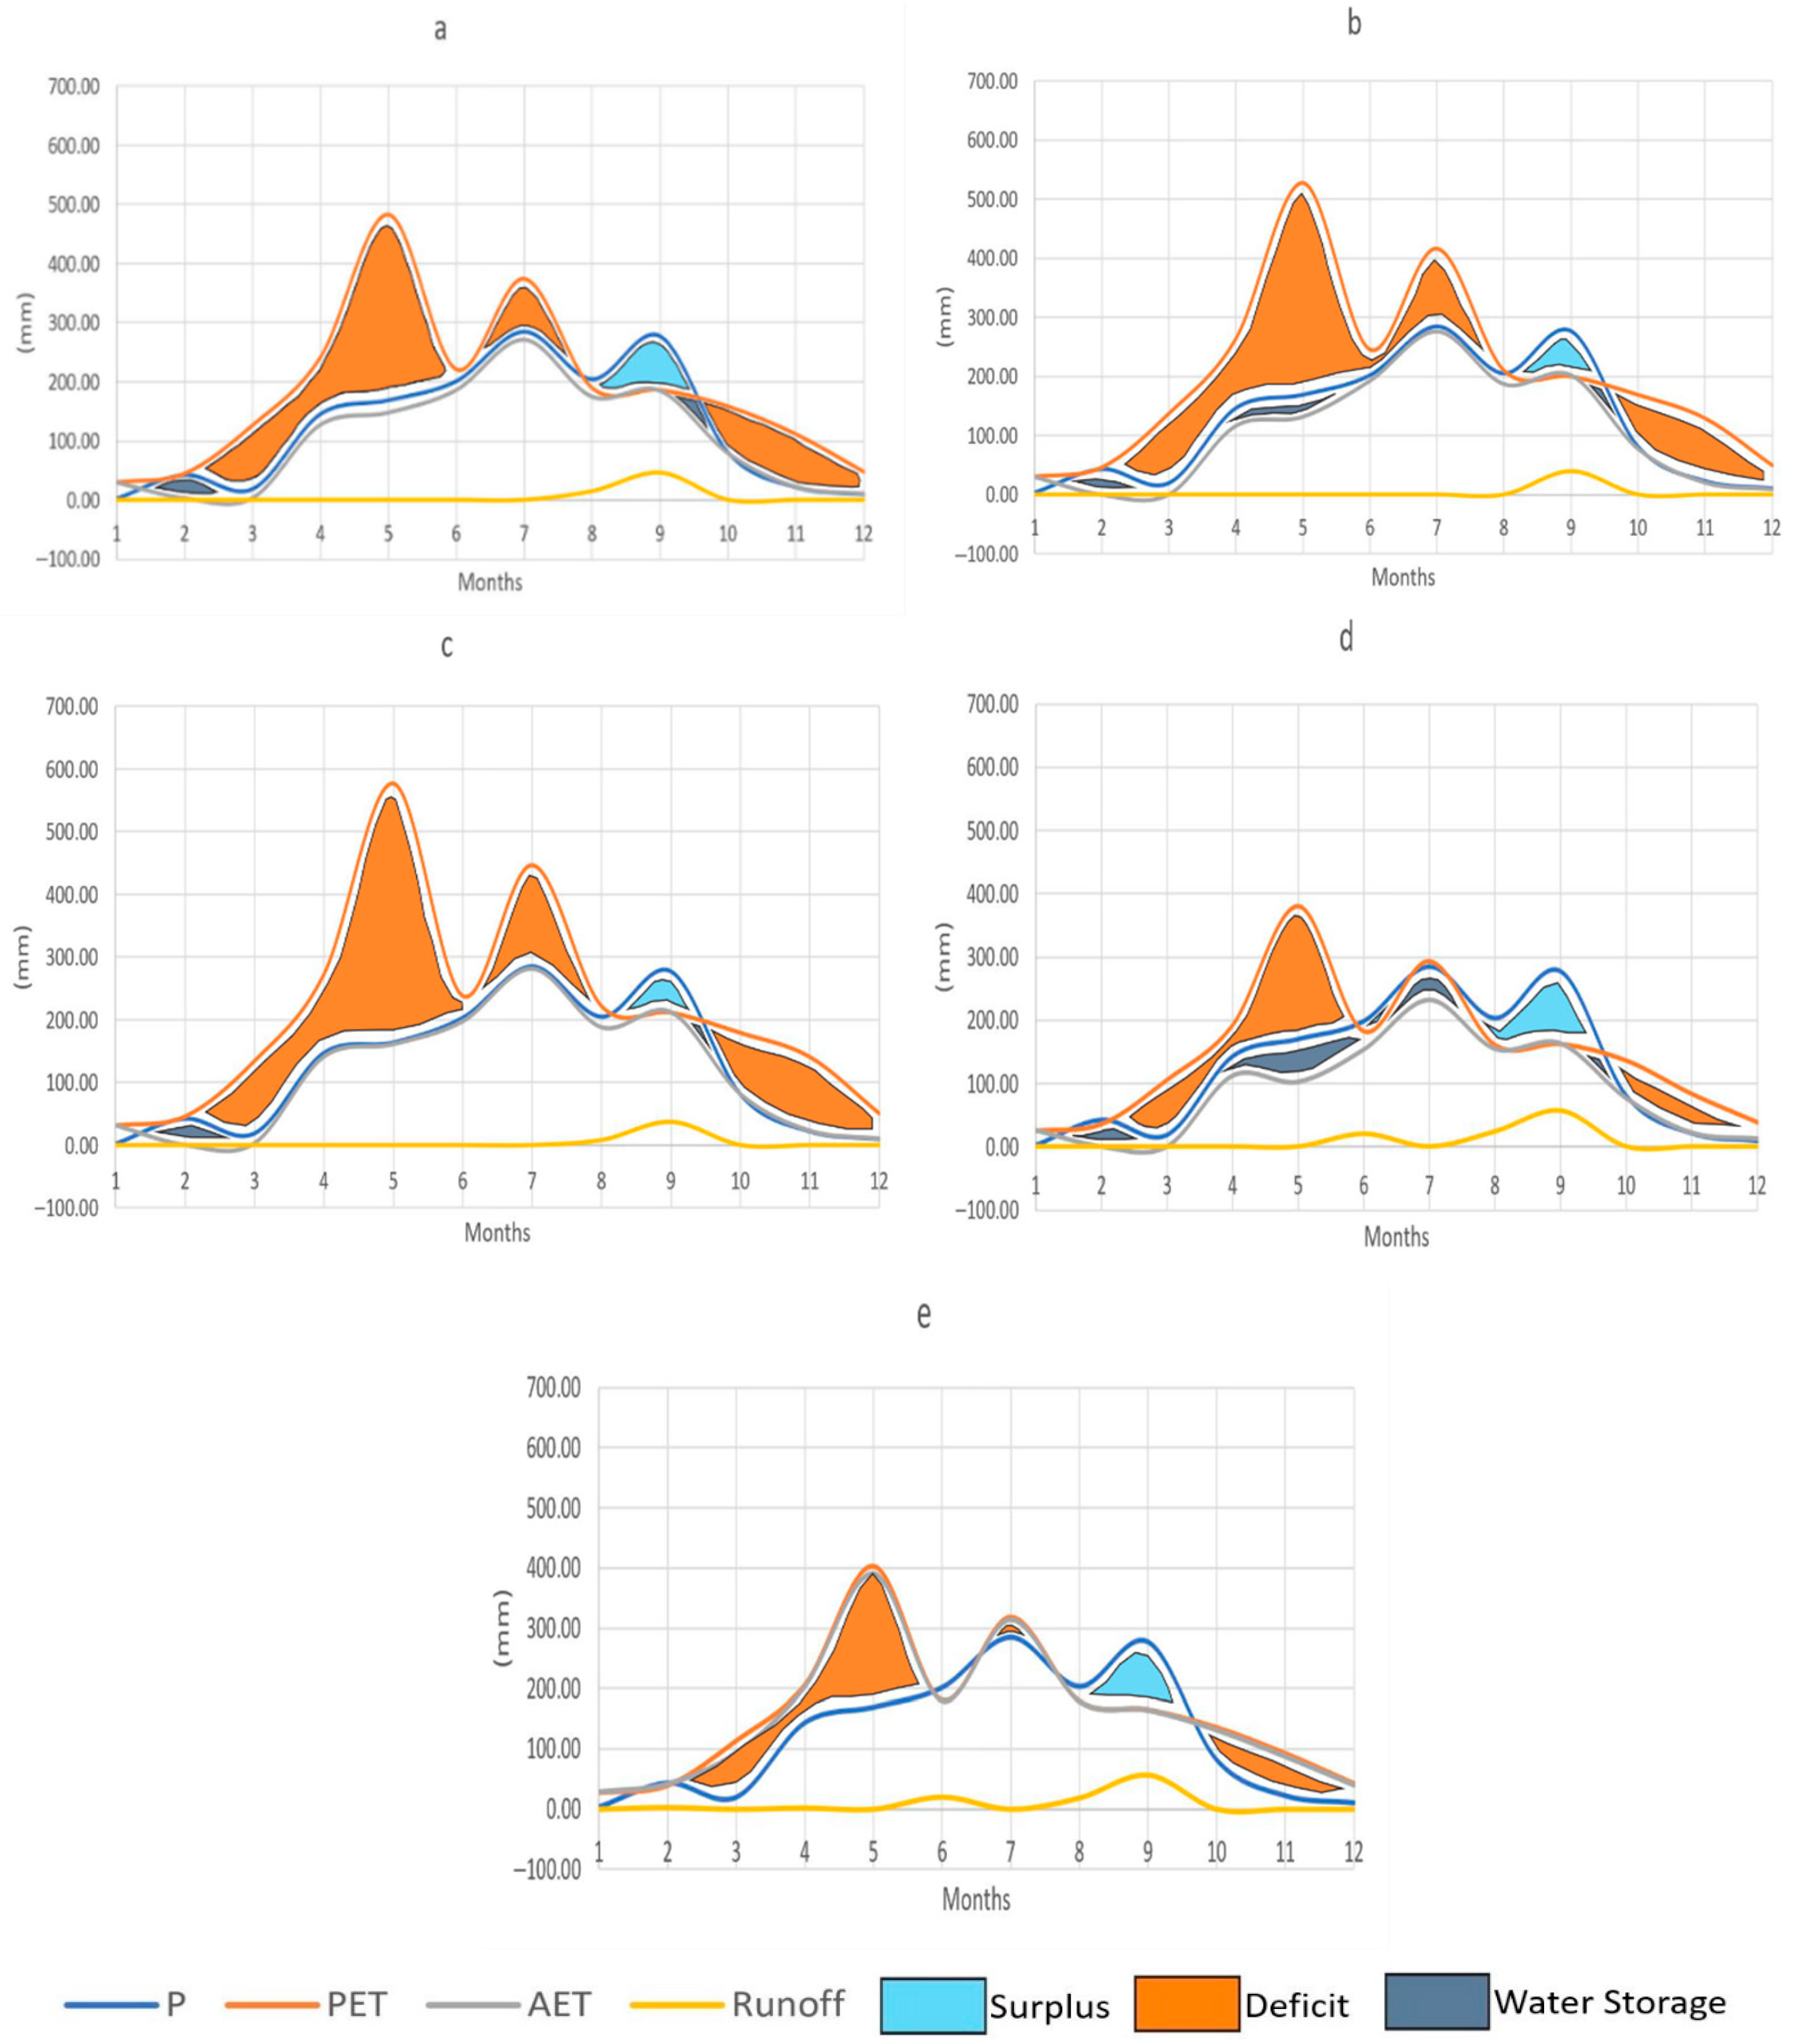
The water balance results in Chieng Hac commune exhibited considerable variability between months while maintaining a similar pattern across land-use types, particularly in agricultural areas (Figure 3). In 2021, precipitation (P), the primary water input, was characterised by a strongly monsoonal distribution, reaching a maximum during July–September (peak monthly value of 290 mm) and declining to a minimum in January (3 mm). However, PET was consistently found to peak in May, although its magnitude varied between areas with different crops. Paddy fields exhibited the highest PET (576 mm), followed by tree crops (528 mm), maize (482 mm), and forest areas (380 mm). Although PET was observed to peak in May, its value never went below P until the month of August. This pattern was consistent with the regional climatic regime, in which the wet season coincides with high solar radiation in northern Vietnam.
Figure 3.
Water balance component graph (mm) for (a) maize, (b) tree crop, (c) paddy, (d) forest, and (e) other land uses in Chieng Hac commune.
On the other hand, AET closely followed the P value throughout the year, except in September. High PET, driven by elevated solar radiation, caused the P value to become the limiting factor for AET. In addition, the overall AET value for each land-use type in Chieng Hac never surpassed the P value. The interaction among P, PET, and AET values resulted in an overall minimum runoff generation across the study area. There was almost no runoff throughout the year, except in September. Forest area contributed as the highest runoff generation area with higher P than PET in June, August, and September, thus becoming the only land-use type that generates runoff for more than a month. Forest area also had the highest overall runoff in September (57 mm), followed by maize (46 mm), tree crops (39 mm), and paddy fields (38 mm).
Water balance outcomes of Chieng Hac commune region can be interpreted from Figure 3. Water surplus is represented by the area between P and PET (blue); conversely, deficit is the condition where PET is higher than P (orange). Further, soil water storage is represented by the area between P and AET where P is higher (grey). The overall trend in the Chieng Hac commune region was a surplus in September and a deficit in the rest of the year. Forest areas exhibited the largest surplus throughout the year and the greatest soil water storage capacity. The largest water deficit occurred in May, when the area between PET and P was greatest, with an occasional increase in July. The greatest deficit in Chieng Hac was observed in paddy fields, whereas the lowest was observed in forest areas. Maize exhibited a smaller deficit than tree crop areas; this may have been associated with higher land surface temperatures in tree crop areas compared to maize fields. Although maize showed a smaller deficit and larger surplus than tree crop areas, maize had a narrower difference between P and AET than tree crops, indicating that tree crop cultivation can provide higher water retainment capacity in the soil than maize.
3.3. Spatial Water Balance in Chieng Hac
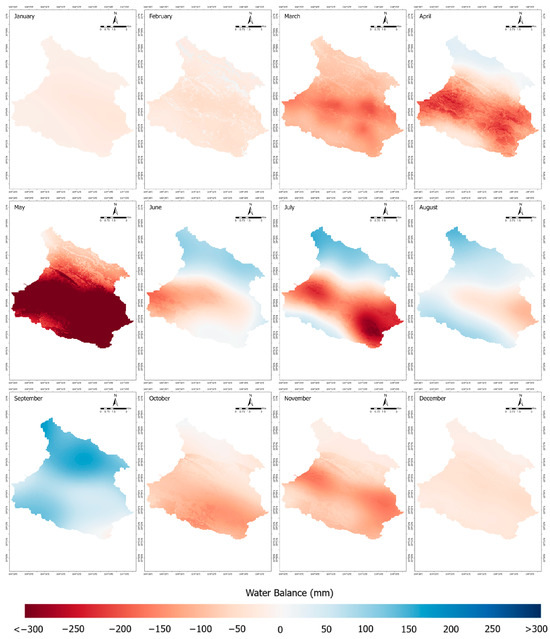
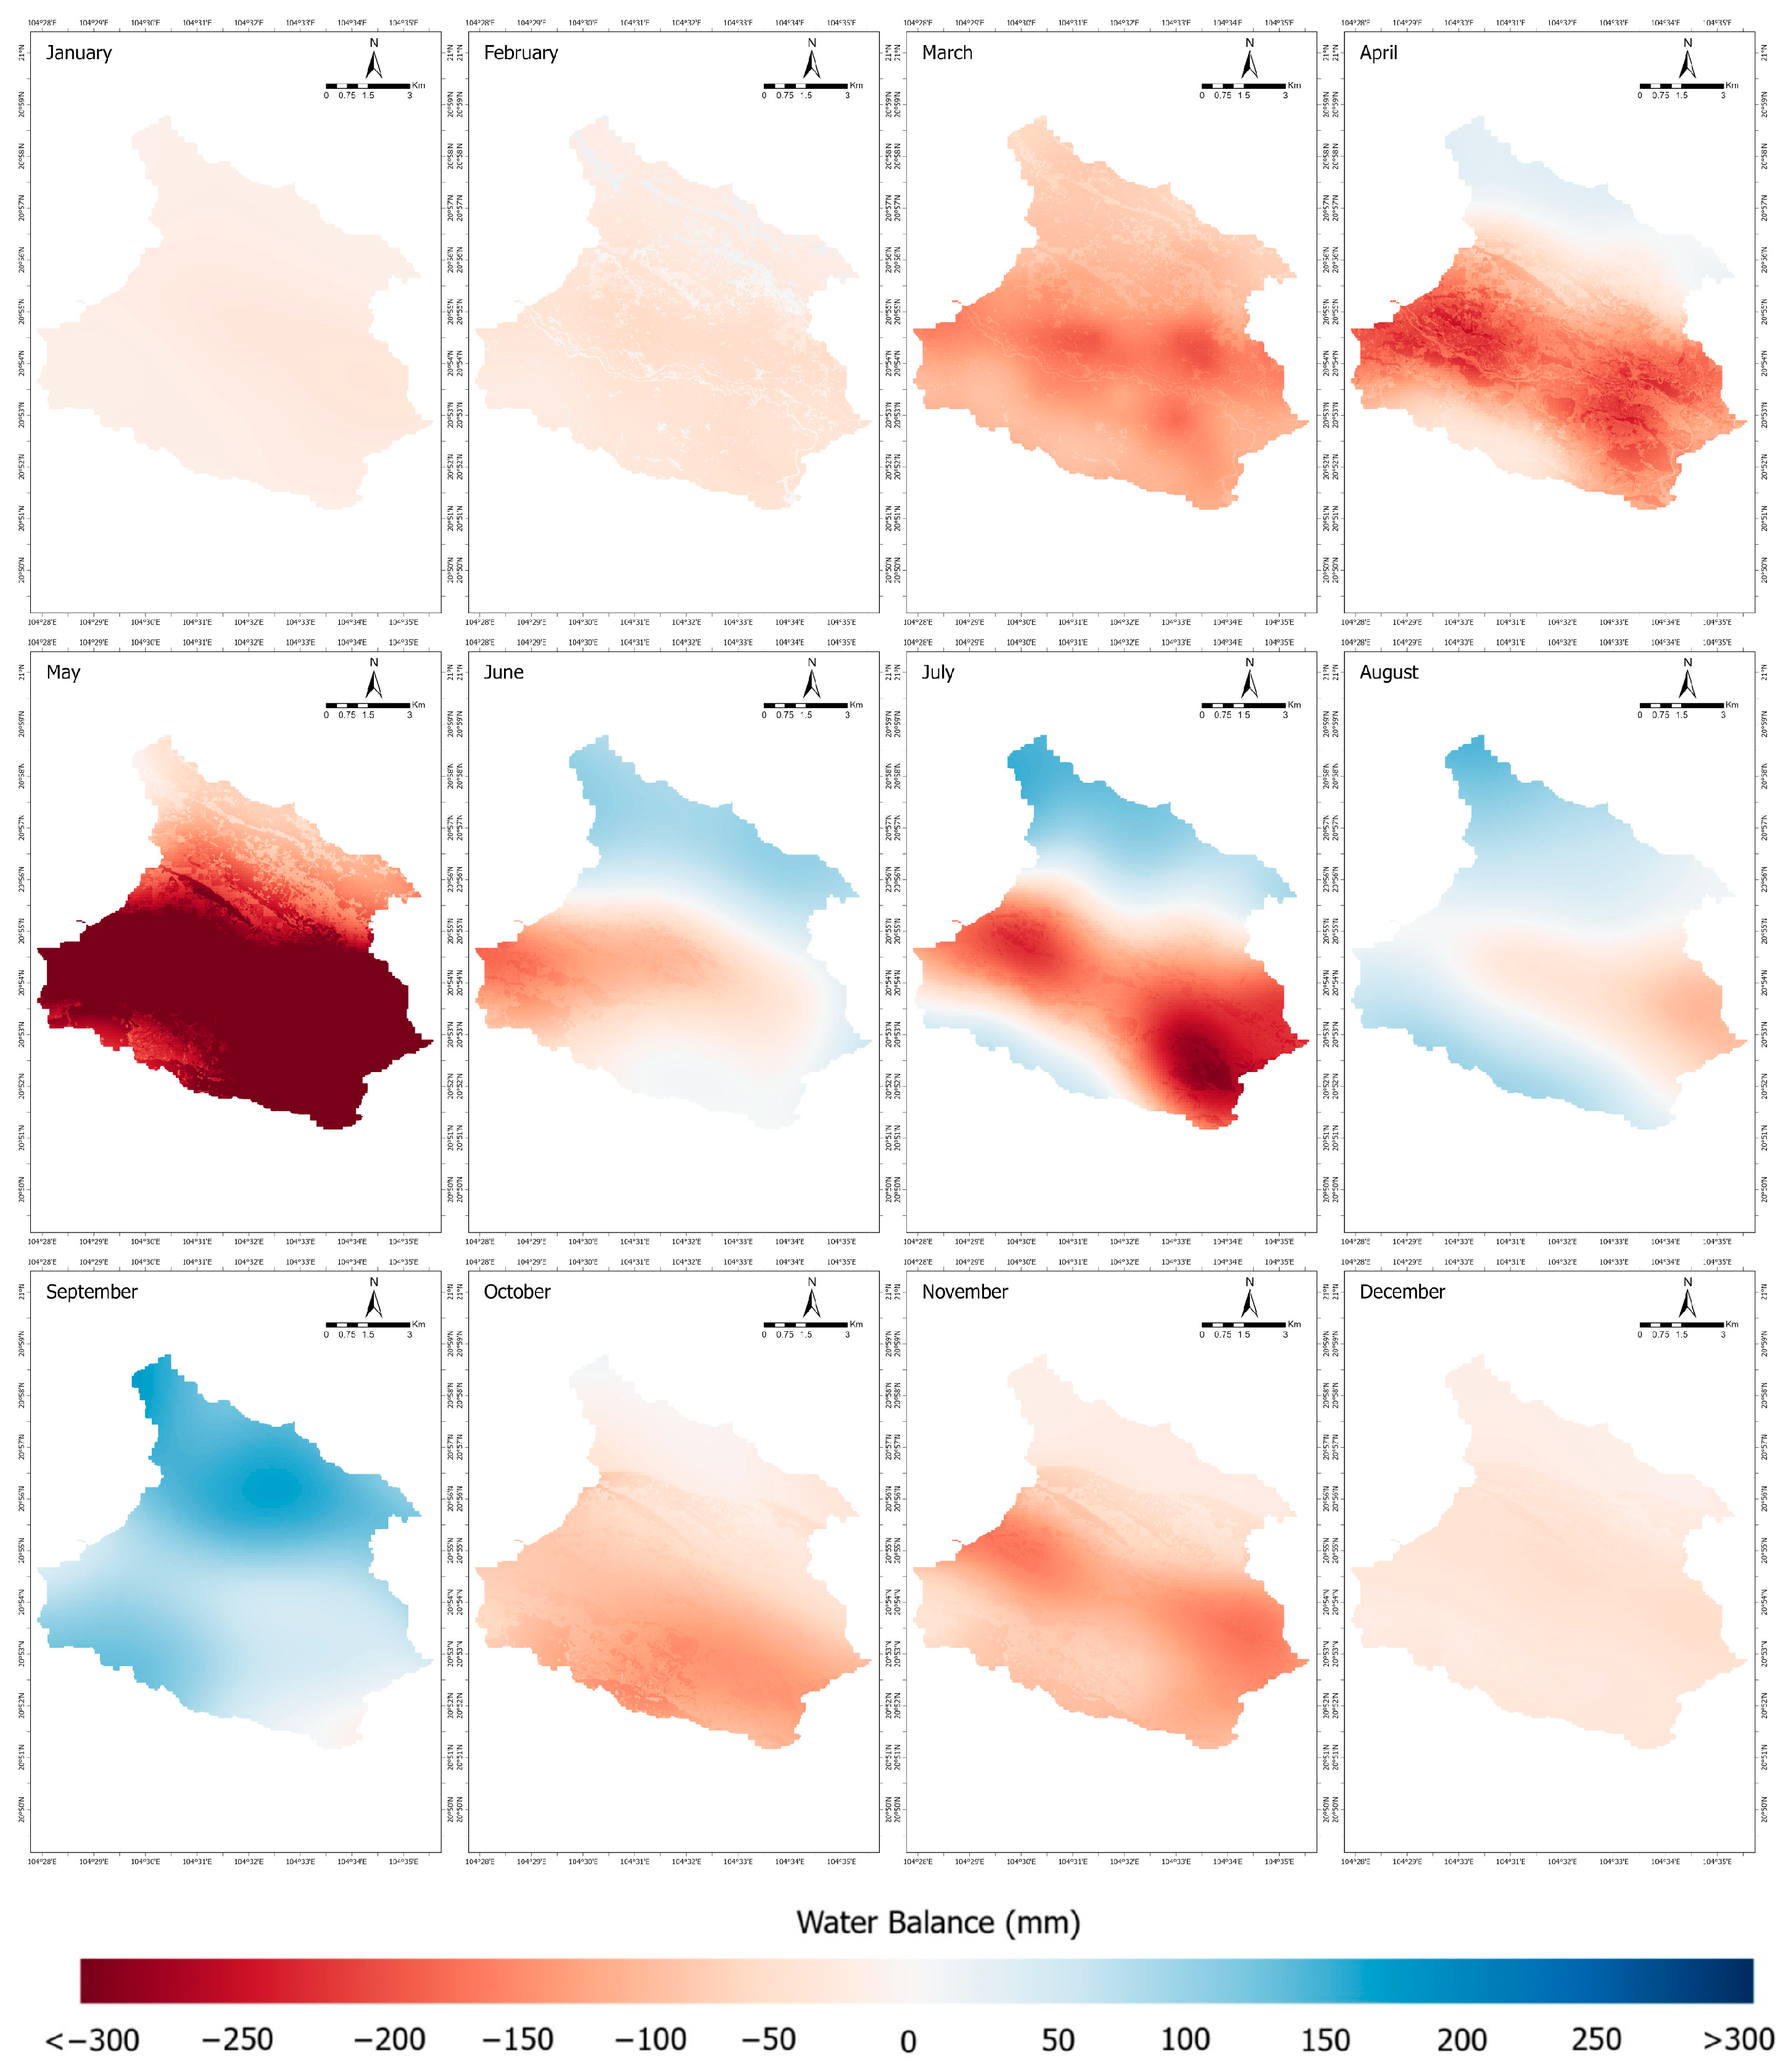
In wet months, when precipitation was high, the northern and southern areas of Chieng Hac experienced a substantial water surplus. The middle area, which is topographically lower, rarely experienced water surplus in 2021. The distribution was closely related to the physiographic conditions of the area (Figure 4). The mountain ranges of the Moc Chau Plateau, located on the northern and southern sides of Chieng Hac commune, promoted orographic precipitation, thus increasing water input.
Figure 4.
Maps of monthly water balance resource in Chieng Hac commune in 2021.
In contrast, the lower central area received less water, as water vapour was transported upslope by prevailing winds. The water surplus in the northern and southern areas ranged from 100 to 200 mm, whereas the central area experienced a water deficit ranging from 15 mm to more than 750 mm.
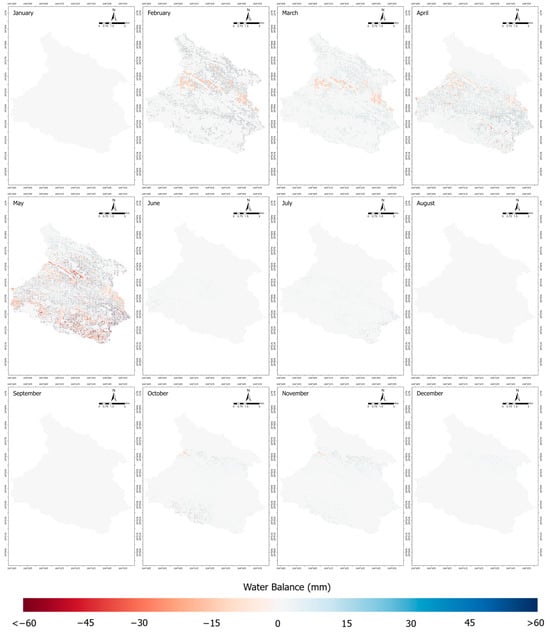
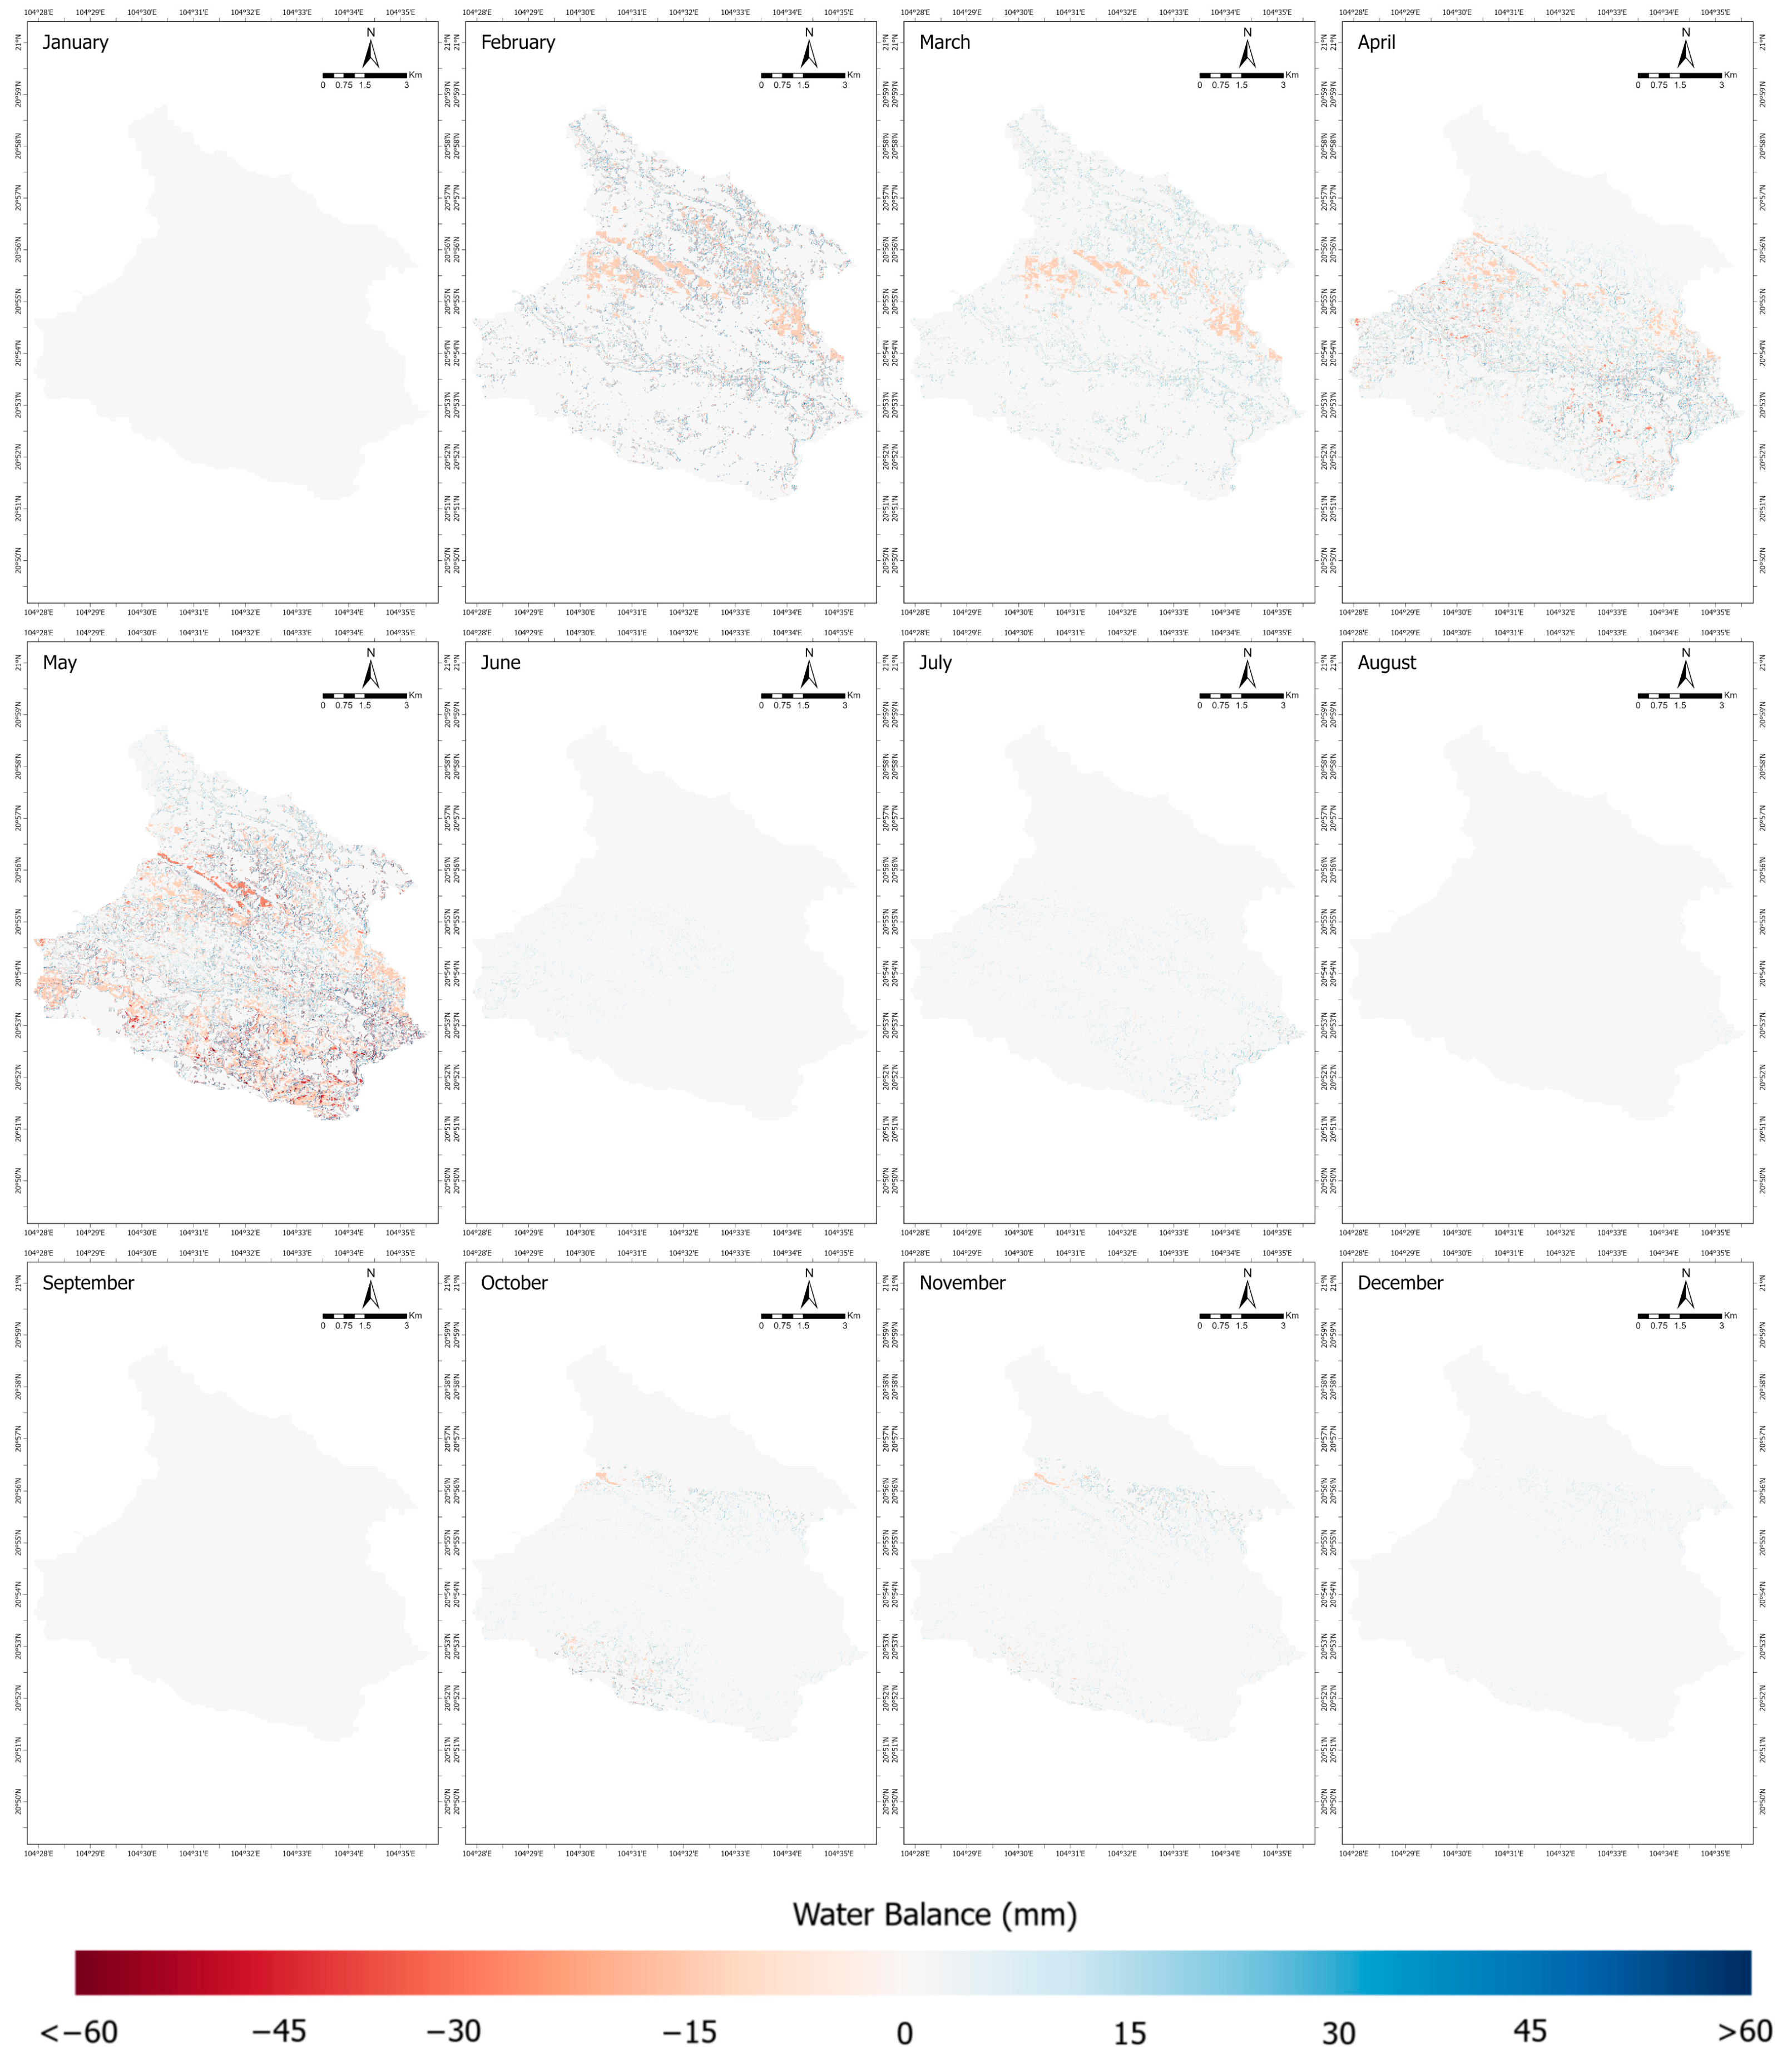
The conversion of maize to tree crops and the introduction of grass strip cropping increased the climatic water deficit (PET − AET) in Chieng Hac (Figure 5). In the TM model, this outcome was driven by lower simulated AET under the adjusted scenario. Because AET is determined by precipitation and the month-to-month change in soil water storage () when , the higher Available Water Capacity assigned to tree crops altered the storage–APWL relationship relative to maize. This parameterization reduced the modelled dry-season release of soil water (i.e., smaller ), constraining AET relative to PET and thereby widening the PET–AET gap.
Figure 5.
Maps of the difference in monthly water balance resource in Chieng Hac commune according to the adjusted land-use scenario in 2021. Light-shaded areas indicate little to no difference (~0 mm) in water balance compared to the baseline land-use scenario. January and June to December show that the water balance difference between the two scenarios in Chieng Hac is close to 0 mm.
3.4. Regional Erosion Rate in Chieng Hac
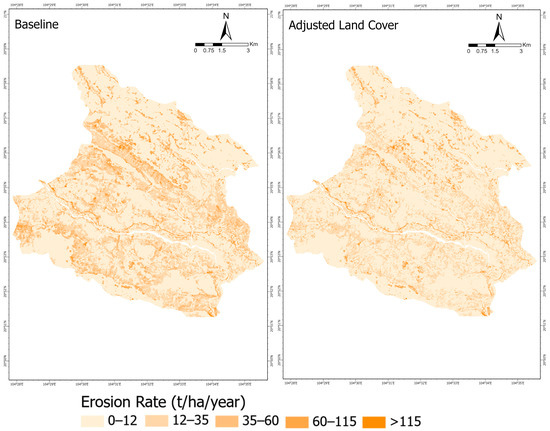
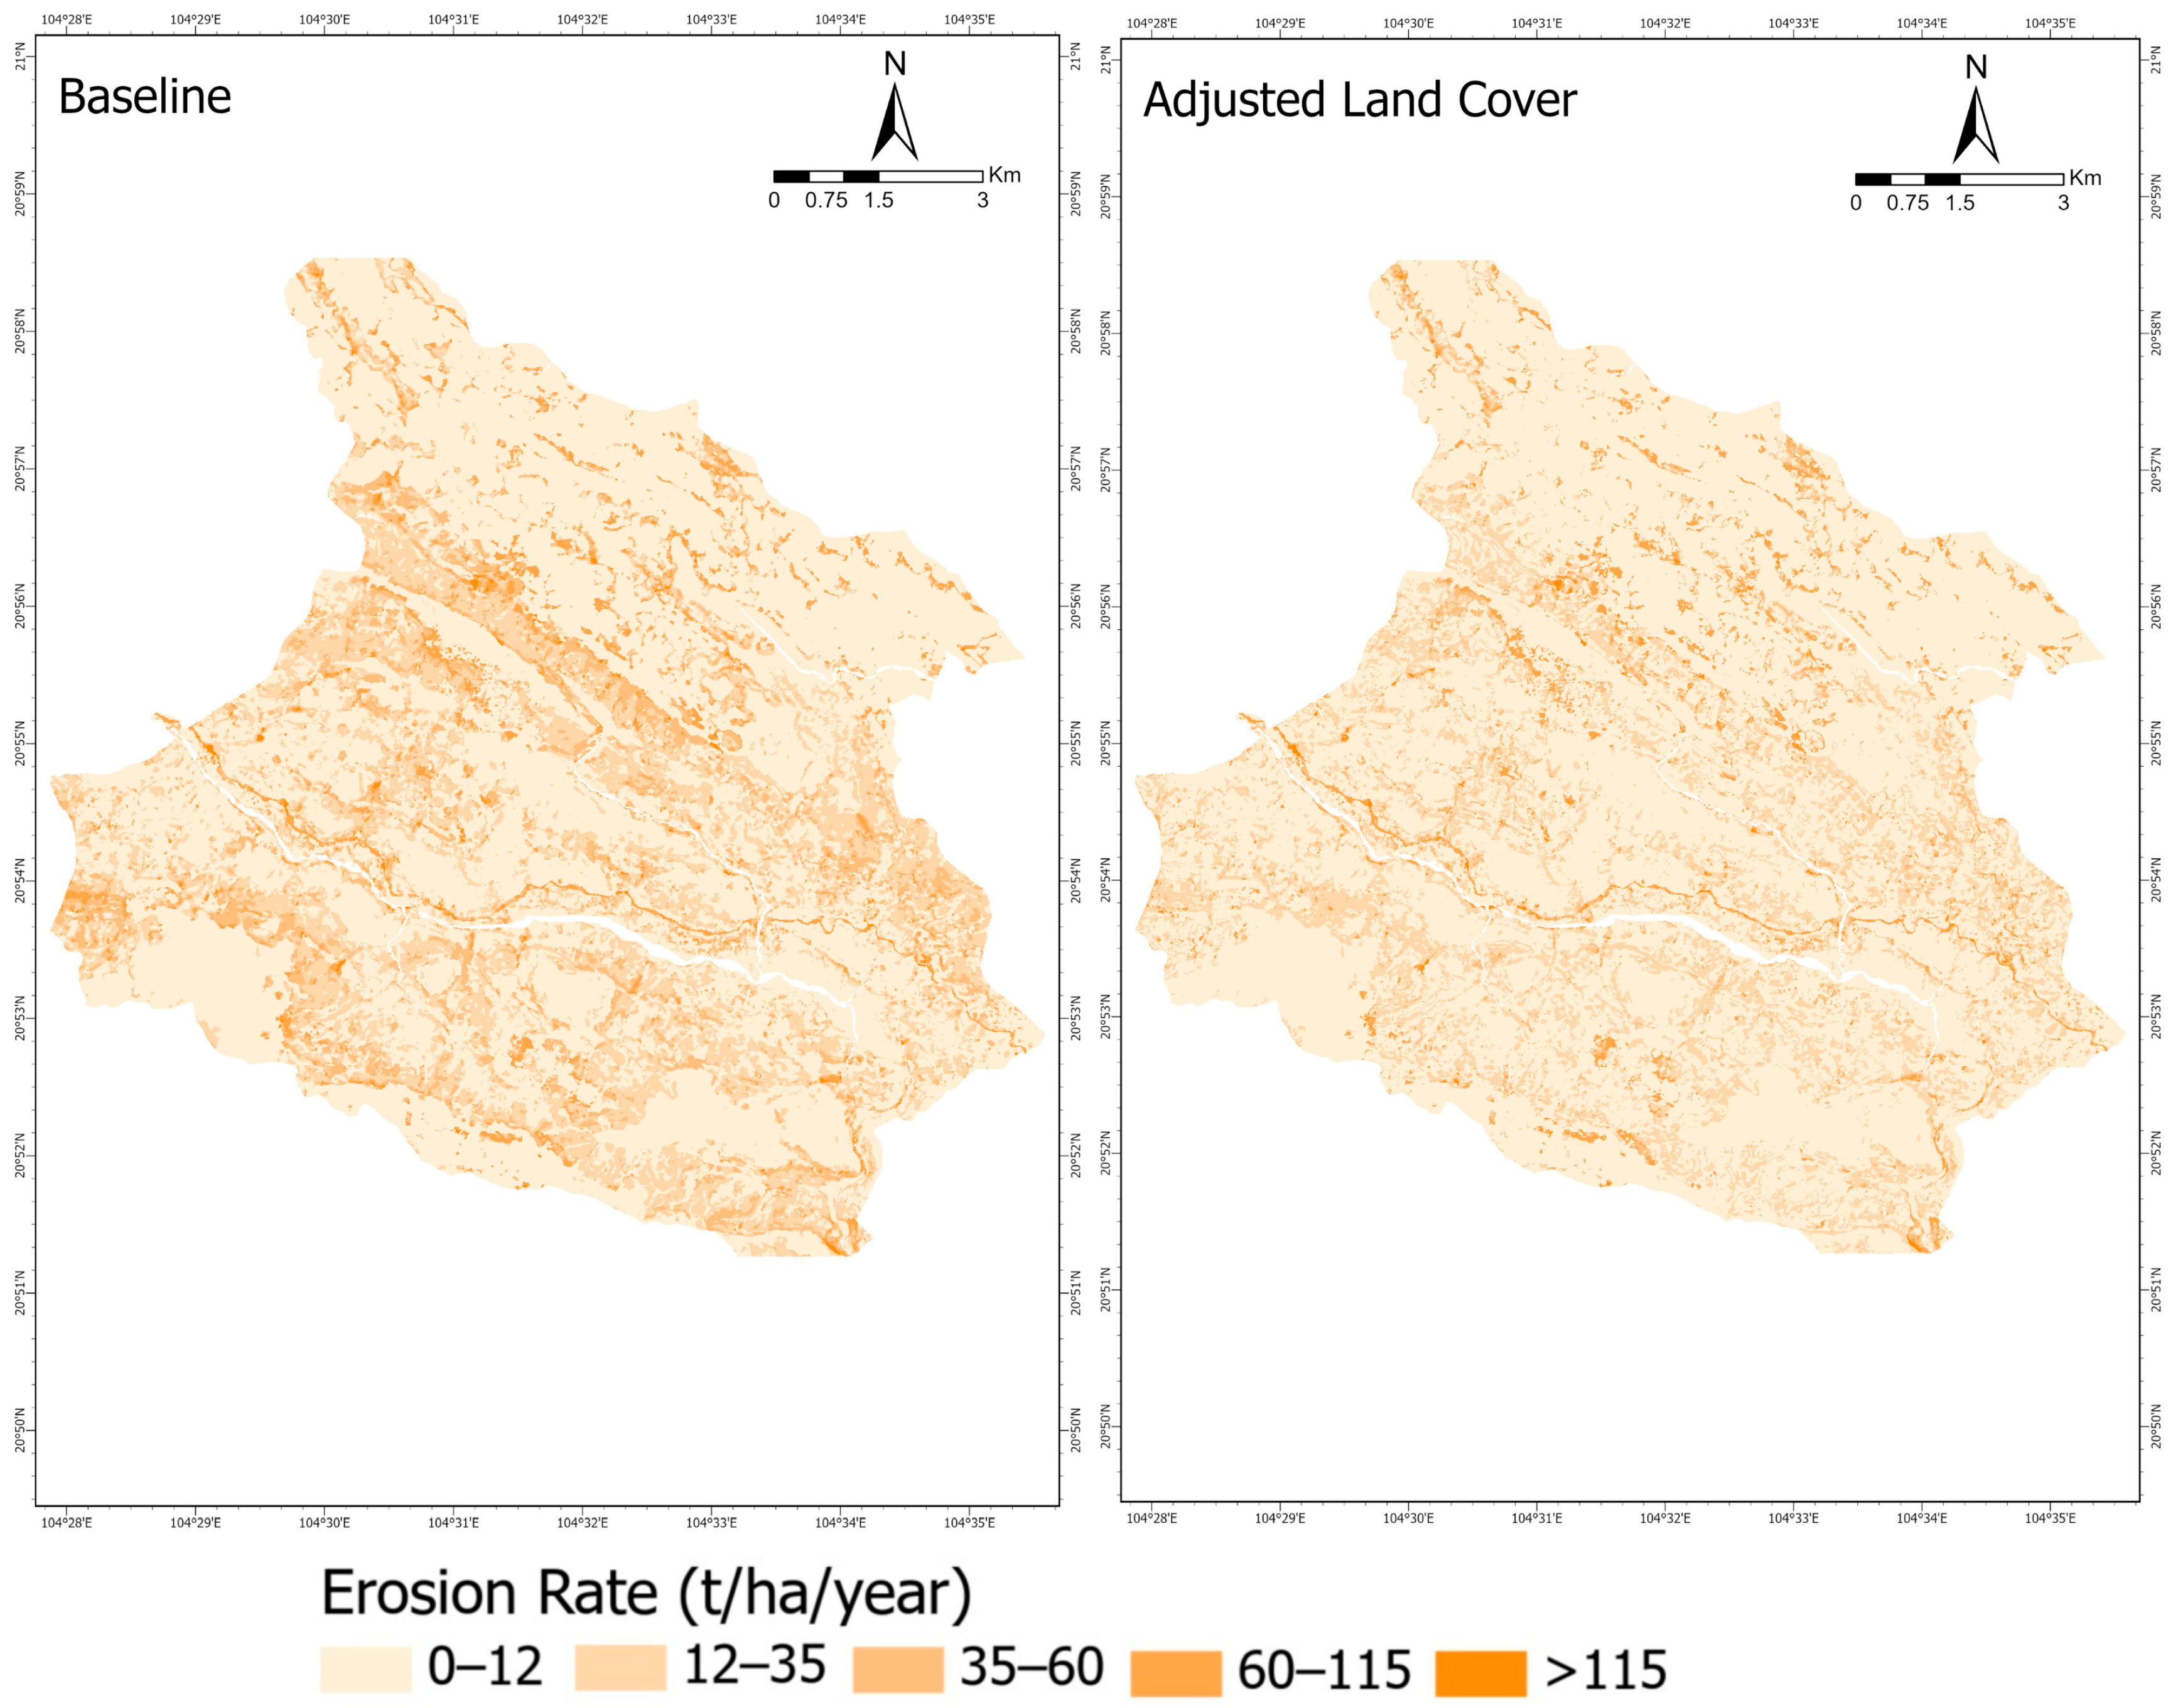
In the baseline map (Figure 6 left), higher soil loss classes are concentrated on middle and upper arrangements of slopes, with additional hotspots adjacent to headwater channels. Valley bottoms and broad lower slopes are dominated by low classes. The distribution is closely related to the physiographic condition of the commune, where steeper gradients and longer flow paths increase the LS factor on hillslopes and maize-dominated cover accelerates the erosion rate.
Figure 6.
Erosion rate from RUSLE model for Chieng Hac under (left) baseline and (right) adjusted land-cover scenarios.
In the adjusted land-cover map (Figure 6 right), two changes shape the pattern. The land cover and conservation interventions visibly reduce the 35 to 60 t/ha/year erosion class on steep converted slopes. Reductions are most apparent along the central ridge and neighbouring middle slopes where maize is extensive. However, residual hotspots persist on very steep, convergent slopes and along drainage corridors where the LS factor remains high. Overall, the adjusted scenario indicates a reduction in erosion risk where conservation practices and land-cover changes were applied, while areas outside these treatments continue to exhibit elevated soil loss.
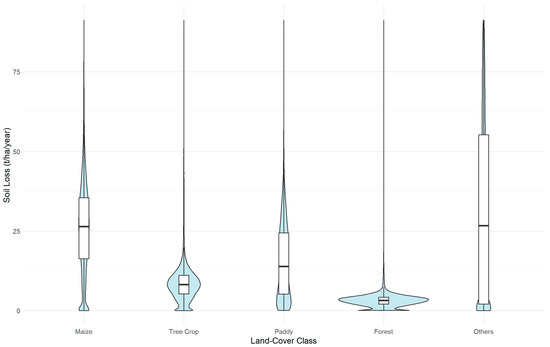
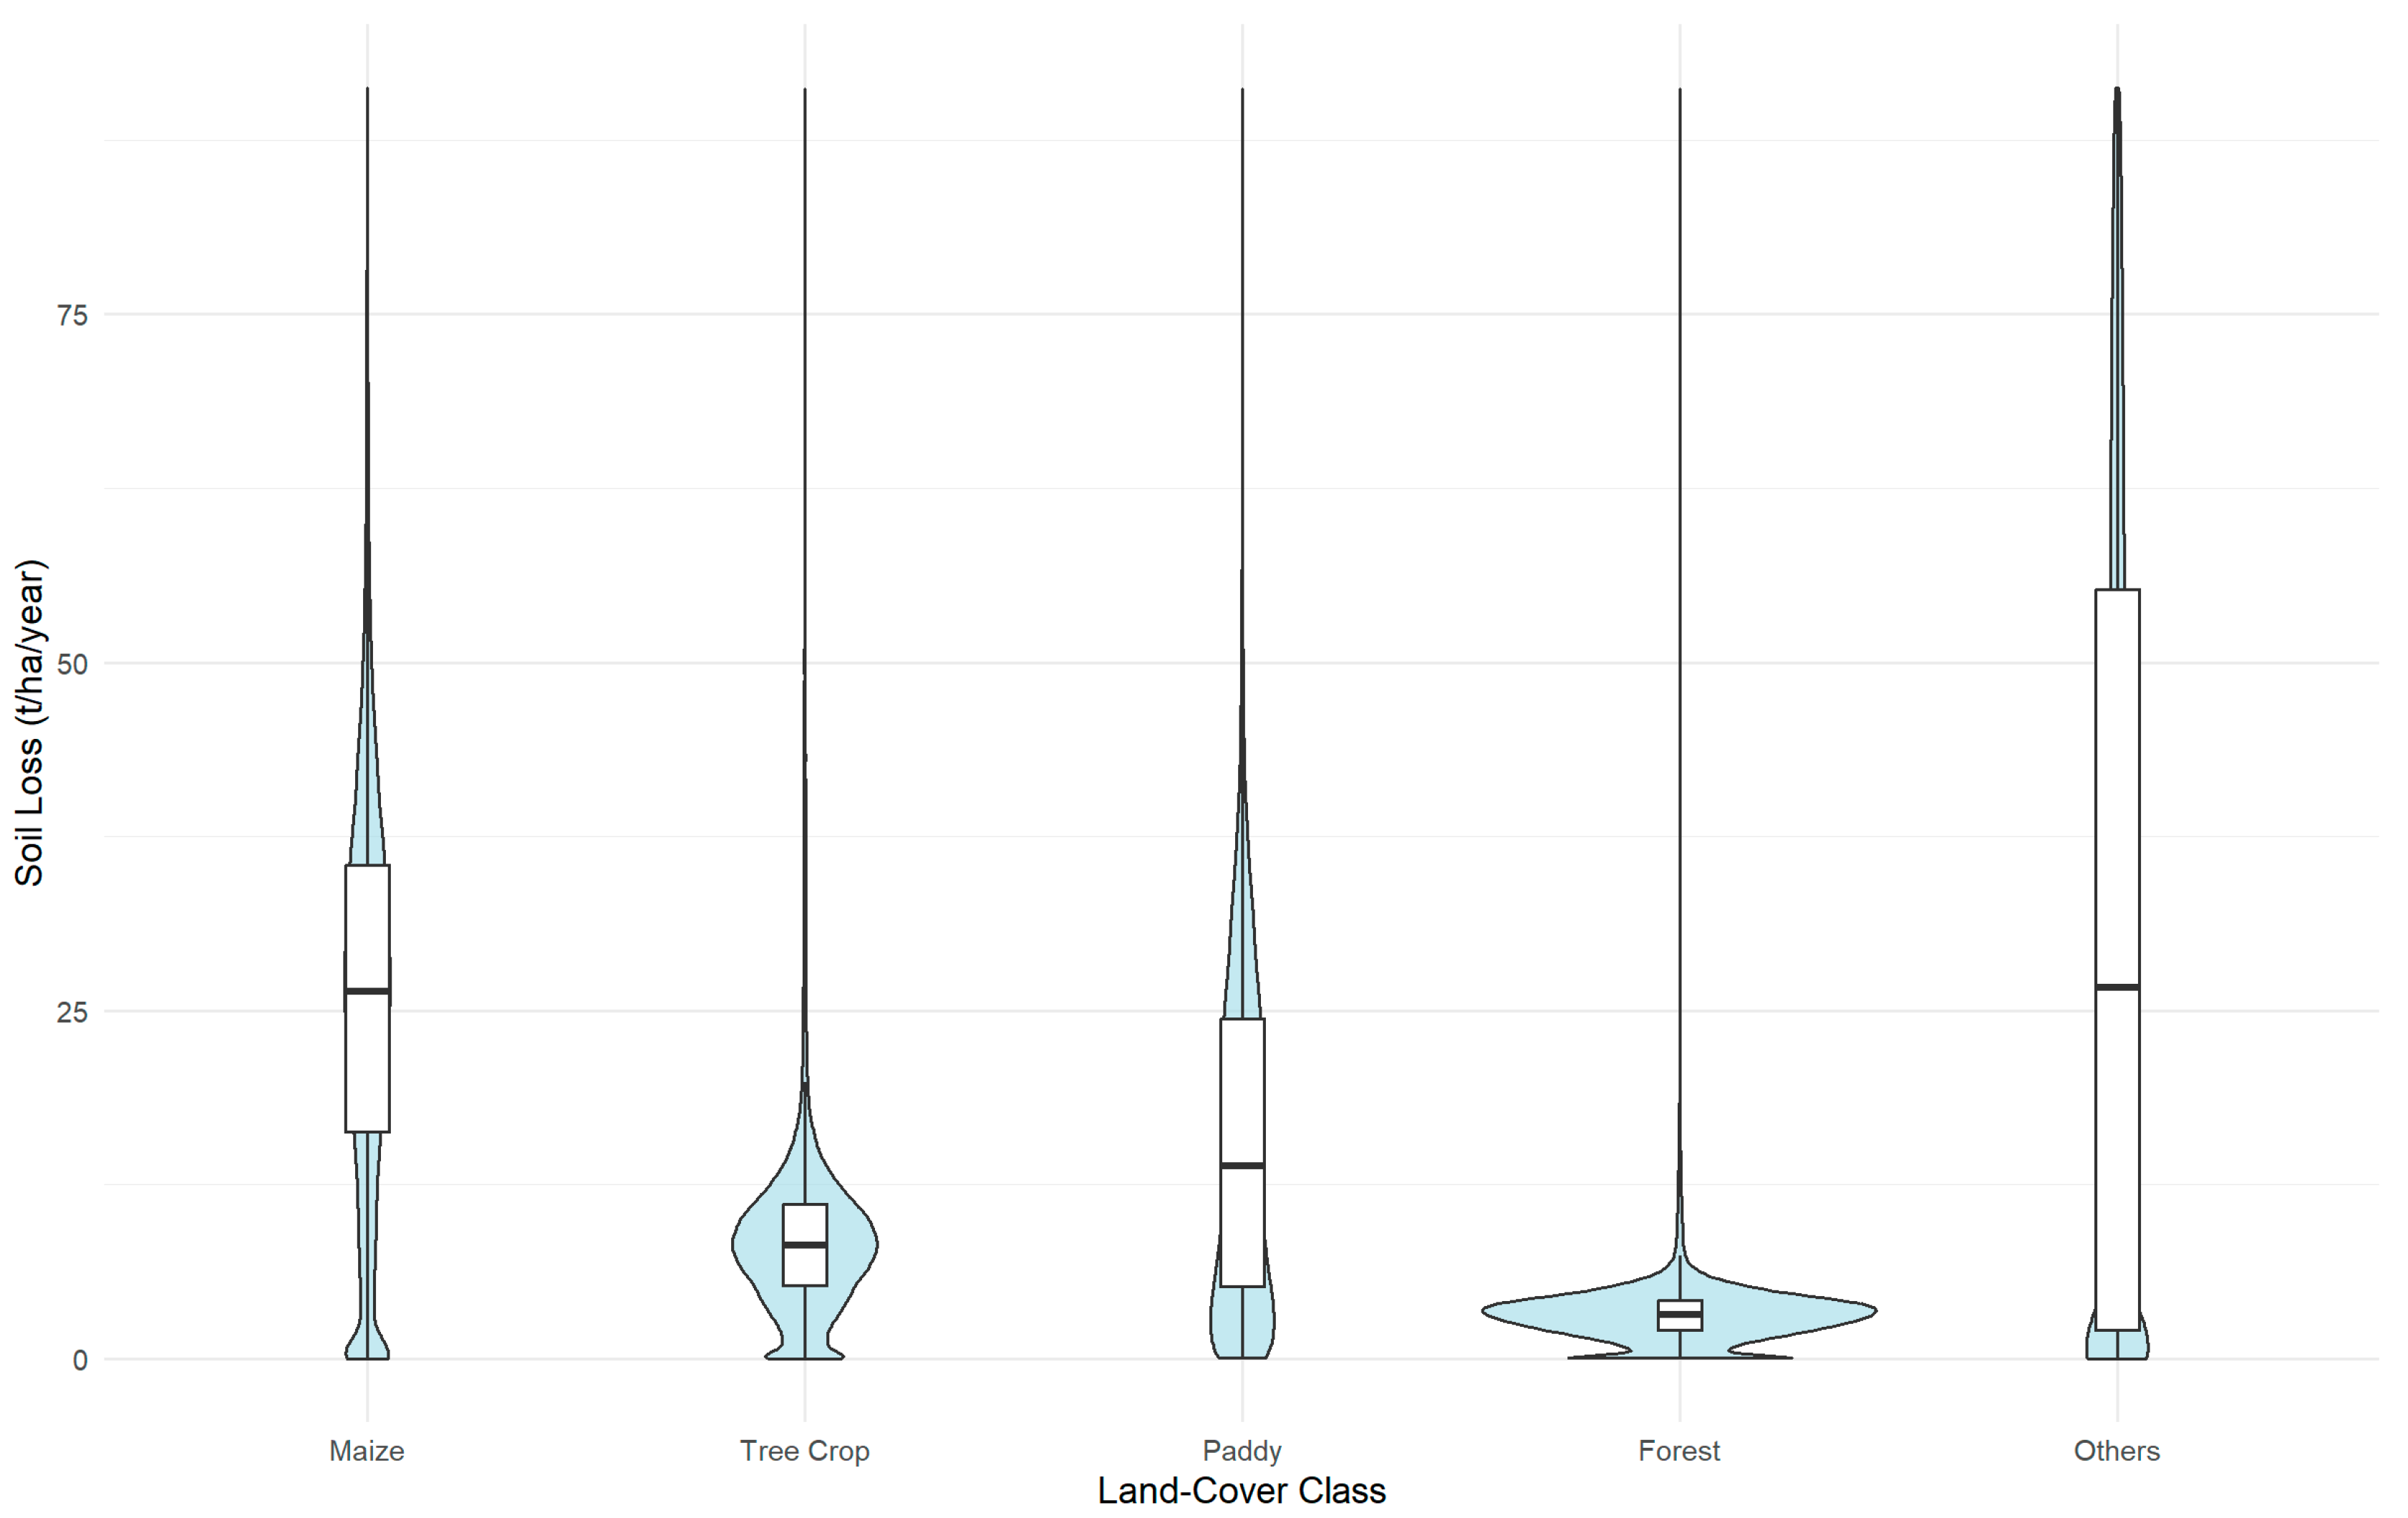
To understand the effect of each type of land cover, violin plots were constructed to illustrate the baseline erosion rate by the land-cover class (Figure 7). In this diagram, forest concentrates at the lowest values with a tight distribution (median 3.18 t/ha/year, SD 4.01). Tree crop remains low and compact (median 8.17 t/ha/year, SD 8.28), and paddy is low to moderate (median 13.8 t/ha/year, SD 12.4). Maize exhibits a higher central tendency and wider spread (median 26.4 t/ha/year, SD 15.3), while the “others” category is the most heterogeneous, with the broadest dispersion (median 26.7 t/ha/year, SD 28.1). The ordering reflects the commune’s physiography and land management: more exposed and intensively managed surfaces tend to have higher erosion, whereas continuous canopy and ponded fields suppress losses.
Figure 7.
Violin plots of annual erosion rate (t/ha/year) by land-cover class in Chieng Hac.
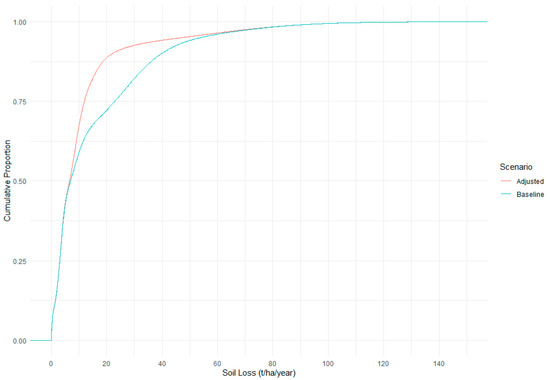
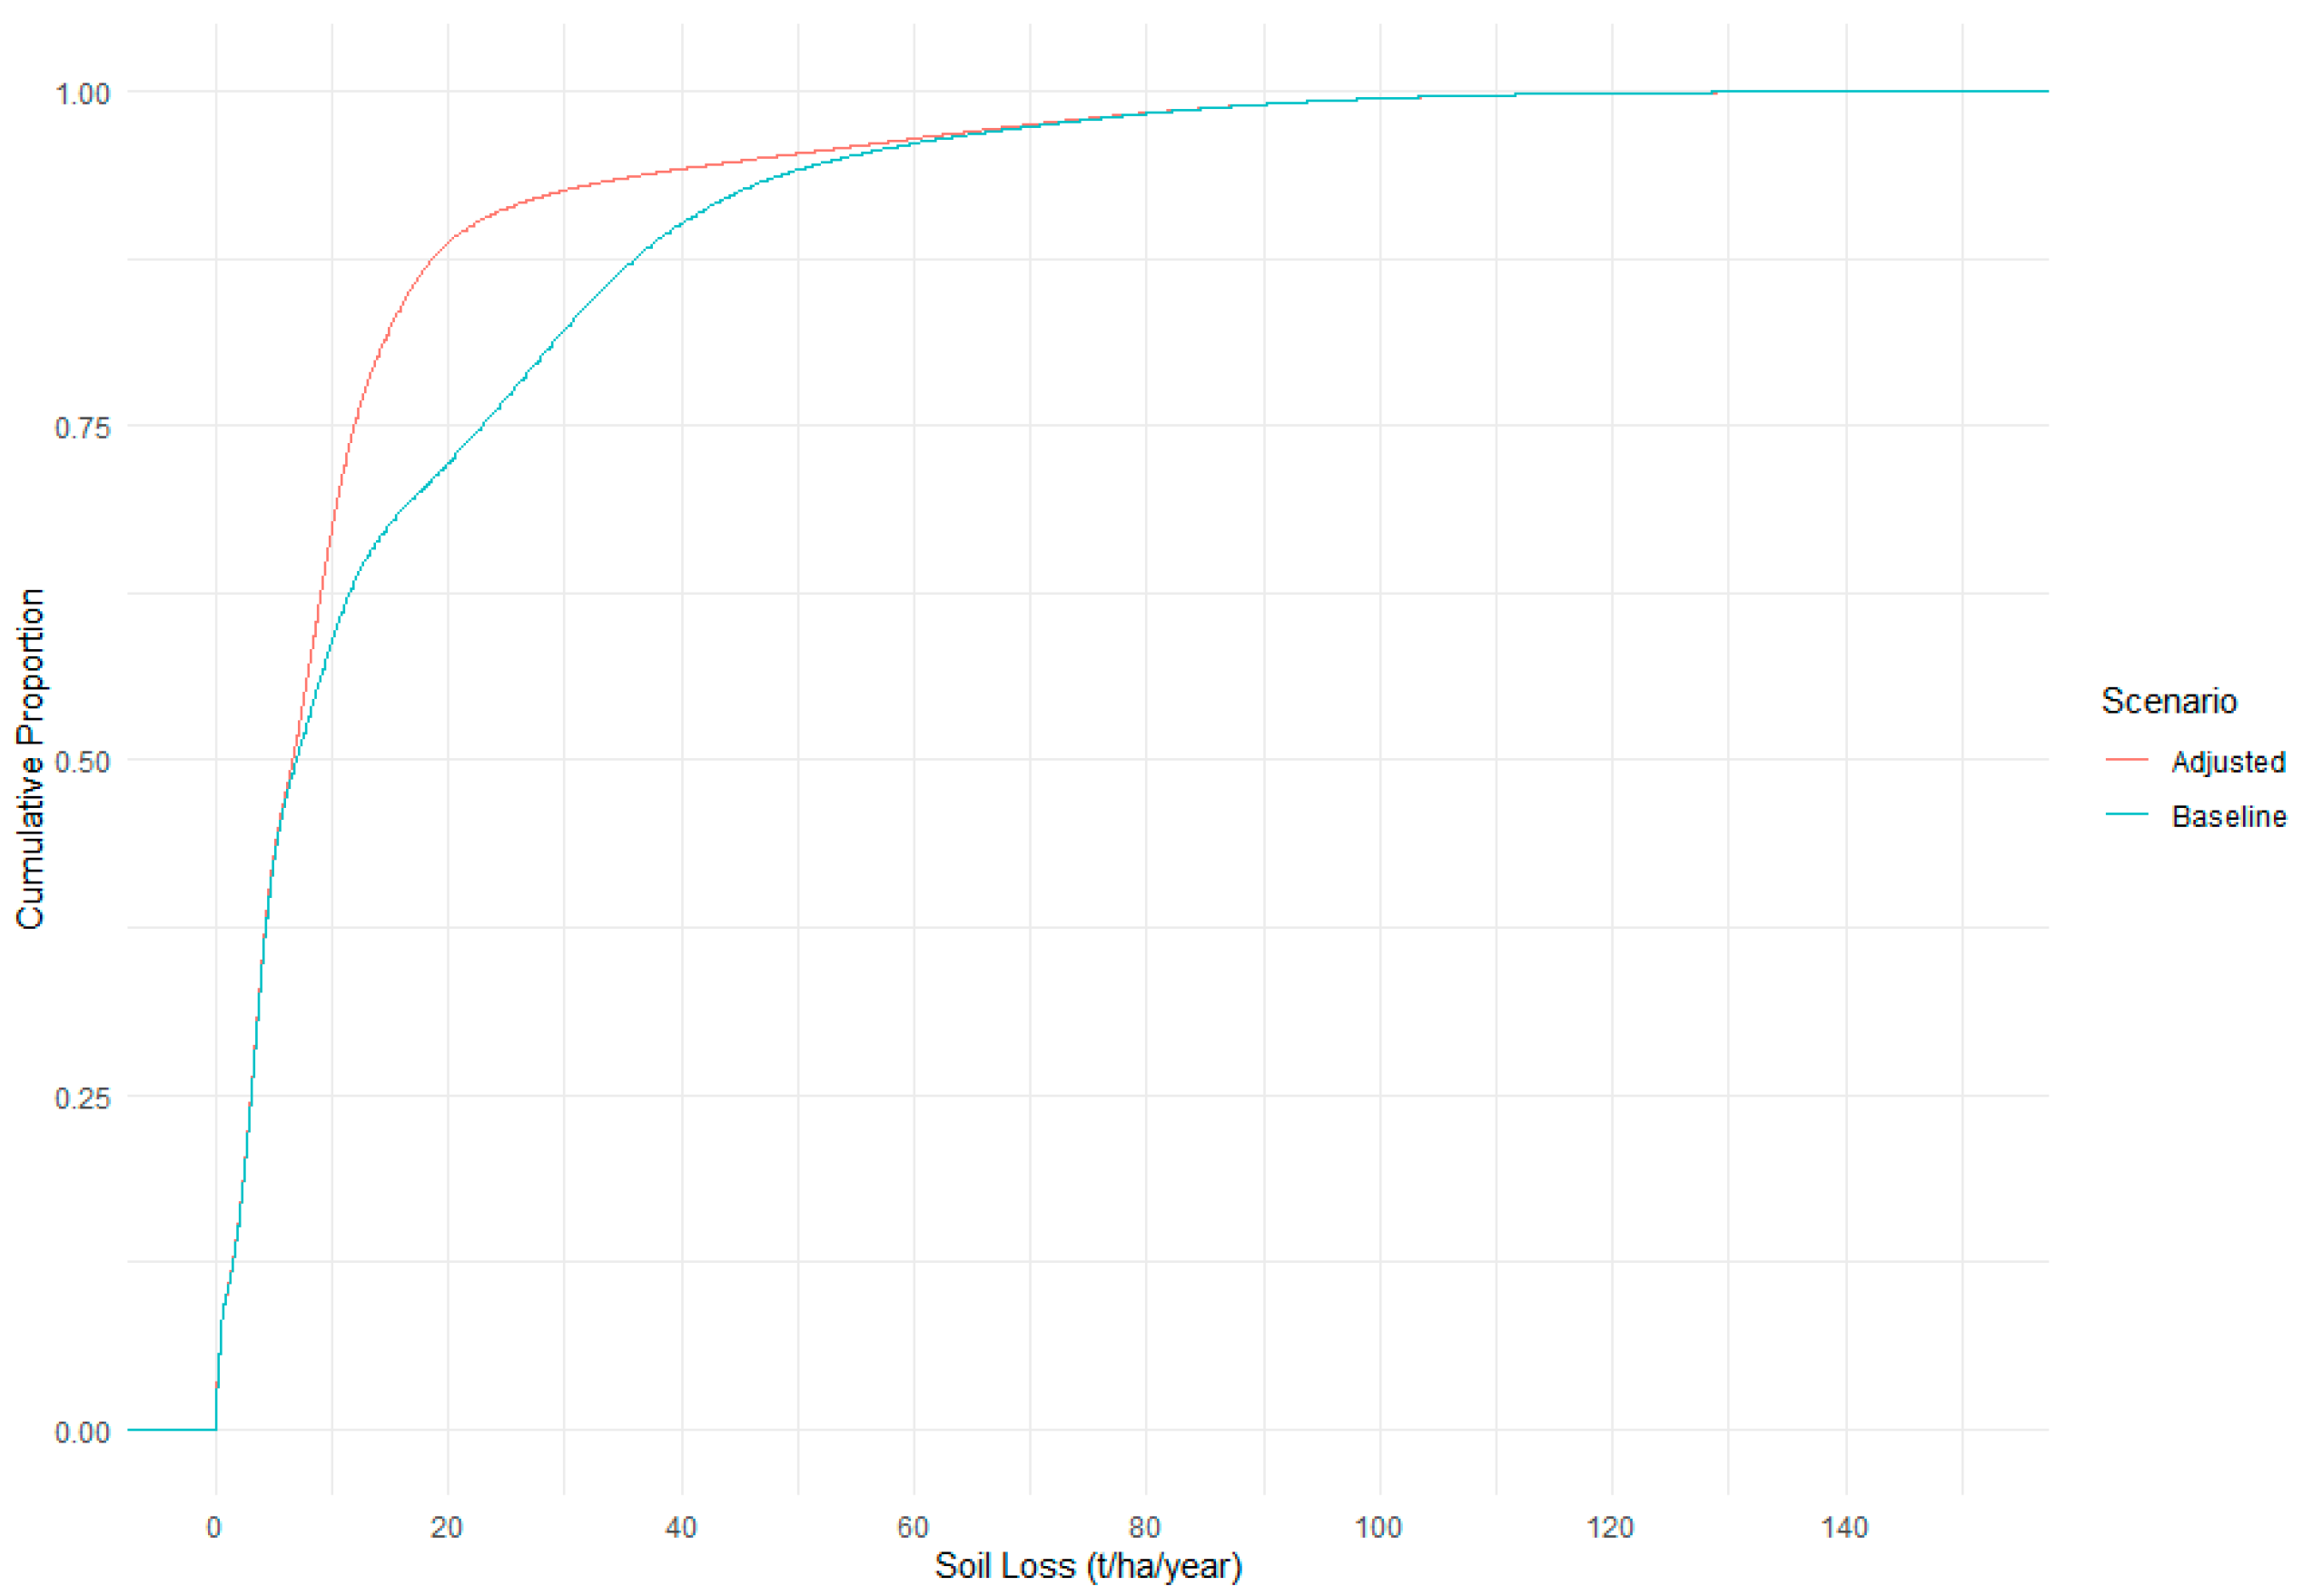
Building on the class-wise patterns in the violin plots, the Empirical Cumulative Distribution Function (ECDF) curves (Figure 8) summarise how soil loss is distributed across the commune. The adjusted curve rises more quickly than the baseline, with the greatest separation in the 5–25 t/ha/year interval, which corresponds to the slopes targeted by the interventions. The curves overlap at the lower end, where stable forests and paddies dominate, and converge again in the high-loss tail, indicating a small number of persistent hotspots on very steep slopes. Aggregating across all pixels, the mean soil loss declines from 15.52 t/ha/year in the baseline to 11.51 t/ha/year in the adjusted scenario, a reduction of approximately 26%. This pattern indicates a landscape-wide leftward shift in the distribution, consistent with broader erosion mitigation rather than isolated site effects.
Figure 8.
Empirical cumulative distributions of annual erosion rate between baseline and adjusted land-cover scenarios.
3.5. Trade-Off Assessment of Water Deficit and Soil Loss
To evaluate the combined effects of hydrological conditions and land degradation processes, an integrated comparison of annual water deficit and soil loss was conducted for both the baseline and adjusted scenarios (Table 5). The water balance results indicate that the adjusted scenario exhibited a slightly higher annual water deficit (1022.2 mm/year) compared to the baseline scenario (1013.6 mm/year), representing a marginal increase in moisture limitation across the study area. This suggests that the applied adjustments may have influenced soil moisture dynamics, potentially through changes in evapotranspiration or water retention processes.
Table 5.
Comparison of annual water deficit and soil loss under baseline and adjusted scenarios.
In contrast, soil loss was substantially reduced under the adjusted scenario, decreasing from 15.52 t/ha/year in the baseline scenario to 11.51 t/ha/year. This indicates that the adjustments were effective in mitigating erosion processes, likely through improved surface protection or reduced susceptibility to detachment and transport.
Taken together, while the adjusted scenario improves landscape stability by reducing soil loss, it is associated with a slight increase in water deficit. This suggests that land management interventions in mountainous agricultural systems need to balance hydrological and land processes outcomes to achieve sustainable performance.
4. Discussion
This study addressed persistent gaps in understanding the spatial and temporal dynamics of water balance and soil erosion by integrating spatially explicit water balance components with erosion modelling. The results reveal pronounced seasonal variability driven by monsoonal precipitation and strong spatial differentiation controlled by physiography and land-use patterns. The observed heterogeneity in water surplus, deficit, and soil loss underscores the complex interactions among climatic forcing, topography, and land management in mountainous agroecosystems. The following discussion evaluates the implications of these findings for sustainable water resource management and integrated erosion control, while also considering methodological limitations and uncertainties inherent in regional-scale modelling.
Intensification of maize cultivation in Chieng Hac extends the period of water-deficit months and increases sensitivity to dry spells during early growth. Sparse canopy and limited surface roughness promote rapid runoff on sloping fields, which reduces on-site water storage and elevates erosion risk. For most months, Actual Evapotranspiration closely tracked precipitation, limiting runoff production; however, once precipitation exceeded storage capacity during peak monsoon periods, rapid overland flow on steep slopes likely intensified erosion processes. This seasonal hydrological pulse helps explain why erosion hotspots are concentrated on exposed maize-dominated slopes, consistent with findings from sloping uplands in northern Vietnam and comparable tropical regions [53]. At the annual scale, this pattern is reflected in a slight increase in water deficit under the adjusted scenario (from 1013.6 to 1022.2 mm/year).
The observed water balance patterns are controlled by rainfall timing, PET, and land-use distribution. Precipitation peaks during July–September, whereas surface temperature reaches its maximum earlier in May, creating a period of pronounced deficit. This explains the large deficit observed across all land-use types in May and the limited runoff generation throughout most of the year. Differences in water balance indicator values among land-use types are also influenced by their topographic setting. Paddy fields, which are concentrated in lower-elevation areas, exhibit higher PET values during peak months due to higher temperature conditions, whereas forest and upland areas show lower PET and greater water storage and surplus.
Large and permanent groundwater storage is difficult because the commune is underlain by carbonate rocks and surface forms are strongly erosional [54]. This setting can depress yields by combining dry-season drought with wet-season flash runoff [55,56,57,58]. High runoff also lowers field-scale water-use efficiency (WUE) [59,60,61]. The runoff generation is also intensified by physical conditions, which are dominated by the steep slope. On the other hand, surface water (precipitation, rivers, ponds, etc.) is the main water source for agricultural activities in Chieng Hac. Accessing groundwater resources has proven to be difficult due to the high cost of drilling a well [62] and Chieng Hac’s geohydrological characteristic being intermediately poor for water resources [54].
On maize fields with 10–20° slopes, contour strip cropping with grass or legumes should be adopted to slow overland flow, increase infiltration, and retain soil moisture through the season. Evidence shows that maize strip systems with companions such as narrow-leafed lupin or spring oat can reduce runoff and improve nutrient uptake, while legume integration can lower irrigation demand by up to 50% [63,64,65]. On slopes steeper than 20°, conversion from annual maize to tree crops is recommended where market access and local water availability allow. Perennial cover increases interception and rooting depth, stabilises Actual Evapotranspiration when water is available, and strengthens buffering against early-season deficits. We acknowledge that dry-season water demand may remain high where supplemental water is not available. These measures primarily target water availability and water-use efficiency; a secondary benefit is reduced soil loss on treated slopes.
Where storage is feasible, small, lined farm ponds or distributed rainwater-harvesting structures could be prioritised at sites with low-permeability soils and gentle slopes [66]. Complementary soil-moisture conservation practices, including residue retention, reduced tillage, organic amendments, cover crops, and mulching, increase infiltration and soil water storage and reduce evaporative losses [67]. Operational measures such as aligning planting dates with the onset of wet months and improving in-field water distribution through maintenance of paddy bunds, field levelling, and localised infiltration strips can further raise water-use efficiency without large capital costs [68].
Increasing the canopy cover and cultivating crops that may help to store water can be done by shifting some of the area used for maize monoculture into tree crops. Tree crops can store water better than maize in higher-PET conditions. They also provide canopy protection that can hamper rain drop velocity before hitting the soil. Shifting to tree crops may also help the farmers’ livelihood as the market for maize is unstable in Vietnam [6]. The shift to tree crops could be focused on the southern area, which has a large maize-growing area with a relatively steep slope.
Our adjusted scenario reduces the mean erosion rate from 15.52 to 11.51 t/ha/year (about 26%), moving the landscape closer to an often-cited benchmark of 10 t/ha/year for the low-erosion-rate class [69]. Recent work and reviews place tolerable ranges broadly between about 5 and 11 t/ha/year, with watershed-specific studies sometimes adopting 10 t/ha/year as a planning target [70]. The largest improvements occur where strip cropping is introduced on 10–20° maize and where steep maize is converted to tree crops, consistent with evidence that contour strip systems and perennial cover substantially reduce runoff and soil loss [71]. Although the intervention shows a favourable effect on slopes < 20°, steeper terrain will require not only vegetative measures but also tillage and mechanical interventions.
Steep slopes remain the main hotspots. Site-specific conservation is needed to push these areas toward <10 t/ha/year. Practical options include shortening slope length with small contour bunds or hedgerows, establishing grassed flow paths where runoff concentrates, stabilising field tracks that intercept flow, and, where banks are actively eroding, applying targeted streambank stabilisation using bioengineering or structural methods [72]. These measures should be phased by slope class, starting with vegetative practices on moderate slopes and adding structural elements as gradients increase, so that conservation follows a gradual, slope-based sequence.
While the results provide valuable insight into water balance and erosion dynamics of the study area, they are subject to several modelling assumptions and data limitations. The water balance in Chieng Hac commune area was modelled by the assumption of precipitation inside the area as the only source of input for Chieng Hac’s hydrological system. The model did not consider the interaction of the watershed-based hydrological system, which may provide another source of input. The Chieng Hac area is located inside the Da River watershed system. While its location is relatively far from the mainstream, it is crossed by the small river going to the mainstream. This small stream can bring water from other areas into Chieng Hac’s hydrological system. Thus, the model may give an underestimation of water resource availability throughout the year. In addition, the TM model does not explicitly represent lateral runoff or upstream inflow contributions that may occur through the small streams connected to the watershed system. As a result, episodic runoff generated in upstream areas or short-term surface flow entering the study area during intense rainfall events may not be fully captured by the model structure. More physically based models such as SWAT can represent watershed routing processes and water transfer between sub-basins. But SWAT requires more detailed hydrological observations and calibration data, which are often limited in mountainous regions such as Chieng Hac. Therefore, the TM approach was selected as a practical method for regional-scale water balance assessment under data-limited conditions. This limitation should be considered when interpreting the spatial patterns of water availability derived from the model. However, the possible water input underestimation might be balanced by the underestimation of output. The TM model only considers evapotranspiration and storage recharge as the means of output. This assumption might not be enough to represent the actual condition as the hydrological system in a watershed also brings another possibility of water resource output through river stream discharge out of Chieng Hac.
Aside from the model assumption, the water balance model was created using open-source data, so it can take advantage of primary-collected data to improve further. While open-source data are easily accessible for anyone, they came with different resolutions that required further adjustments before they could be used for modelling. In particular, the integration of a 12.5 m DEM with precipitation data at a coarser spatial resolution (~5.5 km) introduces additional uncertainty. The use of weather station and river gauge data inside Chieng Hac and more detailed soil texture data could potentially allow for more accurate water balance modelling.
The RUSLE estimates long-term average sheet and rill erosion and does not simulate gully initiation or channel processes. Factor layers were harmonised to 12.5 m resolution; results reflect DEM-derived slope length/steepness and the accuracy of the land-cover map. We trimmed extreme pixel values for summary plots and assumed a single-year climate (2021) for erosivity factor. The scenario changed practice factor only for maize on 10–20° slopes and reclassified steep maize to tree crops; other factors followed baseline assignments. These choices likely underestimate benefits where additional practices are present but not mapped, and overestimate stability where small gullies concentrate flow.
Another limitation of the study is that the modelling framework used climate data from a single year (2021) to estimate water balance and rainfall erosivity. This study did not assess whether 2021 represents a climatologically normal year, and the results may therefore be influenced by interannual climate variability. Interannual variability in precipitation and temperature can influence evapotranspiration, runoff generation, and soil erosion processes, particularly in mountainous regions where rainfall variability is high. Therefore, the results presented in this study represent the hydrological and erosion conditions under the climatic characteristics of 2021 rather than long-term averages. This study focused on spatial patterns and model integration under a representative year. Future research could address this limitation by incorporating multi-year climate datasets or long-term reanalysis data to evaluate interannual variability, as well as by applying scenario-based approaches to assess potential climate change impacts on water balance and soil erosion dynamics.
5. Conclusions
Chieng Hac is one of the main maize production areas in northern Vietnam. As climate change’s impact becomes more prevalent, competition for freshwater for agriculture continues to increase. By integrating the TM water balance model with the RUSLE approach, this study provides a more comprehensive assessment of land-use impacts than either model alone. The integrated TM water balance and RUSLE analyses demonstrate that land-use type strongly regulates both hydrological redistribution and soil erosion. Based on TM model and RUSLE results, maize-dominated systems exhibited greater seasonal water deficit and higher erosion rates compared to tree crops and forest, while paddy fields showed limited water retention capacity despite low erosion under ponded conditions. Although tree crops increased modelled water demand and in some locations indicated seasonal deficit (~1% increase), they provided substantially stronger surface protection and contributed to a marked reduction in soil loss under the adjusted scenario, with mean soil loss reduced from 15.52 to 11.51 t/ha/year (approximately 4 t/ha/year). These results reveal a trade-off between erosion control benefits and increased water demand.
Spatial patterns further revealed clear physiographic control, with the northern and southern mountainous sectors maintaining higher water surplus and lower deficit than the drier central zone. These findings indicate that effective land management in Chieng Hac must integrate slope-dependent conservation with seasonal water balance considerations, supporting a tiered management approach rather than a uniform strategy. Contour strip cropping with grass or legumes on maize fields on 10–20° slopes is suitable to slow runoff and keep more water on site. Selective conversion from maize to perennial crops (e.g., tree crops) on slopes steeper than 20° is suitable where local water supply or small storage is feasible. This adjusted scenario reflects both erosion control potential and the general economic value of tree crops, but its application must account for local conditions. Practical implementation should also consider socio-economic factors such as establishment costs, farmer acceptance, market conditions, and local agricultural policies.
Residue retention, cover crops, and improved field water distribution can support seasonal water availability. Site-specific add-ons are still needed at hotspots, such as grassed flow paths, short contour bunds or hedgerows, simple track stabilisation, and in some cases additional structural measures such as small check dams or reinforced bunding. This combination reduces soil loss while managing the trade-offs in water balance under current and future conditions.
Beyond the case study area, this integrated modelling framework demonstrates strong applicability for data-limited mountainous regions. By relying on widely available remote sensing datasets (e.g., PlanetScope, ALOS DEM, and CHIRPS precipitation), the approach can be transferred to other upland systems in northern Vietnam and similar environments across the Global South to support spatially targeted land and water management planning.
Overall, this study shows that combining hydrological and erosion modelling provides actionable insights into the trade-offs shaping upland agricultural systems. These spatially explicit findings can inform more adaptive land-use strategies that reduce erosion while managing water scarcity, helping to mitigate the growing vulnerability associated with monoculture expansion in mountainous regions.
Author Contributions
Conceptualisation, A.S., M.A.A. and A.A.A.; methodology, A.S., Z.W. and F.A.A.; software, A.S.; formal analysis, A.S., Z.W. and F.A.A.; resources, A.A.A.; data curation, A.S. and F.A.A.; writing—original draft preparation, A.S.; writing—review and editing, M.A.A., F.A.A. and A.A.A.; visualisation, A.S., Z.W. and F.A.A.; supervision, M.A.A., M.B. and A.A.A.; funding acquisition, M.B. and A.A.A. All authors have read and agreed to the published version of the manuscript.
Funding
This research was funded by the Australian Centre for International Agricultural Research, grant number SMCN/2014/049 (Improving maize-based farming systems on sloping lands in Vietnam and Lao PDR).
Data Availability Statement
The raw data supporting the conclusions of this article will be made available by the authors on request.
Acknowledgments
During the preparation of this manuscript/study, the authors used ChatGPT 5 (Open AI, San Francisco, CA, USA) for the purposes of improving grammar and phrasing clarity. The authors have reviewed and edited the output and take full responsibility for the content of this publication.
Conflicts of Interest
The authors declare no conflicts of interest. The funders had no role in the design of the study; in the collection, analyses, or interpretation of data; in the writing of the manuscript; or in the decision to publish the results.
References
- D’Odorico, P.; Chiarelli, D.D.; Rosa, L.; Bini, A.; Zilberman, D.; Rulli, M.C. The global value of water in agriculture. Proc. Natl. Acad. Sci. USA 2020, 117, 21985–21993. [Google Scholar] [CrossRef] [Scilit] [PubMed]
- IPBES. Summary for Policymakers of the Assessment Report on Land Degradation and Restoration of the Intergovernmental Science-Policy Platform on Biodiversity and Ecosystem Services; IPBES Secretariat: Bonn, Germany, 2018; p. 44. [Google Scholar]
- Ahmad, M.D.; Turral, H.; Nazeer, A. Diagnosing irrigation performance and water productivity through satellite remote sensing and secondary data in a large irrigation system of Pakistan. Agric. Water Manag. 2009, 96, 551–564. [Google Scholar] [CrossRef] [Scilit]
- FAO. The State of the World’s Land and Water Resources for Food and Agriculture 2021—Systems at Breaking Point: Main Report; FAO: Rome, Italy, 2022. [Google Scholar]
- Wang, W.; Straffelini, E.; Pijl, A.; Tarolli, P. Sustainable water resource management in steep-slope agriculture. Geogr. Sustain. 2022, 3, 214–219. [Google Scholar] [CrossRef] [Scilit]
- Dang Thi Thanh, T.; Nguyen Van, H. Structure Changing in Maize-Based Agriculture Production in Vietnam: Case Study in Son La Province. SEAS (Sustain. Environ. Agric. Sci.) 2020, 4, 65–76. [Google Scholar] [CrossRef] [Scilit]
- Keil, A.; Saint-Macary, C.; Zeller, M. Maize Boom in the Uplands of Northern Vietnam: Economic Importance and Environmental Implications; Universitaet Hohenheim, Department of Agricultural Economics and Social Sciences in the Tropics and Subtropics: Stuttgart, Germany, 2008. [Google Scholar]
- Yadav, L.P.; Smith, D.; Aziz, A.A.; Thuy, C.T.L.; Thao, H.X.; Le, H.H.; Nicetic, O.; Quyen, L.N.; Vagneron, I. Can traders help farmers transition towards more sustainable maize based farming systems? Evidence from the Lao-Vietnamese border. Int. J. Agric. Sustain. 2021, 19, 234–254. [Google Scholar] [CrossRef] [Scilit]
- Desbureaux, S.; Damania, R. Rain, forests and farmers: Evidence of drought induced deforestation in Madagascar and its consequences for biodiversity conservation. Biol. Conserv. 2018, 221, 357–364. [Google Scholar] [CrossRef] [Scilit]
- Dang, V.H.; Tran, D.D.; Cham, D.D.; Hang, P.T.T.; Nguyen, H.T.; Truong, H.V.; Tran, P.H.; Duong, M.B.; Nguyen, N.T.; Le, K.V.; et al. Assessment of Rainfall Distributions and Characteristics in Coastal Provinces of the Vietnamese Mekong Delta under Climate Change and ENSO Processes. Water 2020, 12, 1555. [Google Scholar] [CrossRef] [Scilit]
- McKinley, J.D.; LaFrance, J.T.; Pede, V.O. Climate Change Adaptation Strategies Vary With Climatic Stress: Evidence From Three Regions of Vietnam. Front. Sustain. Food Syst. 2021, 5, 762650. [Google Scholar] [CrossRef] [Scilit]
- Pimentel, D.; Burgess, M. Soil Erosion Threatens Food Production. Agriculture 2013, 3, 443–463. [Google Scholar] [CrossRef] [Scilit]
- Roversi, G.; Pancaldi, M.; Cossich, W.; Corradini, D.; Nguyen, T.T.N.; Nguyen, T.V.; Porcu’, F. The Extreme Rainfall Events of the 2020 Typhoon Season in Vietnam as Seen by Seven Different Precipitation Products. Remote Sens. 2024, 16, 805. [Google Scholar] [CrossRef] [Scilit]
- Singh, V.P.; Fiorention, M. Hydrologic modeling with GIS. In Geographical Information Systems in Hydrology; Singh, V.P., Fiorention, M., Eds.; Springer: Dordrecht, The Netherlands, 1996; p. 13. [Google Scholar]
- Gebru, T.A.; Tesfahunegn, G.B. GIS based water balance components estimation in northern Ethiopia catchment. Soil Tillage Res. 2020, 197, 104514. [Google Scholar] [CrossRef] [Scilit]
- Singh, R.K.; Prasad, V.H.; Bhatt, C.M. Remote sensing and GIS approach for assessment of the water balance of a watershed/Evaluation par télédétection et SIG du bilan hydrologique d’un bassin versant. Hydrol. Sci. J. 2004, 49, 131–141. [Google Scholar] [CrossRef] [Scilit]
- Wischmeier, W.H.; Smith, D.D. Predicting Rainfall Erosion Losses: A Guide to Conservation Planning; U.S. Department of Agriculture, Science and Education Administration: Washington, DC, USA, 1978. [Google Scholar]
- Renard, K.G.; Foster, G.R.; Weesies, G.A.; McCool, D.K.; Yoder, D.C. Predicting Soil Erosion by Water: A Guide to Conservation Planning with the Revised Universal Soil Loss Equation (RUSLE); U.S. Department of Agriculture, Agricultural Research Service: Washington, DC, USA, 1997. [Google Scholar]
- Alemaw, B.F.; Chaoka, T.R. A continental scale water balance model: A GIS-approach for Southern Africa. Phys. Chem. Earth Parts A/B/C 2003, 28, 957–966. [Google Scholar] [CrossRef] [Scilit]
- Mammoliti, E.; Fronzi, D.; Mancini, A.; Valigi, D.; Tazioli, A. WaterbalANce, a WebApp for Thornthwaite–Mather Water Balance Computation: Comparison of Applications in Two European Watersheds. Hydrology 2021, 8, 34. [Google Scholar] [CrossRef] [Scilit]
- Rasheed, N.J.; Al-Khafaji, M.S.; Alwan, I.A.; Al-Suwaiyan, M.S.; Doost, Z.H.; Yaseen, Z.M. Survey on the resolution and accuracy of input data validity for SWAT-based hydrological models. Heliyon 2024, 10, e38348. [Google Scholar] [CrossRef] [Scilit]
- Wi, S.; Ray, P.; Demaria, E.M.C.; Steinschneider, S.; Brown, C. A user-friendly software package for VIC hydrologic model development. Environ. Model. Softw. 2017, 98, 35–53. [Google Scholar] [CrossRef] [Scilit]
- Hendrayana, H.; Widyastuti, M.; Riyanto, I.A.; Nuha, A.; Widasmara, M.Y.; Ismayuni, N.; Rachmi, I.N. Thornthwaite and Mather water balance method in Indonesian tropical area. IOP Conf. Ser. Earth Environ. Sci. 2021, 851, 14. [Google Scholar] [CrossRef] [Scilit]
- Rashid, M.; Haider, S.; Rizwan, A.; Naseer, M.W.; Aslam, M.F.; Hamza, M.; Nadeem, A.; Haider, M.A.; Abbasi, H.K.J.; Tariq, M.A.U.R. Mitigating soil erosion in arid landscapes: Integrating RUSLE and geospatial analysis for sustainable land management. Environ. Chall. 2025, 20, 101210. [Google Scholar] [CrossRef] [Scilit]
- Vergni, L.; Todisco, F. A Random Forest Machine Learning Approach for the Identification and Quantification of Erosive Events. Water 2023, 15, 2225. [Google Scholar] [CrossRef] [Scilit]
- Firoozi, A.A.; Firoozi, A.A. Water erosion processes: Mechanisms, impact, and management strategies. Results Eng. 2024, 24, 103237. [Google Scholar] [CrossRef] [Scilit]
- Li, J.; Yan, K.; Duan, Q.; Li, J.; Chen, Z. Effects of tillage practices on water storage and soil conservation in red soil slope farmland in Southern China. Sci. Rep. 2024, 14, 28781. [Google Scholar] [CrossRef] [Scilit] [PubMed]
- Sun, H.; Cheng, Y.; Liu, L.; An, Q.; Zhang, H. Water deficit is increasingly limiting vegetation productivity in China. Ecol. Indic. 2025, 177, 113775. [Google Scholar] [CrossRef] [Scilit]
- Silva, T.P.; Bressiani, D.; Ebling, É.D.; Reichert, J.M. Best management practices to reduce soil erosion and change water balance components in watersheds under grain and dairy production. Int. Soil Water Conserv. Res. 2024, 12, 121–136. [Google Scholar] [CrossRef] [Scilit]
- Kohmoto, Y.; Watanabe, T.; Sipaseuth, N.; Funakawa, S. Analysis of surface runoff water and sediment generations using a short-term water budget in the steeply sloping agricultural land of northern Laos. Soil Sci. Plant Nutr. 2021, 67, 359–370. [Google Scholar] [CrossRef] [Scilit]
- Mihara, K.; Kuramochi, K.; Toma, Y.; Hatano, R. Spatiotemporal analysis of soil loss in cold climate upland farming watersheds using SWAT: Case study of Tokoro River watershed, Hokkaido, Japan. Soil Sci. Plant Nutr. 2023, 70, 65–77. [Google Scholar] [CrossRef] [Scilit]
- Van Zuidam, R.A. Aerial Photo-Interpretation in Terrain Analysis and Geomorphological Mapping; Smits Publishers: The Hague, The Netherlands, 1985; 442p. [Google Scholar]
- Gupta, S.; Borrelli, P.; Panagos, P.; Alewell, C. An advanced global soil erodibility (K) assessment including the effects of saturated hydraulic conductivity. Sci. Total Environ. 2024, 908, 168249. [Google Scholar] [CrossRef] [Scilit]
- Basheer, S.; Wang, X.; Nawaz, R.A.; Pang, T.; Adekanmbi, T.; Mahmood, M.Q. A comparative analysis of PlanetScope 4-band and 8-band imageries for land use land cover classification. Geomatica 2024, 76, 100023. [Google Scholar] [CrossRef] [Scilit]
- Rouse, J.W., Jr.; Haas, R.H.; Schell, J.A.; Deering, D.W. Monitoring Vegetation systems in The Great Pains with ERTS. In Proceedings of the Third Earth Resources Technology Satellite-1 (ERTS-1) Symposium, Washington, DC, USA, 10–14 December 1973; pp. 309–317. [Google Scholar]
- McFeeters, S.K. The use of the Normalized Difference Water Index (NDWI) in the delineation of open water features. Int. J. Remote Sens. 1996, 17, 1425–1432. [Google Scholar] [CrossRef] [Scilit]
- Louhaichi, M.; Borman, M.M.; Johnson, D.E. Spatially Located Platform and Aerial Photography for Documentation of Grazing Impacts on Wheat. Geocarto Int. 2001, 16, 65–70. [Google Scholar] [CrossRef] [Scilit]
- Gitelson, A.A.; Gritz, Y.; Merzlyak, M.N. Relationships between leaf chlorophyll content and spectral reflectance and algorithms for non-destructive chlorophyll assessment in higher plant leaves. J. Plant Physiol. 2003, 160, 271–282. [Google Scholar] [CrossRef] [Scilit]
- Richardson, A.J.; Wiegand, C.L. Distinguishing Vegetation from Soil Background Information. Disting. Veg. Soil Backgr. Inf. 1977, 43, 1541–1552. [Google Scholar]
- Nagler, P.; Glenn, E.; Nguyen, U.; Scott, R.; Doody, T. Estimating Riparian and Agricultural Actual Evapotranspiration by Reference Evapotranspiration and MODIS Enhanced Vegetation Index. Remote Sens. 2013, 5, 3849–3871. [Google Scholar] [CrossRef] [Scilit]
- Huete, A.R. A Soil-Adjusted Vegetation Index (SAVI). Remote Sens. Environ. 1988, 25, 295–309. [Google Scholar] [CrossRef] [Scilit]
- Pearson, R.L.; Miller, L.D. Remote mapping of standing crop biomass for estimation of the productivity of the shortgrass prairie, Pawnee National Grasslands, Colorado. In Proceedings of the 8th International Symposium on Remote Sensing of Environment, Ann Arbor, MI, USA, 2–6 October 1972; pp. 1357–1381. [Google Scholar]
- Svoboda, J.; Štych, P.; Laštovička, J.; Paluba, D.; Kobliuk, N. Random Forest Classification of Land Use, Land-Use Change and Forestry (LULUCF) Using Sentinel-2 Data—A Case Study of Czechia. Remote Sens. 2022, 14, 1189. [Google Scholar] [CrossRef] [Scilit]
- Jin, Y.; Liu, X.; Chen, Y.; Liang, X. Land-cover mapping using Random Forest classification and incorporating NDVI time-series and texture: A case study of central Shandong. Int. J. Remote Sens. 2018, 39, 8703–8723. [Google Scholar] [CrossRef] [Scilit]
- Nguyen, H.T.T.; Doan, T.M.; Radeloff, V. Applying Random Forest Classification to Map Land Use/Land Cover Using Landsat 8 Oli. Int. Arch. Photogramm. Remote Sens. Spat. Inf. Sci. 2018, XLII–3/W4, 363–367. [Google Scholar] [CrossRef] [Scilit]
- Gislason, P.O.; Benediktsson, J.A.; Sveinsson, J.R. Random Forests for land cover classification. Pattern Recognit. Lett. 2006, 27, 294–300. [Google Scholar] [CrossRef] [Scilit]
- Thornthwaite, C.W.; Mather, J.R. Instructions and Tables for Computing Potential Evapotranspiration and the Water Balance; Drexel Institute of Technology, Laboratory of Climatology: Centerton, NJ, USA, 1957; Volume 10. [Google Scholar]
- Natural Capital Project. InVEST, 3.16.1; Stanford University: Stanford, CA, USA, 2025.
- Roose, E. Land Husbandry: Components and Strategy; Food and Agriculture Organization of the United Nations (FAO): Rome, Italy, 1996. [Google Scholar]
- Desmet, P.J.J.; Govers, G. A GIS procedure for automatically calculating the USLE LS factor on topographically complex landscape units. J. Soil Water Conserv. 1996, 51, 427–433. [Google Scholar] [CrossRef] [Scilit]
- Tian, P.; Zhu, Z.; Yue, Q.; He, Y.; Zhang, Z.; Hao, F.; Guo, W.; Chen, L.; Liu, M. Soil erosion assessment by RUSLE with improved P factor and its validation: Case study on mountainous and hilly areas of Hubei Province, China. Int. Soil Water Conserv. Res. 2021, 9, 433–444. [Google Scholar] [CrossRef] [Scilit]
- Ebabu, K.; Tsunekawa, A.; Haregeweyn, N.; Tsubo, M.; Adgo, E.; Fenta, A.A.; Meshesha, D.T.; Berihun, M.L.; Sultan, D.; Vanmaercke, M.; et al. Global analysis of cover management and support practice factors that control soil erosion and conservation. Int. Soil Water Conserv. Res. 2022, 10, 161–176. [Google Scholar] [CrossRef] [Scilit]
- Häring, V.; Fischer, H.; Stahr, K. Erosion of bulk soil and soil organic carbon after land use change in northwest Vietnam. Catena 2014, 122, 111–119. [Google Scholar] [CrossRef] [Scilit]
- Bui, Q.D.; Ha, H.; Khuc, D.T.; Nguyen, D.Q.; von Meding, J.; Nguyen, L.P.; Luu, C. Landslide susceptibility prediction mapping with advanced ensemble models: Son La province, Vietnam. Nat. Hazards 2022, 116, 2283–2309. [Google Scholar] [CrossRef] [Scilit]
- Altieri, M.A.; Nicholls, C.I.; Henao, A.; Lana, M.A. Agroecology and the design of climate change-resilient farming systems. Agron. Sustain. Dev. 2015, 35, 869–890. [Google Scholar] [CrossRef] [Scilit]
- Lin, H.; Wang, J.; Li, F.; Xie, Y.; Jiang, C.; Sun, L. Drought Trends and the Extreme Drought Frequency and Characteristics under Climate Change Based on SPI and HI in the Upper and Middle Reaches of the Huai River Basin, China. Water 2020, 12, 1100. [Google Scholar] [CrossRef] [Scilit]
- Gao, X.; Liu, Z.; Zhao, X.; Ling, Q.; Huo, G.; Wu, P. Extreme natural drought enhances interspecific facilitation in semiarid agroforestry systems. Agric. Ecosyst. Environ. 2018, 265, 444–453. [Google Scholar] [CrossRef] [Scilit]
- McMillen, M.S.; Mahama, A.A.; Sibiya, J.; Lubberstedt, T.; Suza, W.P. Improving drought tolerance in maize: Tools and techniques. Front. Genet. 2022, 13, 1001001. [Google Scholar] [CrossRef] [Scilit]
- Fox, D.M.; Bryan, R.B.; Price, A.G. The influence of slope angle on final infiltration rate for interrill conditions. Geoderma 1997, 80, 14. [Google Scholar] [CrossRef] [Scilit]
- Callejas Moncaleano, D.C.; Pande, S.; Rietveld, L. Water Use Efficiency: A Review of Contextual and Behavioral Factors. Front. Water 2021, 3, 685650. [Google Scholar] [CrossRef] [Scilit]
- Wang, W.; Elahi, E.; Sun, S.; Tong, X.; Zhang, Z.; Abro, M.I. Factors Influencing Water Use Efficiency in Agriculture: A Case Study of Shaanxi, China. Sustainability 2023, 15, 2157. [Google Scholar] [CrossRef] [Scilit]
- de Putter, H.; Luyen, C.H.; Huong, P.T.T. Report on Visit to Vietnam from 22–30 April 2007; Wageningen University and Research: Wageningen, The Netherlands, 2007. [Google Scholar]
- Hauggaard-Nielsen, H.; Johansen, A.; Carter, M.S.; Ambus, P.; Jensen, E.S. Annual maize and perennial grass-clover strip cropping for increased resource use efficiency and productivity using organic farming practice as a model. Eur. J. Agron. 2013, 47, 55–64. [Google Scholar] [CrossRef] [Scilit]
- Glowacka, A. The influence of strip cropping and adjacent plant species on the content and uptake of N, P, K, Mg and Ca by maize (Zea mays L.). Rom. Agric. Res. 2014, 31, 9. [Google Scholar]
- Raza, M.A.; Yasin, H.S.; Gul, H.; Qin, R.; Mohi Ud Din, A.; Khalid, M.H.B.; Hussain, S.; Gitari, H.; Saeed, A.; Wang, J.; et al. Maize/soybean strip intercropping produces higher crop yields and saves water under semi-arid conditions. Front. Plant Sci. 2022, 13, 1006720. [Google Scholar] [CrossRef] [Scilit]
- Critchley, W.; Siegert, K. Water Harvesting: A Manual for the Design and Construction of Water Harvesting Schemes for Plant Production; Food and Agriculture Organization of the United Nations (FAO): Rome, Italy, 1991. [Google Scholar]
- Wang, J.; Zhang, S.; Sainju, U.M.; Ghimire, R.; Zhao, F. A meta-analysis on cover crop impact on soil water storage, succeeding crop yield, and water-use efficiency. Agric. Water Manag. 2021, 256, 107085. [Google Scholar] [CrossRef] [Scilit]
- Le, L.T.; Tran, L.D.; Phung, T.N. Laser land leveling technology for paddy production in Vietnam: Impact on efficient irrigation and water conservation. Environ. Monit. Assess. 2024, 197, 17. [Google Scholar] [CrossRef] [Scilit]
- Rendana, M.; Idris, W.M.R.; Rahim, S.A.; Rahman, Z.A.; Lihan, T. Predicting soil erosion potential under CMIP6 climate change scenarios in the Chini Lake Basin, Malaysia. Geosci. Lett. 2023, 10, 1. [Google Scholar] [CrossRef] [Scilit]
- Bui, E.N.; Hancock, G.J.; Wilkinson, S.N. ‘Tolerable’ hillslope soil erosion rates in Australia: Linking science and policy. Agric. Ecosyst. Environ. 2011, 144, 136–149. [Google Scholar] [CrossRef] [Scilit]
- Liu, S.; Dong, A.; Niu, B.; Xu, F.; Xu, J.; Yin, L.; Wang, S. Maize/cover crop intercropping mitigates soil erosion and enhances yield of ridge cultivation in Chinese Mollisol region. Catena 2025, 255, 109012. [Google Scholar] [CrossRef] [Scilit]
- Rajbanshi, J.; Das, S.; Paul, R. Quantification of the effects of conservation practices on surface runoff and soil erosion in croplands and their trade-off: A meta-analysis. Sci. Total Environ. 2023, 864, 161015. [Google Scholar] [CrossRef] [Scilit]

Disclaimer/Publisher’s Note: The statements, opinions and data contained in all publications are solely those of the individual author(s) and contributor(s) and not of MDPI and/or the editor(s). MDPI and/or the editor(s) disclaim responsibility for any injury to people or property resulting from any ideas, methods, instructions or products referred to in the content. |
© 2026 by the authors. Licensee MDPI, Basel, Switzerland. This article is an open access article distributed under the terms and conditions of the Creative Commons Attribution (CC BY) license.