


Highlights
What are the main findings?
- Hyperspectral imaging is suitable to spectrally separate whitish disease symptoms caused by biotroph pathogens on leaves of apple and grapevine.
- Plant species, leaf side, variability of symptoms and their interactions are key factors that influence the spectral reflectance of affected tissue and its potential for disease differentiation.
What are the implications of the main findings?
- In remote sensing, spectral similarity of whitish symptoms facilitates disease detection, though it impedes their differentiation.
- In proximal sensing, more detailed spectral information and higher spatial resolution enable the differentiation of whitish disease symptoms.
Abstract
Diseases like downy mildew (DM) and powdery mildew (PM) are characterized by whitish symptoms on leaves of many plant species. Hyperspectral imaging (HSI) has been successfully used for the detection and identification of various diseases associated with different symptoms. Proximal HSI (400–1000 nm) was tested under controlled conditions for its potential to differentiate among whitish disease symptoms on leaves of apple and grapevine due to DM, PM, and a non-melanized mutant of apple scab at the leaf and tissue (microscopic) level. Spectral traits were analyzed by using difference spectra and spectral ratios, spectral vegetation indices like NDVI, and average brightness and half NIR increase introduced here and were confirmed by supervised spectral angle mapper classification. Although similar, spectral signatures of whitish symptoms were significantly different and could be used for spectral separation of diseases; differences were greater on the tissue level than on the leaf level. However, disease detection and differentiation were affected by spectral differences between plant species, leaf sides, the variability of symptoms in space and time, and the integrity of superficial pathogen structures. In the case of similar disease symptoms, additional spectral information on the effects of pathogens on plant metabolism, e.g., leaf water patterns, supports spectral differentiation of leaf diseases.
1. Introduction
Plant diseases may cause severe economic losses in crop production and often have to be controlled [1,2]. The potential of hyperspectral imaging (HSI) for the detection and monitoring of diseases has been reviewed several times in recent years [3,4,5,6]. These sensor systems should facilitate and promote disease monitoring in crop production (under field and controlled conditions) as well as disease rating in phenotyping approaches of breeding for disease resistance and in investigations of host–pathogen interactions in basic research.
HSI has proven to be suitable for the detection, identification and quantification of leaf diseases differing in typical symptoms due to various pathogen species [7,8,9], due to isolates of a pathogen species [10] and for host plant cultivars differing in compatibility with the pathogen [11,12,13]. Differentiation among relevant diseases and disease identification rely on disease-specific spectral signature(s) of symptoms, which ideally should be unique. However, typical symptoms of plant diseases have more than one spectral signature as (I) symptoms develop during pathogenesis from early through mature to late symptoms, and (II) there is a spatial and spectral continuum from healthy tissue to the site of strongest pathogen effects on plant tissue often located at the site of original tissue penetration—at least at the leaf and tissue level [7]. Bohnenkamp et al. [14] established a spectral library for five wheat leaf diseases, including powdery mildew, strongly differing in symptoms at three stages in pathogenesis. In contrast, it is not known whether HSI is able to differentiate among diseases with similar—e.g., whitish—symptoms caused by biotrophic pathogens, i.e., without producing necrotic tissue in compatible interactions. Recent advances in deep learning have further expanded the capabilities of hyperspectral image analysis. For instance, multi-scale autoencoder strategies have shown promise for anomaly detection in hyperspectral images by suppressing background while enhancing target features [15].
Whitish spots on the leaf surface may be symptoms of powdery mildew, downy mildew, white rust and other—less common—leaf diseases. A common feature of these leaf diseases is that typical symptoms are not caused by modifications of host plant cells, but by (structures of) the biotroph pathogens themselves: (I) epiphytotic mycelium and conidia of powdery mildew fungi from phylum Ascomycota occurring on both leaf sides; (II) sporangiophores and sporangia of downy mildew pathogens from phylum Oomycota, order Peronosporales, on leaf sides with stomata; (III) chains of sporangia of white rust pathogens from Oomycota, order Albuginales, breaking through the epidermal layer (on both leaf sides); (IV) hyaline conidia (and conidiophores) of the non-melanized isolate SW01 of the ascomycetous apple scab fungus Venturia inaequalis penetrating the cuticle from inside out in a highly localized manner [16].
The hyaline (=without pigmentation) pathogen structures involved in whitish symptoms vary depending on the causal organism (Table 1). As biotroph organisms, the pathogens’ infections do not kill leaf tissue, which remains green—at least at the disease stages investigated in this study.
Table 1.
Characteristics of four pathogens causing leaf diseases of apple and grapevine.
Downy mildew (DM) of grapevine is characterized by the formation of long sporangiophores of Plasmopara viticola (Berk. & M.A. Curt.) Berl. & de Toni protruding from stomata and bearing sporangia in groups of three at the top of branches [17]. Sporulation requires induction by a spell of high relative humidity (RH): under dry conditions, oil spot symptoms may occur on the adaxial leaf side. Downy mildew symptoms associated with sporulation are typically confined to the leaf side harboring stomata—in broadleaf species often the abaxial side—but may also occur on the leaf side with rudimentary stomatal openings, like in grapevine [12]. Other downy mildew symptoms like adaxial oil spots were not considered in this study.
Powdery mildew (PM) is associated with chains of conidia (varying from one to many conidia) and extensive superficial hyphae with appressoria required for the formation of haustoria within epidermal cells. Podosphaera leucotricha (Ellis & Everh.) E.S. Salmon (anamorph Oidium farinosum Cooke), causal agent of apple PM, produces conidia in chains; Erysiphe necator Schw. (anamorph Oidium tuckeri Berk.), causal agent of grapevine PM, produces one conidium per day, and chains of conidia occur only in the absence of wind currents [17,18].
Apple scab is characterized by the formation of conidiophores of Venturia inaequalis (Cooke) G. Winter (anamorph Spilocea pomi Fr.:Fr.) penetrating the cuticle and bearing a single conidium; epicuticular mycelium is rare; in later stages, dislodged conidia may accumulate to form a fluffy layer on the surface [18,19]. White scab (WS) is caused by a non-melanized mutant of V. inaequalis limited to lab conditions [16].
Diseases with whitish symptoms may occur on the same leaf, e.g., downy mildew and powdery mildew of grapevine and powdery mildew and white scab of apple. Hyperspectral information has been used for the assessment of these diseases, but without comparing the different whitish diseases. The effects of powdery mildew on spectral characteristics of leaves have been studied in several host plants including wheat, sugar beet, cucumber, lettuce, and rubber tree [4,7,20,21,22,23] as well as in bunches of grapevine berries [24,25]. Powdery mildew increased reflectance in the range 400–700 nm and increased or reduced reflectance in the NIR range. The effects on leaf spectra patterns increased with disease severity and were consistent on leaf and canopy levels.
Downy mildew also occurs on several plant species and has been investigated for its effect on leaf spectra of brassicas, grapevine, lettuce, and watermelon [12,26,27,28,29,30]. Often a shift of reflectance to higher values throughout the range 400–1000 nm is described; however, as only a few studies differentiate between symptoms on the abaxial and adaxial leaf sides (whitish sporulation and chlorotic or necrotic tissue, respectively), other spectral signatures have been described as well. Adaxial symptoms of downy mildew of kimchi cabbage were detected and quantified by a hyperspectral camera mounted on an unmanned aerial vehicle [31].
Apple scab increased reflectance of apple leaves in the visible range and increased or decreased NIR reflectance depending on disease severity [32]. Hyperspectral imaging has also been used for assessing the effect of scab on the quality of apple fruits [33]. In these studies, wild-type brown scab has been considered under field and controlled conditions.
Three diseases causing whitish symptoms—powdery mildew, downy mildew and white scab—on leaves of two plant species—apple and grapevine—were used to investigate whether HSI is able to differentiate between the diseases caused by four pathogens. Disease symptoms were recorded under controlled conditions using HSI setups at two scales: (I) a hyperspectral push broom camera with 0.3 m working distance for recording complete leaves with disease symptoms; (II) a hyperspectral microscope with 0.1 m working distance and 3.2× magnification for single disease symptoms on the leaf tissue. Higher spatial resolution of the sensor system was expected to improve the differentiation of surface elements including pathogen structures forming the disease symptoms. More details on disease symptoms are available on the tissue scale; however, the combination of HSI and microscopy (=additional optical lenses) may be associated with focus problems due to the unevenness of leaf surfaces and the size of pathogen structures >0.1 mm.
Diagnosis of leaf diseases (by the human eye and technical sensors) uses the color and shape of symptoms, most often modifications—discoloration or necrotization—of the plant tissue, which are rather homogenous in the case of plant leaves, and sometimes of pathogen structures. A third component—texture—may be useful when symptom color is identical or similar (to the human eye) and the shape of disease symptoms is highly variable and, hence, not of diagnostic value. On the other hand, pathogen activities may modify the physiological state of diseased plant tissue, which can also be detected by hyperspectral sensors and may be of additional value for differentiation among otherwise similar disease symptoms.
As different plant pathogens may cause similar whitish disease symptoms on the leaves of their host plants, the aim of the present study was to investigate whether HSI sensing is able to differentiate between downy mildew (of grapevine), powdery mildew (of apple and grapevine) and white scab of apple as an additional model disease under controlled conditions. The focal point was to assess spectral differences between disease symptom(s) and healthy tissue within the same leaf, not mean disease-specific spectra (averaged over several leaves), because leaves, plants, genotypes and species considerably differ in physical structure and chemical composition—a situation even complicated by differences in tissue age and growth conditions. Difference spectra (Rsymptom − Rhealthy) of symptoms from PM, DM and WS were compared for their spectral similarity and dissimilarity by using the spectral angle mapper algorithm for supervised classification. At least at high spatial resolution, spectral differences among diseases should indicate pathogen-specific effects linked to the pathogens’ biology.
2. Materials and Methods
2.1. Plant Material
Seedlings of apple (Malus x domestica Borkh., cv. Cripps Pink) were grown in pots (9 × 9 × 8 cm) filled with standard potting mixture (Klasmann-Deilmann GmbH, Geeste, Germany) at 21/17 °C ± 2 °C and 16 h daylight (300 µmol m−2 s−1, Philips SGR 140, Hamburg, Germany) in a growth chamber with 50 to 70% relative humidity (RH). Plants were irrigated and fertilized (liquid fertilizer Flory 2 special, NPK 16 + 9 + 22; Euflor, Schermbeck, Germany) as required. Plants with at least six fully expanded leaves were used for the experiments. The cultivar is highly susceptible to scab (rating 7, on a scale from 1 = highly resistant to 9 = highly susceptible) and moderately susceptible to powdery mildew (rating 5) of apple [34].
Plants of grapevine (Vitis vinifera L.) cultivar ‘Mueller-Thurgau’ were grown from green cuttings in standard potting mixture (Klasmann-Deilmann GmbH) in plastic pots (10 × 10 cm, 0.9 L volume) in a greenhouse at 23/20 °C (day/night), 50 to 70% RH and a photoperiod of 16 h (>300 μmol m−2 s−1). Plants were watered as necessary and fertilized before the experiment once with 100 mL of a 0.2% solution of Poly Crescal (Aglukon GmbH, Düsseldorf, Germany). The cultivar ‘Mueller-Thurgau’ is susceptible to downy mildew (rating 7) and powdery mildew (rating 5) of grapevine [35].
2.2. Pathogens and Inoculations
Isolate SW01 (melanin-deficient mutant, GenBank accession number OQ110533) of Venturia inaequalis (Cooke) G. Wint. was cultivated on apple leaves by spraying a conidia suspension onto the leaves and incubating plants at 100% RH for 48 h. Leaves with sporulating scab lesions were stored at −18 °C as inoculum. Isolate SW01 is less aggressive than the wild-type isolate (HS1). Due to differences in the melanin content of conidia, scab symptoms of both isolates on the same leaf can be easily discriminated.
Conidia of V. inaequalis were washed off the stored leaves with tap water, passed through two layers of cheese cloth and adjusted to a conidia concentration of 1.0 × 10⁵ conidia mL−1 using a Fuchs–Rosenthal hemacytometer. Apple leaves were spray-inoculated (0.5 mL per leaf) using a commercial hand sprayer. After incubation at 100% RH for 48 h, RH was reduced to 50 to 70% until the end of the experiments.
Podosphaera leucotricha (Ellis & Everh.) E.S. Salmon, causal agent of apple powdery mildew, was cultivated on susceptible apple plants in a special greenhouse chamber devoted to the cultivation of powdery mildew fungi. Young apple plants (with >6 leaves) were inoculated with the pathogen by shaking off conidia from heavily infected older plants.
Erysiphe necator Schwein., causal agent of grapevine powdery mildew, was cultivated on susceptible grapevine plants (cv. ‘Mueller Thurgau’) in a special greenhouse chamber devoted to the cultivation of powdery mildew fungi. Young grapevine plants (with >6 leaves) were inoculated with the pathogen by shaking off conidia from heavily infected older plants.
Sporangia of Plasmopara viticola (Berk. & M.A. Curtis) Berl. & De Toni produced on the abaxial side of grapevine leaves of cultivar ‘Mueller Thurgau’ and stored at −18 °C were washed from leaves with water containing 0.1% Tween 20, adjusted to a concentration of 5 × 10⁴ mL−1 and sprayed onto the abaxial side of grapevine leaves (1.2 mL per leaf) by turning the plants upside down during spraying. Plants were incubated for 24 h at 100% RH; subsequently, they were grown at 60% RH. Inoculation of the adaxial leaf side was done in a similar way.
For each disease, leaves of 4 to 5 plants were inoculated with the compatible pathogen. After the period of incubation under 100% RH as specified above, inoculated plants were grown under the same growth conditions as before inoculation. Plants inoculated with powdery mildew pathogens did not require specific incubation conditions for successful infection. After the appearance of first symptoms, generally 6–8 days after inoculation, plants with leaves having a suitable level of infection were selected for image recording. For the generation of typical symptoms of downy mildew, sporulation of P. viticola was induced by incubating grapevine plants at 100% RH for 14 h (18:00 to 8:00).
2.3. Visual Assessment of Disease Symptoms
Symptoms of downy mildew of grapevine, powdery mildew of grapevine and apple, and white scab of apple were assessed on leaves of inoculated plants in regular intervals starting 5 days post inoculation (d p.i.). For the induction of P. viticola sporulation, infected plants were incubated for 14 h (7:00 pm to 9:00 am) at 100% RH. Disease symptoms were recorded for adaxial and abaxial leaf sides. The severity of diseases symptoms was assessed as percentage leaf area covered by pathogen structures on a scale 0, 1, 3, 5, 10, 20, …, 100%.
2.4. Hyperspectral Imaging on Leaf and Tissue Scale
2.4.1. Recording Setups
On the macro (=leaf) scale, the HSI system included a spectral line scanner (ImSpector V10E, Spectral Imaging Ltd., Oulu, Finland) with spectral range 400 to 1000 nm (VIS and NIR) and 0.7 nm spectral resolution. An effective slit length of 11.84 mm and 1600 pixels per line result in a sensor pixel size of 7.4 µm. The camera objective had focal length 23 mm and FOV 28.9°. A distance of 0.30 to 0.40 m between leaf surface and objective resulted in a spatial resolution of 0.11 to 0.13 mm per pixel. Spectral binning 4 gave a spectral resolution of 2.8 nm (212 bands).
Three ASD-Pro-Lamps (Analytical Spectral Devices Inc., Boulder, CO, USA) on each side of the camera provided a near-solar light spectrum and gave even illumination of the scene. Camera and lamps were arranged on a motorized line stage (SP-X-Stage-Dual2, Spectral Imaging Ltd.), which moved the recording system above the plants. Camera and line stage were controlled by SpectralCube software v0.6.7 (Spectral Imaging Ltd.). During HSI measurements, the leaves of interest were fixed between two grids (mesh size 30 × 40 mm) of black fibers to support the leaves from below and to smooth them from above, which were positioned 30 cm above a black plastic tray. The pots and the supporting system were placed on a motorized table in order to vertically adjust the distance between objective and leaves.
On the micro (=tissue) scale, a spectral line scanner (ImSpector V10E, Spectral Imaging Ltd., Oulu, Finland) was mounted on a stereo microscope foreoptic (Z6 APO, Leica, Wetzlar, Germany) equipped with an OLE-23 lens (Spectral Imaging Ltd., Oulu, Finland). Spectral resolution was 2.8 nm (212 wavebands, 400–1000 nm). A single leaf attached to the potted plant was positioned flat on a XY-motorized table (H105 ProScan Upright Stage, Prior Scientific, Jena, Germany), which was moved below the optical system, resulting in the recording of spectral data cubes. The working distance between leaf tissue and optical lens was 100 mm; 3.6-fold magnification resulted in a spatial resolution of 6.3 µm per pixel and a maximal image size of 10 × 14 mm. Two linear line lights attached to a 150 W cold light source (Schott, Mainz, Germany) via a non-absorbing fiber (DCR Light Source EKE, Polytec, Waldbronn, Germany) provided homogenous illumination. Raw spectra were recorded using the software Lumo Recorder v. 1.4 (Spectral Imaging Ltd.).
2.4.2. Data Recording
As the surface of leaves had to be without droplets of water for data recording, grapevine plants had to dry off after the induction of P. viticola sporulation. Hyperspectral data were recorded in darkened rooms in order to realize optimal and reproducible illumination. Instruments were warmed up for 30 min before measurements were taken to maintain constant and reproducible illumination and constant sensitivity of the sensor unit. A set of four images per object were taken in order to allow the calculation of reflectance values: (I) a white reference bar (Spectral Imaging Ltd. and Zenith Polymer Target, SphereOptics GmbH, Herrsching, Germany, for macro and micro scale, respectively) with horizontal size and vertical level similar to the object area; (II) dark current image recorded by closing an internal camera shutter; (III) image of the object area of interest with optimized exposure time; and (IV) dark current image of the same area.
2.4.3. Processing of Hyperspectral Data
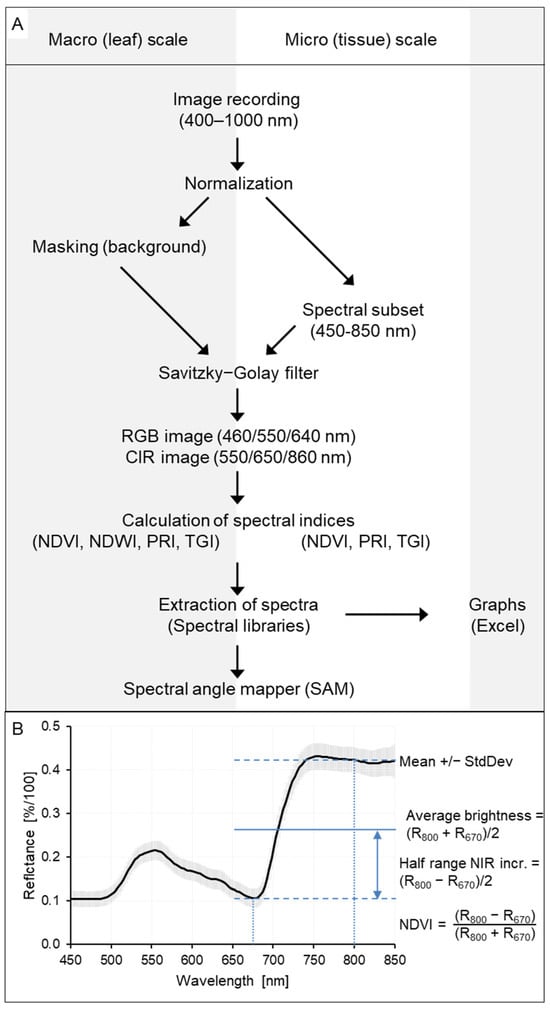
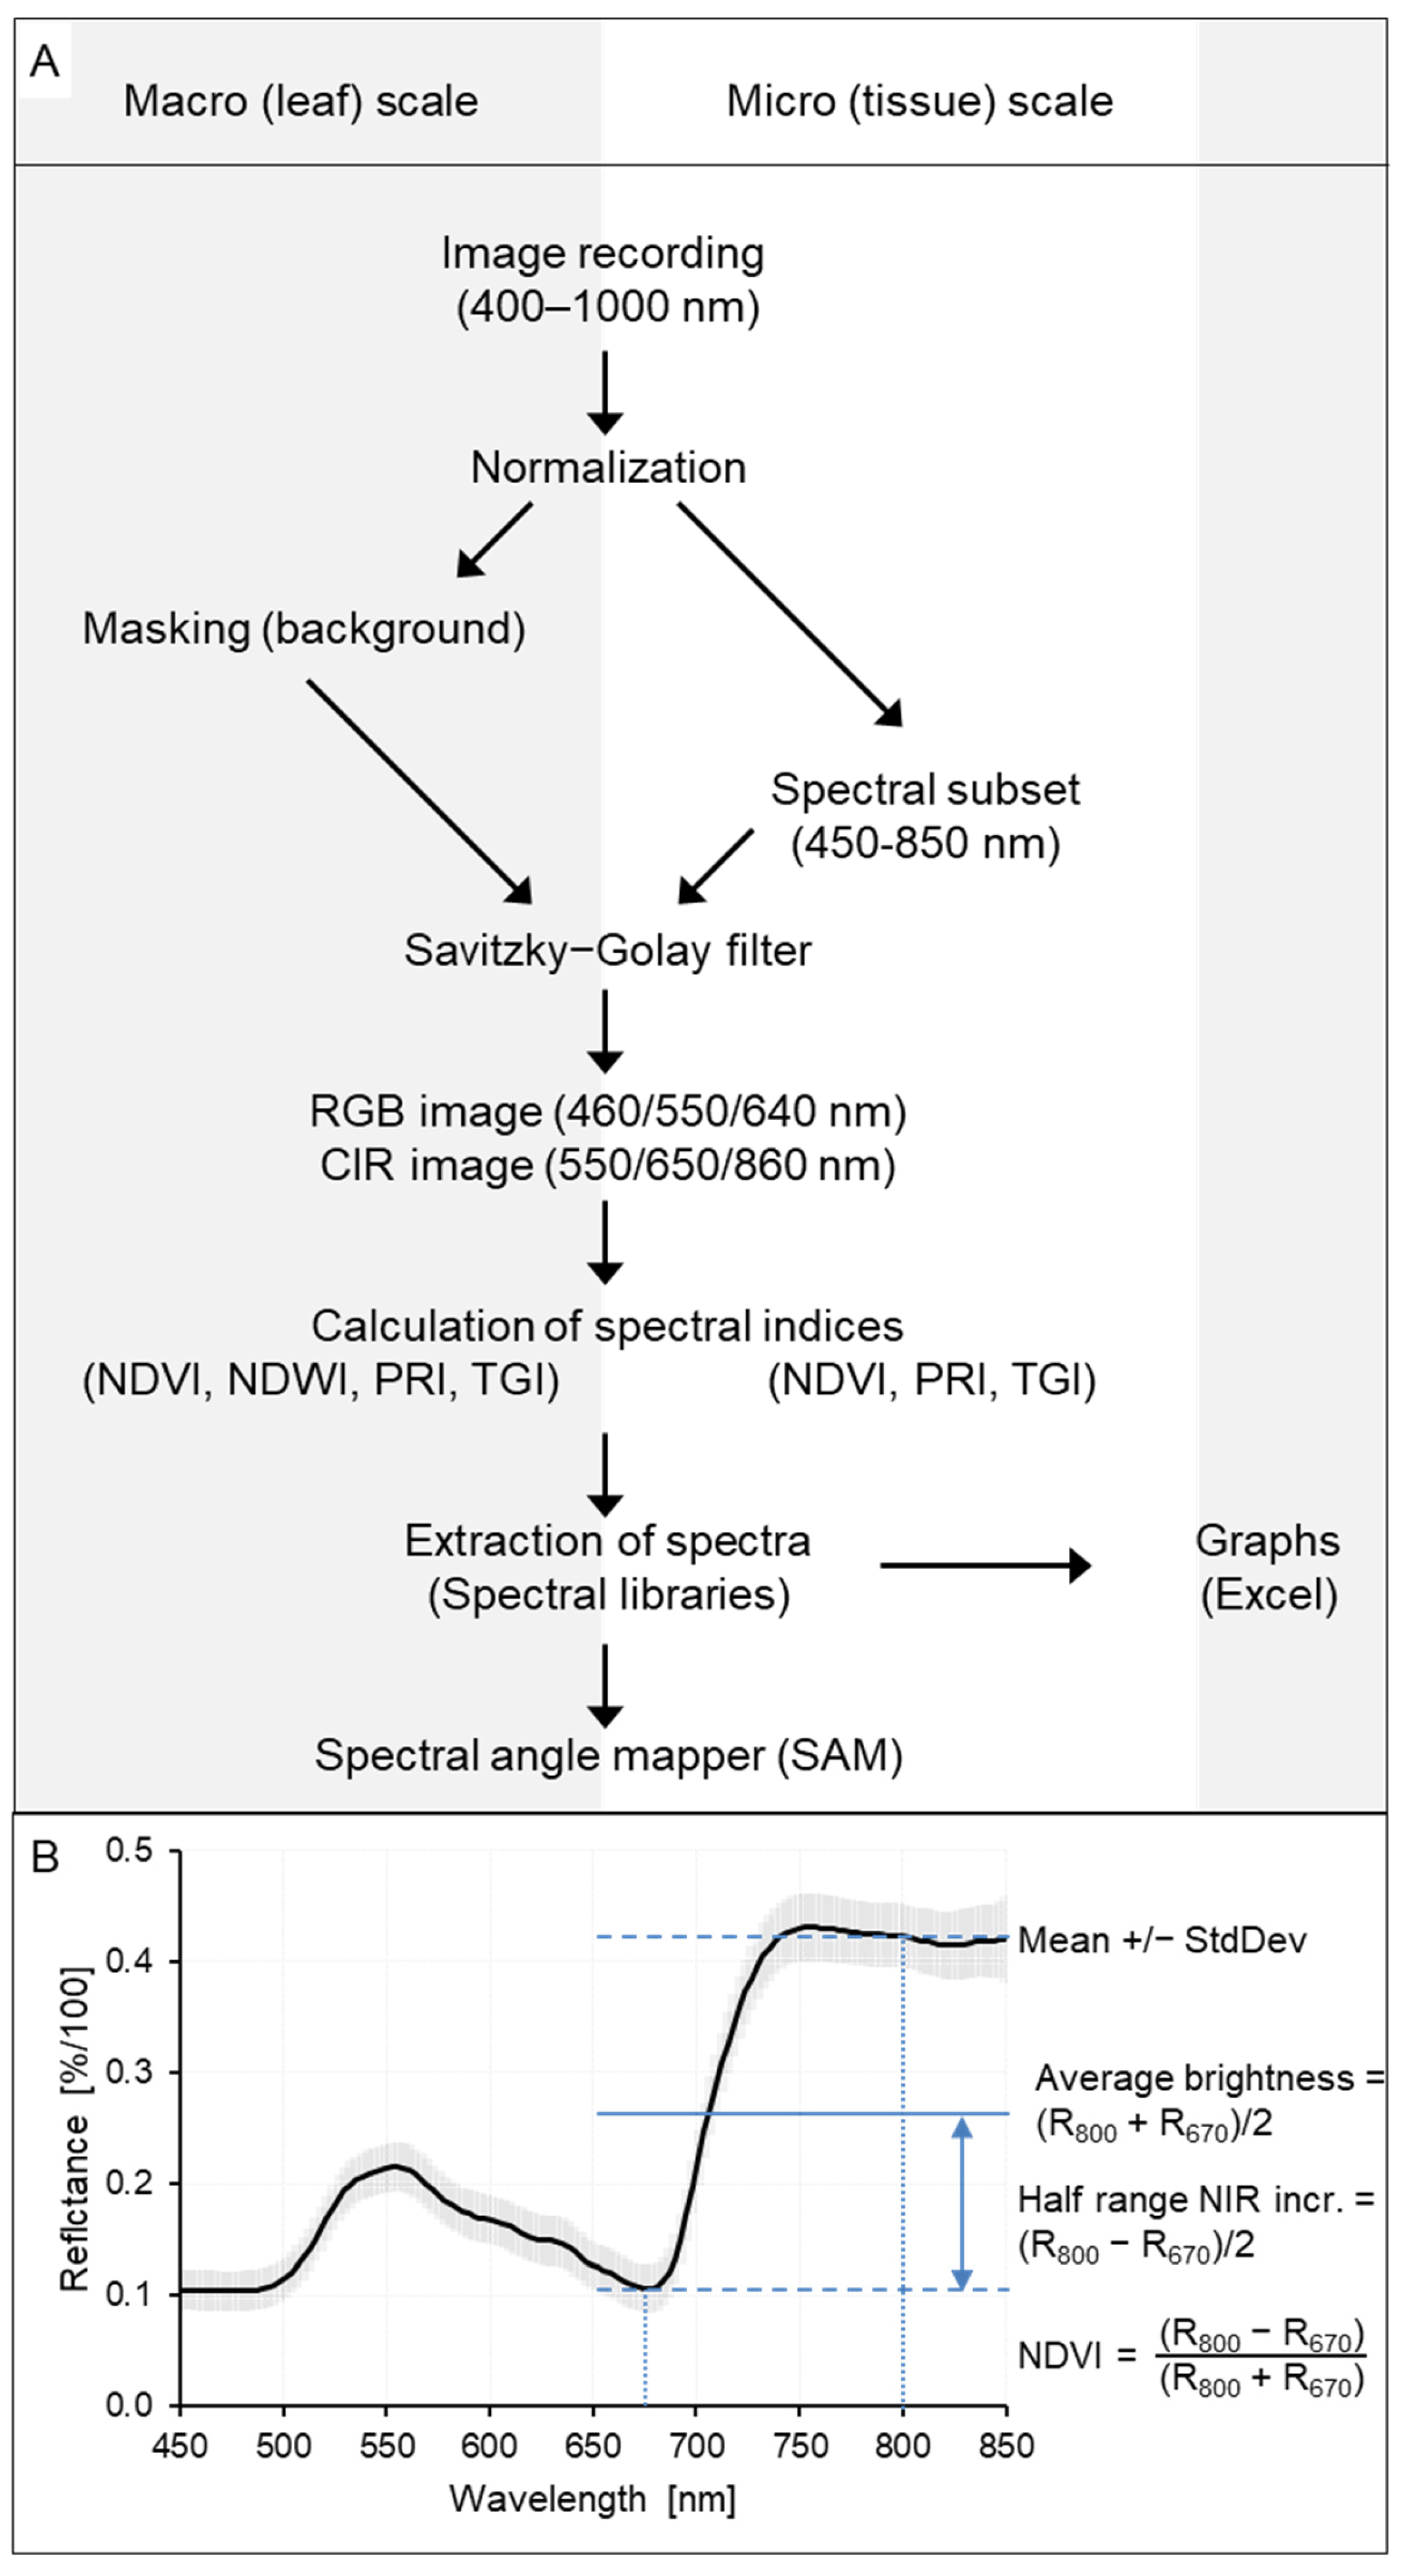
The workflow of data recording, processing and usage is summarized in Figure 1A. RGB images from hyperspectral data included wavebands 460 nm, 550 nm, and 640 nm, whereas color-infrared (CIR) images included wavebands 550 nm, 650 nm, and 860 nm.
Figure 1.
Workflow of hyperspectral data processing using ENVI/IDL (A); most important characteristics of spectral signatures and calculation of average brightness and half range of spectral increase in the NIR range (B).
Preprocessing. The raw image data (reflection values for 212 wavebands) were converted into spectral reflectance images using the software ENVI 5.1 + IDL 8.3 (ITT Visual Information Solutions, Boulder, CO, USA). Data from the four images of an object were imported and normalized by a customized IDL tool (GEOSCAP, Cologne, Germany) according to the following formula:
where Robj(x,y, λ) represents the reflectance at a specific spatial position (x,y) and wavelength λ. Iobj/light and Iobj/dark denote the intensities of reflection from the object of interest with and without illumination, respectively, whereas Iwhite/light and Iwhite/dark represent the equivalent reflection intensities of the white reference.
Robj(x,y,λ) = [Iobj/light(x,y,λ) − Iobj/dark(x,y,λ)]/[Iwhite/light(x,y,λ) − Iwhite/dark(x,y,λ)]
For data from the micro level, the spectral range was limited to 450 to 850 nm (=141 wavebands, bds. 21 to 160) because of a poor signal-to-noise ratio for shorter and longer wavelengths. Subsequently, the Savitzky–Golay filter [36] was applied to smooth spectral information with three supporting points to both sides and a second-degree polynomial.
Difference spectra and reflectance ratios. In order to investigate the effect of disease symptoms on the spectral signature of leaf tissue irrespective of plant species, leaf status (age, nutrient status) and environmental conditions during data recording, difference spectra (=Rsymptom − Rhealthy) and reflectance ratios (=Rsymptom/Rhealthy) were calculated for each wavelength. For comparisons of spectral information (=shape of spectral signature independent from the level of average reflectance) from different plant species and leaf sides, spectra were normalized to the highest reflectance value.
Spectral vegetation indices. Spectral vegetation indices characterizing the status of plant tissue were calculated for the image pixels by applying band ratios developed for remote sensing of vegetation. The relationship between reflectance at 670 nm (red, absorbance by chlorophyll of the photosynthetic apparatus) and 800 nm (infrared, reflection of irradiation unsuitable for photosynthesis by tissue) was characterized by three indices. The Normalized Difference Vegetation Index (NDVI = (RNIR − Rred)/(RNIR + Rred)) is used in remote sensing of plant cover [37]. As white disease symptoms increases leaf reflection throughout the range 400 to 1000 nm, the average brightness of leaf tissue and a metric for the relation between NIR and VIS reflectance were calculated by using the non-normalized indices useful for comparisons of regions within the same image (Figure 1B: Average brightness of spectrum, (R800 + R670)/2); and half range of NIR increase, (R800 − R670)/2).
The Photosynthetic Reflectance Index [38], calculated as PRI = ((R531 − R570)/(R531 + R570), was used for visualization of spatial patterns of radiation use efficiency [39]. The Triangular Greenness Index, TGI = −0.5 [190 (R670 − R550) − 120 (R670 − R480)] [40], was calculated to estimate the chlorophyll content of tissue; it was not normalized and proved to be sensitive to irradiation differences. The Red Edge Inflection Point (REIP) of spectra was calculated according to REIP = 700 +40(((R670 +R780)/2 − R700)/(R740 − R700)) [41]. The Water Index, WI = R900/R970 nm, described by Peñuelas et al. [42] was modified to a normalized difference index by calculating the Normalized Difference Water Index NDWI970 = ((R900 − R970)/(R900 + R970).
Spectral angle mapper classification. For supervised classification of spectral information, the spectral angle mapper (SAM) algorithm was applied [43,44]. SAM calculates the spectral angle between the spectrum of each pixel and reference spectra from a spectral library by treating them as vectors in a dimensionality that equals the number of bands. The size of the manually marked regions of interest (ROIs) for the different tissue types varied depending on the area size of healthy tissue, leaf vein and disease symptoms and typically was in the range 200–3500 pixels for non-infected tissue, 75–500 pixels for downy mildew, and 150–1000 pixels for powdery mildew and white scab (irrespective of the scale); exemptions are noted in the results. The smaller the angle, the higher the similarity between the pixel spectrum of interest and reference spectrum. SAM assigns all pixels to the reference components or leaves them unclassified. The classification converts the information of the spectral image into a false color image; non-classified pixels are represented in black. SAM is relatively robust to changes in illumination conditions and the supervised classification algorithm has the advantage that classes (=endmembers) to be included in data analysis are predefined. Image pixels were categorized as belonging to the endmembers healthy (green) tissue and symptoms of downy mildew (DM), powdery mildew (PM), and white scab (WS) differing in intensity (sparse, medium or dense cover of plant tissue by pathogen structures, respectively, according to the operator’s visual evaluation). When appropriate, an additional class ‘leaf vein’ was added.
SAM was used to demonstrate representativeness of the spectra chosen and for illustration of spectral (dis)similarity of spectra from various sources (reference spectra, images, plant and pathogen species). Unless stated otherwise, the setting of spectral dissimilarity accepted for classification (SAM value) was 0.1. The spectral angle value was varied for the same image in order to demonstrate the degree of spectral similarity among various stages of the disease (symptom).
2.5. Statistical Analysis
For statistical analysis, individual leaves were used as the experimental unit (n = 4). Data were analyzed statistically by using R (vers. 12.0 + 467) [45]. In case of non-normality (according to Shapiro–Wilk test) or heteroscedasticity (according to Levene’s test), data were transformed using x’ = sqrt(x). For normally distributed data, one-way ANOVA (effect of diseases on NDWI970) and two-way ANOVA (effects of diseases and scale on NDVI, REIP, average brightness and half range of NIR increase) were performed. For significant F-values, mean comparisons—Tukey–Kramer test and Scheffé test—were performed using a significance level of p ≤ 0.05. t-test statistics (significance level p ≤ 0.05) were applied to detect significant differences between healthy and infected leaves. All experiments were conducted in biologically independent repetitions at least twice. The data presented in Table 2 and Table 3 as well as in Table S1 are summaries of a series of experiments. Results from three independent experiments on the effects of diseases on spectral vegetation indices at the leaf scale and three experiments on the tissue level have been pooled and analyzed statistically.
3. Results
3.1. Spectral Characteristics of Downy Mildew, Powdery Mildew and White Scab on the Leaf and Tissue Level
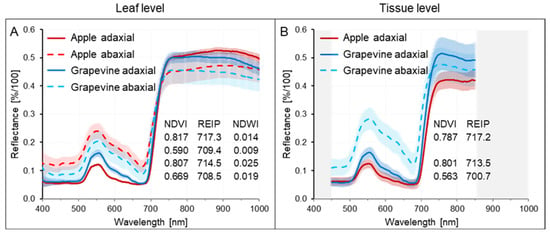
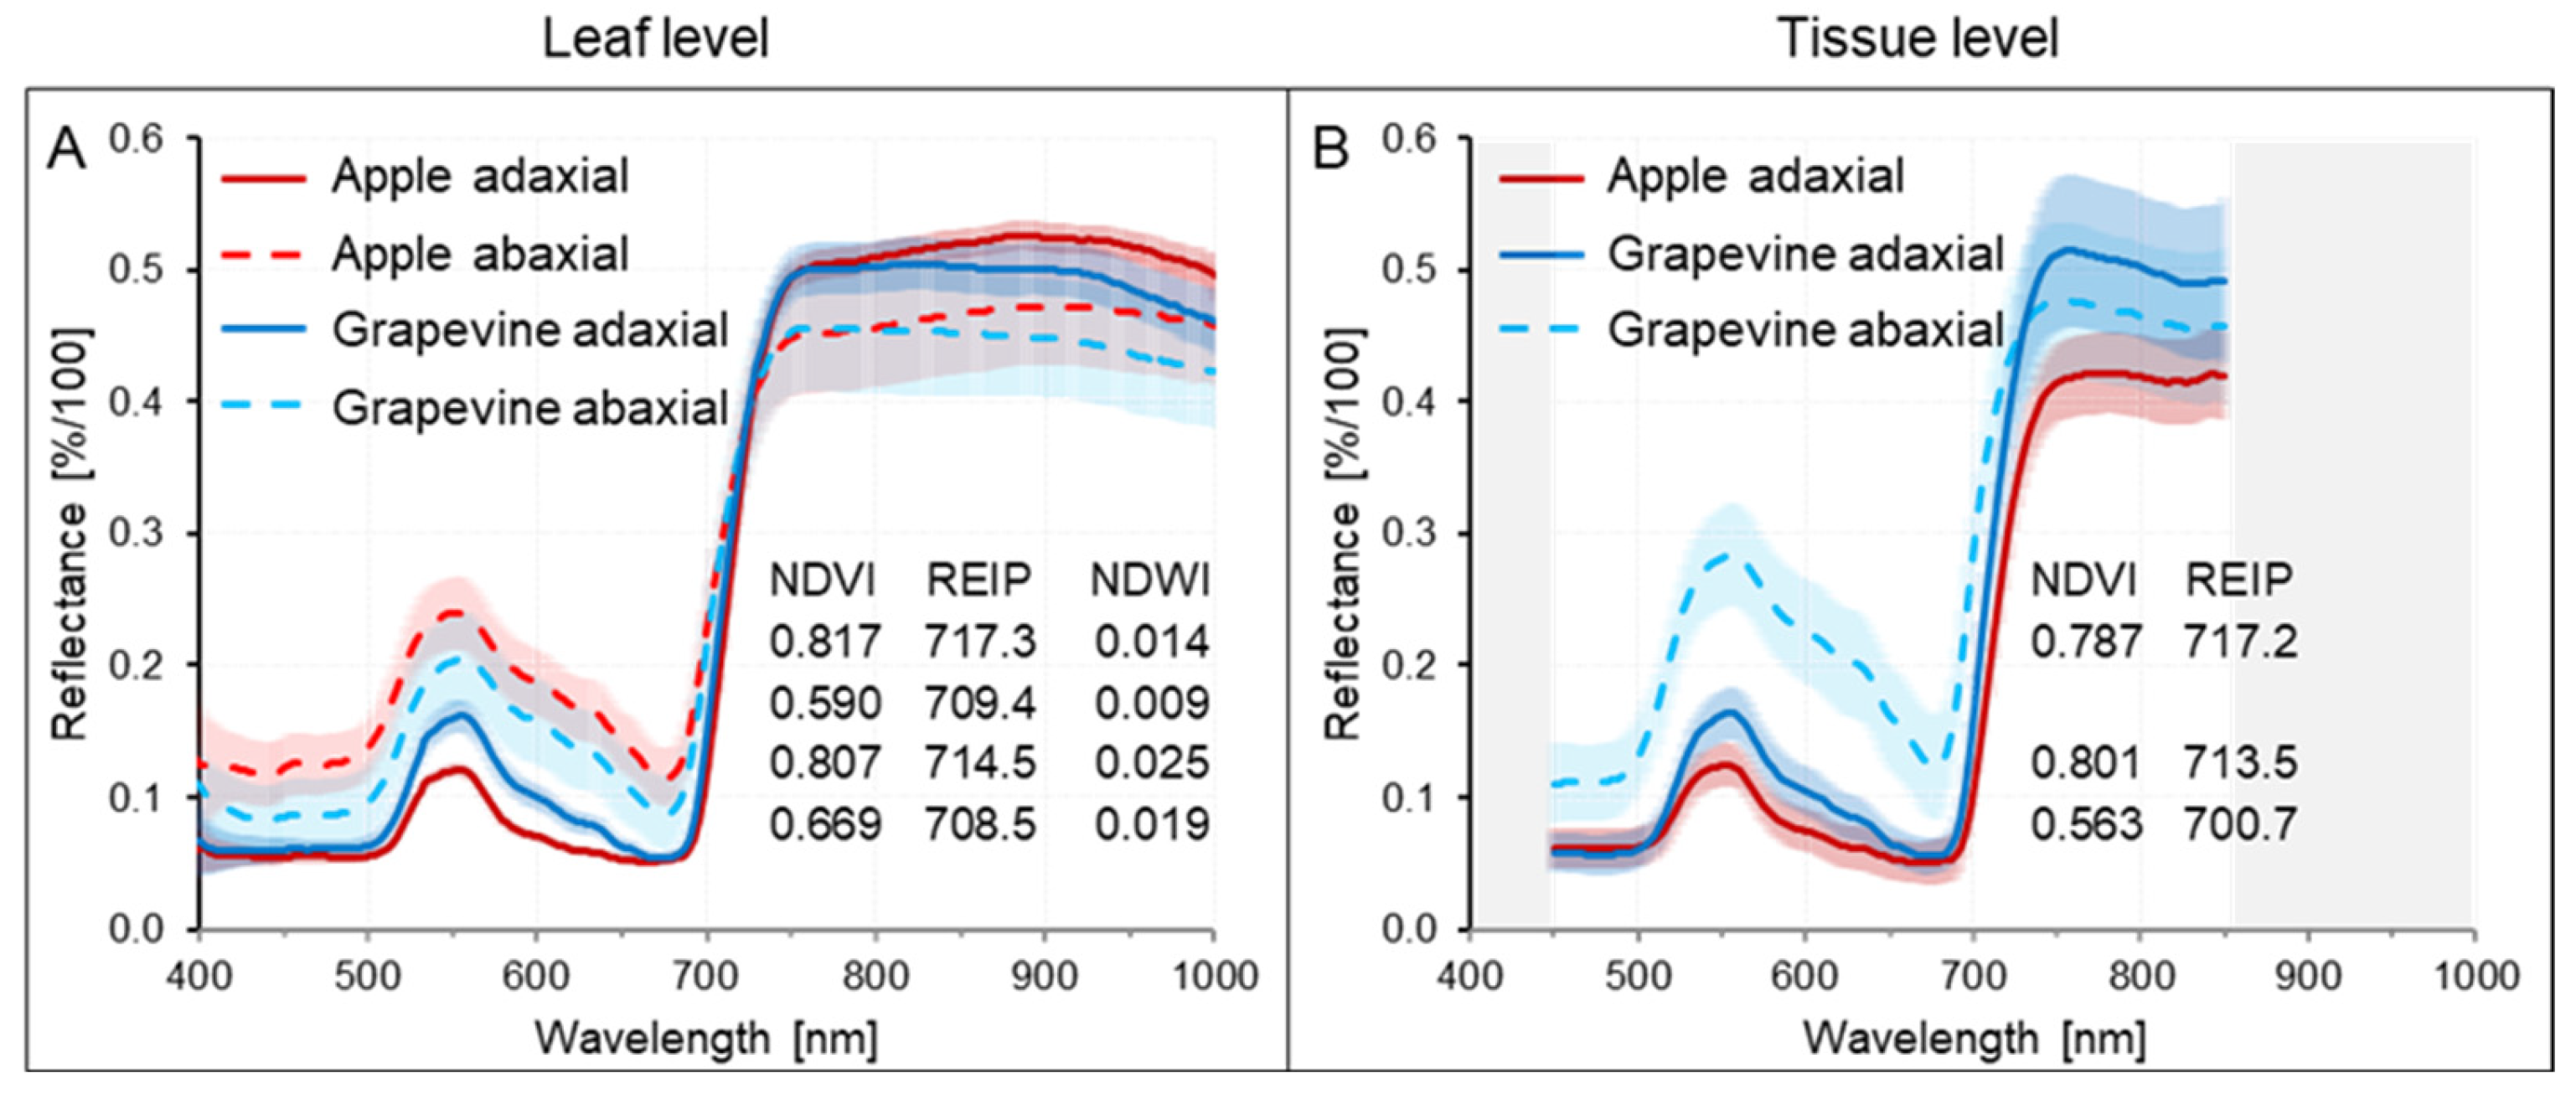
Spectral signatures of non-diseased leaves demonstrated significant differences between apple and grapevine leaves and adaxial and abaxial leaf sides and an effect of recording conditions differing between leaf scale—background within 0.3 m distance—and tissue scale—background directly below the leaf tissue (Figure 2 and Figures S1–S4). However, spectral characteristics, e.g., NDVI and PRI, had rather homogeneous spatial patterns on both scales (Figures S1–S4). NDWI970 values confirmed higher leaf water content of adaxial sides for both plant species.
Figure 2.
Spectral characteristics of non-infected apple and grapevine leaves recorded at leaf (A) and tissue (B) level, respectively. Effects of plant species, leaf side and recording conditions. Data on NDVI, REIP, and NDWI (leaf level only) values highlight similarities and differences between leaf and tissue level.
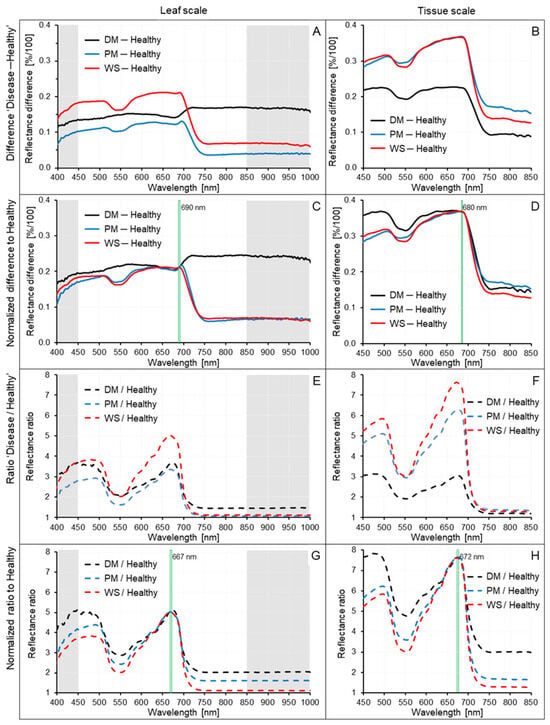
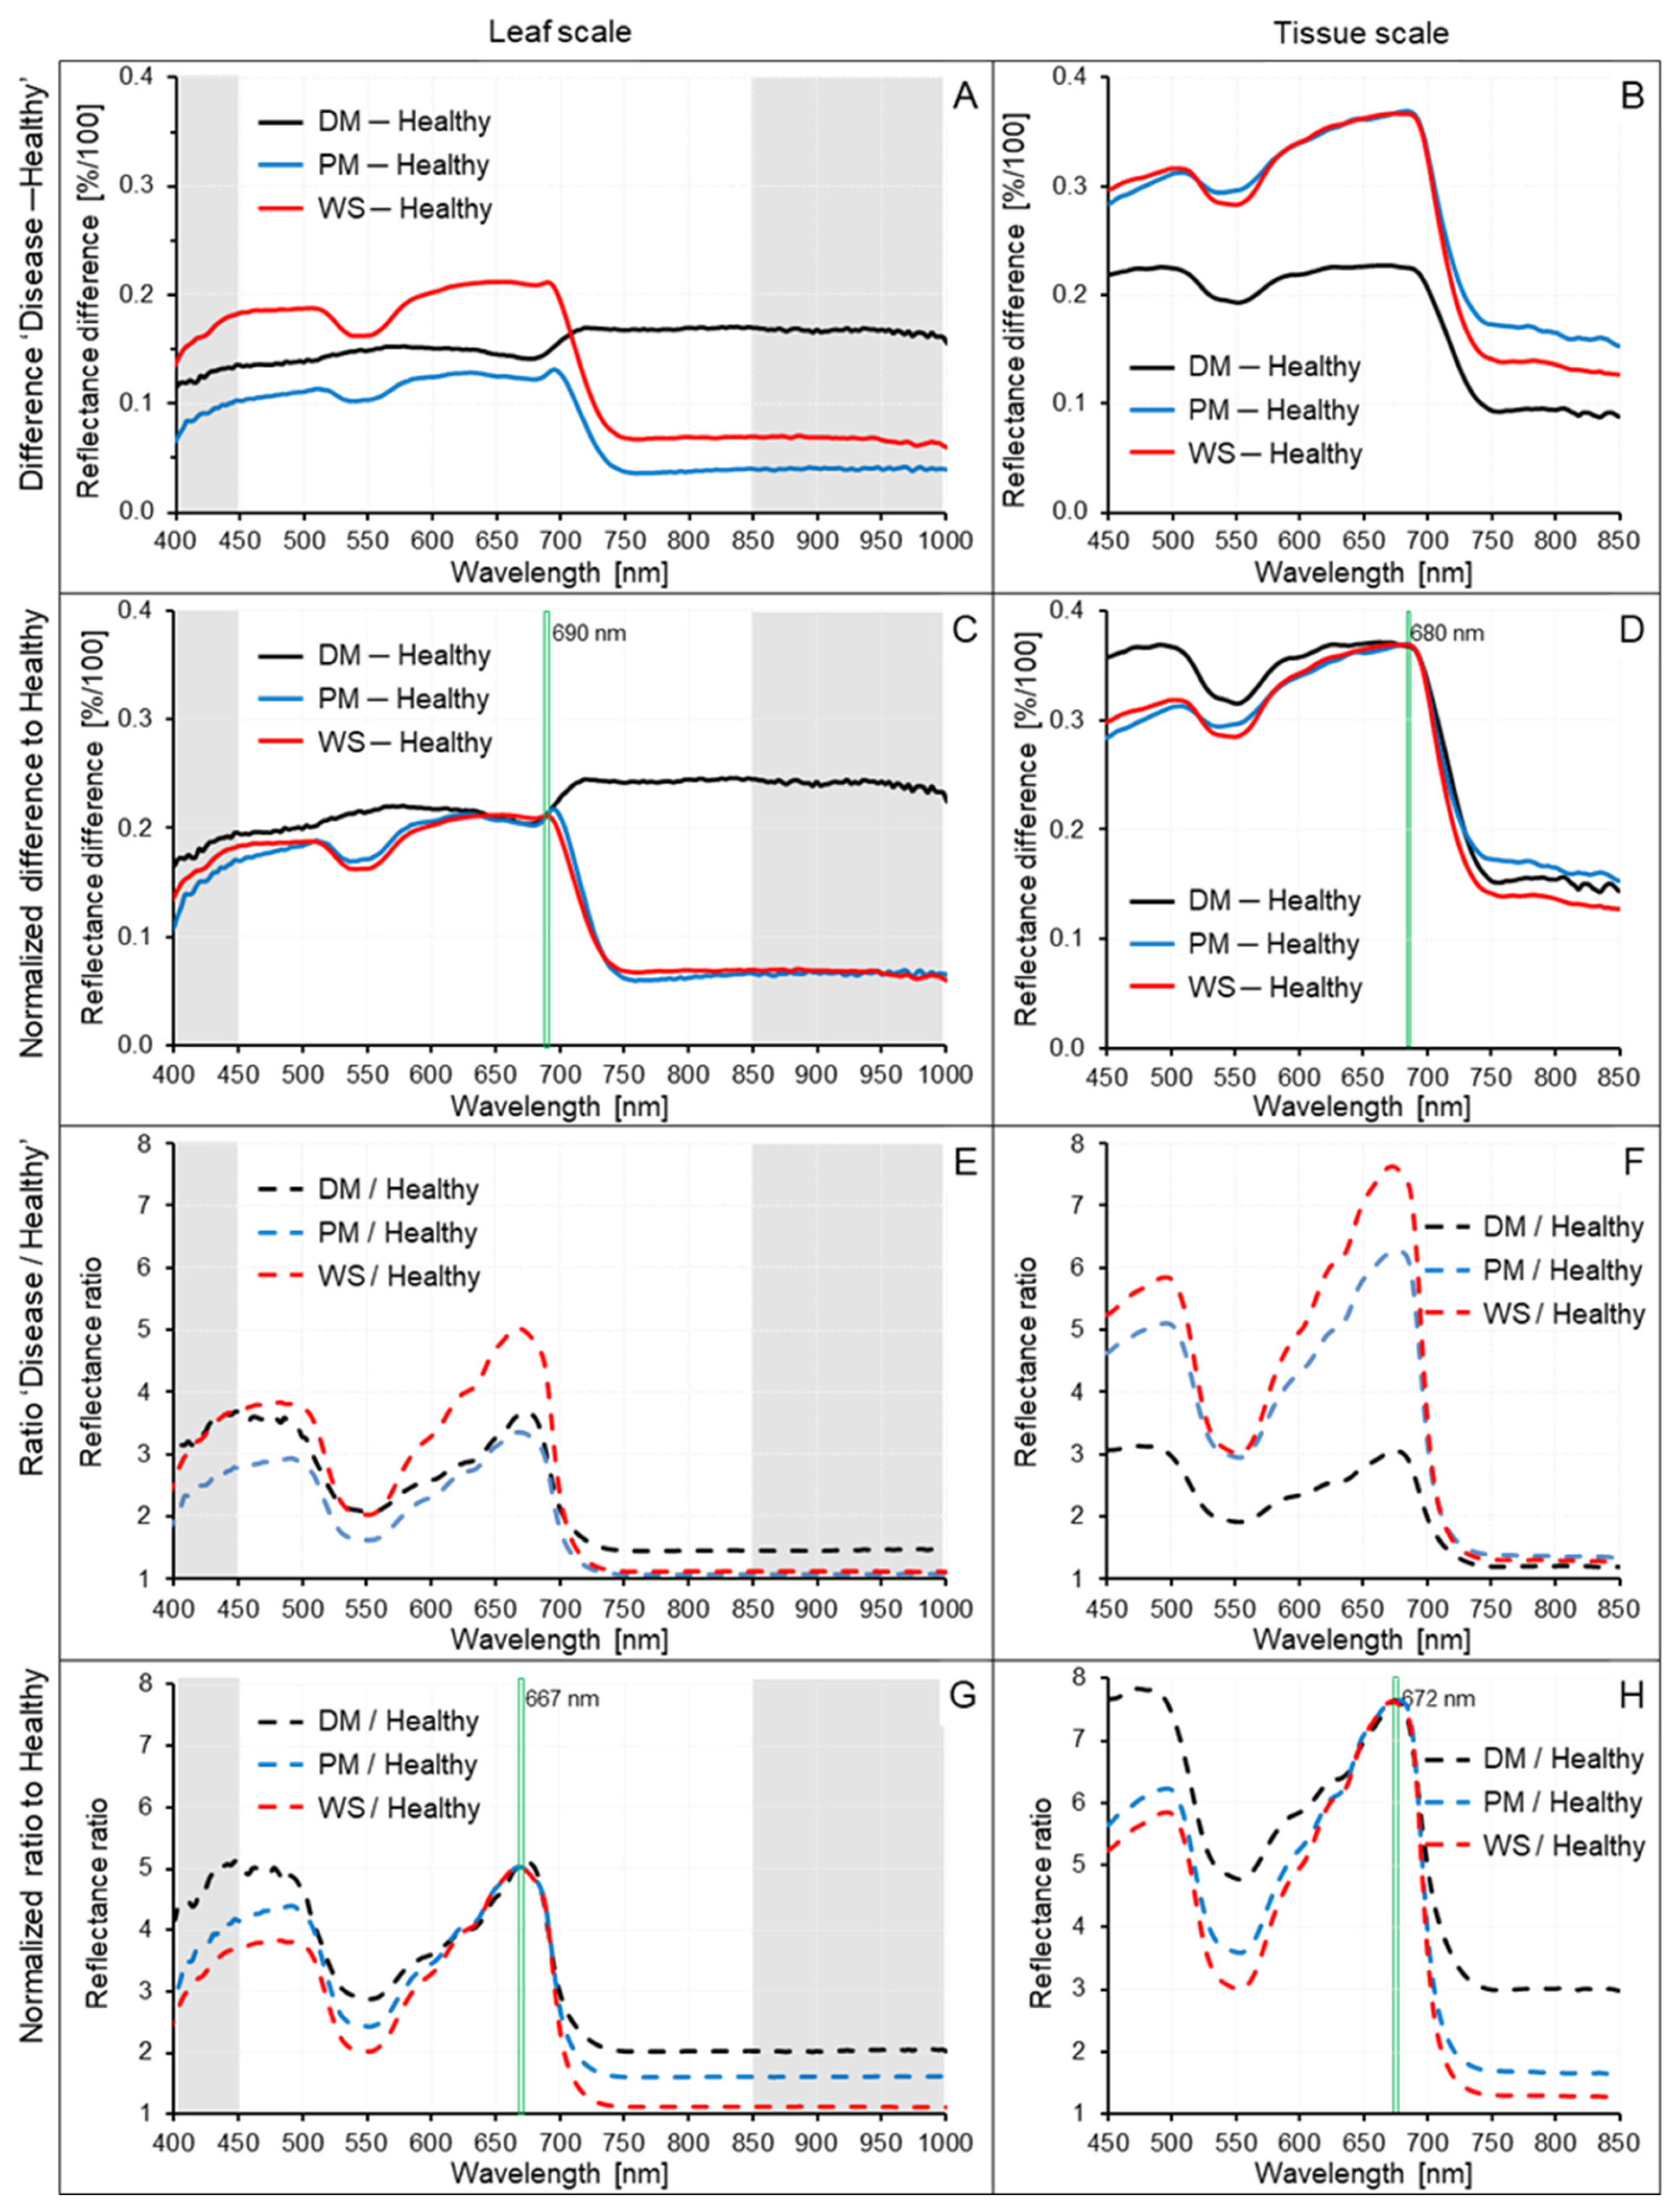
The leaf diseases exhibiting whitish symptoms—powdery mildew and white scab of apple preferentially on adaxial side and downy mildew of grapevine on abaxial side—caused a significant increase in reflectance for the spectrum ranging from 400 to 1000 nm at both imaging scales. For comparison of the effects of the three diseases, Figure 3 includes difference spectra (disease (symptom)—healthy) and spectral ratios (disease (symptom)/healthy); the original reflectance data of healthy and diseased leaf areas are given in Figures S5 and S6. The symptom-induced increase in spectral reflectance was significantly (p ≤ 0.05) higher on the tissue level. On the leaf level, the effect of disease symptoms on spectral characteristics differed, with downy mildew (on the abaxial side of grapevine leaves) resulting in a strong increase in reflectance in the NIR range. Despite similarities with downy mildew in their effects on spectral reflectance, powdery mildew and apple scab resulted in a more pronounced dip in the green range (520–570 nm) and small reflectance increases in the NIR range, with scab being the disease with the strongest effect on spectral differences and spectral ratios.
Figure 3.
Spectral characteristics of the white diseases downy mildew (DM) of grapevine, powdery mildew (PM) of apple, and white scab (WS) of apple. Difference spectra ‘Disease ─ Healthy‘ (A–D) and reflectance ratio ‘Disease/Healthy‘ (E–H) on leaf (A,C,E,G) and tissue (B,D,F,H) level. Normalization of spectral information according to the wavelength with highest reflectance as indicated (C,D,G,H). Gray background indicates the additional spectral range of images recorded on the leaf level. The corresponding reflectance spectra are summarized in Figures S5 and S6.
Index values calculated from the spectra of the symptoms also indicated significant differences in disease effects on spectral characteristics on the leaf and tissue level. White scab increased average brightness and reduced the half range of spectral increase in the NIR range, with effects stronger than those of mildew diseases (Table 2, Table 3 and Tables S1–S7). As disease-induced increases in reflectance were (relatively) stronger in the visible range than in the NIR range, increased brightness of symptoms was associated with a decrease in the spectral difference between NIR and VIS. This effect was detectable also in NDVI values. The effect on the Red Edge Inflection Point (REIP) was small but consistently negative for all diseases. The index values confirmed the stronger effect of diseases on the tissue level with relative change rates about two times higher.
Table 2.
Effects of diseases and scale of recording on spectral characteristics of grapevine and apple leaves.
Table 3.
Summary of the effects of whitish diseases and recording scale on spectral characteristics of grapevine and apple leaves. Disease effects were quantified as difference to healthy tissue and as percentage change compared to healthy tissue.
3.2. SAM Classification of White Disease Symptoms on Leaf Level and Tissue Level
The spectral angle mapper (SAM) algorithm compares spectral similarity of spectra with reference spectra collected in a spectral library on a pixel basis. The degree of similarity between spectra may be controlled by the SAM value with default setting 0.1. As reference spectra for white disease symptoms like downy mildew included information from >100 pixels differing in spectral details and showed significant standard deviation, a higher SAM value increased the percentage leaf covered by downy mildew and a lower value reduced the diseased area to regions with the most pronounced symptoms (Figure S7A–F). However, the continuum from healthy tissue to tissue with strong (=dense) downy mildew symptoms on top could be characterized better by using two or more reference spectra for the different disease stages (Figure S7G–L). A single spectrum was not sufficient to cover the symptoms of a specific disease at all stages of pathogenesis—early (=sparse) cover of leaf surface, dense cover, and sometimes discolorations of mycelium in late stages.
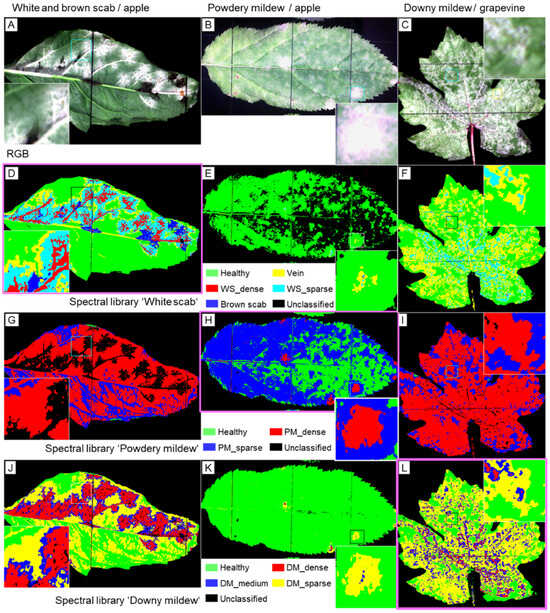
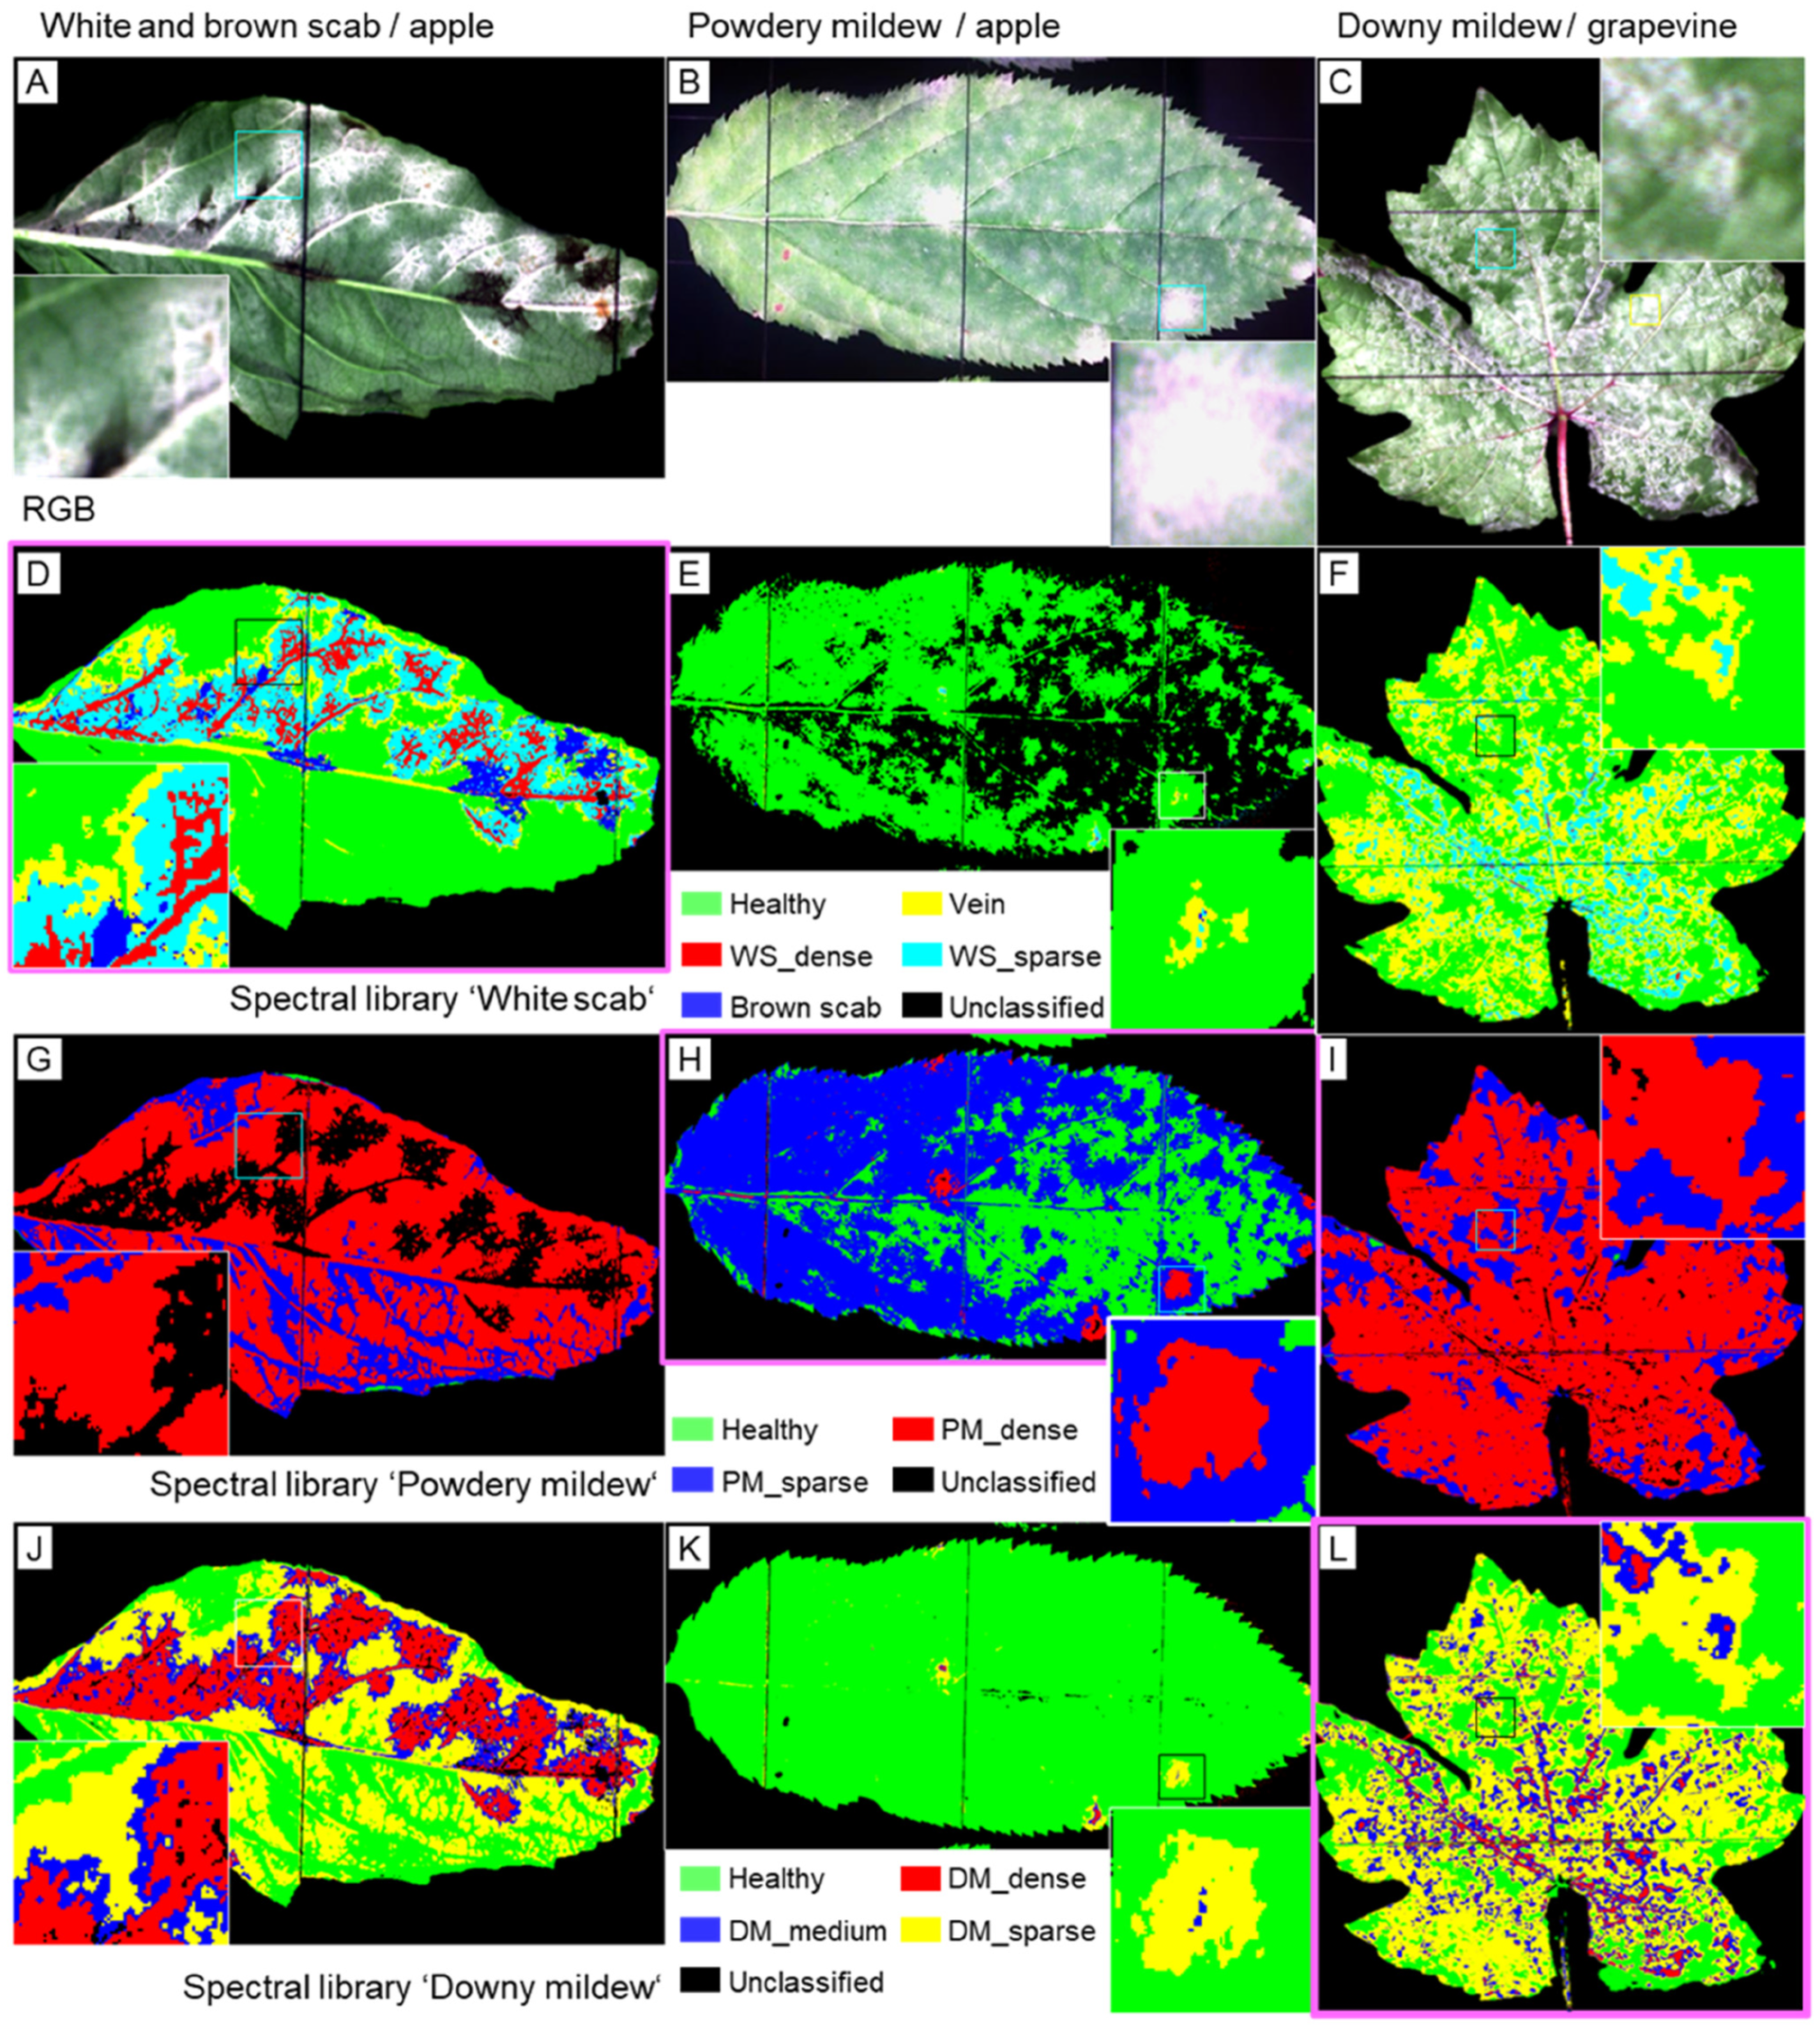
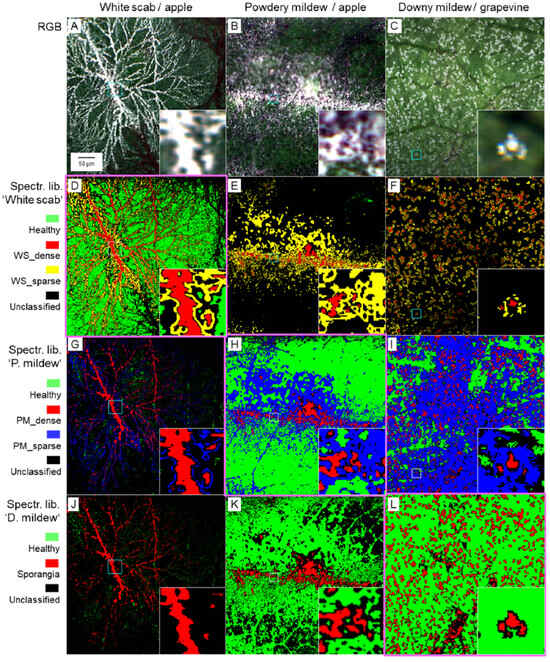
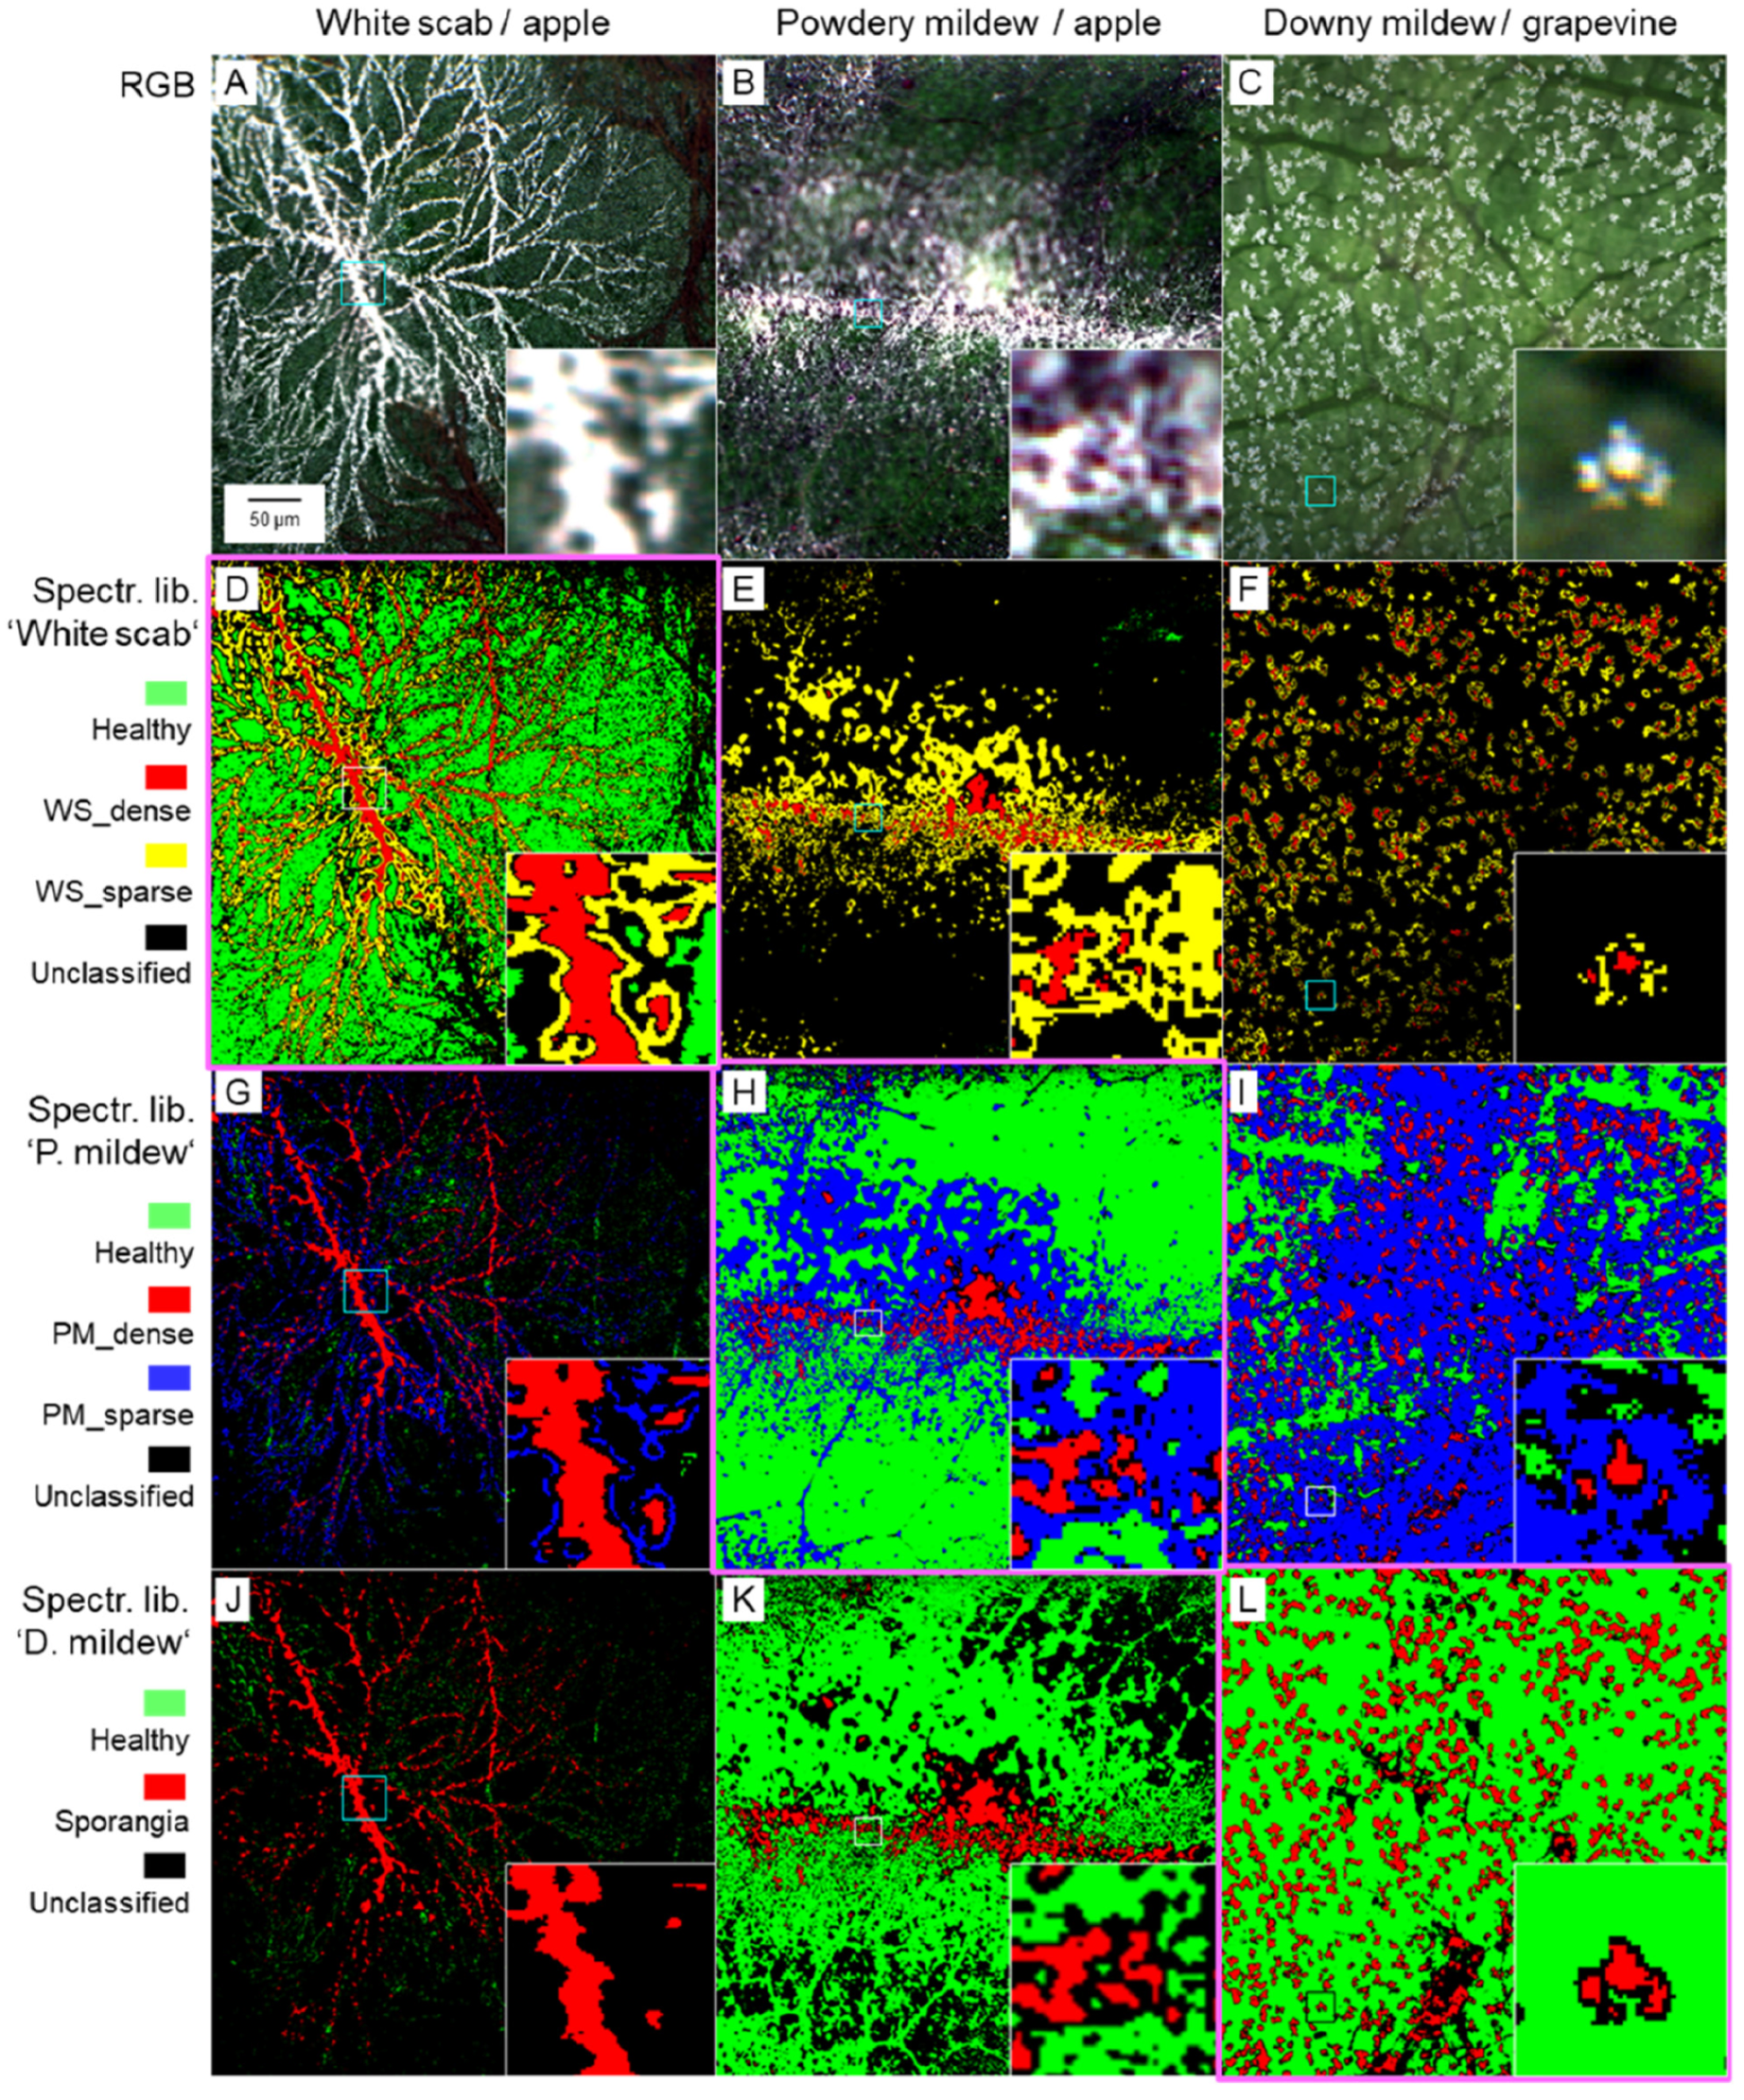
For testing the translation of reference spectra (as collected in spectral libraries for white scab, powdery mildew and downy mildew) among the three diseases, disease symptoms were classified by the SAM algorithm by applying the three spectral libraries for each disease on the leaf level (Figure 4) and on the tissue level (Figure 5). Application of original spectral libraries resulted in good differentiation of sparse and dense disease symptoms (Figure 4D,H,L) very well in agreement with the RGB images (Figure 4A–C). Use of a spectral library collected for another disease resulted in considerably poorer classification results; the spectral library from white scab of apple resulted in non-identification of powdery mildew and an underrating of downy mildew symptoms—probably due to the compact mycelium of dense scab spots. The spectral library from apple powdery mildew was unsuitable to identify healthy tissue of scabby apple leaves and grapevine with downy mildew, which was uniformly classified as dense disease. The spectral library from downy mildew of grapevine could identify and differentiate white scab, but was not suitable to detect sparse powdery mildew.
Figure 4.
Illustration of SAM classification of white apple scab (A,D,G,J), powdery mildew of apple (B,E,H,K), and downy mildew of grapevine (C,F,I,L), at the leaf level using spectral libraries from different disease symptoms. RGB images of diseased leaves (A,B,C) and use of spectral library from apple scab (D,E,F), powdery mildew (G,H,I), and downy mildew (J,K,L) for demonstrating the representativeness of reference spectra. The result from the original spectral library is highlighted by a pink margin; inserts represent areas with increased magnification.
Figure 5.
Illustration of SAM classification of white apple scab (A,D,G,J), powdery mildew of apple (B,E,H,K), and downy mildew of grapevine (C,F,I,L) at the tissue level by using spectral libraries from different disease symptoms. RGB images of disease symptoms (A,B,C) and use of spectral library from apple scab (D,E,F), powdery mildew (G,H,I), and downy mildew (J,K,L) for demonstrating the representativeness of reference spectra. The result from the original spectral library is highlighted by a pink margin; inserts represent areas with increased magnification.
On the tissue level, in contrast, all spectral libraries were suitable to identify dense symptoms of the three diseases (Figure 5, red class). However, the detection of sparse disease symptoms was worse and the detection of non-infected tissue was also impaired.
3.3. Comparison of Powdery Mildew on Apple and Grapevine
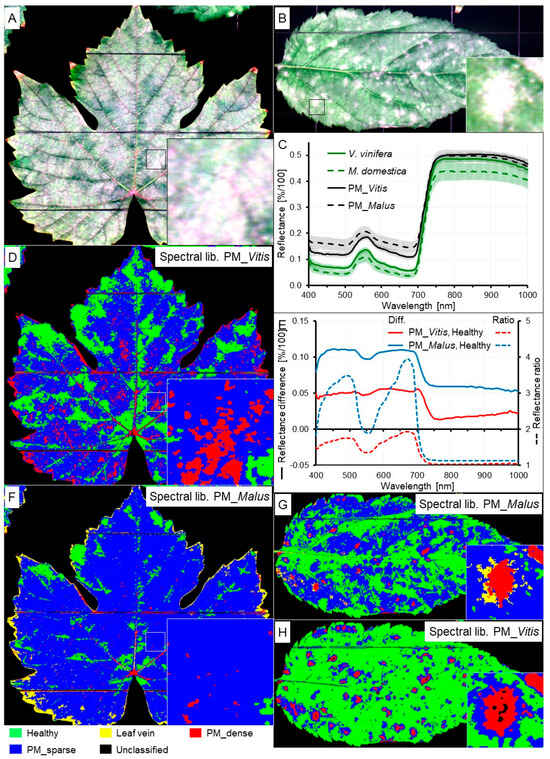
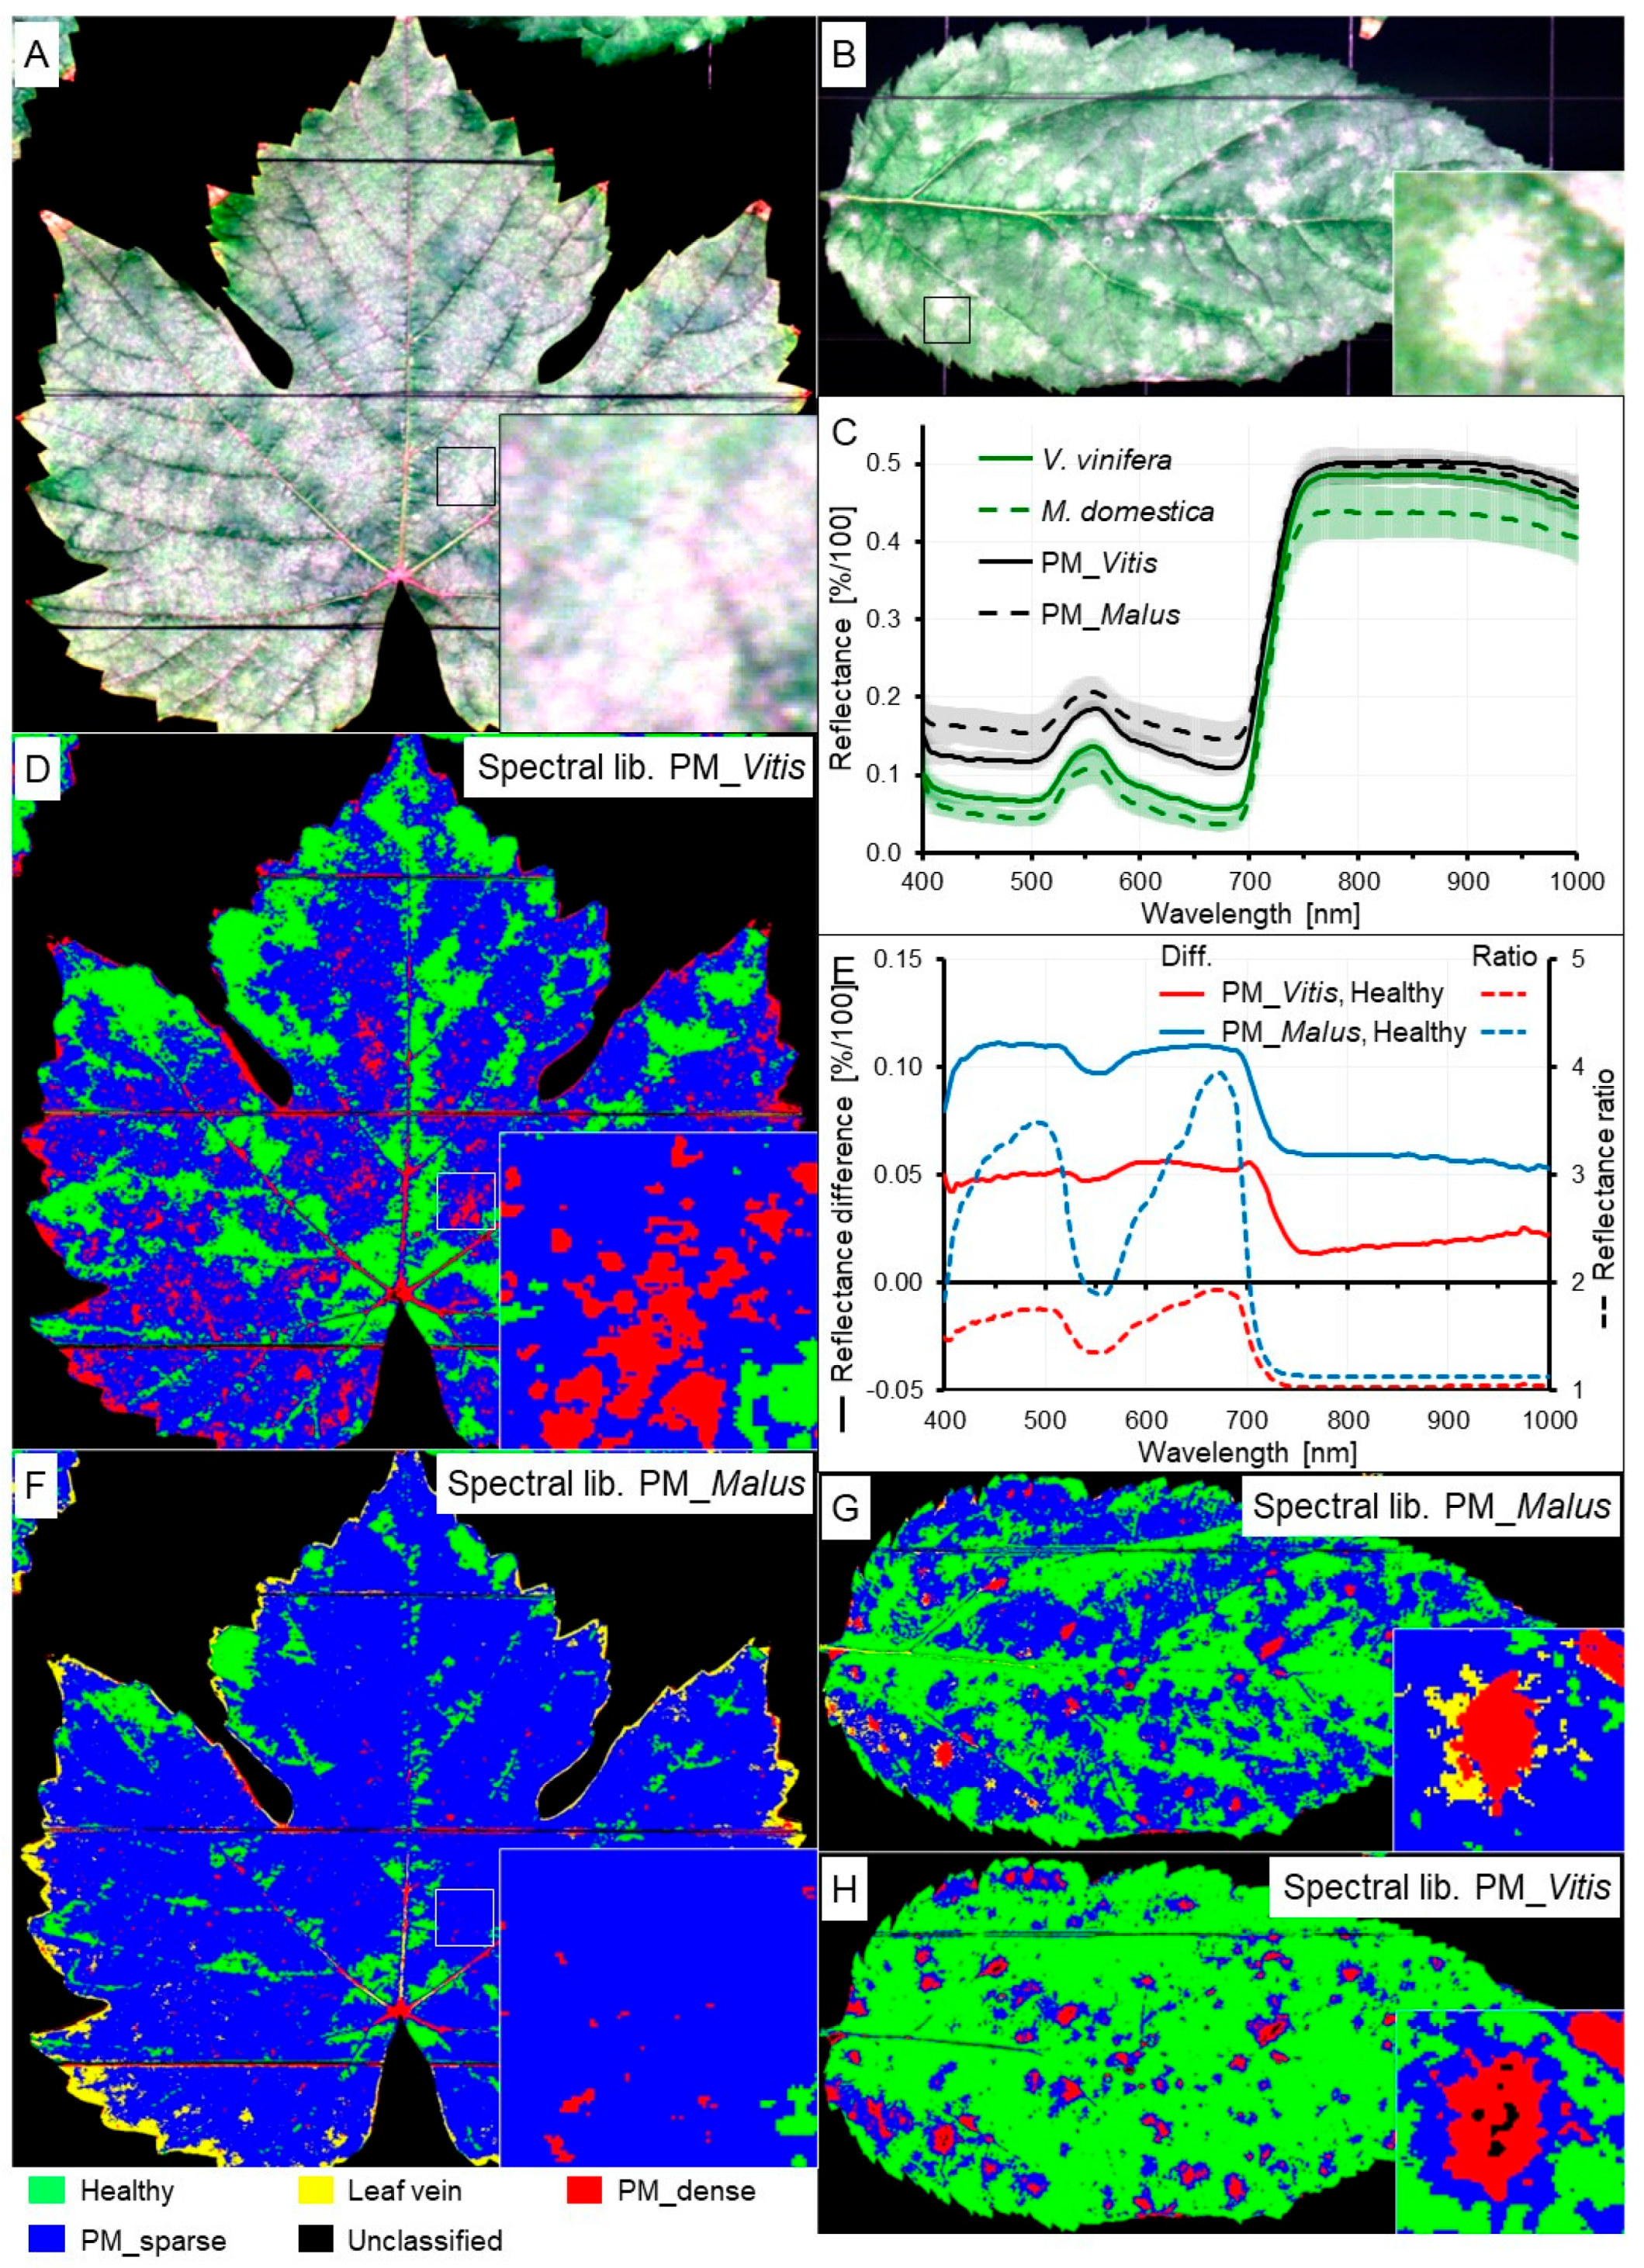
Symptoms of diseases like powdery mildew or downy mildew are prevalent on many host plant species and are caused by various host-specific pathogen species. Disease symptoms caused by Podosphaera leucotricha on apple and Erysiphe necator on grapevine are typical for powdery mildew on dicotyledonous plant species—fluffy white spots that rapidly cover larger areas of the sun-exposed leaf surface (Figure 6A,B).
Figure 6.
Comparison of spectral characteristics of powdery mildew (PM) on grapevine (A,D,F) and on apple (B,G,H). RGB images (A,B); reflectance spectra (C); spectral differences and spectral ratios (E); SAM classification with the original spectral library (D,G); SAM classification with spectral library from the other species (F,H).
Spectral reflectance of non-infected tissue of grapevine leaves was higher than that of apple leaves throughout the spectrum with larger differences in the NIR range than in the VIS range (Figure 6C). Powdery mildew 12 to 14 d p.i. considerably increased reflectance in the VIS range for apple leaves; this effect was less pronounced on grapevine. The increase in reflectance in the NIR range was smaller in both species. As spectral signatures of powdery mildew on apple and grapevine differed—the spectral difference between powdery mildews was similar to the difference between powdery mildew and healthy tissue of grapevine—SAM classification of powdery mildews using the spectral library (reference spectra) from the other species gave inferior results (Figure 6D,F–H). Dense powdery mildew colonies could be detected in some cases, but areas with sparse disease symptoms were misclassified as healthy (on apple, Figure 6H) or healthy leaf tissue was classified as diseased (on grapevine, Figure 6F). As spectral differences between healthy tissue and tissue with powdery mildew were greater for apple leaves, the classification result was more robust to external reference spectra than that for grapevine.
3.4. Effect of Disease Intensity
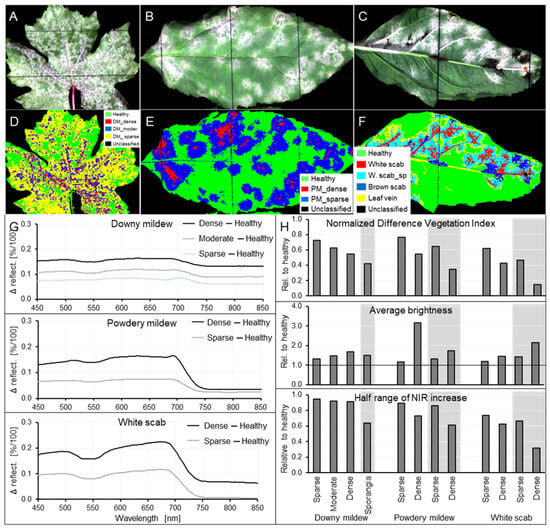
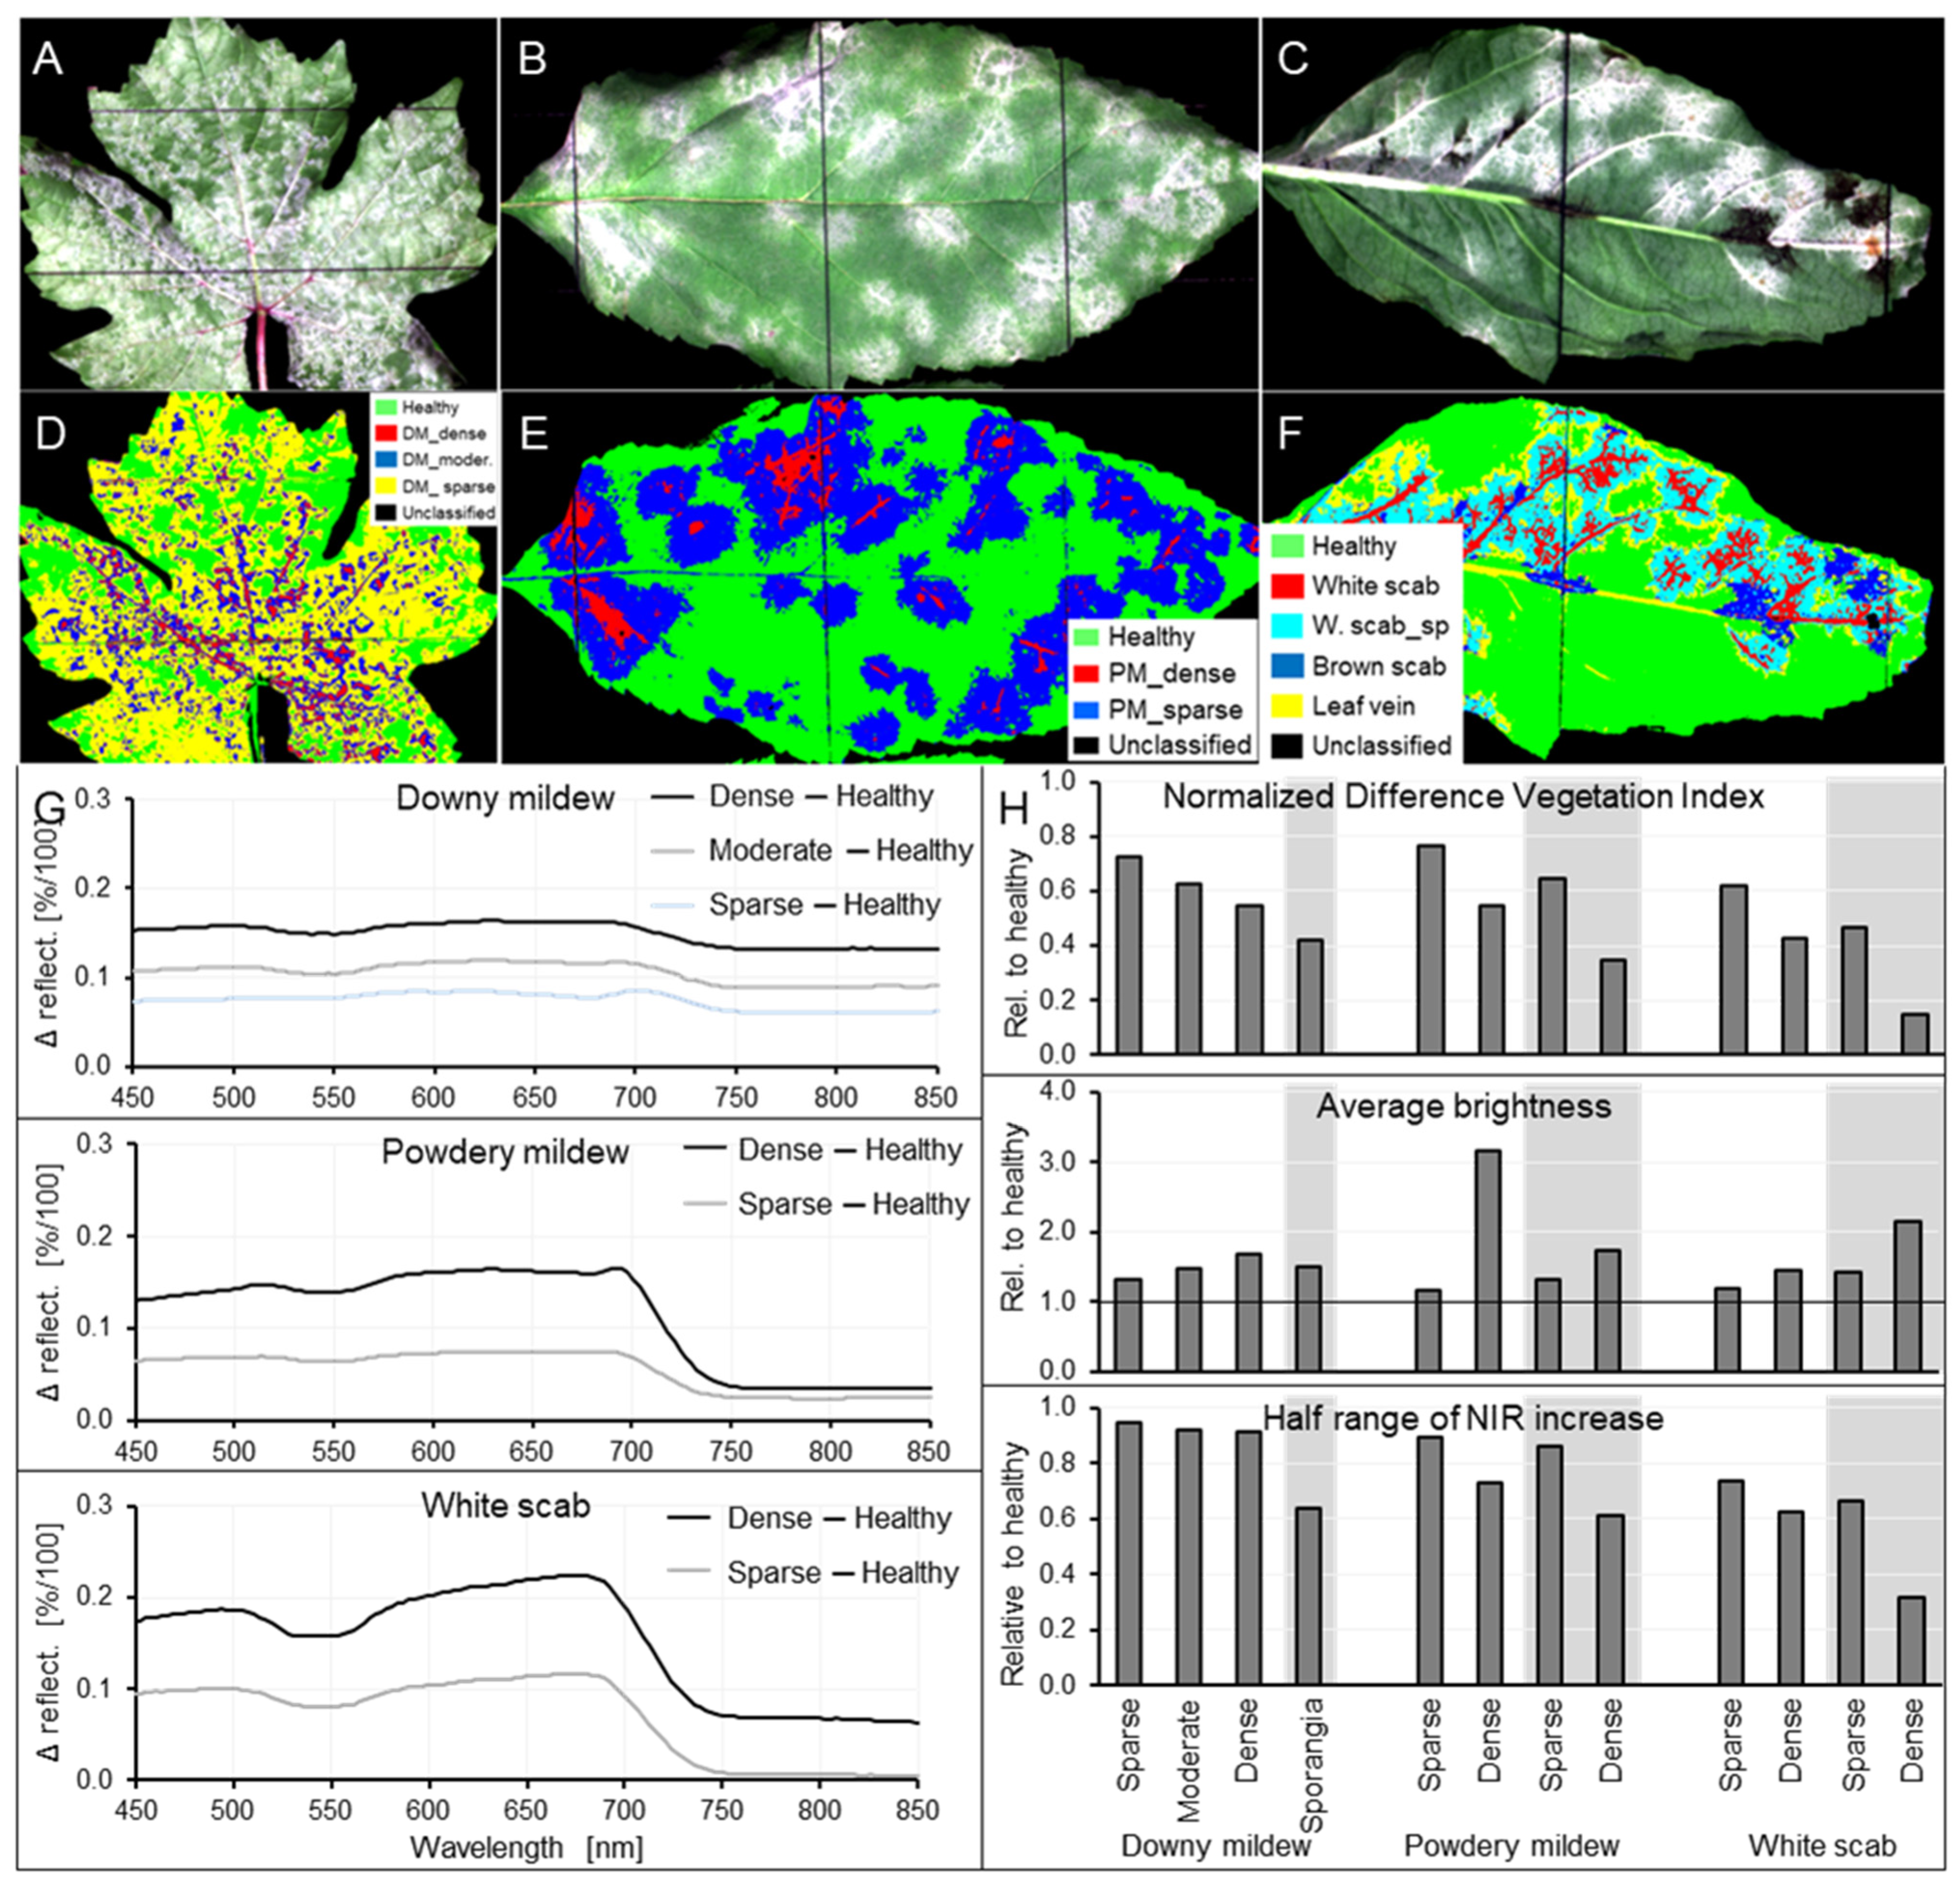
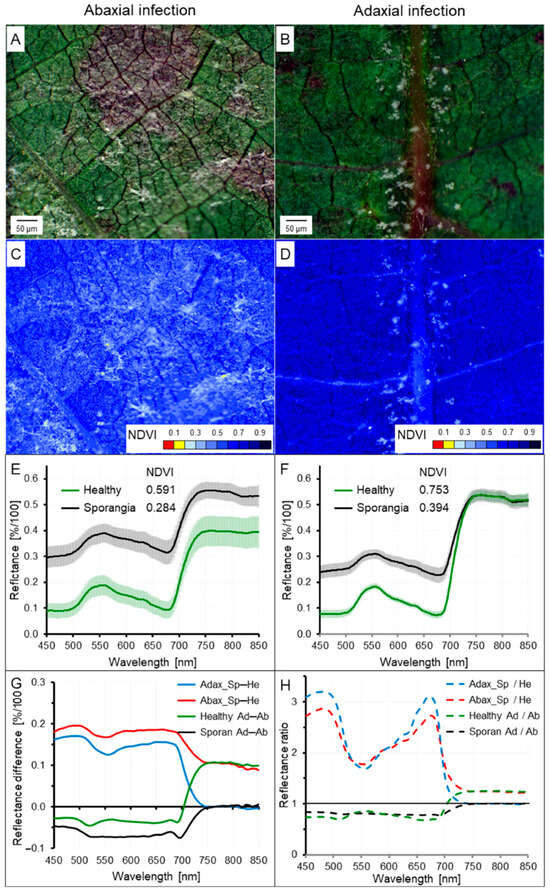
Spectral signature of leaf tissue was increasingly affected by white diseases when the intensity of symptoms (=pathogen biomass per leaf area; please note the difference to disease severity, i.e., the frequency of disease symptoms per leaf and percentage diseased leaf area) increased (Figure 7G–H). At the leaf level, the intensity of surface cover varied from sparse to dense for all three diseases. On the tissue level, individual sporangiophores with sporangia of P. viticola could be identified on the abaxial tissue of grapevine leaves (see Figure 8B,D). For the fungal diseases on apple leaves, in contrast, individual pathogen structures could not be identified, but the intensity of tissue coverage also varied from sparse to dense on the tissue level. Sparse (and moderate) symptoms caused smaller effects on spectral characteristics like NDVI, average brightness and half range of NIR increase (Figure 7H) than a dense layer of pathogen structures. The effect of downy mildew on spectral signature in the NIR range was more pronounced than for the other diseases. As demonstrated by SAM classification, low and high intensity of the diseases were associated with spectral differences suitable for the demonstration of differences in pathogen biomass per leaf area by proximal sensing (Figure 7D–F). The effect of increasing disease intensity on spectral characteristics of leaf surfaces was more pronounced on the tissue level than on the leaf level.
Figure 7.
Effects of the intensity of downy mildew (A,D), powdery mildew (B,E) and white scab (C,F) on spectral characteristics of host tissue. RGB images (A–C), representativeness of spectra as demonstrated by SAM classification (D–F), difference spectra (G), and effects on NDVI (H, top), average brightness (middle) and half range (bottom); columns without and with gray background (in (H)) represent results from leaf level and tissue level, respectively.
Figure 8.
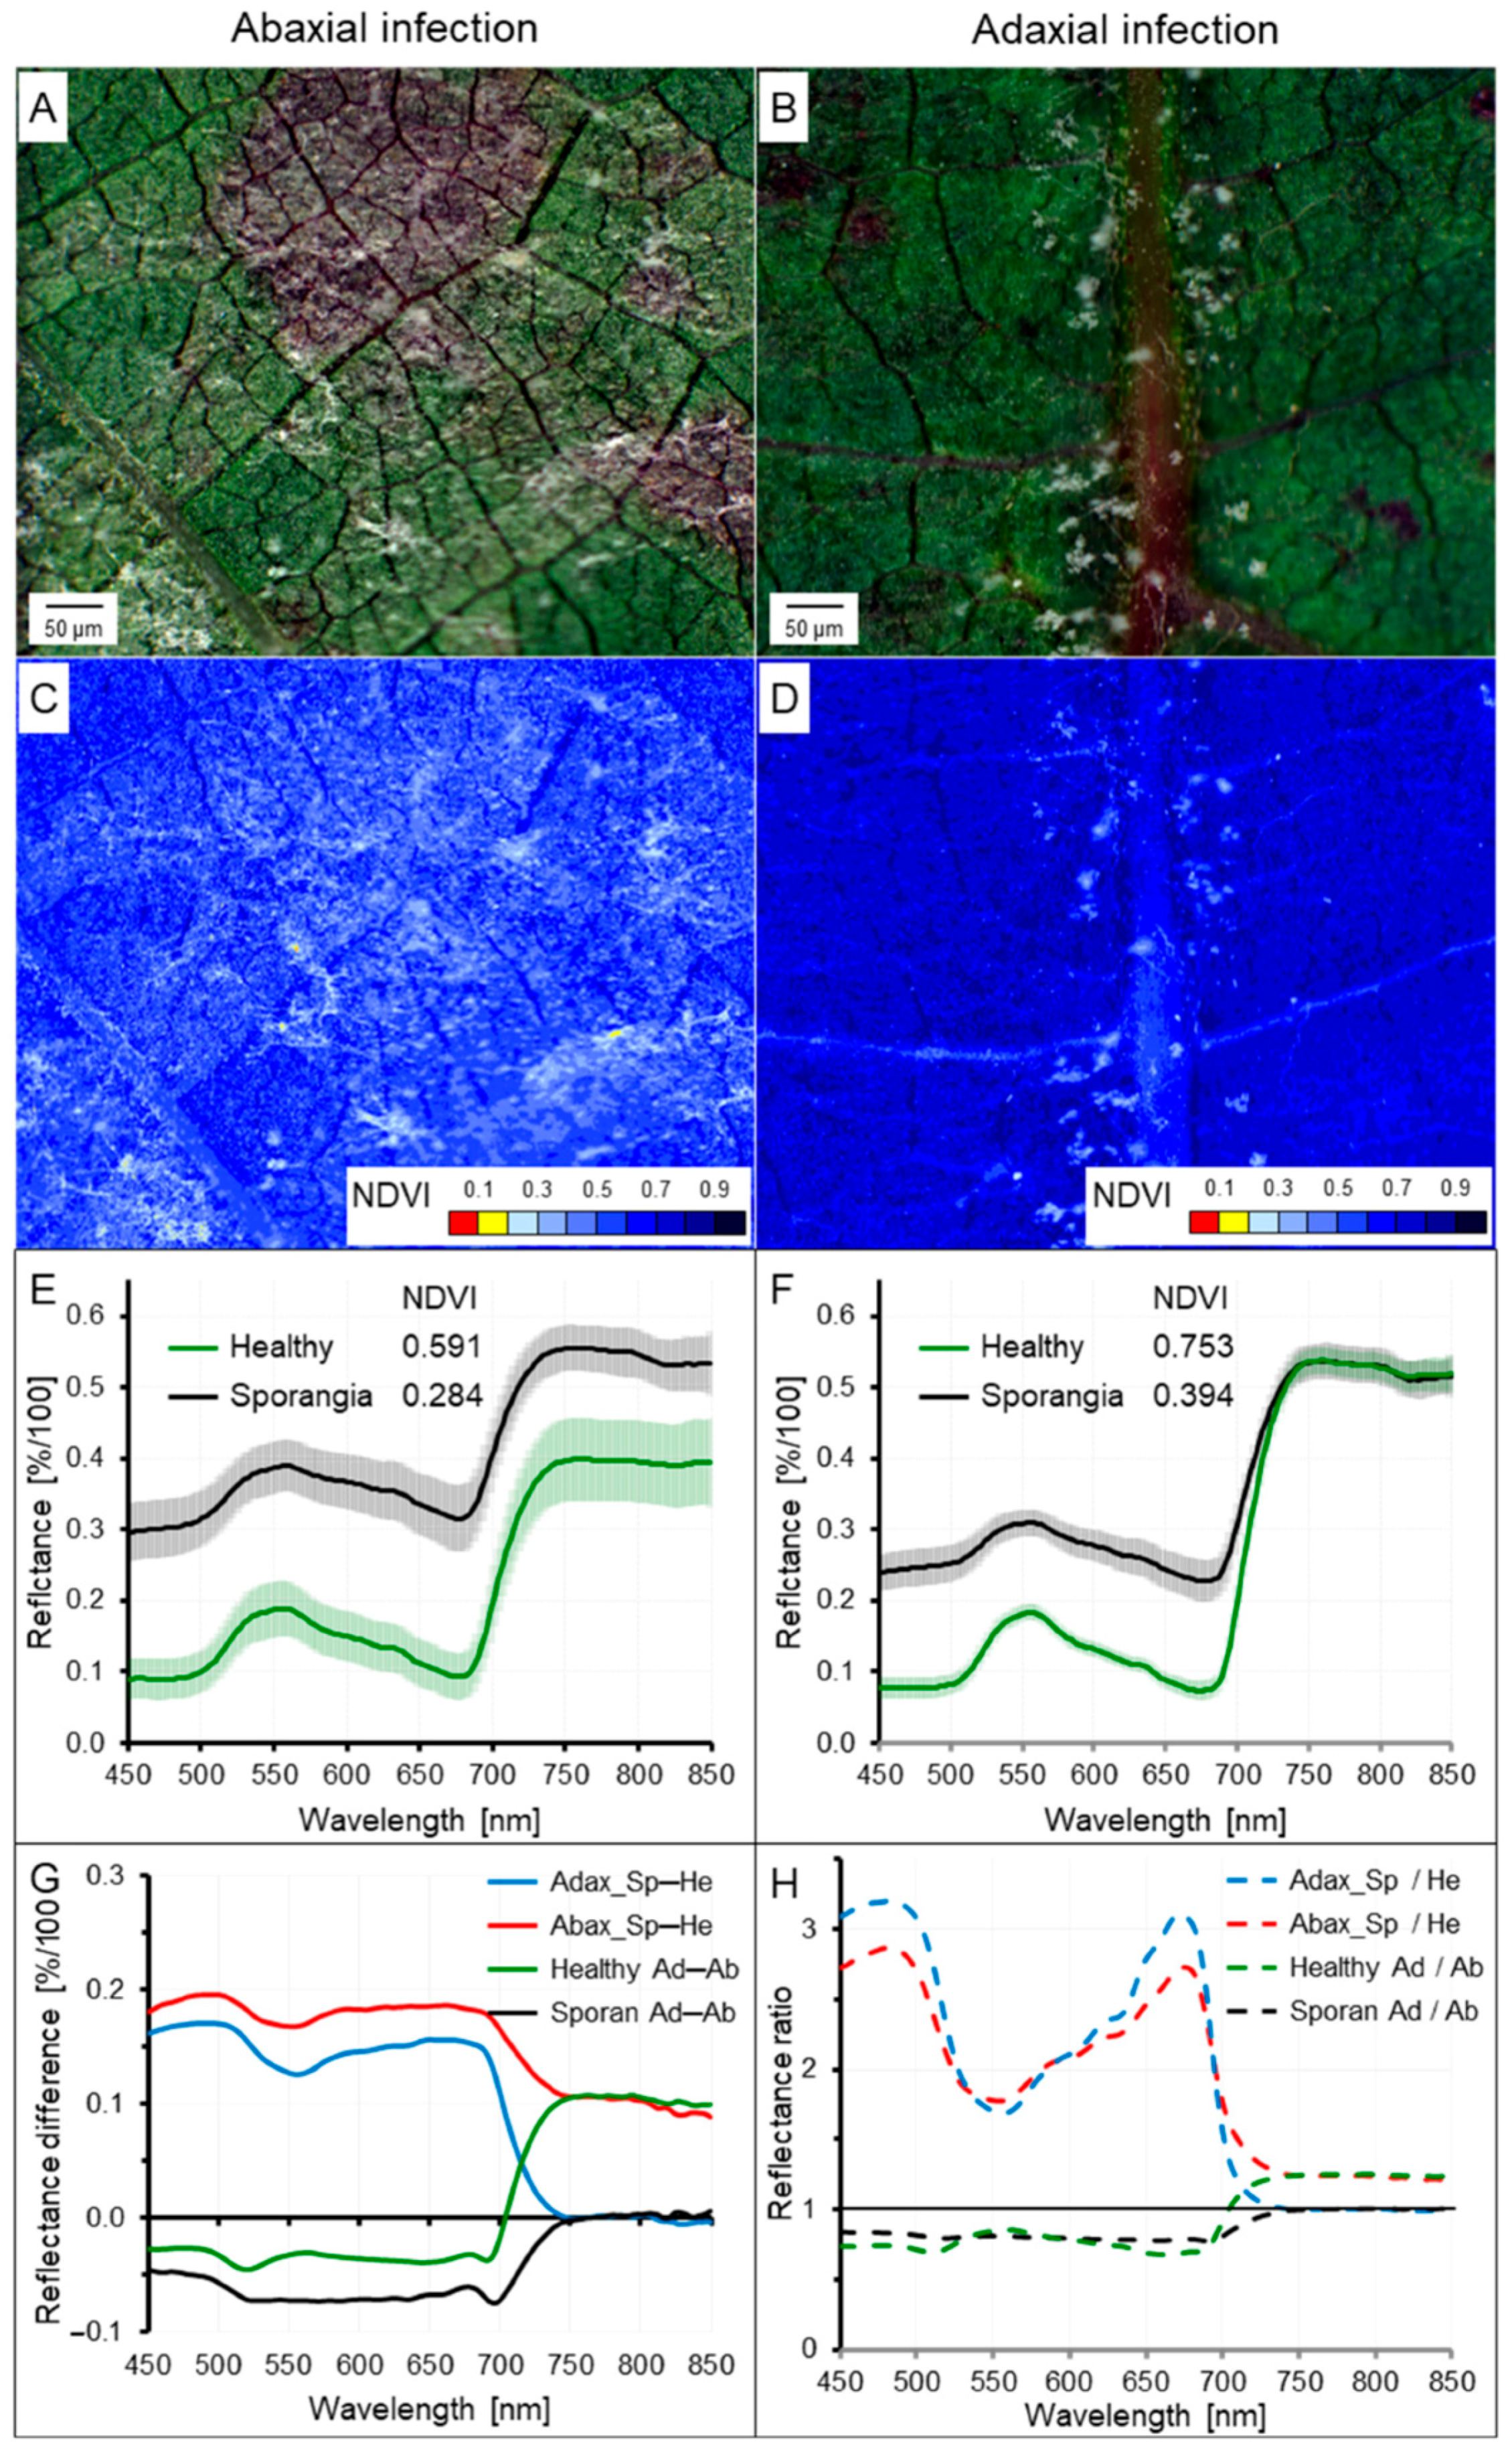
Effect of leaf side and P. viticola sporulation on spectral characteristics of grapevine. RGB images of P. viticola sporulation [Sp] (A,B), images of NDVI values (C,D), spectra of non-infected (healthy [He]) tissue and tissue with P. viticola sporulation (E,F), difference spectra (G) and spectral ratios (H) for abaxial [Ab, Abax] (A,C,E) and adaxial [Ad, Adax] (B,D,F) leaf side.
High spatial resolution of spectral information on the tissue level delivered details on pathogen structures of P. viticola protruding from the leaf surface. Conidia (and conidiophores) of P. leucotricha and V. inaequalis were smaller and could be neither visualized individually nor differentiated.
3.5. Effect of Leaf Side on Spectral Signature of Diseases—Case Study of Downy Mildew of Grapevine
As Plasmopara viticola is able to form sporangiophores also through rudimentary stomata on the adaxial leaf side in the case of heavy leaf colonization, downy mildew of grapevine was suitable to study the effect of leaf side on spectral characteristics of leaf diseases as the complex of pathogen and underlying host plant tissue. High spatial resolution of the sensor system revealed significant differences between healthy tissue and tissue with P. viticola sporulation on the abaxial and adaxial leaf side (Figure 8). For non-infected tissue, spectral reflectance in the NIR range and characteristics like NDVI were higher on the adaxial leaf side. The presence of sporangiophores increased reflectance throughout the spectrum for the abaxial side and only in the visible range for the adaxial side. Both spectra of non-infected tissue and overlaying pathogen structures differed between leaf sides.
3.6. Effect of Optical Focus and Integrity of Pathogen Structures on Spectral Characteristics of Disease Symptoms
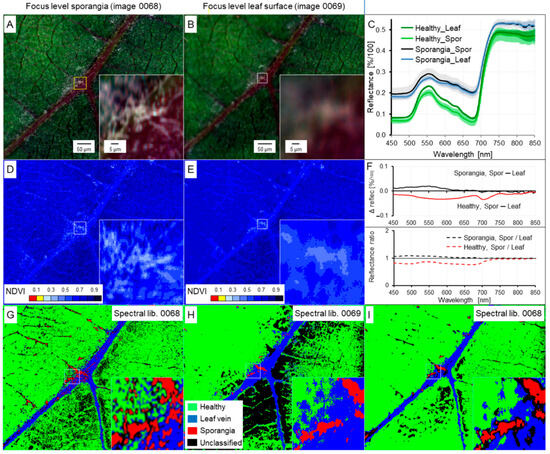
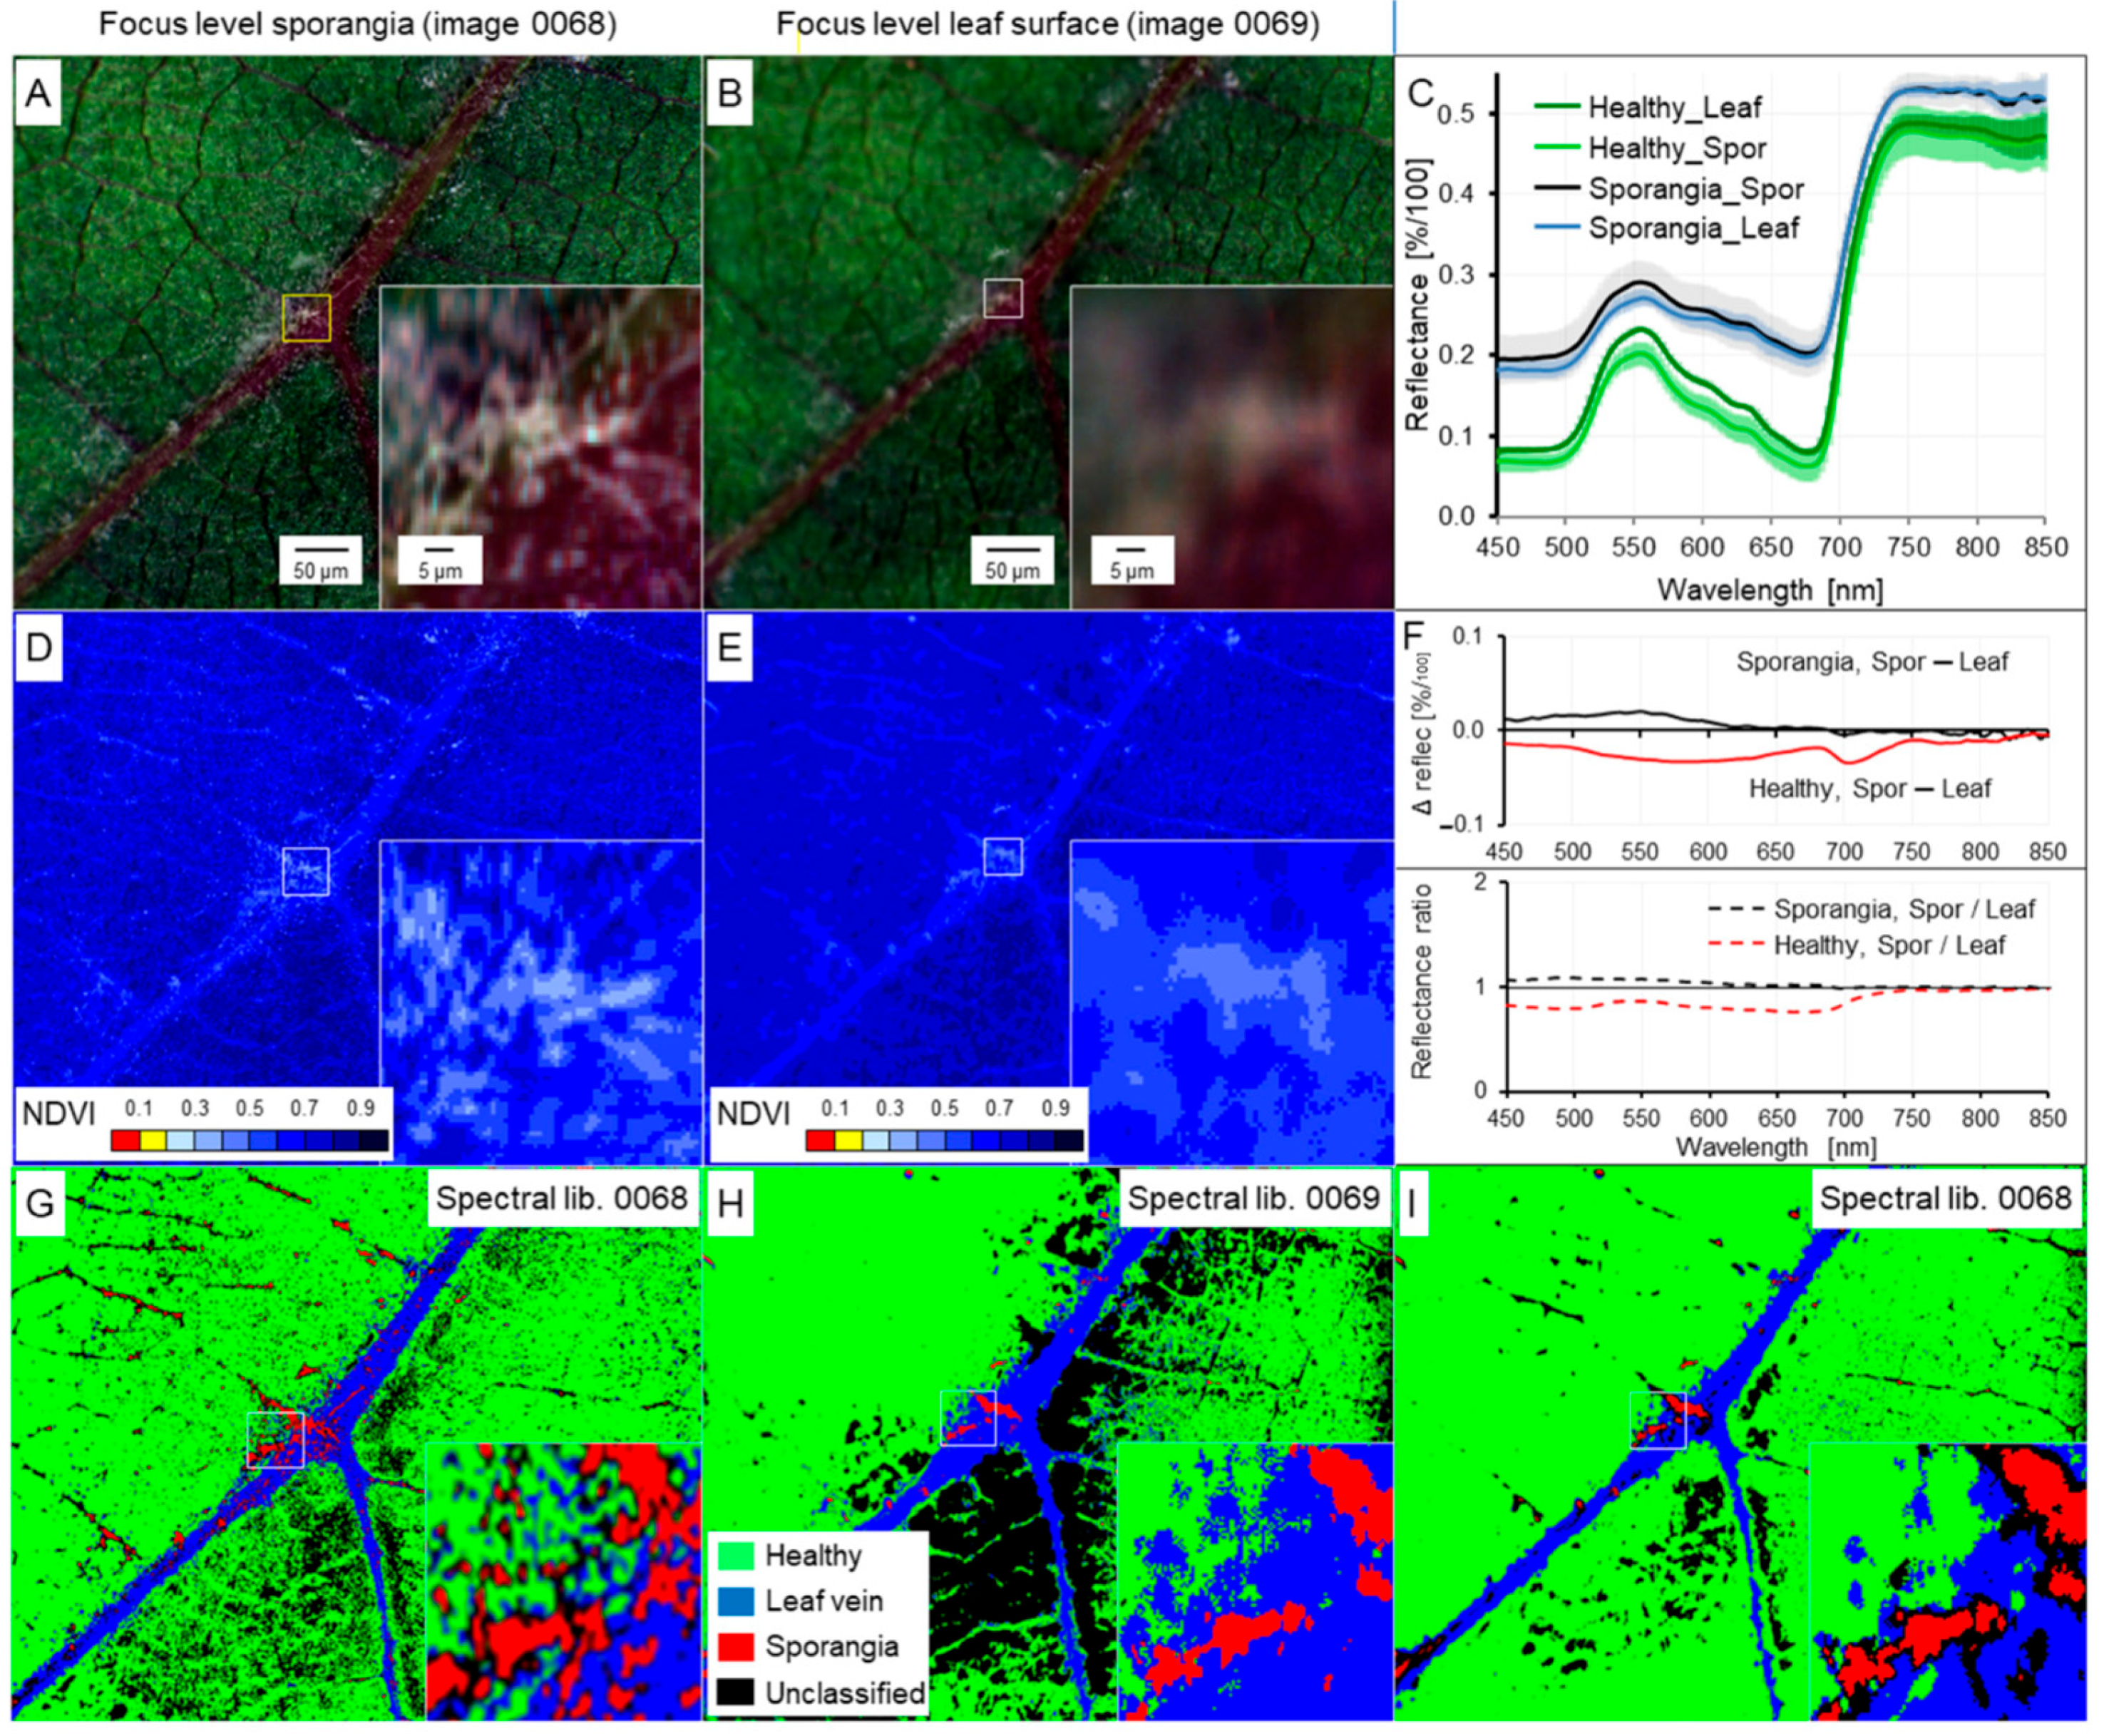
Focusing onto the object (=region) of interest is crucial for the extraction of spectral signature(s) and may become problematic at the microscopic scale in cases where the leaf surface is not flat or is covered by pathogen structures emerging from the plant tissue. As sporangiophores of P. viticola formed through stomata are up to 250 µm in length, sporangia are positioned significantly above the leaf surface. Effects of the focus level—either sporangia or leaf surface—on spectral characteristics of grapevine tissue and pathogen structures were investigated on the tissue scale.
Spectral signatures of leaf surface and P. viticola sporangia sampled from images with the focus level leaf surface and sporangia, respectively, were similar, but differed especially in the visible range (Figure 9C,F). The differences were more pronounced for healthy leaf tissue than for leaf areas covered with sporangia. NDVI maps calculated from these images slightly differed in index values, but were more important, in spatial patterns of diseased leaf areas (Figure 9D,E). Differences in the reference spectra ‘healthy’, ‘leaf vein’, and ‘sporangia’ resulted in a reduced area with sporangia when the image had been recorded with the focus level ‘leaf tissue’.
Figure 9.
Effect of focus level on spectral characteristics of downy mildew on grapevine leaves. RGB images (A,B), spectra of healthy tissue and sporangia (C), NDVI patterns (D,E), difference spectra and spectral ratios (F), and SAM classification using original (G,H) and different (I) spectral libraries depending on focus level ‘sporangia of P. viticola‘ (A,D,G) and ‘surface of grapevine leaves’ (B,E,H,I).
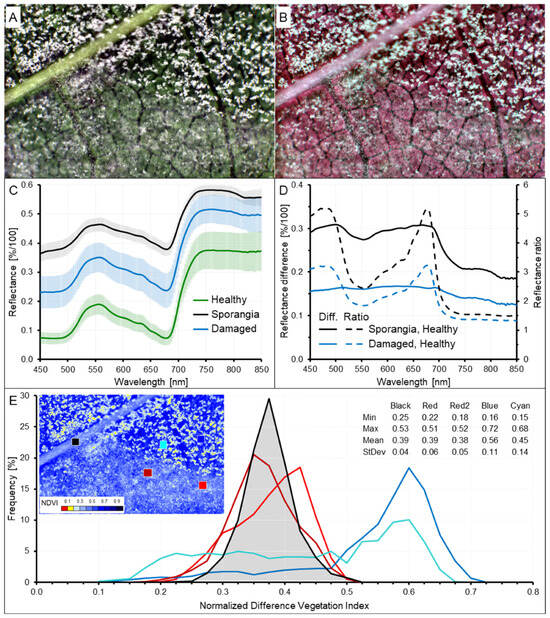
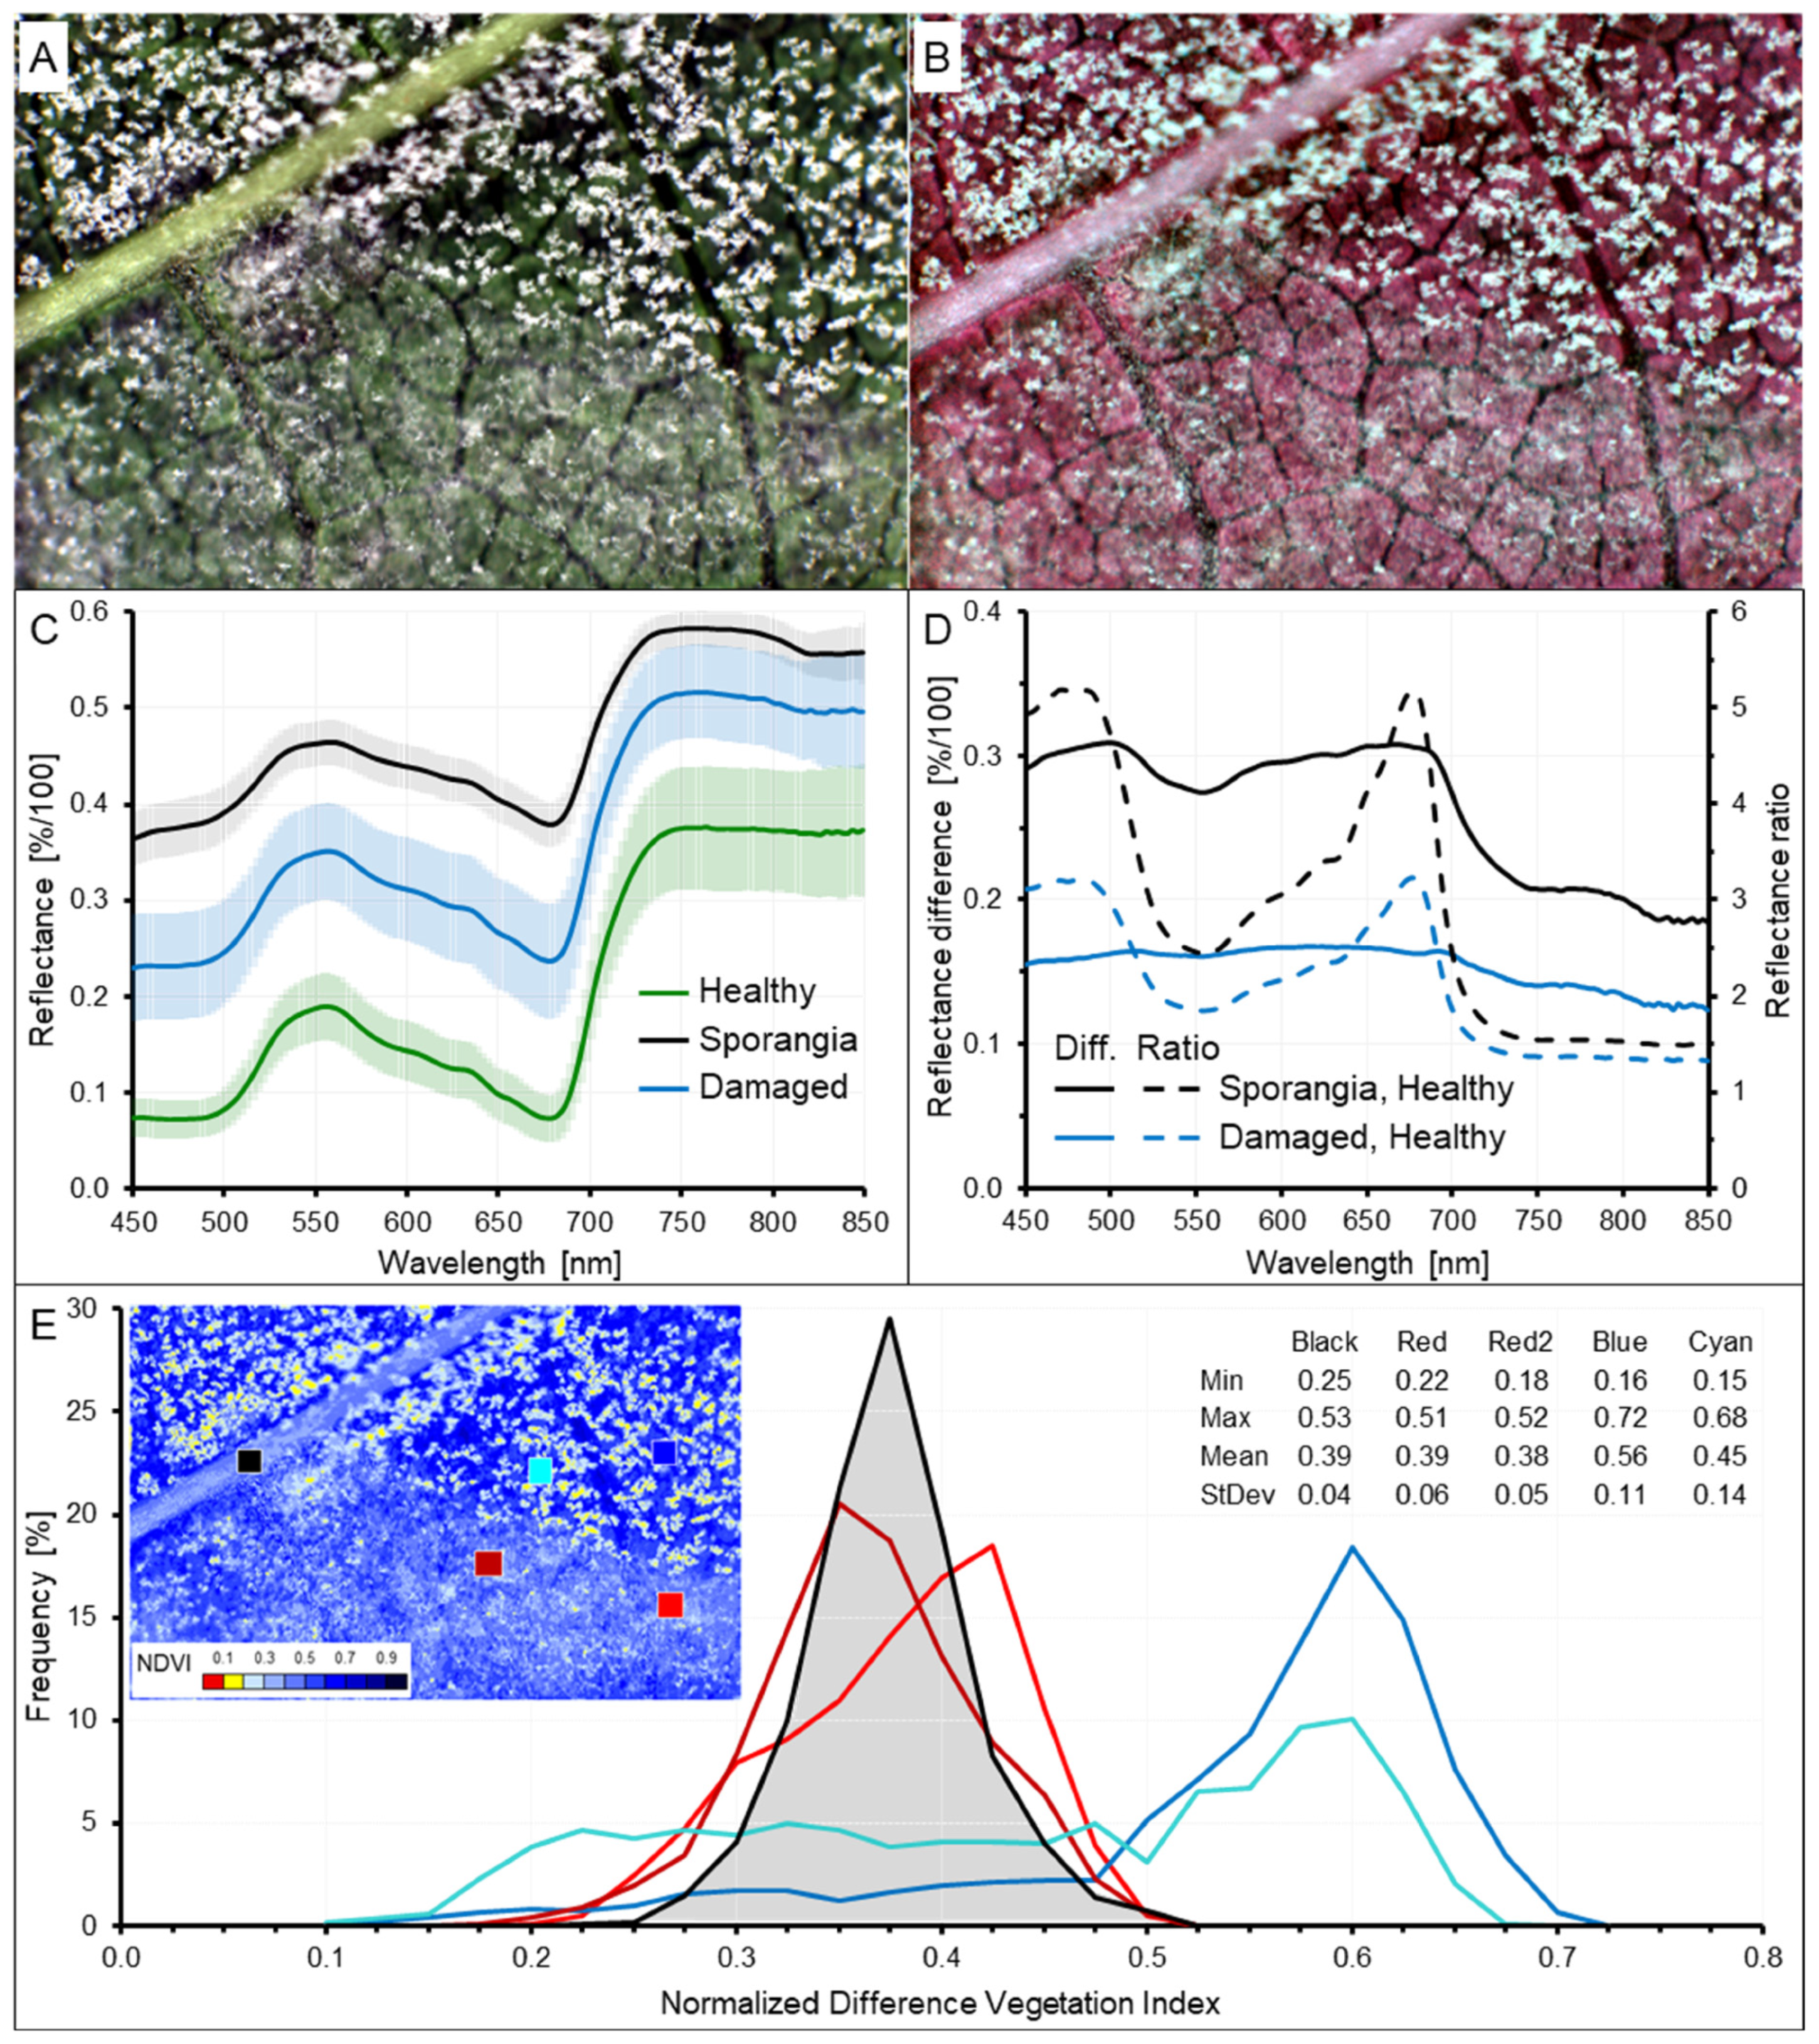
Mechanical contact may affect epicuticular pathogen structures like sporangiophores with sporangia and, therefore, may impair spectral information used for the detection and subsequent quantification of disease symptoms—at least at the tissue level. A leaf area with P. viticola sporangiophores and sporangia was partly damaged mechanically; the squeezed tissue had a spectral signature intermediate between healthy tissue and pure sporangia (Figure 10). For the damaged area, a differentiation between pathogen structures and healthy tissue was not possible anymore. NDVI values calculated for small areas (=2400 ± 75 pixels) including sporangia and non-diseased tissue demonstrated reduced mean values, a Gaussian distribution of values for damaged leaf areas—similar to values for leaf veins—and a non-Gaussian distribution with high standard deviation and higher mean values for tissue with intact sporangiophores and sporangia. SAM classification confirmed spectral differences between non-damaged and damaged tissue and spectral similarity between leaf vein and damaged sporangia (Figure S8).
Figure 10.
Effect of sporangia squeezing on spectral characteristics of downy mildew on grapevine leaves. RGB (A) and CIR (B) image of abaxial surface with erect sporangia (upper half) and sporangia appressed to the leaf surface (lower half); spectra (C), difference spectra and reflectance ratios (D), and frequency of NDVI values for five leaf areas differing in the presence (and quality) of P. viticola sporangia (E).
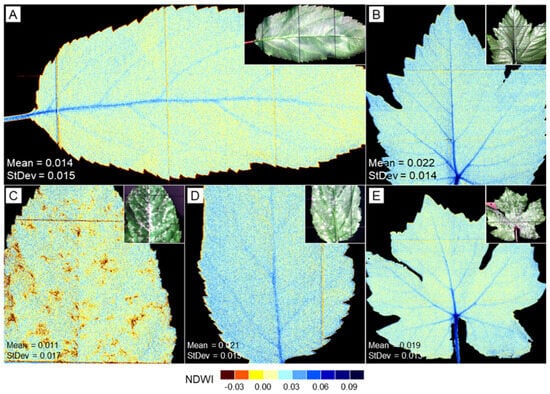
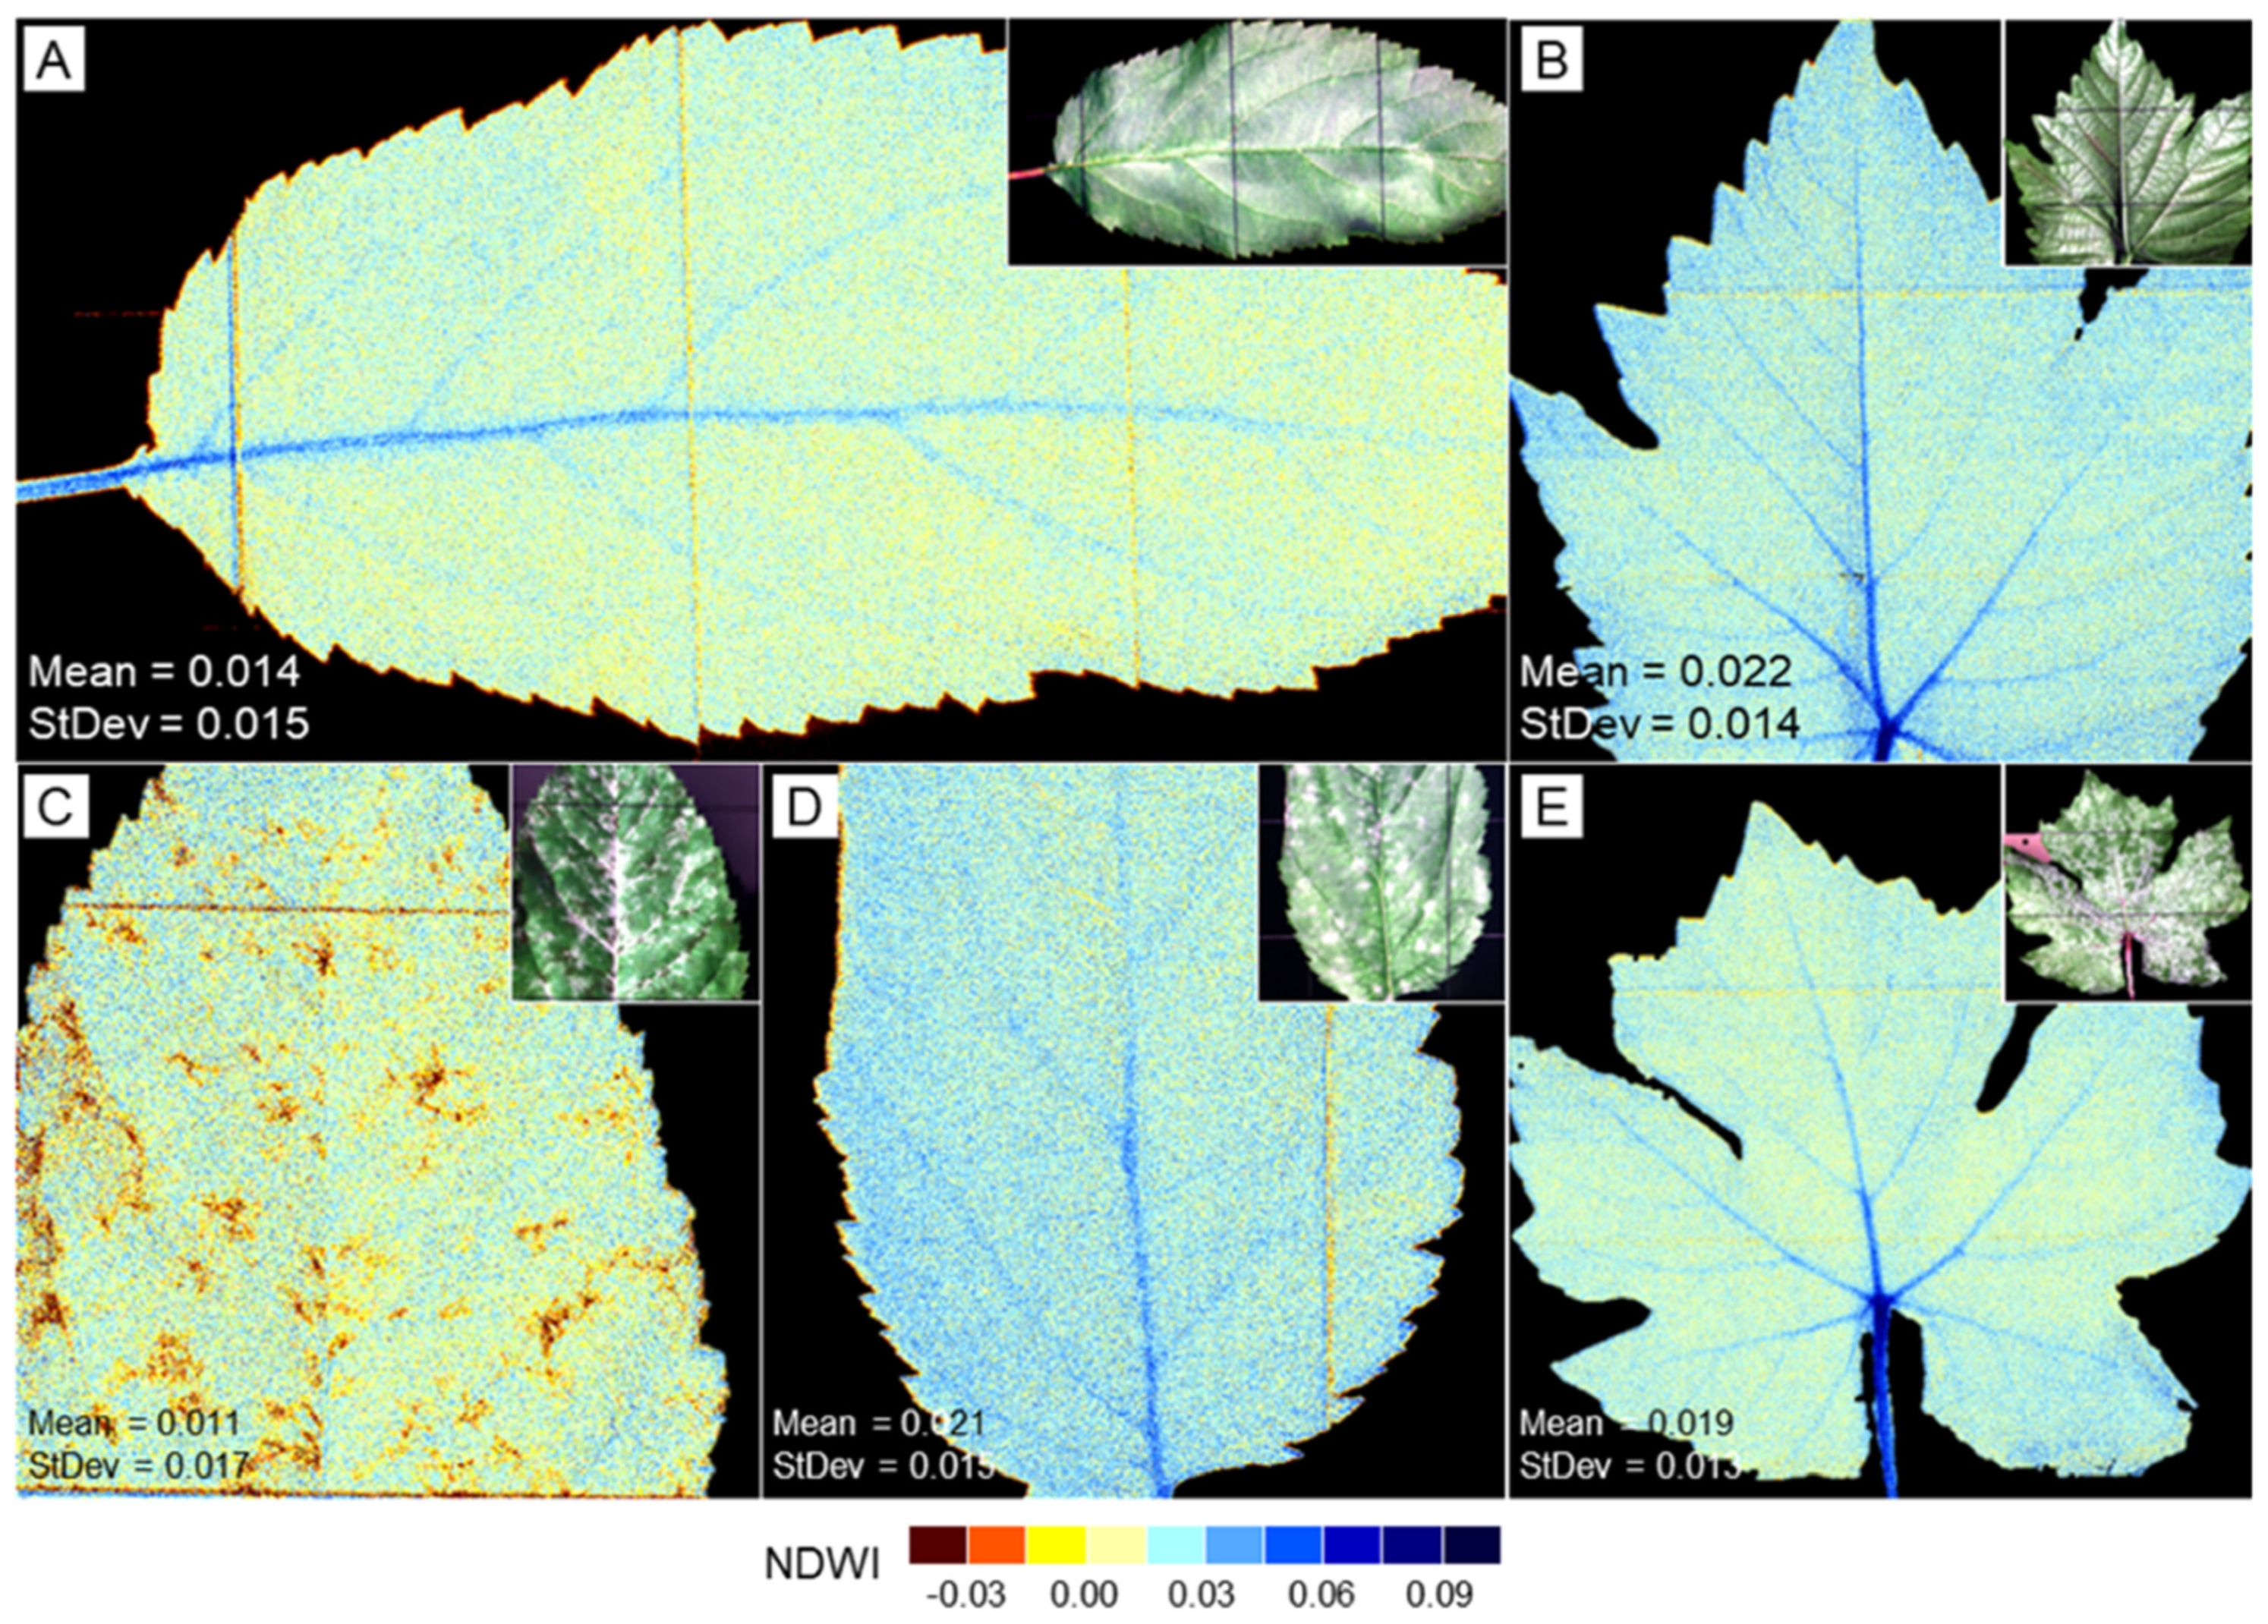
3.7. NDWI Images of Leaves Without and With Disease Symptoms
Spatial patterns of the water content could be assessed on the leaf level only, as the microscopic recording setup at the tissue level impaired the signal-to-noise ratio for the critical spectral range from 850 to 1000 nm. NDWI patterns of non-infected apple and grapevine leaves revealed the expected higher water content of leaf veins, which attenuated with increasing order of veins to the level of interveinal areas (Figure 11A,B). Spots of white apple scab were associated with locally restricted significant reductions in the water content of apple leaves. Powdery mildew had no effect, whereas downy mildew slightly reduced the water content of affected interveinal areas of grapevine leaves (Figure 11C–E).
Figure 11.
Spatial patterns of leaf water content in leaves of apple (A,C,D) and grapevine (B,E) without pathogen infection (A,B) and effect of apple scab ((C), adaxial), powdery mildew of apple ((D), adaxial) and downy mildew of grapevine ((E), abaxial) on leaf water pattern according to Normalized Difference Water Index (NDWI970 = (R900 − R970)/(R900 + R970) calculated from proximal hyperspectral imaging. Inserts represent RGB images of the same leaf.
4. Discussion
Whitish disease symptoms—downy mildew (DM), powdery mildew (PM) and white scab (WS)—increase leaf reflectance throughout the spectrum from 400 to 1000 nm. Hyperspectral imaging was suitable to differentiate between disease-specific spectral signatures influenced by host plant species, disease intensity, and leaf side on the leaf and tissue level.
Differences in spectral signature between leaves of apple and grapevine were expected as hyperspectral imaging is used for species characterization in ecosystems [46,47,48]. Being highly suitable for the classification of plant species (and cultivars), these differences impede the use of spectral signatures for disease identification in more than one crop species. Similarly, spectral differences between adaxial and abaxial leaf sides have been described for bifacial leaves of broadleaf species and even for monocotyledonous cereal species [49,50,51]. The two surfaces of bifacial leaves differ in structure and function. The palisade mesophyll contains densely packed, elongated cells with a high concentration of chloroplasts. The cell shape facilitates the penetration of adaxial collimated light into the spongy parenchyma, which is composed of irregular and loosely arranged cells and tends to scatter light [52]. This difference limits a generalization of remotely sensed proxies—spectral vegetation indices—for biochemical leaf traits like chlorophyll content and leaf water content. Dorsiventral and angular-resistant spectral indices improved the estimation of leaf chlorophyll content and equivalent water thickness of leaves at the leaf and canopy level [53]. However, apart from surface differences affecting light reflection, reflection differences between adaxial and abaxial side also demonstrate the internal leaf structure including several horizontal cell layers differing in biochemical and physical properties. Recording in NADIR position results in higher and lower reflectance values of abaxial leaf sides in the VIS range and NIR range, respectively. This difference between sides agrees with the internal structure of broadleaf plant leaves.
Similarities in spectral reflectance among disease symptoms and within-symptom variability of disease-specific spectral signatures depending on spatial heterogeneity of pathogen structures as well as on the inhomogeneity of the leaf tissue beneath make the differentiation of whitish leaf diseases a challenge. The spectral overlap in signatures of DM, PM and SW confirms that there is no uniqueness/singularity of spectral disease signatures; metro maps of spectral information from barley diseases demonstrated that specific stages of two diseases transiently may have similar spectral signature [8]. Moreover, the spectral signature of a symptom exhibits variation because of progress in pathogenesis in space and time (i.e., the spatial continuum from healthy tissue to the center of host infection; the sequence from primary infection through hyphal spread and increase in pathogen biomass to sporulation; and modifications of hyphae in response to the environment), the variability of host tissue and the influence of irradiation geometry on reflectance. The effect of diseases on spectral reflectance was stronger on the tissue level because of the higher spatial resolution, which improves the potential of differentiation between pathogen structures and non-colonized leaf areas.
The spatial heterogeneity of disease symptoms within individual leaves presents challenges analogous to the multi-scale heterogeneity observed in soil systems, where preferential flow paths create complex spatial patterns [54]. Just as understanding soil heterogeneity requires consideration of multiple scales, accurate disease detection must account for within-leaf variability in symptom expression. Our use of both leaf-level and tissue-level imaging addresses this multi-scale requirement, revealing that spectral differences among diseases become more pronounced at higher spatial resolution.
Calculation of reflectance differences and ratios (using ‘diseased’ and ‘healthy’) eliminated the influence of plant species and leaf side and enabled a direct comparison of spectral signatures of disease symptoms from different leaf sides and plant species. Difference spectra describe the distances between the reflectance curve of a pixel of interest and the reference signature ‘healthy’, whereas reflectance ratio curves include additional information on the reflectance level of reference spectra. The use of difference spectra and spectral ratios is limited by the variability of non-infected plant tissue—interveinal areas and various leaf veins. The use of spectral anomaly detection in disease detection should be more successful at the canopy scale where variations in leaf tissue, side and orientation are smaller. Anomaly detection algorithms are used in environmental sciences for remote detection of targets with low probabilities or significant changes occurring with respect to a previous situation and do not need prior information about target objects [55,56,57].
Differences in the shape of spectra among whitish diseases were confirmed by the values of spectral indices like NDVI and average brightness and (half range of) NIR reflectance increase in symptoms on leaf tissue, which were introduced in this study. These indices were suitable to quantify the degree of overall reflectance increase due to whitish pathogen biomass and differences in the increase between VIS and NIR range, respectively. They are especially helpful to characterize the (parallel) shift in reflectance due to white symptoms within an image. As the diseases differed in some SVIs, threshold values for a combination of SVIs for white symptoms—NDVI, average brightness, NIR increase and REIP—and those for disease-induced modifications in leaf physiology like NDWI970 may be used for the differentiation of whitish diseases—similar to the use of spectral signatures (see Table S2).
Supervised classification with reference spectra (I) from the same image and (II) from images from another white disease of the same host species or another white disease from another host plant species using the SAM algorithm demonstrated that PM, DM and WS have similar but significantly different spectral signatures. Similarly, plant species and the side of bifacial leaves had different signatures. As the spectrum of a specific disease (=host–pathogen interaction) includes spectral information from both pathogen structures (varying with the stage of pathogenesis) and plant tissue beneath (varying with species, genotype, leaf side and within the leaf plane), a generalization of the use of reference spectra (or spectral information like SVIs) is hardly possible. Typically, SAM classification of a symptom that exhibited variation in disease intensity was improved by using more than one reference spectrum for the disease. The use of difference spectra ‘diseased—healthy’ reduces or even eliminates the effect of plant species and leaf side; however, spectral variability of symptoms due to age and disease intensity and spatial differences in the plant tissue—interveinal areas and veins of various orders—still pose a problem in proximal sensing. For remote sensing from UAV or other platforms, the similarity among whitish diseases enables their detection and quantification; however, it prevents disease identification, e.g., differentiation between powdery mildew and downy mildew, which may occur on the same grapevine leaf.
As expected from the continuum of spectral modifications from healthy tissue to advanced disease symptoms observed in this study and others [7,12], disease intensity, i.e., the amount of pathogen biomass on the leaf surface, influenced the spectral signature of symptoms. Similarly, the increase in leaf reflectance due to powdery mildew increased with time after infection (=pathogen biomass) in wheat [14]. The possibility to differentiate between sparse and dense pathogen layers on leaf tissue also implies that there is not a unique spectral signature for a specific disease, which may be used for spectral assessment of diseases.
Spectral differences between leaf sides were larger than scale effects, i.e., image recording at the leaf and tissue level. The reflection of light, and thus the spectral signature of leaves and leaf sides, is influenced by pigmentation (content of chlorophyll, accessory pigments, number of chloroplasts per cell volume), cell morphology (roundish spongy parenchyma cells, rod-like palisade parenchyma cells), and tissue structure (dense layer of palisade cells, loose network of spongy parenchymatic cells) with all (cell) surfaces involved.
The hyaline biomass of PM, DM and WS pathogens increased the (low) reflectance of the abaxial leaf side, but not the (higher) reflectance of adaxial sides with a compact layer of palisade cells. The epidermal cell layers may be ignored here as the morphology of their cells is similar for both leaf sides—except for the presence of functional stomata on the abaxial side and differences in the structure and number of trichomes between sides. The back side of detached wheat leaves from the field had higher reflectance than the front side throughout the full spectrum 400–2500 nm [49]. Yellow rust infections eliminated this difference at almost all spectral ranges. Reflectance from the adaxial and abaxial side of citrus leaves has been successfully used for the classification of citrus diseases including scab [58].
Elimination of the effect of leaf side in spectral analysis—by the use of side-insensitive wavebands—is useful for remote sensing approaches interested in plant biomass and overall pigmentation (as indicator of nutrient status and plant health); however, it neglects vertical differences in pigmentation among cell layers (e.g., chlorophyll content of palisade cells and spongy parenchymatic cells). It is not suitable for proximal sensing at the tissue level interested in subtle differences among leaf diseases that may occur on both leaf sides.
Sporangiophores of the downy mildew pathogen P. viticola are considerably longer than the conidiophores of powdery mildews and apple scab. As V. inaequalis produces single annelloconidia on short conidiophores and conidiation of P. leucotricha and E. necator results in chains of meristem arthroconidia only when the release of conidia by air currents is prevented, the layer of pathogen structures forming scab and powdery mildew, respectively, were flat and compact. Focusing on leaf tissue and sporangia makes a difference in the spectra of leaf tissue and sporangia; however, the effect is far smaller than the effect of leaf side, at least in dicotyledonous species with bifacial leaves.
Patterns of leaf water content of grapevine and apple leaves affected by downy mildew and apple scab, respectively, demonstrated the potential of VISNIR-HSI in assessing pathogen effects on the water status on the leaf level and confirmed earlier results using SWIR-HSI [59]. In the study reported here, NDWI970 proved to be suitable for assessing leaf water patterns of healthy and diseased leaves in proximal sensing. Unfortunately, the range from 850 to 1000 nm, which is critical for leaf water mapping, was not available in the microscopic setup because of a low signal–noise ratio due to the lenses of the optical system.
The size and shape of symptoms of whitish diseases are highly variable and, hence, unsuitable for disease differentiation. Similarly, the texture of the superficial symptoms of powdery mildew and white scab is similar—the thickness of pathogen biomass decreases from the site of original infection to the symptom’s margin. The interpretation of this pattern, however, is complicated by coalescence of primary spots and the fate of propagules produced during growth. Spatial information, therefore, is not likely to improve the differentiation of whitish diseases, except for the identification of sporangiophores of P. viticola at the micro scale.
5. Conclusions
Under standardized experimental conditions, the hyperspectral sensor delivered spectral signatures of white symptoms suitable for spectral separation of hyaline pathogen structures and to demonstrate differences in disease intensity. The human eye senses only three broad wavebands—R, G and B—whereas hyperspectral sensors detect hundreds of narrow wavebands. Structures appearing as white to our eye, therefore, can be differentiated by the technical sensor demonstrating that not every white is the same white. As spectral characteristics of leaves differ among plant species, between leaf sides and within the leaf plane, a translation of reference spectra among image data sets was difficult to achieve. This fact limits the generalization of spectral signatures for the identification of diseases that display the interactions between plant tissue and pathogen. These complex interactions also impair the identification of links between biological structures and spectral signatures. Nevertheless, the detection of whitish symptoms by using a common difference reference spectrum ‘white disease’ should be possible in remote sensing.
The effect of superficial pathogen structures on the spectral signature of leaf tissue depends on the scale of imaging and limits the translation of spectral information among platforms for applications under production conditions. The focus level was of minor importance for disease assessment on the leaf level, but it may become problematic on the tissue (=microscopic) level, not only because of surface roughness/asperity, but also because of the presence of larger pathogen structures like sporangiophores. Reflectance spectra of disease symptoms damaged by sample handling demonstrated that the integrity of pathogen structures and symptoms are by far more important for an effective assessment of the health status of plant tissue.
Symptoms of various diseases may be very similar; however, disease effects on host metabolism may be different, as demonstrated by the reverse effects of white scab and downy mildew on the spatial distribution of leaf water content. Sensing of disease-induced metabolic changes provides valuable additional information supporting the differentiation of primary disease symptoms. Similarly, misclassification of lighter leaf veins resembling whitish disease symptoms may be avoided by adding information on the water content of leaves as assessed by NDWI970—when available from the recording system and when reasonable from the recording platform.
Supplementary Materials
The following supporting information can be downloaded at https://www.mdpi.com/article/10.3390/rs18070976/s1. Table S1: F statistics of the effects of scale and disease on NDVI of leaf tissue; Table S2: F statistics of the effects of scale and disease on REIP of leaf tissue; Table S3: F statistics of the effects of scale and disease on average brightness of leaf tissue; Table S4: F statistics of the effects of scale and disease on half range of NIR increase of leaf tissue; Table S5: F statistics of the effects of disease on NDWI970 of leaf tissue; Table S6: Spectral characteristics of downy mildew of grapevine, powdery mildew of apple and white apple scab on leaves as assessed on the leaf and tissue level; Table S7: Summary of the effects of whitish leaf diseases on spectral characteristics of host plants depending on the scale of recording; Figure S1: Spectral characteristics of non-infected grapevine leaves; Figure S2: Spectral characteristics of non-infected grapevine tissue; Figure S3: Spectral characteristics of non-infected apple leaves; Figure S4: Spectral characteristics of non-infected apple leaf tissue; Figure S5: Spectral characteristics of whitish leaf diseases on the leaf level; Figure S6: Spectral characteristics of whitish leaf diseases on the tissue level; Figure S7: Effect of SAM value variation on the result of SAM classification of downy mildew, powdery mildew and white scab on apple leaves; Figure S8: Effect of mechanical sporangiophore squeezing on the classification of downy mildew on the abaxial side of grapevine leaves.
Author Contributions
Conceptualization, E.-C.O. and U.S.; methodology, E.-C.O.; software, E.-C.O.; investigation, E.-C.O. and U.S.; resources, U.S.; data curation, E.-C.O.; writing—original draft preparation, E.-C.O. and U.S.; writing—review and editing, E.-C.O. and U.S. All authors have read and agreed to the published version of the manuscript.
Funding
This research received no external funding.
Data Availability Statement
The raw data supporting the conclusions of this article will be made available by the authors on request.
Acknowledgments
The authors thank Stefan Barthel and Julia Weidtmann for experimental support.
Conflicts of Interest
The authors declare no conflicts of interest.
References
- Oerke, E.C. Crop losses to pests. J. Agric. Sci. 2006, 144, 31–43. [Google Scholar] [CrossRef] [Scilit]
- Savary, S.; Willocquet, L.; Pethybridge, S.J.; Esker, P.; McRoberts, N.; Nelson, A. The global burden of pathogens and pests on major food crops. Nat. Ecol. Evol. 2019, 3, 430–439. [Google Scholar] [CrossRef] [Scilit] [PubMed]
- Mahlein, A.K.; Kuska, M.T.; Behmann, J.; Polder, G.; Walter, A. Hyperspectral sensors and imaging technologies in phytopathology: State of the art. Annu. Rev. Phytopathol. 2018, 56, 535–558. [Google Scholar] [CrossRef] [Scilit] [PubMed]
- Zhang, J.C.; Huang, Y.B.; Pu, R.L.; Gonzalez-Moreno, P.; Yuan, L.; Wu, K.H.; Huang, W.J. Monitoring plant diseases and pests through remote sensing technology: A review. Comput. Electron. Agric. 2019, 165, 104943. [Google Scholar] [CrossRef] [Scilit]
- Oerke, E.C. Remote sensing of diseases. Annu. Rev. Phytopathol. 2020, 58, 225–252. [Google Scholar] [CrossRef] [Scilit]
- Reis-Pereira, M.; Tosin, R.; dos Santos, F.N.; Tavares, F.; Cunha, M. Digital assessment of plant diseases: A critical review and analysis of optical sensing technologies for early disease diagnosis. Comput. Electron. Agric. 2025, 236, 110443. [Google Scholar] [CrossRef] [Scilit]
- Mahlein, A.K.; Steiner, U.; Hillnhütter, C.; Dehne, H.W.; Oerke, E.C. Hyperspectral imaging for small-scale analysis of symptoms caused by different sugar beet diseases. Plant Methods 2012, 8, 3. [Google Scholar] [CrossRef] [Scilit]
- Wahabzada, M.; Mahlein, A.K.; Bauckhage, C.; Steiner, U.; Oerke, E.C.; Kersting, K. Metro maps of plant disease dynamics—Automated mining of differences using hyperspectral images. PLoS ONE 2015, 10, e0116302. [Google Scholar] [CrossRef] [Scilit]
- Yuan, L.; Zhang, J.C.; Deng, Q.; Dong, Y.Y.; Wang, H.L.; Du, X.K. Differentiation of wheat diseases and pests based on hyperspectral imaging technology with a few specific bands. Phyton 2023, 92, 611–628. [Google Scholar] [CrossRef] [Scilit]
- Maina, A.W.; Oerke, E.C. Characterization of rice-Magnaporthe oryzae interactions by hyperspectral imaging. Plant Dis. 2023, 107, 3139–3147. [Google Scholar] [CrossRef] [Scilit]
- Leucker, M.; Mahlein, A.K.; Steiner, U.; Oerke, E.C. Improvement of lesion phenotyping in Cercospora beticola—Sugar beet interaction by hyperspectral imaging. Phytopathology 2016, 106, 177–184. [Google Scholar] [CrossRef] [Scilit]
- Oerke, E.C.; Herzog, K.; Toepfer, R. Hyperspectral phenotyping of the reaction of grapevine genotypes to Plasmopara viticola. J. Exp. Bot. 2016, 67, 5529–5543. [Google Scholar] [CrossRef] [Scilit] [PubMed]
- Oerke, E.C.; Juraschek, L.; Steiner, U. Hyperspectral mapping of the response of grapevine cultivars to Plasmopara viticola infection at the tissue scale. J. Exp. Bot. 2023, 74, 377–395. [Google Scholar] [CrossRef] [Scilit]
- Bohnenkamp, D.; Behmann, J.; Paulus, S.; Steiner, U.; Mahlein, A.K. A Hyperspectral library of foliar diseases of wheat. Phytopathology 2021, 111, 1583–1593. [Google Scholar] [CrossRef] [Scilit] [PubMed]
- Tu, B.; Zhou, T.; Liu, B.; He, Y.; Li, J.; Plaza, A. Multi-scale autoencoder suppression strategy for hyperspectral image anomaly detection. IEEE Trans. Image Process. 2025, 34, 5115–5130. [Google Scholar] [CrossRef] [Scilit] [PubMed]
- Steiner, U.; Oerke, E.C. A melanin-deficient isolate of Venturia inaequalis reveals various roles of melanin in pathogen life cycle and fitness. J. Fungi 2023, 9, 35. [Google Scholar] [CrossRef] [Scilit]
- Wilcox, W.F.; Gubler, W.D.; Uyemoto, J.K. (Eds.) Compendium of Grape Diseases, Disorders, and Pests, 2nd ed.; APS Press, American Phytopathological Society: St. Paul, MN, USA, 2015. [Google Scholar]
- Sutton, T.B.; Aldwinckle, H.S.; Agnello, A.M.; Walgenbach, J.F. (Eds.) Compendium of Apple and Pear Diseases and Pests, 2nd ed.; APS Press, American Phytopathological Society: St. Paul, MN, USA, 2014. [Google Scholar]
- Bowen, J.K.; Mesarich, C.H.; Bus, V.G.M.; Beresford, R.M.; Plummer, K.M.; Templeton, M.D. Venturia inaequalis: The causal agent of apple scab. Mol. Plant Pathol. 2011, 12, 105–122. [Google Scholar] [CrossRef] [Scilit]
- Mahlein, A.K.; Rumpf, T.; Welke, P.; Dehne, H.W.; Plümer, L.; Steiner, U.; Oerke, E.C. Development of spectral indices for detecting and identifying plant diseases. Remote Sens. Environ. 2013, 128, 21–30. [Google Scholar] [CrossRef] [Scilit]
- Pane, C.; Manganiello, G.; Nicastro, N.; Cardi, T.; Carotenuto, F. Powdery mildew caused by Erysiphe cruciferarum on wild rocket (Diplotaxis tenuifolia): Hyperspectral imaging and machine learning modeling for non-destructive disease detection. Agriculture 2021, 11, 337. [Google Scholar] [CrossRef] [Scilit]
- Zhang, X.; Wang, P.; Wang, Y.; Hu, L.; Luo, X.; Mao, H.; Shen, B. Cucumber powdery mildew detection method based on hyperspectra-terahertz. Front. Plant Sci. 2022, 13, 1035731. [Google Scholar] [CrossRef] [Scilit]
- Cheng, X.; Huang, M.; Guo, A.; Huang, W.; Cai, Z.; Dong, Y.; Guo, J.; Hao, Z.; Huang, Y.; Ren, K.; et al. Early detection of rubber tree powdery mildew by combining spectral and physicochemical parameter features. Remote Sens. 2024, 16, 1634. [Google Scholar] [CrossRef] [Scilit]
- Knauer, U.; Matros, A.; Petrovic, T.; Zanker, T.; Scott, E.S.; Seiffert, U. Improved classification accuracy of powdery mildew infection levels of wine grapes by spatial-spectral analysis of hyperspectral images. Plant Methods 2017, 13, 47. [Google Scholar] [CrossRef] [Scilit]
- Pérez-Roncal, C.; López-Maestresalas, A.; Jarén, C.; Lopez-Molina, C.; Urrestarazu, J.; Santesteban, L.G.; Arazuri, S. Hyperspectral imaging to assess the presence of powdery mildew (Erysiphe necator) in cv. Carignan Noir grapevine bunches. Agronomy 2020, 10, 88. [Google Scholar] [CrossRef] [Scilit]
- Abdulridha, J.; Ampatzidis, Y.; Qureshi, J.; Roberts, P. Identification and classification of downy mildew severity stages in watermelon utilizing aerial and ground remote sensing and machine learning. Front. Plant Sci. 2022, 13, 791018. [Google Scholar] [CrossRef] [Scilit] [PubMed]
- Lacotte, V.; Peignier, S.; Raynal, M.; Demeaux, I.; Delmotte, F.; da Silva, P. Spatial–spectral analysis of hyperspectral images reveals early detection of downy mildew on grapevine leaves. Int. J. Mol. Sci. 2022, 23, 10012. [Google Scholar] [CrossRef] [Scilit] [PubMed]
- Liu, B.; Fernandez, M.A.; Liu, T.M.; Ding, S. Investigation of using hyperspectral vegetation indices to assess brassica downy mildew. Sensors 2024, 24, 1916. [Google Scholar] [CrossRef] [Scilit] [PubMed]
- Ban, S.; Tian, M.; Hu, D.; Xu, M.; Yuan, T.; Zheng, X.; Li, L.; Wei, S. Evaluation and early detection of downy mildew of lettuce using hyperspectral imagery. Agriculture 2025, 15, 444. [Google Scholar] [CrossRef] [Scilit]
- Lyu, Y.; Kuswidiyanto, L.W.; Wang, P.; Noh, H.-H.; Jung, H.-Y.; Han, X. One-dimensional convolutional neural network for automated kimchi cabbage downy mildew detection using aerial hyperspectral images. Remote Sens. 2025, 17, 1626. [Google Scholar] [CrossRef] [Scilit]
- Kuswidiyanto, L.W.; Wang, P.A.; Noh, H.H.; Jung, H.Y.; Jung, D.H.; Han, X.Z. Airborne hyperspectral imaging for early diagnosis of kimchi cabbage downy mildew using 3D-ResNet and leaf segmentation. Comput. Electron. Agric. 2023, 214, 108312. [Google Scholar] [CrossRef] [Scilit]
- Delalieux, S.; Somers, B.; Verstraeten, W.W.; van Aardt, J.A.N.; Keulemanns, W.; Coppin, P. Hyperspectral indices to diagnose leaf biotic stress of apple plants, considering leaf phenology. Int. J. Remote Sens. 2009, 30, 1887–1912. [Google Scholar] [CrossRef] [Scilit]
- Keshavarzia, M.; Mesarich, C.; Bailey, D.; Johnson, M.; Gupta, G.S. A review of semantic segmentation methods and their application in apple disease detection. Comput. Electron. Agric. 2025, 237, 110531. [Google Scholar] [CrossRef] [Scilit]
- Anonymous. Descriptive List of Cultivars. Pomaceous Fruits Apple, Pear; Bundessortenamt: Hannover, Germany, 2000. [Google Scholar]
- Anonymous. Descriptive List of Cultivars. Grapevine; Bundessortenamt: Hannover, Germany, 2024. [Google Scholar]
- Savitzky, A.; Golay, M.J.E. Smoothing and differentiation of data by simplified least squares procedures. Anal. Chem. 1964, 36, 1627–1639. [Google Scholar] [CrossRef] [Scilit]
- Rouse, J.W.; Haas, R.H.; Scheel, J.A.; Deering, D.W. Monitoring vegetation systems in the Great Plains with ERTS. In Proceedings of the Third Earth Resources Technology Satellite (ERTS), Washington, DC, USA, 10–14 December 1973; Voulme 1, pp. 48–62. [Google Scholar]
- Gamon, J.A.; Peñuelas, J.; Field, C.B. A narrow-waveband spectral index that tracks diurnal changes in photosynthetic efficiency. Remote Sens. Environ. 1992, 41, 35–44. [Google Scholar] [CrossRef] [Scilit]
- Peñuelas, J.; Garbulsky, M.F.; Filella, I. Photochemical reflectance index (PRI) and remote sensing of plant CO2 uptake. New Phytol. 2011, 191, 596–599. [Google Scholar] [CrossRef] [Scilit]
- Hunt, E.R., Jr.; Doraiswamy, P.C.; McMurtrey, J.E.; Daughtry, C.S.T.; Perry, E.M.; Akhmedov, B. A visible band index for remote sensing leaf chlorophyll content at the canopy scale. Int. J. Appl. Earth Obs. Geoinf. 2013, 21, 103–112. [Google Scholar] [CrossRef] [Scilit]
- Guyot, G.; Baret, F.; Major, D.J. High spectral resolution: Determination of spectral shifts between the red and the near infrared. Int. Arch. Photogram. Remote Sens. Spatial Inf. Sci. 1988, 11, 750–760. [Google Scholar]
- Peñuelas, J.; Filella, I.; Biel, C.; Serrano, L.; Savé, R. The reflectance at the 950–970 nm region as an indicator of plant water status. Int. J. Remote Sens. 1993, 14, 1887–1905. [Google Scholar] [CrossRef] [Scilit]
- Yuhas, R.; Goetz, F.H.; Boardman, J.W. Discrimination among semi arid landscape endmembers using the Spectral Angle Mapper (SAM) algorithm. In Summaries of the Third Annual JPL Airborne Geoscience Workshop; Jet Propulsion Laboratory Publication: Pasadena, CA, USA, 1992; pp. 147–149. [Google Scholar]
- Kruse, F.A.; Lefkoff, A.B.; Boardman, J.B.; Heidebrecht, K.B.; Shapiro, A.T.; Barloon, P.J.; Goetz, A.F.H. The spectral image processing system (SIPS)—Interactive visualization and analysis of imaging spectrometer data. Remote Sens. Environ. 1993, 44, 145–163. [Google Scholar] [CrossRef] [Scilit]
- R Core Team. R: A Language and Environment for Statistical Computing; R Foundation for Statistical Computing: Vienna, Austria, 2024; Available online: https://www.R-project.org/ (accessed on 10 February 2025).
- Andrew, M.; Ustin, S. The role of environmental context in mapping invasive plants with hyperspectral image data. Remote Sens. Environ. 2008, 112, 4301–4317. [Google Scholar] [CrossRef] [Scilit]
- Peng, Y.; Fan, M.; Song, J.Y.; Cui, T.T.; Li, R. Assessment of plant species diversity based on hyperspectral indices at a fine scale. Sci. Rep. 2018, 8, 4776. [Google Scholar] [CrossRef] [Scilit]
- Cushnahan, T.A.; Grafton, M.C.E.; Pearson, D.; Ramilan, T. Hyperspectral data can differentiate species and cultivars of C3 and C4 turf despite measurable diurnal variation. Remote Sens. 2024, 16, 3142. [Google Scholar] [CrossRef] [Scilit]
- Yuan, L.; Zhang, J.C.; Wang, K.; Loraamm, R.W.; Huang, W.J.; Wang, J.H.; Zhao, J.L. Analysis of spectral difference between the foreside and backside of leaves in yellow rust disease detection for winter wheat. Precis. Agric. 2013, 14, 495–511. [Google Scholar] [CrossRef] [Scilit]
- Hapuarachchi, N.S.; Trueman, S.J.; Kämper, W.; Farrar, M.B.; Wallace, H.M.; Nichols, J.; Bai, S.H. Hyperspectral imaging of adaxial and abaxial leaf surfaces for rapid assessment of foliar nutrient concentrations in Hass avocado. Remote Sens. 2023, 15, 3100. [Google Scholar] [CrossRef] [Scilit]
- Fanourakis, D.; Papadakis, V.M.; Machado, M.; Psyllakis, E.; Nektarios, P.A. Non-invasive leaf hydration status determination through convolutional neural networks based on multispectral images in chrysanthemum. Plant Growth Regul. 2024, 102, 485–496. [Google Scholar] [CrossRef] [Scilit]
- Ran, D.J.; Sun, Z.Q.; Lu, S.; Omasa, K. An advanced dorsiventral leaf radiative transfer model for simulating multi-angular and spectral reflection: Considering asymmetry of leaf internal and surface structure. Remote Sens. Environ. 2025, 318, 114531. [Google Scholar] [CrossRef] [Scilit]
- Ran, D.J.; Sun, Z.Q.; Lu, S.; Omasa, K. Dorsiventral and angular resistant spectral indices for estimating leaf biochemical traits: Scaling from leaf to plant canopy levels. New Phytol. 2025, 248, 1074–1093. [Google Scholar] [CrossRef] [Scilit]
- Zhao, Y.; Yi, J.; Yao, R.J.; Li, F.; Hill, R.L.; Gerke, H.H. Dimensionality and scales of preferential flow in soils of Shale Hills hillslope simulated using HYDRUS. Vadose Zone J. 2024, 23, e20367. [Google Scholar] [CrossRef] [Scilit]
- Signoroni, A.; Savardi, M.; Baronio, A.; Benini, S. Deep learning meets hyperspectral image analysis: A multidisciplinary review. J. Imaging 2019, 5, 52. [Google Scholar] [CrossRef] [Scilit]
- Leygonie, R.; Lobry, S.; Wendling, L. Can we detect plant diseases without prior knowledge of their existence? Int. J. Appl. Earth Obs. Geoinf. 2024, 13, 104192. [Google Scholar] [CrossRef] [Scilit]
- Wei, C.; Shan, Y.; Zhen, M. Deep learning-based anomaly detection for precision field crop protection. Front. Plant Sci. 2025, 16, 1576756. [Google Scholar] [CrossRef] [Scilit]
- Min, H.J.; Qin, J.W.; Yadav, P.K.; Frederick, Q.; Burks, T.; Dewdney, M.; Baek, I.; Kim, M. Classification of citrus leaf diseases using hyperspectral reflectance and fluorescence imaging and machine learning techniques. Horticulturae 2024, 10, 1124. [Google Scholar] [CrossRef] [Scilit]
- Oerke, E.C.; Steiner, U. Imaging of leaf water patterns of Vitis vinifera genotypes infected by Plasmopara viticola. Remote Sens. 2025, 17, 1788. [Google Scholar] [CrossRef] [Scilit]

Disclaimer/Publisher’s Note: The statements, opinions and data contained in all publications are solely those of the individual author(s) and contributor(s) and not of MDPI and/or the editor(s). MDPI and/or the editor(s) disclaim responsibility for any injury to people or property resulting from any ideas, methods, instructions or products referred to in the content. |
© 2026 by the authors. Licensee MDPI, Basel, Switzerland. This article is an open access article distributed under the terms and conditions of the Creative Commons Attribution (CC BY) license.