


Highlights
What are the main findings?
- By integrating four dimensions including vegetation coverage, land use, meteorological factors and socio-economic factors, a comprehensive framework is provided for diagnosing the mechanism of dry–wet evolution.
- The results offer scientific guidance for long-term water-resource management and climate adaptation strategies in large river basins.
What are the implications of the main findings?
- The Yellow River Basin experienced a historical shift from aridification to humidification and is projected to undergo further overall humidification under increasing emission scenarios.
- The driving mechanisms of aridification and humidification are significantly different and precipitation is the decisive driving factor influencing the dry–wet evolution of the Yellow River Basin.
Abstract
Under the combined effects of climate change and anthropogenic activities, the dry–wet pattern of the Yellow River Basin is undergoing substantial reconfiguration, yet its long-term evolution and driving mechanisms remain unclear. This study constructs a Terrestrial Water Storage Anomaly-based Drought Severity Index (TWSA-DSI) using 1995–2014 as the historical period to characterize spatiotemporal dry–wet heterogeneity. Future changes during 2026–2100 are projected for the near future (2026–2060) and far future (2061–2100) under the SSP126, SSP245, and SSP585 scenarios. A comprehensive driving factor system incorporating vegetation cover, land use, meteorological conditions, and socio-economic factors is established, and dominance analysis is applied to quantify the controlling mechanisms of terrestrial water storage change (TWSC). Results indicate that the basin experienced a historical transition from aridification to humidification. Future dry–wet conditions differ markedly from the historical period, with the basin shifting toward overall humidification as emissions increase. The driving mechanisms of aridification and humidification are significantly different and precipitation is the decisive driving factor influencing the dry–wet evolution of the Yellow River Basin. Especially in the far future under the SSP585 scenario, the proportion of precipitation is as high as 54.9%. These findings provide scientific support for sustainable water-resource management under climate change.
1. Introduction
Climate change and anthropogenic activities have accelerated the hydrological cycle [1], triggering a restructuring of the dry and wet landscape [2]. The frequency of extreme events such as droughts and floods has increased [3,4], posing a serious threat to the natural ecology and socio-economic landscape [5,6,7]. Future drought and flood risk is likely to continue to increase due to anthropogenic activities and ongoing changes in the global climate [8,9,10]. In order to minimize the negative impact of drought and flood disasters, it is of great significance to effectively assess hydrological dry and wet conditions.
At present, the indicators used to quantify regional dry–wet conditions can be broadly classified into four categories: meteorological, hydrological, agricultural, and socio-economic [11]. The Standardized Precipitation Index (SPI) [12] and the Standardized Precipitation Evapotranspiration Index (SPEI) [13] are commonly used meteorological indicators. And the Streamflow Drought Index (SDI) [14], Standardized Streamflow Index (SSI) [15], and Standardized Runoff Index (SRI) [16] are developed to describe dry–wet conditions from a hydrological perspective. In agriculture, soil moisture is often used for analysis, such as the Soil Water Deficit Index (SWDI) defined by [17]. However, the above indicators can only reflect a certain link of the water cycle, and it is difficult to fully capture the combined impact of climate change and anthropogenic activities on dry and wet conditions [18]. The high-precision terrestrial water storage (TWS) data provided by the Gravity Recovery and Climate Experiment (GRACE) satellite system provided a breakthrough for a comprehensive assessment of dry–wet evolution [19]. TWS integrates multiple water components, including snow and ice, surface water, soil water, groundwater, and canopy water storage [20], thereby better reflecting the complexity of the hydrological cycle [21]. The standardized Drought Severity Index (DSI) developed based on TWS [18] can capture dynamic changes in deep soil moisture and has been widely used in watershed-scale dry–wet assessments [22,23,24]. This index can capture the responses of dry and wet conditions to climate change and human activities more comprehensively and effectively than traditional indices, which makes it particularly suitable for regions like the Yellow River Basin, which are influenced by multiple factors, such as climate variability, land-use changes, and human water management.
In the past few years, many issues related to dry–wet evolution have been discussed in the study area. Li et al. [5] found that, from 1961 to 2020, drought events occurred more frequently than wet events in the Yellow River Basin, while drought frequency decreased and wetness increased over time. Meng et al. [25] pointed out that the Yellow River Basin showed obvious regional drought and flood evolution characteristics. Jie et al. [26] analyzed the spatiotemporal characteristics of dry and wet conditions in the Yellow River Basin in the past 61 years based on the humidity index, and predicted the future trend of dry and wet changes in the Yellow River Basin. Gao et al. [27] used SPEI to explore the evolution and continuous characteristics of dry and wet changes in the Yellow River Basin. Under the influence of climate change and anthropogenic activities, the global and regional dry–wet patterns have shown more complex trends and evolution patterns that are different from the past. However, most studies on dry and wet assessment are limited to historical periods, or only make simple fitting predictions of future dry and wet trends, so that there is uncertainty about the future long-term changes in dry and wet conditions. In recent years, many GCM simulations from the Coupled Model Intercomparison Project Phase 6 (CMIP6) have become available [28], providing an important basis for projecting future dry–wet changes under different warming and development scenarios.
Identifying the driving mechanisms of dry and wet events is crucial for disaster prevention and control. The driving factors of dry and wet changes in the Yellow River Basin include natural and human factors. Relevant studies have shown that the drought evolution in the Yellow River Basin is often influenced by a combination of natural factors such as precipitation, reference evapotranspiration, average wind speed, temperature, water vapor pressure, runoff, and relative humidity [29,30]. LULC changes also play a role [31]. Although many studies have explored the influencing factors of dry–wet evolution in the Yellow River Basin, there are still shortcomings in the selection of driving factors. Most studies only focus on natural factors, and there is a lack of exploration of the relationship between human activity-related factors and dry and wet events. However, indicators related to anthropogenic activities should also be considered when developing drought and flood management strategies [32]. For example, revealing the impact of socio-economic development (expressed in terms of population and GDP) on dry and wet events is important for human response to extreme disasters [33]. In addition, most existing studies have focused on the driving mechanisms of aridification, whereas the mechanisms underlying the wetting process in the basin have received much less attention. It is therefore important to integrate multidimensional data and deepen the mechanism research on the relationship between the changing environment and the evolution of dry and wet to improve the ability to respond to the evolution of dry and wet patterns in the future.
The Yellow River Basin has a vast area, and its dry and wet characteristics are affected by various factors such as topography and altitude, showing significant differences in different provinces and regions [5,34], and the driving mechanism of dry–wet evolution is also different. In view of the above research shortcomings, singular spectrum analysis (SSA) and the Theil–Sen slope method were used to analyze the spatiotemporal evolution of dry and wet conditions in the watershed, and the drought characteristics were extracted based on the range theory. In order to attribute the dry–wet evolution, we selected nine driving factors with clear physical mechanisms, and used advantage analysis to quantify the relative contribution of each factor to drought and wetting. The core research objectives are: (1) to reveal the spatiotemporal evolution trend and dry–wet characteristics of the Yellow River Basin under the historical period and the three future SSPs scenarios and (2) to quantify the relative importance of different driving factors in explaining the dry–wet evolution, identify the dominant drivers of each dry–wet region, and explain the driving mechanism of dry–wet evolution. This study aims to elucidate the variation characteristics and causes of dry and wet events in the Yellow River Basin, and to provide key scientific support for the formulation of regional differentiated disaster prevention and mitigation and water resources management strategies.
2. Study Area and Data
2.1. Study Area
The Yellow River Basin spans from 96°E to 119°E longitudinally and from 32°N to 42°N latitudinally (Figure 1), covering Qinghai, Gansu, Ningxia, Inner Mongolia, Shanxi, Shaanxi, Henan and other provinces, and it is an important economic corridor for our country’s “Belt and Road” land route. The basin lies within the westerly wind belt of the atmospheric circulation system, with most of its territory situated in arid and semi-arid regions [35]. The basin is composed of three distinct climate zones: the southeastern region has a semi-humid climate, the central region has a semi-arid climate, and the northwestern region has an arid climate [30]. The basin suffers from water scarcity, fragile ecosystems, and is highly susceptible to the impacts of climate change and anthropogenic activities [36]. To better address drought and flood disasters in the Yellow River Basin, it is essential to gain a deeper understanding of the characteristics of moisture fluctuations in the basin under climate change, enhance theoretical insights into the relationship between climate change and moisture dynamics, and thereby provide robust support for disaster response strategies in the region.
Figure 1.
Study area overview: (a) location of the study area; (b) elevation and provincial distribution of the study area; (c) the distribution of land-use types in the study area.
2.2. Data
2.2.1. GRACE-REC Dataset
The water storage anomaly data used in this study are derived from the GRACE TWS Reconstruction (GRACE_REC_v03) dataset. The GRACE-REC data provide non-seasonal terrestrial water storage (TWS) anomalies expressed in millimeters (kg m−2) [37]. This dataset includes reconstructed time series of monthly TWS anomalies at a spatial resolution of 0.5° × 0.5° for three different meteorological forcing datasets: two different mascon (mass concentration) products and MSWEP, GSWP3, and ERA5 meteorological forcing datasets. The GRACE TWS reconstruction dataset published by Humphrey et al. [37] is available at https://doi.org/10.6084/m9.figshare.7670849 (accessed on 17 June 2025). To account for uncertainties arising from different data products, a bilinear interpolation method was used to uniformly interpolate all data to a 0.25° × 0.25° spatial grid. The temporally overlapping portions of the six datasets were averaged to obtain the reconstructed monthly scale TWS anomaly dataset for the Yellow River Basin from 1995 to 2014.
2.2.2. Vegetation Index Data
The Leaf Area Index (LAI) is used to quantify vegetation coverage in land cover. LAI primarily characterizes differences in vegetation vertical structure and reflects the impact of changes in light on vegetation, effectively highlighting the influence of spatial heterogeneity in vegetation coverage on water storage within the Yellow River Basin. The GIMMS LAI4g dataset published by Cao et al. [38], which has a spatial resolution of 1/12° and temporal resolution of half a month, is available at https://doi.org/10.5281/zenodo.7649107 (accessed on 17 June 2025). For convenience of analysis, this study converted it into a monthly time series with a spatial resolution of 0.25° × 0.25°.
2.2.3. Land-Use Dataset
Four land-use types (primary and secondary land, pastures, cropland, and urban) are used to characterize surface hydrological characteristics. Land-use data are sourced from the global gridded annual-scale data provided by ISIMIP (https://data.isimip.org/search/, accessed on 17 June 2025). These data are obtained at a spatial resolution of 0.5° and uniformly resampled to a spatial resolution of 0.25° × 0.25°.
2.2.4. Temperature and Precipitation Dataset
The temperature and precipitation data are from the 1 km monthly temperature and precipitation dataset of China published by Peng et al. [39] (https://doi.org/10.5194/essd-11-1931-2019, accessed on 18 June 2025). The dataset provides a monthly temperature dataset at 2 m (average monthly temperature, TMP), with units of 0.1 degrees Celsius, and monthly precipitation (PRE) in China, with units of 0.1 mm. The TMP and PRE data have been resampled to a spatial resolution of 0.25° × 0.25°, consistent with the TWSA data.
2.2.5. Socio-Economic Data
The study selected population, gross domestic product (GDP), and sectoral water-use (including irrigation water-use, manufacturing water-use, and domestic water-use) data to represent the impact of social and economic activities on the evolution of dry and wet conditions. For the historical period, we utilized the global gridded annual population data with a resolution of 0.5° provided by ISIMIP (https://data.isimip.org/search/, accessed on 22 June 2025) and the 5 arcmin-resolution gridded GDP dataset (https://doi.org/10.5061/dryad.dk1j0, accessed on 22 June 2025) published by Kummu et al. [40] and the High-resolution Sectoral Water-Use Dataset (HSWUD) with a spatial resolution of 0.1°, which was published by Zhang et al. [41] and can be accessed at https://doi.org/10.6084/m9.figshare.27610524 (accessed on 22 June 2025). For future periods, we selected the estimated dataset under the “universal two-child policy” released by Jiang et al. [42]. This dataset incorporates the results of China’s population and economic censuses and annual statistical yearbooks, using a population–development–environment (PDE) model and a Cobb–Douglas production model with localized population and economic parameters to estimate annual gridded SSPs population and economic data for the period 2026–2100. This dataset is one of the most China-specific datasets available today, including grid-based population and GDP data under different SSPs, with a spatial resolution of 0.5°, and is widely used in socio-economic risk assessments of extreme hydrological events [43]. The data can be obtained from https://doi.org/10.57760/sciencedb.01683 (accessed on 22 June 2025). The future sectoral water-use data was derived from the 0.5° resolution global monthly sectoral water-use dataset published by Khan et al. [44] and can be downloaded from a dataverse online repository (https://doi.org/10.7910/DVN/VIQEAB, accessed on 22 June 2025).
2.2.6. CMIP6 Model Simulation Dataset
To investigate the future dry–wet evolution of the Yellow River Basin and its driving factors, this study utilized five model simulation datasets provided by CMIP6 (https://esgf-node.llnl.gov/projects/cmip6/, accessed on 26 June 2025): terrestrial water storage (TWS), temperature, precipitation, Leaf Area Index (LAI), and four land-use types (primary and secondary land, pastures, cropland, and urban). The data cover the historical period and three major climate scenarios (SSP1-2.6, SSP2-4.5, and SSP5-8.5). During the selection process of climate models, we chose a global climate model (GCM) that incorporates data on temperature, precipitation, and land use. We also ensured that these models cover four research periods: the historical period, SSP126, SSP245, and SSP585. This ensures that these models can cover various climate scenarios, and that the different data sources all come from relatively consistent models, thereby effectively guaranteeing the reliability of the research results. Due to data availability constraints, water storage data from the CESM2, CNRM-CM6-1, IPSL-CM6A-LR, and NorESM2-LM climate models were finally selected, along with data from the CESM2, CESM2-WACCM, CMCC-CM2-SR5, EC-Earth3-Veg, EC-Earth3-Veg-LR, IPSL-CM6A-LR, and MPI-ESM1-2-LR climate model data, with three repeated climate models, totaling nine global climate models (GCMs) (Table 1). Additionally, due to data gaps, the SSP126 scenario data for the Leaf Area Index from the CMCC-CM2-SR5 climate model could not be collected.
Table 1.
Basic information of CMIP6 global climate models.
To ensure temporal consistency between observational data and historical model simulation data, the period from 1995 to 2014 was selected as the historical model simulation period. The period from 2026 to 2100 was selected as the future model simulation period, with the near-future period defined as 2026–2060 and the far-future period as 2061–2100. Considering that the resolution of different climate models varies, a bilinear interpolation method was used to interpolate data from different climate models to a uniform resolution of 0.25° × 0.25°. Finally, the results from different climate models were averaged to effectively reduce the uncertainty in climate simulations [45].
3. Methods
To conduct a comprehensive study on the dry–wet evolution in the Yellow River Basin and its driving mechanisms, this study adopted a comprehensive methodological framework consisting of three main components (Figure 2). The first part is data processing. Based on the observational dataset, the CMIP6 data were first resampled to a consistent spatial resolution, and then bias correction was carried out using the Delta method and the trend-preserving bias correction method according to the data characteristics. Finally, bias-corrected results were obtained for four datasets under different future scenarios. The second part is dry–wet analysis. Based on TWSA-DSI, singular spectrum analysis and trend analysis methods were used to conduct spatiotemporal evolution analysis of dry–wet conditions, and the run-length theory was adopted to extract the characteristics of dry–wet events. The third part is driving analysis. The dominant analysis method was used to quantify the contribution degrees of the driving factors in four dimensions (vegetation coverage, land use, meteorological factors, and socio-economic factors), further analyzing the driving mechanism of dry–wet evolution.
Figure 2.
Overall research framework.
3.1. Dry–Wet Assessment Index
Terrestrial water storage anomaly (TWSA) in GRACE hydrological applications usually refers to the difference between the water storage volume of a given month and that of a reference period. The TWSA calculation formula is as follows:
where denotes the TWSA at year i and month j; denotes the TWS at year i and month j; and refers to the mean value of TWS within the anomaly period.
The period from 2004 to 2009 was used as a fixed reference period for calculating the anomaly of GRACE data. After subtracting the mean value of the sequence during the period of 2004 to 2009, the monthly TWSA sequences for the historical period from 1995 to 2014 and the future period from 2026 to 2100 were obtained [43].
The difference in terrestrial water storage between adjacent times is referred to as terrestrial water storage change (TWSC), and it is estimated using the double-difference derivation based on TWSA [46]:
The degree of dryness and wetness in the Yellow River Basin was measured using the TWSA-DSI metric proposed by Zhao et al. [18]. TWSA-DSI provides information on the deep water storage changes that affect soil moisture recharge and drought recovery, thus complementing the traditional drought indicators. The calculation formula of TWSA-DSI is as follows:
where denotes the TWSA at year i and month j; () refers to the mean value (standard deviation) of TWSA at month j. The negative value of TWSA-DSI indicates that the water storage anomaly was drier than the average state during the study period, which is used to quantify the water deficit conditions and drought severity; similarly, the positive value can be used to quantify the level of wetness. The ranking percentile of DSI is classified into eleven dry–wet categories by matching it to the thresholds used by the USDM (U.S. Drought Monitor) (i.e., 30%, 20%, 10%, 5%, and 2%) [47] (Table 2).
Table 2.
Classification standards for dry and wet conditions.
3.2. Bias Correction Method
The bilinear interpolation method, due to its simple operation and sufficient accuracy for the selected GCM, has been widely applied in the coarse spatial resolution downscaling of GCM data. Compared with simpler methods such as nearest-neighbor interpolation, bilinear interpolation can better preserve spatial continuity and avoid artificial discontinuities, making it particularly suitable for continuous variables (e.g., temperature and precipitation). Therefore, the spatial resolution of the model simulation data was resampled from the original GCM resolution to a grid size of 0.25° × 0.25° using the bilinear interpolation method, followed by bias correction.
We employed two distinct deviation correction methods, namely the Delta method and the trend-preserving bias correction method, to correct the deviations in different data sets. The choice of these methods was based on the nature of the variables to be corrected and the need to preserve specific aspects of the data. The Delta method was applied to variables such as temperature, precipitation, and LAI. The reason for choosing this method is that these variables exhibit short-term fluctuations and their changes are less influenced by long-term trends. The Delta method is highly effective in correcting the average deviations of these variables without distorting their inherent variability. The trend-preserving bias correction method was applied to TWSA. TWSA is directly related to water storage and is expected to follow long-term trends related to climate change and human activities. This method aims to correct deviations while maintaining the long-term trend of the variable, which is crucial for accurately assessing the dynamic changes in long-term drought and wet conditions.
3.2.1. Delta Method
Currently, the GCM downscaling method has been widely applied in domestic and international research, such as BCSD (Bias Correction and Spatial Disaggregation) [48], SDSM (Statistical Downscaling Model) [49], and the Delta method [50,51], etc. Previous studies have shown that the Delta method has a relatively excellent bias correction effect on temperature and precipitation [36,52]. This paper uses the Delta method to correct the GCM data of temperature, precipitation, and Leaf Area Index, thereby reducing the deviation between the observed data and the GCM output. The calculation formula for the deviation between the data is as follows:
where and denote the annual mean values of the observational data and the GCM simulation data during historical periods, respectively; ∆ denotes the possible deviation between the observational data and the GCM simulation data; ∘ denotes an undefined arithmetic symbol. Temperature is denoted by a negative sign, while precipitation and Leaf Area Index are represented by division signs.
Then, the corrected data is calculated using the following formula:
where denotes the corrected GCM simulation data; denotes the original simulation data of the GCM; ∘ denotes an undefined arithmetic symbol. Temperature is denoted by a plus sign, while precipitation and Leaf Area Index are denoted by a multiplication sign.
3.2.2. Trend-Preserving Bias Correction Method
The trend-preserving method based on quantile mapping [53] was adopted to correct the biases of the monthly TWSA simulation data from GCMs. The main steps of this method are as follows.
Firstly, trend removal was performed on the observational data during the historical period (), the GCMs simulation data during the historical period (), and the GCMs simulation data during the scenario period (), resulting in three new data series: , and .
Subsequently, by leveraging additive trend preservation, the change signals were transferred between the simulation series ( and ) to the observation series (), thereby generating a pseudo-future observation series ().
Finally, quantile mapping was used to adjust the distribution of to and then the trend term that was deducted was added to obtain the bias correction result.
3.3. Attribution Analysis
The predictor variables used in the attribution analysis include vegetation indicators, land-use variables, climatic factors, and socio-economic factors. Due to the interaction between the climate–hydrological system and the human activity system, there may be a certain degree of correlation among these variables. To reduce the influence of multicollinearity on the interpretation of the results, this study adopted the dominance analysis method. Dominance analysis (DA) [54,55] was employed to determine the relative importance of different variables in explaining the variability of the target variable (the dynamic changes in drought and wetness). Different from traditional regression methods, dominance analysis assesses the incremental explanatory power of each predictor variable in all possible model combinations, and evaluates its relative contribution, thereby more robustly evaluating the relative importance of different driving factors. This method calculates “dominance weights”, which represent the overall contribution of each driver factor (such as precipitation, temperature, GDP, etc.) to the observed variability of the target variable (i.e., the terrestrial water storage change). These dominance weights can be understood as the relative influence of each factor on the dry–wet changes. The higher the weight value, the greater the relative impact of a specific factor on the dry–wet dynamics of the Yellow River Basin; while a lower weight value indicates a smaller contribution. In summary, these weights show the driving degree of each factor on the change in water storage and the resulting drought and wetness evolution.
Dominance weights measure each predictor’s average incremental contribution to explained variance (R2) across all possible subsets of the other predictors, so they reflect a variable’s importance across different model contexts rather than only in the full model. Let the full set of driver factors be . For any subset , denote by R2(S) the coefficient of determination obtained by fitting the model with driver factors in S. For a driver factor and a subset (a subset that does not contain j), define the increment R2 of this variable j relative to S as
Thus, the dominance weight for driver factor j is the average of across all subsets . The calculation formula for the dominance weight is as follows:
4. Results
4.1. Evaluation of Bias-Correction Performance
The Delta method and the trend-preserving bias correction method were used to correct the bias in large-scale uncorrected monthly GCM data such as LAI. The bias correction effect was evaluated using root mean square error (RMSE) and correlation coefficient (CC) based on observed values, and the results were presented in the form of a Taylor plot (Figure 3). The correction effect for temperature is significantly better than that for LAI and precipitation, with the CC of the corrected data exceeding 0.97, the RMSE below 2.5 °C, and little difference in the bias correction effects among different GCM simulation data. LAI and precipitation data also exhibit good correlation after correction, with the best-performing models being EC-Earth3-Veg and CESM2. The CC for LAI ranges from 0.7 to 0.95, with RMSE between 0.2 and 0.4 m2/m2; for precipitation, the CC ranges from 0.6 to 0.9, with RMSE between 15 and 30 mm. Additionally, compared to a single GCM, the ensemble mean of multiple GCMs shows better performance due to reduced uncertainty between different models. After correction, the CC values of several ensemble mean sequences of WTSA reach 0.75. Overall, all GCM data perform well after bias correction, with an effective reduction in deviations from observational data, making them suitable for future climate scenario assessments and attribution studies.
Figure 3.
Taylor diagram for bias correction of CMIP6 model data: (a) LAI; (b) temperature; (c) precipitation.
4.2. Spatial and Temporal Characteristics of Dry–Wet Evolution
Understanding the long-term spatiotemporal variation trend of DSI is crucial for evaluating the spatiotemporal evolution of the dry–wet environment in the Yellow River Basin. For the monthly DSI, we use a 120-month time window to capture its periodic variation and secular trend, and employ the Theil–Sen median method to assess the interannual spatial variability of DSI. Based on the historical period (1995–2014) and three scenarios of SSP126, SS245, and SSP585, Figure 4 shows the long-term trend of the overall average DSI in the Yellow River Basin. Figure 5 presents the spatial distribution of DSI variability at each grid point. The future period is divided into the near-term (2026–2060) and the long-term (2061–2100), and the spatial areas of increasing and decreasing trends are respectively statistically analyzed.
Figure 4.
The temporal evolution of dry and wet conditions in the Yellow River Basin during different periods: the (a) historical period (1995–2014); (b) SSP126 scenario (2026–2100); (c) SSP245 scenario (2026–2100); and (d) SSP585 scenario (2026–2100).
Figure 5.
The spatial evolution and area proportion of dry and wet conditions in the Yellow River Basin during different periods: the (a) historical period (1995–2014); (b) near-future period (2026–2060) under the SSP126 scenario; (c) far-future period (2061–2100) under the SSP126 scenario; (d) near-future period (2026–2060) under the SSP245 scenario; (e) far-future period (2061–2100) under the SSP245 scenario; (f) near-future period (2026–2060) under the SSP585 scenario; and (g) far-future period (2061–2100) under the SSP585 scenario.
The historical period shows distinct phased change characteristics (Figure 4a). Before 2000, the DSI continuously declined, with a significant trend of aridification. The drought that occurred around 2000 is the most severe one, with the minimum average DSI value of the basin reaching −1.51. However, after 2000, the basin shifted toward humidification. Under future scenarios, the three emission pathways exhibit completely different evolution patterns. The SSP126 low-emission scenario maintains a slow trend of aridification overall, but still retains obvious dry–wet fluctuation cycles (Figure 4b), with the highest and lowest basin-mean DSI values being 2.02 and −1.57, respectively; the SSP245 medium-emission scenario shows a fluctuating feature, with significant alternation between dry and wet periods (Figure 4c), and the absolute values of the average DSI extremes of the basin are also similar in size; while the SSP585 high-emission scenario shows a continuous trend of humidification (Figure 4d), with the DSI reaching a maximum of 1.79.
During the historical period, the dry–wet evolution in the Yellow River Basin exhibits significant spatial heterogeneity, with extreme differentiation (Figure 5a). Among them, the arid areas account for approximately 33% and are mainly concentrated in the northern and eastern parts of the basin, which largely coincide with the main agricultural irrigation areas of the Yellow River Basin, with a large demand for water use; the humid areas are concentrated in the western region, accounting for about 67%. The dry–wet pattern in the future period undergoes a completely different transformation compared to the historical period. Under the SSP126 scenario, the area of aridification is significantly larger than that of humidification, and the entire basin shows a slow but widespread aridification trend (Figure 5b,c); under the SSP245 scenario, the proportions of humidification and humidification areas are similar, with the humidifying area being slightly larger (Figure 5d,e); under the SSP585 scenario, the basin is dominated by humidification, with only a small part of the western and northwestern regions showing a trend of aridification (Figure 5f,g). Overall, in the low-emission scenario, the aridification in the far future is more significant compared to the near future in the northwest and the farthest western parts of the basin; in the medium-emission scenario, there is no significant difference in the dry–wet changes between the near future and the far future; while in the high-emission scenario, the estimated changes in the far future are significantly higher than those in the near future, and the northern part of the basin shows a very significant humidification trend.
4.3. Characteristics of Dry and Wet Events in the Yellow River Basin
Based on the three-threshold run theory method, R1, R2, and R3 are respectively set as the judgment thresholds for no drought (no flood), mild drought (mild flood), and moderate drought (moderate flood) events, with values of 0, −0.5 (0.5), and −0.8 (0.8). Multiple dry and wet disaster characteristics (quantity, duration, severity) in the historical period and different future scenarios were extracted, thereby characterizing dry and wet events from multiple perspectives (Figure 6 and Figure 7).
Figure 6.
Spatial distribution of the (a) number, (b) duration, and (c) severity of dry events in the Yellow River Basin during different periods: the (a1–c1) historical period (1995–2014); (a2–c2) near-future period (2026–2060) under the SSP126 scenario; (a3–c3) far-future period (2061–2100) under the SSP126 scenario; (a4–c4) near-future period (2026–2060) under the SSP245 scenario; (a5–c5) far-future period (2061–2100) under the SSP245 scenario; (a6–c6) near-future period (2026–2060) under the SSP585 scenario; and (a7–c7) far-future period (2061–2100) under the SSP585 scenario.
Figure 7.
Spatial distribution of the (a) number, (b) duration, and (c) severity of wet events in the Yellow River Basin during different periods: the (a1–c1) historical period (1995–2014); (a2–c2) near-future period (2026–2060) under the SSP126 scenario; (a3–c3) far-future period (2061–2100) under the SSP126 scenario; (a4–c4) near-future period (2026–2060) under the SSP245 scenario; (a5–c5) far-future period (2061–2100) under the SSP245 scenario; (a6–c6) near-future period (2026–2060) under the SSP585 scenario; and (a7–c7) far-future period (2061–2100) under the SSP585 scenario.
Historical data show that in the southwest region, both drought and wet events exhibit the characteristics of “few occurrences–long duration–high severity” (with about 0.5 droughts per year and an average duration of over 10 months), while in the Gansu-Ningxia region and the northeast, they mainly present as “frequent occurrences–short duration–low severity” events (with up to about 0.8 droughts per year and an average duration of about 5 months).
Compared with the historical period, the spatial patterns and intensities of dry and wet events under various future scenarios undergo significant differentiation. Under the low-carbon emission scenario (SSP126), in the near future, the southwestern part of the basin experiences a relatively high annual frequency of drought events (exceeding about 0.6 times per year), but with shorter durations and reduced severity. In the far future, drought conditions in the basin further intensify, especially in the southeast, reflecting the continuous aggravation of the drought process under a low greenhouse gas emission path. For wet events, in the near future, the southeast of the basin shows a state of high frequency, moderate duration, and moderate severity; in the far future, the overall frequency decreases, the average duration shortens, and the severity weakens.
Under the medium-emission scenario (SSP245), the climate variability remains relatively stable, and the spatial patterns of dry and wet events are similar in the near and far future. This indicates that the medium-emission pathway exerts a relatively consistent influence on the spatial differentiation of the two extreme events, and the basin’s response shows a strong spatial inertia. Among them, the southern part of the basin has the characteristics of numerous, short-duration, and low-severity dry and wet events. In contrast, the northern part has fewer, longer-duration, and higher-severity events.
Under the high-emission scenario (SSP585), both the near- and far-future periods in the southern part of the basin are characterized by high-frequency dry and wet events (with frequencies exceeding 0.5 times per year). In the far future, with the sharp increase in carbon emissions and the expansion of climate variability, the frequency of wet events in the northern region further increases, tending to become long-term and frequent, reflecting how high carbon emissions significantly intensify regional hydrological extremes.
In summary, different emission paths correspond to differentiated trajectories of dry and wet event evolution. Continuous overall aridification under the low-emission scenario; maintaining a strong spatial pattern inertia under the medium-emission scenario; and triggering more extreme dry and wet differentiation and event intensification under the high-emission scenario. This indicates that carbon emission levels profoundly modulate the spatiotemporal reorganization patterns of dry and wet events.
4.4. Dry–Wet Attribution Analysis
4.4.1. Contributions Quantification of Drivers
Using dominance analysis, the relative importance of different driving factors in explaining the dry–wet evolution of the Yellow River Basin during the historical and future periods was quantified. And by comparing the relative importance of each driving factor in each grid cell, the main driving factors affecting the dry–wet evolution were determined (Figure 8).
Figure 8.
The dominant factors influencing the evolution of dry–wet conditions in the Yellow River Basin during different periods: the (a) historical period (1995–2014); (b) near-future period (2026–2060) under the SSP126 scenario; (c) far-future period (2061–2100) under the SSP126 scenario; (d) near-future period (2026–2060) under the SSP245 scenario; (e) far-future period (2061–2100) under the SSP245 scenario; (f) near-future period (2026–2060) under the SSP585 scenario; and (g) far-future period (2061–2100) under the SSP585 scenario.
Overall, precipitation is the most significant factor influencing the dry–wet evolution of the river basin during the historical period, and its dominant role is mainly concentrated in the southwestern and northern regions of the basin; while temperature is the main controlling factor for the dry–wet evolution in the Gansu region (Figure 8a). In the southeastern part of the basin, the dry–wet evolution is mainly influenced by LAI, land-use changes, and socio-economic factors. Compared to other factors, the overall influence of social economic factors on the dry–wet evolution of the basin is relatively weak. Among the socio-economic factors, the ones with a wider influence range are mainly irrigation water use and manufacturing water use. The dominant area of irrigation water use is mainly distributed in the border area of Shaanxi–Shanxi–Henan, parts of Ningxia and Inner Mongolia, the border area between Qinghai and Gansu, and the central part of the basin. Most of these areas are located along the main trunk of the Yellow River and its main tributaries, with relatively abundant water resources and developed agricultural activities. Therefore, irrigation water use has a certain impact on the changes in regional water storage. In contrast, manufacturing water use is concentrated in Shanxi Province and is distributed in a band along one of the tributaries of the Yellow River, which is consistent with the characteristic that manufacturing has a greater demand for water resources.
In the future period, precipitation remains the primary factor influencing the dry–wet evolution of the river basin. Under the SSP126 scenario, in the near-future, the precipitation-dominated areas are mainly concentrated in the southeastern part of the basin (Figure 8b), while in the far future, they concentrated in the northeastern part of the basin (Figure 8c). In both the near- and far-future periods, the temperature-dominated areas are mainly located in the regions of Gansu and Qinghai, while LAI is mainly distributed in the Inner Mongolia region and the regions of Shaanxi and Henan, and the land-use factors are mainly located in Inner Mongolia. The role of society and economy is not obvious in the near-future period, with the role of irrigation water being slightly more significant, mainly distributed in the Inner Mongolia region; while in the far-future period, a small part of irrigation water use and domestic water use is concentrated in the northern part of the basin within Inner Mongolia, and the population is concentrated near Xi’an, the provincial capital of Shaanxi Province (Figure 1b). Under the SSP245 scenario, the distribution of the dominant factors varies significantly in the near- and far-future periods. In the near future, precipitation almost affects the entire southern part of the basin, while the temperature is mainly located in the southwestern part of Qinghai Province. The dominant areas of LAI, land use, and social and economic factors are all concentrated in the northern part of the basin (Figure 8d). In the far-future period, the influence of climate factors weakens, and the precipitation-dominated and temperature-dominated areas are respectively concentrated in the southwestern and southeastern parts of the basin, while the dominant areas of other factors are more scattered (Figure 8e). The importance of precipitation in influencing dry–wet changes is very significant in the SSP585 scenario. In the near-future period, the precipitation-dominated areas are mainly distributed in the southwestern, northwestern, and eastern parts of the basin (Figure 8f), while in the far-future period, they are concentrated in almost the entire southern part of the basin (Figure 8g). In addition, in the near-future period, the dominant area of LAI is distributed in Inner Mongolia, Qinghai, Gansu, and Shaanxi, and the dry–wet evolution of the westernmost part of the basin is mainly dominated by pastures, while the dominant ranges of temperature and population are respectively concentrated in the southeastern part of the basin and near Xi’an (Figure 8f). In the far-future period, the areas dominated by temperature, society and economy, LAI, and land-use factors for the dry–wet evolution are fragmentedly distributed in the northern and southeastern parts of the basin.
Overall, regardless of the historical period or the future period, precipitation plays a crucial role in influencing the dry–wet evolution of the river basin. The effects and distributions of other factors are quite different. Comparatively speaking, in the historical period, land use mainly had a dominant effect on the southeastern part of the river basin. In the future period, especially in the SSP126 and SSP245 scenarios, land use more significantly dominated the dry–wet evolution of the northwestern part of the river basin. The differences among different future scenarios are also very obvious, especially the extreme emission scenarios. Under the low-emission scenario, the overall influence of land-use factors and socio-economic factors on the dry–wet evolution was not significant. This indicates that under the low forcing sustainable development path, the changes in land use and human activity intensity in the Yellow River Basin and their interference with the change in terrestrial water storage will remain at a relatively low level. In the high-emission scenario, especially in the far-future period, the impact of climate change on dry–wet conditions is very significant, indicating that the drastic changes in climate have disrupted the balanced state where various factors jointly drive the dry–wet evolution, and the Yellow River Basin will face a risk pattern where climate is the sole driver of dry–wet evolution.
To more intuitively compare the contribution of each driving factor to the dry and wet changes in the Yellow River Basin, the dominant area of each factor in different periods is statistically analyzed to obtain the proportion of the dominant area (Figure 9). Generally speaking, in the historical period, precipitation is the factor that made the greatest contribution to the dry–wet evolution of the basin, with a dominant area proportion of 33.7%, while the area proportions of the other factors are all within 7% (Figure 9a). For the future period, under the SSP126 scenario, precipitation, temperature and LAI are the three factors with the largest dominant area proportions, and the dominant area proportions of other factors are all within 7% (Figure 9a). Under the SSP245 scenario, precipitation, temperature and LAI still had relatively high proportions, and precipitation and temperature are the factors with the largest dominant area proportions in the near- and far-future periods, respectively, at 51.2% and 40.5% (Figure 9b). Under the SSP585 scenario, precipitation and temperature became the factors with the highest dominant area proportions, while the dominant area proportions of other factors are all less than 10% (Figure 9c). It is worth noting that the proportion of temperature in this high-emission scenario is only about 13%, indicating that the temperature change caused by a large amount of greenhouse gas emissions plays a more indirect role in the dry–wet evolution of the Yellow River Basin.
Figure 9.
The area proportion of the dominant factors influencing the dry–wet evolution as well as the comparison between historical and future scenarios in the Yellow River Basin: (a) comparison of the proportions of the historical period (1995–2014), the near-future period (2026–2060) under the SSP126 scenario and the far-future period (2061–2100) under the SSP126 scenario; (b) comparison of the proportions of the historical period (1995–2014), the near-future period (2026–2060) under the SSP245 scenario and the far-future period (2061–2100) under the SSP245 scenario; (c) comparison of the proportions of the historical period (1995–2014), the near-future period (2026–2060) under the SSP585 scenario and the far-future period (2061–2100) under the SSP585 scenario.
4.4.2. Comparison of the Relative Importance of Driving Factors in Drying/Wetting Regions
Figure 10 shows the transformation of aridification and humidification in the Yellow River Basin at different periods. In the historical period, the areas of aridification and humidification in the Yellow River Basin account for 33% and 67%, respectively. For the future period, under the SSP126 scenario, most of the humidification areas in the historical period transform into aridification trends (Figure 10a). In the SSP245 scenario, the proportion of aridification/humidification areas is very similar to that of the historical period (Figure 10b), which may be related to the fact that the social and economic development pattern presented in this scenario is similar to that shown in previous historical periods. However, it can be seen that some of these areas also experience a tortuous transformation of aridification and humidification, and do not always maintain the same aridification or humidification trend. In the SSP585 scenario, overall, the total proportion of aridification areas gradually decreases, especially in the far-future period, the proportion of aridification areas is only 19% (Figure 10c).
Figure 10.
The proportion transformation of drying/wetting between historical and future scenarios in the Yellow River Basin: (a) the proportion transformation of drying/wetting between historical period (1995–2014), the near-future period (2026–2060) under the SSP126 scenario and the far-future period (2061–2100) under the SSP126 scenario; (b) the proportion transformation of drying/wetting between historical period (1995–2014), the near-future period (2026–2060) under the SSP245 scenario and the far-future period (2061–2100) under the SSP245 scenario; (c) the proportion transformation of drying/wetting between historical period (1995–2014), the near-future period (2026–2060) under the SSP585 scenario and the far-future period (2061–2100) under the SSP585 scenario.
The dry and wet condition of the Yellow River Basin undergoes complex and tortuous changes in different periods and under different circumstances. Moreover, the driving mechanisms behind these changes also require in-depth exploration. Statistical analysis was conducted on the dominant driving factors of the aridification/wetting regions of the river basin in different periods, as shown in Figure 11.
Figure 11.
Comparison of the relative importance of various driving factors in drying and wetting regions in the Yellow River Basin during different periods: the (a) historical period (1995–2014); (b) near-future period (2026–2060) under the SSP126 scenario; (c) far-future period (2061–2100) under the SSP126 scenario; (d) near-future period (2026–2060) under the SSP245 scenario; (e) far-future period (2061–2100) under the SSP245 scenario; (f) near-future period (2026–2060) under the SSP585 scenario; and (g) far-future period (2061–2100) under the SSP585 scenario.
During the historical period, the process of regional aridification is mainly controlled by precipitation changes, and its influence exceeds that of other driving factors, while the trend of wetting is more often the result of the collaborative drive of multiple factors (Figure 11a). This difference reflects that aridification has a stronger direct dependence on water supply, while wetting may be more subject to complex regulation by buffering or feedback mechanisms such as vegetation and land use.
In the future period, the driving mechanisms of arid and humid regions under different scenarios show significant differentiation. In the SSP126 low-emission scenario, the aridification in the near future is mainly dominated by LAI and precipitation (Figure 11b); in the far future, the addition of the temperature factor highlights the gradual strengthening of the impact of climate change (Figure 11c). In contrast, in this scenario, the process of humidification will be slightly more dependent on land use in the near future (Figure 11b); while in the far future, it will be driven by both climate change and LAI (Figure 11c), indicating that, in this scenario, long-term humidification still relies on the combined effect of climate and vegetation coverage changes.
In the SSP245 medium-emission scenario, aridification in the near future is still dominated by precipitation (Figure 11d), reflecting the core role of climate factors; but by the far future, the role of precipitation weakens, and the influence of LAI and land use significantly increases (Figure 11e), indicating that with increasing emissions, the contribution of vegetation coverage changes to aridification gradually amplifies. Correspondingly, humidification in the near future mainly relies on precipitation-driven effects (Figure 11d), while by the far future, it shifts to LAI as the main driver (Figure 11e), reflecting that under moderate stress, ecological management measures may gradually replace climate factors as the key to humidification in the long term.
In the SSP585 high-emission scenario, aridification in the near future is driven by LAI and precipitation together (Figure 11f); while by the far future, the influence of precipitation intensifies sharply, almost becoming the sole dominant factor of aridification (Figure 11g), indicating that in extreme climate conditions, water availability ultimately determines the dry–wet pattern. At the same time, humidification in the near future is jointly driven by LAI and precipitation (Figure 11f), while by the far future, precipitation also becomes the absolute dominant factor, and the influence of LAI weakens (Figure 11g), further confirming that under high climatic forcing, the dominant role of climatic factors has significantly strengthened. Overall, aridification and humidification in the high-emission scenario tend to be dominated by precipitation, indicating that extreme climate change weakens the regulatory capacity of human intervention and the controlling role of climate is greatly strengthened.
In summary, the driving mechanisms of aridification and humidification are significantly different and precipitation is the decisive driving factor influencing the dry–wet evolution of the Yellow River Basin. The differences among different scenarios further indicate that with the increase in emissions, the control power of climatic factors has significantly strengthened, especially in the high-emission scenario, where precipitation almost becomes the sole dominant factor.
5. Discussion
5.1. Multidimensional Analysis of Dry–Wet Evolution Mechanisms
Our results showed that the Yellow River Basin experienced a clear transition from drying to wetting during the historical period, with the basin-mean DSI reaching a minimum of −1.51 around 2000. This pattern was in line with Wang et al. [56], who also identified a turning point around 2000. Spatially, our finding that humidification accounted for about 67% of the basin, whereas aridification accounted for about 33%, was also close to the regional heterogeneity reported by Meng et al. [25]. In the historical period, precipitation occupied the largest dominant area (33.7%), which was similar to the conclusion of Wang et al. [56] and Wei et al. [57] that precipitation variability remained the main driver of drought evolution in the Yellow River Basin. At the same time, our results showed that the influence of temperature and LAI became more evident in future periods. This was similar to Liu et al. [58], who showed that future drought changes in the basin were shaped not only by precipitation but also by warming-related processes. In other words, the dry–wet evolution identified here was related not only to water input, but also to the increasing effects of atmospheric water demand and vegetation-related land-surface regulation.
The differences among future scenarios were also comparable to earlier projections, but they further showed that mean wetting and event risk did not always change in the same direction. Our results showed that SSP126 tended toward aridification, SSP245 remained relatively close to the historical pattern, and SSP585 shifted toward overall humidification, with the proportion of aridification area decreasing to about 19% in the far future. This scenario contrast was consistent with Li et al. [59], who reported that, during 2023–2100, annual precipitation in the Yellow River Basin increased by about 6.89 mm/10a under SSP126, 5.31 mm/10a under SSP245, and 10.18 mm/10a under SSP585, while annual temperature increased by about 0.1, 0.3, and 0.7 °C/10a, respectively. These results implied a much stronger hydroclimatic intensification under SSP585. They also helped explain why SSP126 and SSP245 did not show strong basin-wide wetting: when precipitation increases were relatively limited, warming still enhanced atmospheric evaporative demand and offset part of the additional water supply. A similar interpretation appeared in Huang et al. [60], who noted that rising temperature could aggravate hydrological drought through greater evapotranspiration and water deficit even when precipitation increased. By contrast, under SSP585, the much larger precipitation increase was more likely to compensate for evapotranspiration losses and support a net increase in terrestrial water storage, which was also consistent with the moisture-budget analysis of Li et al. [61]. Even so, some subregions in our study still showed frequent or persistent extremes, suggesting that a wetter background did not necessarily mean lower dry–wet risk at the event scale.
5.2. Analysis of Uncertainties and Limitations
When conducting future scenario analysis, we employed nine CMIP6 models. These models have certain differences in the range of changes [62], introducing uncertainty into the analysis of future dry–wet evolution. This uncertainty mainly lies in the estimation of the future range of changes, that is, different models may have differences in the predicted intensities of wetness or dryness. To reduce the influence of a single model’s deviation, we adopted the multi-model ensemble average (MME) method, thereby reducing the uncertainty brought about by model selection to a certain extent [63]. In addition to the models themselves, spatial interpolation and resampling also introduce additional uncertainty [64]. Multi-source data with different original resolutions were uniformly resampled to 0.25° resolution grids, and bilinear interpolation was used for continuous variables. This may smooth local spatial gradients and weaken extreme values [65], thereby affecting the characterization of extreme events such as droughts or floods [64]. This uncertainty is more likely to affect the intensity and boundary characteristics of local hotspots, while having a relatively smaller impact on the overall dry–wet change pattern at the basin scale. In the future, higher-resolution data can be adopted, or more suitable interpolation methods can be used to retain extreme values, reducing related uncertainties.
The driving analysis also involves uncertainties [66]. In this study, several influencing factors were selected from four dimensions, including vegetation coverage, land use, meteorological changes, and socio-economic factors, to systematically analyze the driving mechanisms of the dry–wet evolution in the Yellow River Basin. Although these factors can comprehensively reflect the dual influence of nature and human activities, the hydrological system itself has significant complexity and nonlinearity [67]. The variables are not completely independent and often have coupling relationships [68]. In such cases, if the correlation between certain factors is strong, the importance of a specific factor may increase relatively, thereby affecting the ranking of the dominant factors [55]. The dominance analysis method adopted in this study can alleviate the interference of multiple collinearity, but it cannot completely eliminate the potential nonlinear relationships between the variables. Therefore, such uncertainties are more likely to affect the relative ranking of secondary dominant factors, while having relatively limited impact on the core conclusion that “precipitation is the dominant driving factor at the basin scale”. In the future, more complex models can be introduced to describe the interactions and nonlinear relationships between variables, thereby further identifying the relevant driving mechanisms. It is particularly important to note that due to the unique hydrological and climatic background, significant seasonal characteristics, complex topographical and geomorphic conditions, as well as the high intensity of human water demand and the water-resource regulation process in the Yellow River Basin [69], the generalizability of the conclusions of this study is subject to certain limitations. Therefore, the relative importance of the identified driving factors and the dry–wet response mechanism based on changes in terrestrial water storage, if not verified regionally, may not directly apply to other river basins.
6. Conclusions
This study utilized TWSA data from GRACE and CMIP6 to investigate the dry–wet patterns and their evolution under the combined influence of climate change and anthropogenic activities in the Yellow River Basin from 1995 to 2014 and from 2026 to 2100. During the historical period, the basin exhibited a phased characteristic of first becoming drier and then wetter. Arid and humid regions accounted for 33% and 67% of the basin, respectively. Frequent arid and humid events occurred in Gansu, Ningxia, and the northwest regions, while the southeast regions tended to experience low-frequency, long-duration, and severe arid and humid events. Future scenarios showed significant differences. Under the SSP126 scenario, the basin as a whole exhibited a trend toward aridification, with the most severe aridification occurring in the headwaters region. Under the SSP245 scenario, climate variability is moderate, and the spatial distribution of dry and wet event characteristics in the basin during the near- and far-future periods is not significantly different. Under the SSP585 scenario, dry and wet events in the near future are concentrated in the eastern and western regions, respectively. In the far future, both dry and wet events tend to become long-term and high-frequency. To attribute observed regional dry–wet changes to climate drivers and anthropogenic activities, dominance analysis was applied to assess the relative importance of different drivers in explaining water storage changes. Results indicate that, in terms of driving mechanisms, precipitation has a more significant impact on historical basin dry–wet evolution than other factors, accounting for 33.7% of the dominant area. For future periods, precipitation remains the key driver of basin dry–wet changes. Especially in the high-emission scenario, precipitation has almost become the sole decisive factor influencing the dry–wet evolution.
In summary, this study investigated the evolution patterns of aridification and humidification and their driving mechanisms in the Yellow River Basin during different time periods. The results provide new insights into the spatiotemporal variability of drought–wetness conditions and the combined influences of climatic factors and human activities in the basin. From a practical perspective, this study provides useful insights for reservoir operation, water allocation, and drought–flood risk management in the Yellow River Basin. By incorporating sectoral water-use indicators—irrigation water use, manufacturing water use, and domestic water use—into the attribution framework, we improve the representation of human water demand, which is closely related to regional water allocation processes. This provides a useful reference for understanding potential pressures on water resources and may support more informed reservoir scheduling and water-use management under changing climatic conditions. In addition, by clarifying the dominant drivers of dry–wet evolution under historical and future scenarios, our results offer insights into potential dry–wet transitions, thereby contributing to forward-looking water-resource planning and hydrological risk assessment.
Author Contributions
Conceptualization, Q.Y., S.C. and Y.G.; methodology, Q.Y., S.C., H.C. and X.T.; software, Q.Y. and S.C.; validation, Q.Y. and S.C.; formal analysis, Q.Y.; investigation, Q.Y. and S.C.; resources, S.C., Y.-P.X. and Y.G.; data curation, Q.Y., S.C. and Y.G.; writing—original draft preparation, Q.Y.; writing—review and editing, Y.-P.X., Y.G., H.G., H.C. and X.T.; visualization, Q.Y. and S.C.; supervision, Y.-P.X., Y.G., H.G., H.C. and X.T.; project administration, Y.-P.X. and Y.G.; funding acquisition, Y.G. All authors have read and agreed to the published version of the manuscript.
Funding
This study is supported by the National Natural Science Foundation of China (52009121) and the National Natural Science Foundation of China (52579023).
Data Availability Statement
The GRACE TWS reconstruction dataset published by Humphrey et al. [37] can be obtained at https://doi.org/10.6084/m9.figshare.7670849 (accessed on 17 June 2025). The GIMMS Leaf Area Index (GIMMS LAI4g) global dataset with temporal consistency published by Cao et al. [38] can be accessed at https://doi.org/10.5281/zenodo.7649107 (accessed on 17 June 2025). Land-use data come from the global gridded annual-scale data provided by ISIMIP (https://data.isimip.org/search/, accessed on 17 June 2025). Temperature and precipitation data are from the monthly temperature and precipitation dataset of China published by Peng et al. [39] (https://doi.org/10.5194/essd-11-1931-2019, accessed on 18 June 2025). For historical socio-economic data, we used the global gridded annual population data provided by ISIMIP (https://data.isimip.org/search/, accessed on 22 June 2025), the gridded GDP dataset published by Kummu et al. [40] (https://doi.org/10.5061/dryad.dk1j0, accessed on 22 June 2025) and the High-resolution Sectoral Water-Use Dataset (HSWUD) published by Zhang et al. [41] (https://doi.org/10.6084/m9.figshare.27610524, accessed on 22 June 2025). For future socio-economic studies, we selected the open-source estimated dataset under the “Universal two-child” policy released by Jiang et al. [42] (https://doi.org/10.57760/sciencedb.01683, accessed on 22 June 2025) and the global monthly sectoral water-use dataset published by Khan et al. [44] (https://doi.org/10.7910/DVN/VIQEAB, accessed on 22 June 2025). The CMIP6 model simulation data can be obtained at https://esgf-node.llnl.gov/projects/cmip6/ (accessed on 26 June 2025).
Conflicts of Interest
The authors declare no conflicts of interest.
References
- Jin, L.; Yan, C.; Yuan, B.; Liu, J.; Liu, J. Synoptic Analysis of Flood-Causing Rainfall and Flood Characteristics in the Source Area of the Yellow River. Water 2024, 16, 857. [Google Scholar] [CrossRef] [Scilit]
- Yang, T.; Ding, J.; Liu, D.; Wang, X.; Wang, T. Combined Use of Multiple Drought Indices for Global Assessment of Dry Gets Drier and Wet Gets Wetter Paradigm. J. Clim. 2019, 32, 737–748. [Google Scholar] [CrossRef] [Scilit]
- Sharma, P.; Mishra, V. Soil Moisture Rapid Transitions Between Dry and Wet Extremes in India, 1951–2024. J. Geophys. Res. Atmos. 2025, 130, e2025JD043378. [Google Scholar] [CrossRef] [Scilit]
- Zhou, Y.; Lu, C. Drought/Wetting Variations in a Semiarid and Sub-Humid Region of China. Theor. Appl. Clim. 2020, 140, 1537–1548. [Google Scholar] [CrossRef] [Scilit]
- Li, Q.; Cao, Y.; Miao, S.; Huang, X. Spatiotemporal Characteristics of Drought and Wet Events and Their Impacts on Agriculture in the Yellow River Basin. Land 2022, 11, 556. [Google Scholar] [CrossRef] [Scilit]
- Thornton, P.K.; Ericksen, P.J.; Herrero, M.; Challinor, A.J. Climate Variability and Vulnerability to Climate Change: A Review. Glob. Change Biol. 2014, 20, 3313–3328. [Google Scholar] [CrossRef] [Scilit]
- Wu, S.; Yan, X. Variations in Droughts and Wet Spells and Their Influences in China: 1924–2013. Theor. Appl. Clim. 2019, 135, 623–631. [Google Scholar] [CrossRef] [Scilit]
- Rodell, M.; Li, B. Changing Intensity of Hydroclimatic Extreme Events Revealed by GRACE and GRACE-FO. Nat. Water 2023, 1, 241–248. [Google Scholar] [CrossRef] [Scilit]
- Su, B.; Huang, J.; Fischer, T.; Wang, Y.; Kundzewicz, Z.W.; Zhai, J.; Sun, H.; Wang, A.; Zeng, X.; Wang, G.; et al. Drought Losses in China Might Double between the 1.5 °C and 2.0 °C Warming. Proc. Natl. Acad. Sci. USA 2018, 115, 10600–10605. [Google Scholar] [CrossRef] [Scilit]
- Tellman, B.; Sullivan, J.A.; Kuhn, C.; Kettner, A.J.; Doyle, C.S.; Brakenridge, G.R.; Erickson, T.A.; Slayback, D.A. Satellite Imaging Reveals Increased Proportion of Population Exposed to Floods. Nature 2021, 596, 80–86. [Google Scholar] [CrossRef] [Scilit]
- Li, J.; Guo, Y.; Wang, Y.; Lu, S.; Chen, X. Drought Propagation Patterns under Naturalized Condition Using Daily Hydrometeorological Data. Adv. Meteorol. 2018, 2018, 2469156. [Google Scholar] [CrossRef] [Scilit]
- McKee, T.B.; Doesken, N.J.; Kleist, J. The Relationship of Drought Frequency and Duration to Time Scales. In Proceedings of the 8th Conference on Applied Climatology, Anaheim, CA, USA, 17–22 January 1993. [Google Scholar]
- Vicente-Serrano, S.M.; Beguería, S.; López-Moreno, J.I. A Multiscalar Drought Index Sensitive to Global Warming: The Standardized Precipitation Evapotranspiration Index. J. Clim. 2010, 23, 1696–1718. [Google Scholar] [CrossRef] [Scilit]
- Nalbantis, I.; Tsakiris, G. Assessment of Hydrological Drought Revisited. Water Resour. Manag. 2009, 23, 881–897. [Google Scholar] [CrossRef] [Scilit]
- Vicente-Serrano, S.M.; López-Moreno, J.I.; Beguería, S.; Lorenzo-Lacruz, J.; Azorin-Molina, C.; Morán-Tejeda, E. Accurate Computation of a Streamflow Drought Index. J. Hydrol. Eng. 2012, 17, 318–332. [Google Scholar] [CrossRef] [Scilit]
- Shukla, S.; Wood, A.W. Use of a Standardized Runoff Index for Characterizing Hydrologic Drought. Geophys. Res. Lett. 2008, 35, L02405. [Google Scholar] [CrossRef] [Scilit]
- Martínez-Fernández, J.; González-Zamora, A.; Sánchez, N.; Gumuzzio, A. A Soil Water Based Index as a Suitable Agricultural Drought Indicator. J. Hydrol. 2015, 522, 265–273. [Google Scholar] [CrossRef] [Scilit]
- Zhao, M.; Geruo, A.; Velicogna, I.; Kimball, J.S. Satellite Observations of Regional Drought Severity in the Continental United States Using GRACE-Based Terrestrial Water Storage Changes. J. Clim. 2017, 30, 6297–6308. [Google Scholar] [CrossRef] [Scilit]
- Deng, S.; Liu, S.; Mo, X. Assessment and Attribution of China’s Droughts Using an Integrated Drought Index Derived from GRACE and GRACE-FO Data. J. Hydrol. 2021, 603, 127170. [Google Scholar] [CrossRef] [Scilit]
- Shi, X.; Yang, Y.; Yuan, Z.; Ding, H.; Zhang, Y.; Chen, J.; Shi, M. Integrating SWAP and SIF Anomaly to Assess the Responses of Vegetation to the Drought-Flood Abrupt Alternation in the Middle and Lower Reaches of the Yangtze River Basin, China. J. Hydrol. Reg. Stud. 2024, 52, 101726. [Google Scholar] [CrossRef] [Scilit]
- Li, B.; Rodell, M.; Zaitchik, B.F.; Reichle, R.H.; Koster, R.D.; van Dam, T.M. Assimilation of GRACE Terrestrial Water Storage into a Land Surface Model: Evaluation and Potential Value for Drought Monitoring in Western and Central Europe. J. Hydrol. 2012, 446–447, 103–115. [Google Scholar] [CrossRef] [Scilit]
- Xu, G.; Wu, Y.; Liu, S.; Cheng, S.; Zhang, Y.; Pan, Y.; Wang, L.; Dokuchits, E.Y.; Nkwazema, O.C. How 2022 Extreme Drought Influences the Spatiotemporal Variations of Terrestrial Water Storage in the Yangtze River Catchment: Insights from GRACE-Based Drought Severity Index and In-Situ Measurements. J. Hydrol. 2023, 626, 130245. [Google Scholar] [CrossRef] [Scilit]
- Satish Kumar, K.; Venkata Rathnam, E.; Sridhar, V. Tracking Seasonal and Monthly Drought with GRACE-Based Terrestrial Water Storage Assessments over Major River Basins in South India. Sci. Total Environ. 2021, 763, 142994. [Google Scholar] [CrossRef] [Scilit] [PubMed]
- Wu, R.; Wang, Z.; Cui, C.; Li, Y.; Tang, M.; Chu, J.; Xv, R.; Zhu, C.; Wang, S.; Li, Y.; et al. Applicability Analysis of Comprehensive Drought Index Based on GRACE Data in Ten Major River Basins in China. J. Hydrol. 2024, 645, 132275. [Google Scholar] [CrossRef] [Scilit]
- Meng, X.; Lin, C.; Ding, J.; Wang, G.; Zhang, J.; Wang, H.; Chu, C. Spatiotemporal Evolution of Droughts and Floods in the Yellow River Basin: A Novel Approach Combining CMADS-L Evaluation, Hydroclimatic Zonation and CNN-LSTM Prediction. J. Hydrol. Reg. Stud. 2025, 58, 102250. [Google Scholar] [CrossRef] [Scilit]
- Gong, J.; Gao, B.; Li, Y.; Jin, T.; Zhang, Y.; Zhu, Y. Spatiotemporal Variation of Climate Dry-Wet Condition and Its Potential Trend in the Yellow River Basin from 1960 to 2020. Chin. J. Agrometeorol. 2022, 43, 165. [Google Scholar] [CrossRef]
- Gao, B.; Gong, J.; Li, Y.; Jin, T. Analysis of Multi-Scalar Characteristics of Dry and Wet Conditions in the Yellow River Basin Based on SPEI. AZR 2022, 39, 723–733. [Google Scholar] [CrossRef]
- Guo, H.; He, S.; Li, M.; Bao, A.; Chen, T.; Zheng, G.; De Maeyer, P. Future Changes of Drought Characteristics in Coupled Model Intercomparison Project Phase 6 Shared Socioeconomic Pathway Scenarios over Central Asia. Int. J. Clim. 2022, 42, 3888–3908. [Google Scholar] [CrossRef] [Scilit]
- Liu, W.; Zhang, Y. Spatiotemporal Changes of Sc-PDSI and Its Dynamic Drivers in Yellow River Basin. Atmosphere 2022, 13, 399. [Google Scholar] [CrossRef] [Scilit]
- Kang, L.; Wen, Y.; Zhou, L.; Chen, H.; Ye, J. Drought Driving Mechanism and Risk Situation Prediction Based on Machine Learning Models in the Yellow River Basin, China. Geomat. Nat. Hazards Risk 2023, 14, 2279493. [Google Scholar] [CrossRef] [Scilit]
- Li, Y.; Chang, J.; Fan, J.; Yu, B. Agricultural drought evolution characteristics and driving mechanisms in the Yellow River Basin under climate and land use changes. Trans. Chin. Soc. Agric. Eng. 2021, 37, 84–93. [Google Scholar] [CrossRef]
- Daksiya, V.; Mandapaka, P.V.; Lo, E.Y.M. Effect of Climate Change and Urbanisation on Flood Protection Decision-Making. J. Flood Risk Manag. 2021, 14, e12681. [Google Scholar] [CrossRef] [Scilit]
- Zhang, Q.; Li, Y.; Hu, Q.; Yao, N.; Song, X.; Liu, F.; Pulatov, B.; Meng, Q.; Feng, P. Impacts of Different Socioeconomic Development Levels on Extremely Wet/Dry Events in Mainland China. Water 2022, 14, 3950. [Google Scholar] [CrossRef] [Scilit]
- Yan, D.-H.; Han, D.-M.; Wang, G.; Yuan, Y.; Hu, Y.; Fang, H. The Evolution Analysis of Flood and Drought in Huai River Basin of China Based on Monthly Precipitation Characteristics. Nat. Hazards 2014, 73, 849–858. [Google Scholar] [CrossRef] [Scilit]
- Wang, L.; Shu, Z.; Wang, G.; Sun, Z.; Yan, H.; Bao, Z. Analysis of Future Meteorological Drought Changes in the Yellow River Basin under Climate Change. Water 2022, 14, 1896. [Google Scholar] [CrossRef] [Scilit]
- Ji, G.; Lai, Z.; Xia, H.; Liu, H.; Wang, Z. Future Runoff Variation and Flood Disaster Prediction of the Yellow River Basin Based on CA-Markov and SWAT. Land 2021, 10, 421. [Google Scholar] [CrossRef] [Scilit]
- Humphrey, V.; Gudmundsson, L. GRACE-REC: A Reconstruction of Climate-Driven Water Storage Changes over the Last Century. Earth Syst. Sci. Data 2019, 11, 1153–1170. [Google Scholar] [CrossRef] [Scilit]
- Cao, S.; Li, M.; Zhu, Z.; Wang, Z.; Zha, J.; Zhao, W.; Duanmu, Z.; Chen, J.; Zheng, Y.; Chen, Y.; et al. Spatiotemporally Consistent Global Dataset of the GIMMS Leaf Area Index (GIMMS LAI4g) from 1982 to 2020. Earth Syst. Sci. Data 2023, 15, 4877–4899. [Google Scholar] [CrossRef] [Scilit]
- Peng, S.; Ding, Y.; Liu, W.; Li, Z. 1 Km Monthly Temperature and Precipitation Dataset for China from 1901 to 2017. Earth Syst. Sci. Data 2019, 11, 1931–1946. [Google Scholar] [CrossRef] [Scilit]
- Kummu, M.; Taka, M.; Guillaume, J.H.A. Data from: Gridded Global Datasets for Gross Domestic Product and Human Development Index over 1990-2015. Sci. Data 2018, 5, 180004. [Google Scholar] [CrossRef] [Scilit]
- Zhang, Y.; Yin, Y.; Yin, M.; Zhang, X. A High-Resolution Gridded Dataset for China’s Monthly Sectoral Water Use. Sci. Data 2025, 12, 1157. [Google Scholar] [CrossRef] [Scilit]
- Jiang, T.; Zhao, J.; Jing, C.; Cao, L.; Wang, Y.; Sun, H.; Wang, A.; Huang, J.; Su, B.; Wang, R. National and Provincial Population Projected to 2100 Under the Shared Socioeconomic Pathways in China. Clim. Change Res. 2017, 13, 128–137. Available online: https://html.rhhz.net/QHBHYJJZ/html/2017/2/2016-249.htm (accessed on 12 June 2025).
- Yin, J.; Gentine, P.; Slater, L.; Gu, L.; Pokhrel, Y.; Hanasaki, N.; Guo, S.; Xiong, L.; Schlenker, W. Future Socio-Ecosystem Productivity Threatened by Compound Drought–Heatwave Events. Nat. Sustain. 2023, 6, 259–272. [Google Scholar] [CrossRef] [Scilit]
- Khan, Z.; Thompson, I.; Vernon, C.R.; Graham, N.T.; Wild, T.B.; Chen, M. Global Monthly Sectoral Water Use for 2010–2100 at 0.5° Resolution Across Alternative Futures. Sci. Data 2023, 10, 201. [Google Scholar] [CrossRef] [Scilit] [PubMed]
- Zhao, M.; Su, B.; Jiang, T.; Wang, A.; Tao, H. Simulation and Projection of Precipitation in the Upper Yellow River Basin by CMIP6 Multi-Model Ensemble. Plateau Meteorol. 2021, 40, 547–558. [Google Scholar] [CrossRef]
- Long, D.; Longuevergne, L.; Scanlon, B.R. Uncertainty in Evapotranspiration from Land Surface Modeling, Remote Sensing, and GRACE Satellites. Water Resour. Res. 2014, 50, 1131–1151. [Google Scholar] [CrossRef] [Scilit]
- Svoboda, M.; LeComte, D.; Hayes, M.; Heim, R.; Gleason, K.; Angel, J.; Rippey, B.; Tinker, R.; Palecki, M.; Stooksbury, D.; et al. The Drought Monitor. Bull. Am. Meteorol. Soc. 2002, 83, 1181–1190. [Google Scholar] [CrossRef] [Scilit]
- Wood, A.W.; Leung, L.R.; Sridhar, V.; Lettenmaier, D.P. Hydrologic Implications of Dynamical and Statistical Approaches to Downscaling Climate Model Outputs. Clim. Change 2004, 62, 189–216. [Google Scholar] [CrossRef] [Scilit]
- Wilby, R.L.; Dawson, C.W.; Barrow, E.M. SDSM—A Decision Support Tool for the Assessment of Regional Climate Change Impacts. Environ. Modell. Softw. 2002, 17, 147–159. [Google Scholar] [CrossRef] [Scilit]
- Huntingford, C.; Lambert, F.H.; Gash, J.H.C.; Taylor, C.M.; Challinor, A.J. Aspects of Climate Change Prediction Relevant to Crop Productivity. Philos. Trans. R. Soc. Lond. B Biol. Sci. 2005, 360, 1999–2009. [Google Scholar] [CrossRef] [Scilit]
- Ines, A.V.M.; Hansen, J.W.; Robertson, A.W. Enhancing the Utility of Daily GCM Rainfall for Crop Yield Prediction. Int. J. Clim. 2010, 31, 2168–2182. [Google Scholar] [CrossRef] [Scilit]
- Elsadek, E.A.; Zhang, K.; Hamoud, Y.A.; Mousa, A.; Awad, A.; Abdallah, M.; Shaghaleh, H.; Hamad, A.A.A.; Jamil, M.T.; Elbeltagi, A. Impacts of Climate Change on Rice Yields in the Nile River Delta of Egypt: A Large-Scale Projection Analysis Based on CMIP6. Agric. Water Manag. 2024, 292, 108673. [Google Scholar] [CrossRef] [Scilit]
- Lange, S. Trend-Preserving Bias Adjustment and Statistical Downscaling with ISIMIP3BASD (v1.0). Geosci. Model Dev. 2019, 12, 3055–3070. [Google Scholar] [CrossRef] [Scilit]
- Budescu, D.V. Dominance Analysis: A New Approach to the Problem of Relative Importance of Predictors in Multiple Regression. Psychol. Bull. 1993, 114, 542–551. [Google Scholar] [CrossRef]
- Azen, R.; Budescu, D.V. The Dominance Analysis Approach for Comparing Predictors in Multiple Regression. Psychol. Methods 2003, 8, 129–148. [Google Scholar] [CrossRef] [Scilit] [PubMed]
- Wang, M.; Chen, Y.; Li, J.; Zhao, Y. Spatiotemporal Evolution and Driving Force Analysis of Drought Characteristics in the Yellow River Basin. Ecol. Indic. 2025, 170, 113007. [Google Scholar] [CrossRef] [Scilit]
- Wei, C.; Su, D.; Zhao, D.; Li, Y.; He, J.; Wang, Z.; Cao, L.; Jia, H. Spatiotemporal Analysis of Drought and Its Driving Factors in the Yellow River Basin Based on a Standardized Precipitation Evapotranspiration Index. Atmosphere 2025, 16, 145. [Google Scholar] [CrossRef] [Scilit]
- Liu, J.; Liu, X.; Liang, J.; Feng, Y. Climate-Driven Changes in Drought Metrics across the Yellow River Basin Based on Coupled Model Intercomparison Project Phase 6. J. Geogr. Sci. 2024, 34, 1841–1856. [Google Scholar] [CrossRef] [Scilit]
- Li, H.; Mu, H.; Jian, S.; Li, X. Assessment of Rainfall and Temperature Trends in the Yellow River Basin, China from 2023 to 2100. Water 2024, 16, 1441. [Google Scholar] [CrossRef] [Scilit]
- Huang, X.; Yang, X.; Wu, F.; Zhang, J. Future Propagation Characteristics of Meteorological Drought to Hydrological Drought in the Yellow River Basin. J. Hydrol. 2025, 649, 132443. [Google Scholar] [CrossRef] [Scilit]
- Li, J.; Zhao, Y.; Tang, Z. Projection of Future Summer Precipitation over the Yellow River Basin: A Moisture Budget Perspective. Atmosphere 2020, 11, 1307. [Google Scholar] [CrossRef] [Scilit]
- Wang, Y.; Shen, Y.-J.; Wang, L.; Guo, Y.; Cheng, Y.; Zhang, X. Multi-Model Ensemble Enhances the Spatiotemporal Comprehensive Performance of Regional Climate in China. Remote Sens. 2025, 17, 582. [Google Scholar] [CrossRef] [Scilit]
- Yang, X.; Zhou, B.; Xu, Y.; Han, Z. CMIP6 Evaluation and Projection of Temperature and Precipitation over China. Adv. Atmos. Sci. 2021, 38, 817–830. [Google Scholar] [CrossRef] [Scilit]
- Rajulapati, C.R.; Papalexiou, S.M.; Clark, M.P.; Pomeroy, J.W. The Perils of Regridding: Examples Using a Global Precipitation Dataset. J. Appl. Meteorol. Clim. 2021, 60, 1561–1573. [Google Scholar] [CrossRef] [Scilit]
- Accadia, C.; Mariani, S.; Casaioli, M.; Lavagnini, A.; Speranza, A. Sensitivity of Precipitation Forecast Skill Scores to Bilinear Interpolation and a Simple Nearest-Neighbor Average Method on High-Resolution Verification Grids. Weather Forecast. 2003, 18, 918–932. [Google Scholar] [CrossRef] [Scilit]
- Cappelli, F.; Grimaldi, S. Feature Importance Measures for Hydrological Applications: Insights from a Virtual Experiment. Stoch. Environ. Res. Risk Assess. 2023, 37, 4921–4939. [Google Scholar] [CrossRef] [Scilit]
- Kirchner, J.W. Characterizing Nonlinear, Nonstationary, and Heterogeneous Hydrologic Behavior Using Ensemble Rainfall–Runoff Analysis (ERRA): Proof of Concept. Hydrol. Earth Syst. Sci. 2024, 28, 4427–4454. [Google Scholar] [CrossRef] [Scilit]
- Zhou, M.; Wang, X.; Sun, L.; Luo, Y. Spatial Variations in Terrestrial Water Storage with Variable Forces across the Yellow River Basin. Remote Sens. 2021, 13, 3416. [Google Scholar] [CrossRef] [Scilit]
- Zuo, Q.; Ding, X.; Cui, G.; Zhang, W. Yellow River Basin Management Under Pressure: Present State, Restoration and Protection III: Lessons from a Special Issue. Water 2025, 17, 2907. [Google Scholar] [CrossRef] [Scilit]
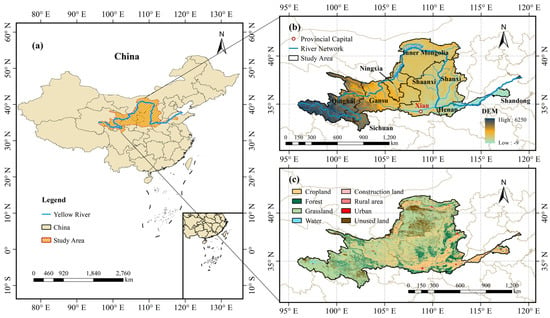
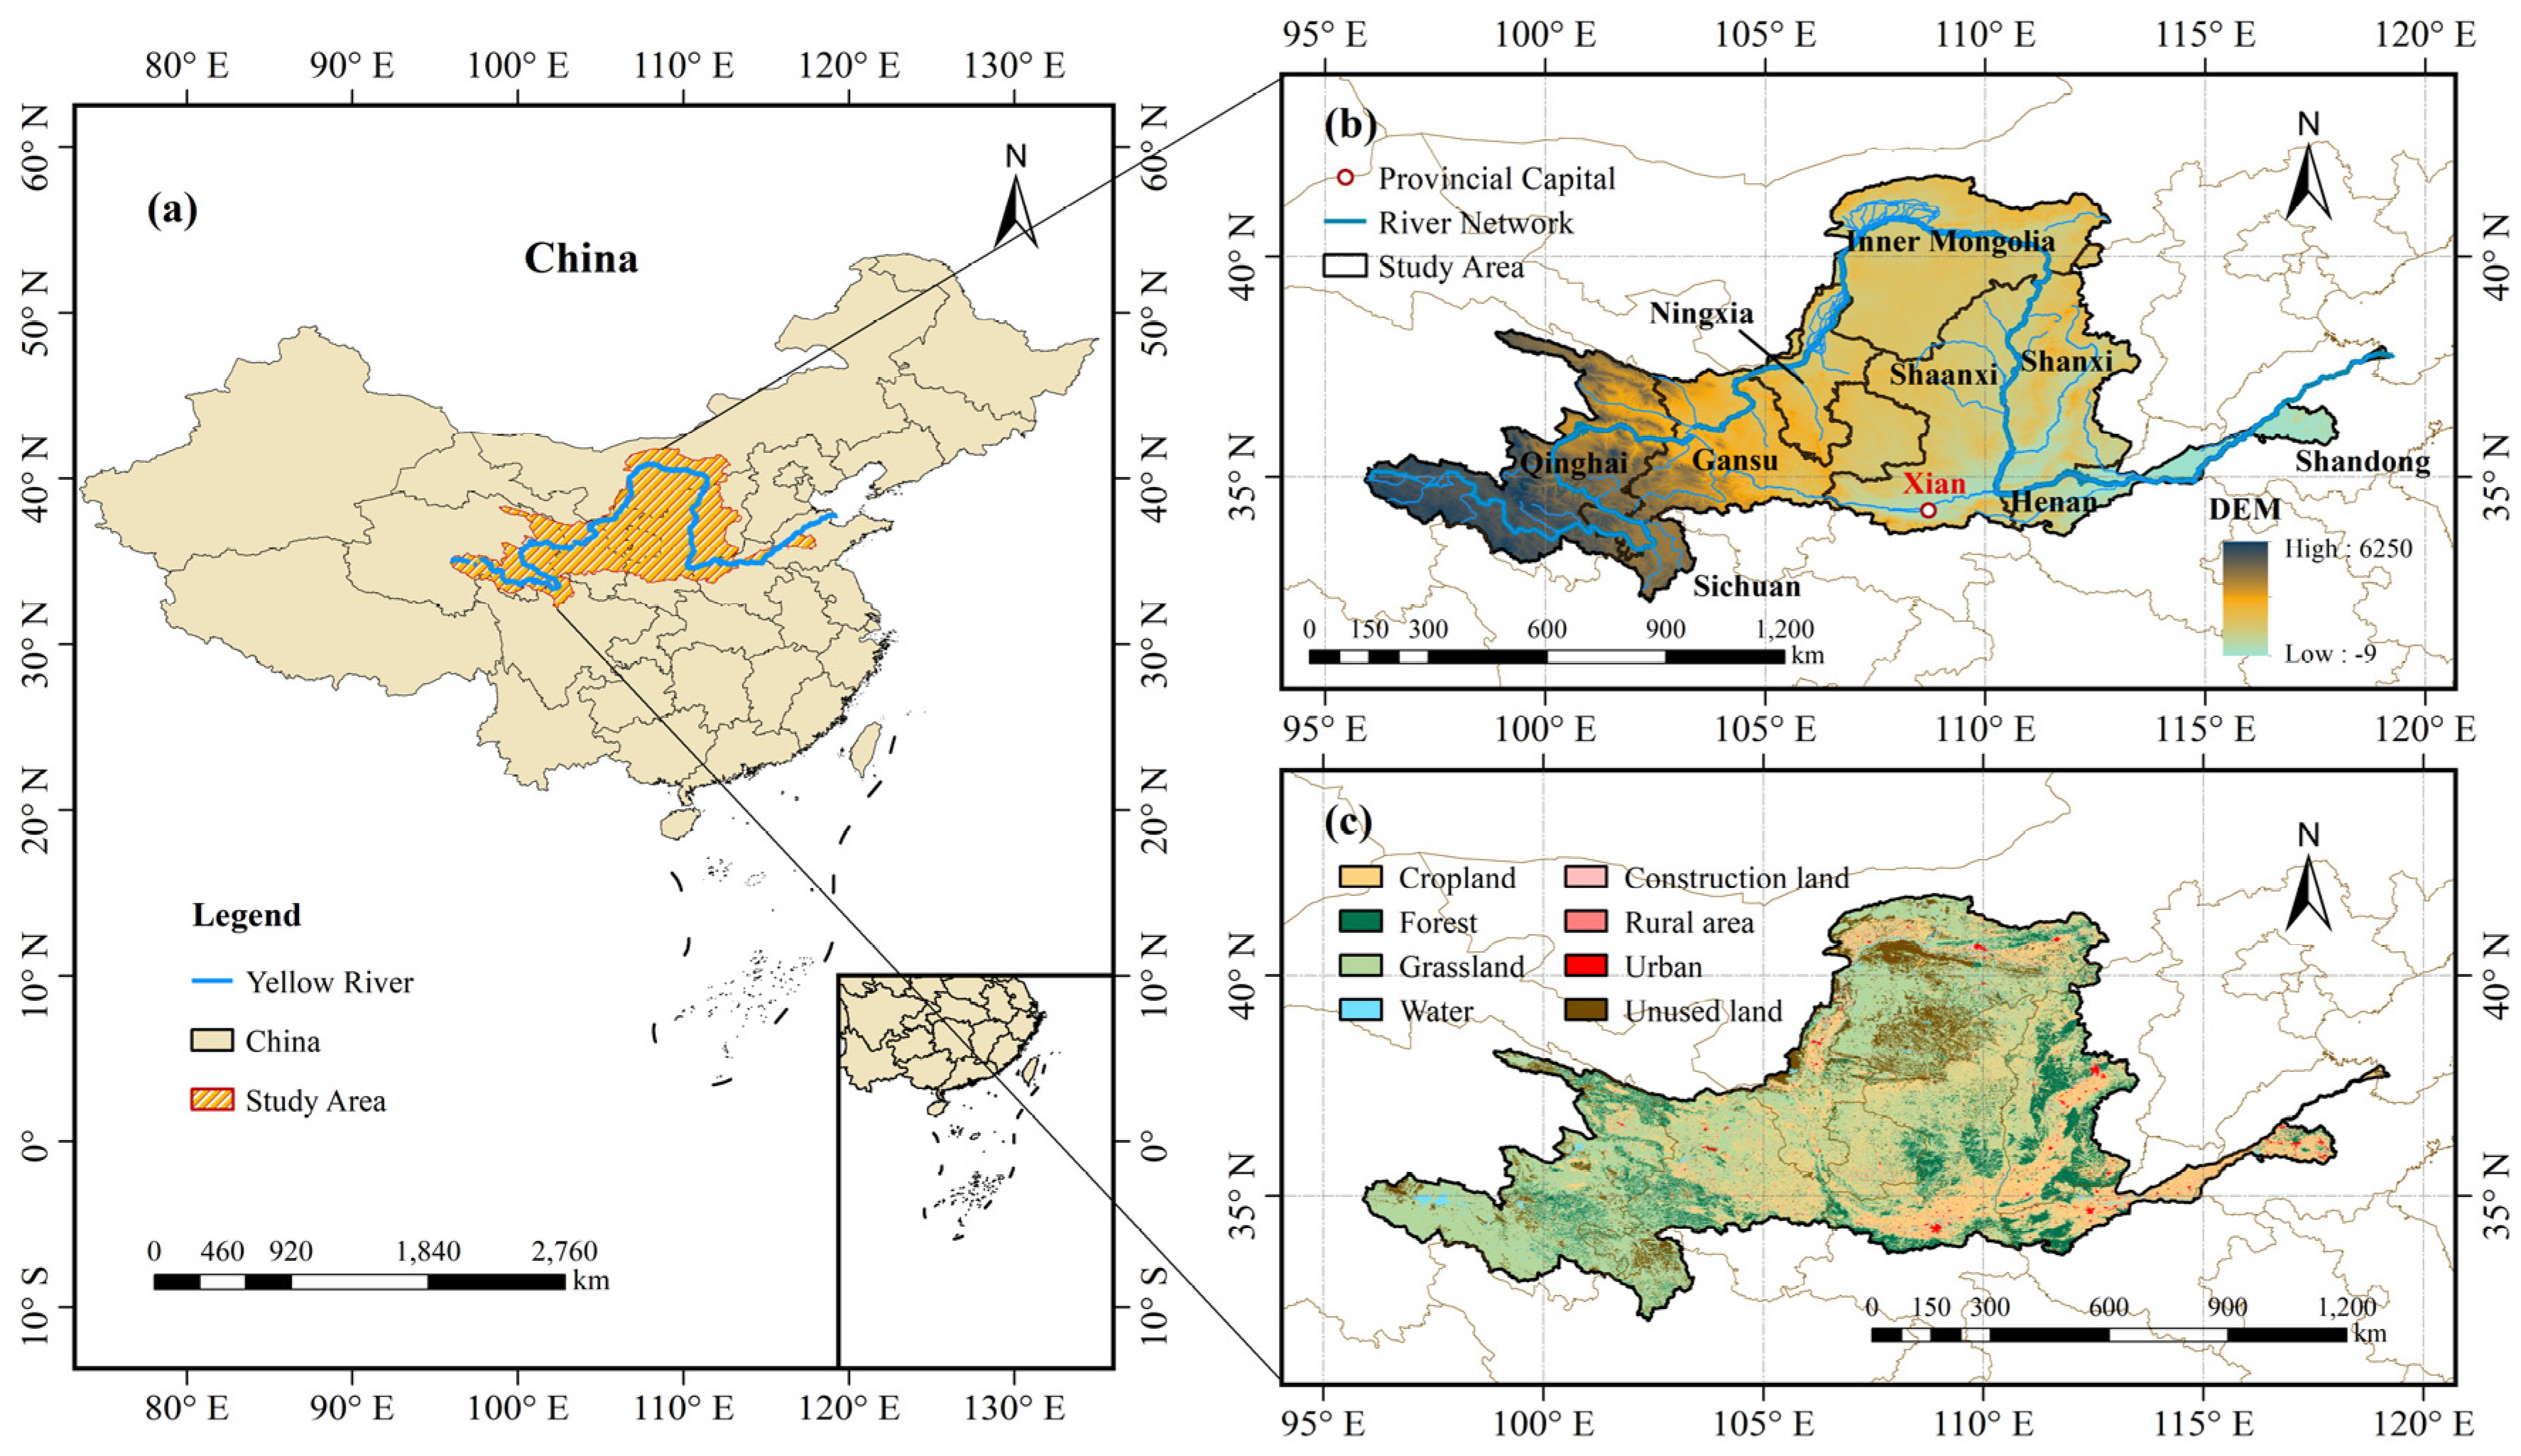
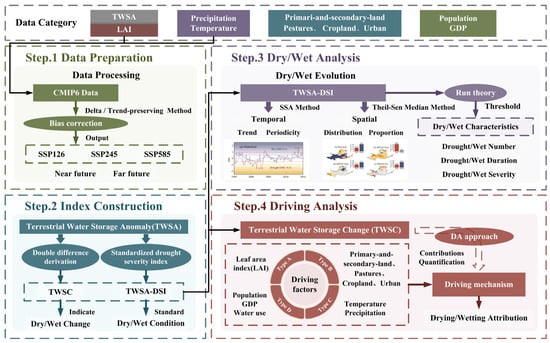
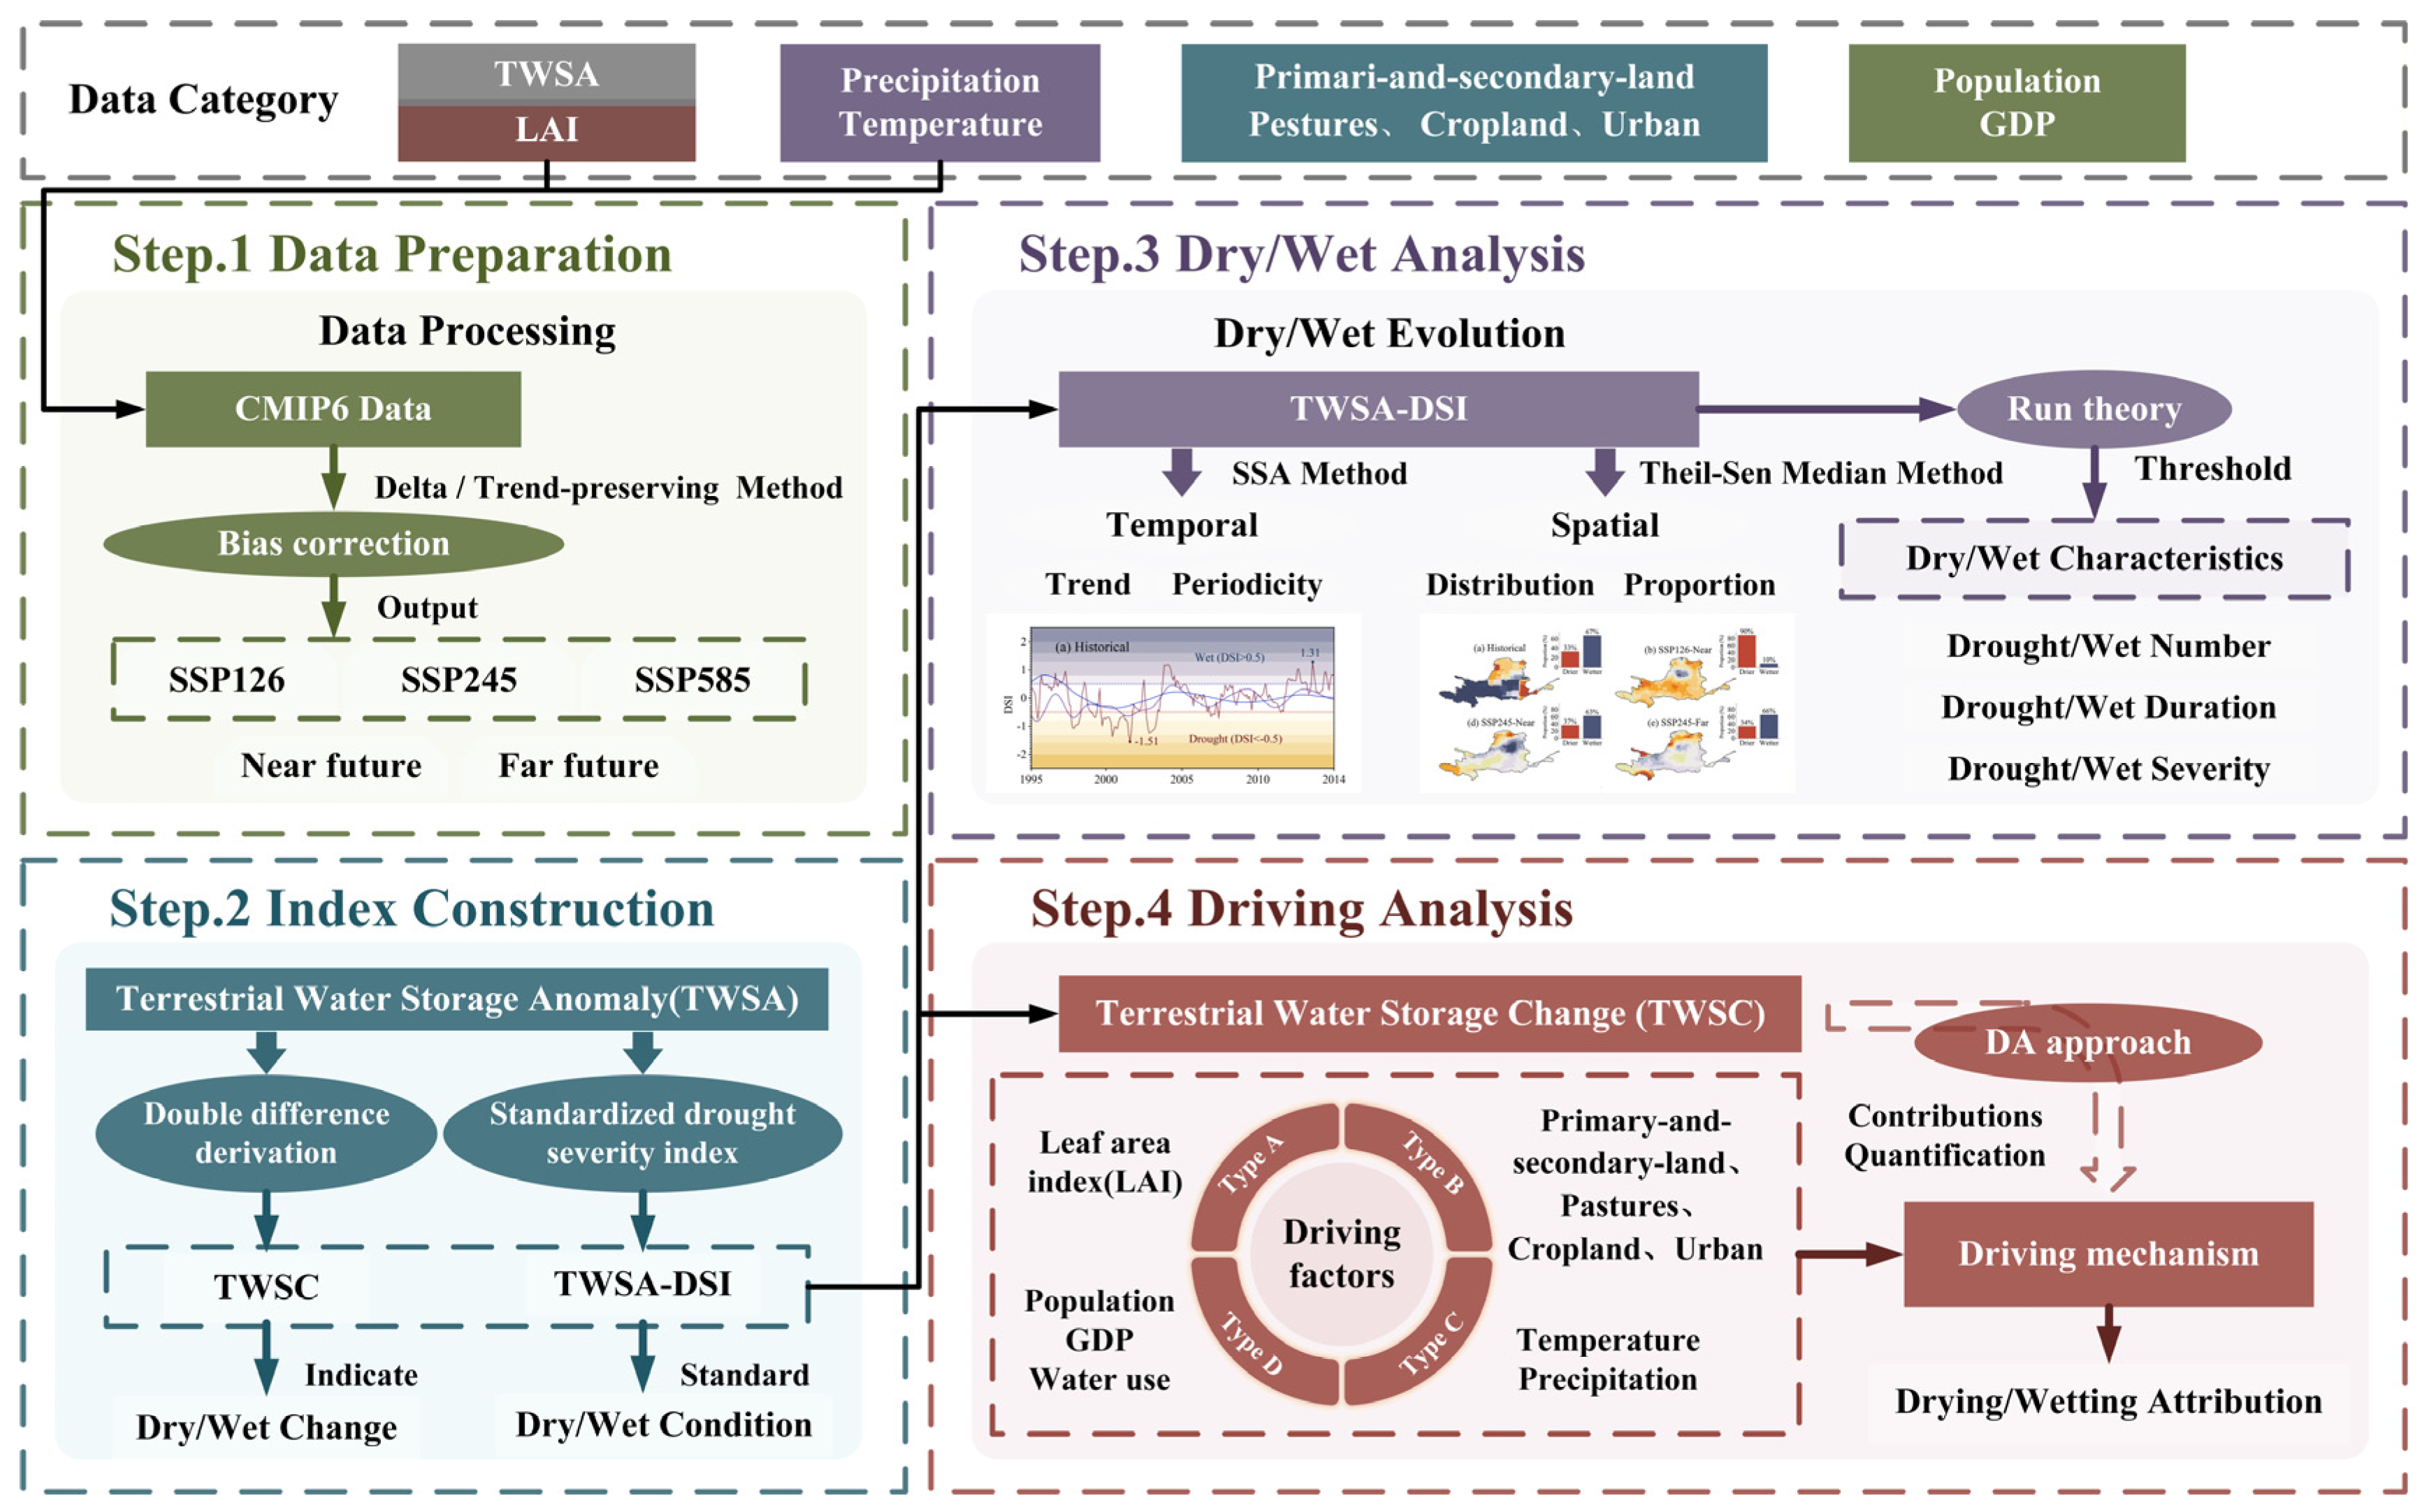
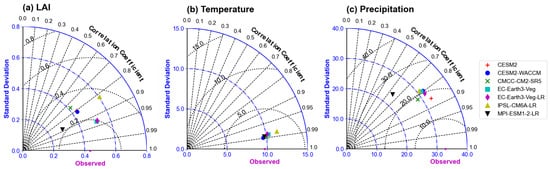
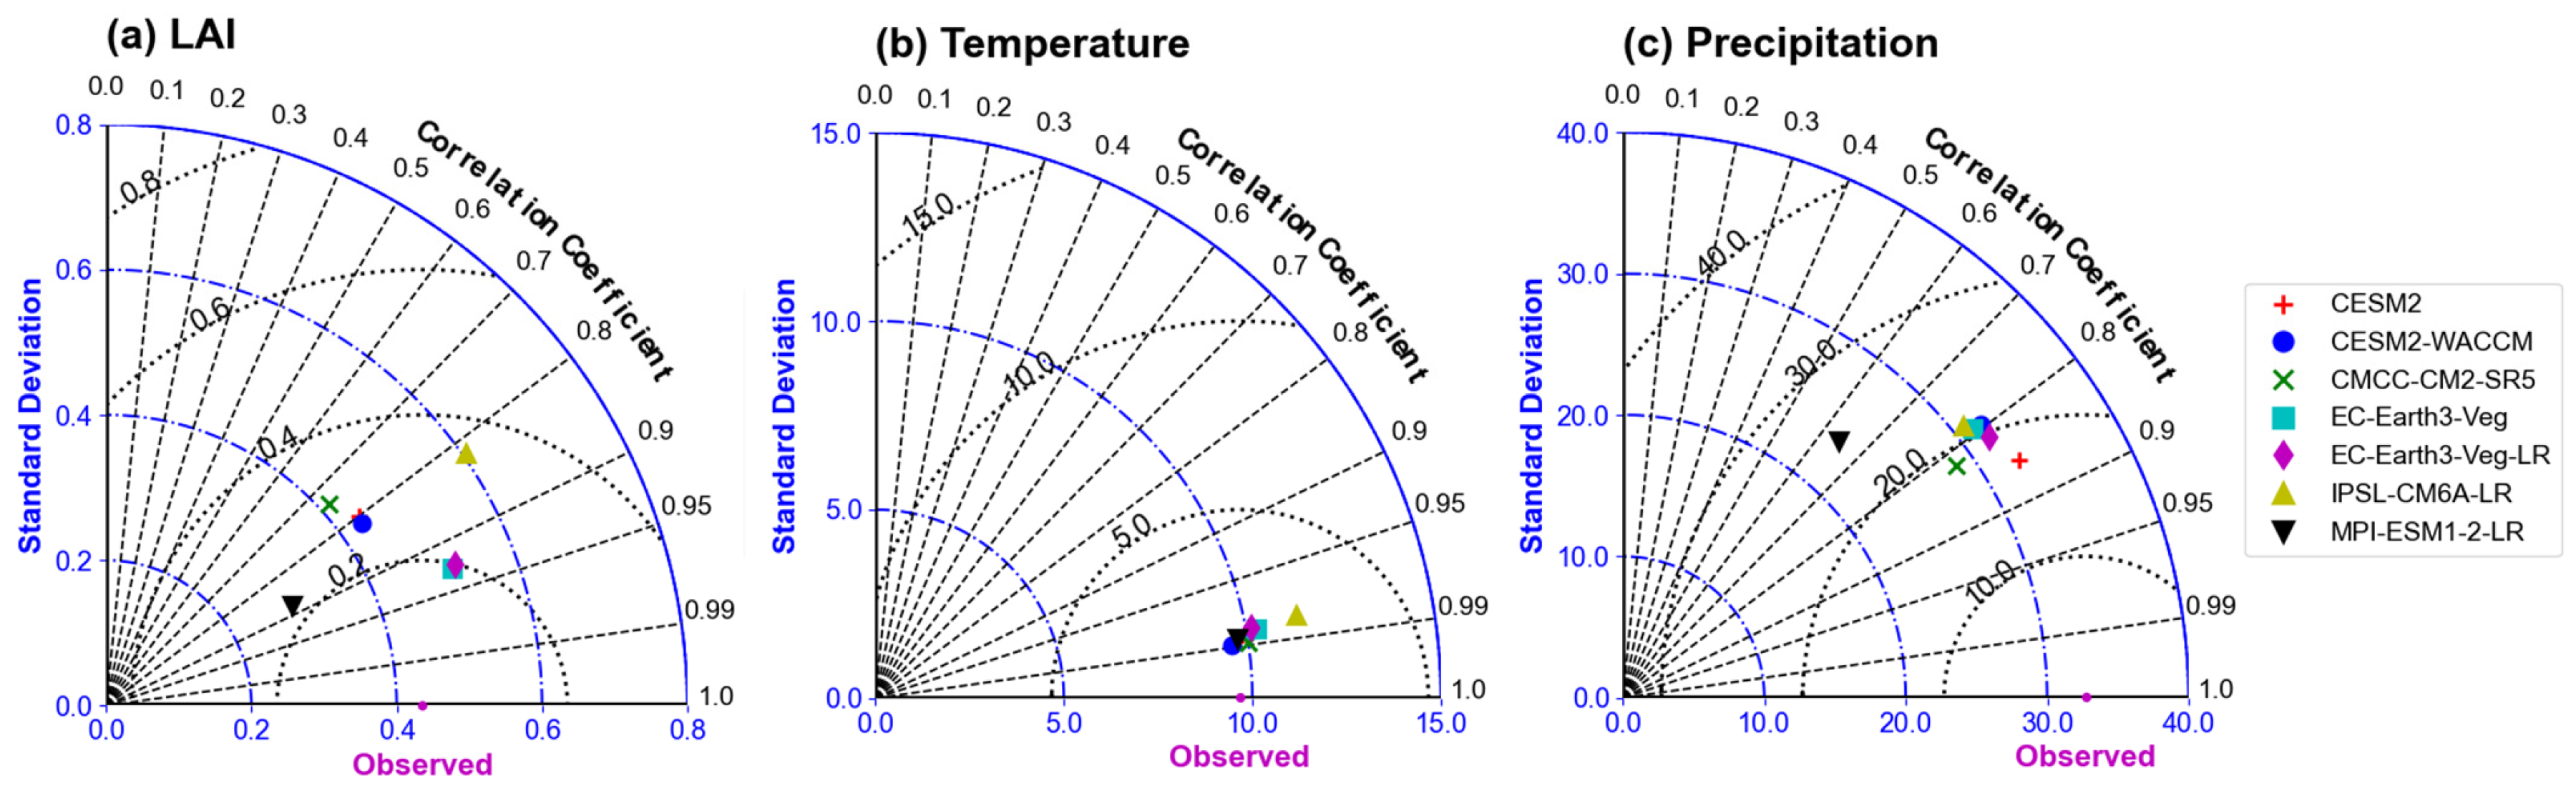
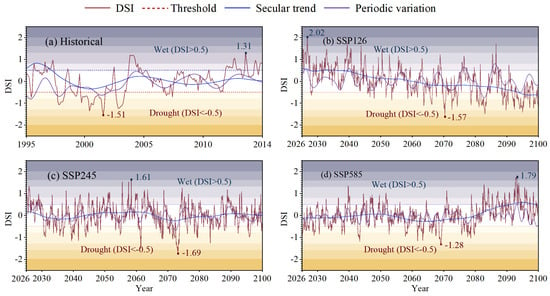
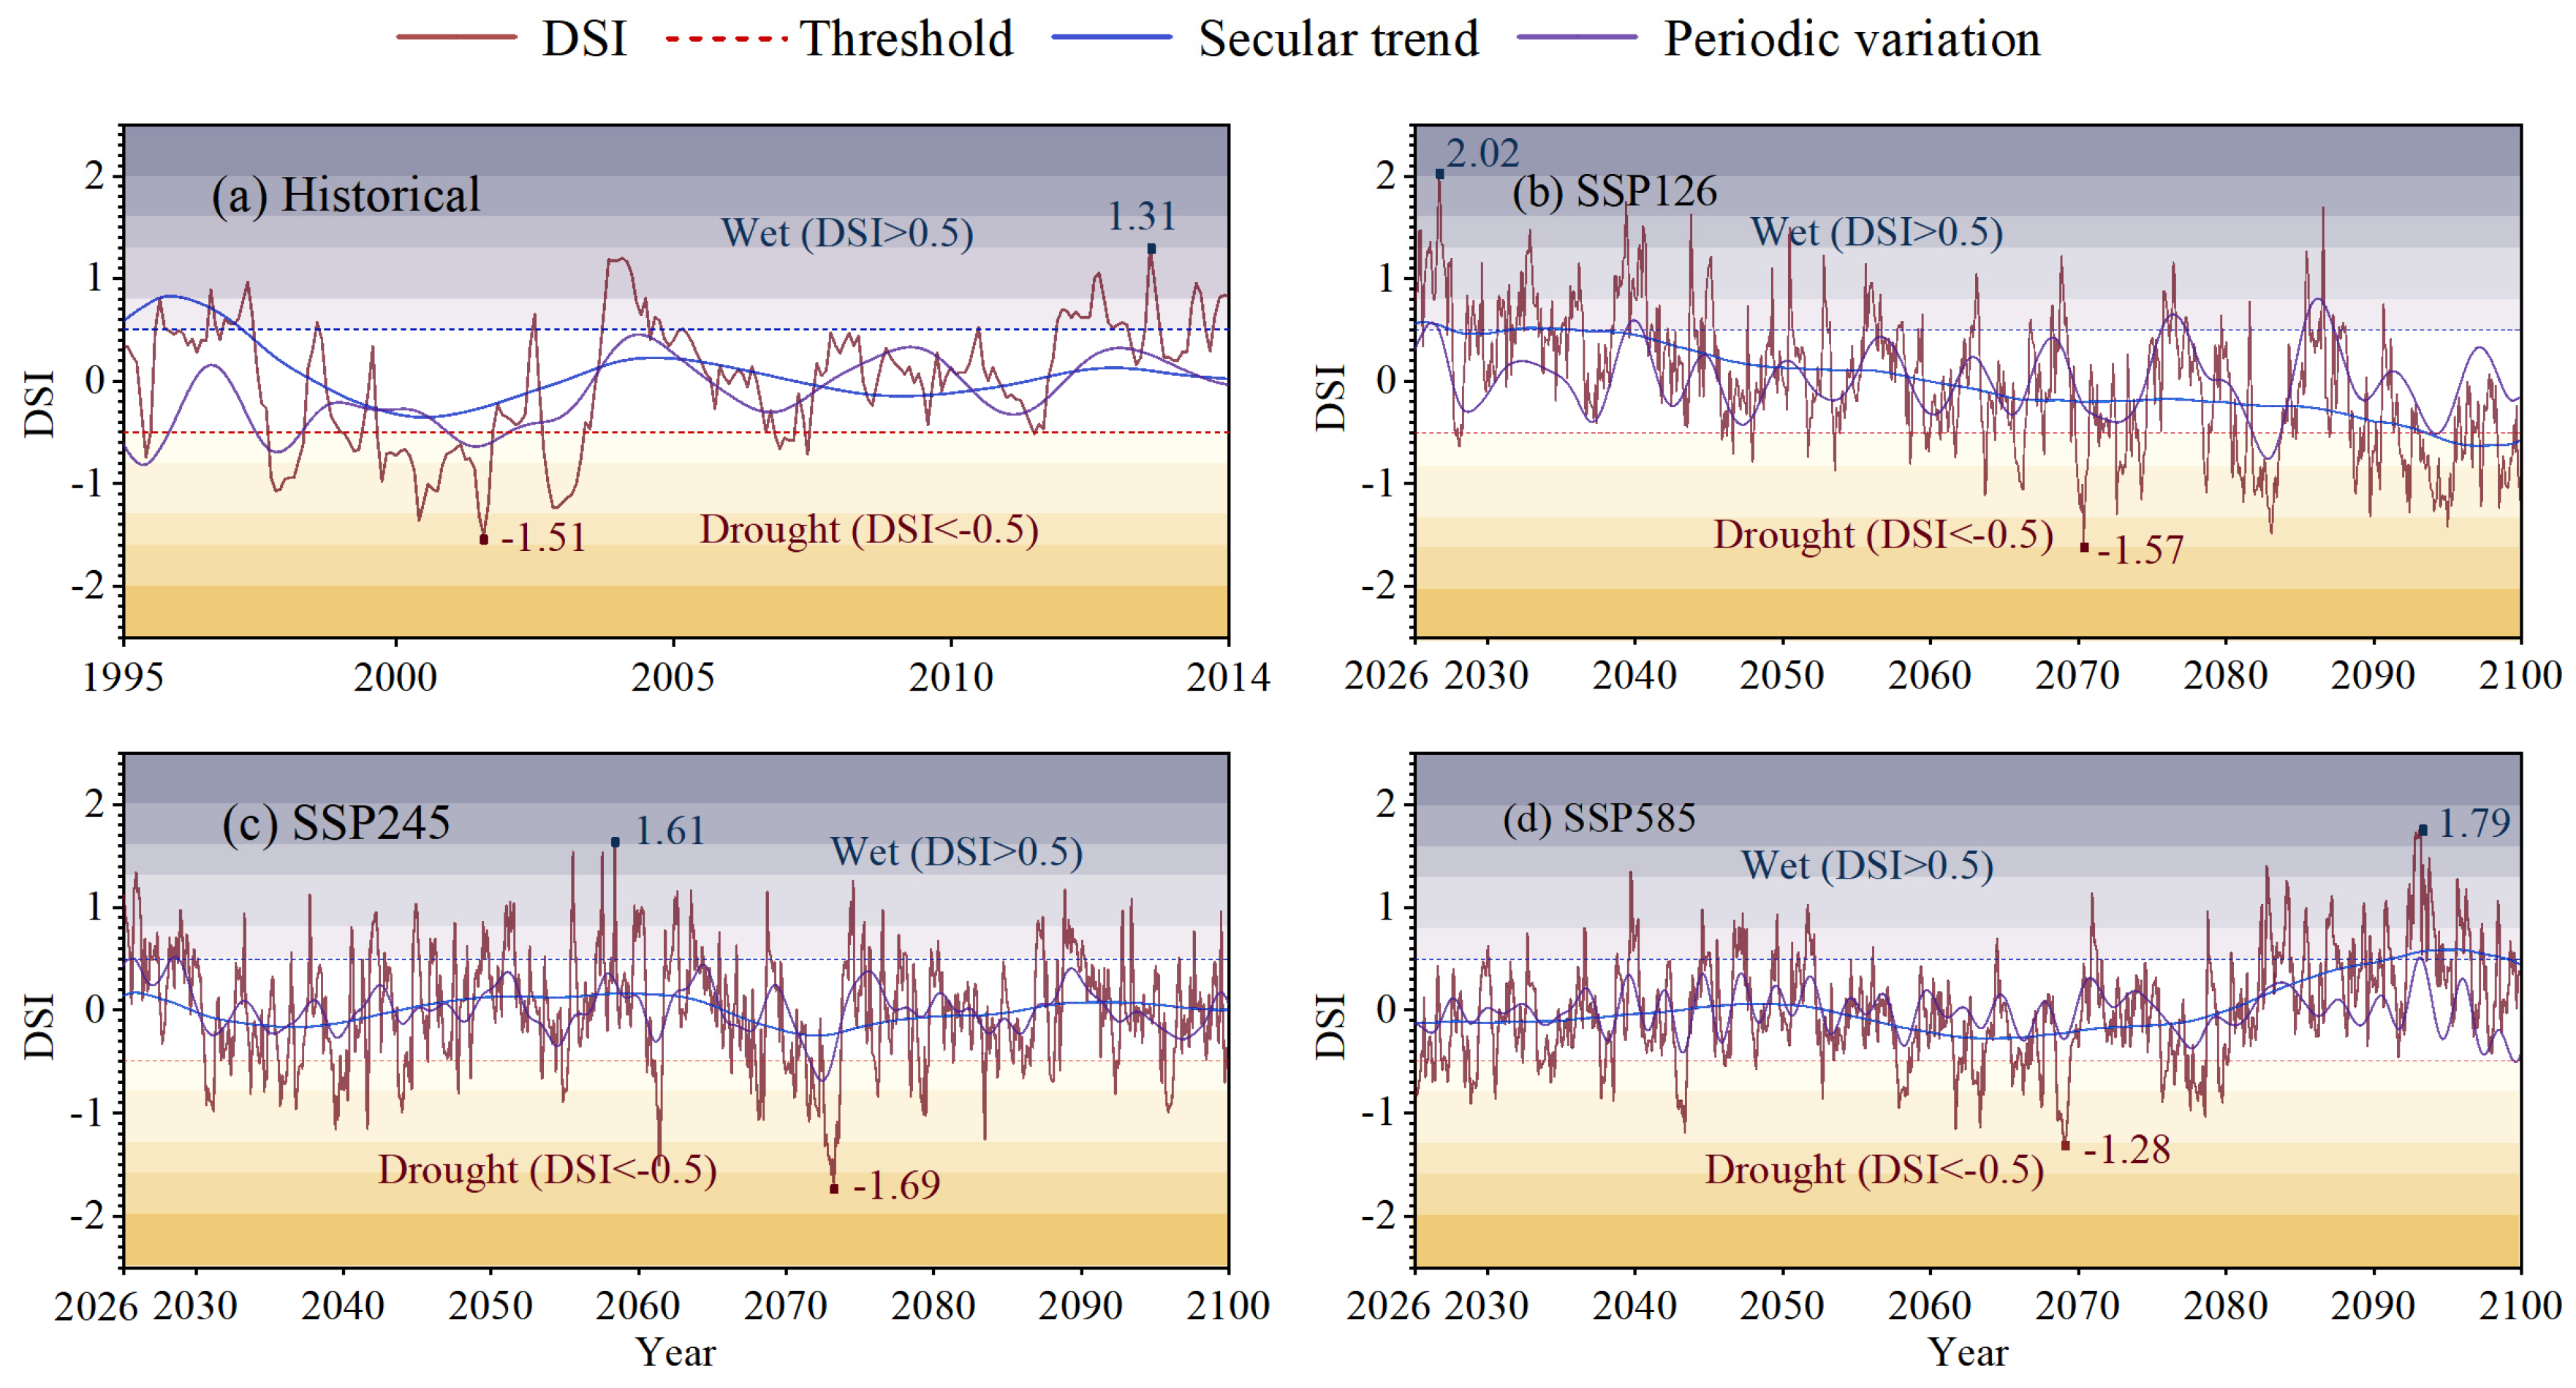
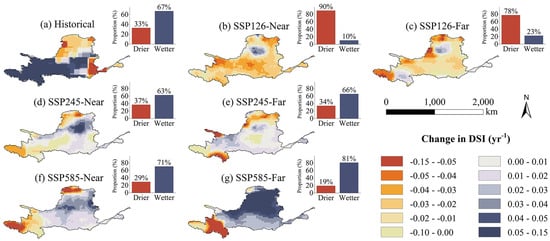
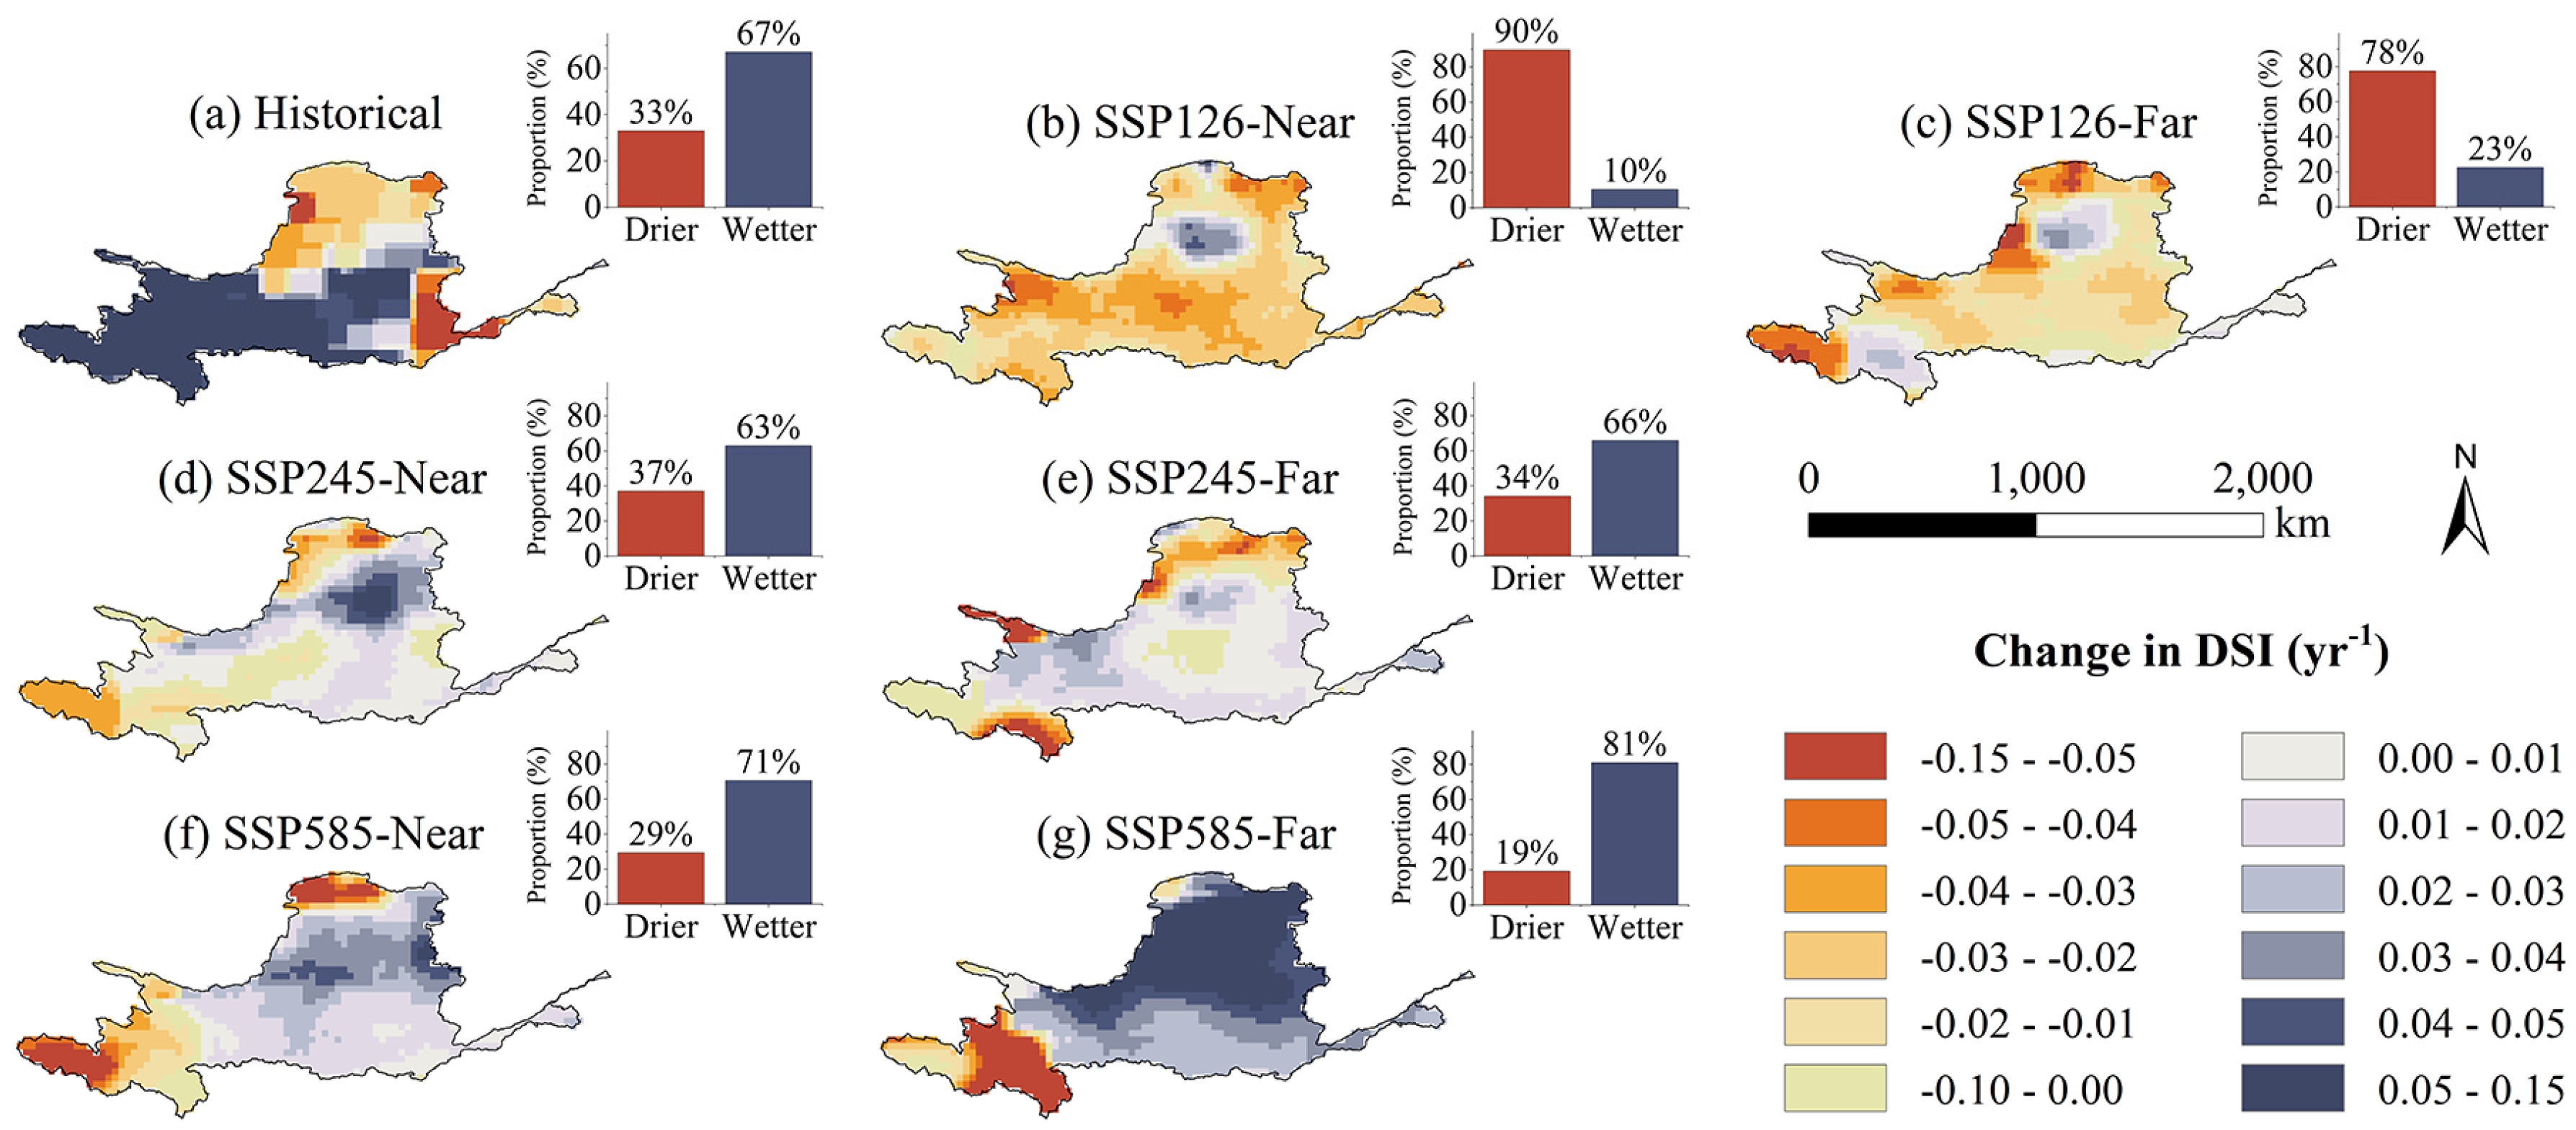
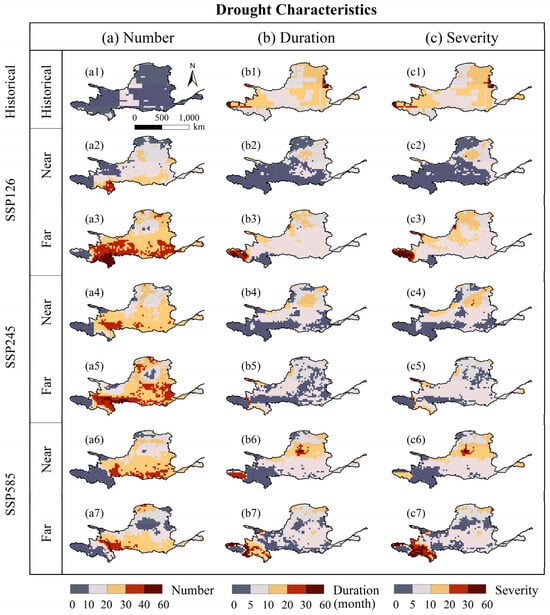
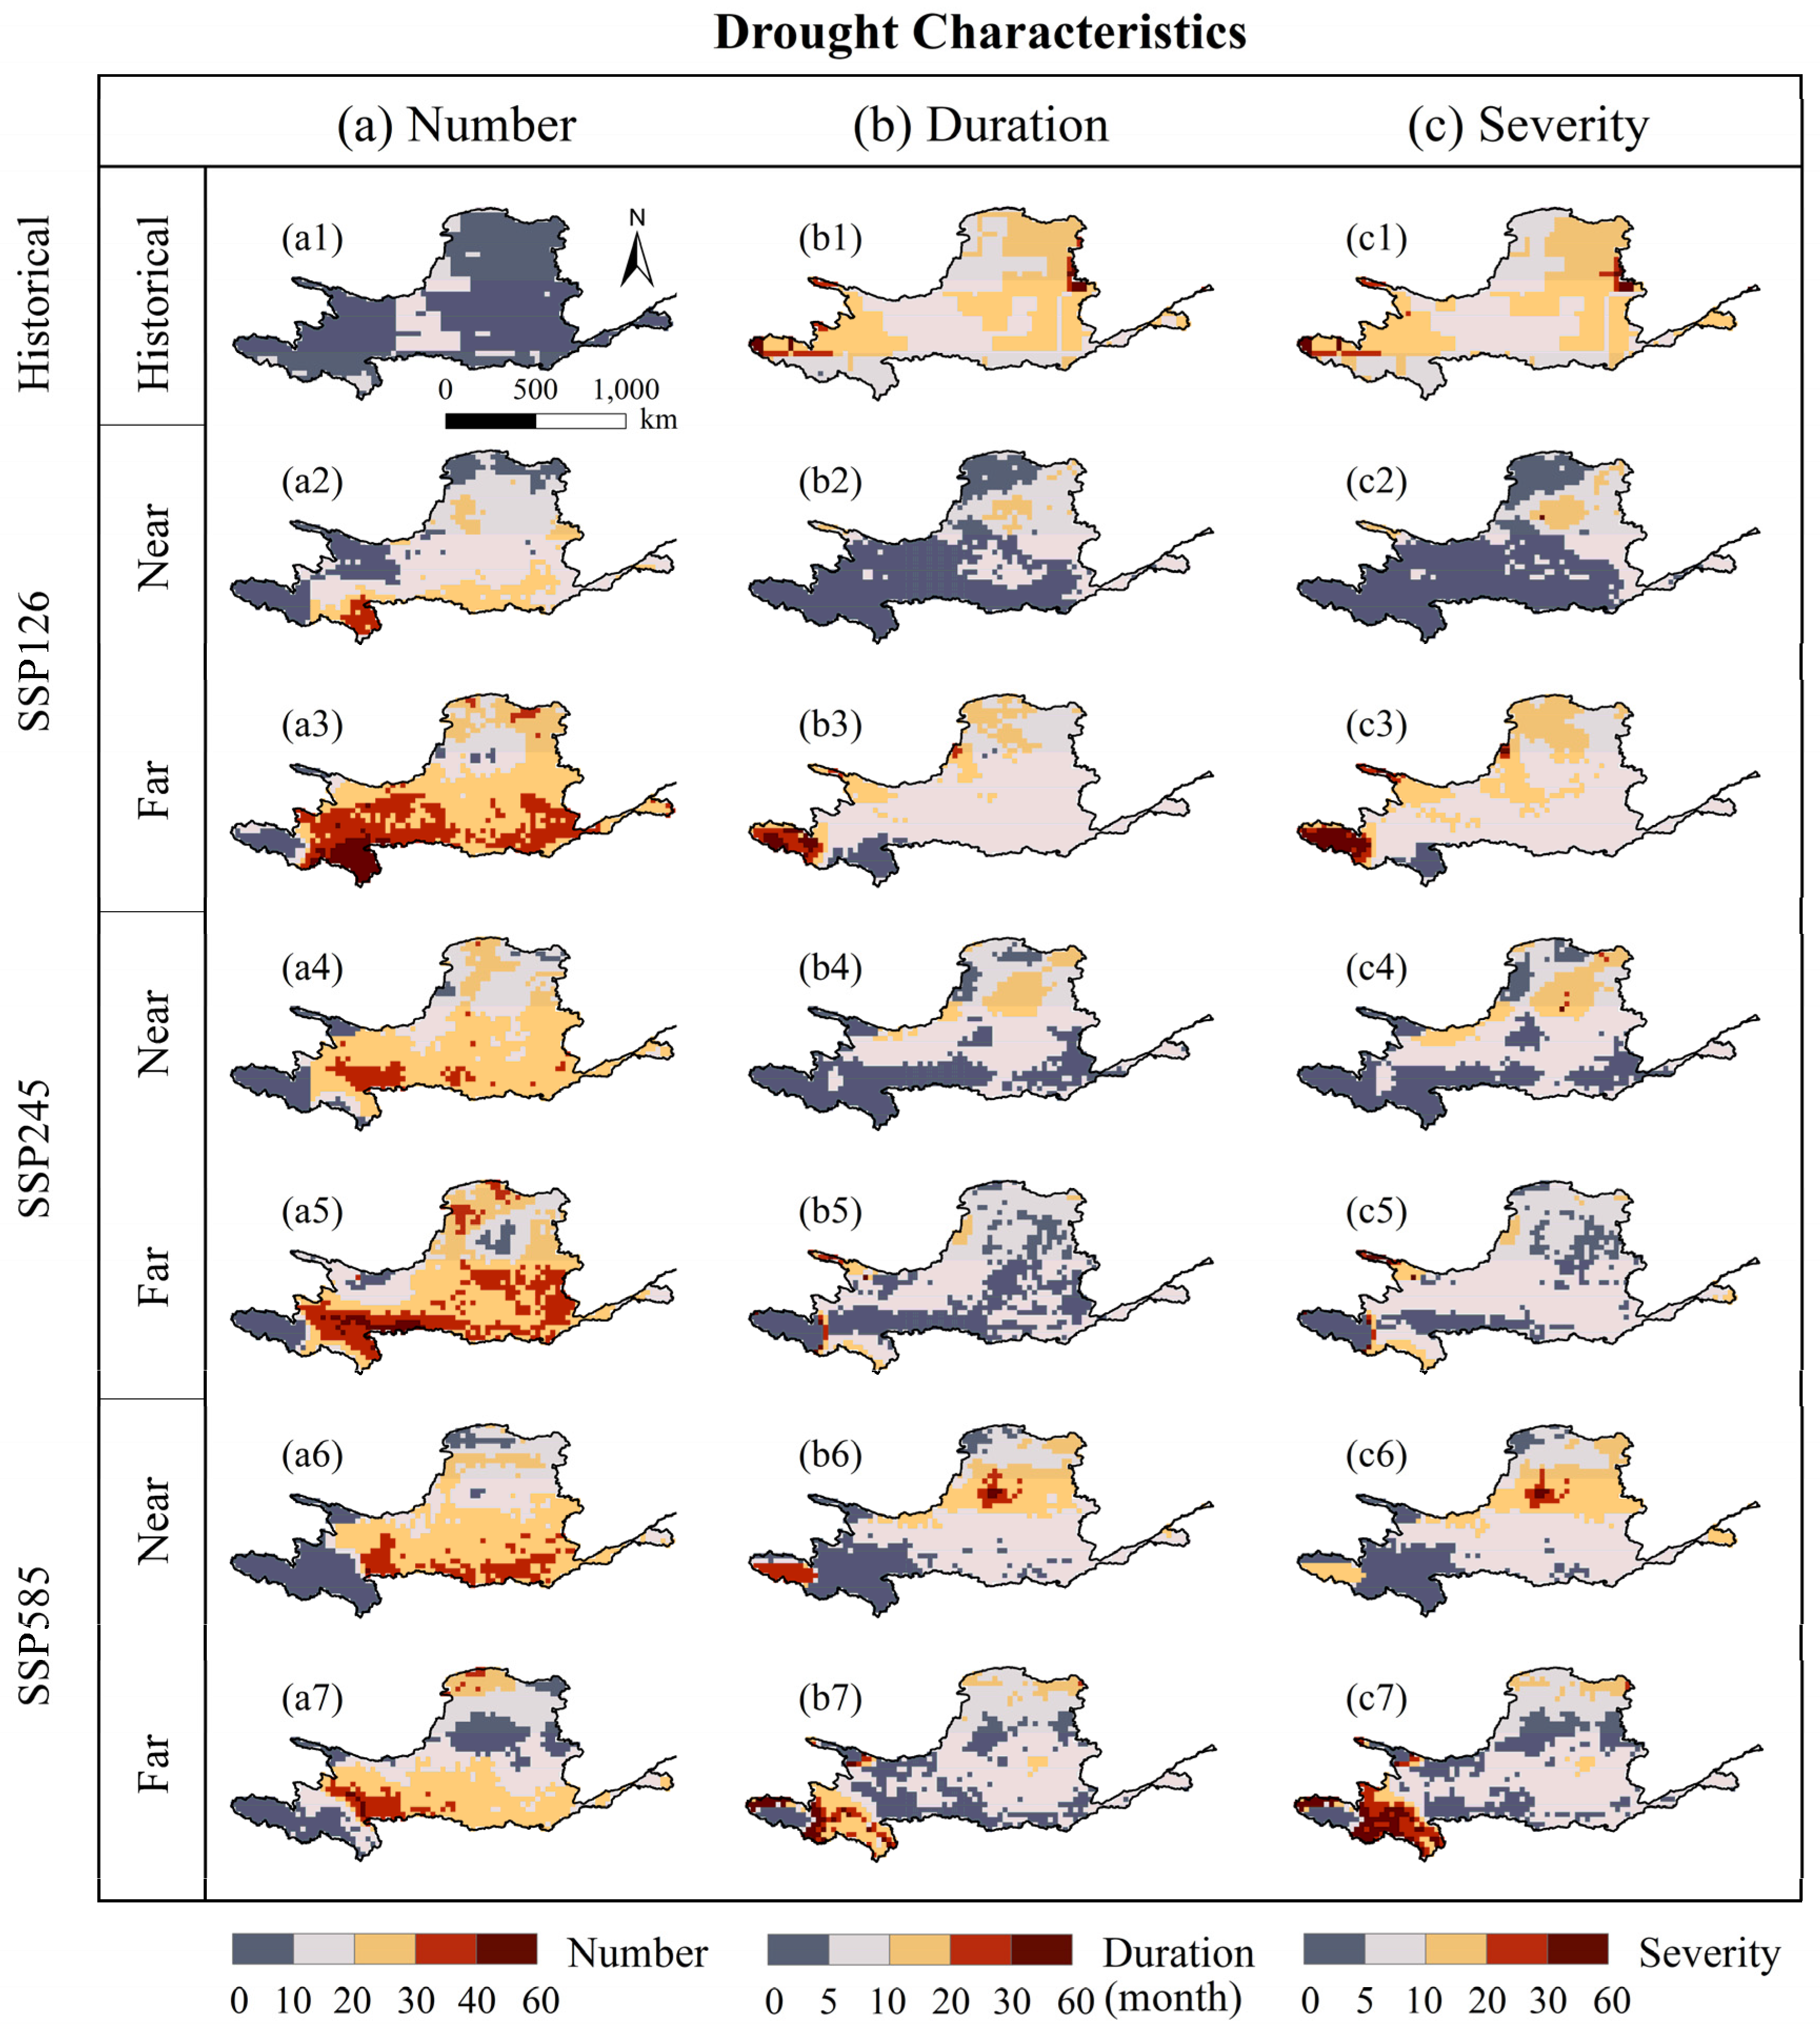
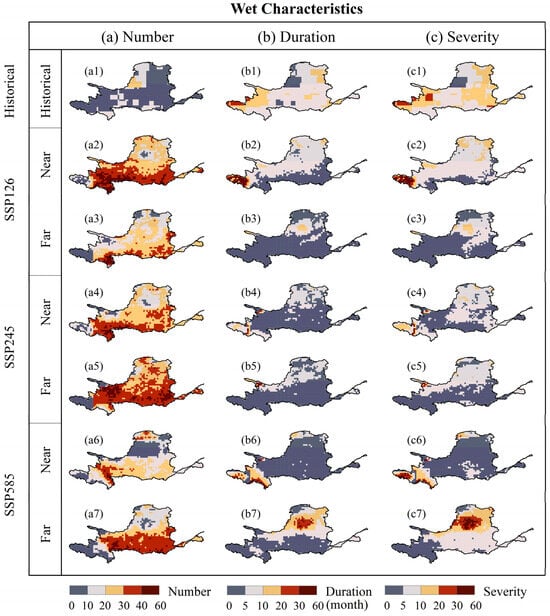
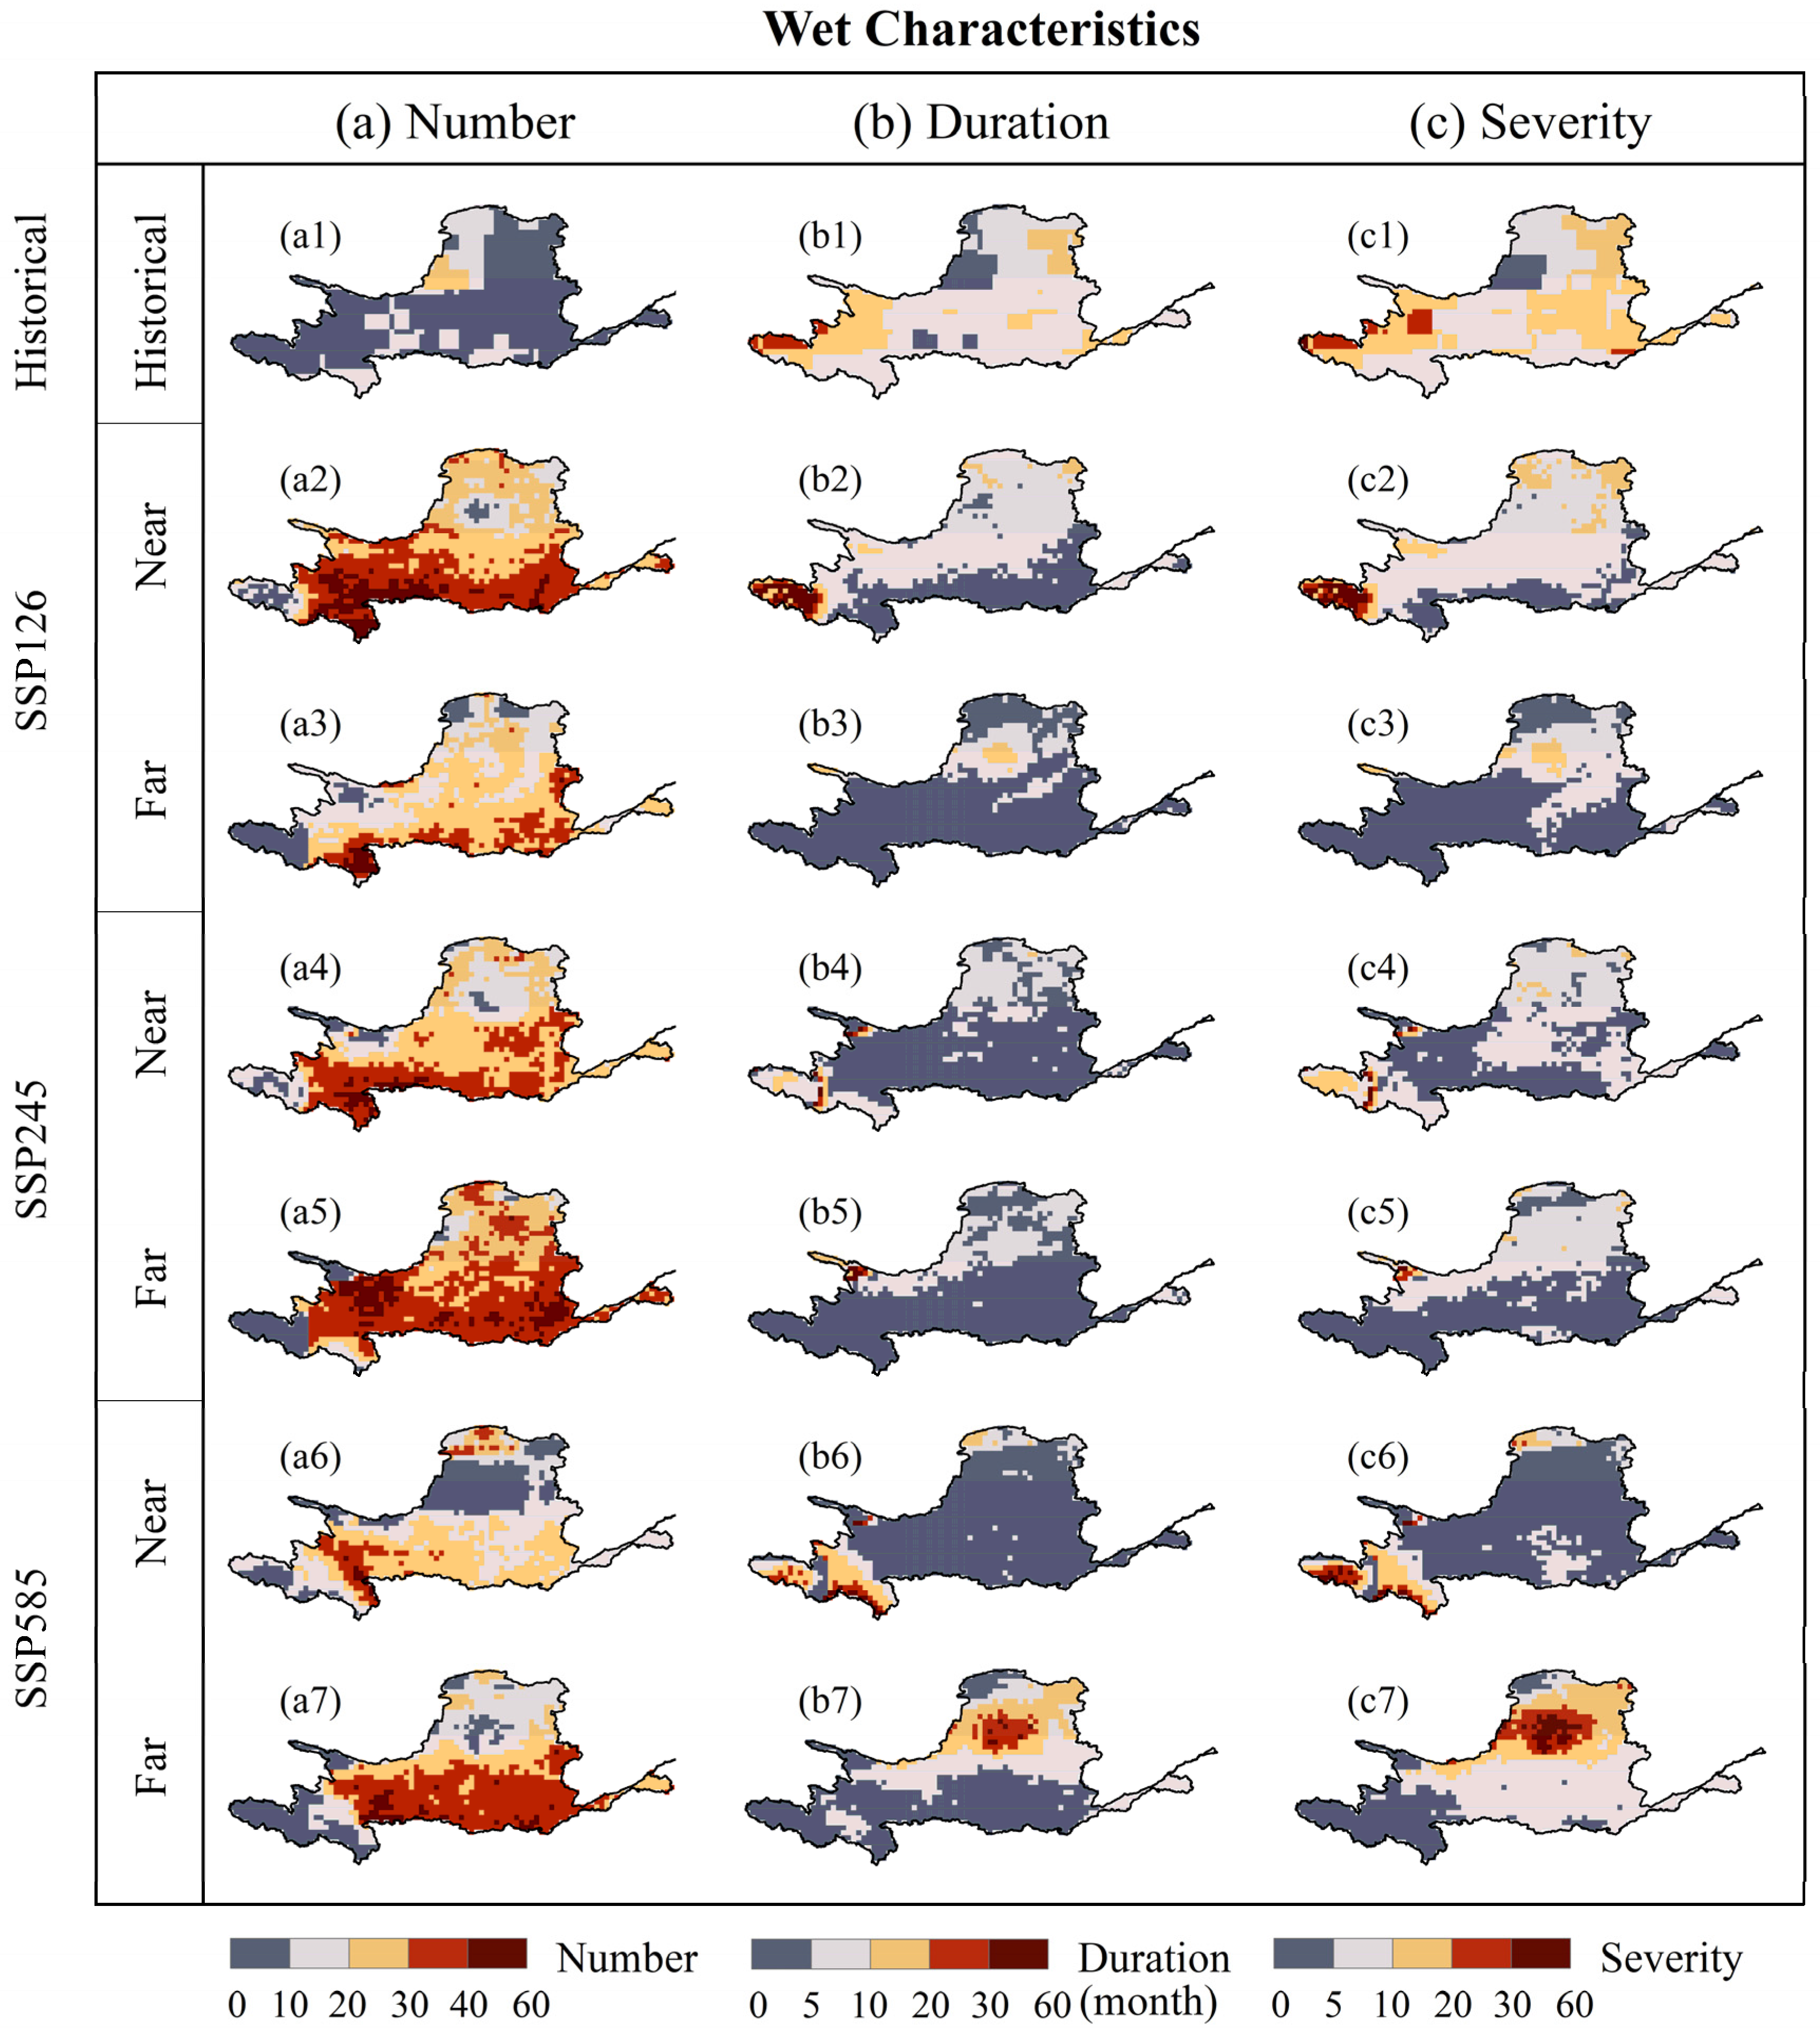
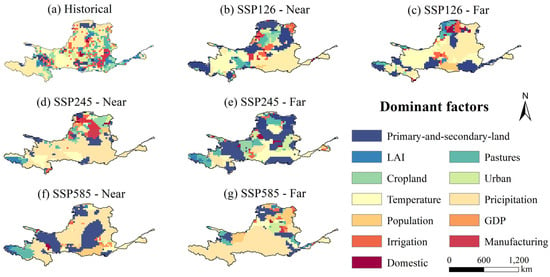
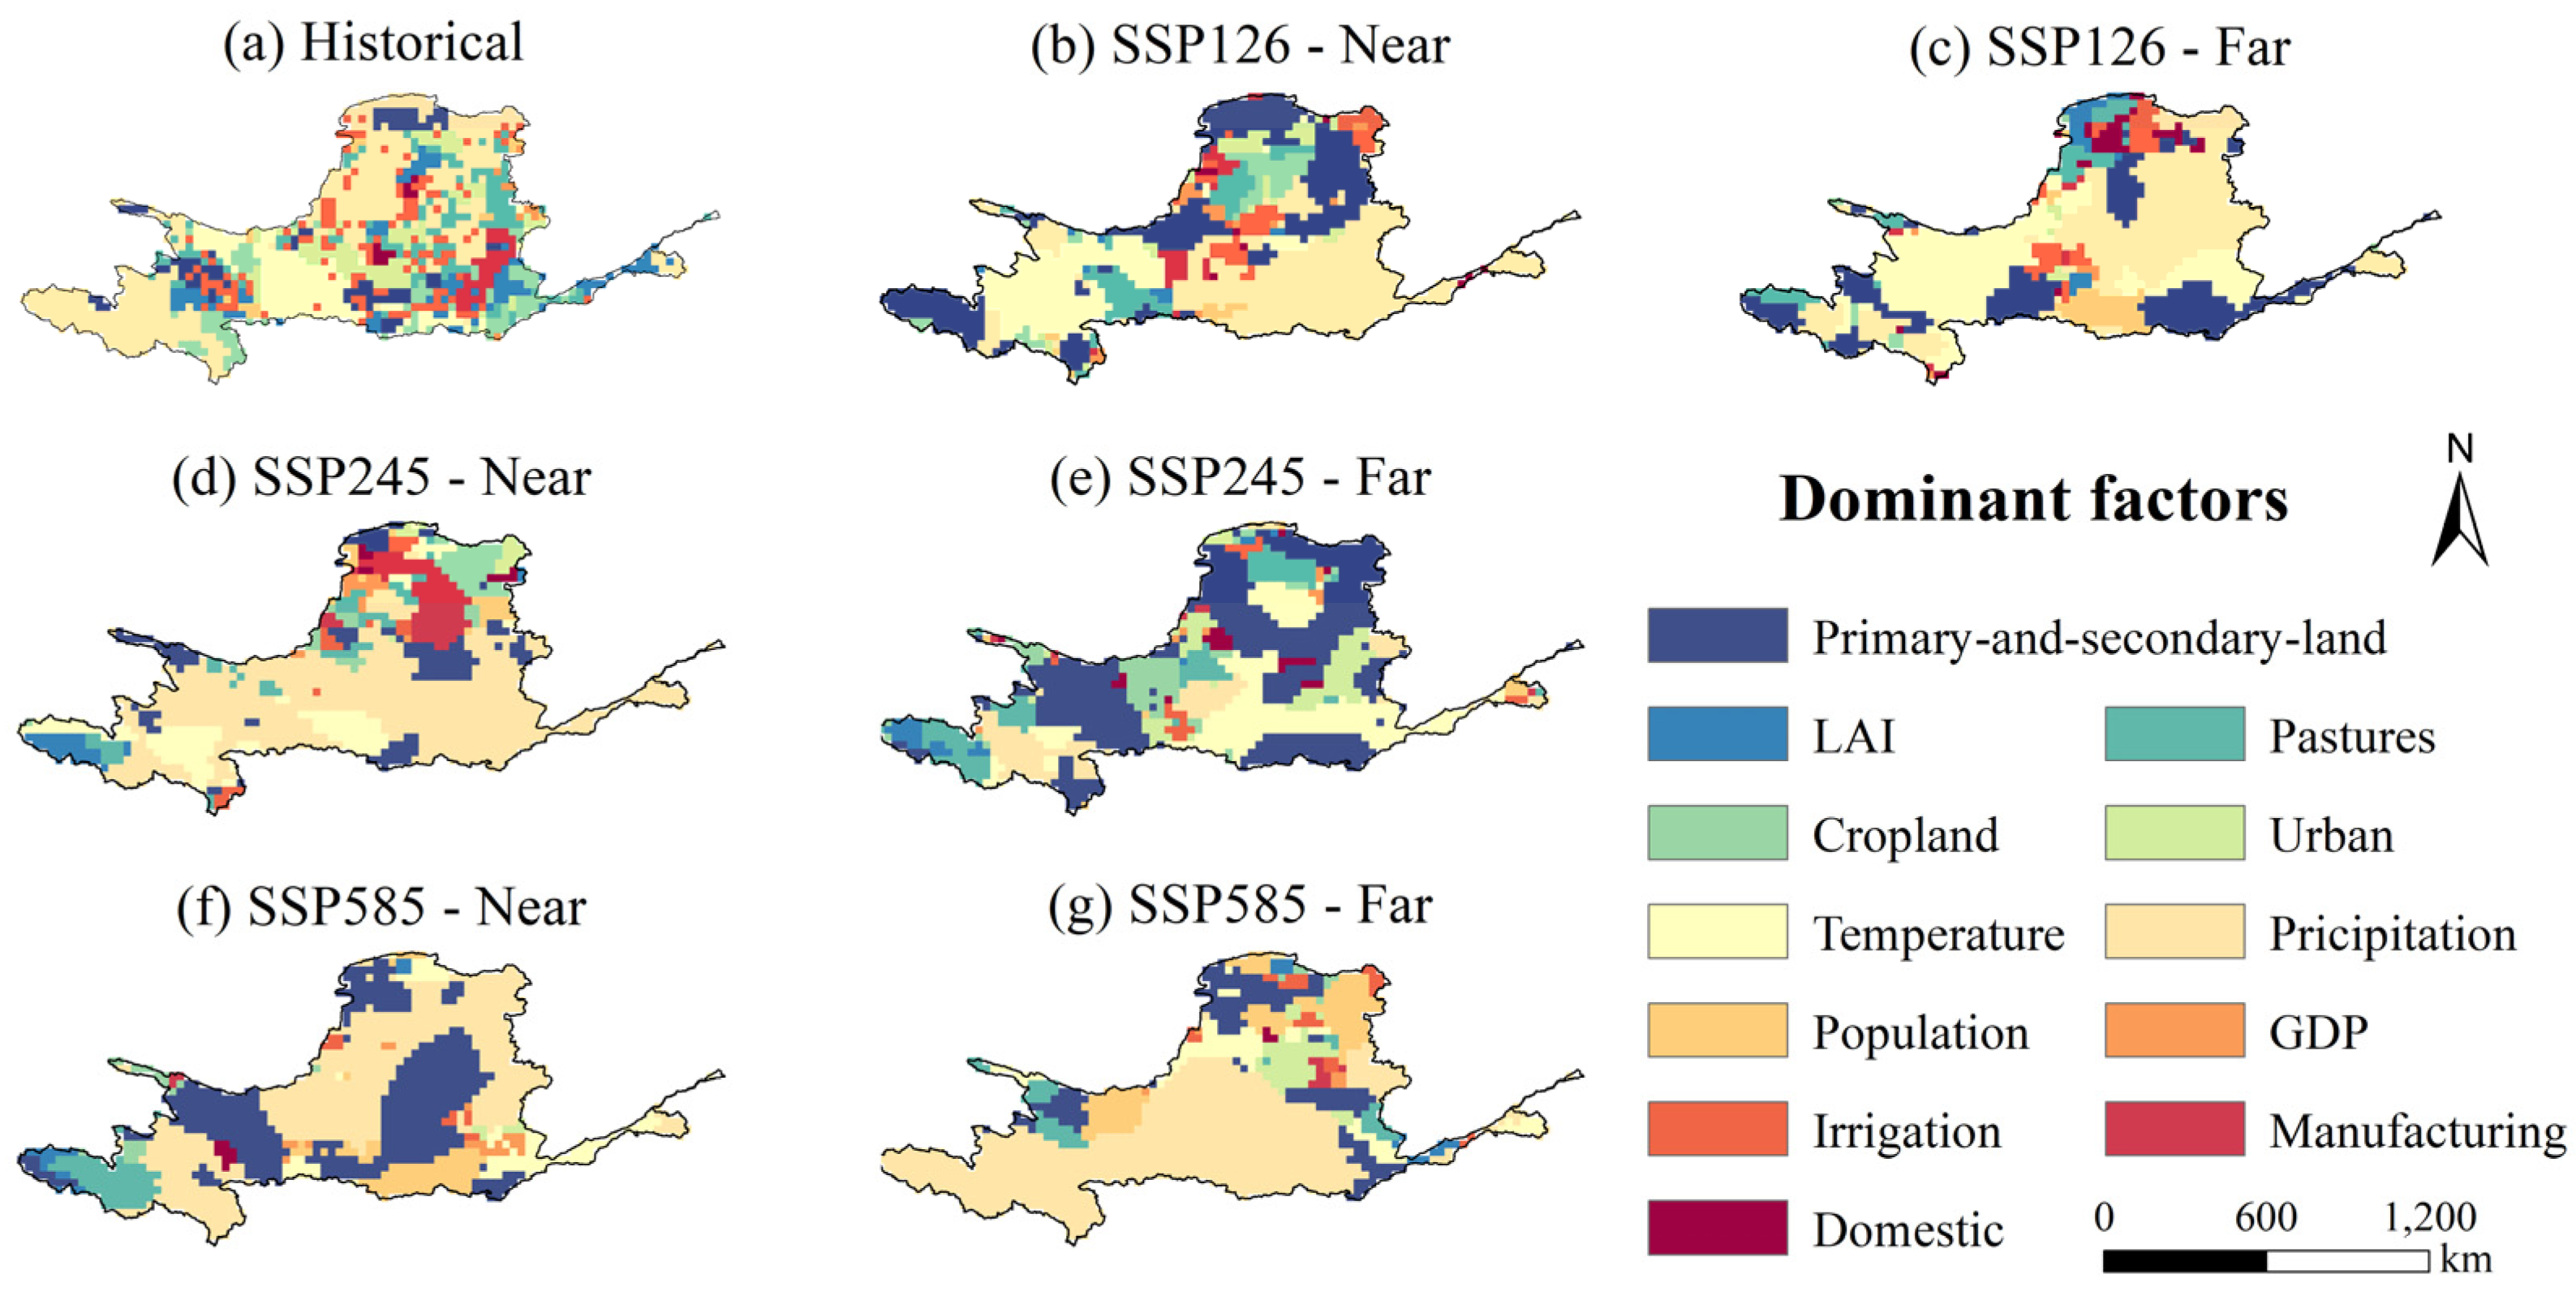
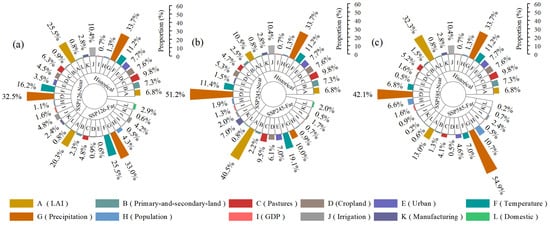
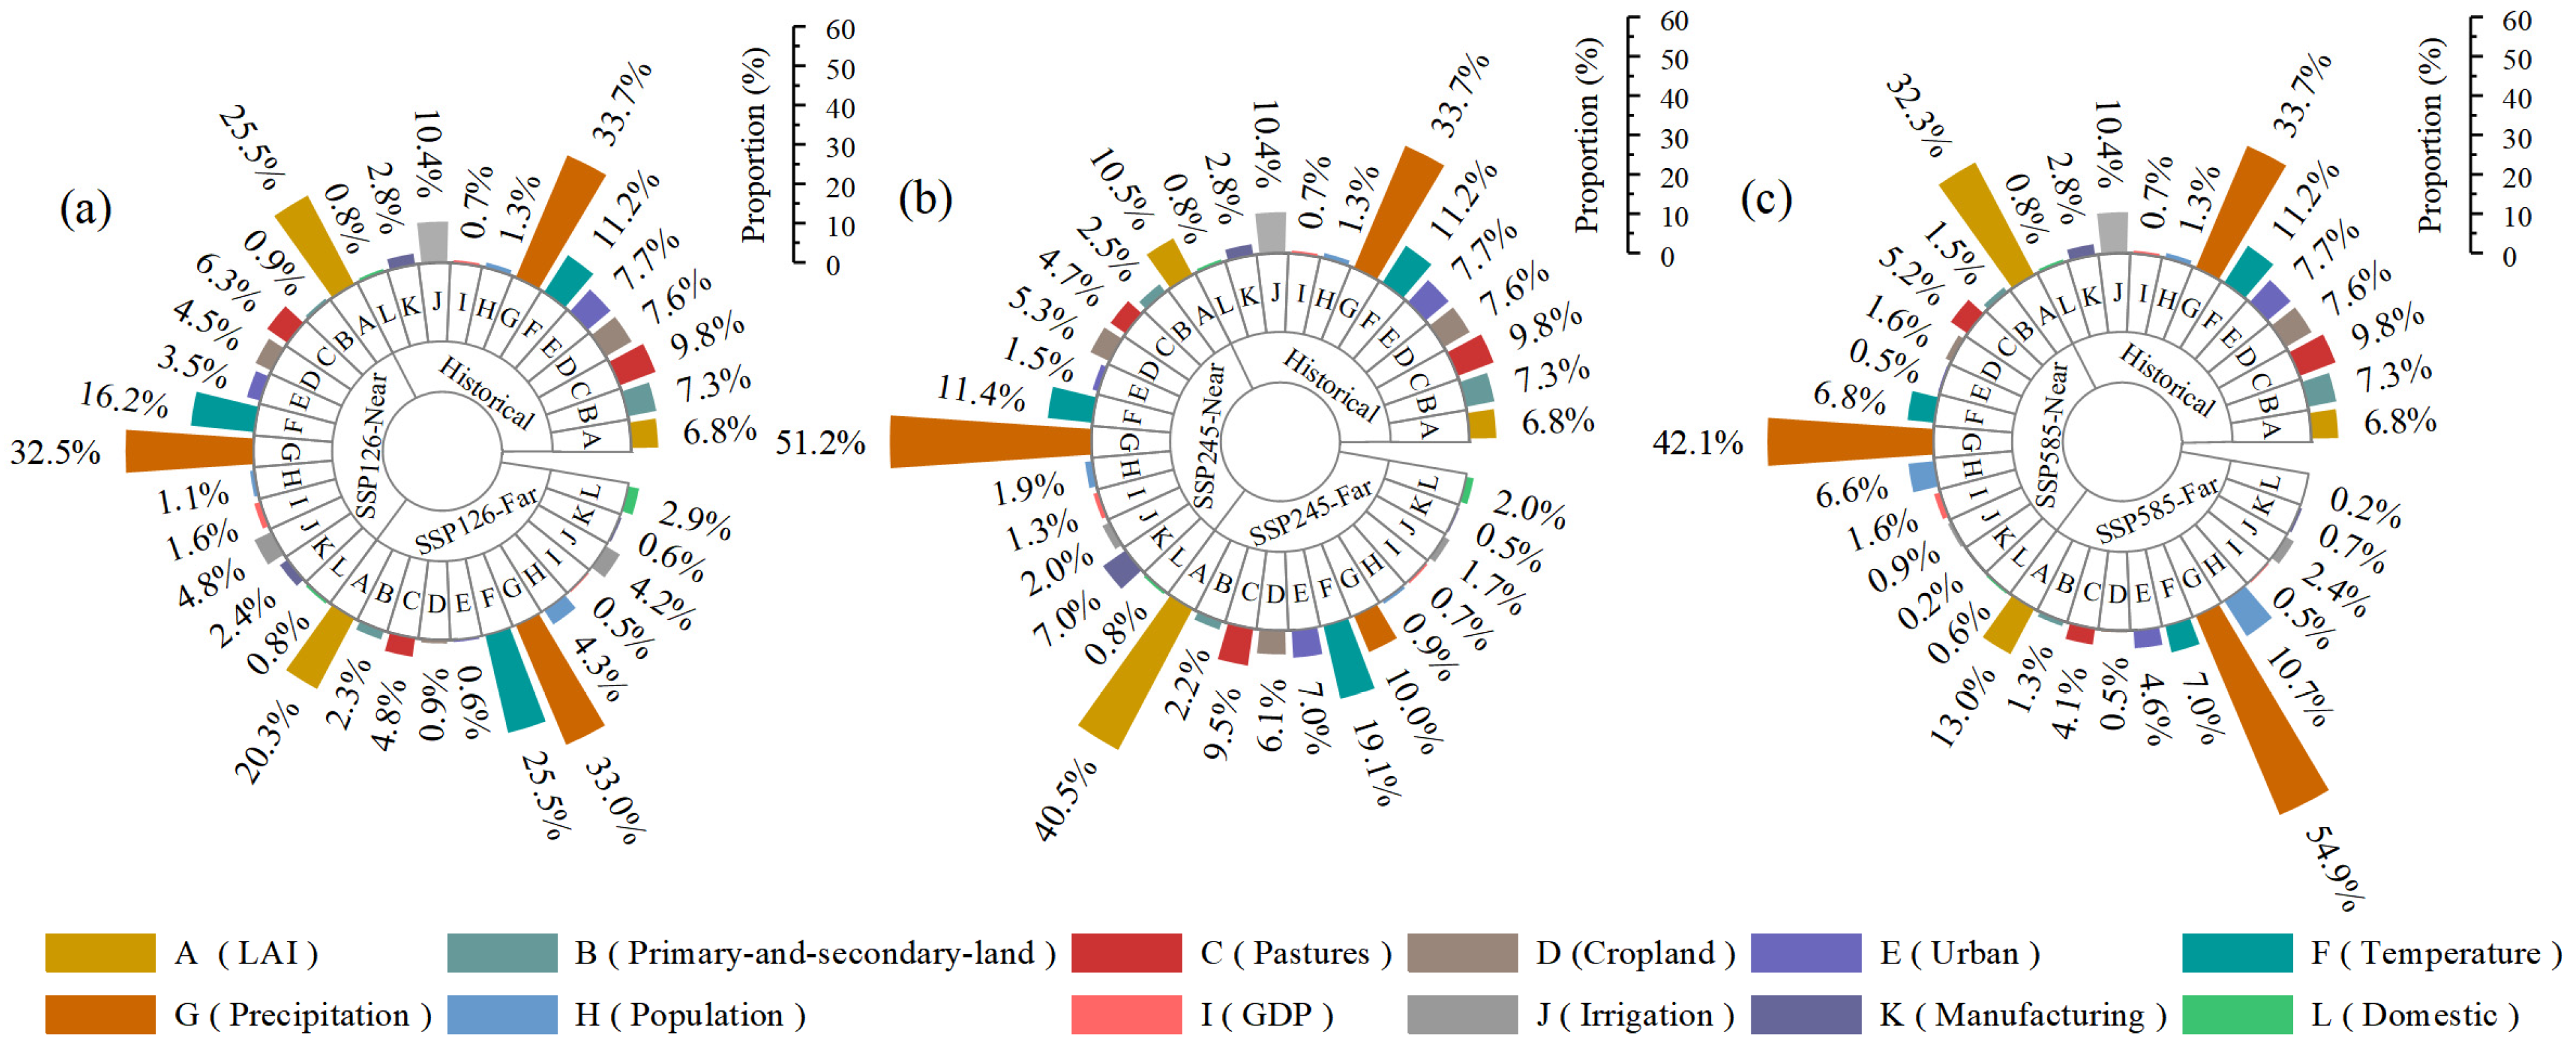
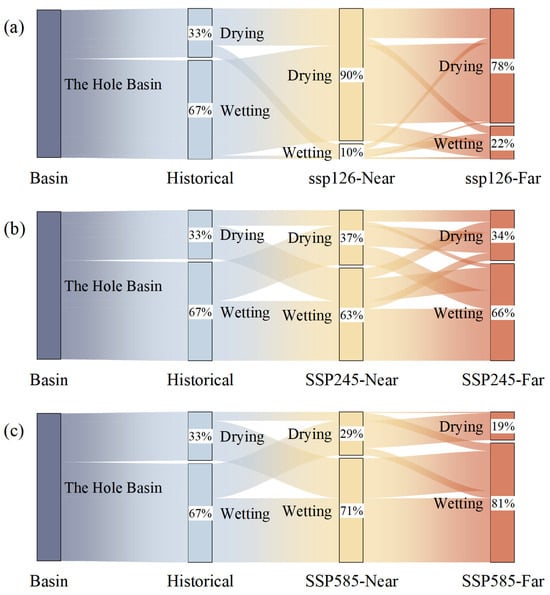
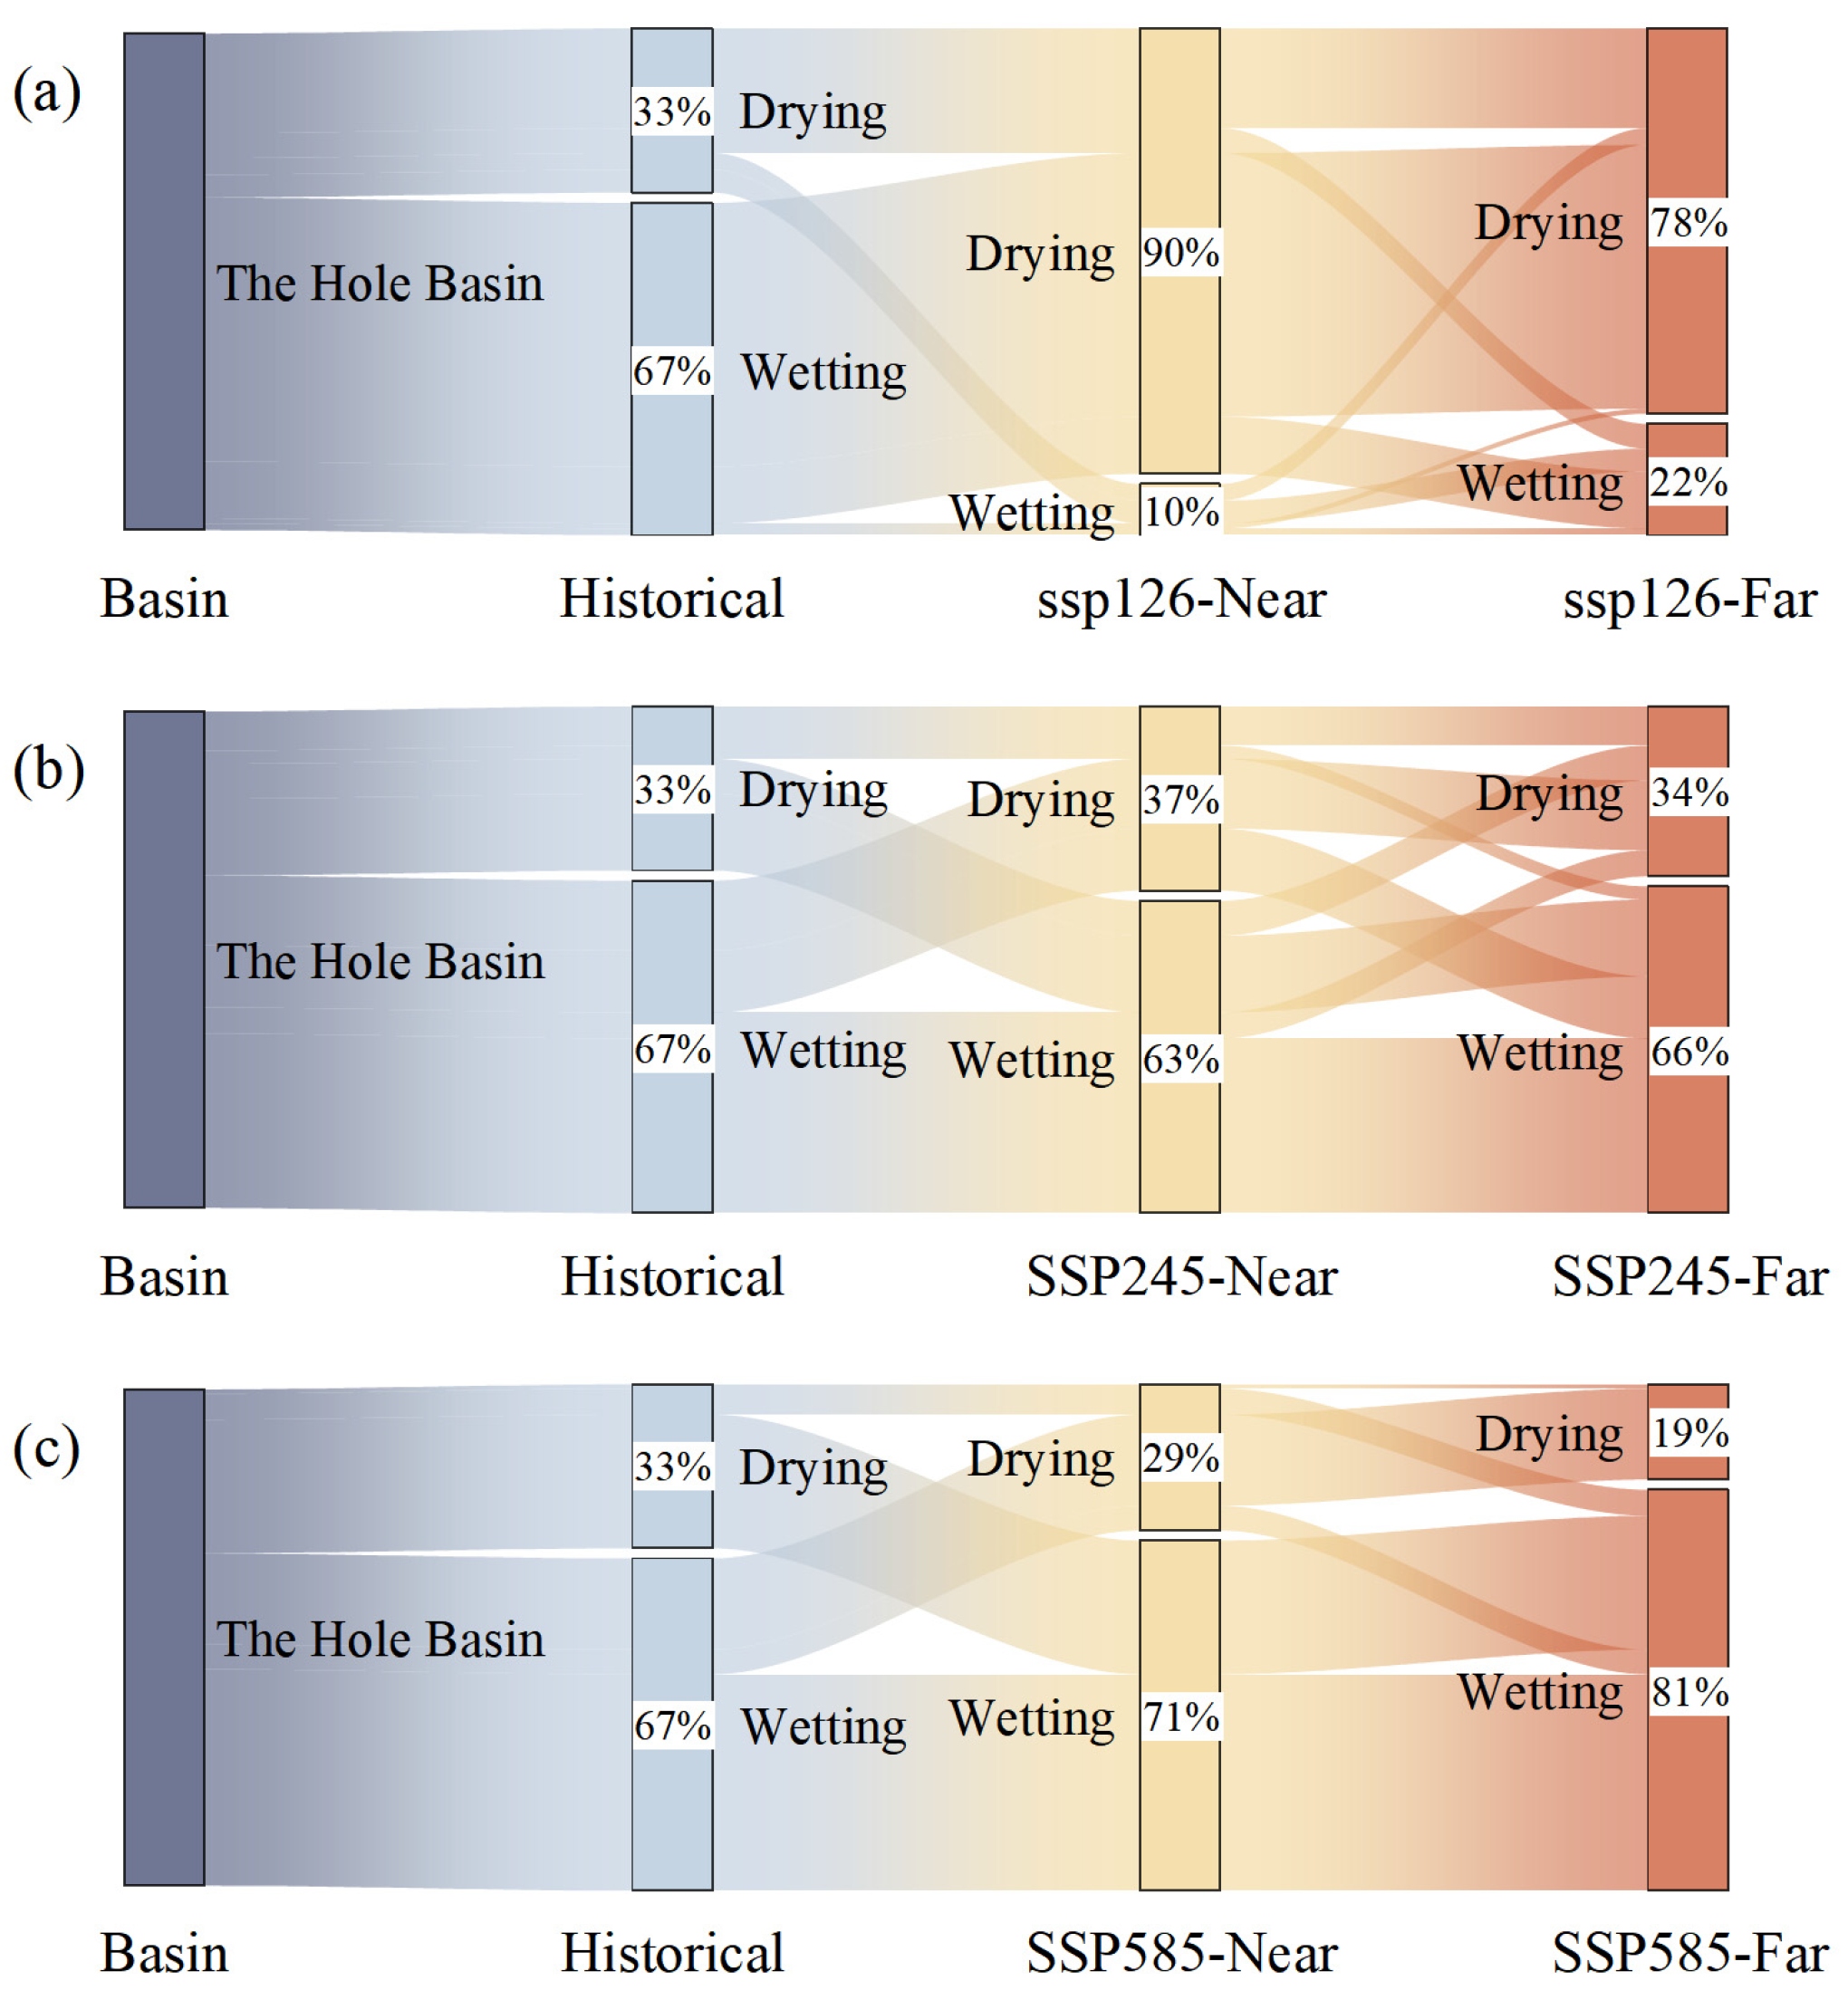
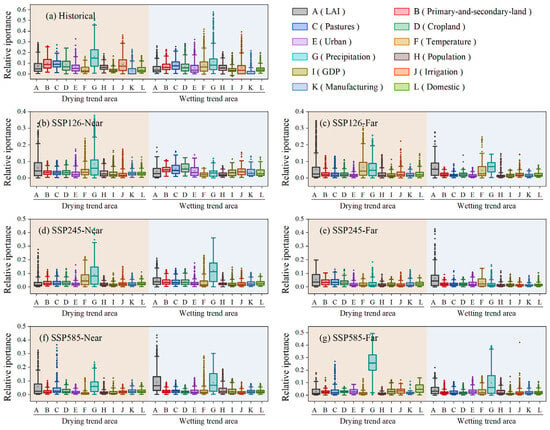
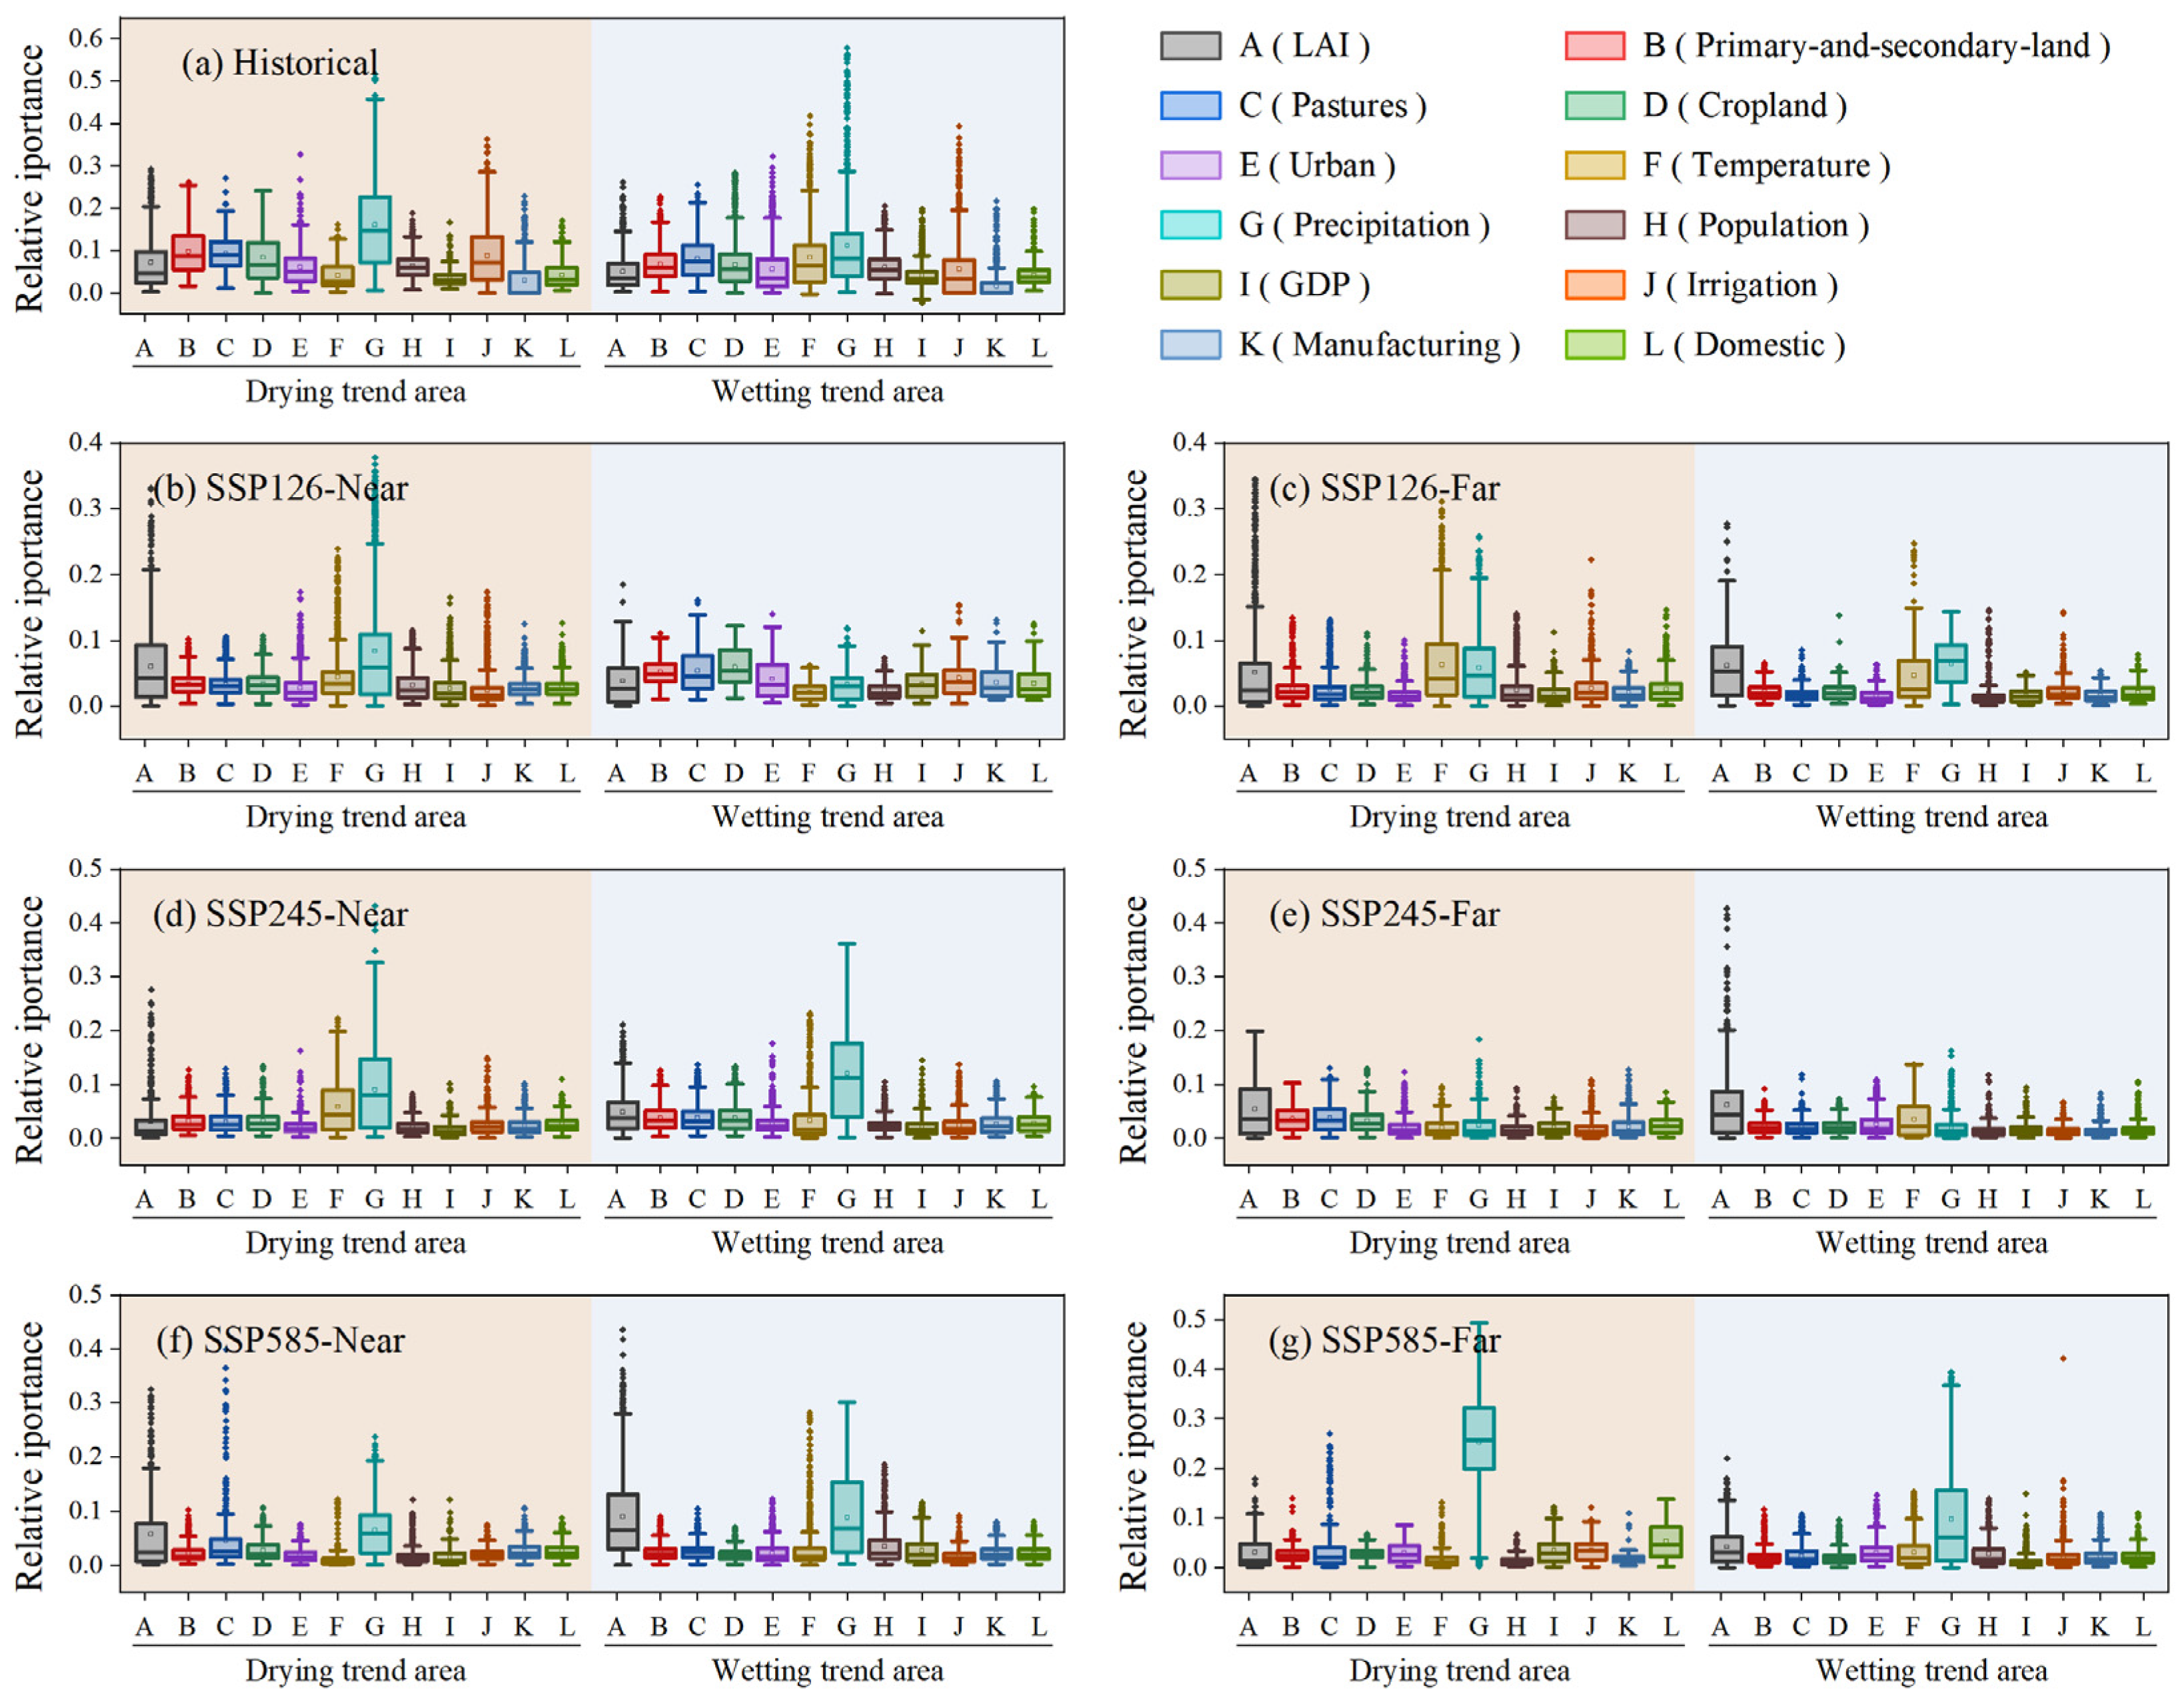

Disclaimer/Publisher’s Note: The statements, opinions and data contained in all publications are solely those of the individual author(s) and contributor(s) and not of MDPI and/or the editor(s). MDPI and/or the editor(s) disclaim responsibility for any injury to people or property resulting from any ideas, methods, instructions or products referred to in the content. |
© 2026 by the authors. Licensee MDPI, Basel, Switzerland. This article is an open access article distributed under the terms and conditions of the Creative Commons Attribution (CC BY) license.