


Highlights
What are the main findings?
- Remote sensing of Land Use and Land Cover change in a regional temperate forest system showed increases in deciduous forest, mixed forest, agriculture, and built-up areas while hay/grass/pasture declined.
- Climate change is projected to disrupt recovery from past forest cover decline, pushing transitions toward mixed and evergreen forests.
What are the implications of the main findings?
- Land Use and Land Cover change in the Shawnee National Forest over 29 years was consistent with Forest Transition Theory.
- It is important to integrate socio-economic trends with climate adaptation to sustain forests and ecosystem changes.
Abstract
The Land Use and Land Cover (LULC) of many regional landscapes are changing due to natural effects and anthropogenic activities, impacting biodiversity and ecosystem services. LULC dynamics reflect the altered flow of energy, water, and greenhouse gases, influencing the pillars of sustainability: society, environment, and economy. Thus, assessing LULC changes is vital for understanding the relationship between nature and society. This study used multi-temporal remotely sensed imagery to examine LULC change between 1990 and 2019 in the context of Forest Transition Theory (FTT) across the Greater Shawnee National Forest (GSNF) area of southern Illinois, USA, using a random forest algorithm, and projecting change to 2050 with a Land Change Model integrated with IPCC temperature and precipitation scenarios. From 1990 to 2019, LULC analysis showed increases in deciduous forest (1.35%), mixed forest (26.40%), agriculture (2.15%), and built-up areas (6.70%), while hay/grass/pasture declined (16.0%). LULC change intensity was highest from 1990 to 2001 (2.35% annually), slowing to 0.23% (2001–2010) and 0.18% (2010–2019). The overall accuracy (OA) of LULC classification ranged from 0.9 to 0.95 at a 95% confidence interval (CI). Projections to 2050 showed consistent increases in built-up areas (17.12–42.61%), water (28.75–39.70%), and hay/grass/pasture (6.23–38.38%), while overall forest cover declined in all scenarios. Deciduous forests decreased by 3.11–19.87% and were replaced by mixed forests in some scenarios (12.45–23.63%), while evergreen forests showed mixed responses, ranging from a decline of up to 17.13% to an increase of 2.90%. The OA of projected LULC ranged from 0.71 to 0.83 (95% CI) across SSP-RCP-based temperature and precipitation scenarios. The results showed that the GSNF broadly follows the FTT framework: forest recovery since 2001 coincided with rural depopulation, slow agricultural expansion, and rising incomes. However, climate change is expected to disrupt this recovery, pushing transitions toward mixed and evergreen forests. Findings demonstrate the importance of integrating remote sensing-based LULC with socio-economic trends and climate adaptation strategies to sustain forests and ecosystem services under future environmental pressures.
1. Introduction
1.1. The Relationship Between Land Use and Land Cover Change, Climate Change, and Ecosystem Services
Land is a fundamental terrestrial resource that humans alter for their basic needs including food, shelter, and services. The anthropogenic alterations of these terrestrial resources, such as converting forests, grasslands, and shrublands to agricultural areas or urban areas, or any other land cover types, are considered Land Use and Land Cover (LULC) change [1,2]. LULC change poses a significant environmental challenge that affects biodiversity, ecosystem services (ESs), and climate regulation, threatening the existence of various terrestrial life forms that depend upon these resources [3,4,5,6]. LULC change is the most visible representation of how an ecosystem and its services change, with impacts that are often immediately apparent, but can also exhibit legacy effects, shaping ecosystem structure, function, and services long after the initial change [2,7,8]. For example, past land conversions may influence current carbon storage, species richness, and recreational values, illustrating the need for frameworks that account for both immediate and lasting impacts [7]. The trajectory of LULC change is driven by industrialization, population growth, and technological progress. These driving forces enable the expansion of agriculture and urban areas, supporting economic development and improved living standards. However, this progress often comes at the expense of ecological integrity, causing immediate damage like deforestation, soil degradation, biodiversity loss, pollution, and the long-term degradation of ecosystem services [1,6,9].
LULC change has complex ecological, social, and economic effects. Landowners and managers often prioritize short-term economic gain, which risks degrading long-term ecosystem services, with significant financial and social consequences, as these services provide trillions of dollars in benefits annually. For instance, Kubiszewski et al. [10] estimated that, depending on land-use decisions, global ES values could decline by $51 trillion or increase by $30 trillion annually by 2050. These changes are not evenly distributed geographically; while Germany recorded increases in ES values, China saw losses. The burden of ES changes is also inequitably distributed within societies. Gourevitch et al. [11] demonstrated that forest and wetland conversion in the US disproportionately reduced ecosystem services for low-income, non-white, and urban communities. Therefore, the legacy of LULC change is not only ecological but also economic and social, indicating that LULC decisions are as much about justice and equity as about environmental sustainability.
Climate change and LULC change are deeply interconnected, forming a feedback system that operates across local-to-global scales. Anthropogenic activities such as deforestation and urban expansion release greenhouse gases and alter surface properties, thereby altering energy balances and climate patterns. Similarly, climate change through shifting rainfall regimes, rising temperatures, and more frequent extreme events impact LULC by reducing crop yields, stressing forests, and straining water supplies [12,13]. These changes increase demand for resources just as their availability decreases, adding stress to ecosystems and human livelihoods [14]. To understand these dynamics, researchers use integrated assessment models that combine the IPCC’s Shared Socio-Economic Pathways (SSPs) with Representative Concentration Pathways (RCPs). These scenario frameworks spanning sustainable futures (SSP1-2.6) to fossil fuel-intensive scenarios (SSP5-8.5) offer a structured way to explore how climate and socio-economic change together influence LULC, biodiversity, and ES [2,15]. Recent scenario-based land-change studies emphasize that such projections should be interpreted as bounded plausible futures rather than deterministic forecasts because nonlinear socio-economic and disturbance processes can alter trajectories beyond calibration behavior [15,16].
The ability to monitor and predict LULC change has improved with advances in remote sensing technologies and modeling techniques. Remote sensing satellite systems such as Landsat, MODIS, and Sentinel provide consistent, multi-temporal, and cost-effective data for monitoring LULC change at multiple spatial scales [17,18]. Global products [19,20], regional datasets [21], and national initiatives [22] now offer comprehensive coverage, enabling researchers to link LULC to biodiversity, ecosystem functions, and atmospheric processes [23]. Predictive models such as Markov chains and cellular automata estimate future transitions based on historical probabilities [24,25], providing an additional dimension to LULC. Recent LULC research increasingly integrates these machine learning (e.g., random forest, support vector, Markov chain and cellular automata, etc.) classifications with multi-temporal satellite archives to ensure consistency across sensors and years and to improve the interpretability of mapped trajectories [26,27]. These models help identify biodiversity hotspots, vulnerable landscapes, and potential policy outcomes, providing tools for proactive management. In this study, remotely sensed data were used not only to map LULC but also to evaluate land system theory by coupling LULC trajectories with demographic and economic indicators and scenario modeling. Such integration in land system analysis is considered an important and innovative application of remote sensing, bridging earth observation and sustainability science [28].
Understanding the causes of LULC requires examining economic drivers, institutional frameworks, and the processes involving LULC transitions. Farmers and landowners frequently prioritize short-term gains, while market forces and government policies can either reinforce or counter these choices [29]. For example, agriculture is often managed to maximize yields, overlooking the non-market benefits provided by forests, such as water regulation and wildlife habitat, which are central to ES [30,31]. Governance plays a key role through regulations, conservation initiatives, and LULC planning, though policy decisions typically involve trade-offs between economic growth and ecological protection. To understand these dynamics, Forest Transition Theory (FTT) offers valuable insights, illustrating how these drivers—human, economy, and institutional frameworks—can shift from deforestation to reforestation, enhancing ecosystems and ES [29]. However, many LULC studies treat FTT solely as a post hoc interpretation, rather than evaluating whether observed trajectories satisfy the structural conditions predicted by the theory. In this study, FTT is treated as an analytical framework with measurable indicators linking LULC, particularly agriculture and forest cover, to demographic and economic drivers. Specifically, remotely sensed forest and agricultural trajectories were evaluated as indicative signals of transition coupled with economic and population trends.
1.2. LULC in the Context of Forest Transition Theory
Forest Transition Theory (FTT) is a conceptual framework that explains long-term forest dynamics as a shift from net forest loss to net forest gain, occurring alongside changes in LULC, demographics, and economic structures [32,33]. In its classic form, FTT characterizes a U-shaped trajectory of forest cover over time: initial rapid deforestation driven by agricultural expansion gives way to a turning point at which net forest loss ceases, followed by stabilization and eventual net reforestation through natural regeneration, the abandonment of marginal farmland, or active restoration [32,33,34,35,36]. The FTT trajectory can be empirically evaluated by testing three coupled indicators, inverse forest–agricultural change, population change, and rising income associated with diversification, which represent the economic development pathway of forest transition. Rudel et al. [37] identified two dominant representative pathways toward reforestation: (1) the economic development pathway, in which urbanization, rising non-farm incomes, and farmland abandonment on less productive lands lead to spontaneous forest recovery, and (2) the forest scarcity pathway, where rising timber prices and perceived shortages stimulate plantations or protection.
Subsequent works have refined FTT by outlining multiple interacting pathways to forest recovery, including economic development (urbanization, agricultural intensification, and farmland abandonment), forest scarcity (rising timber prices incentivizing plantation), state-led reforestation (policy-driven), and, to some extent, globalization (trade displacing deforestation to other regions) [32,34,35,36,38]. MacDonald [34] reported that forest gains often involve trade-offs in biodiversity and equity, while Rosa et al. [39] showed that regrowth in Brazil’s Atlantic Forest remains fragile and governance-dependent. In China, the Grain for Green Program has driven a state-led forest transition, resulting in a net gain of over 438,000 km2 in planted forests from 1990 to 2020, primarily through conversions from cropland, shrublands, and grasslands [40]. Gupta et al. [41] found that LULC transitions shape distinct forest change trajectories within the FTT framework, with cropland expansion driving rapid forest loss due to agricultural prioritization, while wetlands and shrublands support gradual forest recovery through natural regeneration and restoration, reinforcing governance-driven reforestation and the preservation of ES.
These insights help revisit FTT in the US context. Figure 1 illustrates the historical trajectory of LULC and forest cover in relation to agriculture and economic development. The early phase was characterized by rapid land conversion with little government oversight, while the later phase reflects more deliberate policies and conservation initiatives that slowed deforestation and encouraged regrowth. This framework demonstrates that transitions are not automatic outcomes of development but are mediated by institutional capacity, policy interventions, governance, and societal values.
Figure 1.
Overview of LULC transition timeline framework, particularly forest cover, agriculture, and economy, representing different transition zones and essential policies that directly or indirectly help slow down deforestation and increase reforestation or afforestation in the USA.
Despite FTT’s wide application in large-scale forest dynamics, it remains underutilized in local contexts, where it can effectively contextualize, interpret, and quantify LULC trajectories derived from remotely sensed data. This theory is developed mainly in high-income temperate regions, but its relevance to rural settings is underexplored. In southern Illinois, the shift from 19th-century deforestation to 20th-century recovery, driven by land abandonment, conservation policy, and socio-economic change, offers a strong case for testing the theory. This test will reveal how its applications often overlook links between LULC transition and local socio-economic dynamics and broaden the theory’s scope while informing conservation planning, ecosystem management, and sustainable rural development. Few studies directly test FTT indicators using remotely sensed time series at sub-regional scales, leaving uncertainty about whether observed recovery reflects true transition or localized succession dynamics [29]. In operational terms, this study evaluates FTT using measurable indicators: the inverse forest–agriculture relationship and the coupling between forest recovery, declining population, and increasing income following the economic development pathway of forest transition in GSNF.
1.3. Research Motivation and Objectives
The broad aim of this study is to examine LULC dynamics in the Greater Shawnee National Forest (GSNF), southern Illinois, USA, and evaluate them within the FTT framework, while also projecting future LULC trajectories under the SSP-RCPs scenario. The specific objectives are: (i) to quantify spatiotemporal patterns and intensities of LULC change from 1990 to 2019, (ii) to assess whether forest cover and agriculture in the GSNF follow FTT trajectories, and (iii) to predict climate-driven forest transitions to 2050 under SSP-RCP scenarios. The hypotheses are that LULC change in the GSNF aligns with national trends [42,43] and climate variability will significantly influence future forest cover. Local empirical validation of FTT mechanisms remains limited despite widespread global application, particularly in temperate forests where socio-economic and policy-driven conservation dominate land recovery dynamics. GSNF, therefore, represents a critical test case linking satellite-observed LULC change to FTT. Integrating long-term remote sensing data with scenario-based modeling to evaluate theoretical transition criteria aligns with recent calls to move remote sensing from descriptive monitoring to process-based inference in coupled human environment systems, thereby contributing to understanding how local forest transitions interact with broader socio-economic and climatic drivers. The findings provide empirical evidence of FTT in a rural context and offer data-driven insights into conservation planning, ecosystem management, and sustainable LULC policy.
2. Materials and Methods
2.1. Study Area
The GSNF covers approximately 1,425 km2 across 11 counties between the Mississippi and Ohio Rivers in southern Illinois (Figure 2). Elevation ranges from 89 to 312 m, and the climate is characterized by mean seasonal temperatures of 2.2 °C in winter and 24.4 °C in summer, with precipitation averaging 290 mm and 310 mm, respectively. It is located at the terminal boundary of the Illinoisan Glacier during the Pleistocene Epoch (~120,000 years ago), distinguished by sandstone, limestone, and shale escarpments that shape its rugged physiography [44,45,46]. The vegetation is dominated by Oak–Hickory (Quercus–Carya) forests that regenerated following fire and other disturbances, but in recent decades, mesophication has shifted community composition toward mesophytic hardwoods such as red maple (Acer rubrum), sugar maple (Acer saccharum), and beech (Fagus grandifolia) [44,47].
Figure 2.
Greater Shawnee National Forest (GSNF) land cover of the 1800s based on the public land survey system. These data were acquired from the Illinois Natural History Survey, Prairie Research Institute (https://geo.btaa.org/catalog/7901bccf-f9e6-45f4-9270-27129ac80fe8, accessed on 5 February 2020).
In the 1800s, oak–hickory forests, wetlands, and waterways dominated the GSNF landscape (Illinois Natural History Survey, Prairie Research Institute). Indigenous communities maintained subsistence and sustainable lifestyles, prioritizing essential needs, preserving cultural practices, and minimizing environmental footprints through limited modifications to the natural landscape [48]. Beginning in the late 17th century, and especially after 1778, European settlers significantly altered landscapes in southern Illinois. They transformed forests and wetlands into agricultural fields and extracted timber for fuel, construction, and furniture. Thus, the recent transformation of LULC in southern Illinois resulted from the European settlers’ continuous and perceived progress of human society.
2.2. Data Acquisition
The Landsat program, operational since 1972, provides the longest continuous record of spaceborne terrestrial observations globally, with a spatial resolution of 30 m and a 16-day revisit interval [18]. This study utilized Landsat 5 Thematic Mapper (TM), Landsat 7 Enhanced Thematic Mapper Plus (ETM+), and Landsat 8 Operational Land Imager (OLI) imagery to classify LULC in the GSNF region of southern Illinois from 1990 to 2019. The beginning of this study was limited to 1990 due to the lack of earlier high-resolution aerial photographs for training the LULC models. Additionally, many long term LULC studies using Landsat adopt 1990 as a common baseline year due to the improved consistency of radiometric calibration, scene availability, and cross-sensor comparability [18,19]. The Landsat images within the study boundary were stacked year by year and preprocessed for cloud removal, along with gap fillings of Landsat 7 ETM+ scan line error. Then, from the yearly preprocessed stack, the median value of the stack was acquired to classify LULC.
This study incorporated two additional LULC datasets: one for the 1800s, derived from the Public Land Survey System and resampled to 30 m resolution to estimate forest and agricultural land, and another for 1980, published by the USGS and later converted to a GIS format (NAD1983, 30 m). PLSS-derived maps represent generalized vegetation polygons interpreted as categorical proportions rather than precise per-pixel classifications; resampling to 30 m was used only for spatial alignment, not for pixel-level accuracy evaluation [49]. Consequently, comparisons involving the 1800s forest and agricultural cover were interpreted as proportional landscape composition rather than pixel-level classification, thereby avoiding inflation of spatial accuracy [50]. Although the Public Land Survey System-derived dataset contains inherent spatial uncertainties, it remains one of the most valuable and widely used sources for reconstructing pre-settlement land cover. Population and median household income data were obtained from the US Census Bureau for the years 1800 through 2019. These datasets—LULC, population, and household income (Table 1)—were used to evaluate the FTT framework.
Table 1.
Data and their sources used in the study.
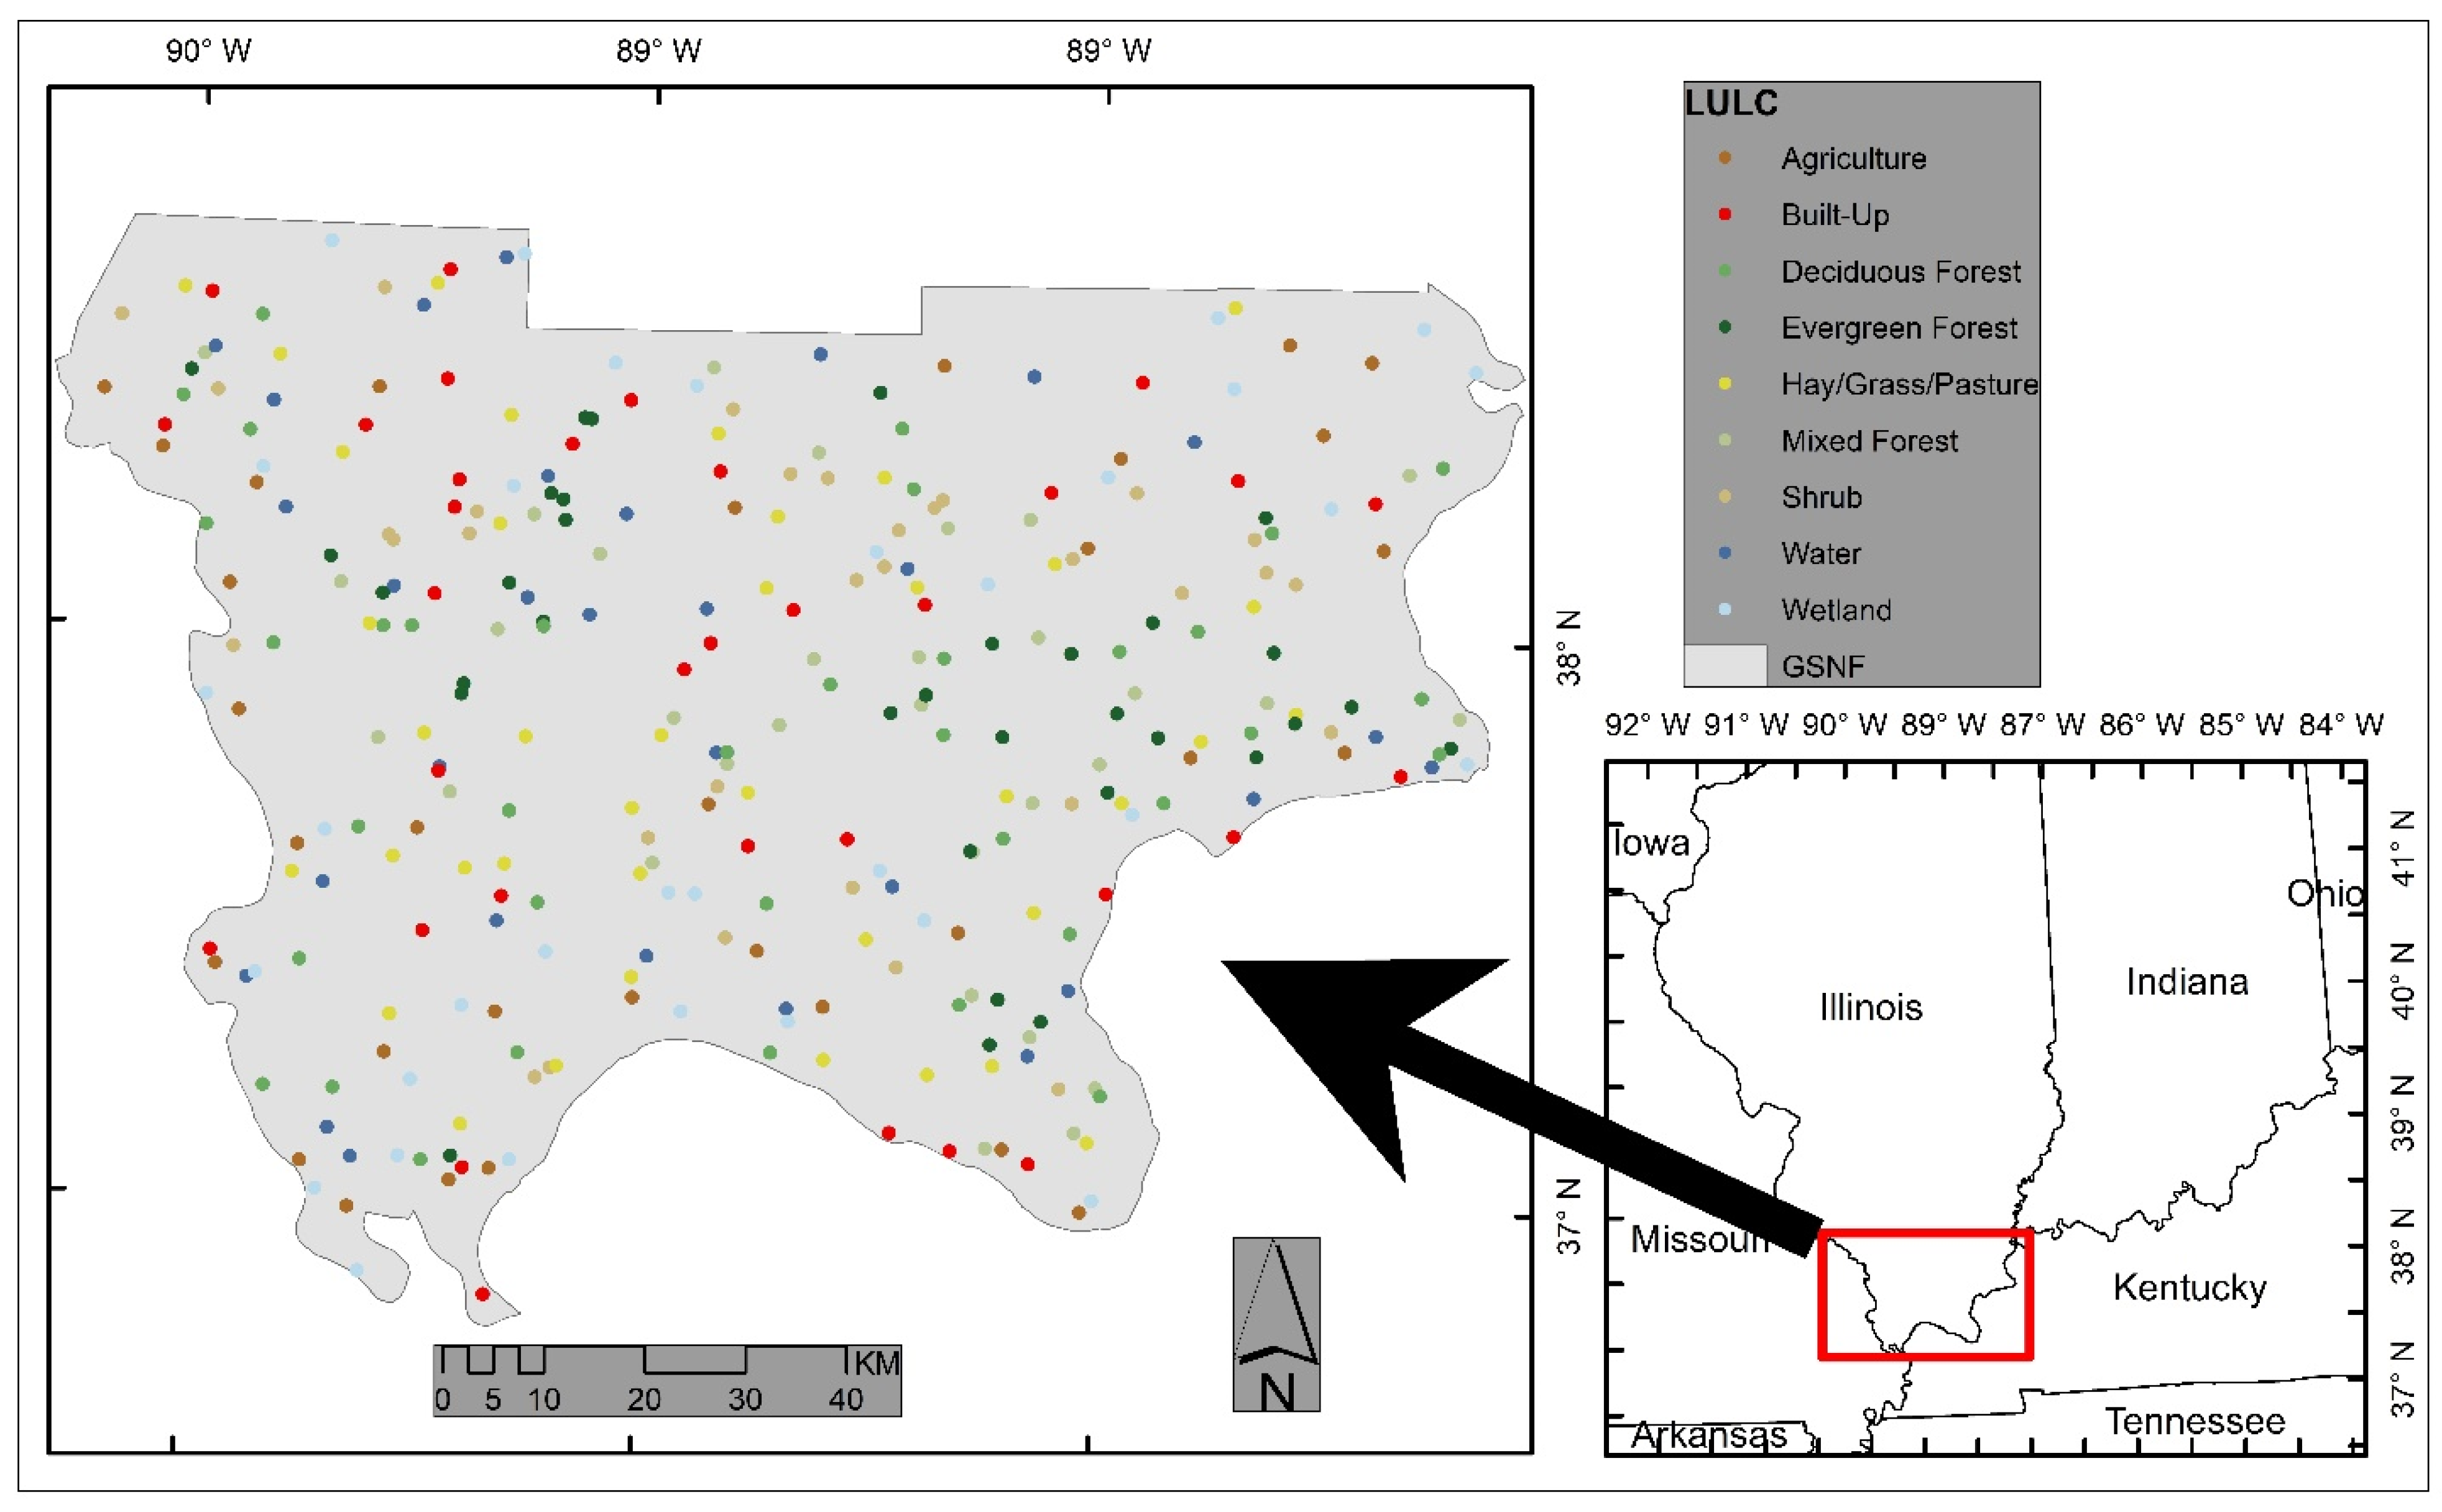
Accurate LULC classification requires reliable ground truth data, ideally collected independently in the field or from reliable sources [18]. For this study, training data were drawn from Google Earth’s historical imagery (1990, 2001) and USDA aerial imagery (2010, 2019; 1 m resolution) obtained from the USDA repository. In addition, 300 random field locations (Appendix A: Figure A1) were surveyed across the study area during the summers of 2019 and 2020, with at least 30 sites per LULC class using a GARMIN GPSMAP 64s to ensure equal representation. The classification included nine categories (Appendix B: Table A1)—agriculture, built-up, deciduous forest, evergreen forest, mixed forest, hay/grass/pasture, shrub/scattered trees, water, and wetland—based on a system developed by Anderson [51], Levels I and II, adapted for medium-resolution satellite data such as Landsat.
2.3. LULC Classification and Prediction
The random forest (RF) algorithm is a widely used and robust supervised machine learning technique for LULC classification and regression, operating on ensembles of decision trees [52,53]. It employs bootstrap aggregation (bagging) to generate multiple decision trees from resampled training data, while out-of-bag (OOB) samples are used to validate model performance [54]. Each tree contributes an independent classification, and final predictions are derived from majority voting across all trees, which reduces variance and increases predictive accuracy [55,56].
RF model construction begins with the selection of predictor variables and splitting criteria, commonly based on the Gini Impurity Index to assess attribute purity [54]. Key tuning parameters include the number of trees (ntree), number of variables sampled at each split (mtry), sample size, minimum node size (nodesize), and maximum number of terminal nodes (maxnodes). Typically, about 64–80% of training samples are used per bootstrap iteration to balance accuracy and avoid overfitting. Default values in R often set ntree to 501, with error convergence assessed using OOB plots [57]. To optimize performance, the tuneRF function in R can be used, which iteratively adjusts parameter values until an optimal model configuration is reached. This study employed all Landsat spectral bands along with derived indices (NDVI, SAVI, MSI; Table 2) as predictor variables for LULC classification in the GSNF. Eighty percent of the training data was used for model development, with the remaining twenty percent reserved for validation.
Table 2.
Predictor variables used in LULC classification in the RF model.
Classification accuracy was evaluated using a stratified area-adjusted framework, following the good-practice recommendations of Olofsson, et al. [58]. An independent set of 360 validation points was collected using an equalized stratified sampling design, with strata defined by map classes to ensure all land cover classes were represented in the accuracy assessment. Reference labels were derived from visual interpretation of Google Earth imagery for the respective years, providing higher spatial resolution than the Landsat-based classified land cover map. Validation samples were collected independently of the training data and were not used in classifier calibration, allowing the accuracy assessment principles to avoid optimistic bias and permit unbiased accuracy estimation [58]. Map accuracy was evaluated using an area-weighted error matrix, from which overall accuracy (OA), user’s accuracy (UA), and producer’s accuracy (PA) were acquired, allowing the reporting of 95% confidence interval. User’s accuracy represents the probability that a pixel mapped as a given class corresponds to that class on the ground, while producer’s accuracy represents the probability that a reference class was correctly mapped. The overall workflow and classification variables are summarized in Figure 3.
Figure 3.
Stepwise workflow of LULC classification and prediction using RF and LCM model.
LULC prediction was conducted using the Land Change Modeler (LCM) in TerrSet Geospatial Monitoring and Modeling System [59], which integrates a Markov Chain Model (MCM) with a multilayer perceptron neural network (MLP-NN) to estimate transition potentials among LULC classes [5,59]. The LCM framework involves four steps: (1) change analysis, (2) transition potential estimation, (3) prediction, and (4) validation.
The MLP-NN is a feed-forward network with input, hidden, and output layers that employs a back-propagation algorithm to capture nonlinear relationships between explanatory and response variables [24]. Compared to logistic regression, it provides greater flexibility in modeling complex spatial transitions. Explanatory variables included population density [60], Euclidean distance from roads and streams (US Census Bureau), slope and elevation (DEM), and SSP-RCP-based precipitation and temperature projections for 2050 (CanESM, downscaled using quantile mapping).
Markov chain analysis was used to model transition probabilities, where the probability of a state at time t + 1 depends on the state at t [24,61]. Transition potentials derived from 1990 to 2010 were first used to predict 2019 and then extended to 2050. Model performance was validated by comparing the 2019 prediction with the observed 2019 LULC, using 198 randomly generated accuracy points, and reporting overall accuracy (OA), producer’s (PA), and user’s (UA) accuracies with 95% CI using the area-weighted accuracy assessment method. The mathematical formulation of the Markov process is:
where is the status of the event at time t, and is the status of the event in time t + 1, is the probability of an event changing from one event to another in time t + n. Equations (1) and (2) develop a transition probability map that depicts the probability of each LULC type at a given pixel after a given number of times. The Markov approach assumes stationary transition probabilities, meaning that future land-change behavior follows the same probabilistic structure as in the calibration interval. This assumption may be violated under rapid climate, economic, or policy shifts, and therefore long-term projections should be interpreted as conditional scenarios rather than deterministic forecasts [62].
2.4. LULC Intensity
Intensity analysis was applied to quantify the rate and stability of LULC changes across multiple time intervals, providing a measure of how rapidly or slowly LULC transitions occurred [63,64,65]. The intensity of LULC can be quantified using the equations below (Equations (3)–(10)), which require at least three distinct time intervals to assess temporal dynamics and the rate of change. In the equations, St (Equation (3)) indicates LULC intensity and U (Equation (4)) indicates uniform intensity; if St is greater than U, the LULC change is fast; otherwise, it is slow, and if St is evenly distributed over a whole-time interval, the change indicates a stable change [63,64,65]. The variables i and j indicate the numbers of LULC categories, while Ctij indicates the area transferred from category i to j at time t, and YT indicates the number of time intervals.
Category-level intensity helps to examine the LULC change in a specific land category over a given period and can be quantified using the equation below [63,64,65]. Gtj (Equation (5)) is annual gain intensity, and Lti (Equation (6)) is annual loss intensity.
Similarly, the transition level of a particular land category can be quantified using the equation below [63]. Rtin (Equation (7)) is a transition intensity from category i to n for a specific time t, Wtn (Equation (8)) is the average transition during time interval t when land category n is increasing over time, Qtmj (Equation (9)) is the transition intensity from category m to category j in a particular time interval, and Vtm (Equation (10)) is the average transition intensity during a given time interval when land category m is decreasing over time t.
2.5. Statistical Analysis
Historical records of forest cover, agricultural LULC, population, and median household income from 1800 to 2019 were compiled from archival sources (Table 1), the US Census Bureau demographic data, and economic surveys. Variables were standardized (e.g., expressed as percentages of total land area) and analyzed across two periods: 1800–2001, representing the pre-intensive conservation, and 2001–2019, corresponding to the phase of management intensification. This segmentation was employed to capture potential shifts in LULC and socio-economic trajectories, consistent with period-based approaches in forest transition research [36,66].
Ordinary least squares (OLS) linear regression was applied to each variable independently, with time as the predictor. Period-specific slopes were estimated and tested for significance at an α level of 0.05. Slope direction and magnitude were interpreted within the FTT, with agricultural decline and population stabilization expected to coincide with forest recovery. Possible external drivers, such as climate change, were considered qualitatively when evidence was available [66]. All analyses were carried out in R using the lm () function [57].
3. Results
3.1. Accuracy Assessment and LULC Change
The classification accuracy increased substantially after 1990 and remained consistently high in subsequent years (Table 3). The 1990 LULC exhibited the lowest classification reliability (OA = 0.90; 95% CI: 0.88–0.92), whereas the 2001 classification ranged from 0.95 to 0.96. The 2010 classification achieved the highest overall accuracy (OA = 0.96; 95% CI: 0.95–0.98). Throughout all years, the water class exhibited the highest reliability, with user’s and producer’s accuracies consistently ranging from 0.97 to 0.99 and 0.94 to 0.98, respectively. Deciduous forest maintained stable, high accuracies, whereas mixed and evergreen forest classes improved over time but remained less accurate, especially in 1990. The shrub class showed very low producer’s accuracy (PA ≈ 0.00–0.02), but its consistently high user’s accuracy (UA ≥ 0.82 after 2001) suggests that pixels labeled as shrub were correctly identified. However, shrub cover was present in small, spatially fragmented patches and transitional ecotones, which were often incorporated into adjacent vegetation classes.
Table 3.
Accuracy assessment of LULC classification [OA = overall accuracy, UA = user’s accuracy, PA = producer’s accuracy, U/LCL = upper/lower class limit].
The multi-temporal LULC analysis of the GSNF from 1990 to 2019 revealed varied changes across nine major classes: agriculture, built-up areas, deciduous forest, evergreen forest, mixed forest, hay/grass/pasture, water, shrub, and wetland (Figure 4). Forests remained the dominant cover, accounting for nearly 39% of the area, followed by agriculture (~28%) and hay/grass/pasture (~18%). Most classes increased modestly over three decades, with agriculture (+2.15%), built-up land (+6.70%), and mixed forest (+26.40%) showing steady gains, while hay/grass/pasture (−16.0%) and evergreen forest (−2.35%) declined. Shrubs (+41.26%) and water (+16.18%) recorded the largest proportional increases, whereas wetlands (+2.24%) and deciduous forests (+1.35%) showed only marginal growth. Spatial patterns illustrate these shifts; for example, near Marion, IL, hay/grass/pasture were replaced mainly by agriculture and built-up land between 1990 and 2001, while near Vienna, IL, agricultural land was converted to residential land after 2010 (Figure 4). The most substantial exchanges occurred between agriculture and hay/grass/pasture during 1990–2001, but after 2001, most classes stabilized, with narrower flows among categories (Figure 5). Built-up land steadily absorbed area from nearly all other classes, while deciduous forests gradually transitioned into mixed forests, indicating ongoing shifts in forest composition (Figure 4 and Figure 5; Table 4).
Figure 4.
LULC maps of GSNF from 1990 to 2019. In the center, between 1990 and 2001 ((A), upper and lower panels, respectively), indicates LULC change from hay/grass/pasture and mixed forest to built-up near the city of Marion, IL, and between 2010 and 2019 ((B), upper and lower panels, respectively) near the city of Vienna, IL, indicates hay/grass/pasture and mixed forest to deciduous forest.
Figure 5.
Sankey diagram showing LULC persistence and conversion between study years. In the figure, AG, BU, DF, H/G/P, SB, MF, WT, EF, and WR represent agriculture, built-up, deciduous forest, hay/grass/pasture, shrubs, mixed forest, wetland, evergreen forest, and water, respectively.
Table 4.
Percent cover LULC of the GSNF by year and the change between different years.
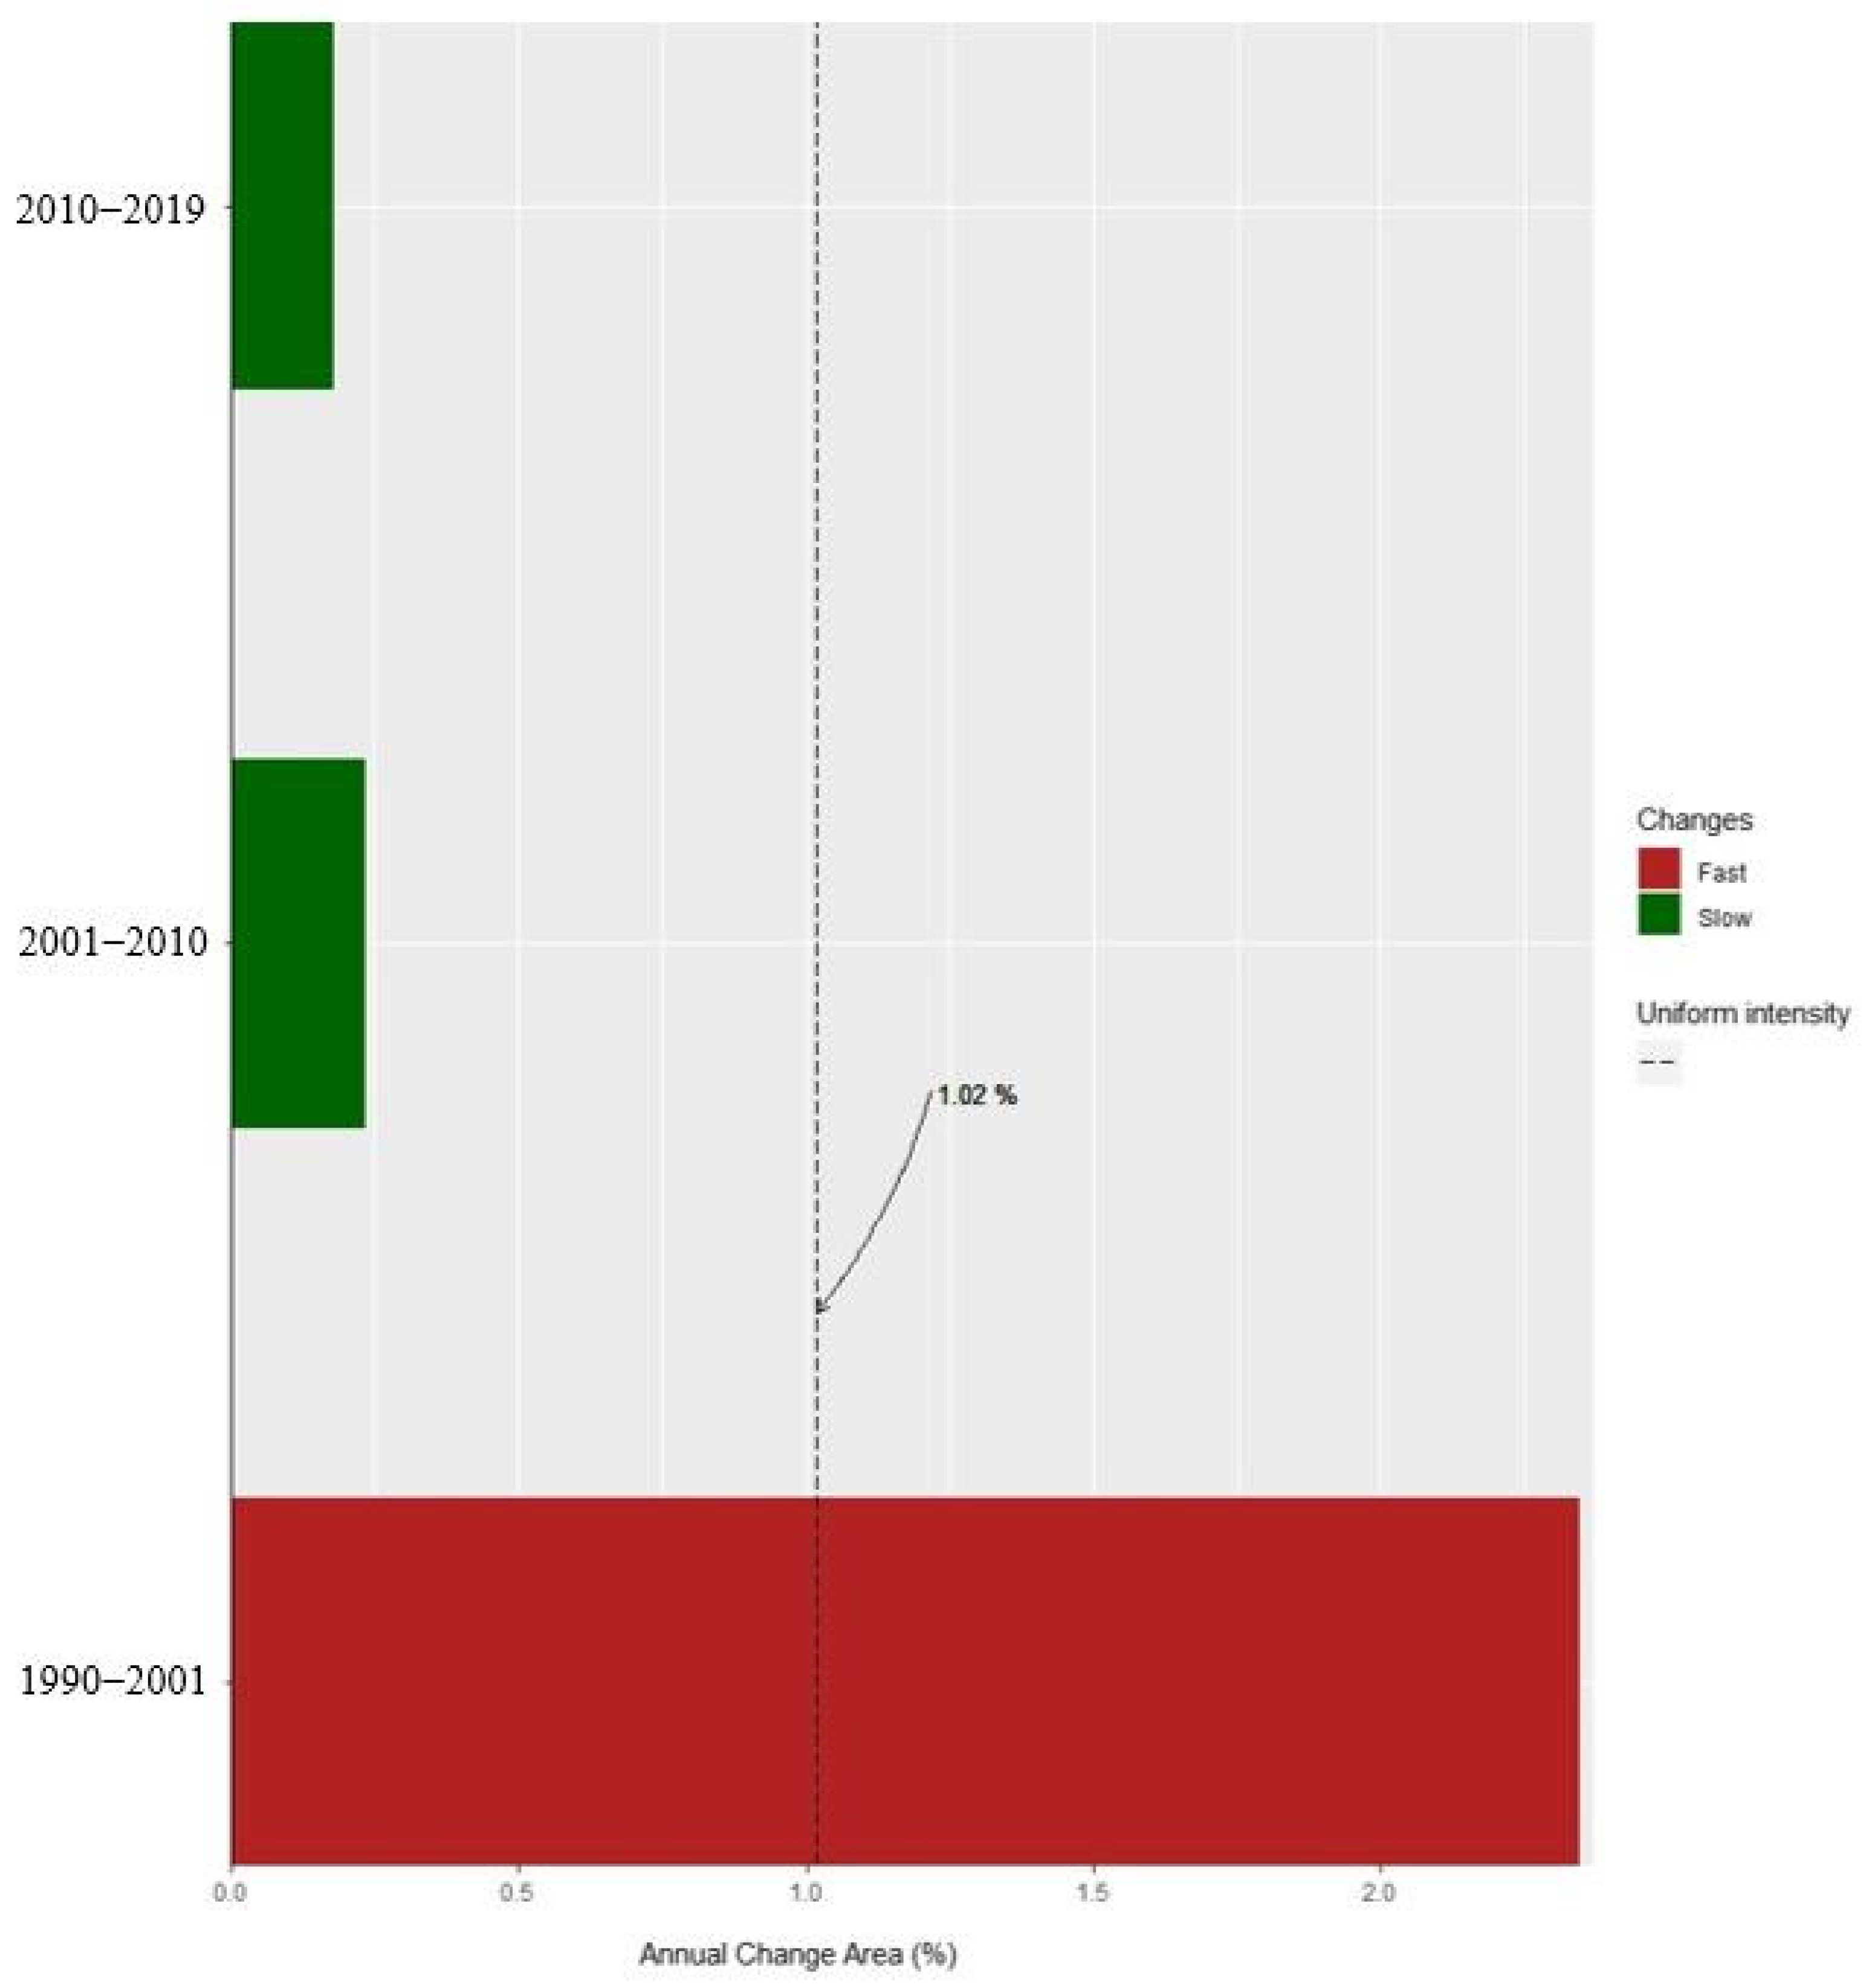
The LULC intensity was higher between 1990 and 2001, when the annual rate reached 2.35%. However, it slowed considerably in the subsequent decades, with rates of 0.23% from 2001 to 2010 and 0.18% from 2010 to 2019 (Appendix C: Figure A2). This temporal trend in intensity aligns closely with the Sankey diagrams (Figure 5): the broad flows during 1990–2001 reflect dynamic exchanges, especially between agriculture and hay/grass/pasture, whereas the narrower flows after 2001 are consistent with lower intensity rates and greater class stability. Category-level analysis confirmed that water, shrubs, and hay/grass/pasture were the most dynamic classes, while agriculture, built-up areas, and forests were relatively stable. Both the intensity metrics and the Sankey diagrams underscore that built-up expansion was cumulative and irreversible, drawing from agriculture, hay/grass/pasture, and shrub, while wetlands and water contributed smaller but consistent flows to agriculture and built-up areas (Figure 4 and Figure 5; Table 4).
3.2. LULC Transition and Prediction
The transition potential between LULC classes varied considerably. The lowest accuracy was observed in the transition from agriculture to hay/grass/pasture (61.88%, skill measure = 0.39), while the highest occurred in the transition from deciduous forest to evergreen or mixed forest (88.76%, skill measure = 0.76). Across scenarios, the overall transition potential accuracy ranged from 77.99% to 84.67%, with corresponding skill measures of 0.59, 0.55, 0.63, 0.65, and 0.69 for SSP-RCP 1 through SSP-RCP 5, respectively. Among these, SSP-RCP 2 produced the lowest predictive accuracy, while SSP-RCP 4 yielded the highest. Similarly, the overall accuracy (OA) of the LCM prediction model ranged from 71% to 83% across the evaluated scenarios (Appendix D: Table A2). The lowest accuracy was observed for SSP-RCP 2 (OA = 0.71; 95% CI: 0.64–0.78), while the highest accuracy occurred under SSP-RCP 1 (OA = 0.83; 95% CI: 0.77–0.88). The remaining scenarios showed intermediate performance: SSP-RCP 3 (0.77; 0.70–0.83), SSP-RCP 4 (0.76; 0.70–0.83), and SSP-RCP 5 (0.74; 0.68–0.80). Projection accuracy is therefore expressed as probabilistic agreement rather than deterministic correctness, consistent with recommended uncertainty reporting in LULC modeling.
Predicted LULC changes between 2019 and 2050 also differed among scenarios (Table 5). Built-up areas, water bodies, and hay/grass/pasture showed consistent increases across all SSP-RCPs. Agriculture increased only under SSP-RCP 5, whereas all other scenarios projected a decline, with SSP-RCP 3 showing the greatest reduction. Wetlands fluctuated depending on the scenario, but were projected to increase under SSP-RCP 2. Forest cover (deciduous, evergreen, and mixed) decreased in all scenarios. Notably, mixed forests expanded in SSP-RCP 2, SSP-RCP 4, and SSP-RCP 5, suggesting that native oak–hickory and other deciduous forests may decline, giving way to evergreen and mixed forests. Such a shift would have important implications for ecosystem composition and functioning, as deciduous forests have long defined the region’s ecological character. Spatial projections indicate that deciduous forests are most likely to be replaced by mixed forests moving west to east through the central GSNF (Figure 6). Variability in wetland cover was concentrated in the Cache River watershed and along the Mississippi River, underscoring the spatial heterogeneity of future LULC transitions in the region.
Table 5.
Predicted LULC change (%) between 2019 and 2050 based on SSP-RCP temperature and precipitation scenarios.
Figure 6.
LULC maps of GSNF 2050. In all SSP-RCP scenarios, the black rectangle shows the area of LULC conversion from deciduous forest to mixed forest.
3.3. Testing Forest Transition Theory in the GSNF
There were distinct phases of LULC transition, particularly forest and agriculture, in the GSNF that align with FTT (Figure 7). Between 1800 and 2001, forest cover declined sharply (slope −0.23) while agricultural land increased (slope +0.12), reflecting the early development phase marked by rapid deforestation and limited government oversight. During the same period, the population grew (slope +0.09) and household income rose modestly (slope +0.11), highlighting the pressure of demographic and economic drivers on land resources. After 2001, however, the trends shifted: forest cover stabilized and showed slight recovery (slope +0.03), agriculture leveled off (slope +0.02), and population began to decline (slope −0.06), while household income increased significantly (slope +0.94). These shifts indicate a transition from rapid to slower LULC change, supported by federal and state conservation policies, rural depopulation, and broader economic diversification. Figure 7 also quantitatively satisfies the FTT economic development pathway because forest increase occurs simultaneously with population decline and income growth, rather than forest recovery alone, which is the diagnostic characteristics of a true transition rather than simple afforestation. GSNF is currently within the forest transition window, where ecological recovery and forest replenishment are emerging alongside reduced dependence on direct land exploitation.
Figure 7.
Graph depicting trends of agriculture, forest cover, median household income, and population of the GSNF. AG, FC, and Pop indicate agricultural land, forest cover, and population of the GSNF, respectively.
4. Discussion
4.1. Accuracy Assessment
Classification accuracy assessment, uncertainty analysis, or both are conducted during land cover classification. Users may be interested in the classification accuracy or the uncertainty of the classification results [67]. Classification accuracy and uncertainty are two different concepts: classification accuracy measures how closely a thematic map aligns with a reference, while uncertainty quantifies the variability of these measures across all potential parameters [67,68]. The uncertainty may arise from various sources, including the resolution and quality of remote sensing data, training/validation data, classification algorithms, and the methodologies, making it challenging to achieve a definitive assessment [68,69]. Therefore, accuracy assessments are often deemed sufficient to gain practical and actionable insights from the LULC classification [67]. Usually, studies use a training dataset to assess classification accuracy, while researchers have warned against using the same data for both training and validation to avoid uncertainty and overestimating accuracy [67,69]. Therefore, in this study, 80% of the ground truth data were used for training models, and 20% of the ground truth data were used for validation to avoid inaccuracy and uncertainty. However, additional independent validation samples were used to assess classification accuracy, thereby avoiding optimistic bias, and reporting OA and class-specific UA and PA to avoid misleading interpretations [70]. The overall accuracy of the land cover ranged between 0.90 and 0.95 (95% CI). The accuracy assessment statistics (OA, UA, and PA) indicated substantial overall agreement. Despite the accuracy assessment indicating high classification accuracy, changes observed between 1990 and 2019 in some classes were minimal (<3%), potentially within the margin of error. This observation aligns with Varanka and Shaver [71], who reported similar findings for the Interior Lowland Ecoregion, which includes the GSNF area, between 1973 and 2000, suggesting that these minor changes accurately reflect real change. Furthermore, the trend in LULC change, especially in forests, corroborates the forest change trends documented in the annual USFS reports, affirming the validity of this study’s findings. Consistency with prior research reinforces the reliability of the findings, but careful interpretation is necessary, acknowledging the potential for inaccuracy and uncertainty. The RF algorithm and LCM model optimize parameters using training data to reduce inaccuracy and uncertainty, improving predictions [67,69]. However, it is important to remember that no model is perfect and free of inaccuracy and uncertainty. The LULC prediction serves as a guiding tool that can be supplemented by an in-depth understanding of the local context and variations in LULC change patterns.
4.2. LULC Change
Visual inspection of the LULC in the early 1800s (Figure 2) and contemporary LULC (Figure 4) reveals a significant alteration in LULC over the last two centuries. The LULC changed variably among LULC classes throughout GSNF between 1990 and 2019, but remained relatively stable after 2001. The relatively stable LULC in the GSNF and elsewhere in the US can be attributed to the maturity of the US land-use system during the past several decades [42]. Major LULC classes, such as forest and agriculture, became stable throughout the US [42,72]. The slowing LULC intensity change can be attributed to technological advances, less land for available conversion, and the success of various governmental and non-governmental programs. Several acts, plans, and policies implemented in Illinois, such as the Natural Areas Preservation Act, sustainable agriculture partnership, conservation reserve program, tax incentives, recreational access program, cost-sharing easements, nutrient loss reduction strategy, and certification programs led to a deceleration in the conversion of LULC. These policies are crucial to slow down LULC conversion, especially in GSNF, where most land is privately owned. However, specific policies or plans that significantly influence the slowdown of LULC conservation have yet to be investigated.
Most of the forest was converted to agriculture or built-up land between 1990 and 2019. The highest positive change was seen in shrub and mixed forests. The shrub change was higher in percentage because it constitutes the smallest portion among the LULC, so a slight change in area will be reflected in an overall increase or decrease in the area. There was an overall increase in forest in the GSNF, consistent with the findings of the Illinois Forest Action Plan [73]. However, there was an increase in deciduous and mixed forests and a slight decrease in evergreen forests between 1990 and 2019. The increase in forest area in the GSNF can be attributed to the successful implementation of the restoration and management program and plans of the federal/state government and other stakeholder programs such as ‘Let The Sun Shine In’ [74]. Such programs implement prescribed burning, invasive species control, stand improvement, overstory tree removal, and the establishment of demonstration areas that aid forest growth. However, the increase in mixed forests may be attributed to both land abandonment and the invasion of evergreen species in areas where deciduous forest patches once existed. Historically, the Shawnee National Forest was used for agriculture, logging, and mining. The cessation of these activities allowed for natural regeneration, leading to the re-establishment of forests, particularly mixed hardwoods and oak–hickory forests.
Additionally, the increase in mixed forests may also be partly linked to climate change, specifically changes in temperature and precipitation, and selective forest harvesting practices that facilitate the expansion of evergreen forests [73]. Invasive pines that were once planted may expand across the landscape, causing some deciduous forest areas to turn into mixed forests. The disturbance activities, such as harvesting and burning, primarily help oak–hickory forests and create an environment for evergreen forests, such as shortleaf pine, to encroach into the surrounding area. However, native shortleaf pine was initially restricted to a very small area in the southeast region of the La Rue Pine Hills, but there are plantations of this species across the GSNF. The decrease in evergreen stands in southern Illinois, particularly pine species, is due to the wilt disease caused by different beetles. As a result, many commercial pine plantations may have been eliminated [73].
Similarly, large areas of mature evergreen forest are currently undergoing thinning and reforestation into hardwood forests, leading to increased mixed and deciduous forests [73]. The forest area throughout the US has experienced minor variations since the 1920s; notably, the overall forest area in Illinois has gradually increased [72,73]. The increase in forest area may also be attributed to agricultural abandonment due to low agricultural prices during the 1990s, leading to a low agricultural return compared to returns from other LULCs such as forestry and urban development [4].
In Illinois, agriculture has changed from small, diverse farms run by hand labor and draft animals to massive industrial farms since the mid-20th century, intensifying forest conversion to agriculture [75]. However, agricultural land conversion dropped significantly after the 1920s [75,76]. Although land conversion decreased substantially after the 1920s, the agricultural land in GSNF increased by 2.15% in three decades despite the development of hybrid crops and chemical fertilizers. Despite the increase in agricultural land, the population of GSNF decreased by 7.76% between 1990 and 2020. Similarly, the number of farms declined by 12.19% between 1992 and 2002, 8.22% between 2002 and 2020, and 19.41% between 1992 and 2020 (https://www.nass.usda.gov/). The decline in population and number of farms, but an increase in agricultural land, might indicate that the farmers that persist are facing agricultural productivity decline due to climate change, forcing them to expand their agricultural lands from other LULC types. Additionally, the increase in farm size could suggest that advances in technology have made it easier to manage larger acreages compared to the past, allowing farmers to be more financially sustainable.
LULC classes such as water consistently increased from 1990, except between 2010 and 2019, whereas wetlands increased between 2001 and 2010. The constant fluctuation of water and wetlands might be attributed to Illinois’s climate pattern. Wetlands and water fluctuate near rivers and streams as more frequent and severe floods have occurred in the recent history of southern Illinois. The 1993, 2011, and 2016 floods caused massive destruction of crops, soils, roads, and residences. These floods primarily impacted counties bordering the Mississippi and Ohio rivers, bringing water further inland and creating temporary water lakes, ponds, and wetlands [77].
4.3. LULC Prediction
The FTT framework showed that LULC change is slowing down with a recent recovery in forest cover. However, the slow LULC transition, particularly forest recovery or agricultural LULC change, may be halted and move in a different direction during the transition window. While inducing SSP-RCP-based temperature and precipitation in the LULC model, the result indicated that forest cover decreases, and built-up area increases in all scenarios. Agricultural land also increases in all scenarios except the business-as-usual scenario (SSP-RCP 5). Therefore, special precautionary steps should be taken while managing the LULC of the GSNF for future conservation and continued forest recovery.
In the GSNF, the built-up area increased from 1990 to 2019, and in all SSP-RCP scenarios, but the growth is at a high differential rate. The GSNF is relatively rural, but the urban area is increasing, particularly in Williamson and Jackson Counties around Marion and Carbondale, respectively [78]. The urban area also grew in all climate scenarios throughout the US, particularly in the Atlantic seaboard in the northeast, the lower peninsula of Michigan, and different urban centers of Illinois [79,80].
The variation in LULC exhibited different characteristics in different SSP-RCP scenarios. All the scenarios showed increased hay/grass/pasture throughout the GSNF. The seasonal variation in temperature and precipitation will alter soil water availability to grassland vegetation, but native grassland vegetation that has adapted to these variations will likely fare better in a changing climate [81]. A disturbance in the balance of temperature and precipitation, i.e., climate change, may reduce the height of native prairie grasses such as big bluestem (Andropogon gerardi) up to 60% in the next 75 years and favor invasion by exotic plants such as cheatgrass (Bromus tectorum) [82,83]. The increase in hay/grass/pasture may be due to the reclamation of fallow fields, road/railroad rights-of-way, and other surface mining areas. However, their reclamations are likely tall fescue (Schedonorus arundinaceus) pasture and broom sedge (Andropogon virginicus)-dominated old fields rather than native bluestem grassland.
All the scenarios except SSP-RCP 5 (business-as-usual) showed a decrease in agriculture. Similar results were obtained by Gurgel, et al. [84], where the authors showed that grassland will increase in all SSP-RCP scenarios and agriculture will decrease in all scenarios except SSP-RCP 5. Wear [80] also suggested that the cropland loss will stretch from southern Michigan to the lower Mississippi valley, encompassing a considerable portion of western Kentucky, Indiana, and Ohio. The decrease in agriculture and increase in hay/grass/pasture might also be related to crop yield and production costs. The per-acre production cost of agriculture (approximately $400) is higher than that of hay/grass/pasture (approximately $300), and farmers can obtain up to three years of hay with a single seeding, accompanied by light maintenance costs. Since some hay/grass/pasture species are favored due to climate disturbances, farmers might move towards growing hay/grass/pasture rather than row crop agriculture.
The SSP-RCP LULC scenario showed that the water would increase in every scenario, but the wetland area varied. The wetlands could increase by 9% (SSP-RCP 2) or decrease by 31% (SSP-RCP 3), depending on the scenario from the 2019 baseline. In the future, higher temperatures and varied precipitation, particularly during summer, would encourage floods that might lead to increased water and abrupt drought, negatively impacting existing wetlands and causing the decline of wetlands [12]. Wetland extent showed a modest increase under environmentally friendly emission scenarios, but declines in others [79]. The loss of wetlands can amplify regional flood risk, release stored carbon, and reduce biodiversity support, nutrient retention, and water purification capacity, further diminishing ecosystem service resilience under climate stress [85].
The overall forest cover of GSNF will decrease in all scenarios, but the mixed forest would benefit from SSP-RCP 2, 4, and 5. Wear [80] also found that overall forest cover in the US will decrease in all climate change scenarios. The southern region will experience more forest cover loss than the northern region, the Rockies, and the Pacific. Forest cover is expected to decline due to the conversion of forested land to urban and agricultural LULC in changing climates [79]. The pure deciduous forest will be encroached upon by other evergreen species, where there were small patches of evergreen species in a baseline scenario of 2019. Several studies suggest that evergreen species, such as spruce, would withstand climate change better than deciduous species, like birch and oak [76,86]. With a warming climate and variable precipitation, early greening occurs (leaf on) that forces deciduous forest species to decrease water use efficiency, benefiting evergreen species and shrubs, particularly in temperate latitudes [86,87]. Reich, et al. [88] suggest that southern boreal forests may be approaching an unsettling “tipping point” where boreal forests may turn into a novel mixture of vegetation, such as shrubs and temperate tree species, that are a less robust ecological system. Similarly, Dial, Maher, Hewitt and Sullivan [87] found that conifer species expand further beyond their tree lines than they did during the last glacial maximum.
4.4. Forest Transition Theory Framework
Overlaying the timeline curves representing forest cover, agriculture, population, and median household income over time, along with their slopes from the 1800s to 2001 and from 2001 to 2019, shows that the forest recovery in the GSNF aligns with the forest transition framework. According to the middle-range land system theory, the FTT case requires simultaneous agricultural decoupling and socio-economic restructuring rather than forest increase alone [29]. The concurrent decline in population, stabilization of agriculture, and income growth, therefore, represent mechanistic evidence rather than simple correlation. This phenomenon corresponds to the theory of agricultural decoupling, where labor exits farming while production consolidates spatially, allowing marginal lands to revert to forest [89]. The overall forest cover in the GSNF has been slowly but consistently increasing for over three decades, while agricultural land has also expanded, albeit at a much slower rate since 2001. Concurrently, the median household income has risen, and the population in the GSNF has declined, paving the way for forest recovery and a decrease in agricultural land. Rural depopulation and the subsequent abandonment of pastures and grasslands have favored shrub encroachment and forest regeneration, playing a substantial role in forest recovery in temperate regions [90]. Foundational drivers of forest and agricultural changes include economic shifts, demographics, technological advancements, and various policy and institutional governance mechanisms [38,91]. The forest cover transitioned from a net loss to a net gain and recovery at the turn of the twenty-first century [73]. Trends since the late 1970s, such as a gradual decrease in cropland and forestland, grazed areas, and an increase in pasture areas and total forestland in the US, correlate with the findings of this study [42,84,92]. Similarly, the impact of per capita income growth on forest cover is more pronounced during the early phases of economic development and diminishes as economies mature [93]. In cases like the GSNF, where forest recovery is ongoing, the economy, population dynamics, and policies play a facilitative role by curbing agricultural land changes and promoting nature conservation.
The stabilization and modest recovery of forest cover in the GSNF occurred alongside agricultural leveling, population decline, and rising household income. This pattern aligns with the economic development pathway of FTT, where socio-economic restructuring mediates LULC reconfiguration under environmental pressure [34,35,94]. Comparable forest transitions have been reported in parts of Europe as well as Costa Rica, Vietnam, China, Chile, El Salvador, Bhutan, China, and India, where forest recovery followed agricultural restructuring and economic development, demonstrating that the GSNF trajectory reflects a globally recognized forest transition pathway [34,38,66,94]. The resilience and ecological quality of forest transitions depend critically on governance capacity, institutional arrangement, and landowner decision-making under climate stress, directly linking demographic restructuring to adaptive capacity [35]. Sustaining ecosystems under climate change requires coordinated action across ecological processes, socio-economic structures, and policy mechanisms rather than reliance on biophysical recovery alone [95]. The socio-economic trends observed in the GSNF function as enabling conditions for climate adaptation and the persistence of ecosystem services, reinforcing the view that forest transitions are socio-economic and ecological transformations.
The forest transition framework evaluated in the study allows a fundamental understanding of the factors that influence the spatial and temporal change in LULC, particularly forest loss and recovery. Although the framework captures the general trend of loss and recovery, it cannot address the issues of forest quality and ecosystem integrity. Forest loss and recovery have gone beyond direct human interventions in recent years. For example, natural regeneration and biophysical factors such as climate change, nitrogen deposition, and carbon dioxide fertilization significantly influence the transition process. Therefore, more complex frameworks considering human interventions and climate change should be considered while expanding the existing framework.
5. Conclusions
This remote sensing study conducted LULC classification using a random forest algorithm and predicted LULC based on the SSP-RCP scenario using LCM. The classification results revealed that agriculture, forest, built-up, and water coverage were projected to increase, but hay/grass/pasture would decrease consistently. The study also demonstrated that the LULC change in the GSNF aligns with the FTT framework, where forest recovery is concurrent with slow agricultural land expansion, population decline, and economic growth. Rather than documenting forest increase alone, the study identifies the economic development pathway of FTT through coupled demographic decline and income growth, providing a rare local-scale empirical test in a developed rural landscape. The framework underscores the importance of economic shifts, policy measures, and demographic changes in influencing LULC dynamics. The SSP-RCP-based LCM simulation projections show that the forest was substantially reduced in all scenarios, but other LULC classes showed variation from scenario to scenario. How land is utilized for forests, agriculture, and wetlands is essential for achieving climate mitigation goals, and this study provided a deeper understanding of past LULC and its spatiotemporal dynamics. This more localized (context-specific) LULC product will play an essential role in studying the regional roles of climate change. It suggests a path forward for adopting and planning for LULC management to cope with the impact of climate change on the GSNF. Historically, the GSNF has faced significant LULC change since European settlement, but it has become more stable with declining intensity in the last 30 years. Declining population and farm numbers suggest that LULC change stability is somewhat related to this at present; however, when SSP-RCP-based temperature and precipitation are introduced into the prediction model, the change exceeds that observed between 1990 and 2019. The increased projected change shows that climate change will have more influence on LULC change, particularly in the forest, wetland, and hay/grass/pasture LULC, than current drivers.
Author Contributions
Conceptualization, S.T., D.J.G. and R.L.; methodology, S.T.; software, S.T.; validation, S.T.; formal analysis, S.T.; investigation, S.T.; resources, S.T.; data curation, S.T.; writing—original draft, S.T., D.J.G. and R.L.; writing—review and editing, S.T., D.J.G. and R.L.; visualization, S.T.; supervision, D.J.G. and R.L.; project administration, S.T. All authors have read and agreed to the published version of the manuscript.
Funding
This research is supported by a graduate research assistantship from the Environmental Resources and Policy Program at Southern Illinois University Carbondale and is partially supported by the Southern Illinois Plants of Concern Program.
Data Availability Statement
Publicly available datasets were used in this study. These data can be accessed at: https://earthexplorer.usgs.gov/ (accessed on 19 March 2019), https://data.census.gov/ (accessed on 3 December 2020), and https://clearinghouse.isgs.illinois.edu/ (accessed on 5 February 2020). The data processing and analysis codes supporting the conclusions of this article will be made available by the authors upon request.
Acknowledgments
S.T. thanks the SIUC Environmental Resources and Policy program and the Plants of Concern Program for financial support. S.T. is grateful to D.J.G. and R.L. for their continued support throughout graduate school and beyond.
Conflicts of Interest
The authors declare no conflicts of interest.
Appendix A
Figure A1.
Locations visited during the summers of 2019 and 2020 to train and validate random forest model for LULC classification.
Appendix B
Table A1.
LULC classification and its definitions based on the system developed by Anderson in 1976.
Appendix C
Figure A2.
Interval intensity of LULC between 1990 and 2019. The dashed line shows the average change intensity that partitions intensity into slow or fast LULC conversion.
Appendix D
Table A2.
Accuracy assessment of predicted LULC classification by scenario [OA = overall accuracy, UA = user’s accuracy, PA = producer’s accuracy, U/LCL = upper/lower class limit].
References
- Foley, J.A.; DeFries, R.; Asner, G.P.; Barford, C.; Bonan, G.; Carpenter, S.R.; Chapin, F.S.; Coe, M.T.; Daily, G.C.; Gibbs, H.K.; et al. Global consequences of land use. Science 2005, 309, 570–574. [Google Scholar] [CrossRef] [Scilit]
- Krause, A.; Haverd, V.; Poulter, B.; Anthoni, P.; Quesada, B.; Rammig, A.; Arneth, A. Multimodel Analysis of Future Land Use and Climate Change Impacts on Ecosystem Functioning. Earth’s Future 2019, 7, 833–851. [Google Scholar] [CrossRef] [Scilit]
- Lambin, E.F.; Geist, H.J.; Lepers, E. Dynamics of land-use and land-cover change in tropical regions. Annu. Rev. Environ. Resour. 2003, 28, 205–241. [Google Scholar] [CrossRef] [Scilit]
- Lawler, J.J.; Lewis, D.J.; Nelson, E.; Plantinga, A.J.; Polasky, S.; Withey, J.C.; Helmers, D.P.; Martinuzzi, S.; Pennington, D.; Radeloff, V.C. Projected land-use change impacts on ecosystem services in the United States. Proc. Natl. Acad. Sci. USA 2014, 111, 7492–7497. [Google Scholar] [CrossRef] [Scilit] [PubMed]
- Leta, M.K.; Demissie, T.A.; Tränckner, J. Modeling and prediction of land use land cover change dynamics based on land change modeler (LCM) in nashe watershed, upper blue nile basin, Ethiopia. Sustainability 2021, 13, 3740. [Google Scholar] [CrossRef] [Scilit]
- Mir, Y.H.; Mir, S.; Ganie, M.A.; Bhat, J.A.; Shah, A.M.; Mushtaq, M.; Irshad, I. Overview of land use and land cover change and its impacts on natural resources. In Ecologically Mediated Development: Promoting Biodiversity Conservation and Food Security; Springer: Berlin/Heidelberg, Germany, 2025; pp. 101–130. [Google Scholar] [CrossRef] [Scilit]
- Dallimer, M.; Davies, Z.G.; Diaz-Porras, D.F.; Irvine, K.N.; Maltby, L.; Warren, P.H.; Armsworth, P.R.; Gaston, K.J. Historical influences on the current provision of multiple ecosystem services. Glob. Environ. Chang. 2015, 31, 307–317. [Google Scholar] [CrossRef] [Scilit]
- Nickelson, J.B.; Holzmueller, E.J.; Groninger, J.W.; Lesmeister, D.B. Previous land use and invasive species impacts on long-term afforestation success. Forests 2015, 6, 3123–3135. [Google Scholar] [CrossRef] [Scilit]
- Gurung, K.; Yang, J.; Fang, L. Assessing Ecosystem Services from the Forestry-Based Reclamation of Surface Mined Areas in the North Fork of the Kentucky River Watershed. Forests 2018, 9, 652. [Google Scholar] [CrossRef] [Scilit]
- Kubiszewski, I.; Costanza, R.; Anderson, S.; Sutton, P. The future value of ecosystem services: Global scenarios and national implications. Ecosyst. Serv. 2020, 26, 289–301. [Google Scholar] [CrossRef] [Scilit]
- Gourevitch, J.D.; Alonso-Rodríguez, A.M.; Aristizábal, N.; de Wit, L.A.; Kinnebrew, E.; Littlefield, C.E.; Moore, M.; Nicholson, C.C.; Schwartz, A.J.; Ricketts, T.H. Projected losses of ecosystem services in the US disproportionately affect non-white and lower-income populations. Nat. Commun. 2021, 12, 3511. [Google Scholar] [CrossRef] [Scilit]
- Byrd, K.; Ratliff, J.; Bliss, N.; Wein, A.; Sleeter, B.; Sohl, T.; Li, Z. Quantifying climate change mitigation potential in the United States Great Plains wetlands for three greenhouse gas emission scenarios. Mitig. Adapt. Strateg. Glob. Chang. 2015, 20, 439–465. [Google Scholar] [CrossRef] [Scilit]
- Gautam, S.; Mishra, U.; Scown, C.D.; Wills, S.A.; Adhikari, K.; Drewniak, B.A. Continental United States may lose 1.8 petagrams of soil organic carbon under climate change by 2100. Glob. Ecol. Biogeogr. 2022, 31, 1147–1160. [Google Scholar] [CrossRef] [Scilit]
- Benez-Secanho, F.J.; Dwivedi, P. Analyzing the impacts of land use policies on selected ecosystem services in the upper Chattahoochee Watershed, Georgia, United States. Environ. Res. Commun. 2021, 3, 115001. [Google Scholar] [CrossRef] [Scilit]
- Rosa, I.M.D.; Purvis, A.; Alkemade, R.; Chaplin-Kramer, R.; Ferrier, S.; Guerra, C.A.; Hurtt, G.; Kim, H.J.; Leadley, P.; Martins, I.S.; et al. Challenges in producing policy-relevant global scenarios of biodiversity and ecosystem services. Glob. Ecol. Conserv. 2020, 22, e00886. [Google Scholar] [CrossRef] [Scilit]
- Tahani Yazdli, M.; Rousta, I.; Abdolazimi, H. Analyzing the Relationship between Temporal and Spatial Changes in Daily Surface Temperature and the Spatial Pattern of Land Cover Changes in the Direction of Environmental Sustainability (Case Study: Kashan city_ Iran). Geogr. Environ. Sustain. 2023, 13, 1–20. [Google Scholar] [CrossRef]
- Pettorelli, N.; Schulte to Bühne, H.; Tulloch, A.; Dubois, G.; Macinnis-Ng, C.; Queirós, A.M.; Keith, D.A.; Wegmann, M.; Schrodt, F.; Stellmes, M.; et al. Satellite remote sensing of ecosystem functions: Opportunities, challenges and way forward. Remote Sens. Ecol. Conserv. 2018, 4, 71–93. [Google Scholar] [CrossRef] [Scilit]
- Roy, D.P.; Ju, J.; Lewis, P.; Schaaf, C.; Gao, F.; Hansen, M.; Lindquist, E. Multi-temporal MODIS–Landsat data fusion for relative radiometric normalization, gap filling, and prediction of Landsat data. Remote Sens. Environ. 2008, 112, 3112–3130. [Google Scholar] [CrossRef] [Scilit]
- Friedl, M.A.; Woodcock, C.E.; Olofsson, P.; Zhu, Z.; Loveland, T.; Stanimirova, R.; Arevalo, P.; Bullock, E.; Hu, K.-T.; Zhang, Y. Medium Spatial Resolution Mapping of Global Land Cover and Land Cover Change Across Multiple Decades From Landsat. Front. Remote Sens. 2022, 3, 894571. [Google Scholar] [CrossRef] [Scilit]
- Liu, Y.; Li, Y.; Li, S.; Motesharrei, S. Spatial and temporal patterns of global NDVI trends: Correlations with climate and human factors. Remote Sens. 2015, 7, 13233–13250. [Google Scholar] [CrossRef] [Scilit]
- Büttner, B.; Kinigadner, J.; Ji, C.; Wright, B.; Wulfhorst, G. The TUM accessibility atlas: Visualizing spatial and socioeconomic disparities in accessibility to support regional land-use and transport planning. Netw. Spat. Econ. 2018, 18, 385–414. [Google Scholar] [CrossRef] [Scilit]
- Jin, S.; Homer, C.; Yang, L.; Danielson, P.; Dewitz, J.; Li, C.; Zhu, Z.; Xian, G.; Howard, D. Overall methodology design for the United States national land cover database 2016 products. Remote Sens. 2019, 11, 2971. [Google Scholar] [CrossRef] [Scilit]
- Kafy, A.-A.; Dey, N.N.; Al Rakib, A.; Rahaman, Z.A.; Nasher, N.R.; Bhatt, A. Modeling the relationship between land use/land cover and land surface temperature in Dhaka, Bangladesh using CA-ANN algorithm. Environ. Chall. 2021, 4, 100190. [Google Scholar] [CrossRef] [Scilit]
- Azari, M.; Billa, L.; Chan, A. Multi-temporal analysis of past and future land cover change in the highly urbanized state of Selangor, Malaysia. Ecol. Process. 2022, 11, 2. [Google Scholar] [CrossRef] [Scilit]
- Khoshnood Motlagh, S.; Sadoddin, A.; Haghnegahdar, A.; Razavi, S.; Salmanmahiny, A.; Ghorbani, K. Analysis and prediction of land cover changes using the land change modeler (LCM) in a semiarid river basin, Iran. Land Degrad. Dev. 2021, 32, 3092–3105. [Google Scholar] [CrossRef] [Scilit]
- Zhu, C.; Wei, Y.; Zhu, F.; Lu, W.; Fang, Z.; Li, Z.; Pan, J. Digital Mapping of Soil Organic Carbon Based on Machine Learning and Regression Kriging. Sensors 2022, 22, 8997. [Google Scholar] [CrossRef] [Scilit]
- Akhundzadah, N.A. Investigating climate change impacts from hydroclimatic trends and land cover change in Afghanistan’s Helmand River Basin. Theor. Appl. Clim. 2026, 157, 79. [Google Scholar] [CrossRef] [Scilit]
- Verburg, P.H.; Crossman, N.; Ellis, E.C.; Heinimann, A.; Hostert, P.; Mertz, O.; Nagendra, H.; Sikor, T.; Erb, K.-H.; Golubiewski, N. Land system science and sustainable development of the earth system: A global land project perspective. Anthropocene 2015, 12, 29–41. [Google Scholar] [CrossRef] [Scilit]
- Meyfroidt, P.; Chowdhury, R.R.; de Bremond, A.; Ellis, E.C.; Erb, K.-H.; Filatova, T.; Garrett, R.; Grove, J.M.; Heinimann, A.; Kuemmerle, T. Middle-range theories of land system change. Glob. Environ. Chang. 2018, 53, 52–67. [Google Scholar] [CrossRef] [Scilit]
- Yang, S.; Cui, X. Building Regional Sustainable Development Scenarios with the SSP Framework. Sustainability 2019, 11, 5712. [Google Scholar] [CrossRef] [Scilit]
- Wang, H.; Liu, Y.; Wang, Y.; Yao, Y.; Wang, C. Land cover change in global drylands: A review. Sci. Total Environ. 2023, 863, 160943. [Google Scholar] [CrossRef] [Scilit]
- Khuc, V.Q.; Tran, B.Q.; Nong, D.; Nguyen, T.H.; Nguyen, M.-H.; Le, T.-T.; Lich, H.K.; Meyfroidt, P.; Van Pham, D.; Leisz, S.J. Driving forces of forest cover rehabilitation and implications for forest transition, environmental management and upland sustainable development in Vietnam. Environ. Dev. Sustain. 2025, 27, 6619–6639. [Google Scholar] [CrossRef] [Scilit]
- Mather, A.S. The forest transition. Area 1992, 24, 367–379. [Google Scholar] [CrossRef] [Scilit]
- MacDonald, H. Envisioning better forest transitions: A review of recent forest transition scholarship. Heliyon 2023, 9, e20429. [Google Scholar] [CrossRef] [Scilit]
- Rudel, T.K.; Meyfroidt, P.; Chazdon, R.; Bongers, F.; Sloan, S.; Grau, H.R.; Van Holt, T.; Schneider, L. Whither the forest transition? Climate change, policy responses, and redistributed forests in the twenty-first century. AMBIO 2020, 49, 74–84. [Google Scholar] [CrossRef] [Scilit]
- Tang, C.; Long, Y.; Tang, Y.; Mao, Y. Impact of economic growth and agricultural expansion on forest cover in ASEAN: New evidence for forest transition theory. For. Policy Econ. 2025, 178, 103576. [Google Scholar] [CrossRef] [Scilit]
- Rudel, T.K.; Coomes, O.T.; Moran, E.; Achard, F.; Angelsen, A.; Xu, J.; Lambin, E. Forest transitions: Towards a global understanding of land use change. Glob. Environ. Chang. 2005, 15, 23–31. [Google Scholar] [CrossRef] [Scilit]
- MacDonald, H.; McKenney, D. Envisioning a global forest transition: Status, role, and implications. Land Use Policy 2020, 99, 104808. [Google Scholar] [CrossRef] [Scilit]
- Rosa, M.R.; Brancalion, P.H.; Crouzeilles, R.; Tambosi, L.R.; Piffer, P.R.; Lenti, F.E.; Hirota, M.; Santiami, E.; Metzger, J.P. Hidden destruction of older forests threatens Brazil’s Atlantic Forest and challenges restoration programs. Sci. Adv. 2021, 7, eabc4547. [Google Scholar] [CrossRef] [Scilit]
- Cheng, K.; Yang, H.; Tao, S.; Su, Y.; Guan, H.; Ren, Y.; Hu, T.; Li, W.; Xu, G.; Chen, M. Carbon storage through China’s planted forest expansion. Nat. Commun. 2024, 15, 4106. [Google Scholar] [CrossRef] [Scilit] [PubMed]
- Gupta, A.; Eppinga, M.B.; Furrer, R.; Santos, M.J. The Effect of Dominant Land-Cover Transitions in Shaping Trajectories of Global Forest Change. Environ. Manag. 2025, 75, 2826–2840. [Google Scholar] [CrossRef] [Scilit]
- Auch, R.F.; Wellington, D.F.; Taylor, J.L.; Stehman, S.V.; Tollerud, H.J.; Brown, J.F.; Loveland, T.R.; Pengra, B.W.; Horton, J.A.; Zhu, Z. Conterminous United States Land-Cover Change (1985–2016): New Insights from Annual Time Series. Land 2022, 11, 298. [Google Scholar] [CrossRef] [Scilit]
- Homer, C.; Dewitz, J.; Jin, S.; Xian, G.; Costello, C.; Danielson, P.; Gass, L.; Funk, M.; Wickham, J.; Stehman, S. Conterminous United States land cover change patterns 2001–2016 from the 2016 national land cover database. ISPRS J. Photogramm. Remote Sens. 2020, 162, 184–199. [Google Scholar] [CrossRef] [Scilit]
- Olson, M.G.; Stevenson, A.P.; Knapp, B.O.; Kabrick, J.M.; Jensen, R.G. Is there evidence of mesophication of oak forests in the Missouri Ozarks? In Proceedings of the 19th Central Hardwood Forest Conference; US Department of Agriculture, Forest Service, Northern Research Station: Madison, WI, USA, 2014; pp. 10–12. [Google Scholar]
- Olson, S.D.; Homoya, M.A.; Shimp, E.L. Native plants and communities and exotic plants within the Hoosier-Shawnee ecological assessment area. In The Hoosier-Shawnee Ecological Assessment; Thompson, F.R., Ed.; U.S. Dept. of Agriculture, Forest Service, North Central Research Station: Madison, WI, USA, 2004; pp. 59–80. [Google Scholar]
- Thurau, R.G.; Fralish, J.; Hupe, S.; Fitch, B.; Carver, A. Ecological modeling for forest management in the Shawnee National Forest. In Proceedings of the 16th Central Hardwood Forest Conference, West Lafayette, IN. Gen. Tech. Rep. NRS-P-24; US Department of Agriculture, Forest Service, Northern Research Station: Madison, WI, USA, 2008; pp. 374–385. [Google Scholar]
- Nowacki, G.J.; Abrams, M.D. The demise of fire and “mesophication” of forests in the eastern United States. BioScience 2008, 58, 123–138. [Google Scholar] [CrossRef] [Scilit]
- Ostermeier, B. Borderlands: The Goshen Settlement of William Bolin Whiteside. Available online: https://whiteside.siue.edu/illinois-frontier (accessed on 24 November 2025).
- Hanberry, B.B.; Abrams, M.D. Recognizing loss of open forest ecosystems by tree densification and land use intensification in the Midwestern USA. Reg. Environ. Change 2018, 18, 1731–1740. [Google Scholar] [CrossRef] [Scilit]
- Rhemtulla, J.M.; Mladenoff, D.J.; Clayton, M.K. Legacies of historical land use on regional forest composition and structure in Wisconsin, USA (mid-1800s–1930s–2000s). Ecol. Appl. 2009, 19, 1061–1078. [Google Scholar] [CrossRef] [Scilit] [PubMed]
- Anderson, J.R. A Land Use and Land Cover Classification System for Use with Remote Sensor Data; Geological Survey US Government Printing Office: Washington, DC, USA, 1976; Volume 964.
- Phiri, D.; Morgenroth, J. Developments in Landsat Land Cover Classification Methods: A Review. Remote Sens. 2017, 9, 967. [Google Scholar] [CrossRef] [Scilit]
- Zhang, H.K.; Roy, D.P. Using the 500 m MODIS land cover product to derive a consistent continental scale 30 m Landsat land cover classification. Remote Sens. Environ. 2017, 197, 15–34. [Google Scholar] [CrossRef] [Scilit]
- Breiman, L. Random forests. Mach. Learn. 2001, 45, 5–32. [Google Scholar] [CrossRef] [Scilit]
- Amini, S.; Saber, M.; Rabiei-Dastjerdi, H.; Homayouni, S. Urban Land Use and Land Cover Change Analysis Using Random Forest Classification of Landsat Time Series. Remote Sens. 2022, 14, 2654. [Google Scholar] [CrossRef] [Scilit]
- Rodriguez-Galiano, V.F.; Ghimire, B.; Rogan, J.; Chica-Olmo, M.; Rigol-Sanchez, J.P. An assessment of the effectiveness of a random forest classifier for land-cover classification. ISPRS J. Photogramm. Remote Sens. 2012, 67, 93–104. [Google Scholar] [CrossRef] [Scilit]
- R Core Team. R: A Language and Environment for Statistical Computing; R Foundation for Statistical Computing: Vienna, Austria, 2020. [Google Scholar]
- Olofsson, P.; Foody, G.M.; Herold, M.; Stehman, S.V.; Woodcock, C.E.; Wulder, M.A. Good practices for estimating area and assessing accuracy of land change. Remote Sens. Environ. 2014, 148, 42–57. [Google Scholar] [CrossRef] [Scilit]
- Eastman, J. TERRSET Tutorial; Clark University: Worcester, MA, USA, 2018. [Google Scholar]
- Swanwick, R.H.; Read, Q.D.; Guinn, S.M.; Williamson, M.A.; Hondula, K.L.; Elmore, A.J. Dasymetric population mapping based on US census data and 30-m gridded estimates of impervious surface. Sci. Data 2022, 9, 523. [Google Scholar] [CrossRef] [Scilit] [PubMed]
- Hewitt, R.J.; Díaz-Pacheco, J.; Moya-Gómez, B. A Cellular Automata Land Use Model for the R Software Environment. 2013. Available online: https://simlander.wordpress.com/ (accessed on 3 February 2026).
- Viana, C.M.; Pontius, R.G., Jr.; Rocha, J. Four fundamental questions to evaluate land change models with an illustration of a cellular automata–markov model. Ann. Am. Assoc. Geogr. 2023, 113, 2497–2511. [Google Scholar] [CrossRef] [Scilit]
- Aldwaik, S.Z.; Pontius, R.G. Intensity analysis to unify measurements of size and stationarity of land changes by interval, category, and transition. Landsc. Urban Plan. 2012, 106, 103–114. [Google Scholar] [CrossRef] [Scilit]
- Sang, X.; Guo, Q.; Wu, X.; Fu, Y.; Xie, T.; He, C.; Zang, J. Intensity and Stationarity Analysis of Land Use Change Based on CART Algorithm. Sci. Rep. 2019, 9, 12279. [Google Scholar] [CrossRef] [Scilit]
- Vojteková, J.; Vojtek, M. GIS-Based Landscape Stability Analysis: A Comparison of Overlay Method and Fuzzy Model for the Case Study in Slovakia. Prof. Geogr. 2019, 71, 631–644. [Google Scholar] [CrossRef] [Scilit]
- Meyfroidt, P.; Lambin, E.F. Forest transition in Vietnam and displacement of deforestation abroad. Proc. Natl. Acad. Sci. USA 2009, 106, 16139–16144. [Google Scholar] [CrossRef] [Scilit]
- Cheng, K.-S.; Ling, J.-Y.; Lin, T.-W.; Liu, Y.-T.; Shen, Y.-C.; Kono, Y. Quantifying uncertainty in land-use/land-cover classification accuracy: A stochastic simulation approach. Front. Environ. Sci. 2021, 9, 628214. [Google Scholar] [CrossRef] [Scilit]
- Palmate, S.S.; Wagner, P.D.; Fohrer, N.; Pandey, A. Assessment of uncertainties in modelling land use change with an integrated cellular automata–Markov chain model. Environ. Model. Assess. 2022, 27, 275–293. [Google Scholar] [CrossRef] [Scilit]
- Congalton, R.G.; Gu, J.; Yadav, K.; Thenkabail, P.; Ozdogan, M. Global land cover mapping: A review and uncertainty analysis. Remote Sens. 2014, 6, 12070–12093. [Google Scholar] [CrossRef] [Scilit]
- Congalton, R.G.; Green, K. Assessing the Accuracy of Remotely Sensed Data: Principles and Practices; CRC Press: Boca Raton, FL, USA, 2019. [Google Scholar]
- Varanka, D.E.; Shaver, D.K. Land-Use Change Trends in the Interior Lowland Ecoregion; 2007-5145; Geological Survey: Reston, VA, USA, 2007. [Google Scholar]
- Li, X.; Tian, H.; Pan, S.; Lu, C. Four-century history of land transformation by humans in the United States: 1630–2020: Annual and 1 km grid data for the HIStory of LAND changes (HISLAND-US). Earth Syst. Sci. Data 2022, 15, 1005–1035. [Google Scholar] [CrossRef] [Scilit]
- IDNR. Illinois Forest Action Plan: A Statewide Forest Resource Assessment and Strategy; Illinois Forestry Development Council: Carbondale, IL, USA, 2019. [Google Scholar]
- Gibson, D.J.; Thapa, S.; Benda, C. Herbaceous Layer Response to Forest Management at Trail of Tears State Forest from 2014–2018; Shawnee RC&D: Golconda, IL, USA, 2019. [Google Scholar]
- Anderson, R.C. Presettlement forests of Illinois. In Proceedings of the Oak Woods Management; Eastern Illinois University: Charleston, IL, USA, 1991; pp. 9–19. [Google Scholar]
- Iverson, L.R.; Taft, J.B. Past, Present, and Possible Future Trends with Climate Change in Illinois Forests. Erigenia 2022, 28, 53–70. [Google Scholar]
- Olson, K.R.; Speidel, D.R. Why Does the Repaired Len Small Levee, Alexander County, Illinois, US Continue to Breach during Major Flooding Events? Open J. Soil Sci. 2020, 10, 16–43. [Google Scholar] [CrossRef]
- Qin, H.; Flint, C. Southern Illinois Land Use; University of Illinois, Urbana-Champaign—Department of Natural Resources and Environmental Sciences: Urbana, IL, USA, 2006. [Google Scholar]
- Sohl, T.L.; Sayler, K.L.; Bouchard, M.A.; Reker, R.R.; Friesz, A.M.; Bennett, S.L.; Sleeter, B.M.; Sleeter, R.R.; Wilson, T.; Soulard, C. Spatially explicit modeling of 1992–2100 land cover and forest stand age for the conterminous United States. Ecol. Appl. 2014, 24, 1015–1036. [Google Scholar] [CrossRef] [Scilit] [PubMed]
- Wear, D.N. Forecasts of County-Level Land Uses Under Three Future Scenarios: A Technical Document Supporting the Forest Service 2010 RPA Assessment; Gen. Tech. Rep. SRS-141; US Department of Agriculture Forest Service, Southern Research Station: Asheville, NC, USA, 2011; Volume 141, pp. 1–41. [CrossRef] [Scilit]
- Wuebbles, D.J.; Angel, J.; Petersen, K.; Lemke, A.M. An Assessment of the Impacts of Climate Change in Illinois; The Nature Conservancy: Chicago, IL, USA, 2021. [Google Scholar]
- Smith, A.B.; Alsdurf, J.; Knapp, M.; Baer, S.G.; Johnson, L.C. Phenotypic distribution models corroborate species distribution models: A shift in the role and prevalence of a dominant prairie grass in response to climate change. Glob. Change Biol. 2017, 23, 4365–4375. [Google Scholar] [CrossRef] [Scilit]
- Belesky, D.P.; Malinowski, D.P. Grassland communities in the USA and expected trends associated with climate change. Acta Agrobot. 2016, 69, 1673. [Google Scholar] [CrossRef] [Scilit]
- Gurgel, A.C.; Reilly, J.; Blanc, E. Agriculture and forest land use change in the continental United States: Are there tipping points? Iscience 2021, 24, 102772. [Google Scholar] [CrossRef] [Scilit]
- Salimi, S.; Almuktar, S.A.; Scholz, M. Impact of climate change on wetland ecosystems: A critical review of experimental wetlands. J. Environ. Manag. 2021, 286, 112160. [Google Scholar] [CrossRef] [Scilit]
- Soh, W.K.; Yiotis, C.; Murray, M.; Parnell, A.; Wright, I.J.; Spicer, R.A.; Lawson, T.; Caballero, R.; McElwain, J.C. Rising CO2 drives divergence in water use efficiency of evergreen and deciduous plants. Sci. Adv. 2019, 5, eaax7906. [Google Scholar] [CrossRef] [Scilit]
- Dial, R.J.; Maher, C.T.; Hewitt, R.E.; Sullivan, P.F. Sufficient conditions for rapid range expansion of a boreal conifer. Nature 2022, 608, 546–551. [Google Scholar] [CrossRef] [Scilit]
- Reich, P.B.; Bermudez, R.; Montgomery, R.A.; Rich, R.L.; Rice, K.E.; Hobbie, S.E.; Stefanski, A. Even modest climate change may lead to major transitions in boreal forests. Nature 2022, 608, 540–545. [Google Scholar] [CrossRef] [Scilit] [PubMed]
- Lambin, E.F.; Meyfroidt, P. Global land use change, economic globalization, and the looming land scarcity. Proc. Natl. Acad. Sci. USA 2011, 108, 3465–3472. [Google Scholar] [CrossRef] [Scilit]
- Bruno, D.; Sorando, R.; Álvarez-Farizo, B.; Castellano, C.; Céspedes, V.; Gallardo, B.; Jiménez, J.J.; López, M.V.; López-Flores, R.; Moret-Fernández, D. Depopulation impacts on ecosystem services in Mediterranean rural areas. Ecosyst. Serv. 2021, 52, 101369. [Google Scholar] [CrossRef] [Scilit]
- Hosonuma, N.; Herold, M.; De Sy, V.; De Fries, R.S.; Brockhaus, M.; Verchot, L.; Angelsen, A.; Romijn, E. An assessment of deforestation and forest degradation drivers in developing countries. Environ. Res. Lett. 2012, 7, 044009. [Google Scholar] [CrossRef] [Scilit]
- Sleeter, B.M.; Liu, J.; Daniel, C.; Rayfield, B.; Sherba, J.; Hawbaker, T.J.; Zhu, Z.; Selmants, P.C.; Loveland, T.R. Effects of contemporary land-use and land-cover change on the carbon balance of terrestrial ecosystems in the United States. Environ. Res. Lett. 2018, 13, 045006. [Google Scholar] [CrossRef] [Scilit]
- Crespo Cuaresma, J.; Danylo, O.; Fritz, S.; McCallum, I.; Obersteiner, M.; See, L.; Walsh, B. Economic development and forest cover: Evidence from satellite data. Sci. Rep. 2017, 7, 40678. [Google Scholar] [CrossRef] [Scilit] [PubMed]
- Meyfroidt, P.; Rudel, T.K.; Lambin, E.F. Forest transitions, trade, and the global displacement of land use. Proc. Natl. Acad. Sci. USA 2010, 107, 20917–20922. [Google Scholar] [CrossRef] [Scilit] [PubMed]
- Gibson, D.J.; Newman, J.; Hager, H. Saving Our Shared Heritage: Priorities for grassland conservation and management. In Handbook of Grasslands; Heather Hager, D.G., Newman, J., Eds.; Routledge: Oxfordshire, UK, 2026. [Google Scholar] [CrossRef] [Scilit]
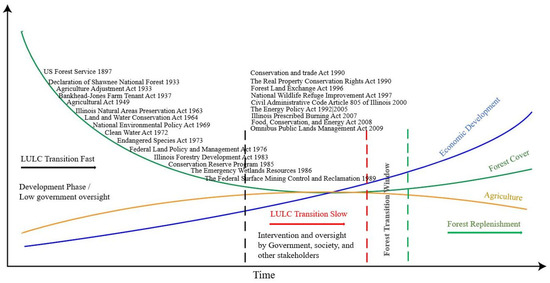
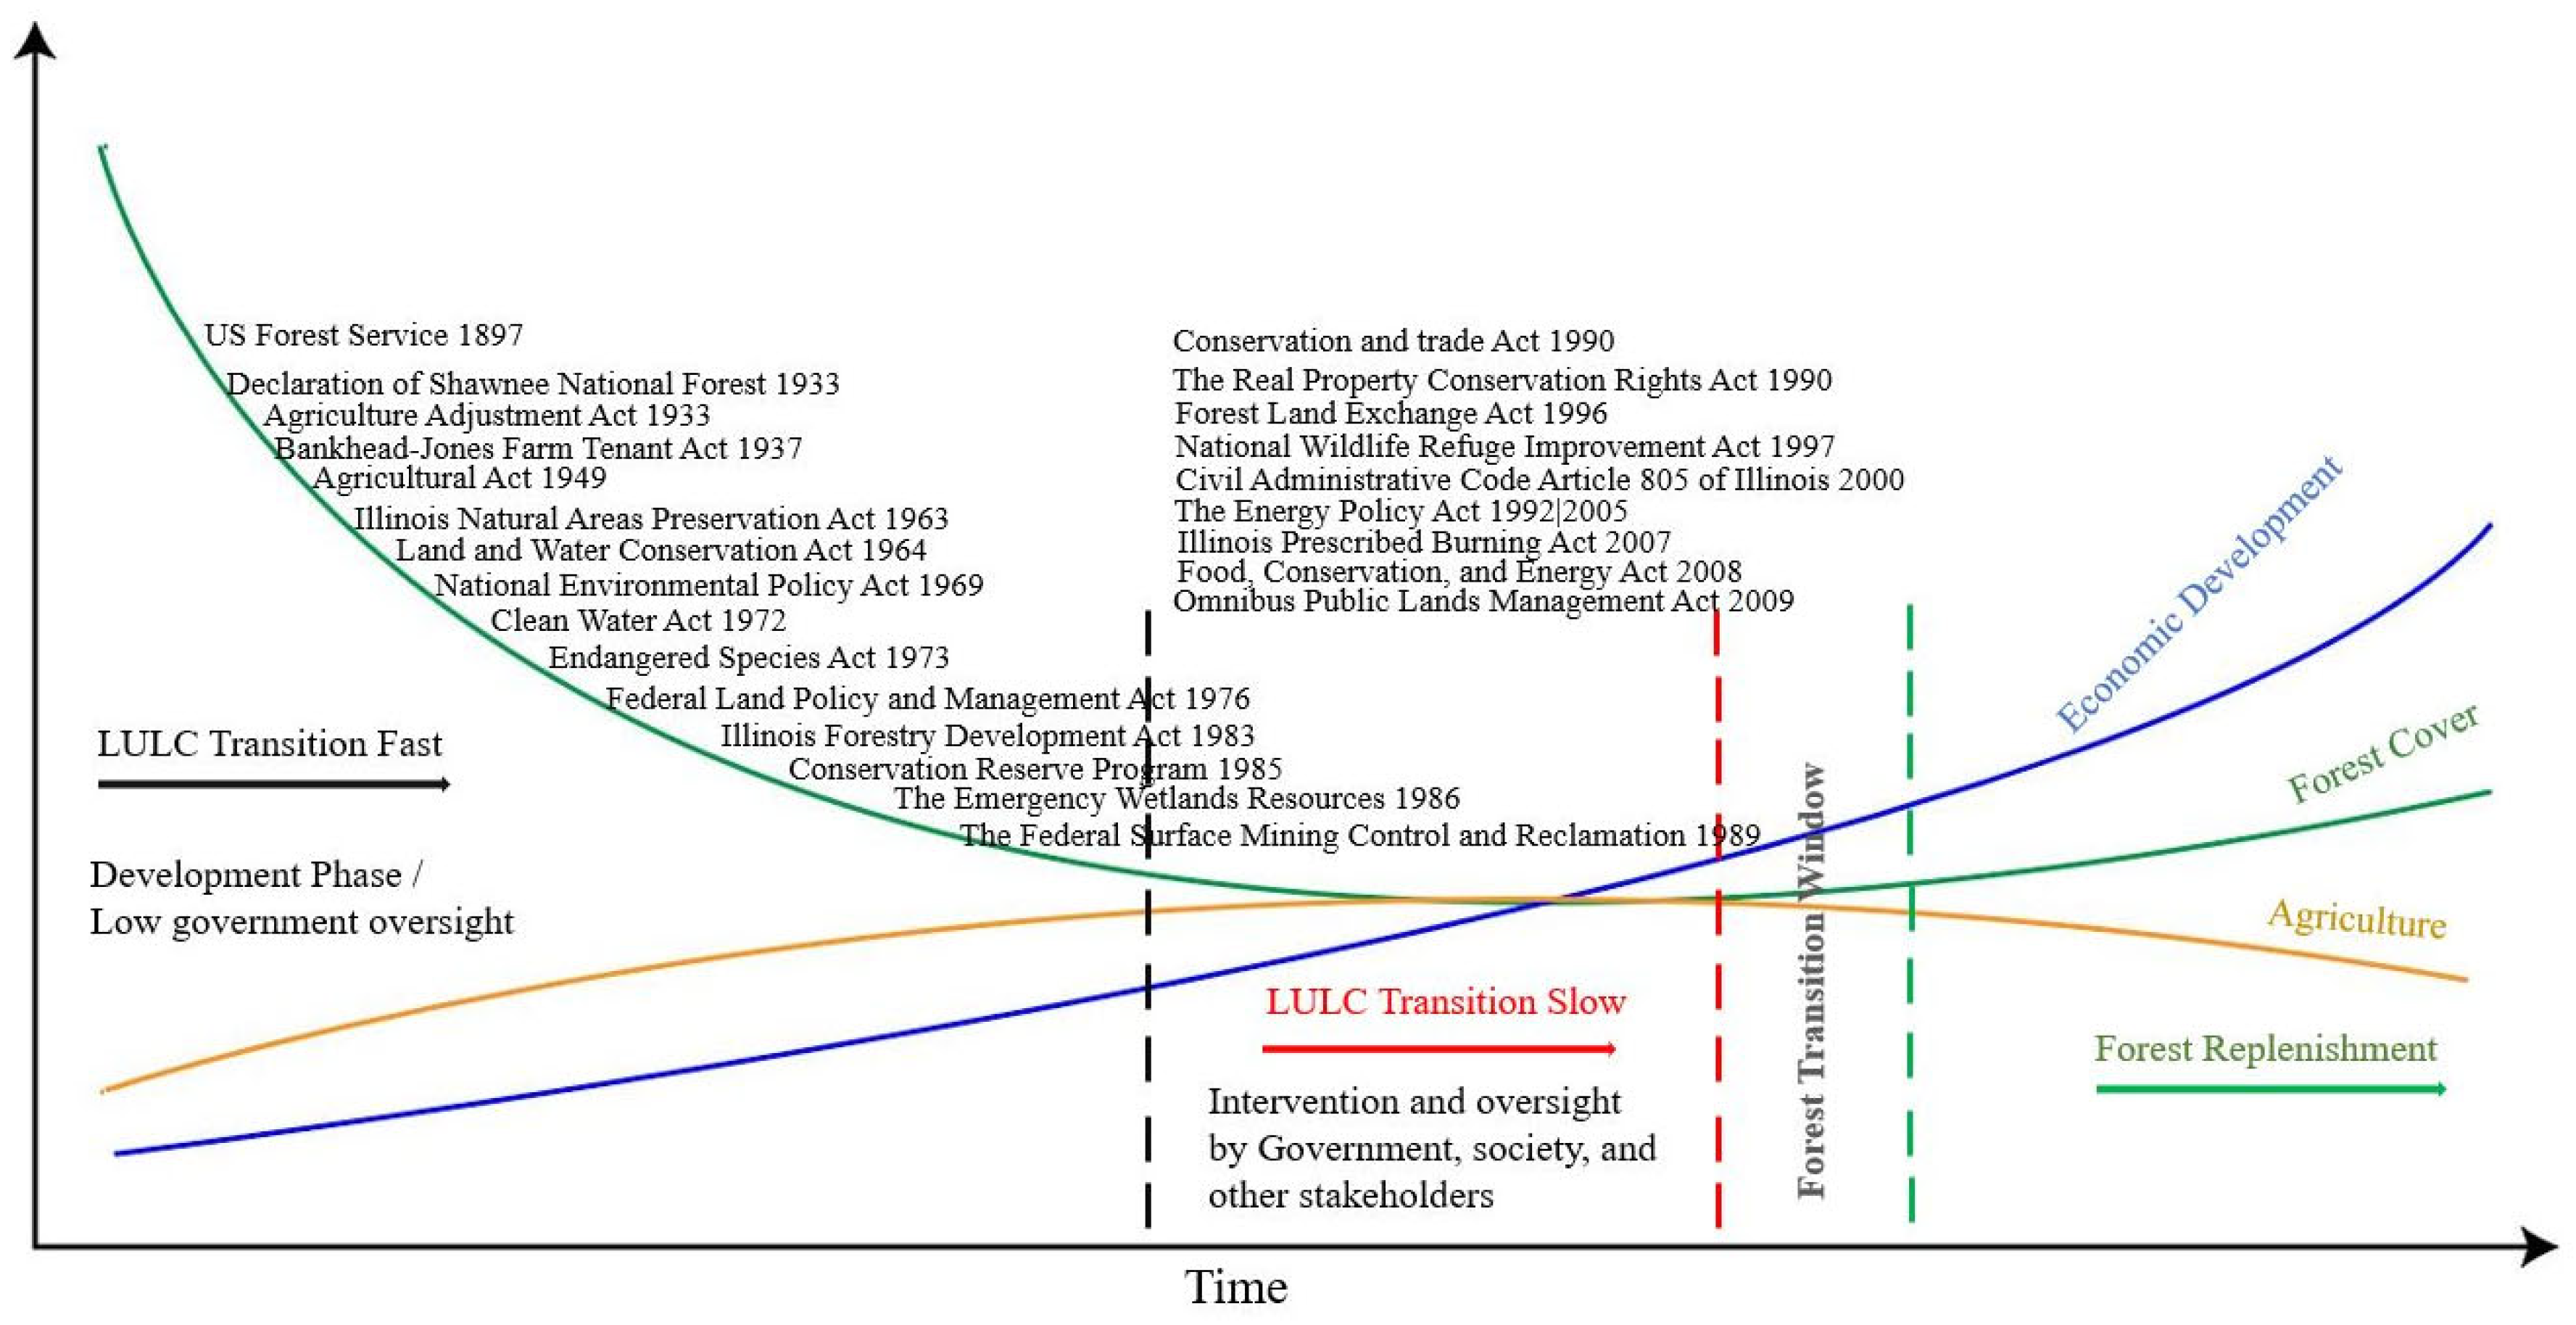
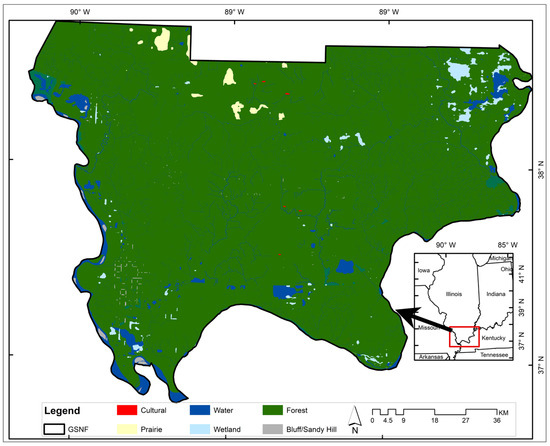
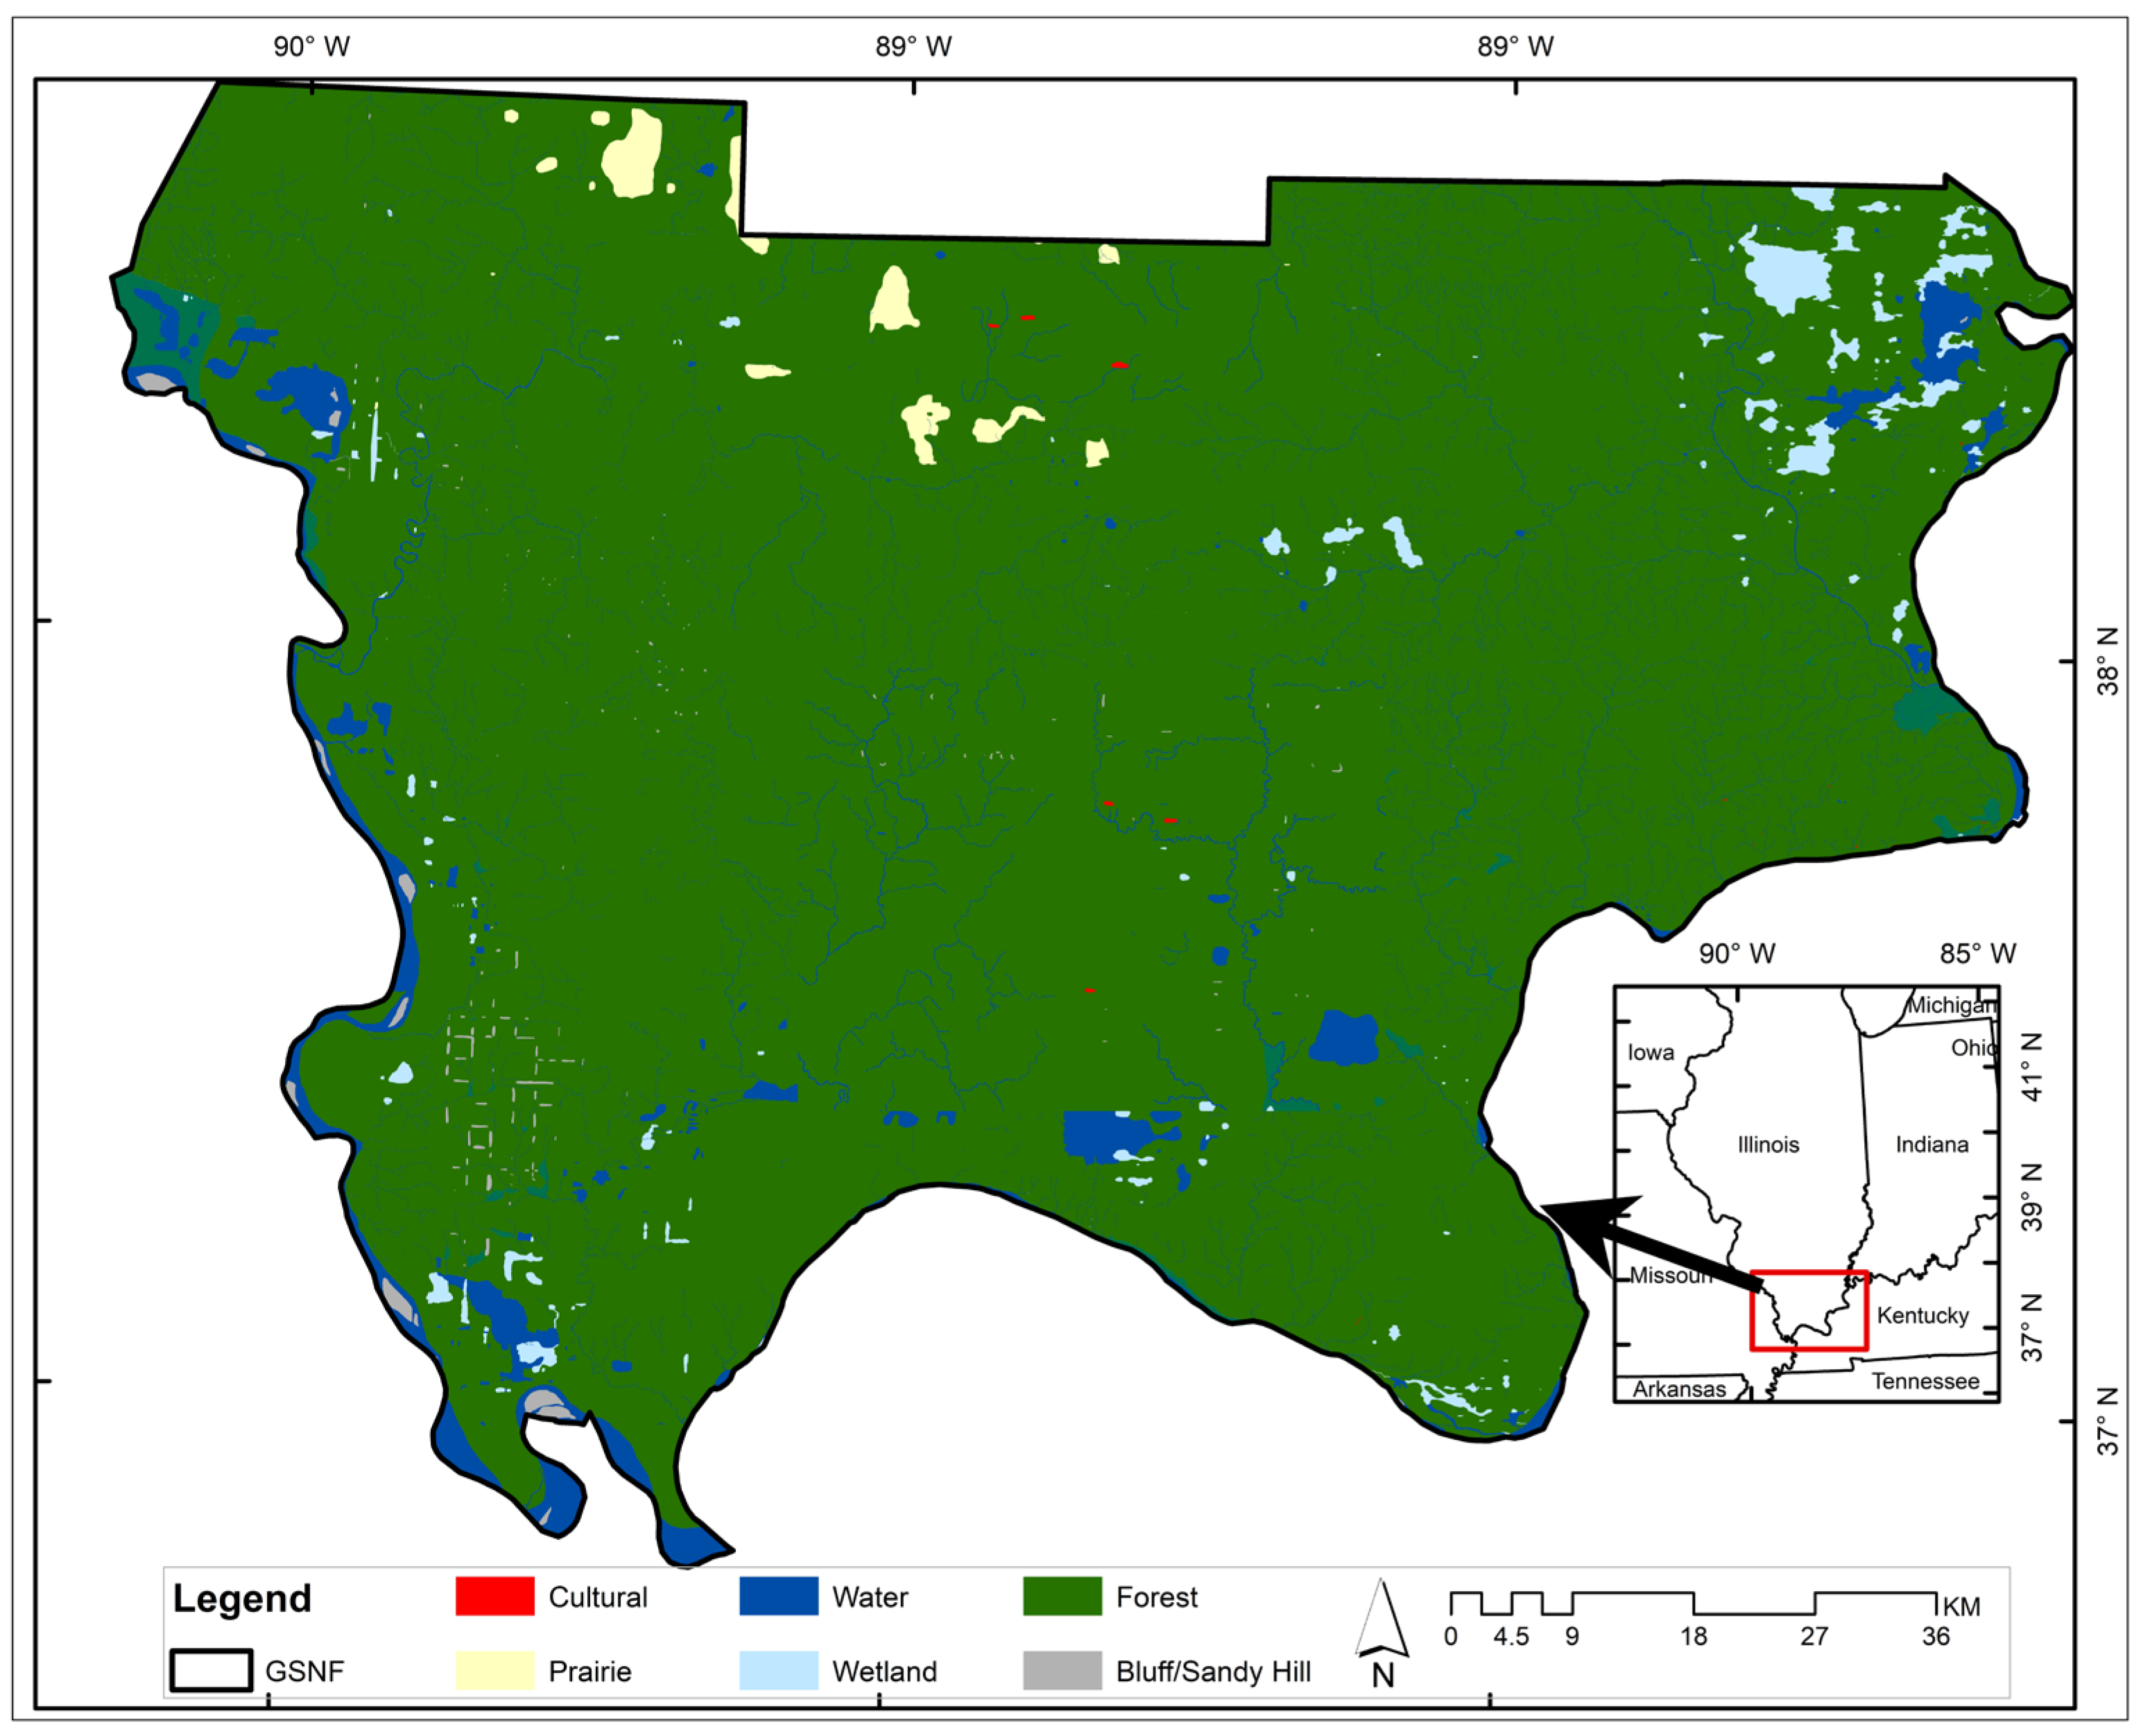
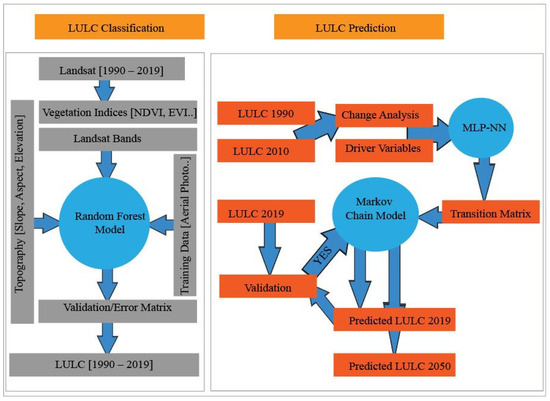
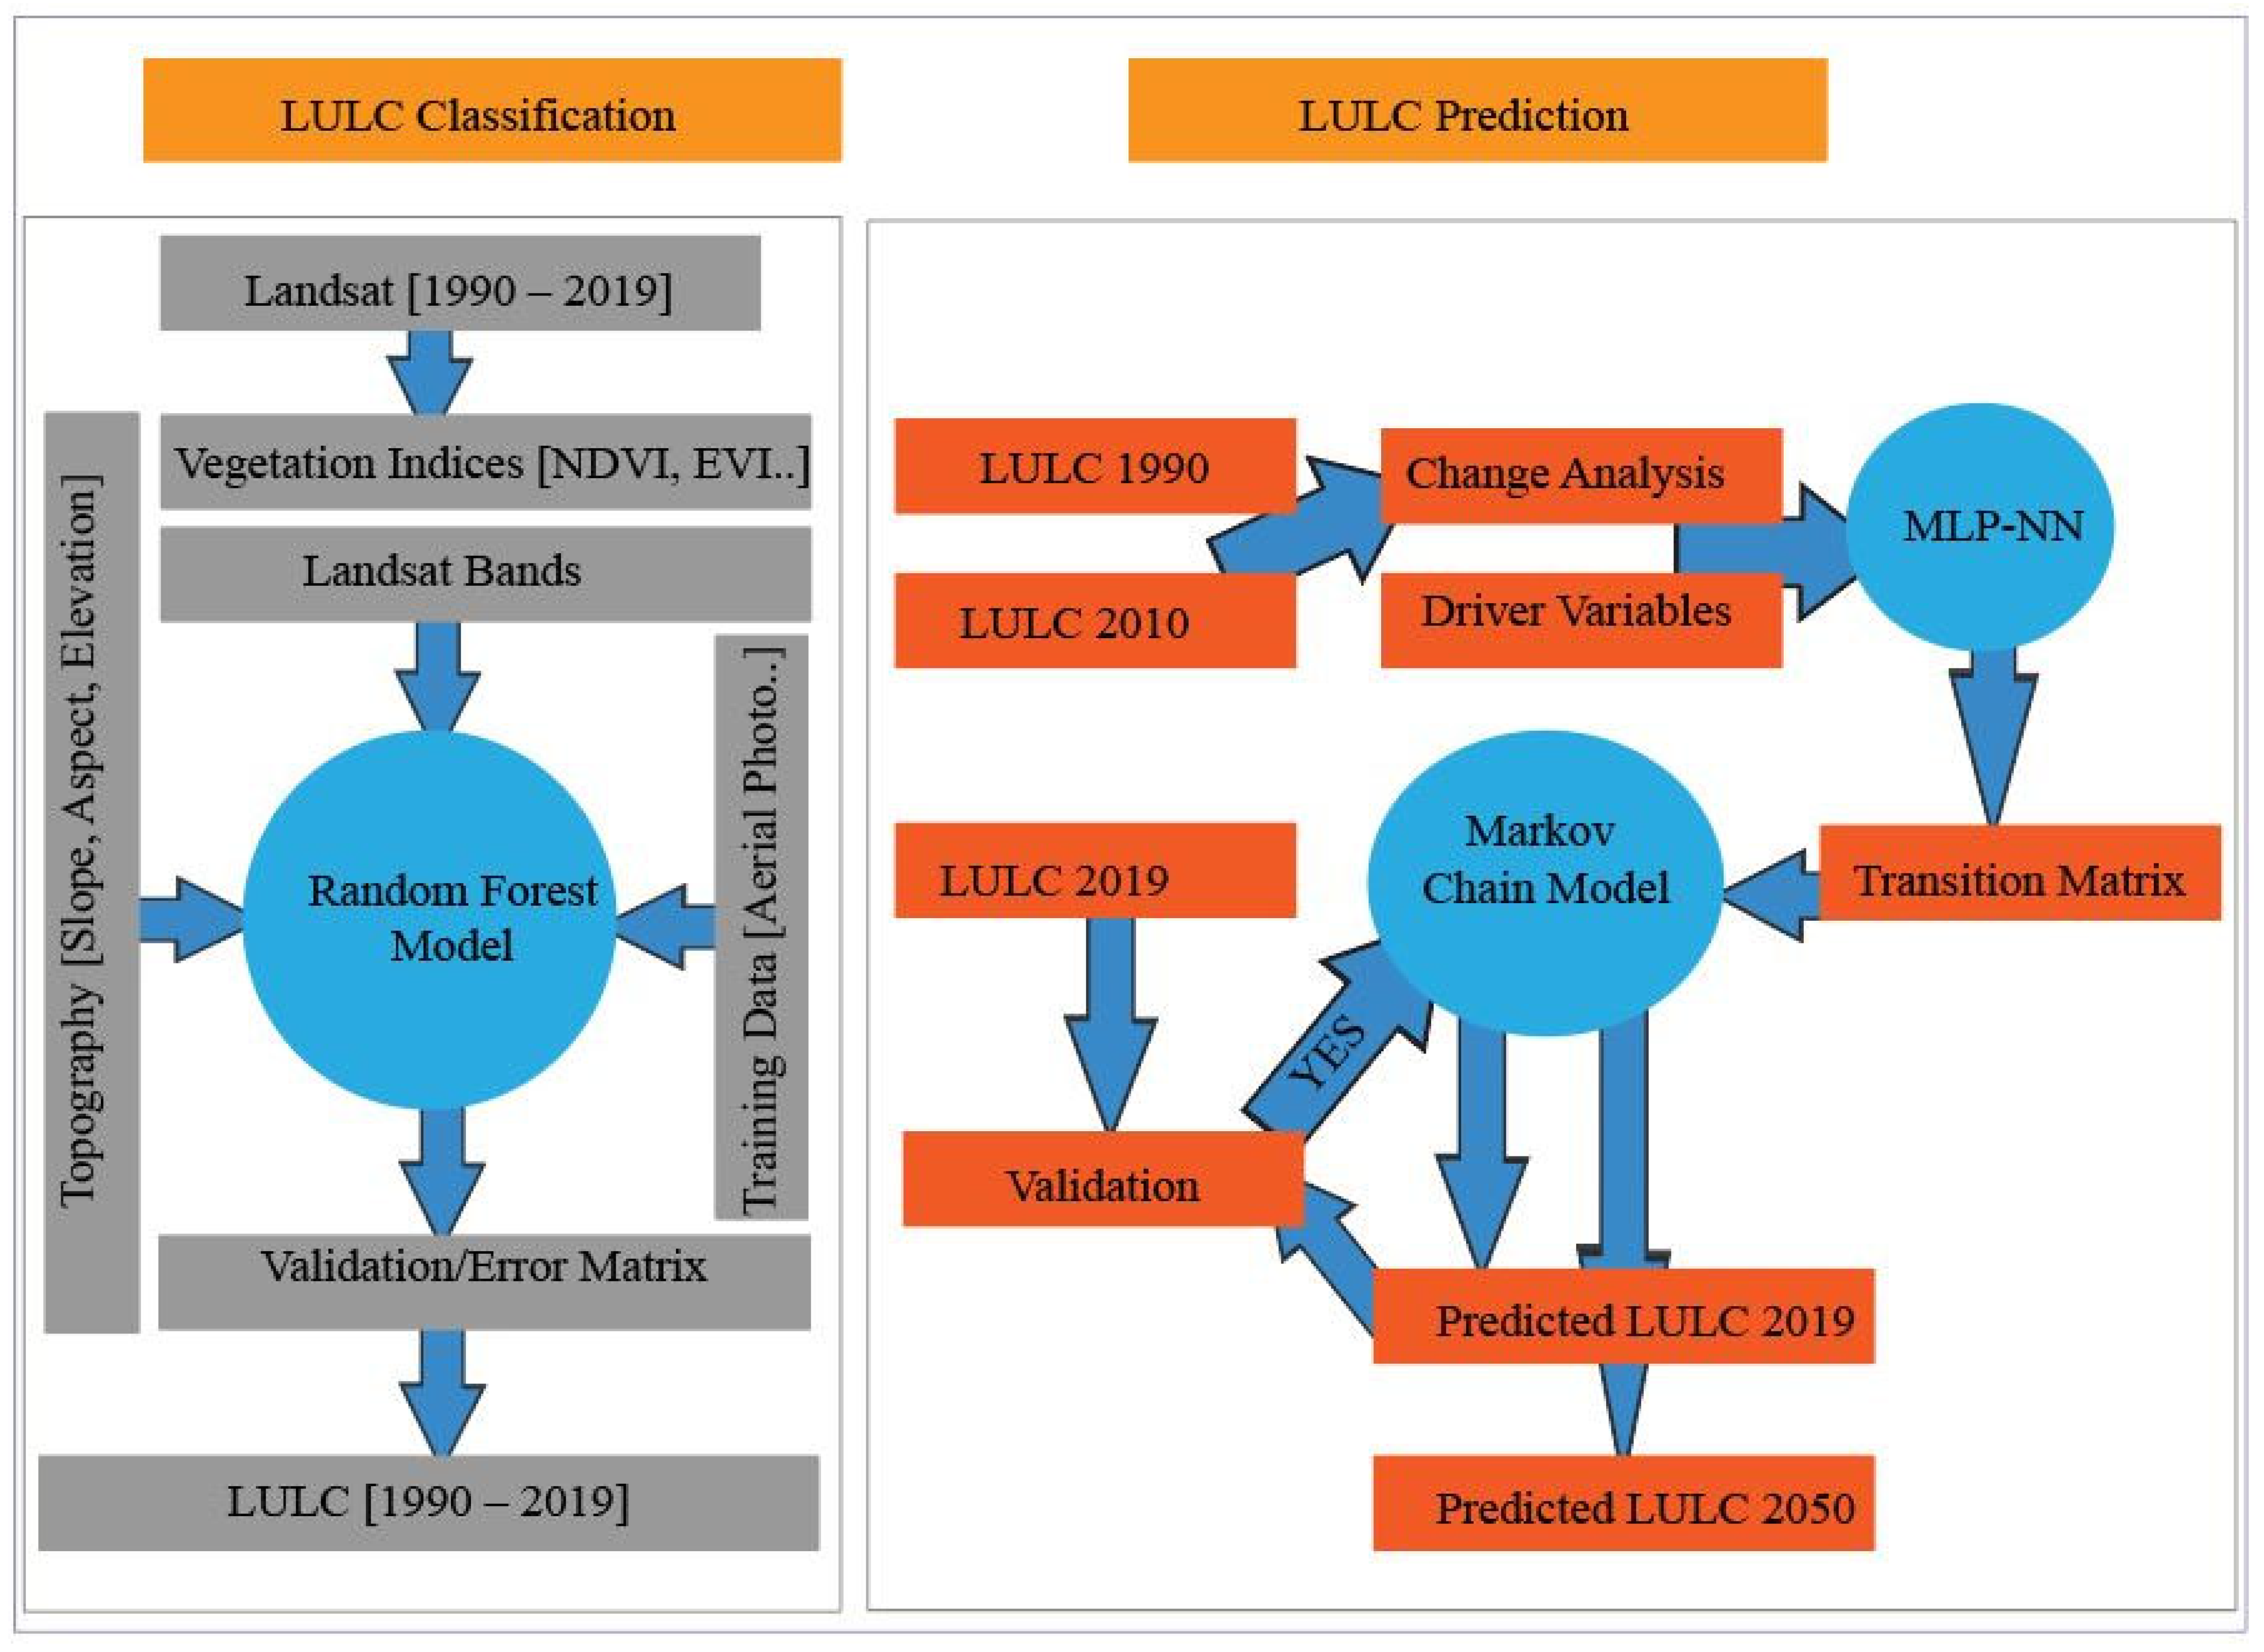
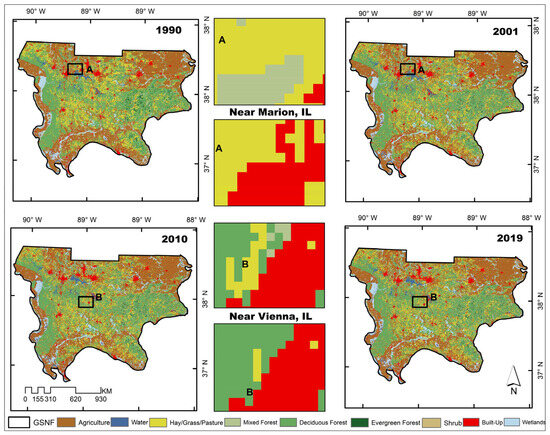
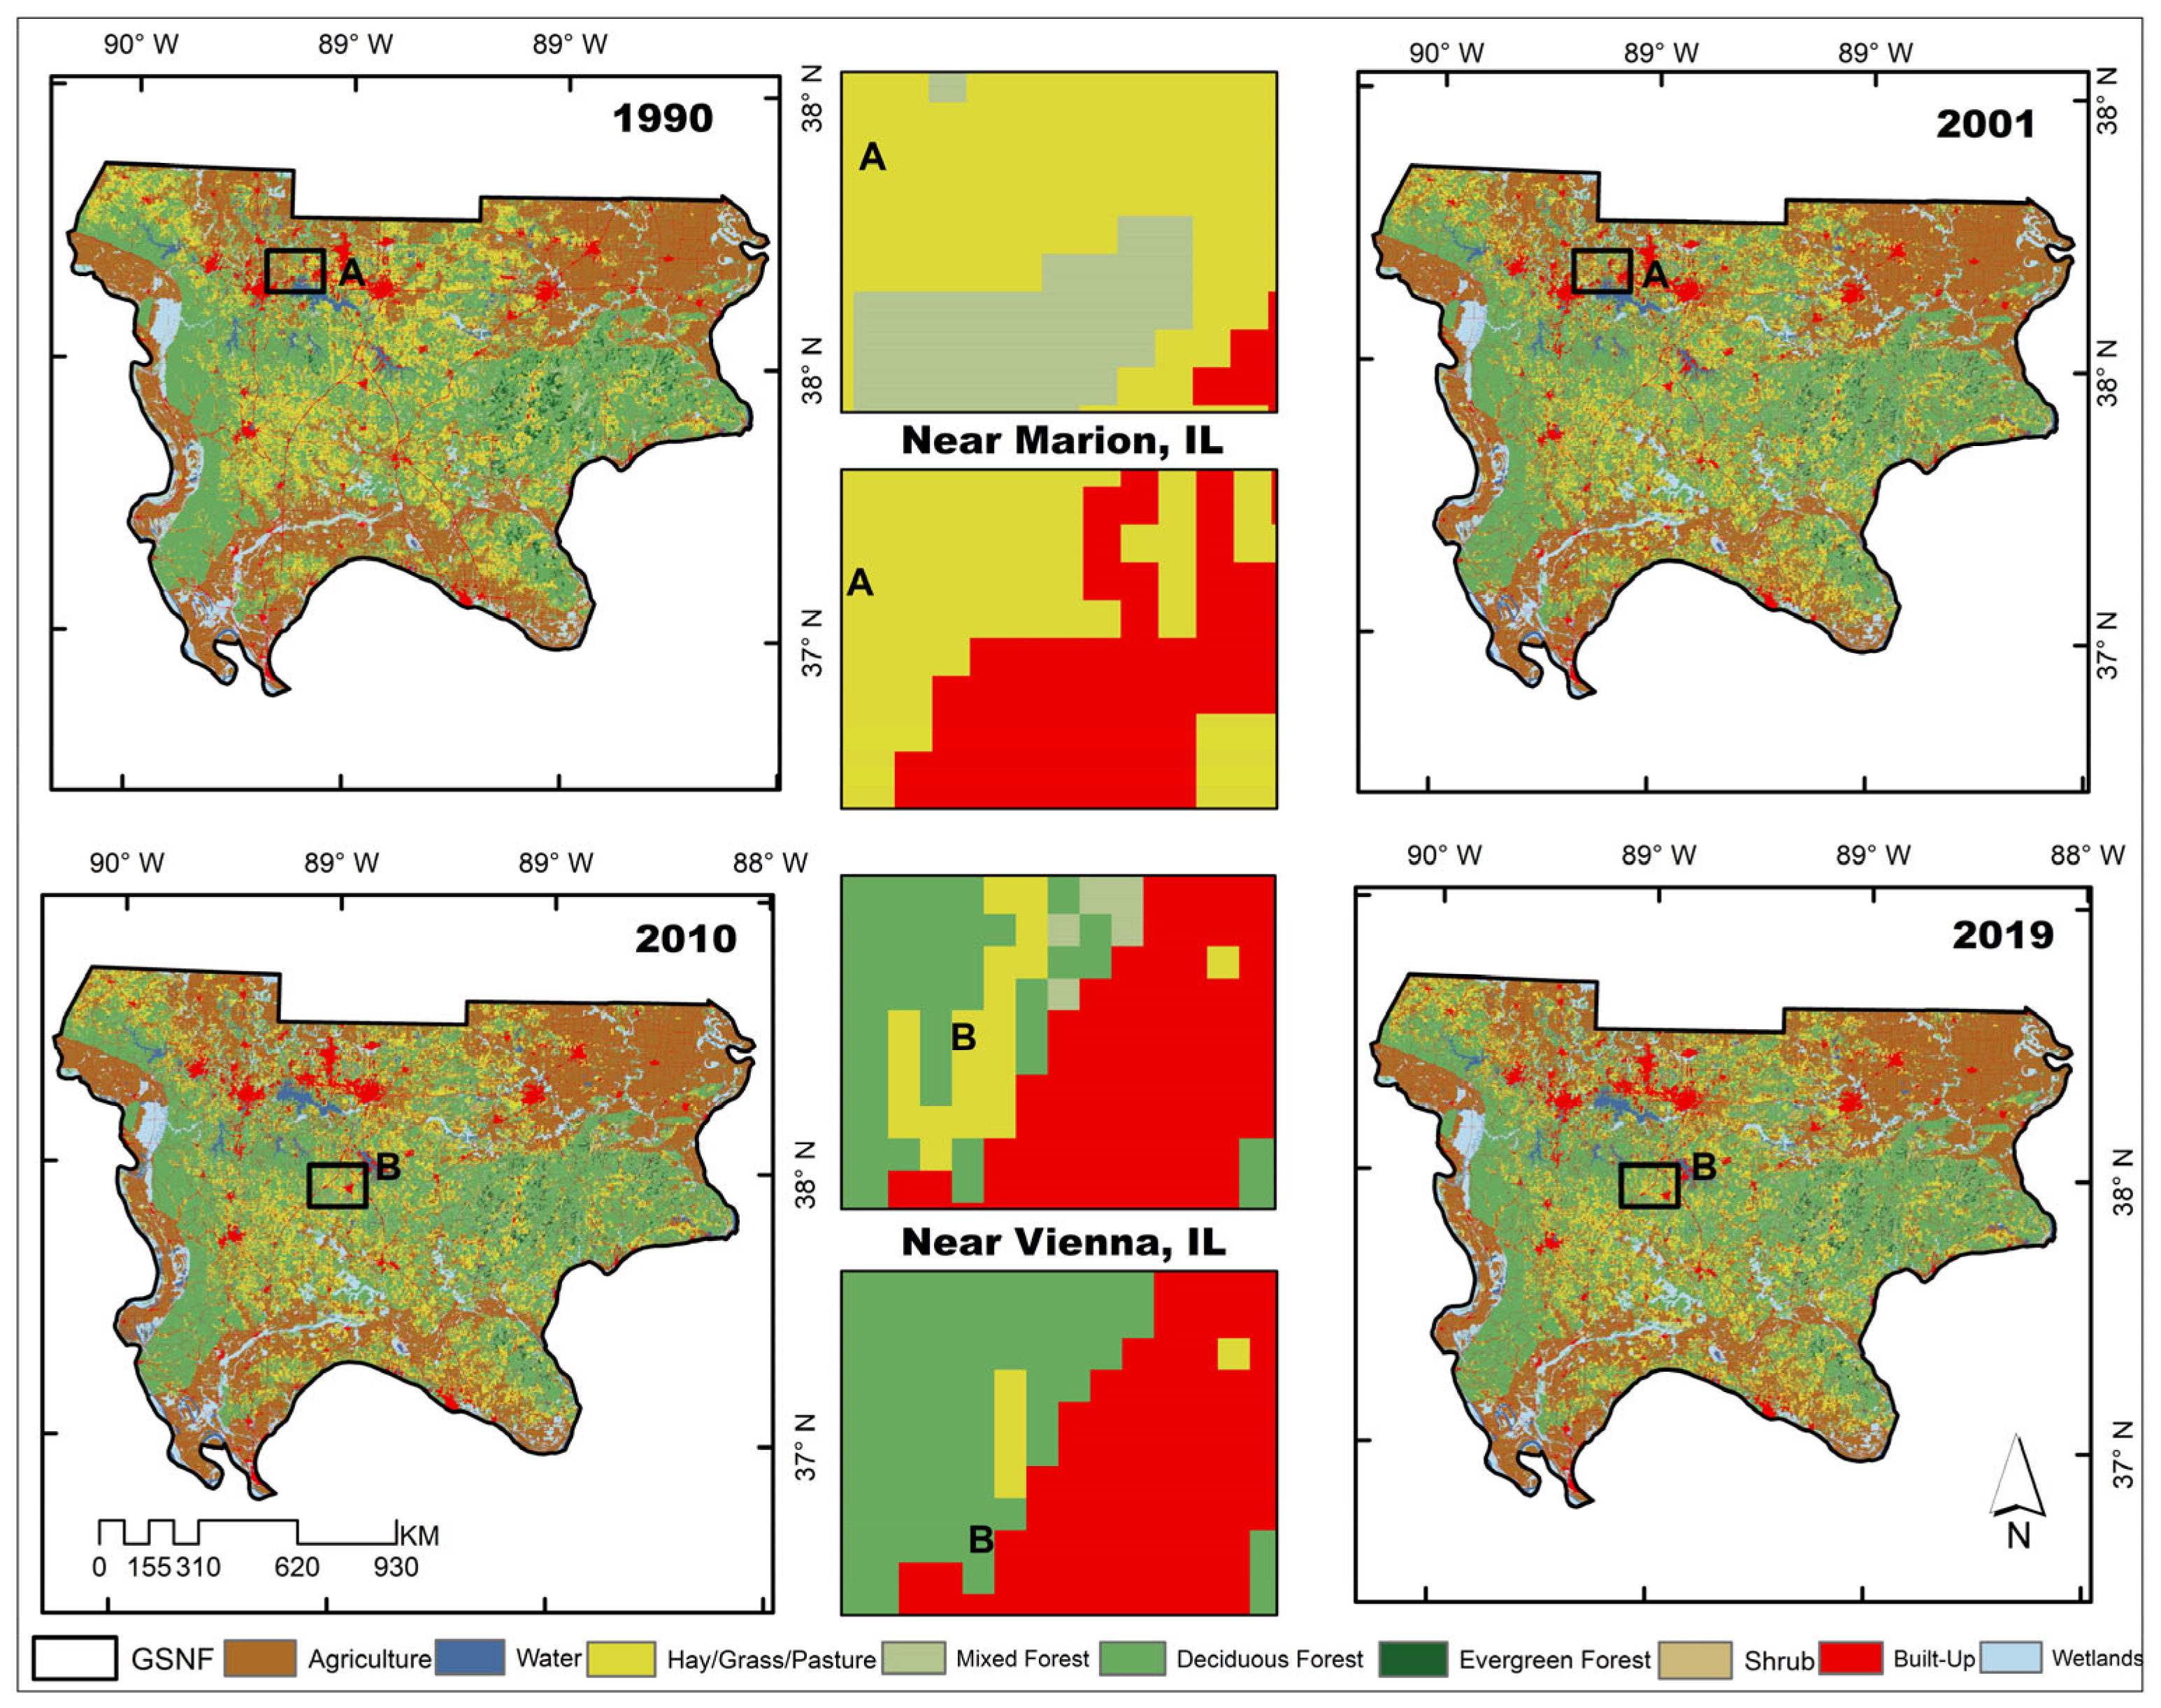
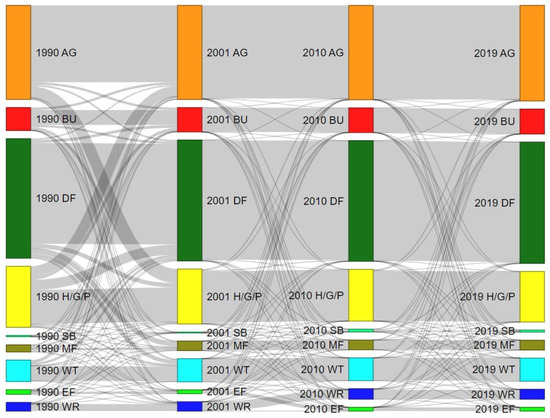
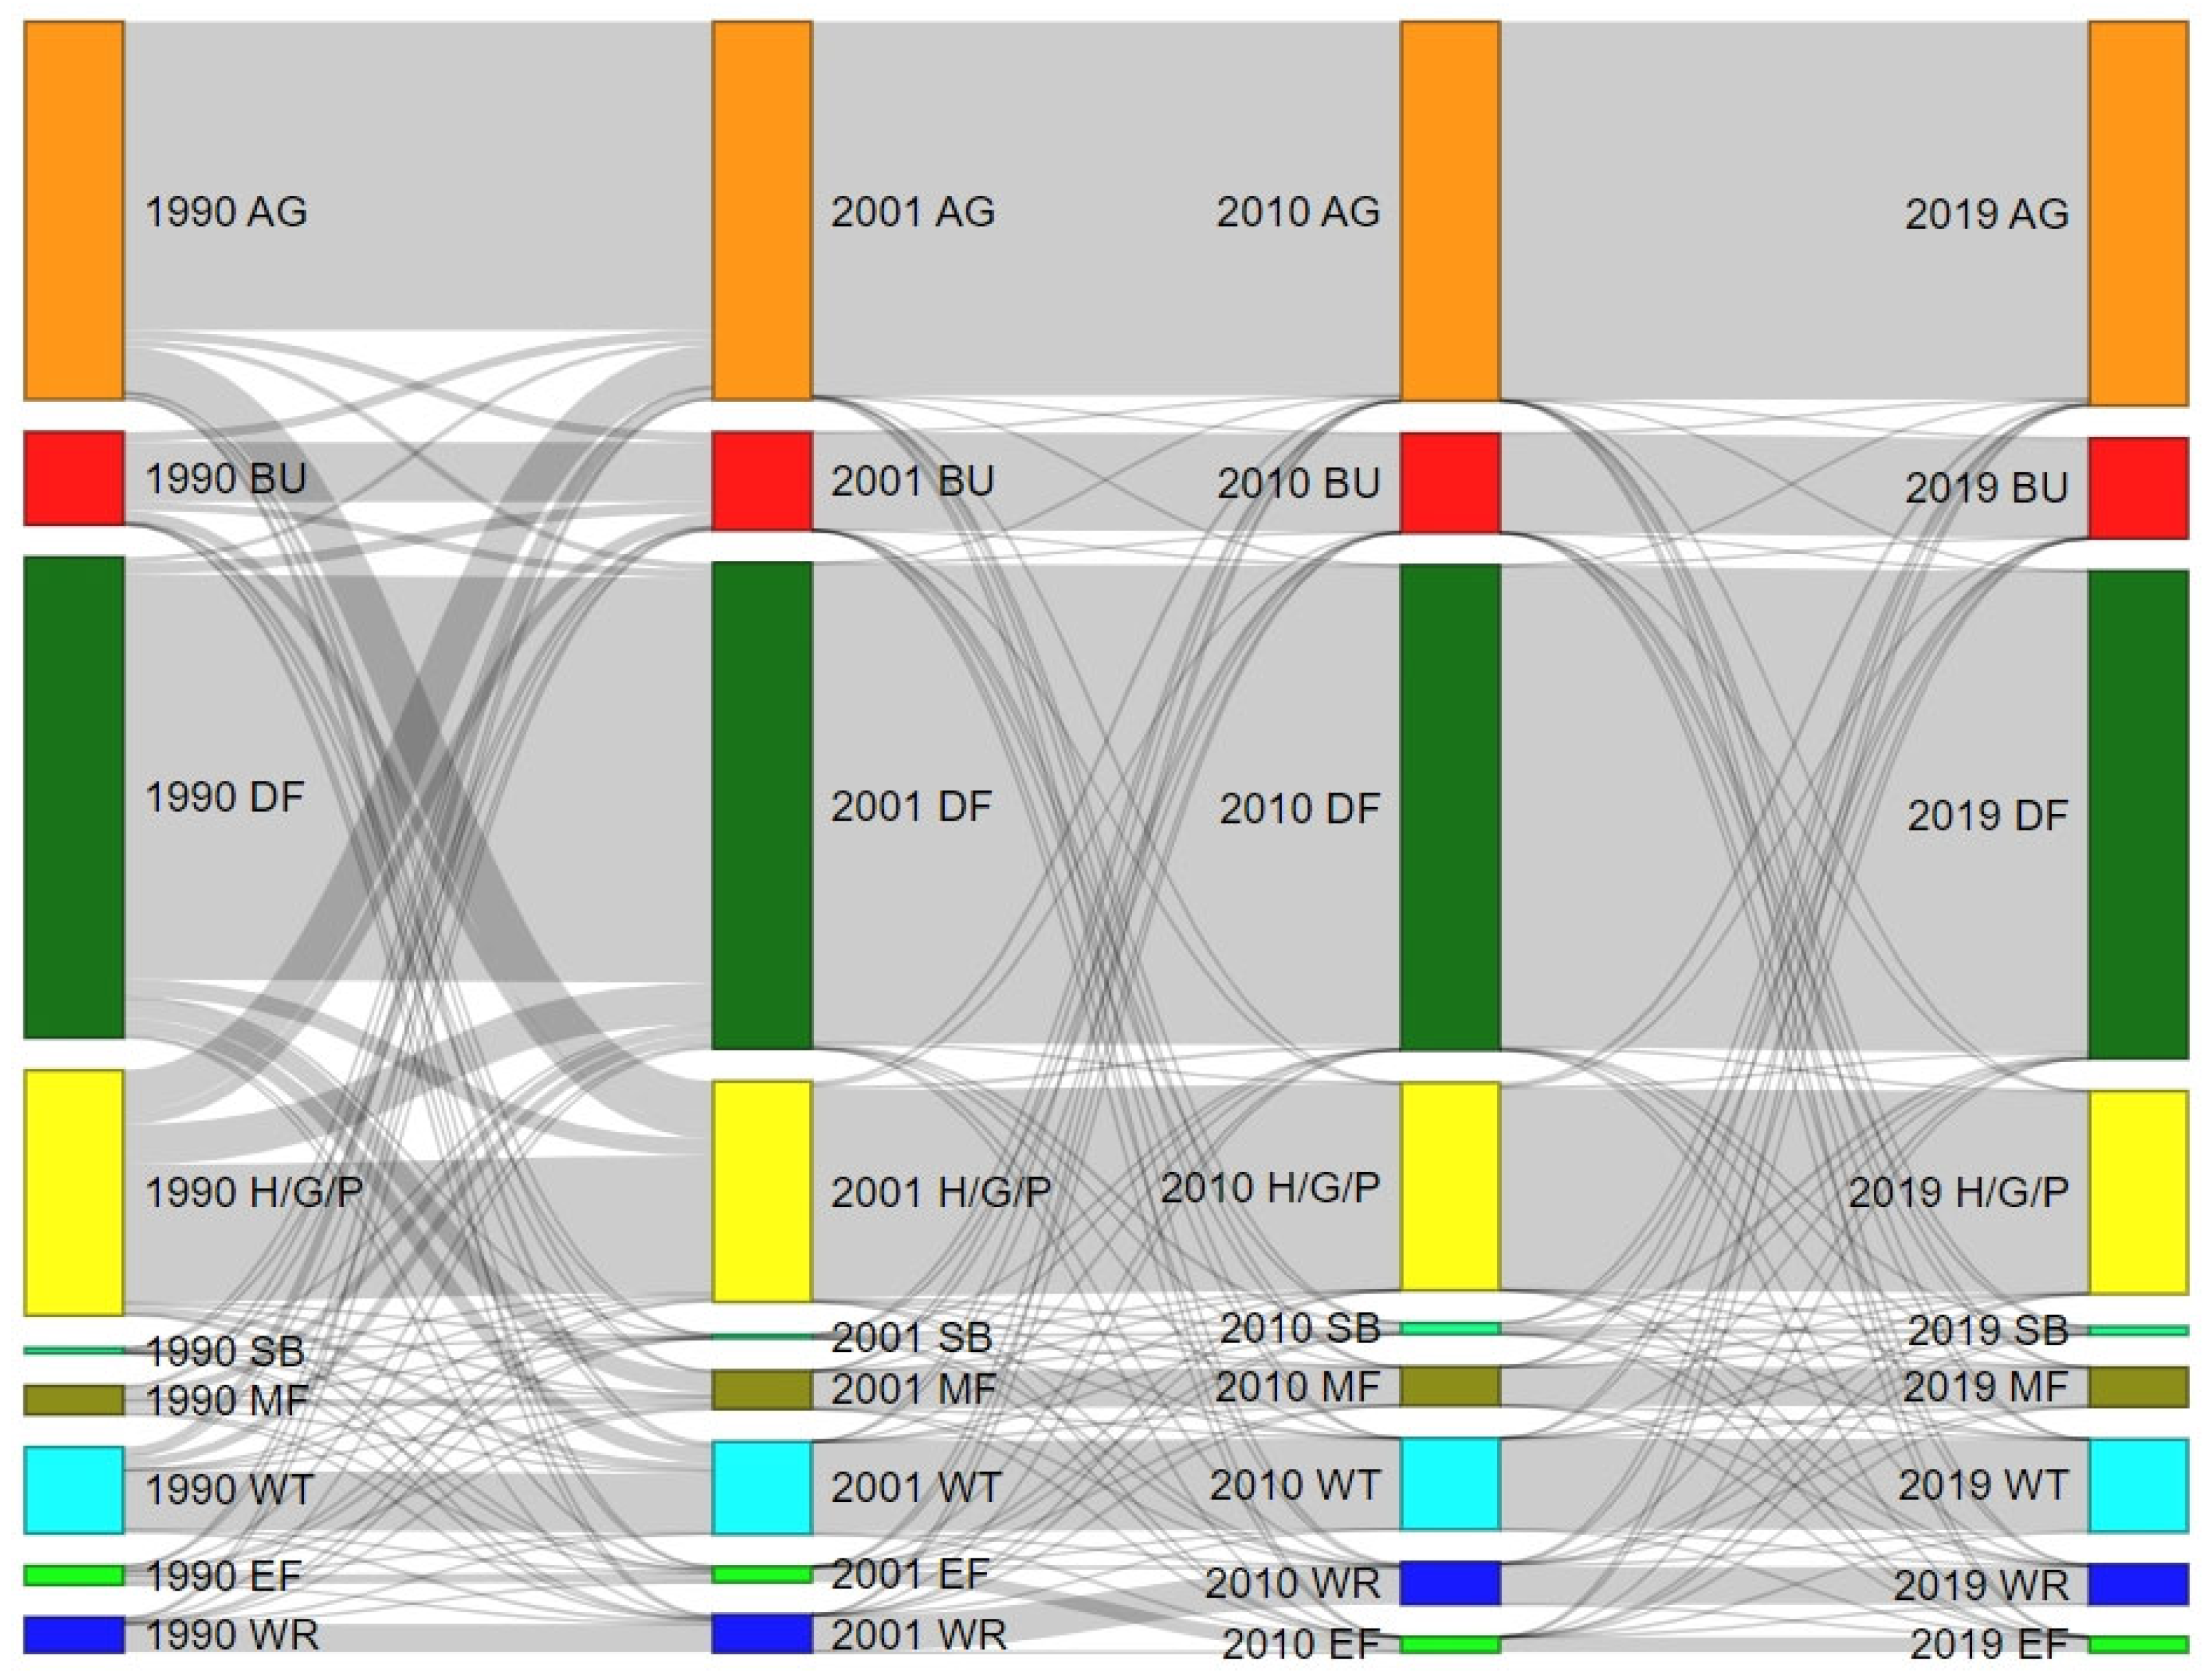
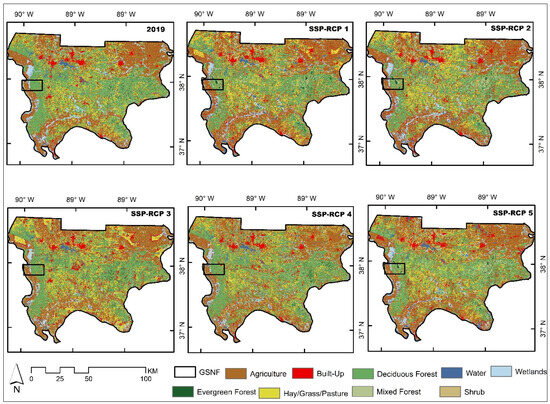
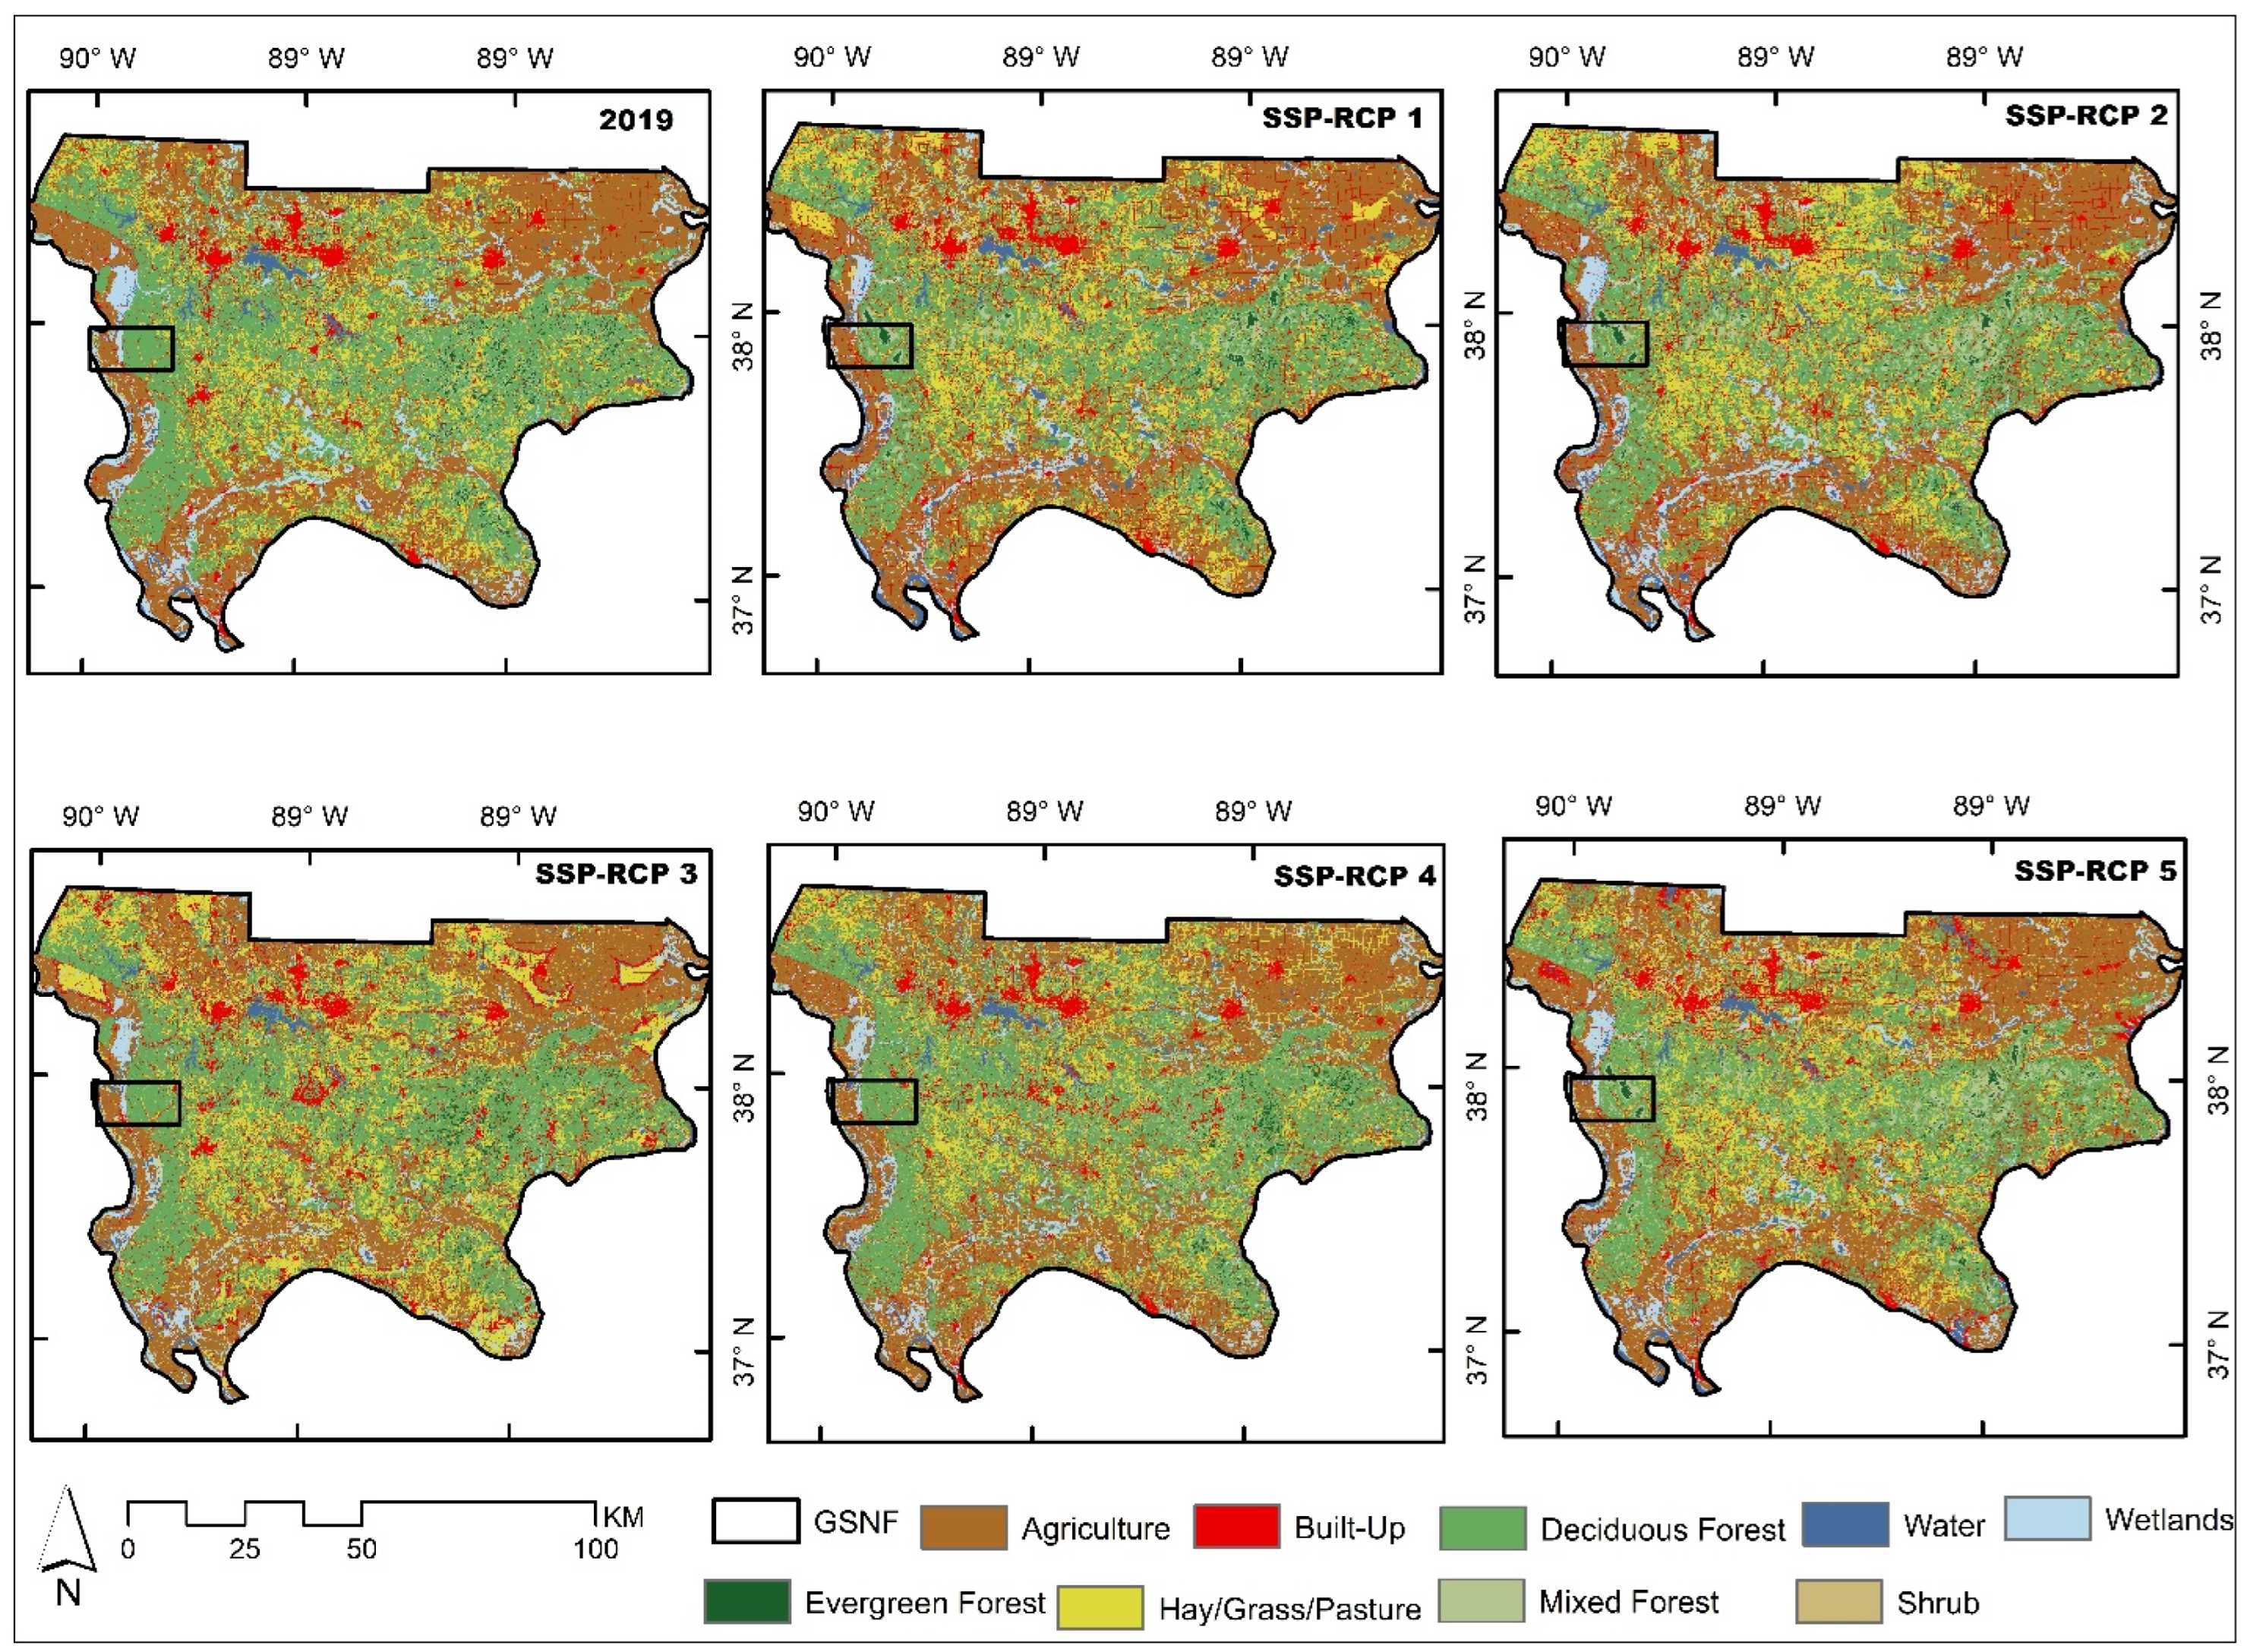
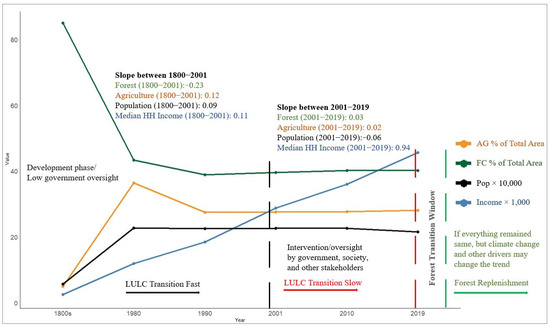
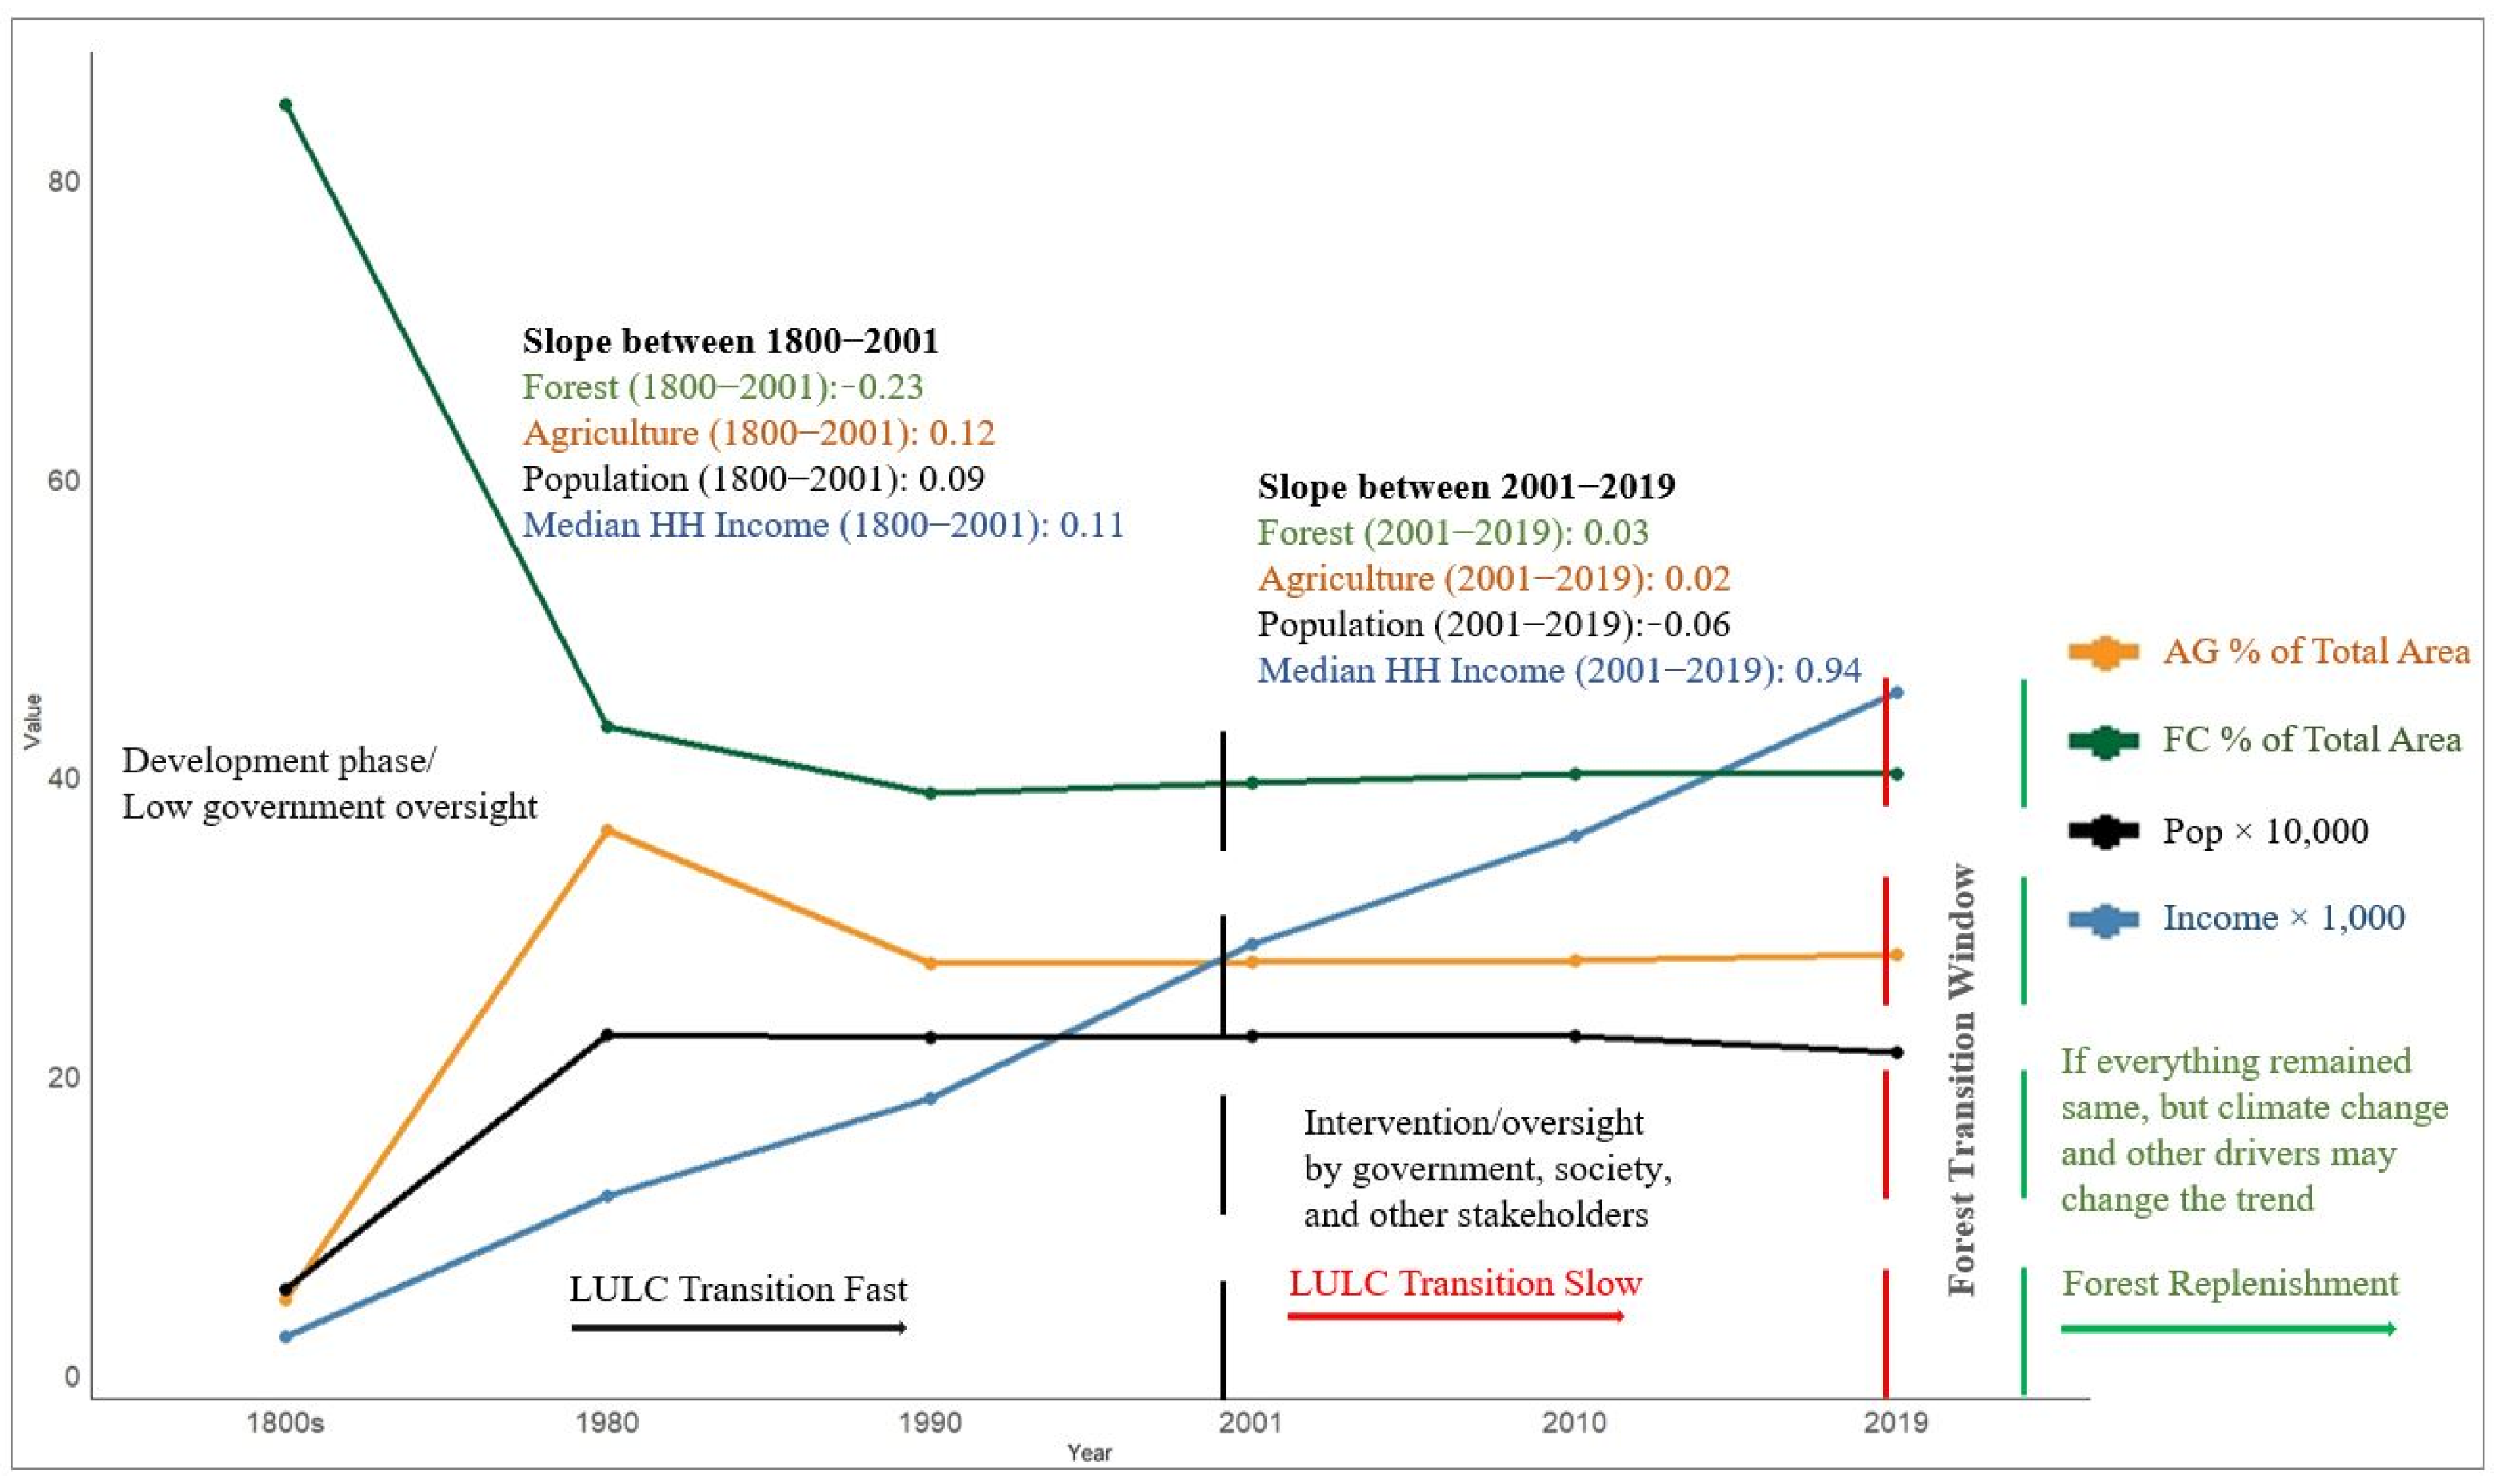

Disclaimer/Publisher’s Note: The statements, opinions and data contained in all publications are solely those of the individual author(s) and contributor(s) and not of MDPI and/or the editor(s). MDPI and/or the editor(s) disclaim responsibility for any injury to people or property resulting from any ideas, methods, instructions or products referred to in the content. |
© 2026 by the authors. Licensee MDPI, Basel, Switzerland. This article is an open access article distributed under the terms and conditions of the Creative Commons Attribution (CC BY) license.