


Highlights
What are the main findings?
- This study presents the first systematic assessment of AEF embeddings for irrigated cropland mapping.
- AEF outperforms conventional optical and SAR predictors, achieving an overall accuracy of 96.2% and a maximum Jeffries–Matusita (JM) distance of 1.58 (A29).
What are the implications of the main findings?
- AEF demonstrates stable cross-year transferability (OA > 0.87) but shows limited generalization across regions.
- A single AEF embedding (A29) provides parcel-scale separability comparable to commonly used vegetation and moisture indices.
Abstract
Accurate irrigated cropland mapping is critical for agricultural water management and food security. Existing image-based irrigation mapping workflows primarily rely on vegetation indices and synthetic aperture radar (SAR) backscatter features, which have limited capacity to characterize the temporal evolution of irrigation processes and crop growth conditions. The AlphaEarth Foundation (AEF) model developed by Google DeepMind provides compact embeddings with temporal semantic information learned via self-supervision, yet their utility for irrigation mapping has not been systematically assessed. In this study, a comprehensive assessment of AEF embeddings for irrigated cropland mapping was performed in terms of feature separability, classification performance, and spatiotemporal transferability. Experiments were conducted in two representative irrigated regions: the Guanzhong Plain in China and Kansas in the USA. Class separability of the 64 embedding dimensions was quantified using the Jeffries–Matusita (JM) distance. Then, the AEF embeddings were compared with the Sentinel feature set (Sentinel-2 bands, normalized difference vegetation index(NDVI), enhanced vegetation index(EVI), normalized difference water index(NDWI) and Sentinel-1 vertical transmit vertical receive(VV), vertical transmit horizontal receive(VH)) using K-means clustering and supervised classifiers, including Decision Tree (DT), Random Forest (RF), Gradient Boosting Decision Trees (GBDT), Support Vector Machine (SVM), and Multi-layer Perceptron (MLP). Finally, transfer experiments across 2022 and 2024 in the Guanzhong Plain and Kansas were conducted to examine cross-year and cross-region performance. The results showed that AEF embeddings consistently provide stronger class separability in both study areas, with a maximum JM distance of 1.58 (A29). Using AEF embeddings, RF achieved overall accuracies (OA) of 0.95 in the Guanzhong Plain and 0.93 in Kansas, outperforming models based on Sentinel-1/2 bands and indices. Notably, unsupervised K-means clustering on AEF embeddings yielded OA > 0.85, indicating high intrinsic separability between irrigated and rainfed croplands. Transfer experiments further demonstrate stable temporal transfer (cross-year OA > 0.87), whereas cross-region transfer is constrained by differences in irrigation regimes, crop phenology and management practices, resulting in limited spatial generalization (OA~0.3). Overall, this study demonstrates the potential of high-information-density representations from geospatial foundation models for irrigated cropland mapping and provides methodological and technical insights to support transfer learning and operational mapping over large areas.
1. Introduction
Irrigated croplands underpin agricultural productivity and food security. Their spatial distribution and seasonal dynamics directly affect regional water-allocation efficiency and the sustainability of agroecosystems. Globally, irrigated land accounts for ~20% of cropland yet contributes ~40% of total food production, with yields commonly 2–3 times higher than those of rainfed systems [1]. In China, irrigated cropland supports ~77% of grain production and ~90% of cash crops; meanwhile, agriculture accounts for 63.04% of total water withdrawals, and irrigation contributes >90% of agricultural water use. The effective irrigation water utilization coefficient is 0.58, still below values reported for many developed countries, ~0.8 [2]. Accurate and timely monitoring of irrigated cropland dynamics is therefore essential for improving water-use efficiency, optimizing irrigation management, assessing food-production potential, and informing climate-adaptation strategies [3].
Irrigation information has traditionally been derived from statistical surveys and field investigations, which are labor-intensive, costly, and spatially discontinuous. With free and open access, high revisit frequency, and complementary optical and SAR observations, Sentinel-1/2 has substantially advanced satellite-based irrigation mapping [4]. Early studies relied largely on optical time series, extracting irrigation signals from vegetation index (VI) trajectories and phenological patterns (e.g., Normalized Difference Vegetation Index (NDVI)-based thresholding and curve analysis) [5]. In agricultural remote sensing, irrigated cropland identification is closely related to crop growth cycles and seasonal dynamics, which makes temporal vegetation information a natural basis for its identification [6]. In this sense, irrigation mapping follows a broader trend in agricultural land-use/land-cover (LULC) classification, which has gradually shifted from static, single-date land-cover identification toward multi-temporal analysis frameworks that emphasize phenology and crop growth processes. Although straightforward, these approaches depend on accurate local phenology knowledge and often transfer poorly across regions with heterogeneous climate conditions, cropping calendars, and management practices. To better capture complex spatiotemporal variability, studies applied machine-learning classifiers (Random Forest (RF), Support Vector Machine (SVM)) to engineered predictors derived from Sentinel-1/2, including multispectral bands, vegetation indices, synthetic aperture radar (SAR) backscatter, and texture features [7]. This shift from threshold or rule-based analysis to data-driven classification represents an important methodological advance in agricultural remote sensing, enabling more flexible use of multi-source signals and more effective characterization of spatiotemporal variability. However, their performance is still constrained by the representativeness and robustness of imagery features and is vulnerable to domain shift that degrades cross-year and cross-region deployment. More recent multi-source fusion approaches incorporate optical/SAR observations with ancillary variables (e.g., land surface temperature) and statistical features to better characterize vegetation and soil-moisture dynamics [8]. These developments further suggest that irrigation mapping is evolving toward richer spatiotemporal characterization and tighter multi-source integration. Nevertheless, these methods largely remain within a feature-engineering paradigm, and practical generalization is often hindered by inter-sensor differences in spatial resolution, revisit frequency, and measurement principles, which complicate spatiotemporal alignment and feature integration. This limitation is particularly evident for irrigated cropland, because its identification depends on both crop phenology and irrigation practices, rather than static land-cover characteristics alone. Taken together, current irrigation-mapping approaches still face three major challenges: strong dependence on manually engineered features [9], limited robustness under cross-year and cross-region domain shift, and difficulty in consistently integrating multi-source spatiotemporal observations [10].
Recent advances in geospatial foundation models provide a new route to alleviate these limitations. Trained via self-supervision on massive unlabeled global remote-sensing archives, such models can learn compact yet semantically rich representations that transfer across tasks [11]. Google DeepMind’s AlphaEarth Foundation (AEF) model, for example, fuses multi-source time series from Sentinel-1/2 and Landsat to produce 64-dimensional embeddings and has shown strong performance across a range of geospatial tasks [12]. Early evidence suggests that even simple linear classifiers built on AEF embeddings can support efficient cropland mapping [13], indicating the potential to reduce reliance on manual feature engineering and improve transferability. Studies have begun to explore the use of AEF embeddings in agriculture, mainly in cropland extent mapping and other agricultural downstream remote-sensing tasks [14]. In contrast, a systematic assessment of AEF embeddings for irrigated cropland identification is still lacking. Compared with general cropland mapping, irrigated cropland identification is more strongly governed by crop phenology, irrigation timing, and management regimes, and therefore places higher demands on learned geospatial representations. With their compact yet semantically rich feature space, AEF embeddings have the potential to reduce reliance on handcrafted predictors while facilitating cross-task transferability. It is therefore important to examine whether AEF can provide stronger class-discriminative power than conventional predictors for irrigated cropland mapping. This is particularly relevant for a task that requires robust feature representation, resilience to domain shift, and coherent integration of multi-source spatiotemporal observations [15]. However, it remains unclear whether AEF-style representations are intrinsically discriminative for irrigated cropland identification, whether they provide consistent gains across different classifiers, and whether they generalize robustly under cross-year and cross-region transfer settings.
To address these questions, we propose a systematic evaluation framework that (1) quantifies irrigated–rainfed separability in the AEF embedding space; (2) benchmarks AEF embeddings against Sentinel-derived bands and indices across multiple classifiers; (3) evaluates spatiotemporal generalization under cross-year and cross-region transfer. This study provides empirical evidence on the value of geospatial foundation models for agricultural remote sensing and their potential for operational irrigated cropland mapping.
2. Study Area and Data
2.1. Study Area
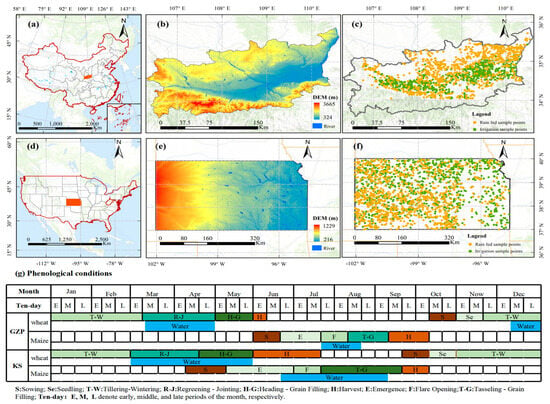
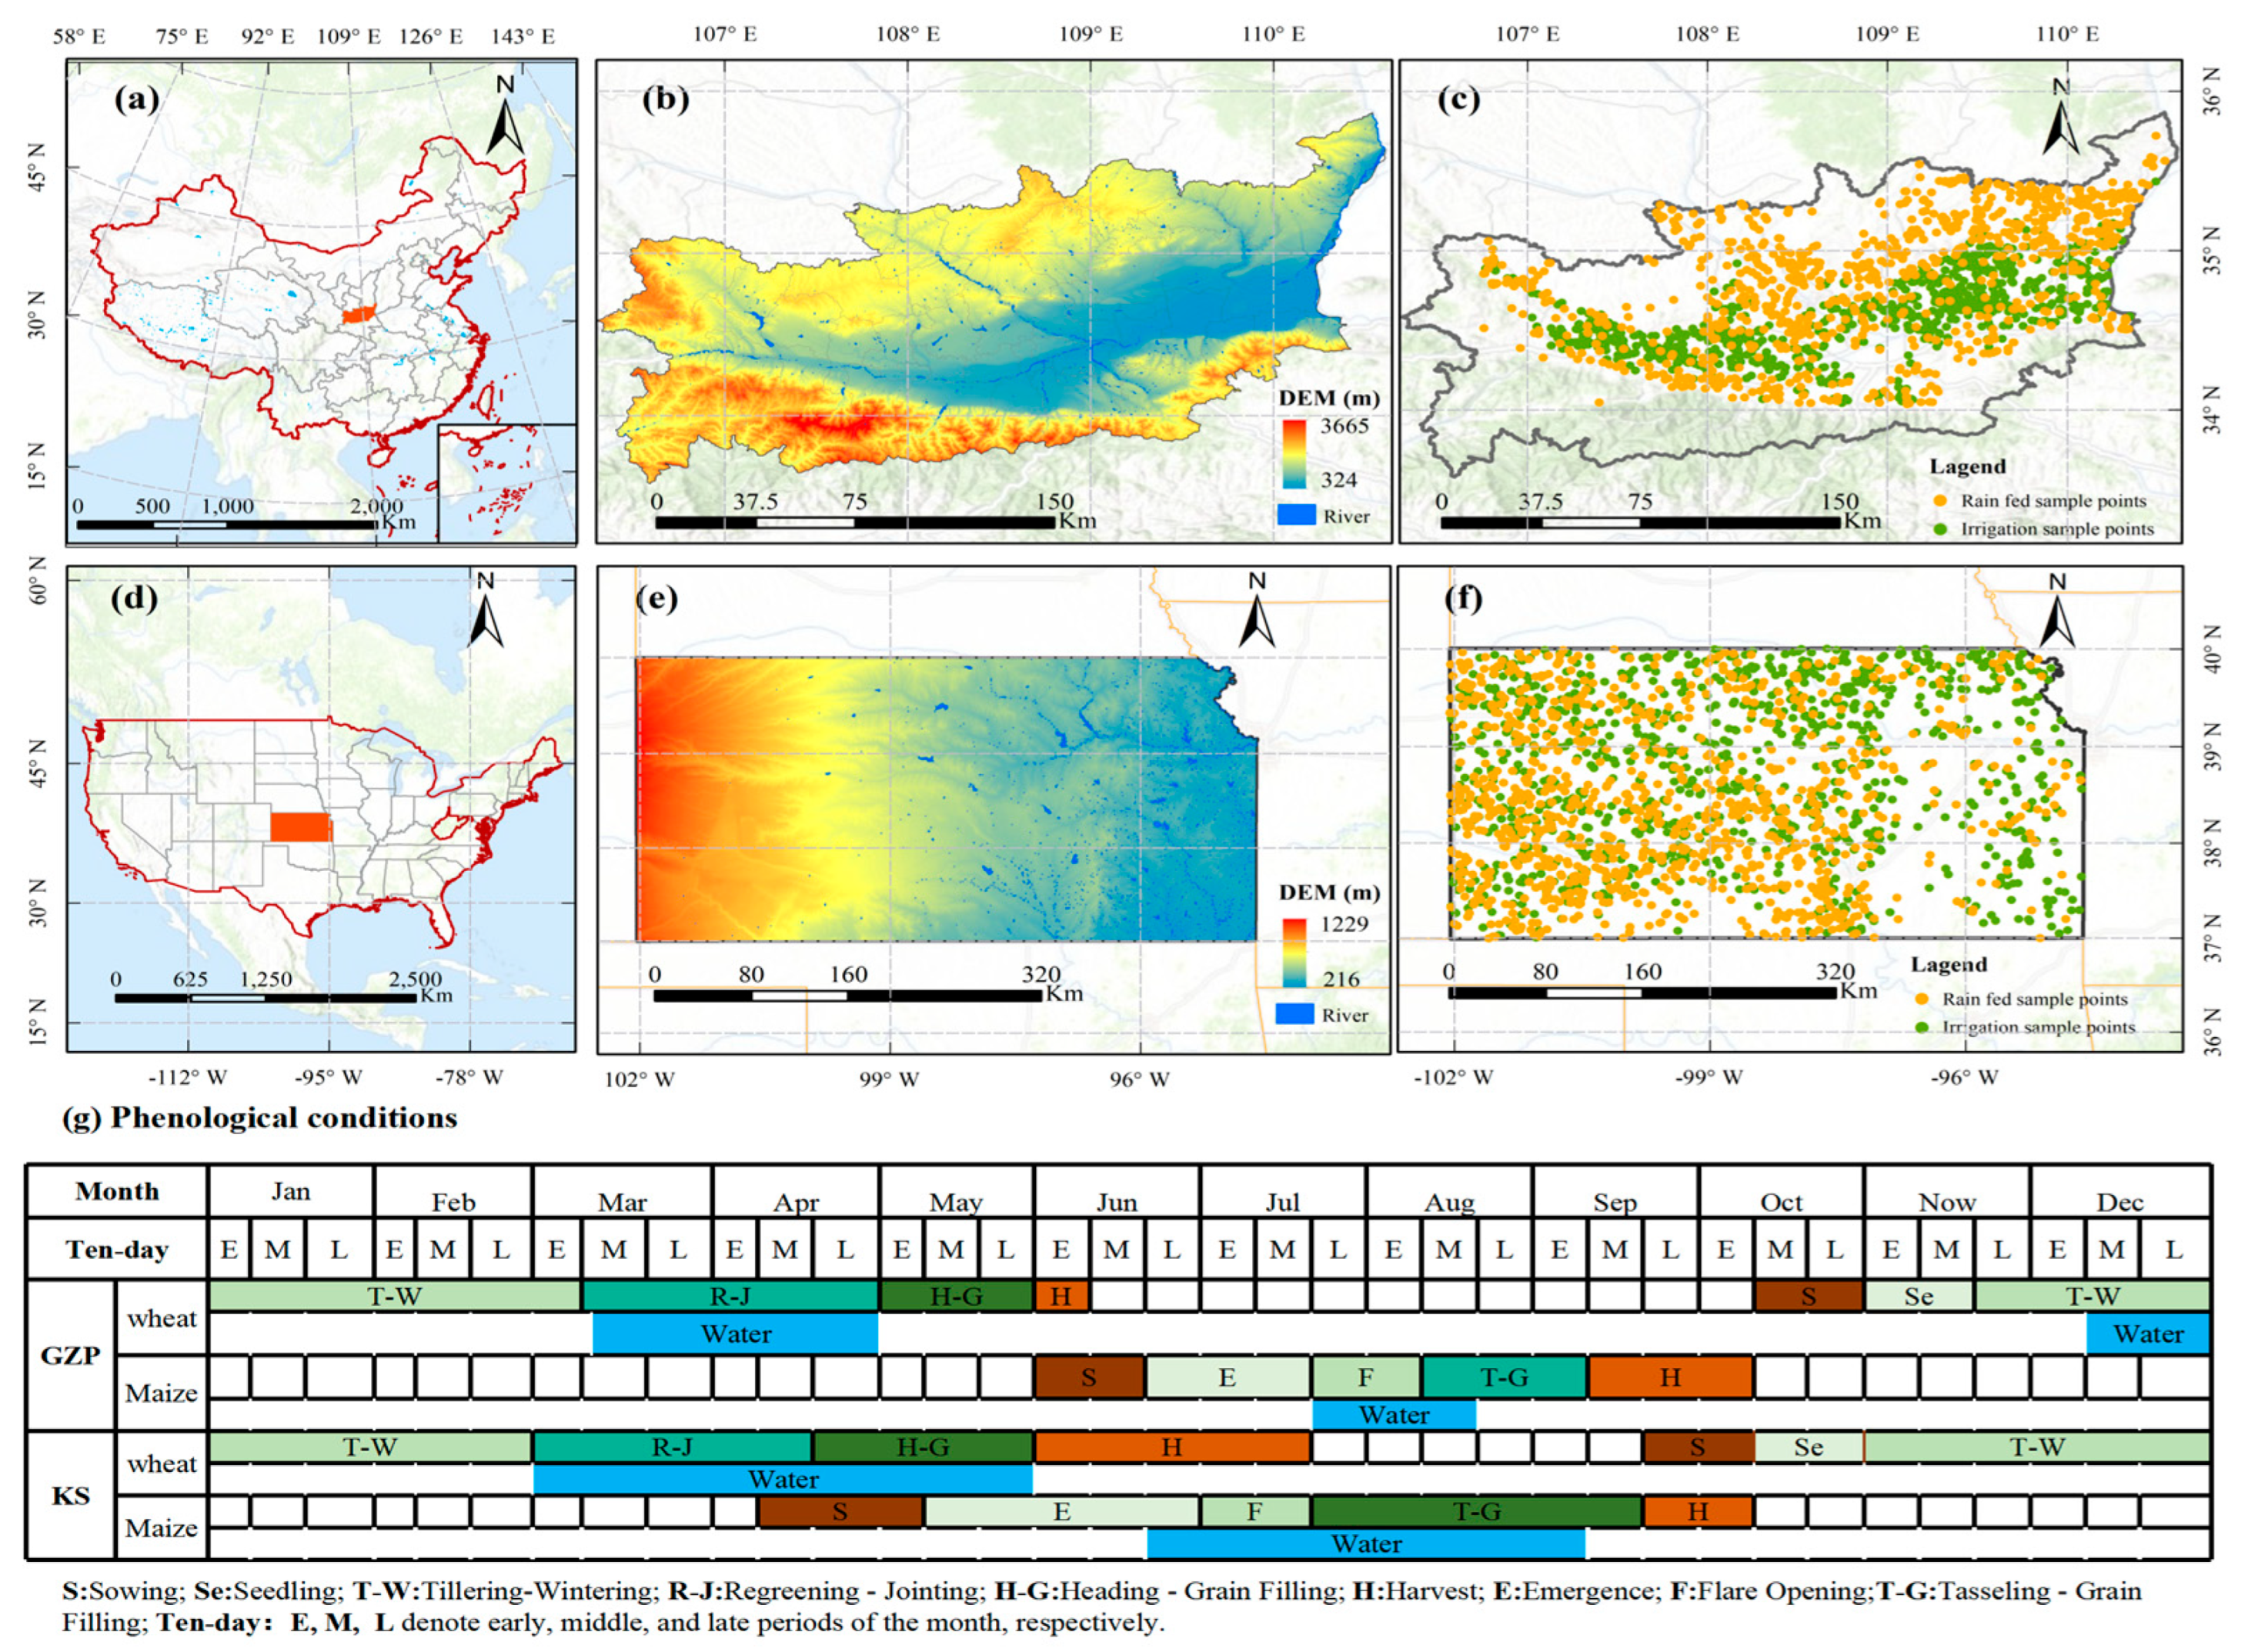
The Guanzhong Plain (GZP) in China was selected as the primary study area, while Kansas (KS) in the USA was used as an independent validation site to evaluate the spatial transferability of the proposed method. The GZP, located in central Shaanxi Province (34°00′–35°30′N, 107°30′–109°30′E; Figure 1a), is characterized by a warm temperate, semi-humid monsoon climate and a west–east descending terrain with elevations ranging from 350 to 700 m (Figure 1b) [16]. Owing to highly seasonal precipitation, the region is prone to spring droughts and relies on a conjunctive irrigation system using both surface water and groundwater. The irrigation regime exhibits a distinct two-peak seasonal pattern, with intensive irrigation during the overwintering stage (December) and the greening-jointing stage (March–April), primarily through traditional flood irrigation (Figure 1g).
Figure 1.
Study areas, sampling design, and winter wheat phenology: (a–c) Guanzhong Plain: location, DEM, sampling points, and key phenological stages and irrigation schedule. (d–f) Kansas: location, DEM, sampling points, and key phenological stages and irrigation schedule. (g) schematic illustration of crop growth stages.
Kansas (38°–40°N, 96°–100°W; Figure 1d) is located in the North American Great Plains and features a temperate continental, semi-arid climate and relatively flat topography with elevations ranging from 400 to 800 m (Figure 1e). Irrigation shows a pronounced west–east gradient, transitioning from groundwater-dominated irrigation in the west to predominantly rainfed systems in the east [17]. In contrast to the GZP, irrigation in Kansas follows a single-peak seasonal schedule concentrated during the growing season (approximately March–August), with minimal irrigation activity in winter (Figure 1g). More than 90% of irrigated cropland uses center-pivot systems [18], resulting in relatively homogeneous field geometry and a strong contrast to the fragmented irrigation landscape in the GZP.
2.2. Imagery Data
2.2.1. AEF Embedding Composites
AEF is a geospatial foundation model developed by Google DeepMind under a representation learning paradigm that transforms high-dimensional remote sensing observations into compact, semantically meaningful embeddings [19]. It employs a self-supervised Spatio-Temporal Precision encoder to process multi-sensor time series from Sentinel-1/2 and Landsat and is trained within a teacher–student framework with an additional text-alignment network. The model is trained by minimizing four loss terms (reconstruction, consistency, text-contrastive and batch-uniformity losses) using diverse training targets, including Copernicus Digital Elevation Model (DEM), National Land Cover Database, ERA5-Land climate variables and produces 64-dimensional embedding vectors [9]. By learning globally consistent surface representations across space and time, AEF is able to compress terabyte-scale imagery into gigabyte-scale feature libraries (≈16:1) while preserving discriminative information for downstream mapping tasks.
In this study, AEF embeddings available in Google Earth Engine (GEE) (dataset ID: GOOGLE/ALPHAEARTH/FEATURES/V1) were used as the primary input data. The 2022/2024 annual composite was retrieved at a 10 m spatial resolution, in which each pixel was represented by a 64-dimensional embedding vector (A0–A63). The embeddings were used in two ways: (1) the Jeffries–Matusita (JM) distance was computed to quantify class separability between irrigated versus non-irrigated classes for each embedding dimension; and (2) the embeddings were used as inputs to machine learning models and benchmarked against Sentinel-derived features.
2.2.2. Sentinel Imagery Data
Multi-temporal Sentinel-1 and Sentinel-2 data for 2022–2024 were accessed and processed in GEE [20]. SAR observations were derived from Sentinel-1 Ground Range Detected products acquired in Interferometric Wide mode using the VV and VH backscatter channels. The Sentinel-1 data had a spatial resolution of 10 m and an approximately 6-day revisit interval. The imagery was preprocessed using a standard workflow, including orbit refinement, border noise removal, thermal noise removal, radiometric calibration, and Range-Doppler terrain correction [21].
For optical observations, Sentinel-2 Level-2A surface reflectance products were used. A total of 11 spectral bands were selected, whereas the atmospheric-sensitive bands (B9 and B10) were excluded. To ensure spatial consistency, the 20 m bands were resampled to 10 m. Cloud masking was performed using the QA60 bitmask [22]. Three spectral indices (NDVI, Normalized Difference Water Index (NDWI), and Enhanced Vegetation Index (EVI)) were derived to characterize canopy vigor and moisture status. Finally, a multi-dimensional feature space comprising 16 variables (Table 1) was constructed to facilitate irrigation mapping, using year-long Sentinel-2 time-series observations in 2022 composited at 15-day intervals to ensure temporal comparability with the annual AEF embeddings.
Table 1.
Sentinel-derived features used for irrigation-related monitoring.
2.3. Training and Validation Samples
Training and validation samples were generated through visual interpretation supported by multiple auxiliary data sources. A consistent workflow was adopted, including (1) cropland masking to constrain candidate sampling areas; (2) irrigation status interpretation using high-resolution imagery; and (3) label verification using time-series satellite images; (4) stratified random splitting of samples into training (70%) and testing (30%) sets.
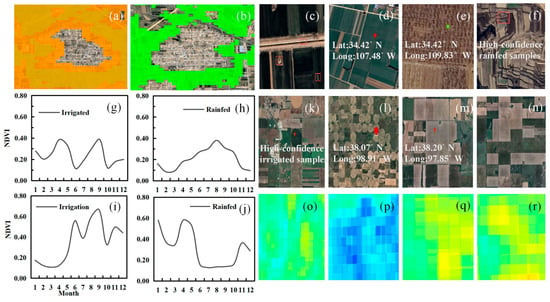
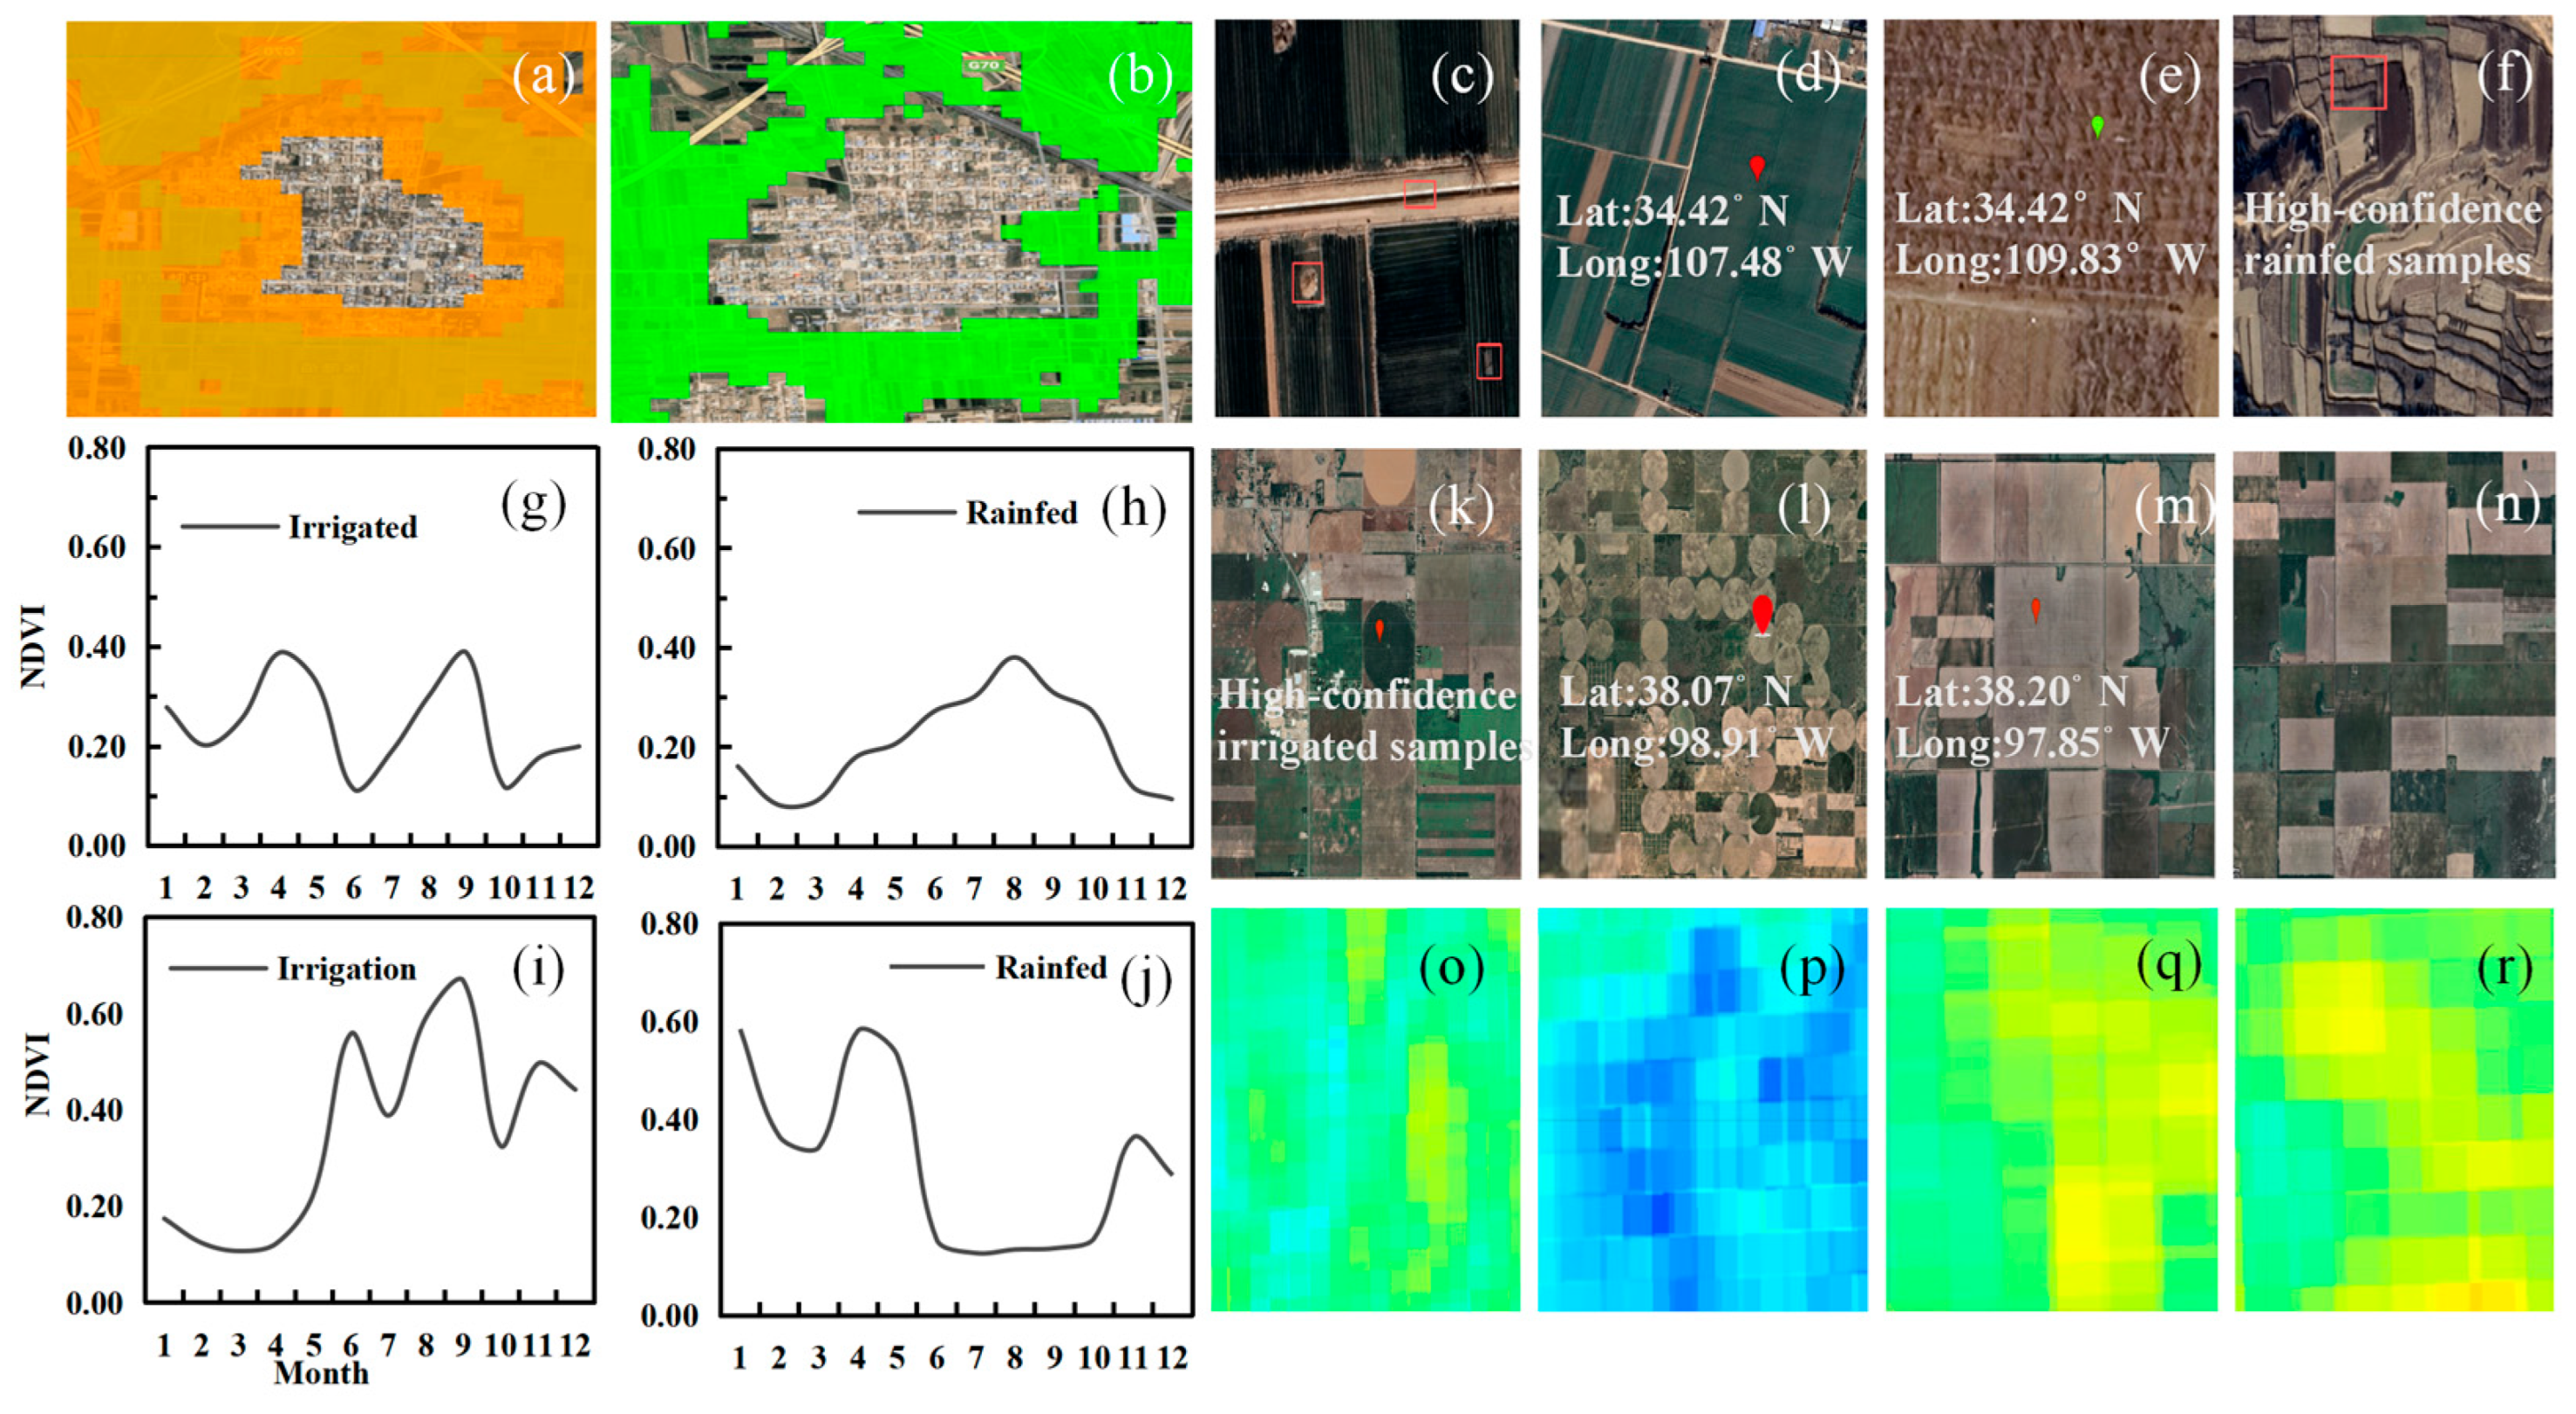
Specifically, an initial cropland mask was constructed from reference products and denoised to obtain a spatially coherent cropland extent (Figure 2a,b), thereby constraining the candidate sampling space before subsequent interpretation. Irrigation status was then preliminarily assigned by interpreting irrigation-related infrastructure and field patterns in high-resolution imagery (e.g., canals, field ridges, and wells; Figure 2c–f,k–n). Finally, sample labels were verified using Sentinel-2 NDVI seasonal trajectories, and Sentinel-1 VV temporal responses indicative of irrigation-driven soil-moisture changes were used as complementary evidence (Figure 2g,h,o–r; Kansas examples in Figure 2i,j). Samples with insufficient evidence or clear conflicts among multiple sources were excluded from the final sample set.
Figure 2.
Sample generation workflow and interpretation evidence: (a) initial cropland mask derived from the reference product; (b) denoised cropland extent; (c–f) high-resolution interpretation examples of field plots with different irrigation types in the Guanzhong Plain; (g,h) examples of NDVI temporal profiles in the Guanzhong Plain; (i,j) examples of NDVI temporal profiles in Kansas; (k–n) high-resolution interpretation examples of field plots with different irrigation types in Kansas; (o–r) VV backscatter time-series variations in the Guanzhong Plain.
Guanzhong Plain samples were generated based on the Dynamic World (DW) v1 land cover product in GEE, which was used solely to construct the initial cropland mask for candidate sample selection. Pixels labeled as “crops” (value = 4) were extracted to produce an initial 10 m cropland mask, which was further denoised using connected-component filtering and morphological operations to reduce fragmentation and non-cropland noise (Figure 2a,b). Visual interpretation was conducted within the denoised cropland extent to preliminarily assign irrigation status using high-resolution imagery (Figure 2c–f). The labels were then verified and refined by examining NDVI seasonal trajectories during key phenological stages (Figure 2g,h) and VV backscatter time series (Figure 2o–r). In total, 1000 irrigated and 1000 rainfed samples were collected in each of 2022 and 2024 (Figure 1c).
In Kansas, the USDA Cropland Data Layer (CDL) was used to delineate cropland candidates and to identify preliminary irrigated and non-irrigated samples. Major crop classes were used to construct a cropland mask, and CDL irrigation class codes (101–124) were used to separate irrigated from non-irrigated cropland. To mitigate local labeling errors in CDL, candidate samples were visually cross-checked using the same-year Sentinel-2 imagery and NDVI time series, and obvious inconsistencies were corrected or removed (Figure 2i–n). A total of 1000 irrigated and 1000 rainfed samples were collected for 2022 (Figure 1f).
3. Methods
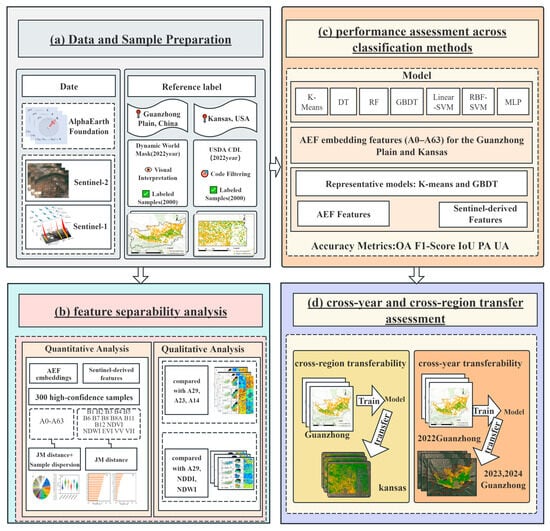
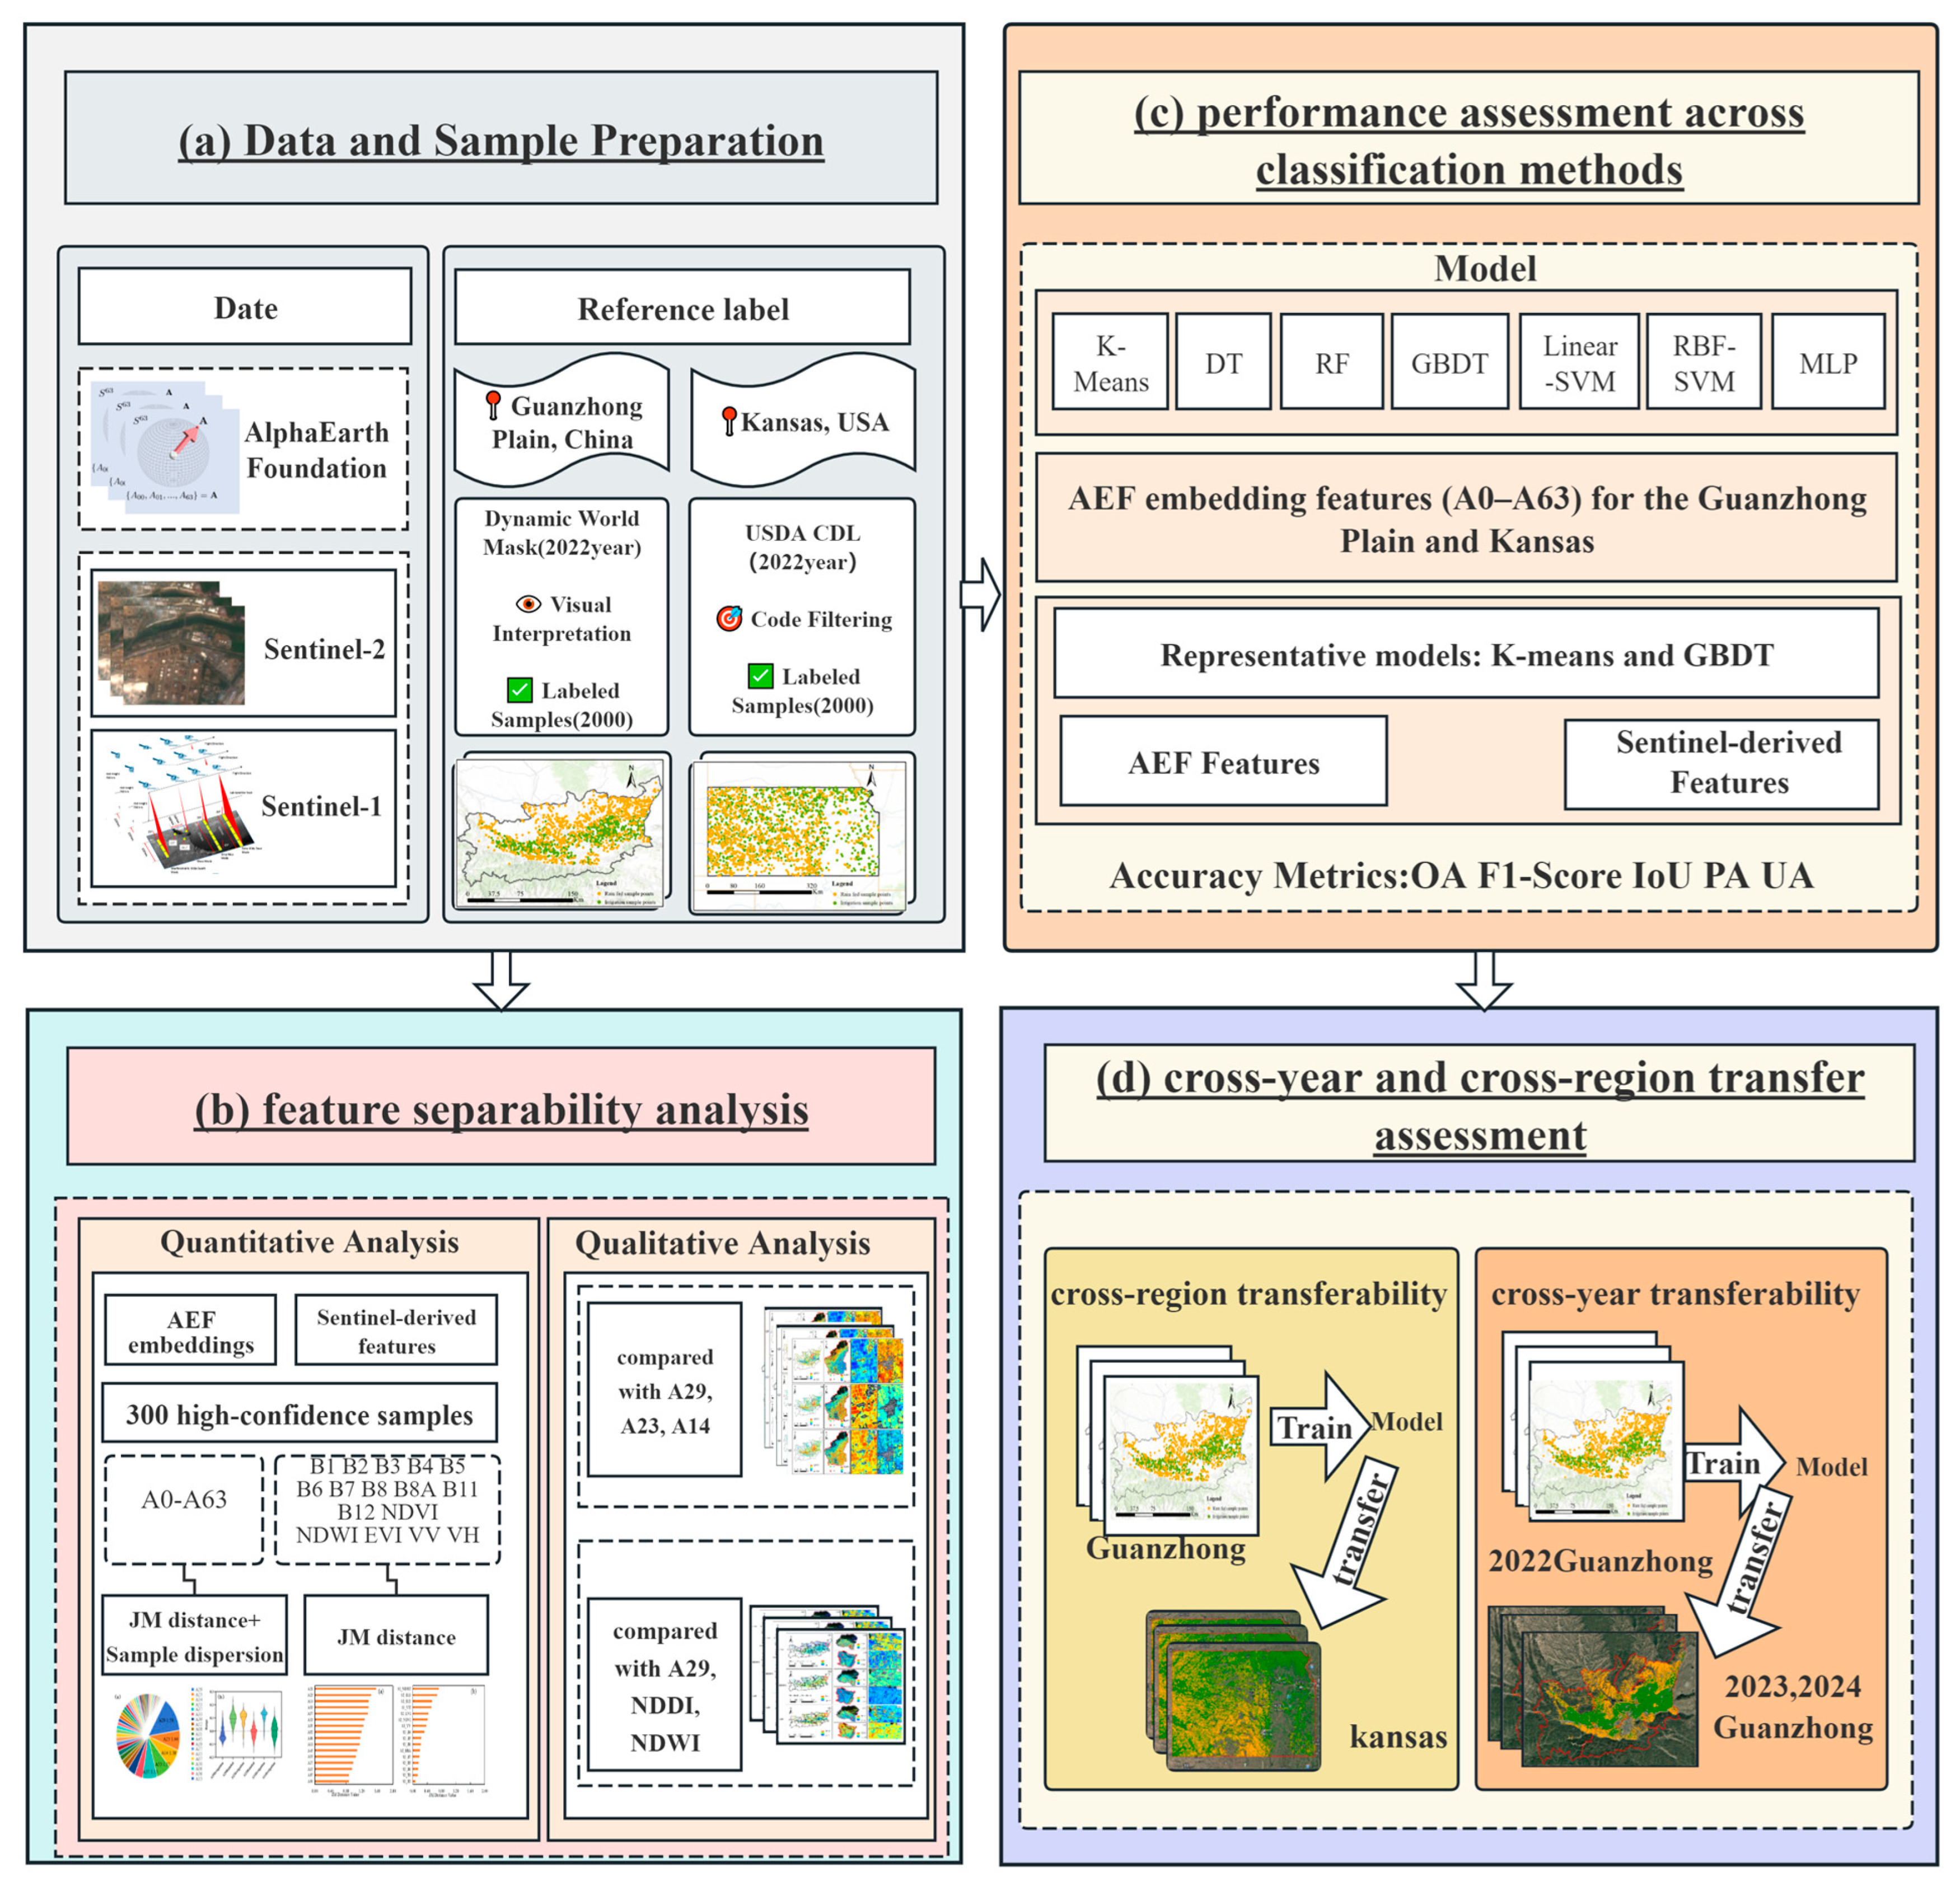
A systematic framework was established to evaluate the utility of AEF embeddings for irrigated cropland mapping, including (a) data and sample preparation, (b) feature separability analysis, (c) performance assessment across classification methods, and (d) cross-year and cross-region transfer assessment (Figure 3). First, AEF embeddings were paired with reference labels for the Guanzhong Plain and Kansas, and samples were partitioned into training and testing sets. Second, feature separability between irrigated and rainfed classes was quantified using the JM distance for each AEF embedding dimension (A0–A63) as well as for the Sentinel-derived features, and informative dimensions were identified. Third, under controlled experimental settings, AEF embeddings were used as inputs to multiple classifiers and benchmarked against conventional Sentinel-derived optical and SAR features to evaluate classification performance, with this assessment replicated for the Kansas region to examine the classification performance of AEF embeddings across different geographic areas. Finally, cross-year and cross-region experiments were conducted to assess the robustness and transferability of AEF-based features.
Figure 3.
Workflow in this study.
3.1. JM Distance-Based Separability Analysis of AEF Embeddings
Class separability of AEF embeddings for irrigated cropland mapping was assessed using the JM distance. To obtain a consistent separability estimate for each embedding dimension, 300 high-confidence samples were selected for each class from the labeled dataset using stratified sampling. For each of the 64 AEF embedding dimensions (A0–A63) and the 16-dimensional Sentinel features, the JM distance between the irrigated and rainfed classes was computed independently. To support interpretation, the top three dimensions ranked by JM distance were mapped as single-dimension spatial distributions over the cropland extent of the study area. In addition, based on the JM-based ranking, the top-ranked AEF embedding dimension was selected as a representative variable for comparison with conventional Sentinel-derived indices. Specifically, it was compared with EVI and NDWI to examine differences in how irrigation-related spatial contrast and structure are expressed.
The JM distance is derived from the Bhattacharyya distance (B) and measures the separability between two classes in a feature space [27]. Under the assumption that both classes follow normal distributions, the calculation is performed as follows:
where B represents the Bhattacharyya distance.
3.2. Classification Performance Assessment of AEF Embeddings
To systematically evaluate the effectiveness, stability, and cross-model applicability of AEF embeddings for irrigated cropland mapping, a set of methods spanning unsupervised clustering and supervised classification was employed, with the aim of assessing whether their discriminative advantage can be consistently maintained across different learning methods. The evaluated methods include K-means clustering, decision tree (DT), random forest (RF), gradient boosting decision trees (GBDT), linear-kernel support vector machine (Linear-SVM), radial basis function kernel support vector machine (RBF-SVM), and a multi-layer perceptron (MLP). These methods enabled the assessment of intrinsic separability, linear separability, nonlinear discrimination capability, and high-order feature interactions of the AEF embeddings under two diverse regional conditions. Using the same sample set and identical model configurations, a controlled comparison was further conducted between AEF embeddings and conventional Sentinel-derived feature sets (Sentinel-2 optical and Sentinel-1 SAR) to quantify their relative performance for irrigated cropland mapping. Because the two feature sets were generated through different temporal aggregation and preprocessing pipelines, the comparison was designed to assess their relative discriminative effectiveness under the same classification framework.
3.2.1. K-Means Clustering
K-means is an unsupervised clustering algorithm that partitions samples by minimizing within-cluster variance [28]. In this study, K-means clustering was applied to the 64-dimensional AEF embeddings of cropland pixels, with the number of clusters set to two, corresponding to irrigated and rainfed classes. After clustering, cluster semantics were assigned by computing Euclidean distances between each cluster center and class centers derived from reference samples; the cluster closer to the irrigated class center was labeled as “irrigated”, and the other as “rainfed” [29]. K-means clustering was implemented in GEE (https://earthengine.google.com/, accessed on 20 March 2026) using ee.Clusterer.wekaKMeans.
3.2.2. Decision Tree
DT is a rule-based, tree-structured classifier that recursively partitions the feature space by selecting splits that increase node purity until predefined stopping criteria are met [30]. DT provides intuitive interpretability and computational efficiency. In this study, DT was implemented in GEE using ee.Classifier.smileCart, with the maximum number of nodes set to 100 and the minimum leaf population set to 10.
3.2.3. Random Forest
RF is an ensemble learning method that constructs multiple decision trees and aggregates their predictions to reduce overfitting and improve classification robustness [31]. RF is well suited for high-dimensional feature spaces and does not require explicit feature scaling. In this study, RF was implemented using ee.Classifier.smileRandomForest, with the number of trees set to 300, the number of variables considered at each split set to 64, the minimum leaf population set to 1, and the bag fraction set to 1.0. A fixed random seed of 42 was used to ensure reproducibility.
3.2.4. Gradient Boosting Decision Trees
GBDT is a forward stagewise ensemble learning method that iteratively trains weak learners, typically shallow decision trees, to progressively reduce prediction errors [32]. GBDT can capture complex nonlinear relationships and is, therefore, often used as a competitive baseline for supervised classification. In this study, GBDT was implemented using ee.Classifier.smileGradientTreeBoost, with the number of trees set to 300, the learning rate (shrinkage) set to 0.01, the sampling rate set to 1.0, and the maximum number of nodes set to 200. A fixed random seed of 42 was used to ensure reproducibility.
3.2.5. Linear-Kernel Support Vector Machine
Linear-SVM is a margin-based linear classifier that learns a linear decision boundary by maximizing the margin to the closest constrained samples, referred to as support vectors [33]. In this study, Linear-SVM was employed as a baseline model to assess the linear separability of the AEF embeddings. The classifier was implemented in GEE using ee.Classifier.libsvm with a linear kernel (kernel Type = ‘LINEAR’). The regularization parameter was set to cost = 1.0, and the shrinking heuristic was enabled (shrinking = true) to improve computational efficiency.
3.2.6. Radial Basis Function Kernel Support Vector Machine
RBF-SVM introduces nonlinear decision boundaries by replacing the inner product with a radial basis function kernel, which implicitly maps samples into a higher-dimensional space to model more complex class boundaries [33]. In this study, RBF-SVM was used to evaluate the contribution of nonlinear decision boundaries to irrigated cropland classification based on AEF embeddings. The classifier was implemented in GEE using ee.Classifier.libsvm with a radial basis function kernel (kernel Type = ‘RBF’). The penalty parameter was set to cost = 10.0, the kernel width parameter was set to gamma = 0.1, and the shrinking heuristic was enabled (shrinking = true).
3.2.7. Multi-Layer Perceptron
MLP is a feedforward neural network that learns complex feature representations through nonlinear hidden layers and is capable of automatically capturing high-order interactions among features [34]. In this study, a single-hidden-layer MLP model was constructed using TensorFlow/Keras on Google Colab (https://colab.research.google.com/, accessed on 20 March 2026). The architecture consisted of an input layer with 64 neurons, a hidden layer with 32 neurons, and an output layer with one neuron using a sigmoid activation function. The Adam optimizer was employed with a learning rate of 0.001, and binary cross-entropy was used as the loss function. The batch size was set to 32, the number of training epochs to 100, and early stopping was applied to prevent overfitting (patience = 10).
3.3. Cross-Year and Cross-Region Transfer Performance Assessment
To assess the cross-year and cross-region consistency of AEF embeddings and their implications for model transferability, transfer experiments were conducted using AEF composite features from the Guanzhong Plain and Kansas for the years 2022, 2023 and 2024. For cross-year transfer, the model was trained using samples from the Guanzhong Plain in 2022 and then directly applied to the 2023 and 2024 datasets from the same region without retraining or hyperparameter adjustment, thereby isolating performance variations attributable to interannual differences; For cross-region transfer, the model trained with 2022 samples from the Guanzhong Plain was used as the source model and directly applied to the 2022 Kansas dataset, again without retraining or parameter tuning, to evaluate the cross-region transferability of AEF features under different geographic and agricultural conditions.
3.4. Accuracy Assessment Metrics
Performance was assessed using overall accuracy (OA), F1 score, intersection over union (IoU), producer’s accuracy (PA; recall), and user’s accuracy (UA; precision). Metrics were computed from the confusion matrix following standard definitions [35]:
where TP, TN, FP, and FN represent true positives, true negatives, false positives, and false negatives, respectively; the irrigated class was treated as the positive class.
4. Results
4.1. Feature Separability of AEF Embeddings
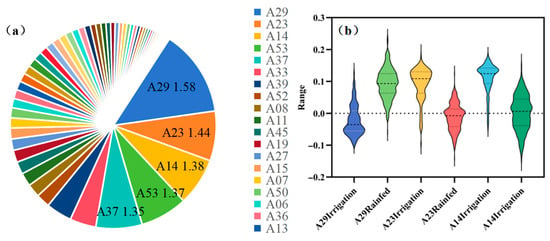
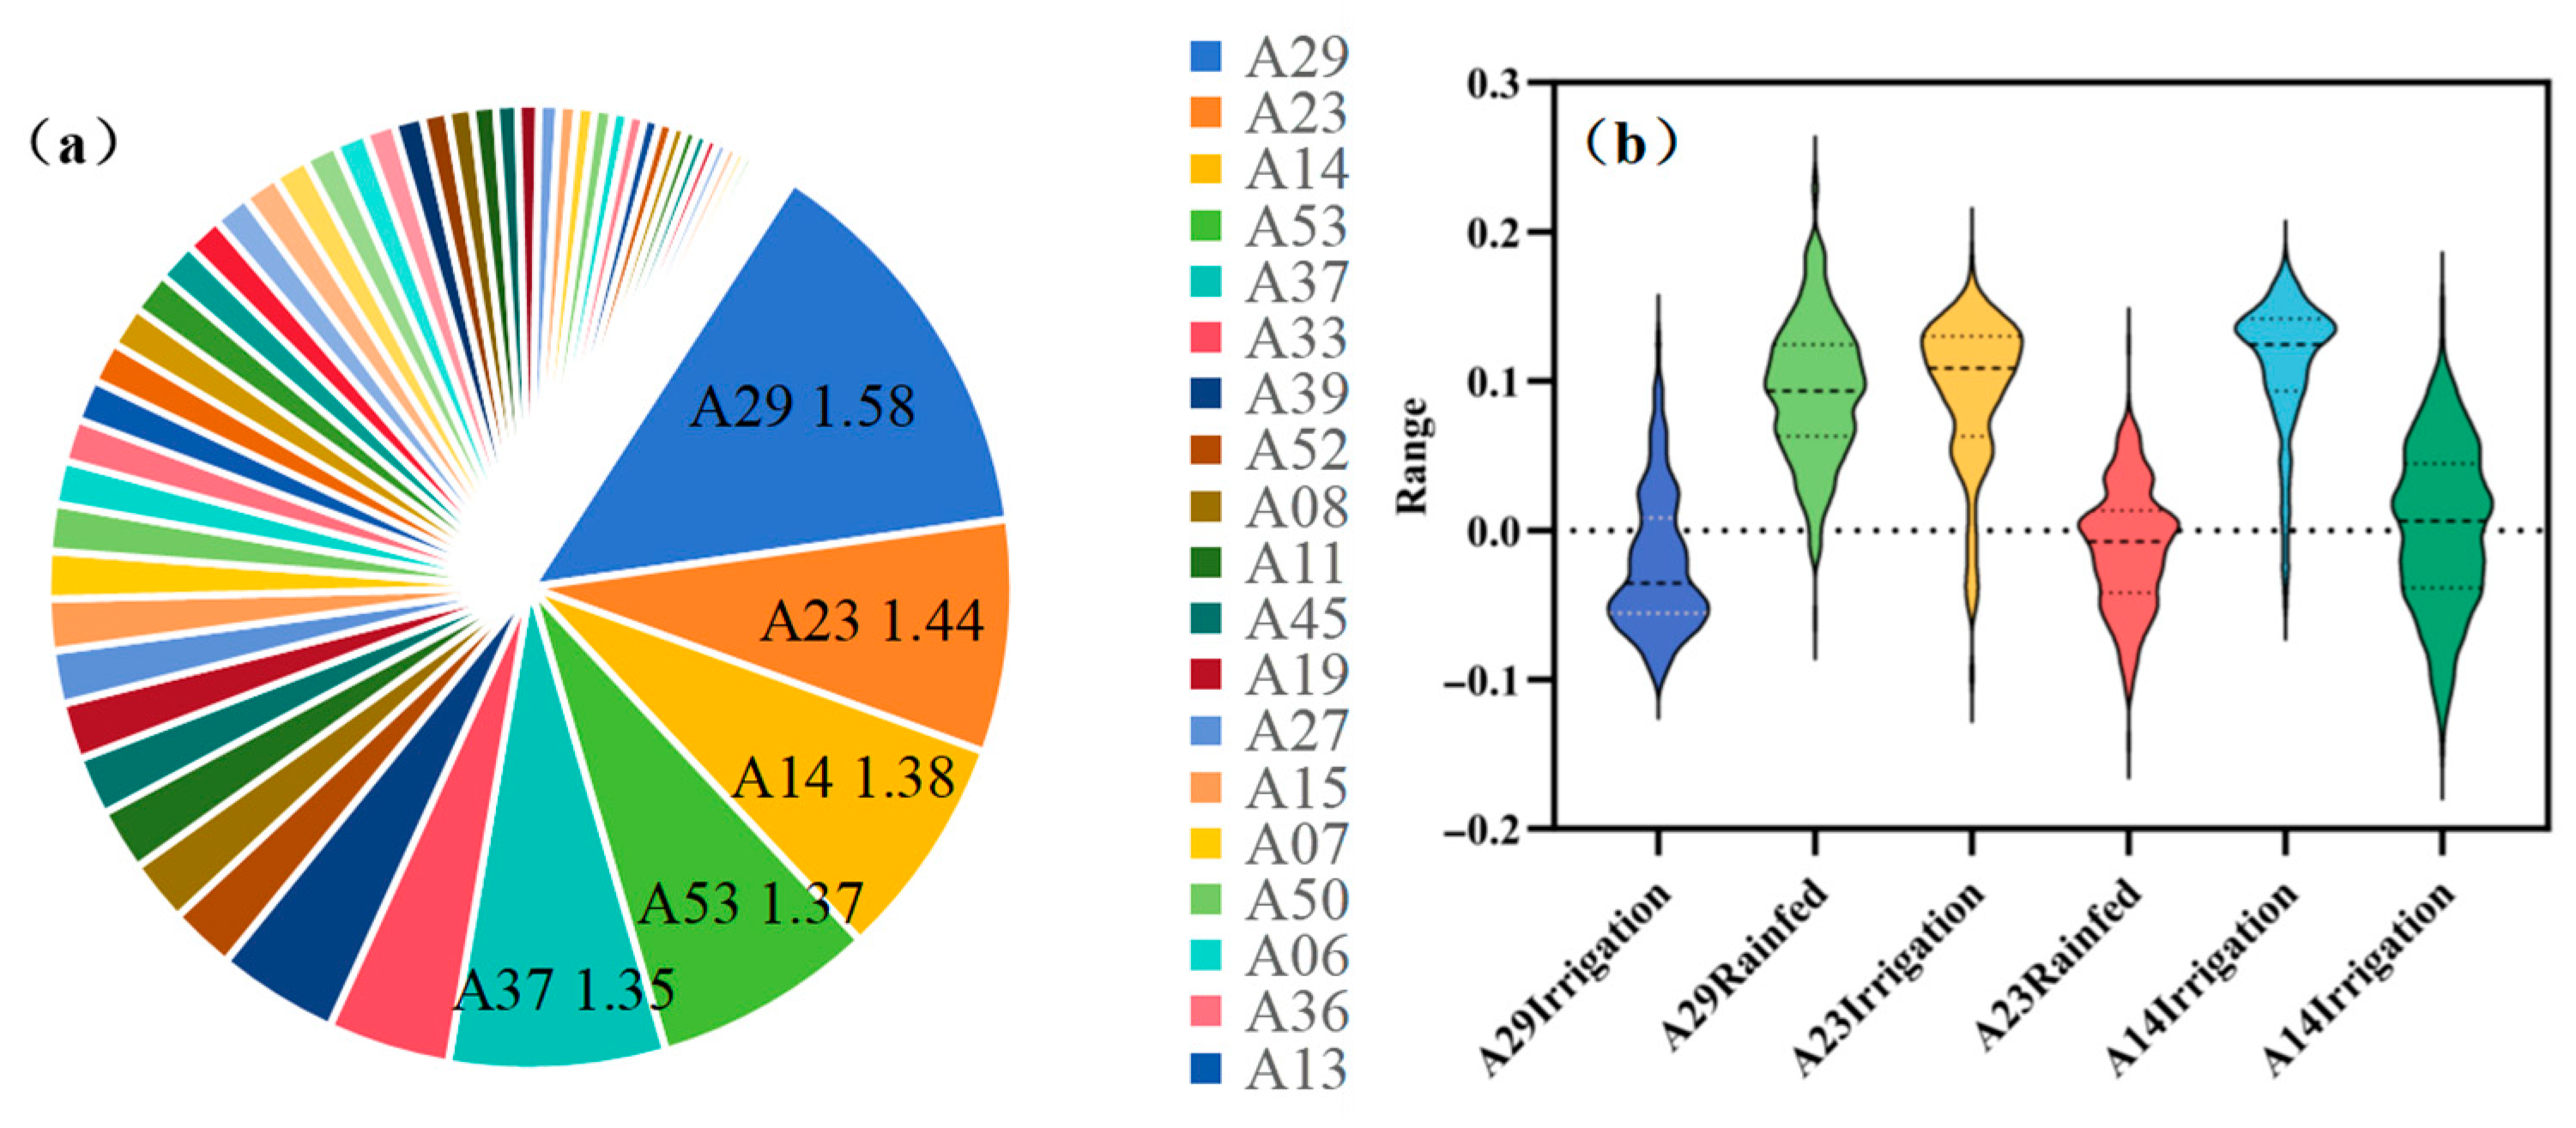
To quantitatively evaluate the intrinsic discriminative capability of AEF embedding features between irrigated and rainfed croplands, the JM distance was computed for all 64 AEF embedding dimensions (Figure 4). Among the AEF embeddings, the top three features ranked by JM distance are A29, A23, and A14, all exhibiting JM distance values greater than 1.3. Among them, A29 shows superior class separability, with the highest JM distance of 1.58. On this basis, the top three AEF embedding dimensions were further analyzed in terms of their value distributions (Figure 4b). The results show that significant differences exist in the value distributions of these features between irrigated and rainfed samples. For irrigated samples, the values of A29 are concentrated within a relatively narrow negative range, whereas A23 and A14 exhibit positive median values. For rainfed samples, A14 shows more pronounced negative fluctuations, with its distribution extending to −0.2, whereas A29 is the only feature that exhibits a relatively concentrated positive value distribution within the rainfed samples. These results indicate that, compared with A23 and A14, A29 forms a more stable and symmetric numerical separation between irrigated and rainfed croplands.
Figure 4.
Feature separability analysis based on the JM distance; (a) shows the JM distances of the 64 AEF embedding dimensions; (b) illustrates the value distributions of high-confidence samples for the top three AEF embedding dimensions (A29, A23, and A14) in irrigated and rainfed cropland.
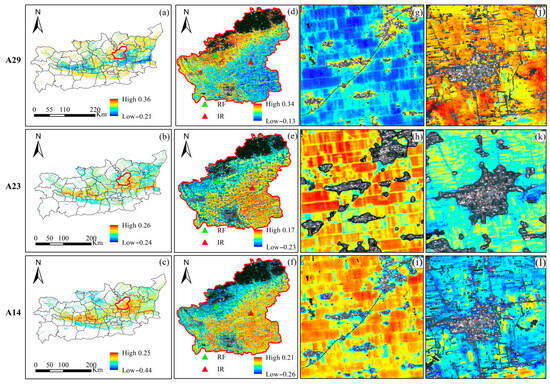
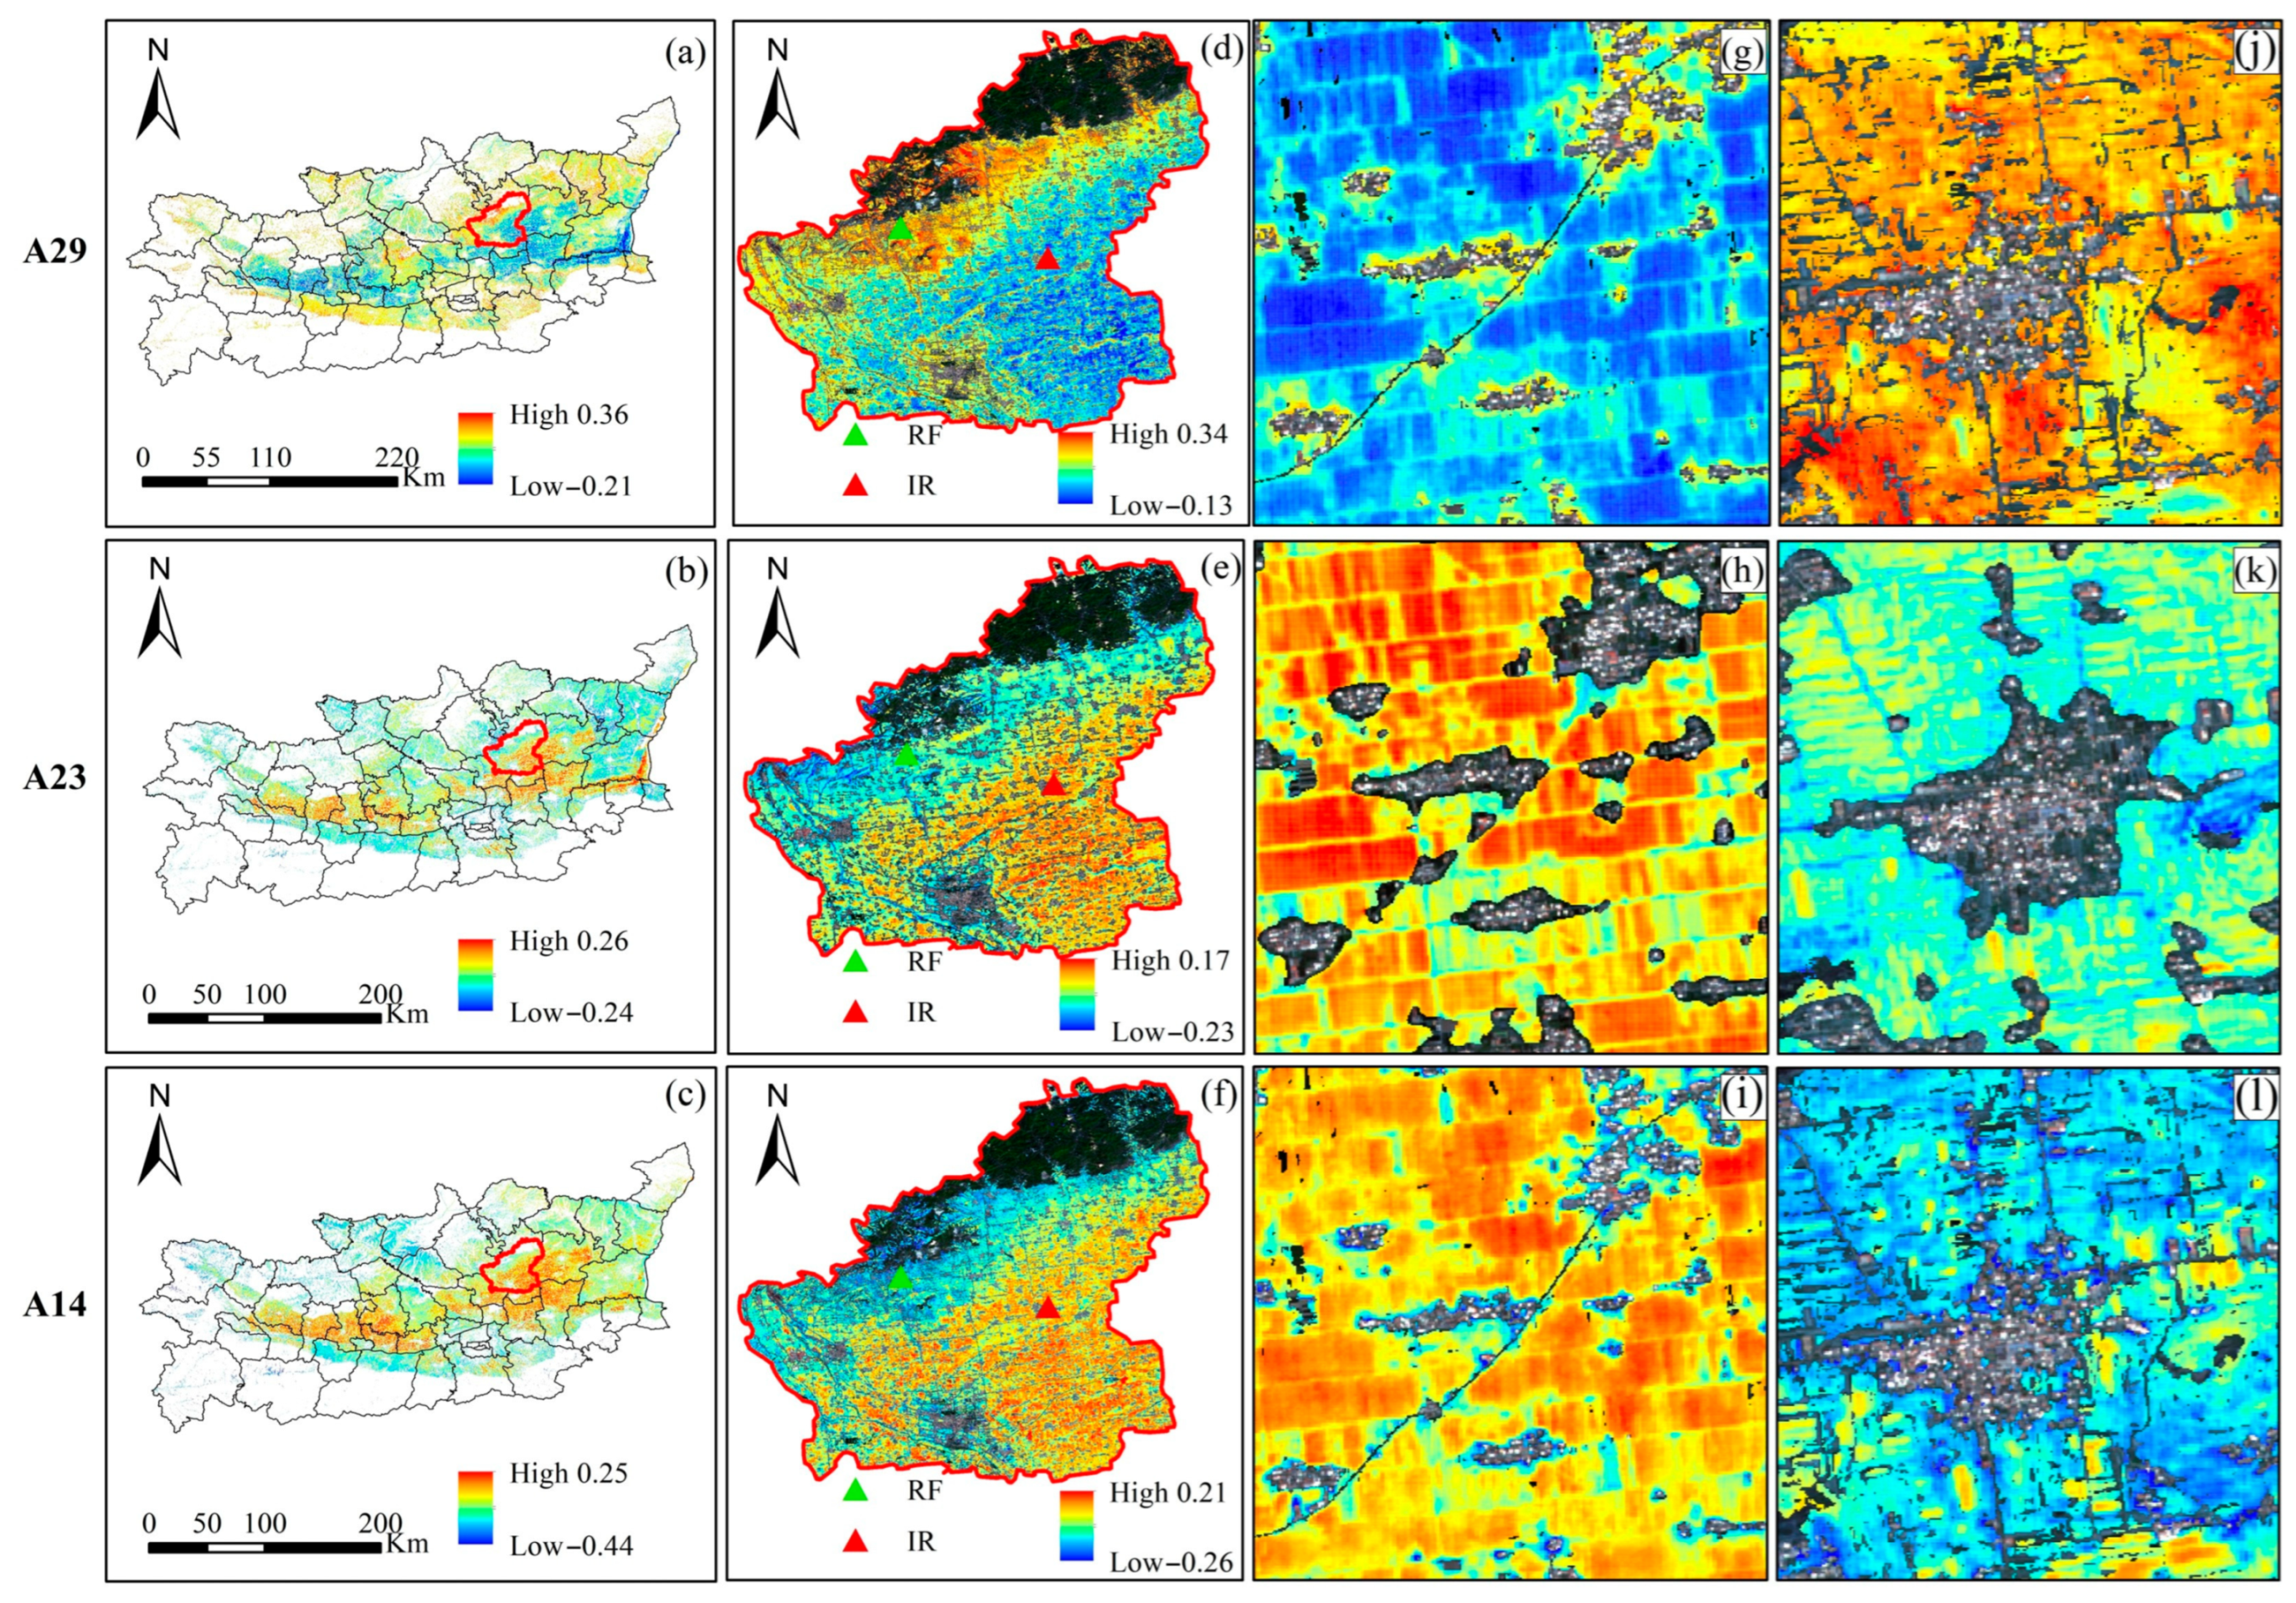
After confirming that the top three AEF embedding dimensions exhibit strong discriminative capability at the numerical level, the spatial distribution characteristics of A29, A23, and A14 were further analyzed (Figure 5). At the scale of the Guanzhong Plain (Figure 5a–c), A29 shows a spatial distribution pattern clearly distinct from those of A23 and A14. Low values of A23 and A14 are primarily concentrated in the loess tableland and hilly regions, whereas A29 exhibits persistently high values in these same areas, forming a spatial pattern opposite to that of the other two features. To further examine separability at the parcel scale, Fuping County in Weinan City, Shaanxi Province—where irrigated and rainfed croplands coexist—was selected for detailed analysis (Figure 5d–f). The results show that, under the A29 feature, irrigated croplands are predominantly characterized by spatially continuous low values, whereas rainfed croplands are dominated by high values, consistent with the value distribution patterns shown in Figure 4b. At the parcel scale, minimal color overlap is observed between the two cropland types under A29, and the separability is markedly stronger than that achieved by A23 and A14.
Figure 5.
Comparison of the spatial distributions of AEF embedding features A29, A23, and A14; (a–c) show the spatial distributions of A29, A23, and A14 across the Guanzhong Plain; (d–f) present the corresponding distributions of A29, A23, and A14 in Fuping County; (g–i) irrigated cropland parcels in Fuping; (j–l) rainfed cropland parcels in the in Fuping.
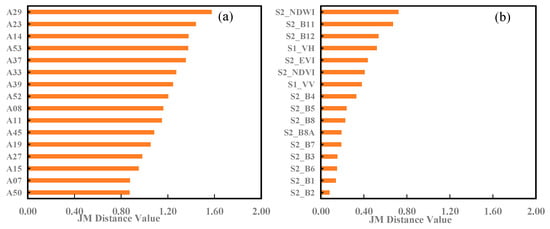
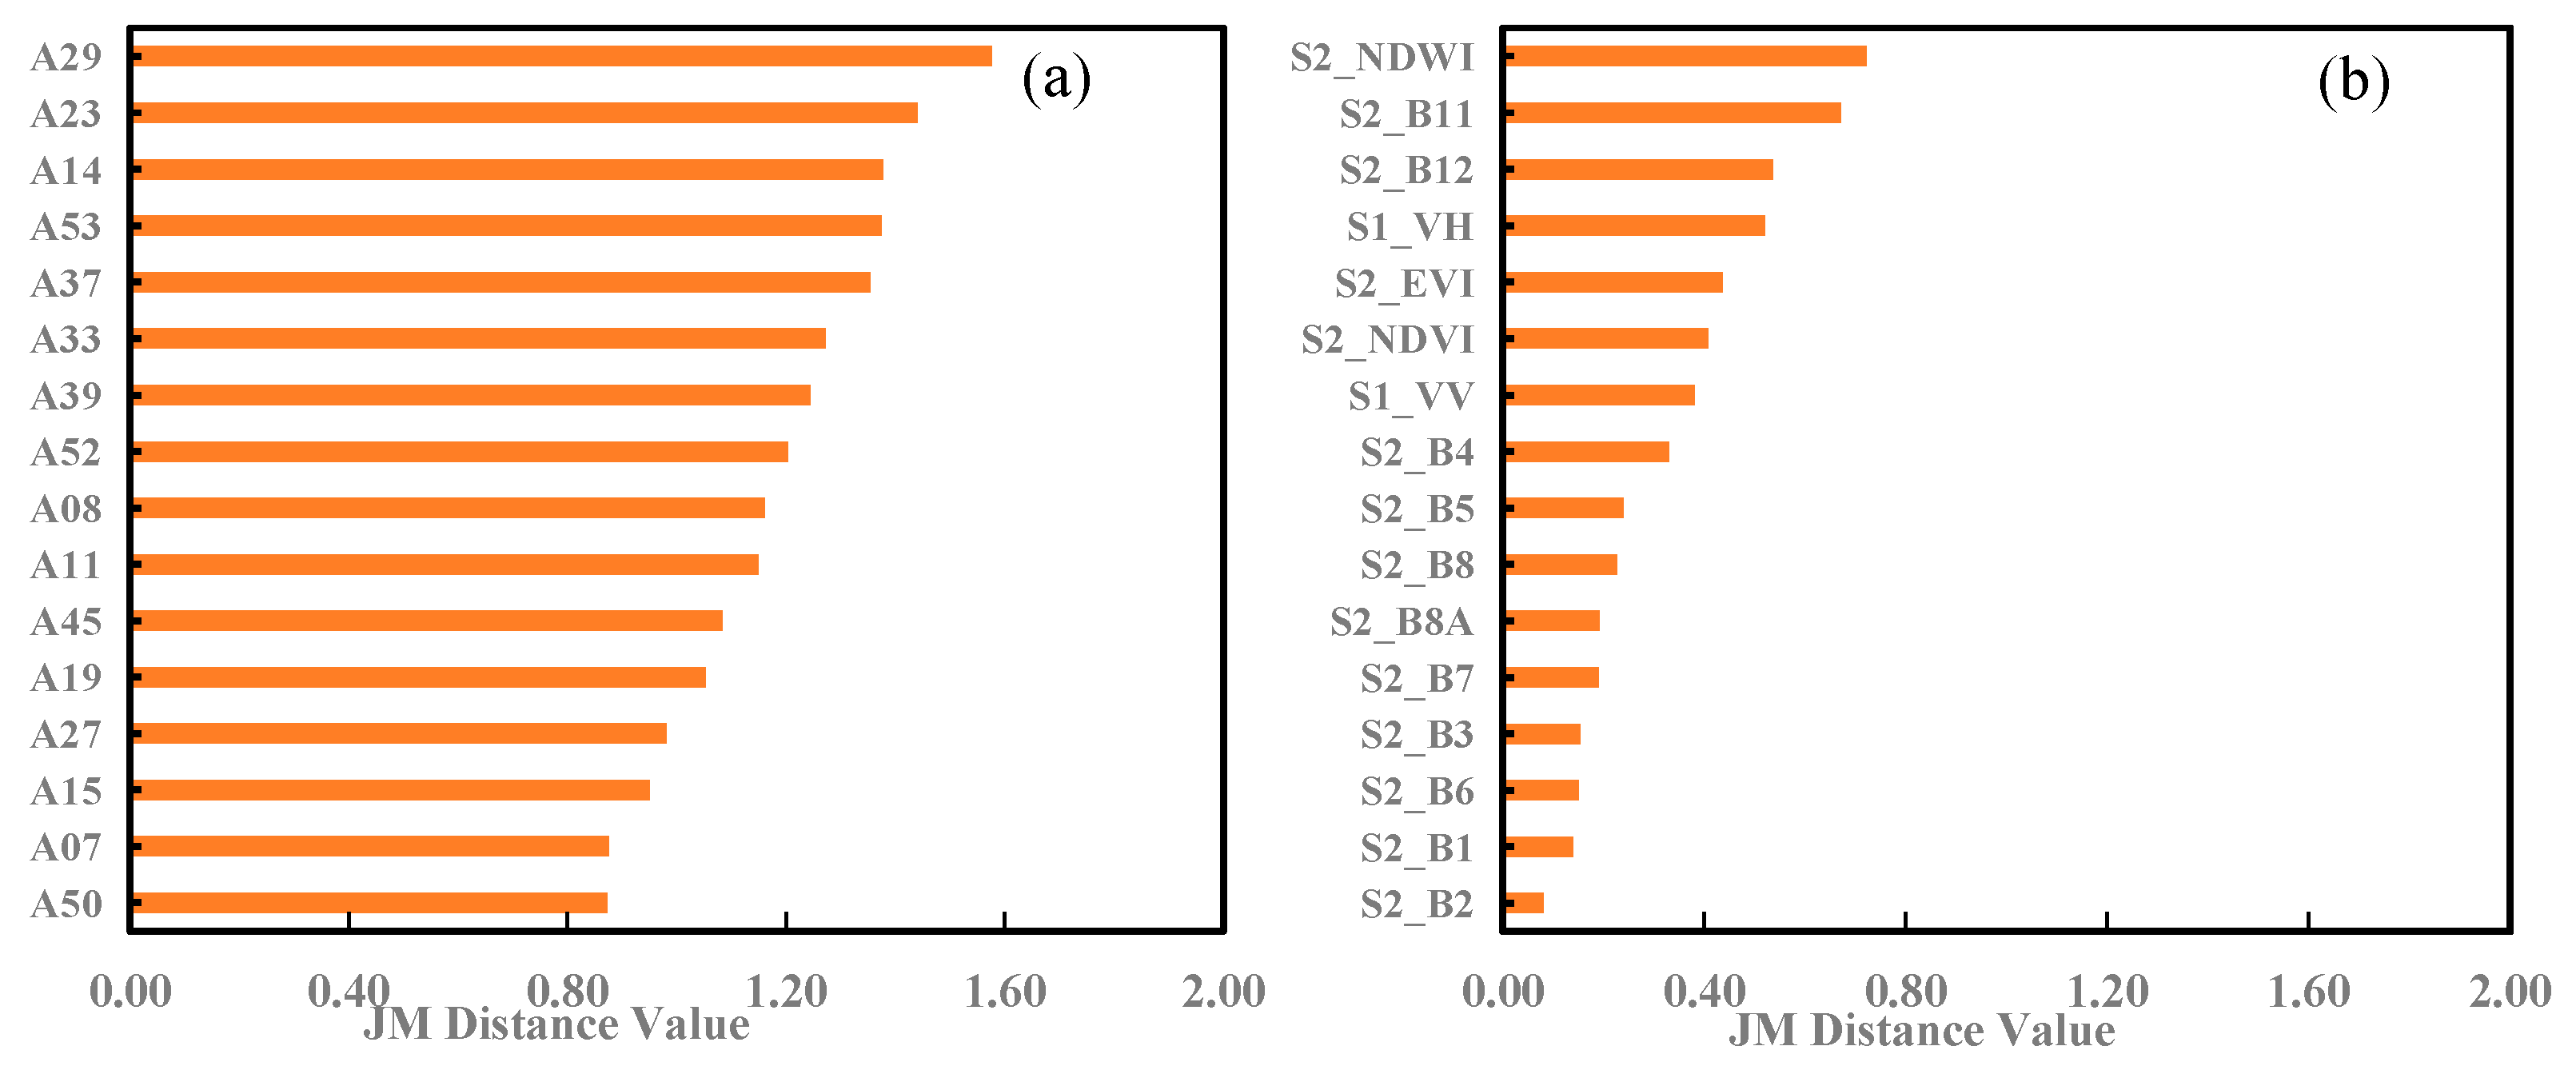
To further evaluate the discriminative advantage of AEF embedding features relative to conventional remote sensing features, a comparative analysis was conducted between the top 16 AEF embedding dimensions ranked by JM distance and the 16 Sentinel-derived features (Figure 6). The results show that the JM distances of the AEF embeddings are primarily distributed within the range of 0.8–1.6, with A29 achieving the highest JM distance of 1.58. In contrast, the JM distances of the Sentinel-derived features are substantially lower overall. The most contributive Sentinel feature is NDWI, with a JM distance of only 0.72, while the JM distances of the remaining spectral bands and indices are mostly below 0.6. These results further demonstrate that, under the same JM distance calculation framework, AEF embedding features exhibit superior discriminative capability at the feature level compared with conventional Sentinel-derived features.
Figure 6.
Comparison of JM distance results: (a) JM distance ranking of the top 16 AEF embedding features; (b) JM distance results of the 16 Sentinel-derived features.
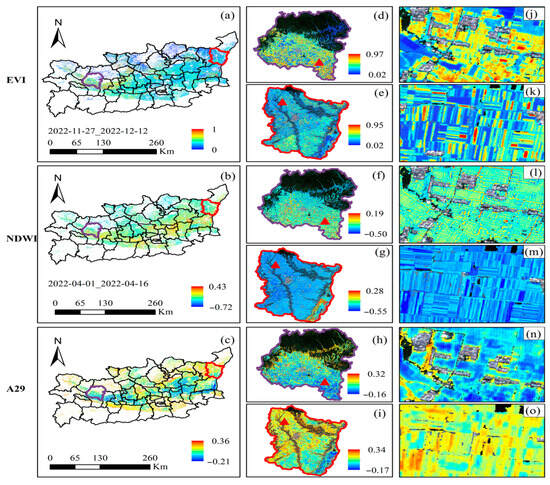
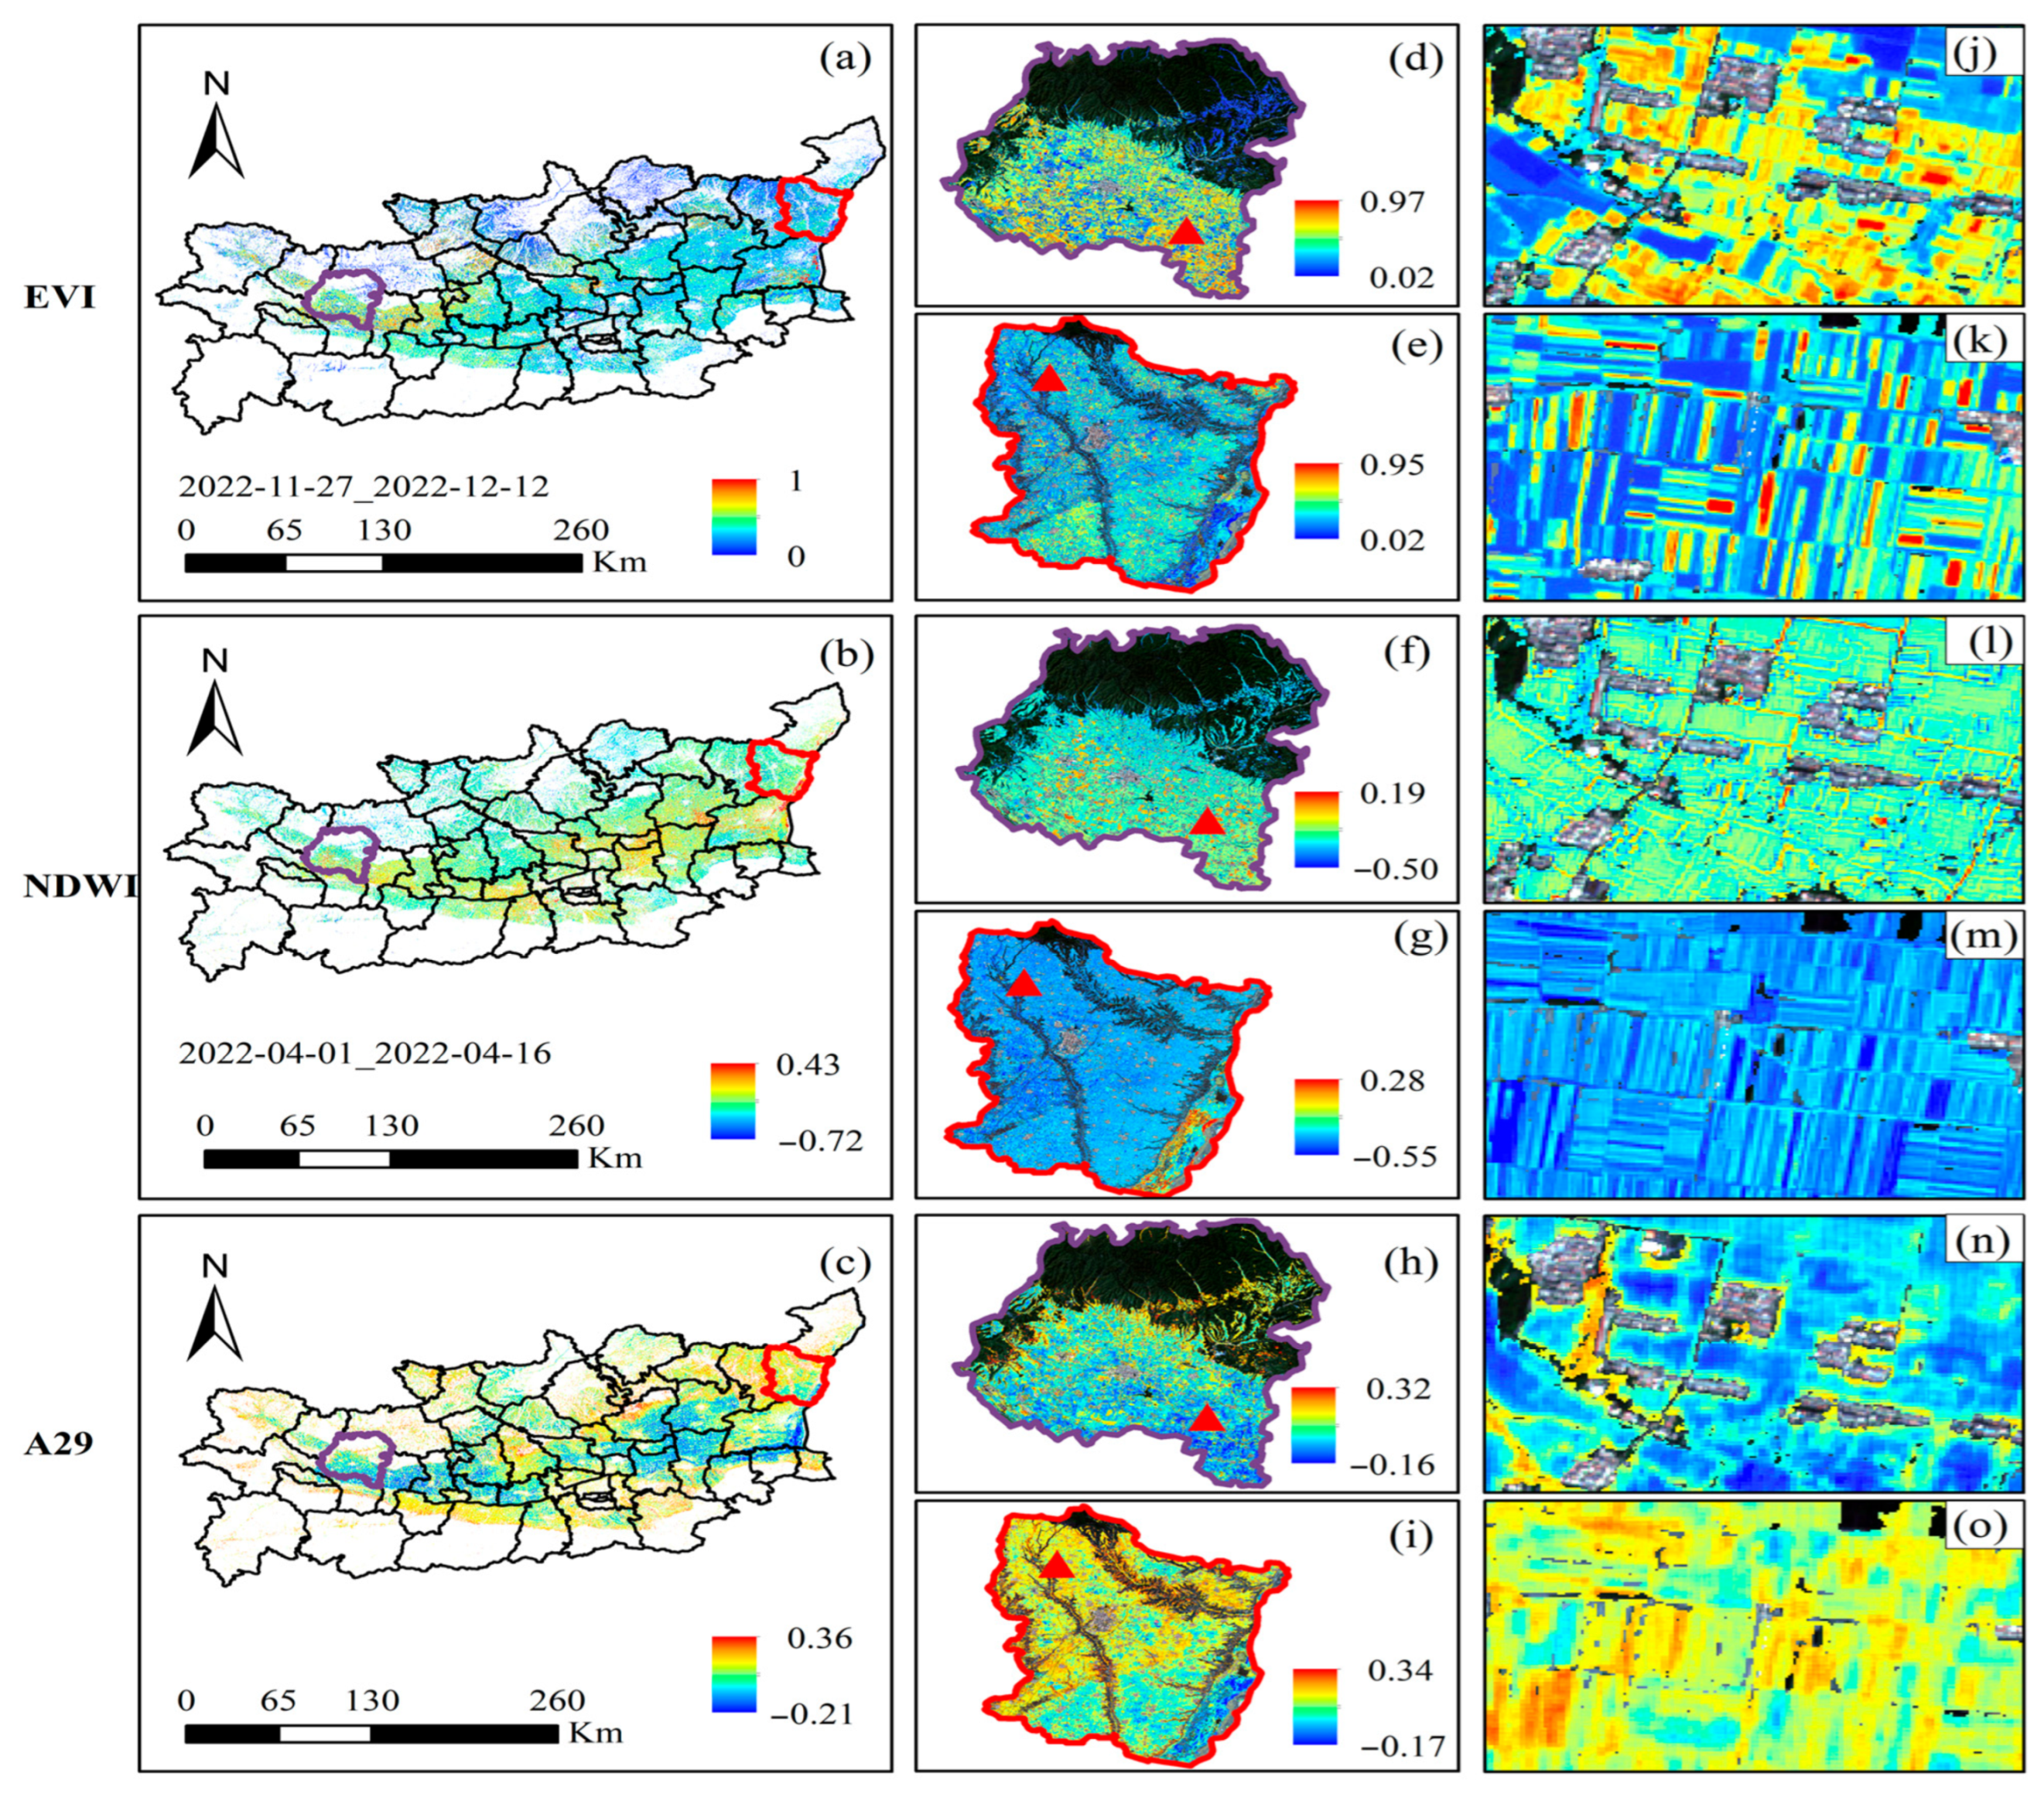
Based on the JM distance ranking of the Sentinel-derived features, NDWI, which is closely associated with moisture conditions, and EVI, which reflects vegetation growth status, were selected and compared with the most discriminative AEF embedding, A29, in terms of spatial expression. As shown in Figure 7, for both EVI and NDWI, the two 15-day time windows contributing most strongly to their overall JM distances were identified, and corresponding mean composite images were generated for comparative analysis (Table A1). The results in Figure 7a–c indicate that, at the scale of the Guanzhong Plain, all three features are capable of capturing spatial differences between irrigated and rainfed croplands. However, A29 exhibits a more distinct, near-bimodal spatial pattern between the two cropland types, enabling a more intuitive delineation of large-scale irrigation distribution. In contrast, the spatial variations in EVI and NDWI are characterized by more gradual transitions, with less clearly defined boundaries between irrigated and rainfed areas.
Figure 7.
Comparison of the spatial distributions of irrigation-related indices and the AEF embedding A29 across the Guanzhong Plain: (a–c) Regional-scale spatial patterns of EVI, NDWI, and A29 over Guanzhong Plain; (d,f,h) corresponding representations for the Fengxiang area with a high proportion of irrigated cropland; (e,g,i) corresponding representations for the Heyang area dominated by rainfed agriculture; (j–o) field-scale comparisons of representative parcels in the two regions. Red triangles indicate the locations corresponding to the field-scale examples shown in the right panels.
To further examine feature behavior at the parcel scale, Fengxiang County, located near major irrigation districts, and Heyang County, situated on the Weibei dryland plateau, were selected for detailed comparison (Figure 7j–o). In Fengxiang (Figure 7j,l,n), both EVI and A29 show clustered high-value patterns, while A29 provides clearer contrast along irrigated parcels and field boundaries. In Heyang (Figure 7k,m,o), all three features display relatively homogeneous areal distributions, with NDWI exhibiting particularly high spatial consistency within rainfed areas. Overall, these comparisons demonstrate that A29 achieves a level of information representation for irrigated and rainfed croplands comparable to that of physically interpretable indices such as EVI and NDWI, while offering more visually explicit irrigation-related spatial contrasts at the parcel scale.
4.2. Classification Performance Across Study Areas
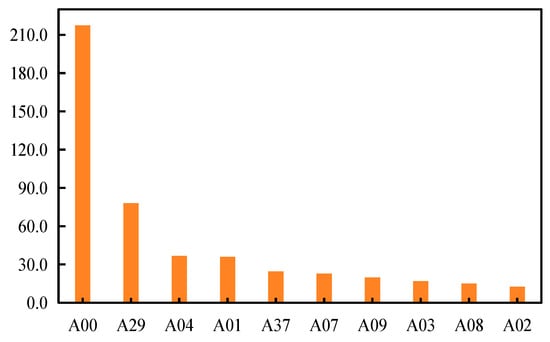
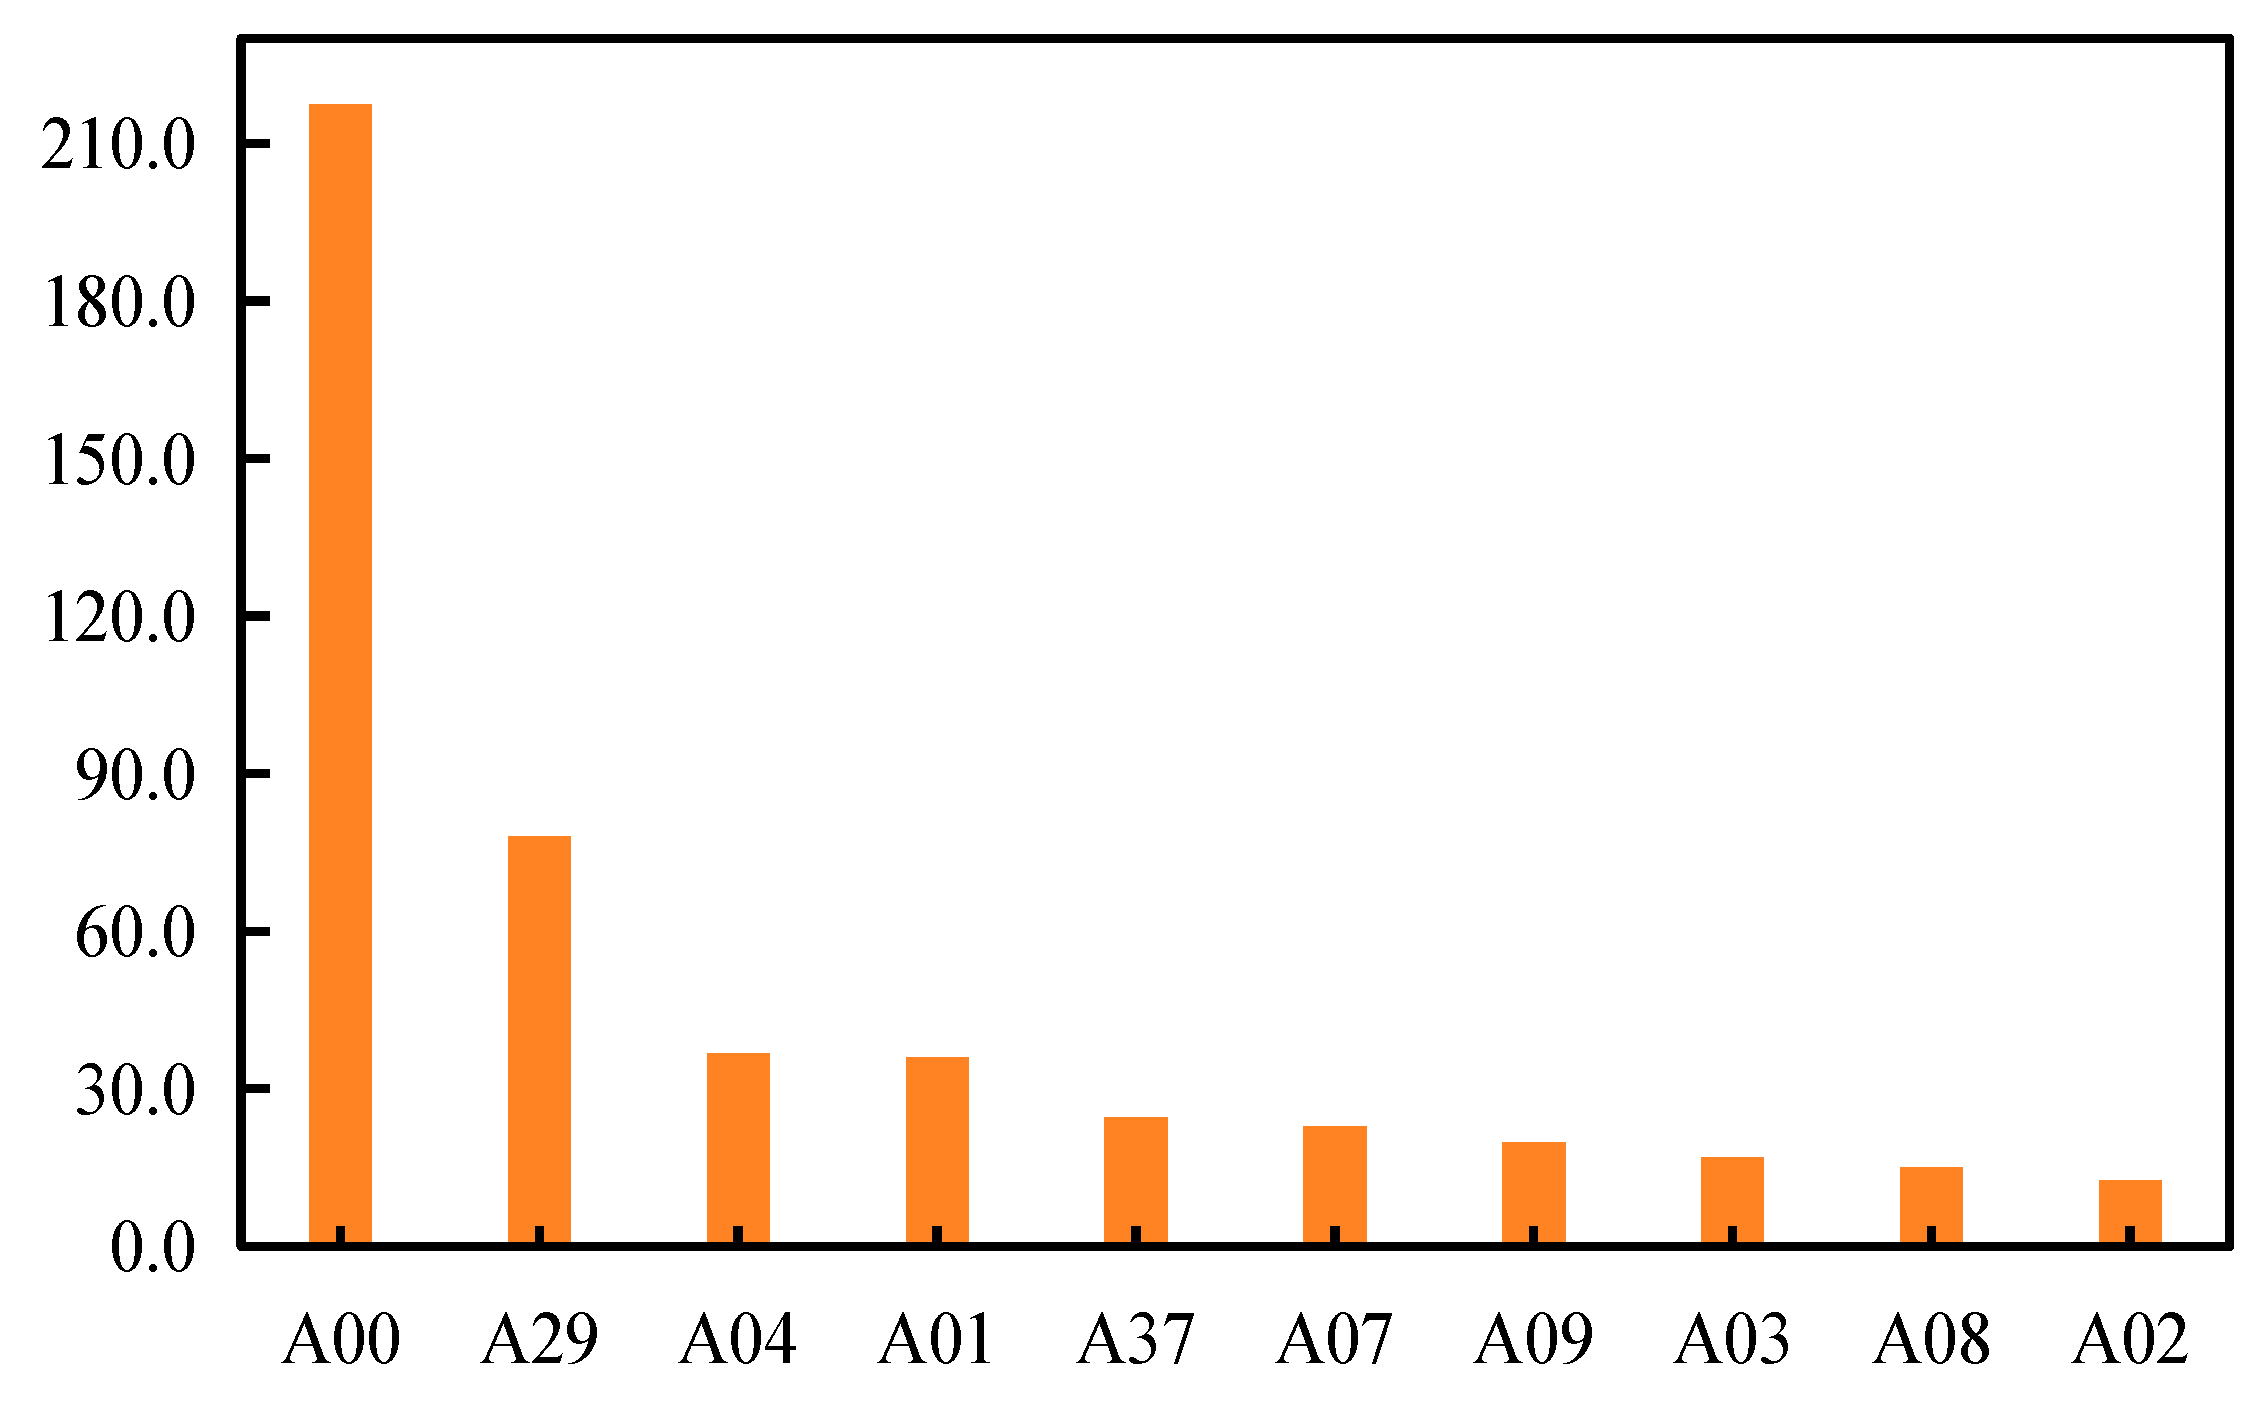
A Random Forest–based feature importance analysis was further conducted using samples from the Guanzhong Plain to evaluate the relative contribution of the 64 AEF embedding dimensions under a multivariate classification setting (Figure 8). The results show that the importance of the embedding dimensions varies across features, with A00, A29, A04, A01, and A37 ranked among the most important variables. Among them, A29 exhibits consistently high importance, which is consistent with its top ranking in the JM-distance analysis. This result indicates that A29 maintains strong discriminative capability both at the single-feature level and within the multivariate classification framework. Overall, the results suggest that the discriminative information of AEF embeddings is mainly concentrated in a subset of the embedding space rather than being evenly distributed across all 64 dimensions.
Figure 8.
Top-10 Random Forest feature importance ranking of AEF embedding dimensions in the Guanzhong Plain.
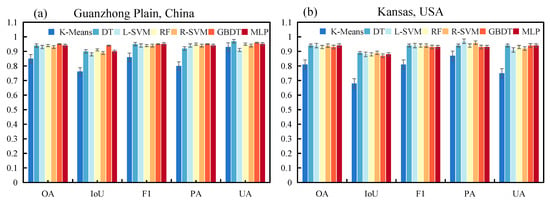
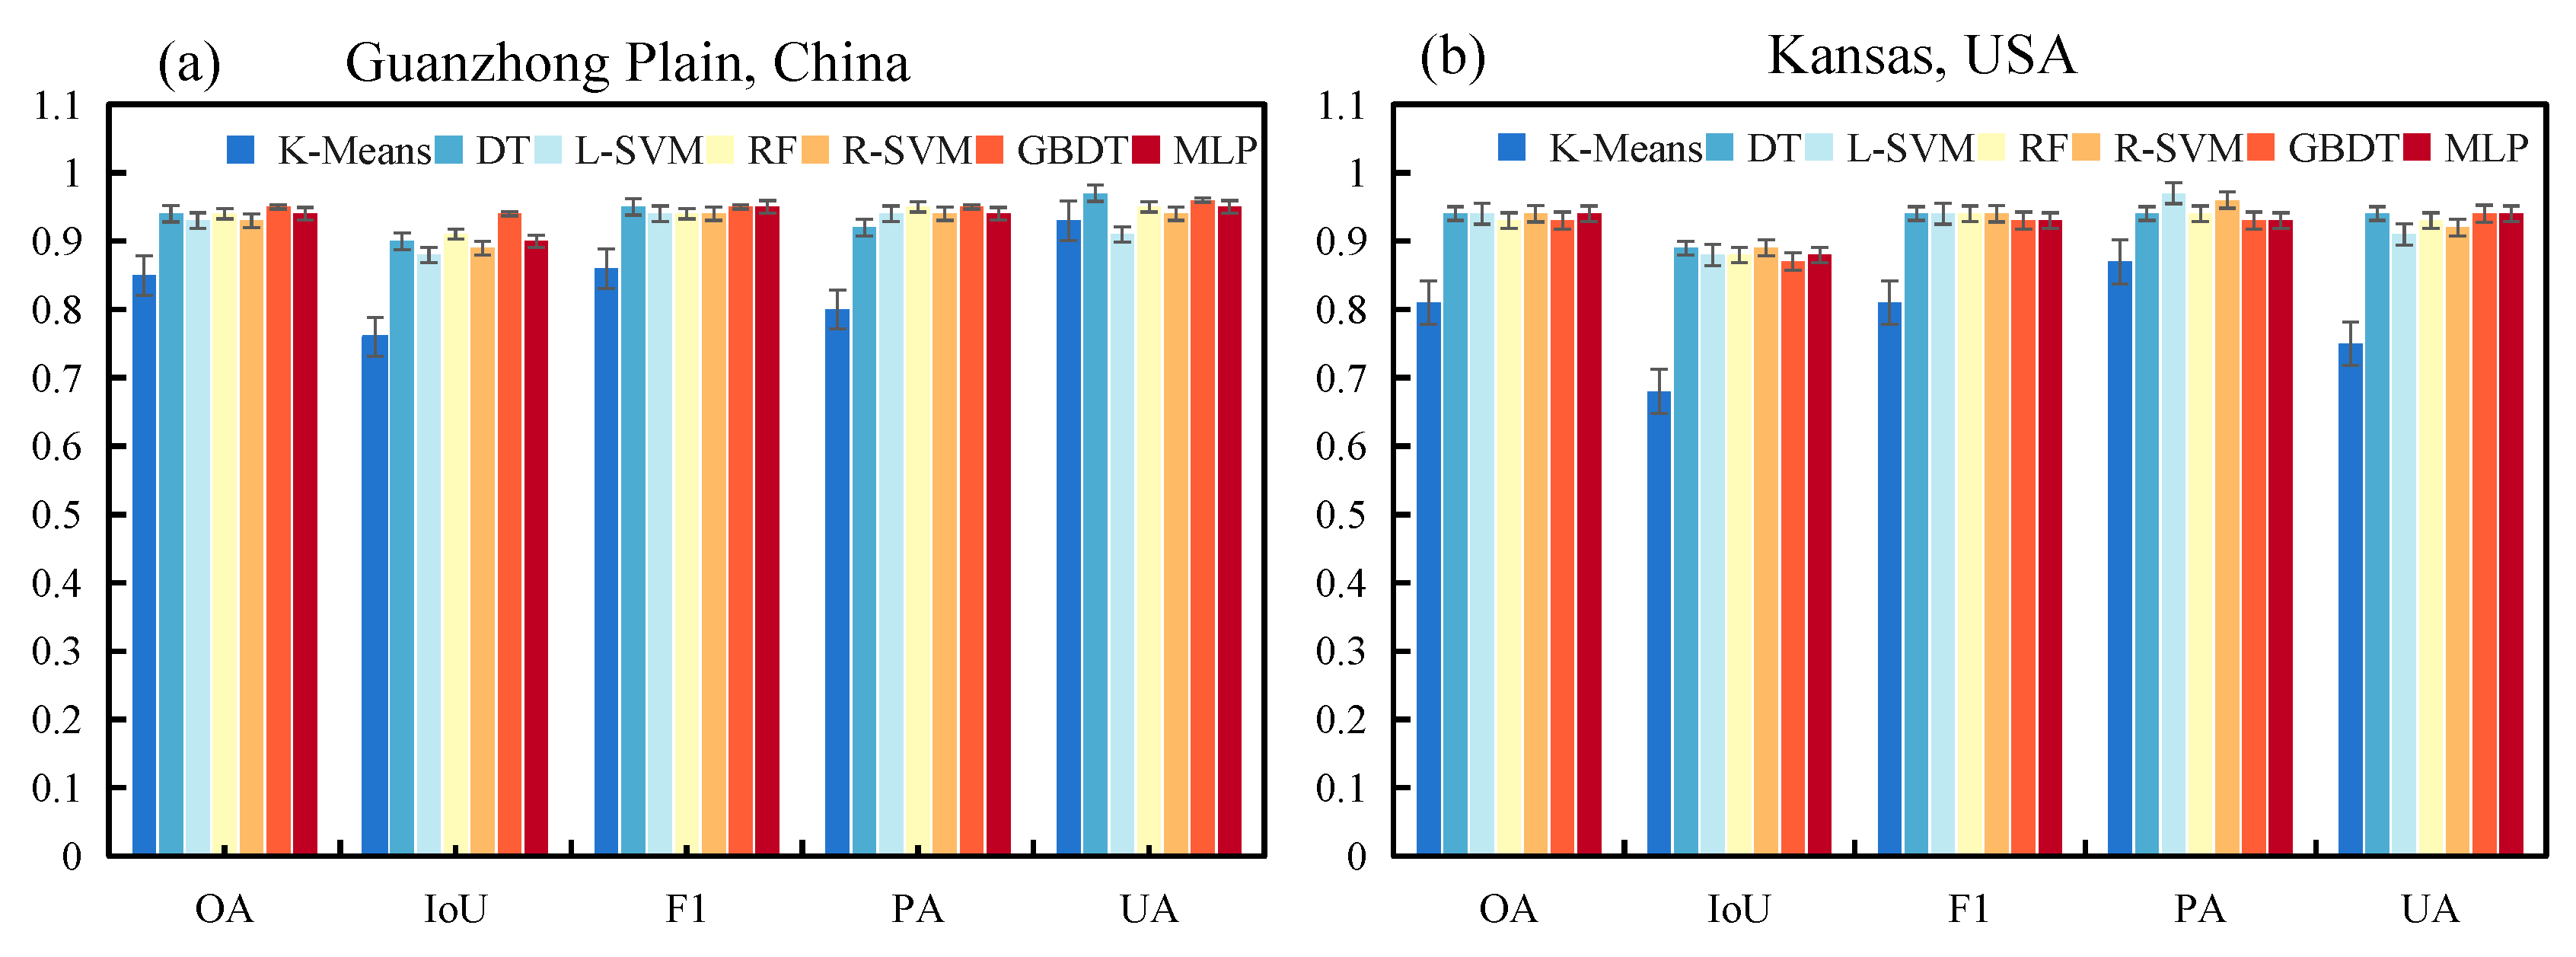
In the Guanzhong Plain, the intrinsic separability of AEF embedding features between irrigated and rainfed croplands was evaluated using both unsupervised and supervised classification methods. As shown in Figure 9a, even under unsupervised conditions, K-means clustering achieved an OA of 0.85. Under supervised classification, the classification performance of all models was further improved, with OA values concentrated in the range of 0.90–0.95, indicating that AEF embedding features can form a clear class separation in the feature space. On this basis, while keeping the classification models and parameter settings consistent, the stability of AEF feature performance across different geographic regions was further evaluated. As shown in Figure 9, when AEF embedding features were used, supervised classification models achieved comparable performance levels in both study areas. In the Guanzhong Plain, the best-performing GBDT model achieved an OA of 0.95 and an IoU of 0.94, whereas in Kansas, the OA values of all models were concentrated within a narrow range of 0.90–0.94. Compared with the Guanzhong Plain, performance differences among different models were reduced in Kansas. Among them, DT and RBF-SVM achieved the highest OA (0.94), while GBDT and RF showed slightly lower accuracy (OA = 0.93). Overall, when AEF embedding features were adopted, classification performance remained stable across different regions. To further improve the interpretability of these results, the confusion-matrix components (TP, FP, FN, and TN) and related accuracy metrics for all the evaluated models in the Guanzhong Plain and Kansas are provided in Table A2 and Table A3, respectively.
Figure 9.
Comparison of classification performance across different study areas: (a) the Guanzhong Plain, China; (b) Kansas, USA.
To further quantify the classification performance differences between feature types, K-means and GBDT models were selected to compare the performance of AEF embeddings and conventional Sentinel-derived features (Table 2). The results show that, under the GBDT model, AEF embeddings outperform Sentinel features across all evaluation metrics, achieving an OA of 0.95 and an IoU of 0.94, whereas the corresponding values for Sentinel features are only 0.84 and 0.73. These results indicate that, under identical model configurations and experimental settings, AEF embeddings can substantially improve the classification accuracy of irrigated and rainfed croplands. Under the K-means clustering setting, AEF embeddings also demonstrate clear advantages, with an OA of 0.85 and an IoU of 0.76, yielding overall classification performance superior to that of Sentinel features.
Table 2.
Performance comparison of AEF features and Sentinel features across different classifiers.
4.3. Cross-Year Transfer Performance
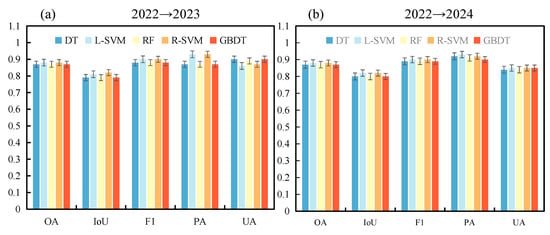
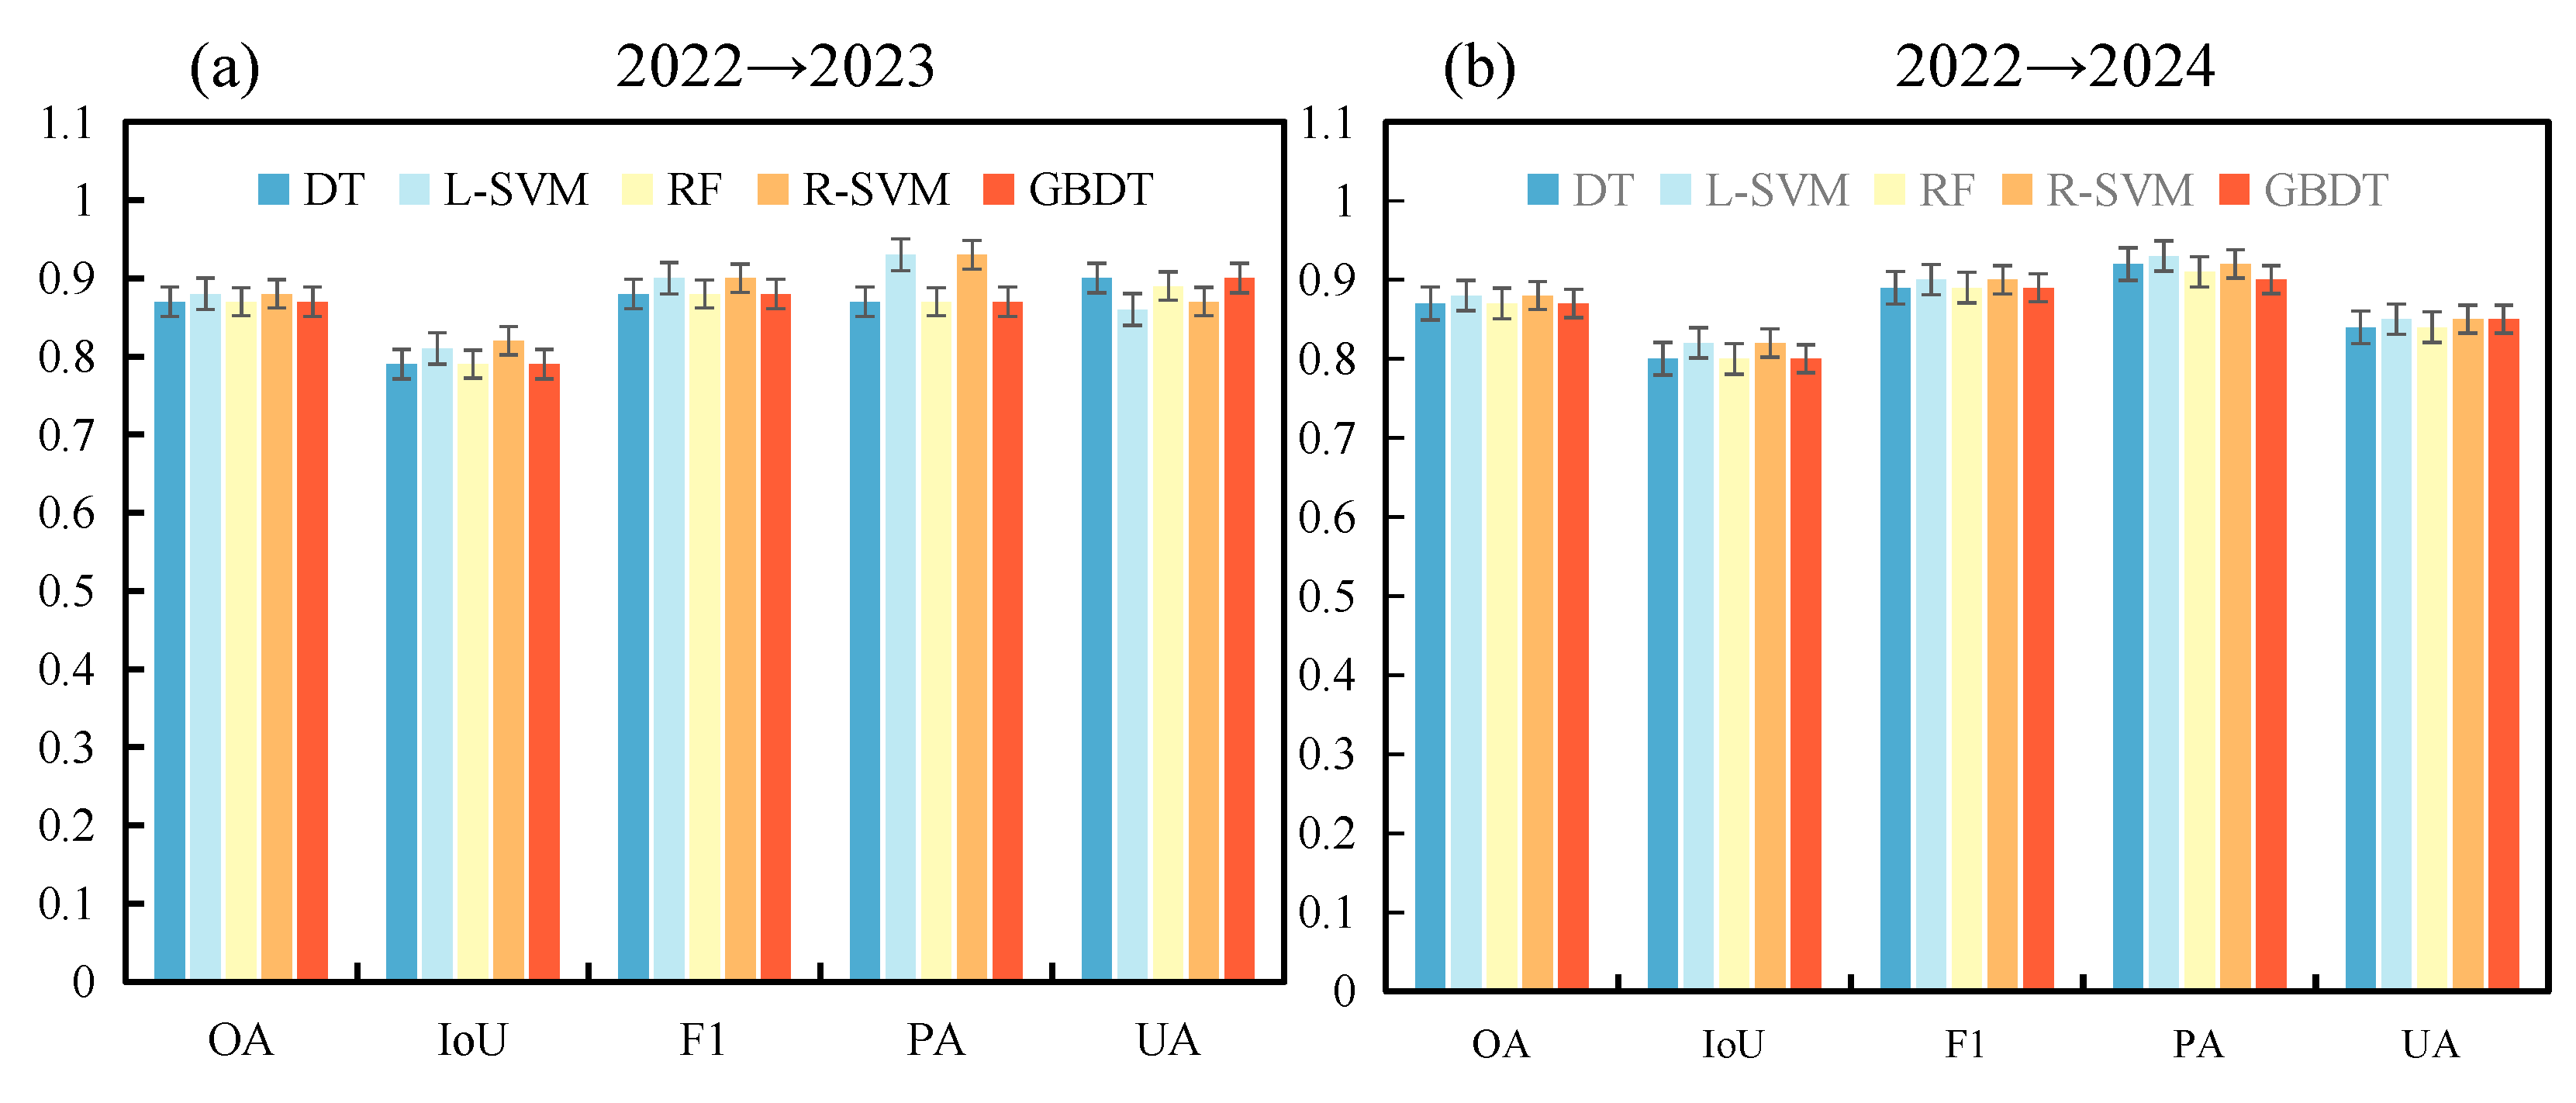
The cross-year transfer performance of AEF embeddings was evaluated in the Guanzhong Plain. Models were trained using samples from 2022 and were directly applied to the 2023 and 2024 datasets from the same region without retraining or hyperparameter adjustment. Because 2023 experienced relatively higher natural precipitation than typical years, it was initially not selected as the primary target year for cross-year validation. To further examine the robustness of temporal generalization, the 2022-trained models were additionally applied to both 2023 and 2024. As shown in Figure 10, OA values across different models were consistently concentrated between 0.87 and 0.88 in both target years, indicating relatively stable cross-year transfer performance. In 2023, Linear-SVM and RBF-SVM achieved the best overall performance, with IoU values of 0.82 and F1 of 0.90. Similar patterns were also observed in 2024, where Linear-SVM and RBF-SVM again showed the best performance, with IoU reaching 0.81–0.82 and F1 remaining at 0.90. Across the two target years, PA and UA remained relatively balanced, suggesting no evident systematic bias under the cross-year transfer setting. Overall, the comparable results obtained for 2023 and 2024 indicate that year-to-year differences in precipitation did not substantially alter the general conclusion regarding the temporal transferability of AEF embeddings.
Figure 10.
Temporal generalization performance of different models in the Guanzhong Plain using models trained on 2022 data: (a) results for 2023; (b) results for 2024.
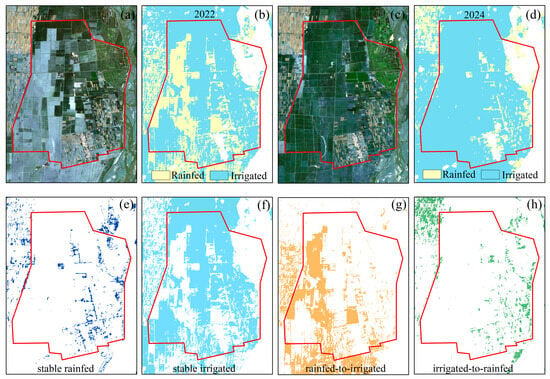
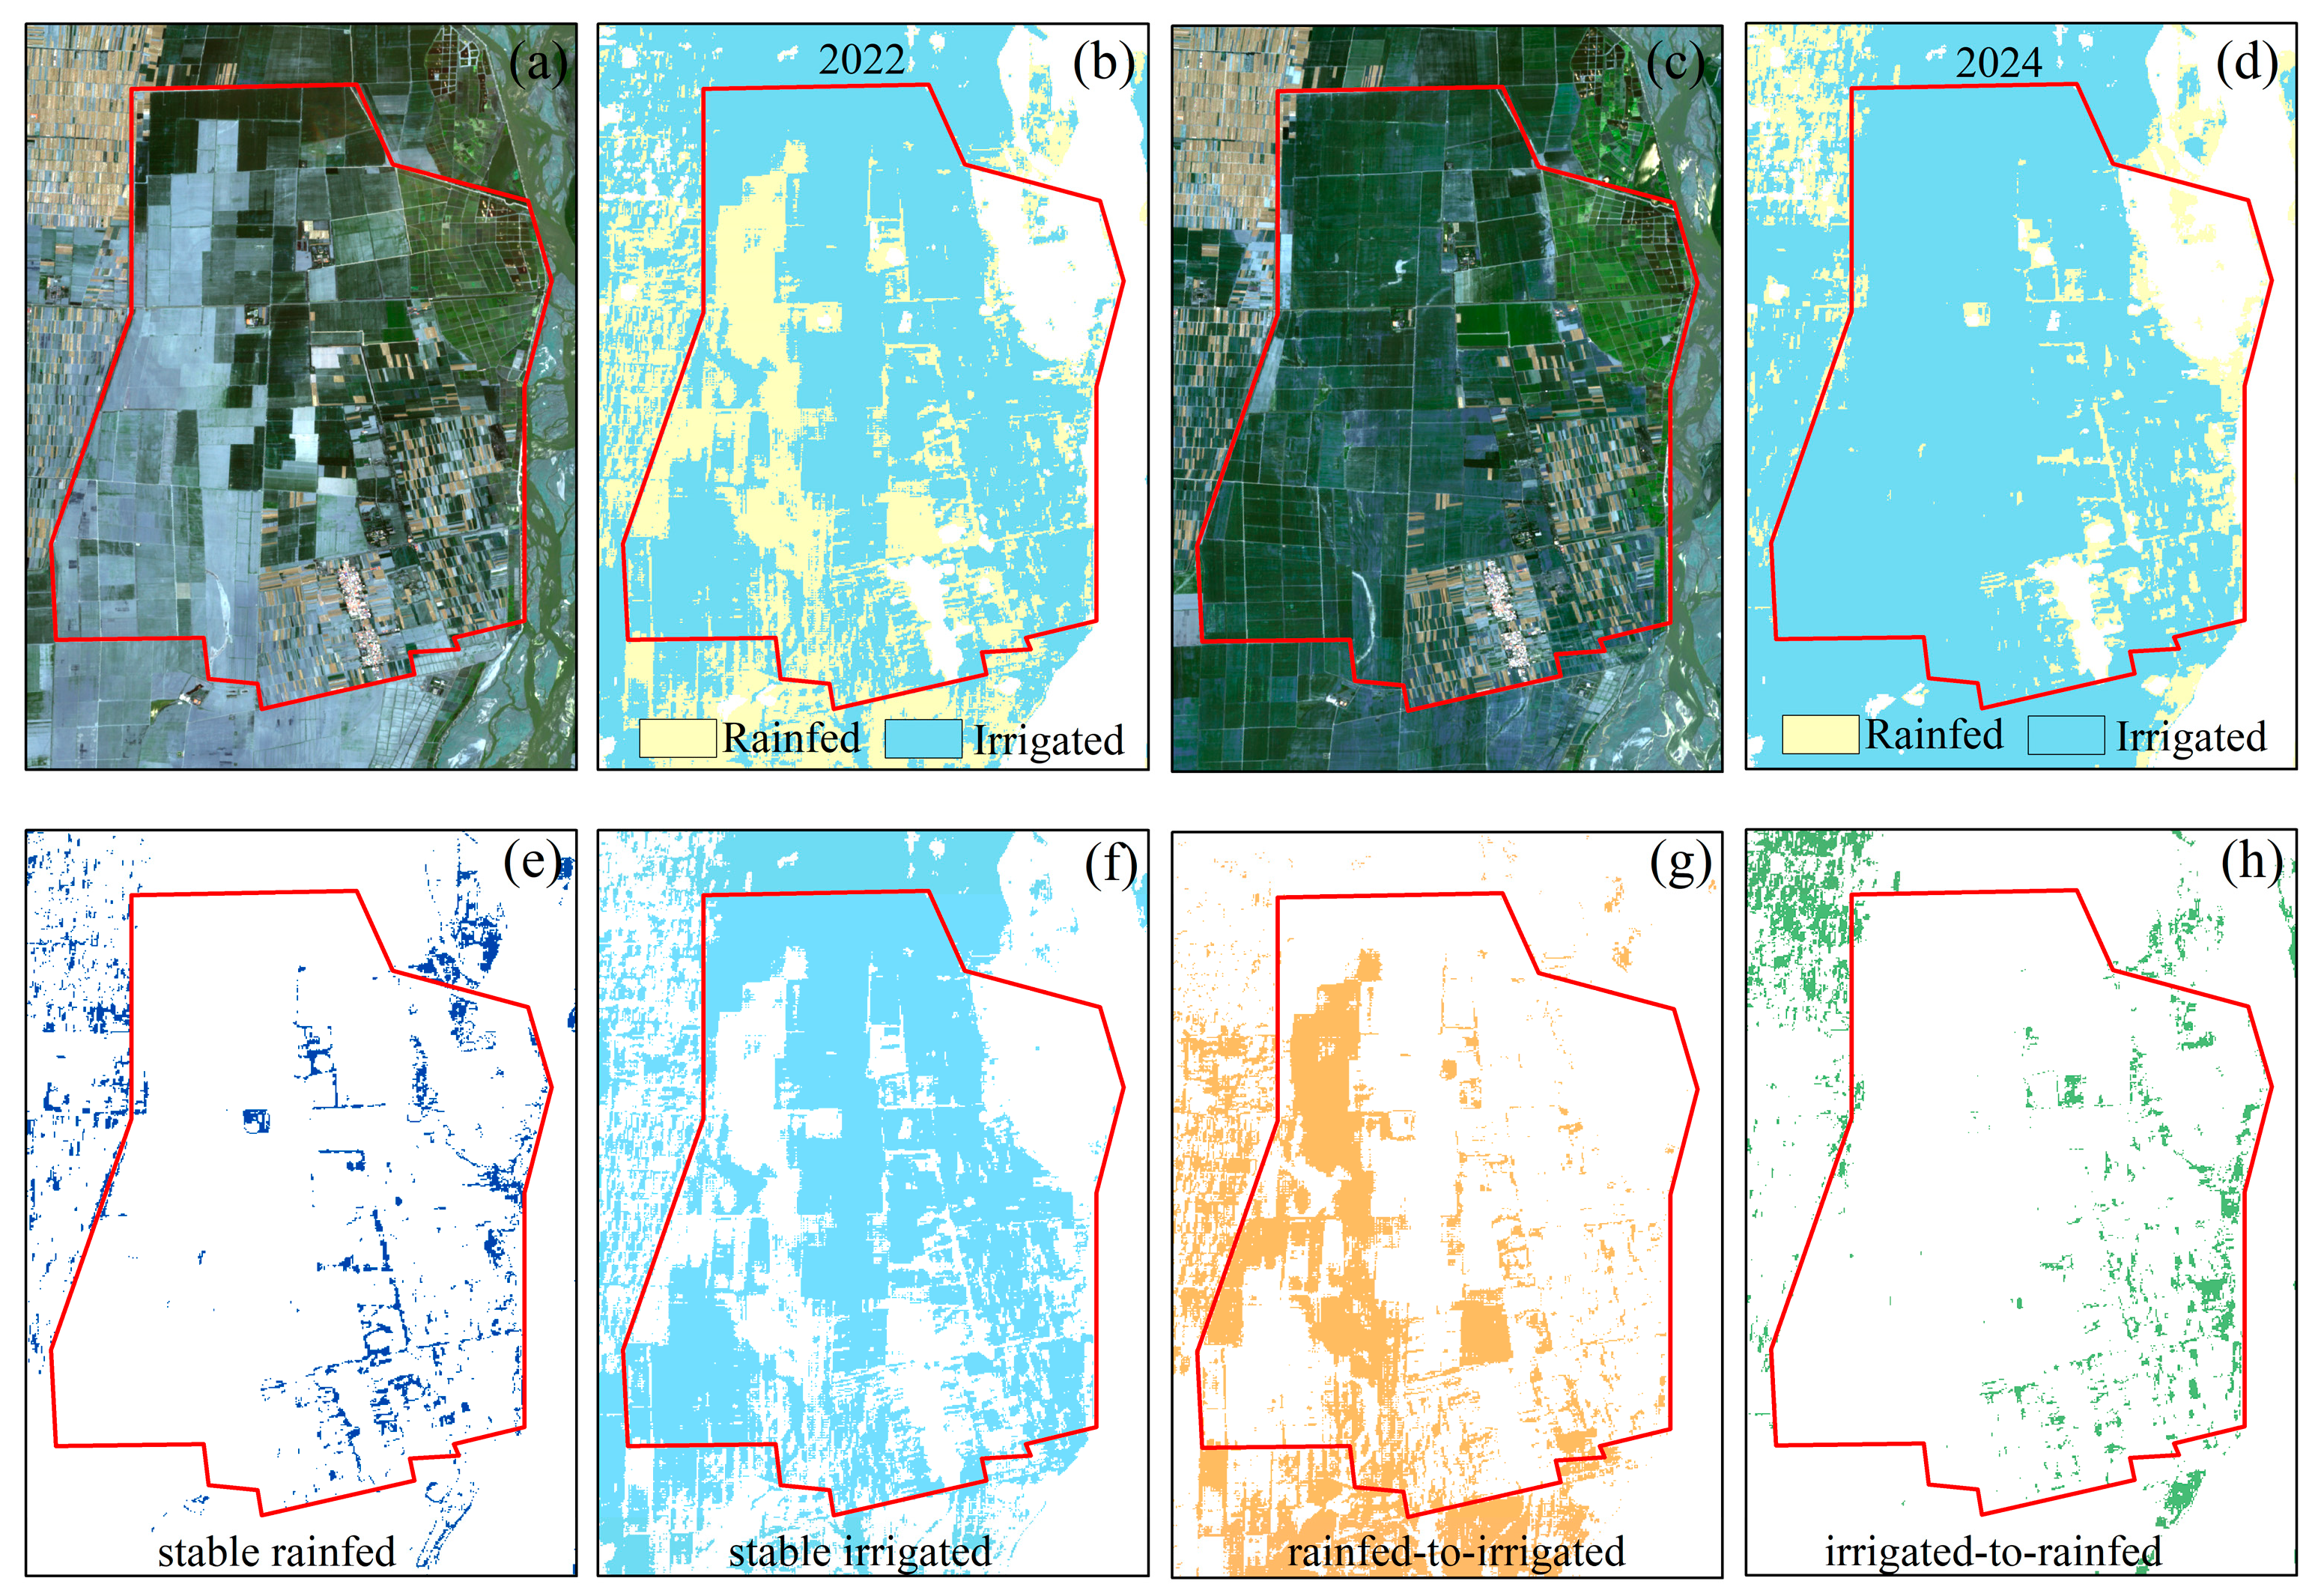
To further examine cross-year robustness from a spatial perspective, a representative spatial comparison was conducted by overlaying the irrigation classification results of 2022 and 2024 over the Dali Experimental Farm in Shaanxi Province (Figure 11). Although cross-year transfer performance was quantitatively evaluated for both 2023 and 2024 in Figure 10, the 2022–2024 comparison was selected here as an illustrative case for spatial analysis. Four parcel-level transition categories were derived, including stable rainfed, stable irrigated, rainfed-to-irrigated, and irrigated-to-rainfed. (Figure 11). At the parcel scale, irrigation outcomes remain highly consistent between the two years, with most cropland parcels maintaining stable irrigation status (Figure 11e,f). Among these categories, stable irrigated and stable rainfed parcels occupy the dominant proportion and show relatively coherent spatial patterns, indicating that the overall irrigation structure remained largely stable between 2022 and 2024. By contrast, the two transition categories are much more limited in spatial extent and occur as scattered patches within the study area. Specifically, parcels changing from rainfed to irrigated are visible in Figure 11g, whereas parcels changing from irrigated to rainfed are shown in Figure 11h. These transition parcels are mainly distributed locally rather than forming large contiguous areas, suggesting that interannual changes in irrigation status occurred at the parcel scale but did not alter the dominant regional pattern. These results show that the AEF feature-based identification framework supports reliable characterization of stable irrigation patterns and captures cross-year dynamics in irrigation status.
Figure 11.
Temporal generalization and interannual irrigation-status transitions over the Dali Experimental Farm, Shaanxi Province: (a,c) multitemporal true-color images of the study area in 2022 and 2024, respectively; (b,d) irrigation classification results for 2022 and 2024; (e) stable rainfed parcels; (f) stable irrigated parcels; (g) rainfed-to-irrigated transitions; and (h) irrigated-to-rainfed transitions.4.4. Cross-region transfer Performance.
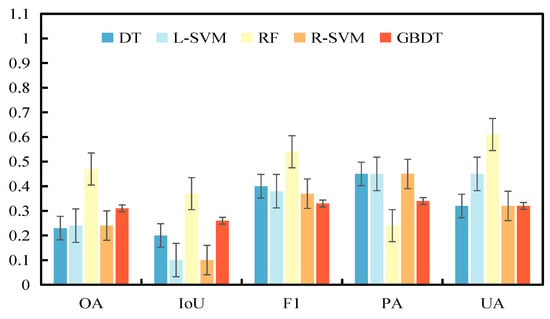
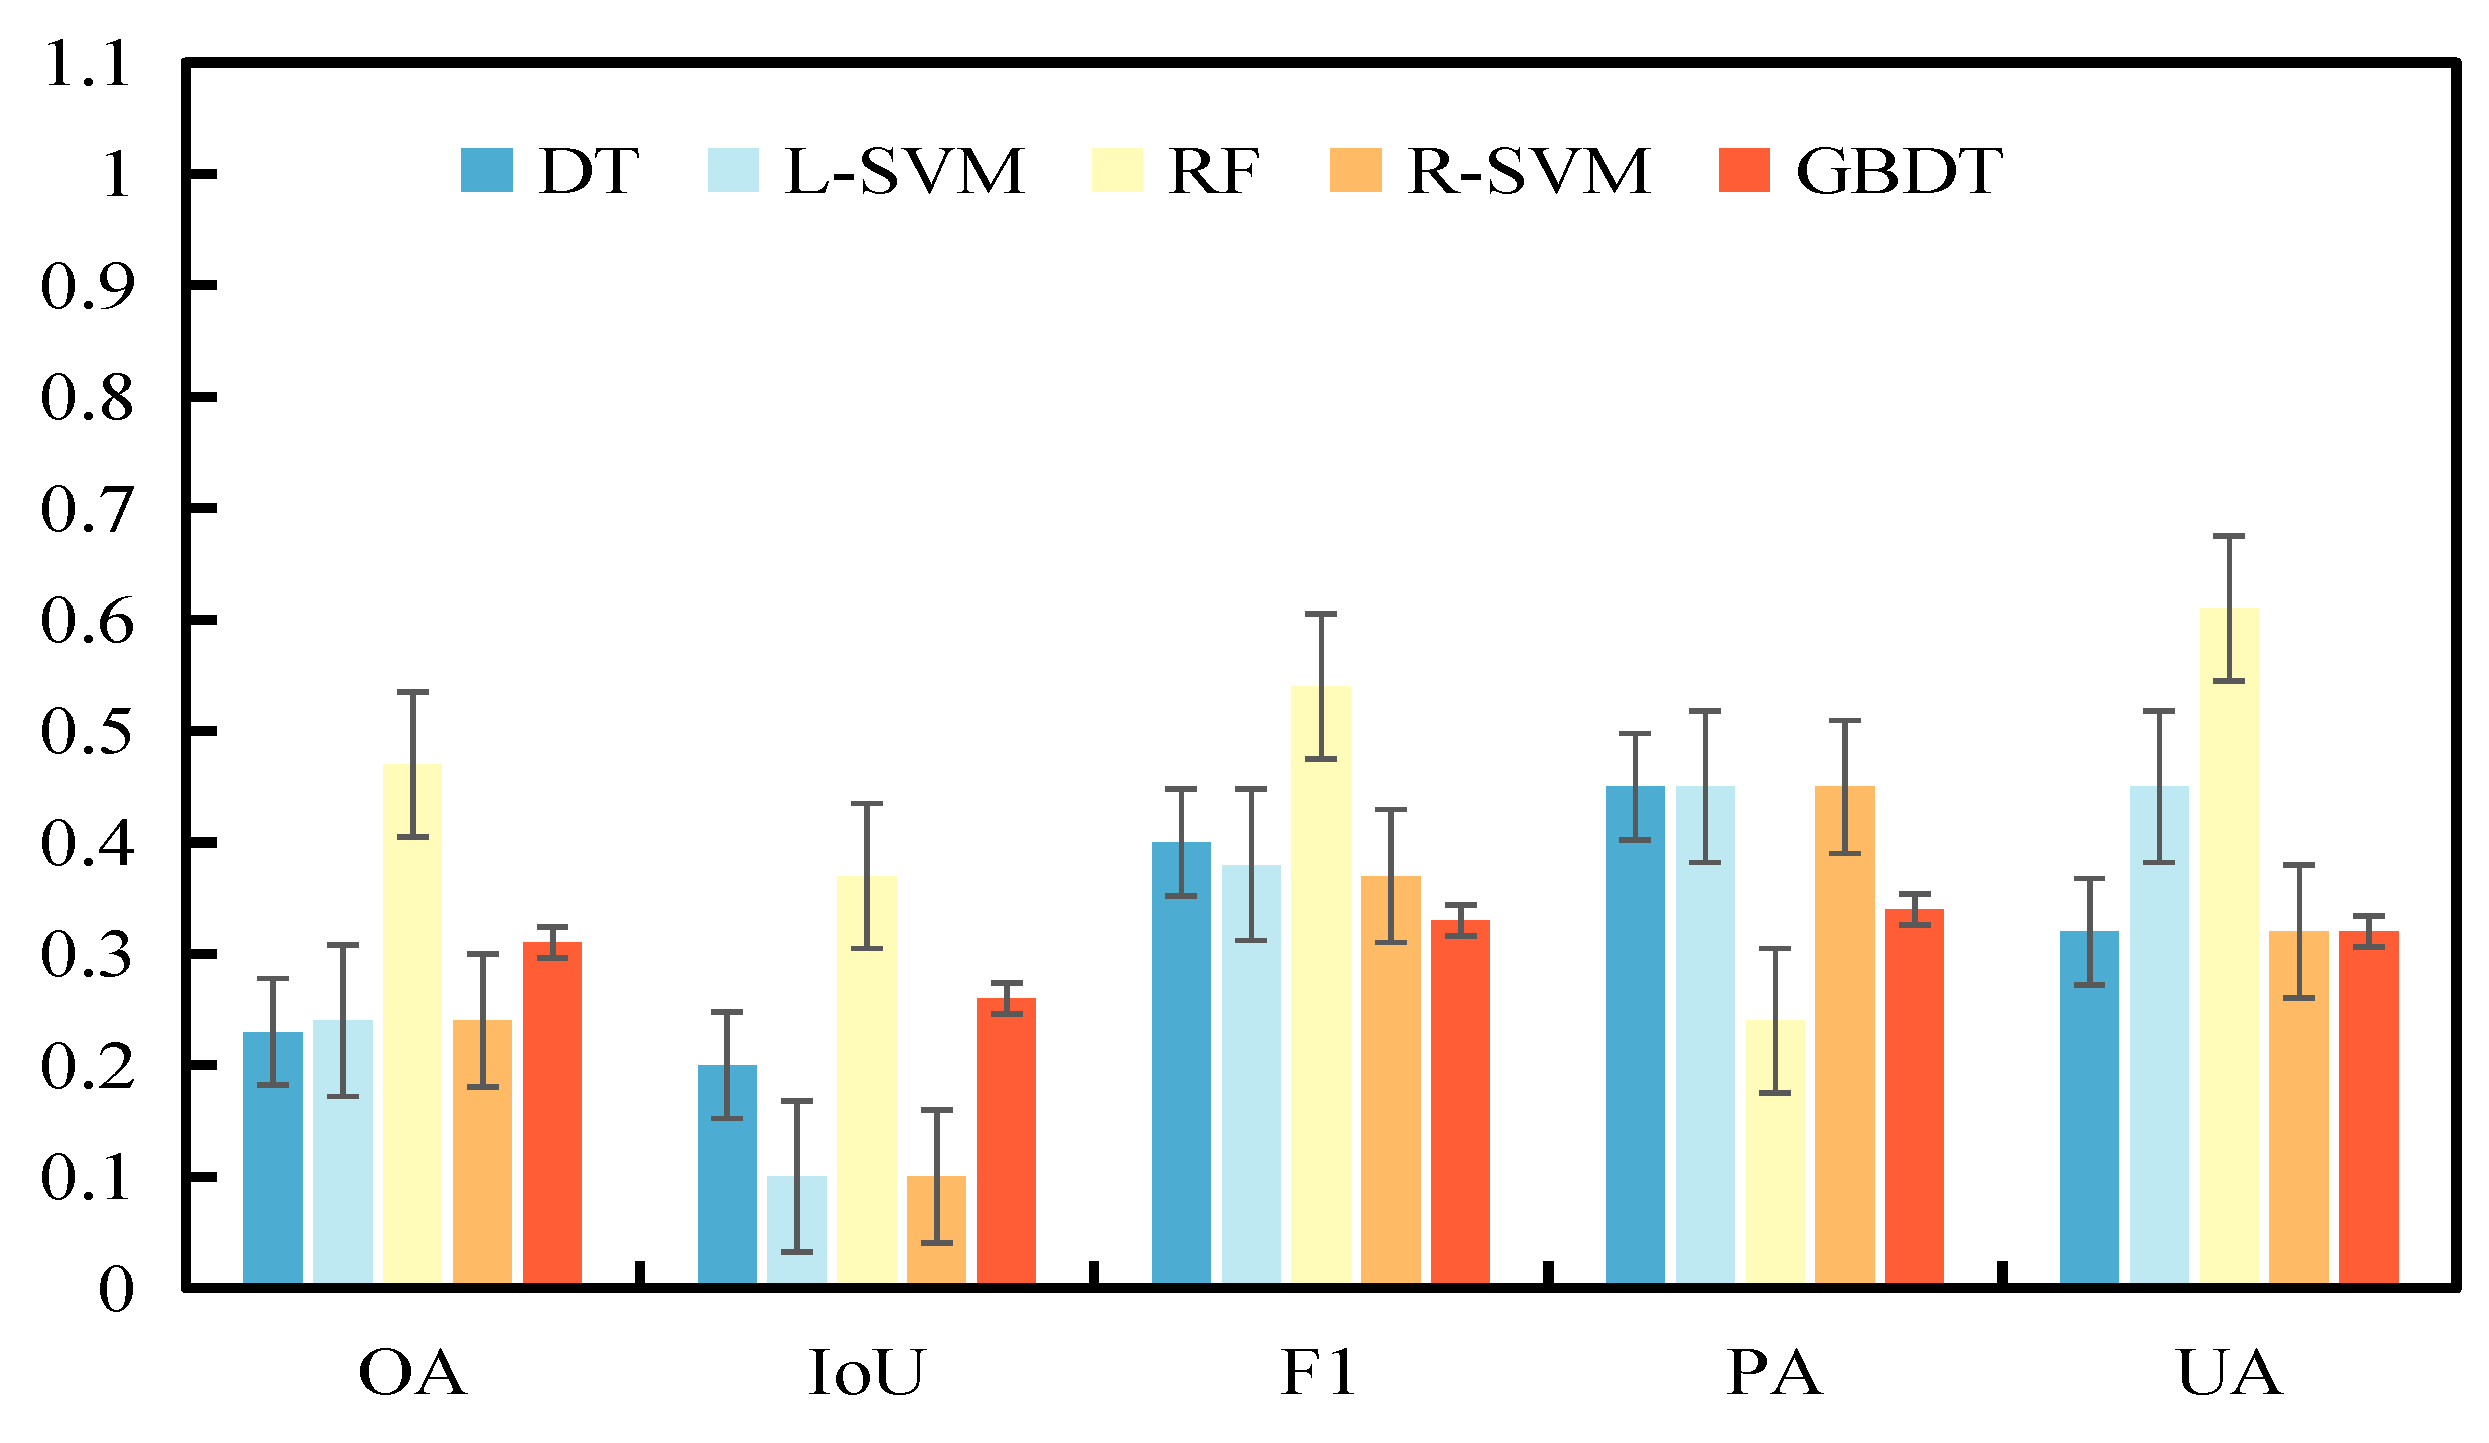
In the cross-region transfer experiment, classification performance was first evaluated for different models trained in the Guanzhong Plain and directly transferred to Kansas (Figure 12). The results show that OA values for all models are below 0.5, with an overall range of approximately 0.2–0.47, which is markedly lower than the accuracy levels observed in the cross-year transfer experiment. Among the evaluated models, RF achieves relatively higher values across all metrics, with an OA of 0.47, an IoU of 0.37, and an F1 of approximately 0.54, while the remaining models exhibit substantially lower overall performance.
Figure 12.
Spatial Generalization Accuracy Evaluation of the Same Model in the Guanzhong Plain-Kansas Region.
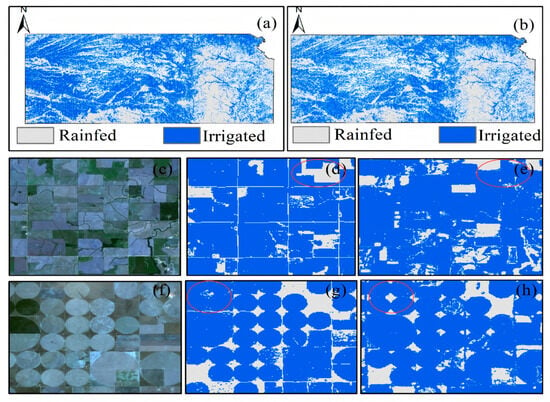
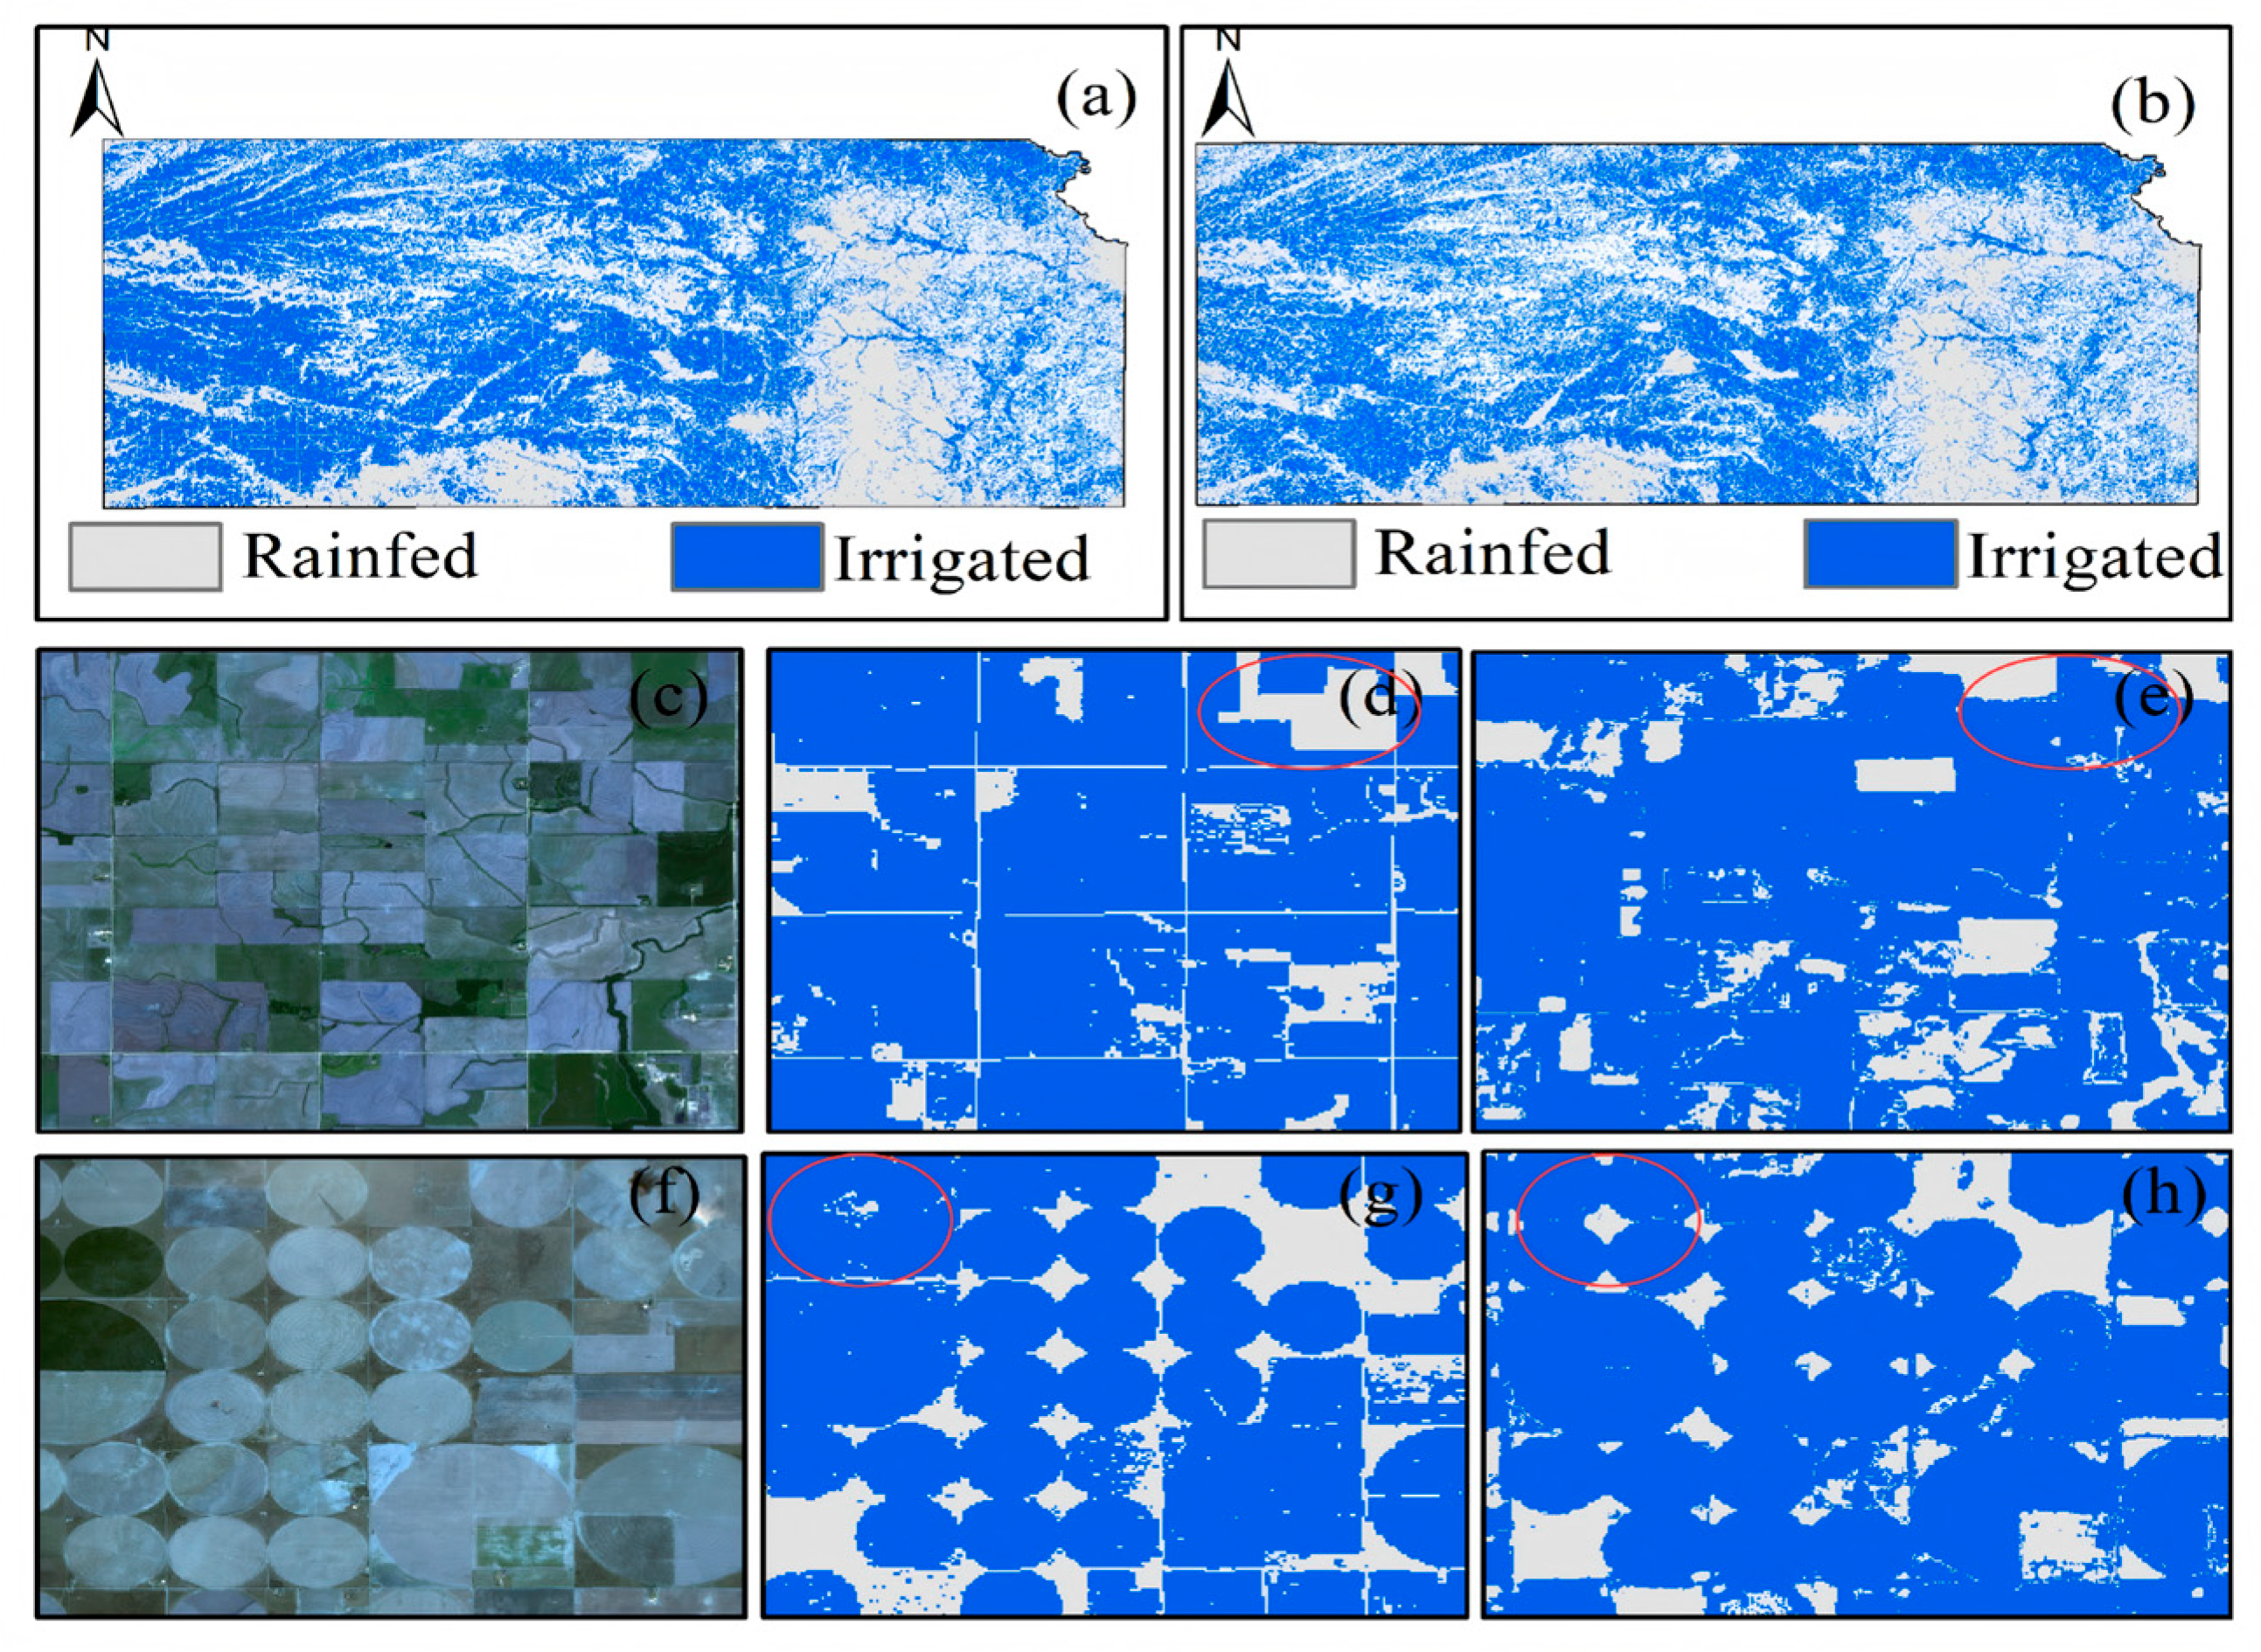
Based on these results, the RF transfer output is selected as a representative case for spatial comparison with the CDL reference data (Figure 13). At the regional scale (Figure 13a,b), the irrigation spatial pattern produced by the transferred RF model remains broadly consistent with the CDL reference in terms of overall distribution, but the spatial extent identified as irrigated cropland is markedly reduced. In the CDL reference maps (Figure 13d,g), large circular irrigated fields are identified as continuous irrigated areas with strong spatial coherence. In contrast, in the RF transfer results (Figure 13e,h), these originally continuous irrigated fields are frequently fragmented into scattered patches, and some areas are entirely labeled as rainfed cropland.
Figure 13.
Spatial generalization results of rainfed–irrigated cropland mapping in Kansas: (a) Classification result generated by the RF model trained locally; (b) classification result from the CDL reference; (c,f) multitemporal true-color composite images; (d,g) irrigated cropland classification from the CDL reference; (e,h) irrigated cropland classification from the transferred RF model.
Further comparison shows that misclassification under the cross-region transfer setting is dominated by omission of truly irrigated fields rather than confusion between irrigated and rainfed classes. Specifically, the spatial extent of the irrigated class is substantially reduced in the model predictions, while the rainfed class occupies a dominant proportion. This spatial pattern corresponds to the accuracy structure observed in the quantitative evaluation, where PA is markedly lower than UA.
5. Discussion
5.1. Advantages of AEF Embeddings
By comparing AEF embeddings with Sentinel-derived features in irrigated cropland identification, this study found that AEF embeddings exhibited stronger class discriminative capacity under different learning paradigms. Regardless of whether complex ensemble models such as RF, simple linear models such as Linear-SVM, or unsupervised K-means clustering were employed, AEF features consistently outperformed conventional optical and SAR-derived features across all evaluation metrics [36]. Beyond the accuracy gains, AEF embeddings also reduce the dependence on extensive feature engineering and time-series preprocessing, providing directly usable representations for classification and spatial comparison analyses even when satellite time series are incomplete and effective observations are limited, which improves the operational practicality and consistency of the workflow.
Conventional feature engineering approaches, such as NDVI and NDWI, are explicitly designed to capture specific physical attributes. These indices are constructed based on prior knowledge of biophysical processes (e.g., vegetation greenness or moisture-related reflectance differences) and approximate land surface conditions through simple linear combinations of spectral bands [37]. In contrast, top AEF embeddings such as A29 and A23 are latent features learned through self-supervised training on massive, multi-source satellite imagery, rather than manually defined variables targeting a specific physical attribute. As such, they should not be directly interpreted as one-to-one proxies of individual biophysical variables such as soil moisture or evapotranspiration. Instead, they may reflect composite signals related to crop condition under irrigated management, moisture-temperature interactions, and field-level spatial heterogeneity. A more rigorous linkage between top embeddings and external biophysical variables would require additional auxiliary datasets and dedicated validation, which is beyond the scope of the current study and should be explored in future work.
More broadly, AEF-derived features are learned through self-supervised training on massive, multi-source global satellite imagery, including multimodal optical and SAR observations, resulting in a continuous, high-dimensional embedding space [12]. Rather than relying on manually defined rules, this training paradigm allows the model to discover and encode data-driven patterns directly. In this study, the advantage of AEF embeddings lies in their ability to capture complex spatiotemporal patterns, which traditional indices struggle to represent, through the implicit fusion of optical, SAR, and other multimodal data [38]. For instance, AEF embeddings may encode composite signals related to crop condition under irrigated management, moisture-temperature interactions, and field-level spatial heterogeneity that are not readily described by simple band-ratio indices. This is consistent with the higher JM distances observed for AEF features, enabling clearer discrimination between irrigated and rainfed croplands and yielding consistently improved classification performance (e.g., OA > 0.9 under the within-region accuracy assessment). Overall, AEF embeddings can be viewed as providing a more expressive representation space for irrigation-related land-surface characterization than conventional handcrafted indices. These results suggest that the significance of AEF embeddings extends beyond the specific accuracy gains observed for irrigated cropland identification. Because irrigation status is closely related to agricultural land-surface conditions within broader cropland and land use and land cover systems, the enhanced spatiotemporal representation provided by AEF embeddings may offer useful support for regional-scale agricultural mapping tasks that depend on subtle management-related differences. Nevertheless, the observed degradation under cross-region transfer indicates that such representations remain influenced by regional context. As a result, their broader application in agricultural LULC mapping still requires careful validation across different environments and cropping systems.
5.2. Transferability of AEF Features
AEF feature-driven models exhibited contrasting generalization behaviors, showing robust temporal stability while demonstrating pronounced context dependency in the spatial dimension. For temporal generalization, models trained on 2022 data maintained comparable performance when evaluated on 2023 and 2024 data (e.g., OA = 0.87–0.88 under the cross-year setting). These results indicate that AEF embeddings preserve relatively stable temporal information relevant to irrigation-related land surface dynamics, supporting cross-year transferability across the tested years in the same study area. In contrast, model performance declined substantially under cross-region transfer. This decline is unlikely to be explained solely by feature quality, as AEF features still achieved high performance when models were trained locally on Kansas data (e.g., OA ≈ 0.93). A more plausible explanation is that supervised training in the source region (the Guanzhong Plain) induces region-specific associations that do not hold in the target region, consistent with the notion of region-specific bias [39]. The Guanzhong Plain is dominated by winter wheat–summer maize rotation systems, with irrigation activities characterized by a distinct bimodal seasonal pattern, in which winter irrigation for overwintering wheat generates unique surface temperature and soil-moisture signals during the winter season. Models trained in this region may therefore rely on seasonal cues that are correlated with irrigation occurrence. In Kansas, where wheat and maize are the dominant crops but are generally grown under a single-cropping system, irrigation is largely concentrated during the growing season, and the seasonal organization of cropland differs from that of the Guanzhong Plain. Winter-season surface conditions are primarily controlled by local climate rather than irrigation management. As a result, cross-region degradation may reflect negative transfer caused by mismatched cropping systems, phenological regimes, irrigation timing, management practices, and environmental backgrounds, rather than a lack of discriminative information in the embeddings themselves. This highlights that improving spatial generalization requires reducing reliance on region-specific contextual correlations while retaining transferable representations. Accordingly, the present results suggest that the proposed AEF-based framework is more reliable for within-region and cross-year applications, whereas direct cross-region transfer should be applied with caution when substantial differences exist in cropping systems, phenological patterns, irrigation management, and environmental background. From the perspective of agricultural LULC classification, irrigated cropland identification depends not only on static surface information but also on crop phenology and irrigation management. The results of this study suggest that AEF embeddings provide an effective data representation for this task.
5.3. Limitations and Future Work
Although this study demonstrated the advantages of AEF embeddings for irrigated cropland identification, several limitations remain. Experiments were conducted in only two temperate agricultural regions—the Guanzhong Plain in China and Kansas in the USA—with a temporal coverage limited to two years. The performance of AEF features has not yet been assessed in other agroecological systems (e.g., tropical rice paddies or orchards with drip irrigation) or under more diverse climate conditions. Substantial degradation was observed when models were transferred from the Guanzhong Plain to Kansas. However, the relative contributions of (i) management and cropping-system differences (e.g., irrigation timing and crop composition), and (ii) geographic distribution shifts remain unclear and were not quantified in this study. In addition, because AEF is a pretrained multi-source representation and the detailed contribution of each encoded data source is not explicitly available, the individual roles of Sentinel-1/2 and the other auxiliary inputs could not be disentangled in the present study. Moreover, although the Sentinel-based features were constructed from year-long Sentinel-1/2 time-series observations using 15-day compositing intervals to improve temporal comparability with the annual AEF embeddings, differences in compositing strategy, preprocessing pipeline, and source-data integration may still introduce some uncertainty into the comparative conclusions. Another limitation is that the interpretation of individual embedding dimensions remains qualitative. Although dimensions such as A29 and A23 exhibited meaningful spatial patterns and class-separation behavior, their relationships with specific physical variables were not quantitatively analyzed in this study. Future work should adopt controlled evaluation designs—such as stratifying experiments by crop type and season window, and constructing cross-region transfer matrices across multiple regions—to disentangle these factors and to identify conditions under which AEF-based models can achieve more reliable spatial transfer. Future work should also investigate the relationships between embedding dimensions and known physical variables to improve the interpretability of learned geospatial representations.
6. Conclusions
To evaluate the applicability of AEF embeddings for irrigated and rainfed cropland mapping, this study systematically assessed their feature separability, classification performance, and spatiotemporal transferability in the Guanzhong Plain (China) and Kansas (USA). The 64 embedding dimensions exhibited strong intrinsic separability, with the most discriminative dimension (A29) reaching a maximum JM distance of 1.58; notably, unsupervised K-means clustering on AEF embeddings achieved OA > 0.85, indicating a well-structured embedding space for distinguishing irrigated from rainfed croplands. Across supervised models, AEF-based classifiers consistently outperformed conventional Sentinel-derived bands and indices, with RF reaching OA of 0.95 in the Guanzhong Plain and 0.93 in Kansas. Transfer experiments further demonstrated stable cross-year performance (OA > 0.87), whereas cross-region transfer showed pronounced degradation (OA ≈ 0.3), suggesting that spatial generalization is constrained by regional differences in irrigation regimes, crop phenology, and management practices. Overall, AEF embeddings provide a compact, high-information-density representation that can substantially improve irrigation mapping within consistent regional contexts, while the cross-region results highlight the importance of addressing region-specific bias for operational large-area applications.
Author Contributions
Y.G. and L.Y. conceived and designed the methodology; R.M., S.X. and L.Y. were responsible for figure preparation and visualization; R.W., X.Z. (Xiangyang Zhao) and N.L. provided ground-truth sample data; L.Y. processed and analyzed the data; X.Z. (Xiao Zhang) provided overall conceptual guidance and supervised the study framework; Y.G. and L.Y. wrote, reviewed and edited the manuscript; funding acquisition, R.W. All authors have read and agreed to the published version of the manuscript.
Funding
This research was supported by the National Natural Science Foundation of China (Grant No. 32270277), the National Key Research and Development Program of China (Grant No. 2024YFD2300205), and the Shaanxi Provincial Key Research and Development Program (Grant No. 2024NC-ZDCYL-01-02).
Data Availability Statement
The AlphaEarth Foundation (AEF) embedding features used in this study are publicly available through the GEE platform at https://developers.google.com/earth-engine/datasets/catalog/GOOGLE_SATELLITE_EMBEDDING_V1_ANNUAL (accessed on 20 March 2026); the annual composite product for 2022 with a spatial resolution of 10 m was utilized. Sentinel-1 and Sentinel-2 data are openly available from the ESA Copernicus Open Access Hub and the Google Earth Engine platform at https://developers.google.com/earth-engine/datasets/catalog/COPERNICUS_S1_GRD (accessed on 20 March 2026); https://developers.google.com/earth-engine/datasets/catalog/COPERNICUS_S2_SR_HARMONIZED (accessed on 20 March 2026). The ground truth samples used for model training and validation are available from the corresponding author upon reasonable request.
Acknowledgments
The authors would like to acknowledge the European Space Agency (ESA) for providing the Sentinel-1 and Sentinel-2 satellite datasets.
Conflicts of Interest
The authors declare no conflicts of interest.
Appendix A
Table A1.
Long-term JM distance distributions of 16 Sentinel-derived features in 2022.
Table A2.
Accuracy metrics and confusion-matrix components of different models for irrigation classification in the Guanzhong study area.
Table A3.
Accuracy metrics and confusion-matrix components of different models for irrigation classification in the Kansas study area.
References
- Zhang, L.; Zhang, K.; Zhu, X.; Chen, H.; Wang, W. Integrating remote sensing, irrigation suitability and statistical data for irrigated cropland mapping over mainland China. J. Hydrol. 2022, 613, 128413. [Google Scholar] [CrossRef] [Scilit]
- Cui, X.; Zhong, Z. Climate change, cropland adjustments, and food security: Evidence from China. J. Dev. Econ. 2024, 167, 103245. [Google Scholar] [CrossRef] [Scilit]
- van Dijk, M.; Geurtsen, S. Mapping Irrigated Areas in China Using a Synergy Approach. Water 2023, 15, 1666. [Google Scholar] [CrossRef] [Scilit]
- Wu, S.Y.; Bao, Y.S.; Li, Y.F.; Wu, Y. Joint retrieval of soil moisture from Sentinel-1 and Sentinel-2 remote sensing data based on neural network algorithm. Trans. Atmos. Sci. 2021, 44, 636–644. [Google Scholar]
- Chen, Y.; Lu, D.; Luo, L.; Pokhrel, Y.; Deb, K.; Huang, J.; Ran, Y. Detecting irrigation extent, frequency, and timing in a heterogeneous arid agricultural region using MODIS time series, Landsat imagery, and ancillary data. Remote Sens. Environ. 2018, 204, 197–211. [Google Scholar] [CrossRef] [Scilit]
- Li, W.; Sun, Y.; Zhou, Y.; Gong, L.; Li, Y.; Xin, Q. Mapping irrigated croplands from Sentinel-2 images using deep convolutional neural networks. Remote Sens. 2023, 15, 4071. [Google Scholar] [CrossRef] [Scilit]
- Elwan, E.; Le Page, M.; Jarlan, L.; Baghdadi, N.; Brocca, L.; Modanesi, S.; Dari, J.; Quintana Seguí, P.; Zribi, M. Irrigation Mapping on Two Contrasted Climatic Contexts Using Sentinel-1 and Sentinel-2 Data. Water 2022, 14, 804. [Google Scholar] [CrossRef] [Scilit]
- Sun, Y.; Kosmas, P. Meta-forests: Domain generalization on random forests with meta-learning. In Proceedings of the 15th Asian Conference on Machine Learning 2024, İstanbul, Turkey, 11–14 November 2023; pp. 1292–1307. [Google Scholar]
- Zhang, L.; Xie, Y.; Zhu, X.; Ma, Q.; Brocca, L. CIrrMap250: Annual maps of China’s irrigated cropland from 2000 to 2020 developed through multisource data integration. Earth Syst. Sci. Data 2024, 16, 5207–5226. [Google Scholar] [CrossRef] [Scilit]
- Li, W.; Xiao, C.; Liang, X.; Yang, W.; Zhang, J.; Dai, R.; La, Y.; Kang, L.; Zhao, D. Precision Identification of Irrigated Areas in Semi-Arid Regions Using Optical-Radar Time-Series Features and Ensemble Machine Learning. Hydrology 2025, 12, 214. [Google Scholar] [CrossRef] [Scilit]
- Tsaris, A.; Dias, P.A.; Potnis, A.; Yin, J.; Wang, F.; Lunga, D. Pretraining Billion-scale Geospatial Foundational Models on Frontier. In 2024 IEEE International Parallel and Distributed Processing Symposium Workshops (IPDPSW); IEEE: New York, NY, USA, 2024. [Google Scholar]
- Brown, C.F.; Kazmierski, M.R.; Pasquarella, V.J.; Rucklidge, W.J.; Samsikova, M.; Zhang, C.; Shelhamer, E.; Lahera, E.; Wiles, O.; Ilyushchenko, S. Alphaearth foundations: An embedding field model for accurate and efficient global mapping from sparse label data. arXiv 2025, arXiv:2507.22291. [Google Scholar] [CrossRef] [Scilit]
- Houriez, L.; Pilarski, S.; Vahedi, B.; Ahmadalipour, A.; Scully, T.H.; Aflitto, N.; Andre, D.; Jaffe, C.; Wedner, M.; Mazzola, R. Scalable geospatial data generation using AlphaEarth foundations model. arXiv 2025, arXiv:2508.11739. [Google Scholar] [CrossRef] [Scilit]
- Cai, Y.; Li, B.; Liu, X.; Jiang, X.; Zhu, Y.; Luo, S.; Qin, Y.; Xie, S.; Ye, J.; Shen, H.; et al. Annual 10-m high-resolution cropland maps for Southeast Asia since 2019 using AlphaEarth embeddings. Earth Syst. Sci. 2026, 2026, 1–30. [Google Scholar] [CrossRef] [Scilit]
- Deressu, T.F.; Bojer, A.K.; Debelee, T.G.; Negera, W.G.; Nadarajah, S.; Gebissa, K.W. Enhancing land use and land cover classification with deep learning-based satellite imagery segmentation. Int. J. Appl. Earth Obs. Geoinf. 2025, 144, 104839. [Google Scholar] [CrossRef] [Scilit]
- Fu, Y.; Tong, T.; Li, W.; Zhao, Z.; Wang, L. Establishment of Soil Nutrient Index System for Winter Wheat in Guanzhong Irrigation Areas of Shaanxi Province. J. Triticeae Crops 2009, 29, 897–900. [Google Scholar]
- Baldwin, K.; Williams, B.; Sichko, C.; Tsiboe, F.; Toossi, S.; Jones, J.; Turner, D.; Skorbiansky, S.R. US Agricultural Policy Review; USDA/ERS: Washington, DC, USA, 2023.
- Hunt, K.; Beeson, P. The Crop Sequence Boundaries using 2016–2023 USDA National Agricultural Statistics Service Historical Cropland Data Layers. In Proceedings of the AGU Fall Meeting Abstracts, Washington, DC, USA, 9–13 December 2024. [Google Scholar]
- Bengio, Y.; Courville, A.; Vincent, P. Representation learning: A review and new perspectives. IEEE Trans. Pattern Anal. Mach. Intell. 2013, 35, 1798–1828. [Google Scholar] [CrossRef] [Scilit] [PubMed]
- Bazzi, H.; Baghdadi, N.; Ienco, D.; El Hajj, M.; Zribi, M.; Belhouchette, H.; Escorihuela, M.J.; Demarez, V. Mapping irrigated areas using Sentinel-1 time series in Catalonia, Spain. Remote Sens. 2019, 11, 1836. [Google Scholar] [CrossRef] [Scilit]
- Patel, P.; Srivastava, H.S.; Panigrahy, S.; Parihar, J.S. Comparative evaluation of the sensitivity of multi-polarized multi-frequency SAR backscatter to plant density. Int. J. Remote Sens. 2006, 27, 293–305. [Google Scholar] [CrossRef] [Scilit]
- Drusch, M.; Del Bello, U.; Carlier, S.; Colin, O.; Fernandez, V.; Gascon, F.; Hoersch, B.; Isola, C.; Laberinti, P.; Martimort, P.; et al. Sentinel-2: ESA’s optical high-resolution mission for GMES operational services. Remote Sens. Environ. 2012, 120, 25–36. [Google Scholar] [CrossRef] [Scilit]
- Kriegler, F.J. Preprocessing transformations and their effects on multspectral recognition. In Proceedings of the Sixth International Symposium on Remote Sesning of Environment, Ann Arbor, MI, USA, 13–16 October 1969. [Google Scholar]
- Gao, B.-C. NDWI—A normalized difference water index for remote sensing of vegetation liquid water from space. Remote Sens. Environ. 1996, 58, 257–266. [Google Scholar] [CrossRef] [Scilit]
- Huete, A.; Didan, K.; Miura, T.; Rodriguez, E.P.; Gao, X.; Ferreira, L.G. Overview of the radiometric and biophysical performance of the MODIS vegetation indices. Remote Sens. Environ. 2002, 83, 195–213. [Google Scholar] [CrossRef] [Scilit]
- Ulaby, F.T.; Moore, R.K.; Fung, A.K. Microwave remote sensing: Active and passive. In Radar Remote Sensing and Surface Scattering and Emission Theory; Longman Higher Education: London, UK, 1982; Volume 2. [Google Scholar]
- Wacker, A.G. Minimum Distance Approach to Classification; Purdue University: West Lafayette, IL, USA, 1972. [Google Scholar]
- MacQueen, J. Multivariate observations. In Proceedings of the 5th Berkeley Symposium on Mathematical Statisticsand Probability; University of California Press: Oakland, CA, USA, 1967. [Google Scholar]
- Tian, L.; Tang, Y.; Hu, L.; Ren, Z.; Zhang, W. Domain adaptation by class centroid matching and local manifold self-learning. IEEE Trans. Image Process. 2020, 29, 9703–9718. [Google Scholar] [CrossRef] [Scilit] [PubMed]
- Quinlan, J.R. Induction of decision trees. Mach. Learn. 1986, 1, 81–106. [Google Scholar] [CrossRef] [Scilit]
- Breiman, L. Random forests. Mach. Learn. 2001, 45, 5–32. [Google Scholar] [CrossRef] [Scilit]
- Friedman, J.H. Greedy function approximation: A gradient boosting machine. Ann. Stat. 2001, 29, 1189–1232. [Google Scholar] [CrossRef] [Scilit]
- Cortes, C.; Vapnik, V. Support-vector networks. Mach. Learn. 1995, 20, 273–297. [Google Scholar] [CrossRef] [Scilit]
- Rumelhart, D.E.; Hinton, G.E.; Williams, R.J. Learning representations by back-propagating errors. Nature 1986, 323, 533–536. [Google Scholar] [CrossRef] [Scilit]
- Maxwell, A.E.; Warner, T.A.; Fang, F. Implementation of machine-learning classification in remote sensing: An applied review. Int. J. Remote Sens. 2018, 39, 2784–2817. [Google Scholar] [CrossRef] [Scilit]
- Khan, H.; Ahmad, A. Evaluating AlphaEarth Foundation Embeddings for Pixel-and Object-Based Land Cover Classification in Google Earth Engine. Preprints 2025, 2025112172. [Google Scholar]
- Hu, S.; Zhang, C.; Qiao, N.; Sun, X.; Zhong, T. Universal normalized vegetation index (UNVI) and UNVI software based on IDL. Natl. Remote Sens. Bull. 2021, 23, 952–958. [Google Scholar]
- Xiao, A.; Xuan, W.; Wang, J.; Huang, J.; Tao, D.; Lu, S.; Yokoya, N. Foundation models for remote sensing and earth observation: A survey. IEEE Geosci. Remote Sens. Mag. 2025, 13, 297–324. [Google Scholar] [CrossRef] [Scilit]
- Tollefson, J. Google AI model creates maps of Earth ‘at any place and time’. Nature 2025, 644, 313. [Google Scholar] [CrossRef] [Scilit] [PubMed]

Disclaimer/Publisher’s Note: The statements, opinions and data contained in all publications are solely those of the individual author(s) and contributor(s) and not of MDPI and/or the editor(s). MDPI and/or the editor(s) disclaim responsibility for any injury to people or property resulting from any ideas, methods, instructions or products referred to in the content. |
© 2026 by the authors. Licensee MDPI, Basel, Switzerland. This article is an open access article distributed under the terms and conditions of the Creative Commons Attribution (CC BY) license.