


Highlights
What are the main findings?
- We proposed a novel map feature perception (MFP) metric that evaluates AI-generated map quality based on high-level semantic features and topological relationships rather than raw pixels.
- Experiments demonstrate that MFP significantly outperforms traditional metrics (PSNR, SSIM) and modern perceptual metrics (DISTS, LPIPS-ViT), showing higher consistency with human subjective choices.
What are the implications of the main findings?
- The MFP metric can be integrated as a robust loss function to optimize generative models, leading to more accurate and structurally sound automated map generation.
- This study provides a standardized evaluation framework that bridges the gap between general computer vision metrics and professional cartographic requirements.
Abstract
Evaluating the quality of synthesized maps remains a critical challenge in generative cartography. Prevailing methods rely on pixel-wise computer vision metrics (e.g., PSNR, SSIM). However, these metrics prioritize low-level signal fidelity over high-level geographical logic features and treat pixels as independent units, which prevents them from capturing the complex topological interdependencies and global semantics inherent in maps. Consequently, they inadequately assess essential cartographic features and spatial relationships, often producing outputs with semantic and structural artifacts. To address this limitation, we introduce the map feature perception (MFP) metric, a novel approach that quantifies disparities in high-level cartographic structures and spatial configurations. Unlike pixel-based comparisons, MFP extracts deep elemental-level features to encode cartographic structural integrity and topological relationships comprehensively. Experimental validation demonstrates MFP’s superior capability in evaluating cartographic semantics. Furthermore, when implemented as a loss function, our MFP-based objective consistently outperforms conventional loss functions across diverse generative frameworks and benchmarks. Our findings establish that explicitly optimizing for cartographic features and spatial coherence is crucial for enhancing the geographical plausibility of synthesized maps.
1. Introduction
Modern map services are essential to various domains, including emergency response, disaster management, and urban planning. However, traditional cartographic workflows, which are heavily reliant on manual surveying and digitization, struggle to meet the escalating demands for real-time geospatial information in dynamic environments. This limitation has driven the development of automated and intelligent cartographic methods. Concurrently, advances in remote sensing technologies provide an unprecedented volume of high-resolution imagery. Deep generative models leverage these data, presenting a powerful alternative to conventional map production. Despite this synergy, a pivotal challenge persists in generative cartography: enhancing the realism of synthesized maps while preserving their geographic integrity. Consequently, the quality assessment of generated outputs is not merely an evaluative step but a foundational component that dictates the efficacy of the entire generative pipeline.
The predominant method for assessing the quality of maps generated by architectures like cGAN [1] and DDPM [2] has been the application of pixel-level metrics such as peak signal-to-noise ratio (PSNR) and mean squared error (MSE) [3]. While these metrics can reflect geometric accuracy to some extent, their pixel-level nature prevents them from evaluating critical cartographic semantics and structural integrity. Specifically, these metrics treat pixels as independent units, prioritizing numerical fidelity (such as brightness and contrast) while neglecting spatial relationships. In cartography, minute pixel displacements can lead to significant topological errors (such as road network disconnections), yet pixel-based metrics fail to adequately penalize such issues, thus remaining confined to a “low-level” perceptual understanding. Furthermore, they are limited in their ability to evaluate stylistic consistency and chromatic precision. Perceptual metrics like SSIM [4], despite incorporating considerations of the human visual system, also demonstrate inherent inadequacies in cartographic contexts, often producing misleading assessments that correlate poorly with actual map usability.
In response to the limitations of pixel-wise evaluation, modern methodologies have shifted towards neural-driven metrics such as the Fréchet inception distance (FID) [5] that utilize deep feature extractors to measure disparities in high-level semantic representations. A common approach formulates a perceptual loss by computing the L2 distance between feature activations in pre-trained networks like VGG [6]. The learned perceptual image patch similarity (LPIPS) metric [7] builds upon this foundation to improve spatial fidelity. However, the efficacy of these advanced metrics is constrained by a fundamental domain gap; they are typically pre-trained on natural image datasets (e.g., ImageNet), rendering them insensitive to the unique structural and topological properties of cartographic data. This insensitivity to geospatial specifics limits their performance and necessitates the use of models with more domain-aware feature representations.
To bridge this domain gap, one strategy involves developing task-specific models, such as those using the multi-scale discriminative feature (MDF) loss [8], that can achieve superior perceptual alignment but are constrained by high retraining costs and poor generalization. In contrast, large-scale vision foundation models represent a more transformative paradigm, offering remarkable zero-shot generalization to a wide array of downstream tasks. This shift is evident in the geospatial domain, where pre-trained networks are widely adopted for remote sensing interpretation [9,10,11,12]. Notably, the Vision Transformer (ViT) [13] and its variants [14] have established new benchmarks in automated geospatial feature extraction by addressing challenges in multi-scale processing and computational efficiency. The demonstrated power of these foundation models to discriminate complex geospatial features suggests their profound potential to serve as the basis for a more semantically aware and structurally robust evaluation framework for generative cartography.
Despite advances in neuro-inspired metrics, there remains a lack of evaluation frameworks specifically designed for the unique demands of generative mapping. Existing neural metrics are largely optimized for natural image scenarios, lacking specialized encoding for cartographic principles or topological consistency. This often leads to the occurrence of “geographic hallucinations” where the model generates visually plausible but logically invalid map elements. This phenomenon is similar to the object hallucinations observed in large vision–language models where synthesized content lacks factual or structural grounding [15]. Consequently, suboptimal pixel-level comparisons are often employed for map generation tasks, failing to capture critical higher-order cartographic properties. This reliance on inadequate metrics severely overlooks the geometric fidelity of map elements and their spatial coherence. This discrepancy highlights a crucial need for evaluation metrics that extend beyond the pixel level, focusing instead on the map’s holistic semantic and structural integrity.
To address these limitations, we propose the map feature perception (MFP) metric, a novel evaluation framework leveraging the Vision Transformer (ViT) architecture for deep feature extraction. The primary objective of this metric is to establish a robust benchmark for map fidelity by assessing the discrepancies between generated and reference map images within a high-dimensional semantic feature space. Beyond evaluation, this metric is further integrated as a fidelity loss function to guide the model training process, specifically targeting the enhancement of structural realism in generated maps. Extensive experiments across various generative frameworks—including both GAN-based and diffusion-based models—demonstrate that our proposed method significantly outperforms existing benchmarks in both qualitative and quantitative terms. Specifically, a mean opinion score (MOS) study was conducted, revealing that our approach aligns more closely with human visual perception and geographical common sense compared to traditional evaluation metrics. Furthermore, comprehensive ablation studies confirm the indispensable role of the MFP loss in improving topological continuity and reducing artifacts.
2. Related Work
The advancement of generative cartography is critically contingent upon the methods developed to assess the quality of synthesized maps. While sophisticated deep learning architectures, including generative adversarial networks (GANs) and diffusion models (DMs), have demonstrated significant potential in map generation tasks, their optimization and performance are fundamentally governed by the selected loss functions and evaluation metrics. A persistent challenge remains: the metrics conventionally employed to guide these models often fail to adequately capture the complex spatial structures and semantic features essential for cartographic fidelity. This disconnect between pixel-level optimization and the requirements for geographical plausibility limits the practical utility of current generative techniques.
To address this context, this section reviews the state of the art from two perspectives. We first survey the foundational image-to-image (I2I) translation frameworks that underpin modern generative cartography. We then critically analyze the prevailing evaluation metrics used for generated maps, highlighting the gap that motivates the development of more perceptually and structurally aware assessment methodologies.
2.1. Deep Generative Models in Cartography
I2I translation aims to learn a mapping function between a source and a target domain where the model architecture significantly influences the quality and fidelity of the generated imagery [16]. The objective of this task extends beyond pixel-level replication, aiming instead to capture latent semantic representations and model complex feature distributions. Formally, given data from a specific distribution, generative models learn to synthesize artificial instances that approximate the intrinsic probability distribution of authentic samples [17,18].
Early generative approaches, such as the variational autoencoder (VAE) [19], pioneered probabilistic data modeling but were often limited in synthesizing high-resolution outputs. Subsequently, generative adversarial networks (GANs) became the predominant architecture. The Pix2Pix framework [1], which leverages conditional GANs (cGANs) [20], established a paradigm for supervised cross-domain mapping and demonstrated efficacy in tasks such as semantic label-to-photo conversion and edge-to-object reconstruction. Concurrently, denoising diffusion probabilistic models (DDPMs) [2] have emerged as a powerful alternative, with models like Palette [21] achieving state-of-the-art performance across multiple I2I tasks within a unified framework. Further architectural innovations, including StarGAN for multi-domain translation [22] and unpaired methodologies [23], have significantly broadened the applicability of I2I techniques.
These I2I frameworks provide a robust foundation for addressing persistent challenges in cartography, a field that has traditionally relied on time-intensive manual drawing and feature vectorization [24]. The advent of deep learning has catalyzed a shift toward the automated generation of maps. Initial efforts applied foundational I2I models directly; for instance, cGANs were adapted for the end-to-end conversion of semantic labels to map imagery [1], and the Pix2Pix framework was used to map aerial photographs to standard-scale maps [1]. Building on these precedents, specialized models have been developed to address unique cartographic requirements. The generative adversarial networks for geographical advancement (GeoGAN) integrates reconstruction loss with style transfer mechanisms for generating satellite imagery [25], while TSIT explicitly disentangles semantic structure from style information to enable high-fidelity synthesis [26]. To better preserve cartographic integrity, SMAPGAN incorporates map gradients as a proxy for topological relationships directly into its loss function [27]. More recently, GDFM was proposed to enhance training stability by introducing noise derived from the discriminator’s feedback into the generator’s input [28].
Despite these architectural advancements, a critical limitation pervades existing methodologies. Their optimization objectives and evaluation protocols predominantly rely on pixel-level metrics such as SSIM, L1, and L2 norms. Such metrics are insufficient for verifying semantic accuracy or structural correctness as they primarily measure low-level similarity rather than high-level cartographic fidelity. This reliance on pixel-wise comparisons reveals a fundamental gap between current technical capabilities and the stringent requirements of practical cartographic applications, which demand geographical plausibility and semantic coherence.
2.2. Evaluation Metrics for Generated Maps
The intelligent generation of map scenes is a spontaneous learning process. The results of this generation need to model the location, structure, distribution, interrelationships, and potential laws of multi-dimensional spatial entities. Furthermore, these results must conform to the cognitive framework of the real world as perceived by humans. To continuously optimize and improve the performance of the map scene generation model, it is necessary to scientifically and rationally evaluate and provide feedback on the generation results. In traditional methods for evaluating map quality, many studies primarily rely on similarity metrics, including geometric properties, directionality, and topological relationships, to comprehensively assess the reliability of the generated map. However, these methods often ignore whether the generated map is consistent with human subjective perception. In contrast, research on image quality evaluation in the field of computer vision provides valuable ideas and can draw inspiration from the following three types of methods:
Subjective image quality assessment: Subjective assessment methods directly leverage human perception to evaluate image quality. Amazon Mechanical Turk (AMT) employs a “true/false” forced-choice paradigm for subjective IQA in I2I tasks [1,29]. Participants select real images from pairs containing both real and generated samples, with subsequent feedback analysis producing quantitative scores. The core value of this method lies in its ability to directly capture human perception of the quality of generated maps, effectively reflecting intangible dimensions such as the readability of map-specific elements, the rationality of the symbolic system, overall aesthetic appeal, and alignment with user cognitive habits. This is particularly crucial for evaluating the effectiveness of stylized map generation, and its mandatory selection mechanism also helps reduce scoring biases. However, its high organizational costs, time-consuming nature, and reliance on participants’ professional backgrounds and the clarity of task instructions limit its large-scale application and make it difficult to identify specific quality issues precisely.
Objective image quality assessment: PSNR quantifies intensity differences between translated and reference images, serving as a widely adopted full-reference metric. Its advantage lies in its computational efficiency and direct relevance to tasks that require extremely high geometric precision. However, PSNR is extremely insensitive to more critical structural errors and perceptual differences in maps, and its effectiveness strictly depends on pixel-level perfect alignment between the reference image and the generated image, which is often difficult to achieve in map generation. FID measures distributional divergence between synthetic and real image datasets [5]. The evaluation is performed by comparing the distribution distances between the generated atlas and the real atlas in the depth feature space, without the need for paired reference images. Comparative studies of loss functions (L1, L2, SSIM, MS-SSIM [30]) demonstrate that combined MS-SSIM+L1 achieves superior performance across multiple quality metrics [3]. Research indicates that a hybrid metric combining multi-scale structural similarity (MS-SSIM) and L1 loss outperforms single metrics in balancing structural similarity and pixel fidelity. This combination is, to a certain extent, closer to humans’ comprehensive perception of map structural integrity and detail accuracy. Nevertheless, it still does not depart from the premise of pixel-level comparison.
Feature perceptual evaluation metric: Traditional metrics (PSNR, SSIM) show limited applicability in complex tasks (e.g., super-resolution, 3D reconstruction). Prior studies demonstrate weak correlations between traditional super-resolution metrics and human visual assessment [31]. Perceptual loss leverages deep CNN features (e.g., VGG [6]) to measure semantic, textural, and structural similarity, proving effective for generating complex images. Research reveals that perceptual loss efficacy stems from deep network architectures rather than pre-trained weights [32]. Comparative analyses across network architectures (untrained VGG, pre-trained VGG, SqueezeNet) and training paradigms (supervised, self-supervised, unsupervised) confirm the predictive capability of deep features for visual perception tasks [7]. Building upon this, the learned perceptual image patch similarity (LPIPS) has been extended to utilize Vision Transformer (ViT) backbones (LPIPS-ViT), which better captures long-range spatial dependencies and global context compared to pure CNN-based approaches [7]. Furthermore, the deep image structure and texture similarity (DISTS) metric [33] has emerged to specifically address the balance between structural integrity and texture preservation. By considering the correlation between deep feature maps, DISTS offers enhanced sensitivity to the fine-grained geographical textures and topological patterns essential for high-fidelity map synthesis.
The key inspiration derived from these advancements is that deep feature extractors, especially those utilizing Vision Transformer (ViT) architectures, offer a superior capacity for capturing long-range dependencies and complex spatial configurations compared to traditional pixel-wise methods. While LPIPS-ViT and DISTS demonstrate the potential of deep features in aligning with human perception, they are primarily optimized for natural image scenes. In the field of generative cartography, we have discovered that map-specific evaluation requires specialized mechanisms to distinguish between semantic features and topological integrity. This challenge necessitates a metric that explicitly separates these two dimensions to ensure the geographical plausibility of synthesized maps. Can we leverage the semantic encoding capabilities of foundational models to construct an evaluation framework that is both semantically sensitive and structurally robust?
3. Methodology
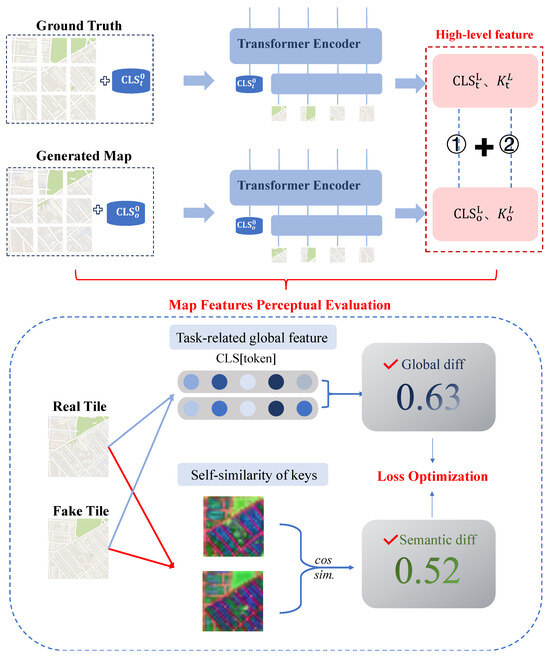
In the image translation task, pre-trained VGG is commonly used as an image feature extractor, and the difference in features is compared as a perceptual loss. Building upon this concept, our map feature perception (MFP) metric is specifically inspired by the feature decoupling framework of Tumanyan et al. [34], which demonstrates that DINO-ViT features can effectively separate global appearance from spatial structure. We identify a unique and natural transferability of this mechanism to generative cartography due to the inherent alignment between ViT feature representation and cartographic elements. Specifically, the global information captured by [CLS] tokens corresponds to the map style, including color schemes and symbology, while the self-similarity of Keys represents the geographic topology and grid-based spatial relationships, such as road network connectivity and building arrangements.
As shown in Figure 1, our proposed metric combines the advantages of traditional evaluation metrics (FID, SSIM, PSNR) with these deep semantic capabilities. However, we introduce targeted improvements to adapt this framework for the specific requirements of map synthesis. Unlike general image splicing, we discard the identity loss to allow for higher abstraction in cross-modal translation and implement an asymmetric 10:1 weighting scheme between global and local features. This prioritization ensures that high-level geographical semantics dominate the optimization process. By leveraging the semantic capabilities of the ViT model as a feature extractor for maps, it is possible to obtain semantic-level contextual information and better evaluate the differences between maps. This information is then fed back into the model training process to enhance the quality of the generated maps.
Figure 1.
Overview of methods for evaluating map features. Among them, [CLS] token is an additional learnable global feature in ViT, and represents the keyword of the self-attention layer QKV of the L (i.e., last) layer block, which is used to represent the deep semantic features of the map. Finally, the global feature G and semantic similarity S of the map are calculated. ➀ represents the group of [CLS] tokens ( and ), while ➁ denotes the Key (K) vectors ( and ) derived from the final self-attention layer.
Next, we introduce the semantic features in the ViT model. In Section 3.1, we describe our map feature perception metrics, and in Section 3.2, we propose the concept of map perception loss.
3.1. Map Feature Perception Metric
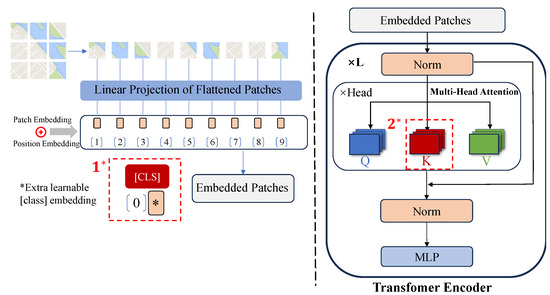
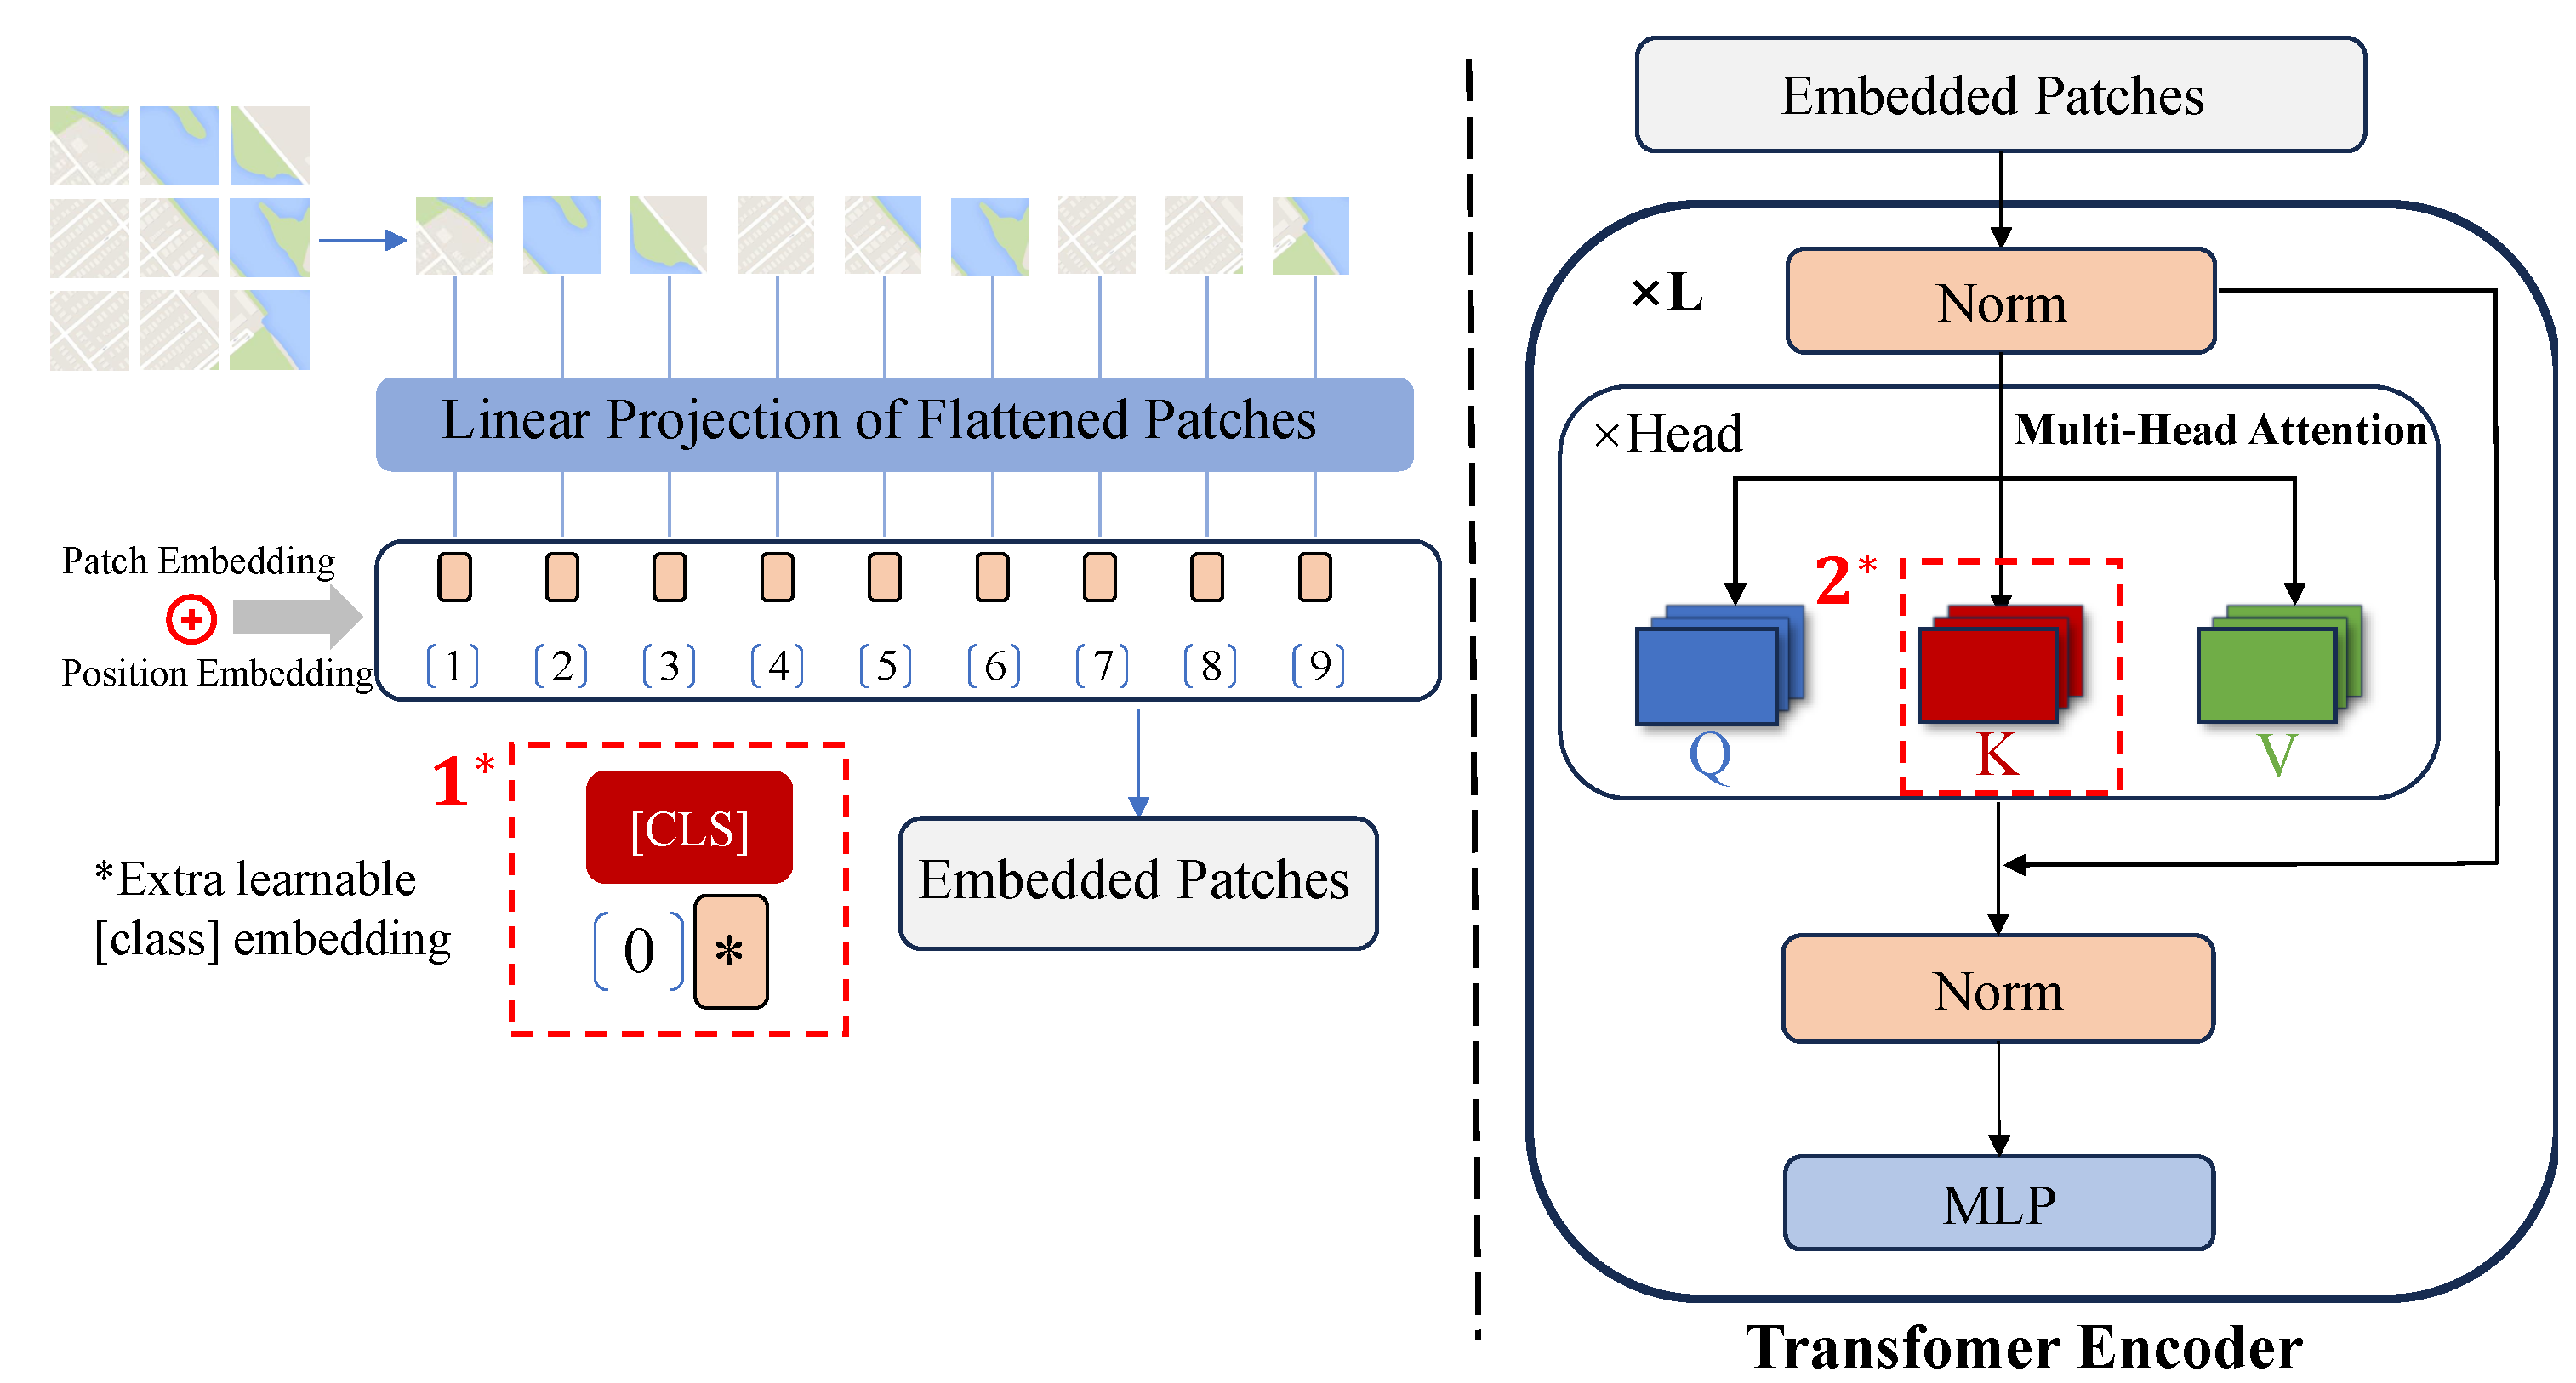
To capture the unique characteristics of digital maps, such as spatial correlation and element diversity, we build upon the findings of Amir et al. [35], who demonstrated that the deep features extracted in ViT can be used as dense visual descriptors. Zhang et al. [36] show that the features extracted by the self-supervised training DINO-ViT model, a ViT model pre-trained using the self-distillation with no labels (DINO) framework, have less noise than those of the supervised ViT model and that the deep (usually the last) layer features have local semantic information similar to that of the semantic object part. It is also noted in [37] that DINO-ViT exhibits stronger semantic capabilities and is less noisy when acquiring images. Based on these properties, we adopt a pre-trained DINO-ViT model as our feature extractor. Our proposed MFP metric evaluates map quality from two complementary aspects: global feature consistency and local spatial similarity. See Figure 2 for details.
Figure 2.
Forward propagation process diagram of ViT. 1*: The overall layout is used with additional learnable classification tokens. 2*: ViT’s multi-head self-attention mechanism after multiple propagation layers, where the tensor key focuses on rich semantic features in each image block. Numbers 1–9 represent positional encodings.
To better understand the rich features in the map, we follow the steps of ViT to process the image [13], and the map I is processed into n non-overlapping image blocks. The specific trend is as follows:
- (1)
- Input processing: The input map is divided into n image blocks (patches) of size P × P, and each image block is flattened into a vector . Then, it is mapped to the d-dimensional space by linear embedding to obtain the embedding vector .where is the linear embedding matrix. The positional encoding adds a learnable [CLS] token as a global representation of the image.
- (2)
- Transformer Encoder: The input tensor z, formed by adding the position encoding, will pass through L Transformer layers. Each Transformer encoder layer consists of a multi-head self-attention (MSA) and a multi-layer perceptron (MLP), utilizing layer normalization (LN) and residual connections.where is the output of the layer l.
3.1.1. Global Feature Evaluation
Global map features refer to the overall characteristics and macrostructure of the map. For example, the map’s color scheme and visual style, the type of scene it represents (such as city, countryside, etc.), and the semantic information on the map (including roads, buildings, rivers, etc.). The [CLS] token, after being expressed through the model (after passing through the L-layer ), contains a feature classification and understanding of the map. Therefore, we reasonably use [CLS] tokens to represent global map information. Given the generated map and the reference map , the corresponding and are obtained through the DINO-ViT model to represent the map’s global information. Then, the difference between the two global features of the map is expressed by the following formula:
The mean square error (MSE) calculates the average error of the global features between the generated and reference maps. A higher G value indicates a smaller MSE between the [CLS] tokens, suggesting greater similarity in the overall scene characteristics (e.g., layout, style, and composition of elements like buildings and vegetation).
3.1.2. Map Spatial Similarity
To assess map spatial similarity, an index is needed to evaluate the degree of similarity between the structure of a local area on the map and the overall map, as well as to identify various spatial relationships (such as distance and distribution) between elements. As stated in [35], the Transformer model demonstrates a transition in feature representation from low-level features, such as edges and textures, to high-level semantic features as the number of layers increases. In other words, ViT has captured richer semantic information in the last self-attention layer, which is very important for understanding the global structure and semantic relationships of images. This aligns with our previous assertion in Section 3.1 that deep features are highly effective as dense visual descriptors. Therefore, we can use ViT’s self-attention mechanism to capture the relationships and similarities between different regions on the map. By calculating the key (i.e., ) of the multi-head self-attention layer, we can obtain similar information between different parts of the map:
Among them, L is the last layer of self-attention, is the spatial feature key of the last layer, is the input of the L layer, and is the weight matrix of the L layer key. The cosine similarity is used to obtain the self-similarity matrix of the key, where n is the number of patches after the image is divided.
In the map’s self-similarity descriptor S, the local texture and the surrounding spatial layout, shape, and perceptual semantics can be well retained while discarding the map’s appearance information. This has been demonstrated to be effective in previous studies [38]. We chose the key’s self-similarity to represent the map’s spatial similarity, rather than using query and value [35].
3.2. Map Feature Perception Loss
Based on the map feature perception metric we proposed in Section 3.1, we know that our understanding of the map is divided into two parts, so our objective function is transformed into the following, divided into two parts: the loss of global features and the loss of map spatial semantics, which can be expressed as
where is denoted as the global feature loss (see Equation (4)), is expressed as the spatial semantic loss (see Equation (7)), and and are the hyperparameters of the two. We set , based on the experimental settings.
It should be noted that the loss is unstable only on features extracted from the deep network [23]. Due to pooling in the network’s hidden layers, there is no guarantee that each input has a unique potential representation. Feature loss is, therefore, often combined with a regularization term (e.g., the L2 or L1 norm), and the weights of each loss component need to be carefully tuned. In this paper, our loss also incorporates the L1 loss, which is uniformly referred to as the map feature perception loss. It will not be described in detail here.
4. Experimental Evaluation and Analysis
This section presents a series of experiments designed to validate our proposed metrics for map generation tasks. We first introduce the experimental design, including the datasets, baseline models, and the conventional metrics used for comparison. We then establish the validity of our metrics by correlating their outputs with those of established metrics across various generative models and analyzing the resulting trends. Subsequently, we conduct both qualitative and quantitative experiments to benchmark the performance of different translation methods and to investigate the influence of various loss functions on the quality of the generated maps. Finally, we provide a detailed interpretation of the proposed metrics, highlighting their practical and theoretical significance.
4.1. Experimental Details
4.1.1. Datasets
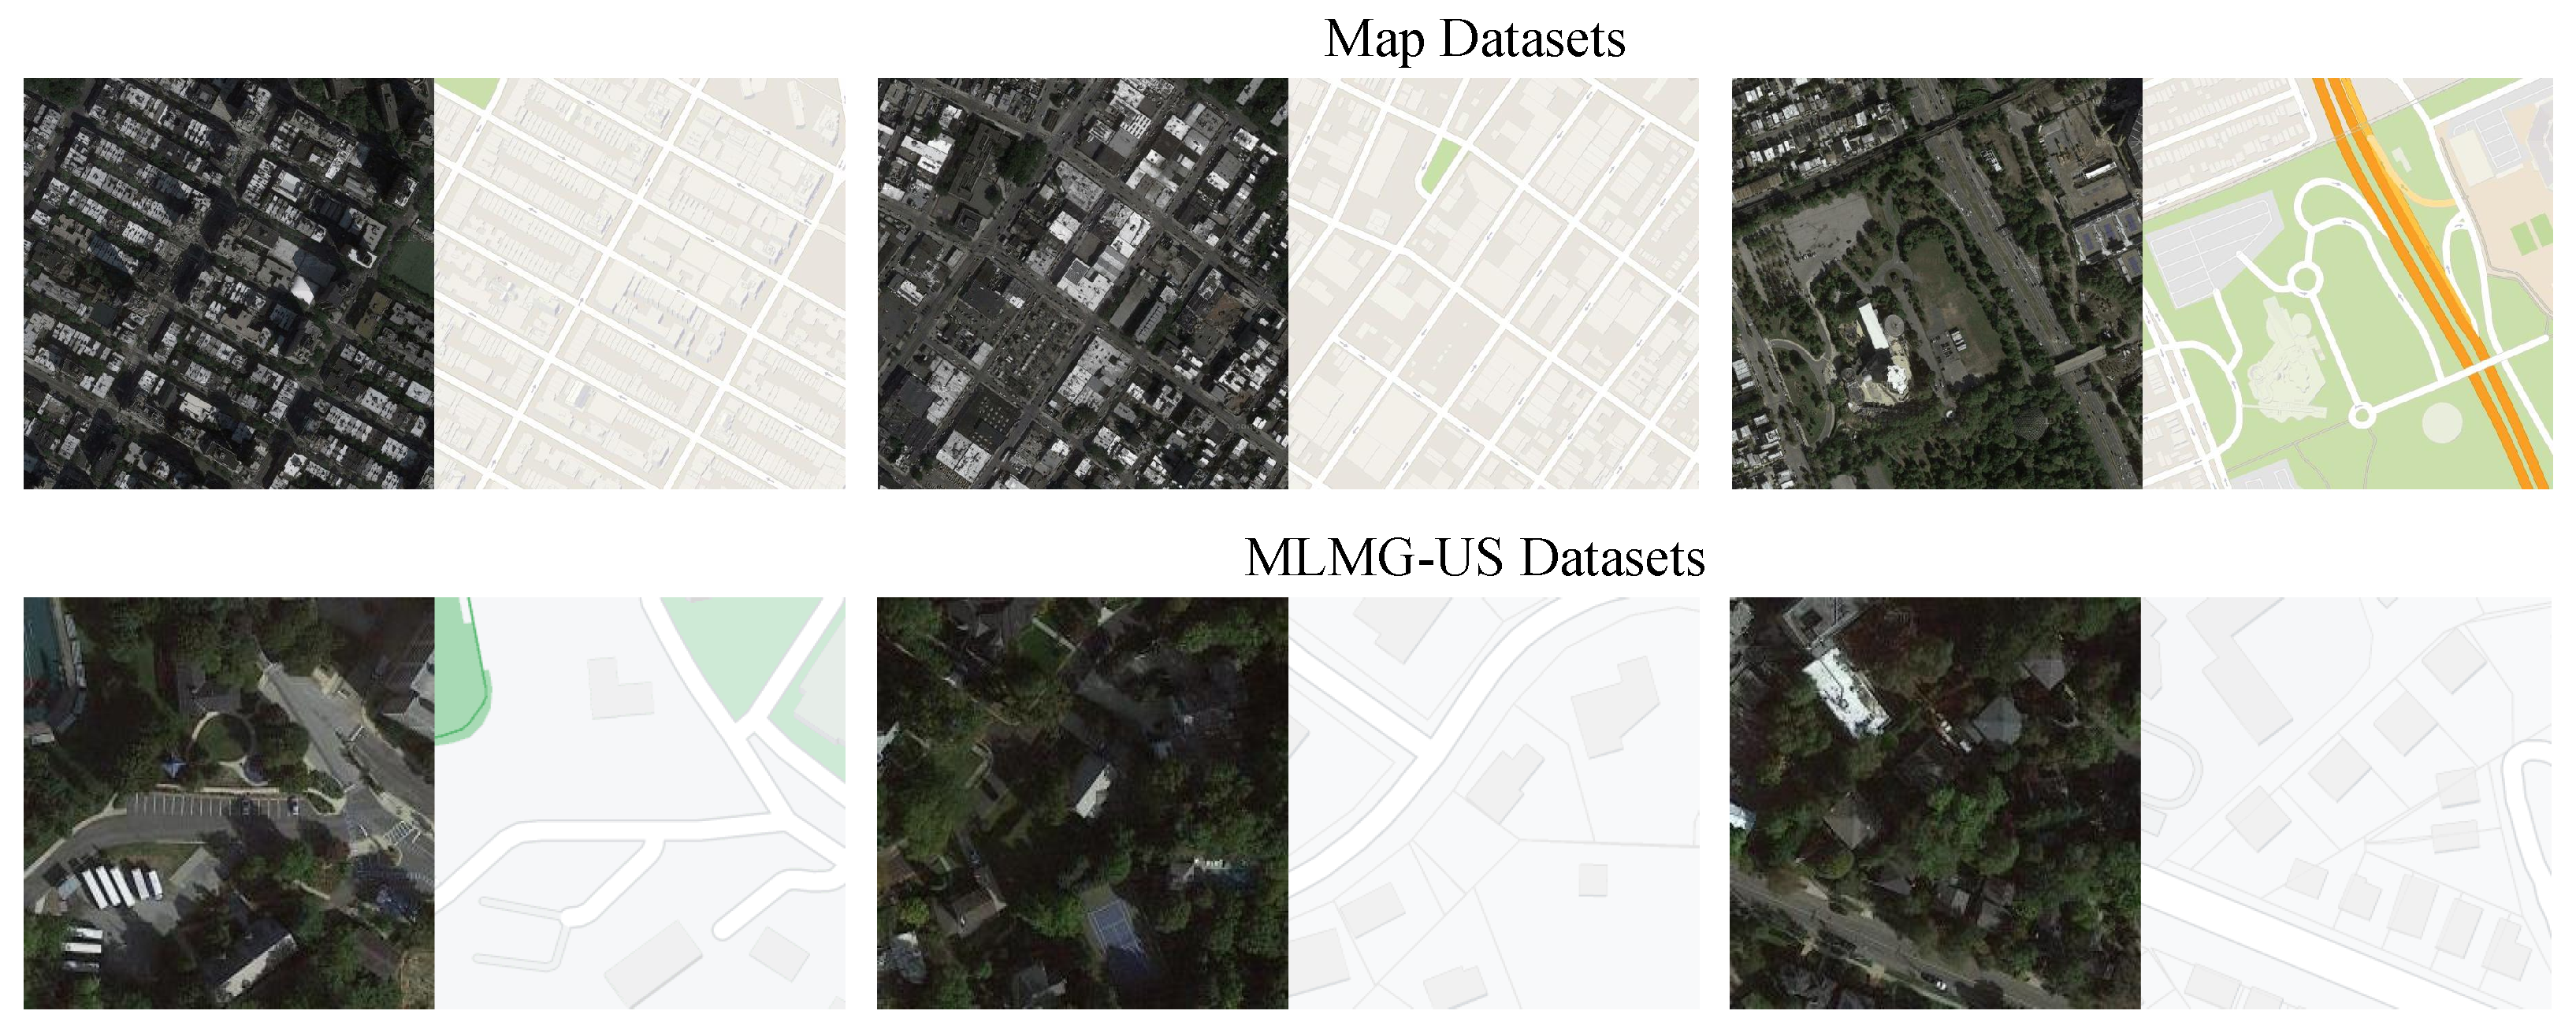
To comprehensively verify the usability and effectiveness of the proposed map evaluation index, multiple representative datasets were used for experimentation. As shown in Figure 3, We selected the following two datasets about previous studies [1,39]:
Figure 3.
Map datasets, MLMG-US datasets, some paired aerial images (left), and map images (right).
- (1)
- Maps datasets: consist of Google online maps, including high-resolution aerial images and corresponding map-matching samples.
- (2)
- MLMG-US datasets: contain paired samples of aerial images and maps of US cities. These datasets comprise training and test sets from various areas within the same city, ensuring the consistency and representativeness of the data. Each dataset’s image size is 256 × 256 pixels.
Table 1 shows the differences between the two datasets in terms of spatial resolution and sample size. The Maps dataset has a pixel resolution of (zoom level 16), which focuses on urban road networks. In contrast, the MLMG-US dataset provides a much higher resolution of (zoom level 18) and covers more diverse geographical regions. This significant change in resolution—from 16-level urban skeletons to 18-level fine-grained features—tests the model’s ability to handle different map scales. The fact that the MFP metric remains effective across these two different resolutions demonstrates its strong generalization and robustness for various generative cartography tasks.
Table 1.
Quantitative and qualitative comparison between the Maps and MLMG-US datasets.
4.1.2. Evaluation Indicators
To comprehensively evaluate the quality of the generated maps, we employed multiple evaluation metrics, combining quantitative and qualitative analysis methods. A multifaceted approach was employed to comprehensively evaluate the quality of the generated maps, incorporating a combination of quantitative and qualitative analysis methods. Specifically, we selected the evaluation metrics SSIM, FID, and PSNR, alongside state-of-the-art perceptual metrics LPIPS-ViT and DISTS. These metrics were chosen because they evaluate the quality of synthesized maps from diverse perspectives: PSNR quantifies intensity differences at the pixel level to reflect geometric accuracy and reconstruction precision. SSIM focuses on structural similarity by incorporating considerations of the human visual system, measuring luminance, contrast, and structure. FID evaluates the overall distribution divergence between the generated and authentic map datasets within a deep feature space, measuring the realism of the synthesized results. LPIPS-ViT and DISTS utilize deep feature extractors to measure disparities in high-level semantic representations and perceptual textures, addressing the limitations of traditional pixel-wise metrics in cartographic contexts.
Notably, while our proposed map feature perception (MFP) metric is implemented as a loss function to guide model optimization and enhance geographical plausibility, it is intentionally excluded from the final quantitative evaluation. This decision ensures methodological independence and avoids potential evaluative bias or circularity that could arise from using the same optimization objective as a benchmark for performance. To ensure the reliability and robustness of the assessment, all indicators are calculated for each generated sample and subsequently averaged.
4.1.3. Experimental Model
As shown in Table 2, the experimental models are selected to encompass diverse generative paradigms, spanning from foundational GAN-based benchmarks to state-of-the-art diffusion models specifically tailored for cartographic synthesis. We categorized these representative models into two groups: GANs (e.g., Pix2Pix, CycleGAN) and diffusion models (e.g., GDFM, SCGM). This selection provides a comprehensive quality gradient that allows us to rigorously validate the discriminative power and generalizability of the proposed MFP metric across varying architectural complexities. By including both established image-to-image translation frameworks and the latest domain-specific diffusion architectures, we ensure that the evaluation framework remains robust across the evolving landscape of generative cartography.
Table 2.
Selection of generative models and evaluation metrics.
4.1.4. Experimental Setup
We designed two sets of experiments: one on the Maps dataset, using different models for training and validation, and the other on the MLMG-US dataset. Both sets used the same number of training rounds, i.e., 200. All models used the Adam optimizer, where and . The learning rates are different. The Maps group’s learning rate is 2 × . The MLMG-US group’s learning rate is 1 × . It is worth noting that the GDFM model is prone to mode collapse. After testing, training the model with a learning rate of 1 × is more appropriate.
Regarding the loss function, the two groups were subdivided into two experiments: one group utilized the original loss function of each model, while the other group incorporated the map perception loss proposed to the original loss function. This design enables a direct comparison of the impact of the map perception loss on model performance. All experiments were performed on a training platform equipped with two NVIDIA 5090D GPUs to ensure consistency of computing resources. Due to the high VRAM requirements of the massive-parameter DINO-ViT backbone on the NVIDIA 5090D, we optimized the hardware efficiency by setting the batch size to 4. This allowed us to perform deep feature extraction without compromising the stability of the loss calculation or exceeding the GPU’s memory capacity.
In addition, we compare our map feature perception loss with the most widely used loss functions, such as L1 and L2, as well as the perceptual loss LPIPS [7] and DISTS [33]. We use the classic generative model Pix2Pix as the baseline and train it for 200 rounds in MLMG-US. The remaining learning rate configurations correspond to those above.
To anchor our objective metrics with human perception, we conducted an extensive subjective user study involving 500 valid questionnaires. First, 15 graduate students with cartography backgrounds and over 400 non-specialists evaluated 300 sampled instances across three dimensions: visual fidelity, semantic consistency, and structural integrity. These subjective ratings were normalized into mean opinion scores (MOS) to serve as the ground truth for correlation analysis.
Furthermore, we performed hyperparameter ablation studies to ensure the robustness of the MFP metric. We specifically investigated the sensitivity of global feature loss and the spatial semantic loss . By testing varying configurations, we determined the optimal balance that maximizes structural alignment without interfering with pixel-level convergence.
Through this multifaceted and multi-perspective verification method, we aim to comprehensively evaluate the usability and effectiveness of the proposed map evaluation indicators. This proves the universality of our method and reveals performance characteristics in different geographical environments and map styles, providing valuable insights for future improvements.
4.2. Comparative Experiment on Perceptual Metrics of Map Features
This study conducted a qualitative and quantitative comparative analysis of metrics for evaluating generative models to evaluate the effectiveness of the proposed map feature perception (MFP) metrics. The experimental results show that our proposed MFP metrics effectively distinguish maps with different generation effects and demonstrate their unique advantages compared with traditional metrics (e.g., SSIM, FID).
As shown in Table 3, we selected a suite of representative and state-of-the-art generative models to evaluate the discriminative power of the MFP metric. This selection encompasses a diverse technological gradient, ranging from foundational architectures such as Pix2Pix and CycleGAN to advanced domain-specific frameworks including GDFM and SCGM. By testing the MFP metric against models of varying architectural complexity and synthesis quality, we can rigorously validate its sensitivity and generalizability. As indicated by the results, the state-of-the-art SCGM consistently achieves superior scores across deep perceptual metrics and the proposed MFP metric, confirming that MFP effectively aligns with the performance improvements of the most advanced generative frameworks in cartography.
Table 3.
Comparison results of different model generation effects. Bold and underline represent the best and worst results, respectively. (↑: higher is better; ↓: lower is better).
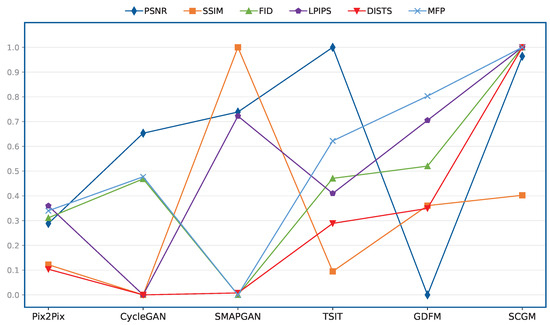
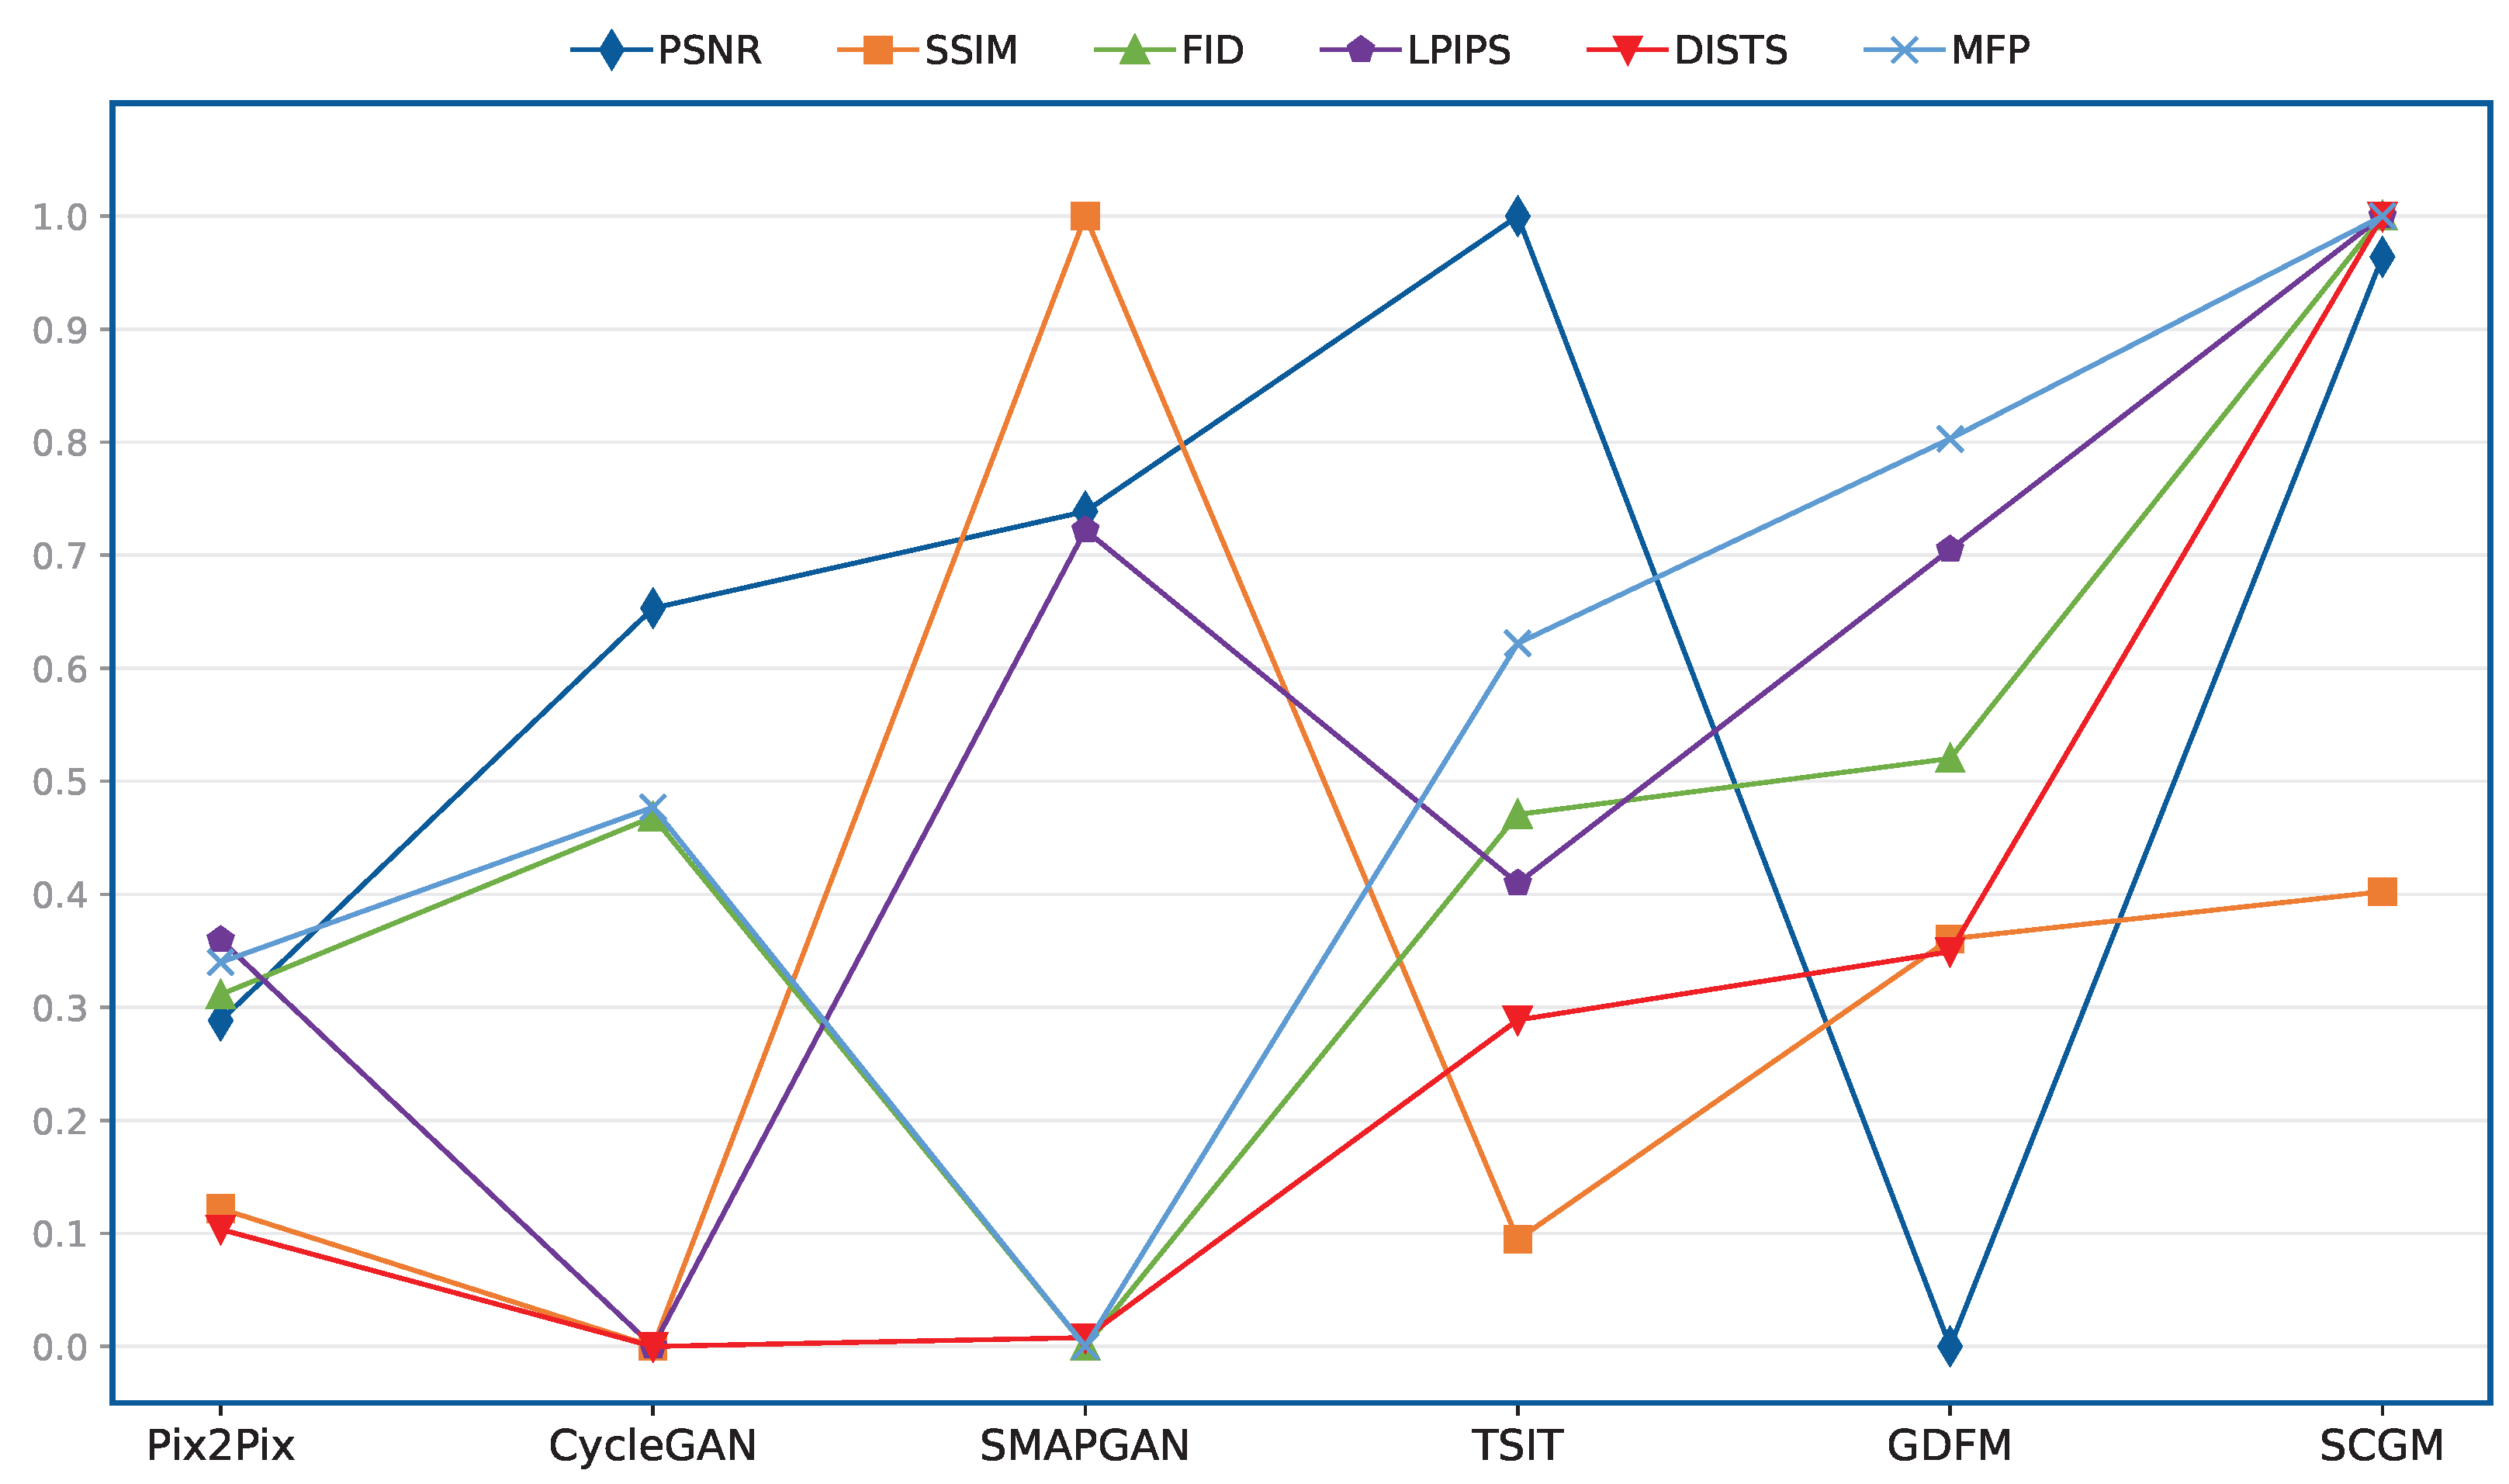
Specifically, Pix2Pix and CycleGAN, as classical models in the generative adversarial network (GAN) class, have low and relatively close SSIM and PSNR value scores, suggesting a comparable performance in terms of pixel-level similarity. On the other hand, they generally score low on our proposed MFP metrics, which coincides with the visual effect and overall quality of the generated maps, suggesting that the maps generated by these models differ significantly from real maps in terms of spatial structure and semantic features. Notably, models with similar pixel-level scores (e.g., Pix2Pix and CycleGAN on SSIM/PSNR) yield distinct MFP scores. This highlights MFP’s sensitivity to semantic differences that are overlooked by traditional metrics. Further analyses reveal that the MFP metrics offer a more comprehensive view of map generation quality than traditional metrics, such as SSIM and FID. For example, SMAPGAN performs better on SSIM and PSNR but poorly on MFP and FID, indicating that its generated maps exhibit higher pixel-level similarity but obvious deficiencies in overall feature spatial distribution and semantic consistency.
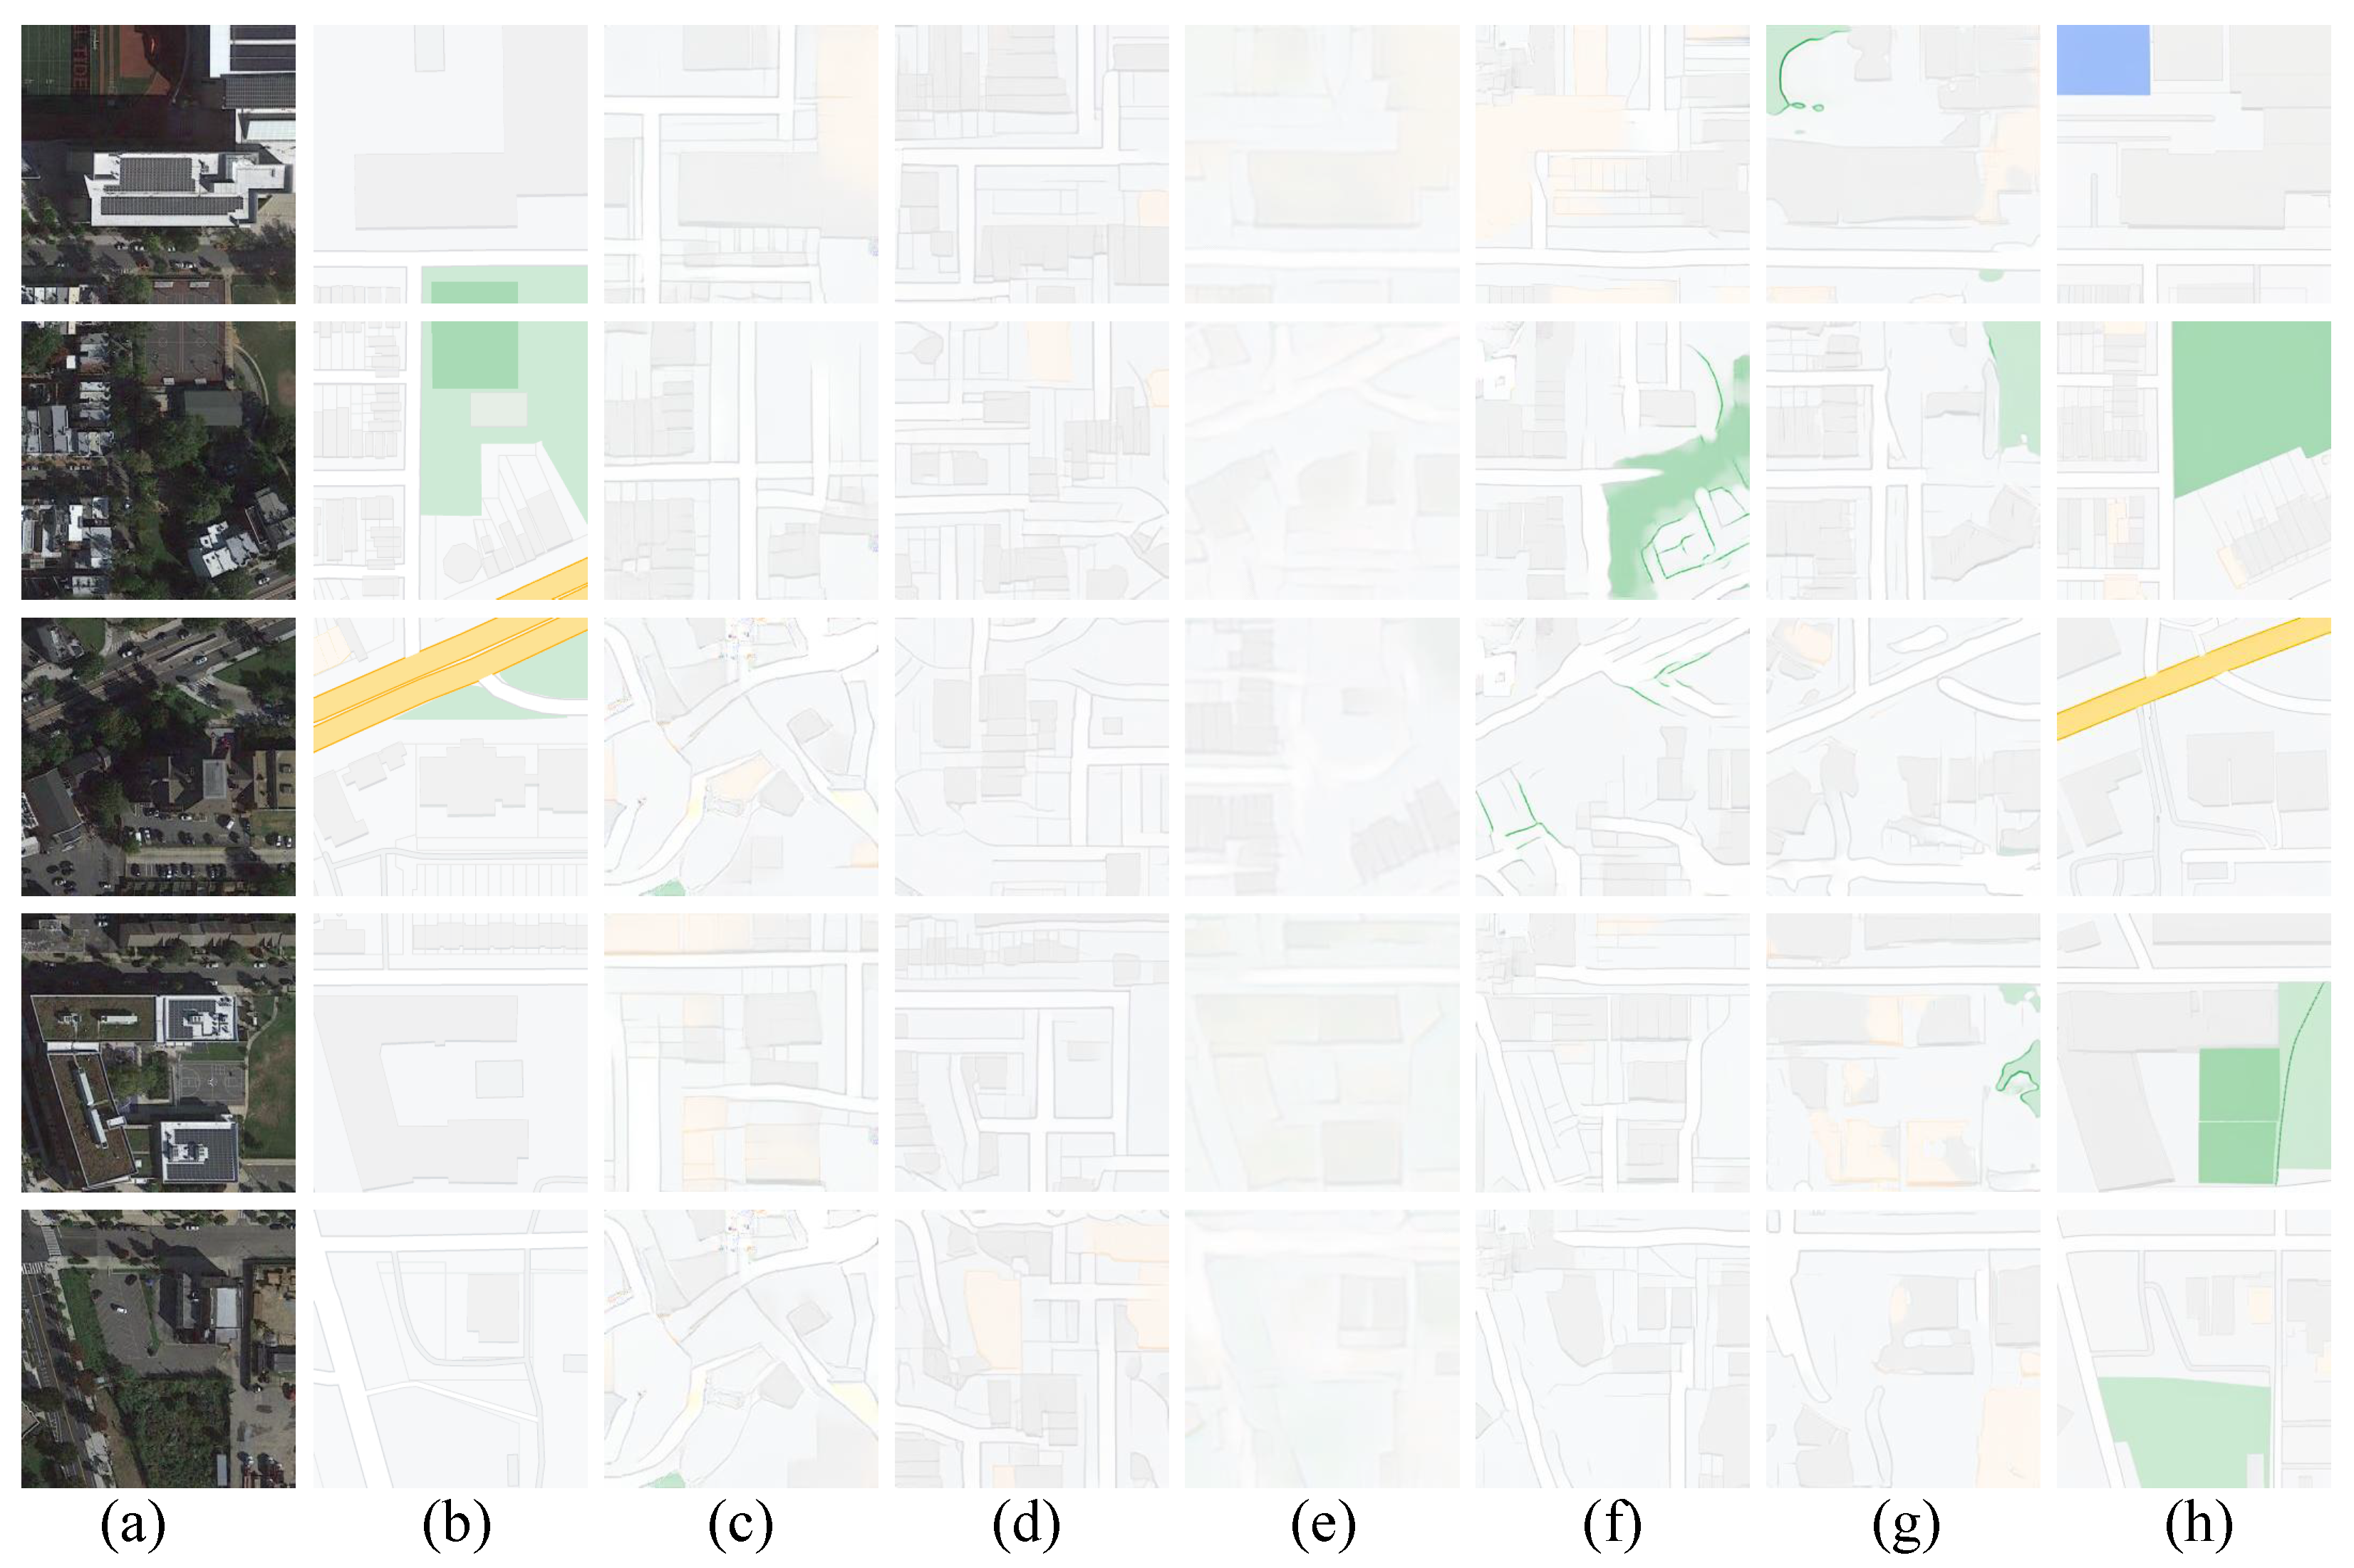
On the other hand, the high score of the SCGM model on the MFP metric fully demonstrates its advantage in generating high-quality maps that are highly consistent with real maps in terms of spatial structure and semantic features. Similarly, for GDFM and SCGM, as representatives of the diffusion model class, the SCGM model outperforms GDFM in almost all metrics, which indicates that the maps generated by SCGM are not only highly similar to the real maps in terms of pixel level and structure but also in terms of spatial structure and semantic features. This set of results strongly validates the effectiveness of the MFP metrics: for maps that are well generated, the MFP values are higher, while for maps that are poorly generated, the MFP values are lower. From a visualization perspective, Figure 4 effectively demonstrates this observation as well.
Figure 4.
Sample comparison of the output of the some map generation models: (a) input; (b) GT; (c) Pix2Pix; (d) CycleGAN; (e) SMAPGAN; (f) TSIT; (g) GDFM; (h) SCGM.
Notably, the evaluation trends of the MFP metric exhibit high consistency with those of LPIPS and DISTS. Specifically, models that achieve superior performance in LPIPS and DISTS (where lower values indicate higher similarity), such as the SCGM model, also attain high scores in the MFP metric. This consistency demonstrates that MFP is capable of extracting deep-level features, much like LPIPS and DISTS, and maintains strong sensitivity to the spatial layout and structural consistency of maps.
The trend analysis presented in Figure 5 validates the utility of our map feature perception (MFP) metric, demonstrating that it performs comparably to standard metrics while providing superior insight into map generation quality. The insufficiency of traditional pixel-wise metrics is evident when comparing DMs and GANs; although DMs produce qualitatively better maps, PSNR and SSIM scores show negligible differentiation. The case of the SMAPGAN model is particularly illustrative: its high PSNR/SSIM scores, coupled with low MFP/FID scores, reveal an ability to generate maps with high pixel similarity that nonetheless lack coherent overall feature spaces and semantic integrity. While MFP’s overall trend corroborates that of FID, thereby confirming its validity as a perceptual metric, its distinct evaluation of the GDFM model highlights its specialized capability. This divergence suggests that MFP is more acutely sensitive to the unique spatial configurations and semantic content inherent in cartographic data, providing a more nuanced assessment of map quality.
Figure 5.
Comparative analysis of trends in metric evaluation results.
In summary, this study demonstrates that the proposed MFP metrics can effectively assess the quality of map generation, with higher MFP values indicating well-generated maps and lower MFP values indicating poorly generated maps. This is a visual representation of the effectiveness of our metrics for evaluating map generation.
4.3. Optimization Experiment on Perceptual Loss of Map Features
To validate the efficacy of our proposed perceptual loss for map features, this section presents a comprehensive set of optimization experiments. We systematically benchmark the performance of several state-of-the-art map generation models through both qualitative and quantitative analyses. A primary objective of this investigation is to ascertain the impact of various loss functions on the final quality of the synthesized maps, thereby highlighting the distinct advantages of our approach.
4.3.1. Qualitative Comparison
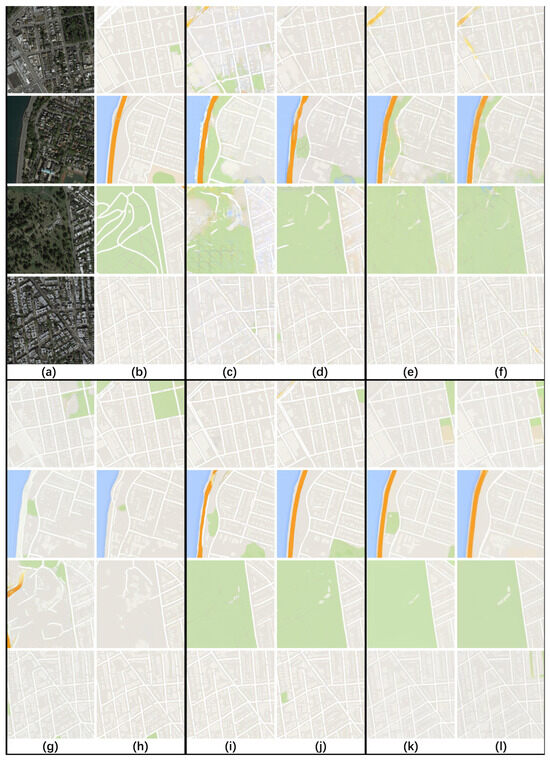
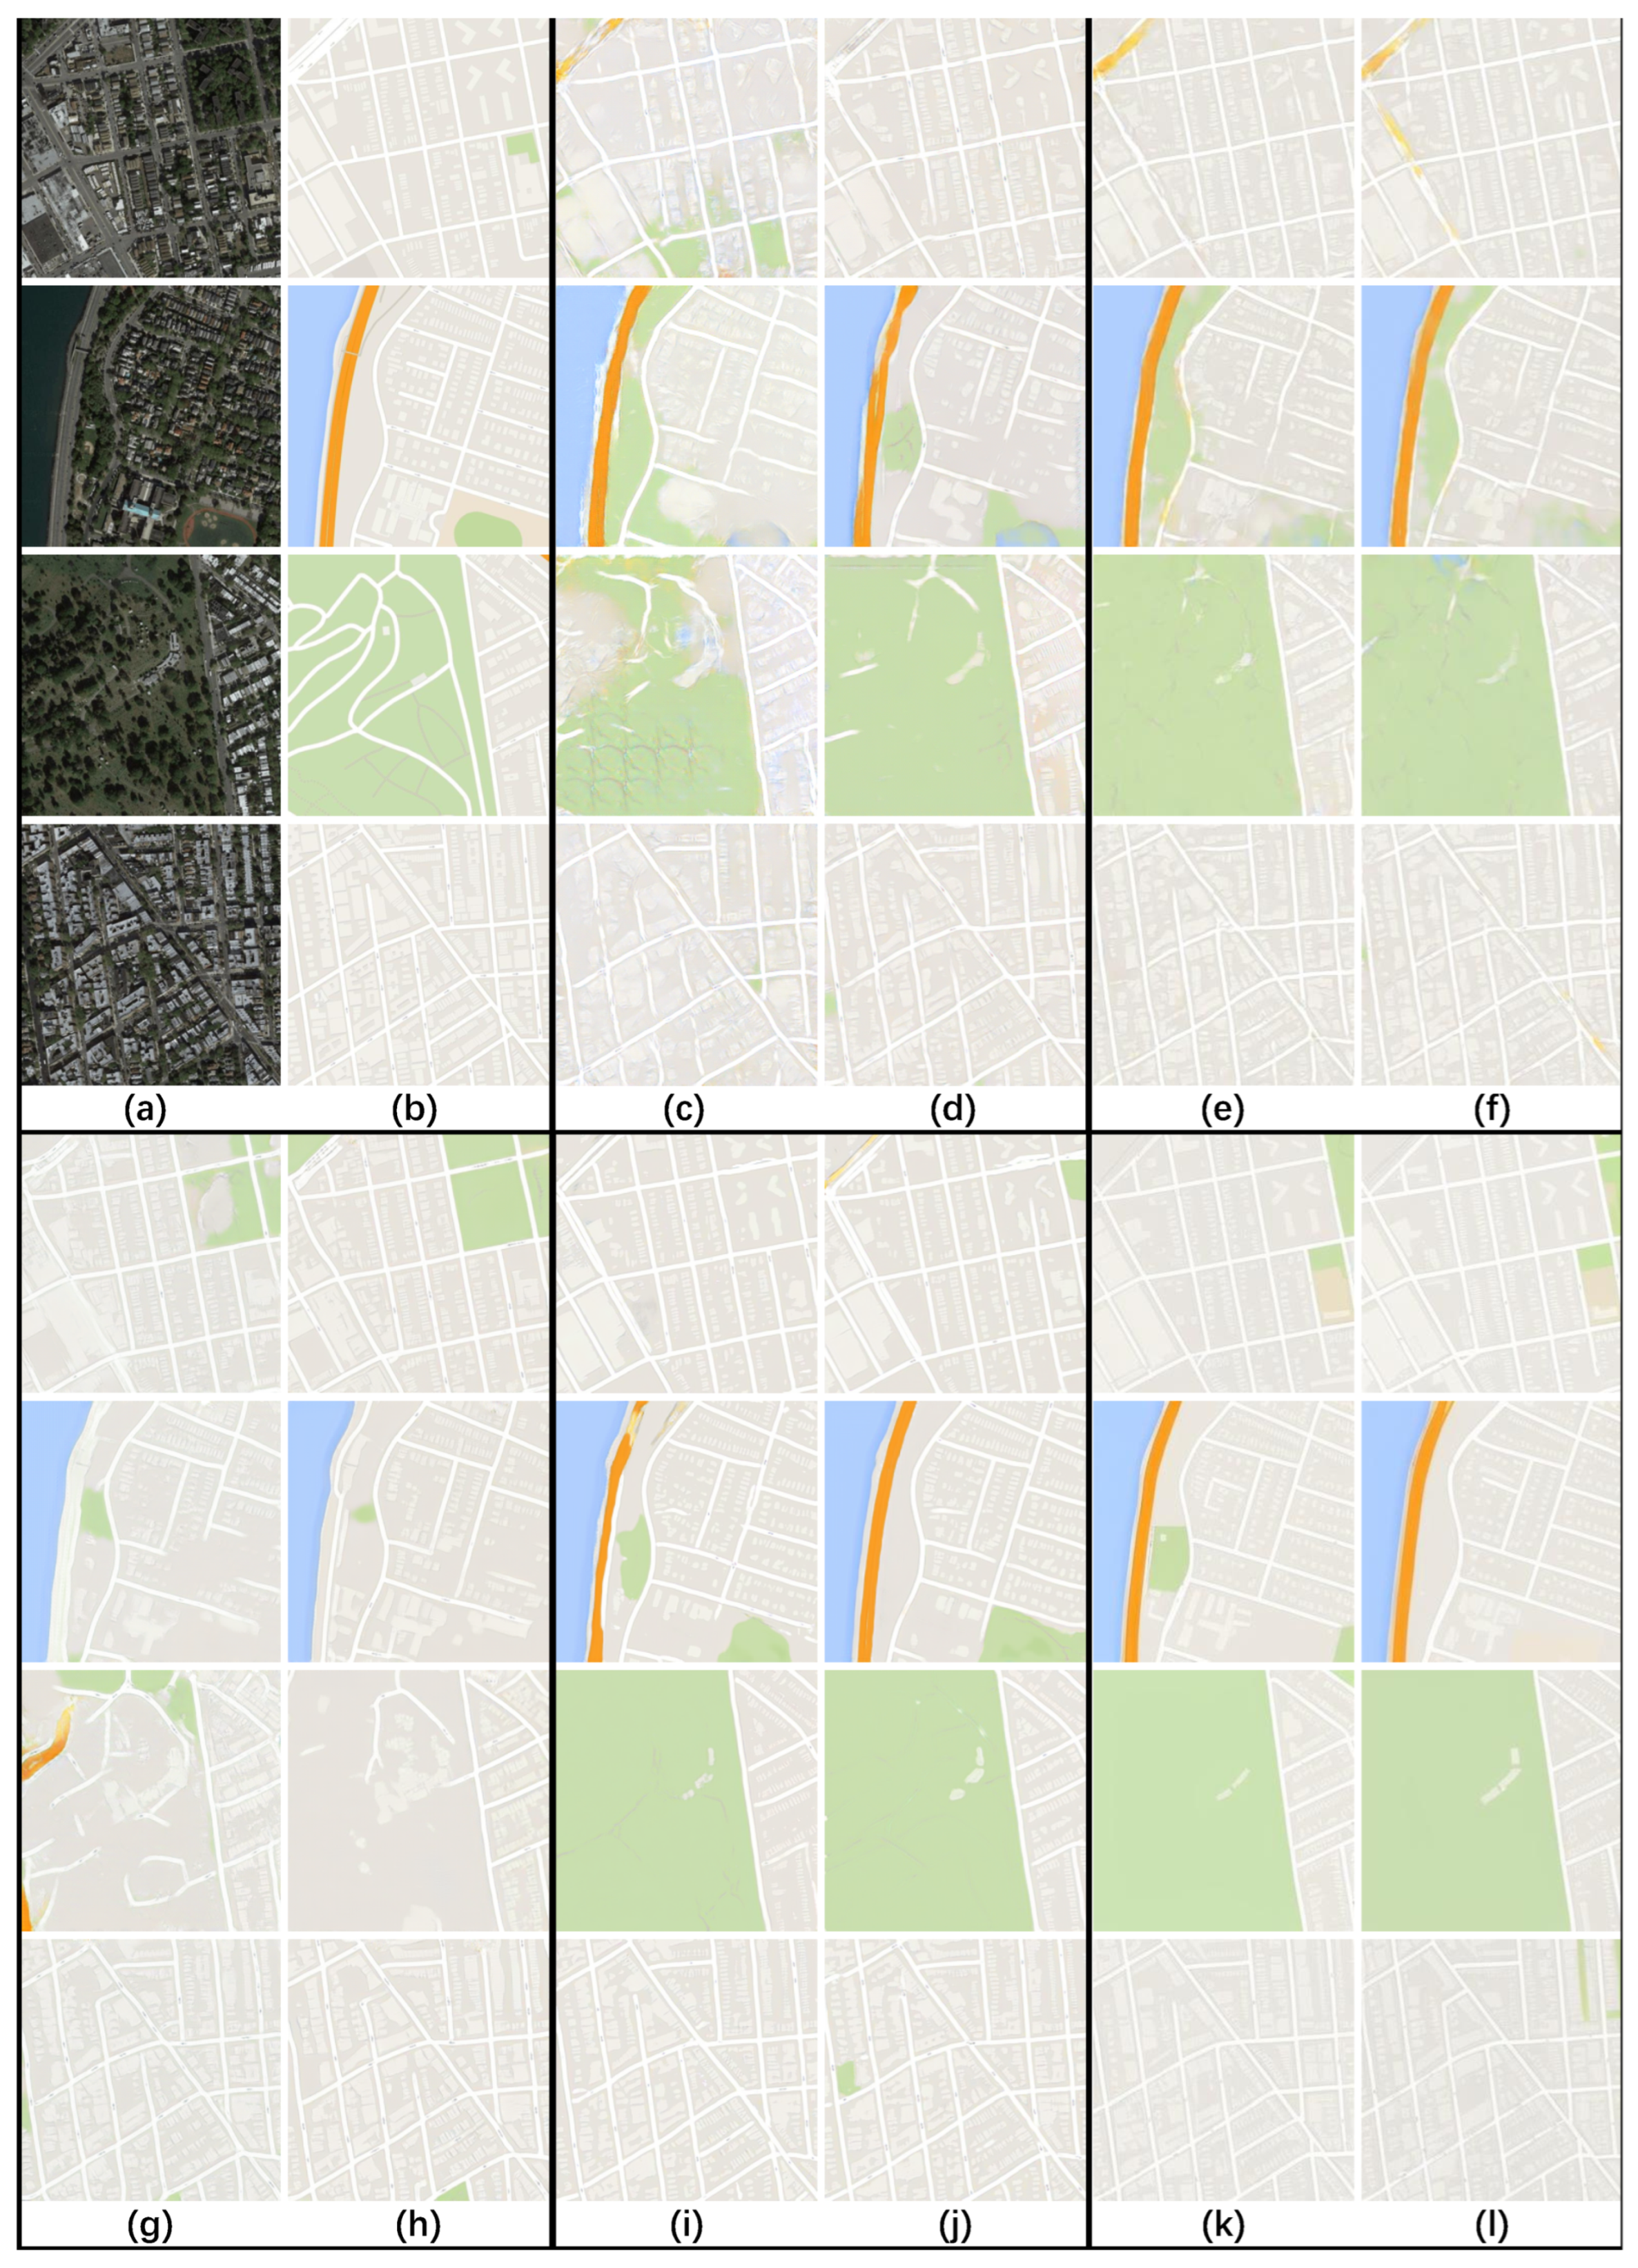
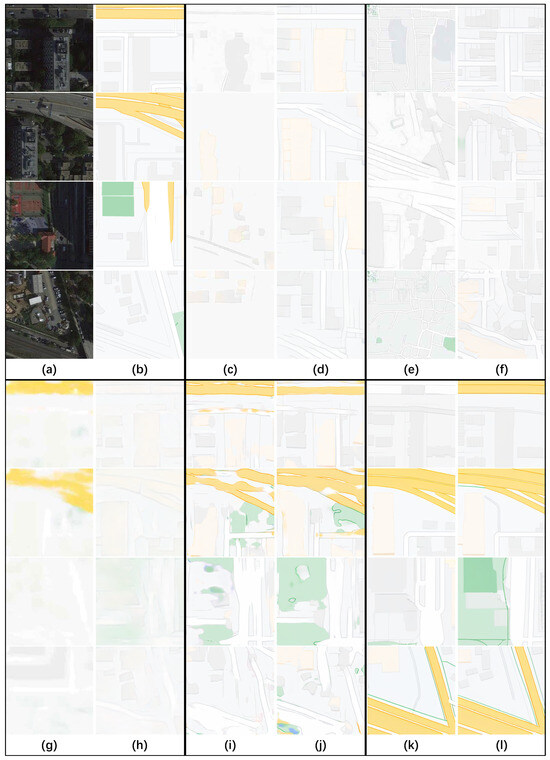
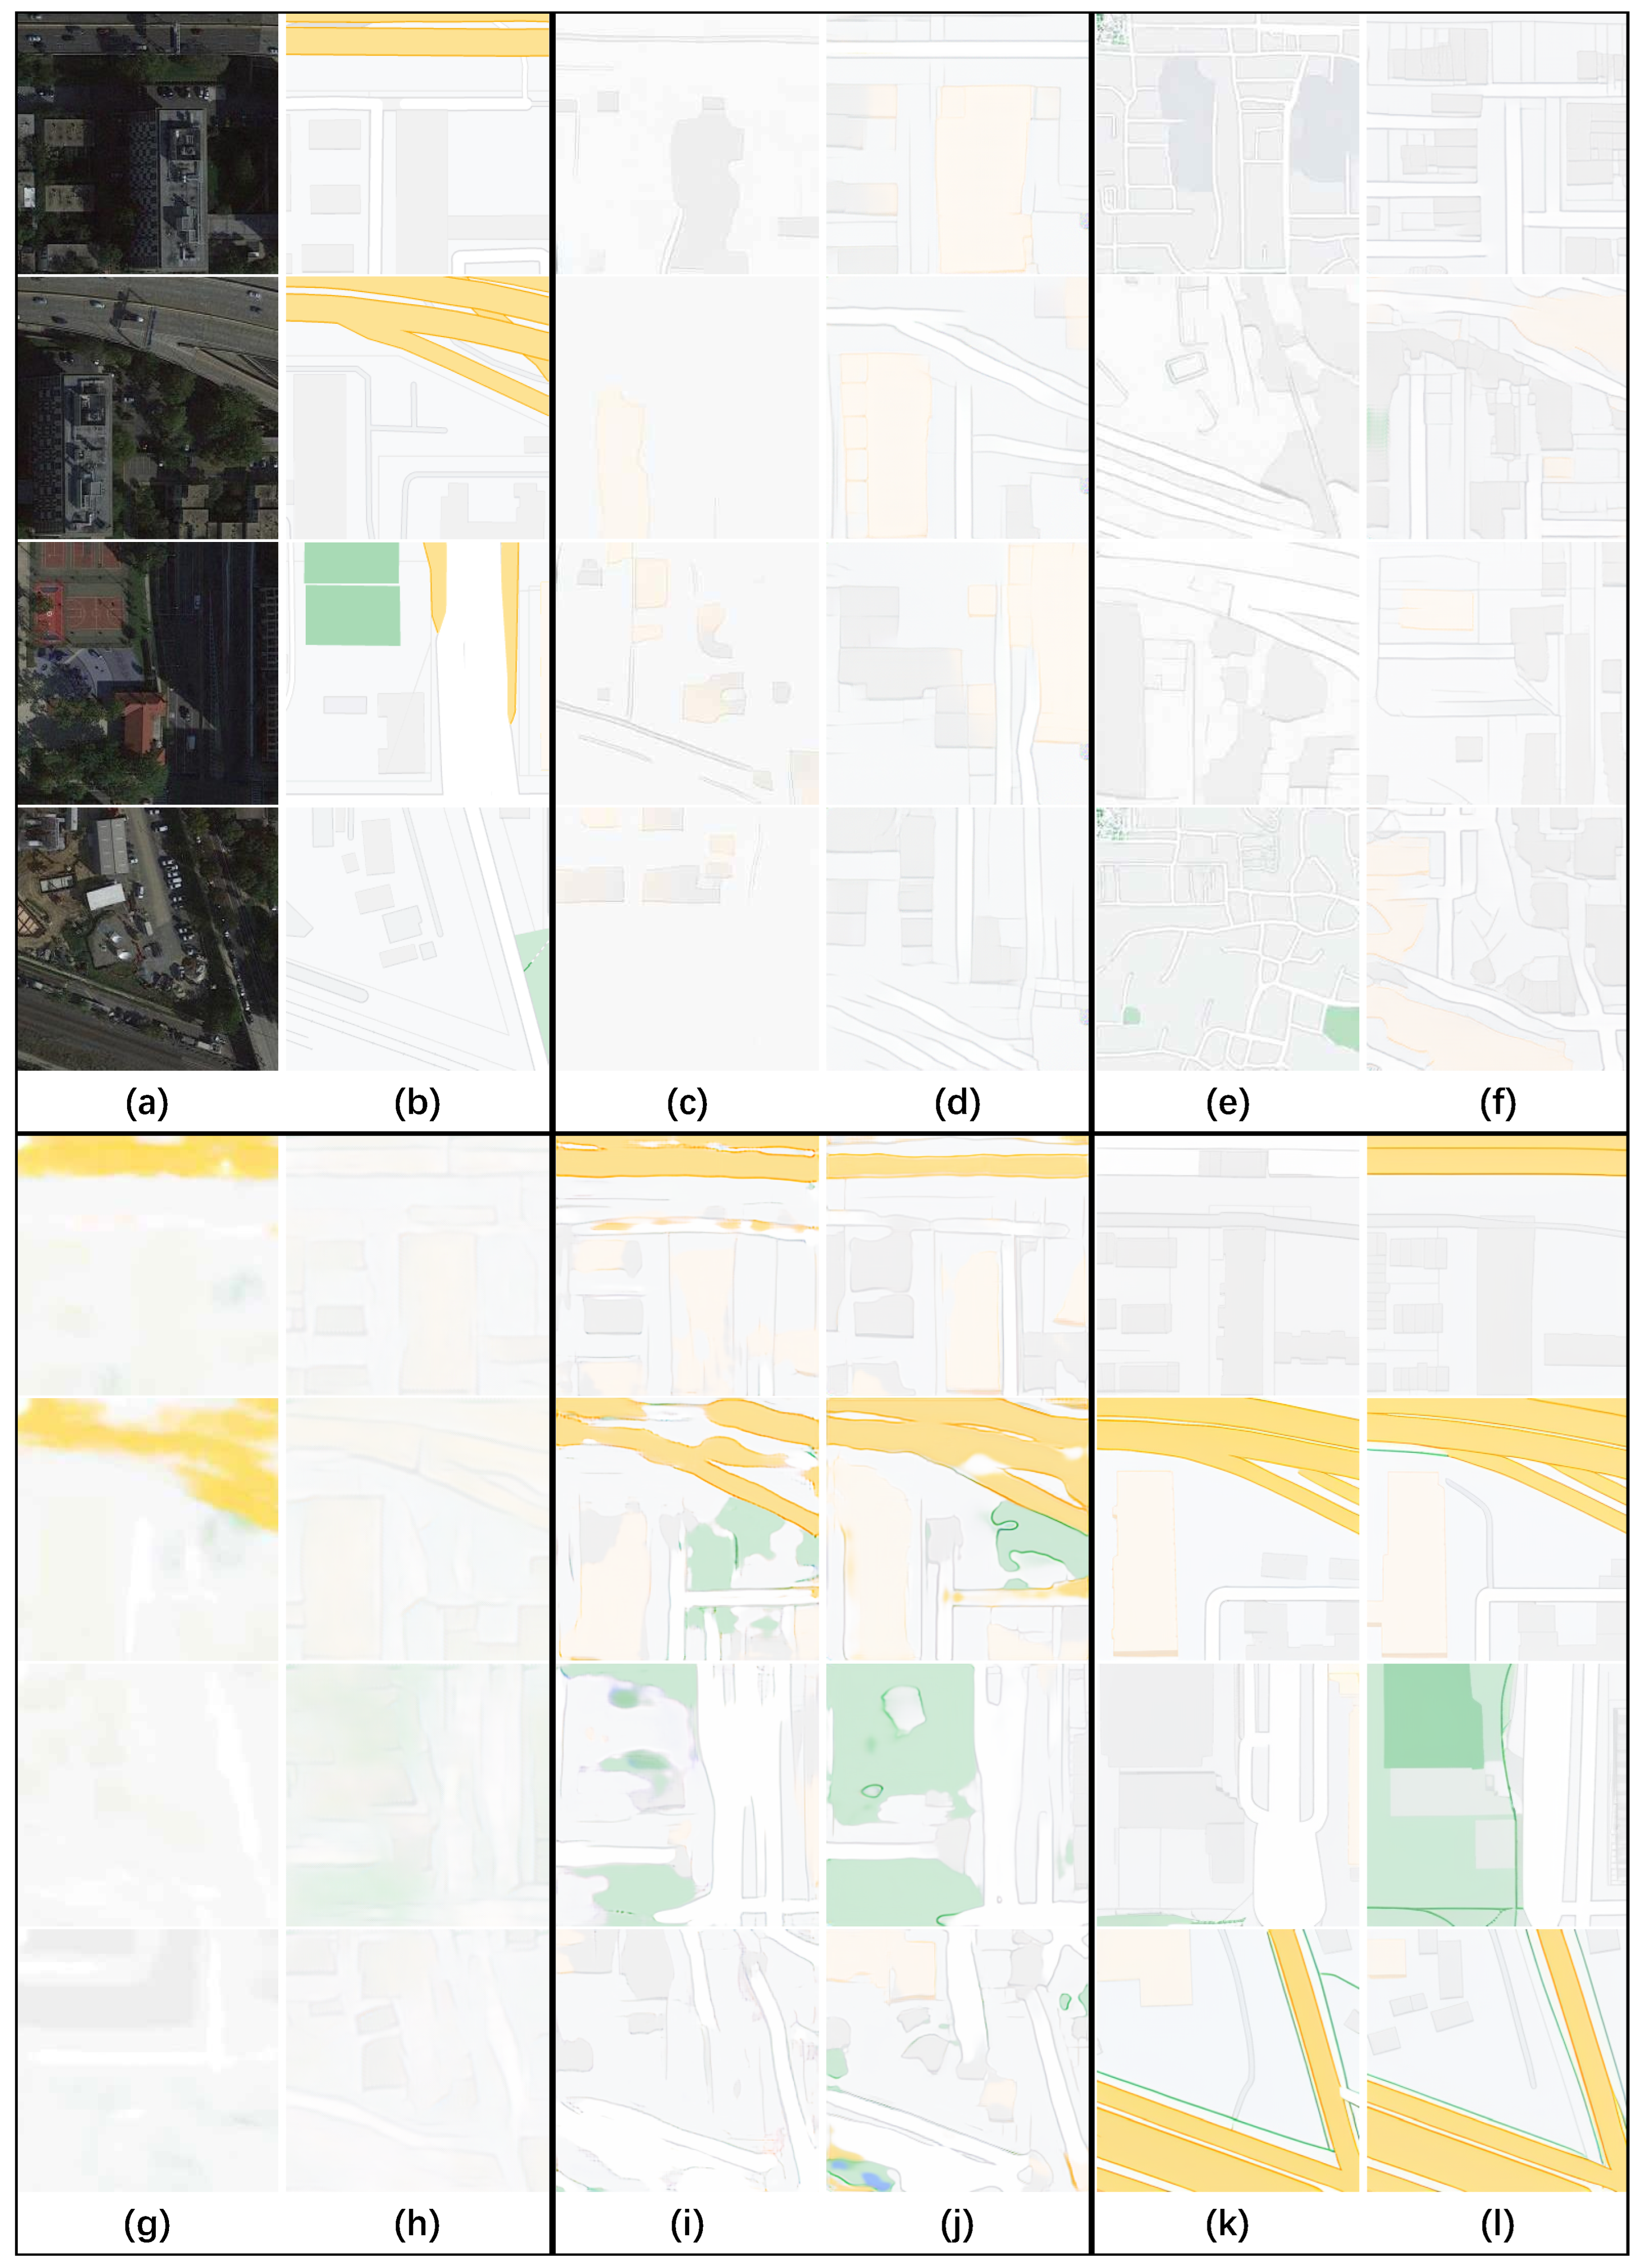
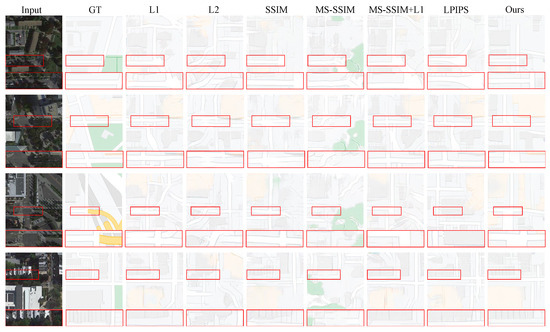
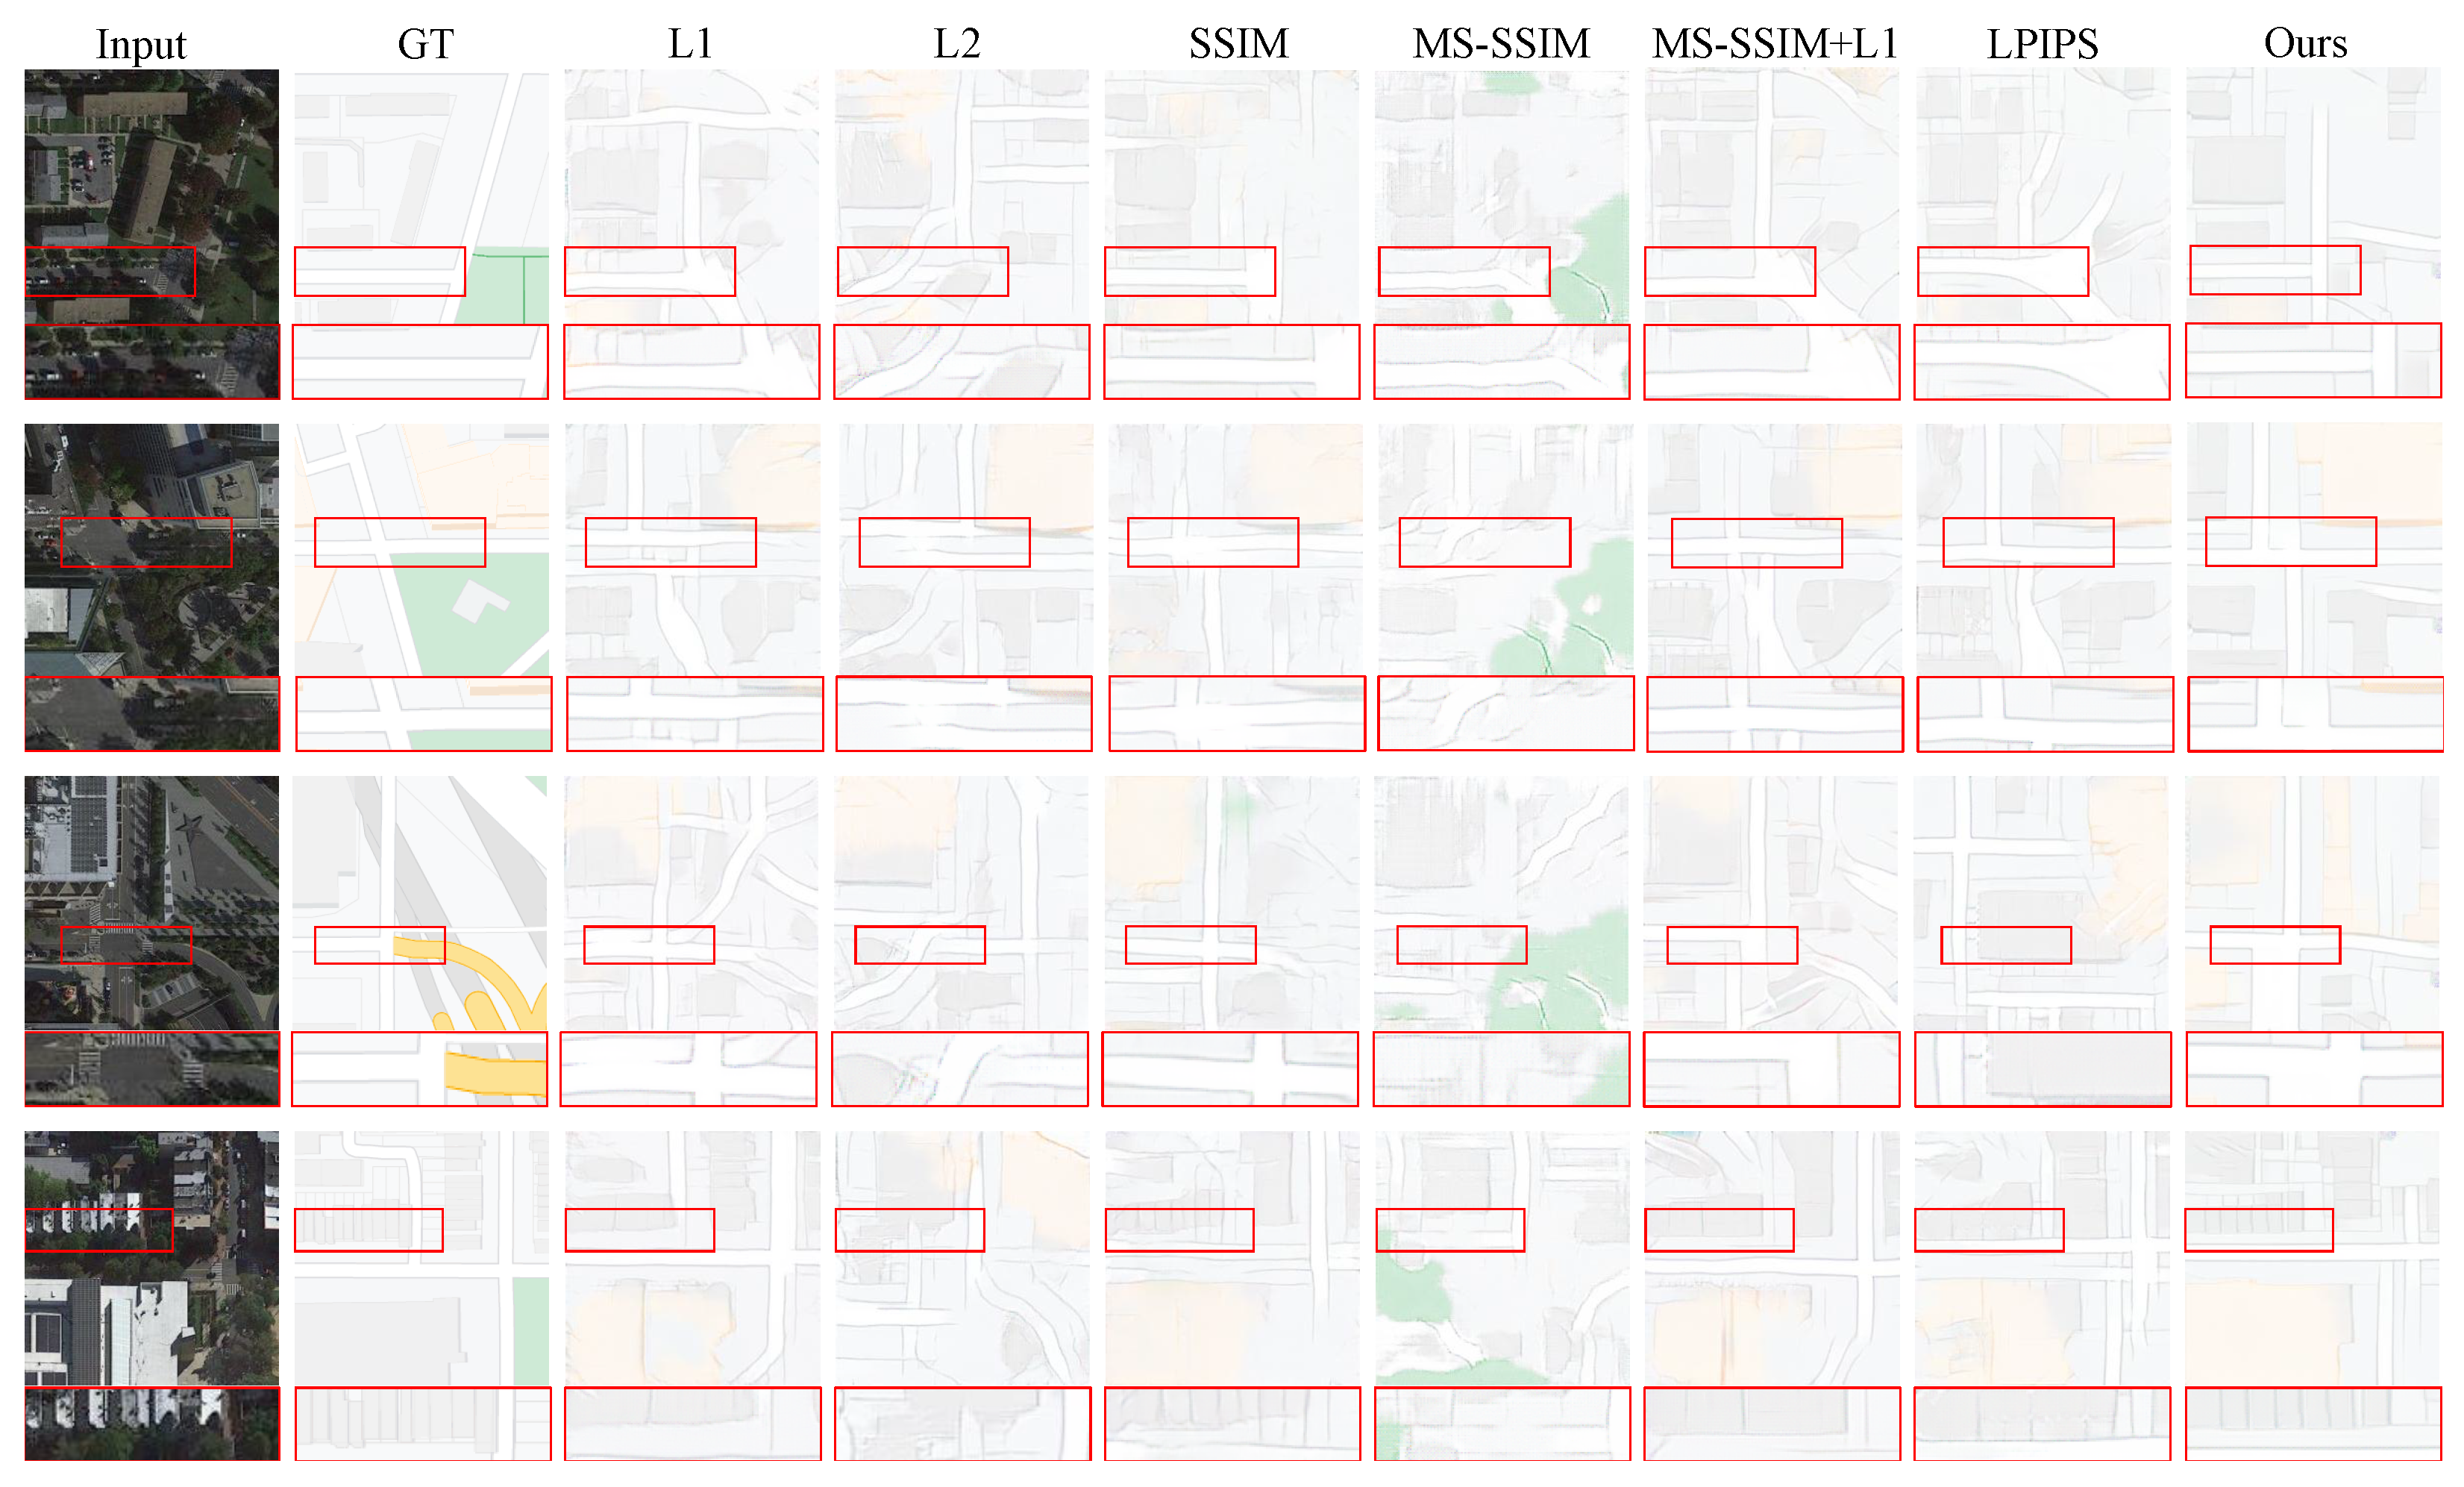
First, we studied different methods on the Maps and MLMG-US datasets. Figure 6 shows the results of each model on the Maps data (including GAN-based and diffusion-based methods). Our figure shows that by adding a map feature perception loss, the model can more accurately identify map elements (such as building groups, infrastructure, and water areas) and clarify the road structure. Figure 7 displays the results of each model on the US-MLMG dataset, utilizing various methods. Compared with the group that only uses the original loss function, after adding our loss function transformed by the map feature perception metric (as in the second row, the completeness of the road, bridge, and building clusters is higher), this shows that our method correctly focuses on the semantic matching regions between the output image and the real image and also determines the spatial relationship of semantic features in the image. To further demonstrate the advantages of our approach, a comparison is made for each commonly used loss function against a basic model, Pix2Pix. As shown in Figure 8, our method makes the overall road structure more continuous in certain road structures and, simultaneously, more accurately delineates the boundaries of map semantic features, such as rivers, grasslands, and other semantic features.
Figure 6.
Qualitative results of each model on the Maps datasets using different methods. The asterisk (*) denotes model results with the additional incorporation of our map feature loss function: (a) input; (b) GT; (c) Pix2Pix; (d) Pix2Pix*; (e) Pix2PixHD; (f) Pix2PixHD*; (g) CycleGAN; (h) CycleGAN*; (i) GDFM; (j) GDFM*; (k) SCGM; (l) SCGM*.
Figure 7.
Qualitative results of each model on the US-MLMG datasets using different methods. The asterisk (*) denotes model results with the additional incorporation of our map feature loss function: (a) Input; (b) GT; (c) Pix2Pix; (d) Pix2Pix*; (e) CycleGAN; (f) CycleGAN*; (g) SMAPGAN; (h) SMAPGAN*; (i) GDFM; (j) GDFM*; (k) SCGM; (l) SCGM*.
Figure 8.
Inference results of the Pix2Pix model trained with different loss functions. Our proposed loss function improves road continuity (rows 1–3) and produces a more spatially uniform distribution of buildings. The red box in the lower part of the figure is a magnified view of the area indicated by the red box in the upper part.
4.3.2. Quantitative Comparison
As shown in Table 4, Table 5, Table 6 and Table 7, incorporating the MFP loss consistently improves performance across multiple metrics for GAN-based models. For instance, on the Maps dataset, Pix2pix with MFP loss (Pix2pix*) shows a significant drop in FID (182.24 to 123.32) and a substantial increase in MFP score (0.4786 to 0.6798), indicating improved realism and structural integrity. It is worth noting that the quantitative assessment results using our map quality assessment indicator MFP are consistent with the qualitative analysis. High MFP values usually accompany high-quality maps and rank high in other evaluation indicators.
Table 4.
Evaluation results of GAN models under different metrics for the Maps dataset using different methods. (The asterisk (*) indicates the model version incorporating the proposed MFP loss function. ↑: higher is better; ↓: lower is better.).
Table 5.
Evaluation results of DMs under different metrics for the Maps dataset using different methods. (The asterisk (*) indicates the model version incorporating the proposed MFP loss function. ↑: higher is better; ↓: lower is better.).
Table 6.
Evaluation results of GAN models under different metrics for the MLMG-US dataset using different methods. (The asterisk (*) indicates the model version incorporating the proposed MFP loss function. ↑: higher is better; ↓: lower is better.).
Table 7.
Evaluation results of DMs under different metrics for the MLMG-US dataset using different methods. (The asterisk (*) indicates the model version incorporating the proposed MFP loss function. ↑: higher is better; ↓: lower is better.).
The diffusion model generally outperforms GAN-based models in all metrics. Although the improvement in each indicator after adding the MFP loss is relatively limited, it may be because the model can already effectively capture the semantic features in the map, showing strong generative ability. This differential performance gain can be attributed to the inherent architectural differences between the two paradigms. GANs often struggle with adversarial training instability and a lack of explicit structural priors, making them prone to “mode collapse” where map elements become fragmented or semantically inconsistent. The deep structural constraints provided by the MFP loss act as a corrective guide that compensates for these critical shortcomings in GANs. In contrast, the iterative Markov chain denoising process of diffusion models inherently maintains superior spatial consistency and distributional alignment. Because diffusion models already possess a stronger baseline for structural integrity, the quantitative improvements from MFP loss appear more modest, functioning as a fine-grained refinement rather than a fundamental structural correction. Furthermore, the stability of non-adversarial MFP loss provides a critical optimization point for generative adversarial networks (GANs)—whose discriminators are often constrained by vanishing gradient issues and the limitations of local receptive fields. By introducing long-range dependencies through ViT-based attention mechanisms, MFP loss enables GANs to overcome their inherent challenges in handling large-scale topological connections, such as generating continuous road networks and coherent hydrological systems.
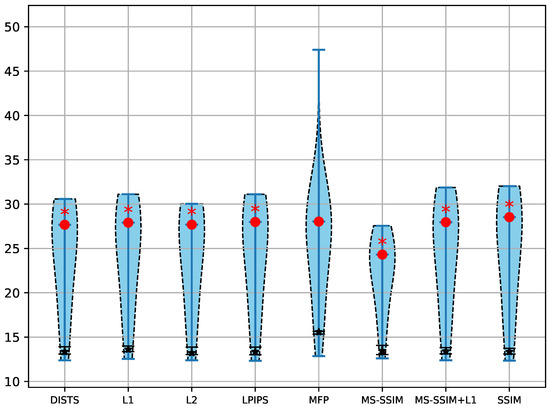
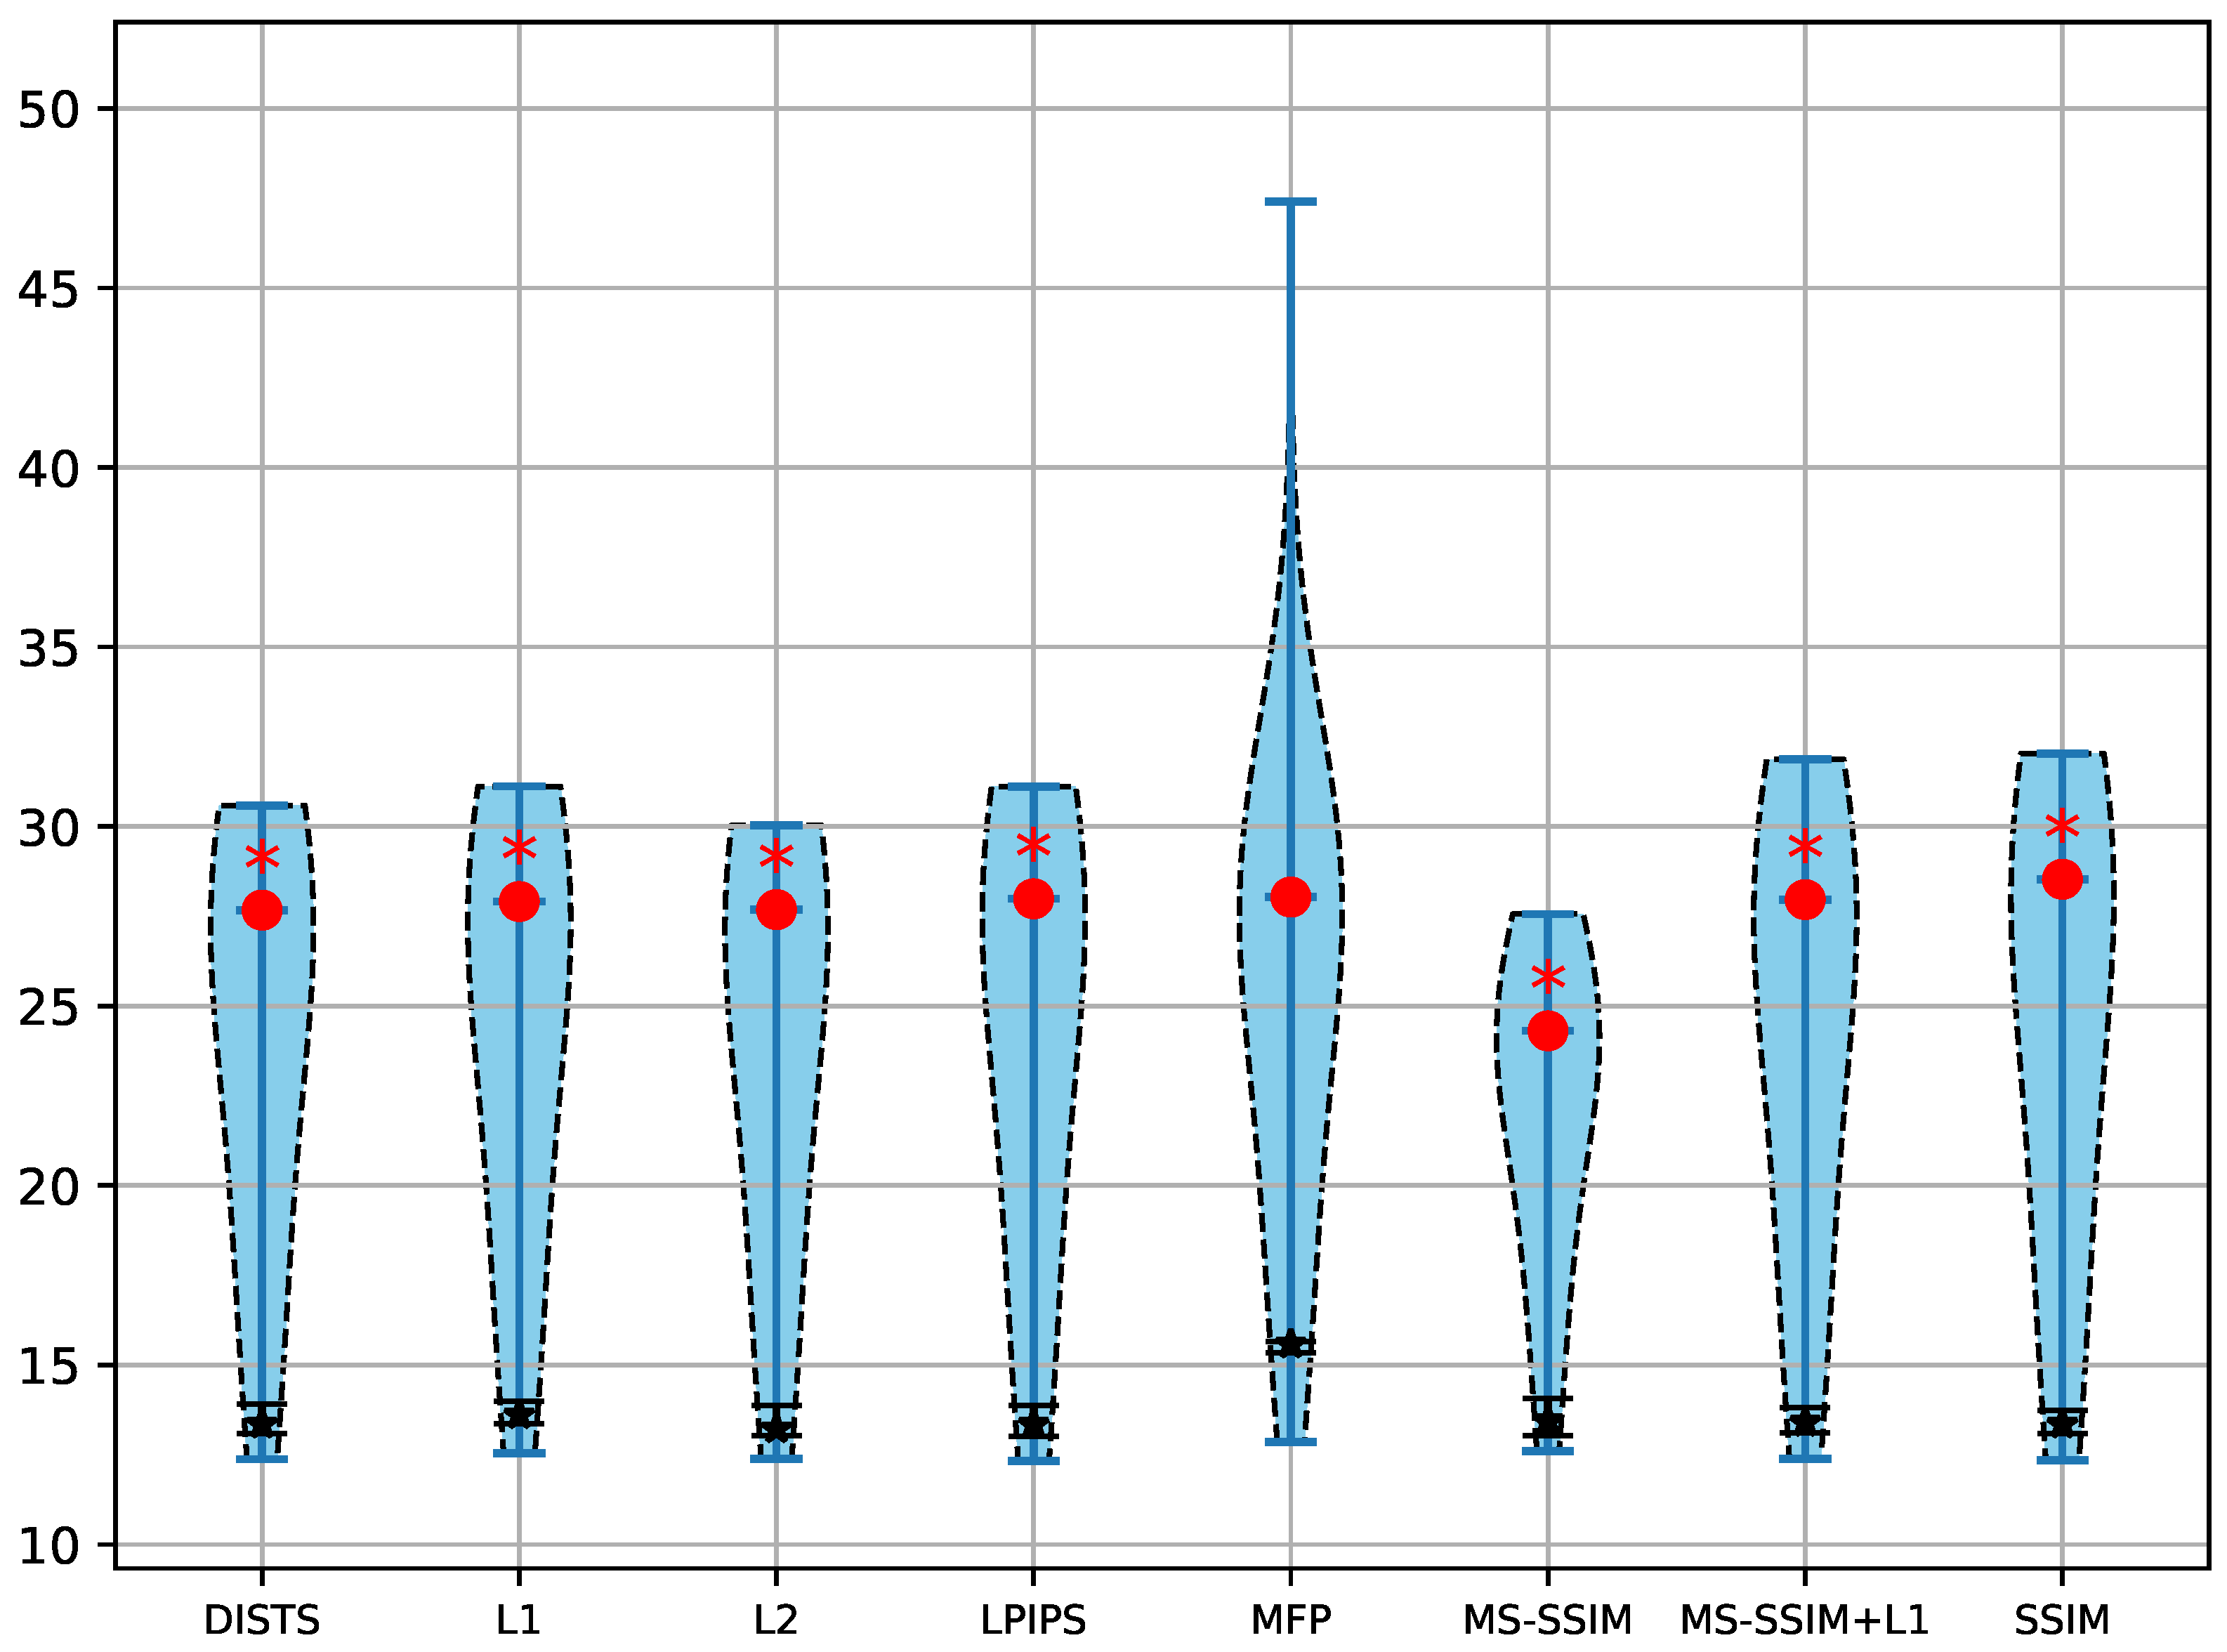
However, a qualitative analysis of the generated maps (Figure 6, Figure 7 and Figure 8) reveals subtle yet important enhancements. For example, the GDFM* and SCGM* models produce roads with better continuity and clearer boundaries for geographic features, such as water bodies and parks, details that are not fully captured by the quantitative metrics. Specifically, our method not only effectively improves the semantic information perception ability of the generated map but also makes the generated map more similar in characteristics to the real map. This indicates that after incorporating the map feature loss, the model can more accurately consider the semantic structure of the map during the generation process, thereby further enhancing the quality and authenticity of the generated results. To validate the independence and fidelity of our proposed metric, we evaluate its performance across models optimized with diverse loss functions. As illustrated in Table 8, a comparative analysis was conducted on the MLMG-US dataset using baseline models trained with , , SSIM, MS-SSIM, LPIPS, and MFP. As illustrated in Table 8, our method generally outperforms other methods in terms of the mean of multiple indicators. The impact of specific loss functions on metric evaluation is disregarded (e.g., employing SSIM as a loss may result in elevated SSIM metric evaluation values). Utilizing PSNR as an objective metric, our method exhibits clear advantages for both the worst and best results, as demonstrated in Figure 9 (as evident from the red dots and distribution in the figure).
Table 8.
Performance comparison of different standalone fidelity loss functions in the Pix2Pix framework. All models are trained with , where represents the exclusive choice of the loss term below. Bold and underline represent the best and worst results, respectively. (↑: higher is better; ↓: lower is better).
Figure 9.
Violin plots illustrating the distribution of PSNR (↑) with different loss functions on the MLMG-US dataset. The red points represent mean values, and the black bars indicate the 95% confidence intervals. Red asterisks denote one-tailed t-tests for the means, indicating statistically significant differences (). The results demonstrate that our method produces more high-quality map images with fewer low-quality outliers.
4.4. Metric Validation Against Human Perception
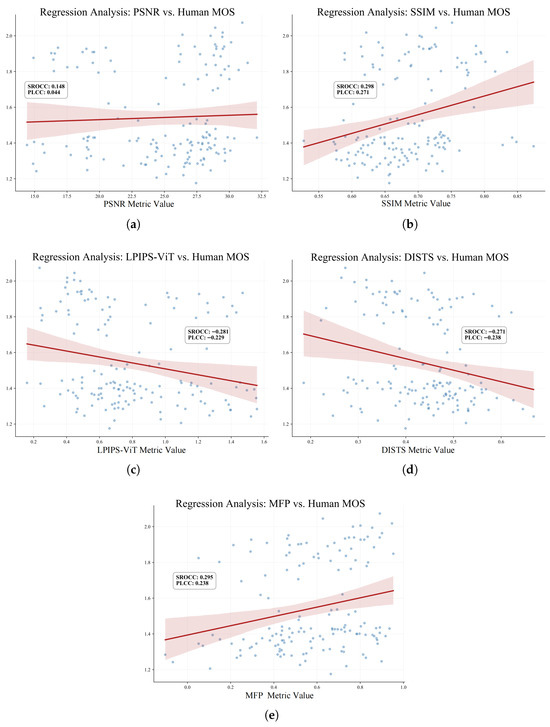
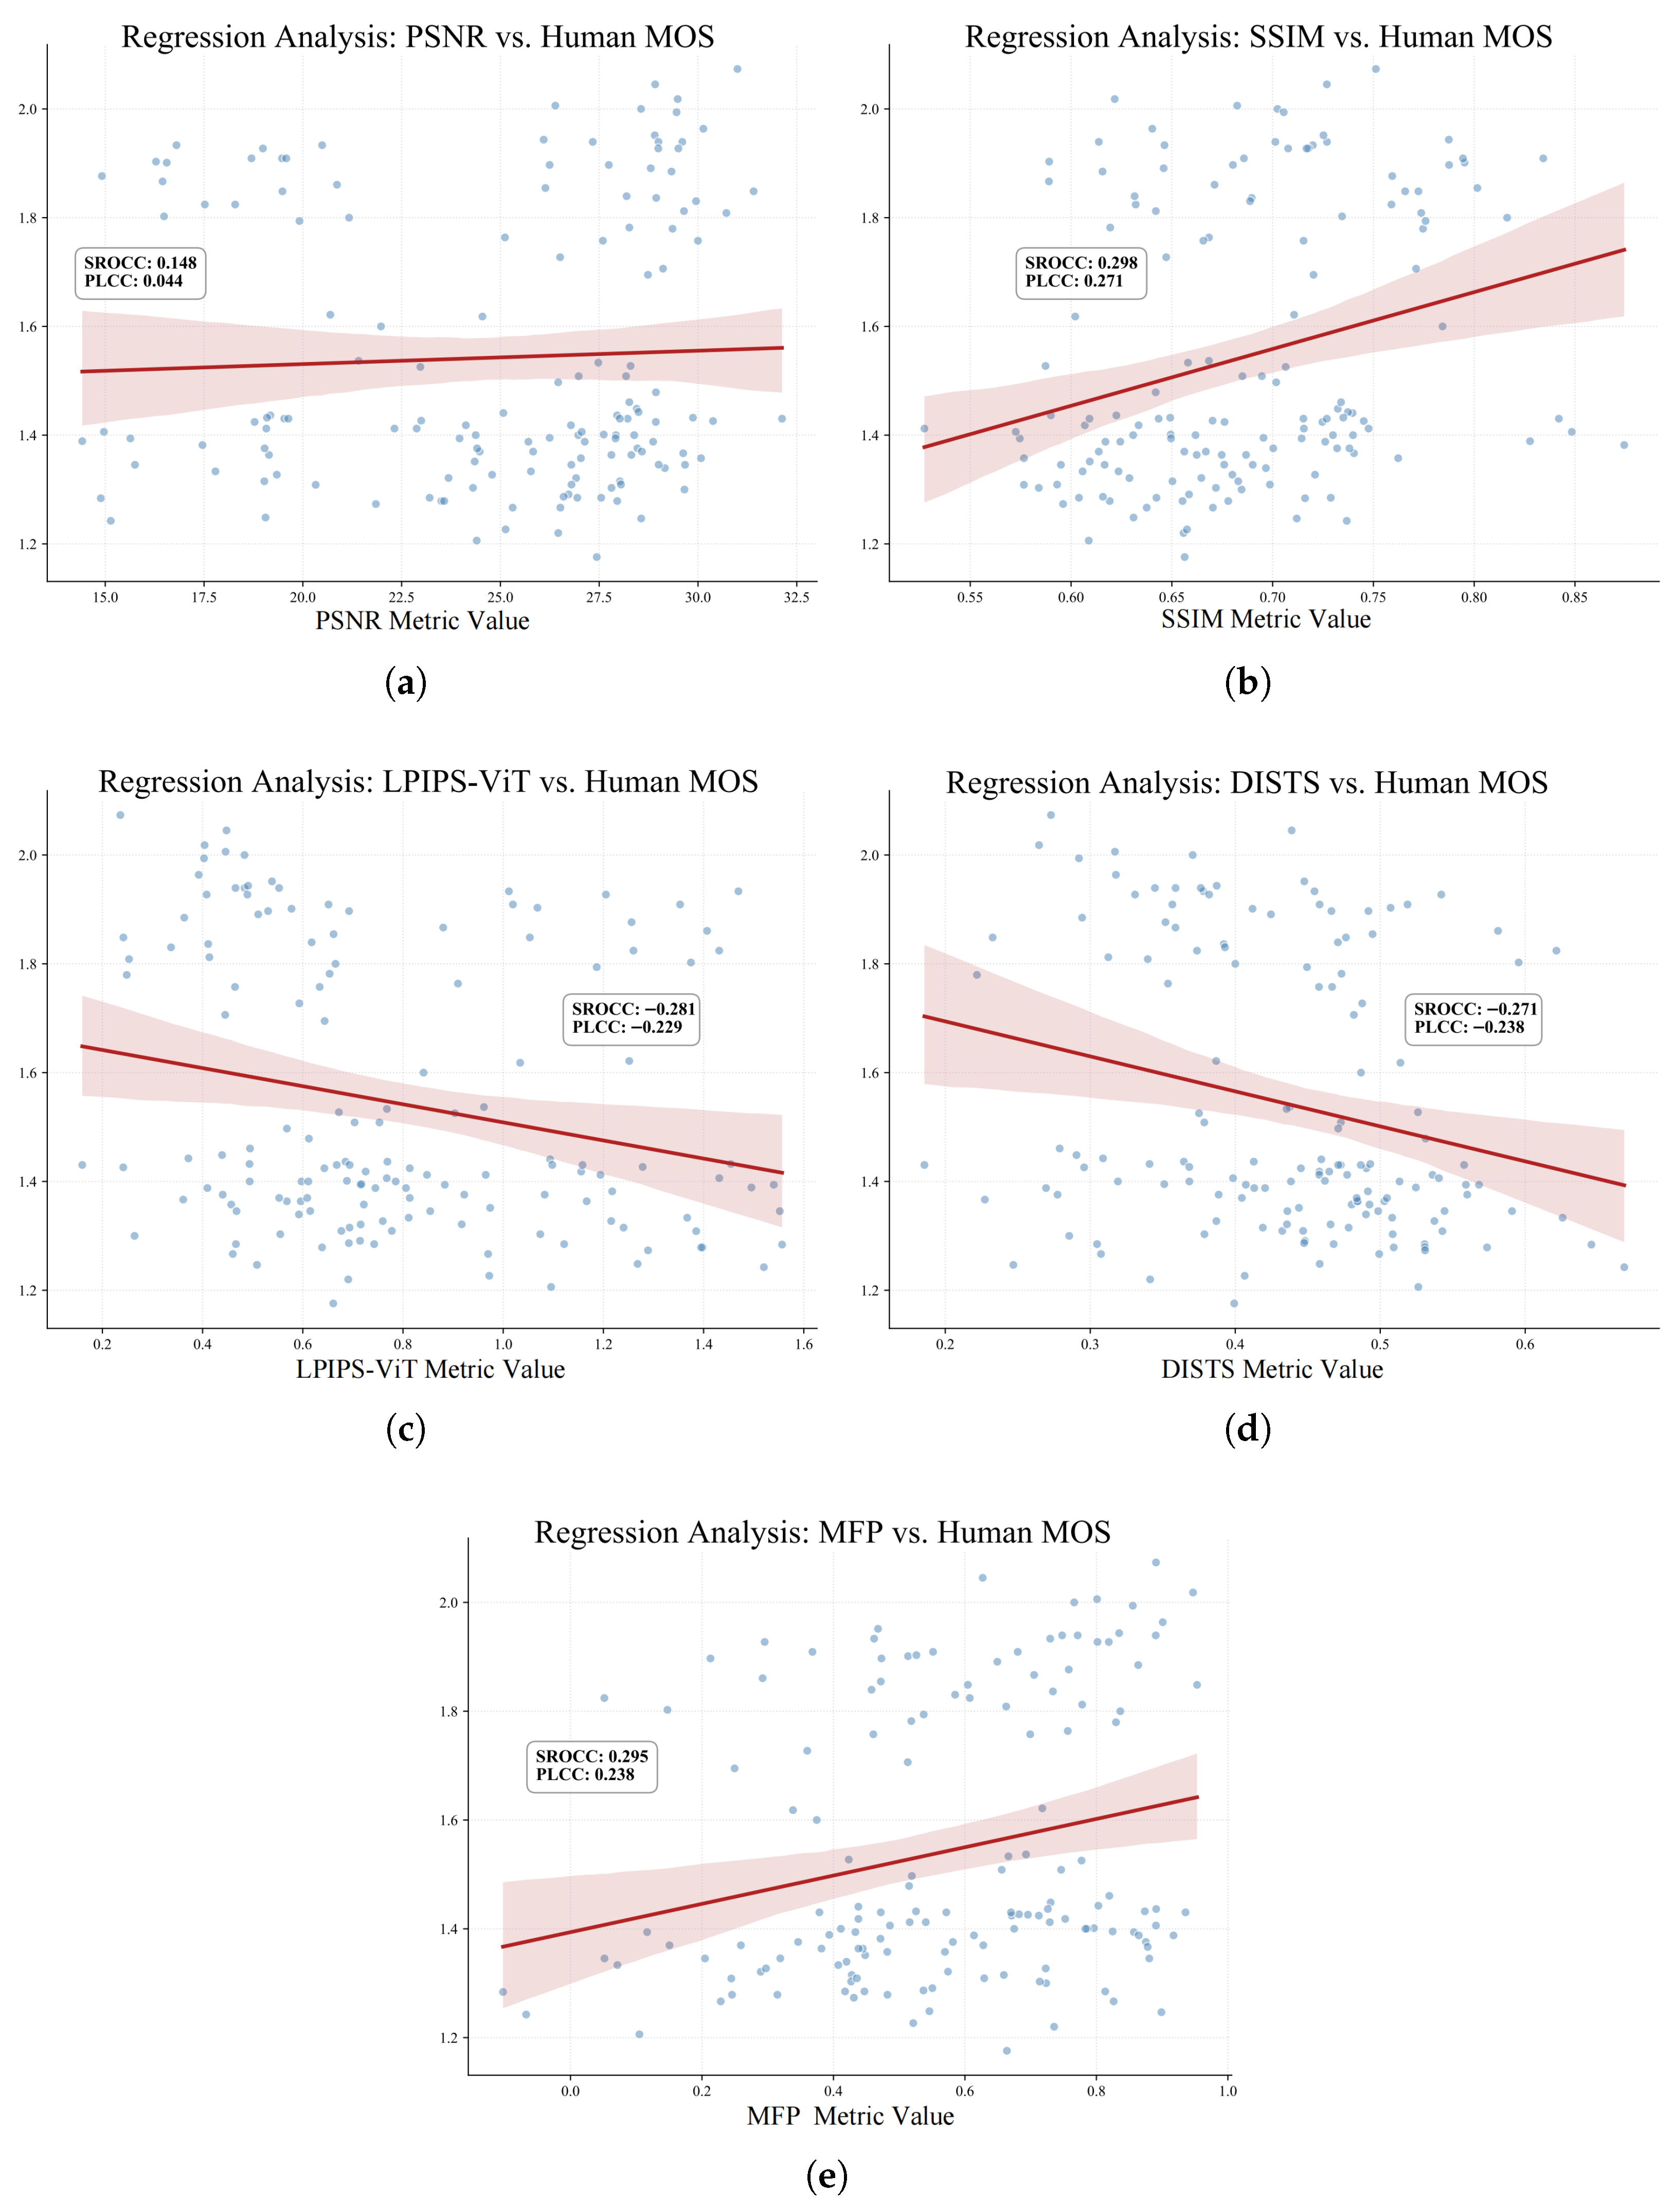
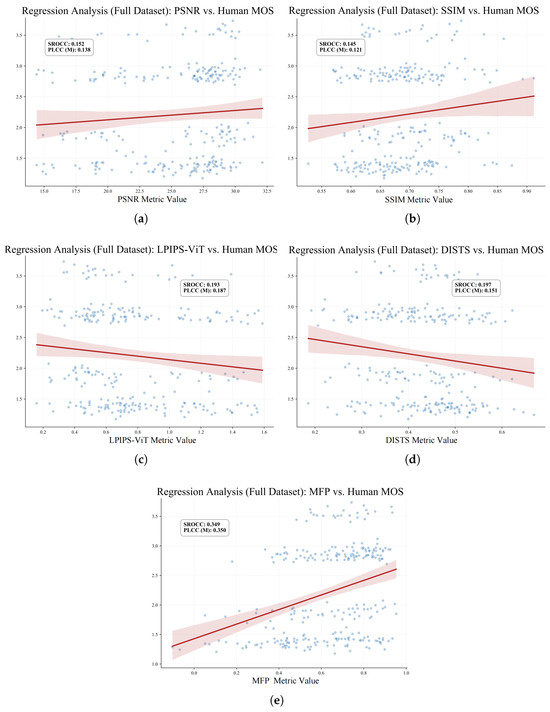
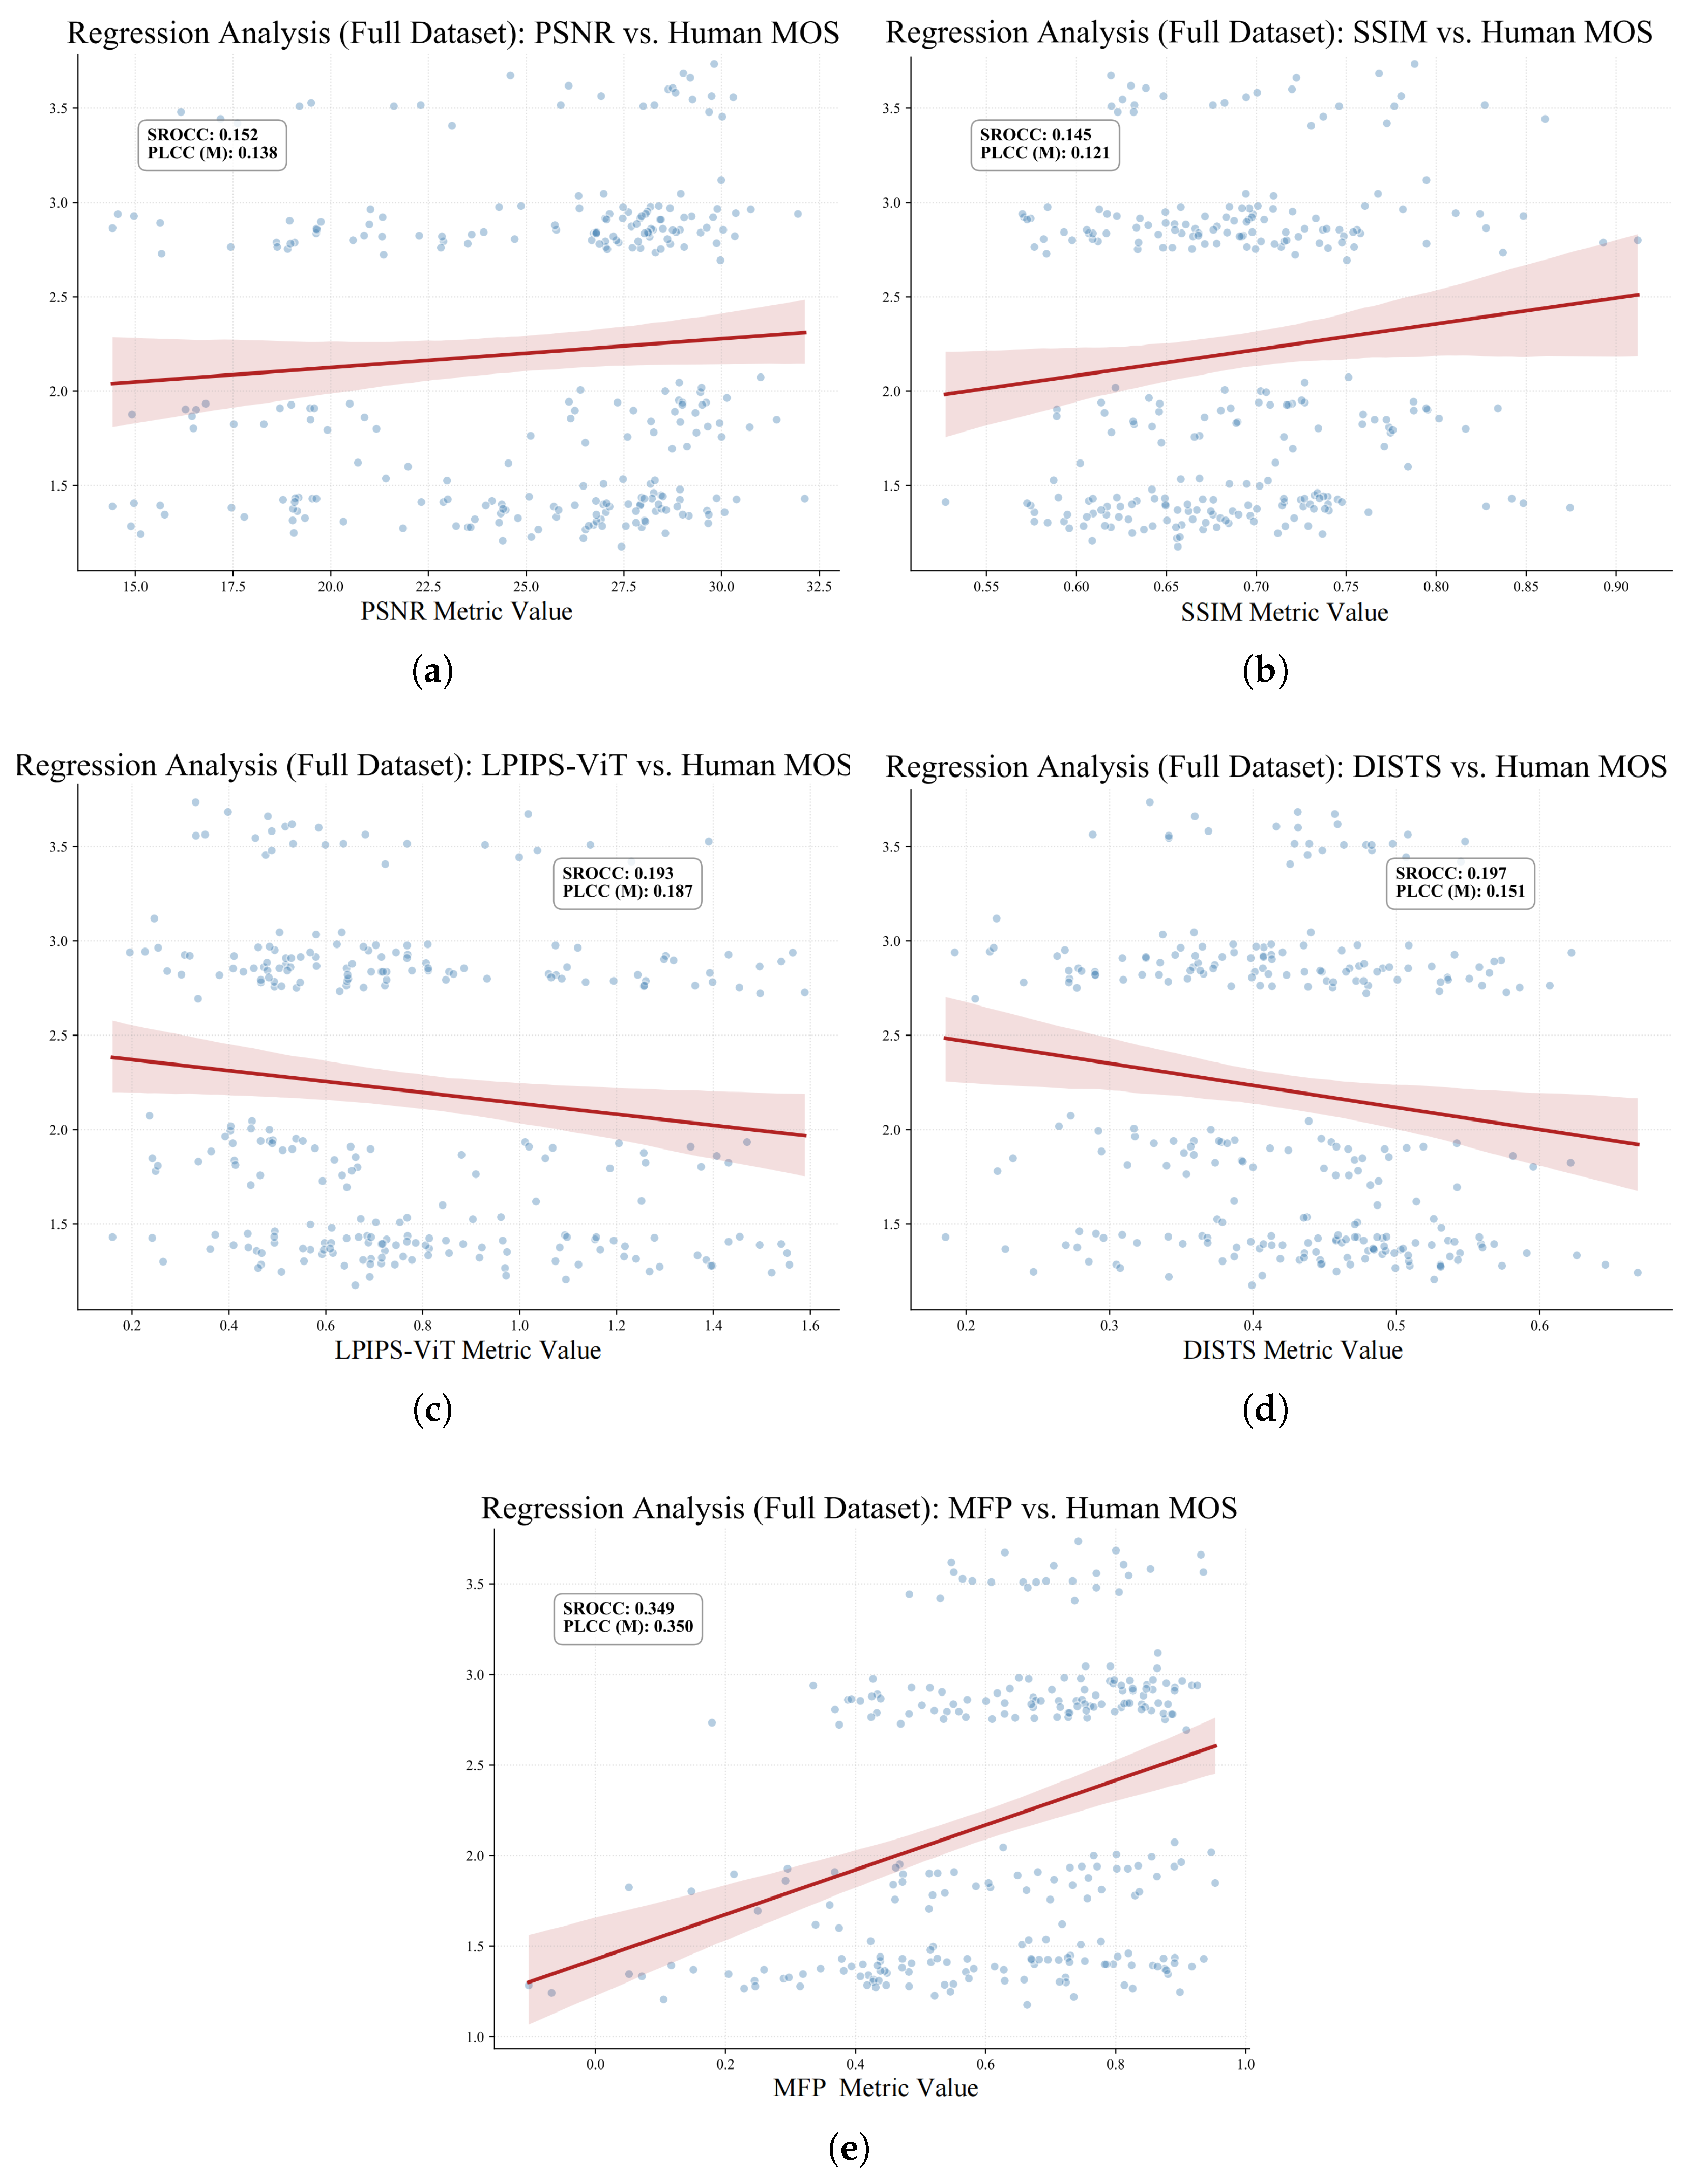
To validate whether the MFP metric aligns with human cartographic expertise, we conducted a subjective user study. We randomly sampled 300 instances from the MLMG-US dataset, covering multiple generative models (Pix2Pix, CycleGAN, ATME, etc.) and different optimization versions (baseline and MFP-optimized), ensuring the integrity of the quality gradient. We divided the 300 samples into 10 distinct questionnaires for the experiment, inviting 15 professional graduate students with cartography backgrounds and over 400 non-specialists to participate in the evaluation. Ultimately, we received a total of 500 questionnaires. Each questionnaire provides an input image, the target map, and maps generated by different models for evaluation. Respondents are asked to comprehensively rate the generated maps across three dimensions (on a scale of 1 to 5, where 1 is very poor and 5 is excellent): Visual Fidelity: Does it look like a real map? Semantic Consistency: Do the generated elements (roads, buildings) align with the positions in the input image? Structural Integrity: Is the road network topology reasonable? To eliminate individual subjective biases, we normalized the raw scores and calculated the mean opinion score (MOS) for each sample. To demonstrate the effectiveness of the MFP metric, we conducted a comparative analysis against traditional metrics (SSIM, PSNR) and state-of-the-art perceptual metrics (LPIPS-ViT, DISTS). The final scores are shown in Table 9. The experimental results in Table 9 demonstrate that incorporating our proposed MFP optimization significantly enhances the subjective quality of synthesized maps across all evaluated dimensions. For GAN-based models like Pix2Pix and CycleGAN, the average MOS scores experienced a substantial increase, jumping from approximately 1.3 to over 2.8. Diffusion-based models (GDFM and SCGM) exhibited even more pronounced gains, with SCGM achieving the highest overall average of 3.58. Notably, the marked improvements in structural integrity (SI) and semantic consistency (SC) across all frameworks suggest that our method effectively guides the models to capture complex cartographic topologies and geographical logic that traditional pixel-wise metrics often overlook. This quantitative leap in human-perceived quality—nearly doubling the baseline scores in several instances—underscores the efficacy of the MFP loss in bridging the gap between automated synthesis and professional cartographic standards. As shown in Figure 10, without incorporating any optimized offsets: MFP (Ours) demonstrates exceptionally strong independent evaluation capability, achieving an SROCC of 0.295. This performance matches that of the traditional metric SSIM (0.298) and significantly outperforms PSNR (0.148). Compared to general perceptual metrics LPIPS-ViT (SROCC: −0.281) and DISTS (SROCC: −0.271), MFP demonstrates more stable judgment logic in positive correlations. This indicates that MFP is better than general metrics at identifying global and structural features in maps. When all samples (including maps enhanced with our MFP optimization) were analyzed, significant divergence emerged across metrics (as shown in Figure 11): Most notably, with the inclusion of high-quality images, the SSIM correlation (SROCC) plummeted from 0.298 to 0.145. This indicates that SSIM is only effective at identifying blurriness and noise. When it comes to the deep semantic logic involved in map generation, SSIM fails to distinguish between significant leaps in image quality. Although the correlation between LPIPS-ViT and DISTS turned positive on the full dataset, it remained at a low level of approximately 0.19, indicating that general features still struggle to capture specific map semantics. Beyond global relevance, we also calculated the 2AFC consistency accuracy between the metric and human preferences. MFP achieved 66.9% consistency, significantly outperforming SSIM (59.2%). This further confirms that in “two-choice” decision tasks, MFP’s judgment direction closely aligns with that of cartographic experts.
Table 9.
Mean opinion score (MOS) evaluation results. Scores range from 1 to 5 (higher is better). VF: visual fidelity, SC: semantic consistency, SI: structural integrity. (↑: higher is better).
Figure 10.
Regression analysis of evaluation metrics on the baseline subset: (a) PSNR; (b) SSIM; (c) LPIPS-ViT; (d) DISTS; (e) MFP (Ours). The x-axis represents the metric value, and the y-axis represents the MOS value for each sample.
Figure 11.
Regression analysis of evaluation metrics on the full dataset (including MFP-optimized samples): (a) PSNR; (b) SSIM; (c) LPIPS-ViT; (d) DISTS; (e) MFP (Ours). The x-axis represents the metric value, and the y-axis represents the Mean Opinion Score for each sample.
Additionally, it is noteworthy in Figure 10 and Figure 11 that although the MFP indicator achieved the highest SROCC value with the mean opinion score (MOS), its absolute value remains relatively low at approximately 0.295. This phenomenon highlights a fundamental challenge in the automated evaluation of synthesized maps. Specifically, there is an inherent contradiction between the “one-vote veto” property of cartographic quality and the “global averaging” nature of deep feature metrics. In professional cartography, a single topological flaw such as a disconnected primary road or an overlapping building footprint can render an entire map geographically invalid. Human subjects are highly sensitive to these local showstoppers and will assign a low MOS regardless of the quality of the rest of the map. In contrast, deep feature extractors including ViT and CNN architectures typically employ global pooling or attention mechanisms that average features across the entire spatial domain. Consequently, the impact of a critical local topological error is often numerically “diluted” by the majority of correctly synthesized pixels. This mismatch between local sensitivity in human perception and global aggregation in neural networks explains the constrained correlation coefficients. Our findings suggest that while MFP makes significant strides in capturing semantic integrity, further research into spatially adaptive or topology-sensitive weighting mechanisms is necessary to bridge this gap.
4.5. Research on Semantic Visualization of Map Features
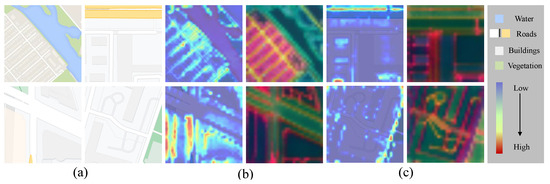
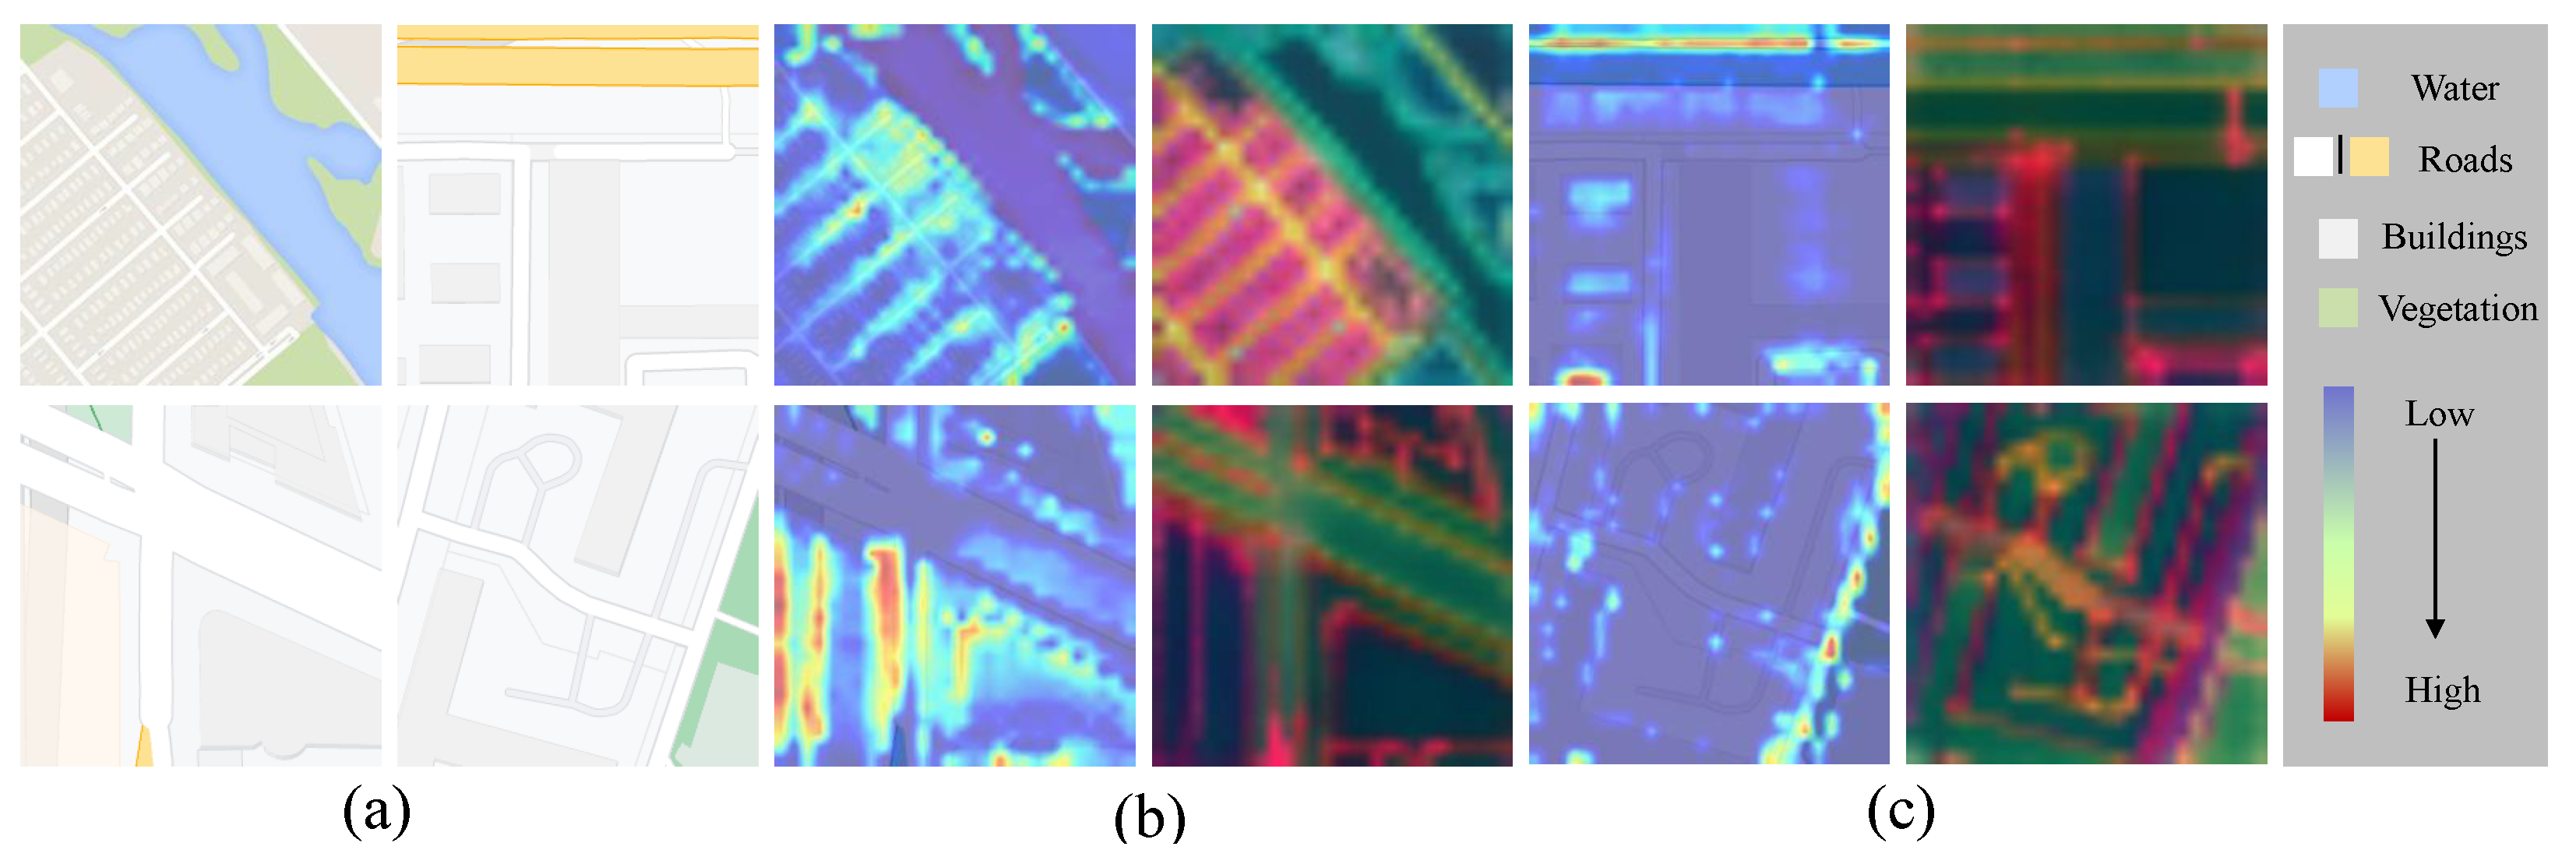
Next, to gain a deeper understanding of our map feature perception metric, which focuses on certain features, we visualize the index when extracting the semantic meaning of the map. Specifically, we use each map as input and the Grad-Cam method [41] to obtain the output feature map of the last layer and its gradient by forward and backward propagation of ViT. We obtain the activation map by weighted superposition, activation, and normalization of the feature map, which is mapped to the input image to achieve attention localization. The visualization result is shown in Figure 12b. We can see that the model pays more attention to the edges of some map elements. Finally, we visualize the map spatial similarity in the metric and perform a PCA dimensionality reduction on the self-similarity descriptor of . Figure 12c does not focus on the appearance of the map (such as the arrangement of buildings, the color of roads, etc.) but only captures the main semantic information of the map (the same semantic parts are processed with the same color). The results of the visualization processing further illustrate that our index can effectively capture the spatial semantic information in the map.
Figure 12.
Visualization of attention and feature distribution. The (top row) displays a sample from the Map dataset, and the (bottom row) shows a sample from the MLMG-US dataset: (a) Original images; (b) Attention visualization (darker regions indicate higher model focus/weight); (c) PCA visualization.
4.6. Correlation of Map Feature Perception Indicators Research
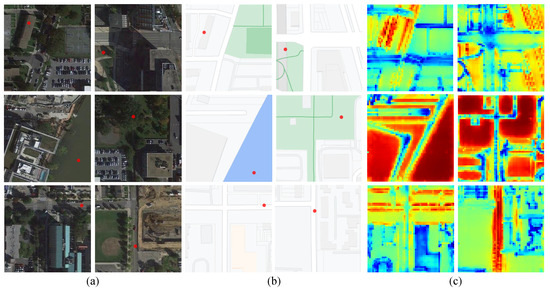
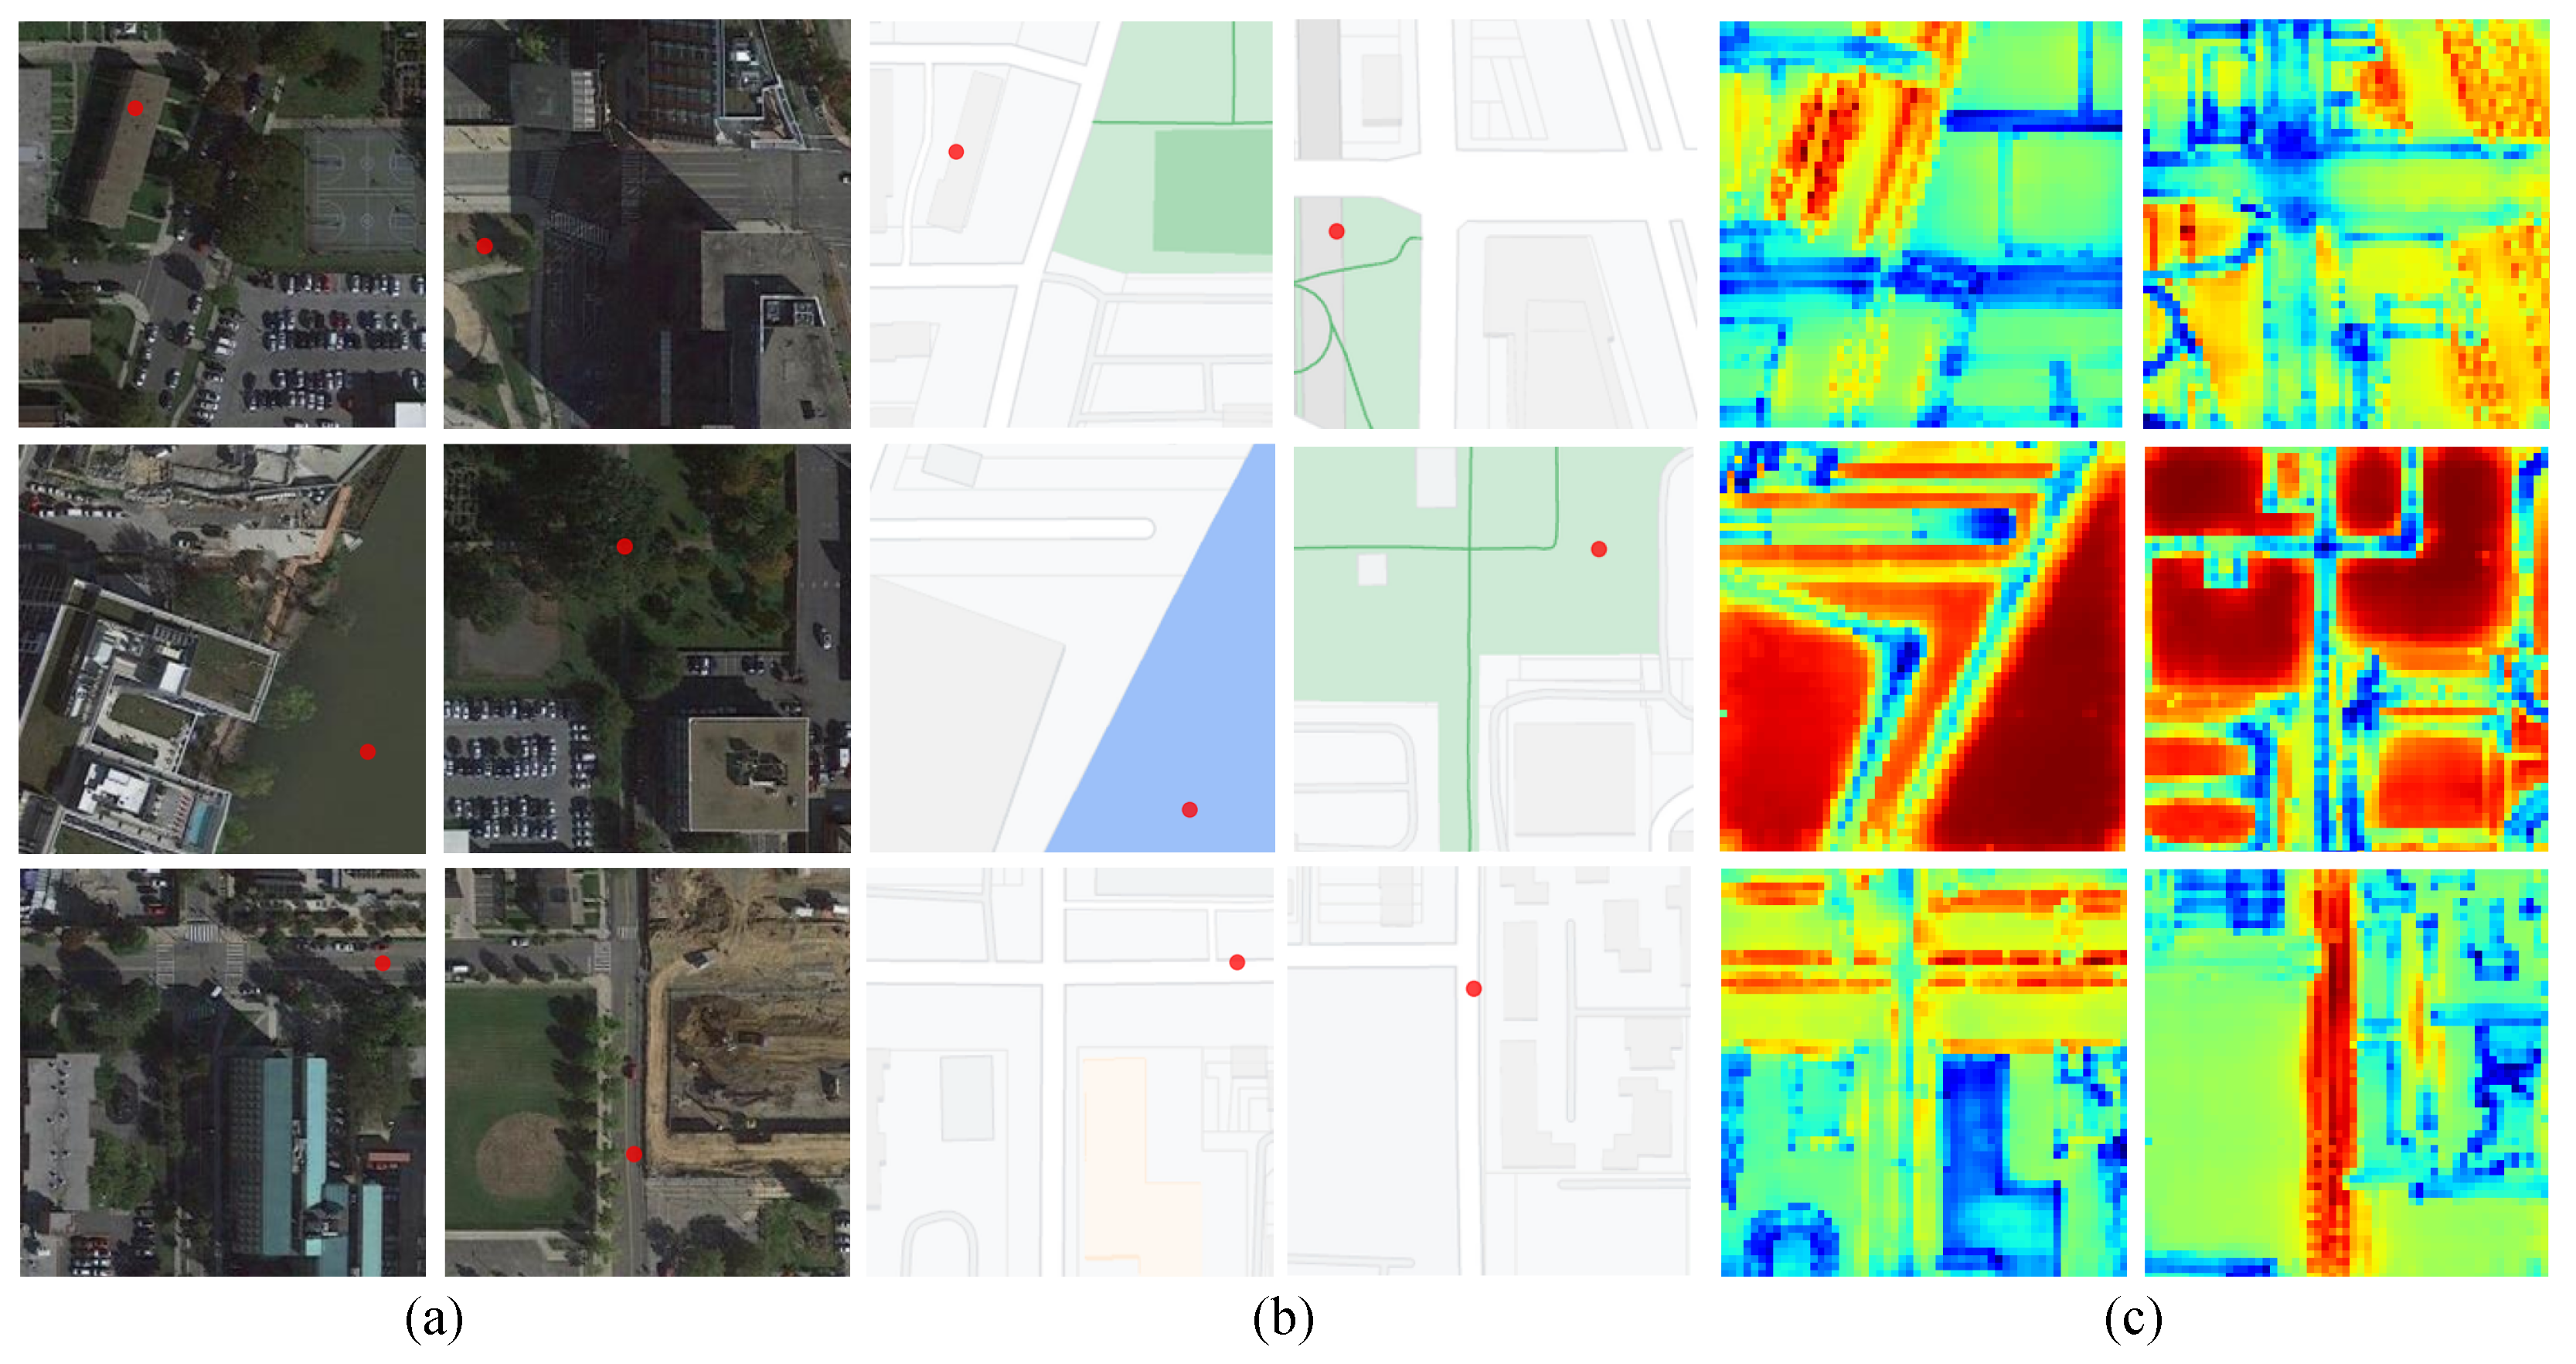
Through Section 4.3.1 and Section 4.3.2, the results of our qualitative and quantitative metrics demonstrate the ability of our map feature perception metrics to capture the overall characteristics of the map and its spatial similarity. However, this result may not be intuitive. We thus performed a feature correlation analysis of the original remote sensing images and their corresponding real map images. Specifically, we calculate the similarity of the corresponding feature points (labeled by position vectors) in the original remote sensing image to all features in the reference map. As illustrated in Figure 13, the semantic features of the remote sensing image exhibit a high degree of consistency with the map’s features in terms of location. Additionally, a degree of correlation is observed at other locations. As can be seen from the correlation map, our indicator can perceive semantics. It can establish a connection between the semantic features in the remote sensing image and the features of the elements in the map; on the other hand, it also successfully identifies the elements in the map.
Figure 13.
Feature similarity analysis between the reference point and target image. (a) original image with a reference point (red dot); (b) target image; (c) similarity map generated by calculating the feature correlation as defined in Equation (9). (Darker colors represent greater attention weights).
4.7. Ablation
To further validate the effectiveness of each component within the MFP metric and investigate the impact of hyperparameters on model performance, we conducted a series of ablation experiments based on the Pix2Pix framework on the MLMG-US dataset. As illustrated in Table 10, the baseline model (Exp. 1), which relies solely on standard pixel-level reconstruction, exhibits limited capability in capturing high-level cartographic semantics, evidenced by a high FID of 194.18 and a low MFP score of 0.275. As illustrated in Table 10, the baseline model in Exp. 1, which relies solely on traditional pixel-wise reconstruction, exhibits significant limitations in capturing the complex semantic and structural properties of cartographic data. This is evidenced by a high FID of 194.18 and a notably low MFP score of 0.275. The introduction of the global feature loss in Exp. 2 leads to a remarkable surge in the MFP score to 0.536 and achieves the highest SSIM of 0.7255. These results demonstrate that the [CLS] token effectively encodes macro-level scene attributes and visual style, which is crucial for maintaining perceptual consistency in generated maps. In contrast, the spatial semantic loss employed in Experiment 3 proved more effective at reducing distributional divergence, lowering the FID value to 177.41. However, its contribution to the MFP score was only 0.373, indicating that while local spatial configurations are vital for geographic integrity, they must be balanced with global features to achieve high-quality map synthesis. The synergistic effect of these two components is most clearly demonstrated in Exp. 4, where the full MFP metric utilizing our proposed hyperparameters () achieves the best overall performance. This configuration produced the lowest FID value (132.62) and the highest MFP score (0.610), achieving a 31.7% reduction in FID compared to the baseline. These findings establish that explicitly optimizing for both deep elemental-level features and global spatial configurations is essential for enhancing the geographical plausibility and structural correctness of synthesized maps. The quantitative improvements in this optimal setting align with the qualitative observations of clearer road structures and more accurate delineations of geographic boundaries like water areas and building groups. Our investigations into the sensitivity of hyperparameter in Experiments 5 and 6 further underscore the necessity of balanced semantics. When global feature weights are insufficient (as in Experiment 5 with ), the model fails to maintain global consistency, resulting in poor FID and MFP scores that consistently remain near baseline levels. Conversely, excessively high global weights (e.g., in Experiment 6) resulted in significant declines in FID, LPIPS, and DISTS. This indicates that overemphasizing macro-level feature alignment suppresses the model’s ability to reconstruct spatial structural details and geometric accuracy. Consequently, our results confirm that the selected weighting of and provides the ideal trade-off between global semantic guidance and local structural fidelity.
Table 10.
Ablation study of the proposed MFP components on the MLMG-US dataset. and denote global feature loss and spatial semantic loss, respectively; and represent their hyperparameters. Bold and underline represent the best and worst results, respectively. (↑: higher is better; ↓: lower is better).
5. Conclusions
This paper addresses the inadequacy of pixel-wise metrics in generative cartography by introducing the map feature perception (MFP) metric, a framework that evaluates maps based on deep semantic features rather than superficial pixel values. Our research presents a paradigm shift from simple pixel reconstruction to the preservation of essential cartographic semantics and spatial structures. The central contribution is a unified tool that is not only a more accurate evaluator of map quality but also a powerful loss function for model optimization. Our experiments conclusively demonstrate that when used as an optimization objective, MFP guides generative models to produce maps with substantially higher geographical fidelity and structural integrity. By directly aligning the technical optimization process with the functional requirements of cartography, MFP effectively bridges the critical gap between pixel-level synthesis and semantic correctness. This work establishes a new and more meaningful benchmark for developing and validating generative cartographic models, enhancing their plausibility and utility for downstream geospatial applications.
However, some limitations of this work should be noted. The reliance on deep Vision Transformer backbones introduces higher computational complexity compared to traditional metrics, which may limit its application in resource-constrained environments. Additionally, while the metric performs robustly on the selected urban datasets, its generalizability across diverse geographical scales and specialized map types remains to be further validated. The inherent “black-box” nature of neural network features also poses challenges for the direct interpretability of specific cartographic errors. This work establishes a new and more meaningful benchmark for developing and validating generative cartographic models. Future research will focus on optimizing the computational efficiency of the MFP metric and enhancing its explainability to provide more actionable feedback for downstream geospatial applications.
Author Contributions
Conceptualization, C.S. and Z.C.; data curation, J.B. and H.C.; formal analysis, X.L. and C.S.; funding acquisition, X.L. and Z.C.; investigation, J.B. and H.C.; methodology, J.B. and C.S.; project administration, C.S. and Z.C.; resources, Z.C.; software, J.B.; supervision, X.L. and Z.C.; validation, J.B.; visualization, J.B.; writing—original draft, J.B. and C.S.; writing—review and editing, X.L. and Z.C. All authors have read and agreed to the published version of the manuscript.
Funding
This study is funded by the National Natural Science Foundation of China under Grant 42471475; Deep Earth Probe and Mineral Resources Exploration—National Science and Technology Major Project under Grant 2025ZD1008501; the Key Projects of Foundation Improvement Program; the Opening Fund of Key Laboratory of Geological Survey and Evaluation of Ministry of Education (Grant No. GLAB 2024ZR06); the Fundamental Research Funds for the Central Universities; the Natural Science Foundation of Hubei Province, China (Grant No. 2025AFB107) and Joint Open Fund of the Research Platforms of School of Computer Science, China University of Geosciences, Wuhan (No. PTLH2024-B-09).
Institutional Review Board Statement
Ethical review and approval were waived for this study due to its non-interventional nature.
Informed Consent Statement
Informed consent was obtained from all subjects involved in the study.
Data Availability Statement
The code and data for our key contributions will be open sourced in the code repository: https://github.com/AKAxiaobai-123/MFP, accessed on 13 January 2026.
Acknowledgments
During the preparation of this manuscript, the authors used ChatGPT (version 5.0, OpenAI, San Francisco, CA, USA) and Gemini (version 3 Pro, Google, Mountain View, CA, USA) for the purposes of text polishing and linguistic refinement. The authors have reviewed and edited the output and take full responsibility for the content of this publication.
Conflicts of Interest
The authors declare that the research was conducted in the absence of any commercial or financial relationships that could be construed as a potential conflict of interest.
References
- Isola, P.; Zhu, J.Y.; Zhou, T.; Efros, A.A. Image-to-Image Translation with Conditional Adversarial Networks. In Proceedings of the 2017 IEEE Conference on Computer Vision and Pattern Recognition (CVPR), Honolulu, HI, USA, 21–26 July 2017; pp. 1125–1134. [Google Scholar]
- Ho, J.; Jain, A.; Abbeel, P. Denoising Diffusion Probabilistic Models. In Advances in Neural Information Processing Systems; NeurIPS: San Diego, CA, USA, 2020; Volume 33, pp. 6840–6851. [Google Scholar]
- Zhao, H.; Gallo, O.; Frosio, I.; Kautz, J. Loss Functions for Image Restoration with Neural Networks. IEEE Trans. Comput. Imaging 2017, 3, 47–57. [Google Scholar] [CrossRef] [Scilit]
- Wang, Z.; Bovik, A.; Sheikh, H.; Simoncelli, E. Image quality assessment: From error visibility to structural similarity. IEEE Trans. Image Process. 2004, 13, 600–612. [Google Scholar] [CrossRef] [Scilit] [PubMed]
- Heusel, M.; Ramsauer, H.; Unterthiner, T.; Nessler, B.; Hochreiter, S. Gans trained by a two time-scale update rule converge to a local nash equilibrium. In Advances in Neural Information Processing Systems; NeurIPS: San Diego, CA, USA, 2017; Volume 30. [Google Scholar]
- Simonyan, K.; Zisserman, A. Very deep convolutional networks for large-scale image recognition. arXiv 2014, arXiv:1409.1556. [Google Scholar]
- Zhang, R.; Isola, P.; Efros, A.A.; Shechtman, E.; Wang, O. The Unreasonable Effectiveness of Deep Features as a Perceptual Metric. In Proceedings of the 2018 IEEE/CVF Conference on Computer Vision and Pattern Recognition, Salt Lake City, UT, USA, 18–23 June 2018; pp. 586–595. [Google Scholar] [CrossRef] [Scilit]
- Mustafa, A.; Mikhailiuk, A.; Iliescu, D.A.; Babbar, V.; Mantiuk, R.K. Training a Task-Specific Image Reconstruction Loss. In Proceedings of the 2022 IEEE/CVF Winter Conference on Applications of Computer Vision (WACV), Waikoloa, HI, USA, 3–8 January 2022; pp. 21–30. [Google Scholar] [CrossRef] [Scilit]
- Mei, J.; Li, R.J.; Gao, W.; Cheng, M.M. CoANet: Connectivity Attention Network for Road Extraction from Satellite Imagery. IEEE Trans. Image Process. 2021, 30, 8540–8552. [Google Scholar] [CrossRef] [Scilit] [PubMed]
- Zhou, G.; Chen, W.; Gui, Q.; Li, X.; Wang, L. Split Depth-Wise Separable Graph-Convolution Network for Road Extraction in Complex Environments From High-Resolution Remote-Sensing Images. IEEE Trans. Geosci. Remote Sens. 2022, 60, 5614115. [Google Scholar] [CrossRef] [Scilit]
- Sultan, R.I.; Li, C.; Zhu, H.; Khanduri, P.; Brocanelli, M.; Zhu, D. GeoSAM: Fine-tuning SAM with sparse and dense visual prompting for automated segmentation of mobility infrastructure. arXiv 2023, arXiv:2311.11319. [Google Scholar]
- Zhang, J.; Zhou, Z.; Mai, G.; Mu, L.; Hu, M.; Li, S. Text2Seg: Remote Sensing Image Semantic Segmentation via Text-Guided Visual Foundation Models. arXiv 2023, arXiv:2304.10597. [Google Scholar]
- Dosovitskiy, A. An image is worth 16x16 words: Transformers for image recognition at scale. arXiv 2020, arXiv:2010.11929. [Google Scholar]
- Xu, Z.; Zhang, W.; Zhang, T.; Yang, Z.; Li, J. Efficient Transformer for Remote Sensing Image Segmentation. Remote Sens. 2021, 13, 3585. [Google Scholar] [CrossRef] [Scilit]
- Yang, L.; Zheng, Z.; Chen, B.; Zhao, Z.; Lin, C.; Shen, C. Nullu: Mitigating object hallucinations in large vision-language models via halluspace projection. In Proceedings of the 2025 IEEE/CVF Conference on Computer Vision and Pattern Recognition (CVPR), Nashville, TN, USA, 10–17 June 2025; pp. 14635–14645. [Google Scholar]
- Pang, Y.; Lin, J.; Qin, T.; Chen, Z. Image-to-Image Translation: Methods and Applications. IEEE Trans. Multimed. 2022, 24, 3859–3881. [Google Scholar] [CrossRef] [Scilit]
- Xu, J.; Li, H.; Zhou, S. An overview of deep generative models. IETE Tech. Rev. 2015, 32, 131–139. [Google Scholar] [CrossRef] [Scilit]
- Oussidi, A.; Elhassouny, A. Deep generative models: Survey. In Proceedings of the 2018 International Conference on Intelligent Systems and Computer Vision (ISCV), Fez, Morocco, 2–4 April 2018; pp. 1–8. [Google Scholar] [CrossRef] [Scilit]
- Kingma, D.P.; Welling, M. Auto-Encoding Variational Bayes. arXiv 2022, arXiv:1312.6114. [Google Scholar] [PubMed]
- Mirza, M. Conditional generative adversarial nets. arXiv 2014, arXiv:1411.1784. [Google Scholar] [CrossRef] [Scilit]
- Saharia, C.; Chan, W.; Chang, H.; Lee, C.; Ho, J.; Salimans, T.; Fleet, D.; Norouzi, M. Palette: Image-to-image diffusion models. In Proceedings of the SIGGRAPH’22: Special Interest Group on Computer Graphics and Interactive Techniques Conference, Vancouver, BC, Canada, 7–11 August 2022; pp. 1–10. [Google Scholar]
- Choi, Y.; Choi, M.; Kim, M.; Ha, J.W.; Kim, S.; Choo, J. Stargan: Unified generative adversarial networks for multi-domain image-to-image translation. In Proceedings of the 2018 IEEE/CVF Conference on Computer Vision and Pattern Recognition, Salt Lake City, UT, USA, 18–23 June 2018; pp. 8789–8797. [Google Scholar]
- Blau, Y.; Michaeli, T. The Perception-Distortion Tradeoff. In Proceedings of the 2018 IEEE/CVF Conference on Computer Vision and Pattern Recognition, Salt Lake City, UT, USA, 18–23 June 2018; pp. 6228–6237. [Google Scholar] [CrossRef] [Scilit]
- Haunold, P.; Kuhn, W. A keystroke level analysis of manual map digitizing. In COSIT; Series Title: Lecture Notes in Computer Science; Frank, A.U., Campari, I., Goos, G., Hartmanis, J., Eds.; Springer: Berlin/Heidelberg, Germany, 1993; Volume 716, pp. 406–420. [Google Scholar] [CrossRef] [Scilit]
- Ganguli, S.; Garzon, P.; Glaser, N. GeoGAN: A Conditional GAN Generate Standard Layer of Maps from Satellite Images; Technical Report; Department Computer Science, Stanford University: Stanford, CA, USA, 2018. [Google Scholar]
- Jiang, L.; Zhang, C.; Huang, M.; Liu, C.; Shi, J.; Loy, C.C. Tsit: A simple and versatile framework for image-to-image translation. In Computer Vision—ECCV 2020, Proceedings of the 16th European Conference, Glasgow, UK, 23–28 August 2020; Springer: Cham, Switzerland, 2020; pp. 206–222. [Google Scholar]
- Chen, X.; Chen, S.; Peng, J.; Mei, X.; Li, H. SMAPGAN: Generative Adversarial Network-Based Semisupervised Styled Map Tile Generation Method. IEEE Trans. Geosci. Remote Sens. 2021, 59, 4388–4406. [Google Scholar] [CrossRef] [Scilit]
- Sun, C.; Fan, X.; Lu, X.; Zhou, L.; Zhao, J.; Dong, Y.; Chen, Z. Feature Constraints Map Generation Models Integrating Generative Adversarial and Diffusion Denoising. Remote Sens. 2025, 17, 2683. [Google Scholar] [CrossRef] [Scilit]
- Zhu, J.Y.; Park, T.; Isola, P.; Efros, A.A. Unpaired Image-to-Image Translation Using Cycle-Consistent Adversarial Networks. In Proceedings of the 2017 IEEE International Conference on Computer Vision (ICCV), Venice, Italy, 22–29 October 2017; pp. 2242–2251. [Google Scholar] [CrossRef] [Scilit]
- Wang, Z.; Simoncelli, E.; Bovik, A. Multiscale structural similarity for image quality assessment. In Proceedings of the Thrity-Seventh Asilomar Conference on Signals, Systems & Computers, Pacific Grove, CA, USA, 9–12 November 2003; Volume 2, pp. 1398–1402. [Google Scholar] [CrossRef] [Scilit]
- Johnson, J.; Alahi, A.; Fei-Fei, L. Perceptual losses for real-time style transfer and super-resolution. In Computer Vision—ECCV 2016, Proceedings of the 14th European Conference, Amsterdam, The Netherlands, 11–14 October 2016; Springer: Cham, Switzerland, 2016; pp. 694–711. [Google Scholar]
- Liu, Y.; Chen, H.; Chen, Y.; Yin, W.; Shen, C. Generic Perceptual Loss for Modeling Structured Output Dependencies. In Proceedings of the 2021 IEEE/CVF Conference on Computer Vision and Pattern Recognition (CVPR), Nashville, TN, USA, 20–25 June, 2021; pp. 5420–5428. [Google Scholar] [CrossRef] [Scilit]
- Ding, K.; Ma, K.; Wang, S.; Simoncelli, E.P. Image quality assessment: Unifying structure and texture similarity. IEEE Trans. Pattern Anal. Mach. Intell. 2020, 44, 2567–2581. [Google Scholar] [CrossRef] [Scilit] [PubMed]
- Tumanyan, N.; Bar-Tal, O.; Bagon, S.; Dekel, T. Splicing ViT Features for Semantic Appearance Transfer. In Proceedings of the 2022 IEEE/CVF Conference on Computer Vision and Pattern Recognition (CVPR), New Orleans, LA, USA, 18–24 June 2022; pp. 10748–10757. [Google Scholar]
- Amir, S.; Gandelsman, Y.; Bagon, S.; Dekel, T. Deep vit features as dense visual descriptors. arXiv 2021, arXiv:2112.05814. [Google Scholar]
- Zhang, H.; Dou, H.; Miao, Z.; Zheng, N.; Hao, M.; Shi, W. Extracting Building Footprint From Remote Sensing Images by an Enhanced Vision Transformer Network. IEEE Trans. Geosci. Remote Sens. 2024, 62, 5406814. [Google Scholar] [CrossRef] [Scilit]
- Caron, M.; Touvron, H.; Misra, I.; Jégou, H.; Mairal, J.; Bojanowski, P.; Joulin, A. Emerging properties in self-supervised vision transformers. In Proceedings of the 2021 IEEE/CVF International Conference on Computer Vision (ICCV), Montreal, QC, Canada, 10–17 October 2021; pp. 9650–9660. [Google Scholar]
- Sun, C.; Xu, Y.; Xu, X.; Fan, X.; Bai, J.; Lu, X.; Chen, Z. Bridging Scales in Map Generation: A Scale-Aware Cascaded Generative Mapping Framework for Seamless and Consistent Multi-Scale Cartographic Representation. arXiv 2025, arXiv:2502.04991. [Google Scholar] [CrossRef] [Scilit]
- Fu, Y.; Liang, S.; Chen, D.; Chen, Z. Translation of Aerial Image Into Digital Map via Discriminative Segmentation and Creative Generation. IEEE Trans. Geosci. Remote Sens. 2022, 60, 4703715. [Google Scholar] [CrossRef] [Scilit]
- Wang, T.C.; Liu, M.Y.; Zhu, J.Y.; Tao, A.; Kautz, J.; Catanzaro, B. High-resolution image synthesis and semantic manipulation with conditional gans. In Proceedings of the 2018 IEEE/CVF Conference on Computer Vision and Pattern Recognition, Salt Lake City, UT, USA, 18–23 June 2018; pp. 8798–8807. [Google Scholar]
- Selvaraju, R.R.; Cogswell, M.; Das, A.; Vedantam, R.; Parikh, D.; Batra, D. Grad-cam: Visual explanations from deep networks via gradient-based localization. In Proceedings of the 2017 IEEE International Conference on Computer Vision (ICCV), Venice, Italy, 22–29 October 2017; pp. 618–626. [Google Scholar]

Disclaimer/Publisher’s Note: The statements, opinions and data contained in all publications are solely those of the individual author(s) and contributor(s) and not of MDPI and/or the editor(s). MDPI and/or the editor(s) disclaim responsibility for any injury to people or property resulting from any ideas, methods, instructions or products referred to in the content. |
© 2026 by the authors. Licensee MDPI, Basel, Switzerland. This article is an open access article distributed under the terms and conditions of the Creative Commons Attribution (CC BY) license.