


Highlights
What are the main findings?
- Ice clouds at both sites exhibit pronounced diurnal and seasonal variability, with substantial regional differences in their physical characteristics and radiative impacts, as revealed by long-term, high-resolution radar observations.
- Longwave radiation dominates the net radiative forcing of ice clouds at the top of the atmosphere at both sites, leading to atmospheric heating within and beneath cloud layers, while ice clouds substantially reduce surface net radiation, resulting in an overall cooling effect.
What are the implications of the main findings?
- Ice cloud radiative effects show strong diurnal variability driven by daily changes in cloud occurrence and physical properties, highlighting a critical but previously underexplored diurnal influence on cloud–radiation interactions.
- This study characterizes midlatitude ice cloud physical and radiative properties across multiple timescales, providing observational constraints for improving ice cloud parameterizations and more accurately assessing cloud–radiation interactions in midlatitude climate systems.
Abstract
Ice clouds play a significant role in the Earth’s radiation balance due to their unique microphysical and radiative properties, which vary with formation mechanisms and regions and influence the local energy budget. In this study, six years of Ka-band Zenith Radar (KAZR) observations from the Semi-Arid Climate and Environment Observatory of Lanzhou University (SACOL) and the Southern Great Plains (SGP) sites, combined with the Fu–Liou radiative transfer model, were used to examine the macrophysical and microphysical properties of ice clouds, their radiative effects, and contributions to the surface energy budget. The results show that the frequency of ice cloud occurrence at SACOL is 40%, significantly higher than the 27% observed at SGP. At both sites, ice cloud altitudes exhibit an increasing trend in the context of recent warming, with a more pronounced increase at SGP. Seasonal variations are evident, with spring characterized by relatively thick and widespread ice clouds, while summer is dominated by high-altitude, optically thin clouds. Ice cloud occurrence peaks at night and decreases during the day at both sites; however, cloud diurnal variations in summer are much greater at SGP than at SACOL. Radiative analysis indicates that longwave radiation-induced warming dominates ice cloud radiative forcing. Net radiative forcing at the top of the atmosphere is 6.08 W/m2 at SACOL and 3.06 W/m2 at SGP, contributing to atmospheric heating within and beneath cloud layers. At the surface, sensible heat dominates the energy budget at SACOL (over 63%) due to its arid climate, whereas latent heat dominates at SGP (about 67%) because of abundant moisture; and ice clouds have the greatest impact in winter, reducing surface net radiation by 29% at SACOL and 26% at SGP, producing a cooling effect.
1. Introduction
About 20–30% of the Earth’s surface is covered by ice clouds, which are mostly made up of microscopic ice crystals with irregular shapes and are mostly created in the upper troposphere [1,2,3]. Compared to low-level water clouds, ice clouds have a small optical thickness, which allows more shortwave solar radiation to penetrate and reach the surface, thereby weakening the albedo effect. Meanwhile, due to their higher altitude, ice clouds emit infrared radiation at lower temperatures, which reduces the outgoing longwave radiation from the Earth-atmosphere system and enhances the greenhouse effect [4,5,6,7]. Matus and L’Ecuyer [8] reported that, on a global scale, ice clouds contribute a net radiative forcing of up to 3.5 W/m2, indicating a substantial warming effect on the Earth-atmosphere system. This highlights the importance of ice clouds in shaping the global radiative energy balance and underscores the need for detailed investigation into their characteristics and impacts.
Due to varying meteorological conditions across different regions, the formation mechanisms of ice clouds differ, resulting in significant variations in their physical properties. In tropical areas, ice clouds are primarily formed by airflows released from the tops of deep convective cumulonimbus clouds. Most of these clouds are located at the tops of convective systems, where their greenhouse effect often surpasses the albedo effect, leading to a net warming of the surface-atmosphere system. Studies have shown that ice clouds over the western Pacific can increase atmospheric temperatures near 110 hPa by approximately 1.3 K [9]. In mid-latitude regions, the occurrence frequency of ice clouds is second only to that in the tropics [2,10,11]. However, ice cloud occurrence varies considerably across midlatitude regions due to differences in topography and climate. Due to frequent storm activities, mid-latitude ice clouds mainly originate from the release of deep convective cloud systems and ice nucleation processes within atmospheric circulation [2,12]. According to De et al. [13], the effective diameter of ice crystals in mid-latitude ice clouds is smaller, with a median of about 165 μm, compared to 210 μm in high-latitude ice clouds, a difference likely due to higher aerosol loading and more active convection in the mid-latitudes. Krämer et al. [14] found that globally, tropical regions exhibited the highest ice crystal number concentrations among cirrus clouds (up to 0.074 cm−3), followed by mid-latitude and polar regions. Beyond regional differences, ice cloud properties also exhibit significant seasonal and diurnal variability. Studies by Feofilov et al. [15] and Zhao et al. [16] showed that ice cloud coverage is more extensive over mid-latitude land in winter, while in the tropics, it peaks in summer and autumn. Ice clouds are also more prevalent at night than during the day, with substantial amplitude differences. Gouveia et al. [17] observed that in the low-latitude Amazon, the frequency of ice cloud occurrence reaches a minimum at noon and a maximum in the evening. Wang et al. [18] reported that ice clouds in the mid-latitude region are more likely to occur at night, with a maximum frequency of 48% at midnight compared to 35% at noon. These findings highlight the complex and diverse spatiotemporal variations in ice cloud physical properties, which pose challenges to accurately representing ice cloud processes in climate model parameterizations. Therefore, utilizing long-term and reliable observations to analyze the occurrence and evolution of ice cloud physical properties is crucial for improving the parameterization schemes in climate models, reducing model uncertainties, and advancing our understanding of ice cloud radiative feedback mechanisms. However, the limitation in observational capabilities has resulted in a scarcity of long-term cloud observation, especially high-temporal resolution datasets required to examine the diurnal variability of cloud properties.
With continuous advancements in detection technologies, remote sensing and ground-based observations have gradually become essential tools for cloud monitoring. However, most passive satellite retrieval products may partially miss thin cirrus clouds [19], especially if they overlap mid- and low-cloud layers. Ka-band millimeter-wave cloud radars (KAZR) have demonstrated distinct advantages in ice cloud observation due to their superior detection capabilities. KAZR is capable of penetrating low-level liquid clouds to detect high-altitude ice clouds, accurately capturing the vertical structure of multilayer cloud systems. It can also effectively identify small cloud particles and light precipitation phenomena. In addition, KAZR provides ultra-high temporal resolution measurements, offering a solid observational foundation for accurately identifying ice clouds and investigating their macrophysical and microphysical properties across multiple temporal scales [20]. In January 2011, the Southern Great Plains (SGP) site in the United States deployed the KAZR cloud radar, enhancing the active remote sensing products of the Atmospheric Radiation Measurement (ARM) program. Similarly, in July 2013, the Semi-Arid Climate and Environment Observatory of Lanzhou University (SACOL) in China installed a KAZR system with the same operating frequency and comparable performance characteristics as the one at the SGP site. Although both sites are located in the same mid-latitude of the Northern Hemisphere, they exhibit significant differences in terrain elevation and meteorological conditions. The SACOL site lies east of the Kunlun Mountains and south of the Gobi Desert. This semi-arid region is characterized by limited moisture availability and is influenced by midlatitude storm tracks and complex terrain-induced circulation. And the SGP site is located in the Southern Great Plains of the United States, characterized by relatively flat terrain. Moreover, both KAZR systems have accumulated long-term, high-resolution, high-quality observational datasets, providing favorable conditions for studying the properties of ice clouds under different meteorological backgrounds in mid-latitude regions.
This study utilizes high temporal and spatial resolution KAZR observations from the SACOL and SGP sites during the period 2014–2019. Based on the identification of ice cloud profiles and the retrieval of their microphysical properties at the SACOL site, we conduct a comparative analysis of the interannual, seasonal, and diurnal variations in the macrophysical and microphysical characteristics of ice clouds at both sites. In addition, combining with a radiative transfer model, we calculate and assess the radiative forcing and heating rates induced by ice clouds at the two locations, as well as their contributions to the surface energy budget. The structure of the manuscript is arranged as follows: Section 2 describes the datasets, models, and methodology; Section 3 presents the results, including the temporal and seasonal variations in ice cloud macrophysical and microphysical, and radiative properties at both sites; and Section 4 provides a discussion and summarizes the main conclusions.
2. Materials and Methods
2.1. KAZR Cloud Radar Observation Data
The KAZR deployed at the SACOL and SGP sites are advanced zenith-pointing Doppler radar systems operating at a frequency of 35 GHz [21,22]. Compared to lidar systems, KAZR exhibits significantly lower signal attenuation under precipitation conditions, enabling it to penetrate thick cloud layers and light precipitation to detect high-altitude clouds. KAZR operates in a unique dual-polarization mode (burst and chirp), simultaneously receiving horizontally and vertically polarized signals. This study primarily relies on data obtained from the “chirp” mode, which maximizes transmitted energy, thereby extending its detection range and improving both sensitivity and resolution for accurately identifying high-altitude ice clouds. Both the SACOL radar and the SGP KAZR have a vertical spatial resolution of 30 m. At SACOL, the radar detects 583 vertical levels above 150 m with a temporal resolution of 4.27 s, while at SGP, it captures 596 levels above 160 m with a 4.0 s resolution. Despite minor differences in radar configuration and detection precision between the two sites, these remain sufficient for the effective comparison of ice cloud properties based on their respective KAZR observations.
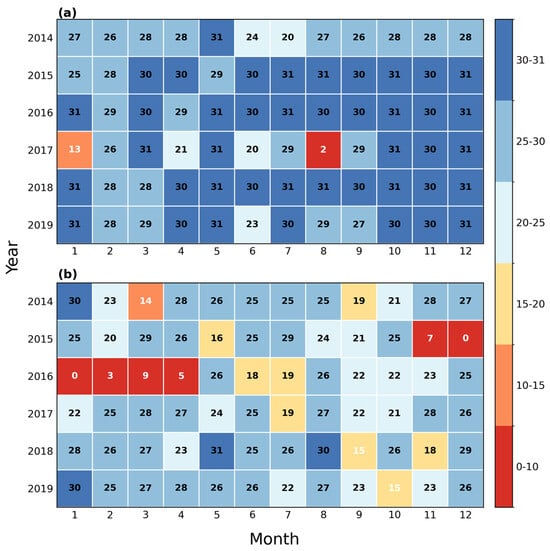
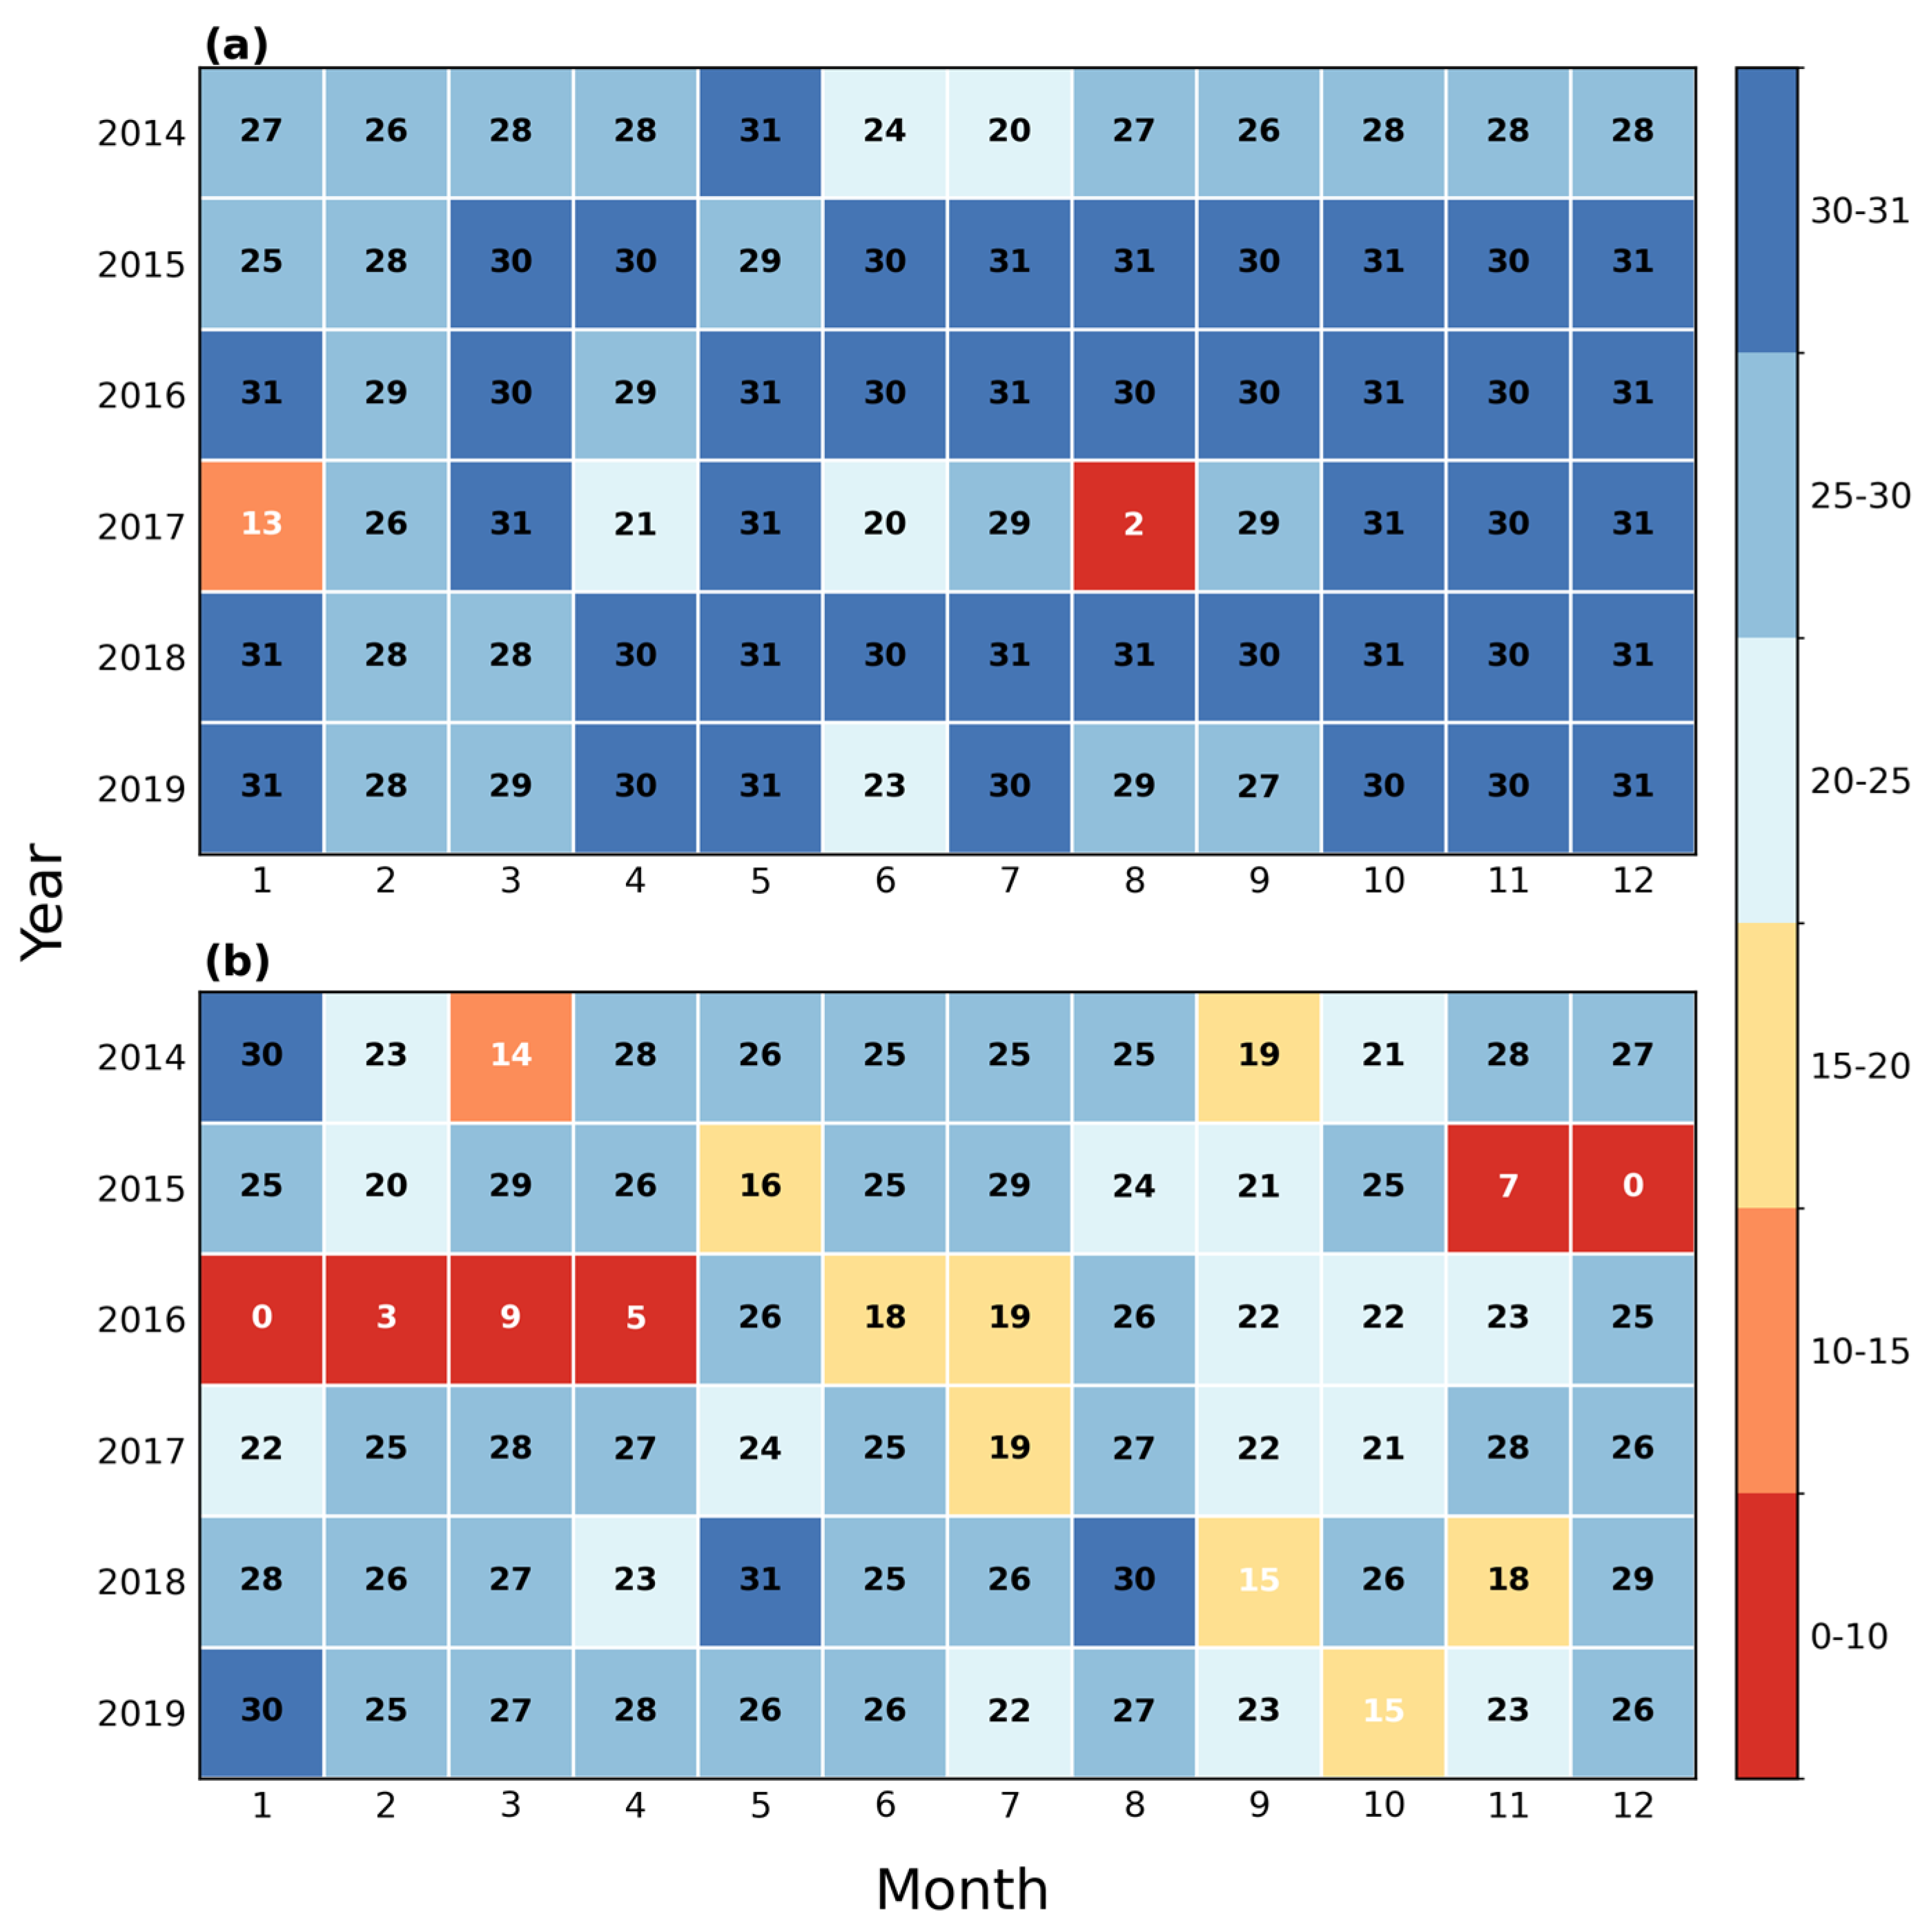
This study selects six years from 2014 to 2019, during which both sites maintained relatively continuous and complete cloud radar records, to conduct a comparative analysis of the macrophysical and microphysical properties of ice clouds. Figure 1 presents the monthly distribution of valid observation days from the cloud radars at both sites during this period. It is necessary to note that data from SACOL in August 2017 and from SGP between November 2015 and April 2016 were excluded from the analysis due to equipment malfunctions that resulted in fewer than 10 days of valid data per month.
Figure 1.
Monthly number of valid ice cloud observation days at the SACOL site (a) and the SGP site (b) from 2014 to 2019. Unit: day.
2.2. CERES Satellite Data
This study primarily utilizes instantaneous short and long-wave fluxes at top-of-atmosphere (TOA) observed by the Clouds and the Earth’s Radiant Energy System (CERES) instruments aboard the Aqua and Terra polar-orbiting satellites for radiation closure experiments. The CERES Single Scanner Footprint (SSF) Edition 4A (Ed4A) product, which provides these flux measurements together with relevant ancillary information, serves as the primary dataset for the analysis. Additionally, observed broadband surface albedo data from SSF Ed4A are also used as key input parameters for the radiative transfer model.
2.3. ERA5 Reanalysis Data
This study primarily employs hourly atmospheric vertical profile parameters from the ERA5 reanalysis dataset, including pressure, temperature, water vapor, and ozone, which are used as inputs to the radiative transfer model for calculating radiative fluxes and heating rates under both clear-sky and all-sky conditions. In addition, surface latent heat flux, sensible heat flux, and net radiation flux are utilized to analyze the surface energy budget contributions. The data have a horizontal resolution of 31 km × 31 km, with 137 vertical levels extending from the surface to approximately 80 km, and a temporal resolution of one hour [23,24].
2.4. Fu-Liou Radiative Transfer Model
The Fu-Liou radiative transfer model was developed by Professors Qiang Fu and Kuo-Nan Liou in the 1990s [25,26], which is capable of calculating shortwave (SW) and longwave (LW) radiative fluxes as well as atmospheric radiative heating rates. The model offers both the delta-two-stream and four-stream approximation schemes for SW and employs the correlated k-distribution method to treat gaseous absorption for LW. In the Fu–Liou radiative transfer model, ice-cloud optical properties are parameterized with consideration of the non-spherical characteristics of ice crystals. The model internally converts ice water content and generalized effective diameter into extinction coefficient, single-scattering albedo, and asymmetry factor using the built-in ice-cloud optical property parameterization. The Fu-Liou model has been routinely applied at NASA Langley Research Center for retrieving satellite-observed radiative fluxes. In this study, the model inputs parameters include the atmospheric profiles of temperature, pressure, water vapor and ozone derived from the ERA5 reanalysis dataset, surface albedo from CERES products, and ice cloud microphysical properties are retrieved from KAZR cloud radar observations. The vertical discretization of cloud properties follows the model pressure levels. Radar-derived vertical profiles with 30 m resolution were re-gridded to the model pressure layers through interpolation.
2.5. Retrieval of Ice Cloud Microphysical Properties
For the SACOL site, we use cloud profiles from KAZR and atmospheric profiles from ERA5 reanalysis data to identify the ice cloud and retrieve the microphysical property. The ice cloud identification was performed following the method proposed by Mace et al. [27]. A cloud was classified as an ice cloud if the cloud top temperature was below −30 °C, and both the temperature at the height of the maximum radar reflectivity factor within the cloud layer and the cloud base temperature were below 0 °C. After identifying ice clouds, Ice Water Content (IWC) and Particle Effective Diameter (Dge) were retrieved. According to the evaluation of different retrieval methods for IWC and Dge in the semi-arid region by Xin et al. [28], the Z-IWC-T relationship algorithm proposed by Hogan et al. [29] was used to calculate ice water content, and the traditional algorithm proposed by Fu [30] was applied to calculate the effective particle diameter. The retrieval formulas are as follows:
Here, equivalent reflectivity (dBZ is the radar reflectance factor), and T is the temperature.
For the SGP site, the ARM program provides products of ice cloud microphysical properties, which employs the Z-IWC relationship algorithm [31] and a temperature-dependent particle effective diameter algorithm [32] for the retrieval of IWC and Dge. The accuracy of data products at SGP has been evaluated by Jensen M. and Jensen K. [33].
2.6. Cloud Radiative Forcing and Heating Rate
Cloud radiative forcing (CRF) is the difference in net radiative flux between all-sky and clear-sky conditions [34]. We use the Fu-Liou radiative transfer model to calculate radiative fluxes combined with ice cloud occurrence frequency to derive the radiative effect of ice clouds [35]. The calculation formula is as follows:
Here, CRFSW, CRFLW, and CRFNet represent the cloud shortwave, longwave, and net cloud radiative forcing, respectively; η denotes the cloud occurrence frequency within a given period; TOV and TCL represent the net radiative fluxes under cloudy-sky conditions (only when ice clouds are present) and clear-sky conditions, respectively.
In this study, the radiative effect is calculated with a time resolution of 15 min. The calculation formula for the cloud radiative heating rate (CHR), which represents the change in atmospheric vertical heating rate distribution, is as follows:
Here, HROV and HRCL denote the atmospheric heating rates under cloudy and clear-sky conditions, respectively.
2.7. Surface Energy Budget
To quantify the contribution of ice clouds to the surface energy balance, the surface heat budget was further analyzed using flux variables from the ERA5 reanalysis. According to the principle of energy conservation, the temporal change in surface energy storage S is balanced by the net energy flux absorbed at the surface [35,36,37], which can be written as:
where Rn denotes the surface net radiative flux, representing the difference between net shortwave radiation and net longwave radiation at the surface. H and LE represent the sensible heat flux and latent heat flux, respectively. Clouds influence the surface energy budget primarily through their modulation of both the shortwave and longwave components of Rn. In many land-surface and atmospheric studies, the surface energy storage term S is commonly assumed to be negligible for daily mean conditions, as its contribution is small compared to the radiative and turbulent flux terms [38]. Following this widely adopted approximation, S is set to zero in this study, and the analysis focuses on the relative contributions of radiative and turbulent energy fluxes.
To enable a consistent comparison among different surface energy flux components, all fluxes are converted into a standardized near-surface heating-rate-like metric. Specifically, each flux q (W/m2) is normalized by the specific heat capacity of air cp [39], yielding
where α represents a standardized heating index used for relative comparison. It should be noted that α does not represent an actual atmospheric temperature tendency. A physically complete near-surface heating rate would additionally require information on air density and the effective depth of the near-surface layer. In the present analysis, these quantities are implicitly assumed to be constant, such that α is proportional to the true near-surface temperature tendency. Consequently, this formulation is used solely as a normalized metric to assess the relative magnitude and variability of different energy flux components, rather than to quantify absolute atmospheric heating rates. Using this approach, the net radiative flux, sensible heat flux, and latent heat flux from ERA5 are transformed into standardized heating indices and analyzed together with the model-derived ice-cloud radiative heating rates. This framework allows for a direct comparison of the relative contributions of surface radiative and turbulent processes to near-surface heating under different cloud conditions.
3. Results
3.1. Macrophysical and Microphysical Properties of SACOL and SGP Ice Clouds
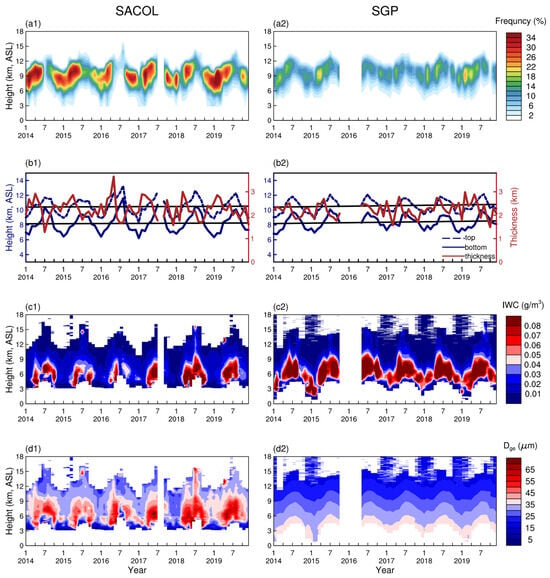
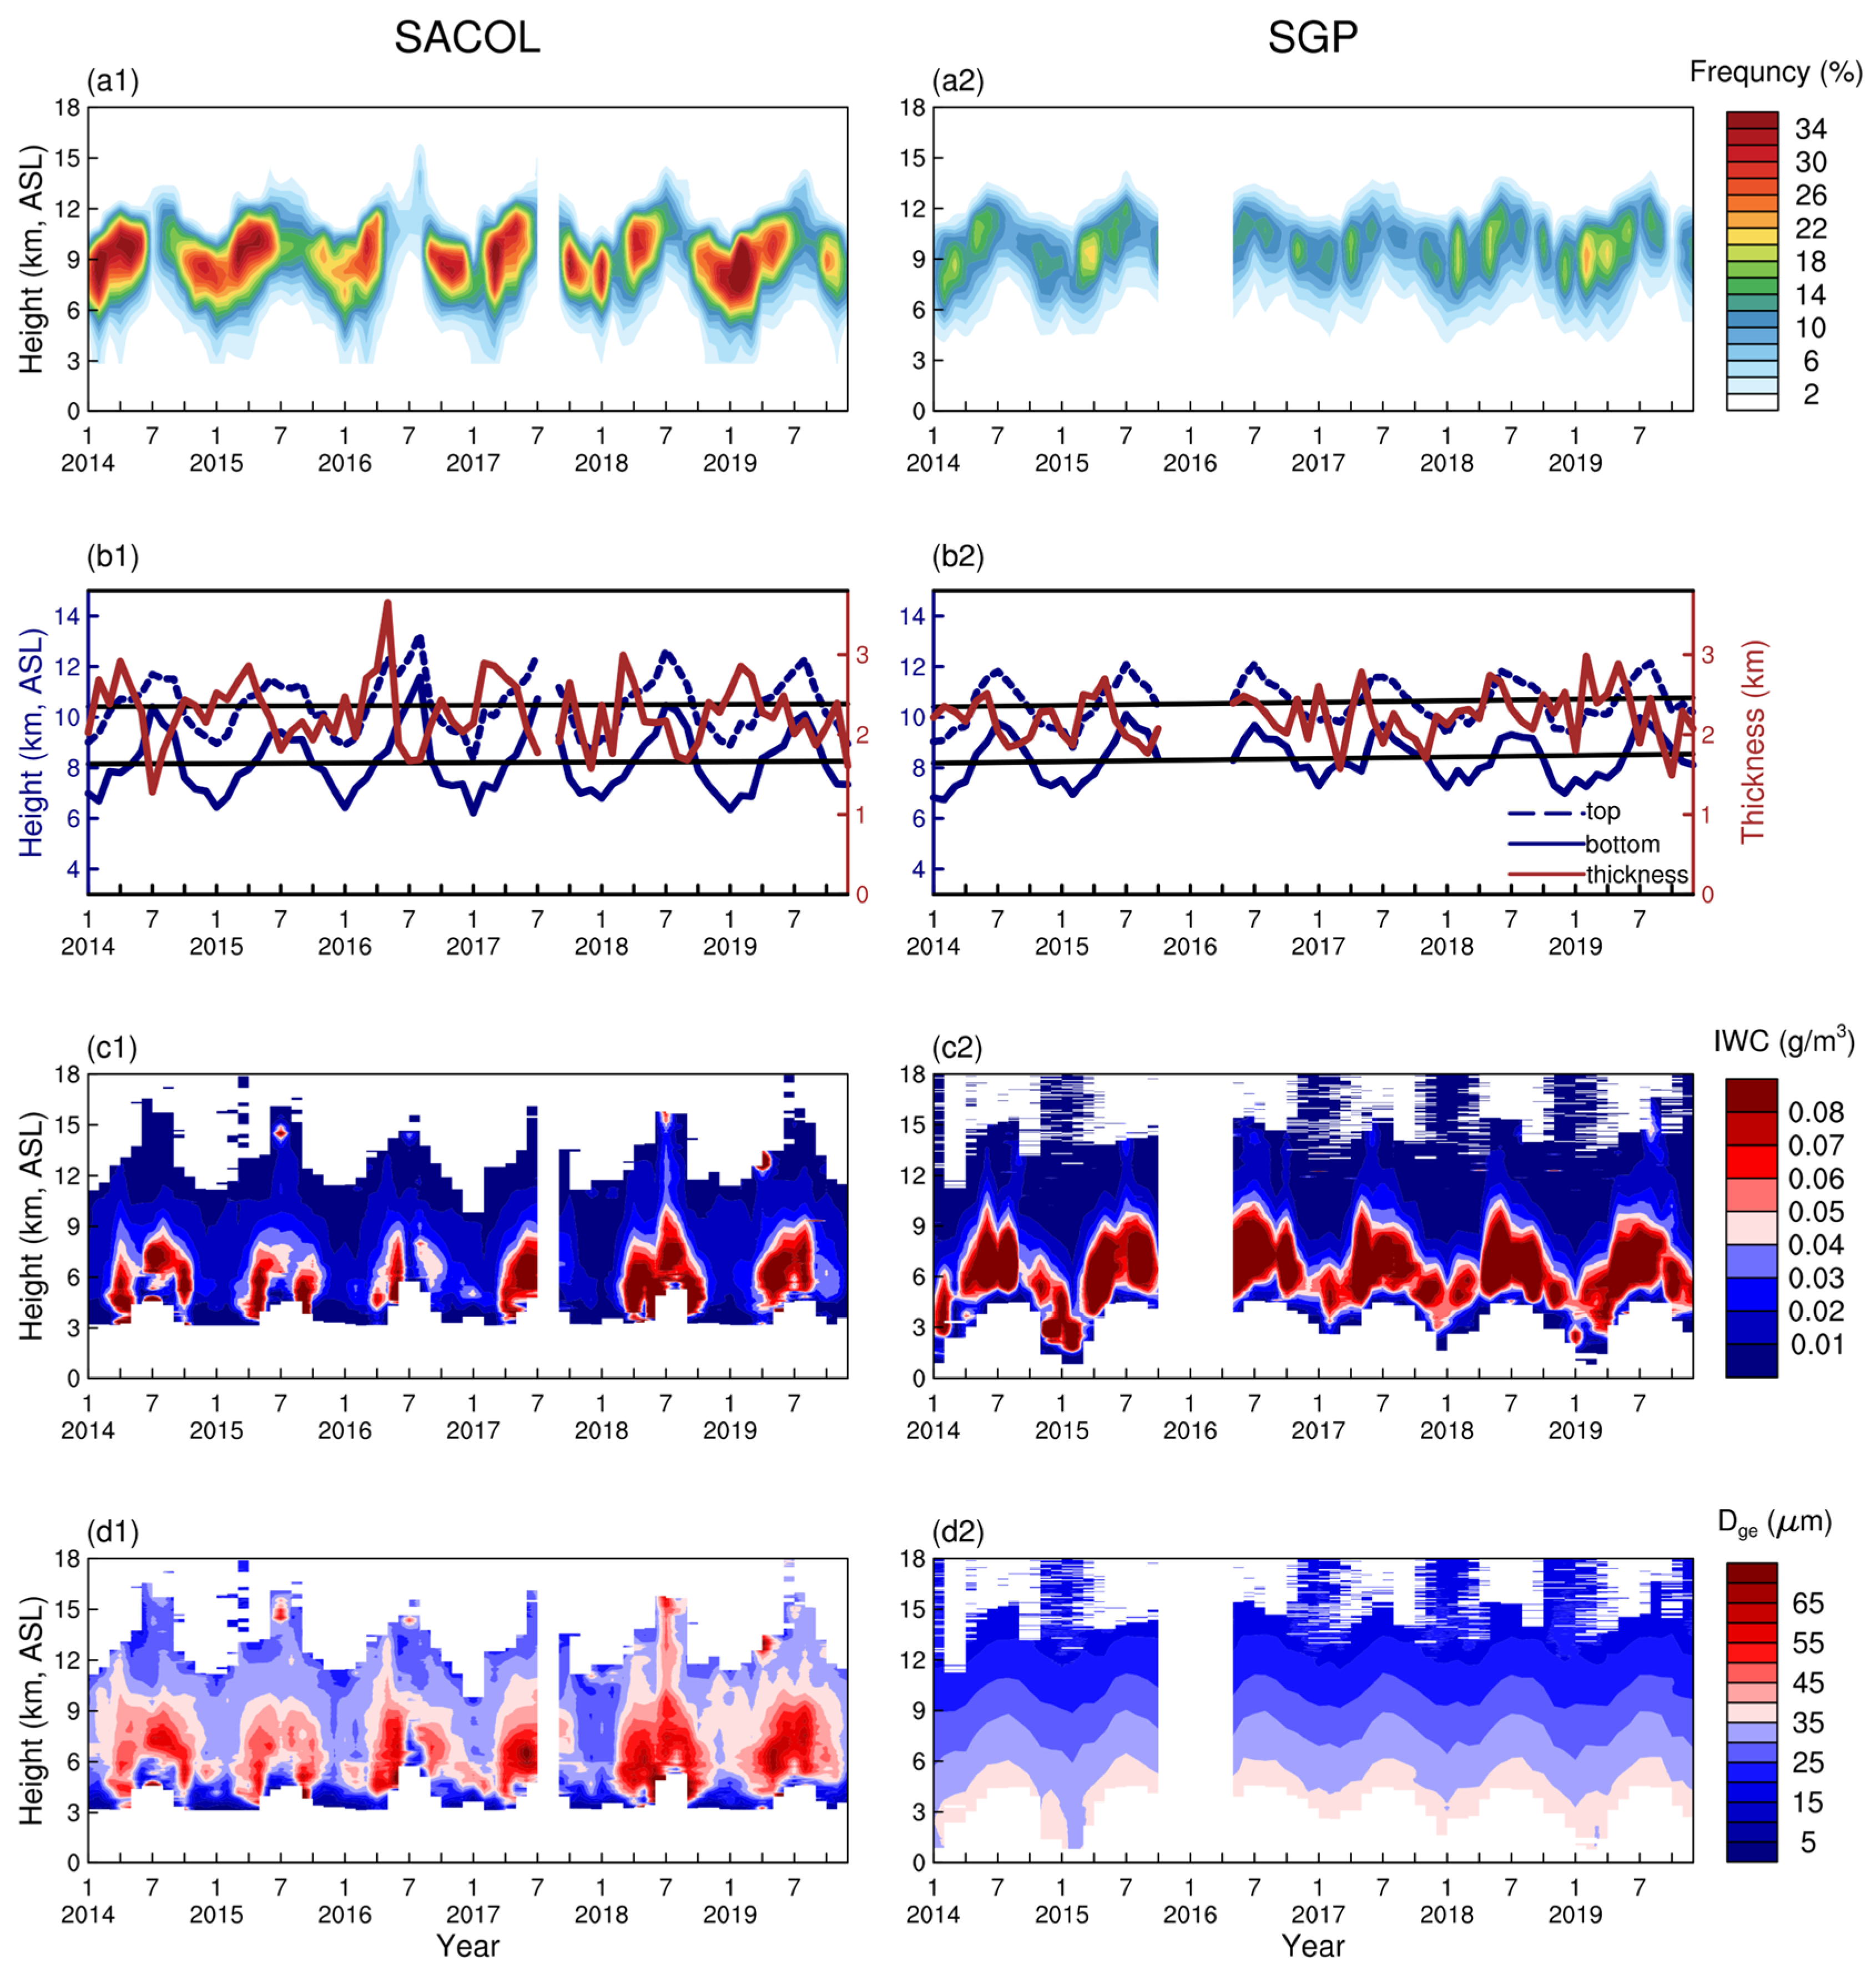
Figure 2 illustrates the interannual variations in ice cloud occurrence frequency, cloud top and base heights, cloud thickness, IWC and Dge at the SACOL and SGP sites from 2014 to 2019. As shown in Figure 2a, the vertical distribution of ice clouds is generally consistent between the two sites, with most occurrences concentrated between 6 and 12 km, peaking around 9 km. However, the overall occurrence frequency of ice clouds at SACOL is significantly higher than at SGP, with an annual mean of 40% at SACOL and only 27% at SGP (as shown in Table 1). The subsequent preliminary results showed that this discrepancy is closely related to differences in water vapor and vertical motion and have demonstrated that the upper atmosphere humidity is significantly higher at SACOL than at SGP. In addition, it may also be affected by the aerosol composition. Studies have shown that the dust, as the dominant aerosol type at the SACOL site, could efficiently enhance ice cloud formation through heterogeneous nucleation pathways [40,41]. Based on Figure 2b and Table 1, compared to SACOL, the SGP site exhibits relatively higher cloud tops and bases, thinner cloud layers, and less variability. As illustrated in Figure 2b, the ice cloud height at both sites shows a clear upward trend over the years. Cloud top and base heights at SACOL increased by 0.11 km and 0.25 km, respectively, while cloud thickness decreased by 0.14 km. At the same time, the SGP site experienced more pronounced increases in cloud top and cloud base heights (0.36 km and 0.26 km, respectively), accompanied by a 0.1 km increase in cloud thickness. This phenomenon of an increase in ice cloud height at two sites is consistent with global findings [42,43,44]. Such changes under global warming may further intensify the surface warming positive feedback, thereby exerting profound impacts on the global climate system [45,46]. Figure 2c,d show the vertical distributions of two microphysical parameters. The overall IWC is higher at SGP than at SACOL. The annual mean ice water path (IWP) is 69.21 g/m2 and 55.45 g/m2 at SGP and SACOL, respectively. However, notable differences are observed in the retrievals of effective particle diameter between the two sites. The vertical distribution of ice cloud particle effective diameters at SACOL closely follows that of IWC. In contrast, at SGP, the effective diameter of ice cloud particles shows a strong dependence on height, as the retrieval is based on an empirical formula that is a function of temperature. At present, the retrieval of ice cloud microphysical properties remains largely dependent on empirical formulations. Our findings of these differences highlight the substantial uncertainties in empirical retrieval methods of ice particle size, particularly in terms of consistency and physical representativeness. To improve the reliability of ice cloud microphysical retrievals, cross-validation with in situ aircraft observations and other multi-source datasets is required [47,48,49].
Figure 2.
Interannual variations in ice cloud (a) occurrence frequency, (b) cloud top height, cloud base height, and geometric thickness; black lines indicate linear regression trends of cloud top and base heights (significant at the 95% confidence level); (c) ice water content; and (d) effective particle diameter at (1) the SACOL site and (2) the SGP site from 2014 to 2019.
Table 1.
Seasonal averages of ice cloud occurrence frequency and macrophysical and microphysical properties at the SACOL and SGP sites over a six-year period. IWP represents the vertical integral of IWC, and Dge is the vertical median of effective particle diameter.
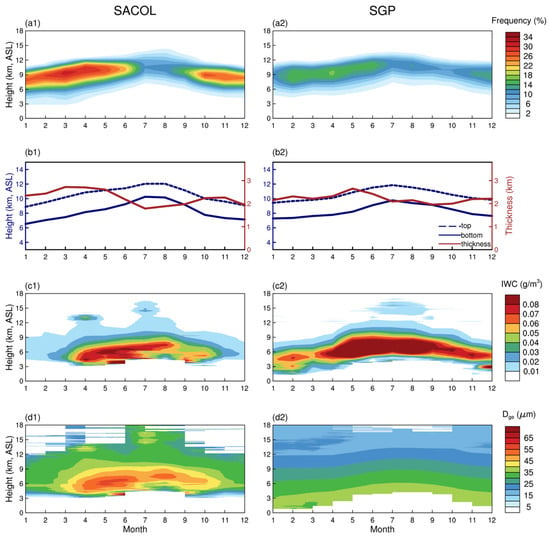
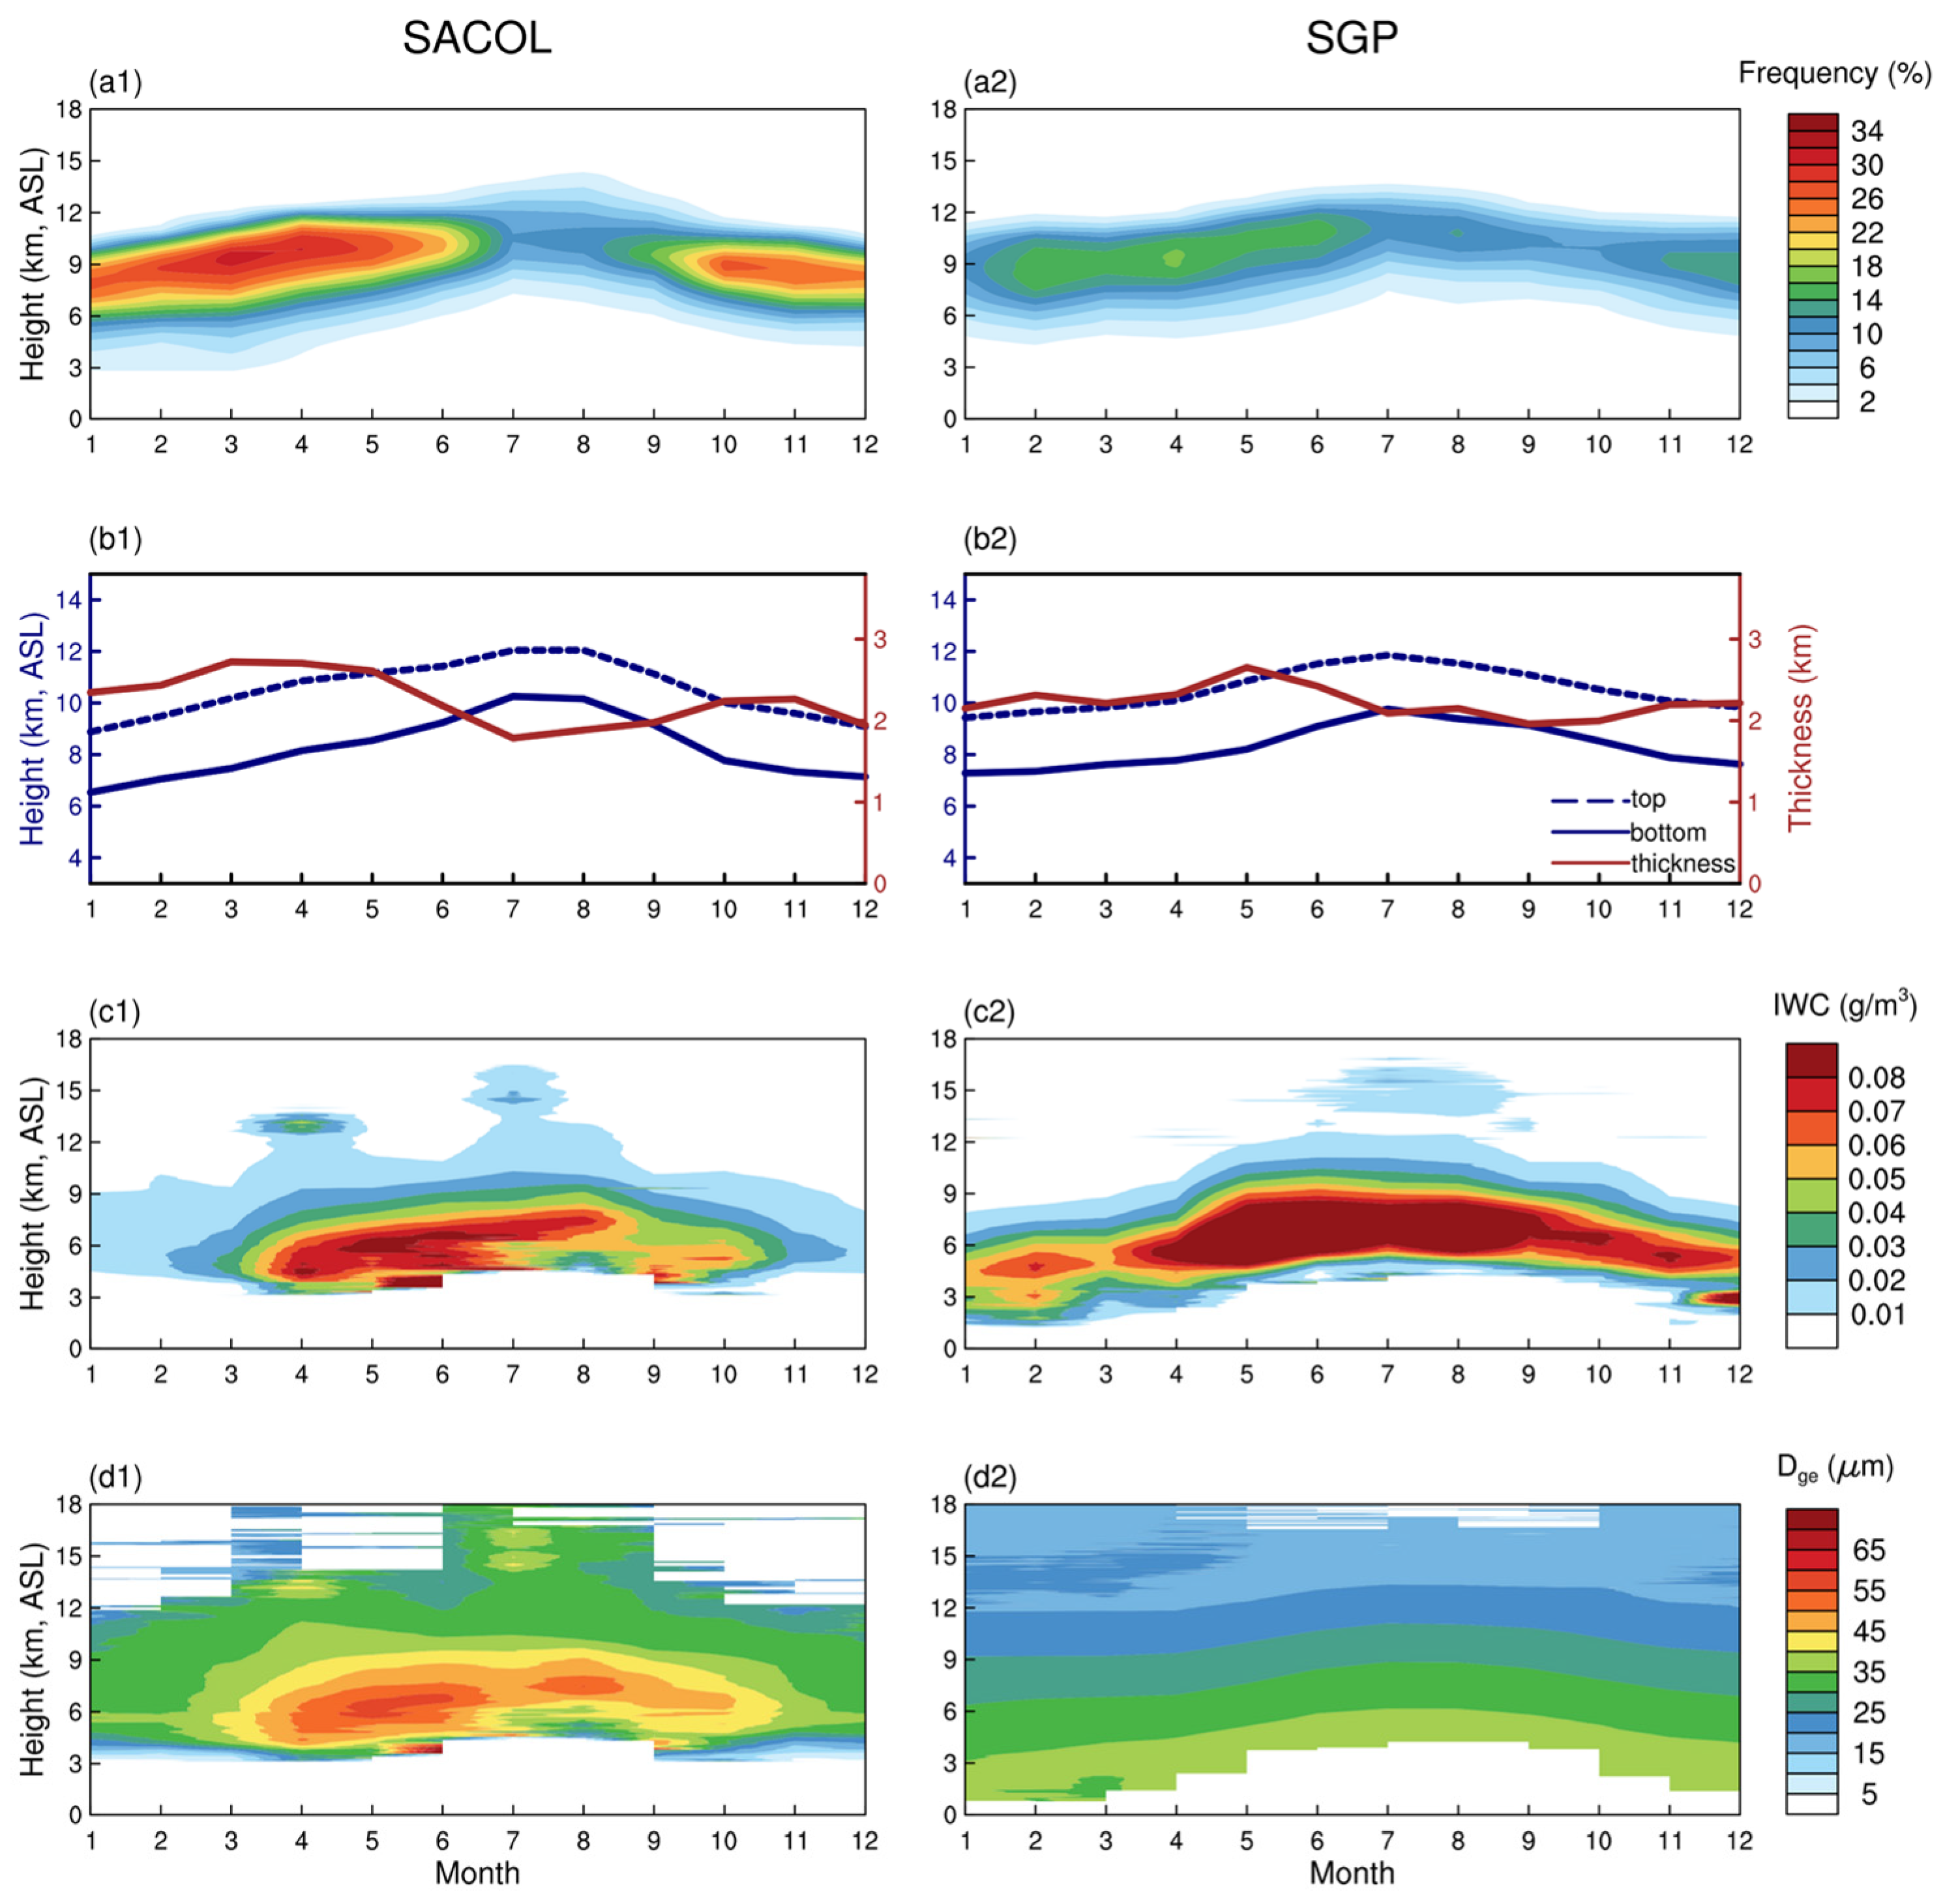
Figure 3 illustrates the seasonal variations in the macrophysical and microphysical properties of ice clouds at the two sites. Both sites exhibit a seasonal pattern in ice cloud occurrence frequency, with higher values during the cold seasons and lower during the warm seasons. As shown in Figure 3a, at SACOL, the ice cloud occurrence frequency at 9 km reaches up to 30% in March but decreases significantly to 10% in September. The six-year average occurrence is 49.5% in spring and only 28.28% in summer. Similarly, at SGP, the frequency peaks in spring (30.65%) and is lowest in autumn (22.41%), but the seasonal variation is less pronounced than at SACOL. Both sites show a seasonal variation in ice cloud height, with lower altitudes in winter and higher in summer. At SACOL, the highest cloud top and base heights occur in August (12.04 km and 10.26 km, respectively), and the lowest in January (8.88 km and 6.53 km). At SGP, the seasonal variation in cloud top and base heights shows less pronounced seasonal fluctuations compared to SACOL. The highest cloud top and base heights at SGP are observed in July (11.85 km and 9.76 km), and the lowest in January (9.43 km and 7.28 km). Notably, the seasonal variation in cloud geometric thickness at both sites exhibits an opposite pattern to that of cloud height, with thicker clouds in cold seasons and thinner clouds in warm seasons. The seasonal variation in ice cloud thickness is larger at SACOL, ranging from a maximum of 2.72 km to a minimum of 1.79 km. At SGP, the corresponding values are 2.65 km and 1.96 km. In terms of microphysical properties, two sites exhibit higher IWC in spring and summer and lower in autumn and winter, with consistently greater values observed at SGP compared to SACOL across all seasons. Meanwhile, the seasonal variability of ice cloud particle size at SACOL is consistent with the IWC. However, the cloud effective radius at SGP exhibits no distinct seasonal variation, primarily due to the use of temperature-based empirical formulas in the retrieval process, as previously discussed. In summary, both sites exhibit higher ice cloud frequencies, lower cloud heights, greater geometric thickness, lower IWC, and smaller particle sizes in the winter and spring, whereas the opposite occurs in summer and autumn. The seasonal distribution of ice cloud properties is closely related to meteorological factors. In warm seasons, higher temperatures and frequent vertical convection transport moisture upward, while the tropopause rises in mid-latitudes, leading to higher ice cloud altitudes and greater IWC. However, due to relatively steady upper-level circulation and significantly reduced wind speeds, the occurrence frequency of ice clouds decreases. During the cold season, the combined effects of large-scale atmospheric circulation patterns, reduced atmospheric water vapor content, and intensified upper-level wind, particularly the jet streams, lead to lower cloud height and smaller IWC [50,51]. Moreover, the SACOL site shows stronger seasonal variability and higher ice cloud frequency during spring and winter, likely associated with frequent cold frontal activities prevailing in northwest China during the cold seasons [52].
Figure 3.
Monthly variations of (a) ice cloud occurrence frequency, (b) cloud top height, cloud base height, and geometric thickness; (c) ice water content, and (d) effective particle diameter at the (1) SACOL and (2) SGP sites from 2014 to 2019.
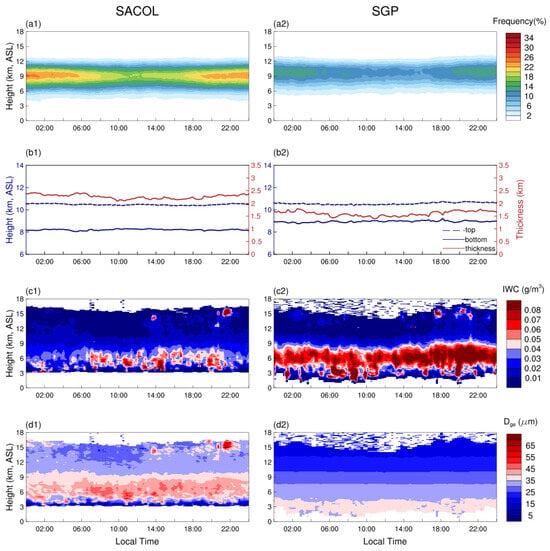
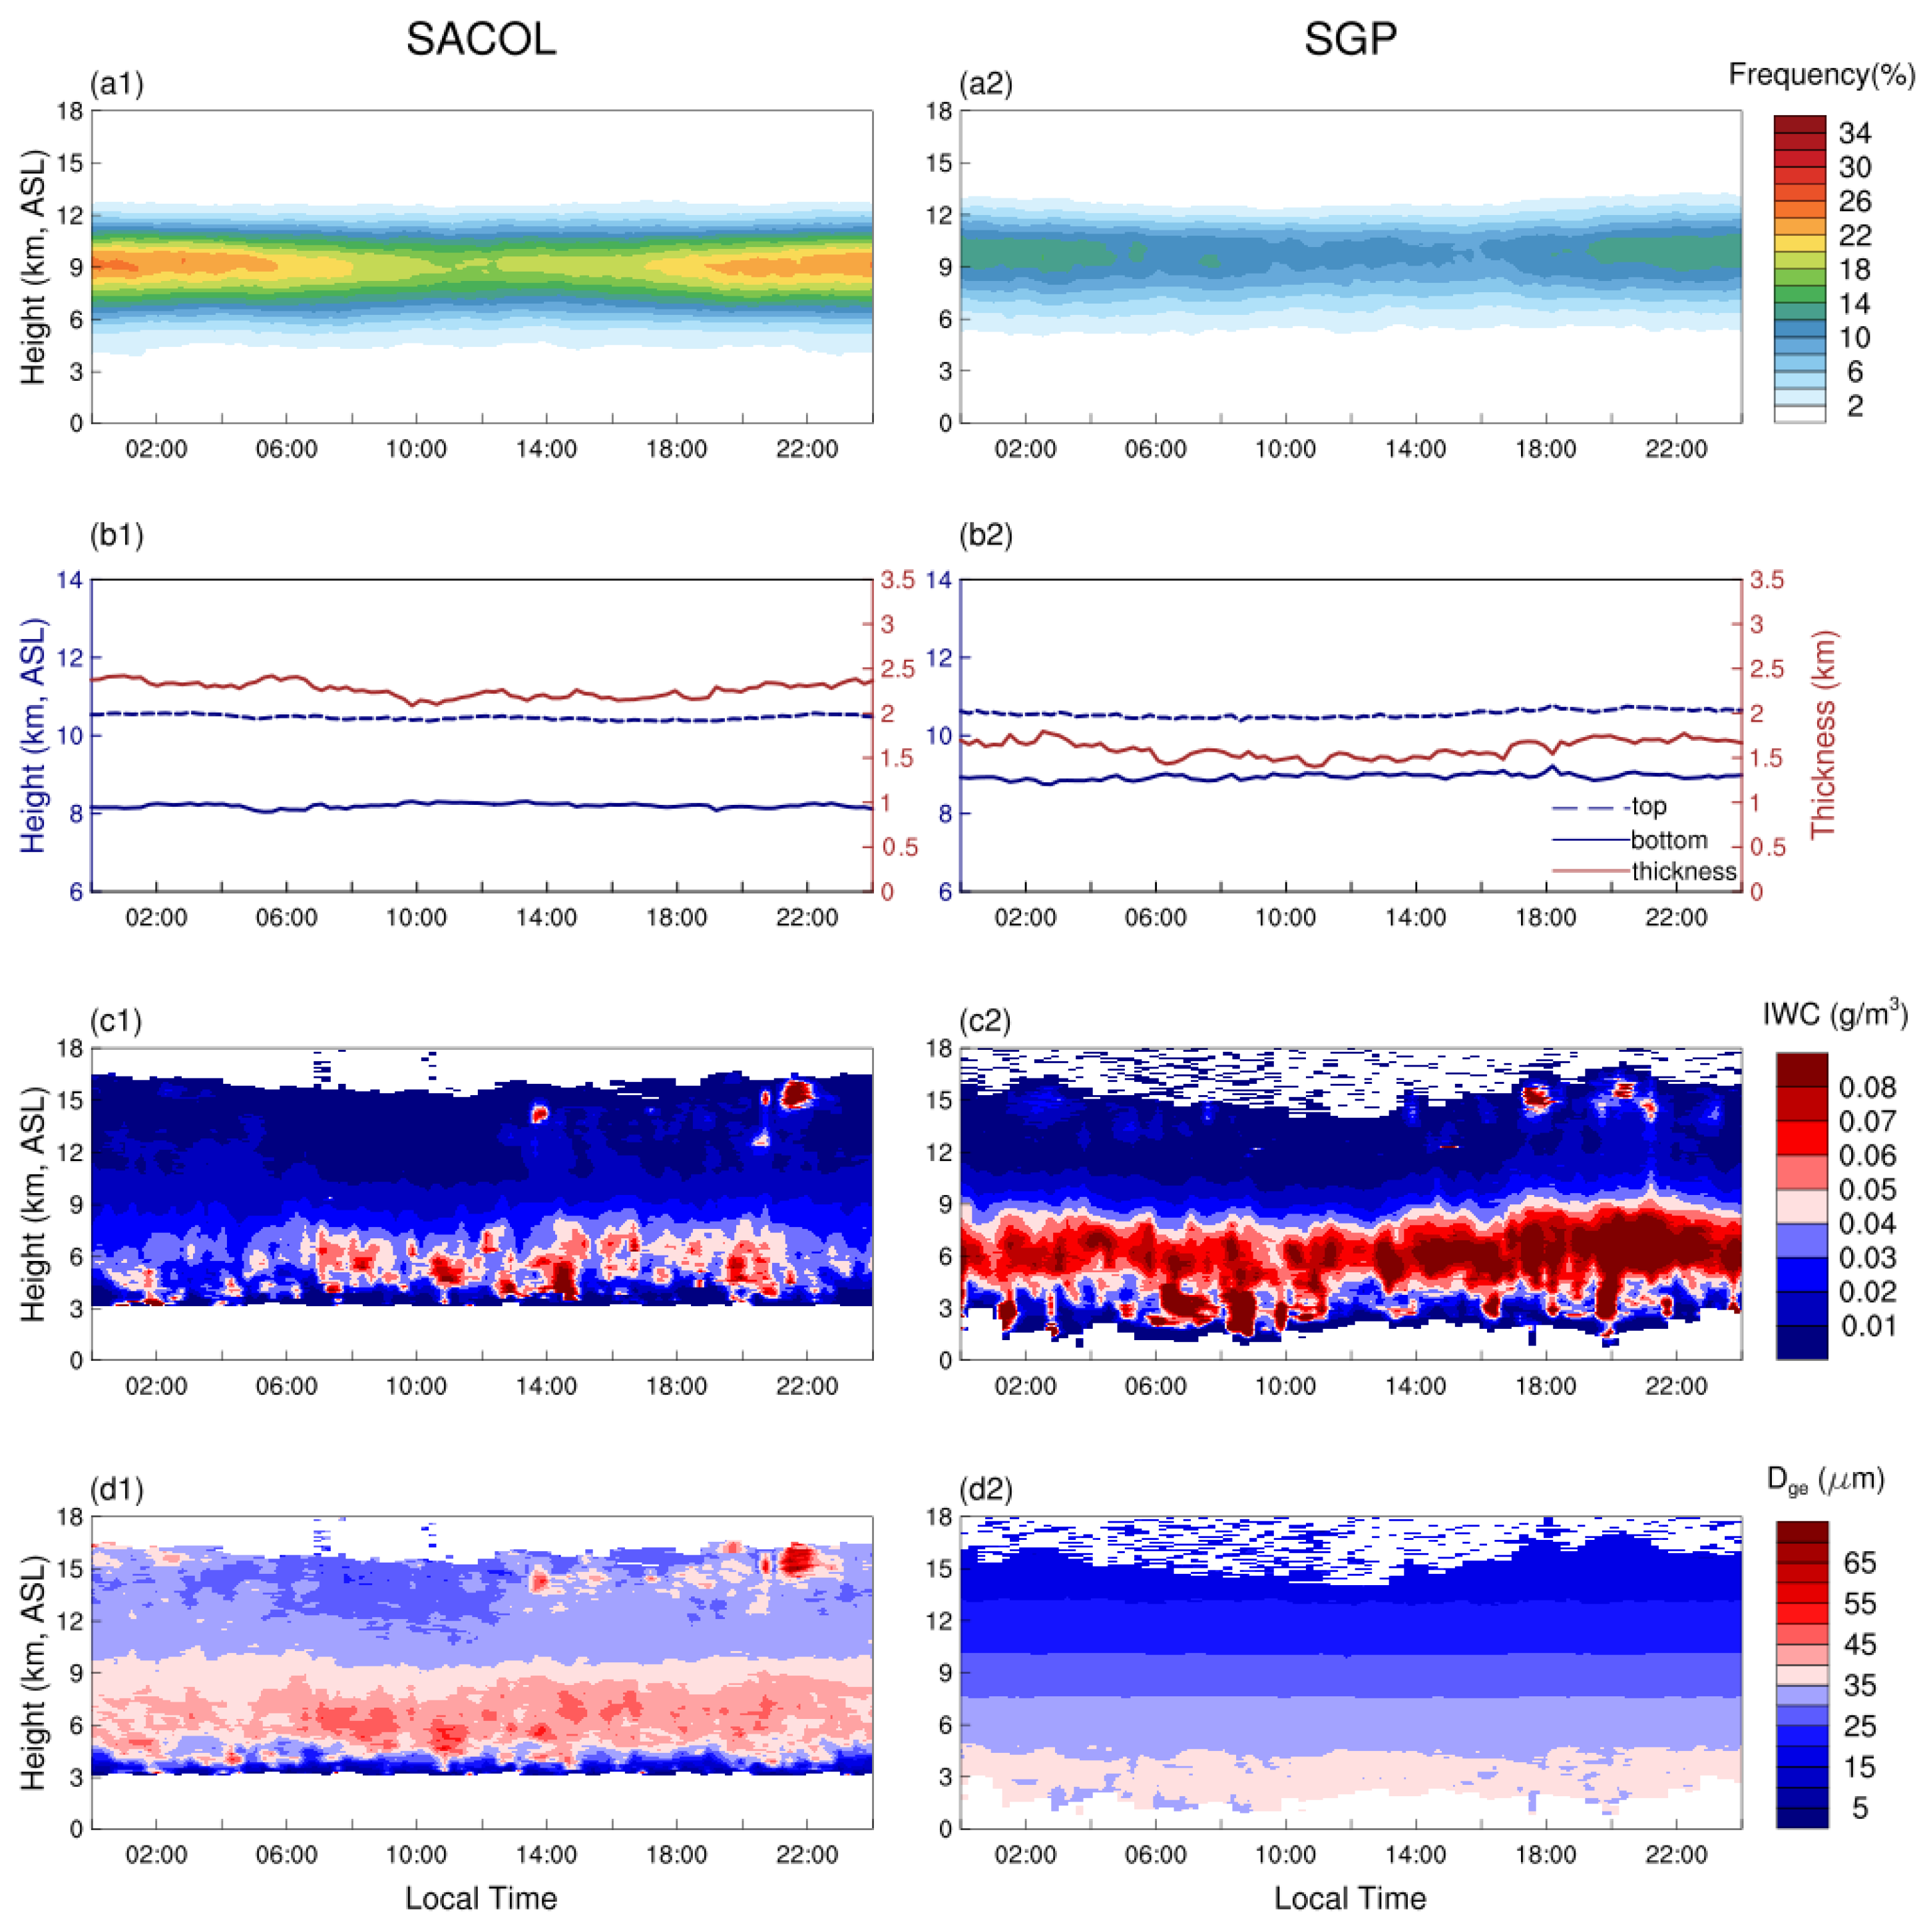
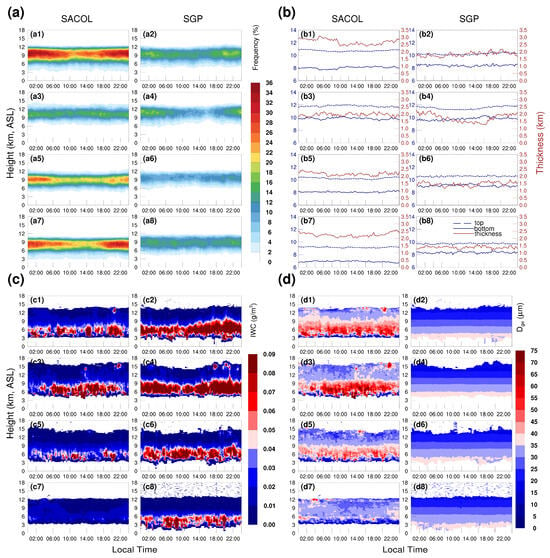
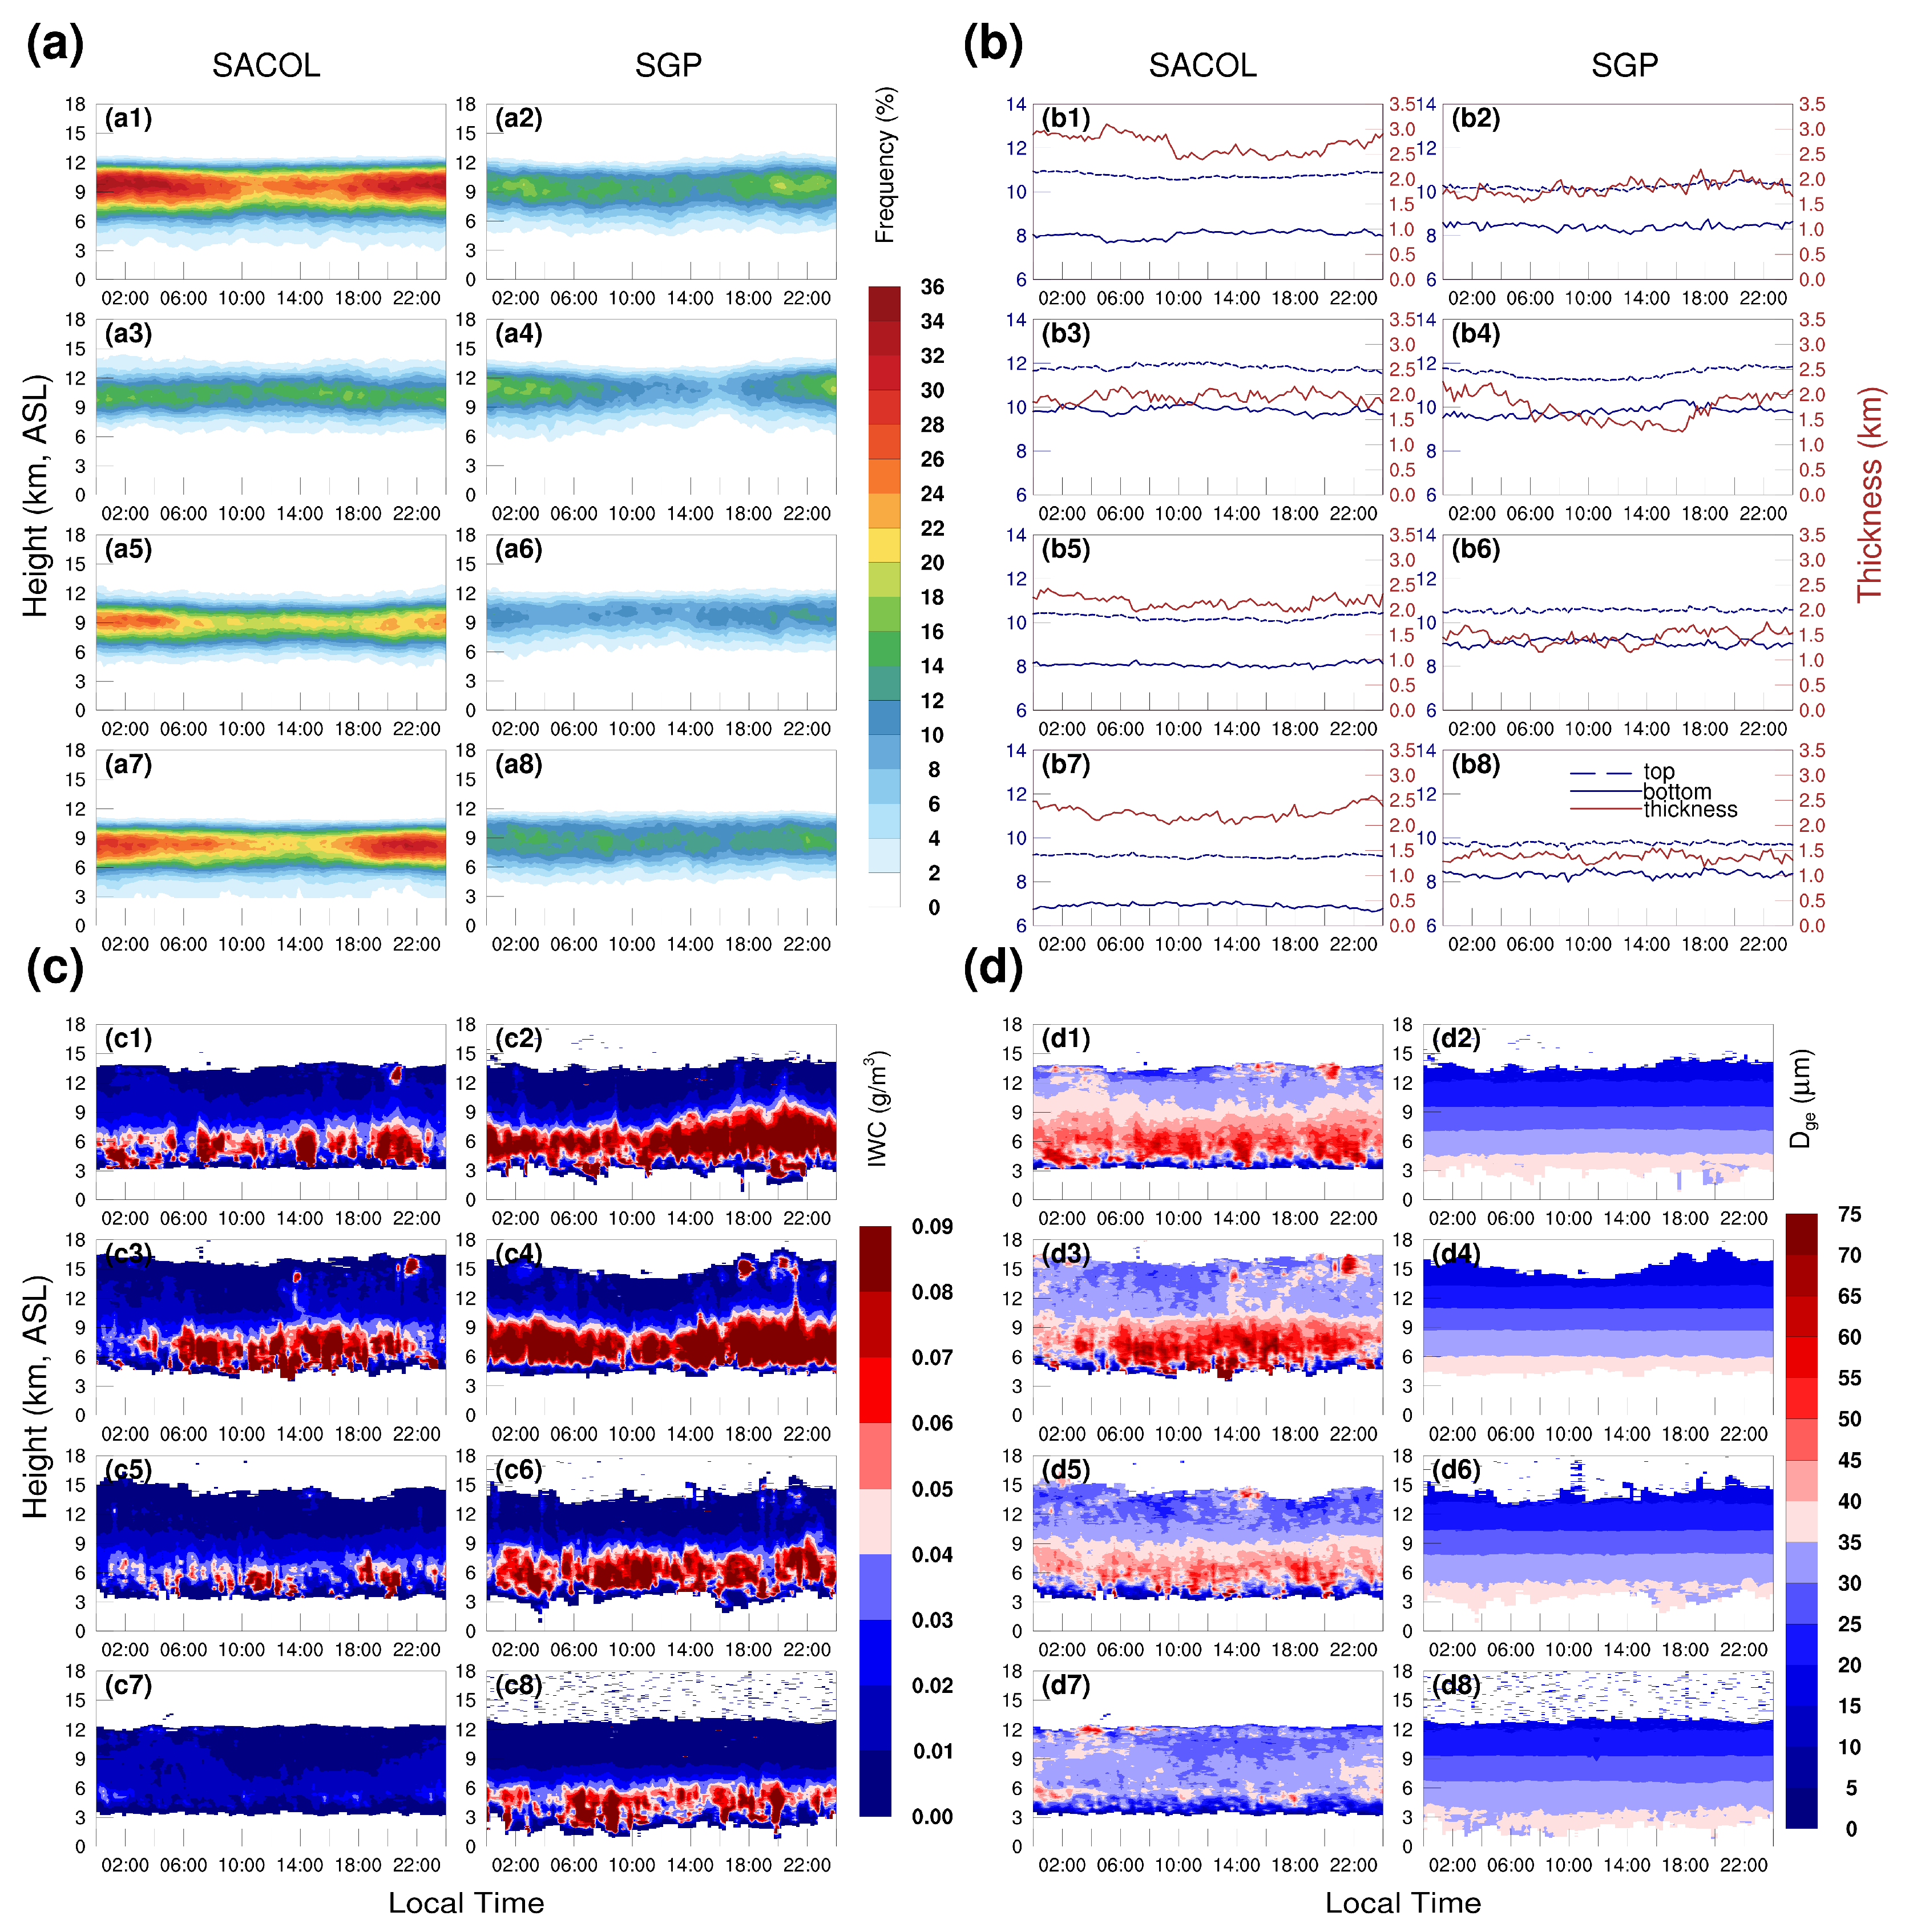
The diurnal cycle of clouds strongly influences the Earth’s radiative energy budget. Daytime ice clouds partially transmit solar radiation but primarily block incoming shortwave flux, producing a cooling effect that depends on optical thickness and ice crystal size. At night, they absorb surface and lower-atmosphere longwave radiation and re-emit it at colder temperatures, inducing a greenhouse warming effect. Advances in observation techniques, such as the 4.0 s KAZR cloud radar measurements at the SACOL and SGP sites, now provide the high temporal resolution required to analyze these diurnal variations. Therefore, building upon the analysis of interannual and seasonal variations, we conducted an investigation into the diurnal variations in the macrophysical and microphysical properties of ice clouds at two sites by using the data from 2014 to 2019, which is shown in Figure 4. Both sites exhibit significantly higher frequencies at night than during the daytime, with a more pronounced signal observed at SACOL. As shown in Figure 5a, the diurnal cycle of ice cloud frequency at SACOL exhibits larger amplitudes in spring and winter compared to summer and autumn, indicating that the day–night variation in ice cloud frequency is stronger in these two seasons. In spring, ice cloud activity is most frequent from 18:00 to 06:00, with peak occurrence exceeding 32%, while at noon the frequency drops to around 22%. Although the overall ice cloud frequency in winter is lower than in spring, its diurnal variation is the most pronounced, with a nighttime-daytime difference of up to 14%. In contrast to SACOL, the diurnal variation in ice clouds at SGP is most evident in summer, with peak frequency reaching 18% between 22:00 and 04:00 and dropping to 6% around 16:00, representing an amplitude of up to 12%. At both sites, the diurnal variation consistently indicates that ice clouds are more active at night, which is likely associated with the enhanced radiative cooling in the upper troposphere during nighttime.
Figure 4.
Diurnal variations in ice cloud (a) occurrence frequency, (b) cloud top height, cloud base height, and geometric thickness; (c) ice water content, and (d) effective particle diameter at (1) the SACOL site and (2) the SGP site from 2014 to 2019.
Figure 5.
Diurnal variations in ice cloud physical properties in different seasons at (1) the SACOL site and (2) the SGP site from 2014 to 2019: (a) occurrence frequency, (b) height and geometric thickness, (c) ice water content, and (d) effective diameter of particles; (a1,a2,b1,b2,c1,c2,d1,d2) spring, (a3,a4,b3,b4,c3,c4,d3,d4) summer, (a5,a6,b5,b6,c5,c6,d5,d6) autumn, and (a7,a8,b7,b8,c7,c8,d7,d8) winter.
Compared with the pronounced diurnal variations in ice cloud occurrence frequency, the variations in cloud top and base heights at both sites are relatively small throughout the day. The annual mean diurnal cycle of cloud thickness shows only slight differences between day and night, as shown in Figure 4. However, from Figure 5b, there is a clear diurnal pattern with SACOL in Spring and SGP in summer, characterized by thinner ice clouds during the day and thicker ones at night. The diurnal amplitude of cloud thickness can reach up to 0.72 km and 1.02 km, respectively. The nocturnal thickening of ice cloud thickness is attributed to intensified nighttime ice cloud activity and enhanced upper-level water vapor.
Regarding the microphysical properties of ice clouds, the annual mean IWC at SACOL exhibits a distinct diurnal pattern, with lower values in the early morning and evening and a peak around noon. In contrast, SGP shows a different pattern, with low IWC in the morning and a gradual increase from afternoon into the night. As shown in Figure 5c, the diurnal variation in summer is most pronounced at SACOL, especially between 12:00 and 18:00, when the IWC exceeds 0.08 g/m3. In contrast, IWC during autumn and winter is relatively low and lacks significant diurnal variation, with its wintertime peak reaching only about 20% of the summer maximum. The SGP site maintains relatively high IWC throughout the year, with the most evident diurnal variation in spring and summer: higher values are observed between 18:00 and 08:00, and lower values around noon. This pattern reflects enhanced nighttime ice cloud activity and the significant role of radiative cooling in modulating IWC. As shown in Figure 5d, the effective diameter of ice particles at SACOL follows a seasonal diurnal cycle pattern similar to IWC, whereas at SGP, it shows almost no diurnal variation, primarily due to the retrieval method employed, which only depends on the temperature.
3.2. Ice Cloud Radiation Effects at SACOL and SGP Sites
3.2.1. Radiation Closure Experiment
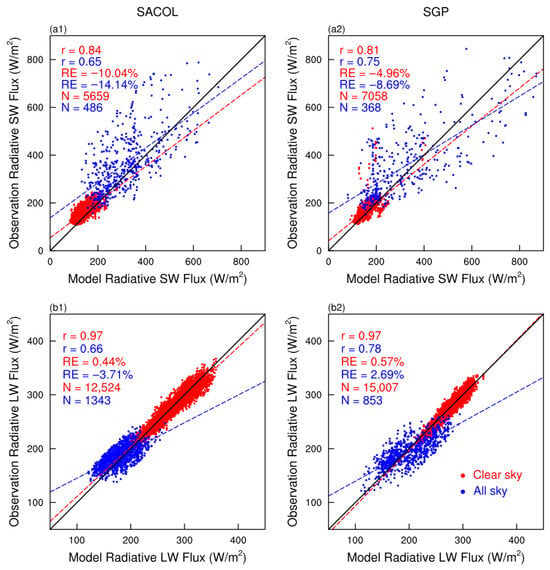
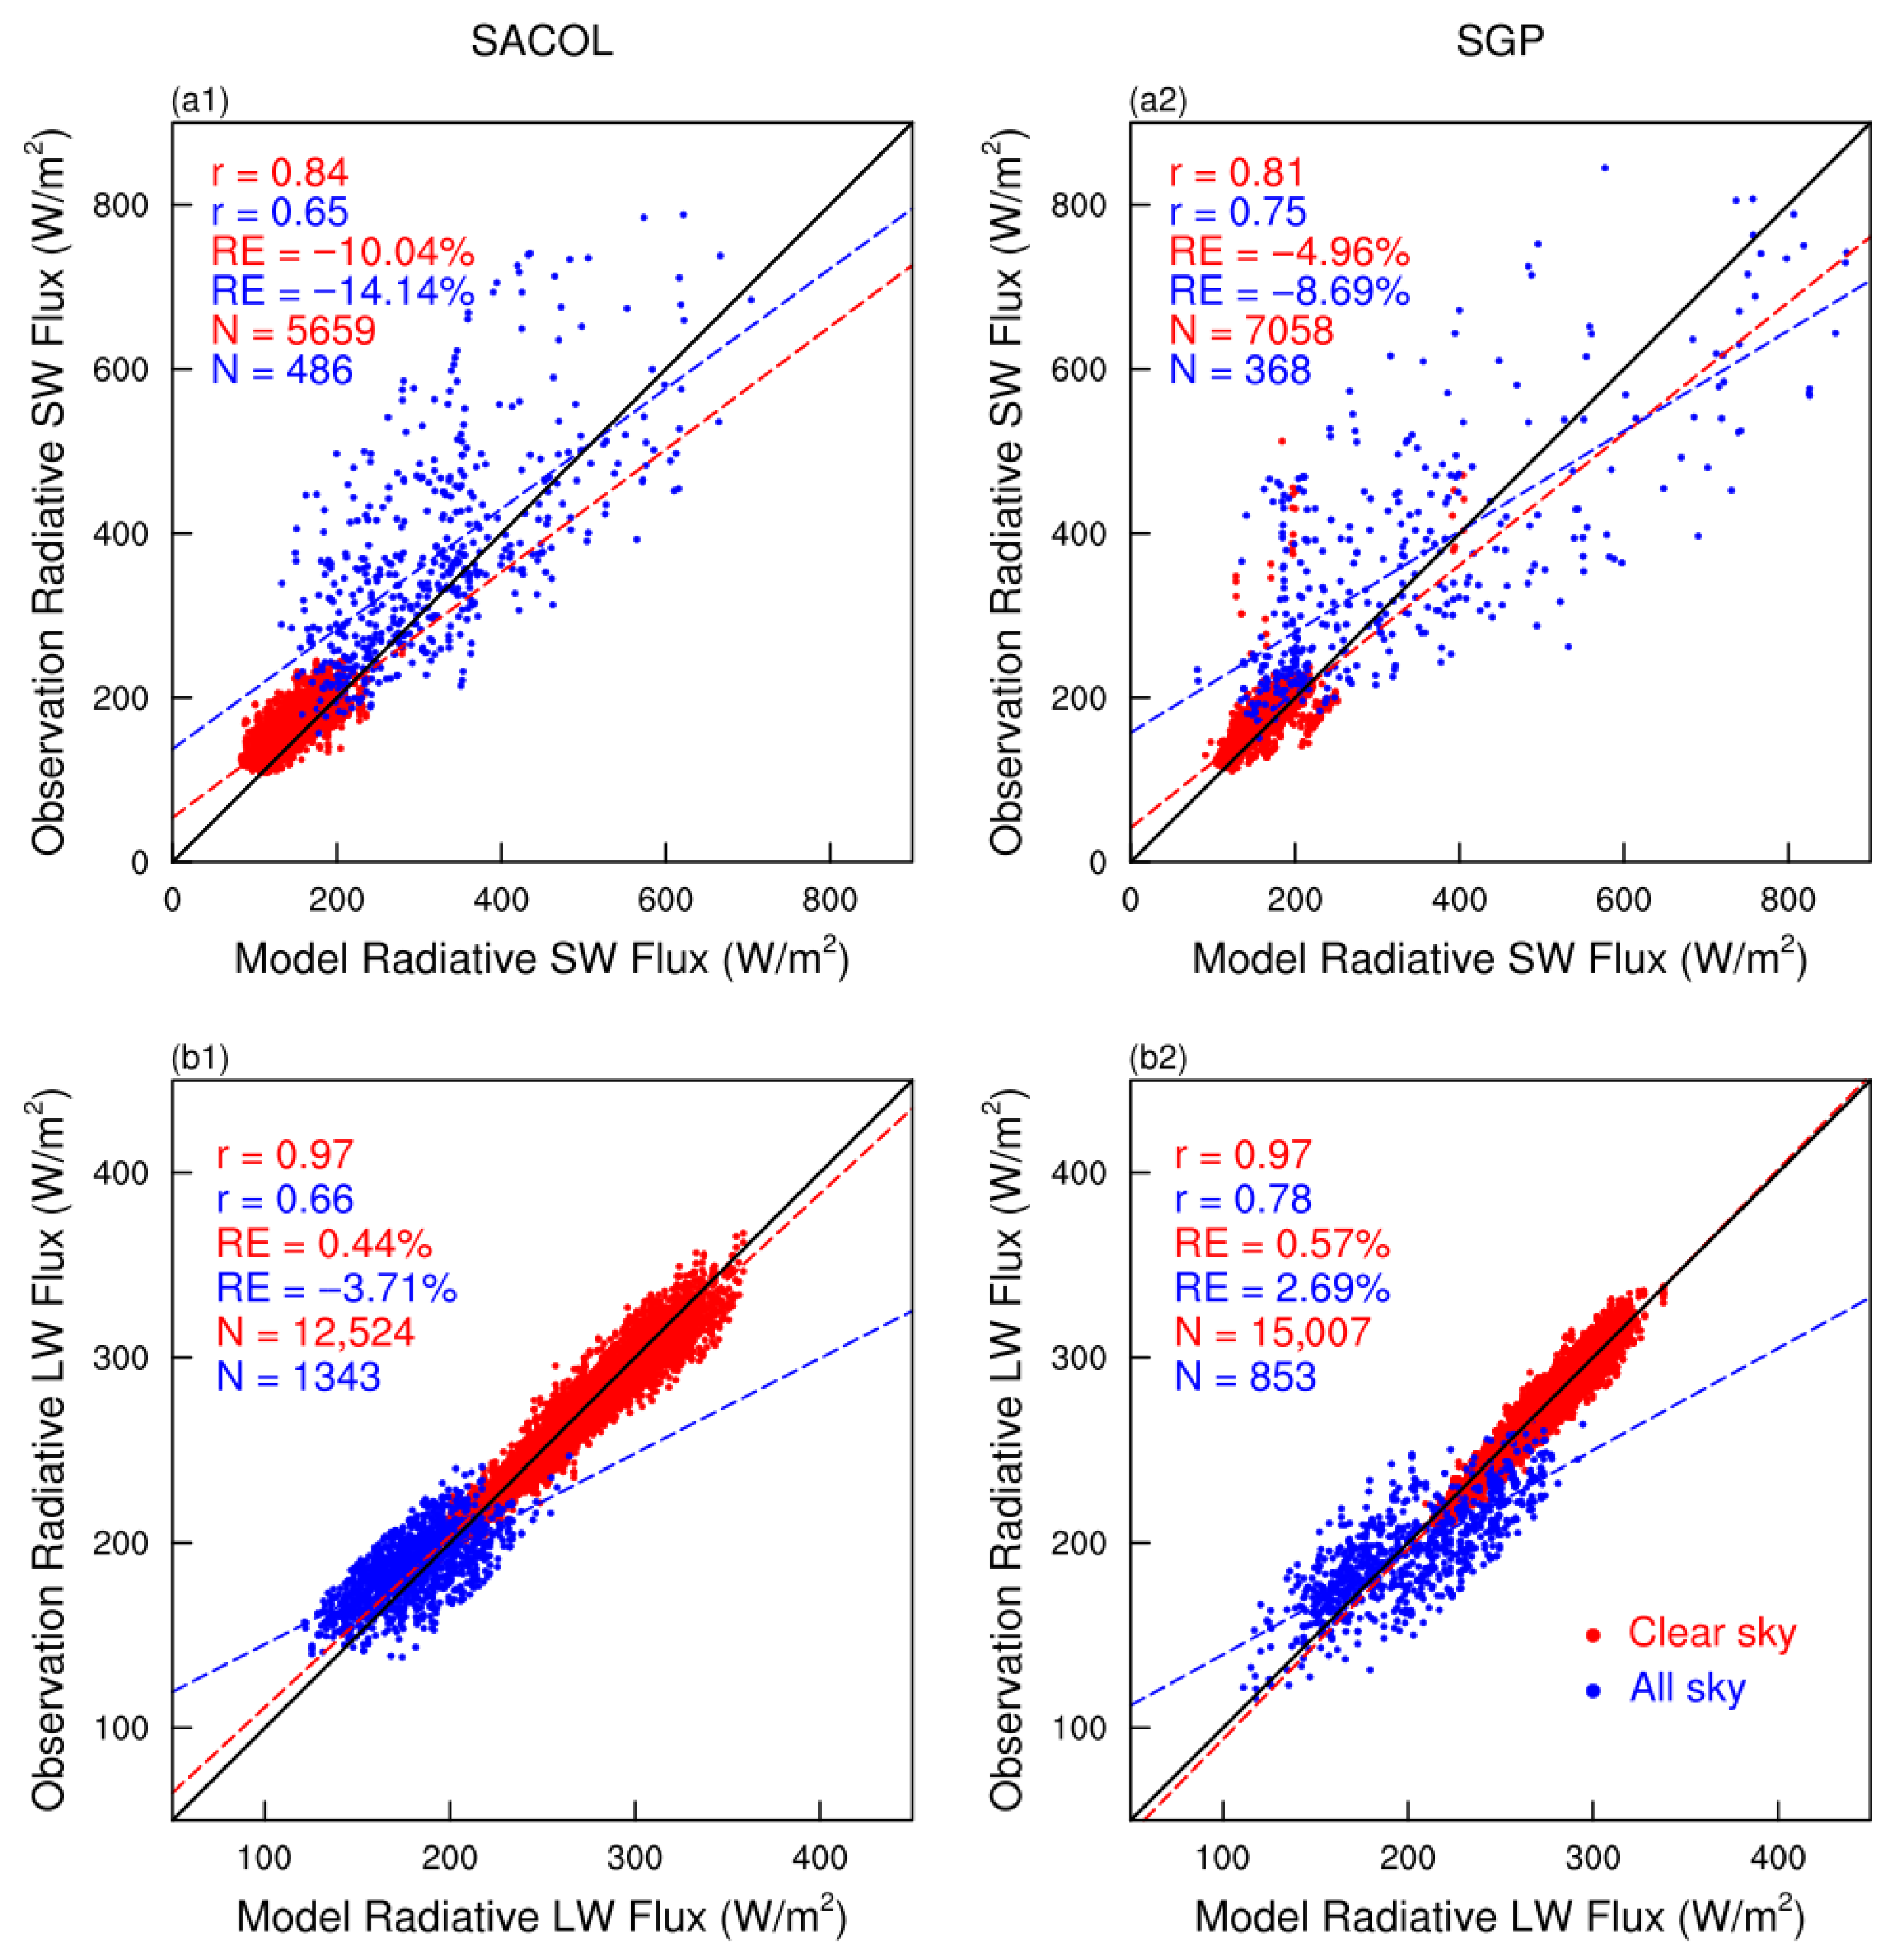
To evaluate the reliability of the model simulation, we conducted the radiative closure experiment by comparing the simulated instantaneous SW and LW radiative fluxes of the Fu-Liou model with the observations from the CERES SSF-Ed4A data at TOA. For the radiation-closure experiment, instantaneous CERES TOA fluxes from Terra (~10:30 local time) and Aqua (~13:30 local time) overpasses were used. For each overpass, the satellite pixel closest to the station location was selected. First, the experiment is produced under clear-sky conditions to ensure the accuracy of key parameters in the radiative transfer model, including atmospheric profiles, surface albedo, and solar zenith angle (SZA). Clear-sky conditions were defined when the CERES SSF-Ed4A instantaneous flux data showed more than 90% clear-sky coverage, and the ground-based radar observations simultaneously detected no cloud over the site. At the SACOL site, the numbers of matched samples are 5659 (clear-sky) and 486 (ice-cloud dominant) for shortwave radiation, and 12,524 (clear-sky) and 1343 (ice-cloud dominant) for longwave radiation. At the SGP site, the corresponding numbers are 7058 and 368 for shortwave, and 15,007 and 853 for longwave radiation. The results in Figure 6 show that model simulations and satellite observations agree well under clear-sky conditions, especially for longwave radiation. The mean (relative) LW errors for SACOL and SGP are only 1.14 W/m2 (0.44%) and 1.57 W/m2 (0.57%), respectively. The shortwave discrepancies are larger than those in the longwave; the relative errors at two sites are below 10% and 5%, respectively. It is mainly due to the complexity of surface albedo in the footprints of the satellite observation, which is hard to be precisely represented in the radiative transfer model. The good agreement between observations and simulations under clear-sky conditions indicates that the key atmospheric background parameters in the model are reasonably accurate and highly reliable. Based on this validation, we input the retrieved ice cloud macrophysical and microphysical parameters into the model to simulate radiative fluxes under all-sky conditions and conducted a further radiative closure experiment. To ensure the ice cloud-dominant scene, we selected CERES data with cloud top and cloud base temperatures below −30 °C and 0 °C, respectively, and required that the total fraction of other cloud types be below 5% to exclude multilayer cloud influence. Under cloudy conditions, the discrepancies between the model simulation and satellite observation remain small for longwave fluxes, whereas the SW differences increase significantly, with relative errors of −14.14% at SACOL and −8.69% and SGP, respectively. The increased discrepancies are mainly attributed to retrieval uncertainties in ice cloud microphysical properties [28,53]. Nevertheless, the relative errors of simulated versus observed SW fluxes under all sky remained below 15%, and those of longwave fluxes below 4%, which is smaller than the results of 16% and 10% in Wang’s study [18]. It is also necessary to notice that the difference in SW flux could be amplified due to the data in comparison being restricted to the period of the Terra/Aqua-MODIS transit time, which is close to noon.
Figure 6.
Scatter plots of instantaneous (a) shortwave and (b) longwave radiative fluxes at the top of the atmosphere, observed by satellite and simulated by the model under clear-sky and all-sky conditions at (1) the SACOL site and (2) the SGP site; r represents the correlation coefficient, RE represents the relative error, and N represents the sample size.
3.2.2. Ice Cloud Radiative Forcing and Heating Rate
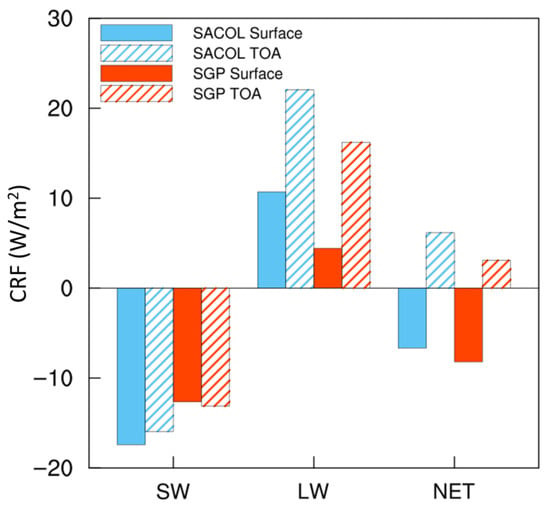
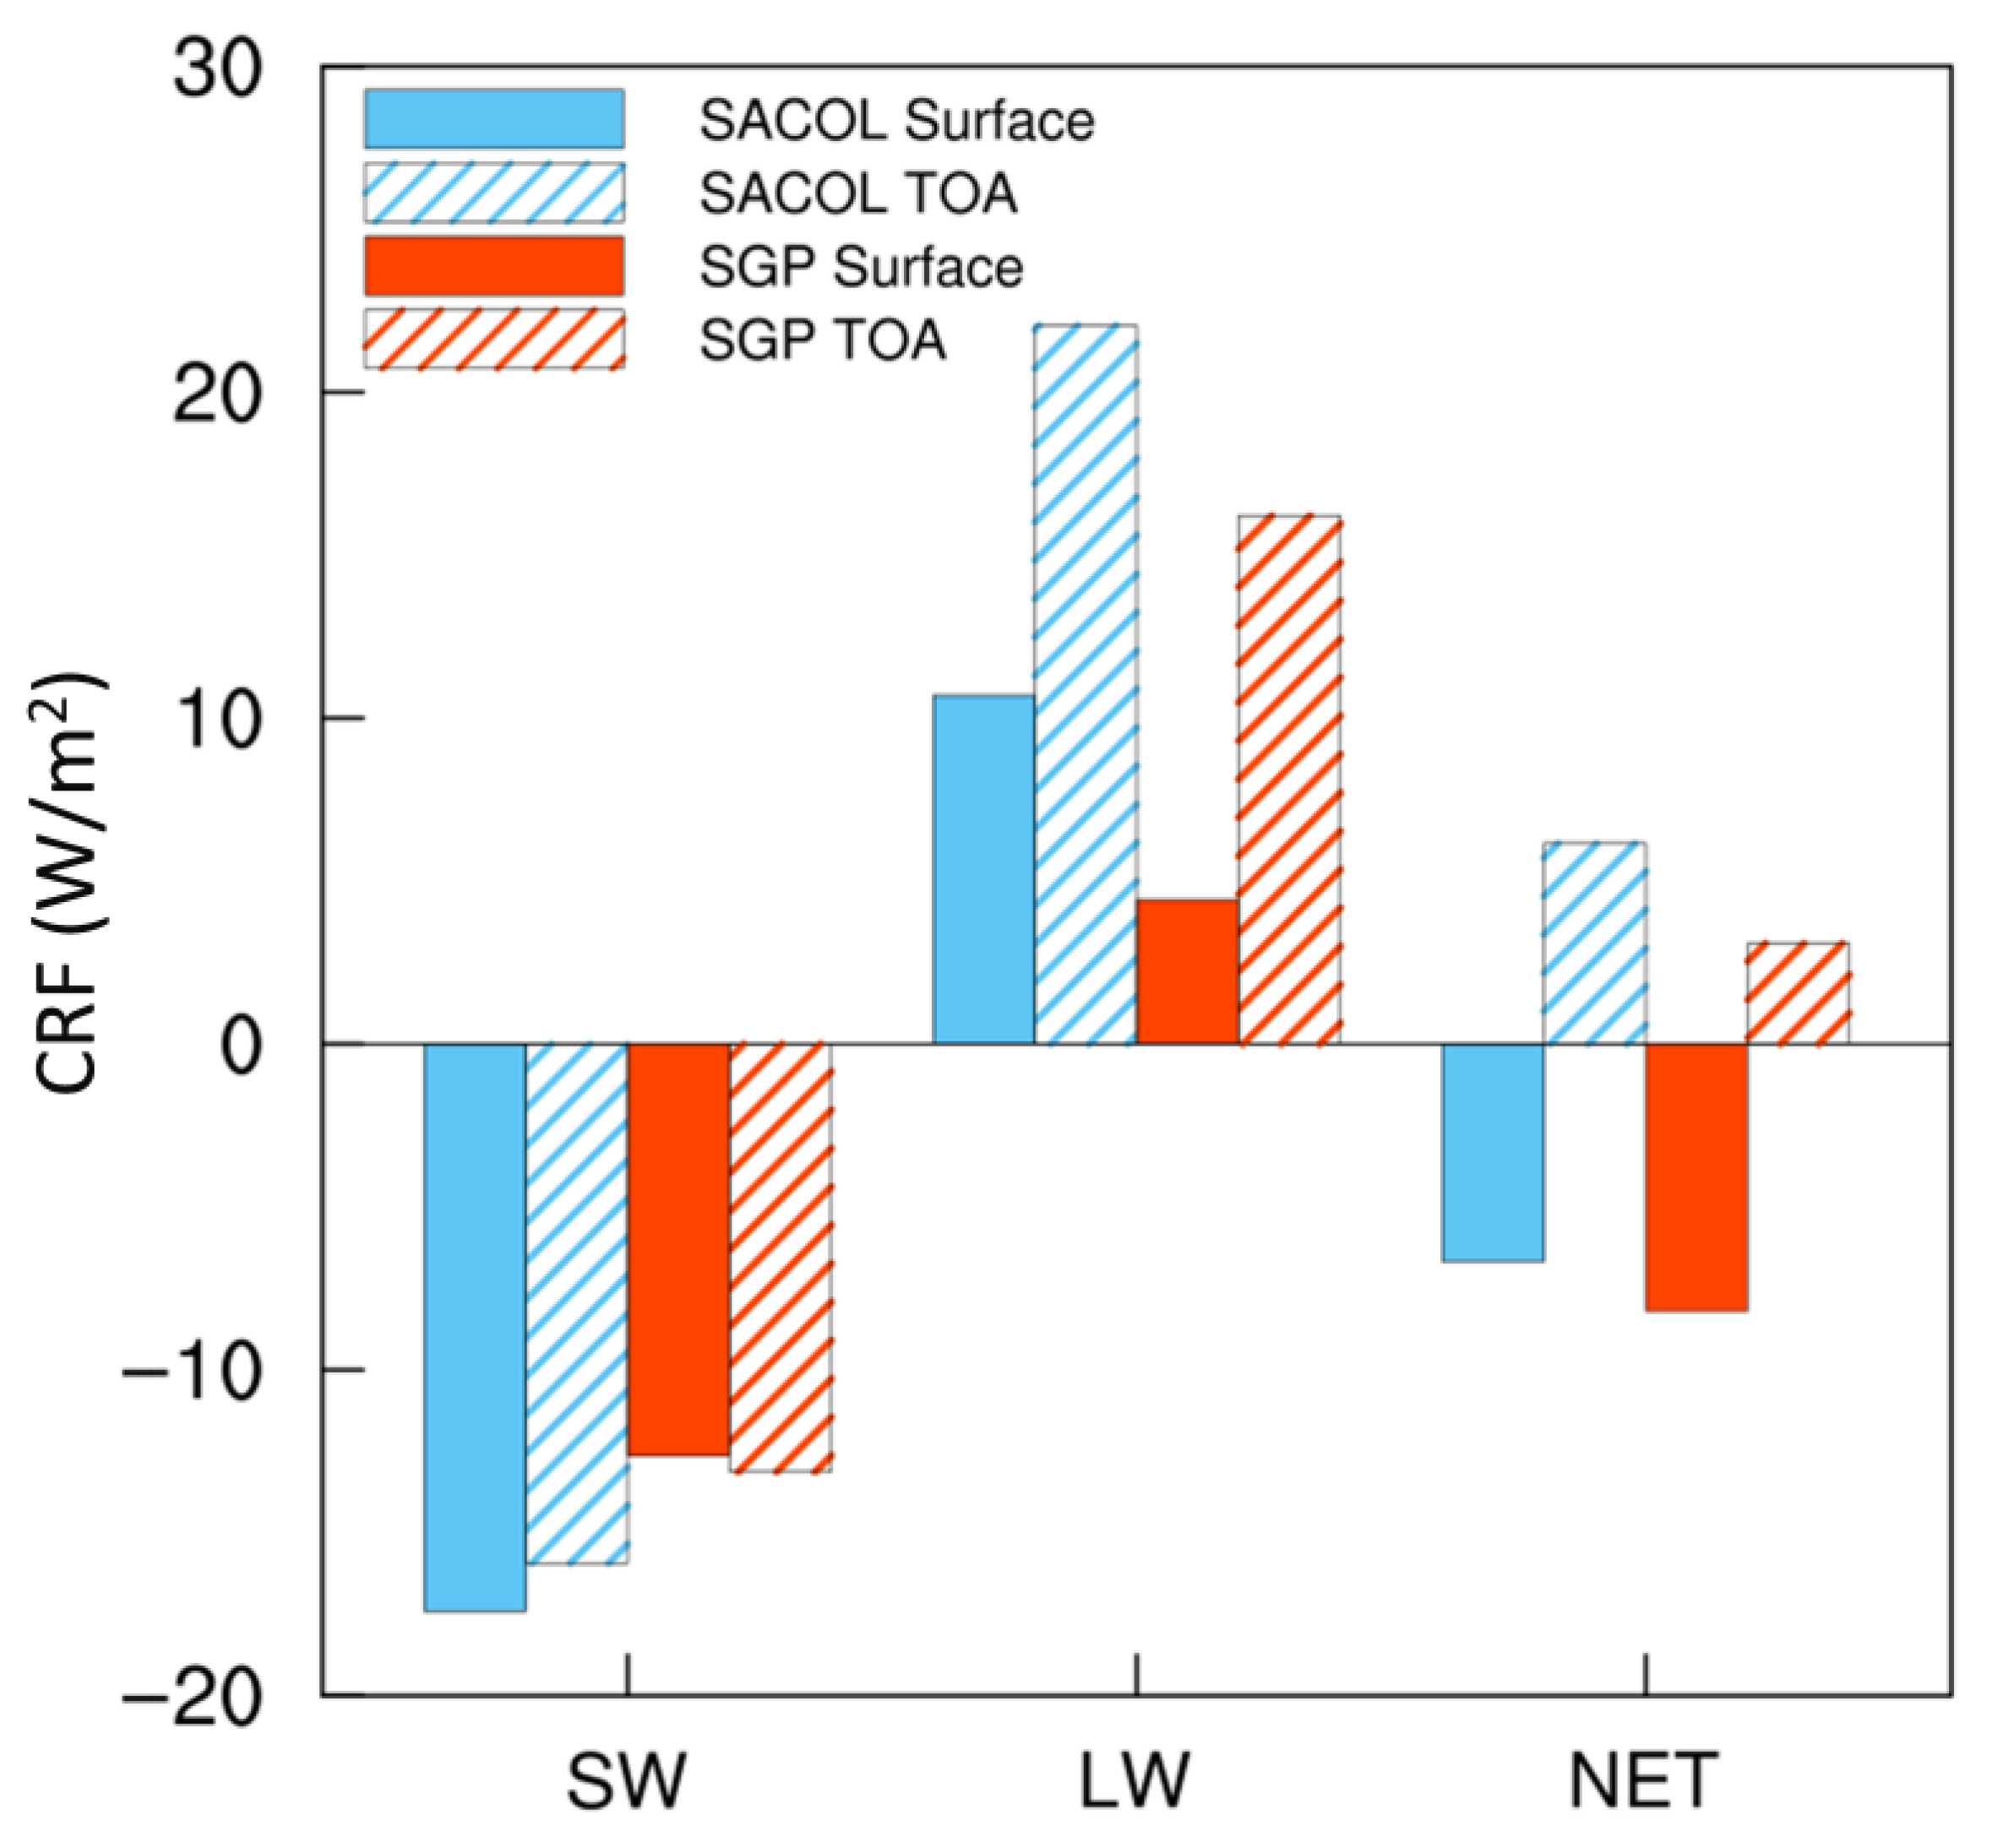
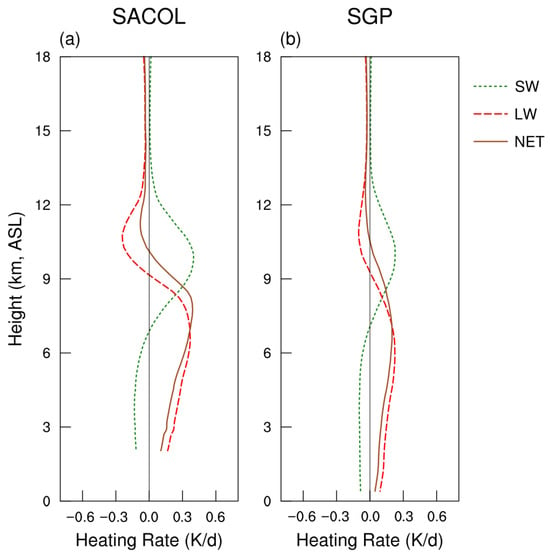
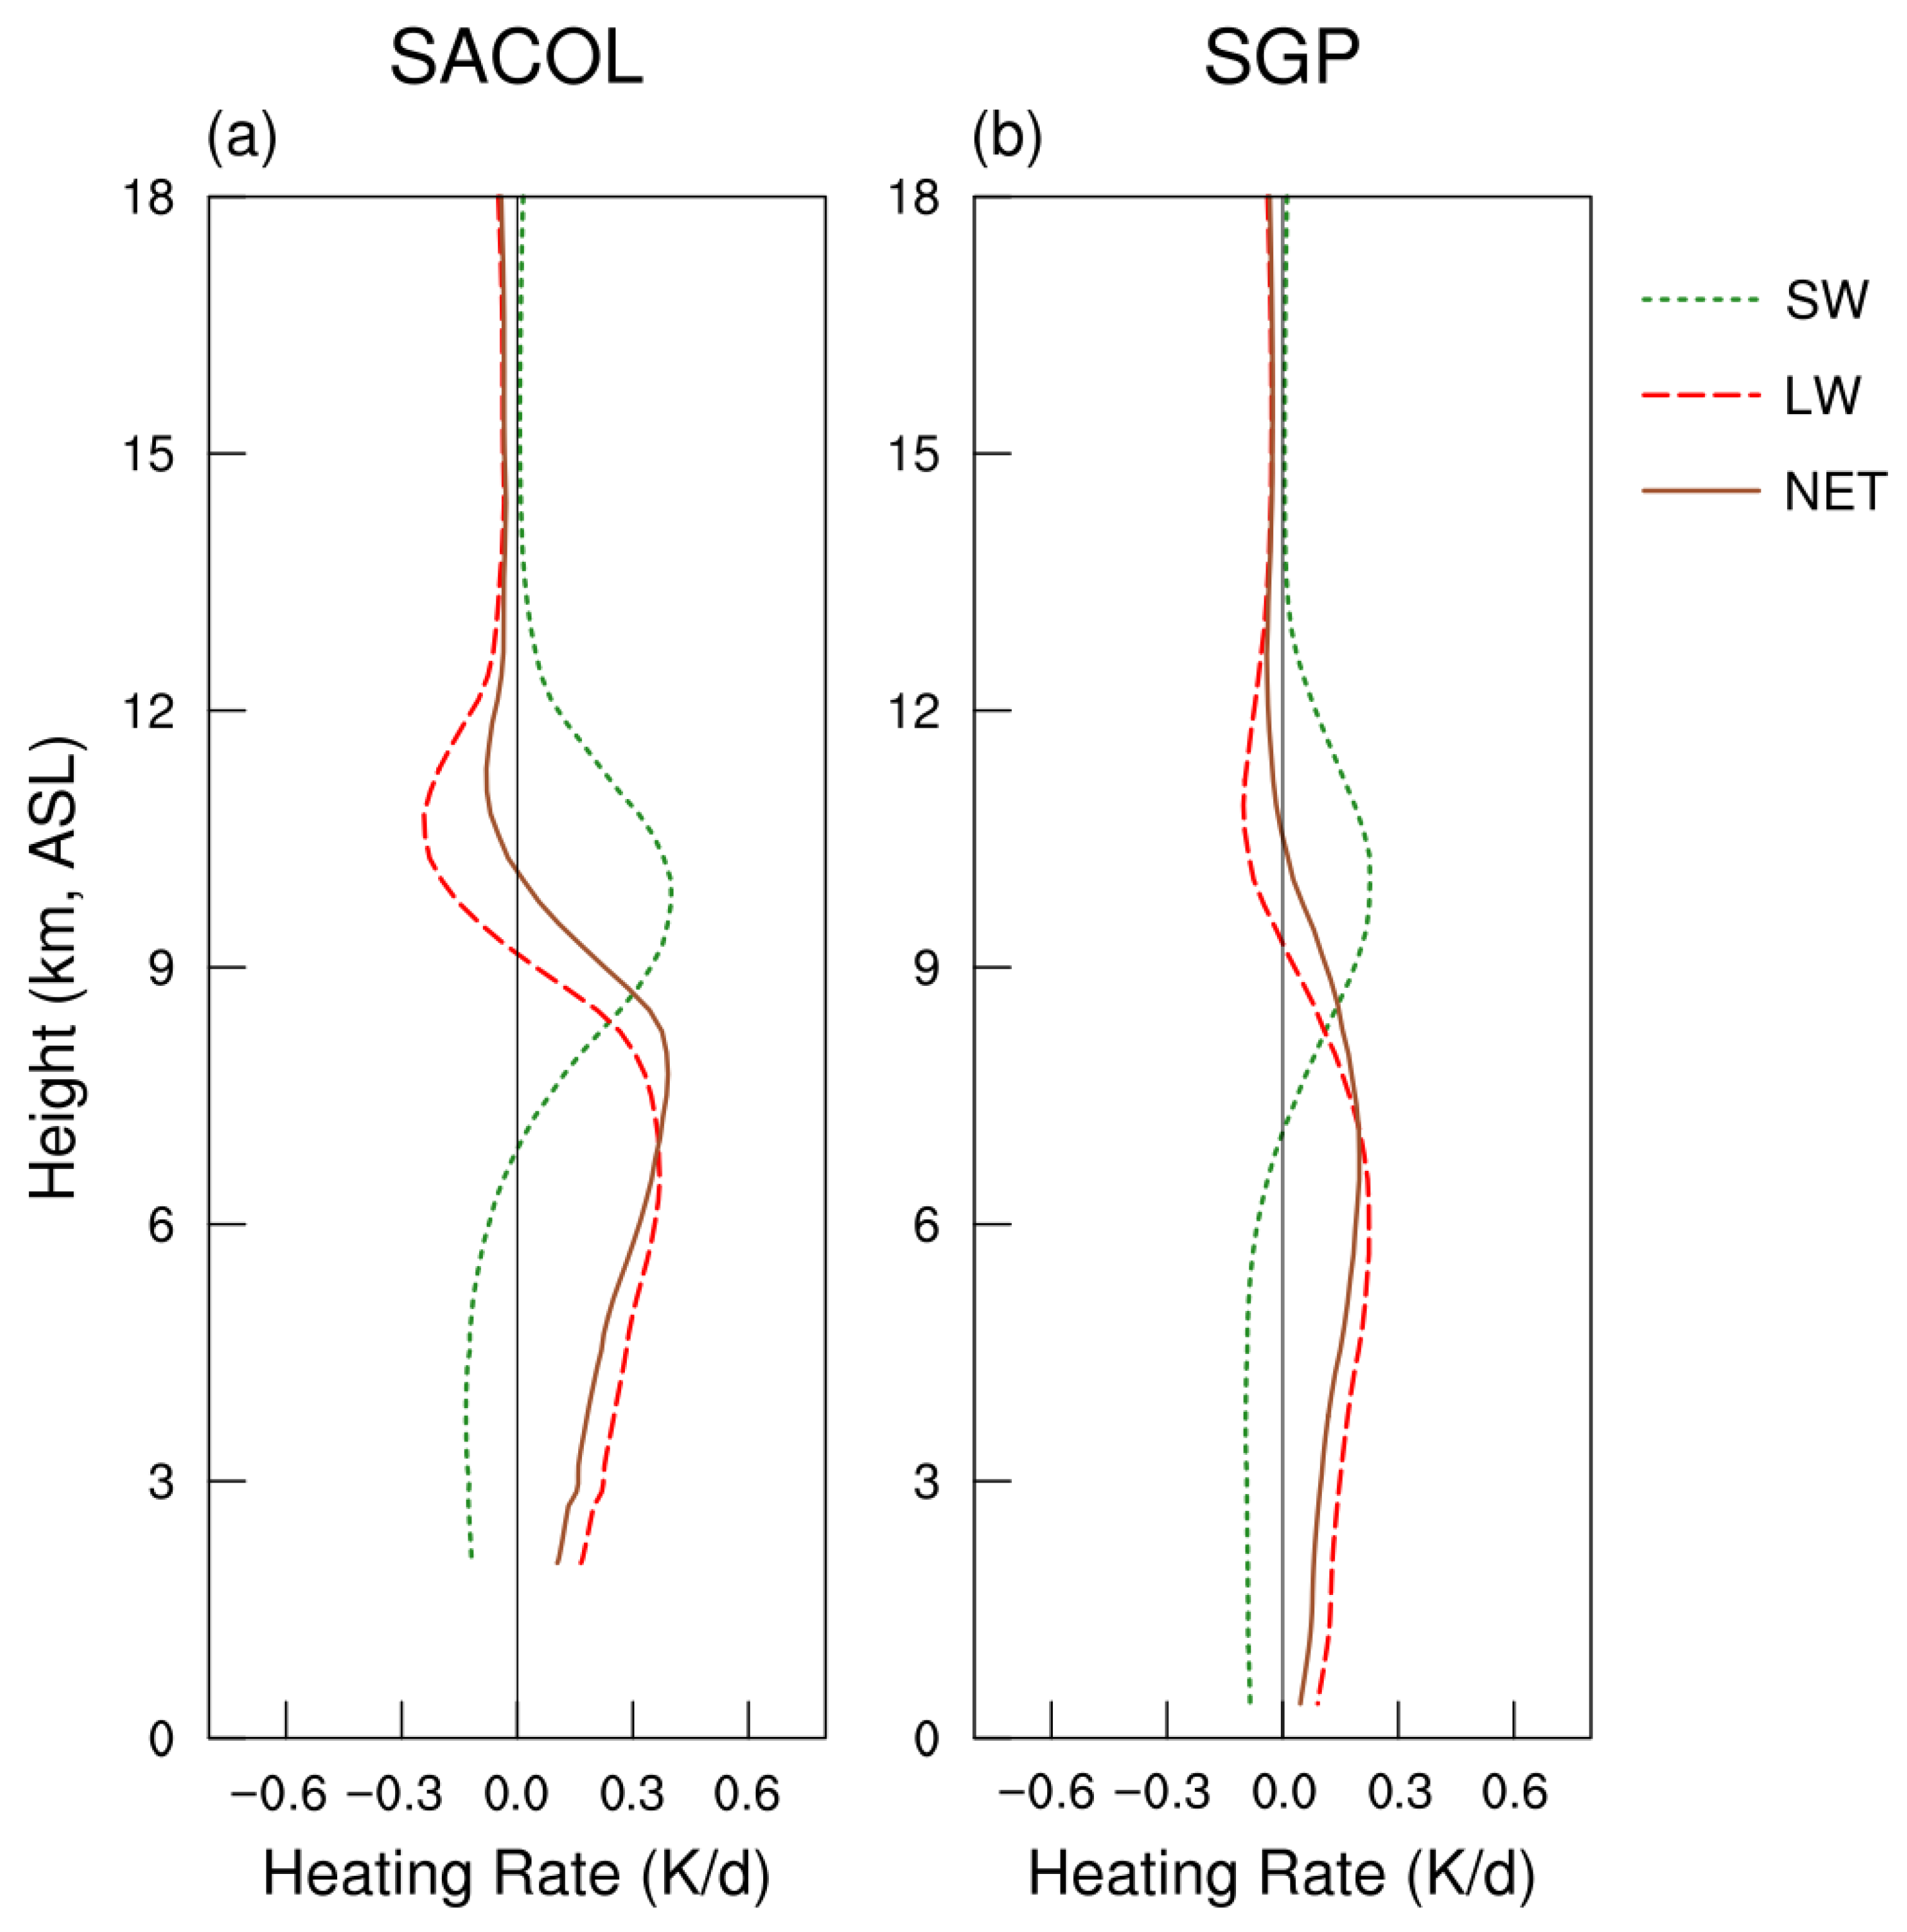
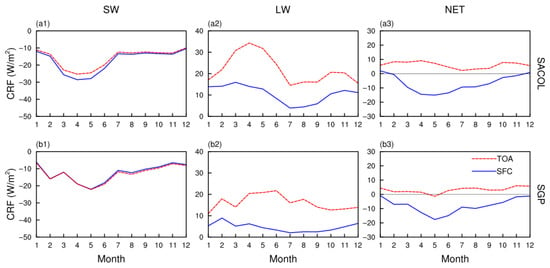
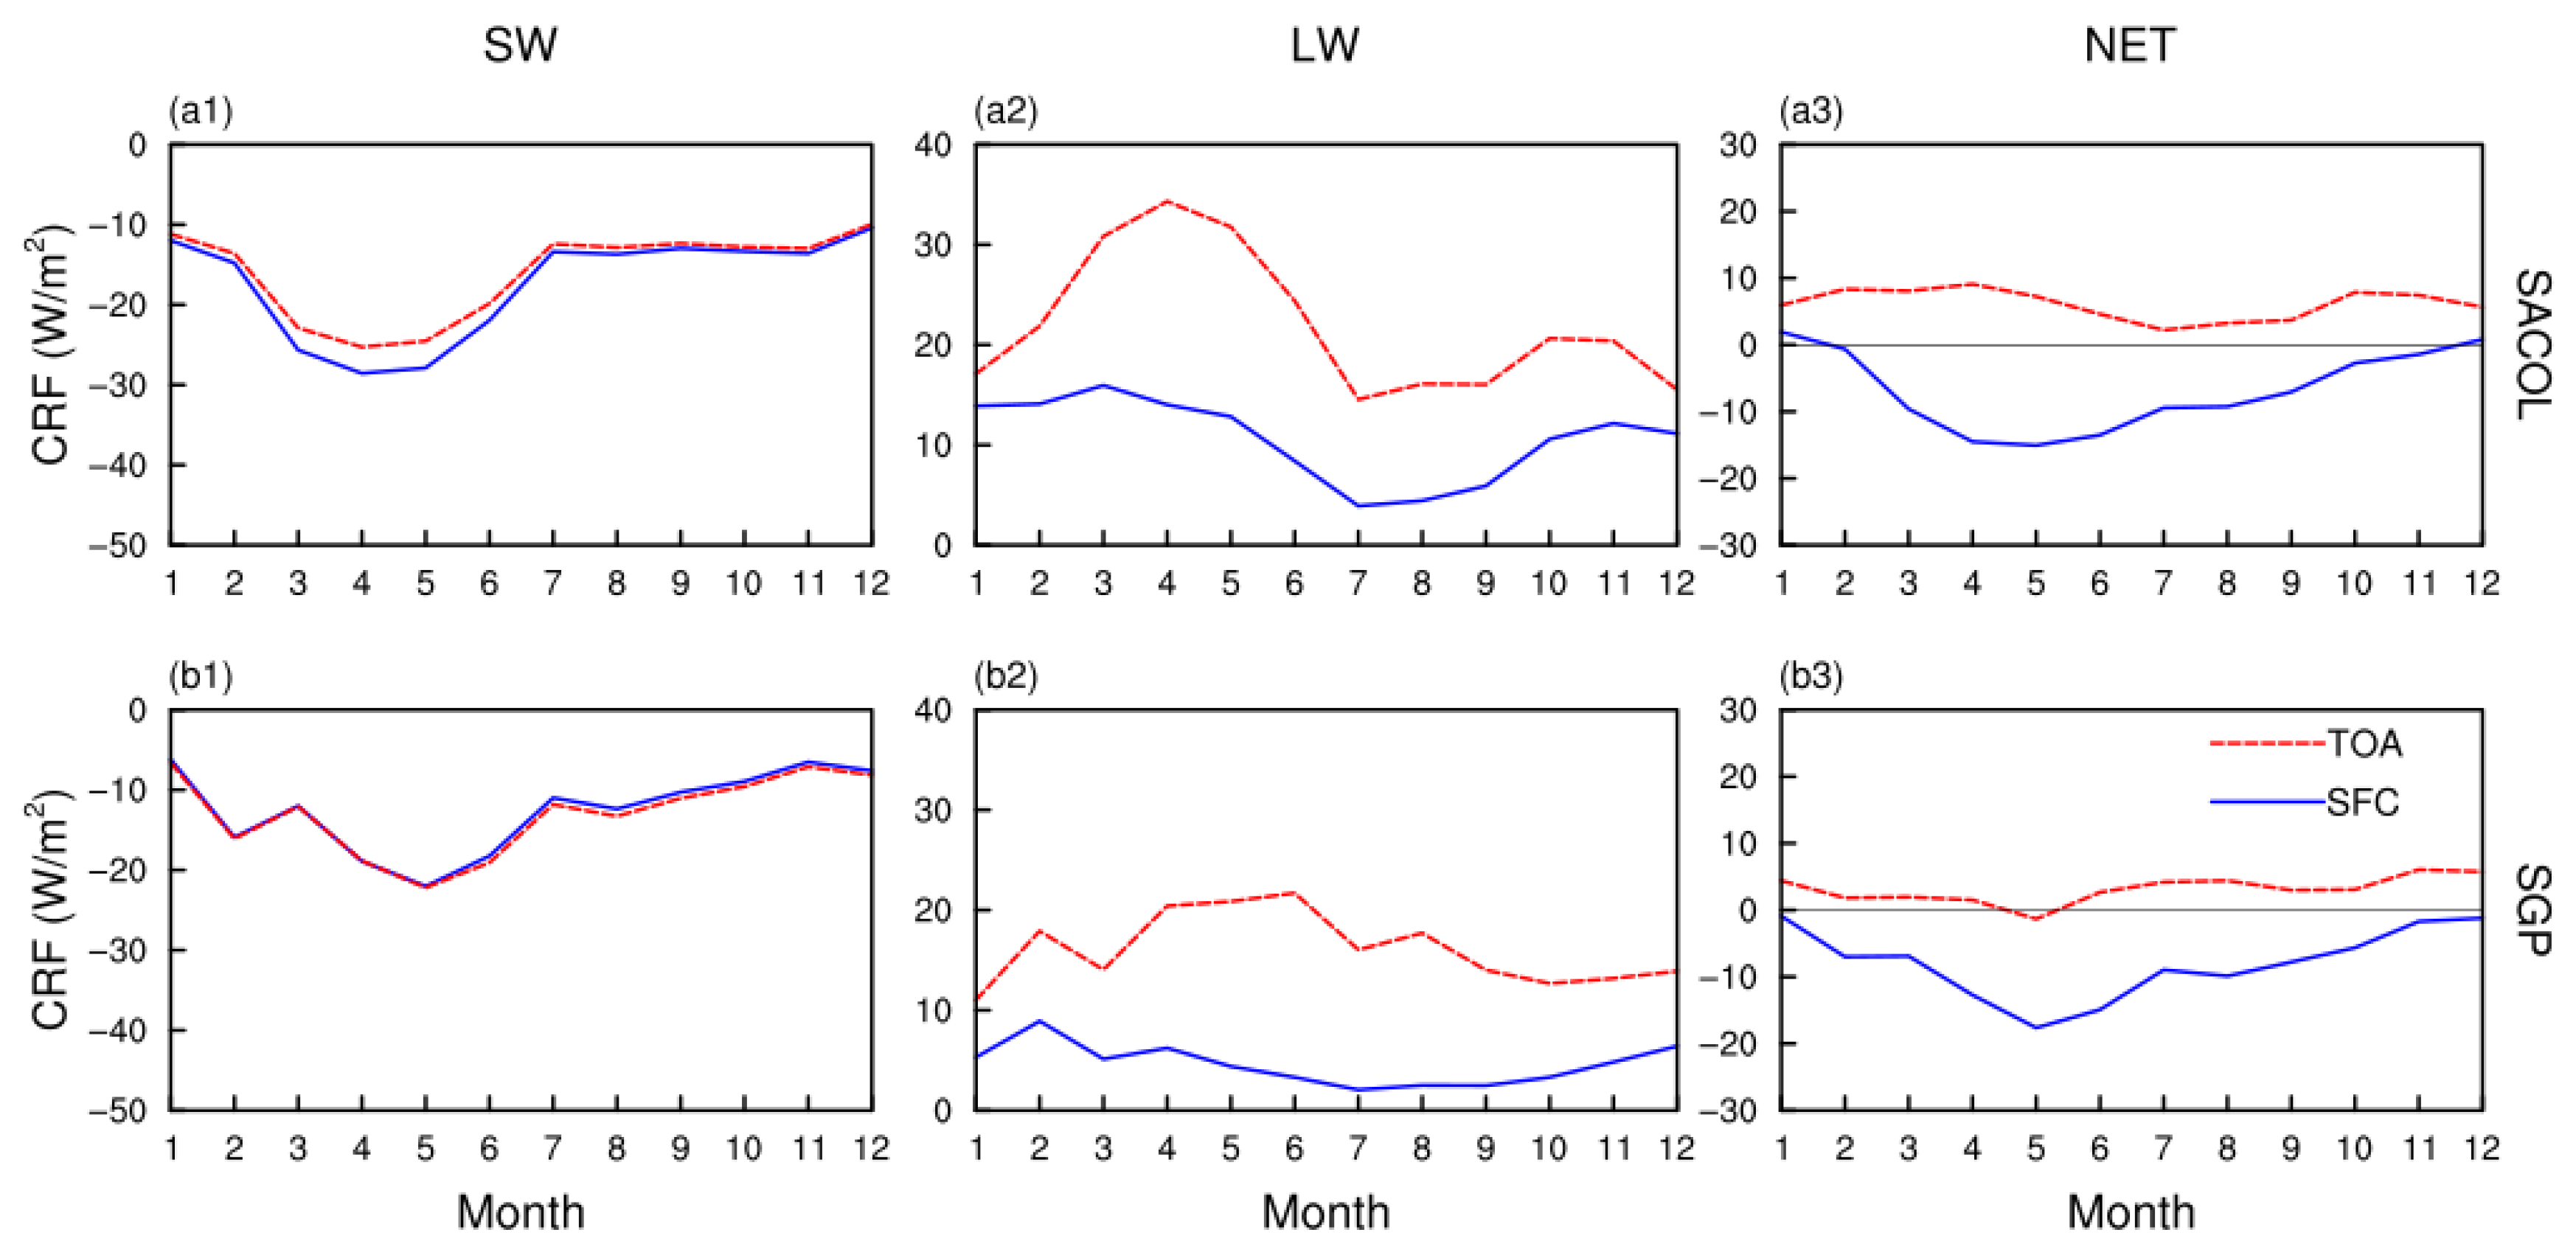
Based on the radiative closure experiments, we calculate the SW, LW and Net radiative forcing and vertical heating rate at SACOL and SGP from 2014 to 2019. According to the annual mean values presented in Figure 7, the SW CRF at the TOA and surface are −15.92 W/m2 and −17.39 W/m2 at SACOL, and −13.10 W/m2 and −12.60 W/m2 at SGP, respectively. The stronger cooling effect observed at SACOL can be largely attributed to its 12% higher ice cloud occurrence frequency compared to SGP. Additionally, at SACOL, the larger difference between TOA and surface CRF indicates that a greater fraction of cloud radiative forcing is absorbed within the atmosphere, while the larger negative surface CRF reflects a stronger surface cooling effect compared to SGP. As illustrated in Figure 8, the impact of ice clouds on the vertical heating rate of the atmosphere indicates that Solar shortwave absorption within the cloud heats the corresponding atmospheric layer and cools the underlying layers. The higher occurrence frequency and greater thickness of ice clouds at SACOL enhance cloud extinction, resulting in a maximum SW heating rate peak within the 9–11 km layer that is about 40% greater than at SGP. This enhanced heating aloft also explains why the presence of ice clouds reduces the amount of SW radiation reaching the surface, thereby exerting a stronger surface cooling effect at SACOL. Additionally, both SACOL and SGP exhibit similar seasonal variation patterns in shortwave CRF, as shown in Figure 9, with stronger negative values occurring from February to July, which are closely linked to seasonal changes in cloud occurrence. The strongest shortwave CRF at TOA appears from April to May, reaching −25.28 W/m2 at SACOL and −22.20 W/m2 at SGP, coinciding with increased ice cloud occurrence and thicker cloud layers.
Figure 7.
Average shortwave, longwave, and net radiative forcing of ice clouds at the top of the atmosphere and at the surface at the SACOL and SGP sites from 2014 to 2019. Unit: W/m2.
Figure 8.
Six-year average vertical profiles of shortwave, longwave, and net radiative heating rates of ice clouds at the (a) SACOL and (b) SGP sites. Unit: K/day.
Figure 9.
Seasonal variations of (1) shortwave, (2) longwave, and (3) net radiative forcing of ice clouds at (a) the SACOL site and (b) the SGP site from 2014 to 2019. The red dashed line represents radiative forcing at the top of the atmosphere, and the blue solid line represents radiative forcing at the surface.
For longwave radiation, ice clouds produce positive radiative forcing both at the TOA and the surface at two sites, showing a significant warming effect. The annual mean longwave CRF values at SACOL are 21.99 W/m2 at the TOA and 10.63 W/m2 at the surface, compared to 16.16 W/m2 and 4.54 W/m2 at SGP. The longwave CRF at the TOA exceeds that at the surface, suggesting that more longwave energy is retained within the atmosphere. Ice clouds absorb outgoing longwave radiation from the lower atmosphere and surface that would otherwise escape into space, thereby trapping this energy and warming the Earth–atmosphere system. Due to their high altitude, ice clouds emit longwave radiation at lower temperatures. As shown in Figure 8, this leads to cooling within the cloud layers, with rates of −0.24 K/day at SACOL and −0.10 K/day at SGP. In the 5–8 km layer below the clouds, significant warming is observed, with peak heating rates of 0.37 K/day and 0.22 K/day, respectively. Seasonal variation in longwave forcing is comparable to that of shortwave forcing, with enhanced effects during the cold season and reduced effects during the warm season, largely driven by seasonal changes in ice cloud occurrence.
Considering both shortwave and longwave radiative effects, ice clouds at two sites exert a net positive radiative forcing at TOA. The annual mean net CRF at TOA is 6.08 W/m2 at SACOL and 3.06 W/m2 at SGP, indicating that the overall influence of ice clouds at TOA is dominated by the longwave warming effect, which ultimately retains more energy within the Earth–atmosphere system. In contrast, ice clouds produce a net negative radiative forcing at the surface, with annual mean values of −6.76 W/m2 at SACOL and −8.07 W/m2 at SGP. These results highlight the role of ice clouds in warming the atmospheric column through radiative absorption, while simultaneously cooling the surface by reducing net radiative fluxes.
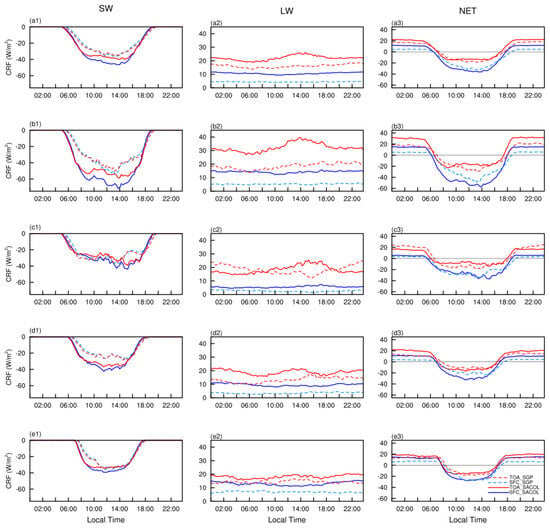
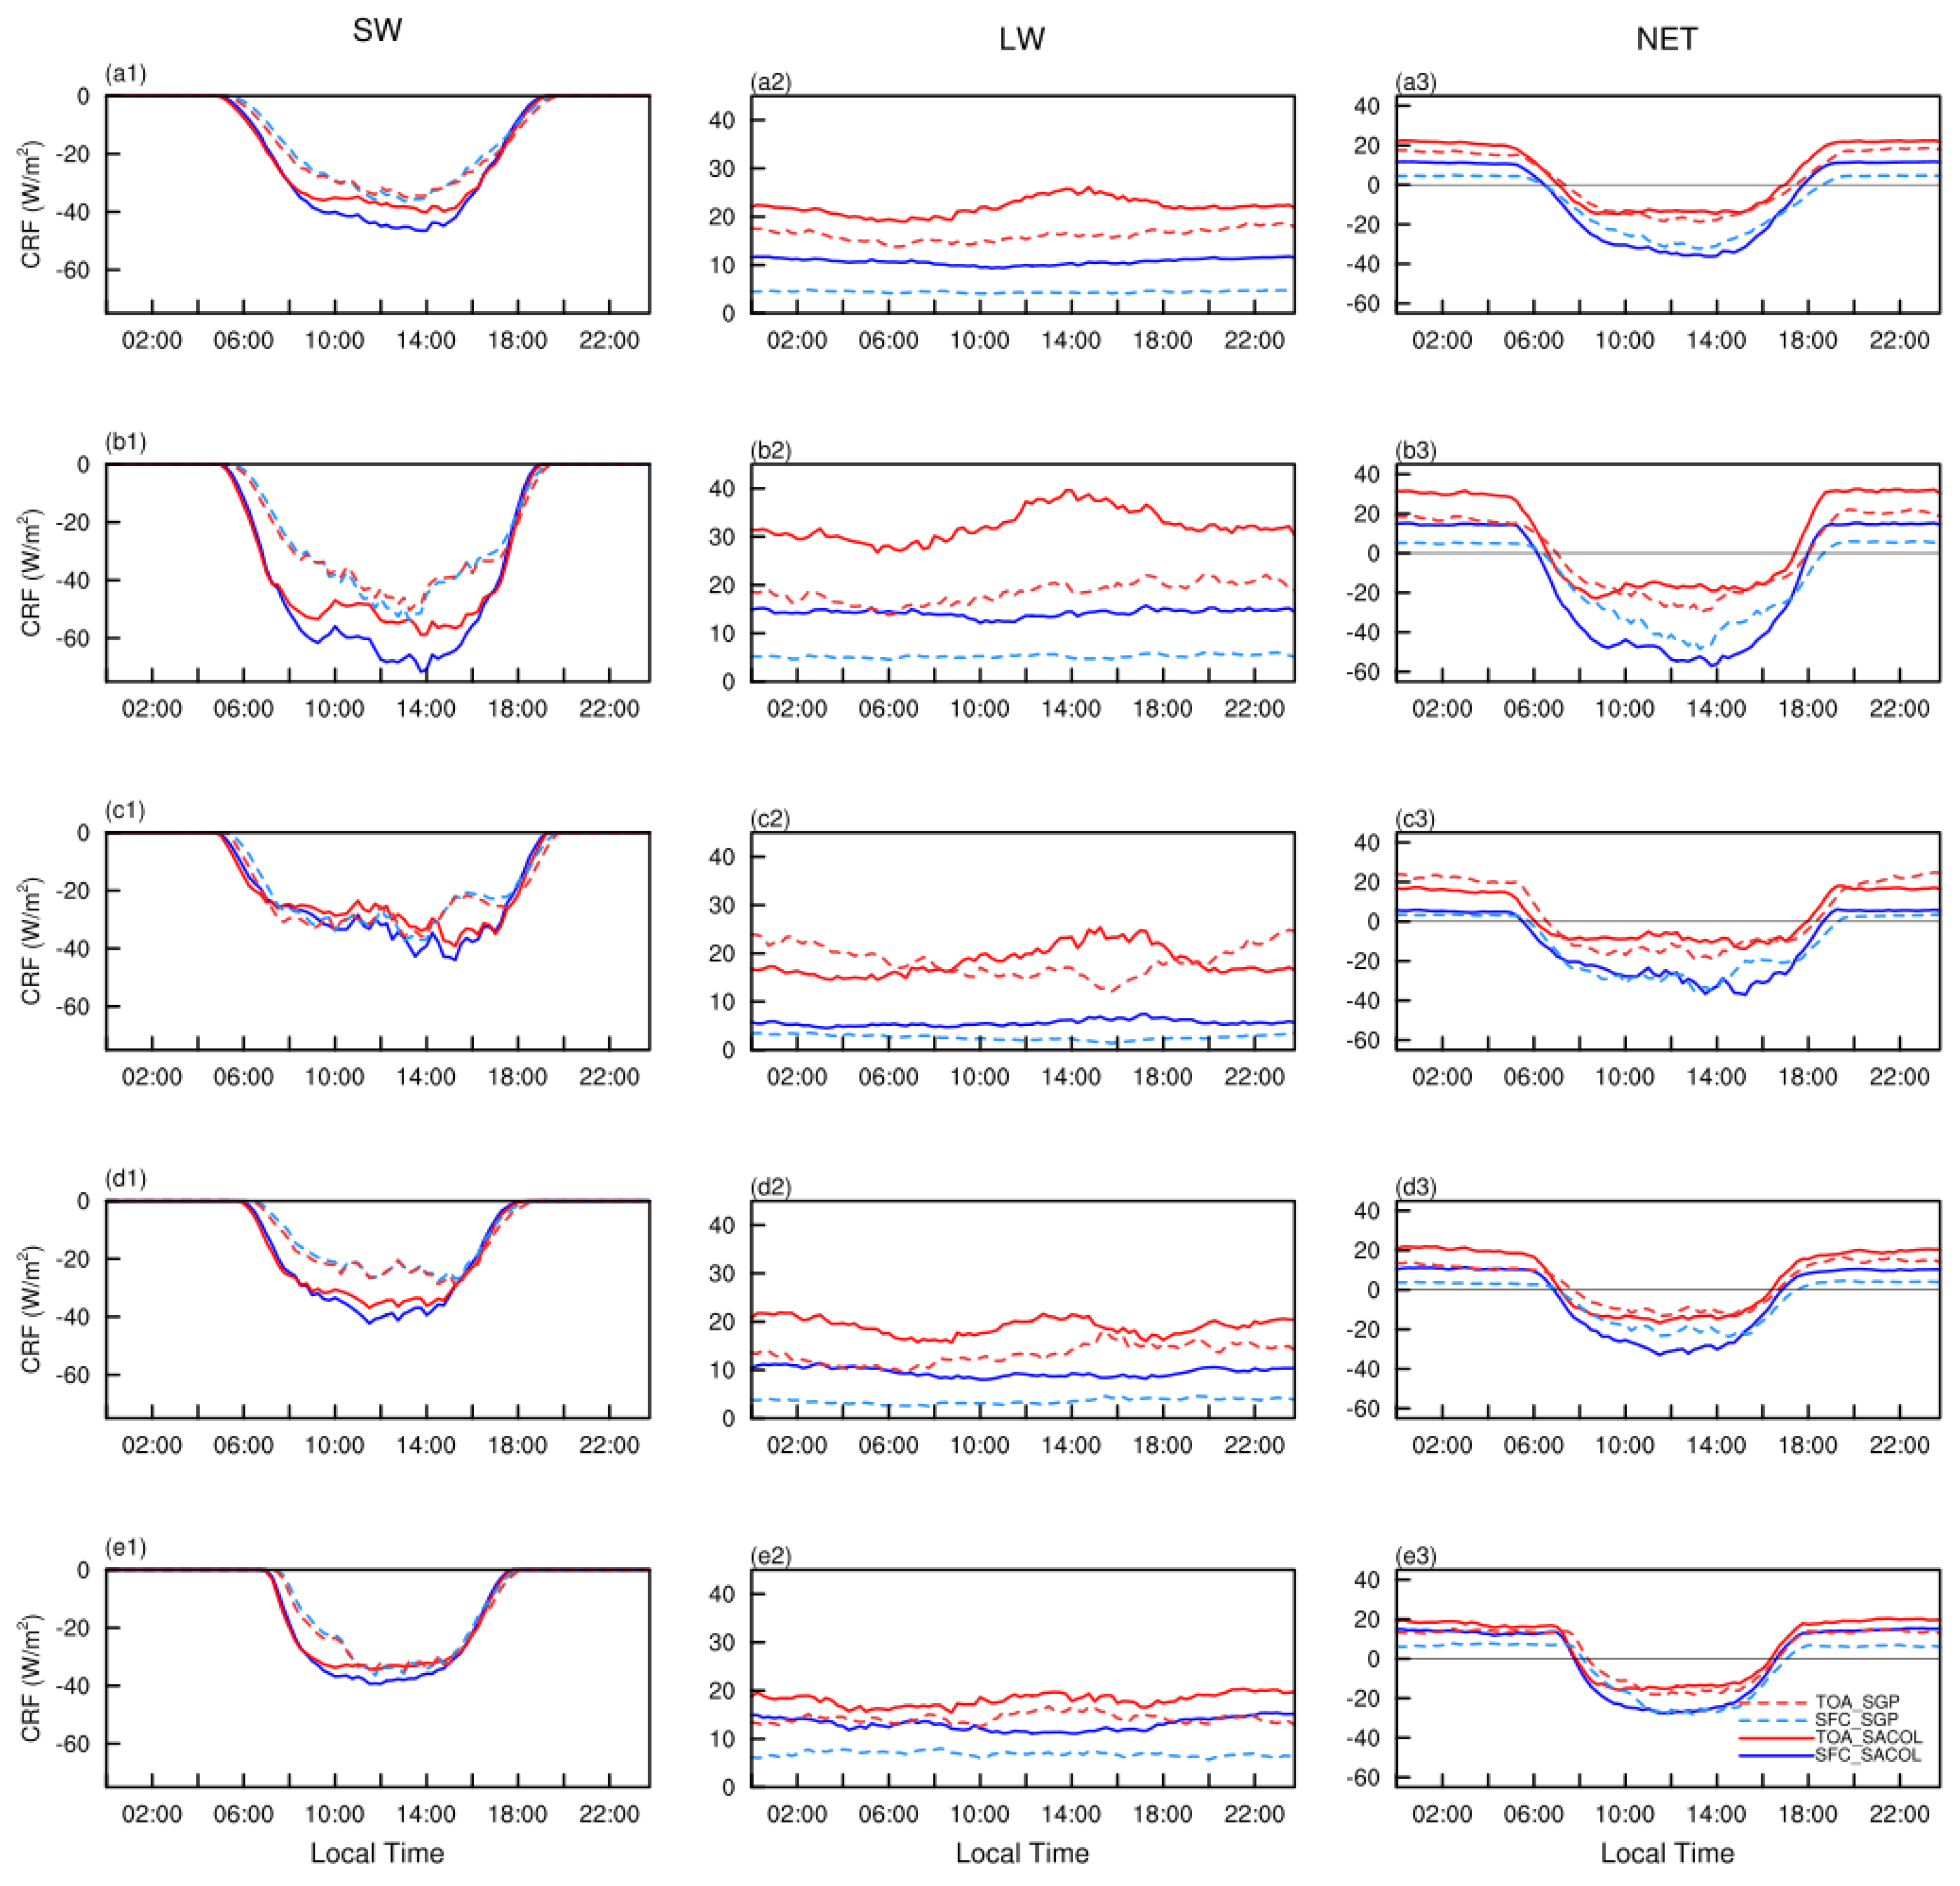
Figure 10 illustrates the diurnal variations in ice cloud SW, LW and net radiative forcing at the SACOL and SGP sites in annual and four seasons. Both sites exhibit significant diurnal variations in the SW radiative forcing of ice clouds. The combined effects of solar zenith angle changes and daily variations in cloud physical properties result in pronounced shortwave radiative forcing peaks, typically occurring between 12:00 and 14:00 local time. At SACOL in spring at 14:00, shortwave forcing reaches minimum values of −58.80 W/m2 at the TOA and −71.63 W/m2 at the surface. This coincides with the highest solar elevation angle and increases in cloud thickness and ice water content, resulting in the strongest shortwave cooling effect of the day. The diurnal variation in spring shortwave forcing at SGP is also pronounced, with afternoon minima of −50.38 W/m2 at the TOA and −53.95 W/m2 at the surface. Compared to shortwave forcing, longwave radiative forcing exhibits less pronounced diurnal variation, particularly at SGP, where TOA and surface longwave force ranges from 13.76 to 18.86 W/m2 and 4.06 to 4.87 W/m2, respectively. At SACOL, ice cloud longwave forcing at the TOA increases from afternoon to nighttime, which is related to increased nighttime ice cloud occurrence and cloud thickening. The net cloud radiative forcing reflects the combined effect of daytime shortwave cooling and longwave warming and is dominated by longwave warming at night. As the solar elevation angles and cloud properties vary diurnally, the net CRF at SACOL ranges from −14.56 to 22.44 W/m2 at the TOA and from −36.25 to 11.75 W/m2 at the surface, with corresponding ranges of −18.74 to 18.86 W/m2 and −32.32 to 4.89 W/m2 at SGP.
Figure 10.
Diurnal variations of (1) shortwave, (2) longwave, and (3) net radiative forcing of ice clouds at the SACOL site and the SGP site, averaged over six years for (a) the entire year, (b) spring, (c) summer, (d) autumn, and (e) winter.
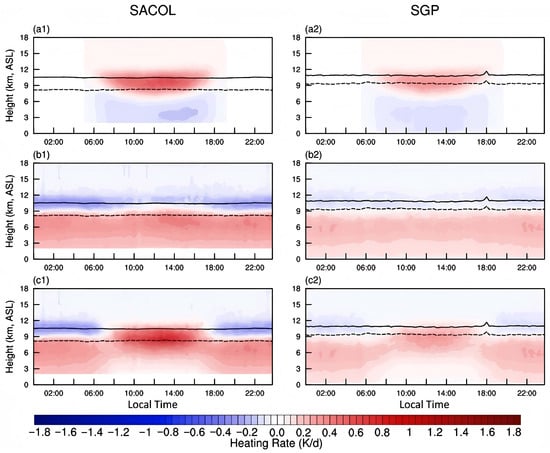
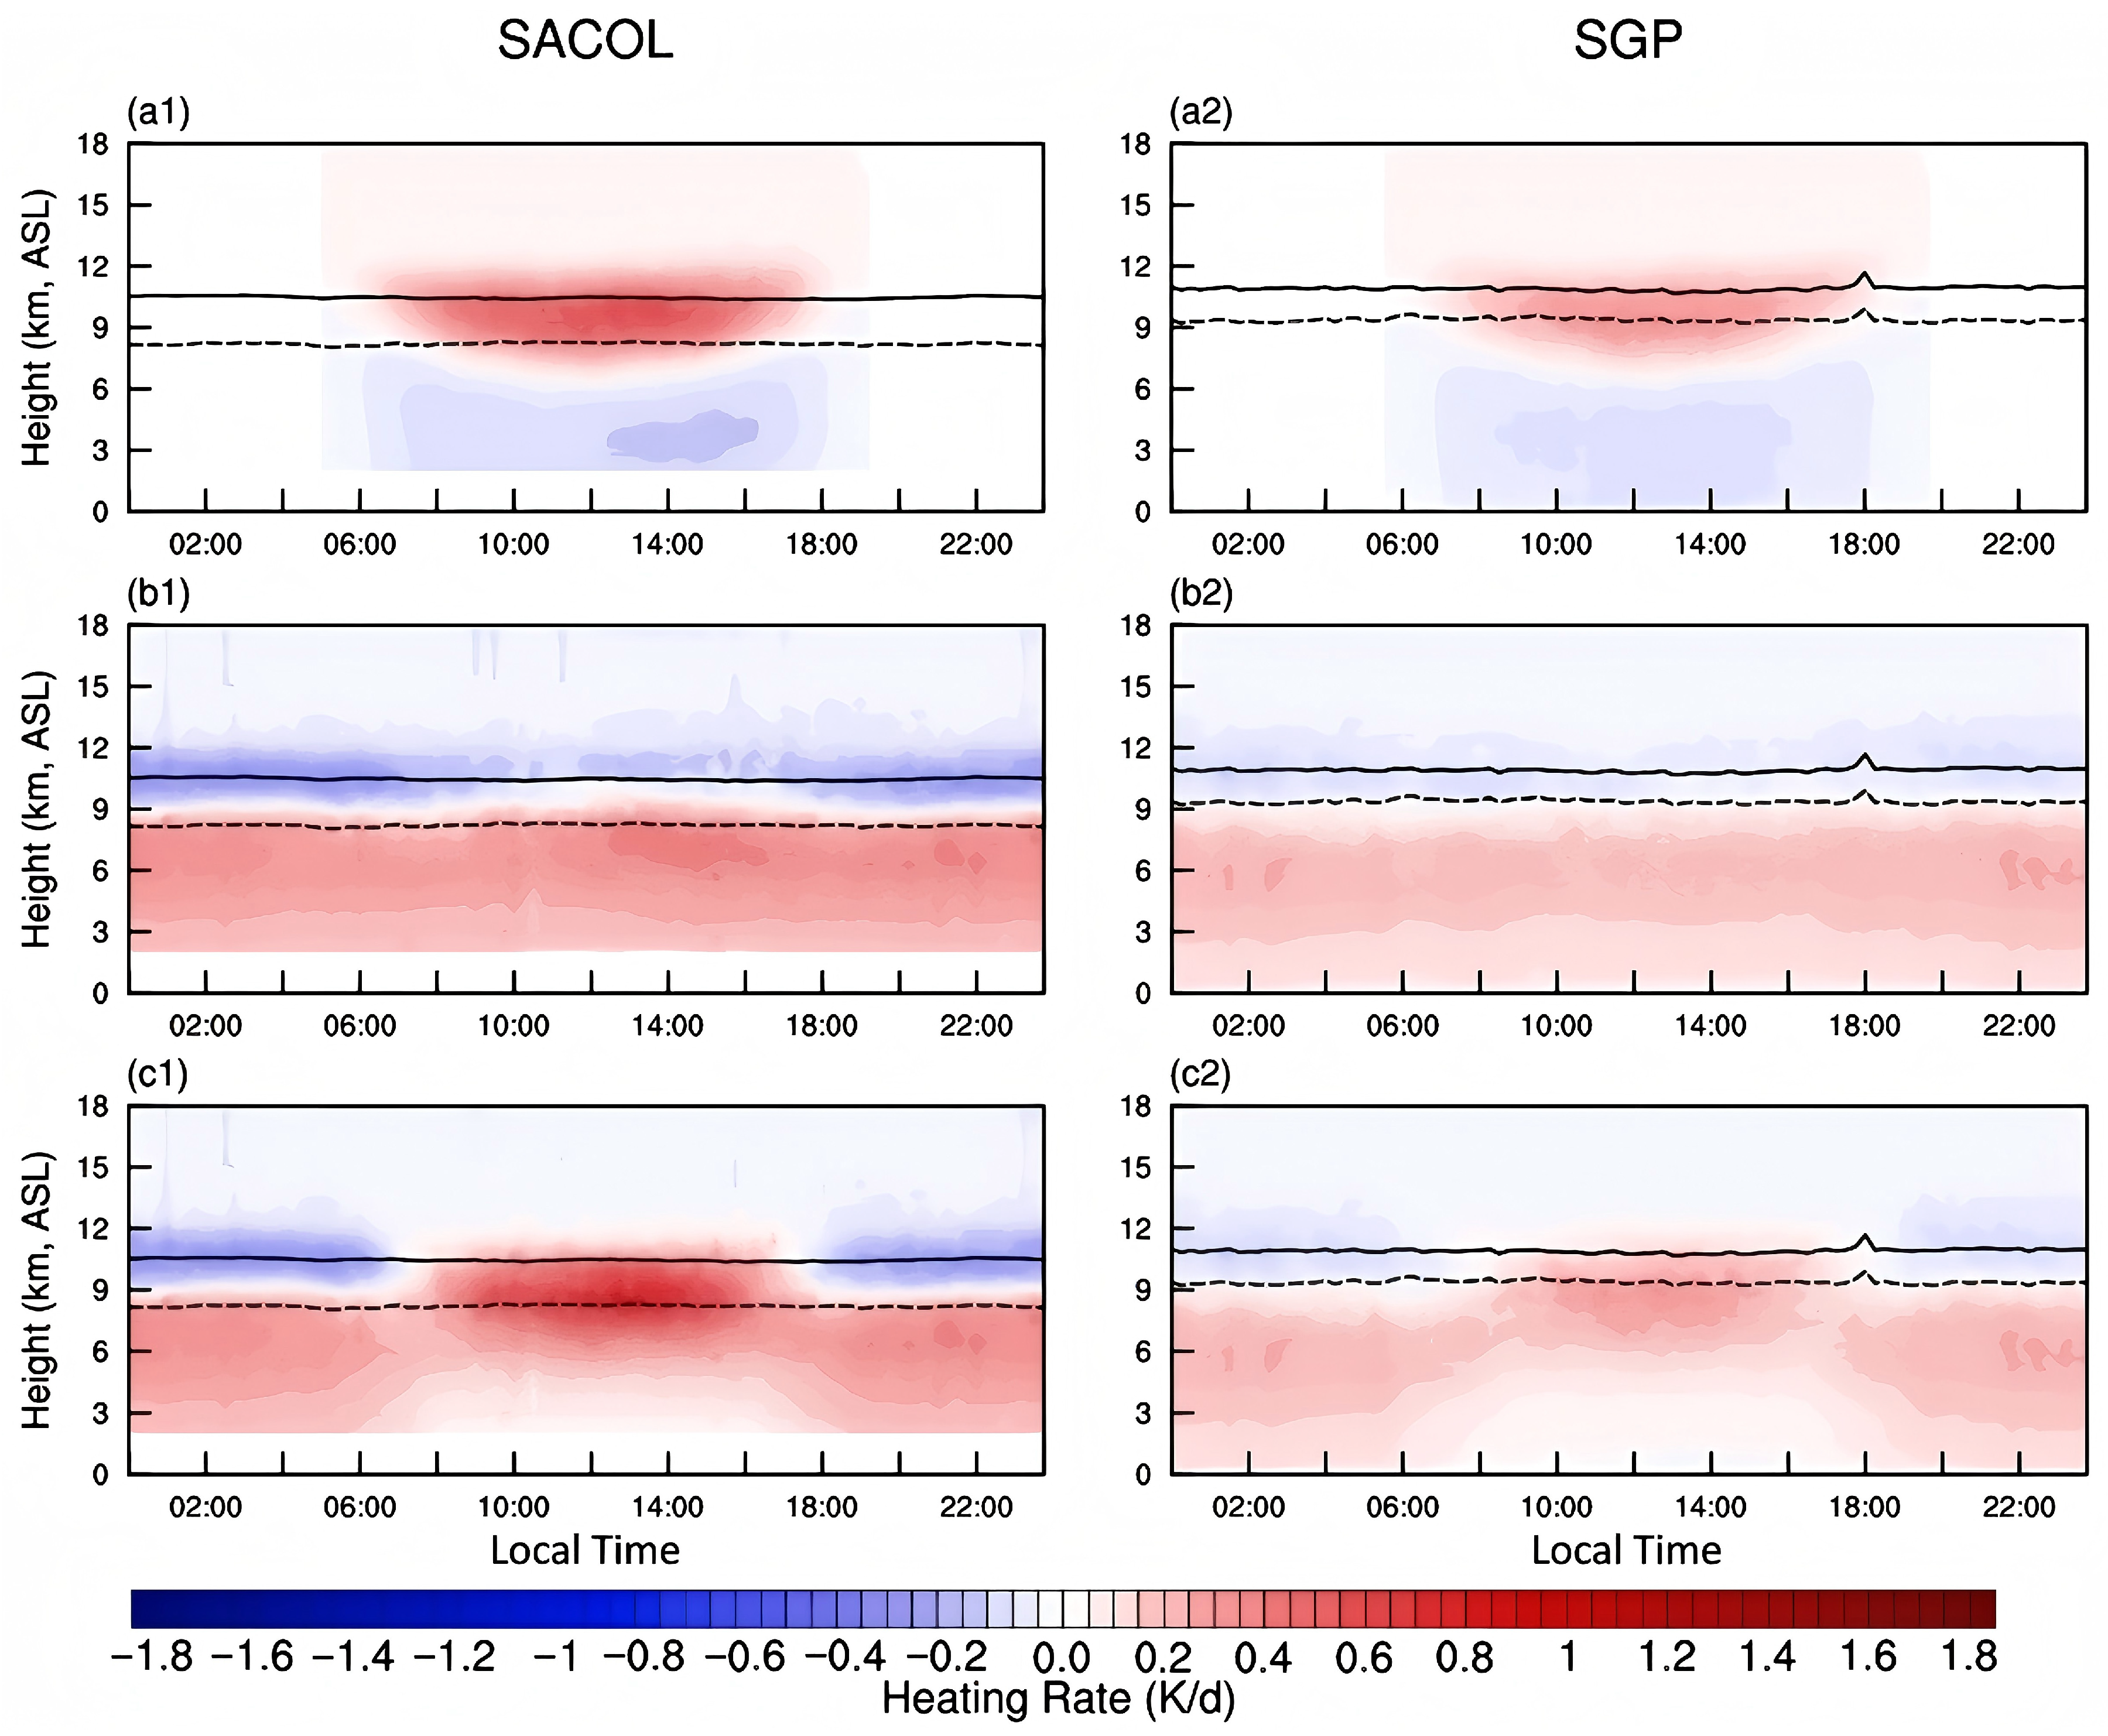
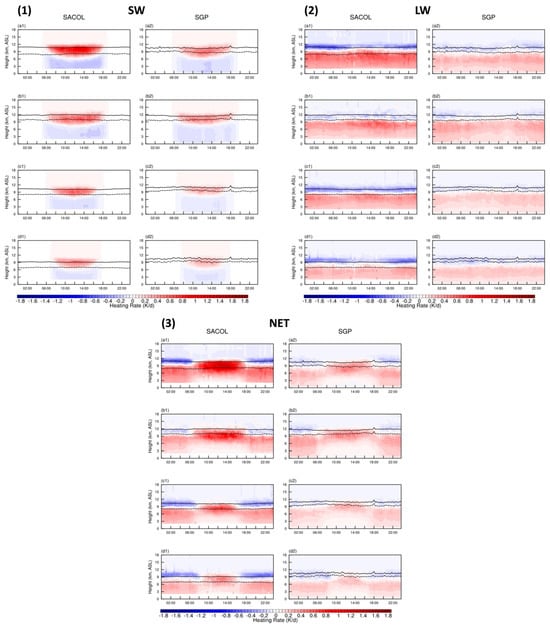
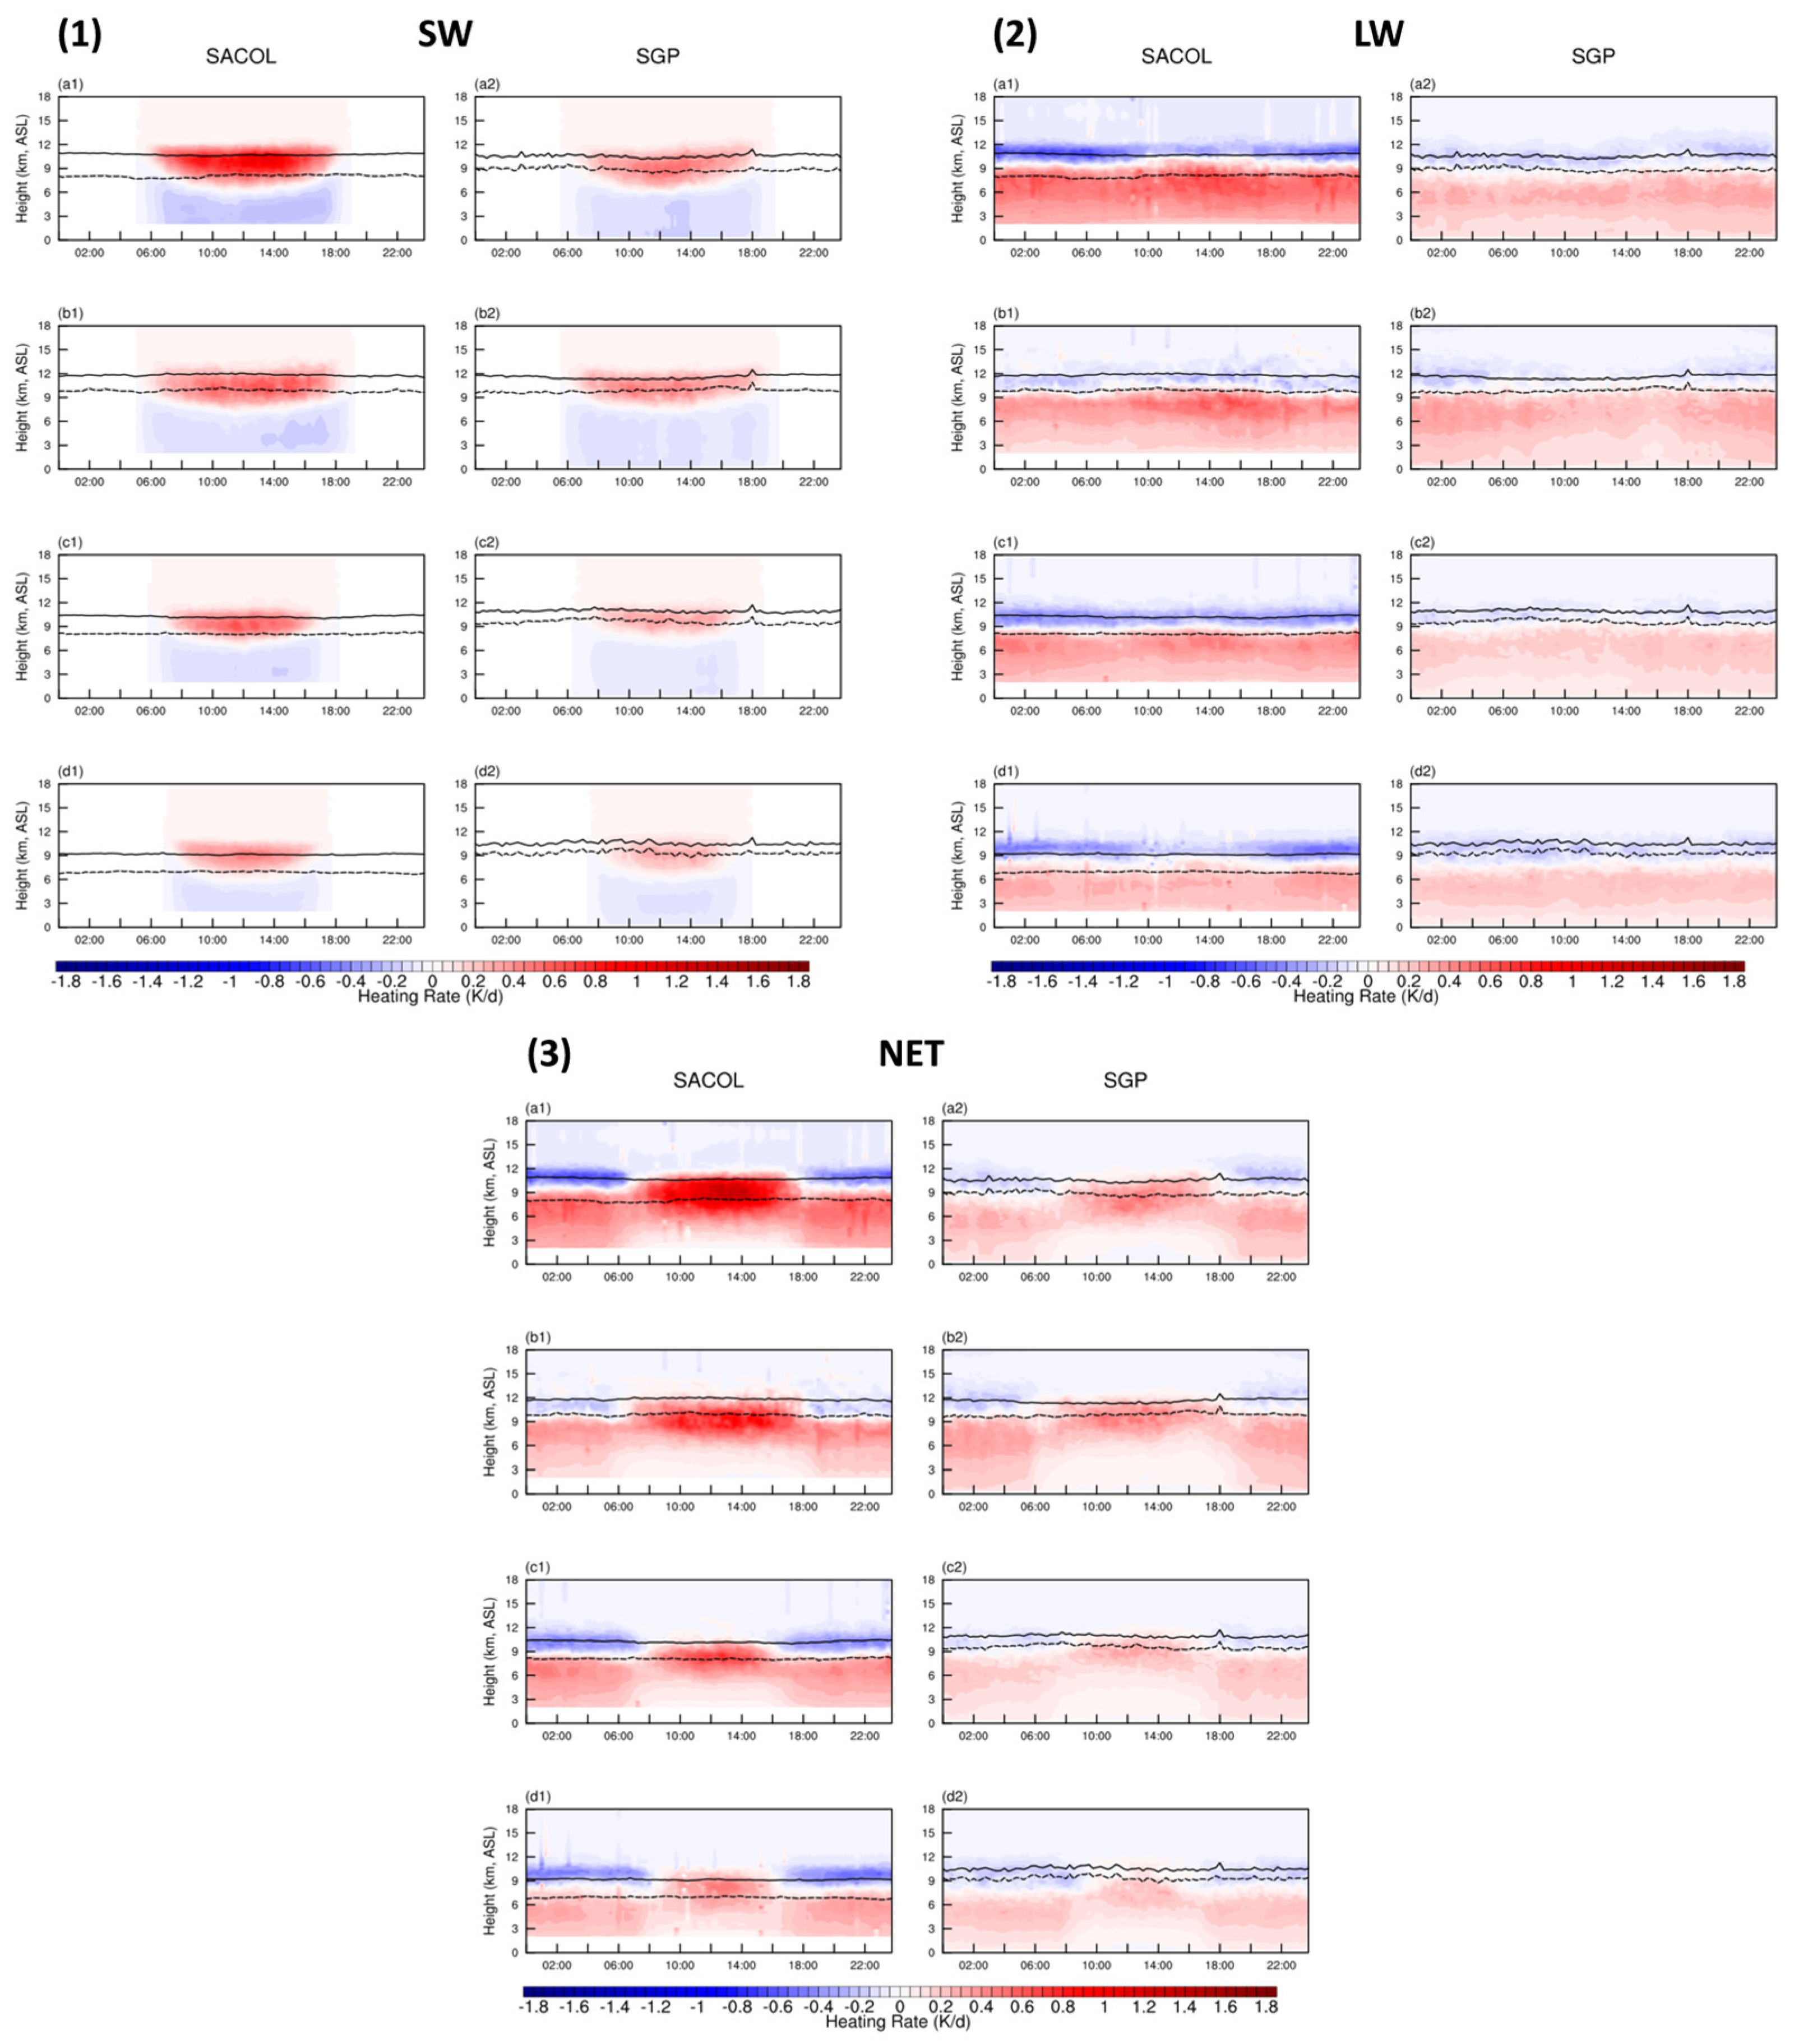
As illustrated by the diurnal variations in atmospheric heating rates in Figure 11, the diurnal variation in heating rates at the SGP site is similar to that at SACOL; however, due to lower cloud occurrence frequency, its impact on atmospheric heating rates is smaller. The net radiative effect of ice clouds at SGP causes nighttime cooling within the cloud and daytime warming that are 50% and 62% smaller, respectively, than those at SACOL. The seasonal diurnal variations, as shown in Figure 12, further demonstrate that differences in ice-cloud-induced heating rate changes between the two sites are closely related to the seasonal occurrence frequency of ice clouds. At two sites, the shortwave radiative effect of ice clouds during daytime heats the cloud layer while cooling the atmosphere beneath it. Simultaneously, throughout the entire day, the longwave radiative effect of ice clouds acts to cool the cloud layer and to warm the underlying atmosphere. Because the shortwave absorption within the cloud layer during daytime substantially exceeds the longwave cooling effect, the net radiative impact within the cloud is warming. In contrast, the atmosphere below the cloud is subject only to longwave warming at night, whereas during daytime the shortwave cooling and longwave warming effects largely offset each other. Consequently, the sub-cloud atmosphere exhibits weak warming during the day but pronounced warming at night. This diurnal contrast highlights the differential vertical redistribution of radiative energy by ice cloud.
Figure 11.
Mean diurnal variations in vertical radiative heating rates due to ice clouds from 2014 to 2019 at (1) the SACOL site and (2) the SGP site: (a) shortwave, (b) longwave, and (c) net heating rates. Solid and dashed lines represent cloud top and cloud base, respectively. Unit: K/day.
Figure 12.
Diurnal variations of (1) shortwave, (2) longwave, and (3) net radiative heating rates of ice clouds in different seasons from 2014 to 2019 at the (a1,b1,c1,d1) SACOL site and the (a2,b2,c2,d2) SGP site: (a) spring, (b) summer, (c) autumn, and (d) winter. Solid and dashed lines represent cloud top and cloud base, respectively. Unit: K/day.
3.2.3. The Contribution of Ice Clouds to the Surface Energy Balance
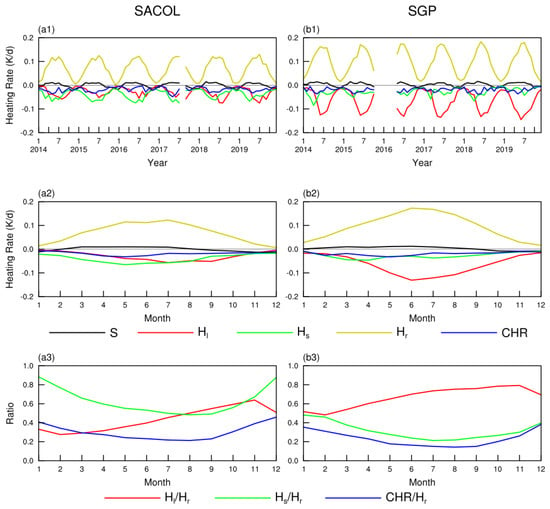
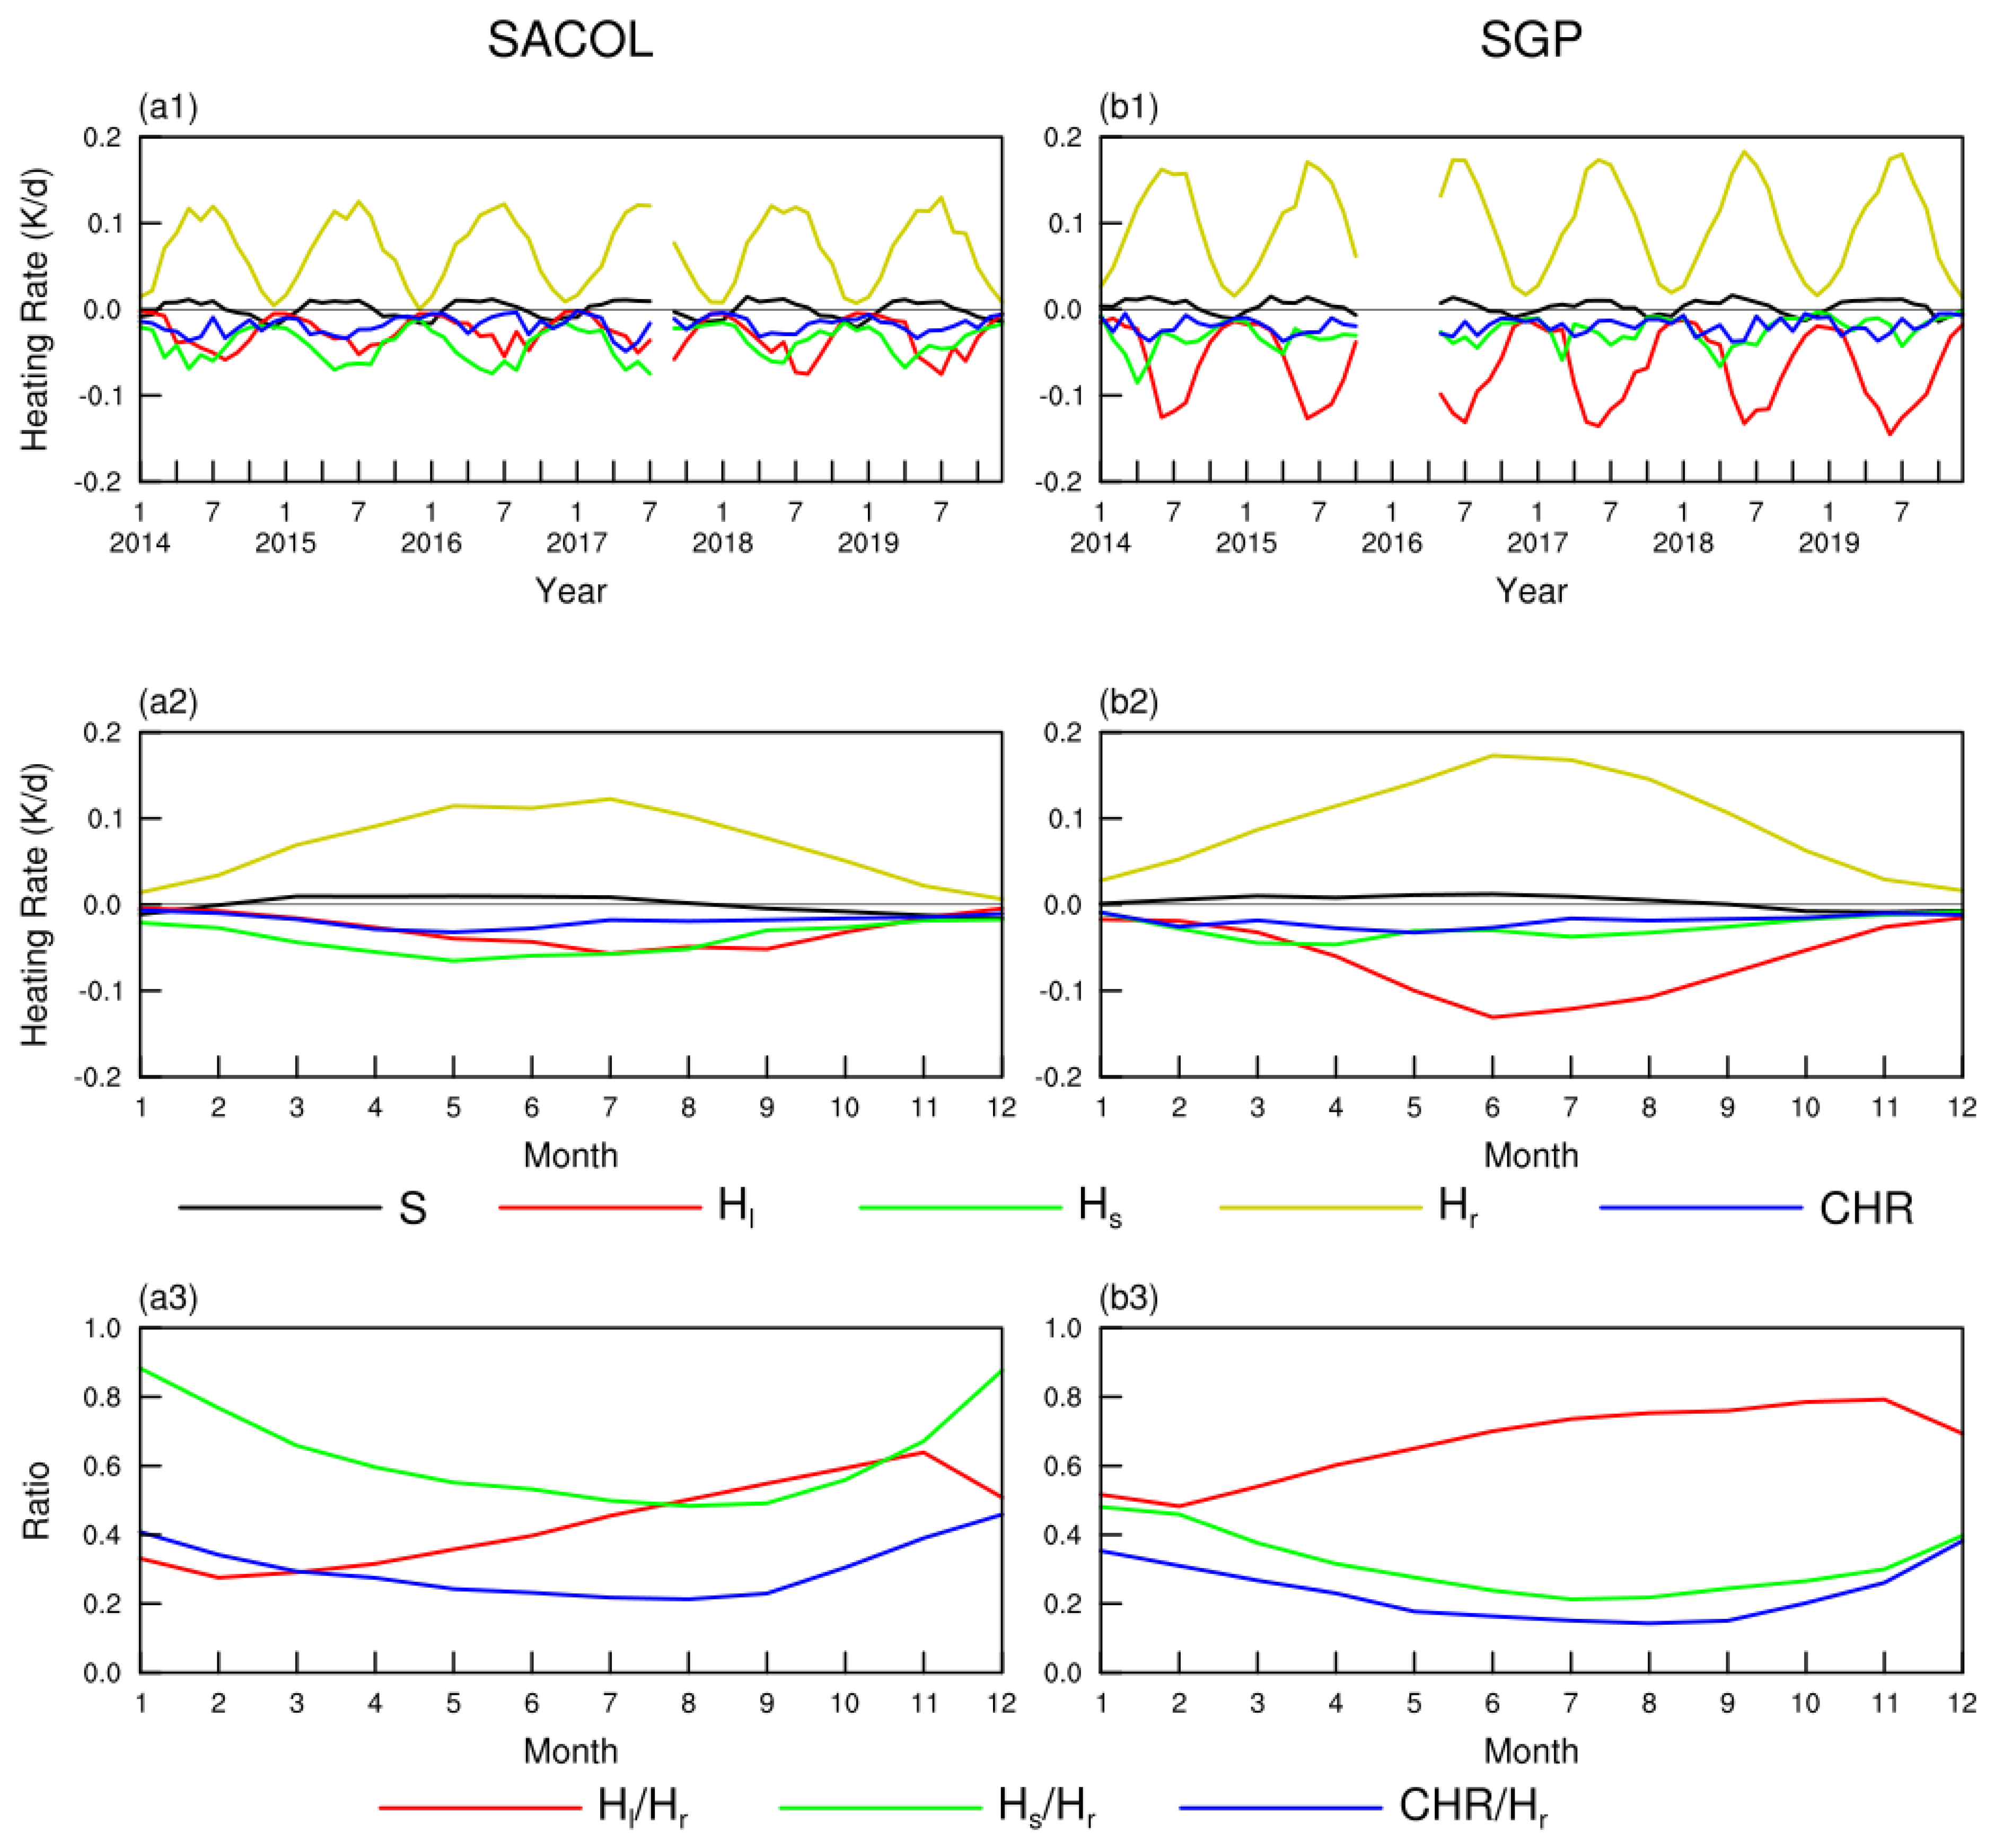
Although energy exchange at the top of the atmosphere is entirely driven by radiative processes, within the Earth system, energy exchange involves multiple mechanisms, with radiative energy transfer being only one component [35]. The surface energy balance consists of turbulent fluxes and net radiative fluxes. The former primarily represents the vertical transfer of energy from the surface to the atmosphere, including sensible heat flux and latent heat flux. The latter consists of solar and infrared components. Clouds influence the surface energy budget primarily through their modulation of both the shortwave and longwave components of net radiative fluxes. In this study, the net energy flux absorbed by the surface is assumed to be zero, and the standardized heating index was used to investigate the relative contribution of radiative and turbulent energy transfer to the surface energy budget (Detailed in Section 2.7). Figure 13 shows the interannual variations in net heating rate (S), net radiation (Hr), sensible heat (Hs), latent heat (Hl), and cloud radiative heating rate (CRH). Consistent with the surface energy balance assumption adopted in this study, the net standardized heating rate (S) remains close to zero at both sites. At SACOL, the contribution of sensible heat to surface heating exceeds 63% annually, whereas at SGP it is only 32%. Conversely, the standardized latent heating rate at SGP is significantly higher, approximately 67% annually. In summer, this value can reach −0.131 K/day at SGP, compared to only −0.057 K/day at SACOL. This indicates that a larger fraction of surface energy at the SGP site is partitioned into latent heat associated with evaporation rather than into sensible heat transfer. Compared with SGP, SACOL is characterized by stronger sensible heat flux and weaker latent heat flux, which is closely related to semi-arid conditions with limited water vapor availability and sparse vegetation. As a result, surface energy at SACOL is more efficiently transferred to the atmosphere through sensible heating. The presence of ice clouds at SACOL and SGP sites leads to reductions in surface net radiation by 29% and 26%, respectively, thereby reducing the net radiative energy available at the surface and exerting a significant influence on the surface energy budget. In particular, during the cold season, ice clouds contribute to standardized surface radiative cooling rates of −0.032 K/day and −0.036 K/day at SACOL and SGP, respectively, indicating that, within the standardized energy framework, the net radiative energy absorbed at the surface is relatively weak and that the cooling effect of ice clouds plays a more pronounced role in modulating the net radiative forcing.
Figure 13.
Interannual (1) and monthly mean (2) variations in standardized surface latent heat heating rate (Hl), standardized sensible heat heating rate (Hs), standardized net radiative heating rate, and ice cloud radiative heating rate (Hr) at (a) the SACOL site and (b) the SGP site from 2014 to 2019, along with (3) their respective contributions to the surface heat balance (S represents the net heating rate).
4. Discussion and Conclusions
This study systematically analyzed and compared the macrophysical and microphysical properties of ice clouds at the SACOL and SGP sites using nearly six years of continuous, high-temporal-resolution observations from KAZR cloud radars, across interannual, seasonal, and diurnal time scales. The annual mean occurrence frequency of ice cloud at the SACOL is 40%, which is significantly higher than the 27% observed at the SGP site, primarily due to the higher upper-tropospheric humidity over SACOL. During the cold season, ice clouds at both sites tend to occur at lower altitudes with greater thickness, whereas in the warm season, they are located at higher altitudes with thinner layers. Ice water content also exhibits seasonal variation at both sites, being lower in winter and higher in summer. On the diurnal timescale, both sites show distinct diurnal patterns, characterized by higher ice cloud occurrence frequency at night and lower during daytime. The difference between the two sites is more significant in summer, with SGP exhibiting a larger diurnal amplitude than SACOL. A pronounced increase in ice cloud height was detected at both sites, particularly at SGP, where cloud top and base heights rose by 0.36 km and 0.26 km, respectively. The elevation of ice clouds reduces outgoing longwave radiation and thus substantially influences cloud radiative feedback. Under global warming, these changes may potentially enhance positive feedback mechanisms, thereby underscoring the need for further investigation. Additionally, in the study of ice cloud microphysical properties, we found considerable uncertainties remain in the retrieval of microphysical parameters based on empirical formulas, both in terms of result consistency and physical representativeness. Therefore, multi-source data validation and evaluation should be pursued.
Based on the study of ice cloud physical properties at the two sites, we validated the reliability of atmospheric and ice cloud physical parameters in the model through a radiation closure experiment and conducted research on the radiative effects of ice clouds and their contributions to the surface radiation energy budget. Ice clouds at both sites primarily contribute to the longwave warming effect in the Earth–atmosphere system, with annual mean net radiation forcing of 6.08 W/m2 and 3.06 W/m2 at TOA, respectively. Ice clouds retain more energy within the atmosphere to heat the atmosphere, with maximum atmospheric heating rate changes reaching 0.37 K/day and 0.22 K/day, respectively. Conversely, at the surface, the dominant effect is shortwave cooling, with net radiation forcing of −6.76 W/m2 and −8.07 W/m2. On the diurnal scale, shortwave cooling effects dominate during the daytime, resulting in negative net radiation forcing at both the TOA and surface. Within the cloud layer, absorption of shortwave radiation causes warming, while shortwave cooling below the cloud and longwave warming counterbalance each other, weakening the overall warming. At night, only longwave warming operates, leading to positive radiation forcing at both the TOA and surface, with significant warming of the air below the cloud and at the surface. Regarding diurnal variations, most existing studies focus on interannual and seasonal characteristics based on daily averages, paying limited attention to the diurnal variations in ice cloud properties, especially their radiative characteristics. However, our results show that ice cloud radiative effects exhibit significant diurnal variation closely linked to daily changes in cloud occurrence frequency and physical properties. Therefore, assessments of ice cloud radiative effects should fully consider diurnal influences, particularly under global warming scenarios where changes in the day–night characteristics of ice cloud occurrence frequency and properties may further affect the interactions between ice clouds and diurnal shortwave and longwave radiation, inducing diurnal feedbacks. Finally, combining ERA data on sensible and latent heat fluxes, we analyzed the contributions of different energy transfer processes to surface heating at the two sites. At SACOL, limited moisture availability near the surface and sparse vegetation mean that the surface energy received primarily heats the air directly, with sensible heat contributing over 63% annually to surface heating. Conversely, at SGP, abundant moisture results in most surface energy being used for evaporation rather than directly heating the air, with latent heat contributing approximately 67% annually, especially in summer. Ice cloud radiative heating is a significant factor affecting the surface energy balance at both sites; notably, during winter, ice clouds reduce net surface radiation by 29% and 26% annually at SACOL and SGP, respectively. This study elucidates the distribution characteristics of midlatitude ice cloud physical properties across multiple timescales, thereby enhancing understanding of their radiative effects and contribution to the surface energy budget. The findings are expected to provide a scientific basis for validating and improving ice cloud physical parameterizations of ice cloud processes in climate models and accurately assessing cloud–radiation interactions in midlatitude regions.
Author Contributions
Conceptualization, X.D. and J.S.; methodology, X.D., J.S. and W.L.; software, X.D.; validation, W.L., N.P. and J.F.; formal analysis, X.D., J.S. and W.L.; investigation, X.D.; resources, X.D. and J.S.; data curation, X.D. and N.P.; writing—original draft preparation, X.D.; writing—review and editing, J.S.; visualization, X.D.; supervision, J.S.; project administration, J.S.; funding acquisition, J.S. All authors have read and agreed to the published version of the manuscript.
Funding
This research was supported by the National Natural Science Foundation of China (42475079 and 41430425), and Natural Science Foundation of Gansu Province (24JRRA401).
Data Availability Statement
The SACOL KAZR data is from https://keylab.lzu.edu.cn (accessed on 1 March 2026). The SGP KAZR data is available at https://adc.arm.gov/discovery (accessed on 1 March 2026). The CERES data is accessible from https://ceres.larc.nasa.gov/data (accessed on 1 March 2026). The ERA5 data can be obtained from https://apps.ecmwf.int/data-catalogues/era5 (accessed on 1 March 2026).
Acknowledgments
We gratefully acknowledge the SACOL, SGP, CERES and ERA5 science teams for providing excellent data products that made this research possible.
Conflicts of Interest
The authors declare no conflicts of interest.
References
- Heymsfield, A.J.; Protat, A.; Bouniol, D.; Austin, R.T.; Hogan, R.J.; Delanoë, J.; Okamoto, H.; Sato, K.; van Zadelhoff, G.-J.; Donovan, D.P.; et al. Testing IWC Retrieval Methods Using Radar and Ancillary Measurements with In Situ Data. J. Appl. Meteor. Climatol. 2008, 47, 135–163. [Google Scholar] [CrossRef] [Scilit]
- Liou, K.-N. Influence of Cirrus Clouds on Weather and Climate Processes: A Global Perspective. Mon. Weather Rev. 1986, 114, 1167–1199. [Google Scholar] [CrossRef] [Scilit]
- Lolli, S.; Dolinar, E.; Lewis, J.R.; Campbell, J.R.; Stewart, S.A.; Belcher, L.R.; Welton, E.J. Two Decades Analysis of Cirrus Cloud Radiative Effects by LiDAR Observations in the Frame of NASA MPLNET LiDAR Network. In Proceedings of the 30th International Laser Radar Conference; Sullivan, J.T., Leblanc, T., Tucker, S., Demoz, B., Eloranta, E., Hostetler, C., Ishii, S., Mona, L., Moshary, F., Papayannis, A., et al., Eds.; Springer International Publishing: Cham, Switzerland, 2023; pp. 333–338. [Google Scholar] [CrossRef] [Scilit]
- Lee, J.; Yang, P.; Dessler, A.E.; Gao, B.-C.; Platnick, S. Distribution and Radiative Forcing of Tropical Thin Cirrus Clouds. J. Atmos. Sci. 2009, 66, 3721–3731. [Google Scholar] [CrossRef] [Scilit]
- Hartmann, D.L.; Ockert-Bell, M.E.; Michelsen, M.L. The Effect of Cloud Type on Earth’s Energy Balance: Global Analysis. J. Clim. 1992, 5, 1281–1304. [Google Scholar] [CrossRef] [Scilit]
- Dupont, J.-C.; Haeffelin, M. Observed Instantaneous Cirrus Radiative Effect on Surface-Level Shortwave and Longwave Irradiances. J. Geophys. Res. Atmos. 2008, 113, D21202. [Google Scholar] [CrossRef] [Scilit]
- Chen, T.; Rossow, W.B.; Zhang, Y. Radiative Effects of Cloud-Type Variations. J. Clim. 2000, 13, 264–286. [Google Scholar] [CrossRef] [Scilit]
- Matus, A.V.; L’Ecuyer, T.S. The Role of Cloud Phase in Earth’s Radiation Budget. J. Geophys. Res. Atmos. 2017, 122, 2559–2578. [Google Scholar] [CrossRef] [Scilit]
- Fu, Q.; Smith, M.; Yang, Q. The Impact of Cloud Radiative Effects on the Tropical Tropopause Layer Temperatures. Atmosphere 2018, 9, 377. [Google Scholar] [CrossRef] [Scilit]
- Sassen, K.; Wang, Z.; Liu, D. Global Distribution of Cirrus Clouds from CloudSat/Cloud-Aerosol Lidar and Infrared Pathfinder Satellite Observations (CALIPSO) Measurements. J. Geophys. Res. Atmos. 2008, 113, D00A12. [Google Scholar] [CrossRef] [Scilit]
- Hong, Y.; Liu, G. The Characteristics of Ice Cloud Properties Derived from CloudSat and CALIPSO Measurements. J. Clim. 2015, 28, 3880–3901. [Google Scholar] [CrossRef] [Scilit]
- Waliser, D.E.; Li, J.-L.F.; Woods, C.P.; Austin, R.T.; Bacmeister, J.; Chern, J.; Genio, A.D.; Jiang, J.H.; Kuang, Z.; Meng, H.; et al. Cloud Ice: A Climate Model Challenge with Signs and Expectations of Progress. J. Geophys. Res. Atmos. 2009, 114, D00A21. [Google Scholar] [CrossRef] [Scilit]
- De La Torre Castro, E.; Jurkat-Witschas, T.; Afchine, A.; Grewe, V.; Hahn, V.; Kirschler, S.; Krämer, M.; Lucke, J.; Spelten, N.; Wernli, H.; et al. Differences in Microphysical Properties of Cirrus at High and Mid-Latitudes. Atmos. Chem. Phys. 2023, 23, 13167–13189. [Google Scholar] [CrossRef] [Scilit]
- Krämer, M.; Rolf, C.; Spelten, N.; Afchine, A.; Fahey, D.; Jensen, E.; Khaykin, S.; Kuhn, T.; Lawson, P.; Lykov, A.; et al. A Microphysics Guide to Cirrus—Part 2: Climatologies of Clouds and Humidity from Observations. Atmos. Chem. Phys. 2020, 20, 12569–12608. [Google Scholar] [CrossRef] [Scilit]
- Feofilov, A.G.; Stubenrauch, C.J. Diurnal Variation of High-Level Clouds from the Synergy of AIRS and IASI Space-Borne Infrared Sounders. Atmos. Chem. Phys. 2019, 19, 13957–13972. [Google Scholar] [CrossRef] [Scilit]
- Zhao, F.; Tang, C.; Tian, X.; Wu, X.; Dai, C.; Wei, H. The Global Spatial and Temporal Distribution of Ice Cloud Optical Thickness Based on MODIS Satellite Data during 2000–2021. Atmosphere 2023, 14, 977. [Google Scholar] [CrossRef] [Scilit]
- Gouveia, D.A.; Barja, B.; Barbosa, H.M.J.; Seifert, P.; Baars, H.; Pauliquevis, T.; Artaxo, P. Optical and Geometrical Properties of Cirrus Clouds in Amazonia Derived from 1 Year of Ground-Based Lidar Measurements. Atmos. Chem. Phys. 2017, 17, 3619–3636. [Google Scholar] [CrossRef] [Scilit]
- Wang, M.; Su, J.; Peng, N.; Xu, Y.; Ge, J. Diurnal Cycle of Cirrus Cloud and Its Associated Radiative Effects at the SACOL Site. Atmos. Res. 2022, 265, 105887. [Google Scholar] [CrossRef] [Scilit]
- Pincus, R.; Platnick, S.; Ackerman, S.A.; Hemler, R.S.; Hofmann, R.J.P. Reconciling Simulated and Observed Views of Clouds: MODIS, ISCCP, and the Limits of Instrument Simulators. J. Clim. 2012, 25, 4699–4720. [Google Scholar] [CrossRef] [Scilit]
- Xu, H.; Guo, J.; Tong, B.; Zhang, J.; Chen, T.; Guo, X.; Zhang, J.; Chen, W. Characterizing the Near-Global Cloud Vertical Structures over Land Using High-Resolution Radiosonde Measurements. Atmos. Chem. Phys. 2023, 23, 15011–15038. [Google Scholar] [CrossRef] [Scilit]
- Wang, M.; Balmes, K.A.; Thorsen, T.J.; Willick, D.; Fu, Q. An Investigation of the Ice Cloud Detection Sensitivity of Cloud Radars Using the Raman Lidar at the ARM SGP Site. Remote Sens. 2022, 14, 3466. [Google Scholar] [CrossRef] [Scilit]
- Seo, E.-K.; Liu, G. Determination of 3D Cloud Ice Water Contents by Combining Multiple Data Sources from Satellite, Ground Radar, and a Numerical Model. J. Appl. Meteor. Climatol. 2006, 45, 1494–1504. [Google Scholar] [CrossRef] [Scilit]
- Hersbach, H.; Dee, D. ERA5 reanalysis is in production. ECMWF Newsl. 2016, 147, 7. Available online: https://www.ecmwf.int/en/newsletter/147/news/era5-reanalysis-production (accessed on 1 March 2026).
- Hersbach, H.; Bell, B.; Berrisford, P.; Hirahara, S.; Horányi, A.; Muñoz-Sabater, J.; Nicolas, J.; Peubey, C.; Radu, R.; Schepers, D.; et al. The ERA5 Global Reanalysis. Q. J. R. Meteorol. Soc. 2020, 146, 1999–2049. [Google Scholar] [CrossRef] [Scilit]
- Fu, Q.; Liou, K.N. On the Correlated K-Distribution Method for Radiative Transfer in Nonhomogeneous Atmospheres. J. Atmos. Sci. 1992, 49, 2139–2156. [Google Scholar] [CrossRef] [Scilit]
- Fu, Q.; Liou, K.N. Parameterization of the Radiative Properties of Cirrus Clouds. J. Atmos. Sci. 1993, 50, 2008–2025. [Google Scholar] [CrossRef] [Scilit]
- Mace, G.G.; Benson, S.; Vernon, E. Cirrus Clouds and the Large-Scale Atmospheric State: Relationships Revealed by Six Years of Ground-Based Data. J. Clim. 2006, 19, 3257–3278. [Google Scholar] [CrossRef] [Scilit]
- Xin, Y.; Su, J.; Li, X.; Hu, X.; Ge, J.; Fu, Q. Retrieval of Ice Cloud Microphysical Properties at the SACOL. Chin. Sci. Bull. 2019, 64, 2728–2740. [Google Scholar] [CrossRef] [Scilit]
- Hogan, R.J.; Mittermaier, M.P.; Illingworth, A.J. The Retrieval of Ice Water Content from Radar Reflectivity Factor and Temperature and Its Use in Evaluating a Mesoscale Model. J. Appl. Meteor. Climatol. 2006, 45, 301–317. [Google Scholar] [CrossRef] [Scilit]
- Fu, Q. An Accurate Parameterization of the Solar Radiative Properties of Cirrus Clouds for Climate Models. J. Clim. 1996, 9, 2058–2082. [Google Scholar] [CrossRef] [Scilit]
- Liu, C.-L.; Illingworth, A.J. Toward More Accurate Retrievals of Ice Water Content from Radar Measurements of Clouds. J. Appl. Meteor. Climatol. 2000, 39, 1130–1146. [Google Scholar] [CrossRef] [Scilit]
- Ivanova, D.; Mitchell, D.L.; Arnott, W.P.; Poellot, M. A GCM Parameterization for Bimodal Size Spectra and Ice Mass Removal Rates in Mid-Latitude Cirrus Clouds. Atmos. Res. 2001, 59–60, 89–113. [Google Scholar] [CrossRef] [Scilit]
- Jensen, M.; Jensen, K. Continuous Profiles of Cloud Microphysical Properties for the Fixed Atmospheric Radiation Measurement Sites; PNNL: Richland, WA, USA, 2006. [Google Scholar] [CrossRef] [Scilit]
- Ramanathan, V.; Cess, R.D.; Harrison, E.F.; Minnis, P.; Barkstrom, B.R.; Ahmad, E.; Hartmann, D. Cloud-Radiative Forcing and Climate: Results from the Earth Radiation Budget Experiment. Science 1989, 243, 57–63. [Google Scholar] [CrossRef] [Scilit] [PubMed]
- Liou, K.N. An Introduction to Atmospheric Radiation; Academic Press: Cambridge, MA, USA, 2002; pp. 1–36. [Google Scholar]
- Rahman, M.M.; Zhang, W. Review on Estimation Methods of the Earth’s Surface Energy Balance Components from Ground and Satellite Measurements. J. Earth Syst. Sci. 2019, 128, 84. [Google Scholar] [CrossRef] [Scilit]
- Chuang, X.Z.S.T. The Observation and Calculation Method of Soil Heat Flux and Its Impact on the Energy Balance Closure. Adv. Earth Sci. 2013, 28, 875. [Google Scholar] [CrossRef]
- Bowen, I.S. The Ratio of Heat Losses by Conduction and by Evaporation from Any Water Surface. Phys. Rev. 1926, 27, 779–787. [Google Scholar] [CrossRef] [Scilit]
- de Bruin, H.A.R. The Energy Balance of the Earth’s Surface: A Practical Approach. Ph.D. Thesis, Wageningen University, Wageningen, The Netherlands, 1982. [Google Scholar] [CrossRef] [Scilit]
- Chen, J.; Xu, J.; Wu, Z.; Meng, X.; Yu, Y.; Ginoux, P.; DeMott, P.J.; Xu, R.; Zhai, L.; Yan, Y.; et al. Decreased Dust Particles Amplify the Cloud Cooling Effect by Regulating Cloud Ice Formation over the Tibetan Plateau. Sci. Adv. 2024, 10, eado0885. [Google Scholar] [CrossRef] [Scilit]
- Parworth, C.; Fast, J.; Mei, F.; Shippert, T.; Sivaraman, C.; Tilp, A.; Watson, T.; Zhang, Q. Long-Term Measurements of Submicrometer Aerosol Chemistry at the Southern Great Plains (SGP) Using an Aerosol Chemical Speciation Monitor (ACSM). Atmos. Environ. 2015, 106, 43–55. [Google Scholar] [CrossRef] [Scilit]
- Boucher, O.; Randall, D.; Artaxo, P.; Bretherton, C.; Feingold, G.; Forster, P.; Kerminen, V.-M.; Kondo, Y.; Liao, H.; Lohmann, U.; et al. Clouds and aerosols. In Climate Change 2013: The Physical Science Basis; Cambridge University Press: Cambridge, UK, 2013; pp. 571–657. [Google Scholar]
- Marvel, K.; Zelinka, M.; Klein, S.A.; Bonfils, C.; Caldwell, P.; Doutriaux, C.; Santer, B.D.; Taylor, K.E. External Influences on Modeled and Observed Cloud Trends. J. Clim. 2015, 28, 4820–4840. [Google Scholar] [CrossRef] [Scilit]
- Thompson, D.W.J.; Bony, S.; Li, Y. Thermodynamic Constraint on the Depth of the Global Tropospheric Circulation. Proc. Natl. Acad. Sci. USA 2017, 114, 8181–8186. [Google Scholar] [CrossRef] [Scilit]
- Raghuraman, S.P.; Medeiros, B.; Gettelman, A. Observational Quantification of Tropical High Cloud Changes and Feedbacks. J. Geophys. Res. Atmos. 2024, 129, e2023JD039364. [Google Scholar] [CrossRef] [Scilit]
- Zhou, T.; Chen, X.; Zuo, M.; Jiang, J. Earth’s Climate Sensitivity: Methods, Climate Feedback Processes, Progresses and Prospects. Quat. Sci. 2023, 43, 604–624. [Google Scholar] [CrossRef]
- Baran, A.J. From the Single-Scattering Properties of Ice Crystals to Climate Prediction: A Way Forward. Atmos. Res. 2012, 112, 45–69. [Google Scholar] [CrossRef] [Scilit]
- Baran, A.J.; Hill, P.; Furtado, K.; Field, P.; Manners, J. A Coupled Cloud Physics–Radiation Parameterization of the Bulk Optical Properties of Cirrus and Its Impact on the Met Office Unified Model Global Atmosphere 5.0 Configuration. J. Clim. 2014, 27, 7725–7752. [Google Scholar] [CrossRef] [Scilit]
- Mitchell, D.L. Final Report for the DOE/ARM Project Titled Representation of the Microphysical and Radiative Properties of Ice Clouds in SCMs and GCMs; DOE/ER/62935-1; Desert Research Institute: Reno, NV, USA, 2005. Available online: https://www.osti.gov/servlets/purl/842226 (accessed on 1 March 2026).
- Li, Y.; Wen, Z. Influence of Tropical Convective Enhancement in Pacific on the Trend of Stratospheric Sudden Warmings in Northern Hemisphere. Clim. Dyn. 2022, 58, 2541–2555. [Google Scholar] [CrossRef] [Scilit]
- Yan, H.; Wang, T. Ten Years of Aerosol Effects on Single-Layer Overcast Clouds over the US Southern Great Plains and the China Loess Plateau. Adv. Meteorol. 2020, 2020, 6719160. [Google Scholar] [CrossRef] [Scilit]
- Ge, J.; Zheng, C.; Xie, H.; Xin, Y.; Huang, J.; Fu, Q. Midlatitude Cirrus Clouds at the SACOL Site: Macrophysical Properties and Large-Scale Atmospheric States. J. Geophys. Res. Atmos. 2018, 123, 2256–2271. [Google Scholar] [CrossRef] [Scilit]
- Zhao, C.; Xie, S.; Chen, X.; Jensen, M.P.; Dunn, M. Quantifying Uncertainties of Cloud Microphysical Property Retrievals with a Perturbation Method. J. Geophys. Res. Atmos. 2014, 119, 5375–5385. [Google Scholar] [CrossRef] [Scilit]

Disclaimer/Publisher’s Note: The statements, opinions and data contained in all publications are solely those of the individual author(s) and contributor(s) and not of MDPI and/or the editor(s). MDPI and/or the editor(s) disclaim responsibility for any injury to people or property resulting from any ideas, methods, instructions or products referred to in the content. |
© 2026 by the authors. Licensee MDPI, Basel, Switzerland. This article is an open access article distributed under the terms and conditions of the Creative Commons Attribution (CC BY) license.