


Highlights
What are the main findings?
- Systematic differences in bending angles from all 12 RO missions are generally consistent below 60 km, while their standard deviations show good consistency below 35 km.
- In the middle stratosphere (35–50 km), MetOp-B/C and Sentinel-6 display the smallest standard deviations. Spire values are 1–2% larger, COSMIC-2 values 5–10% larger, and TerraSAR-X values the largest.
- Compared to ERA5 data, Spire products demonstrate the highest quality control pass rate, followed by MetOp, Sentinel-6, COSMIC-2, TerraSAR-X and KOMPSAT-5.
- Most RO missions show small bending angle biases at high altitudes with values smaller than 0.05 μrad.
- Regarding noises, Sentinel-6 records the smallest bending angle noise (0.87 μrad), whereas TerraSAR-X (2.3 μrad) and KOMPSAT-5 (1.9 μrad) show the largest noise magnitudes.
What are the implications of the main findings?
- RO data from the 12 selected missions are generally consistent below 35 km and can therefore be combined into a benchmark dataset for reliable weather and climate studies at these altitudes.
- In numerical weather prediction, different error models should be applied to these datasets above 35 km.
- Users should be cautious in using GNSS RO data for climate studies above the middle stratosphere.
Abstract
This study evaluates the quality of ionosphere-corrected bending angle products from 12 satellite radio occultation (RO) missions, with data provided by the ROM SAF and CDAAC data centers. The missions include MetOp-B/C, Sentinel-6, Spire, COSMIC-2, KOMPSAT-5, and TerraSAR-X. The assessment focuses on bending angle quality control (QC), bias and noise characteristics at 65–80 km altitude, and statistical errors, with ERA5 data used as the reference. For quality control, Spire products achieved the highest pass rate, exceeding 99%. Products from the two MetOp satellites and Sentinel-6 exhibited pass rates above approximately 90%. The COSMIC-2 series had a pass rate of ~81%, while KOMPSAT-5 and TerraSAR-X had pass rates of 62% and 68%, respectively. Concerning bending angle biases, slightly larger biases were observed in MetOp setting events. Biases from other missions were mostly within the range of 0–0.05 μrad. Regarding noises, Sentinel-6 recorded the smallest bending angle noise (0.87 μrad), whereas TerraSAR-X (2.3 μrad) and KOMPSAT-5 (1.9 μrad) showed the largest noise magnitudes. Systematic differences in bending angles from all 12 RO missions were generally consistent below 60 km, while their standard deviations show good consistency below 35 km. In the middle stratosphere (35–50 km), MetOp-B/C and Sentinel-6 displayed the smallest standard deviations. Spire values are 1–2% larger, COSMIC-2 values 5–10% larger, and TerraSAR-X values the largest. Since ERA5 data also contain inherent uncertainties, particularly above 60 km, the findings of this study can only serve as a preliminary reference for users applying these datasets in weather and climate research. Future work will investigate the detailed causes of discrepancies among different datasets at high altitudes.
1. Introduction
Global Navigation Satellite System (GNSS) radio occultation (RO) is a robust remote satellite sensing technique. This technique places RO receivers on the low-Earth orbit (LEO) satellites to receive GNSS signals [1,2]. As the signals propagate through the atmosphere, they will be bent due to the refractivity gradient. Given the position information of both GNSS and LEO satellites, the accumulated bending angle can be retrieved. Other atmospheric profiles, such as refractivity, temperature, pressure, etc., can then be retrieved. An RO event usually lasts about 1–2 min. According to the relative motion directions between the GNSS and LEO satellites, an RO event can be classified into rising and setting events. If both satellites are moving from the top downward, then the obtained RO event is a setting event, otherwise, it is a rising event.
RO data provide several distinctive advantages, including high accuracy (in the upper troposphere and lower stratosphere), high vertical resolution, all-weather capacity, self-calibration, and long-term stability [3,4]. These advantages can compensate for the limitations of ground-based GNSS and other atmospheric detection technologies [5,6]. Therefore, RO data have been widely used in numerical weather prediction (NWP), climate monitoring, and space weather research [7,8,9,10]. Positive impacts have been demonstrated from these applications. For instance, assimilation of RO data has significantly improved the performance of numerical weather prediction systems [11,12]. Meanwhile, RO data have been proven to be useful in temperature trends detection [13,14], atmospheric boundary identification [15,16], tropopause altitude identification [17,18], sudden stratospheric warming events diagnostics [19,20], and also tropical cyclones tracking [21,22].
The concept of atmospheric profiling using the RO technique was first demonstrated by the Global Positioning System/Meteorology (GPS/MET) mission in 1995 [23,24]. Accurate atmospheric profiles were retrieved in the upper troposphere and lower stratosphere (UTLS) [25,26]. Following this mission, other RO missions were continuously launched. These include the German CHAllenging Mini-Satellite Payload (CHAMP) [27] in 2000, the Argentinian Satélite de Aplicaciones Científicas-C (SAC-C) in 2000 and the German–American Gravity Recovery and Climate Experiment (GRACE) in 2002 [28]. A major advancement occurred in 2006 with the launch of US–Taiwanese Constellation Observing System for Meteorology, Ionosphere, and Climate (COSMIC) mission. This mission is a constellation of six satellites. Therefore, the daily number of RO observations has been significantly increased [29]. The European Meteorological Operational satellite (MetOp) program began in 2008 with the first RO satellite MetOp-A launched in 2008 [30], followed by MetOp-B in 2012 [31] and MetOp-C in 2018 [32].
Other missions equipped with GNSS RO payloads included Germany’s TerraSAR-X launched in 2007 [33] and TerraSAR-X add-on for Digital Elevation Measurement (TanDEM-X) launched in 2010 [34]. In 2013, South Korea launched the Korea Multi-Purpose Satellite-5 (KOMPSAT-5) [35] and China launched Fengyun-3C (FY-3C) RO satellites. The Spanish PAZ was launched in 2018 [36]. Following the success of COSMIC, its follow-on mission, COSMIC-2, was launched in 2019. Deployed in a low-inclination orbit with advanced receivers, COSMIC-2 provides a substantial increase in high-quality RO soundings, particularly enhancing coverage and precision in the tropics [37]. One of the latest notable missions is Sentinel-6, a partnership between European and American agencies, which was launched in 2020 [38].
In addition to these satellites launched by institutional entities, a large number of commercial satellites have also been launched. One of the earliest commercial RO satellites was launched by Spire in 2014. Till now, Spire has launched approximately 60 RO satellites and provides around 20,000 high-quality atmospheric profiles per day [39,40]. PlanetiQ has launched five RO-related satellites (from GNOMES-1 to GNOMES-5) and delivers more than 6600 high-quality neutral atmospheric profiles per day [41]. In addition, GeoOptics operates the Community Initiative for Continuing Earth Radio Occultation (CICERO) constellation [42]. Performance assessments indicate that the constellation initially generated several hundred (≥500) high-quality profiles per day. During subsequent operational trials, its data delivery rate reached approximately 1000–1300 profiles per day, with measurement accuracy comparable to that of COSMIC and MetOp [43]. In recent years, two series of Chinese commercial radio occultation (RO) satellite constellations, Tianmu and Yunyao, have been put into operation. They can provide up to 80,000 and 16,000 atmospheric profiles per day, respectively [44,45]. Collectively, these institutional and commercial satellites have provided unique opportunities for weather and climate research.
The utility of multiple RO data for weather and climate applications requires high consistency among different satellites and data processing centers. Such consistency includes two aspects. First, observations should not be strongly affected by changes in instruments and observation platforms. Second, observations should not be strongly influenced by different processing systems. RO data meets the first aspect well. Owing to the precise time measurements traceable to international time standards, RO data has long-term stability. Data from different RO missions can therefore be combined without additional adjustment in the upper troposphere and lower stratosphere [29,46,47]. Regarding the second aspect, several studies have been conducted to investigate the structural uncertainty of RO data among major data processing centers at that time [48,49]. Results show that all RO variables show low structural uncertainty in the altitude range from 8 km to 25 km.
However, the above evaluations remain insufficient. First, assessments of RO variables above 25 km are lacking. Since both numerical weather prediction (NWP) and certain climate regimes (e.g., sudden stratospheric warming events) require data above 25 km, it is critical to examine the consistency of RO observations from different satellite missions at altitudes above 25 km. Second, most previous evaluations focused on data acquired before 2013, while recent studies have centered on individual RO missions. Consequently, integrated analyses are lacking to characterize the variations among RO missions launched over the past decade and a half.
Given the above context, this study carried out a comparison of 12 recently launched RO missions since 2013, e.g., COSMIC-2 and Spire. The focus altitude range is 10 to 80 km, which covers altitudes from the middle stratosphere upward. The focus variable is ionosphere-corrected bending angle, a key variable in RO data processing obtained by combining bending angles obtained from GPS L1 and L2 signals. This variable is not influenced by background models in the calculation process, like statistical optimization and one-dimensional variational (1dVar) [50,51]. Therefore, its quality is fundamental to understanding the errors and limitations of RO observations from different missions.
The structure of this paper is as follows. Section 2 introduces the data and methodology. Section 3 presents the results, including ionosphere-corrected bending angle quality flags (Section 3.1) and the statistical evaluation of biases and noises. Section 4 provides discussions of the findings. Finally, Section 5 gives the conclusions of this study. It is expected that the outcome of this study will be useful for further utility of recently launched RO data products, especially in the stratosphere.
2. Data and Methodology
2.1. RO Data
In this study, we used RO ionosphere-corrected bending angle observations provided by Radio Occultation Meteorology Satellite Application Facility (ROM SAF) and COSMIC Data Analysis and Archive Center (CDAAC). The ROM SAF data used in this study include MetOp-B, MetOp-C, Sentinel-6, and Spire. The CDAAC data used include COSMIC-2, KOMPSAT-5, and TerraSAR-X. However, we noted that the same types of data for different missions are not always available from these data centers at the same time. Therefore, the MetOp-B and MetOp-C data used are Offline products. The Sentinel-6 data used are Non-Time Critical (NTC) products, and the Spire data used are near-real-time (NRT) products. The COSMIC-2 data used are NRT products. Both the KOMPSAT-5 and TerraSAR-X data used are post-processed (PP) products.
Due to the use of different processing schemes, offline/PP products and NRT products may exhibit some differences above 40 km. This causes the retrieved NRT products to show discrepancies of 1 to several percent larger or smaller relative to ERA5, compared with offline/PP products at altitudes above 40 km [52,53]. This has no influence on our results when analyzing the quality flags of ionosphere-corrected bending angles, as we focus on bending angle profiles that are regarded as outliers. The differences between offline/PP and NRT products only affect the accuracy of the mean profiles that passed quality control. However, these differences can influence the results of biases and noises, which will be taken into account in the subsequent analysis. The data period used is from January to August 2023 during which high vertical resolution (137 layers) ERA5 data are available. Since seasonal variations are beyond the scope of discussion in this study, the selection of temporal period can support our results well.
The RO data that we used are listed in Table 1. The corresponding receivers used and data types are also introduced. The receiver equipped on the MetOp satellite is a GNSS receiver for Atmospheric Sounding (GRAS), which was jointly developed by Saab Ericsson Space (SES) in Gothenburg, Sweden and Austrian Aerospace (AAS) in Vienna, Austria, now RUAG Space. There are four receivers, two for rising and two for setting events per day. For the Sentinel-6 satellites, the RO receivers are TriG, developed in collaboration between the National Aeronautics and Space Administration (NASA) in Washington, D.C., USA, and Jet Propulsion Laboratory (JPL) in Pasadena, California, USA [54]. Spire’s low-Earth multi-use receivers (LEMUR) CubeSats carry the STRATOS GNSS-RO payload, developed by the Spire Global, San Francisco, California, USA. The receiver can collect observations from multiple GNSS constellations, including Global Positioning System (GPS), GLONASS, Galileo, and Quasi-Zenith Satellite System (QZSS), using a zenith precise orbit determination (POD) antenna together with forward- and backward-pointing RO antennas [55,56].
Table 1.
Overview of GNSS RO satellite missions used in this study, including the corresponding GNSS receiver, data center, data type, and differencing method. Regarding the data type, PP denotes post-processed products and NRT denotes near-real time products. Regarding the differencing method, SD denotes single differencing and ZD denotes zero differencing.
COSMIC-2 (FM1-FM6) is equipped with the JPL Tri-GNSS RO System (TGRS), which includes forward/backward precise orbit determination (POD) antennas and forward/backward high-gain RO antennas [57]. In addition, KOMPSAT-5 carries the Atmospheric Occultation and Precision Orbit Determination (AOPOD) instrument developed by the Korea Astronomy and Space Science Institute (KASI) in Daejeon, South Korea [58]. AOPOD is a secondary payload consisting of Integrated GPS Occultation Receiver (IGOR), a spaceborne dual frequency GPS receiver, and the Laser Retro Reflector Array (LRRA). The objective is to provide data for POD and GPS RO measurements. TerraSAR-X carries an IGOR GPS receiver, manufactured by Broad Reach Engineering (BRE), Tempe, Arizona, USA, as a secondary payload for GPS RO measurements. GeoForschungsZentrum Potsdam (GFZ) in Potsdam, Germany, is responsible for the related Tracking, Occultation and Ranging (TOR) experiment [33].
Table 1 shows that zero differencing (ZD) has been applied to most satellite data used in this study, except for Spire, KOMPSAT-5, and TerraSAR-X. If ultra-stable oscillators are used on board the LEO satellite (like on MetOp or COSMIC-2), clock errors are so small that high-quality data can be obtained with zero differencing (ZD), which avoids noise that might be amplified by using single differencing (SD) [59]. For more details and comparisons of both methods see, e.g., Bai et al. [60] and Mannucci et al. [6].
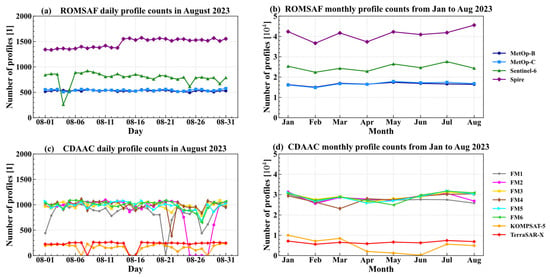
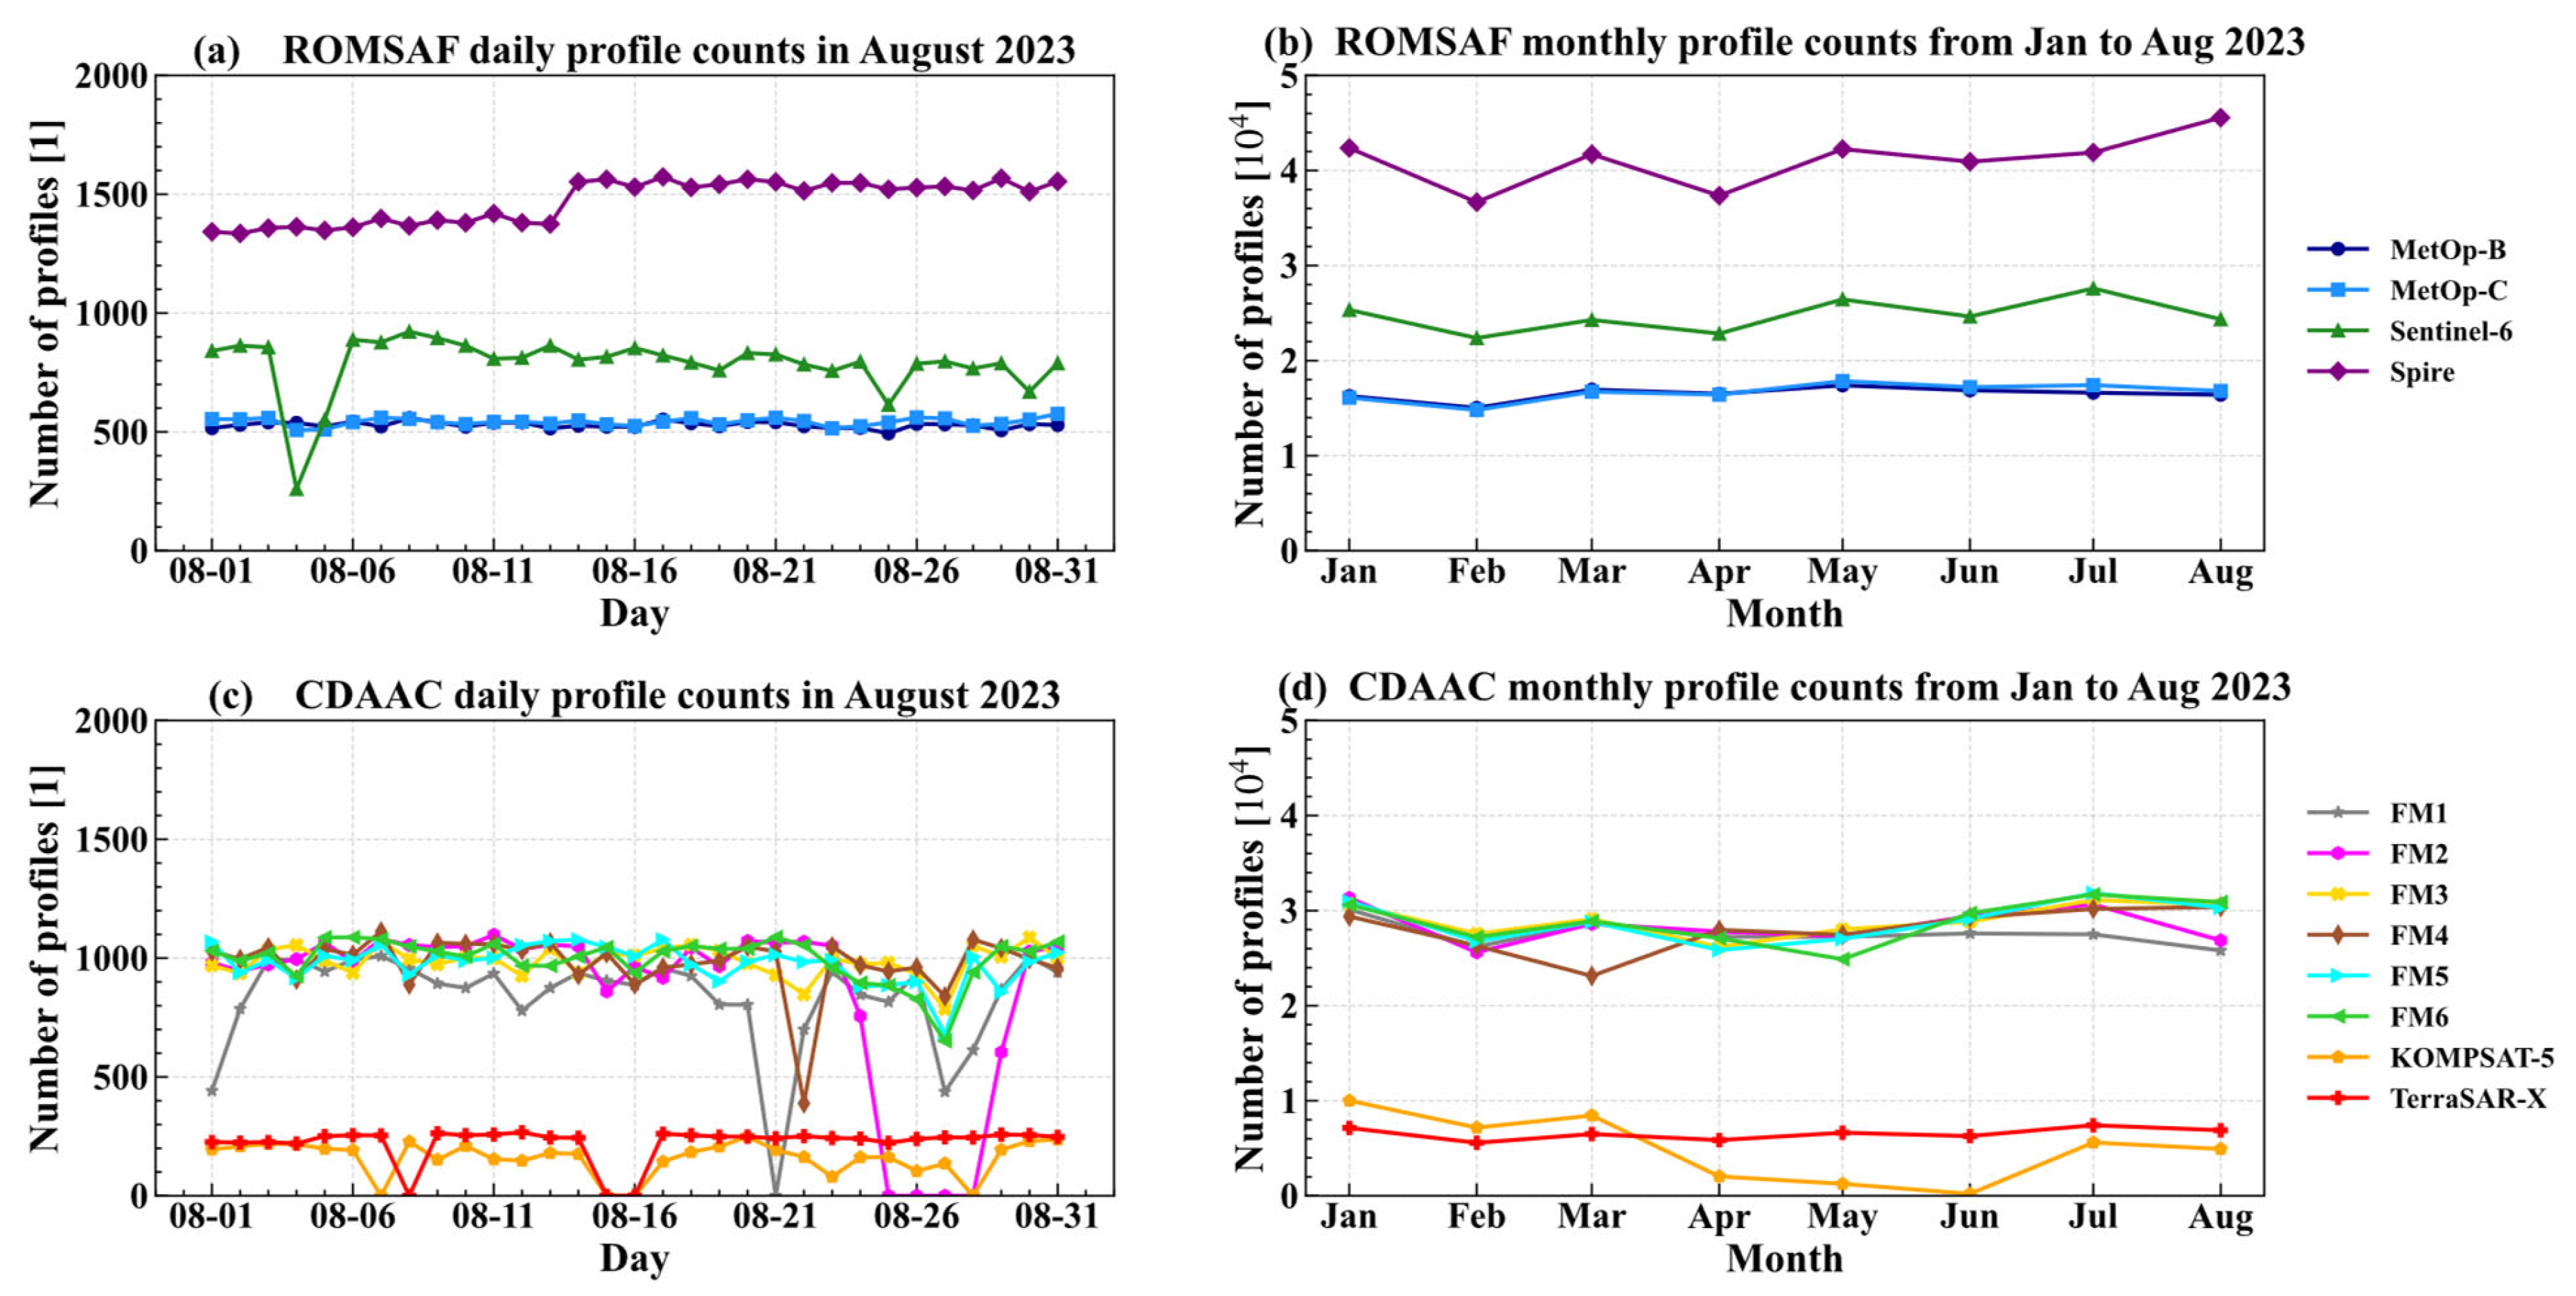
Figure 1 illustrates the number of RO events for the 12 selected missions listed in Table 1. For clarity, the upper two panels show the results from ROM SAF, while the lower two panels present those from CDAAC. The left panels display the daily mean results, and the right panels show the monthly mean results. For ROM SAF data, MetOp RO observations provide stable daily RO profiles of approximately 500 profiles per day. Spire RO observations yield around 1300 profiles per day in early August. Nevertheless, this number increases to 1500 per day from mid-August until the end of the month. For Sentinel-6, the number of profiles varies around 800 for most of the period. However, it exhibits larger daily variations, with a sudden decrease observed on 4 August. Panel (b) shows the monthly mean results for the same four missions. The monthly variation in Spire can reach about 20%, with values ranging from 3.5 × 10⁴ to 4.5 × 10⁴. The number of profiles for Sentinel-6 varies from 2.2 × 10⁴ to 2.8 × 10⁴. MetOp observations show the smallest variations, with values mostly around 1.8 × 10⁴.
Figure 1.
Panel (a,c): Daily number of RO events (one file per RO event) in August 2023 for ROM SAF (a) and CDAAC (c); Panel (b,d): monthly total number of RO events for ROM SAF (b) and CDAAC (d) from January to August 2023.
The lower two panels show the results from CDAAC. For the COSMIC-2 series, the number of RO profiles is mostly around 1000 per day. For KOMPSAT-5 and TerraSAR-X, the number remains mostly around 200 per day. Notably, profiles from FM1, FM2, FM4, KOMPSAT-5, and TerraSAR-X are less stable, and the number of profiles can be zero on some days. Looking at the monthly results, the overall number of each COSMIC-2 satellite varies from about 2.4 × 10⁴ to 3.2 × 10⁴. For KOMPSAT-5, the number of RO events is about 1.0 × 10⁴ for the first three months. However, the number of events decreases significantly in April, May and June, dropping to less than 0.2 × 10⁴, and even reaching zero in June. The monthly number of RO events for TerraSAR-X is about 0.8 × 10⁴.
2.2. ERA5 Data
The European Centre for Medium-Range Weather Forecasts (ECMWF) fifth-generation reanalysis (ERA5) data are also used as reference in this study. The ERA5 is the fifth generation of global weather and climate reanalysis product [61,62], providing high-resolution atmospheric, oceanic, and land variables from 1950 to present. It was produced by ECMWF for the European Copernicus Climate Service (C3S) and replaces the ERA-Interim reanalysis [63], which was discontinued by August 2019. By assimilating worldwide observations with model data through a physically consistent framework, ERA5 provides globally complete and continuous atmospheric fields on regular spatial and temporal grids.
In this study, the ERA5 data used have 137 vertical levels and 2.5° × 2.5° lat/lon horizontal resolution. The ERA5 data are provided at four standard synoptic times each day (00, 06, 12, and 18 UTC). Refractivity and bending angles are forward-simulated from ERA5 temperature. The ERA5 data are downloaded and processed by the Wegener Center for Climate and Global Change (WEGC) at University of Graz, Austria.
2.3. Methodology
The assessments consist of three steps. First, a series of quality control procedures are applied to the ionosphere-corrected bending angles. An analysis is then conducted to examine the quality characteristics of the 12 RO observations. The results from this step help verify the technical performance of the bending angle products from the selected missions, which supports users in developing appropriate quality control strategies for their research applications. Second, bending angle biases and noises are calculated to evaluate the quality of bending angles in the upper atmosphere, where the contribution from the neutral atmosphere is small. Third, systematic differences and standard deviations of the ionosphere-corrected bending angles and refractivity are computed to characterize the discrepancies of these products over the full altitude range from 10 to 80 km.
In the first step, the quality control procedure presented in Li et al. [10] was adopted to assess the quality characteristics of the bending angle products. This quality control scheme was developed based on experience accumulated from numerous existing studies and from the application of Fengyun and MetOp data. These existing studies include the quality control scheme designed by Scherllin-Pirscher et al. [64] for the Bending Angle Radio Occultation Climatology (BAROCLIM) model, the quality control approach used in Angerer et al. [47], and a series of quality control schemes developed by the ROM SAF for its reprocessing system in Syndergaard et al. [65]. The thresholds are empirically determined.
The quality control scheme includes two steps. First, it rejects outliers in different height ranges to avoid their influences at any altitude. In the height range from 50 to 80 km, if absolute differences between RO ionosphere-corrected bending angle and ERA5 bending angle exceed ±40 μrad, then this profile is rejected and assigned a quality flag (QF) of 1 (QF = 1). In the height range from 35 to 50 km, if relative differences exceed thresholds of 100%, then this profile is also rejected (QF = 2). In the height range from 10 to 35 km, if relative differences exceed 20%, then this profile is rejected (QF = 3).
In the second step of the quality control, we reject those RO events with large bending angle biases and noises. Bending angle biases and noises are calculated as the mean systematic differences and standard deviations of ionosphere-corrected bending angle against ERA5 bending angle from the height range of 65 to 80 km (or to the top of a profile) [66,67]. The equations of the bending angle biases and noises are taken from Pirscher [66]:
and the equation of bending angle noise is:
If the RO bending angle bias is larger than its noise, indicating that RO observations suffer from large biases (QF = 4), then this profile is rejected. Furthermore, if RO bending angle noise is larger than 22 μrad, indicating that RO bending angle suffers from large noises, this profile is also rejected (QF = 5). Based on the quality control steps described above, profiles that pass all checks are flagged as high-quality (QF = 0). Additionally, a summary flag (QF = 6) is introduced to mark any profile that fails to meet the high-quality standard (i.e., triggers at least one of the flags QF = 1 to QF = 5). In this paper, we did not adopt the refractivity and temperature quality flags as in Li et al. [10], since we would like to just focus on bending angles.
Based on the quality control, we then carry out a statistical evaluation of these biases and noises at high altitudes. The magnitudes of biases and noises, daily variations, and monthly variations are analyzed. The temporal and spatial variations in these two parameters are also analyzed. Finally, systematic differences and standard deviations of bending angle and refractivity profiles are analyzed and presented.
3. Results
In this section, we first analyze quality control results of bending angles of all the 12 selected missions in Section 3.1. We then examine the biases and noises of these 12 RO missions. Finally, the systematic differences and standard deviation profiles of RO bending angle and refractivity are presented in Section 3.3.
3.1. Bending Angle Quality Control
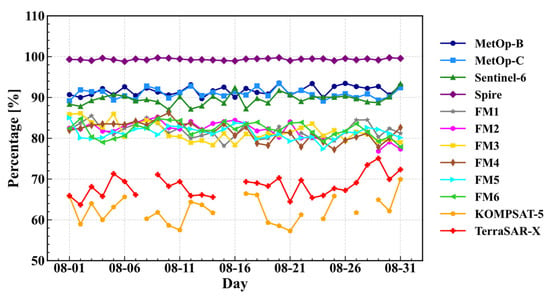
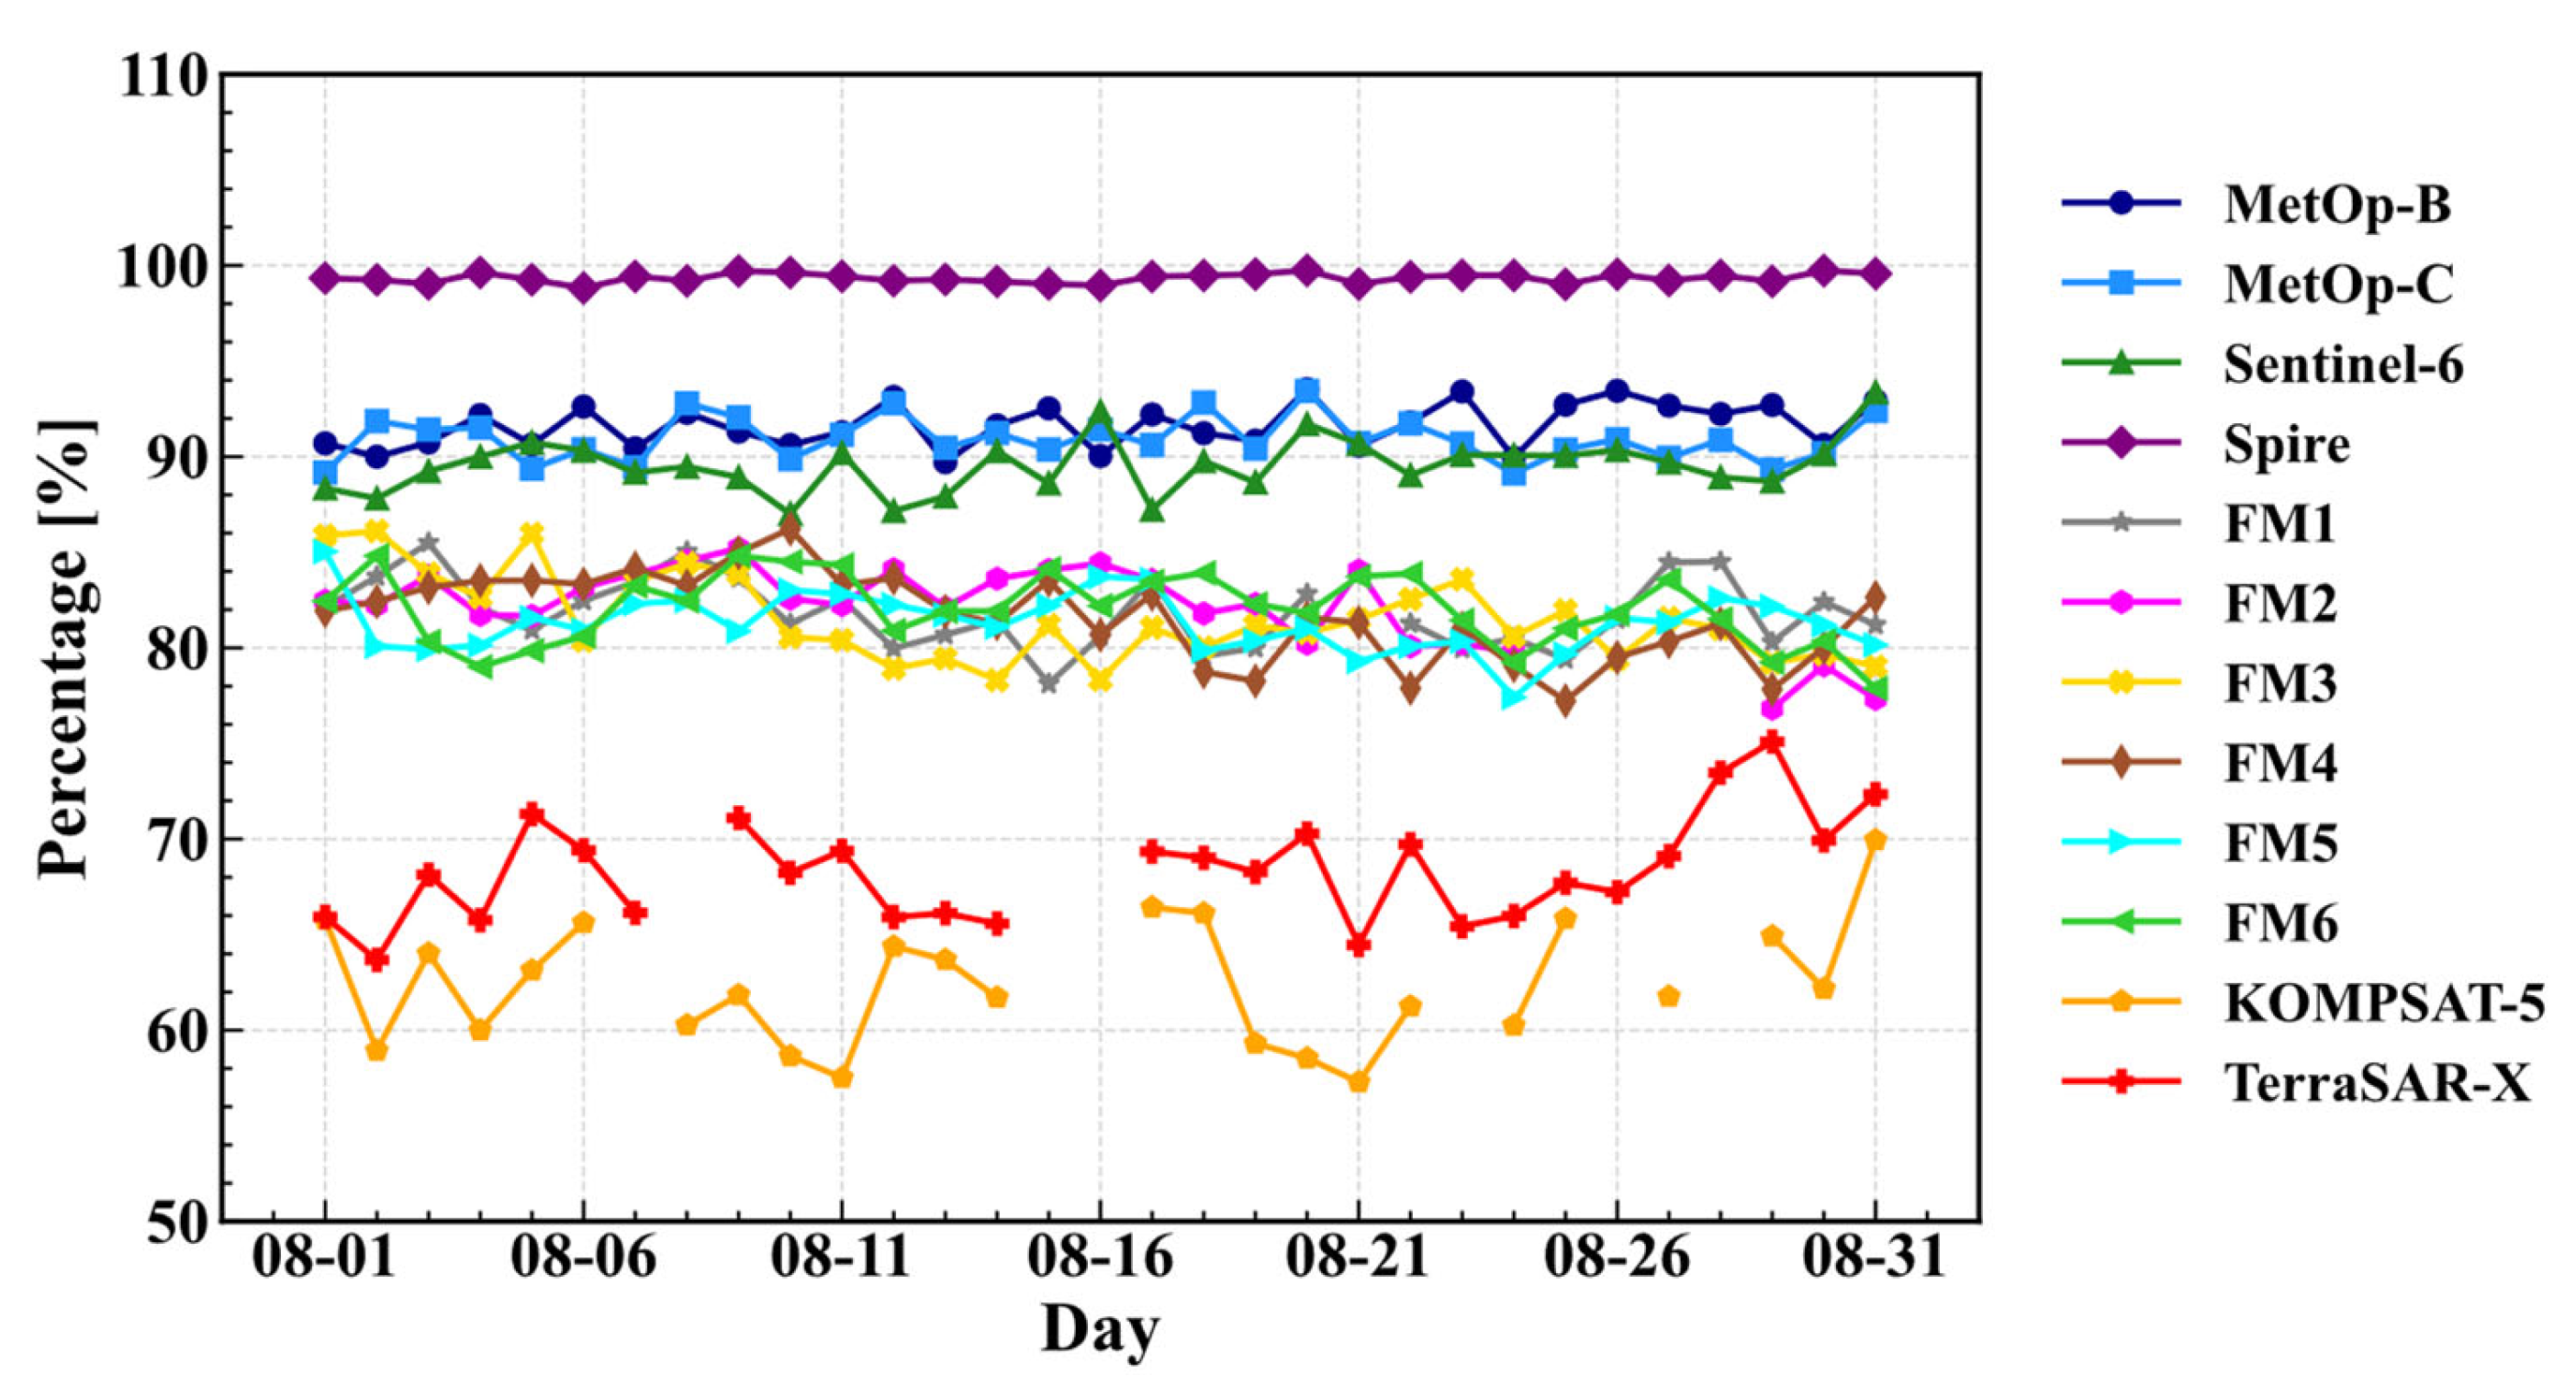
Figure 2 illustrates the temporal evolution of the daily mean percentage of profiles that passed all quality control criteria (QF = 0) during August 2023. Spire achieves the highest data quality passing rate among all products, with valid profiles approaching 99%. The two MetOp satellites and Sentinel-6 rank second, maintaining an overall quality of approximately 90%. The COSMIC-2 series follows, with high-quality profiles accounting for 80% to 85% of the total. In contrast, KOMPSAT-5 exhibits considerable temporal variability, with valid profile percentages fluctuating between 60% and 70%. Daily statistics were not computed for days with fewer than 100 profiles. Therefore, KOMPSAT-5 data are missing on several occasions due to insufficient observational coverage. TerraSAR-X shows a similar pattern of data gaps. On days with adequate sampling, TerraSAR-X exhibits the lowest quality rates, typically ranging from 55% to 65%.
Figure 2.
Temporal evolution of daily mean QF percentage of high-quality (QF = 0) flag for each type of RO observations of August 2023.
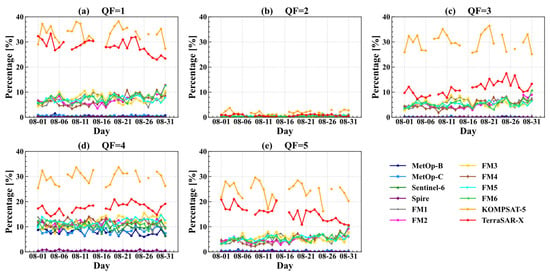
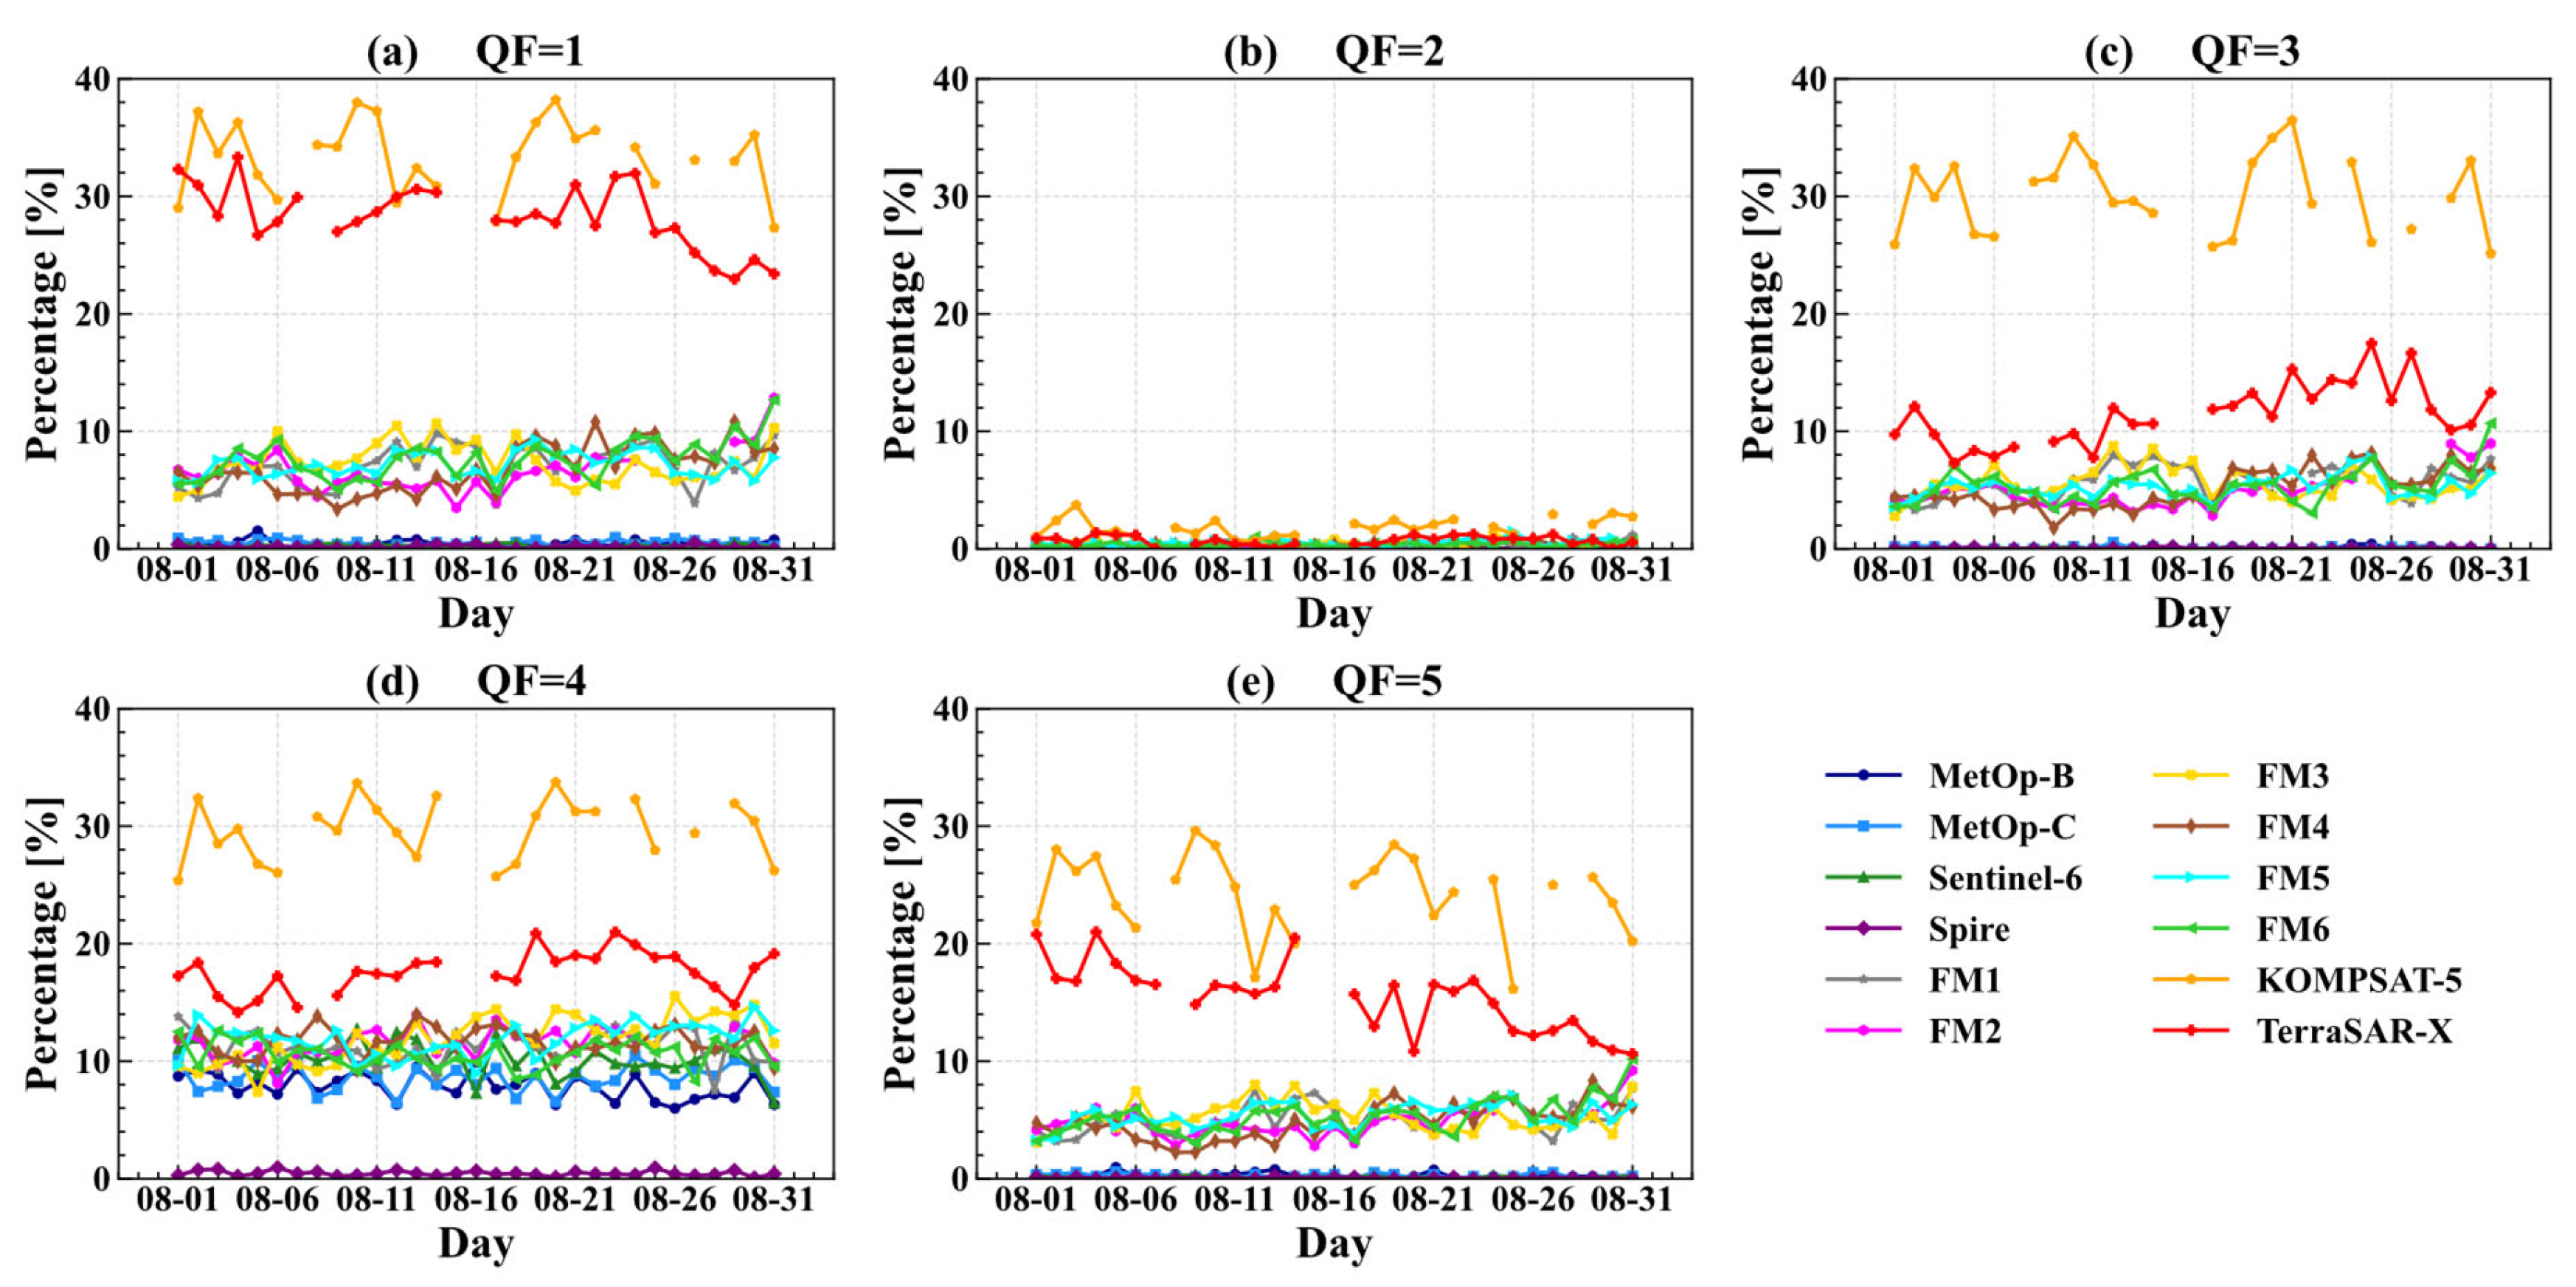
Figure 3 depicts the temporal evolution of bad quality (QF = 1 to QF = 5) percentages. Specifically, for QF = 1, which is designated to flag outliers within the 50–80 km altitude range, KOMPSAT-5 exhibits the highest proportion, ranging from 30% to 40%. It is followed by TerraSAR-X, whose QF = 1 percentages remain stable at around 30% throughout most of the observation period. This finding indicates that these two satellites display greater deviations relative to ERA5. The specific reasons require further investigations. In contrast, the QF = 1 percentages of the four satellites provided by ROM SAF (i.e., MetOp-B, MetOp-C, Sentinel-6, and Spire) are nearly zero, suggesting minimal discrepancies from ERA5 at high altitudes. For the COSMIC-2 satellite series, the QF = 1 percentages are predominantly in the range of 5% to 10%.
Figure 3.
Temporal evolution of daily mean percentage of bad quality flags for each type of RO observations of August 2023.
For QF = 2, all RO observations exhibit low percentages (below 5%), indicating that the selected RO products generally meet our quality control criteria within the 35–50 km height range. For QF = 3, which identifies outliers between 10 and 35 km, KOMPSAT-5 again demonstrates the highest percentages, at approximately 30%—roughly 20% higher than those of other missions. TerraSAR-X ranks second, followed by COSMIC-2, which ranks third. Similarly, the four RO observations provided by ROM SAF show the smallest discrepancies in this height range, with values close to zero.
For QF = 4 and QF = 5, both KOMPSAT-5 and TerraSAR-X still exhibit higher percentages than the other missions. This again suggests that the bending angles of KOMPSAT-5 and TerraSAR-X may be more strongly affected by ionospheric residual errors and other observation errors at high altitudes. Residual ionospheric contributions here are related to E-layer variability, auroral activity, and strong latitudinal total electron content (TEC) gradients [68,69]. Around 30% of KOMPSAT-5 profiles are flagged with QF = 4. TerraSAR-X ranks second, with approximately 15–20% of profiles affected. For the COSMIC-2 series, the percentages range from 5% to 15%. For the two MetOp satellites, the percentages mostly range from 5% to 10%, which are relatively higher than those of the Spire RO observations (close to zero).
Table 2 shows the monthly mean (August) percentages of bad-quality data for all selected missions. Similar to the daily mean results, the percentage of RO observations that passed all quality control checks (QF = 0) is highest for data provided by ROMSAF. The corresponding values for the two MetOp satellites and Sentinel-6 are around 90%. For Spire, the percentage exceeds 99%, while for the COSMIC-2 satellite series, it is approximately 80%. For KOMPSAT-5 and TerraSAR-X, the percentages of observations passing quality control are 62.20% and 68.35%, respectively. For other quality flags, the percentage results are overall consistent with those from the daily analysis. Spire observations exhibit very low percentage values across all five quality flags. For MetOp-B, MetOp-C, and Sentinel-6, all quality flags except QF = 4 (indicating biases larger than noise) are below 1%.
Table 2.
Overview of the monthly mean percentages of high-quality (QF = 0) profiles and bad profiles (QF = 1 to QF = 6) during August 2023 (Units: %).
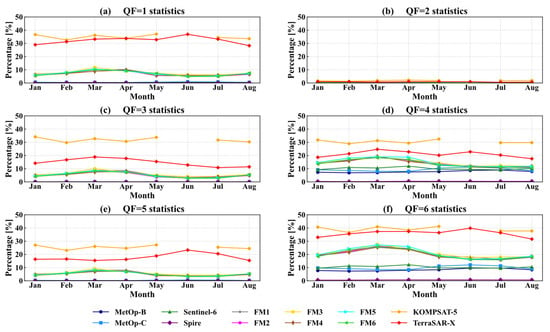
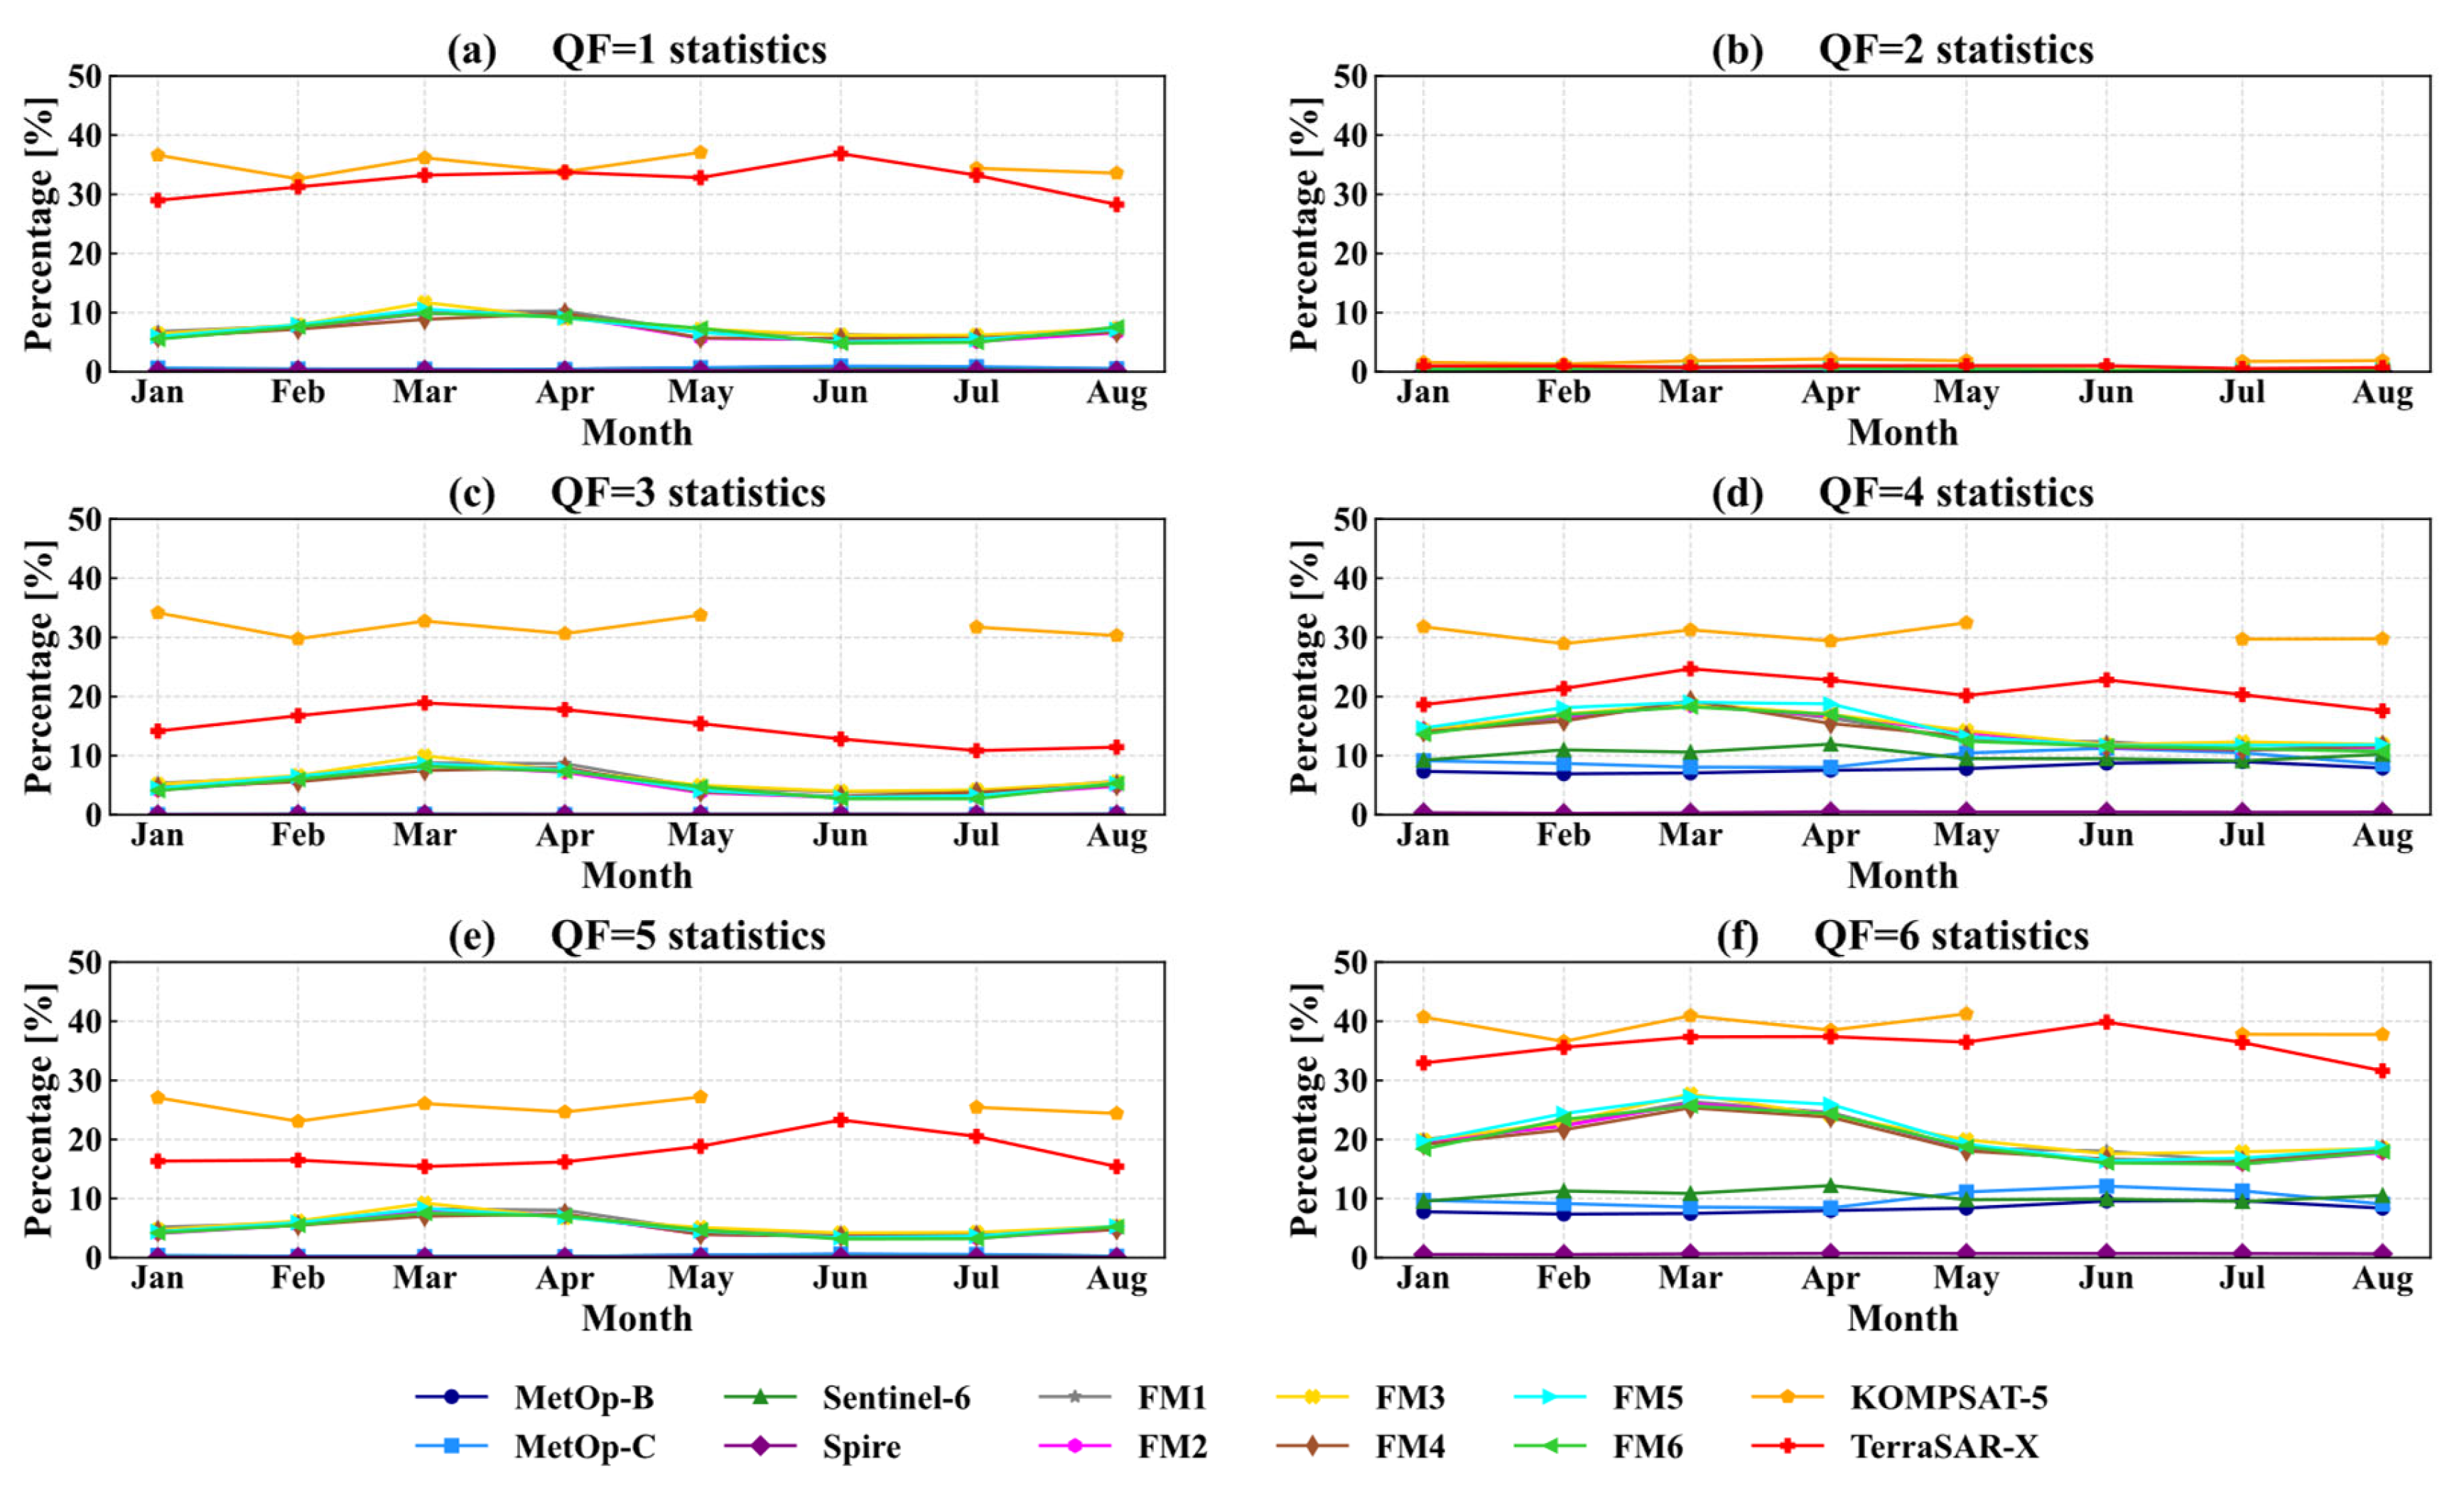
Figure 4 shows the temporal evolution of the monthly mean percentage of bad-quality (QF = 1 to QF = 6) profiles from January to August 2023. Overall, the quality flags for MetOp-B, MetOp-C, Sentinel-6, and Spire remain stable with only small monthly variations. In contrast, those for KOMPSAT-5 and TerraSAR-X display relatively large monthly fluctuations, with values reaching up to 10%, although no distinct regular pattern is observed. For COSMIC-2 observations, monthly variations in quality flags are limited to within 5%. A consistent temporal pattern is found: values are lowest in January, increase gradually to a peak in March and April, decrease steadily until July, and rise again in August. However, longer data records are needed in future studies to further investigate these monthly variations and draw robust conclusions about their monthly and seasonal characteristics.
Figure 4.
Temporal evolution of monthly mean percentage of bad quality flags (from QF = 1 to QF = 6) from January to August 2023.
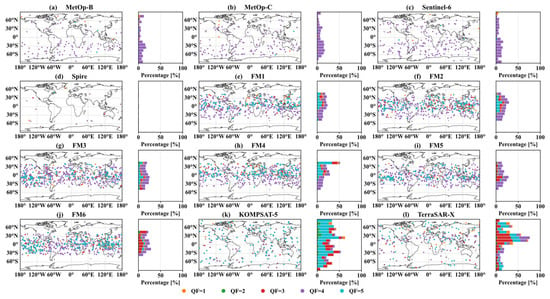
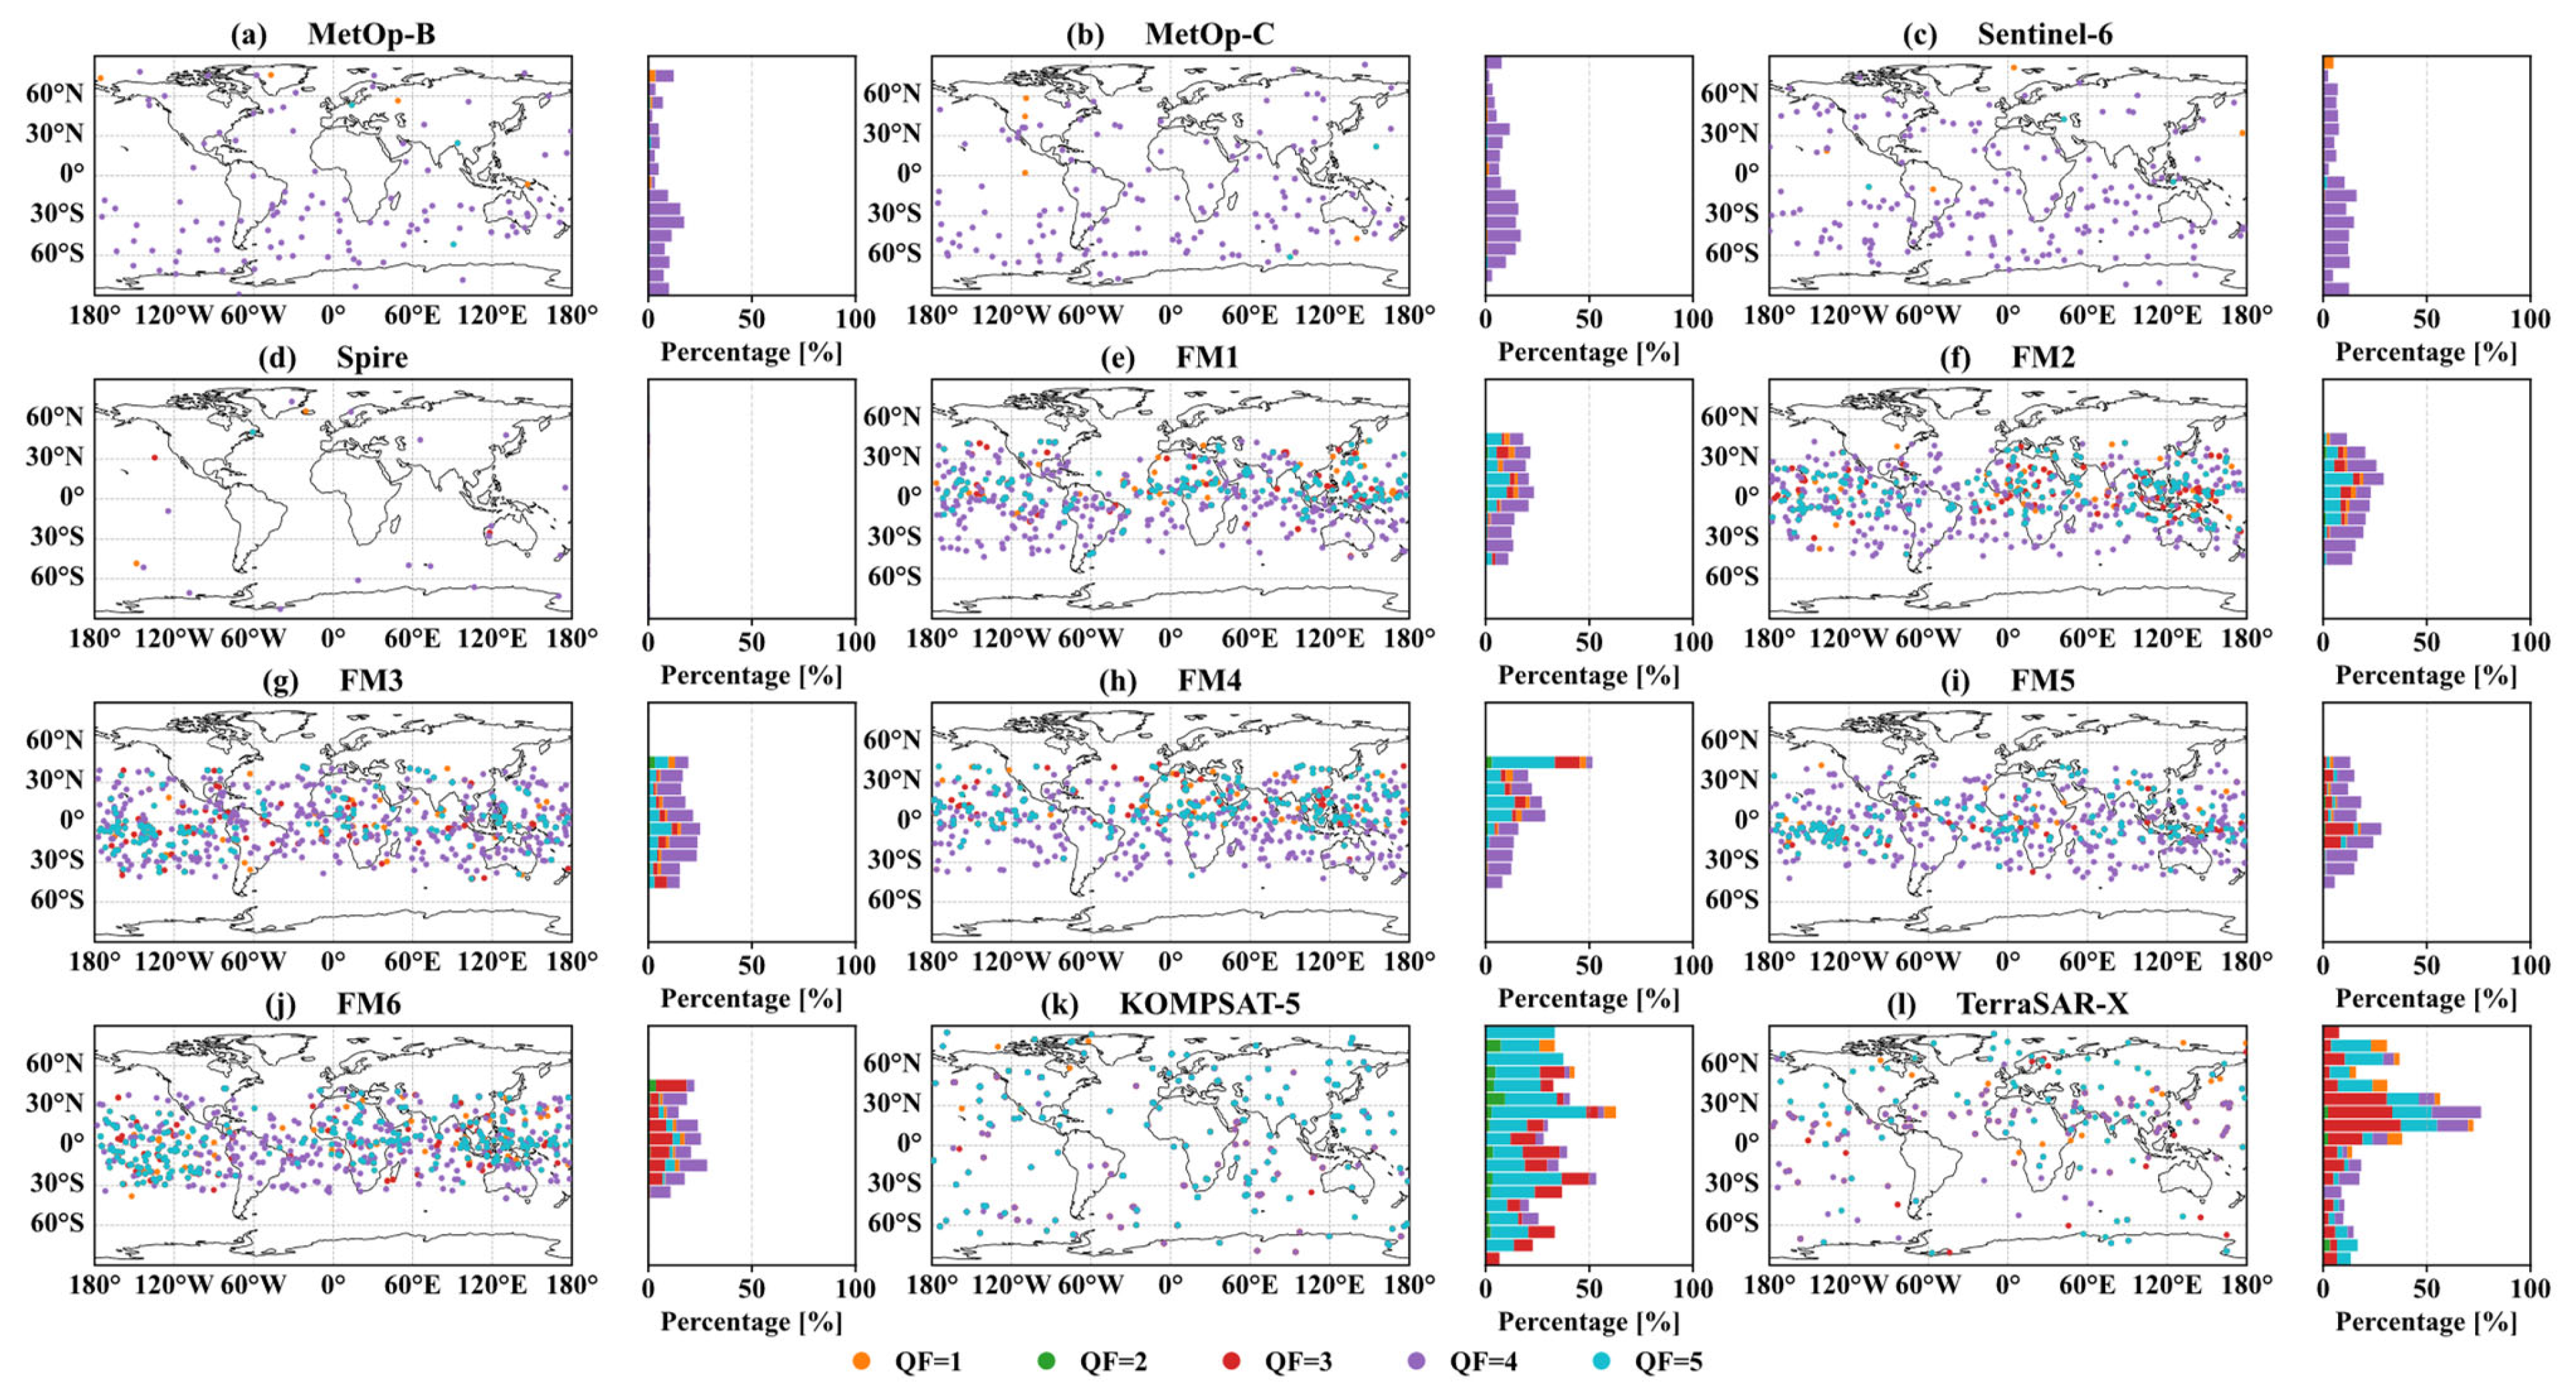
Figure 5 shows the geographical distribution of bad-quality flags, with the percentages of bad-quality profiles relative to the total number of profiles within each 10° latitudinal band also presented. For the two MetOp satellites and Sentinel-6, bad-quality profiles occur mostly in the middle latitudes of the Southern Hemisphere. For the COSMIC-2 series, the highest bad-quality percentages appear in the tropics. For KOMPSAT-5, bad-quality profiles are mostly detected in the Northern Hemisphere and tropics, with more than 30% of profiles affected by quality issues. For TerraSAR-X, bad-quality profiles are concentrated mainly between 0° and 30°N, where the corresponding percentages exceed 60%. This suggests that TerraSAR-X RO observations are more strongly affected by ionospheric residual errors between 0° and 30°N.
Figure 5.
Spatial distribution of RO events with bad quality flags (from QF = 1 to QF = 5) for all selected satellite missions, showing the geographical coverage for three exemplary days (29–31 August 2023) (left subpanels) and the latitudinal distribution over the complete available time range per satellite mission (right subpanels).
3.2. Bending Angle Biases and Noises
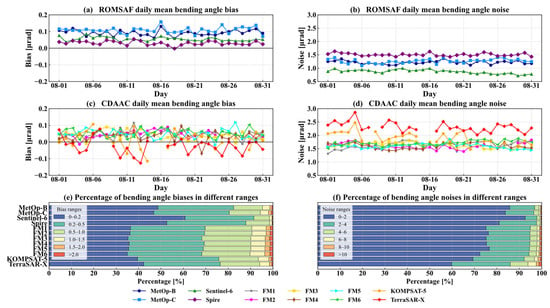
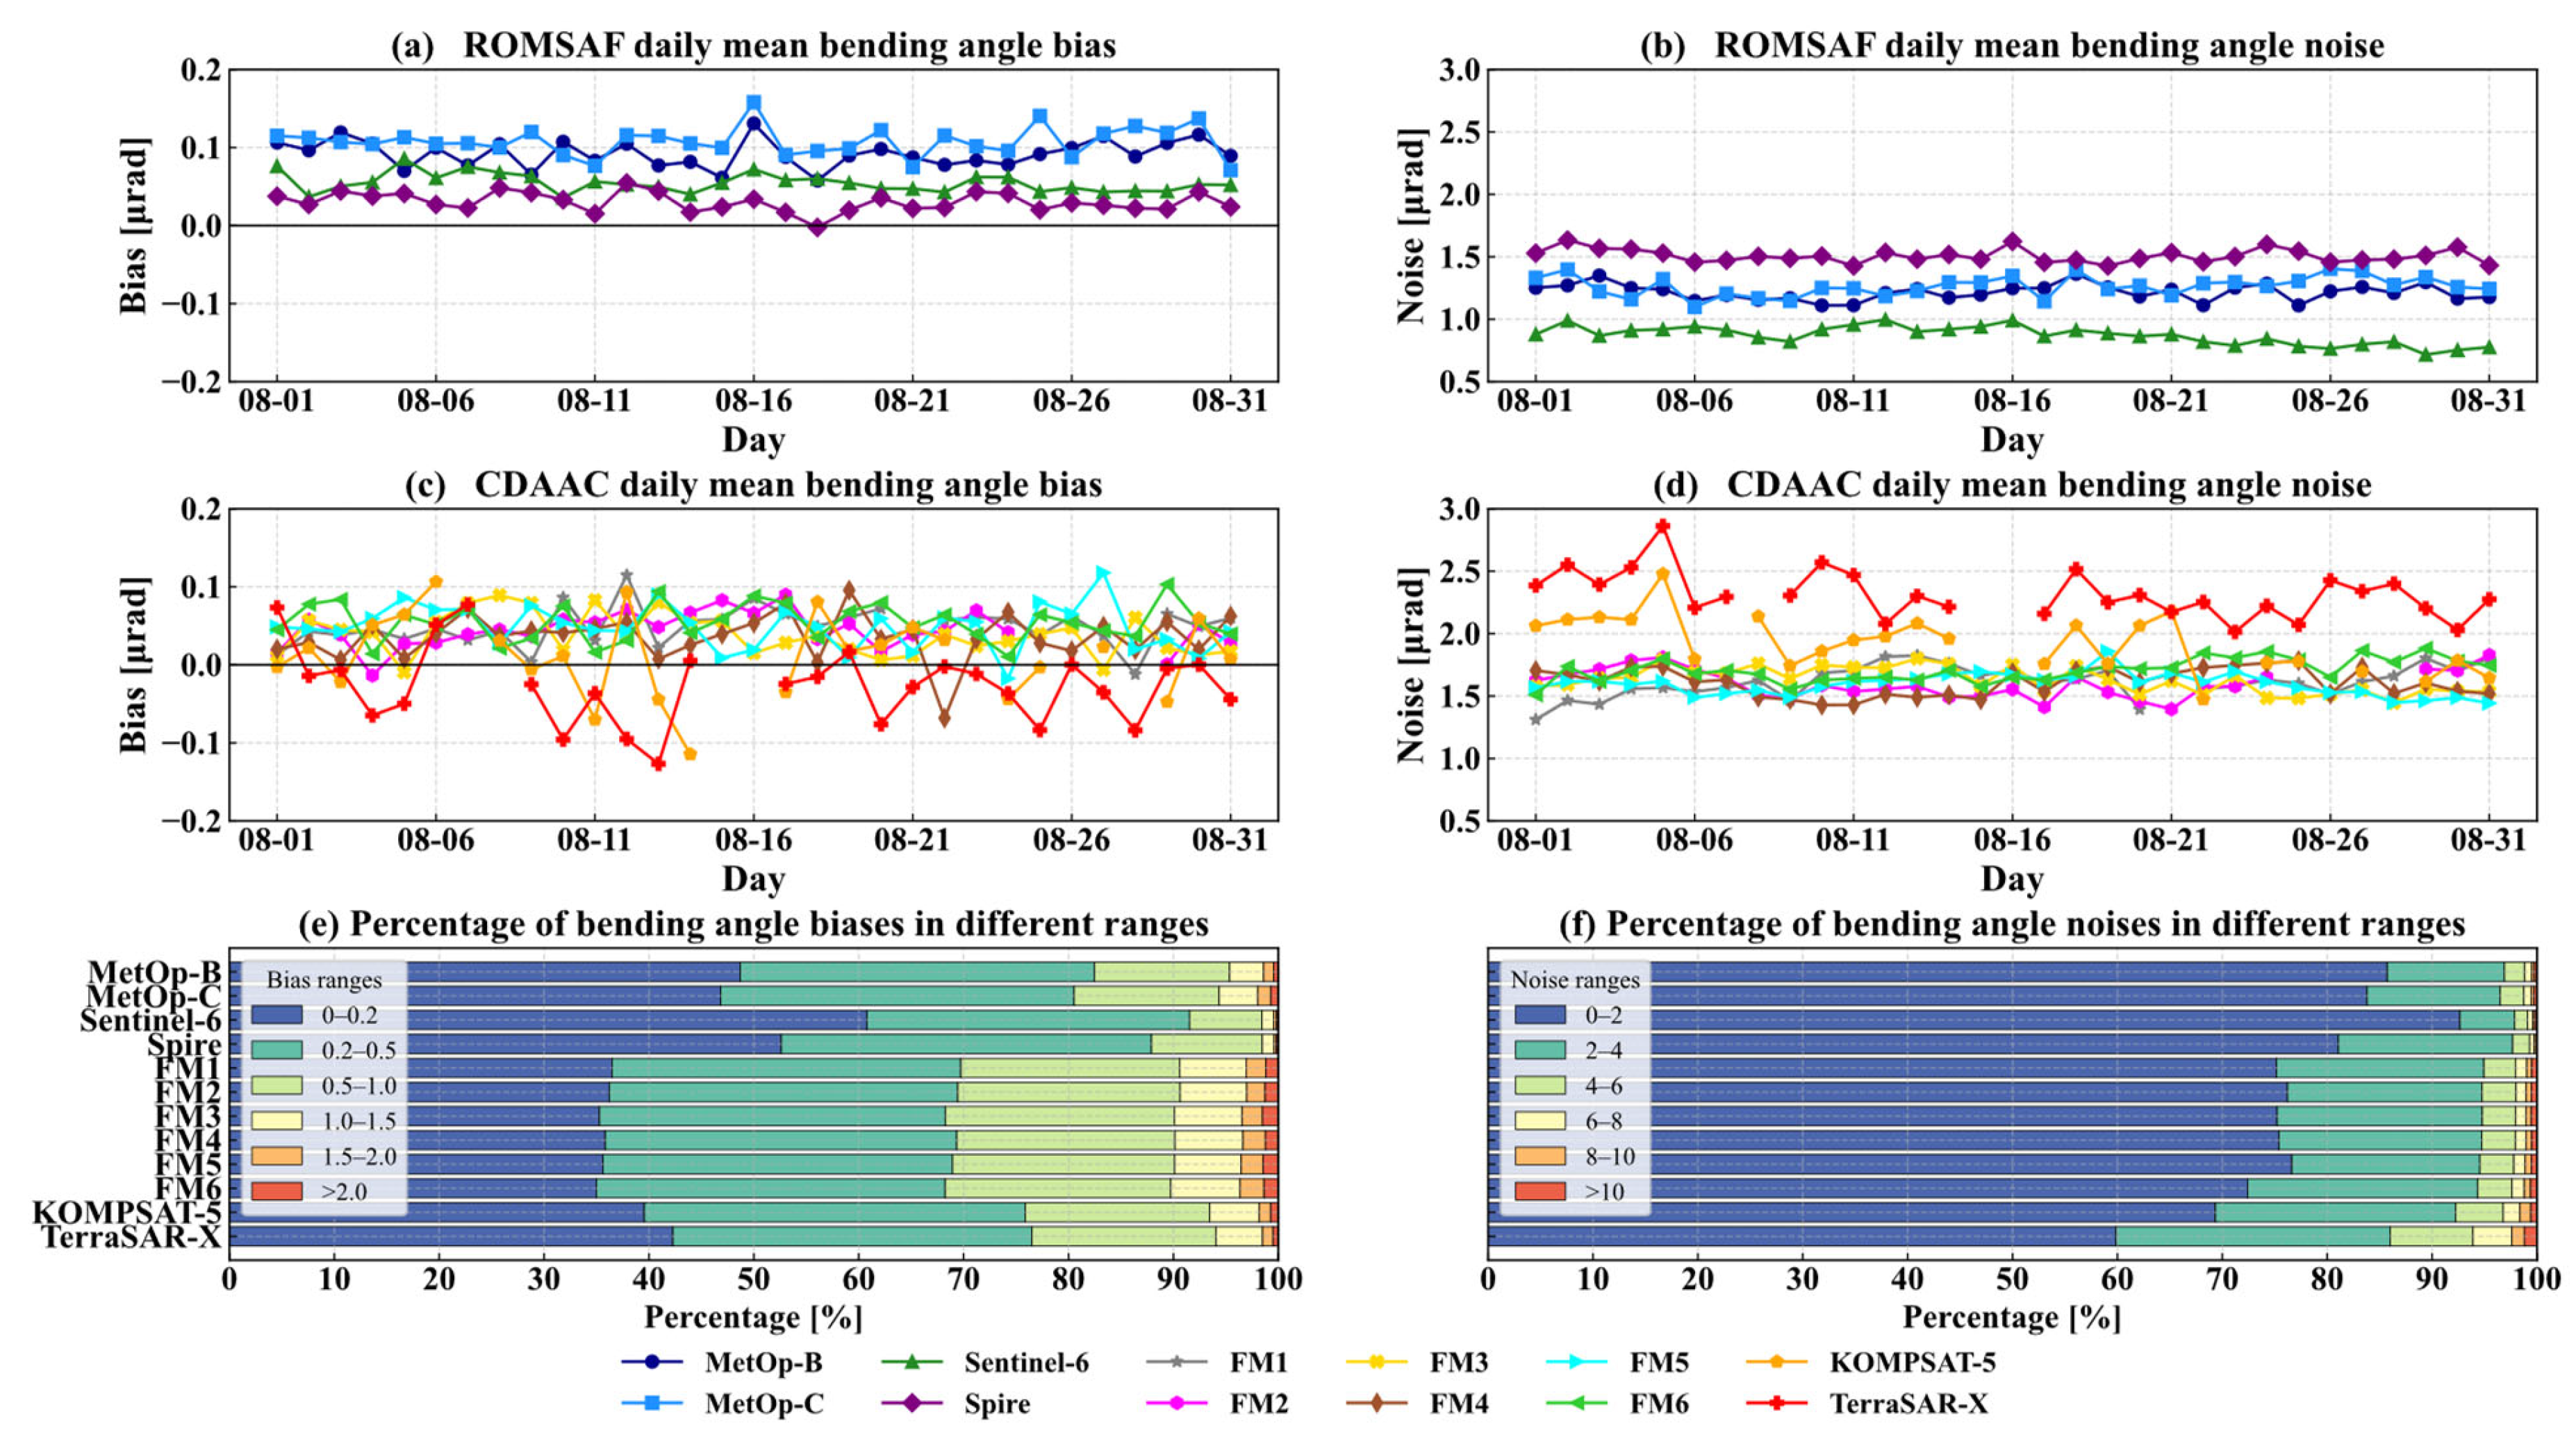
This section presents the biases and noises of ionosphere-corrected bending angles derived from observations that passed all quality control checks (QF = 0). Figure 6 illustrates the daily variations in these parameters: the upper and middle panels show the daily variations in biases and noises for ROM SAF and CDAAC, respectively, while the bottom two panels display the percentages of biases and noise values falling within specified error ranges.
Figure 6.
Panels (a,b): temporal evolution of daily mean bending angle biases (a) and bending angle noises (b) in August 2023 for ROM SAF; panels (c,d): temporal evolution of daily mean bending angle biases (c) and bending angle noises (d) in August 2023 for CDAAC; panels (e,f) show the percentage distributions of bending angle biases and noises, respectively, categorized by absolute ranges (|bias|, μrad: 0–0.2, 0.2–0.5, 0.5–1.0, 1.0–1.5, 1.5–2.0, >2.0; noise, μrad: 0–2, 2–4, 4–6, 6–8, 8–10, >10) and displayed as bar charts. The black horizontal lines in panels (a,c) denote bending angle bias equals zero.
For the four RO missions provided by ROM SAF, daily variations are overall stable, with differences mostly within 0.05 μrad. The bending angle biases of Spire are the smallest, with values mostly within 0–0.05 μrad. The magnitudes of the biases for MetOp-B and MetOp-C vary mostly around 0.10 μrad, approximately 0.05 μrad larger than those for Sentinel-6 and COSMIC-2. Bending angle biases from KOMPSAT-5 and TerraSAR-X show the largest daily variations, with differences reaching more than 0.2 μrad. Regarding bending angle noise, all RO missions exhibit small daily variations except for KOMPSAT-5 and TerraSAR-X. In terms of noise magnitude, Sentinel-6 shows the lowest noise levels, with values below 1.0 μrad. The two MetOp satellites rank second, with most values around 1.2 μrad. In contrast, Spire observations display relatively larger noise, at approximately 1.5 μrad. The noise levels of bending angles from the COSMIC-2 series are also around 1.5 μrad.
Panels (e) and (f) show the percentages of individual bending angle bias and noise values that fall within different error ranges, respectively. For bending angle biases, Sentinel-6 and Spire exhibit the smallest biases, with approximately 90% of values within 0.5 μrad. MetOp-B and MetOp-C follow closely, with about 80% of biases below 0.5 μrad. Although KOMPSAT-5 and TerraSAR-X display large daily variations in bending angle biases, approximately 75% of their bias values still lie within the 0–0.5 μrad range. For COSMIC-2, around 70% of biases are below 0.5 μrad. As shown in panel (f) for bending angle noise, more than 90% of Sentinel-6 noise values are less than 2 μrad, and about 85% of MetOp noise values fall below 2 μrad. For the COSMIC-2 series and Spire, approximately 75% of noise values are below 2 μrad. For KOMPSAT-5 and TerraSAR-X, despite their relatively small mean biases, noise levels are higher than those of other missions, with only 60% and 65% of RO profiles, respectively, having noise values below 2 μrad.
Table 3 shows the monthly mean biases and noise levels of ionosphere-corrected bending angles from high-quality (QF = 0) profiles for the selected missions during August 2023. Sentinel-6 RO observations exhibit the smallest biases and noise, indicating the smallest deviations relative to ERA5 data at high altitudes and high receiver stability. MetOp-B and MetOp-C RO observations show larger bending angle biases than other missions, implying larger deviations from ERA5 above 65 km. Nevertheless, their noise levels are overall small, suggesting that the GRAS receiver onboard the MetOp satellites is highly stable. The biases and noise levels of Spire and the six COSMIC-2 satellites are relatively close to each other. KOMPSAT-5 and TerraSAR-X show small biases relative to ERA5 at high altitudes. However, larger noise levels are found for these two satellites, indicating that their observations are less stable.
Table 3.
Monthly mean ionosphere-corrected bending angle biases and noises of high-quality (QF = 0) profiles for selected missions during August 2023.
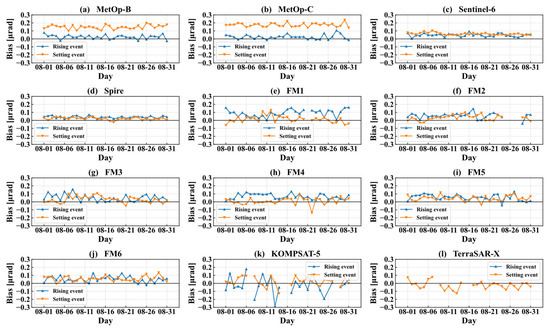
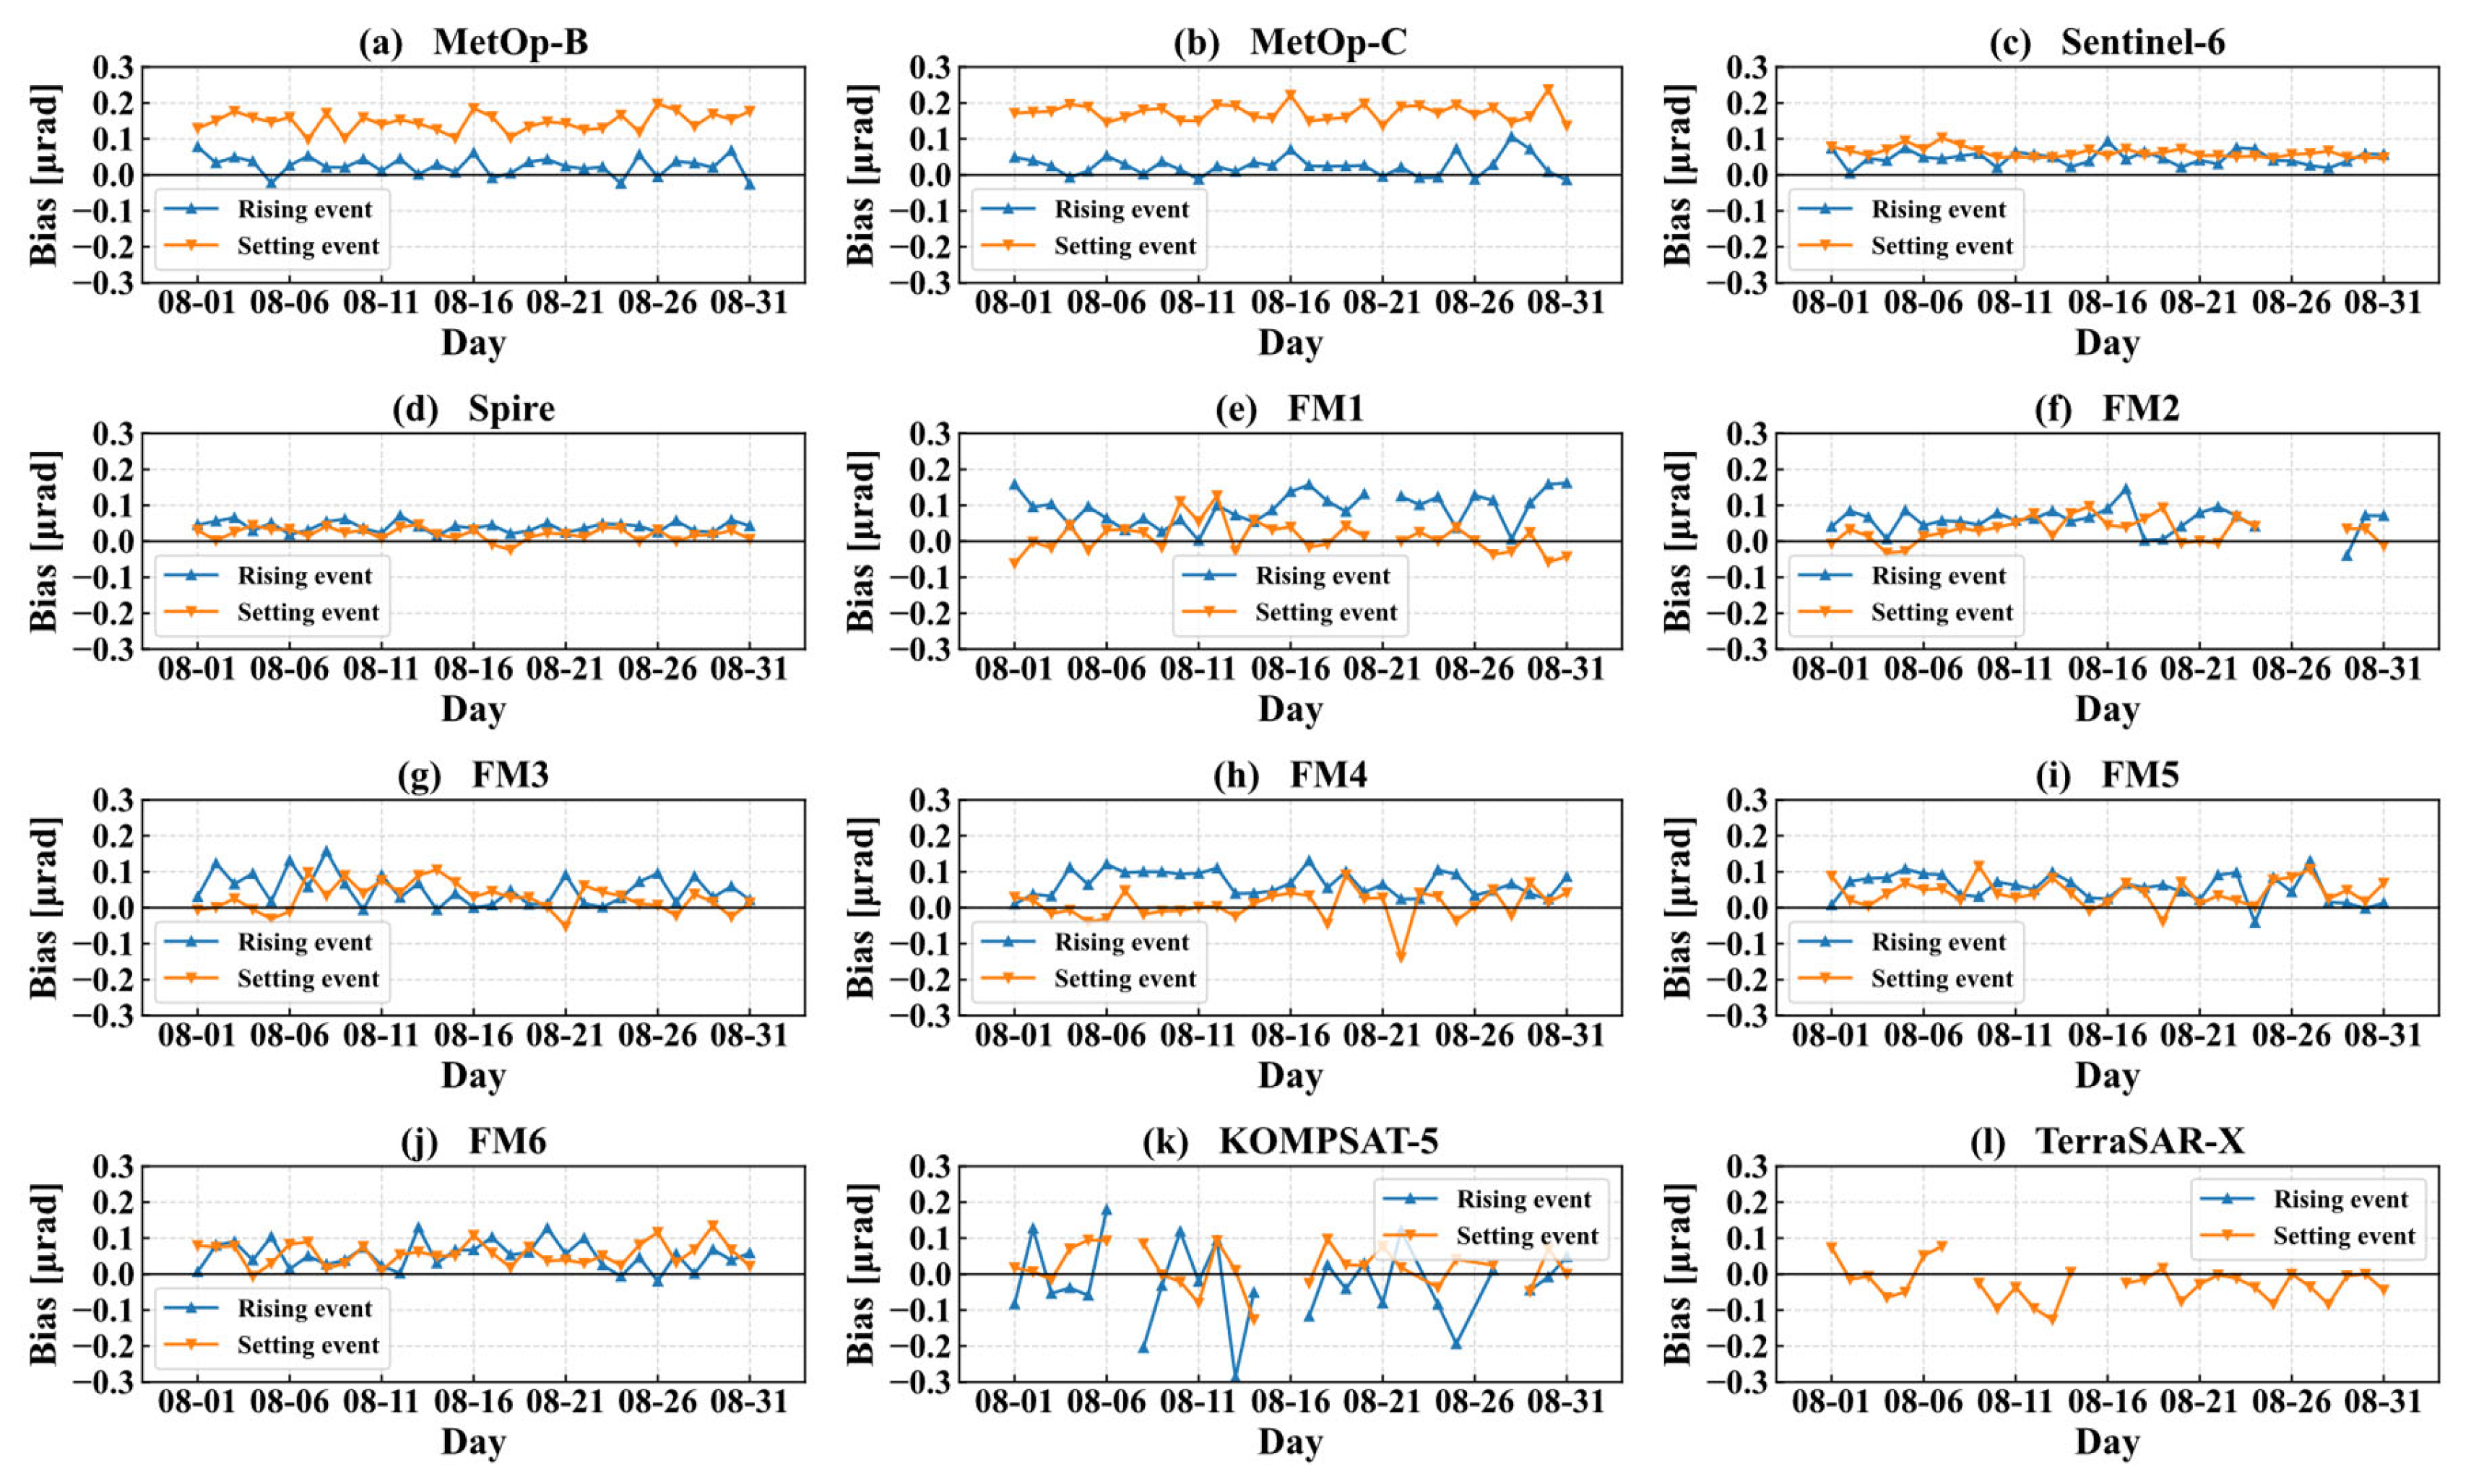
Figure 7 shows the temporal evolution of the daily mean bending angle biases for rising and setting events from all satellite missions in August 2023. For MetOp, the bending angle biases are approximately 0.2 μrad in setting events, whereas those in rising events range from 0 to 0.05 μrad. This discrepancy between setting and rising events is consistent with the results reported by ROM SAF report 34 [70]. KOMPSAT-5 observations exhibit larger daily variations and bending angle biases in rising events, while those in setting events are generally small. For observations from other satellites, the differences between setting and rising events are overall minor.
Figure 7.
Temporal evolution of bending angle biases for rising and setting events of each satellite mission in August 2023. Blue upper triangles represent rising events, and orange lower triangles represent setting events. The black horizontal lines in each panel denote bending angle bias equals zero.
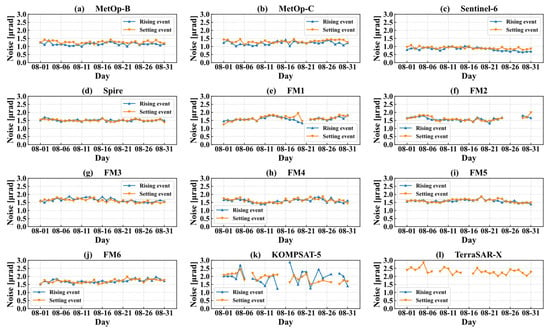
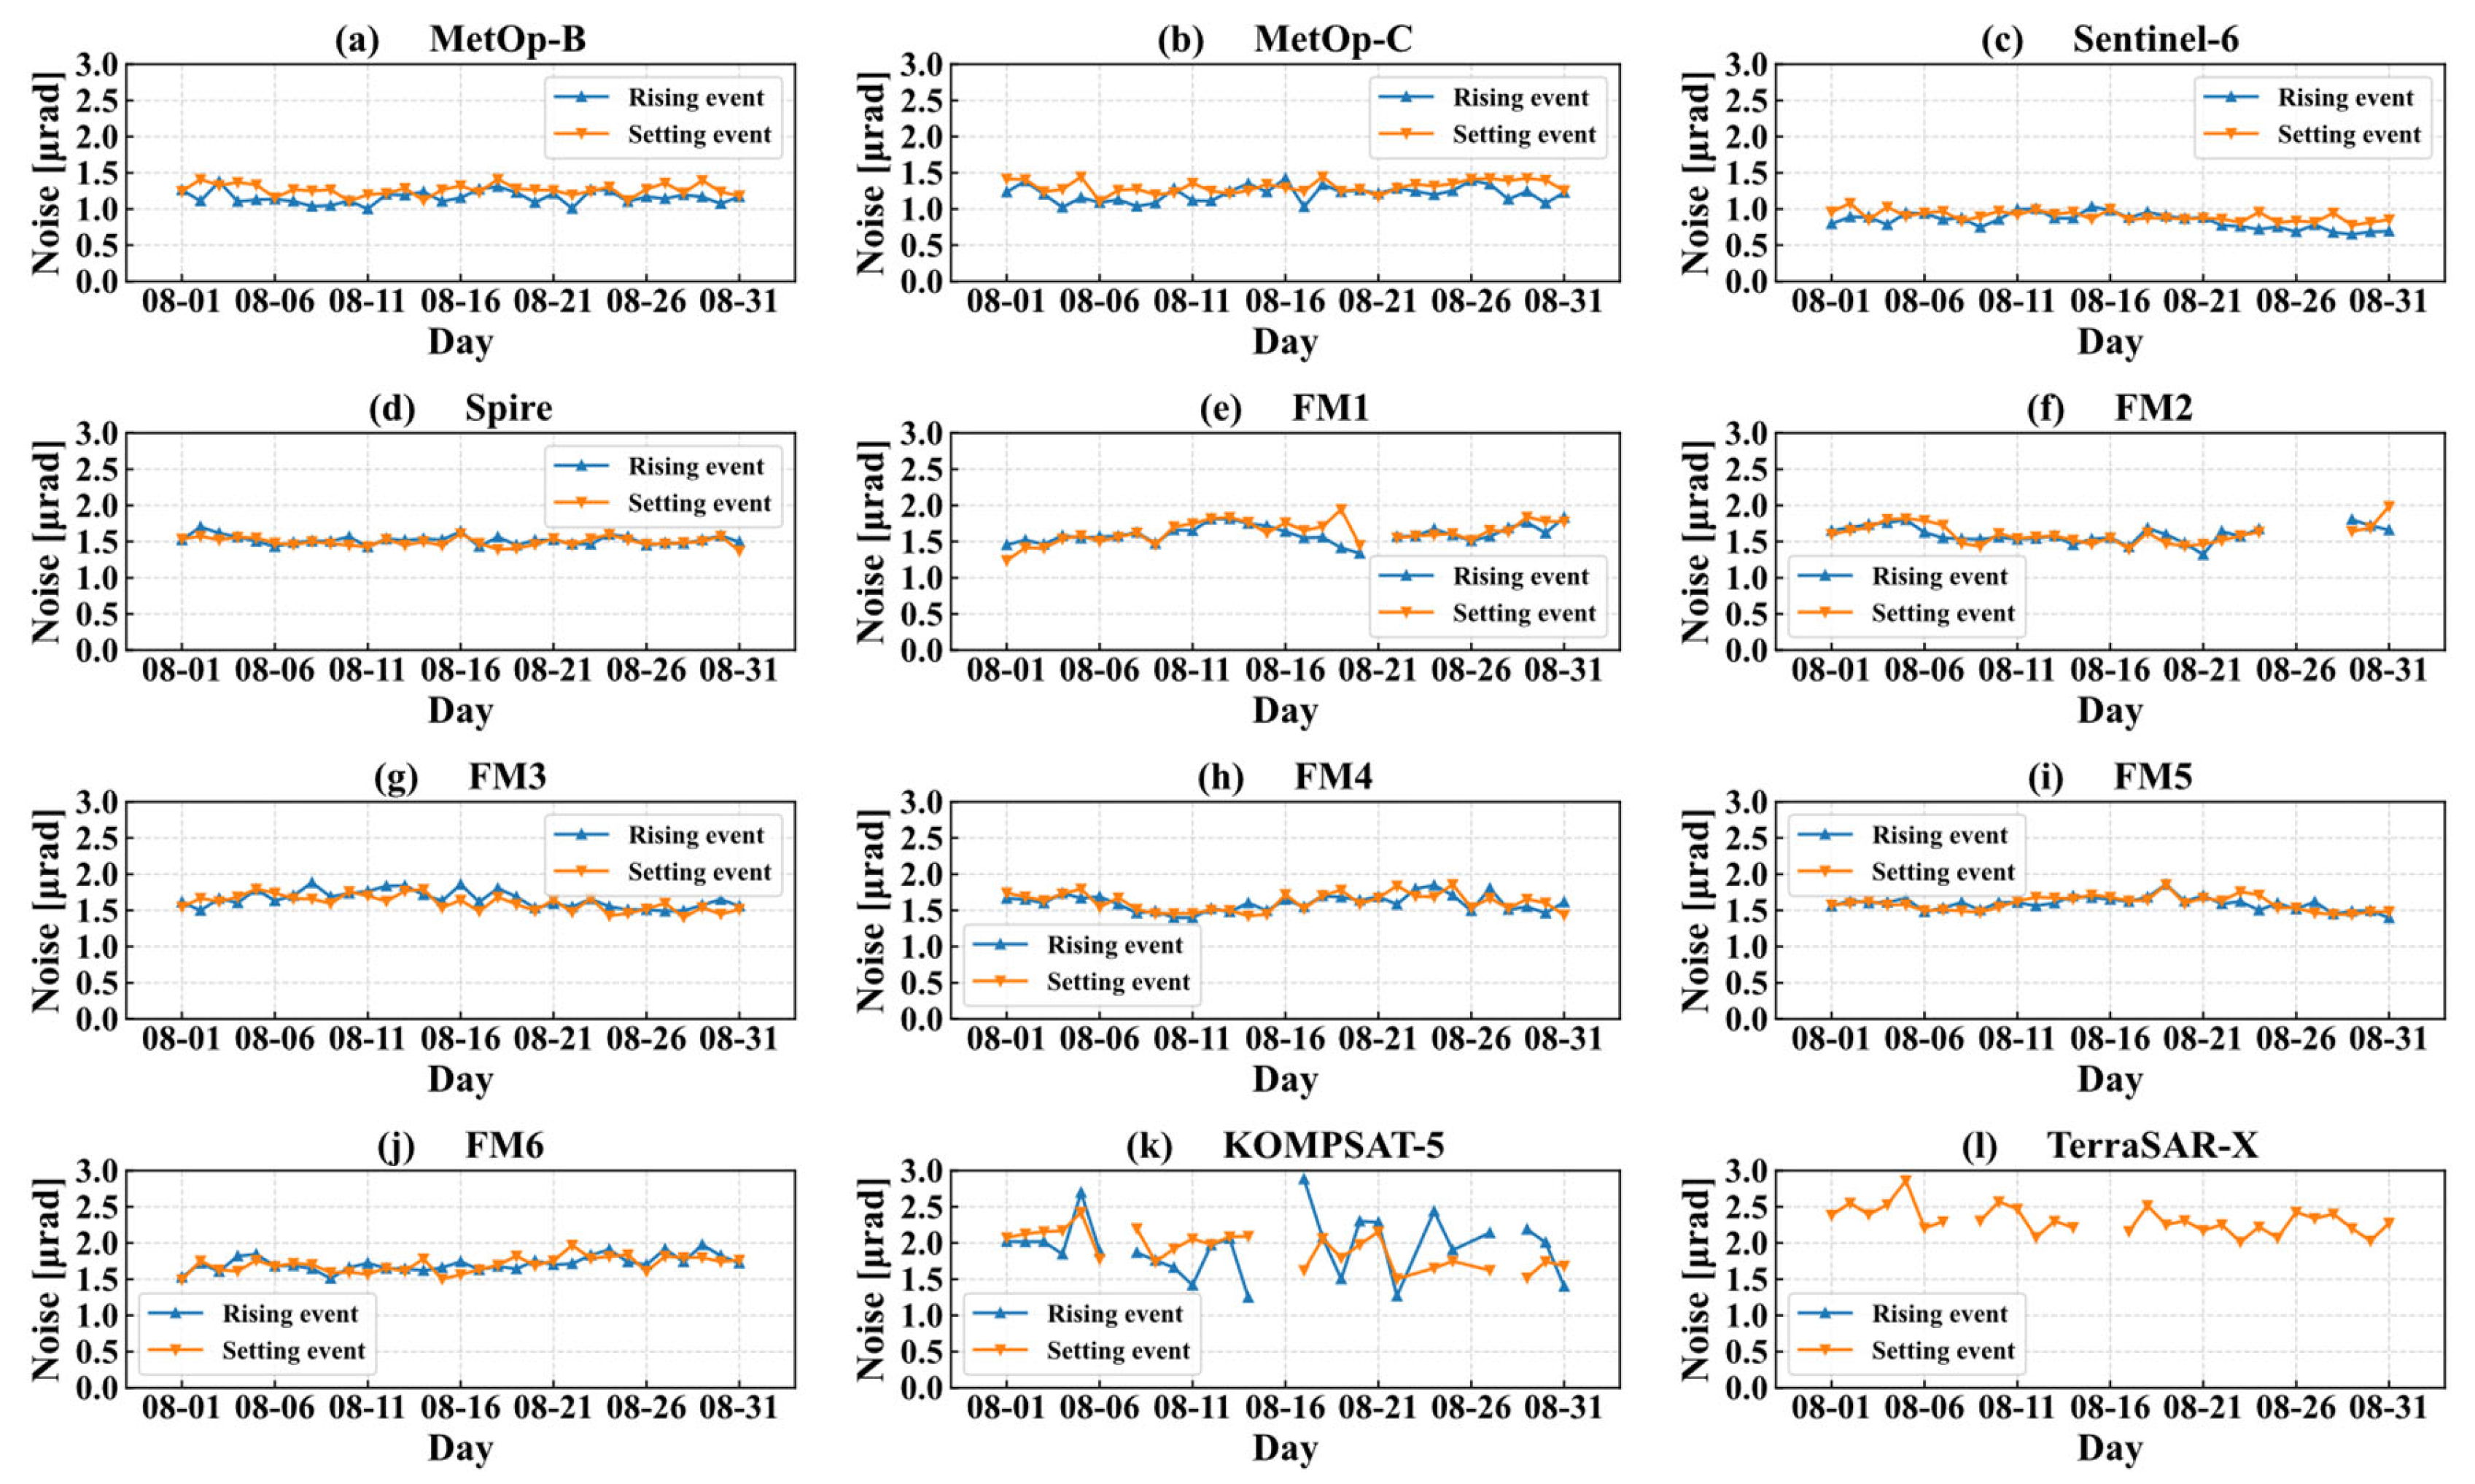
Figure 8 shows similar results to Figure 7 but for bending angle noises. It can be seen that, except for KOMPSAT-5 and TerraSAR-X, the differences between rising and setting events are overall minor. For KOMPSAT-5, rising events also have larger bending angle noises than setting events.
Figure 8.
Temporal evolution of bending angle noises for rising and setting events of each satellite mission during August 2023. Blue upper triangles represent rising events, and orange lower triangles represent setting events.
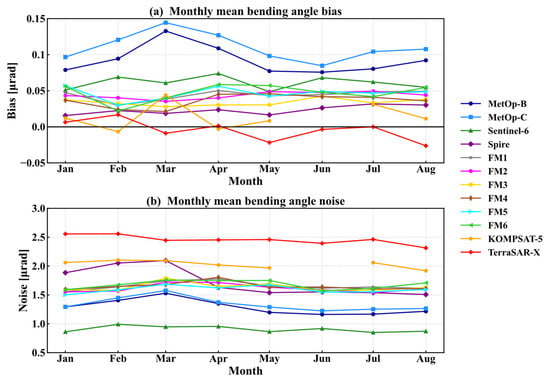
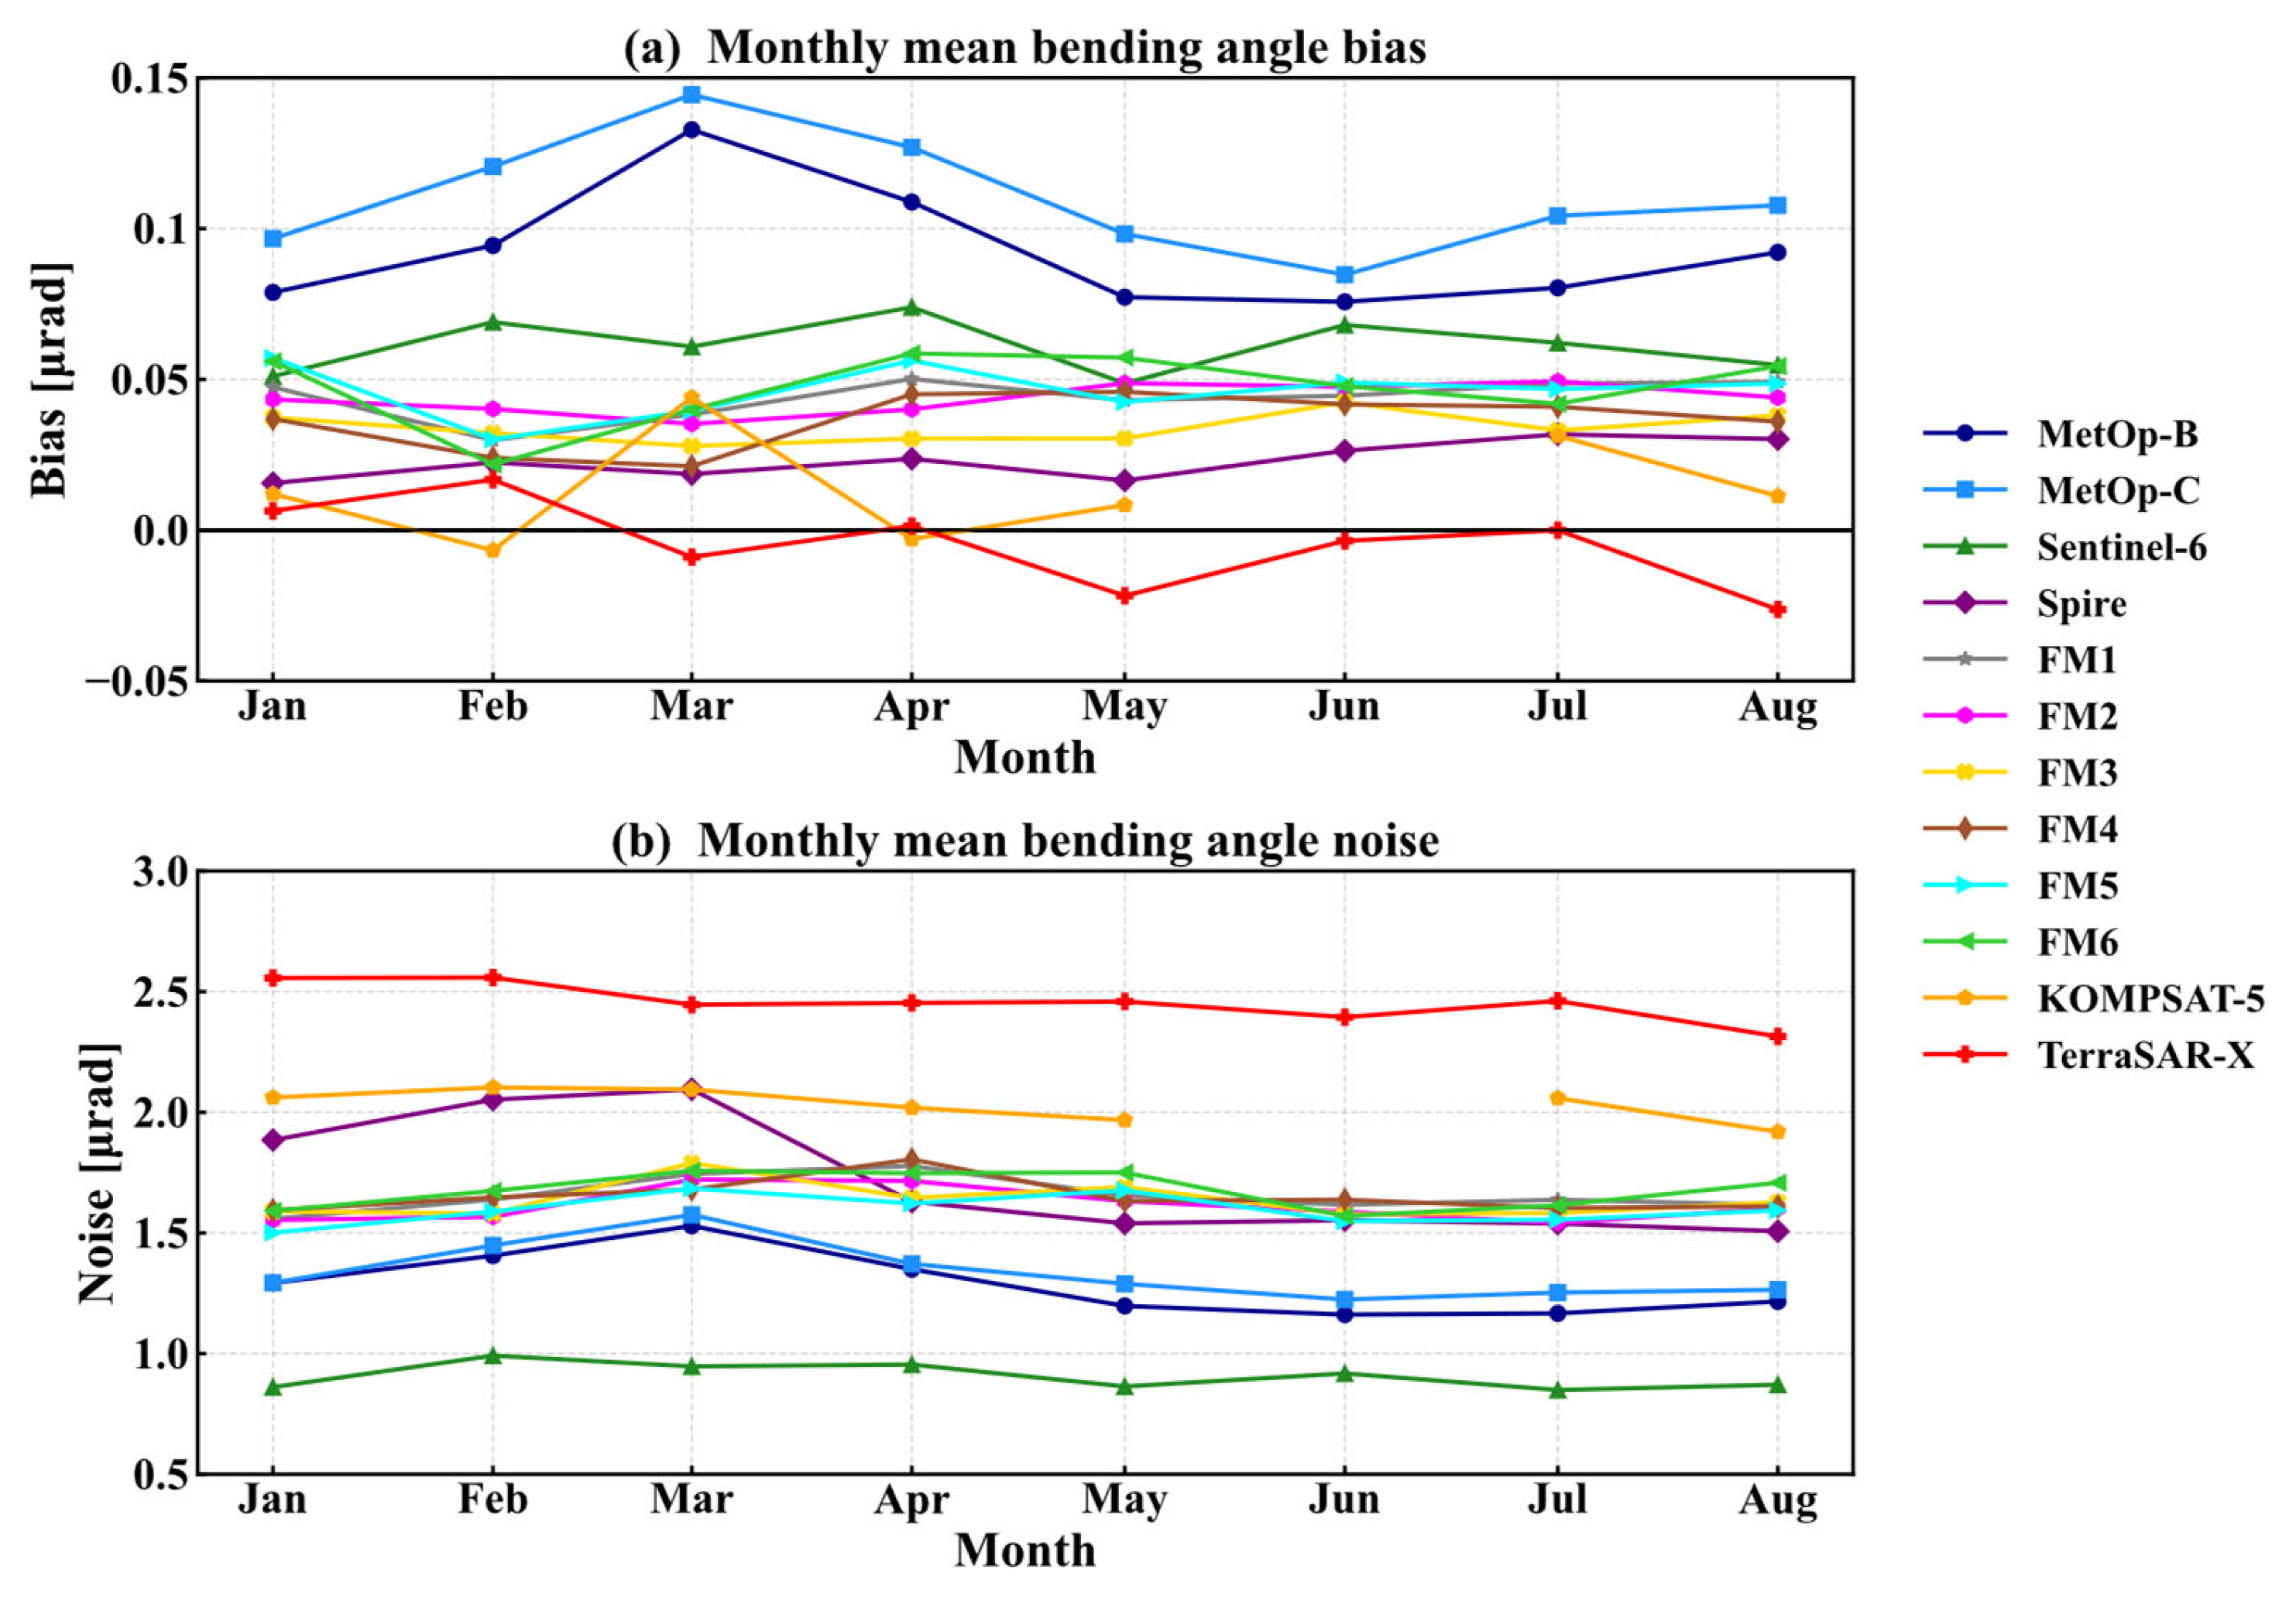
Figure 9 depicts the temporal evolution of the monthly mean bending angle biases and noise levels. The monthly mean biases derived from all satellites exhibit substantial variability, with monthly variations of up to 50%. Such variations are primarily attributed to ionospheric residual errors, uncalibrated clock errors, and orbital errors. Bending angle noises from the two MetOp satellites and the Spire satellite display noticeable monthly fluctuations: values increase gradually over the first three months, decrease toward July, and rise again starting in August. For other satellites, monthly mean bending angle noises remain relatively stable.
Figure 9.
Temporal evolution of monthly mean bending angle biases (a) and bending angle noises (b) for all selected RO missions. The black horizontal line in panel (a) denotes bending angle bias equals zero.
3.3. Retrieved RO Profiles
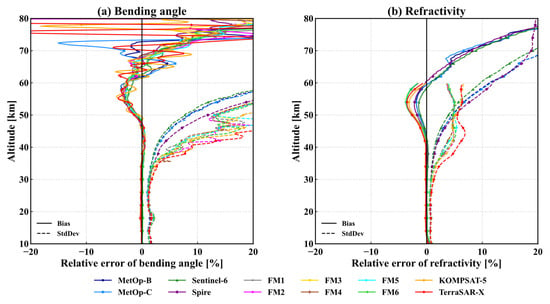
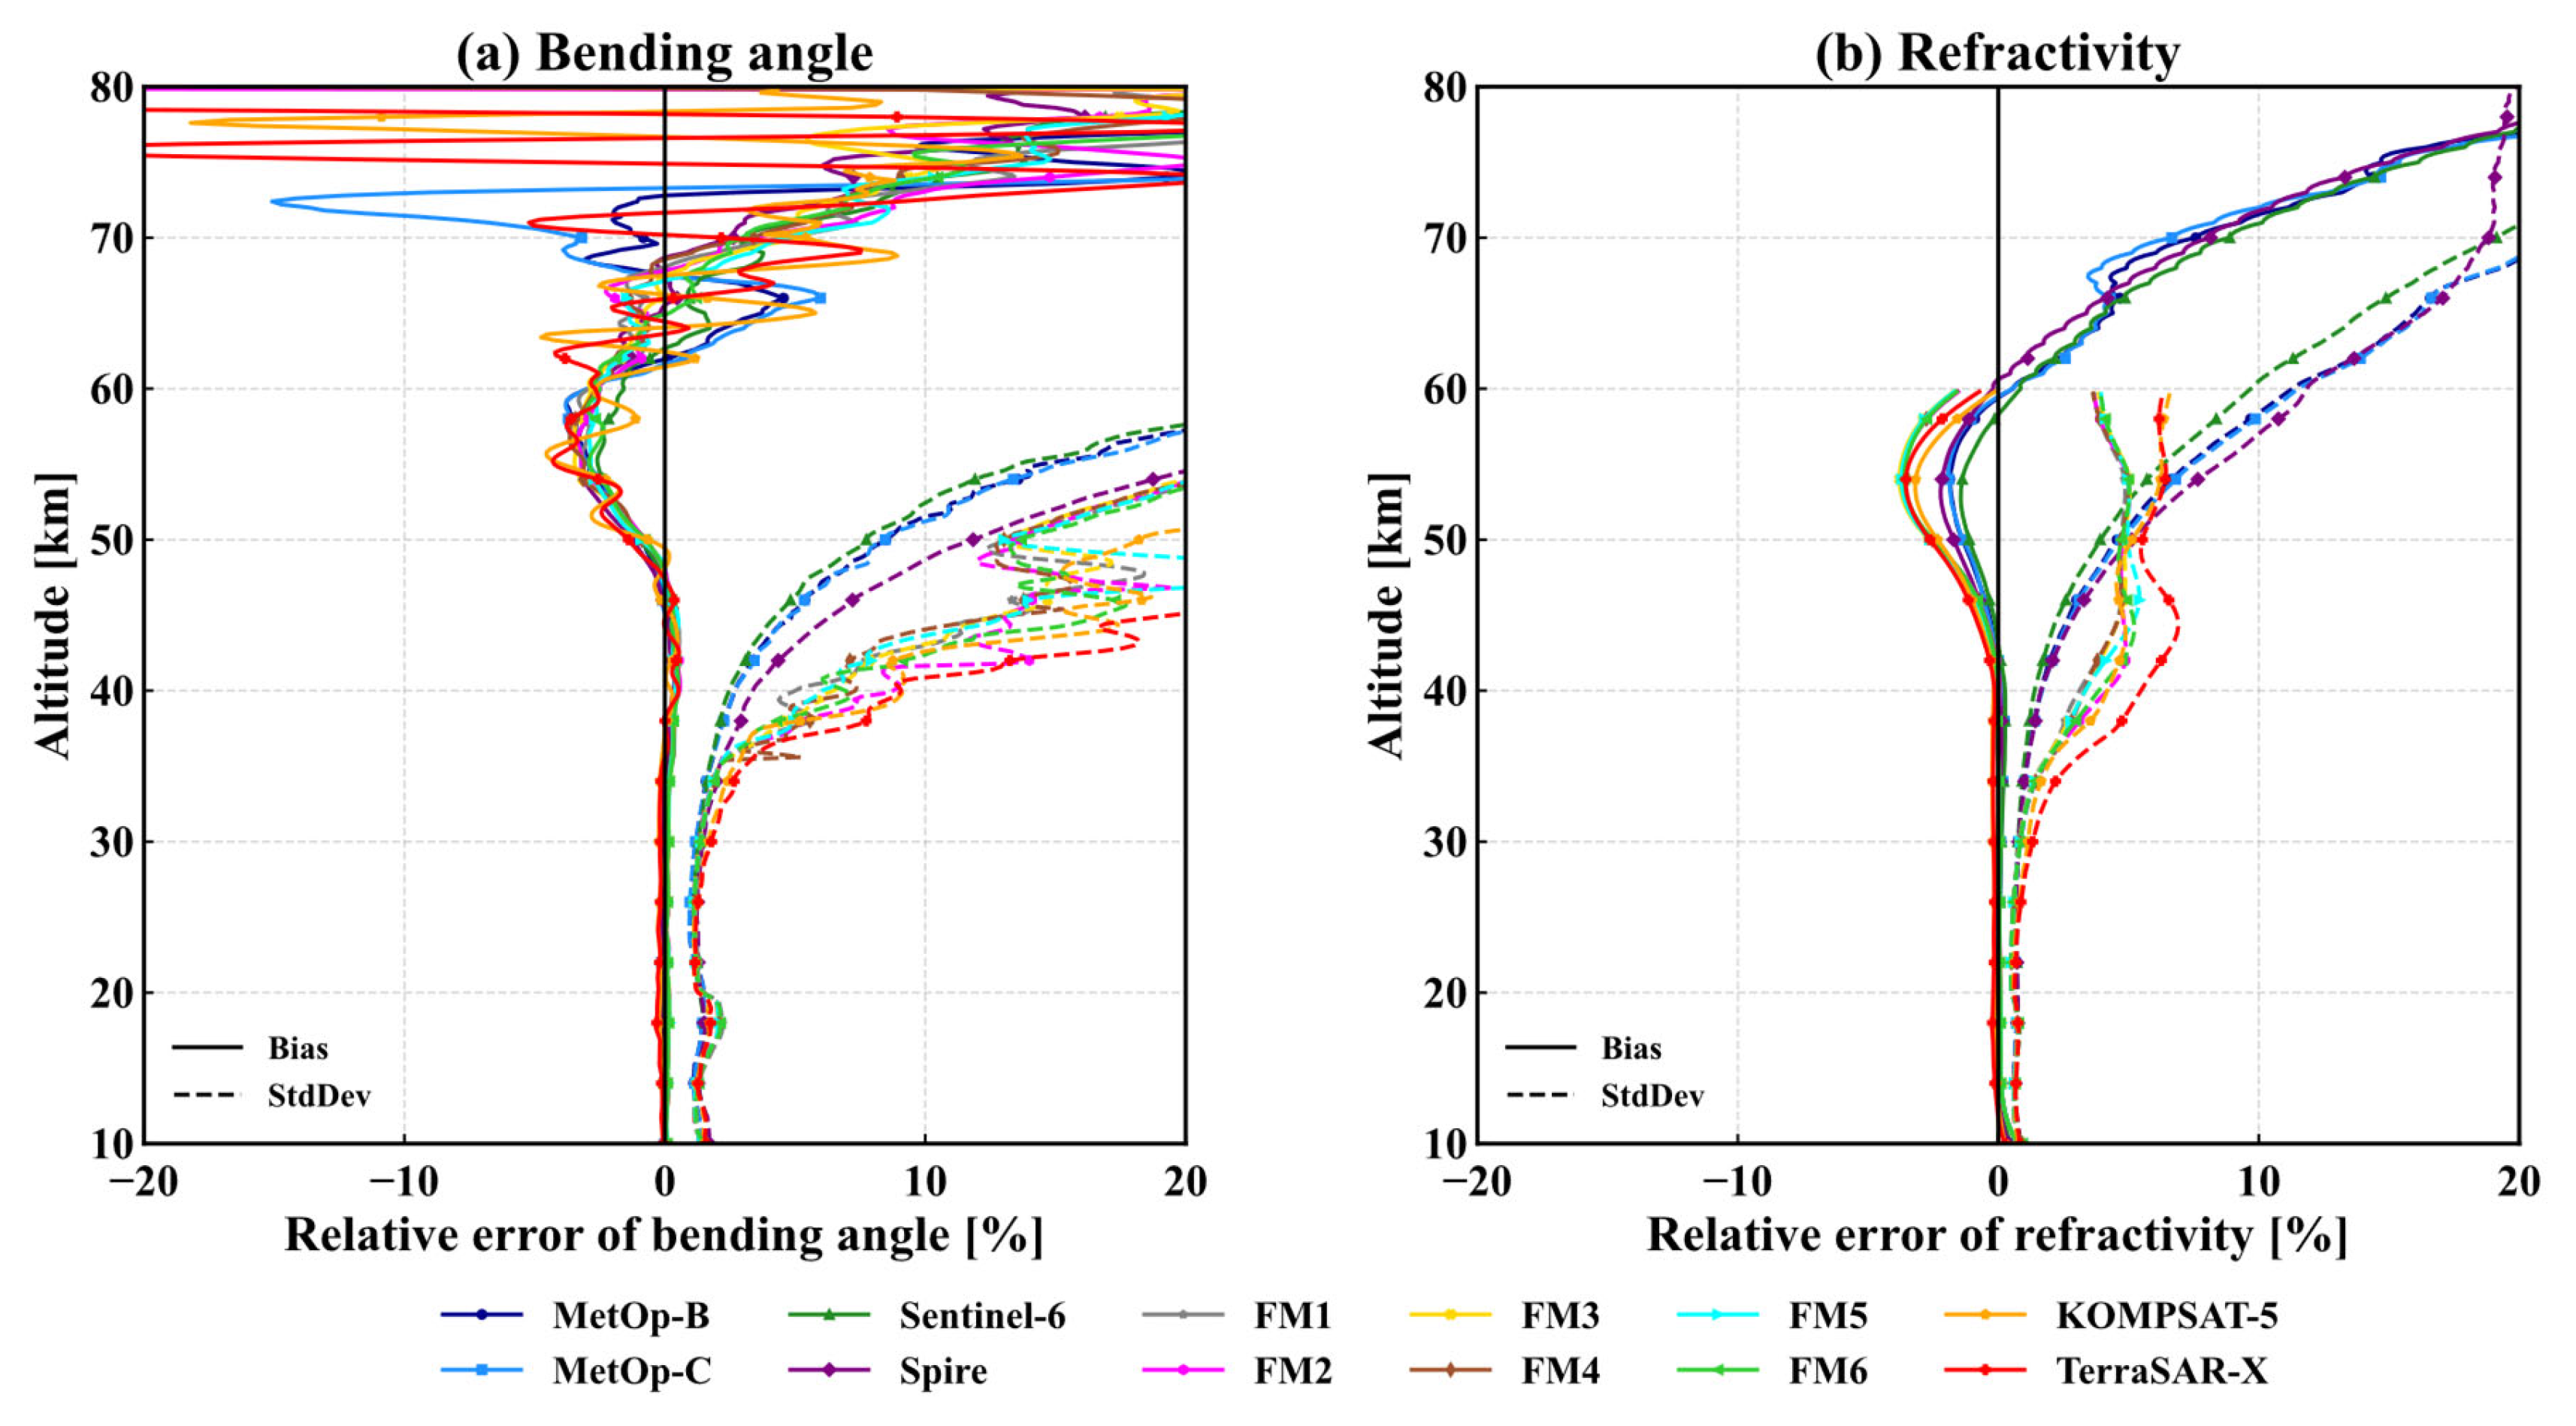
Figure 10 shows the systematic differences and standard deviations of bending angles (Figure 10a) and refractivity (Figure 10b). It can be observed that the systematic differences in bending angles below 60 km are generally consistent. However, the standard deviations from these 12 missions exhibit noticeable variations above 35 km. The standard deviations from MetOp-B, MetOp-C, and Sentinel-6 are the smallest. Those from Spire are approximately 1–2% larger than those of the MetOp satellites. The standard deviations of all COSMIC-2 satellites are about 5–10% larger than those of the MetOp satellites, while the standard deviations from TerraSAR-X are the largest.
Figure 10.
Systematic differences and standard deviations of the RO bending angle (a) and RO refractivity (b) against ERA5.
Similar to the results of bending angle, refractivity systematic differences from all 12 missions are rather close below 40 km. From 40 to 60 km, refractivity systematic differences from MetOp-B, MetOp-C, Sentinel-6 and Spire observations are smallest. Systematic differences from other missions are about 1% to 2% larger than those from four missions. Refractivity standard deviations from all 12 missions are rather close below 30 km. From 30 to 50 km, standard deviations from the four missions again are about 1% to 2% smaller than those of the other missions which is attributed to the small bending angle standard deviations propagated downward to the refractivity field. Above 50 km, standard deviations from the four missions keep increasing, while those of the other missions do not change. This is due to the influences of statistical optimization, which reduces the discrepancies of refractivity against ERA5 at high altitudes.
4. Discussions
This study has evaluated the quality of ionosphere-corrected bending angle from 12 selected RO satellites focusing on bending angle quality control (QC), bias and noise characteristics at 65–80 km altitude, as well as statistical errors, using ERA5 data as the reference. All the results have been presented in Section 3. Results show that large bending angle biases and noises of KOMPSAT-5 and TerraSAR-X have been detected at high altitudes.
Larger bending angle noises and outliers at high altitudes can be caused by measurement noise due to poor GPS receiver quality on board the LEO satellites, large residual ionospheric errors, or the differencing method used for clock error removal. Both satellites use a strategy of single differencing to remove their clock errors. From the receiver perspective, KOMPSAT-5’s AOPOD integrates a dual-frequency GPS receiver primarily to meet precise orbit determination (POD) requirements for the synthetic aperture radar (SAR) mission, with RO as an additional function, which can make high-altitude RO more sensitive to tracking/clock imperfections [35]. TerraSAR-X is likewise a secondary TOR experiment using the IGOR, so its observation/processing configuration is not as RO-optimized as dedicated meteorological missions [33].
The potential differences between setting and rising events are mostly due to the orbital and clock errors as well as occultation geometry. The systematic discrepancies in bending angle biases between rising and setting radio occultation (RO) events at high altitudes primarily arise from asymmetric signal propagation physics and geometric effects. Setting occultation signals traverse longer slant paths through the upper atmosphere and ionosphere, enhancing residual ionospheric refraction errors and plasma density fluctuations. In contrast, rising signals propagate through relatively more stable ionospheric conditions with shorter perturbed paths. Diurnal atmospheric tides, horizontal refractivity gradients, and thermospheric variations further induce altitude-dependent refractive asymmetries. Combined with differences in open-loop tracking stability and orbital geometry, these propagation-related physical mechanisms lead to distinct systematic biases in bending angles at high altitudes between rising and setting RO events.
There are still some limitations of our methodology. Although ERA5 data are a suitable and widely used reference, they still have inherent uncertainties, especially in the data-sparse mesosphere. Therefore, the analysis of biases and noises, which use ERA5 data above 60 km, needs further investigation. Second, due to a short data period selected, which corresponds to relatively low solar and geomagnetic activity, our results may not be able to be generalized to periods of high solar activity.
5. Conclusions
In this study, we systematically evaluate the quality of ionosphere-corrected bending angles from the MetOp-B/C, Sentinel-6, and Spire missions provided by ROM SAF, as well as the COSMIC-2 (FM1–FM6), KOMPSAT-5, and TerraSAR-X missions provided by CDAAC. ERA5 data are employed as the reference dataset. The evaluation is conducted from three perspectives: first, the quality of the ionosphere-corrected bending angle profiles is analyzed; second, the characteristics of bending angle biases and noise are examined; third, the systematic differences and standard deviations of bending angles and refractivity are computed.
For overall quality control, radio occultation (RO) observations from MetOp-B, MetOp-C, Sentinel-6, and Spire (provided by ROM SAF) show the highest quality control pass rates. Spire exhibits the highest proportion, with more than 99% of profiles passing quality control. MetOp-B, MetOp-C, and Sentinel-6 each achieve pass rates of approximately 90% or higher. The COSMIC-2 series achieves a pass rate of about 81%. In contrast, KOMPSAT-5 and TerraSAR-X present the lowest pass rates, with only around 62% and 68% of observations meeting high-quality standards, respectively.
Regarding the detailed quality control schemes, KOMPSAT-5 and TerraSAR-X are prone to have outliers at high altitudes, indicating that RO observations from KOMPSAT-5 are easily affected by observation errors in the upper atmosphere. The two MetOp satellites and Sentinel-6 exhibit higher percentages of QF = 4 than other quality flags. This suggests that RO observations from these three satellites tend to show larger deviations relative to ERA5 at high altitudes. Larger bending angle noise can result from measurement noise due to poor GPS receiver quality on board the LEO satellite, large residual ionospheric errors, and from the differencing method used for clock error removal. However, a detailed investigation is required to determine the specific causes of these discrepancies.
Regarding temporal and spatial variations, all quality flags reveal few monthly variations; however, due to the relatively short time period selected, robust conclusions cannot yet be drawn, and further investigation is warranted. Regarding latitudinal variations, we found that the QF = 4 of MetOp data occurs easily in the southern hemisphere regions. For COSMIC-2 series, which only has observations in middle latitudes and tropics, most of its quality issues are found in the middle latitudes of the northern hemisphere and the tropics, and such quality issues can be caused by the influences of the ionospheric errors. TerraSAR-X, which has the same RO receiver as COSMIC, also has more quality issues in the middle latitudes of the northern hemisphere and the tropics.
Regarding biases and noises quantification, we noted that RO observations from the two MetOp satellites have larger discrepancies against ERA5 than other RO satellites, and most of these biases lie in the setting events. Regarding measurement noises, Sentinel-6 showed the smallest noises, with magnitudes of only about 0.87 μrad. The observation noises of the two MetOp satellites rank second, which are about 1.2 μrad. The Spire and COSMIC-2 series follow, with values around 1.5 μrad. The relatively small noises of these satellites reflect the stability of these receivers. KOMPSAT-5 and TerraSAR-X showed the largest noise, with monthly averages of approximately 1.9 and 2.3 μrad, respectively.
Bending angle systematic differences are generally consistent below 60 km, but their standard deviations vary noticeably above 35 km, with MetOp-B/C and Sentinel-6 having the smallest, Spire 1–2% larger, COSMIC-2 5–10% larger, and TerraSAR-X the largest. For refractivity, systematic differences are close below 40 km; MetOp-B/C, Sentinel-6 and Spire have the smallest at 40–60 km, others 1–2% larger. Refractivity standard deviations are close below 30 km; the four missions are 1–2% smaller at 30–50 km. Above 50 km, their standard deviations increase, while others remain stable due to statistical optimization reducing high-altitude discrepancies against ERA5.
The results of this study are useful for weather and climate studies. First, the quality control scheme can be useful for users who would like to use products from these centers for weather and climate studies. Second, RO data from the 12 selected missions are generally consistent below 35 km and can therefore be combined into a benchmark dataset for reliable weather and climate studies at these altitudes. Due to different error magnitudes above 35 km, different error models should be applied to these datasets above 35 km in numerical weather prediction. Finally, users should be cautious in using GNSS RO data for climate studies above the middle stratosphere.
Our future work will adopt the three-cornered hat (3CH) method to further quantify the biases and noises of RO bending angles at high altitudes. Additionally, we will focus on quantifying specific error sources, including differences in orbit determination accuracy, variations in clock error handling methods (e.g., single differencing versus other techniques), and residual ionospheric effects.
Author Contributions
Conceptualization, J.Y. and Y.L.; methodology, J.Y. and Y.L.; software, J.Y.; validation, J.Y. and Y.L.; formal analysis, J.Y.; investigation, J.Y.; resources, Y.L.; data curation, J.Y.; writing—original draft preparation, J.Y.; writing—review and editing, J.Y., Y.L., and X.H.; visualization, J.Y. and Y.L.; supervision, Y.L. and X.H.; project administration, Y.L. and X.H.; funding acquisition, Y.L. All authors have read and agreed to the published version of the manuscript.
Funding
The research at APM (Wuhan, China) was supported by the development project founded by the cultivation project funded by the National Precise Gravity Measurement Facility, Huazhong University of Science and Technology (PGMF-2024-P012) and the general project funded by the National Natural Science Foundation of China (Grant no. 42474063).
Data Availability Statement
The radio occultation data from MetOp-B, MetOp-C, Sentinel-6, and Spire are available from the ROM SAF upon registration at https://rom-saf.eumetsat.int, accessed on 1 September 2025. The data from COSMIC-2, KOMPSAT-5, and TerraSAR-X are available from the CDAAC at https://data.cosmic.ucar.edu/gnss-ro, accessed on 1 September 2025. The ERA5 reanalysis data used for comparison are available from the Copernicus Climate Change Service (C3S) Climate Data Store at https://cds.climate.copernicus.eu, accessed on 25 July 2025.
Conflicts of Interest
The authors declare no conflicts of interest.
References
- Kursinski, E.R.; Hajj, G.A.; Bertiger, W.I.; Leroy, S.S.; Meehan, T.K.; Romans, L.J.; Schofield, J.T.; McCleese, D.J.; Melbourne, W.G.; Thornton, C.L.; et al. Initial Results of Radio Occultation Observations of Earth’s Atmosphere Using the Global Positioning System. Science 1996, 271, 1107–1110. [Google Scholar] [CrossRef] [Scilit]
- Jin, S.; Feng, G.P.; Gleason, S. Remote sensing using GNSS signals: Current status and future directions. Adv. Space Res. 2011, 47, 1645–1653. [Google Scholar] [CrossRef] [Scilit]
- Kirchengast, G. Occultations for Probing Atmosphere and Climate: Setting the Scene. In Occultations for Probing Atmosphere and Climate; Kirchengast, G., Foelsche, U., Steiner, A.K., Eds.; Springer: Berlin/Heidelberg, Germany, 2004; pp. 1–8. [Google Scholar]
- Steiner, A.K.; Lackner, B.C.; Ladstädter, F.; Scherllin-Pirscher, B.; Foelsche, U.; Kirchengast, G. GPS radio occultation for climate monitoring and change detection. Radio Sci. 2011, 46, 1–17. [Google Scholar] [CrossRef] [Scilit]
- Yu, K.; Rizos, C.; Burrage, D.; Dempster, A.G.; Zhang, K.; Markgraf, M. An overview of GNSS remote sensing. EURASIP J. Adv. Signal Process. 2014, 2014, 134. [Google Scholar] [CrossRef] [Scilit]
- Mannucci, A.J.; Ao, C.O.; Williamson, W. GNSS Radio Occultation. In Position, Navigation, and Timing Technologies in the 21st Century; John Wiley & Sons: Hoboken, NJ, USA, 2020; pp. 971–1013. [Google Scholar]
- Anthes, R.A. Exploring Earth’s atmosphere with radio occultation: Contributions to weather, climate and space weather. Atmos. Meas. Tech. 2011, 4, 1077–1103. [Google Scholar] [CrossRef] [Scilit]
- Bai, W.; Deng, N.; Sun, Y.; Du, Q.; Xia, J.; Wang, X.; Meng, X.; Zhao, D.; Liu, C.; Tan, G.; et al. Applications of GNSS-RO to Numerical Weather Prediction and Tropical Cyclone Forecast. Atmosphere 2020, 11, 1204. [Google Scholar] [CrossRef] [Scilit]
- Ho, S.-p.; Zhou, X.; Shao, X.; Chen, Y.; Jing, X.; Miller, W. Using the Commercial GNSS RO Spire Data in the Neutral Atmosphere for Climate and Weather Prediction Studies. Remote Sens. 2023, 15, 4836. [Google Scholar] [CrossRef] [Scilit]
- Li, Y.; Liu, Y.; Ding, W.; Liao, M.; Huo, X.; Ye, J. Quality aspects of Fengyun3 D/E radio occultation bending angle products. Atmos. Meas. Tech. 2026, 19, 659–678. [Google Scholar] [CrossRef] [Scilit]
- Cardinali, C.; Healy, S. Impact of GPS radio occultation measurements in the ECMWF system using adjoint-based diagnostics. Q. J. R. Meteorol. Soc. 2014, 140, 2315–2320. [Google Scholar] [CrossRef] [Scilit]
- Eyre, J.; Bell, W.; Cotton, J.; English, S.; Forsythe, M.; Healy, S.; Pavelin, E. Assimilation of satellite data in numerical weather prediction. Part II: Recent years. Q. J. R. Meteorol. Soc. 2022, 148, 521–556. [Google Scholar] [CrossRef] [Scilit]
- Leroy, S.S.; Ao, C.O.; Verkhoglyadova, O.P. Temperature Trends and Anomalies in Modern Satellite Data: Infrared Sounding and GPS Radio Occultation. J. Geophys. Res. Atmos. 2018, 123, 11431–11444. [Google Scholar] [CrossRef] [Scilit]
- Steiner, A.K.; Ladstädter, F.; Randel, W.J.; Maycock, A.C.; Fu, Q.; Claud, C.; Gleisner, H.; Haimberger, L.; Ho, S.P.; Keckhut, P.; et al. Observed Temperature Changes in the Troposphere and Stratosphere from 1979 to 2018. J. Clim. 2020, 33, 8165–8194. [Google Scholar] [CrossRef] [Scilit]
- Guo, P.; Kuo, Y.H.; Sokolovskiy, S.V.; Lenschow, D.H. Estimating Atmospheric Boundary Layer Depth Using COSMIC Radio Occultation Data. J. Atmos. Sci. 2011, 68, 1703–1713. [Google Scholar] [CrossRef] [Scilit]
- Basha, G.; Ratnam, M.V. Identification of atmospheric boundary layer height over a tropical station using high-resolution radiosonde refractivity profiles: Comparison with GPS radio occultation measurements. J. Geophys. Res. Atmos. 2009, 114, D16101. [Google Scholar] [CrossRef] [Scilit]
- Lewis, H.W. A robust method for tropopause altitude identification using GPS radio occultation data. Geophys. Res. Lett. 2009, 36, L12808. [Google Scholar] [CrossRef] [Scilit]
- Schmidt, T.; Wickert, J.; Beyerle, G.; Heise, S. Global tropopause height trends estimated from GPS radio occultation data. Geophys. Res. Lett. 2008, 35, L11806. [Google Scholar] [CrossRef] [Scilit]
- Li, Y.; Kirchengast, G.; Schwaerz, M.; Yuan, Y. Monitoring sudden stratospheric warmings under climate change since 1980 based on reanalysis data verified by radio occultation. Atmos. Chem. Phys. 2023, 23, 1259–1284. [Google Scholar] [CrossRef] [Scilit]
- Li, Y.; Kirchengast, G.; Schwärz, M.; Ladstädter, F.; Yuan, Y. Monitoring sudden stratospheric warmings using radio occultation: A new approach demonstrated based on the 2009 event. Atmos. Meas. Tech. 2021, 14, 2327–2343. [Google Scholar] [CrossRef] [Scilit]
- Teng, H.-F.; Kuo, Y.-H.; Done, J.M. Potential Impacts of Radio Occultation Data Assimilation on Forecast Skill of Tropical Cyclone Formation in the Western North Pacific. Geophys. Res. Lett. 2023, 50, e2021GL096750. [Google Scholar] [CrossRef] [Scilit]
- Lasota, E.; Steiner, A.K.; Kirchengast, G.; Biondi, R. Tropical cyclones vertical structure from GNSS radio occultation: An archive covering the period 2001–2018. Earth Syst. Sci. Data 2020, 12, 2679–2693. [Google Scholar] [CrossRef] [Scilit]
- Ware, R.; Exner, M.; Feng, D.; Gorbunov, M.; Hardy, K.; Herman, B.; Kuo, Y.; Meehan, T.; Melbourne, W.; Rocken, C.; et al. GPS Sounding of the Atmosphere from Low Earth Orbit: Preliminary Results. Bull. Am. Meteorol. Soc. 1996, 77, 19–40. [Google Scholar] [CrossRef] [Scilit]
- Hocke, K. Inversion of GPS meteorology data. Ann. Geophys. 1997, 15, 443–450. [Google Scholar] [CrossRef] [Scilit]
- Rocken, C.; Anthes, R.; Exner, M.; Hunt, D.; Sokolovskiy, S.; Ware, R.; Gorbunov, M.; Schreiner, W.; Feng, D.; Herman, B.; et al. Analysis and validation of GPS/MET data in the neutral atmosphere. J. Geophys. Res. Atmos. 1997, 102, 29849–29866. [Google Scholar] [CrossRef] [Scilit]
- Steiner, A.K.; Kirchengast, G.; Ladreiter, H.P. Inversion, error analysis, and validation of GPS/MET occultation data. Ann. Geophys. 1998, 17, 122–138. [Google Scholar] [CrossRef] [Scilit]
- Wickert, J.; Reigber, C.; Beyerle, G.; König, R.; Marquardt, C.; Schmidt, T.; Grunwaldt, L.; Galas, R.; Meehan, T.K.; Melbourne, W.G.; et al. Atmosphere sounding by GPS radio occultation: First results from CHAMP. Geophys. Res. Lett. 2001, 28, 3263–3266. [Google Scholar] [CrossRef] [Scilit]
- Wickert, J.; Beyerle, G.; König, R.; Heise, S.; Grunwaldt, L.; Michalak, G.; Reigber, C.; Schmidt, T. GPS radio occultation with CHAMP and GRACE: A first look at a new and promising satellite configuration for global atmospheric sounding. Ann. Geophys. 2005, 23, 653–658. [Google Scholar] [CrossRef] [Scilit]
- Schreiner, W.; Rocken, C.; Sokolovskiy, S.; Syndergaard, S.; Hunt, D. Estimates of the precision of GPS radio occultations from the COSMIC/FORMOSAT-3 mission. Geophys. Res. Lett. 2007, 34, L04808. [Google Scholar] [CrossRef] [Scilit]
- Luntama, J.-P.; Kirchengast, G.; Borsche, M.; Foelsche, U.; Steiner, A.; Healy, S.; von Engeln, A.; O’Clerigh, E.; Marquardt, C. Prospects of the EPS GRAS Mission For Operational Atmospheric Applications. Bull. Am. Meteorol. Soc. 2008, 89, 1863–1876. [Google Scholar] [CrossRef] [Scilit]
- Klaes, K.D.; Francois, M.; Carole, L. Metop-B, the second satellite of the EUMETSAT Polar System, in orbit. In Proceedings of the International Society for Optical Engineering, San Diego, CA, USA, 25–29 August 2013; p. 886613. [Google Scholar]
- Righetti, P.L.; de Juana Gamo, J.M.; Sancho, F. Metop-C deployment and start of three-satellite operations. Aeronaut. J. 2020, 124, 902–916. [Google Scholar] [CrossRef] [Scilit]
- Beyerle, G.; Grunwaldt, L.; Heise, S.; Köhler, W.; König, R.; Michalak, G.; Rothacher, M.; Schmidt, T.; Wickert, J.; Tapley, B.D.; et al. First results from the GPS atmosphere sounding experiment TOR aboard the TerraSAR-X satellite. Atmos. Chem. Phys. 2011, 11, 6687–6699. [Google Scholar] [CrossRef] [Scilit]
- Zus, F.; Beyerle, G.; Grunwaldt, L.; Heise, S.; Michalak, G.; Schmidt, T.; Wickert, J. Sensitivity of GPS radio occultation atmospheric soundings wrt open loop signal tracking parameters. In Proceedings of the Joint OPAC-5 & IROWG-3 International Workshop on Occultations for Probing Atmosphere and Climate, Seggau Castle, Leibnitz near Graz, Austria, 5–11 September 2013. [Google Scholar]
- Park, J.-U.; Cho, S.; Lee, W.-K.; Choi, M. Operation of the radio occultation mission in KOMPSAT-5. J. Astron. Space Sci. 2010, 27, 345–352. [Google Scholar] [CrossRef] [Scilit]
- Padullés, R.; Cardellach, E.; Paz, A.; Oliveras, S.; Hunt, D.C.; Sokolovskiy, S.; Weiss, J.P.; Wang, K.N.; Turk, F.J.; Ao, C.O.; et al. The PAZ polarimetric radio occultation research dataset for scientific applications. Earth Syst. Sci. Data 2024, 16, 5643–5663. [Google Scholar] [CrossRef] [Scilit]
- Weiss, J.-P.; Schreiner, W.S.; Braun, J.J.; Xia-Serafino, W.; Huang, C.-Y. COSMIC-2 Mission Summary at Three Years in Orbit. Atmosphere 2022, 13, 1409. [Google Scholar] [CrossRef] [Scilit]
- Donlon, C.; Cullen, R.; Giulicchi, L.; Fornari, M.; Vuilleumier, P. Copernicus Sentinel-6 Michael Freilich Satellite Mission: Overview and Preliminary in Orbit Results. In Proceedings of the 2021 IEEE International Geoscience and Remote Sensing Symposium IGARSS, Brussels, Belgium, 11–16 July 2021; pp. 7732–7735. [Google Scholar]
- Murphy, M.J.; Chattopadhyay, M.; El Akkraoui, A.; Damon, M.R. The Impact of Assimilating Large Volumes of GNSS Radio Occultation Observations from Spire’s Commercial Constellation into NASA’s GEOS. In Proceedings of the 104th American Meteorological Society (AMS) Annual Meeting, Baltimore, MD, USA, 28 January–1 February 2024. [Google Scholar]
- Bowler, N.E. An assessment of GNSS radio occultation data produced by Spire. Q. J. R. Meteorol. Soc. 2020, 146, 3772–3788. [Google Scholar] [CrossRef] [Scilit]
- Shao, H.; Foelsche, U.; Mannucci, A.J.; Azeem, I.; Bowler, N.E.; Braun, J.J.; Lonitz, K.; Marquardt, C.; Steiner, A.K.; Ruston, B.; et al. Advances in GNSS-Based Remote Sensing for Weather, Climate, and Space Weather: Missions, Applications, and Emerging Techniques. Bull. Am. Meteorol. Soc. 2025, 106, E1471–E1477. [Google Scholar] [CrossRef] [Scilit]
- McCormick, C.; Lenz, C.; Smith, D.; Yunck, T. Community Initiative for Continuing Earth Radio Occultation CICERO. In Proceedings of the Small Satellite Conference, Logan, UT, USA, 13–16 August 2007. [Google Scholar]
- Chang, H.; Lee, J.; Yoon, H.; Morton, Y.J.; Saltman, A. Performance assessment of radio occultation data from GeoOptics by comparing with COSMIC data. Earth Planets Space 2022, 74, 108. [Google Scholar] [CrossRef] [Scilit]
- Hao, S.; Liu, X.; Peng, W.; Chen, L.; Liu, K.; Yang, Y. Effects of Tianmu-1 Radio Occultation Data Assimilation on the Super Typhoon Gaemi (2024) Predictions. J. Phys. Conf. Ser. 2025, 3007, 012008. [Google Scholar] [CrossRef] [Scilit]
- Yue, H.; Fu, N.; Li, F.; Cheng, Y.; Wu, M.; Guo, P.; Dong, W.; Hu, X.; Wang, F. The Yunyao LEO Satellite Constellation: Occultation Results of the Neutral Atmosphere Using Multi-System Global Navigation Satellites. Remote Sens. 2025, 17, 2851. [Google Scholar] [CrossRef] [Scilit]
- Hajj, G.A.; Ao, C.O.; Iijima, B.A.; Kuang, D.; Kursinski, E.R.; Mannucci, A.J.; Meehan, T.K.; Romans, L.J.; de la Torre Juarez, M.; Yunck, T.P. CHAMP and SAC-C atmospheric occultation results and intercomparisons. J. Geophys. Res. Atmos. 2004, 109, D06109. [Google Scholar] [CrossRef] [Scilit]
- Angerer, B.; Ladstädter, F.; Scherllin-Pirscher, B.; Schwärz, M.; Steiner, A.K.; Foelsche, U.; Kirchengast, G. Quality aspects of the Wegener Center multi-satellite GPS radio occultation record OPSv5.6. Atmos. Meas. Tech. 2017, 10, 4845–4863. [Google Scholar] [CrossRef] [Scilit]
- Ho, S.-p.; Kirchengast, G.; Leroy, S.; Wickert, J.; Mannucci, A.J.; Steiner, A.; Hunt, D.; Schreiner, W.; Sokolovskiy, S.; Ao, C.; et al. Estimating the uncertainty of using GPS radio occultation data for climate monitoring: Intercomparison of CHAMP refractivity climate records from 2002 to 2006 from different data centers. J. Geophys. Res. Atmos. 2009, 114, D23107. [Google Scholar] [CrossRef] [Scilit]
- Steiner, A.K.; Hunt, D.; Ho, S.P.; Kirchengast, G.; Mannucci, A.J.; Scherllin-Pirscher, B.; Gleisner, H.; von Engeln, A.; Schmidt, T.; Ao, C.; et al. Quantification of structural uncertainty in climate data records from GPS radio occultation. Atmos. Meas. Tech. 2013, 13, 1469–1484. [Google Scholar] [CrossRef] [Scilit]
- Li, Y.; Kirchengast, G.; Scherllin-Pirscher, B.; Wu, S.; Schwaerz, M.; Fritzer, J.; Zhang, S.; Carter, B.; Zhang, K. A new dynamic approach for statistical optimization of GNSS radio occultation bending angles for optimal climate monitoring utility. J. Geophys. Res. 2013, 118, 13022–13040. [Google Scholar] [CrossRef] [Scilit]
- Li, Y.; Kirchengast, G.; Scherllin-Pirscher, B.; Schwaerz, M.; Nielsen, J.K.; Ho, S.-p.; Yuan, Y.-b. A New Algorithm for the Retrieval of Atmospheric Profiles from GNSS Radio Occultation Data in Moist Air and Comparison to 1DVar Retrievals. Remote Sens. 2019, 11, 2729. [Google Scholar] [CrossRef] [Scilit]
- Syndergaard, S.; Nielsen, J.K.; Lauritsen, K.B. Validation Report: Near Real-Time Level 2a Refractivity Profiles: Metop-A (GRM-01, NRPMEA) and Metop-B (GRM-40, NRPMEB) (Version 1.6); SAF/ROM/DMI/RQ/REP/001; DMI, ECMWF, IEEC, METO; EUMETSAT: Darmstadt, Germany, 2016; pp. 1–21. [Google Scholar]
- Syndergaard, S.; Gleisner, H.; Lauritsen, K.B. Validation Report: Offline Level 1B Bending Angle, Level 2A Refractivity, Level 2A Dry Temperature Products (Version 1.1); EUMETSAT: Darmstadt, Germany, 2020; pp. 1–51. [Google Scholar]
- Paolella, S.; Von Engeln, A.; Padovan, S.; Notarpietro, R.; Marquardt, C.; Sancho, F.; Rivas Boscan, V.; Morew, N.; Martin Alemany, F. Assessment of operational non-time-critical Sentinel-6A Michael Freilich radio occultation data: Insights into tropospheric GNSS signal cut-off strategies and processor improvements. Atmos. Meas. Tech. 2025, 18, 2825–2846. [Google Scholar] [CrossRef] [Scilit]
- Masters, D.; Irisov, V.; Nguyen, V.; Duly, T.; Nogués-Correig, O.; Tan, L.; Yuasa, T.; Ringer, J.; Sikarin, R.; Gorbunov, M. Status and plans for Spire’s growing commercial constellation of GNSS science CubeSats. In Proceedings of the Joint 6th ROM SAF User Workshop and 7th IROWG Workshop, Helsingør, Denmark, 19–25 September 2019; pp. 19–25. [Google Scholar]
- Jing, X.; Ho, S.-P.; Shao, X.; Liu, T.-C.; Chen, Y.; Zhou, X. Spire RO Thermal Profiles for Climate Studies: Initial Comparisons of the Measurements from Spire, NOAA-20 ATMS, Radiosonde, and COSMIC-2. Remote Sens. 2023, 15, 3710. [Google Scholar] [CrossRef] [Scilit]
- Schreiner, W.S.; Weiss, J.P.; Anthes, R.A.; Braun, J.; Chu, V.; Fong, J.; Hunt, D.; Kuo, Y.H.; Meehan, T.; Serafino, W.; et al. COSMIC-2 Radio Occultation Constellation: First Results. Geophys. Res. Lett. 2020, 47, e2019GL086841. [Google Scholar] [CrossRef] [Scilit]
- Lee, W.-K.; Cho, S.-K.; Jo, J.-H.; Park, J.-U.; Yoon, J.-C.; Lee, J.-H.; Chun, Y.-S. Atmospheric Profiles from KOMPSAT-5 Radio Occultation: A Simulation Study. In Proceedings of the Korean Institute of Navigation and Port Research Conference, Jeju, Republic of Korea, 18–20 October 2006; pp. 53–56. [Google Scholar]
- Beyerle, G.; Schmidt, T.; Michalak, G.; Heise, S.; Wickert, J.; Reigber, C. GPS radio occultation with GRACE: Atmospheric profiling utilizing the zero difference technique. Geophys. Res. Lett. 2005, 32, L13806. [Google Scholar] [CrossRef] [Scilit]
- Bai, W.; Liu, C.; Meng, X.; Sun, Y.; Kirchengast, G.; Du, Q.; Wang, X.; Yang, G.; Liao, M.; Yang, Z.; et al. Evaluation of atmospheric profiles derived from single- and zero-difference excess phase processing of BeiDou radio occultation data from the FY-3C GNOS mission. Atmos. Meas. Tech. 2018, 11, 819–833. [Google Scholar] [CrossRef] [Scilit]
- Hersbach, H. Global reanalysis: Goodbye ERA-Interim, hello ERA5. ECMWF Newsl. 2019, 159, 17–24. [Google Scholar] [CrossRef]
- Simmons, A.; Soci, C.; Nicolas, J.; Bell, B.; Berrisford, P.; Dragani, R.; Flemming, J.; Haimberger, L.; Healy, S.; Hersbach, H. Global Stratospheric Temperature Bias and Other Stratospheric Aspects of ERA5 and ERA5.1; Technical Memo 859; European Centre for Medium-Range Weather Forecasts: Reading, UK, 2020. [Google Scholar] [CrossRef]
- Lavers, D.A.; Simmons, A.; Vamborg, F.; Rodwell, M.J. An evaluation of ERA5 precipitation for climate monitoring. Q. J. R. Meteorol. Soc. 2022, 148, 3152–3165. [Google Scholar] [CrossRef] [Scilit]
- Scherllin-Pirscher, B.; Syndergaard, S.; Foelsche, U.; Lauritsen, K.B. Generation of a bending angle radio occultation climatology (BAROCLIM) and its use in radio occultation retrievals. Atmos. Meas. Tech. 2015, 8, 109–124. [Google Scholar] [CrossRef] [Scilit]
- Syndergaard, S.; Healy, S.; Lauritsen, K.B. Validation Report: Reprocessed Level 1B Bending Angle, Level 2A Refractivity, Level 2A Dry Temperature CDR v1.0 Products (Version 1.2); SAF/ROM/DMI/REP/1DVAR/001—ROM SAF Consortium (DMI, ECMWF, IEEC, UKMO); EUMETSAT: Darmstadt, Germany, 2018; pp. 1–157. [Google Scholar]
- Pirscher, B. Multi-Satellite Climatologies of Fundamental Atmospheric Variables from Radio Occultation and Their Validation. Ph.D. Thesis, Wegener Center Verlag, Graz, Austria, 2010. [Google Scholar]
- Li, Y.; Kirchengast, G.; Scherllin-Pirscher, B.; Norman, R.; Yuan, Y.B.; Fritzer, J.; Schwaerz, M.; Zhang, K. Dynamic statistical optimization of GNSS radio occultation bending angles: Advanced algorithm and performance analysis. Atmos. Meas. Tech. 2015, 8, 3447–3465. [Google Scholar] [CrossRef] [Scilit]
- Gonzalez-Esparza, J.A.; Sanchez-Garcia, E.; Sergeeva, M.; Corona-Romero, P.; Gonzalez-Mendez, L.X.; Valdes-Galicia, J.F.; Aguilar-Rodriguez, E.; Rodriguez-Martinez, M.; Ramirez-Pacheco, C.; Castellanos, C.I.; et al. The Mother’s Day Geomagnetic Storm on 10 May 2024: Aurora Observations and Low Latitude Space Weather Effects in Mexico. Space Weather 2024, 22, e2024SW004111. [Google Scholar] [CrossRef] [Scilit]
- Nayak, K.; Carrillo-Vargas, A.; Urias, C.L.; Romero-Andrade, R.; Nava, G.C.; Caccavari-Garza, A. Regional variability and multiscale dynamics of ionospheric total electron content during the intense geomagnetic storm of May 10, 2024, in central Mexico. Adv. Space Res. 2025, 76, 7412–7432. [Google Scholar] [CrossRef] [Scilit]
- Bowler, N.E.; Eyre, J.; Forsythe, M.; Healy, S.B.; Lauritsen, K.B. An Initial Assessment of the Quality of RO Data from Metop-C; SAF/ROM/METO/REP/RSR/034; EUMETSAT: Darmstadt, Germany, 2019. [Google Scholar]

Disclaimer/Publisher’s Note: The statements, opinions and data contained in all publications are solely those of the individual author(s) and contributor(s) and not of MDPI and/or the editor(s). MDPI and/or the editor(s) disclaim responsibility for any injury to people or property resulting from any ideas, methods, instructions or products referred to in the content. |
© 2026 by the authors. Licensee MDPI, Basel, Switzerland. This article is an open access article distributed under the terms and conditions of the Creative Commons Attribution (CC BY) license.