


Highlights
What are the main findings?
- An AI training dataset for thunderstorm monitoring and forecasting (AITDTS) is constructed, encompassing 85,071 thunderstorm events and 3,973,171 corresponding gridded samples at 10 min temporal resolution and 1 km × 1 km spatial resolution across China from 2016 to 2023, with thunderstorm occurrence labels, radar parameters, and environmental factors.
What are the implications of the main findings?
- The AITDTS provides high-quality spatiotemporal gridded data that can directly support the training and validation of deep learning models for AI-driven thunderstorm nowcasting and potential forecasting tasks.
- The quantified feature contribution analysis offers a reliable reference for optimizing the selection of input features in thunderstorm prediction models, enhancing their generalization capability.
Abstract
A thunderstorm is a weather system that can trigger severe natural disasters, characterized by sudden onset, short duration, and significant damage. Accurate forecasting of thunderstorms has long been a challenging task. Data-driven artificial intelligence (AI) technologies have provided new solutions, yet AI-driven thunderstorm forecasting still lacks high-quality thunderstorm training datasets. Leveraging lightning data from the China Meteorological Administration’s Advanced Direction and Time-of-Arrival Detecting (ADTD) network and the three-dimensional Very Low Frequency/Low Frequency (VLF/LF) lightning location data of the Institute of Electrical Engineering, Chinese Academy of Sciences, we have constructed an AI training dataset for thunderstorms over China (AITDTS) through four sequential procedures: rigorous data quality control, multi-source integration, thunderstorm-prone area labeling, and feature extraction. The AITDTS encompasses 85,071 thunderstorm events and 3,973,171 corresponding gridded samples at 10 min temporal resolution and 1 km × 1 km spatial resolution across China during 2016–2023. Each sample includes location labels, 38 radar-derived physical parameters with a 10-min temporal resolution and 62 environmental parameters with an hourly temporal resolution. We further quantified predictor information gain for thunderstorm forecasting: radar echo top/base heights, composite reflectivity, vertical integrated liquid water content and reflectivity at 10 km showed high information gain. Atmospheric instability, dynamic uplifting, moisture conditions and vertical wind shear at 1 km exhibited moderate information gain. The AITDTS can be directly applied to training and evaluation of AI-driven forecasting models, offering critical data for thunderstorm nowcasting.
1. Introduction
Thunderstorms, particularly severe ones accompanied by strong gales, hail and flash floods, are one of the natural phenomena that have attracted extensive attention in contemporary atmospheric science. As direct causes of numerous weather disasters, they pose a severe threat to public safety and endanger people’s lives and property [1,2]. Accurately forecasting the spatiotemporal occurrence of thunderstorms remains a prominent research topic worldwide. Currently, the forecasting and early warning of thunderstorms mainly rely on the extrapolation of radiosonde and radar observations, coupled with numerical weather prediction (NWP) models. However, since thunderstorms occur over short timescales (0–3 h) and small scales (1–10 km), conventional weather observations are often insufficient to reveal the evolution of thunderstorms at the meso-γ to meso-β scale. Statistical extrapolation based on observations exhibits limited forecasting capability due to its weak ability to capture the nonlinear dynamics of mesoscale convective systems. Numerical prediction models perform less effectively than statistical extrapolation methods on nowcasting due to the model spin-up issue [3]. From 2010 to 2018, the threat scores (TS) of 12 h thunderstorm forecasts from the National Meteorological Center ranged from 0.2 to 0.3, which are far from satisfying operational requirements, and the improvement in forecasting performance over this period was quite limited [4]. The TS of 6 h thunderstorm forecasts from the U.S. National Oceanic and Atmospheric Administration (NOAA) Storm Prediction Center are only 0.155–0.213 [5]. Therefore, improving the accuracy of thunderstorm forecasting is an urgent scientific challenge.
In recent years, with the continuous advancement in high-performance computing capabilities, data-driven machine learning and deep learning technologies have been widely used in the field of weather forecasting. Relevant studies have proved that artificial intelligence (AI) technologies exhibit considerable potential in forecasting thunderstorms at meso- and microscale, which numerical weather prediction cannot yet adequately address [6,7]. A variety of machine learning and deep learning algorithms have been applied to thunderstorm forecasting based on various observations including radar, ground-based stations, lightning location systems, radiosonde soundings and satellites, as well as mesoscale numerical model products [8,9,10,11], all of which have exhibited higher forecasting performance compared with operational weather forecasts.
AI models require vast volumes of data for training to learn the complex relationships between target predictions (i.e., truth values or labels) and predictors (i.e., features), from which robust forecasting models can be derived. Training data thus constitute the fundamental basis of AI-driven forecasting systems. Most AI algorithms used in weather forecasting are based on supervised learning, in which model training processes aim to iteratively minimize the discrepancy between model predictions and labeled target values (ground truth values). Consequently, the quantity and quality of training data are key determinants of model forecasting performance, rendering high-quality, large-sample and well-labeled training datasets an indispensable prerequisite for machine learning applications [12,13,14].
Several research institutions worldwide have developed AI training datasets specifically tailored to severe convective weather (SCW). The Massachusetts Institute of Technology (MIT) developed the Storm Event Imagery (SEVIR) dataset for deep learning applications, which contains 10,000 convective events such as thunderstorms, thunderstorm gusts and hail. This dataset incorporates the visible (0.6 µm) and infrared (6.9 and 10.7 µm) channels of the Geostationary Operational Environmental Satellite-16, lightning imager data, and vertical integrated liquid water content (VIL) radar measurements, as well as storm event labels from the National Centers for Environmental Information (NCEI) [15]. In addition, several research institutions in the United States jointly developed an AI training dataset containing 548,383 extreme weather events—namely, the Severe Reflectivity Image Dataset (SVRIMG)—which provides radar composite reflectivity (CR) and corresponding extreme weather report labels derived from the Storm Prediction Center (SPC), National Oceanic and Atmospheric Administration (NOAA) [16]. These datasets have been applied in some recent studies [17,18]. However, existing datasets still have distinct limitations. First, labeled data are mostly derived from remote sensing retrievals or single-station observations. Remote sensing retrievals may not accurately represent actual surface conditions, while single-station observations cannot meet the requirements of deep learning models for spatiotemporally continuous two-dimensional coverage. Additionally, most predictor variables are confined to a single spatial scale, lacking multi-scale descriptors that characterize the full evolution of SCW. Actually, the occurrence and development of SCW are not only related to meso- and microscale weather conditions, but also substantially influenced by large-scale synoptic backgrounds.
To improve AI-driven thunderstorm forecasting models, constructing a high-quality training dataset is crucial and fundamental. Motivated by operational and professional thunderstorm forecasting applications, in this study, we integrate multi-source historical thunderstorm cases and related meteorological data to develop an AI training dataset for thunderstorms across China (AITDTS). The dataset encompasses radar parameters, environmental factors and thunderstorm area labels of 85,071 thunderstorm events from 2016 to 2023, which can be directly applied to the training of AI-driven thunderstorm forecasting models.
The remainder of this paper is organized as follows. Section 2 outlines the data sources and data processing methods employed in this study. Section 3 introduces the sampling algorithm and the spatio-temporal distribution characteristics of thunderstorms over China. Section 4 presents the extraction of thunderstorm-related predictors. Section 5 details the construction of thunderstorm labels. Section 6 describes the overall organization and structure of the dataset. Section 7 illustrates typical application scenarios of the dataset. Finally, the discussion and main conclusions of this research are summarized in Section 8 and Section 9.
2. Data and Methodology
2.1. Data Description
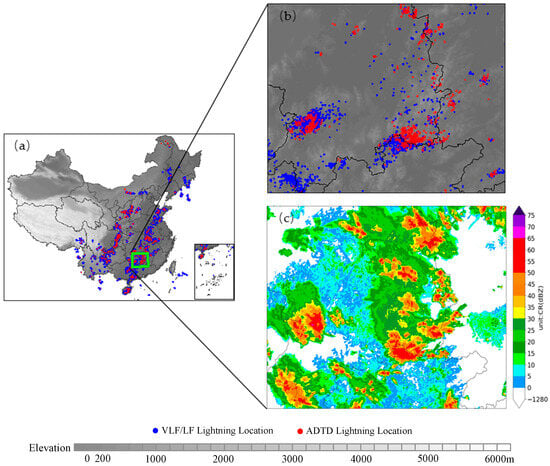
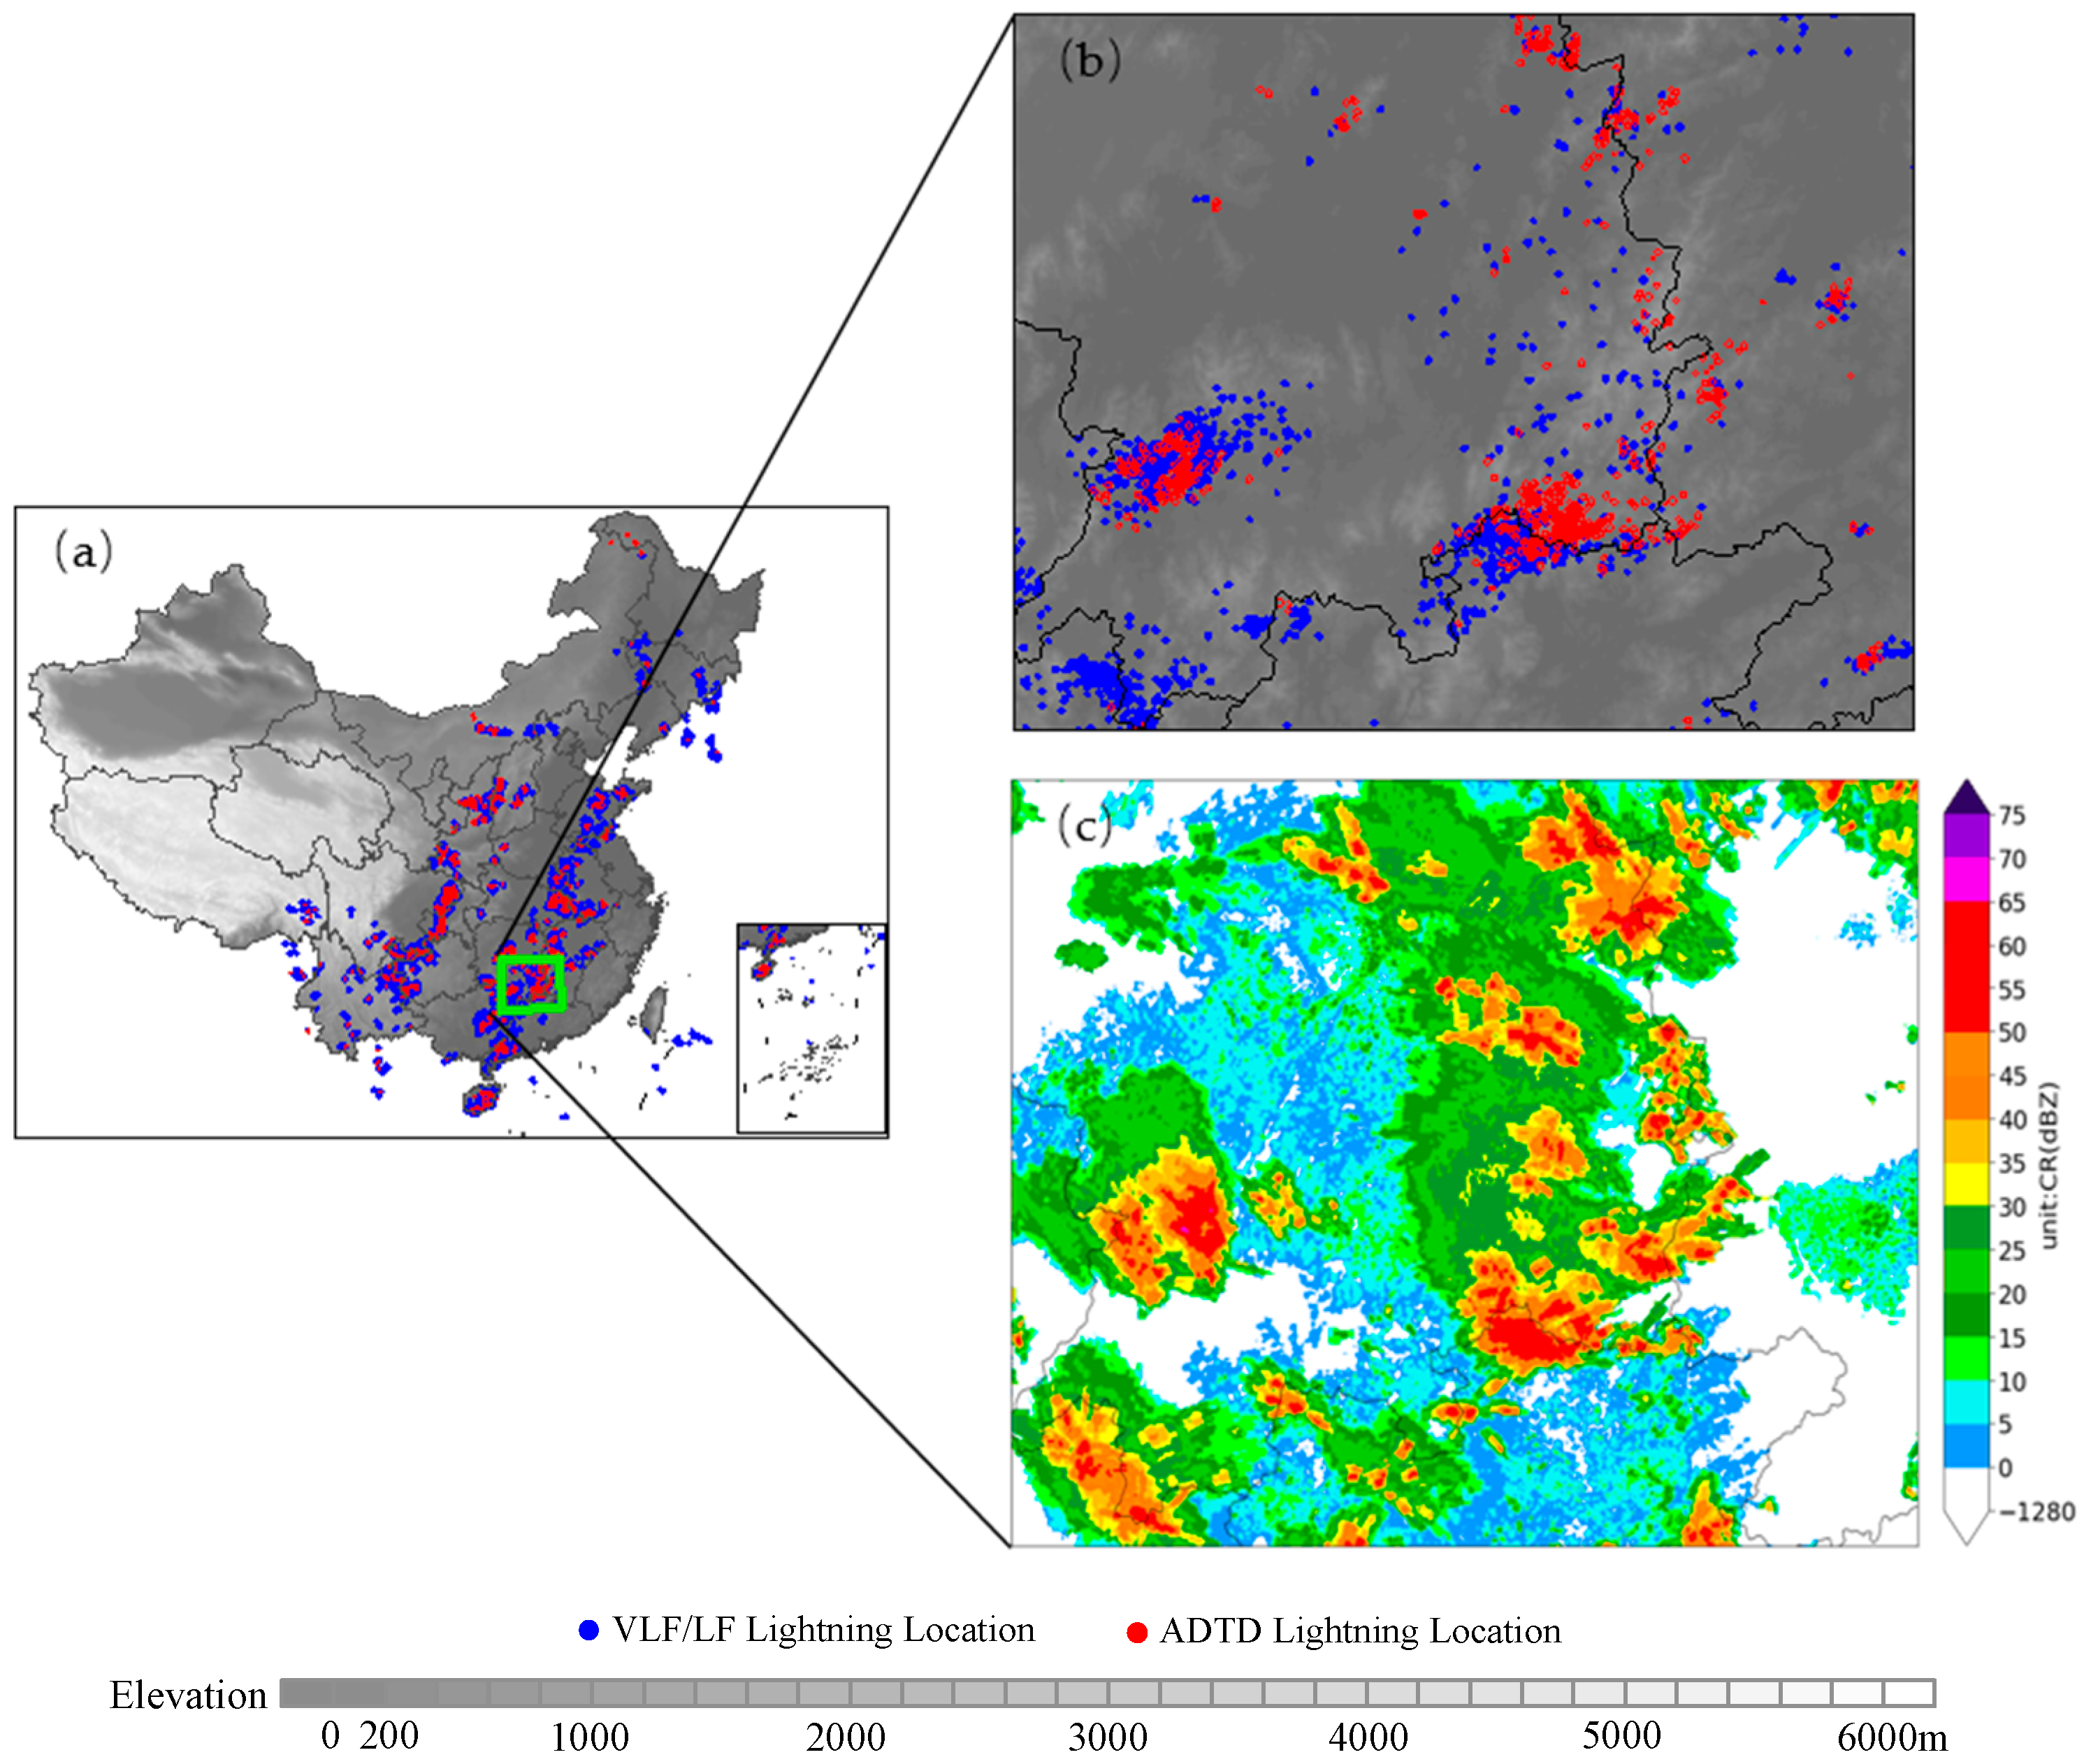
A thunderstorm is defined as a convective weather phenomenon accompanied by electrical discharges occurring within cumulonimbus clouds, among clouds, or between clouds and the ground, characterized by lightning and thunder—though instances with audible thunder but no visible lightning have also been documented [19]. Only manual observations of thunderstorm weather phenomena were conducted up to 2013, before the upgrade and development of automated observation. To accurately delineate thunderstorm occurrence areas, this study primarily utilizes lightning location observation data collected across China from 2016 to 2023 to construct a training dataset for AI-driven thunderstorm identification and forecasting, which incorporates historical thunderstorm events along with their associated radar parameters and environmental factors derived from the numerical reanalysis product. The lightning location observation data consists of cloud-to-ground (CG) lightning observations from the Advanced Direction and Time-of-Arrival Detecting (ADTD) system and the total lightning observations (intracloud [IC] and CG lightning) of the three-dimensional Very Low Frequency/Low Frequency (VLF/LF) lightning location system. The ADTD system exhibits a horizontal localization error below 400 m and a detection efficiency of 80–90%, while the VLF/LF system shows a horizontal localization error below 300 m and a vertical localization error below 500 m, with detection efficiencies exceeding 90% for cloud-to-ground lightning and about 45% for intra-cloud lightning [20,21,22]. The observational parameters include altitude, peak current intensity, return-stroke steepness, which is defined as the maximum rate of rise of the lightning return-stroke current, and localization mode, which includes two-dimensional and three-dimensional modes. The two data sources are complementary in both temporal and spatial coverage. Figure 1 presents an example of lightning locations observed by the two systems during 15:00–15:10 (Beijing Time, BJT) on 31 July 2016. Weather radar data were obtained from a network of 256 weather radars in the land area of China. The numerical reanalysis product is the hourly regional reanalysis dataset, developed by the CMA Earth System Modeling and Prediction Center based on the CMA Mesoscale Numerical Weather Prediction Model coupled with three-dimensional variational data assimilation, with a horizontal spatial resolution of 3 km.
Figure 1.
Spatial distribution diagram of (a) lightning location during 15:00–15:10 on 31 July 2016. (b) illustrates the lightning location and (c) the associated radar CR in the green box in (a).
2.2. Lightning Data Quality Control
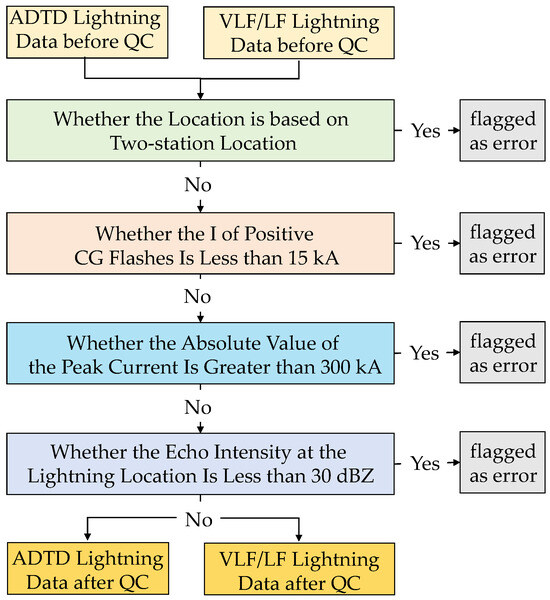
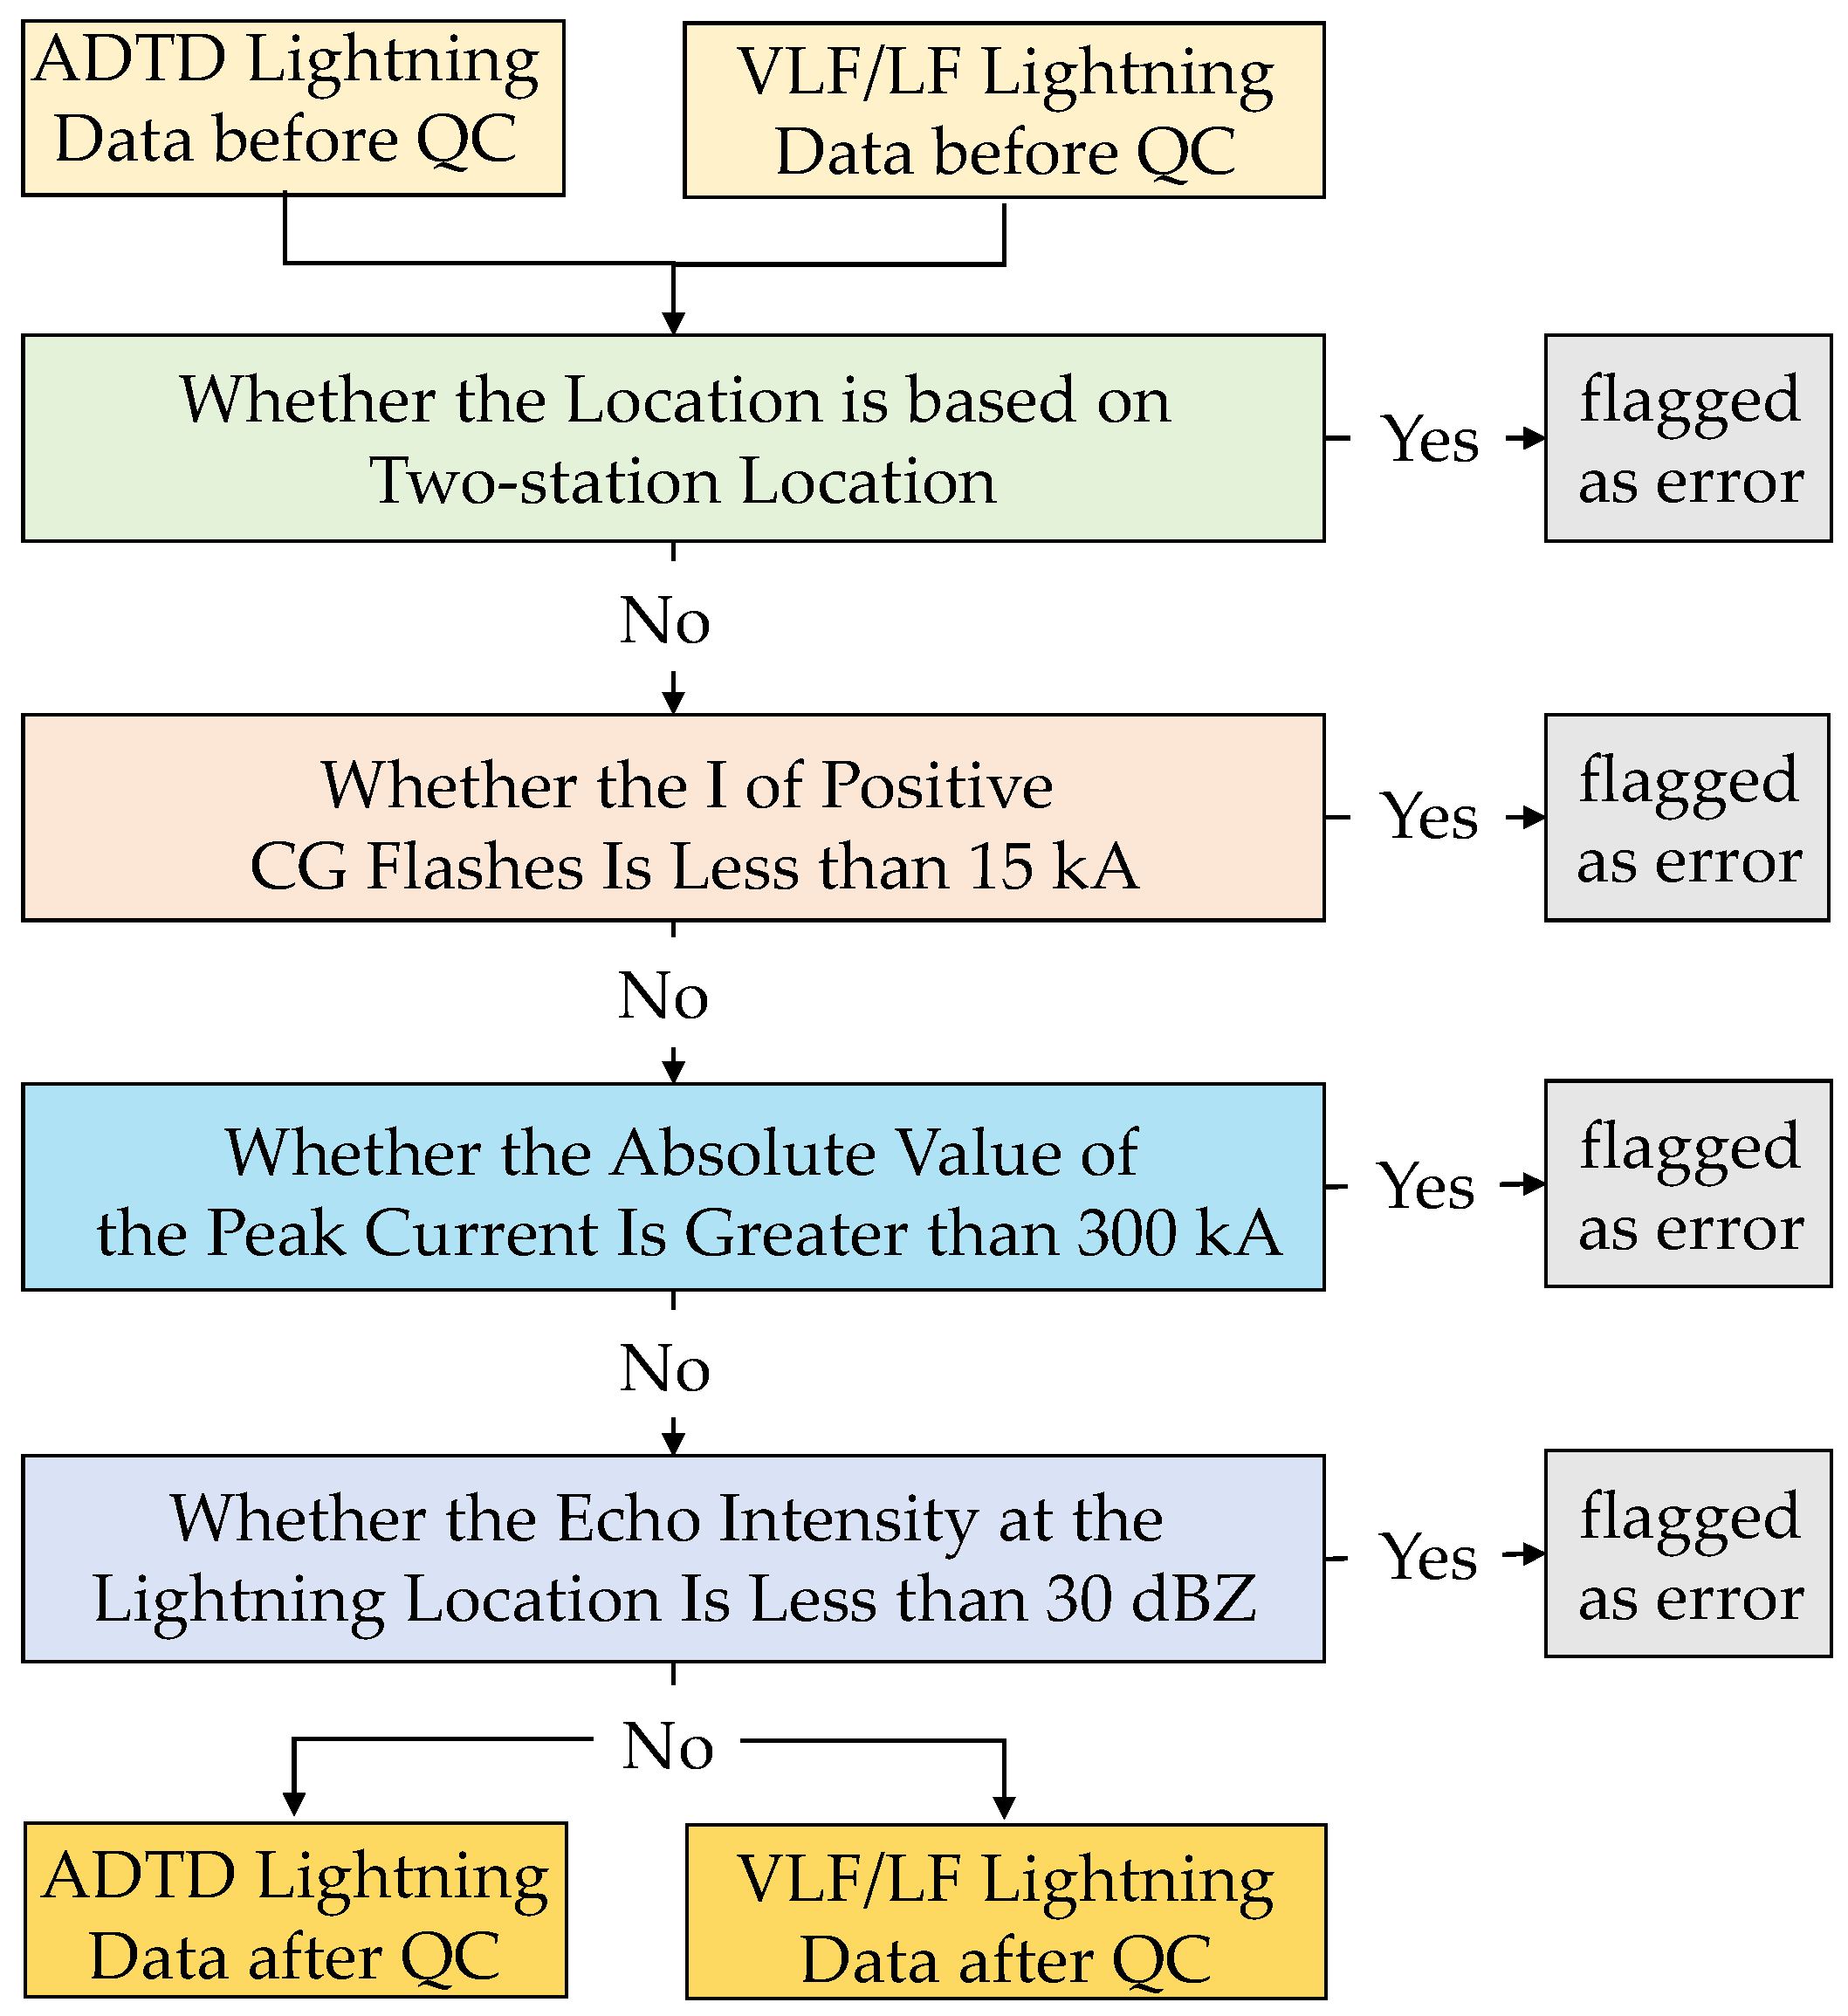
High-quality and highly reliable lightning data form the foundation of training dataset construction. Lightning detection systems are prone to uncertainties stemming from localization techniques, electromagnetic interference, algorithms and detection efficiency, which may induce data distortion or inaccuracies [23,24]. To ensure the reliability of the training dataset, quality control (QC) procedures are implemented separately to the ADTD and VLF/LF data. As shown in Figure 2, the QC framework includes localization mode validation, peak current intensity threshold screening, and consistency validation with radar reflectivity data.
Figure 2.
The process of quality control (QC) of lightning data: “two-station location” in the figure means determining the lightning location by the intersection of bearing lines of lightning electromagnetic signals detected by two stations.
Location mode-based checking: According to the detection principles of lightning localization systems and findings from prior studies, a minimum of three stations are required to accurately determine the geographic location of lightning strikes. Lightning strikes detected by only two stations exhibit considerable uncertainties in both location accuracy and peak current estimation [25]. Therefore, lightning records derived from two stations are excluded in the initial quality control step.
Current intensity-based filtering: Previous studies have demonstrated that positive lightning strikes with a peak current intensity (I) less than 15 kA cannot be reliably identify as CG strikes, and that the detection efficiency for positive CG strikes with peak currents below this threshold is extremely low [26,27]. In addition, lightning events with an absolute I value exceeding 300 kA are considered to be associated with large uncertainties [24]. Accordingly, positive CG strikes with I less than 15 kA and extreme lightning events with an absolute I value greater than 300 kA were excluded to minimize uncertainties in the training dataset.
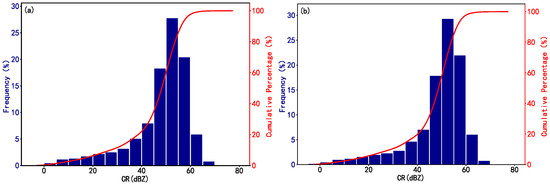
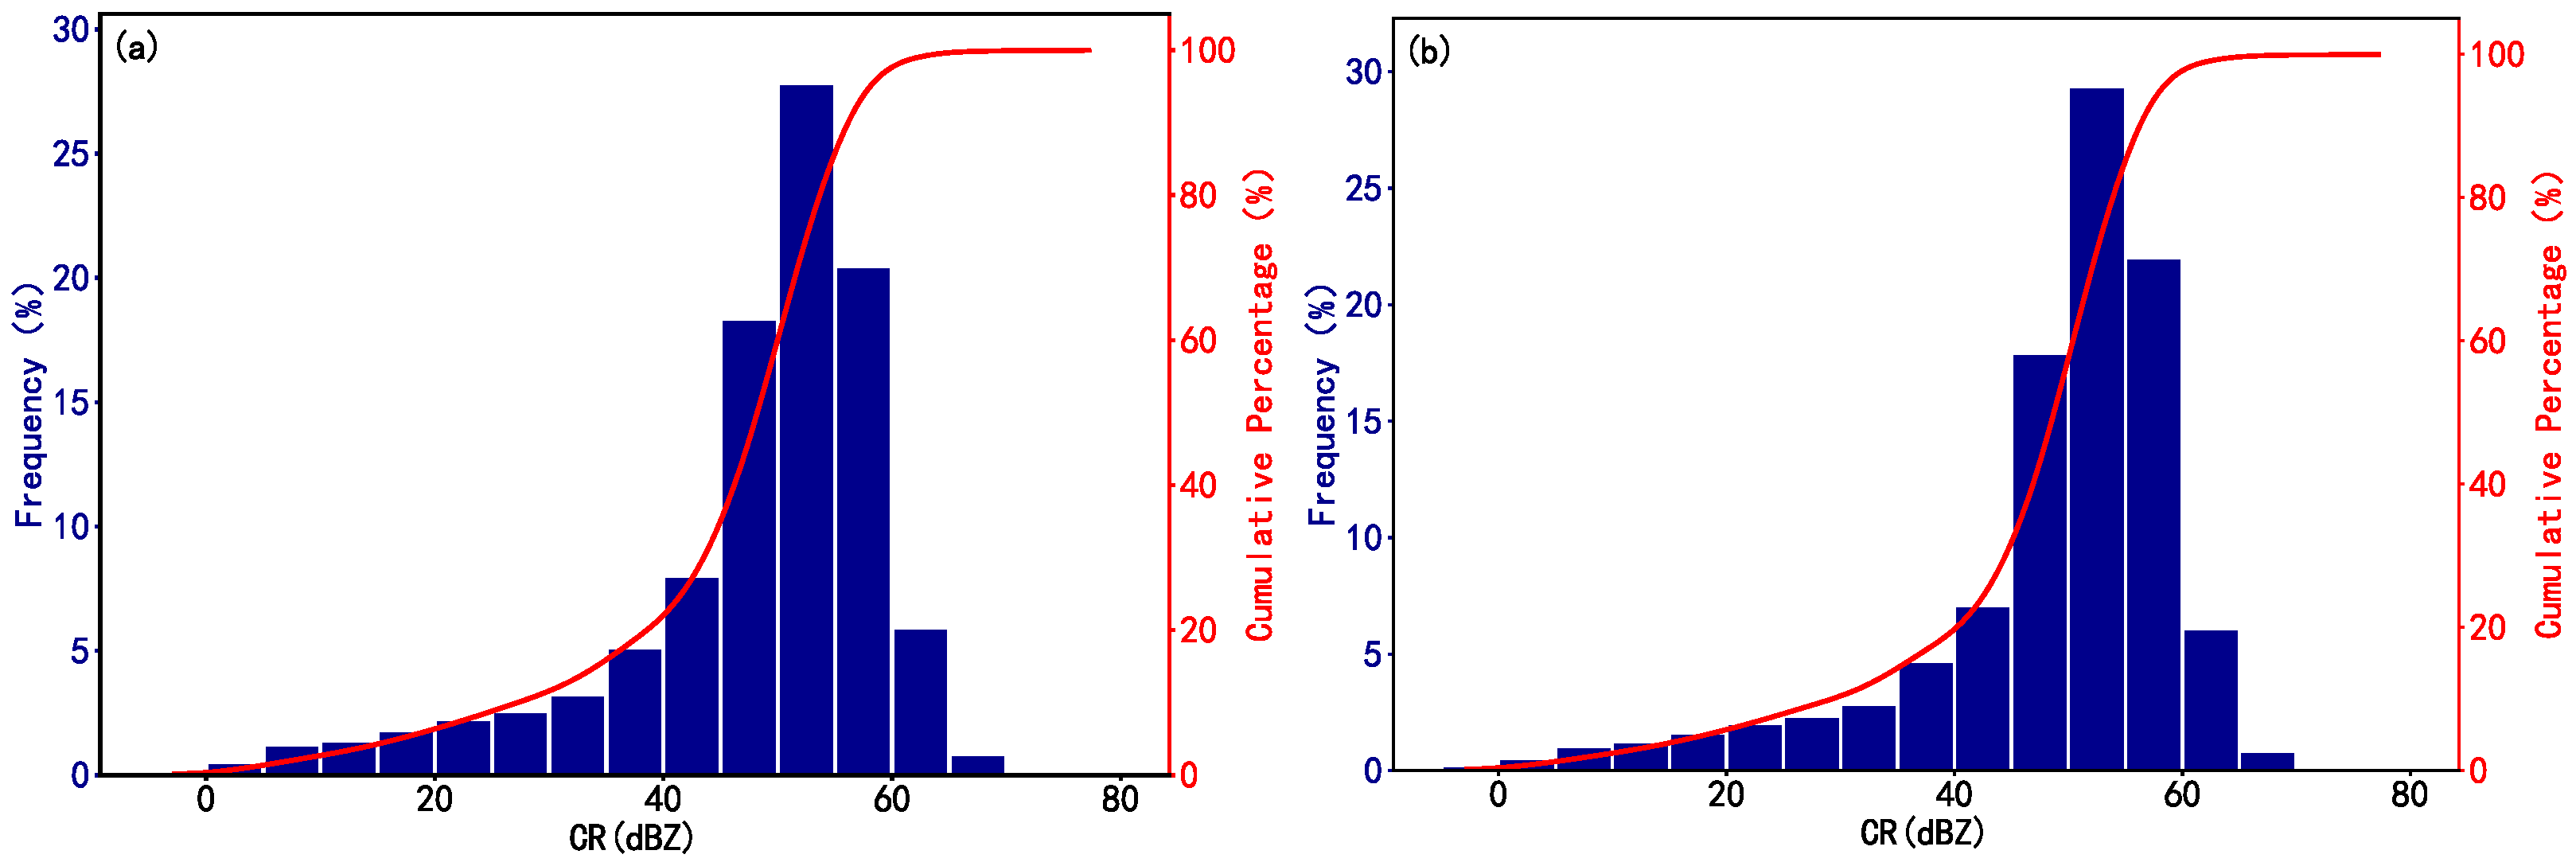
Radar reflectivity-based validation: Thunderstorm weather systems are typically characterized by convective clouds with high liquid or solid water content, which are associated with intense radar echoes. Taking the occurrence time and geographic location of lightning strikes as the reference, the maximum value of the radar composite reflectivity (CR) within the 7 km × 7 km spatial window centered at the strike location which matches the meso-β/γ scale was extracted by matching the nearest temporal radar frame following the nearest-time matching principle, where the radar CR mosaic products have a 10 min temporal resolution and a 1 km × 1 km spatial resolution. Subsequently, the relationships between CR and occurrence frequencies of IC and CG strikes, which are distinguished according to the flash type recorded in the observation, were statistically analyzed at 5 dBZ intervals (Figure 3), in order to determine the CR threshold ranges corresponding to lightning occurrence. Figure 3 illustrates the occurrence frequency of IC and CG strikes across different CR bins. The results indicate that when CR < 30 dBZ, the lightning occurrence frequency is low (<5%) and increases slowly with rising CR values. When CR ≥ 30 dBZ, the lightning occurrence frequency increases rapidly with increasing CR. Therefore, a CR threshold of 30 dBZ is adopted as the criterion for identifying valid lightning occurrences. Lightning records with CR values of <30 dBZ are considered unreliable and are excluded, thereby effectively eliminating lightning data acquired under clear-sky or weak-echo conditions [28,29].
Figure 3.
The relationships between CR and frequency/cumulative percentage of IC and CG strikes, which are distinguished according to the flash type recorded in the observation: (a) IC lightning and (b) CG lightning.
After implementation of the above quality control procedures, the valid data ratios for total lightning, positive strikes, negative strikes, CG strikes, and positive CG strikes in the VLF/LF data were determined to be 92.367%, 88.417%, 93.589%, 93.646%, and 89.482%, respectively. Based on the valid data, the proportion of CG and positive CG strikes relative to total lightning strikes were 65.821% and 11.830%. For the ADTD data, the valid ratios of total lightning, positive CG strikes, and negative CG strikes were identified as 91.285%, 89.141%, and 91.953%, respectively. For the VLF/LF and ADTD data, the proportions of records meeting the criteria of |I| > 300 kA, 0 kA < I < 15 kA and CR < 30 dBZ were 7.63% and 8.715%, respectively (Table 1). These records were excluded from the sampling and processing pipeline. Through these quality control procedures, the accuracy and representativeness of the thunderstorm samples were ensured, providing a robust and reliable data foundation for subsequent thunderstorm-related research and the development of AI-driven forecasting models.
Table 1.
Statistics of quality control results for VLF/LF and ADTD lightning data.
2.3. Integration of Multi-Source Lightning Data
As illustrated in Figure 1, the ADTD and VLF/LF data exhibit complementary characteristics and spatiotemporal overlap. To maximize the utilization of available lightning information, it is necessary to integrate the two data sources into a unified dataset that achieves spatiotemporal complementarity while eliminating duplicate records.
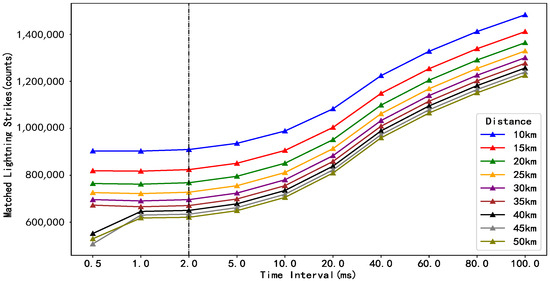
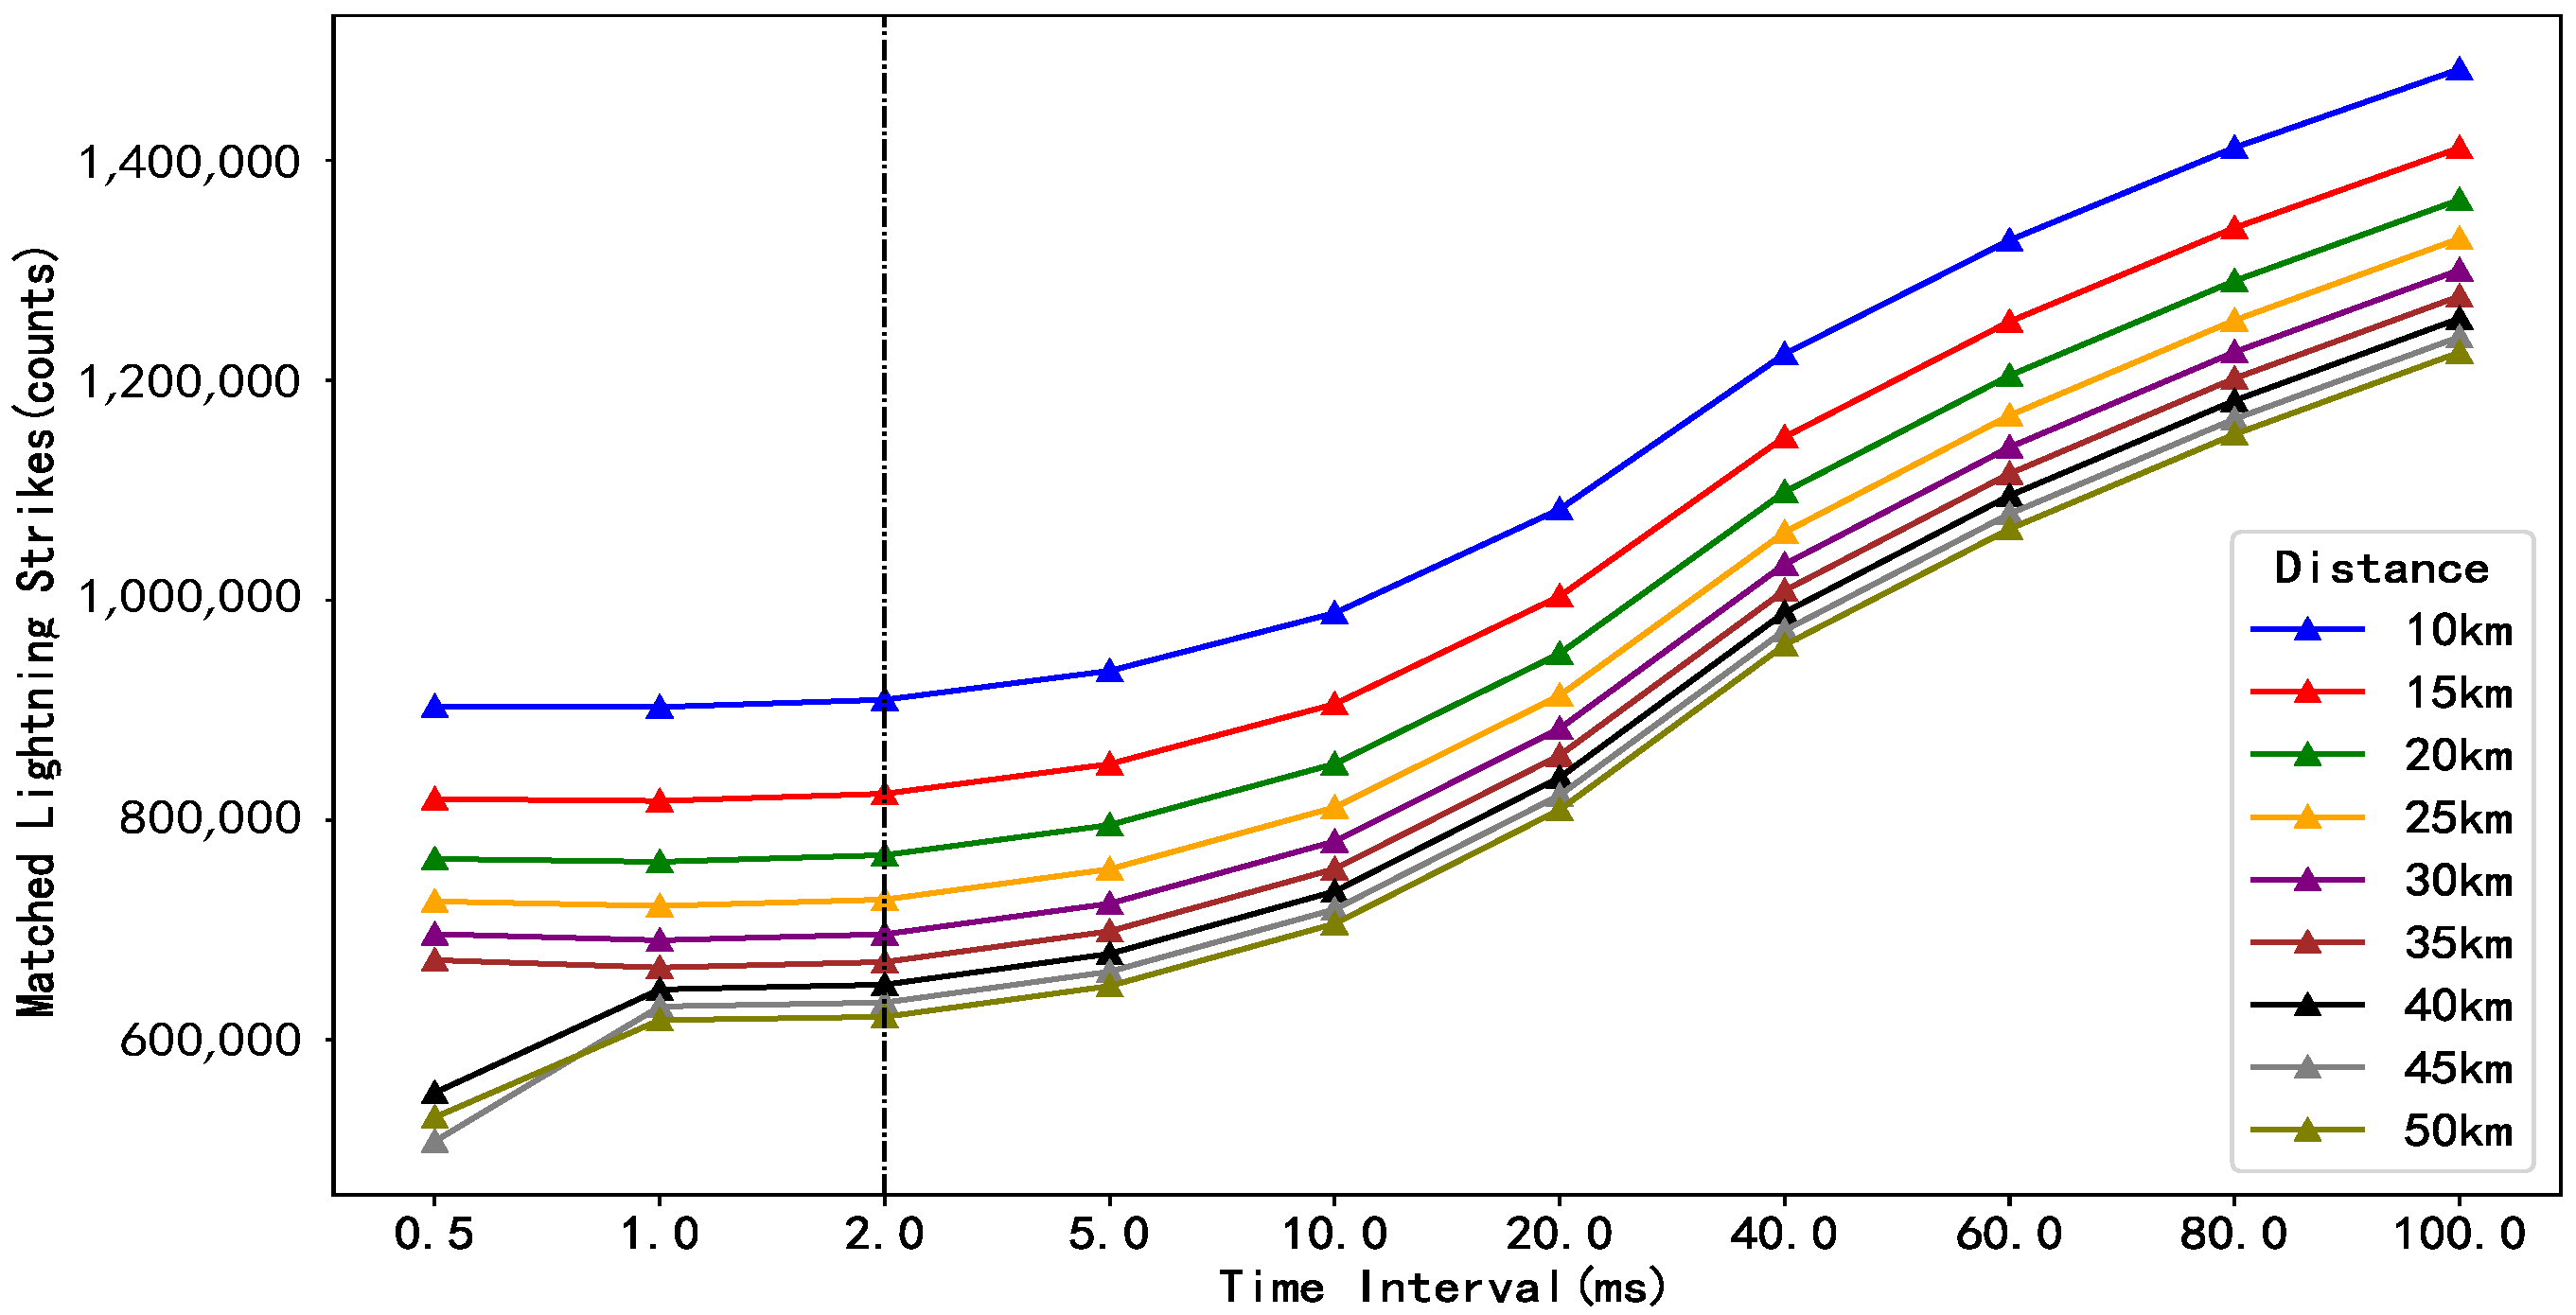
Data integration aims to eliminate duplicate records from both sources within overlapping temporal windows and spatial domains, while retaining mutually complementary observations. Therefore, appropriate temporal interval (T∆) and spatial distance (D∆) thresholds must be defined to determine whether the records from the two sources correspond to the same lightning event, which is known as a single lightning discharge process. Following the evaluation methodology proposed by Kleshcheva [30] and Bürgesser [31], the temporal interval threshold (T∆) and the spatial distance threshold (D∆) were determined based on the frequency variation curves of ADTD lightning strikes that can be matched to VLF/LF lightning strikes under different T∆ and D∆ combinations. For the same lightning event occurring within a given spatial range (or temporal window), the occurrence time (or location) should differ only slightly. That is, the frequency of ADTD strikes matched with the VLF/LF strikes varies gently with variations in the temporal interval (spatial distance). Therefore, the temporal interval (spatial distance) at which the variation rate of the matched strike frequency approaches 0 was selected as the threshold for identifying duplicate records. Based on this criterion, T∆ was set to 2 ms, and D∆ was set to 40 km (Figure 4).
Figure 4.
The matched CG strikes detected by ADTD in the field of view of VLF/LF for different distance thresholds and time intervals. Colors represent different distance thresholds. Curves indicate the variation in matched CG strikes for each distance under different time intervals. The black line with black triangles denotes the selected distance threshold, and the vertical black dashed line marks the selected time interval.
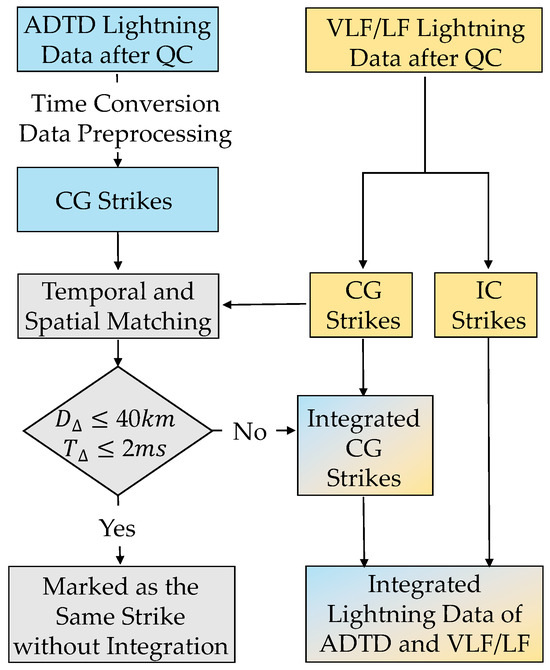
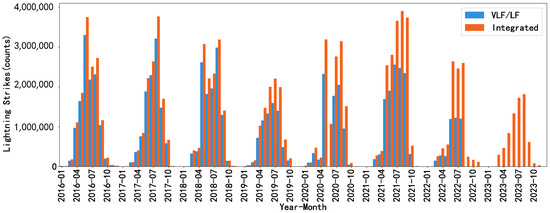
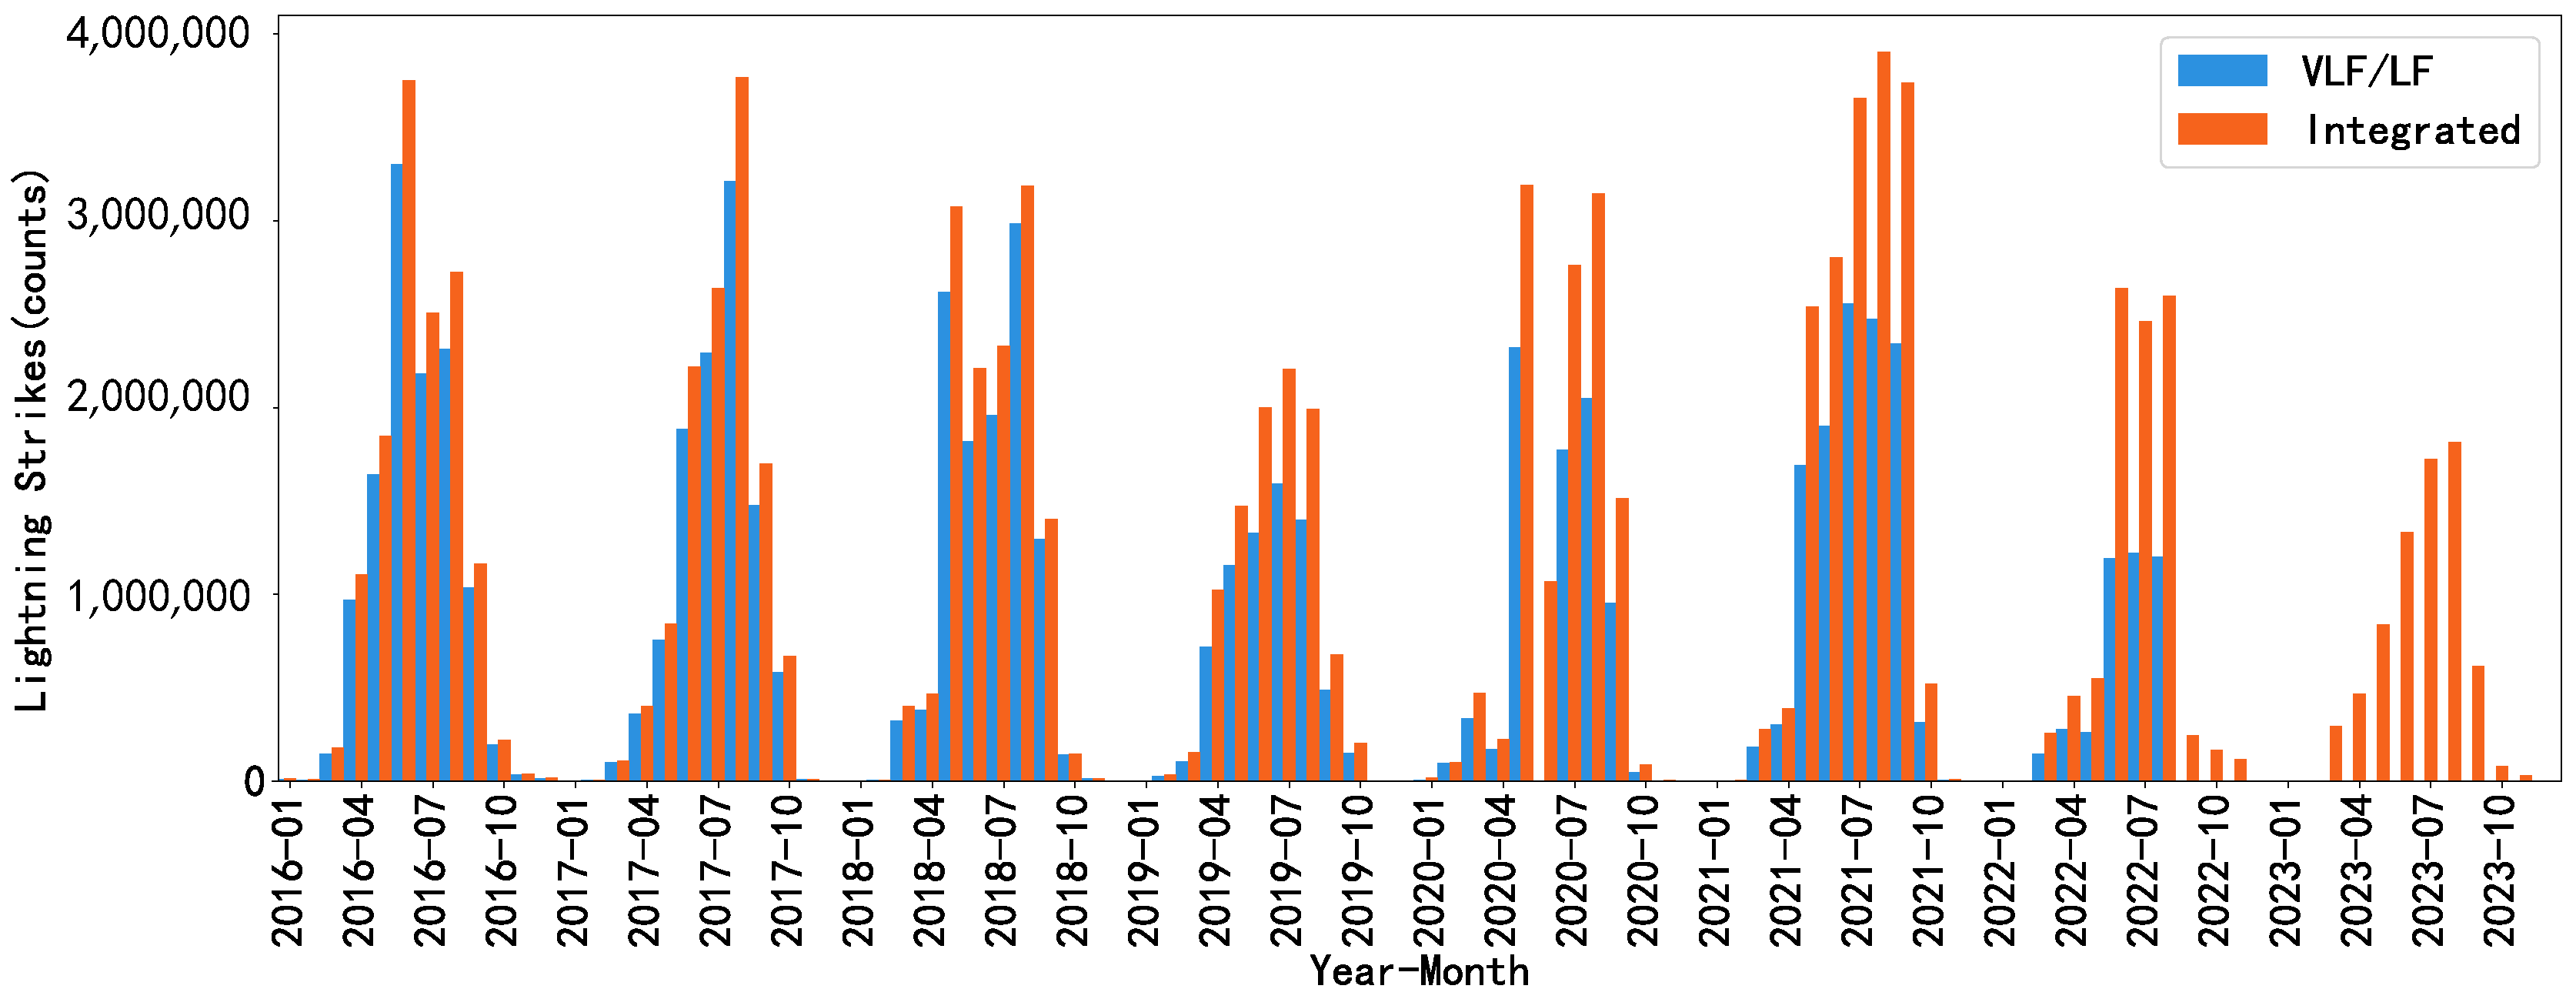
Figure 5 illustrates the data integration workflow adopted, which is detailed as follows. First, all VLF/LF IC flashes were retained in full. Then, using the VLF/LF CG strikes as the reference, the ADTD CG strikes that correspond to the same lightning events as the VLF/LF records were removed in accordance with the duplicate record identification criteria. Finally, the remaining CG strikes in the ADTD data were merged with the VLF/LF data to generate a unified, integrated lightning dataset (UILD). Compared with the original data, the resulting integrated lightning dataset exhibits superior spatiotemporal completeness, as visualized in Figure 6. It should be noted that the reduction in lightning strike counts after August 2022 is primarily attributable to the unavailability of VLF/LF lightning data during this period, and the increase in lightning strike counts in the summers of 2021 and 2022 is due to the addition of 241 observation stations in 2021, along with the upgrade of the observation system from two-dimensional to three-dimensional that enhanced its detection capability.
Figure 5.
Technical scheme for the integration of ADTD and VLF/LF lightning data after quality control (QC).
Figure 6.
Time series of lightning strikes: the light blue and orange represent VLF/LF and integrated lightning, respectively; the integrated total valid lightning strikes show a 48.033% increase vs. single VLF/LF data.
3. Data Sampling
Thunderstorm events are characterized by a low occurrence probability. Data samples during thunderstorm periods serve as positive samples in the dataset and should be included as comprehensively as possible. The dataset should also contain an adequate number of samples from non-thunderstorm periods, referred to as negative samples. In addition, given that the intended application of the dataset is time-series forecasting, the samples should consist of sequences spanning multiple consecutive time steps. Therefore, the sample series constructed consist of multiple consecutive time intervals that encompass both thunderstorm and non-thunderstorm events.
3.1. Sampling Algorithm for Thunderstorm Events
Lightning activity is typically concentrated in the most intensely convective regions of thunderstorm clouds, manifesting as clusters of densely distributed lightning flashes [32]. Numerous studies have confirmed the feasibility of identifying thunderstorm systems based on ground-based lightning location observations [33,34]. Lightning location observations consist of discrete, single-point, single-time lightning strike records, whereas studies on thunderstorm physical processes emphasize the “process-oriented” characteristics and “spatiotemporal continuity” of thunderstorm initiation, development and dissipation. In addition, each individual thunderstorm event corresponds to a multitude of discrete strike records. Therefore, we adopt a clustering algorithm to aggregate individual lightning strike records into cohesive thunderstorm events based on the integrated lightning dataset (UILD). Each identified thunderstorm event includes key information: start time, end time, spatial extent, and the minimum and maximum current intensity values.
The clustering method used in this study is the Density-Based Spatial Clustering of Applications with Noise (DBSCAN), proposed by Ester et al. [35,36]. DBSCAN is a density-based spatial clustering algorithm that partitions spatially contiguous regions of sufficiently high density into distinct clusters. Its basic principle is as follows: If the number of neighboring points within a specified neighborhood radius (ε) exceeds a minimum number of points (minPts), the point is classified as a core point, and its neighboring points are further searched recursively. If the number of neighboring points is less than minPts yet the point lies within the neighborhood of a core point, it is classified as a boundary point, and no further neighborhood search is performed. If the number of neighboring points is less than minPts and the point does not fall within the neighborhood of any core point, it is classified as a noise point. Core points and boundary points are assigned to the same cluster. An important advantage of the DBSCAN algorithm is that it is not restricted by the distribution shape of sample points, enabling it to identify clusters of arbitrary shapes in spatial datasets [37,38].
In this research, the spatial neighborhood radius (ε), time window (εtime) and minimum number of points (minPts) are used as clustering parameters. Considering the meso- and microscale dynamical characteristics of thunderstorm systems, the thresholds of these parameters are set to ε = 40 km, εtime = 10 min and minPts = 5. Based on the DBSCAN algorithm, we search for target samples within a 40 km radius of each lightning sample point (P) in the lightning location dataset (D). If there are at least 5 neighboring lightning samples within 40 km of a given lightning sample P, a cluster with P as the core point is initialized. Neighboring lightning samples within the 40 km radius and 10 min interval of the core point are iteratively identified and assigned to the same cluster. This process may also involve cluster merging when overlapping clusters are detected. The clustering process terminates when no additional sample points within the 40 km spatial radius or 10 min interval of any existing cluster can be incorporated. The clustering criteria can be mathematically expressed as Equation (1).
where D and T represent the Euclidean distance (km) and time difference (minutes) between any two lightning strikes, respectively. Pnum denotes the number of lightning strikes constituting a thunderstorm event. F represents the clustering success indicator. When F < 1, it signifies that the corresponding lightning strikes can be clustered into one coherent thunderstorm event.
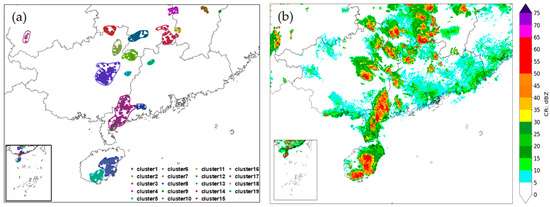
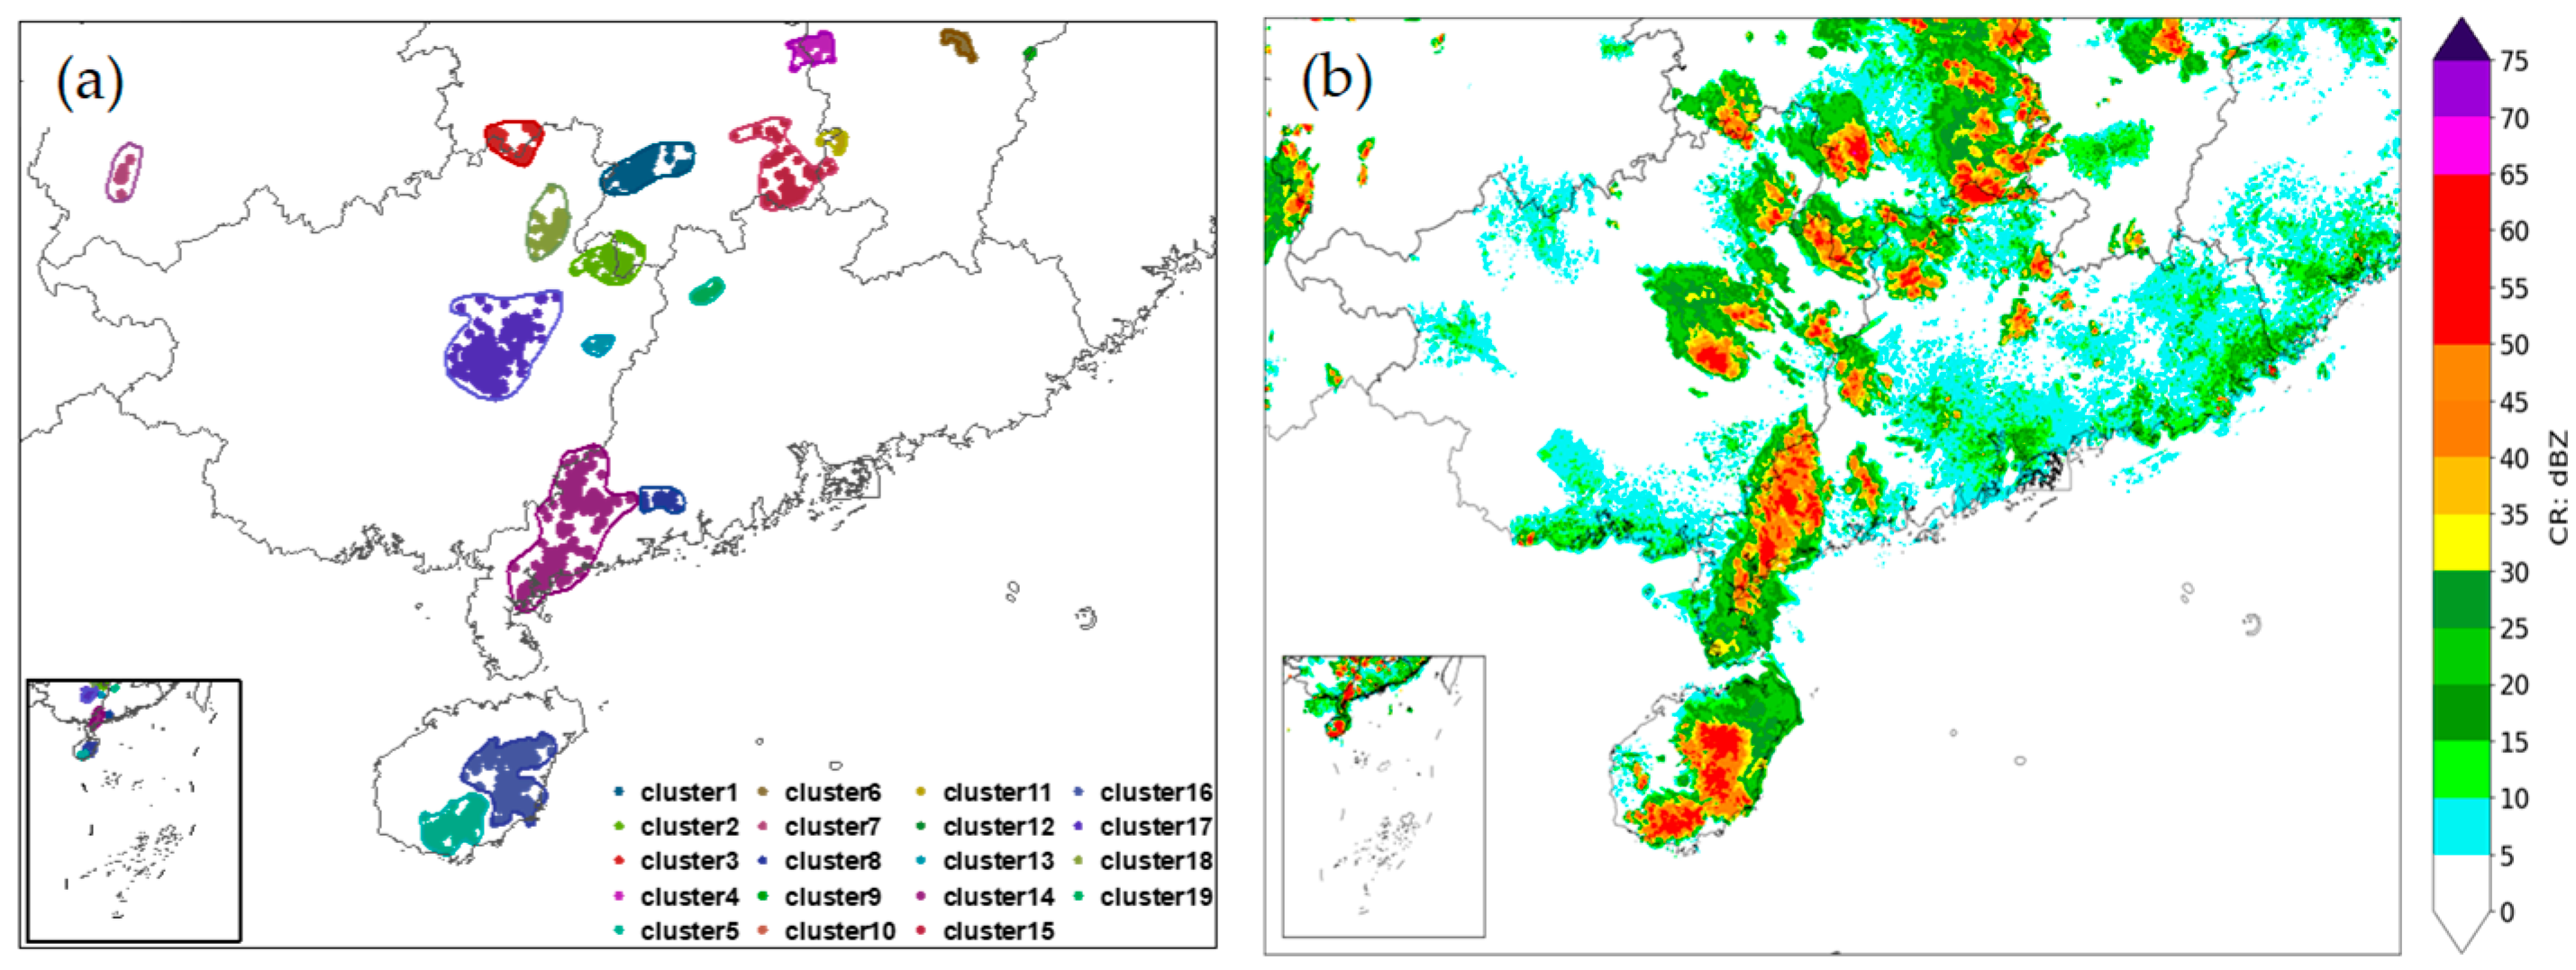
For each single thunderstorm event (TSE-S) formed by clustering, the onset (and termination) time is defined as the earliest (latest) lightning occurrence time during the clustering procedure, and its spatial extent corresponds to the spatial coverage of the cluster. Figure 7 shows an example of the clustering results for TSE-S events. It can be seen that the spatial distribution of the clustered TSE-S events is generally consistent with that of the radar CR. Distinct TSE-S events with overlapping temporal windows are merged into a composite thunderstorm event (TSE-C). Through this procedure, a total of 85,071 TSE-Cs were ultimately obtained. Simultaneously, key characteristics of each TSE-C, such as peak intensity, minimum intensity, and event duration, were also recorded. For each mesoscale and microscale TSE-C, to continuously and completely record its initiation, development, and dissipation characteristics, while also expanding the number of the non-thunderstorm (negative) samples, the time window of the TSE-C was defined as the period ranging from 3 h prior to the TSE-C onset time to 3 h following the TSE-C termination time. For each TSE-C, radar-derived parameters and environmental factors associated with the event were extracted within this temporal window and across China.
Figure 7.
Example of (a) lightning strikes clustering during 15:00–15:10 on 31 July 2016 and its correlation with (b) radar CR distribution: strikes marked with the same color are clustered as the same single thunderstorm event (TSE-S), and these TSE-Ss are merged into the same TSE-C since these TSE-Ss overlap in time.
3.2. Distribution Characteristics of Thunderstorm Events
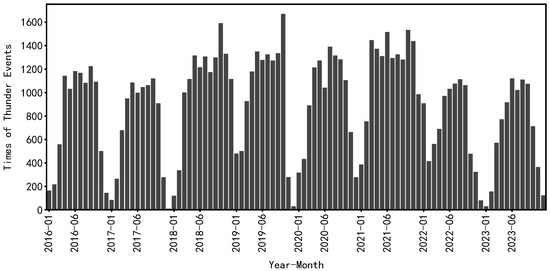
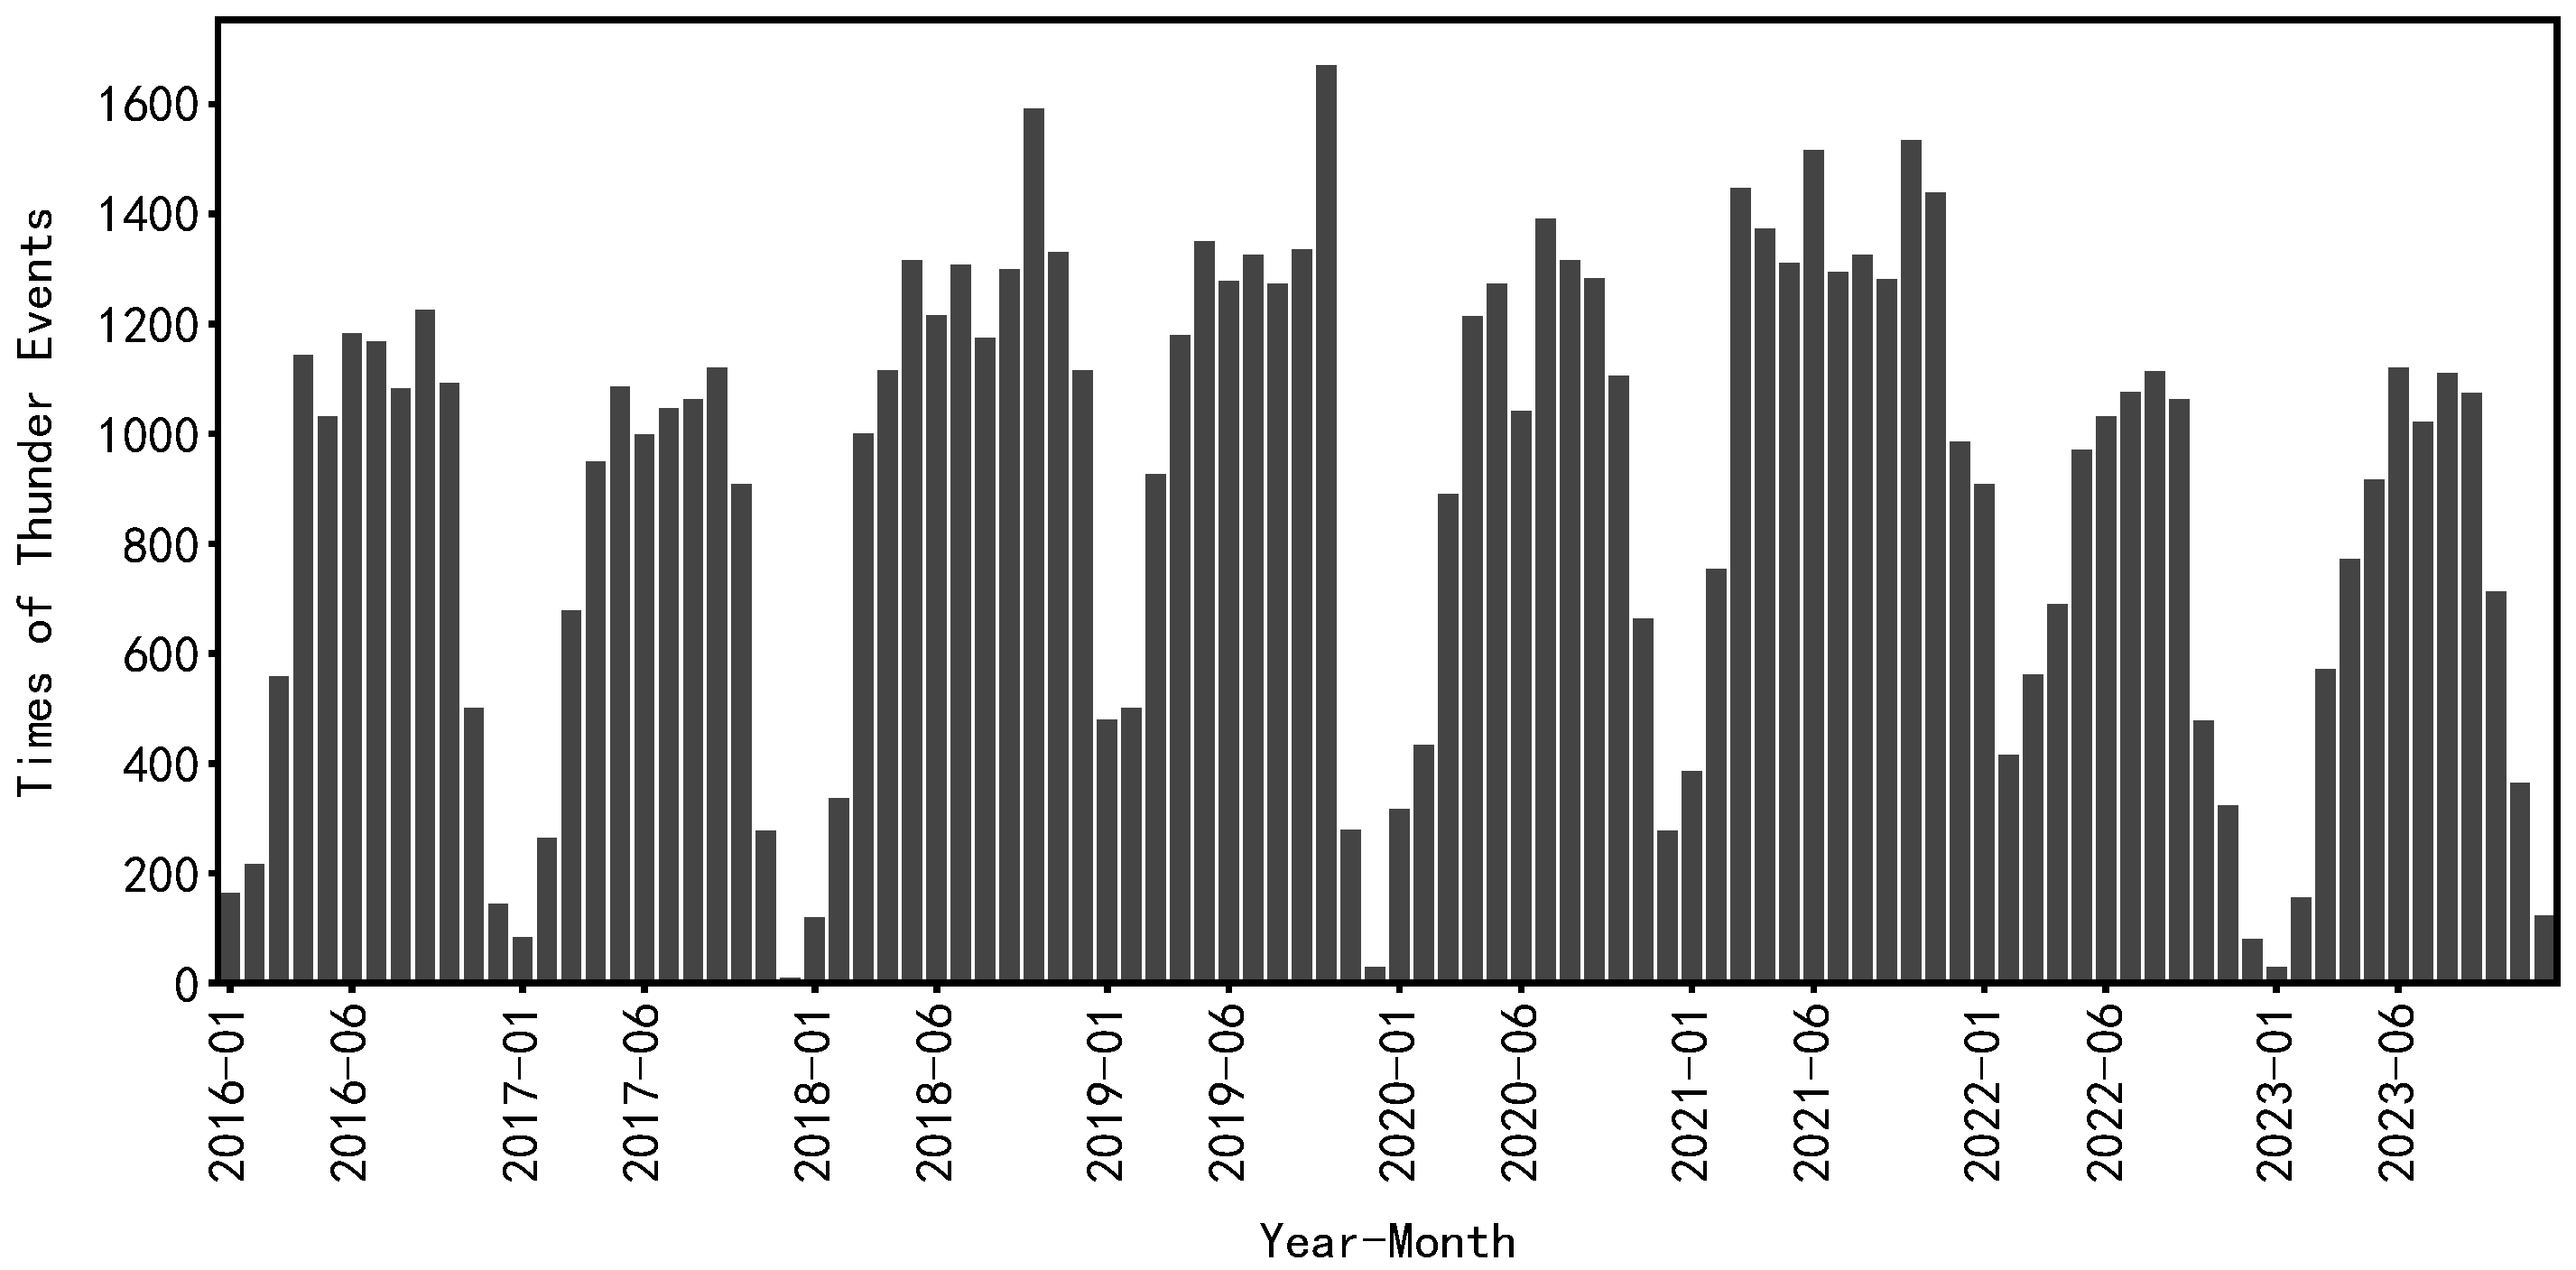
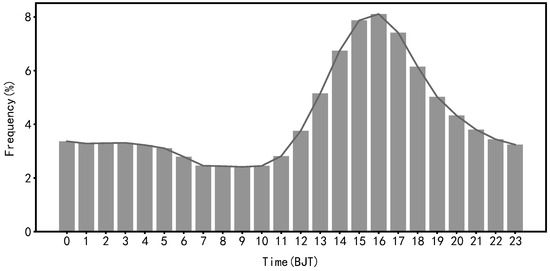
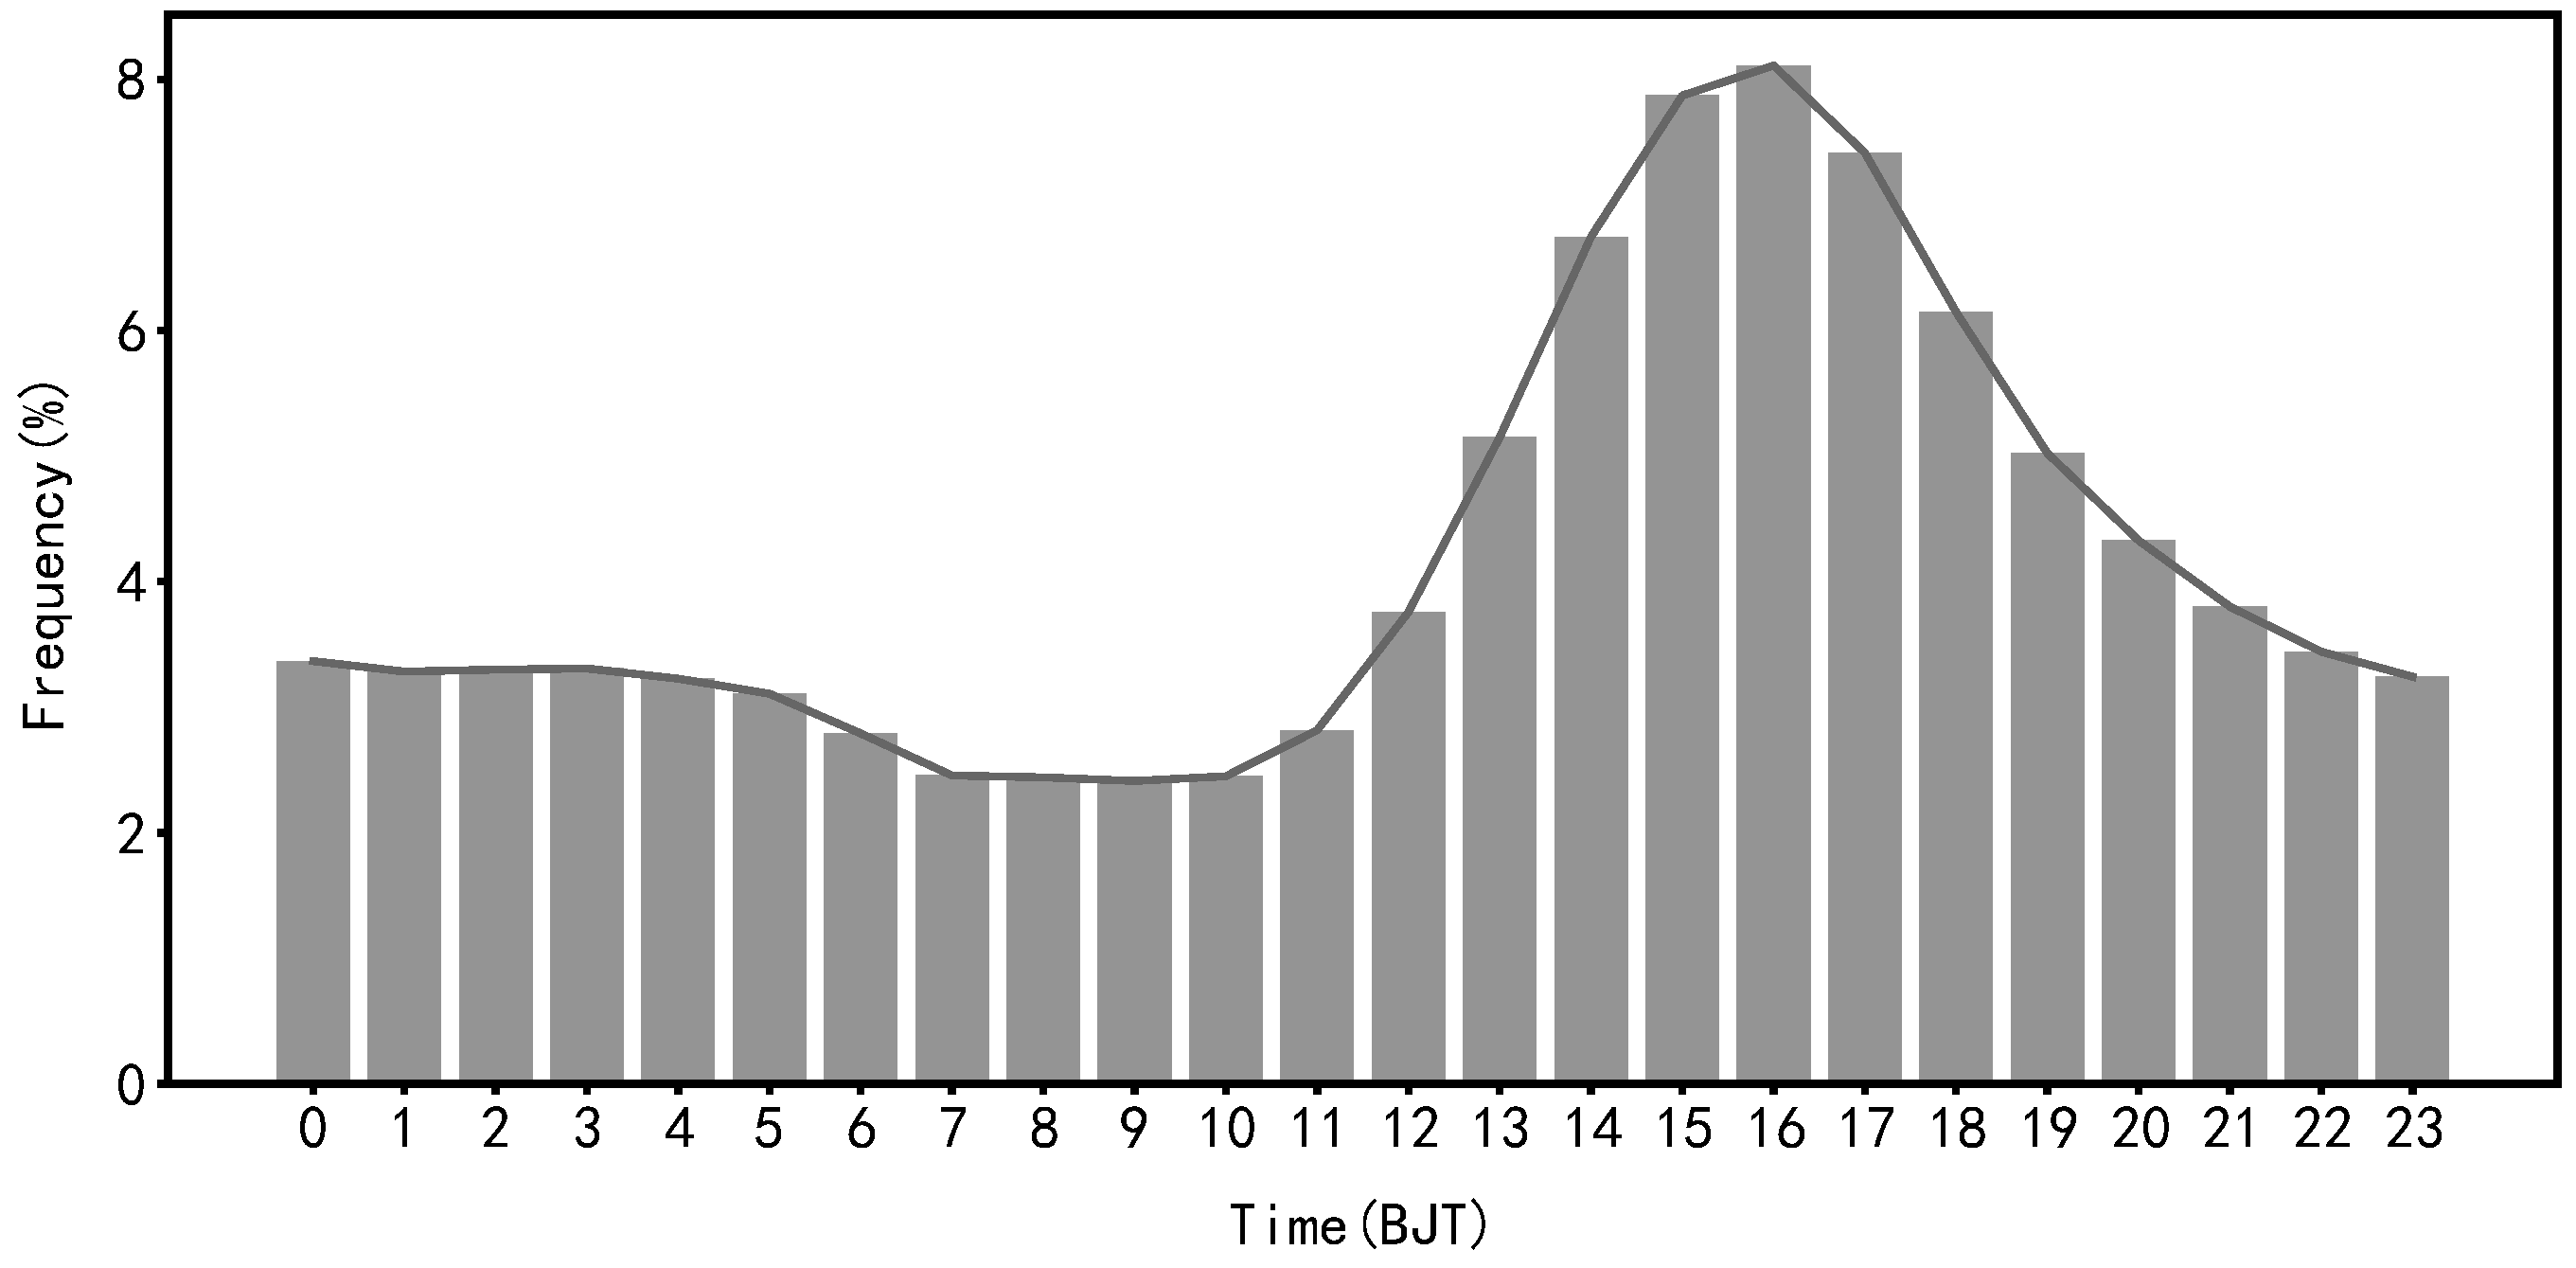
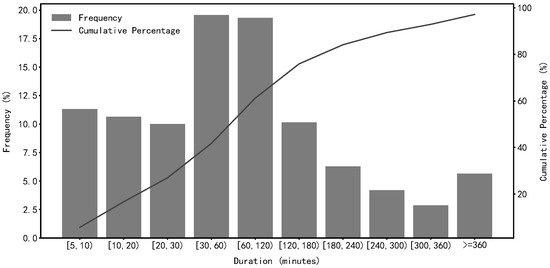
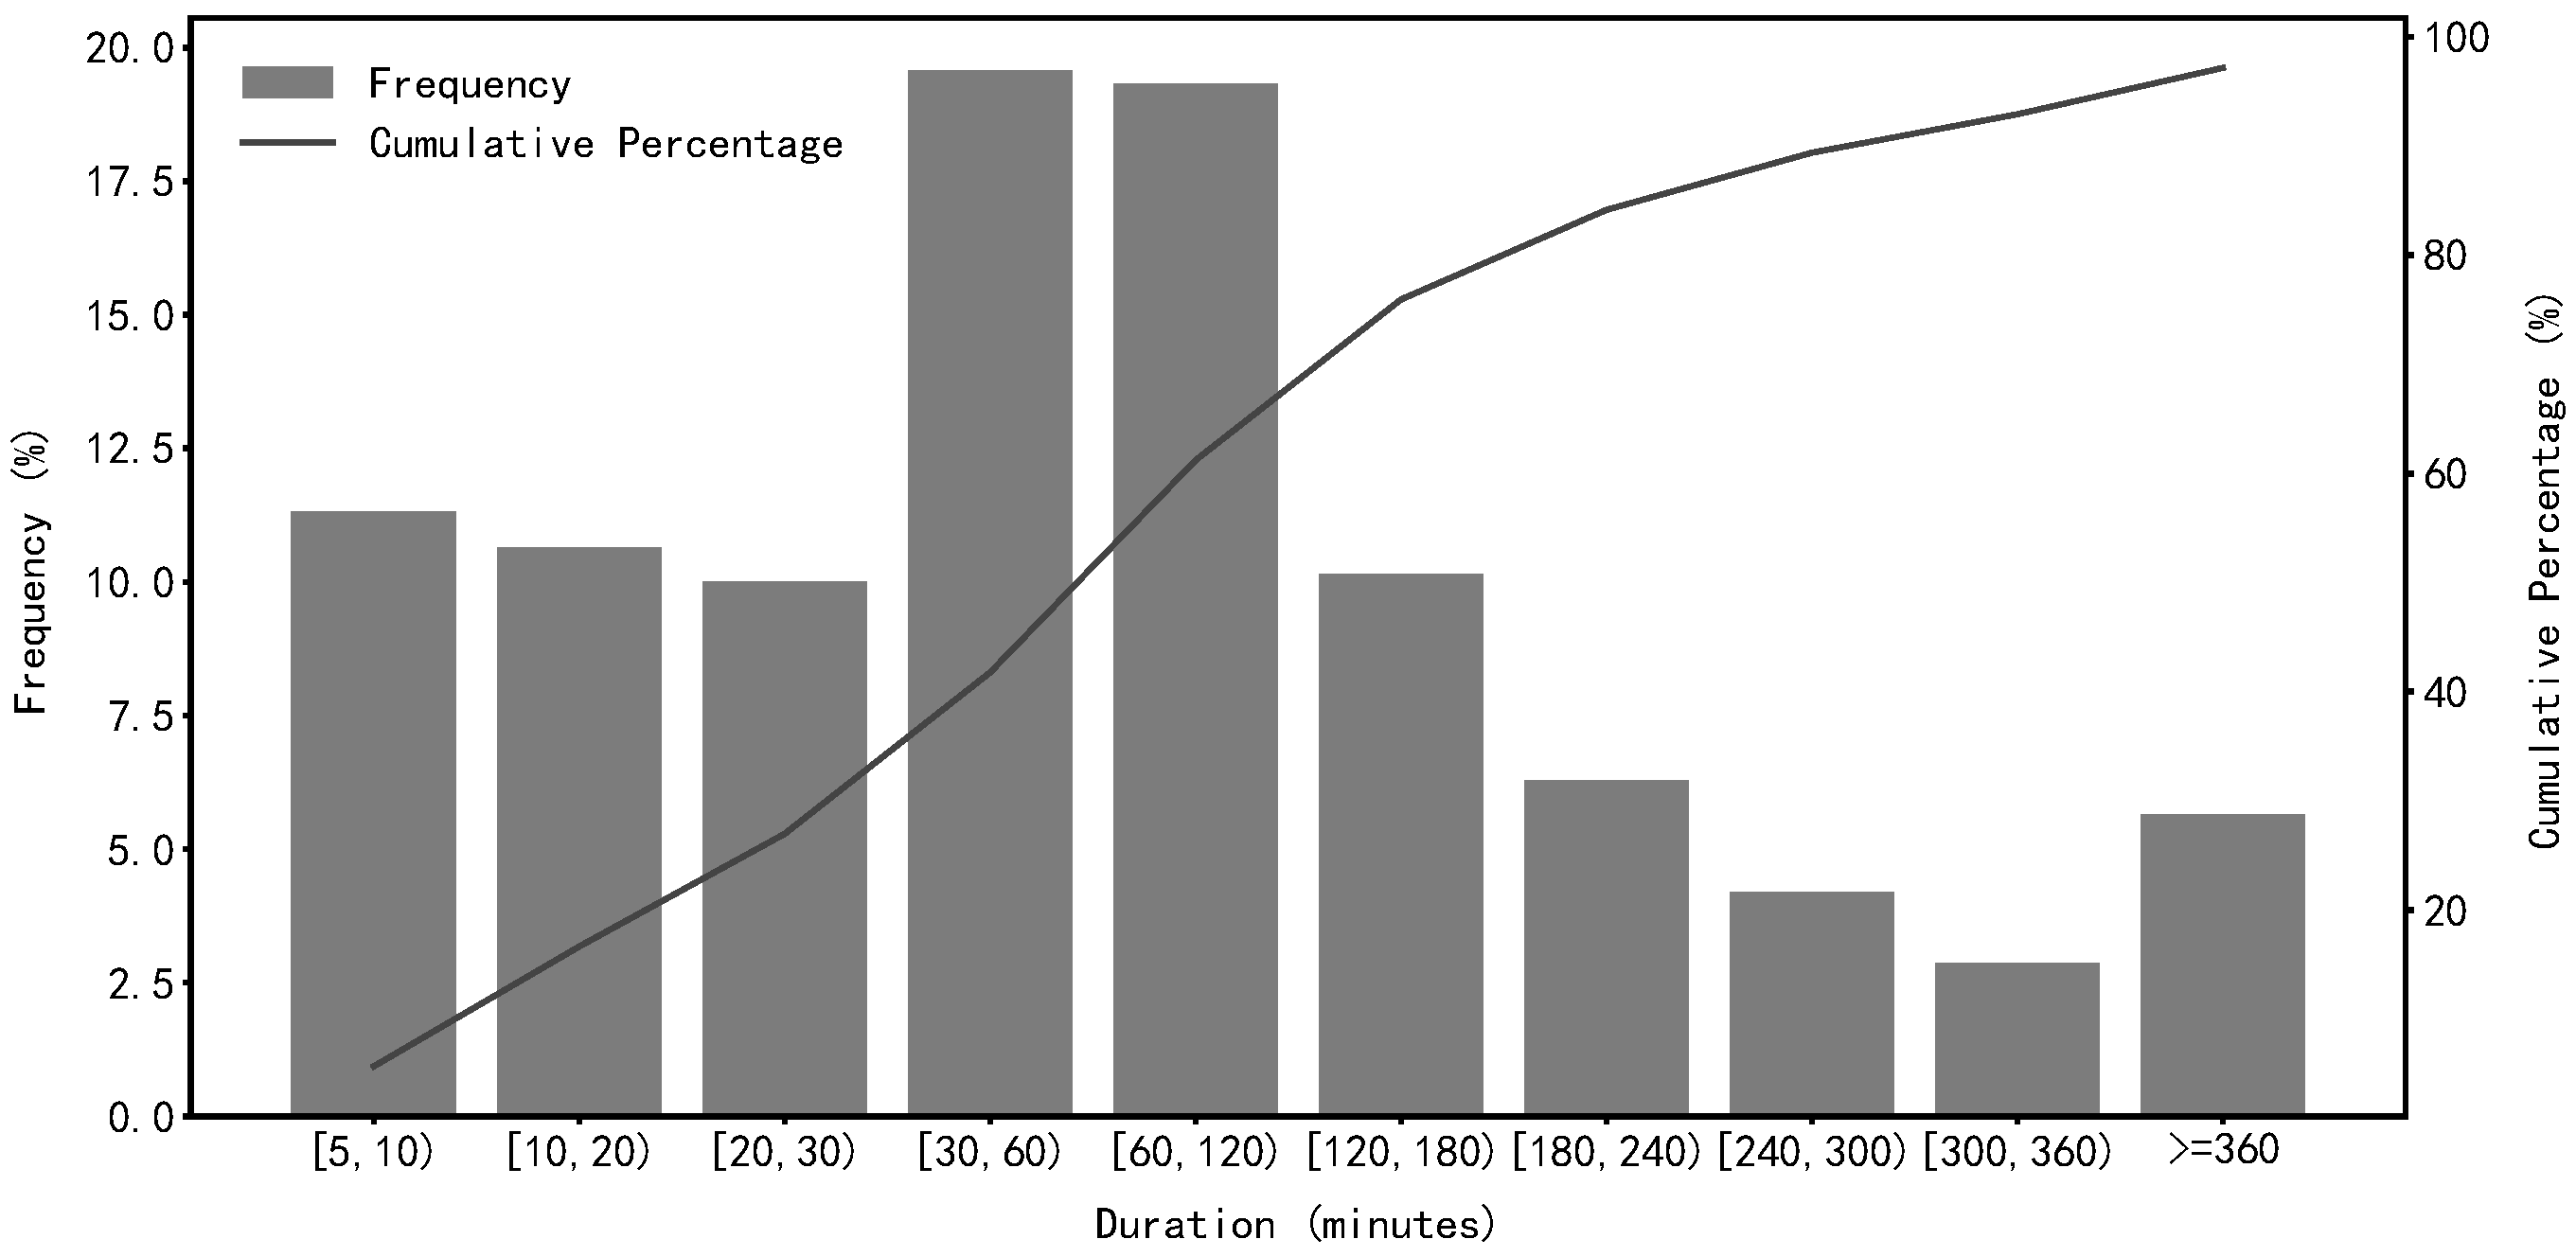
Based on the 102,652,520 lightning strike records across China from 2016 to 2023, a total of 85,071 composite thunderstorm event (TSE-Cs) were identified through clustering and merging. Influenced by the East Asian monsoon, thunderstorm activity exhibits marked seasonal variability. The thunderstorm events collected occurred predominantly from March to October, with the highest frequency in summer (June–August), which accounted for 56.2% of all events. A notable decline in the frequency of identified thunderstorm events was detected after 2022, primarily attributable to the discontinuation of VLF/LF lightning location data since August 2022 (Figure 8). The diurnal variations of thunderstorms (Figure 9) indicate that thunderstorms occurred most frequently from the afternoon to evening (13:00–19:00 BJT), especially during 14:00–17:00 BJT (38.1% of all events). The frequency dramatically decreased after 20:00 BJT and remained at a low level throughout the night. This diurnal pattern can be attributed to the fact that atmospheric thermodynamic instability conditions are most favorable during the afternoon and early evening, which facilitates thunderstorm initiation and development. Conversely, from nighttime to early morning, inadequate thermal forcing typically inhibits thunderstorm formation and development. With respect to thunderstorm duration (Figure 10), the majority of thunderstorm events persisted for less than 4 h, with the highest frequency for durations of 30–60 min accounting for 19.6%. Approximately 32.0% of thunderstorm events lasted for less than 30 min, while 29.1% persisted for more than 2 h.
Figure 8.
Time series of composite thunderstorm events (TSE-Cs).
Figure 9.
Diurnal variation of thunderstorm occurrence frequency.
Figure 10.
Frequency distribution of duration of composite thunderstorm events (TSE-Cs).
4. Extraction of Feature Factors
4.1. Extraction of Radar Parameters
Previous studies have demonstrated that radar echoes provide effective indicators of lightning occurrence [39,40,41,42,43]. Accordingly, radar-derived parameters, serving as predictors, constitute a vital component of the training dataset for thunderstorm forecasting models. Prior to feature extraction, rigorous quality control was performed on radar base data eliminate various non-meteorological echoes and invalid signals. The quality control procedures implemented included noise (isolated echo) filtering, radial interference identification, ground clutter and anomalous propagation echo identification, sea clutter discrimination, superrefraction echo removing, and clear-air echo suppression. Based on the quality-controlled radar base data, single-site radar products were generated, which were then mosaicked at the national scale to produce radar products with consistent spatiotemporal coverage. A total of 38 radar parameters (RPs) mosaic products closely associated with the initiation, development and dissipation of thunderstorms (Table 2) were obtained, with a spatial resolution of 0.01° × 0.01° and a temporal resolution of 6 min.
Table 2.
Radar parameters contained in the dataset.
The CR represents the maximum reflectivity factor across all altitude levels detected by radar. If CR ≥ 35 dBZ and appears at lower atmospheric levels, it can effectively reflect the spatial distribution of surface precipitation. The Constant Altitude Plan Position Indicator (CAPPI) reflectivity products at different altitude levels between 0.5 km and 14 km are derived via three-dimensional spatial interpolation of radar radial scanning data at different elevation angles, following the methodology proposed by Xiao et al. [44]. The 40 dBZ echo top height (ET40), defined as the maximum height at which targets with reflectivity factors exceeding 40 dBZ are detected by radar, serves as an effective indicator of lightning occurrence [28,29,45]. Vertical integrated liquid (VIL) water content is obtained by converting reflectivity values at different elevation angles into equivalent liquid water content values and performing vertical integration, based on the assumption that all radar reflectivity echoes are generated by liquid hydrometeors [46].
4.2. Extraction of Environmental Factors
The occurrence of deep moist convection in the atmosphere requires three fundamental conditions: atmospheric instability, sufficient water vapor, and updrafts. In addition, vertical wind shear (defined as the variations in wind direction and speed with height) and cloud-precipitation microphysical processes play critical roles in the initiation, structural organization, and evolutionary development of deep moist convection [42]. Intense thunderstorms can only develop under conducive synoptic conditions. Research has shown that the background environmental conditions governing the initiation and development of mesoscale severe convective systems include four key elements: water vapor, static instability, uplifting conditions and vertical wind shear [47,48]. To comprehensively represent the environmental conditions associated with thunderstorm evolution, meteorological data at the forecast timestamp and during the antecedent period are incorporated into the machine learning model inputs. The AITDTS contains 62 environmental factors (EFs) (Table 3), such as water vapor, static instability and dynamic uplifting conditions, collectively referred to as atmospheric physical factors, which were extracted 3 h prior to the thunderstorm initiation time. These variables were derived from the reanalysis product independently developed by the CMA, which has a temporal resolution of 1 h and a spatial resolution of 0.03° × 0.03°. Some factors were directly output by the numerical model, while others were derived from the model output variables at the surface and multiple isobaric levels using the MetPy software version 1.7.0 package [49].
Table 3.
Environmental factors contained in the dataset.
4.3. Importance Analysis of Features
For AI applications, constructing a high-performance model relies not only on massive data and effective algorithms, but also on the optimal selection of input features. Therefore, feature importance analysis plays a crucial role in this process by quantifying the contribution of individual features to model predictions. It provides guidance for selecting model inputs, improves prediction accuracy, reduces model complexity, elevates training efficiency, and—to some extent—enhances model interpretability. Thunderstorms involve complex physical processes and dynamic characteristics, yet they are low-frequency events that can easily be overshadowed by a vast volume of irrelevant information. Fully extracting multiple representations of thunderstorms and comprehensively considering geographic and climatic background conditions are therefore essential for improving thunderstorm forecasting skills [34].
Information gain is a key metric for feature selection, defined as the magnitude of information that a given feature contributes to target variable prediction. A higher information gain value indicates that a feature provides more discriminative information and thus has a greater contribution to the target prediction. Information gain also represents the reduction in information uncertainty under specified conditions, where information uncertainty is quantified by information entropy and conditional uncertainty by conditional entropy. Therefore, information gain can be obtained by subtracting conditional entropy from information entropy, as expressed by Equations (2)–(4).
where represents the information entropy of feature , is the probability of , is the conditional probability of predictand , when , is the conditional entropy of information across all possible values of feature , and is the information gain under the value of .
Table 4 lists 100 features and their information gain for thunderstorm forecasting, sorted in descending order of information gain. Information gain quantifies the contribution of each feature to thunderstorm forecasting performance, and higher values indicate more robust discriminative information for differentiating between thunderstorm and non-thunderstorm events. (1) The radar echo top and base heights for reflectivity between 18 dBZ and 45 dBZ exhibit relatively high information gain values. This finding is primarily attributable to the fact that radar echo top and base heights are directly related to the dynamic initiation and development of thunderstorms. A rapid rise in echo top height indicates strengthening ascending motion, which is a key signal for thunderstorm intensification. Echo base height is associated with boundary layer stability conditions, and a low echo base typically corresponds to an unstable boundary layer, a favorable thermodynamic condition for convective initiation and maintenance. Thus, echo base height serves as a critical indicator of the potential for thunderstorms to persist and exert surface impacts. (2) The information gain of CAPPI reflectivity at 10 km is higher than that at other heights, indicating that the radar reflectivity at 10 km exerts a more pronounced influence on thunderstorm forecasting. The graupels and small hailstones usually form and grow within the isothermal layer between 0 °C and −20 °C. At the 10 km height, the separation of graupels and ice crystals may become significant, resulting in charged particles separating and forming a net charge layer. Ultimately, electrical discharges occur, producing lightning strikes. Thus, reflectivity at the 10 km height is a critical precursor signal for thunderstorm occurrence. (3) The environmental characteristic factors with information gain values larger than 0.2 mainly include static instability conditions (e.g., KI and DCAPE), uplifting conditions (e.g., LCL and CIN), water vapor conditions (e.g., PE and RH), and 0–1 km vertical wind shear. The accumulation of convective instability energy is a prerequisite for thunderstorm occurrence. Uplifting conditions are the key triggering factors that break the hydrostatic state of the atmosphere and initiate convective motion, thereby releasing instability energy. Sufficient water vapor releases latent heat via condensation, which serves to enhance convective buoyancy—a core dynamic factor driving the initiation and development of deep convection [50]. In turn, the latent heat released during water vapor condensation acts as a critical energy source for sustaining the vigorous development of thunderstorm systems and their associated convective motion. Vertical wind shear provides horizontal momentum and vorticity, and strong vertical wind shear can promote the development of rotating storm structures and facilitate the intensification of severe thunderstorms. Thus, vertical wind shear serves as a crucial facilitating factor for thunderstorm development.
Table 4.
Information gain of RPs and EFs for thunderstorm forecasting.
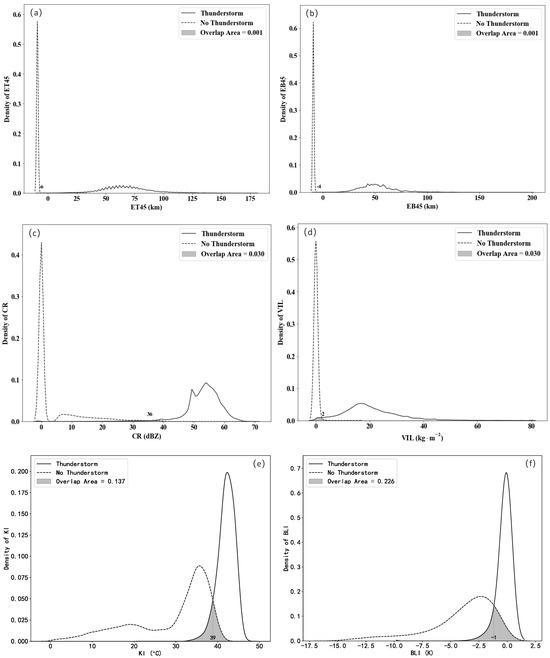
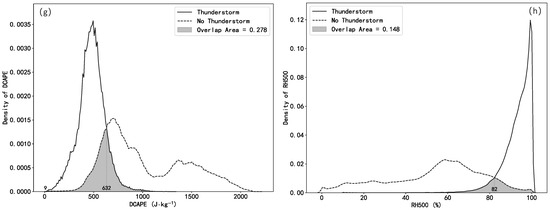
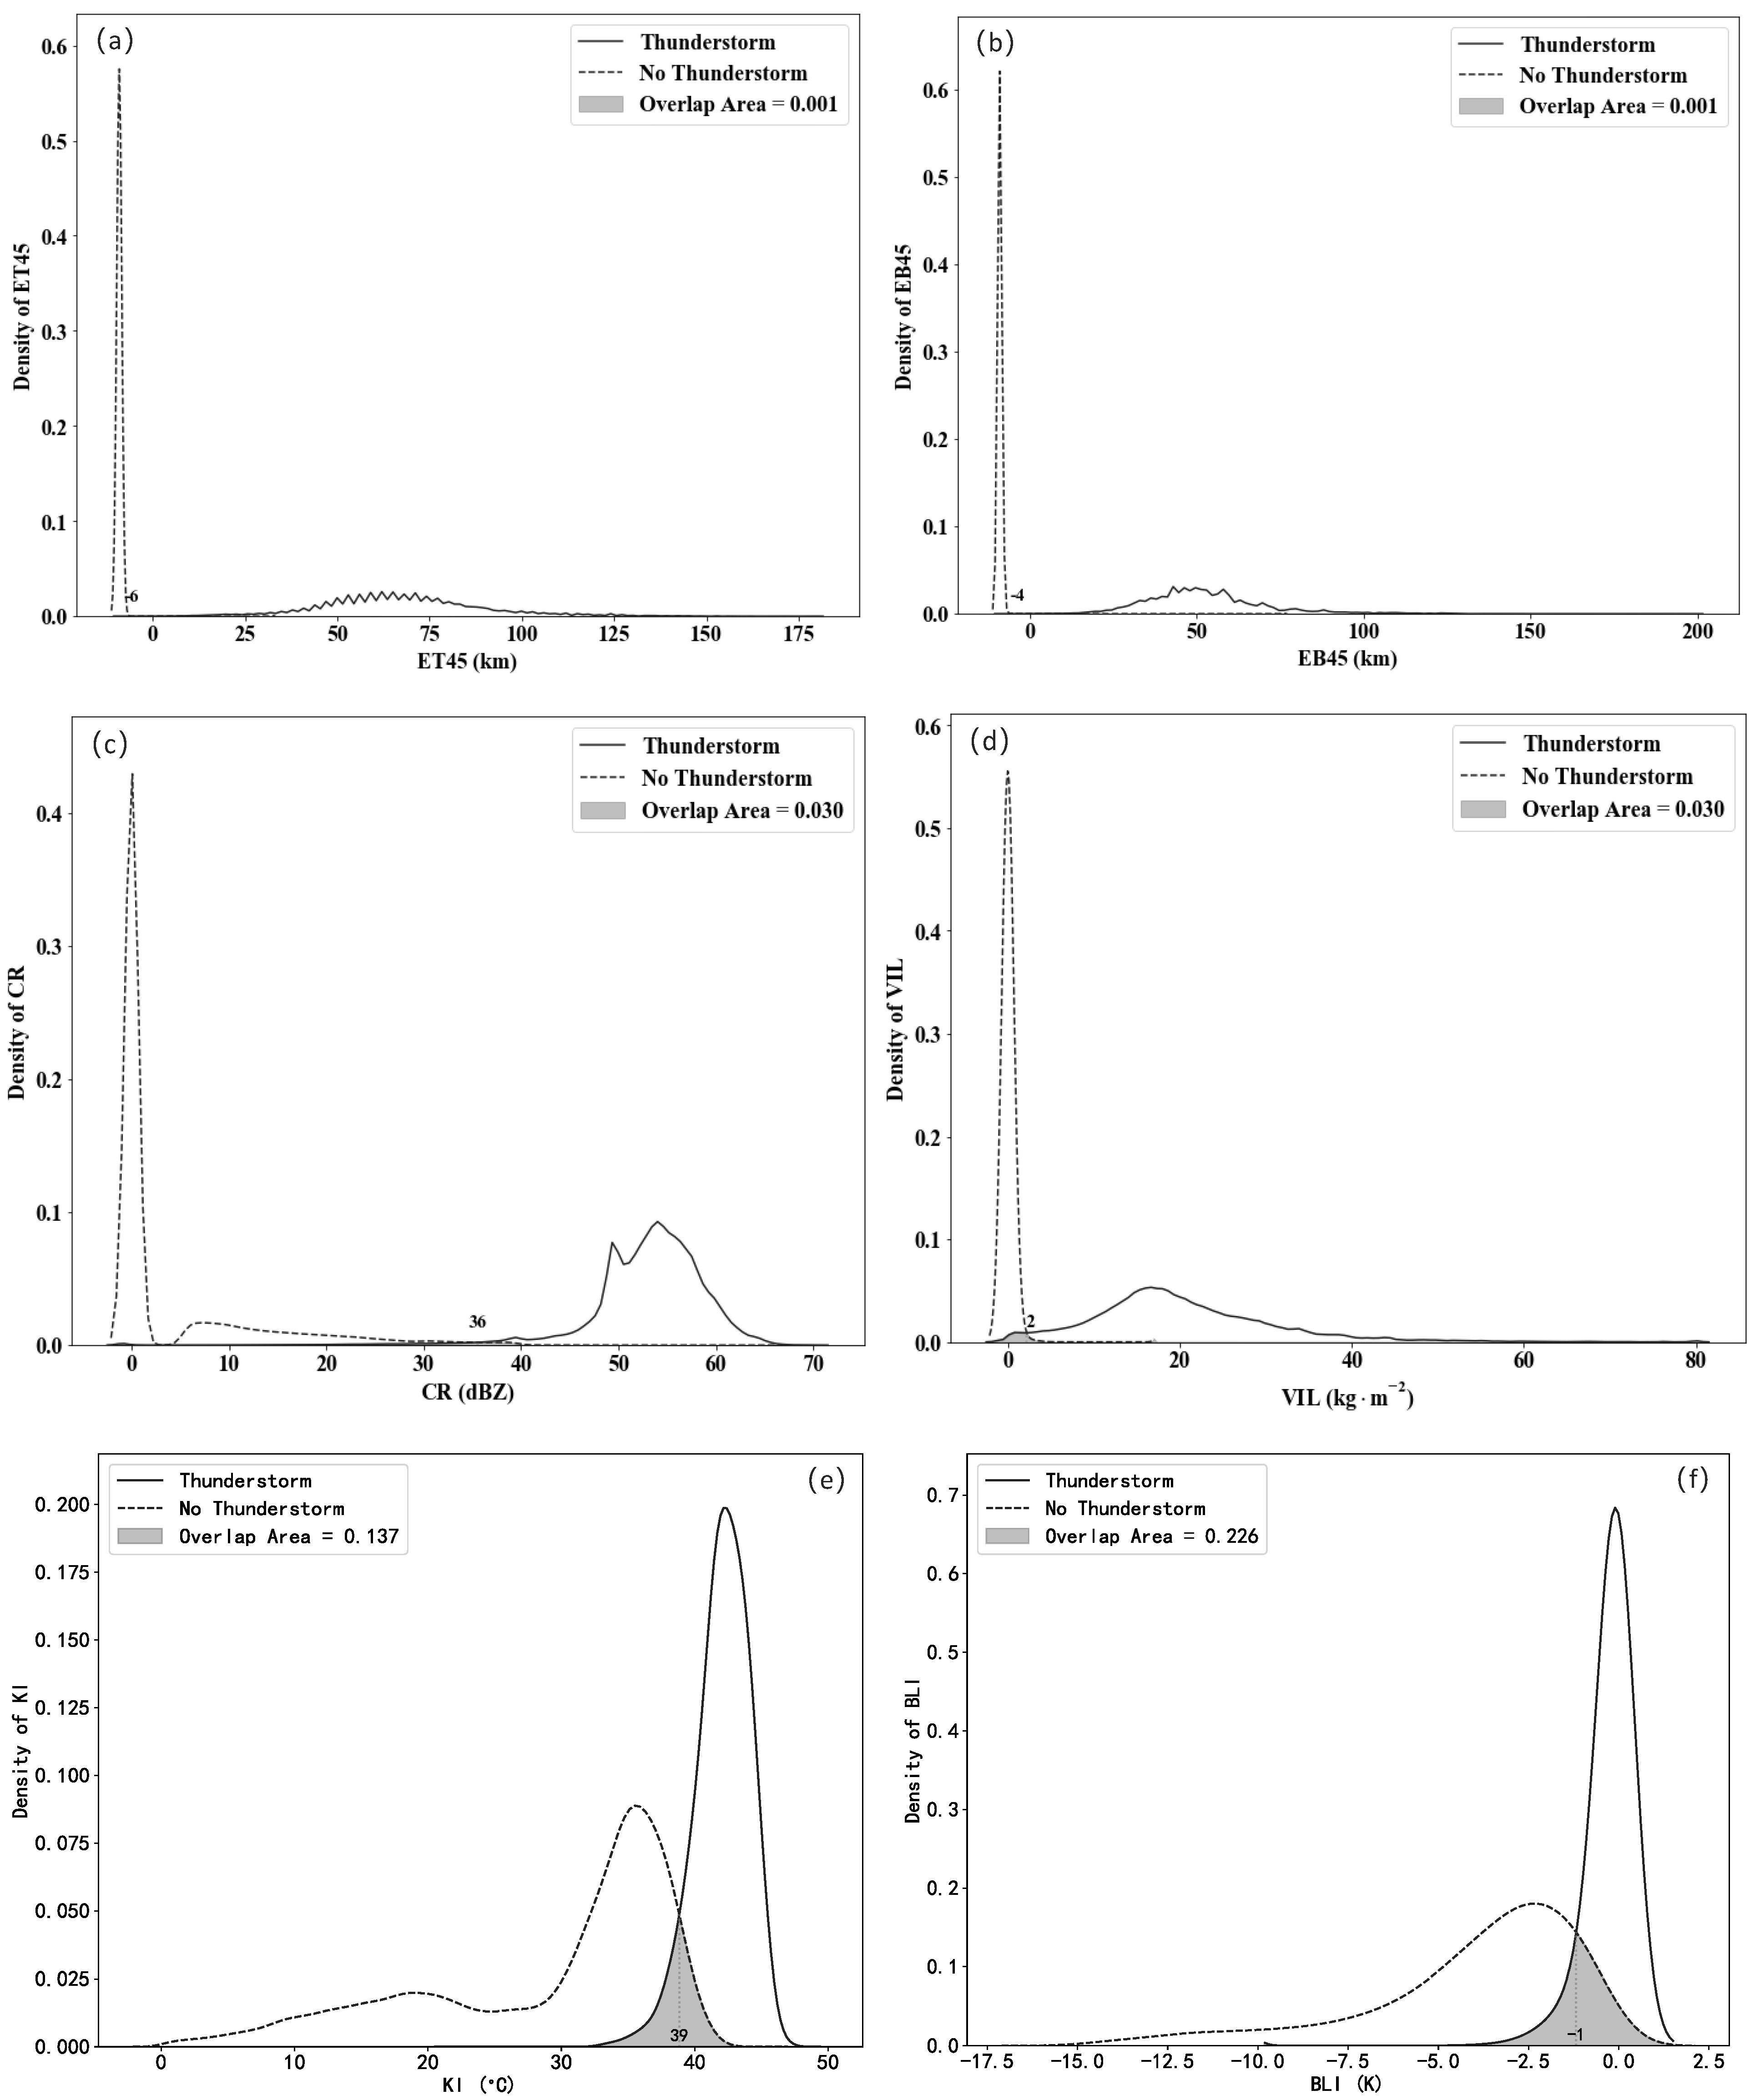
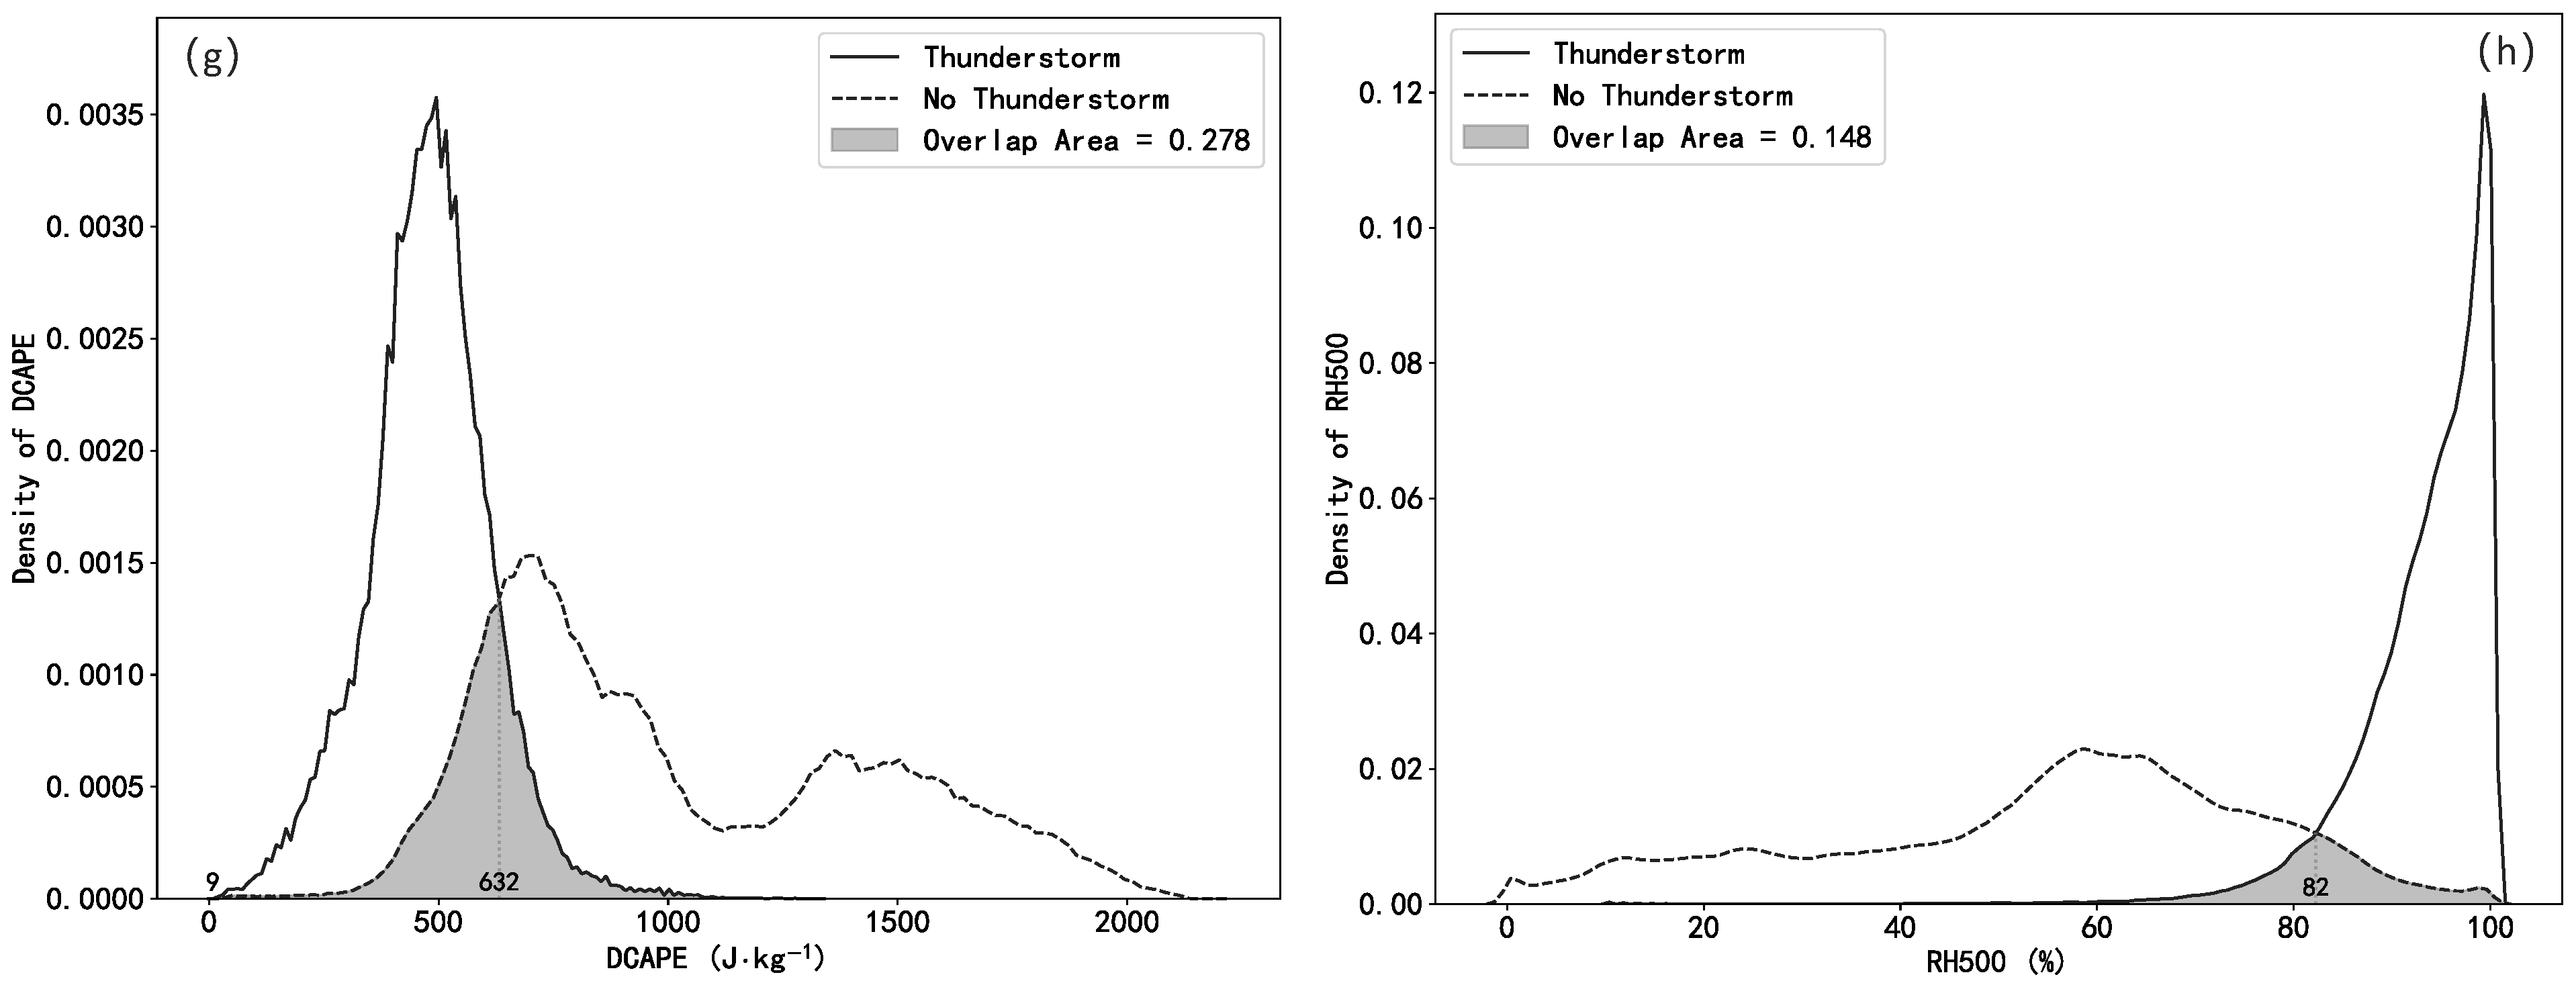
Figure 11 displays the probability density distributions of selected feature parameters under thunderstorm and non-thunderstorm conditions. A smaller overlap area between the two probability density curves indicates stronger discriminative capability of the corresponding feature parameter. As presented in Figure 11a,b, the top and base heights of 45 dBZ echoes, the CR and the VIL exhibit robust discrimination between thunderstorm and non-thunderstorm cases. In thunderstorm events, the top and base heights of 45 dBZ echoes are over 25 km and 12 km, respectively, and the CR and VIL are larger than 40 dBZ and 10 kg·m−2, respectively. In non-thunderstorm cases, the values of these features are generally small: 45 dBZ echoes are absent, and the CR and VIL are smaller than 5 dBZ and 2 kg·m−2, respectively. From Figure 11e–h, it is evident that thunderstorm conditions are characterized by KI > 39 °C, BLI > −1 K, DCAPE > 632 J·kg−1, and RH500 > 82%, whereas non-thunderstorm conditions correspond to KI ≤ 39 °C, BLI ≤ −1 K, DCAPE ≤ 632 J·kg−1, and RH500 ≤ 82%. These results confirm that these atmospheric condition physical features exhibit strong discriminative ability for identifying thunderstorm occurrence.
Figure 11.
The probability density functions of some factors under thunderstorm occurrence and non-occurrence, the density of (a) ET45, (b) EB45, (c) CR, (d) ET45, (e) KI, (f) BLI, (g) DCAPE and (h) RH500 were illustrated, where the ET45 and EB45 are assigned as missing value “−9” when 45 dBZ echoes are absent).
5. Construction of Thunderstorm Region Labels
Most machine learning methods adopt supervised learning frameworks, which require each sample in the dataset to be assigned a ground-truth value representing the prediction target, referred to as label data. For example, in the QpefBD dataset, minute-level ground-based precipitation observations are used to construct 10 min, 1 km × 1 km precipitation intensity labels that are temporally aligned with radar volume-scanning data through a piecewise interpolation approach [12].
For the task of AI identification and forecasting of thunderstorms, label data represent the reference truth toward which model predictions converge during training. Therefore, the AITDTS dataset requires each training sample to be assigned a label indicating the thunderstorm occurrence area. However, the actual distribution of thunderstorms is difficult to obtain directly. Within the spatial domain of the ATDTC dataset, dense multi-source integrated lightning observations are available, which can provide 10 min lightning flash counts temporally matched to the radar volume-scanning time. To ensure spatio-temporal consistency between the label and the primary input features (radar products), lightning flashes are spatially gridded. In this research, IC and CG lightning flashes occurring within the previous 6 min were counted over a spatial grid of 0.01° × 0.01° to generate a lightning strike density product.
where t represents the time window (6 min), indicates the spatial area of grid cell g, and denotes the number of lightning strikes within grid cell g over the past 6 min.
Statistics show that grid cells with a strike density equal to 1 in the past 6 min account for 90.83% of all grid cells. Accordingly, grid cells with strike density < 1 are labeled as no thunderstorm occurrence (label = 0), while those with strike density ≥ 1 are labeled as thunderstorm occurrence (label = 1).
6. Dataset Description
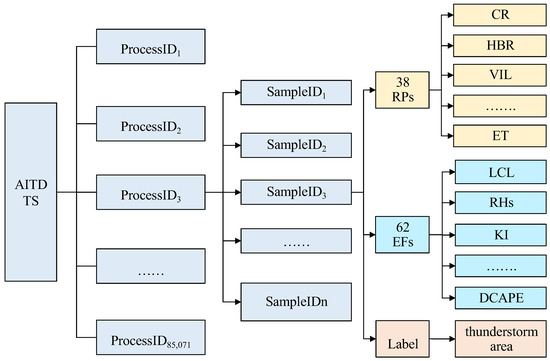
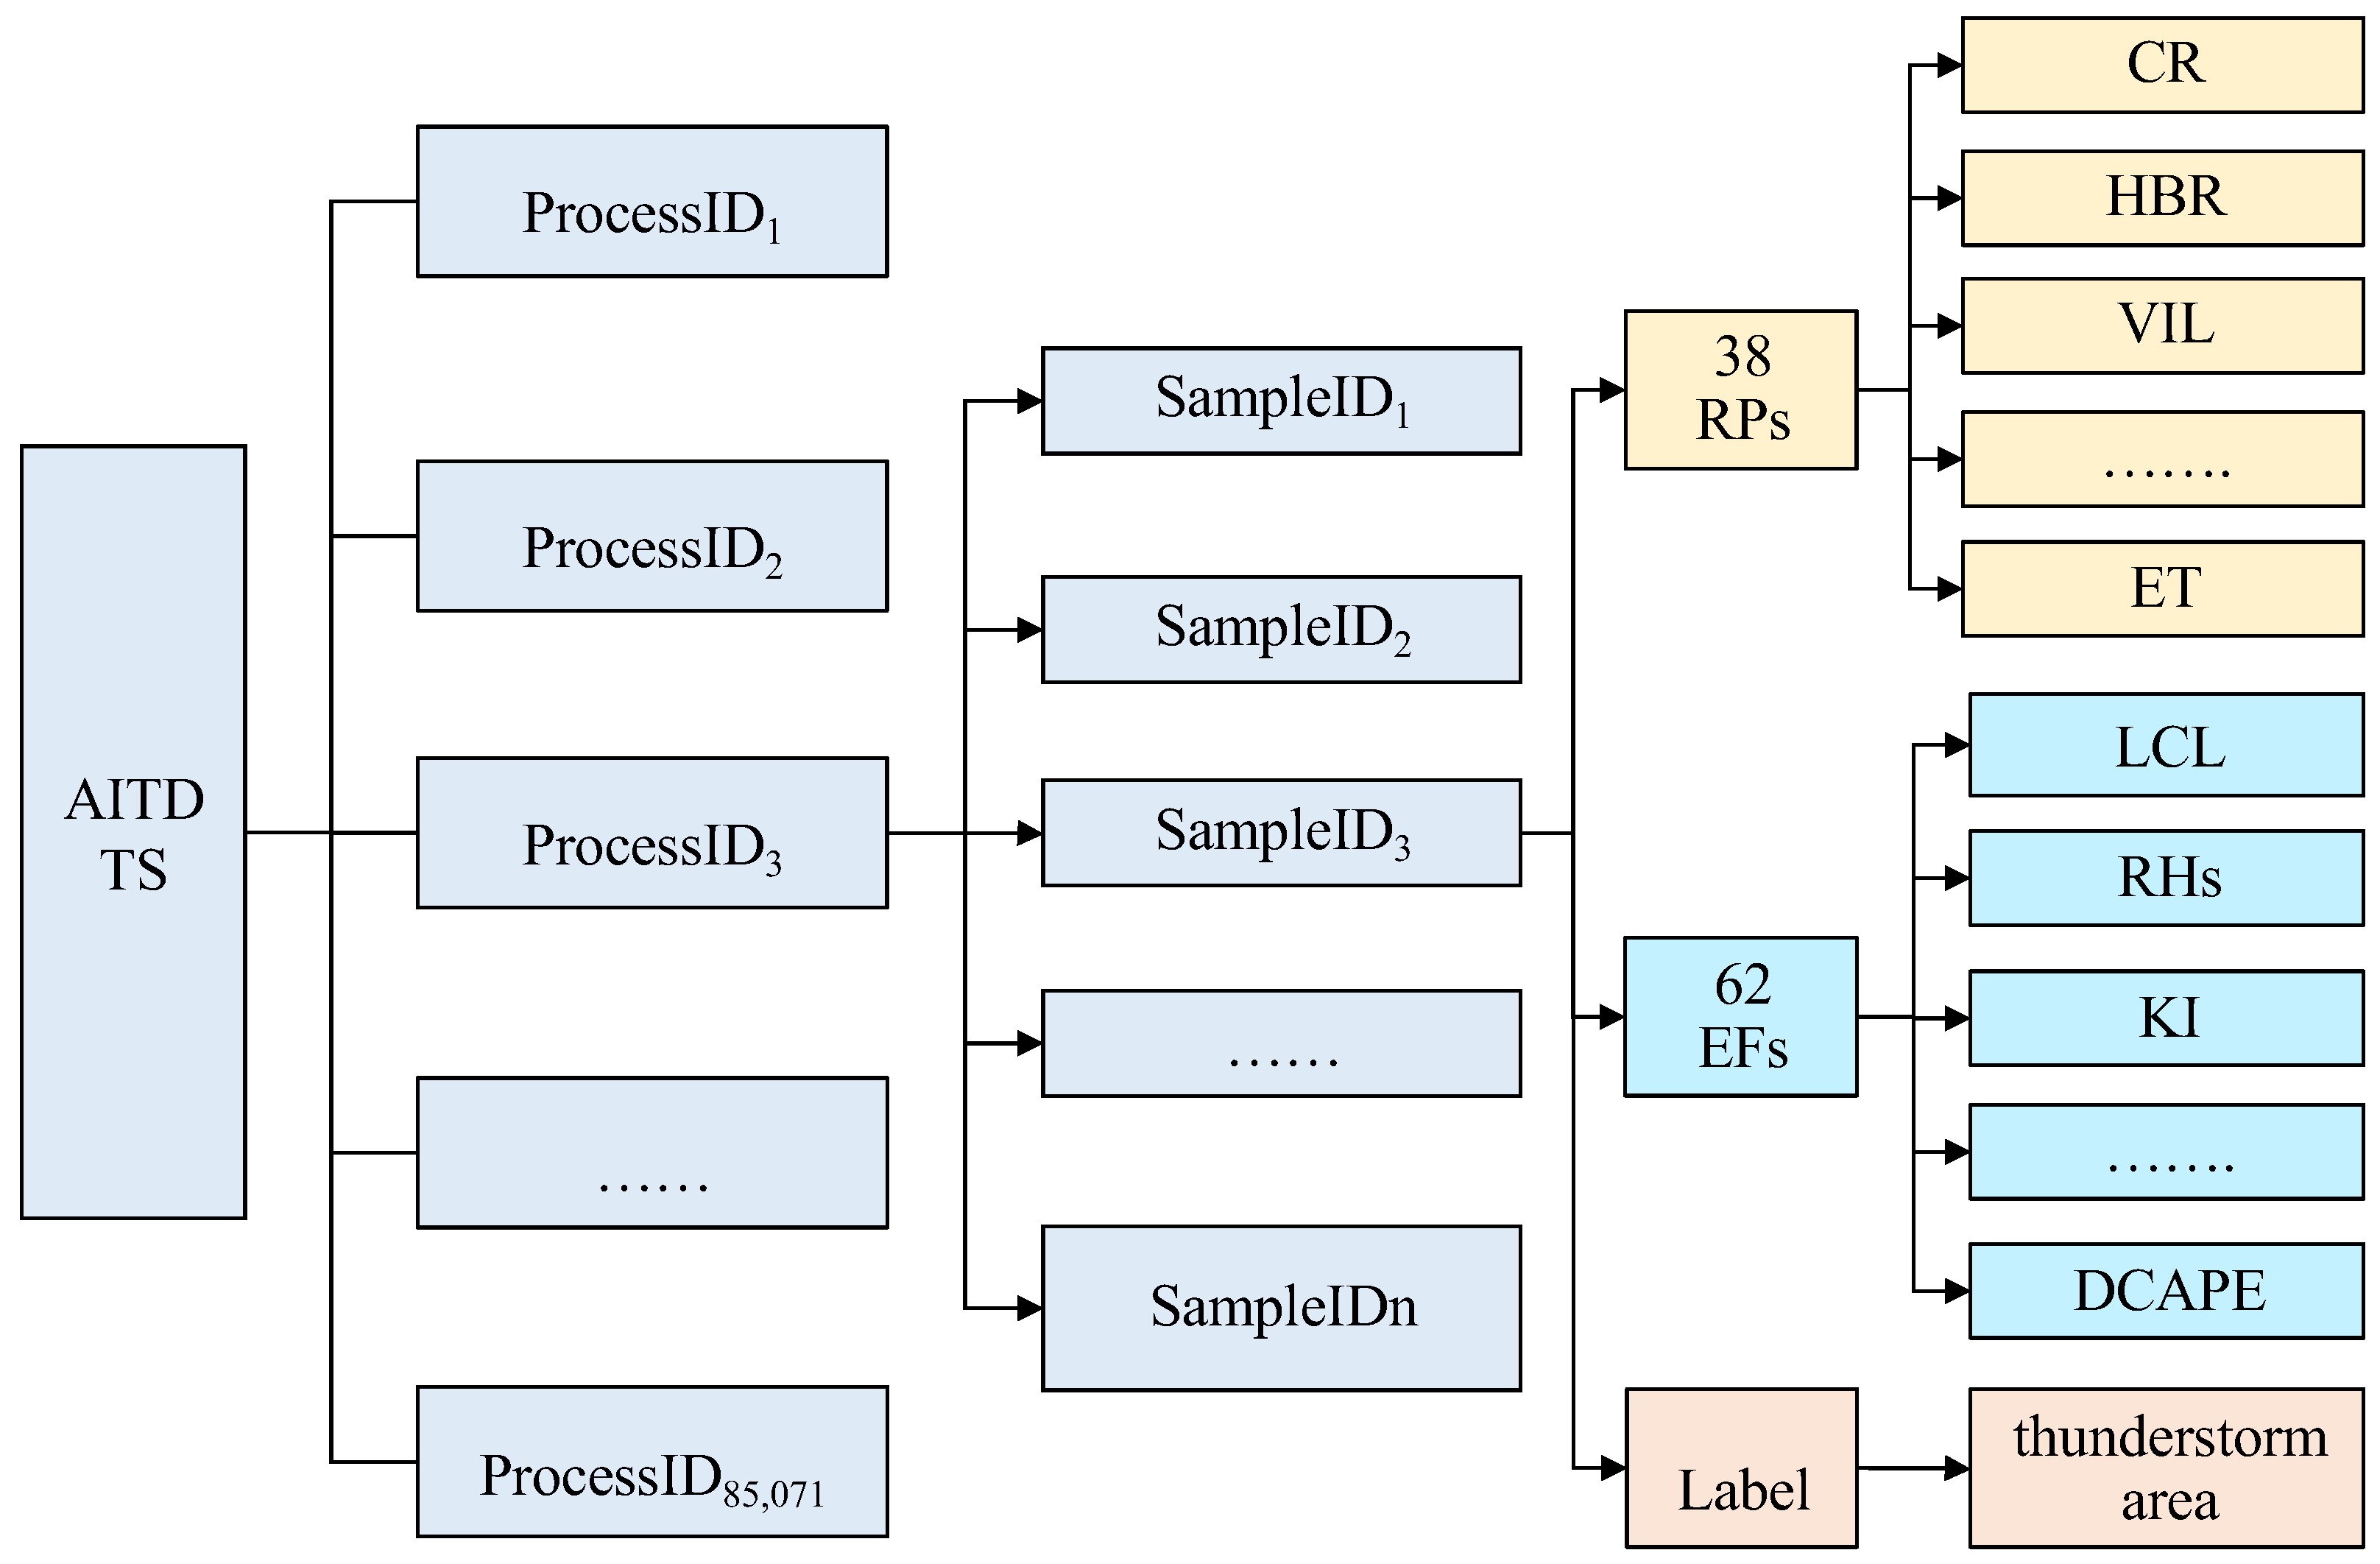
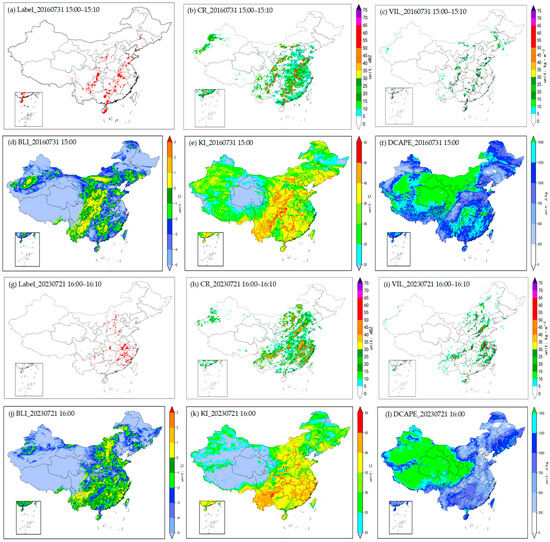
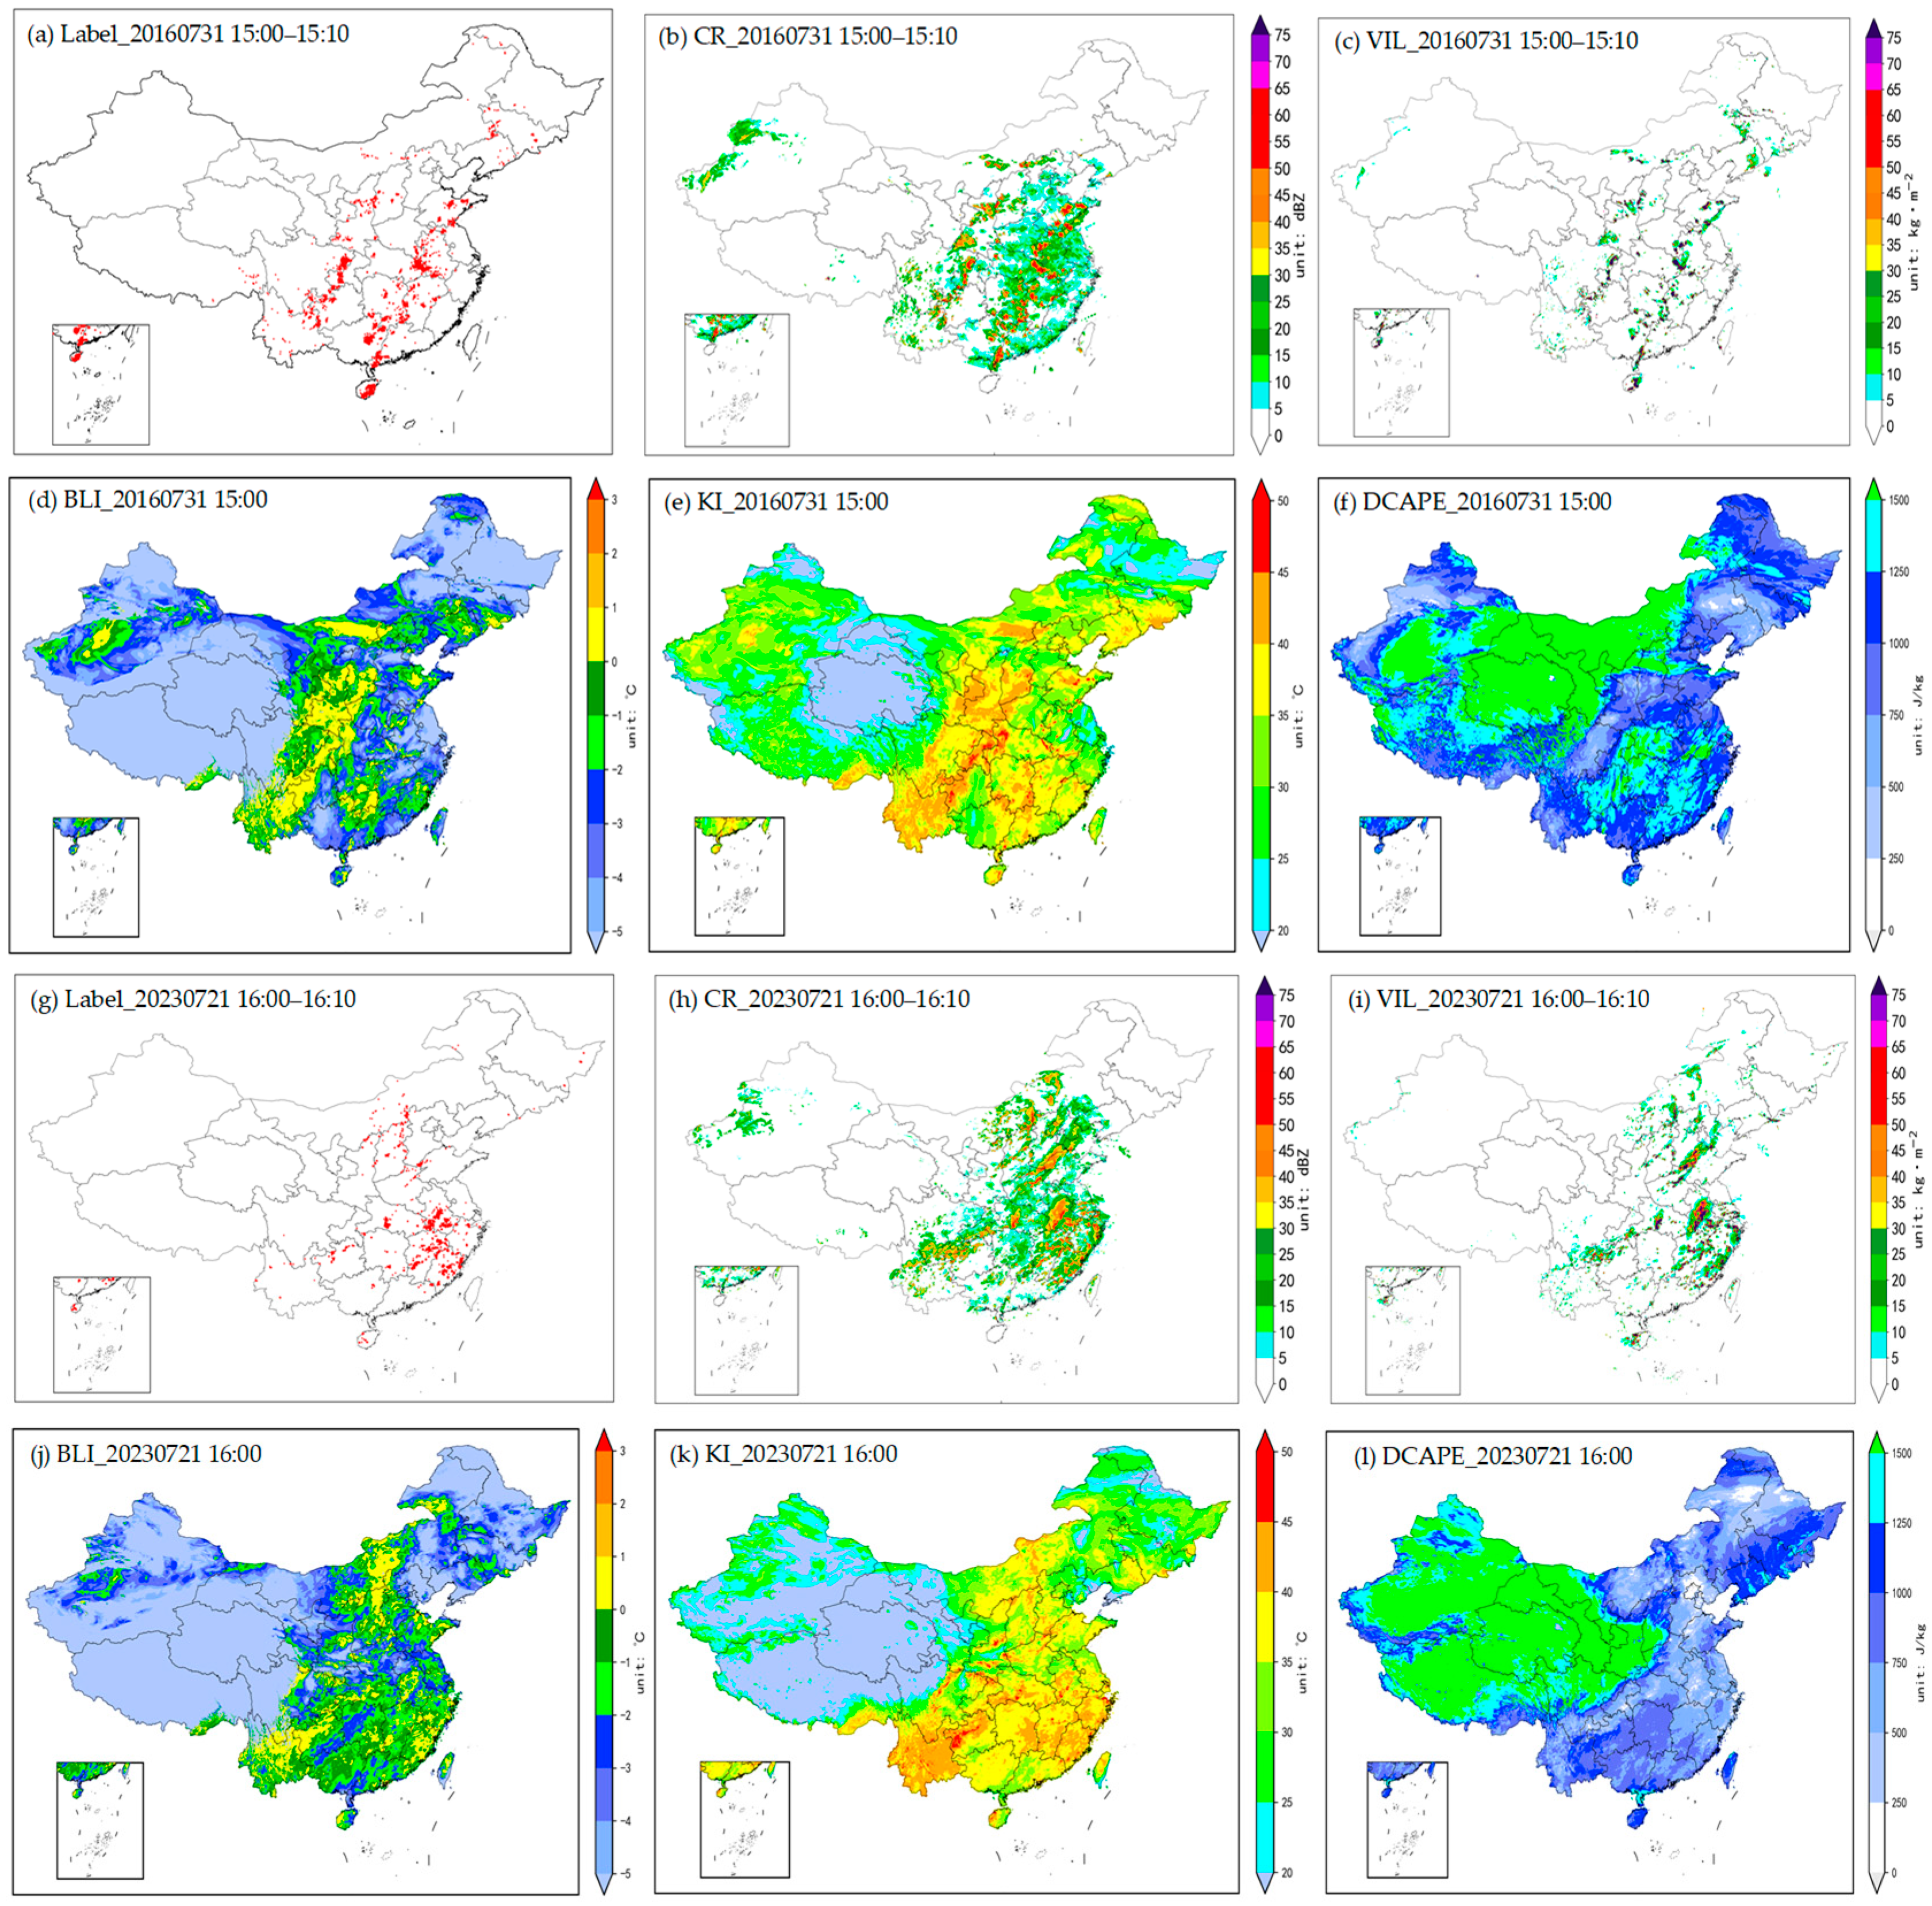
The AITDTS dataset comprises a total of 85,071 thunderstorm events (ProcessID1, ProcessID2, ProcessID3, …, ProcessID85,071) in China from 1 January 2016 to 31 December 2023. According to the time window definition for thunderstorm events described in Section 3.1, samples are constructed at 10 min intervals. Each thunderstorm event consists of a temporally continuous sequence of samples, yielding a total of 3,973,171 samples (SampleID1, SampleID2, SampleID3, …, SampleID3,973,171) across all events. Each sample comprises 38 RPs (Table 2), 62 EFs (Table 3), and one thunderstorm occurrence area label. The organizational structure of the dataset is illustrated in Figure 12. Figure 13 presents a visualization example of selected features and the corresponding label for a single sample.
Figure 12.
Content and structure of AITDTS where ProcessID and SampleID represent the serial number of thunderstorm events and the serial number of samples at 10 min intervals, respectively.
Figure 13.
Examples of 2D patterns of several variables in a sample of AITDTS during 15:00–15:10 on 31 July 2016: (a) thunderstorm occurrence label, (b) CR, (c) VIL, (d) BLI, (e) KI and (f) DCAPE; and another sample during 16:00–16:10 on 21 July 2023: (g) thunderstorm occurrence label, (h) CR, (i) VIL, (j) BLI, (k) KI and (l) DCAPE. Spatial distributions of (a–f) and (g–l) both exhibit a good correlation.
7. Dataset Application Scenarios
The AITDTS can be applied to various scenarios, including AI identification, nowcasting and potential forecasting of thunderstorm-prone areas [14]. For AI model training, in addition to the RPs and EFs provided by this dataset, features such as seasonal variability, diurnal variability, and topography can also be incorporated to improve the prediction accuracy and generalization capability of the model.
7.1. Intelligent Identification of Thunderstorm Occurrence Areas
Based on the AITDTS, AI algorithms can learn complex nonlinear relationships between thunderstorm occurrence area labels with multiple RPs and EFs, enabling the construction of an identification model for thunderstorm occurrence areas. By using a combination of RPs and EFs as model inputs, the two-dimensional spatial distribution of thunderstorm occurrence areas can be directly output.
7.2. Thunderstorm Nowcasting
The AITDTS provides at least 6 h of 10 min sample sequences for each thunderstorm event. Based on these data, sliding window sampling can be implemented. Using RPs sequences within the 3 h window preceding the forecast timestamp and EFs at the forecast timestamp as predictor variables, deep learning models can learn the relationship between predictors and predictand (thunderstorm occurrence areas). Once the model is constructed, inputting the RPs within the 3 h window preceding the forecast timestamp and EFs at the forecast timestamp enables the model to output predictions of two -dimensional gridded thunderstorm occurrence areas at 10 min intervals at the forecast leading time of 3 h.
7.3. Thunderstorm Potential Forecasting Based on Numerical Models
Based on the AITDTS, EFs can be used as model inputs to train deep learning models that learn the relationship between EFs and concurrent thunderstorm occurrence areas. By incorporating outputs from numerical weather prediction (NWP) models at various forecast leading times, the potential forecasting of thunderstorm occurrence areas at different leading times can be realized.
8. Discussion
All samples in the AITDTS are provided in the form of two-dimensional gridded data on a regular latitude–longitude grid, which can be directly used for the training of machine learning models, particularly deep learning. However, several limitations should also be acknowledged. In this study, radar features and environmental condition features were primarily selected based on existing expert knowledge and well-documented physical mechanisms. Although these features capture key factors influencing thunderstorm occurrence, they may fail to encompass additional, yet-to-be-identified thunderstorm-related features. Future efforts may expand and refine the feature space through feature engineering techniques—such as physically constrained feature selection and machine-learning-based feature derivation—to provide robust data support for developing more accurate thunderstorm forecasting models, and may also focus on expanding sample size, optimizing data cleansing techniques, and improving sample completeness and accuracy, which will further enhance the scientific rigor and application value of the dataset.
9. Conclusions
To meet the data requirements of AI-driven thunderstorm recognition and forecasting, this paper has proposed the AITDTS. Comprehensive data quality control, multi-source data integration and thunderstorm occurrence area labeling were implemented. In addition, feature extraction and feature importance analysis were conducted. The main characteristics of the dataset developed in this research are summarized as follows.
- (1)
- The AITDTS takes thunderstorm events as fundamental units, and each event consists of multiple samples within a predefined time window. The dataset encompasses 85,071 thunderstorm events corresponding to a total of 3,973,171 samples. Each sample contains one thunderstorm occurrence area label, 38 meso- and microscale RPs and 62 EFs.
- (2)
- The information gain analysis reveals that RPs, i.e., radar echo top and base heights, CR, VIL and 10 km height reflectivity, exhibit higher information gain values exceeding 0.6, indicating substantial contributions to thunderstorm prediction. EFs, i.e., static instability conditions (KI and DCAPE), uplifting conditions (LCL and CIN), water vapor conditions (PE and RH) and the 0–1 km vertical wind shear have relatively higher information gain (greater than 0.2).
- (3)
- The frequency of thunderstorm events in the AITDTS exhibits distinct seasonal and diurnal variations from 2016 to 2023. Thunderstorms predominantly occurred from June to August, accounting for 56.2% of all events. In terms of diurnal variations, thunderstorms most frequently appeared from the afternoon to early evening (13:00–19:00 BJT), with the peak frequency observed between 14:00–17:00 BJT (38.1% of all events). After 20:00 BJT, thunderstorm frequency decreased substantially, remaining at a low level throughout the nighttime hours.
Author Contributions
Conceptualization, N.L. and W.X.; methodology, W.X. and A.X.; formal analysis, A.X.; resources, Q.Z.; investigation, H.X.; data curation, N.L. and H.M.; writing—original draft preparation, N.L. and S.Z.; writing—review and editing, N.L., W.X., A.X., Q.Z., Y.S., Y.L. and Z.H.; visualization, H.M. and S.Z.; funding acquisition, N.L., W.X. and A.X. All authors have read and agreed to the published version of the manuscript.
Funding
This research was funded by the Joint Fund for Meteorology of the National Natural Science Foundation of China, grant number U2442217, and the National Meteorological Information Centre Key Innovation Team for Artificial Intelligence Training Dataset for Meteorological Applications (NMIC-2024-ZD01).
Data Availability Statement
The data presented in this article is not readily available because the data is part of an ongoing study. Request to access the data should be directed to the corresponding author.
Acknowledgments
We acknowledge any support given which is not covered by the author contribution or funding sections. This may include administrative and technical support, or donations in kind (e.g., materials used for experiments).
Conflicts of Interest
The authors declare no conflict of interest.
Abbreviations
The following abbreviations are used in this manuscript:
| AI | Artificial Intelligence |
| ADTD | Advanced Direction and Time-of-Arrival Detecting |
| AITDTS | AI Training Dataset for ThunderStorms |
| SCW | Severe Convective Weather |
| VIL | Vertical Integrated Liquid Water Content |
| CR | Radar Composite Reflectivity |
| VLF/LF | Very Low Frequency/Low Frequency |
| QC | Quality Control |
| IC | Intracloud |
| CG | Cloud-to-Ground |
| 3D | Three-dimensional |
| UILD | Unified, Integrated Lightning Dataset |
| DBSCAN | Density-Based Spatial Clustering of Applications with Noise |
| TSE-S | Single Thunderstorm Event |
| TSE-C | Composite Thunderstorm Event |
| RPs | Radar Parameters |
| EFs | Environmental Factors |
References
- Tao, S.Y.; Ding, Y.H.; Zhou, X.P. The present status of the research on rainstorm and severe convective weathers in China. Chin. J. Atmos. Sci. 1979, 3, 227–238. (In Chinese) [Google Scholar]
- Chen, H.B.; Zhu, Y.L. Review on the observation investigation of thunderstorms. Chin. J. Atmos. Sci. 2012, 36, 411–422. (In Chinese) [Google Scholar]
- Sun, J.; Xue, M.; Wilson, J.W.; Zawadzki, I.; Ballard, S.P.; Onvlee-Hooimeyer, J.; Joe, P.; Barker, D.M.; Li, P.-W.; Golding, B.; et al. Use of NWP for nowcasting convective precipitation: Recent progress and challenges. Bull. Am. Meteorol. Soc. 2014, 95, 409–426. [Google Scholar] [CrossRef] [Scilit]
- Zhang, X.; Sun, J.; Zheng, Y.; Zhang, Y.; Ma, R.; Yang, X.; Zhou, K.; Han, X. Progress in severe convective weather forecasting in China since the 1950s. J. Meteorol. Res. 2020, 34, 699–719. [Google Scholar] [CrossRef] [Scilit]
- Hitchens, N.M.; Brooks, H.E. Evaluation of the storm prediction center’s day 1 convective outlook. Weather Forecast. 2012, 27, 1580–1585. [Google Scholar] [CrossRef] [Scilit]
- Sun, J.; Cao, Z.; Li, H.; Qian, S.; Wang, X.; Yan, L.; Xue, W. Application of artificial intelligence technology to numerical weather prediction. J. Appl. Meteorol. Sci. 2021, 32, 1–11. (In Chinese) [Google Scholar]
- Han, F.; Long, M.S.; Li, Y.A.; Xue, F.; Wang, J.M. The application of recurrent neural network to nowcasting. J. Appl. Meteorol. Sci. 2019, 30, 61–69. (In Chinese) [Google Scholar]
- Yousefnia, K.V.; Bölle, T.; Zöbisch, I.; Gerz, T. A machine-learning approach to thunderstorm forecasting through post-processing of simulation data. RMets 2024, 150, 3495–3510. [Google Scholar] [CrossRef] [Scilit]
- Brodehl, S.; Müller, R.; Schömer, E.; Spichtinger, P.; Wand, M. End-to-end prediction of lightning events from geostationary satellite images. Remote Sens. 2022, 14, 3760. [Google Scholar] [CrossRef] [Scilit]
- Guastavino, S.; Piana, M.; Tizzi, M.; Cassola, F.; Iengo, A.; Sacchetti, D.; Solazzo, E.; Benvenuto, F. Prediction of severe thunderstorm events with ensemble deep learning and radar data. Sci. Rep. 2022, 1, 20049. [Google Scholar] [CrossRef] [Scilit]
- Leinonen, J.; Hamann, U.; Germann, U.; Mecikalski, J. Nowcasting thunderstorm hazards using machine learning: The impact of data sources on performance. Nat. Hazards Earth Syst. Sci. 2022, 22, 577–597. [Google Scholar] [CrossRef] [Scilit]
- Xiong, A.; Liu, N.; Liu, Y.; Zhi, S.; Wu, L.; Xin, Y.; Shi, Y.; Zhan, Y. QpefBD: A benchmark dataset applied to machine learning for minute-scale quantitative precipitation estimation and forecasting. J. Meteorol. Res. 2022, 36, 93–106. [Google Scholar] [CrossRef] [Scilit]
- Prabhat; Kashinath, K.; Mudigonda, M.; Kim, S.; Kapp-Schwoerer, L.; Graubner, A.; Karaismailoglu, E.; von Kleist, L.; Kurth, T.; Greiner, A.; et al. ClimateNet: An expert-labeled open dataset and deep learning architecture for enabling high-precision analyses of extreme weather. Geosci. Model Dev. 2021, 14, 107–124. [Google Scholar] [CrossRef] [Scilit]
- Bala, K.; Paul, S.; Mohanty, S.N.; Mahapatra, S. Improved prediction analysis with hybrid models for thunderstorm classification over the Ranchi Region. New Gener. Comput. 2024, 42, 7–31. [Google Scholar] [CrossRef] [Scilit]
- Veillette, M.; Samsi, S.; Mattioli, C.J. SEVIR: A storm event imagery dataset for deep learning applications in radar and satellite meteorology. In Proceedings of the 34th Annual Conference on Neural Information Processing Systems (NeurIPS), Virtual Conference, 6–12 December 2020. [Google Scholar]
- Haberlie, A.M.; Ashley, W.S.; Karpinski, M. Mean storms: Composites of radar reflectivity images during two decades of severe thunderstorm events. Int. J. Climatol. 2020, 42, 1738–1756. [Google Scholar] [CrossRef] [Scilit]
- Gong, J.C.; Bai, L.; Ye, P.; Xu, W.H.; Liu, N.; Dai, J.; Yang, X.; Ouyang, W. CasCast: Skillful high-resolution precipitation nowcasting via Cascaded Modelling. In Proceedings of the 41st International Conference on Machine Learning (ICML), Vienna, Austria, 21–27 July 2024. [Google Scholar]
- Gao, Z.H.; Shi, X.J.; Han, B.R.; Wang, H.; Jin, X.Y.; Maddix, D.; Zhu, Y.; Li, M.; Wang, Y.Y. PreDiff: Precipitation nowcasting with latent diffusion models. In Proceedings of the 37th International Conference on Neural Information Processing Systems (NIPS ’23), New Orleans, LA, USA, 10–16 December 2023. [Google Scholar]
- China Meteorological Administration. Specifications for Surface Meteorological Observation; China Meteorological Press: Beijing, China, 2003; pp. 24–25. (In Chinese) [Google Scholar]
- Sergio, F.A.; Kristen, L.C.; Thomas, J.G. An evaluation of the World Wide Lightning Location Network (WWLLN) using the National Lightning Detection Network (NLDN) as ground truth. J. Geophys. Res. 2010, 115, 1–11. [Google Scholar]
- Xu, H.F.; Li, J.Y.; Zhou, J.J.; Zhu, J.; Zou, Q.; Du, S.; Xie, C. Detection and analysis of lightning activities based on DDW1 total-flash 3D lightning location system. J. Trop. Meteorol. 2023, 39, 643–654. (In Chinese) [Google Scholar]
- Tian, Y.; Pang, W.J.; Chen, Z.F.; Lai, Y.; Wang, L.; Xie, N.; Liu, X. Comparative evaluation of the lightning location system in Sichuan province before and after the Upgrade. Chin. J. Atmos. Sci. 2025, 49, 1675–1690. (In Chinese) [Google Scholar]
- Xu, Y.; Shen, Y.; Jiang, X.; Tian, F.; Cao, L.; Wang, N. Quality control technique for ground-based lightning detection data based on multi-source data over China. Remote Sens. 2025, 17, 1928. [Google Scholar] [CrossRef] [Scilit]
- Li, J.X.; Guo, F.X.; Hu, H.B.; Li, R.J.; Qian, M.H.; Xiao, W.A. Comparative analysis of SAFIR and ADTD lightning location data over Beijing and its circumjacent regions. Plateau Meteorol. 2017, 36, 1115–1126. (In Chinese) [Google Scholar]
- Zhao, W.; Jiang, Y.J.; Tong, H.W.; Zhang, B. Comparative analysis of the cloud-to-ground lightning data between two lightning location systems. J. Appl. Meteorol. Sci. 2015, 26, 354–363. (In Chinese) [Google Scholar]
- Xia, R.D.; Zhang, D.L.; Wang, B.L. A 6-Yr cloud-to-ground lightning climatology and its relationship to rainfall over Central and Eastern China. J. Appl. Meteorol. Climatol. 2015, 54, 2443–2460. [Google Scholar] [CrossRef] [Scilit]
- Yang, X.L.; Sun, J.H.; Wang, L.L. An analysis of cloud-to-ground lightning in China during 2010–13. Weather. Forecast. 2015, 30, 1537–1550. [Google Scholar] [CrossRef] [Scilit]
- Hayashi, S.; Umehara, A.; Nagumo, N.; Ushio, T. The relationship between lightning flash rate and ice-related volume derived from dual-polarization radar. Atmos. Res. 2021, 248, 1–14. [Google Scholar] [CrossRef] [Scilit]
- Mosier, R.M.; Schumacher, R.E.C.; Orville, L.D. Radar Nowcasting of Cloud-to-Ground Lightning over Houston, Texas. Weather Forecast. 2011, 26, 199–212. [Google Scholar] [CrossRef] [Scilit]
- Kleshcheva, T.I.; Potalova, E.Y.; Permyakov, M.S. Comparison of world wide lightning location network (WWLLN) data and standard observations at weather stations in the Southern Russian Far East. Russ. Meteorol. Hydrol. 2021, 46, 403–409. [Google Scholar] [CrossRef] [Scilit]
- Bürgesser, R.E. Assessment of the World Wide Lightning Location Network (WWLLN) detection efficiency by comparison to the Lightning Imaging Sensor (LIS). Q. J. R. Meteorol. Soc. 2017, 143, 2809–2817. [Google Scholar] [CrossRef] [Scilit]
- Zhou, K.H.; Zheng, Y.G.; Lan, Y. Flash cell identification, tracking and nowcasting with lightning data. J. Appl. Meteorol. Sci. 2016, 27, 173–181. (In Chinese) [Google Scholar]
- Hou, R.T.; Zhu, B.; Feng, M.X.; Shi, X.M.; Lu, Y. Prediction model for lightning nowcasting based on DBSCAN. J. Comput. Appl. 2012, 32, 847–851. (In Chinese) [Google Scholar] [CrossRef] [Scilit]
- Zhou, K.H.; Zheng, Y.G.; Wang, T.B. Very short-range lightning forecasting with NWP and observation data: A deep learning approach. Acta Meteorol. Sin. 2021, 79, 1–14. (In Chinese) [Google Scholar]
- Hutchins Michael, L.; Holzworth Robert, H. Thunderstorm characteristics from cluster analysis of lightning. In Proceedings of the XV International Conference on Atmospheric Electricity, Norman, OK, USA, 15–20 June 2014. [Google Scholar]
- Ram, A.; Jalal, S.; Jalal, A.; Manoj, K. A density based algorithm for discovering density varied clusters in large spatial databases. Int. J. Comput. Appl. 2010, 3, 739–1038. [Google Scholar] [CrossRef] [Scilit]
- Ester, M.; Kriegel, H.; Sander, J.; Xu, X. A density-based algorithm for discovering clusters in large spatial databases with Noise. In Proceedings of the Second International Conference on Knowledge Discovery and Data Mining; AAAI Press: Cambridge, MA, USA, 1996; pp. 226–231. [Google Scholar]
- Tian, Y.; Pang, W.J.; Chen, Z.F.; He, N.; Zhao, S.; Ji, Y.; Hao, R.; Zhang, T.; Yan, D. Application of the 2σ lightning jump algorithm based on DBSCAN cluster. J. Appl. Meteorol. Sci. 2023, 34, 309–323. (In Chinese) [Google Scholar]
- Li, K.; Wei, M.; Yao, Y.Q. Analysis and mechanism study on the correlation between lightning and radar data in severe weather. J. Trop. Meteorol. 2006, 3, 265–272. (In Chinese) [Google Scholar]
- Vincent, B.R.; Carey, L.D.; Schneider, D.; Keeter, K.; Gonski, R. Using WSR-88D reflectivity data for the prediction of cloud-to-ground lightning: A central North Carolina study. Natl. Weather Dig. 2003, 27, 35–44. [Google Scholar]
- Wang, F.; Zhang, Y.J.; Zhao, J.Z.; Lü, W.T.; Meng, Q. The prelimiary application of radar data to the lightning warning of isolated storm cells. J. Appl. Meteorol. Sci. 2008, 19, 153–160. (In Chinese) [Google Scholar]
- Yang, C.; Xiao, W.N.; Feng, M.X.; Jiao, S.M.; Jiao, X. A case study on characteristics of lightning and Doppler radar echo in a strong convective system. J. Meteorol. Sci. 2009, 9, 403–407. (In Chinese) [Google Scholar]
- Zhang, Y.P.; Wang, X.M.; Niu, S.Z.; Fan, X.F.; Lv, X.N.; Zhou, H.J. Analysis of relationship between cloud to ground Lightning activities of severe thunderstorm and radar echo in Henan. Meteorol. Mon. 2010, 36, 54–61. (In Chinese) [Google Scholar]
- Xiao, Y.J.; Liu, L.P. Study of methods for interpolating data from weather radar network to 3-D grid and mosaics. Acta Meteorol. Sin. 2006, 64, 647–657. (In Chinese) [Google Scholar]
- Maribel, M. The relationship between radar reflectivity and lightning activity at initial stages of convective storms. In Proceedings of the 82nd Annual Meeting of the American Meteorological Society & First Annual Student Conference, Orlando, FL, USA, 20–24 January 2002. [Google Scholar]
- Yu, X.D.; Zhou, X.G.; Wang, X.M. The advances in the nowcasting techniques on thunderstorms and severe convection. Acta Meteorol. Sin. 2012, 70, 311–337. (In Chinese) [Google Scholar]
- Zhang, X.L.; Chen, Y.; Zhang, T. Meso-scale convective weather analysis and severe convective weather forecasting. Acta Meteorol. Sin. 2012, 70, 642–654. (In Chinese) [Google Scholar]
- Yang, X.L.; Sun, J.H.; Lu, R.; Zhang, X. Environmental characteristics of severe convective wind over South China. Meteorol. Mon. 2017, 43, 769–780. (In Chinese) [Google Scholar]
- May, R.M.; Goebbert, K.H.; Thielen, J.E.; Leeman, J.R.; Camron, M.D.; Bruick, Z.; Bruning, E.C.; Manser, R.P.; Arms, S.C.; Marsh, P.T. MetPy: A meteorological python library for data analysis and visualization. Bull. Am. Meteorol. Soc. 2022, 103, E2273–E2284. [Google Scholar] [CrossRef] [Scilit]
- Grabowski, W.; Morrison, H. Supersaturation, buoyancy, and deep convection dynamics. Atmos. Chem. Phys. 2021, 21, 13997–14018. [Google Scholar] [CrossRef] [Scilit]

Disclaimer/Publisher’s Note: The statements, opinions and data contained in all publications are solely those of the individual author(s) and contributor(s) and not of MDPI and/or the editor(s). MDPI and/or the editor(s) disclaim responsibility for any injury to people or property resulting from any ideas, methods, instructions or products referred to in the content. |
© 2026 by the authors. Licensee MDPI, Basel, Switzerland. This article is an open access article distributed under the terms and conditions of the Creative Commons Attribution (CC BY) license.