


Highlights
What are the main findings?
- Spatiotemporal Unmanned Aerial System (UAS) surveys for Underground Coal Fires (UCFs) provide an effective method for studying UCFs in unstable and hazardous terrain and difficult-to-reach areas.
- The orthomosaics analysis reveals UCF-induced terrain changes and their propagation over time, while the Multiscale Model-to-Model Cloud Comparison (M3C2) enables monitoring displacements in the area of interest.
- The orthomosaics and M3C2 results are complementary and generally align well, although processing the M3C2 data is challenging due to vegetation, uneven illumination, and different UASs used from survey to survey.
What are the implications of the main findings?
- The key findings support risk mitigation efforts near Colorado Highway 13, and the results offer critical insights into the use of UAS for ongoing monitoring of geohazards associated with legacy coal mine fires.
- The approach developed in this study is readily applicable to other UCF sites and provides a flexible, cost-effective complement to in situ UCF studies.
Abstract
Underground coal fires (UCFs) pose a persistent environmental and economic threat to both the built and natural worlds. In Colorado, 38 known coal fires are currently monitored by the Colorado Division of Reclamation, Mining, and Safety, many of which are in the immediate vicinity of communities and transportation infrastructure. The Axial underground coal mine fire in northwestern Colorado has been active for over 70 years and has a documented history of surface impacts, including wildfire ignition and UCF-induced slope instability near a major highway corridor. Subsurface investigations indicate active combustion in multiple coal seams, contributing to complex and evolving surface deformation. Unmanned Aerial System (UAS)-based optical surveys acquired between 2018 and 2025 were used to assess terrain changes and slope instability at the Axial site. Structure-from-motion photogrammetry was used to generate three-dimensional point clouds and orthomosaics, and surface deformation was quantified using the Multiscale Model-to-Model Cloud Comparison (M3C2) algorithm. Orthomosaic products were additionally evaluated to characterize the development of geomorphic features and cross-validate the interpretation of M3C2-derived deformation patterns. Repeat UAS surveys effectively identified changes in unstable and hazardous terrain caused by UCFs. Results reveal progressive subsidence, fracture development, and localized slope instability associated with ongoing subsurface combustion. The findings provide critical information for risk mitigation and illustrate both the capabilities and challenges of using UAS photogrammetry for long-term monitoring of geohazards associated with legacy coal mine fires. The study further emphasizes the importance of georeferencing strategies, including ground control points and real-time kinematic positioning, to ensure consistent and reliable multi-temporal change detection.
1. Introduction
1.1. Motivations and Scope of Work
Underground coal fires (UCFs) are persistent geohazards with severe environmental, economic, and societal consequences. They contribute to ground deformation and infrastructure damage [1,2,3,4,5], vegetation degradation [4,5,6,7,8,9,10], soil contamination [5,10,11,12], air pollution [4,12,13,14,15,16,17], water pollution [4,15,16,17], dangers to human health [11,14,15,16,17,18,19,20,21], depletion of coal resources [14,16,17], and the ignition of surface fires [1,6,16]. Despite decades of mitigation efforts, extinguishment projects remain difficult to implement as recognition and funding often fluctuate. At the same time, a limited understanding of how these fires initiate, propagate in the subsurface, and interact with the land surface continues to hinder effective delineation of their extent and assessment of the dangers they pose to surrounding landscapes and communities.
Delineation of the subsurface extent of the fire is essential for effective extinguishment projects. While direct measurement is rarely possible, surface manifestations such as subsidence, fissures, cracks, and localized temperature anomalies provide important indirect evidence of subsurface fire activity. However, these indicators can be spatially variable and difficult to monitor consistently through conventional field surveys due to hazardous site conditions and hard-to-access locations.
Remote sensing, in general, offers a safer, lower-cost, and more scalable alternative for monitoring fire dynamics. In particular, unmanned aerial systems (UAS) provide repeatable, high-resolution data that can detect subtle geomorphic change. Structure-from-motion (SfM) photogrammetry applied to UAS imagery can generate point clouds, digital elevation models (DEMs), and orthomosaics, which in turn enable detailed quantification of deformation. While UAS SfM has been applied in mining and other deformation contexts, its potential for capturing the geomorphic expression of UCFs remains underexplored.
The primary aim of this study is to evaluate the use of UAS-based multitemporal surveys to detect and quantify surface deformation and geomorphic changes related to UCFs and coal mine subsidence. SfM photogrammetry-derived products, multi-temporal point clouds, and orthomosaics provide the basis for generating digital surface models and topographic derivatives that capture spatial and temporal patterns of ground movement and terrain changes. Because delineating the extent of subsurface fire is critical to fire control projects, surface indicators such as subsidence, cracking, fissuring, and temperature anomalies are valuable indicators for approximating fire boundaries. While surface deformation alone does not directly identify active combustion zones, it contributes to characterizing fire-related geomorphology and associated hazards. This approach supports decision-making in monitoring, instrumentation design, and risk mitigation. Furthermore, evaluating various UAS flight configurations shows that improved UAS survey planning can significantly enhance model accuracy and ensure a more effective long-term monitoring program, particularly by using both nadir and oblique imagery in complex topography and variable vegetation cover, and by deploying more ground control points (GCPs) [22]. This study also evaluates the reliability and limitations of multi-temporal UAS photogrammetry for deformation monitoring under evolving acquisition strategies, rather than presenting a fully uniform time-series analysis.
1.2. Coal Fire Causes and Associated Geomorphology
Coal fires are commonly human-induced [14]. Underground mining operations expose coal to oxygen and create semi-enclosed spaces, fostering conditions favorable to spontaneous combustion and the development of coal fires [16,23,24]. Natural coal fires can be ignited by wildfires or intense solar heating of exposed coal seams, which are brought to the surface by geologic processes, such as faulting, folding, and erosion [25,26]. Once initiated, UCF can destabilize overlying strata through the collapse of residual coal pillars and thermally-driven volume changes in mined or unmined seams, producing the fractures, subsidence, and emission features observed at the surface [24,27,28]. Understanding the development and evolution of these geomorphic features provides critical insight into fire behavior, extent, and hazard potential.
Observable UCF-induced geomorphic features can be broadly grouped into surface fracture features and surface subsidence features (Table 1). Surface fractures include fissures, cracks, funnels, vents, and sponges, which commonly act as conduits for hot gases and air ingress, thereby sustaining combustion and facilitating fumarolic mineral deposition [1,4]. Surface subsidence features include sinkholes, trenches, broad depressions, and mass wasting features (e.g., slides and rockfalls), reflecting the progressive weakening and collapse of subsurface materials. In addition to deformation-related landforms, UCF activity may produce exposed ash layers, pyro-metamorphic rocks, and fumarolic mineral deposits, which serve as mineralogical indicators of sustained high-temperature combustion and gas emission at the surface.
Table 1.
Summary of Geomorphic Features Associated with Underground Coal Fire (UCF) (Summarized and modified based on [1] and observations in this study).
It is important to note that fractures and subsidence features are not uniquely diagnostic of UCFs. Similar features may be produced by mining activity, tectonic stresses, shear zones, freeze–thaw processes, erosion, or weathering-related microfracturing [29]. Cracks and fissures associated with UCFs can extend several meters in depth depending on subsurface conditions and commonly serve as pathways for hot gas emission and oxygen ingress, accelerating combustion, heat transfer, and the penetration of moisture and oxygen [1].
Surface subsidence typically develops progressively, with shallow depressions evolving into sinkholes and trenches as subsurface voids expand. Partial-surface subsidence represents an incomplete collapse of the overburden above underground voids, forming a transitional stage between surface depression and full collapse and typically affecting areas ranging from a few meters to several tens of meters in extent [1]. In contrast, large-surface subsidence is characterized by the complete collapse of overlying bedrock associated with advanced-stage coal seam burnout and generally affects areas of several square meters or more [1].
1.3. Approaches for UCFs Detection
UCFs often exhibit limited or subtle surface expressions, making detection reliant on indirect indicators. Observed changes can be difficult to attribute solely to UCF, as they may result from other unrelated environmental processes or anthropogenic activities. Current anthropogenic activities at UCFs in Colorado include disturbances from ongoing investigations and mitigation efforts, such as road development, drilling, instrumentation installation, vegetation removal, and subsidence backfilling.
Ground-based monitoring of UCFs is further constrained by high costs and safety concerns, including exposure to toxic gases, elevated surface temperatures, and unstable ground conditions, all of which pose serious risks to field personnel. These limitations restrict spatial coverage and observation frequency, hindering long-term monitoring. Consequently, remote sensing is becoming an increasingly important technique for UCF detection and characterization, offering a non-contact means of observing hazardous or inaccessible areas over broad spatial and temporal scales.
Remote sensing approaches are particularly effective for identifying indirect indicators of UCF activity, such as surface subsidence, fracture development, geomorphic change, thermal anomalies, and vegetation stress. High-resolution remote sensing data enable mapping of terrain and elevation changes that may not be apparent during field inspections alone. However, the detectability of underground coal fire–related geomorphic features varies with the remote-sensing approach and the feature scale and expression. Cracks and larger fissures can be detected in high-resolution satellite imagery; however, smaller features such as funnels and sponges are difficult to detect by remote sensing unless accompanied by prominent halos of fumarolic mineralization (Table 1).
Field-based observations and remote sensing approaches provide complementary perspectives for assessing UCF geomorphic features. Field surveys are particularly useful for documenting small-scale features that may fall below the spatial resolution of many remote sensing datasets or lack sufficient surface expression for reliable detection, such as narrow fissures, cracks, funnels, and localized vents. These surveys commonly involve GPS mapping, visual inspection, and thermal measurements to record feature coordinates, dimensions, temperature, and associated fumarolic mineralization [1]. In contrast, remote sensing provides spatially extensive coverage and is well suited to identifying and monitoring large-scale geomorphologic features, including cracks, vents, sinkholes, trenches, broad depressions, slides, and surface subsidence.
UAS-based optical and thermal surveys bridge the scale gap between field observations and satellite imagery by providing centimeter-scale resolution, enabling improved detection and mapping of small- to intermediate-scale features, such as narrow cracks, vents, and localized subsidence.
Integration of remote sensing and fieldwork enhances detection capabilities, supports quantification of deformation, and improves understanding of the evolution of geomorphic features in both active and post-combustion coal fire environments.
1.3.1. Advancement in Remote Sensing for UCFs
Advancements in remote sensing technologies show great potential as available and inexpensive tools for addressing these challenges in coal fire identification, monitoring, and behavior research at local, regional, and global scales [30,31]. The non-contact and retrospective nature of this technique offers unique advantages, as the same target can be observed from different distances, providing information at various scales and different times. Several typical surface features, referred to as geoenvironmental indicators of coal fires, can be detected, delineated, and quantified using remote sensing techniques to characterize coal fire areas [32]. Geomorphic features, temperature anomalies, gas emissions, and vegetation degradation are frequently used to detect UCFs and delineate their extent [1,31,32,33,34].
Both traditional and advanced remote sensing methods can detect and monitor terrain changes associated with UCFs, including those at risk of future changes [26,30,35]. Traditional methods rely on visual interpretation of aerial photos, in which subsidence is detected by elements such as tone, texture, shape, size, and pattern, and verified through field observations. These approaches are limited by spatial coverage, survey costs, access constraints in hazardous areas, and variability among field personnel.
Advances in remote sensing technologies and the availability of high-resolution satellite data (e.g., WorldView-1, GeoEye-1, WorldView-2, and WorldView-3) enable broader terrain coverage and improve the detection of UCFs. Satellite-based interferometric synthetic aperture radar (InSAR) has demonstrated its ability to monitor subsidence associated with UCFs and other ground disturbances caused by natural events and anthropogenic activities. With advanced InSAR techniques, such as persistent scatterer (PS) time-series analysis and the four-dimensional (4D) filtering method, ground deformation can be detected at the millimeter scale [36,37,38,39,40]. InSAR provides day-and-night, weather- and smoke-independent images that can detect ground features over extensive areas [2,3,31,41,42,43,44,45,46,47,48]. However, InSAR has limitations, although some can be overcome by advanced data processing techniques. For instance, it may experience “decorrelation” in regions with dense vegetation, snow on the ground, and atmospheric noise. Furthermore, InSAR is not suitable for detecting large, rapid changes or for small study areas, such as deformation zones with insufficient pixel coverage (e.g., areas smaller than 3-by-3 pixels).
Unmanned aerial systems (UAS) have enabled the acquisition of high-resolution terrain data at the site-specific scale, substantially improving the ability to monitor surface changes. UAS surveys offer flexible, high-resolution, and repeatable monitoring of terrain and surface changes. Unmanned aerial vehicle (UAV) platforms equipped with high-resolution cameras capture geotagged images that can be processed with structure-from-motion (SfM) photogrammetric algorithms to generate three-dimensional (3D) point clouds, which can then be converted into orthomosaics and digital elevation models (DEMs). These products enable detailed quantification of surface deformation and geomorphic changes over time.
Despite these capabilities, the application of UAS-based surveys to underground coal fire (UCF) studies has primarily focused on thermal and gas-based observations, while its use for identifying UCF-related geomorphic features and monitoring surface deformation remains limited. Most UAS applications to coal fires have focused on thermal and gas measurements, including the construction of 3D thermal surfaces to characterize surface thermal anomalies [49,50,51,52,53,54,55] and the use of UAV-mounted gas sensors to detect emissions and determine the coal rank of the burning seam [56]. These approaches provide valuable insights into fire activity but do not directly capture surface deformation, which is critical for assessing subsidence, fractures, and associated hazard potential.
In contrast, UASs have been widely applied to model surface deformation induced by underground coal mining, using both SfM photogrammetry [57,58,59,60,61,62,63,64,65] and LiDAR [66,67]. These approaches enable high-resolution, multi-temporal monitoring of elevation changes, even in complex or inaccessible terrain, demonstrating suitability for capturing deformation processes analogous to those expected in UCF-affected settings.
UAS-based surveys offer several advantages over traditional ground surveys for deformation monitoring, including lower acquisition costs, greater flexibility in complex terrain, and user-defined spatial and temporal resolution. UAS platforms cover large areas quickly with high accuracy and capture fine-scale features, such as cracks and small-scale subsidence, that may be missed by terrain models derived from airborne LiDAR or satellite-based platforms [58]. At larger study areas, satellite-based remote sensing remains more suitable for regional monitoring due to its extensive coverage, whereas UAS surveys are best suited for high-resolution, site-specific investigations that require detailed characterization of surface deformation.
Despite these advantages, UAS surveys are subject to technical limitations that can affect measurement precision. Vegetation cover can reduce the accuracy of vertical displacement estimates, while low-quality imagery or poor co-registration can reduce the precision of SfM products [59]. Operational constraints further limit UAS deployment. Battery capacity restricts flight duration and spatial coverage, often requiring multiple flights to fully map target areas. In addition, UAS operations may require personnel to access remote or hazardous locations, increasing logistical complexity. Consequently, proper mission planning and quality control are essential for reliable measurements.
Several studies have also assessed the relative precision of photogrammetric point clouds generated with limited ground control. For instance, one study [58] evaluated sparse point clouds using Monte Carlo simulation and then co-registered multi-temporal UAV datasets to airborne lidar reference surfaces. Their results demonstrate that UAV-based photogrammetry can capture spatiotemporal deformation patterns even under data-sparse conditions, although with reduced confidence compared with GCP-controlled surveys.
1.3.2. Point Clouds Versus Raster-Based Change Detection Approaches
Two general approaches are commonly used to monitor mine-subsidence-induced surface deformation from UAS surveys: raster-based surface differencing and direct point cloud comparison. Raster-based methods typically quantify vertical or horizontal displacement by differencing gridded elevation models [59,60,61,62,63,64,65,66,67]. These models are interpolated from elevation values derived from point clouds, often after filtering to isolate bare-earth points to create a digital terrain model (DTM). However, the gridding process can introduce errors and interpolation artifacts, reduce detail, and obscure fine-scale deformation features such as fractures. This approach is also biased toward detecting vertical change, potentially missing non-vertical displacement vectors in more complex geomorphic settings.
By contrast, direct point cloud comparison preserves the full 3D geometry of the data, avoiding surface interpolation and preserving fine-scale topographic detail. Point cloud–based approaches can capture multidirectional displacement, making them more suitable for complex terrain and deformation processes not restricted to the vertical axis, such as mining-related subsidence and collapse features. Several techniques exist for performing point cloud comparisons. The cloud-to-cloud (C2C) method calculates displacement as the nearest-neighbor distance between points in successive clouds, providing a simple but noise-sensitive measure of surface change. The cloud-to-mesh (C2M) method calculates displacement relative to a reference surface mesh generated from one of the point clouds, reducing sensitivity to local point-density variability. More advanced methods, such as the multi-scale model-to-model cloud comparison (M3C2), improve robustness in rough or complex terrain by estimating surface displacement vectors from local neighborhoods of points rather than from individual nearest-neighbor matches, reducing sensitivity to noise and point-density variability [49]. These methods can only calculate the out-of-plane displacement of the local surface, while measuring the in-plane displacement remains challenging for most point cloud comparison techniques [68].
Direct point cloud comparison methods have been successfully applied to landslides, rockfalls, glacial movement, and other environments. Few studies have used direct point cloud comparison methods to monitor mining subsidence [57,58]. Direct C2C analysis has been applied to identify areas of subsidence, reclamation, and sinkholes [57]. M3C2 has been used to characterize deformation in complex mining terrain [58]. Both approaches highlight the importance of precise co-registration, as registration error directly propagates into displacement estimates regardless of the comparison method employed. The reliability of multi-temporal point cloud change analysis also depends on data quality, point density, surface roughness, and registration error, which can affect displacement estimates [58].
1.4. Study Area
The Axial Underground Coal Mine Fire is located in the Yampa Valley Coal Field in Moffat County, Colorado, along Colorado State Highway 13 (CO-13) between the towns of Meeker and Craig (Figure 1). The site sits at an elevation of approximately 2000 to 2150 m. Historic underground mining and subsequent fire spread have left the terrain unstable, with ongoing geohazard risks, including subsidence, surface fracturing, and slope instability.
Figure 1.
The location of the Axial Underground Coal Mine Fire site draping on a topographic map showing the location of Good Spring Creek (blue) and State Highway CO-13 (white line).
The site is characterized by steep, east- and south-facing rocky outcrops that rise to a broad northwest-trending ridge. Surface manifestations of the coal fire occur primarily mid-slope on the east-facing hillside overlooking Good Spring Creek and CO-13. To the south and southwest, an overburden disposal area associated with the current Colowyo Coal Mine backfills the historic Redwing Mine.
The underground mine at the Axial site operated from 1905 to 1951, producing an estimated 640,000 tons of coal [6]. Coal seams at the site include the mined coal seams (lower H Seam, upper G Seam) as well as three overlying rider seams—thin and unmineable coal beds (unpublished). Mining operations ceased in October 1951 following a collapse of the mine triggered by a cave-in in an abandoned upper G Seam [69]. The underground coal fire was first reported in 1953, although it likely ignited in 1951, when the mine cave-in triggered the spontaneous combustion of the pulverized, collapsed coal pillars [6].
In July 2020, the underground fire ignited the Streeter Wildfire, prompting evacuations at the nearby Colowyo Coal Mine, the temporary closure of CO-13, and the burning of approximately 1600 acres. The Axial fire remains one of Colorado’s most persistent and hazardous coal mine fires, characterized by multi-seam combustion, widespread fracturing, subsidence, and mass wasting features [70]. Figure 2 shows examples of UCF-induced surface changes at the study site. With the close proximity to the highway, the hazards at the site pose a risk to trespassers, and a full collapse of the possible landslide at the site could impact the highway.
Figure 2.
Examples of underground coal fire (UCF)–induced surface changes observed at the Axial study site: (a) Actively venting feature documented on 1 June 2023, exhibiting elevated surface temperatures (~400 °F), visible gas emissions, and creosote formation; vegetation stress is evident in the immediate vicinity of the vent. (b) East-facing perspective view from the slope crest of a north–south–striking fracture features interpreted as a subsidence-related landform, photographed on 8 October 2024. The gray horizontal linear feature in the upper portion of the photo is CO-13.
At the Axial underground coal fire site, UCF-induced geomorphic features observed during field investigations and UAS surveys include numerous open cracks and fissures, trenches, localized vents, and slope instabilities, including rockfalls and shallow slides. Observable surface expressions include fractured bedrock, localized collapse, and associated rockfall.
Cracks and fissures occur predominantly along the slope crest and upper slope, often aligning with mapped mine entries and inferred subsurface voids. Trenches developed as elongated depressions along these fracture zones, reflecting progressive subsidence and collapse. Actively venting features were observed in localized areas, marked by gas emissions, altered rock surfaces, and sparse vegetation. Downslope mass-wasting features (e.g., slides and rockfalls) were identified along steep cliff faces, particularly where subsurface weakening reduced the stability of the rock mass. These features exhibit measurable spatial and temporal variation between survey epochs, making them suitable targets for multi-temporal deformation and terrain change analyses using UAS-derived point clouds and orthomosaics.
Site Geology
The bedrock in the study area consists of Late Cretaceous sedimentary rocks of the Mesaverde Group, including the coal-bearing Williams Fork Formation and the underlying Iles Formation, which together form part of the Yampa Valley Coal Field [71,72,73]. Coal is widely distributed vertically throughout the Mesaverde Group in seams that vary widely in thickness and lateral continuity and commonly split into multiple seams. Tracing individual coal beds at the surface is often difficult due to irregular seam geometry, limited outcrop exposure, and the presence of clinker, a fused, heat-altered material produced by coal combustion that forms hard nodules and slag-like deposits [25].
Coal seams interbedded with sandstone and sandy shale have burned extensively across the region, producing brick-red sandstone, baked shale, and thick accumulations of clinker [71,72]. These thermally altered materials are more resistant to erosion than the surrounding unaltered Mancos Shale, often resulting in steepened slopes and prominent topographic features [71]. Combustion of thick coal seams can induce surface fracturing, subsidence, and slumping, thereby enhancing airflow and promoting sustained and deeper burning.
The study area is situated within a landscape of north- to northeast-trending V-shaped ravines, including an area immediately east of the site with surficial deposits composed of Quaternary alluvium (Qal) (Figure 3). These ravines cut perpendicular to the strike of coal-bearing strata, exposing thick sequences of beds [71]. Ravine side slopes gently rise to broad ridges with long, gradual northeastward slopes.
Figure 3.
Geologic map of the Axial Underground Coal Mine Fire Site showing major lithologic units and structural features. Modified from [74].
At the site scale, the Williams Fork Formation consists of brown to gray, fine-grained, lenticular-bedded sandstone, darker-colored mudstones, siltstones, and carbonaceous shale [72]. Historical descriptions from a 1925 document, tell of a prominent sandstone unit that burned to brick-red color overlying multiple coal beds exposed on the east-facing hillside above Good Spring Creek. Such historic reports testify to the long-standing coal combustion activity in the area [71].
Structurally, the NW–SE trending Collom syncline passes just south of the site (Figure 3). Near the synclinal axis, strata dip gently southward at less than 5°, with dips steepening northward to approximately 20–30° toward the Axial Basin anticline, located approximately 6 km north of the site. Coal-bearing strata are exposed along the southern limb of this anticline within the ravine system.
Coal seams at the site include two historically mined seams, the upper G Seam and lower H Seam, as well as three overlying rider seams. Based on drilling data from 1998 and 2016 investigations, coal-bearing strata occur beneath approximately 60 m of sandstone and shale overburden. The rider seams are encountered at depths of approximately 62–88 m below ground surface, while the G Seam occurs from approximately 99–106 m and the H Seam from approximately 109–115 m below ground surface. The G Seam, approximately 5.8 m (19 ft) thick, is known to be actively burning based on drilling investigations and subsurface temperature measurements. In contrast, the H Seam, approximately 5.2 m (17 ft) thick, does not appear to be actively burning. Portions of the G Seam and the overlying rider seams are involved in combustion, with fire propagation facilitated by mining-induced and combustion-related subsidence fractures. These fractures provide pathways for heat transfer and oxygen ingress, allowing combustion to extend upward into the rider seams and to persist preferentially along fracture networks that intersect the ground surface.
2. Materials and Methods
This study investigates UCF-induced terrain changes using four multitemporal UAS surveys conducted over a seven-year period. Photogrammetry-derived point-cloud comparisons are used to detect ground deformation, and corresponding optical orthomosaic imagery is used to identify geomorphic features associated with UCF.
The methods used in this study include (1) UAS data acquisition, (2) photogrammetric processing, (3) multi-temporal point cloud co-registration, (4) cloud comparison surface change analysis, and (5) geomorphic feature interpretations supported by orthomosaics. The above methods are integrated in the analyses, and the results provide a comprehensive understanding of the UCF in the study site. The technical flowchart for the UAS survey and data processing is provided in Figure 4.
Figure 4.
Technical flowchart of the proposed method used in this study.
2.1. UAS Data Acquisition
UAS datasets were acquired in August 2018, March 2021, June 2023, and March 2025 (Table 2) using the DJI Phantom 4 Pro (P4P), DJI Mavic 2 Pro (M2P), DJI Matrice 300 RTK, and DJI Mavic 3 Enterprise (M3E) quadrotor unmanned aerial vehicles (UAV) platforms, respectively. All UAV platforms were manufactured by DJI Technology Co., Ltd, in Shenzhen, China. Four different UAV platforms were used due to ongoing advances in UAS technology and platform availability at the time of each survey. In contrast to fixed-wing UAVs, all platforms provide high maneuverability, flight stability, and compact take-off and landing capabilities, making them well-suited for surveys in complex terrain. Camera parameters for UAV payloads are summarized in Table 2.
Table 2.
Summary of UAV platforms, camera payloads, and image acquisition parameters for surveys conducted between 2018 and 2025.
The 2018 survey was conducted using the P4P equipped with a DJI FC6310 camera featuring a 20-megapixel, 1-inch CMOS sensor with an 8.8 mm focal length (24 mm in 35 mm format). The DJI FC6310 camera was manufactured by DJI Technology Co., Ltd, in Shenzhen, China. Images were captured at a resolution of 5472 × 3078 pixels. The camera is fitted with a mechanical shutter to remove rolling-shutter distortions, thereby enhancing photogrammetric geometric accuracy.
The 2021 survey was conducted using the M2P equipped with a Hasselblad L1D-20c camera featuring a 20-megapixel, 1-inch CMOS sensor with a focal length of 10.26 mm (equivalent to 28 mm in 35 mm format). Camera was manufactured by Hasselblad, in Gothenburg, Sweden. Images were captured at a resolution of 5472 × 3078 pixels. Unlike the mechanical shutters on the other survey payloads, the M2P uses an electronic rolling shutter, which may introduce geometric distortions during rapid flight or under windy conditions.
The 2023 survey was conducted using the Matrice 300 RTK equipped with the DJI Zenmuse P1 camera payload manufactured by DJI Technology Co., Ltd, in Shenzhen, China. The P1 features a full-frame 45-megapixel CMOS sensor paired with interchangeable DJI DL lenses. For this survey, a 35 mm focal-length lens was used. Images were captured at 8192 × 5460 pixels. The camera includes a global mechanical shutter, eliminating rolling-shutter artifacts and supporting high-accuracy photogrammetric measurements. The M300 RTK has an onboard real-rime kinematic (RTK) positioning system, enabling centimeter-level geolocation accuracy when used with a compatible global navigation satellite system (GNSS) correction source.
The 2025 survey was conducted using the M3E equipped with a 20-megapixel 4/3-inch CMOS sensor and a 12.3 mm focal length (24 mm equivalent), producing images with a resolution of 5280 × 3956 pixels. The camera uses a mechanical shutter to minimize rolling-shutter distortions.
Photogrammetric mission plans were developed based on the specifications of the UAS equipment, relative flight altitude, ground sampling distance (GSD), and image overlap (Table 3). Image overlap, flight configurations, and ground resolution targets were not fully standardized across survey years. Early missions were conducted when the site conditions and optimal acquisition strategies were still being characterized, and when UAS-based surveying practices were in comparatively early stages of implementation for the project. Later missions benefited from increased site familiarity and advances in UAV capabilities, resulting in more consistent acquisition settings.
Table 3.
UAS data acquisition parameters.
The 2018 survey was conducted along a predefined flight path and was supplemented by a manual flight with nadir image capture at the end. The 2021 survey also collected images only along the predefined flight path, but with no manual nadir or oblique imagery captured. The 2023 survey was again conducted along a predefined flight path and was supplemented by a manual flight with a mix of nadir image and oblique image captures. Unfortunately, the oblique imagery is not along the cliff face. The 2025 survey also followed a predefined flight path, with manual takeover at the end of the flight to acquire oblique imagery along the cliff face and fracture features (Figure 5).
Figure 5.
UAS Survey Initial Image Locations and GCPs: (a) 2018 Survey; (b) 2021 Survey; (c) 2023 Survey; (d) 2025 Survey.
During image acquisition, the UAV embeds geolocation data, including latitude, longitude, altitude, and acquisition time, derived from the onboard global navigation satellite system (GNSS), into the image exchangeable image file format (EXIF) metadata of each image file. These metadata provide approximate camera positions, which can be imported directly into photogrammetric processing software.
Georeferencing is critical for producing repeatable data to monitor surface changes [58]. Georeferencing approaches varied across survey years due to differences in equipment availability and field logistics. The 2018 and 2025 surveys incorporated ground control points (GCPs), providing the strongest absolute positional control among the surveyed datasets. The 2021 survey relied entirely on onboard GNSS image geotagging for positioning, as neither GCPs nor RTK positioning were available. The 2023 survey utilized RTK positioning but did not include supplemental GCPs. These differences in control strategies reflect the evolving operational framework of the project and directly influence the absolute positional accuracy of the resulting photogrammetric products.
Advancements in GNSS technology and precise time-measurement systems have enabled UAS equipped with real-time kinematic (RTK) and post-processed-kinematic (PPK) positioning to more accurately determine camera position at the moment of image capture [58]. These systems reduce reliance on ground control relative to surveys without RTK or PPK.
Final georeferencing of the 2018 and 2025 photogrammetric models was achieved using GCPs integrated during photogrammetric processing to constrain bundle adjustment and georeference the reconstructed models to an external coordinate reference frame. In addition to their role in model alignment, GCP residuals were used to evaluate the absolute georeferencing accuracy of surveys with ground control.
For the 2018 and 2025 surveys, GCP coordinates were measured using a Trimble R2 GNSS receiver (Trimble Inc., Westminster, CO, USA) with Trimble RTX real-time satellite correction service the day prior to UAS image acquisition. GCPs were marked in the field using high-contrast, rigid circular targets with a bright orange background and a centrally located black cross for identification in UAS imagery. In the 2025 study, GCPs were positioned outside the suspected deformation area and the mining extent to minimize the influence of ground movement on georeferencing accuracy.
Surveys acquired without GCPs (2021 and 2023) were georeferenced using onboard GNSS or RTK image positions, which provide improved absolute positioning relative to standard image geotagging but lack independent ground-based validation. Consequently, absolute georeferencing accuracy could not be directly assessed for these datasets.
2.2. UAS Photogrammetric Processing
The UAV-geolocated images were processed using Pix4Dmapper version 10.4.0 software [75]. The software uses structure-from-motion (SfM) photogrammetry to construct a point cloud, which can then be processed to create digital surface models (DSMs) and orthomosaics.
The process involves three main steps: (1) initial processing, (2) point cloud and mesh processing, and (3) DSM and orthomosaics generation. The initial processing involves extracting specific feature keypoints from the images, followed by keypoint matching between overlapping images, camera calibration, and the entry of GCPs to georeference the projected images and to create a sparse point cloud of automatically generated tie points. The second step builds on the automatically generated tie points, implementing point densification and creating a 3D-textured mesh from the densified point cloud. Finally, the densified point cloud is used to generate a digital surface model (DSM) and orthomosaic through orthorectification, which removes perspective distortion from the images. The DSM represents the elevation of all surfaces, including vegetation and human-built structures. This study focuses on the use of the densified point cloud and orthomosaic for further analyses.
The platform used for data processing was a custom-built workstation (Intel(R) Core (TM) i7-14700K @ 3.40 GHz, 128 GB RAM, NVIDIA GeForce RTX 3090 Ti). The time required to complete each processing workflow was approximately 12 to 26 h per UAS dataset.
To improve the stability and accuracy of the photogrammetric reconstruction, low-quality photographs and images with poor geometric reliability were excluded. These exclusions resulted in only a small number of matched keypoints, which can destabilize bundle adjustment and introduce errors into the 3D geometry. Removing such images reduced noise in the final point cloud and improved the overall consistency of the DSM and orthomosaic. Additionally, image edges affected by lens vignetting or excessive distortion were masked to further minimize reconstruction artifacts. The precision and accuracy of the point clouds were evaluated by reviewing the quality report generated in Pix4D.
2.3. Point Cloud Post-Processing
To accurately evaluate differences in surface dimensions, it is necessary to isolate bare-earth ground points. Point cloud post-processing was conducted using CloudCompare version 2.14 software (http://www.cloudcompare.org, accessed 13 June 2025). Ground point classification was performed through a combination of denoising and filtering steps. First, noise was reduced using the Statistical Outlier Removal (SOR) tool in CloudCompare, which removes points with distances to neighbors that exceed a statistical threshold.
After denoising, the point cloud was subdivided into regions based on slope and vegetation cover to optimize parameter selection for the Cloth Simulation Filter (CSF). The CSF algorithm simulates a cloth draped over the inverted point cloud, and the resulting surface is used to distinguish ground from non-ground objects. A finer grid size was applied in steep, rocky areas with cliffs and fractures to preserve fine terrain features while effectively filtering out small shrubs and grass. In contrast, flatter regions with less vegetation were processed with coarser grid sizes to balance computational efficiency and classification accuracy.
Areas with dense vegetation posed challenges, as a thick canopy reduced image matching and limited the number of reconstructed points. Despite this challenge, CSF successfully separated most ground and vegetation points, although fewer classified ground points were available in heavily vegetated regions. The classification results were subsequently verified through visual inspection, including spot checks of colorized point clouds and assessments of point distribution, to ensure reliable ground separation.
2.4. Multi-Temporal UAS Point Cloud Alignment (Co-Registration)
To enable consistent multi-temporal comparisons, UAS-derived photogrammetric point clouds were co-registered to the 2025 dataset, which served as the reference surface due to its ground control point (GCP) constrained georeferencing. Using the most geometrically stable and spatially complete dataset as the reference minimizes error propagation during multi-temporal alignment. Prior to alignment, all point clouds were denoised and filtered to isolate bare-earth ground points.
Co-registration was performed in CloudCompare using a two-step process. First, an initial coarse alignment was conducted using the point-pair picking tool on corresponding features located within areas of stable, non-deforming terrain present across all surveys. Stable areas were selected to avoid zones affected by mining activity or mitigation efforts and were characterized by relatively flat topography, low vegetation cover, and higher point density. Where feasible, reference areas were chosen proximal to GCP locations used in the 2025 survey to enhance spatial consistency.
Following coarse alignment, the Iterative Closest Point (ICP) adjustment algorithm was applied to the same stable subsets to refine co-registration. ICP iteratively minimizes distances between corresponding points or surfaces by solving for the optimal translation and rotation parameters [76]. The resulting transformation parameters obtained from this process were then applied to the full point cloud for each survey year.
Alignment uncertainty was evaluated using ICP residuals and Multiscale Model-to-Model Cloud Comparison (M3C2) distance statistics, both calculated within the stable reference areas for each aligned dataset and the 2025 alignment reference surface. M3C2 computes distances directly between point clouds along locally estimated surface normals, allowing evaluation of alignment quality on rough natural surfaces while accounting for variations in point density and surface roughness [77]. Within stable reference areas, ICP residuals quantify bulk alignment performance, while M3C2 distance statistics provide an independent assessment of residual registration uncertainty and local surface noise, complementing the point-to-point correspondence assumptions inherent to ICP. The residual alignment uncertainty quantified in this step was subsequently incorporated into deformation analyses by calculating the Level of Detection (LoD).
2.5. Multi-Temporal UAS Point Cloud Comparison and Deformation Analysis
Following co-registration, quantitative surface change was evaluated using cloud-to-cloud comparison methods. Although all point clouds were aligned within a common geometric reference frame defined by the 2025 dataset, surface deformation was evaluated relative to the 2018 survey, which defines the temporal baseline for cumulative change analysis. This approach separates geometric alignment from temporal referencing, allowing deformation to be reported relative to the onset of monitoring while maintaining optimal co-registration accuracy across survey epochs.
To quantify 3D changes with greater sensitivity to surface geometry, the M3C2 tool [77] in the CloudCompare software was used. M3C2 computes distances directly between point clouds along locally estimated surface normals, enabling comparison of rough natural surfaces while accounting for variations in point density, surface orientation, and surface roughness [77]. The resulting distance fields capture the magnitude of fracture and subsidence development across the study area, enabling assessment of the temporal evolution of UCF-induced terrain features over the evaluated period. In addition to per-point distance estimates, M3C2 provides confidence intervals derived from local surface roughness and residual registration error and identifies statistically significant changes [77].
Measurement uncertainty was quantified by calculating the Level of Detection (LoD) using M3C2 distance statistics derived from stable, non-deforming reference areas following co-registration. The LoD represents the minimum surface displacement that can be reliably distinguished from measurement of noise and residual alignment uncertainty. For each aligned survey pair, local surface roughness and residual registration error were quantified within stable reference areas, and the LoD at the 95% confidence level was calculated using a statistical t-test and assuming normally distributed errors as:
where and represent local surface roughness measured along the surface normal within local neighborhoods defined by the M3C2 projection diameter ; and are the number of points within the respective neighborhoods for the two point clouds; and represents registration error, estimated as the M3C2’s Root Mean Square (RMS) distance between the aligned clouds within stable reference areas [77].
Only M3C2 distances exceeding the calculated LoD were considered statistically significant surface changes at the 95% confidence level. Projection and normal scales were selected based on the characteristic size of the surface features of interest, balancing sensitivity to small-scale deformation with robustness to surface roughness and point cloud noise.
2.6. Cross-Validation Between Analyzing the Orthomosaics and M3C2 Results
Following point cloud comparison and deformation analyses, the resulting displacement maps were evaluated in conjunction with UAS-derived orthomosaics to support the interpretation of geomorphic change and surface alterations. High-resolution orthomosaic imagery generated from each UAS survey was used to visually assess surface expressions of deformation, including fissures, cracks, vents, trenches, mass wasting features, and changes in vegetation condition. Observed surface features were spatially compared with deformation patterns revealed by M3C2-based change detection to evaluate consistency between measured surface displacement and observable geomorphic expression. This comparison aided the interpretation of deformation and helped distinguish UCF-related surface change from unrelated surface disturbances or noise in the point cloud data.
3. Results
3.1. UAS Photogrammetric Products Precision and Accuracy
The precision and accuracy of the photogrammetric reconstructions were evaluated using Pix4Dmapper quality metrics, distinguishing between relative geometric precision, which governs multi-temporal surface alignment and change detection, and absolute georeferencing accuracy, which controls alignment with an external coordinate reference frame.
Median keypoint counts per image ranged from approximately 59,000 in the 2018 survey to over 84,000 in 2023, while median image matches increased from approximately 19,000 in 2018 to nearly 45,000 in 2025 (Table 4). The 2021 and 2023 datasets show intermediate values, with progressively higher match redundancy relative to 2018. Increasing keypoint matches over time indicates improved image connectivity and redundancy within the tie-point network, which contributes to more stable bundle adjustment solutions and higher relative model precision. Although the 2025 dataset has a coarser ground sampling distance (GSD) than the 2023 survey, it has the highest number of matched keypoints, suggesting that factors such as flight geometry, overlap, and image quality strongly influence tie-point robustness beyond pixel resolution alone.
Table 4.
Image and keypoint statistics of UAS datasets.
Camera calibration and bundle adjustment metrics for all four UAS surveys are summarized in Table 5. Mean reprojection errors range from 0.170 to 0.234 pixels, with the lowest value observed in 2023 and the highest in 2021. Relative differences between initial and optimized camera parameters decreased substantially over time, from 2.66% in 2018 and 3.40% in 2021, to 0.11% in 2023 and 0.24% in 2025, indicating increasingly stable camera calibration and bundle adjustment solutions in later surveys.
Table 5.
Camera adjustment error and relative camera position and orientation uncertainty metrics of UAS datasets.
Among the four surveys, the 2021 dataset exhibits the highest reprojection error and the largest camera optimization difference, reflecting a comparatively less constrained bundle adjustment solution (Table 5). Mean camera position uncertainties for 2021 (0.012–0.014 m) are similar to those of the 2018 dataset but notably higher than those observed in the 2023 and 2025 surveys. This reduced geometric stability is attributed to the absence of GCPs and RTK positioning, lower image overlap, and the use of an electronic rolling-shutter camera, which increases sensitivity to platform motion and limits geometric stability relative to other surveys employing mechanical shutters and improved georeferencing constraints.
Mean relative camera position and orientation uncertainties decrease in later surveys, with the 2023 and 2025 datasets exhibiting substantially lower uncertainty magnitudes than the 2018 and 2021 datasets (Table 5). Collectively, low reprojection errors, reduced optimization differences, and smaller relative camera uncertainties indicate improved internal geometric precision of the UAS-derived point clouds over time. This trend is consistent with the observed increase in tie-point redundancy.
Bundle adjustment metrics and relative camera uncertainties are indicators of relative geometric precision, which governs surface-to-surface alignment and the sensitivity of change detection. In contrast, ground control point (GCP) residuals are used to evaluate absolute georeferencing accuracy where available (Table 6). GCP residuals primarily reflect the adjustment fit within the constrained solution and are reported here as a measure of internal consistency of the georeferencing constraint rather than as independent checkpoint-based validation.
Table 6.
Georeferencing accuracy statistics of UAS processing with GCPs.
The 2018 dataset, constrained using seven GCPs, achieved a mean RMS error of approximately 0.048 m. The 2025 dataset, constrained using ten GCPs, achieved substantially lower RMS errors, 0.010 m. These results indicate survey-grade accuracy (~1–2 cm) in 2025 compared to lower centimeter-level accuracy (~4–5 cm) in 2018.
The reduced absolute accuracy observed in the 2018 dataset is attributed to fewer GCPs, weaker network geometry, and greater differences in camera optimization compared with 2025. The 2021 dataset was processed without GCPs and therefore lacks an independent measure of absolute georeferencing accuracy. The 2023 dataset was also processed without GCPs but incorporated RTK-enabled camera positions, providing improved absolute positioning compared with standard image geotagging.
Because independent ground-based checkpoints were not collected in 2023, absolute accuracy cannot be directly quantified for that epoch. Instead, expected RTK-level positioning performance is inferred from bundle-adjustment stability (Table 5) and, critically, from the low residual misalignment measured after co-registration within stable reference areas (Section 3.3; Table 7), which is the accuracy metric most relevant for deformation detection.
Despite inter-annual differences in absolute georeferencing accuracy, all datasets exhibit acceptable internal geometric consistency. However, suitability for quantitative relative change detection depends on achieving sufficient multi-temporal co-registration, which is governed by residual alignment uncertainty rather than raw ground control point (GCP) RMS values alone. While all four UAS surveys produced photogrammetric reconstructions suitable for visualization and qualitative interpretation, differences in acquisition strategy, georeferencing control, and camera characteristics resulted in variable co-registration performance. These differences directly influenced the suitability of datasets for quantitative surface change analysis, as evaluated in the following section.
3.2. Orthomosaic Overview and Visual Observations
Building on the geometric quality of the 3D point cloud reconstructions, orthomosaics were generated from each UAS survey using the optimized camera parameters and bundle adjustment solutions described above. Because orthomosaics inherit their geometric fidelity from the underlying photogrammetric model, their positional accuracy depends on tie-point quality, camera calibration stability, and georeferencing constraints.
Orthomosaics generated from each survey epoch provide complementary visual information on surface texture, vegetation cover, burn scars, and anthropogenic disturbance (Figure 6). Illumination conditions varied among survey epochs due to differences in flight timing. The 2018 survey was acquired during the afternoon, resulting in longer shadows and increased shadow contrast across steep terrain. In contrast, the 2021 and 2025 surveys were flown near dawn under more uniform illumination, resulting in shorter shadow lengths and improved radiometric consistency. The 2023 survey was conducted in the morning and exhibits intermediate illumination characteristics; however, strong shadows were present in areas of complex surface geometry, including fracture features, rock outcrops, and zones of dense vegetation, rendering portions of these surfaces not visible in the imagery.
Figure 6.
UAS Survey Orthomosaic Generation Results: (a) 2018 Survey; (b) 2021 Survey; (c) 2023 Survey; (d) 2025 Survey. Note: area in black indicates no data.
Distinct interannual differences in vegetation cover are evident in the orthomosaics. The 2018 survey shows vigorous vegetation growth near the base of the eastern slope associated with warm mine drainage discharge from the mine entries. The 2021 orthomosaic exhibits widespread vegetation loss resulting from the Streeter wildfire, which burned across the site in July 2020, eight months prior, and was ignited by the underground coal fire. Burned areas appear as darkened patches on the surface and show limited regrowth of vegetation in subsequent surveys. Removal/burning of vegetation decreases soil stability, contributing to surface erosion and to the infilling of existing and developing geomorphic fracture features, such as fissures and cracks. Localized snow cover is visible in portions of the 2021 orthomosaic, further influencing surface appearance.
Anthropogenic surface modifications are also evident. A reconstructed access road extending upslope in approximate north–south orientations from the highway CO-13 in May 2023 is visible in the June 2023 orthomosaic, which was used to remove vegetation around vent areas and backfill larger vents such as those pictured in Figure 2a to reduce the risk of surface fire ignition. Vegetation regrowth in areas burned by the wildfire is limited primarily to grasses; trees and shrubs did not reestablish.
Additional access roads and drill pads constructed on the top of the slope in 2024 are visible in the 2025 imagery as linear surface disturbances. These features provide important context for interpreting surface conditions and geomorphic changes but are not interpreted as deformation signals.
Orthomosaics complemented the 3D point cloud analyses by capturing textural and spectral surface characteristics that are not fully represented in elevation-based metrics alone. In particular, orthomosaic interpretation aided identification of fracture continuity, surface disruption patterns, and vegetation stress associated with areas of measured deformation.
3.3. Point Cloud Alignment (Co-Registration) Evaluation
After co-registration, the relative alignment uncertainty of the multi-temporal point cloud datasets was assessed using a combination of ICP residuals and M3C2 distance statistics calculated within the stable reference areas (Table 7). Together, these metrics quantify residual rigid-body misalignment and spatially variable surface noise remaining after co-registration.
Following rigid-body ICP alignment, residual RMS errors within stable reference areas were on the order of centimeters for the 2018–2025 and 2023–2025 comparisons, indicating effective removal of bulk translational and rotational offsets. ICP RMS values of 2.3 cm and 1.2 cm, respectively, are consistent with terrain surface roughness and point spacing and reflect residual registration uncertainty rather than absolute positional error.
Table 7.
ICP and M3C2 distance statistics calculated in stable reference areas to quantify multi-temporal alignment uncertainty.
The 2021 dataset exhibited substantially poorer ICP alignment behavior relative to the 2025 reference, characterized by elevated ICP residuals and unstable surface-to-surface distances within nominally stable areas. As a result, M3C2 distance statistics were not computed for the 2021–2025 comparison. This reduced co-registration performance is consistent with higher reprojection error, larger differences in camera optimization, and greater relative camera uncertainty observed for the 2021 dataset (Section 3.1), and is attributed to the absence of GCPs or RTK positioning, rolling-shutter image acquisition resulting in distortion of images, and reduced image overlap relative to the other surveys, which collectively contributed to reduced network robustness.
Residual surface-to-surface variability after co-registration was further evaluated using M3C2 distance statistics computed along local surface normals within stable reference areas. Mean M3C2 distances were small for both comparisons (0.9 cm for 2018–2025 and 0.001 cm for 2023–2025), indicating minimal systematic bias following co-registration. The standard deviation of M3C2 distances decreased substantially from 2.8 cm in the 2018–2025 comparison to 1.3 cm in the 2023–2025 comparison, reflecting improved relative geometric precision and reduced residual misalignment in the latter dataset.
Assuming an approximately normal distribution, approximately 95% of M3C2 distances within stable reference areas fall within ±1.96 standard deviations, consistent with expectations for rough natural terrain. Minor residual distances are expected due to small-scale topographic variability, variable point density and GSD, and low vegetation cover. These effects are generally acceptable as long as the underlying stable ground features remain well-aligned.
The ICP and M3C2 distance statistics indicate successful co-registration for the 2018 and 2023 datasets relative to 2025, with residual misalignment sufficiently small to support quantitative multi-temporal change detection. In contrast, the 2021 dataset did not achieve comparable co-registration quality and was therefore excluded from quantitative point-cloud-based deformation analysis.
3.4. M3C2-Based Deformation Results and Ground Displacement Monitoring
Multi-temporal surface change was quantified using Multiscale Model-to-Model Cloud Comparison (M3C2) distances calculated between the 2018–2023 and 2018–2025 point cloud pairs. Although all datasets were co-registered to the 2025 reference surface to ensure a consistent external coordinate framework, surface deformation was evaluated relative to the 2018 dataset, which defines the temporal baseline for cumulative displacement analysis in the 2018–2023 and 2018–2025 comparisons. Despite exhibiting higher noise levels relative to later surveys, the 2018 point cloud was retained as the baseline epoch because it enables quantification of long-term cumulative deformation over the full monitoring period. The influence of increased roughness and spatially variable uncertainty in the 2018 dataset was mitigated through conservative Level of Detection (LoD) thresholds derived from stable reference areas.
The 2021 dataset was excluded from quantitative M3C2-based deformation analysis due to insufficient co-registration quality (Section 3.3). However, orthomosaic products from the 2021 survey were retained for qualitative visual interpretation of surface conditions.
For each M3C2 comparison, the analysis was conducted in two sequential steps. First, M3C2 distances were calculated only within stable reference areas to quantify residual registration error and surface roughness and to derive a Level of Detection (LoD) at the 95% confidence level (Table 8). These stable areas are assumed to be free of true surface deformation, such that measured distances primarily reflect measurement noise and co-registration uncertainty. The resulting LoD defines the minimum surface displacement that can be reliably distinguished from noise and residual co-registration uncertainty. Second, M3C2 distances were calculated across the entire study area using identical processing parameters. Surface change was interpreted by comparing full-domain M3C2 distances to the LoD derived from the stable reference areas. Only distances exceeding the LoD were considered statistically significant surface deformation.
Table 8.
Summary of M3C2 distance statistics calculated within stable reference areas and corresponding LoD relative to the 2018 baseline.
The calculated Level of Detection (LoD at the 95% confidence interval) was 13.1 cm for the 2018–2023 comparison and 7.2 cm for the 2018–2025 comparison, reflecting differences in surface roughness and residual registration uncertainty between epochs. Localized anomalous M3C2 distances were detected in areas where vegetation was incompletely removed during classification and in areas where vegetation removal created data gaps, resulting in signals or regions without valid point-to-point comparisons.
Across multiple sectors of the study areas, subsidence, fracturing, and surface disturbance exhibited M3C2 distances exceeding the LoD, indicating statistically significant surface change in both the 2018–2023 and 2018–2025 comparisons.
Subsidence and associated geomorphic feature development are predominantly confined to the eastern side of a major fracture-trench near the slope crest. Negative vertical displacement gradients are preferentially aligned with a north–south–trending fracture complex composed of interconnected cracks, vents, and sinkholes, indicating progressive subsidence and fracture opening over time (Figure 7).
Figure 7.
M3C2-derived surface deformation between 2018–2023 and 2018–2025, calculated relative to the 2018 baseline. Colors represent signed M3C2 distances, with only values exceeding the Level of Detection (LoD) indicating statistically significant surface change. Only displacement magnitudes exceeding ±30 cm are visualized to suppress noise. Black areas represent data gaps where vegetation was removed during ground classification, resulting in insufficient point density for valid M3C2 comparison.
Individual surface expressions of fractures and sinkholes do not always appear as continuous negative-displacement signals in the M3C2 results; however, their consistent spatial alignment and clustering suggest subsurface connectivity within the fracture system. Apparent discontinuities in the M3C2 signal are attributed to sediment infill and vegetation growth within opening features, which intermittently obscure surface deformation in UAS-derived point clouds. Dense vegetation within fractures further limited the detection of detailed fracture geometry and continuity.
In addition to subsidence-related deformation, substantial mass-wasting features (rockfall, slumps, slides, and material deposition) are observed along the eastern and southern cliff faces. These depositional zones are spatially constrained on the western margins by the end of the fracture complex, suggesting structural control over slope instability and material release. Localized artifacts appear in M3C2 distance fields near some fracture zones, reflecting residual vegetation effects and surface roughness rather than true surface deformation, and underscore the need for cautious interpretation of isolated anomalies.
3.5. Geomorphic Features Development
Integration of displacement mapping and UAS orthomosaics revealed progressive geomorphic and structural adjustments over the study period, enabling evaluation of both measured surface deformation and visually interpreted feature development.
Over time, a complex fracture system composed of fissures, cracks, and vents continued to extend, generally trending northward, in line with the orientation of other fractures and subsidence features located to the south and east (Figure 8). Comparison across survey epochs shows progressive propagation and increasing surface expression of the fracture network through time. Reduced tree and shrub cover in the 2021 imagery reflects vegetation loss caused by the July 2020 wildfire. In contrast, illumination conditions in the 2023 imagery locally enhance fracture visibility through shadowing, while simultaneously obscuring portions of other fractures and surface features, particularly in areas of complex microtopography and vegetation cover.
Figure 8.
A fracture complex progression with time mapped on UAS imagery from 2018, 2021, 2023, and 2025. Visual interpretations of major fissures, cracks, funnels and vents are shown and symbolized by date fire observed on UAS imagery.
Many of the mapped fracture features coincide spatially with zones of statistically significant negative displacement identified in the M3C2 analyses (Section 3.4), supporting their interpretation as expressions of active subsidence and fracture opening. However, individual fractures and vents do not always appear as continuous displacement signals in the M3C2 results. This discontinuity reflects a combination of sediment infill, vegetation growth, and variable surface roughness, which intermittently obscure deformation signals in photogrammetric point clouds despite continued subsurface connectivity.
Figure 9 presents examples of underground coal fire (UCF)-induced geomorphic features mapped from UAS imagery acquired in 2018, 2021, 2023, and 2025. Vent openings, surface cracks, and subsidence features are concentrated near the upper portion of the slope, and progressive surface mass-wasting is evident across successive survey epochs. A discrete subsidence feature with an approximate diameter of ~1 m becomes clearly visible by 2023, indicating localized surface collapse relative to earlier imagery. Anthropogenic disturbance is also apparent in the eastern portion of the 2023 imagery, where access road construction has modified the surface expression of previously disturbed areas. In addition, mass-wasting features are observed along the slope, with fan-shaped accumulations of rockfall material developing and expanding downslope over time. Collectively, these features illustrate the spatial clustering and temporal evolution of surface expressions associated with UCF activity as captured by multi-temporal UAS imagery.
Figure 9.
Examples of UCF-induced geomorphic features mapped on UAS imagery from 2018, 2021, 2023, and 2025. Geomorphic features, including vents (yellow), cracks (green), and mass-wasting (blue) features.
Collectively, the observed geomorphic features define a spatially coherent deformation system that evolves over time. The strong correspondence between mapped geomorphic features and zones of high displacement supports the use of integrated point-cloud deformation analysis and orthomosaic interpretation for identifying active and emerging UCF-related hazards. Where deformation signals are weak or discontinuous, geomorphic interpretation provides essential context for distinguishing true surface change from vegetation-related artifacts and photogrammetric noise.
4. Discussion
In this study, differences in UAS platforms, camera sensors, flight paths and spatial extents, illumination conditions, time of year, and image acquisition geometry (including predefined nadir and manual oblique imagery) between survey years affected point density, reconstruction completeness, comparability, and change detection confidence. Additional variations in image resolution, positioning accuracy, and flight stability can lead to inconsistent image quality, calibration challenges, and reduced alignment performance during processing. In general, integrating legacy multi-temporal UAS datasets introduces methodological constraints that directly affect the interpretation of surface change. The following sections evaluate the geomorphic significance of observed changes, assess the precision and accuracy of photogrammetry products, and discuss methodological and environmental limitations relevant to monitoring underground coal fires (UCFs).
4.1. Sources of Error Impact the Accuracy of UAV Photogrammetry Results
The accuracy of UAS-based photogrammetry products is influenced by both image acquisition conditions and photogrammetric processing factors. Variations in image sharpness, resolution, and overlap affect tie-point identification and bundle adjustment stability, potentially introducing small but cumulative positional errors in reconstructed point clouds. These errors propagate through the point clouds, resulting in increased RMS values and subtle misalignments. Shadows, low-light conditions, and varying sun angles across survey epochs affect image quality and radiometric consistency, reducing feature-matching performance. High wind conditions can introduce motion blur and unintended changes in camera orientation, reducing image sharpness and effective overlap. Errors in GNSS positioning and ground control point (GCP) quality can introduce systematic georeferencing inaccuracies, leading to model misalignment or incorrect real-world scaling.
Ignoring the relationship between camera viewing angle and terrain slope reduces orthomosaic quality, as steep surfaces imaged solely from nadir perspectives are prone to distortion, incomplete, or entirely absent. Accurate reconstruction of sloped or vertical surfaces requires oblique imagery acquired with camera orientations more perpendicular to the terrain surface.
Vegetation posed a challenge for M3C2 analyses. Vegetation missed during point classification produced spurious positive and negative distance values, while vegetation removed in surveys (particularly between 2018 and later datasets) created spatial data gaps where direct surface comparison was not possible. These artifacts highlight the sensitivity of surface change metrics to classification completeness and temporal land-cover variability, emphasizing the need for cautious interpretation of isolated anomalies. Inconsistent illumination, variable oblique image coverage, and changing vegetation conditions limited reconstruction completeness and quality on steep slopes and vegetated surfaces, complicating direct comparisons across epochs.
These factors underscore the importance of interpreting detected surface changes in the context of acquisition geometry, processing uncertainty, and site-specific conditions rather than as absolute deformation values. Although stable reference areas were used for ICP-based co-registration to minimize relative misalignment, residual deviations may reflect photogrammetric noise from image quality limitations rather than true surface change. Systematic errors in photogrammetric processing, such as tie-point quality or GCP placement, can also affect co-registration and surface change detection.
4.2. Measures to Improve the Quality of UAS Photogrammetry Results
Consistent flight paths, acquisition of cross-flight routes, and systematic oblique imagery acquisition would enhance coverage and reconstruction of steep surfaces. Slower flight speed and lower flight altitudes reduce motion blur and increase image resolution, improving tie-point redundancy and model precision. Conducting flights under similar diffuse lighting conditions can also minimize shadow-induced variability that can degrade feature matching between datasets.
From a processing perspective, automated removal of blurry or low-quality images prior to photogrammetric processing can reduce noise, improve point cloud accuracy, and enhance confidence in subsequent cloud-comparison analyses. Implementing these strategies would improve the detection of subtle geomorphic changes, such as small-magnitude subsidence or fracture development. This would strengthen interpretation when integrating multi-temporal UAS datasets with historic mine maps and orthomosaics.
4.3. Constraints of the Current Study and Broader Limitations of Monitoring UCFs
The temporal resolution of this study was limited by multi-year intervals between UAS surveys, preventing the detection of short-term deformation events or seasonal variability. Differences in UAV platforms and acquisition strategies across survey dates reduced the strict comparability of the datasets. Vegetation cover and shadows also obscured some ground deformation features. These issues are consistent with challenges reported in other multi-temporal UAS studies, where methodological differences affected surface change detection.
Beyond site-specific limitations, monitoring and modeling underground coal fires (UCFs) remain challenging because of the complex and variable conditions that govern their behavior. Both anthropogenic and natural factors strongly influence UCF initiation, persistence, and propagation, making it difficult to generalize across sites or to apply a single unified monitoring or modeling framework.
Differences in mining methods affect fire dynamics by exposing coal seams to oxygen, altering overburden stability, and creating the potential for voids or fractured rubble zones [23,78,79,80]. Subsequent reclamation activities and surface disturbances may further modify fire pathways, complicating efforts to monitor subsurface conditions. Waste rock dumps can serve as both fuel sources and insulating layers, complicating detection and suppression efforts.
Natural variability in coal seam properties, including rank, composition, moisture content, and mineral impurities, influences combustibility and consumption rates [23,29,79,81]. Geologic factors such as seam orientation, thickness, rider seams, faulting, and overburden competence govern propagation pathways and subsurface stability [29,80,81]. Prolonged burning introduces additional complexity, as ash accumulation, fracturing, and thermo-mechanical alteration of surrounding rocks enhance permeability and oxygen ingress, while higher fire temperatures accelerate consumption rates [29,81].
Coal fires respond dynamically to changes in barometric pressure and wind, effectively “breathing” as oxygen diffuses into or is forced into subsurface zones. This chimney effect, driven by thermal and concentration gradients, sustains oxygen delivery, allowing fires to persist for decades to centuries [24,79,80,82].
Although advances have been made in understanding UCF propagation [29,78,83,84,85], these environmental complexities and technical limitations highlight the difficulty of developing broadly transferable, simplified monitoring or predictive models. To enhance monitoring, future work should integrate UAS SfM with complementary remote sensing techniques. Thermal infrared UAS surveys could help identify combustion zones, while LiDAR and InSAR would improve deformation detection and topographic resolution. Multi-modal sensor fusion has been advocated in recent UCF studies and would strengthen the robustness of hazard detection at this site. Increased survey frequency (e.g., annual or seasonal flights) would improve temporal resolution, allowing progressive deformation to be more precisely linked to subsurface fire dynamics and mine collapse processes.
5. Conclusions
Multitemporal UAS optical surveys successfully identified localized geomorphic features and ground-surface deformation caused by UCF at the Axial Mine in northwestern Colorado from 2018 to 2025. UAV-captured optical imagery was used to generate 3D point clouds for movement analysis. The Multiscale Model-to-Model Cloud Comparison (M3C2) algorithm measured surface changes over time. Photogrammetry-derived orthomosaics facilitated monitoring the development of fractures and subsidence features. Integrating displacement mapping, orthomosaics visualization, and historical mine documentation revealed geomorphic and structural adjustments throughout the study period. UCF-induced geomorphic features observed in the area include: (1) a continuous trench along the slope crest that expanded between 2018 and 2025, directly over mapped mine entries, supporting its interpretation as a collapse-related feature; (2) multiple north–south trending fractures bounding blocks that appear to move in opposite directions, resembling a horst-and-graben structure, with the main subsidence basin forming between the bounding scarps; (3) the central depression deepened and widened, accommodating ongoing collapse above the mining operations; (4) the eastern cliff margin facing east toward the highway showed minimal displacement, contrasting with more active sectors within the basin interior; and (5) a north–south-trending fracture complex composed of interconnected cracks, vents, and sinkholes, indicating progressive subsidence and fracture opening over time.
Due to ongoing technological advances and increased drone availability during surveys, four different drones were used in August 2018, March 2021, June 2023, and March 2025. This presents challenges but also offers opportunities to evaluate the accuracy of UAS point cloud 3D models, assess point cloud alignment, and identify constraints between surveys over the seven-year span.
Optical imagery captured by UAVs was used to generate 3D point clouds for movement analysis. The Multiscale Model-to-Model Cloud Comparison (M3C2) algorithm was utilized to measure surface changes over time and to examine the development of fractures and subsidence features. The M3C2 results align well with the visual interpretation of geomorphic changes in the orthomosaics, including fractures, linear depressions, cracks, and rockfall. The study shows the effectiveness of repeated UAS surveys in detecting and quantifying changes in UCF-induced unstable and hazardous terrain. Its findings are crucial for risk mitigation along Colorado Highway 13. The methodology and results provide valuable insights into using remote sensing for long-term geohazard monitoring related to legacy coal mine fires and offer a cost-effective, adaptable solution for hard-to-reach areas.
Author Contributions
Conceptualization, J.H., W.Z. and L.W.; methodology, J.H.; software, J.H.; validation, J.H.; formal analysis, J.H.; investigation, J.H. and M.J.; resources, J.H.; data curation, J.H.; writing—original draft preparation, J.H.; writing—review and editing, J.H., W.Z. and L.W.; visualization, J.H.; supervision, W.Z. and L.W.; project administration, J.H.; funding acquisition, J.H. All authors have read and agreed to the published version of the manuscript.
Funding
This research received no external funding.
Data Availability Statement
Data available on request due to restrictions (e.g., privacy, legal, or ethical reasons).
Acknowledgments
The authors are grateful to the Colorado Department of Natural Resources, Division of Reclamation, Mining and Safety, for providing access to datasets to carry out this study and for providing technical expertise. GenAI ChatGPT version 5.1 was used to assist with language editing and organizational refinement.
Conflicts of Interest
Authors Jessica Hiatt and Max Johnson were employed by the company Tetra Tech. The remaining authors declare that the research was conducted in the absence of any commercial or financial relationships that could be construed as a potential conflict of interest.
Abbreviations
The following abbreviations are used in this manuscript:
| UCFs | Underground coal fires |
| DRMS | Colorado Division of Reclamation, Mining and Safety |
| UAS | Unmanned aerial system |
| M3C2 | Multiscale model-to-model cloud comparison |
| DEM | Digital elevation model |
| SfM | Structure from motion |
| DTM | Digital terrain model |
| 3D | Three-dimensional |
| C2C | Cloud-to-cloud |
| C2M | Cloud-to-mesh |
| GCPs | Ground control points |
| CO-13 | Colorado State Highway 13 |
| Qal | Quaternary alluvium |
| P4P | DJI Phantom 4 Pro |
| M2P | DJI Mavic 2 Pro |
| RTK | real-time kinematic |
| M3E | DJI Mavic 3 Enterprise |
| UAV | unmanned aerial vehicles |
| GSD | ground sampling distance |
| GNSS | global navigation satellite system |
| PPK | post-processed kinematic |
| DSM | digital surface model |
| SOR | Statistical Outlier Removal |
| CSF | Cloth Simulation Filter |
| ICP | Iterative Closest Point |
| LoD | Level of Detection |
| AOI | area of interest |
| RMS | root mean square |
References
- Kuenzer, C.; Stracher, G.B. Geomorphology of Coal Seam Fires. Geomorphology 2012, 138, 209–222. [Google Scholar] [CrossRef] [Scilit]
- Karanam, V.; Motagh, M.; Garg, S.; Jain, K. Multi-Sensor Remote Sensing Analysis of Coal Fire Induced Land Subsidence in Jharia Coalfields, Jharkhand, India. Int. J. Appl. Earth Obs. Geoinf. 2021, 102, 102439. [Google Scholar] [CrossRef] [Scilit]
- Riyas, M.J.; Syed, T.H.; Kumar, H.; Kuenzer, C. Detecting and Analyzing the Evolution of Subsidence Due to Coal Fires in Jharia Coalfield, India Using Sentinel-1 SAR Data. Remote Sens. 2021, 13, 1521. [Google Scholar] [CrossRef] [Scilit]
- Kuenzer, C.; Zhang, J.; Tetzlaff, A.; Van Dijk, P.; Voigt, S.; Mehl, H.; Wagner, W. Uncontrolled Coal Fires and Their Environmental Impacts: Investigating Two Arid Mining Regions in North-Central China. Appl. Geogr. 2007, 27, 42–62. [Google Scholar] [CrossRef] [Scilit]
- Xie, D.; Zeng, F.; Liu, B.; Fang, Q.; Dong, Y.; Wu, H.; Liu, P.; Wang, K.; Li, G. Evaluating Land-Cover Change and Land Subsidence in Coal Fire Zones: Insights from Multi-Source Monitoring. PLoS ONE 2025, 20, e0322284. [Google Scholar] [CrossRef] [Scilit]
- Rushworth, P.; Haefner, B.D.; Hynes, J.L.; Streufert, R.K. IS-26 Reconnaissance Study of Coal Fires in Inactive Colorado Coal Mines; Information Series; Colorado Geological Survey: Golden, CO, USA, 1989; p. 60.
- Gupta, R.P.; Prakash, A. Cover: Reflectance Aureoles Associated with Thermal Anomalies Due to Subsurface Mine Fires in the Jharia Coalfield, India. Int. J. Remote Sens. 1998, 19, 2619–2622. [Google Scholar] [CrossRef] [Scilit]
- Elick, J.M. Temporal Changes in Vegetation Patterns Associated with the Centralia, PA Coal Fire; GSA: Washington, DC, USA, 2012.
- Abramowicz, A.; Rahmonov, O.; Chybiorz, R.; Ciesielczuk, J. Vegetation as an Indicator of Underground Smoldering Fire on Coal-Waste Dumps. Fire Saf. J. 2021, 121, 103287. [Google Scholar] [CrossRef] [Scilit]
- Abramowicz, A.; Rahmonov, O.; Fabiańska, M.J.; Nádudvari, Á.; Chybiorz, R.; Michalak, M. Changes in Soil Chemical Composition Caused by Self-heating of a Coal-waste Dump. Land Degrad. Dev. 2021, 32, 4340–4349. [Google Scholar] [CrossRef] [Scilit]
- Santos, P.; Ribeiro, J.; Espinha Marques, J.; Flores, D. Environmental and Health Risk Assessment of Soil Adjacent to a Self-Burning Waste Pile from an Abandoned Coal Mine in Northern Portugal. Environments 2023, 10, 53. [Google Scholar] [CrossRef] [Scilit]
- Engle, M.A.; Radke, L.F.; Heffern, E.L.; O’Keefe, J.M.K.; Hower, J.C.; Smeltzer, C.D.; Hower, J.M.; Olea, R.A.; Eatwell, R.J.; Blake, D.R.; et al. Gas Emissions, Minerals, and Tars Associated with Three Coal Fires, Powder River Basin, USA. Sci. Total Environ. 2012, 420, 146–159. [Google Scholar] [CrossRef] [Scilit] [PubMed]
- Engle, M.A.; Radke, L.F.; Heffern, E.L.; O’Keefe, J.M.K.; Smeltzer, C.D.; Hower, J.C.; Hower, J.M.; Prakash, A.; Kolker, A.; Eatwell, R.J.; et al. Quantifying Greenhouse Gas Emissions from Coal Fires Using Airborne and Ground-Based Methods. Int. J. Coal Geol. 2011, 88, 147–151. [Google Scholar] [CrossRef] [Scilit]
- Stracher, G.B.; Taylor, T.P. Coal Fires Burning out of Control around the World: Thermodynamic Recipe for Environmental Catastrophe. Int. J. Coal Geol. 2004, 59, 7–17. [Google Scholar] [CrossRef] [Scilit]
- Pone, J.D.N.; Hein, K.A.A.; Stracher, G.B.; Annegarn, H.J.; Finkleman, R.B.; Blake, D.R.; McCormack, J.K.; Schroeder, P. The Spontaneous Combustion of Coal and Its By-Products in the Witbank and Sasolburg Coalfields of South Africa. Int. J. Coal Geol. 2007, 72, 124–140. [Google Scholar] [CrossRef] [Scilit]
- Kolker, A.; Engle, M.; Stracher, G.; Hower, J.; Prakash, A.; Radke, L.; Ter Schure, A.; Heffern, E. Emissions from Coal Fires and Their Impact on the Environment; U.S. Geological Survey: Reston, VA, USA, 2009; p. 4.
- Finkelman, R.B.; Stracher, G.B. Environmental and Health Impacts of Coal Fires. In Coal and Peat Fires: A Global Perspective; Elsevier: Amsterdam, The Netherlands, 2011; pp. 115–125. [Google Scholar]
- Finkelman, R.B. Potential Health Impacts of Burning Coal Beds and Waste Banks. Int. J. Coal Geol. 2004, 59, 19–24. [Google Scholar] [CrossRef] [Scilit]
- Melody, S.M.; Johnston, F.H. Coal Mine Fires and Human Health: What Do We Know? Int. J. Coal Geol. 2015, 152, 1–14. [Google Scholar] [CrossRef] [Scilit]
- Roy, D.; Singh, G.; Seo, Y.-C. Coal Mine Fire Effects on Carcinogenicity and Non-Carcinogenicity Human Health Risks. Environ. Pollut. 2019, 254, 113091. [Google Scholar] [CrossRef] [Scilit]
- Xu, R.; Gao, C.X.; Dimitriadis, C.; Smith, C.L.; Carroll, M.T.C.; Ikin, J.F.; Johnston, F.H.; Sim, M.R.; Abramson, M.J.; Guo, Y. Long-Term Impacts of Coal Mine Fire-Emitted PM2.5 on Hospitalisation: A Longitudinal Analysis of the Hazelwood Health Study. Int. J. Epidemiol. 2022, 51, 179–190. [Google Scholar] [CrossRef] [Scilit]
- Agüera-Vega, F.; Ferrer-González, E.; Martínez-Carricondo, P.; Sánchez-Hermosilla, J.; Carvajal-Ramírez, F. Influence of the Inclusion of Off-Nadir Images on UAV-Photogrammetry Projects from Nadir Images and AGL (Above Ground Level) or AMSL (Above Mean Sea Level) Flights. Drones 2024, 8, 662. [Google Scholar] [CrossRef] [Scilit]
- Michalski, S.R. Chapter 2—Coal-Mining Techniques and Coal Fires. In Coal and Peat Fires: A Global Perspective; Stracher, G.B., Prakash, A., Sokol, E.V., Eds.; Elsevier: Amsterdam, The Netherlands, 2011; pp. 29–46. [Google Scholar]
- Liang, Y.; Yang, Y.; Guo, S.; Tian, F.; Wang, S. Combustion Mechanism and Control Approaches of Underground Coal Fires: A Review. Int. J. Coal Sci. Technol. 2023, 10, 24. [Google Scholar] [CrossRef] [Scilit]
- Heffern, E.L.; Coates, D.A. Geologic History of Natural Coal-Bed Fires, Powder River Basin, USA. Int. J. Coal Geol. 2004, 59, 25–47. [Google Scholar] [CrossRef] [Scilit]
- Kuenzer, C. Demarcating Coal Fire Risk Areas Based on Spectral Test Sequences and Partial Unmixing Using Multi Sensor Remote Sensing Data. Ph.D. Thesis, Vienna University of Technology, Vienna, Austria, 2005. [Google Scholar]
- Wang, S.; Guo, S.; Liang, Y.; Liu, K.; Yang, Y.; Shi, Y. Numerical Study on Thermal-Hydro Coupling Characteristics of Underground Coal Combustion under Heterogeneous Void Fraction. Case Stud. Therm. Eng. 2023, 49, 103335. [Google Scholar] [CrossRef] [Scilit]
- Li, J.; Bai, J.; Feng, G.; Yilmaz, E.; Han, Y.; Wang, Z.; Wang, S.; Wu, G. Degradation Mechanism of Coal Pillars in an Underground Coal Gasification Environment: Bearing Capacity, Pyrolysis Behaviour and Pore Structure. Int. J. Min. Sci. Technol. 2025, 35, 897–912. [Google Scholar] [CrossRef] [Scilit]
- Bustamante Rúa, M.O.; Daza Aragón, A.J.; Bustamante Baena, P. A Study of Fire Propagation in Coal Seam with Numerical Simulation of Heat Transfer and Chemical Reaction Rate in Mining Field. Int. J. Min. Sci. Technol. 2019, 29, 873–879. [Google Scholar] [CrossRef] [Scilit]
- Voigt, S.; Tetzlaff, A.; Zhang, J.; Künzer, C.; Zhukov, B.; Strunz, G.; Oertel, D.; Roth, A.; Van Dijk, P.; Mehl, H. Integrating Satellite Remote Sensing Techniques for Detection and Analysis of Uncontrolled Coal Seam Fires in North China. Int. J. Coal Geol. 2004, 59, 121–136. [Google Scholar] [CrossRef] [Scilit]
- Liu, J.; Wang, Y.; Yan, S.; Zhao, F.; Li, Y.; Dang, L.; Liu, X.; Shao, Y.; Peng, B. Underground Coal Fire Detection and Monitoring Based on Landsat-8 and Sentinel-1 Data Sets in Miquan Fire Area, XinJiang. Remote Sens. 2021, 13, 1141. [Google Scholar] [CrossRef] [Scilit]
- Prakash, A.; Gens, R. Chapter 14—Remote Sensing of Coal Fires. In Coal and Peat Fires: A Global Perspective; Stracher, G.B., Prakash, A., Sokol, E.V., Eds.; Elsevier: Amsterdam, The Netherlands, 2011; pp. 231–253. [Google Scholar]
- Wang, T.; Wang, Y.; Zhao, F.; Feng, H.; Liu, J.; Zhang, L.; Zhang, N.; Yuan, G.; Wang, D. A Spatio-Temporal Temperature-Based Thresholding Algorithm for Underground Coal Fire Detection with Satellite Thermal Infrared and Radar Remote Sensing. Int. J. Appl. Earth Obs. Geoinf. 2022, 110, 102805. [Google Scholar] [CrossRef] [Scilit]
- Zhang, J.; Kuenzer, C. Thermal Surface Characteristics of Coal Fires 1 Results of In-Situ Measurements. J. Appl. Geophys. 2007, 63, 117–134. [Google Scholar] [CrossRef] [Scilit]
- Kuenzer, C.; Zhang, J.; Li, J.; Voigt, S.; Mehl, H.; Wagner, W. Detecting Unknown Coal Fires: Synergy of Automated Coal Fire Risk Area Delineation and Improved Thermal Anomaly Extraction. Int. J. Remote Sens. 2007, 28, 4561–4585. [Google Scholar] [CrossRef] [Scilit]
- Liu, L.; Xu, N.; Zhou, W.; Qin, Y.; Luan, S. Improvement of Coal Mining-Induced Subsidence-Affected (MISA) Zone Irregular Boundary Delineation by MT-InSAR Techniques, UAV Photogrammetry, and Field Investigation. Remote Sens. 2024, 16, 4221. [Google Scholar] [CrossRef] [Scilit]
- Zhou, W.; Lowry, B.; Wnuk, K.; Liu, L.; Gutierrez, M. InSAR and Its Applications in Geo-Engineering: Case Studies with Different Platforms and Sensors. In Information Technology in Geo-Engineering; Gutierrez, M., Ed.; Springer Nature: Cham, Switzerland, 2024; pp. 175–186. [Google Scholar]
- Wnuk, K.; Zhou, W.; Gutierrez, M. Mapping Urban Excavation Induced Deformation in 3D via Multiplatform InSAR Time-Series. Remote Sens. 2021, 13, 4748. [Google Scholar] [CrossRef] [Scilit]
- Liu, L.; Zhou, W.; Gutierrez, M. Mapping Tunneling-Induced Uneven Ground Subsidence Using Sentinel-1 SAR Interferometry: A Twin-Tunnel Case Study of Downtown Los Angeles, USA. Remote Sens. 2023, 15, 202. [Google Scholar] [CrossRef] [Scilit]
- Wnuk, K.; Walton, G.; Zhou, W. Four-Dimensional Filtering of InSAR Persistent Scatterers Elucidates Subsidence Induced by Tunnel Excavation in the Sri Lankan Highlands. J. Appl. Remote Sens. 2019, 13, 034508. [Google Scholar] [CrossRef] [Scilit]
- van Genderen, J.L.; Prakash, A.; Gens, R.; van Veen, B.S.; Liding, C.; Tao, T.X.; Feng, G. Coal Fire Interferometry; BCRS-USP-2 Report; Beleids Commmissie Remote Sensing (BCRS): Delft, The Netherlands, 2000; Volume 99-32, ISBN 978-90-5411-309-6. [Google Scholar]
- Prakash, A.; Fielding, E.J.; Gens, R.; Van Genderen, J.L.; Evans, D.L. Data Fusion for Investigating Land Subsidence and Coal Fire Hazards in a Coal Mining Area. Int. J. Remote Sens. 2001, 22, 921–932. [Google Scholar] [CrossRef] [Scilit]
- Jiang, L.; Lin, H.; Ma, J.; Kong, B.; Wang, Y. Potential of Small-Baseline SAR Interferometry for Monitoring Land Subsidence Related to Underground Coal Fires: Wuda (Northern China) Case Study. Remote Sens. Environ. 2011, 115, 257–268. [Google Scholar] [CrossRef] [Scilit]
- Gupta, N.; Syed, T.; Athiphro, A. Monitoring Subsurface Coal Fires in Jharia Coalfield Using Observations of Land Subsidence from Differential Interferometric Synthetic Aperture Radar (DInSAR). J. Earth Syst. Sci. 2013, 122, 1249–1258. [Google Scholar] [CrossRef] [Scilit]
- Zhou, L.; Zhang, D.; Wang, J.; Huang, Z.; Pan, D. Mapping Land Subsidence Related to Underground Coal Fires in the Wuda Coalfield (Northern China) Using a Small Stack of ALOS PALSAR Differential Interferograms. Remote Sens. 2013, 5, 1152–1176. [Google Scholar] [CrossRef] [Scilit]
- Liu, J.; Wang, Y.; Li, Y.; Dang, L.; Liu, X.; Zhao, H.; Yan, S. Underground Coal Fires Identification and Monitoring Using Time-Series InSAR with Persistent and Distributed Scatterers: A Case Study of Miquan Coal Fire Zone in Xinjiang, China. IEEE Access 2019, 7, 164492–164506. [Google Scholar] [CrossRef] [Scilit]
- Xu, Y.; Li, T.; Tang, X.; Zhang, X.; Fan, H.; Wang, Y. Research on the Applicability of DInSAR, Stacking-InSAR and SBAS-InSAR for Mining Region Subsidence Detection in the Datong Coalfield. Remote Sens. 2022, 14, 3314. [Google Scholar] [CrossRef] [Scilit]
- Zhang, Y.; Wang, Y.; Huo, W.; Zhao, F.; Hu, Z.; Wang, T.; Song, R.; Liu, J.; Zhang, L.; Fernández, J.; et al. Ground Deformation Monitoring over Xinjiang Coal Fire Area by an Adaptive ERA5-Corrected Stacking-InSAR Method. Remote Sens. 2023, 15, 1444. [Google Scholar] [CrossRef] [Scilit]
- Li, F.; Yang, W.; Liu, X.; Sun, G.; Liu, J. Using High-Resolution UAV-Borne Thermal Infrared Imagery to Detect Coal Fires in Majiliang Mine, Datong Coalfield, Northern China. Remote Sens. Lett. 2018, 9, 71–80. [Google Scholar] [CrossRef] [Scilit]
- He, X.; Yang, X.; Luo, Z.; Guan, T. Application of Unmanned Aerial Vehicle (UAV) Thermal Infrared Remote Sensing to Identify Coal Fires in the Huojitu Coal Mine in Shenmu City, China. Sci. Rep. 2020, 10, 13895. [Google Scholar] [CrossRef] [Scilit] [PubMed]
- Gao, Y.; Hao, M.; Wang, Y.; Dang, L.; Guo, Y. Multi-Scale Coal Fire Detection Based on an Improved Active Contour Model from Landsat-8 Satellite and UAV Images. ISPRS Int. J. Geo-Inf. 2021, 10, 449. [Google Scholar] [CrossRef] [Scilit]
- Shao, Z.; Li, Y.; Deng, R.; Wang, D.; Zhong, X. Three-Dimensional-Imaging Thermal Surfaces of Coal Fires Based on UAV Thermal Infrared Data. Int. J. Remote Sens. 2021, 42, 672–692. [Google Scholar] [CrossRef] [Scilit]
- Shao, Z.; Liang, Y.; Tian, F.; Song, S.; Deng, R. Constructing 3-D Land Surface Temperature Model of Local Coal Fires Using UAV Thermal Images. IEEE Trans. Geosci. Remote Sens. 2022, 60, 5002309. [Google Scholar] [CrossRef] [Scilit]
- Shao, Z.; Deng, R.; Zhang, G.; Li, Y.; Tang, X.; Zhang, W. 3D Thermal Mapping of Smoldering Coal Gangue Pile Fires Using Airborne Thermal Infrared Data. Case Stud. Therm. Eng. 2023, 48, 103146. [Google Scholar] [CrossRef] [Scilit]
- Yuan, G.; Wang, Y.; Zhao, F.; Wang, T.; Zhang, L.; Hao, M.; Yan, S.; Dang, L.; Peng, B. Accuracy Assessment and Scale Effect Investigation of UAV Thermography for Underground Coal Fire Surface Temperature Monitoring. Int. J. Appl. Earth Obs. Geoinf. 2021, 102, 102426. [Google Scholar] [CrossRef] [Scilit]
- Dunnington, L.; Nakagawa, M. Fast and Safe Gas Detection from Underground Coal Fire by Drone Fly Over. Environ. Pollut. 2017, 229, 139–145. [Google Scholar] [CrossRef] [Scilit] [PubMed]
- Pal, A.; Rošer, J.; Vulić, M. Surface Subsidence Prognosis above an Underground Longwall Excavation and Based on 3D Point Cloud Analysis. Minerals 2020, 10, 82. [Google Scholar] [CrossRef] [Scilit]
- Liu, X.; Zhu, W.; Lian, X.; Xu, X. Monitoring Mining Surface Subsidence with Multi-Temporal Three-Dimensional Unmanned Aerial Vehicle Point Cloud. Remote Sens. 2023, 15, 374. [Google Scholar] [CrossRef] [Scilit]
- Ćwiąkała, P.; Gruszczyński, W.; Stoch, T.; Puniach, E.; Mrocheń, D.; Matwij, W.; Matwij, K.; Nędzka, M.; Sopata, P.; Wójcik, A. UAV Applications for Determination of Land Deformations Caused by Underground Mining. Remote Sens. 2020, 12, 1733. [Google Scholar] [CrossRef] [Scilit]
- Zhou, D.; Qi, L.; Zhang, D.; Zhou, B.; Guo, L. Unmanned Aerial Vehicle (UAV) Photogrammetry Technology for Dynamic Mining Subsidence Monitoring and Parameter Inversion: A Case Study in China. IEEE Access 2020, 8, 16372–16386. [Google Scholar] [CrossRef] [Scilit]
- Lian, X.; Liu, X.; Ge, L.; Hu, H.; Du, Z.; Wu, Y. Time-Series Unmanned Aerial Vehicle Photogrammetry Monitoring Method without Ground Control Points to Measure Mining Subsidence. J. Appl. Remote Sens. 2021, 15, 024505. [Google Scholar] [CrossRef] [Scilit]
- Puniach, E.; Gruszczyński, W.; Ćwiąkała, P.; Matwij, W. Application of UAV-Based Orthomosaics for Determination of Horizontal Displacement Caused by Underground Mining. ISPRS J. Photogramm. Remote Sens. 2021, 174, 282–303. [Google Scholar] [CrossRef] [Scilit]
- Zhang, Y.; Lian, X.; Ge, L.; Liu, X.; Du, Z.; Yang, W.; Wu, Y.; Hu, H.; Cai, Y. Surface Subsidence Monitoring Induced by Underground Coal Mining by Combining DInSAR and UAV Photogrammetry. Remote Sens. 2022, 14, 4711. [Google Scholar] [CrossRef] [Scilit]
- Zhao, J.; Yang, X.; Zhang, Z.; Niu, Y.; Zhao, Z. Mine Subsidence Monitoring Integrating DS-InSAR with UAV Photogrammetry Products: Case Studies on Hebei and Inner Mongolia. Remote Sens. 2023, 15, 4998. [Google Scholar] [CrossRef] [Scilit]
- Chen, X.; Chen, J.; Wang, G.; Zhang, Q.; Zheng, Y. Mining Subsidence Based on Integrated SBAS-InSAR and Unmanned Aerial Vehicles Technology. J. Ocean Univ. China 2025, 24, 113–129. [Google Scholar] [CrossRef] [Scilit]
- Zheng, J.; Yao, W.; Lin, X.; Ma, B.; Bai, L. An Accurate Digital Subsidence Model for Deformation Detection of Coal Mining Areas Using a UAV-Based LiDAR. Remote Sens. 2022, 14, 421. [Google Scholar] [CrossRef] [Scilit]
- An, S.; Yuan, L.; Xu, Y.; Wang, X.; Zhou, D. Ground Subsidence Monitoring in Based on UAV-LiDAR Technology: A Case Study of a Mine in the Ordos, China. Geomech. Geophys. Geo-Energy Geo-Resour. 2024, 10, 57. [Google Scholar] [CrossRef] [Scilit]
- Yuan, Y.; Ge, Z.; Lai, B.; Guo, X.; Zhang, Y.; Liu, X.; Suo, T.; Yu, Q. Three Dimensional Deformation Measurement Method Based on Image Guided Point Cloud Registration. Opt. Lasers Eng. 2023, 161, 107399. [Google Scholar] [CrossRef] [Scilit]
- Connell, C.M. Several Aspects of the Collapse of the Streeter Mine, Moffat County, Colorado. In Proceedings of the Rocky Mountain Coal Mining Institute, 49th Regular Meeting; Rocky Mountain Coal Mining Institute: Lakewood, CO, USA, 1953; pp. 30–42. [Google Scholar]
- Tetra Tech. Colorado Underground Coal Mine Fires 2018 Inventory Report; Colorado Department of Natural Resources Division of Reclamation, Mining and Safety: Golden, CO, USA, 2018; p. 254.
- Hancock, E.T. Geology and Coal Resources of the Axial and Monument Butte Quadrangles, Moffat County, Colorado; Bulletin; Govt. Print. Off.: Washington, DC, USA, 1925. [Google Scholar]
- Johnson, E.A. Geologic Map and Coal Sections of the Round Bottom Quadrangle, Moffat County, Colorado; Coal Map; U.S. Geological Survey: Reston, VA, USA, 1987.
- Carroll, C.; Bauer, M. IS-64 Historic Coal Mines of Colorado; Information Series; Colorado Geological Survey, Division of Minerals and Geology, Department of Natural Resources: Denver, CO, USA, 2001. [Google Scholar]
- Hardie, J.K.; Zook, J.M. OF-14-08 Geologic Map of the Axial Quadrangle, Moffat and Rio Blanco Counties, Colorado; Colorado Geological Survey: Golden, CO, USA, 2014. [Google Scholar]
- Pix4Dmapper. Available online: www.pix4d.com (accessed on 10 May 2025).
- Besl, P.J.; McKay, N.D. A Method for Registration of 3-D Shapes. IEEE Trans. Pattern Anal. Mach. Intell. 1992, 14, 239–256. [Google Scholar] [CrossRef] [Scilit]
- Lague, D.; Brodu, N.; Leroux, J. Accurate 3D Comparison of Complex Topography with Terrestrial Laser Scanner: Application to the Rangitikei Canyon (N-Z). ISPRS J. Photogramm. Remote Sens. 2013, 82, 10–26. [Google Scholar] [CrossRef] [Scilit]
- Du, X.; Sun, D.; Li, F.; Tong, J. A Study on the Propagation Trend of Underground Coal Fires Based on Night-Time Thermal Infrared Remote Sensing Technology. Sustainability 2022, 14, 14741. [Google Scholar] [CrossRef] [Scilit]
- Morris, R.; Atkinson, T. Geological and Mining Factors Affecting Spontaneous Heating of Coal. Min. Sci. Technol. 1986, 3, 217–231. [Google Scholar] [CrossRef] [Scilit]
- Wolf, K.-H.; Bruining, H. Modelling the Interaction between Underground Coal Fires and Their Roof Rocks. Fuel 2007, 86, 2761–2777. [Google Scholar] [CrossRef] [Scilit]
- Onifade, M.; Genc, B. Modelling Spontaneous Combustion Liability of Carbonaceous Materials. Int. J. Coal Sci. Technol. 2018, 5, 191–212. [Google Scholar] [CrossRef] [Scilit]
- Song, Z.; Huang, X.; Kuenzer, C.; Zhu, H.; Jiang, J.; Pan, X.; Zhong, X. Chimney Effect Induced by Smoldering Fire in a U-Shaped Porous Channel: A Governing Mechanism of the Persistent Underground Coal Fires. Process Saf. Environ. Prot. 2020, 136, 136–147. [Google Scholar] [CrossRef] [Scilit]
- Huo, H.; Ni, Z.; Gao, C.; Zhao, E.; Zhang, Y.; Lian, Y.; Zhang, H.; Zhang, S.; Jiang, X.; Song, X.; et al. A Study of Coal Fire Propagation with Remotely Sensed Thermal Infrared Data. Remote Sens. 2015, 7, 3088–3113. [Google Scholar] [CrossRef] [Scilit]
- Huo, H.; Jiang, X.; Song, X.; Li, Z.-L.; Ni, Z.; Gao, C. Detection of Coal Fire Dynamics and Propagation Direction from Multi-Temporal Nighttime Landsat SWIR and TIR Data: A Case Study on the Rujigou Coalfield, Northwest (NW) China. Remote Sens. 2014, 6, 1234–1259. [Google Scholar] [CrossRef] [Scilit]
- Singh, N.; Chatterjee, R.S.; Kumar, D.; Panigrahi, D.C. Spatio-Temporal Variation and Propagation Direction of Coal Fire in Jharia Coalfield, India by Satellite-Based Multi-Temporal Night-Time Land Surface Temperature Imaging. Int. J. Min. Sci. Technol. 2021, 31, 765–778. [Google Scholar] [CrossRef] [Scilit]
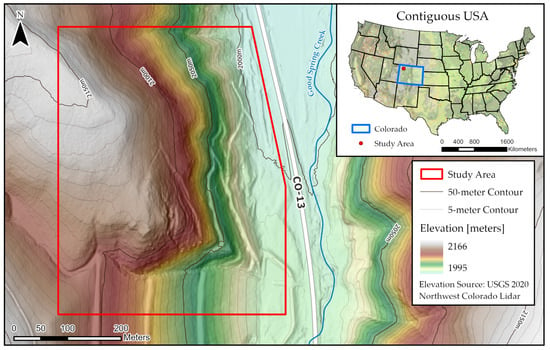
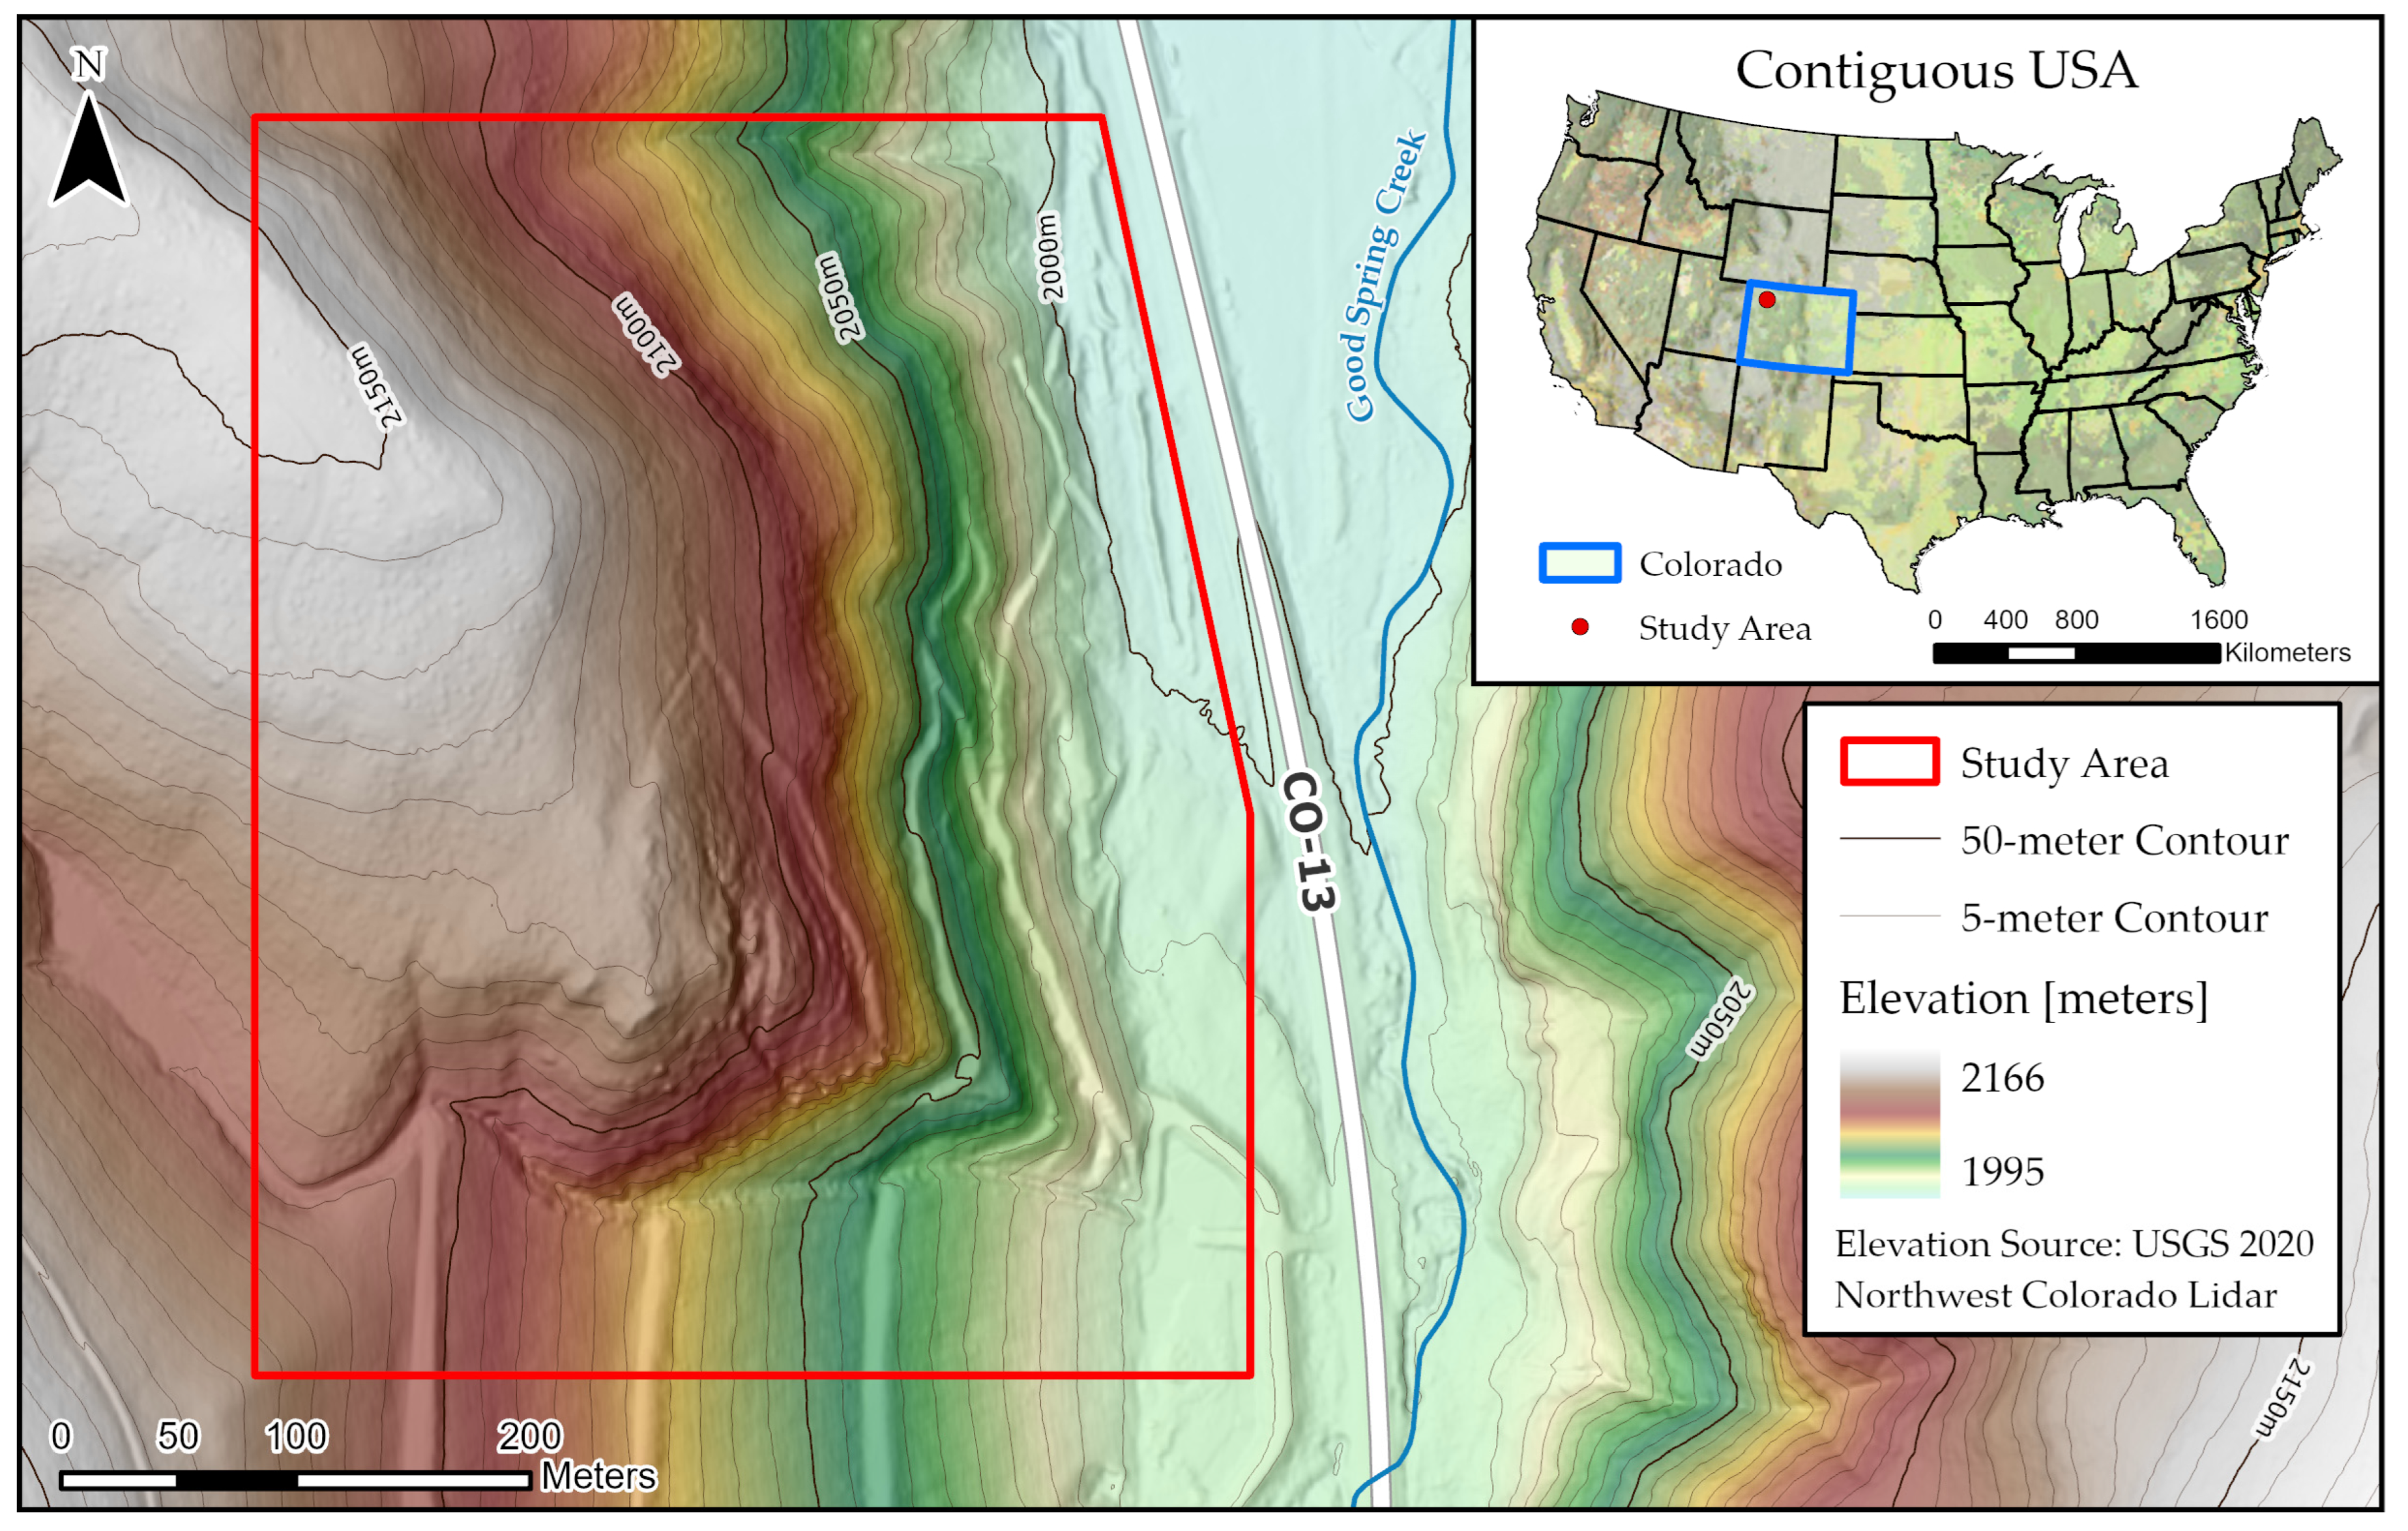
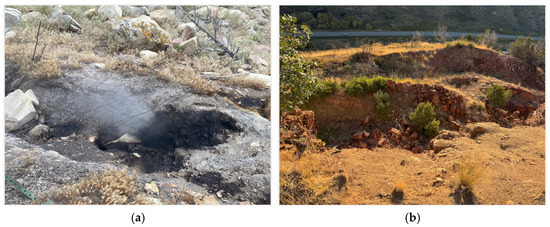
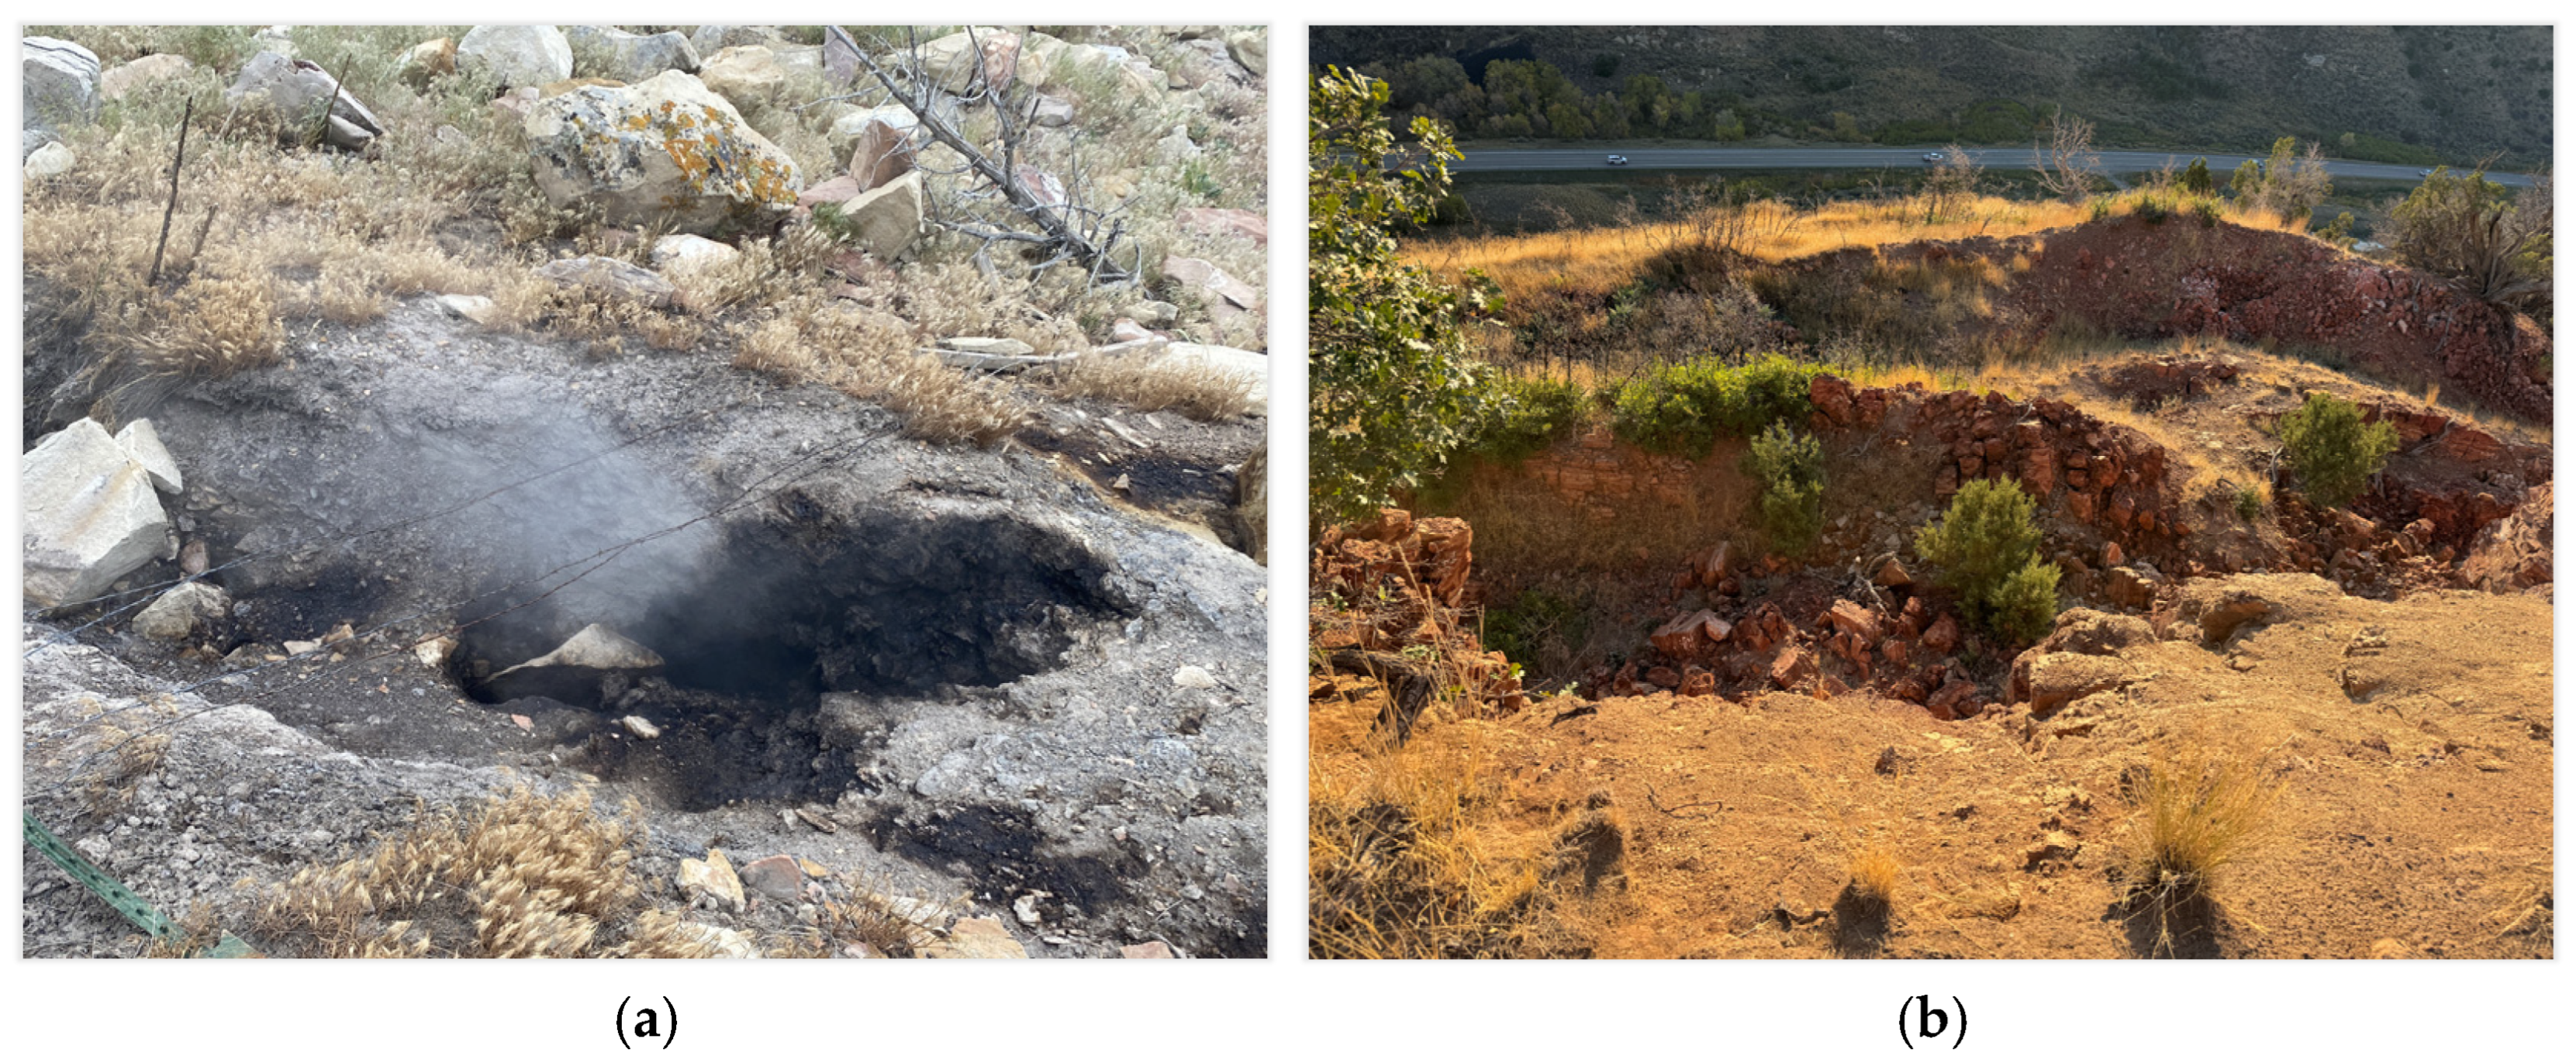
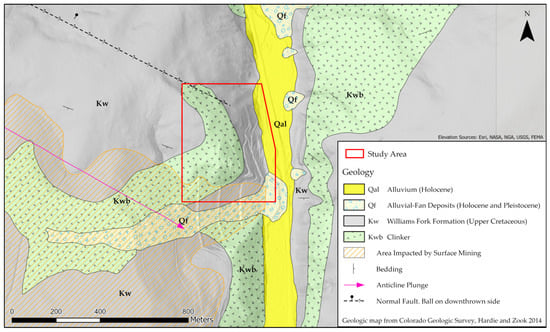
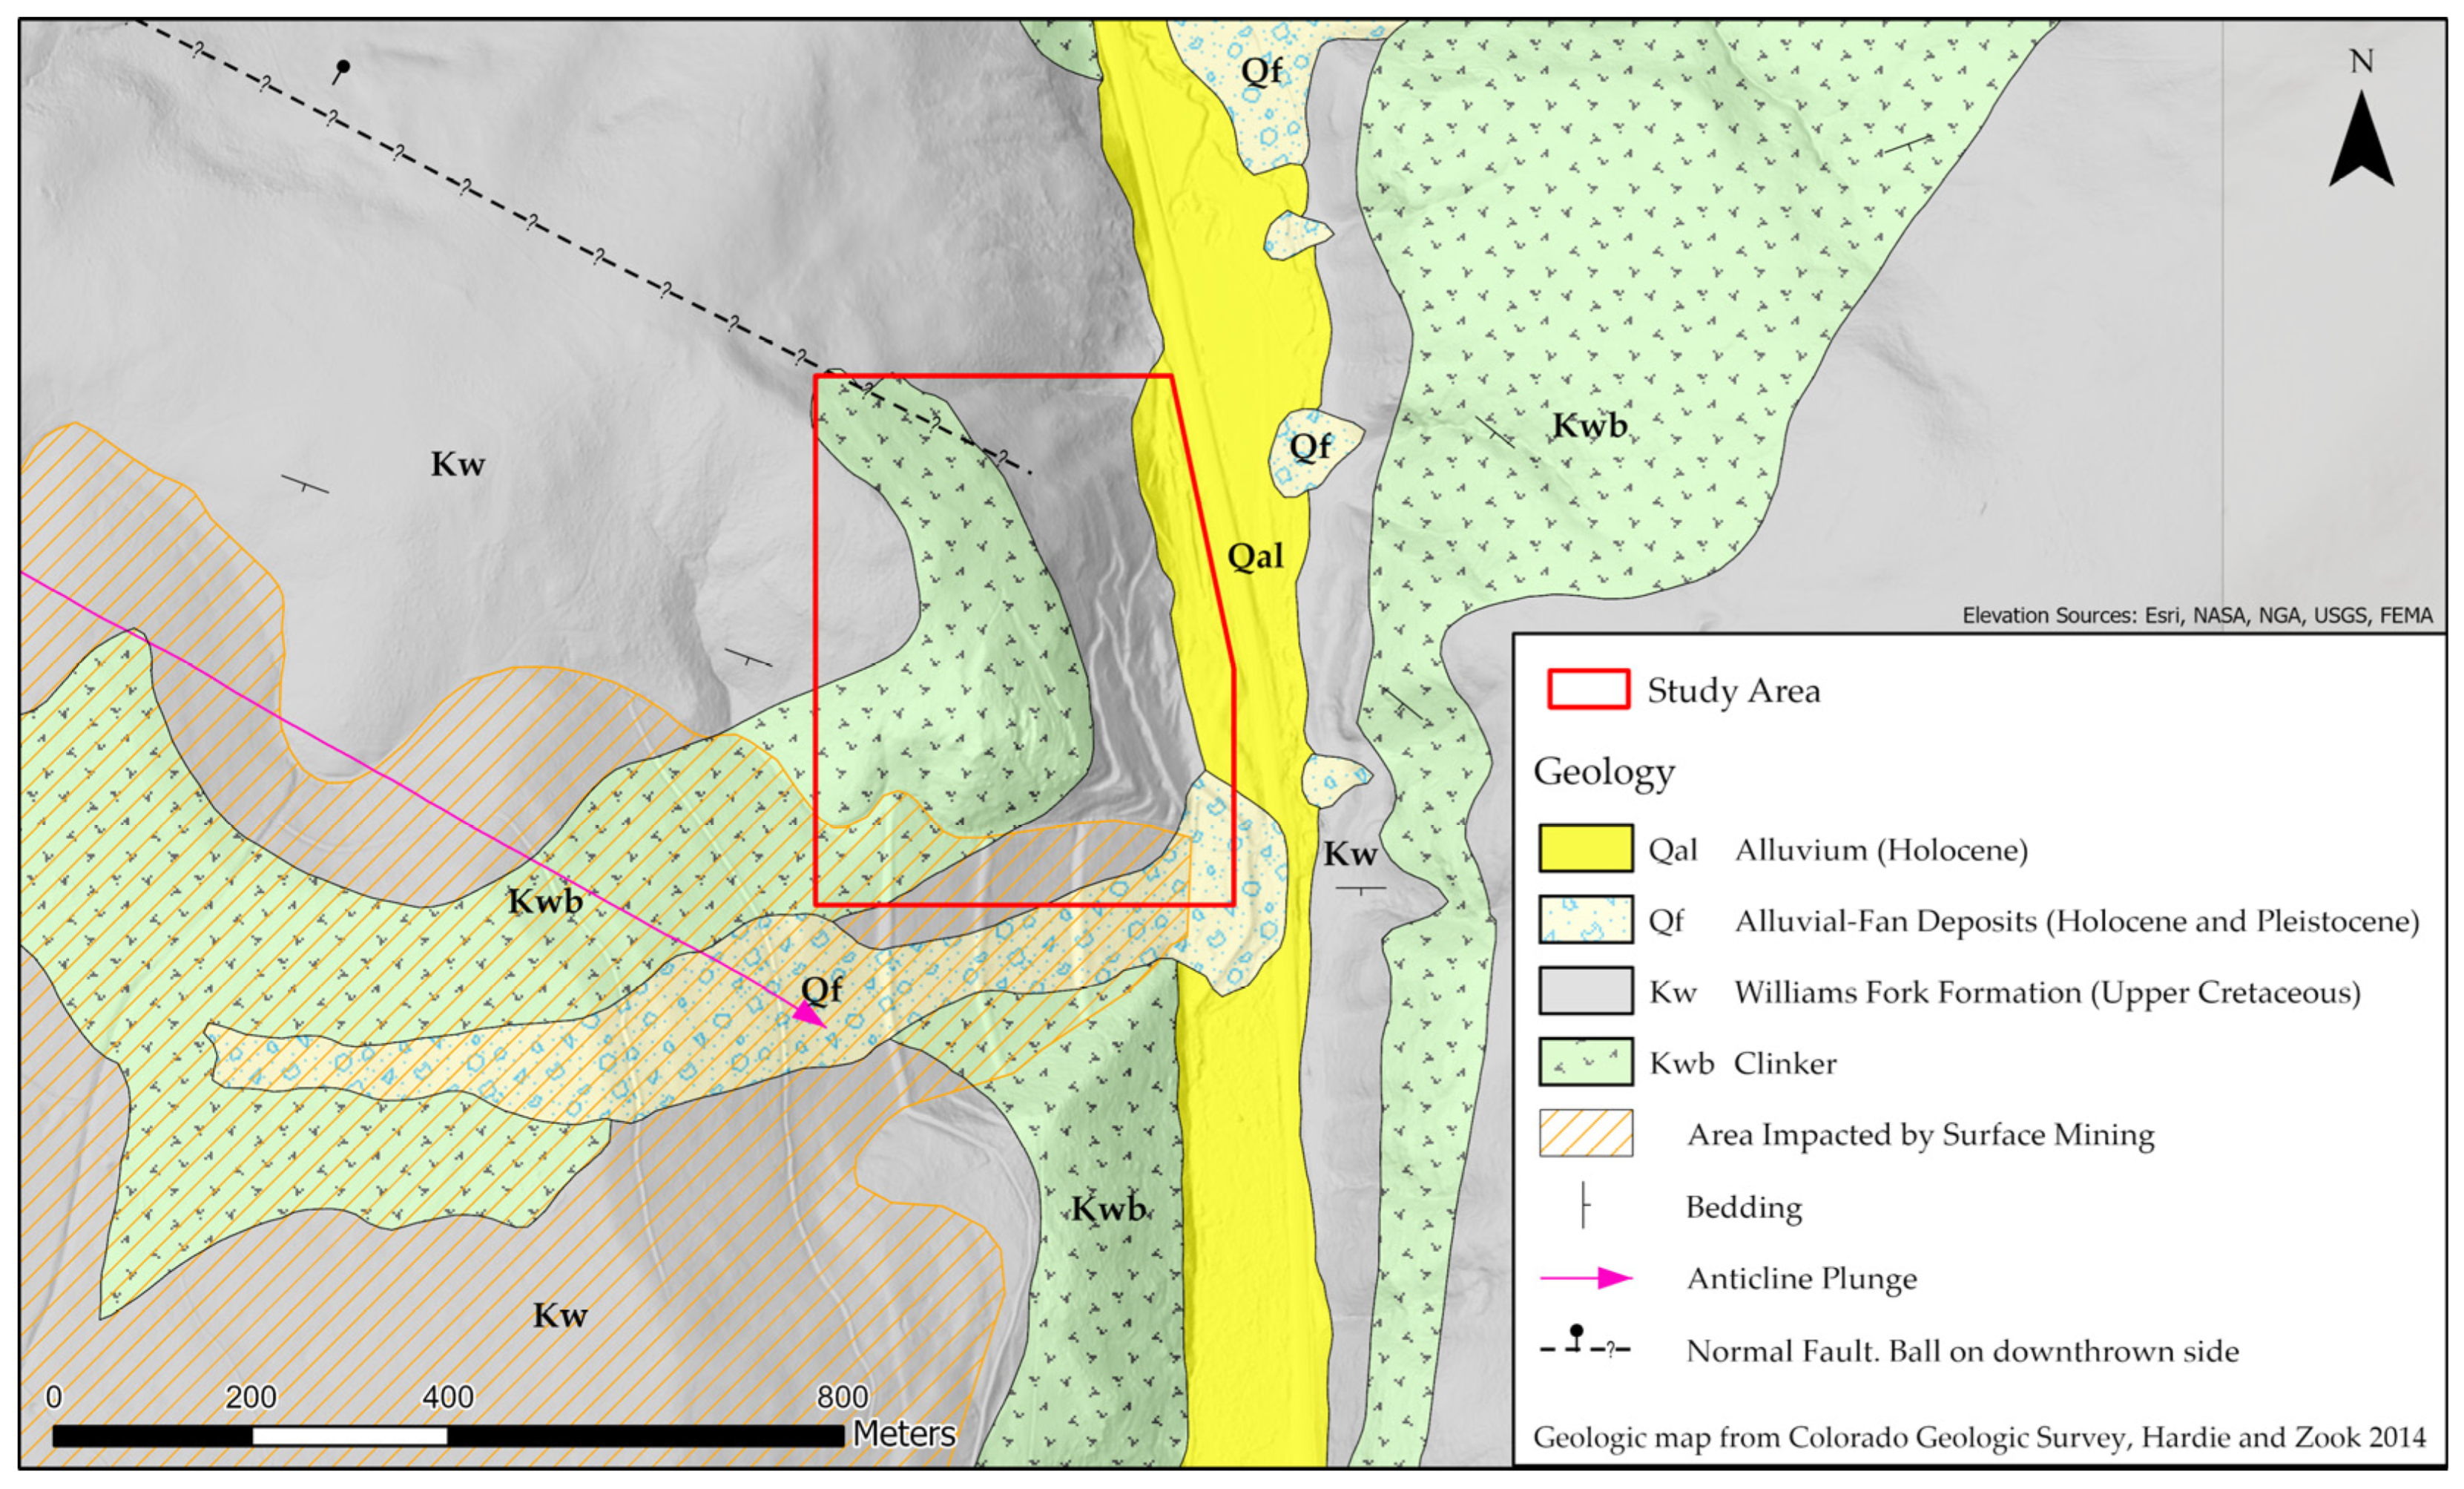
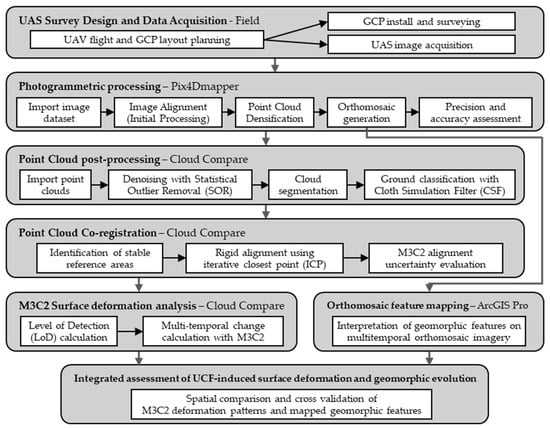
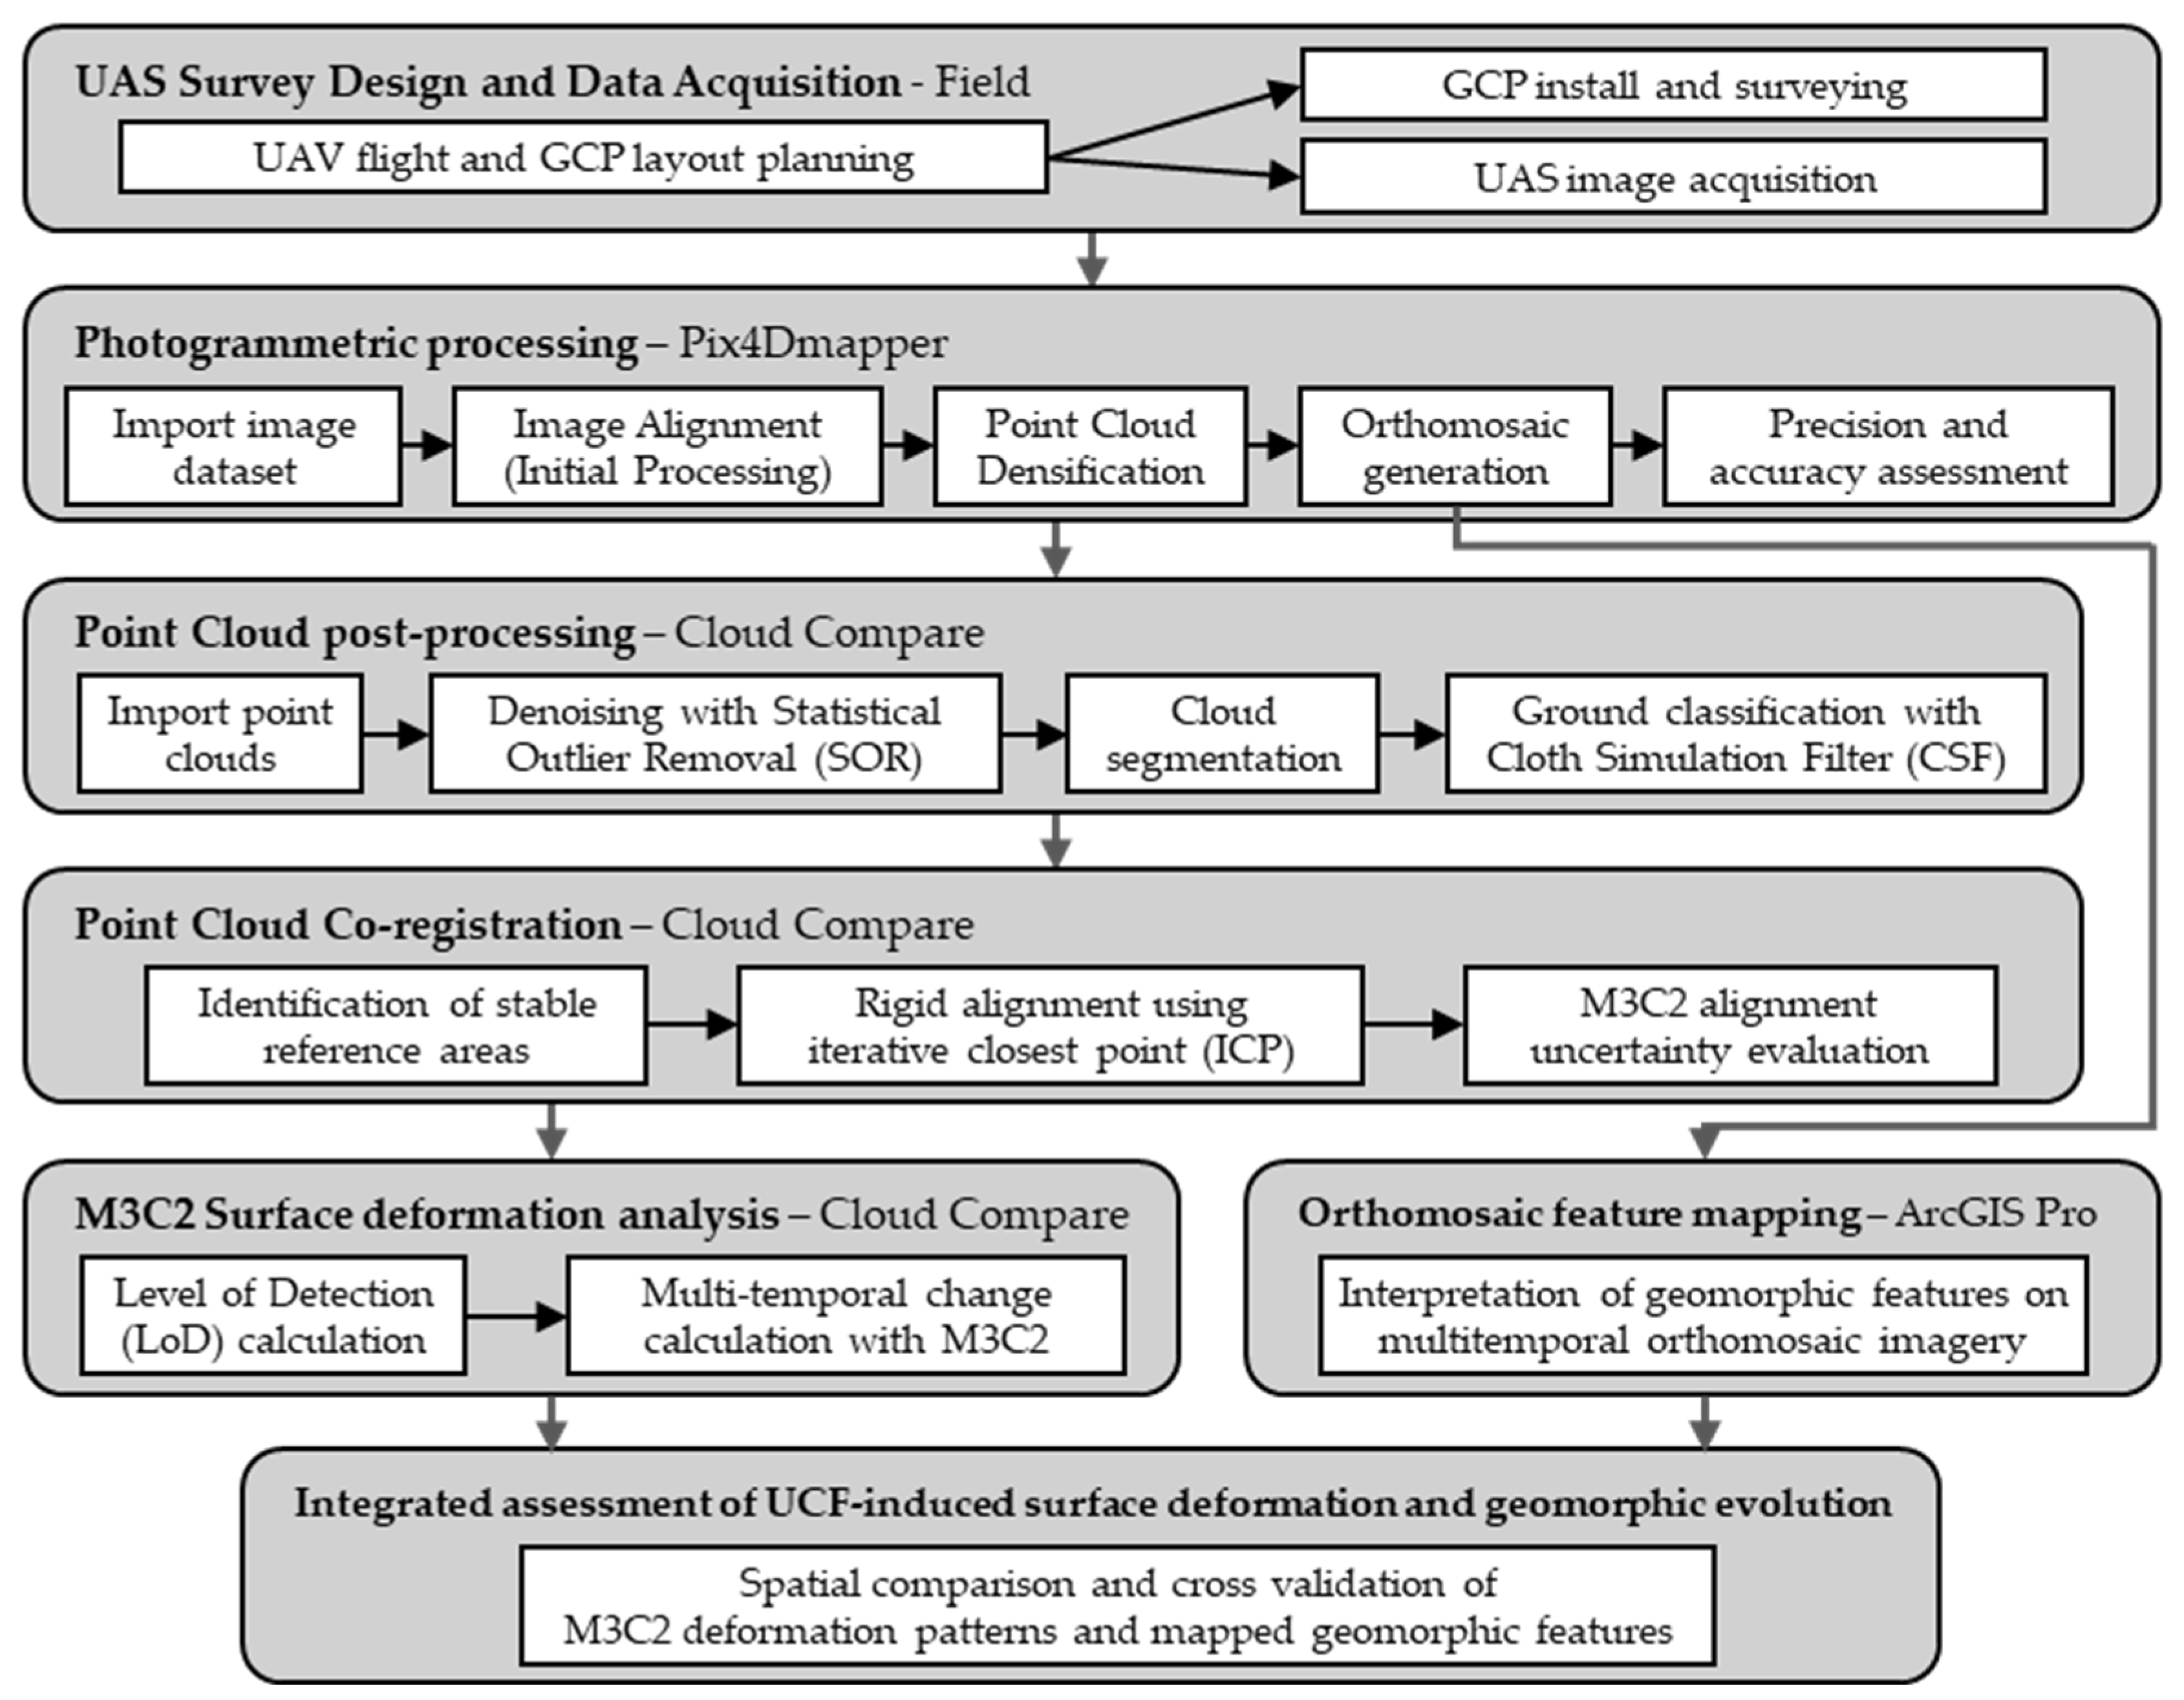
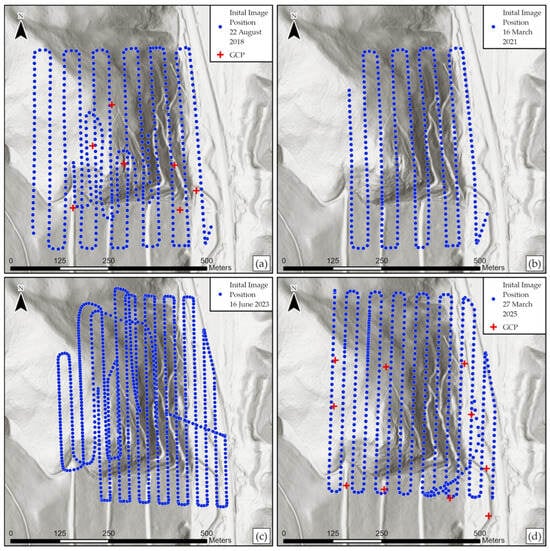
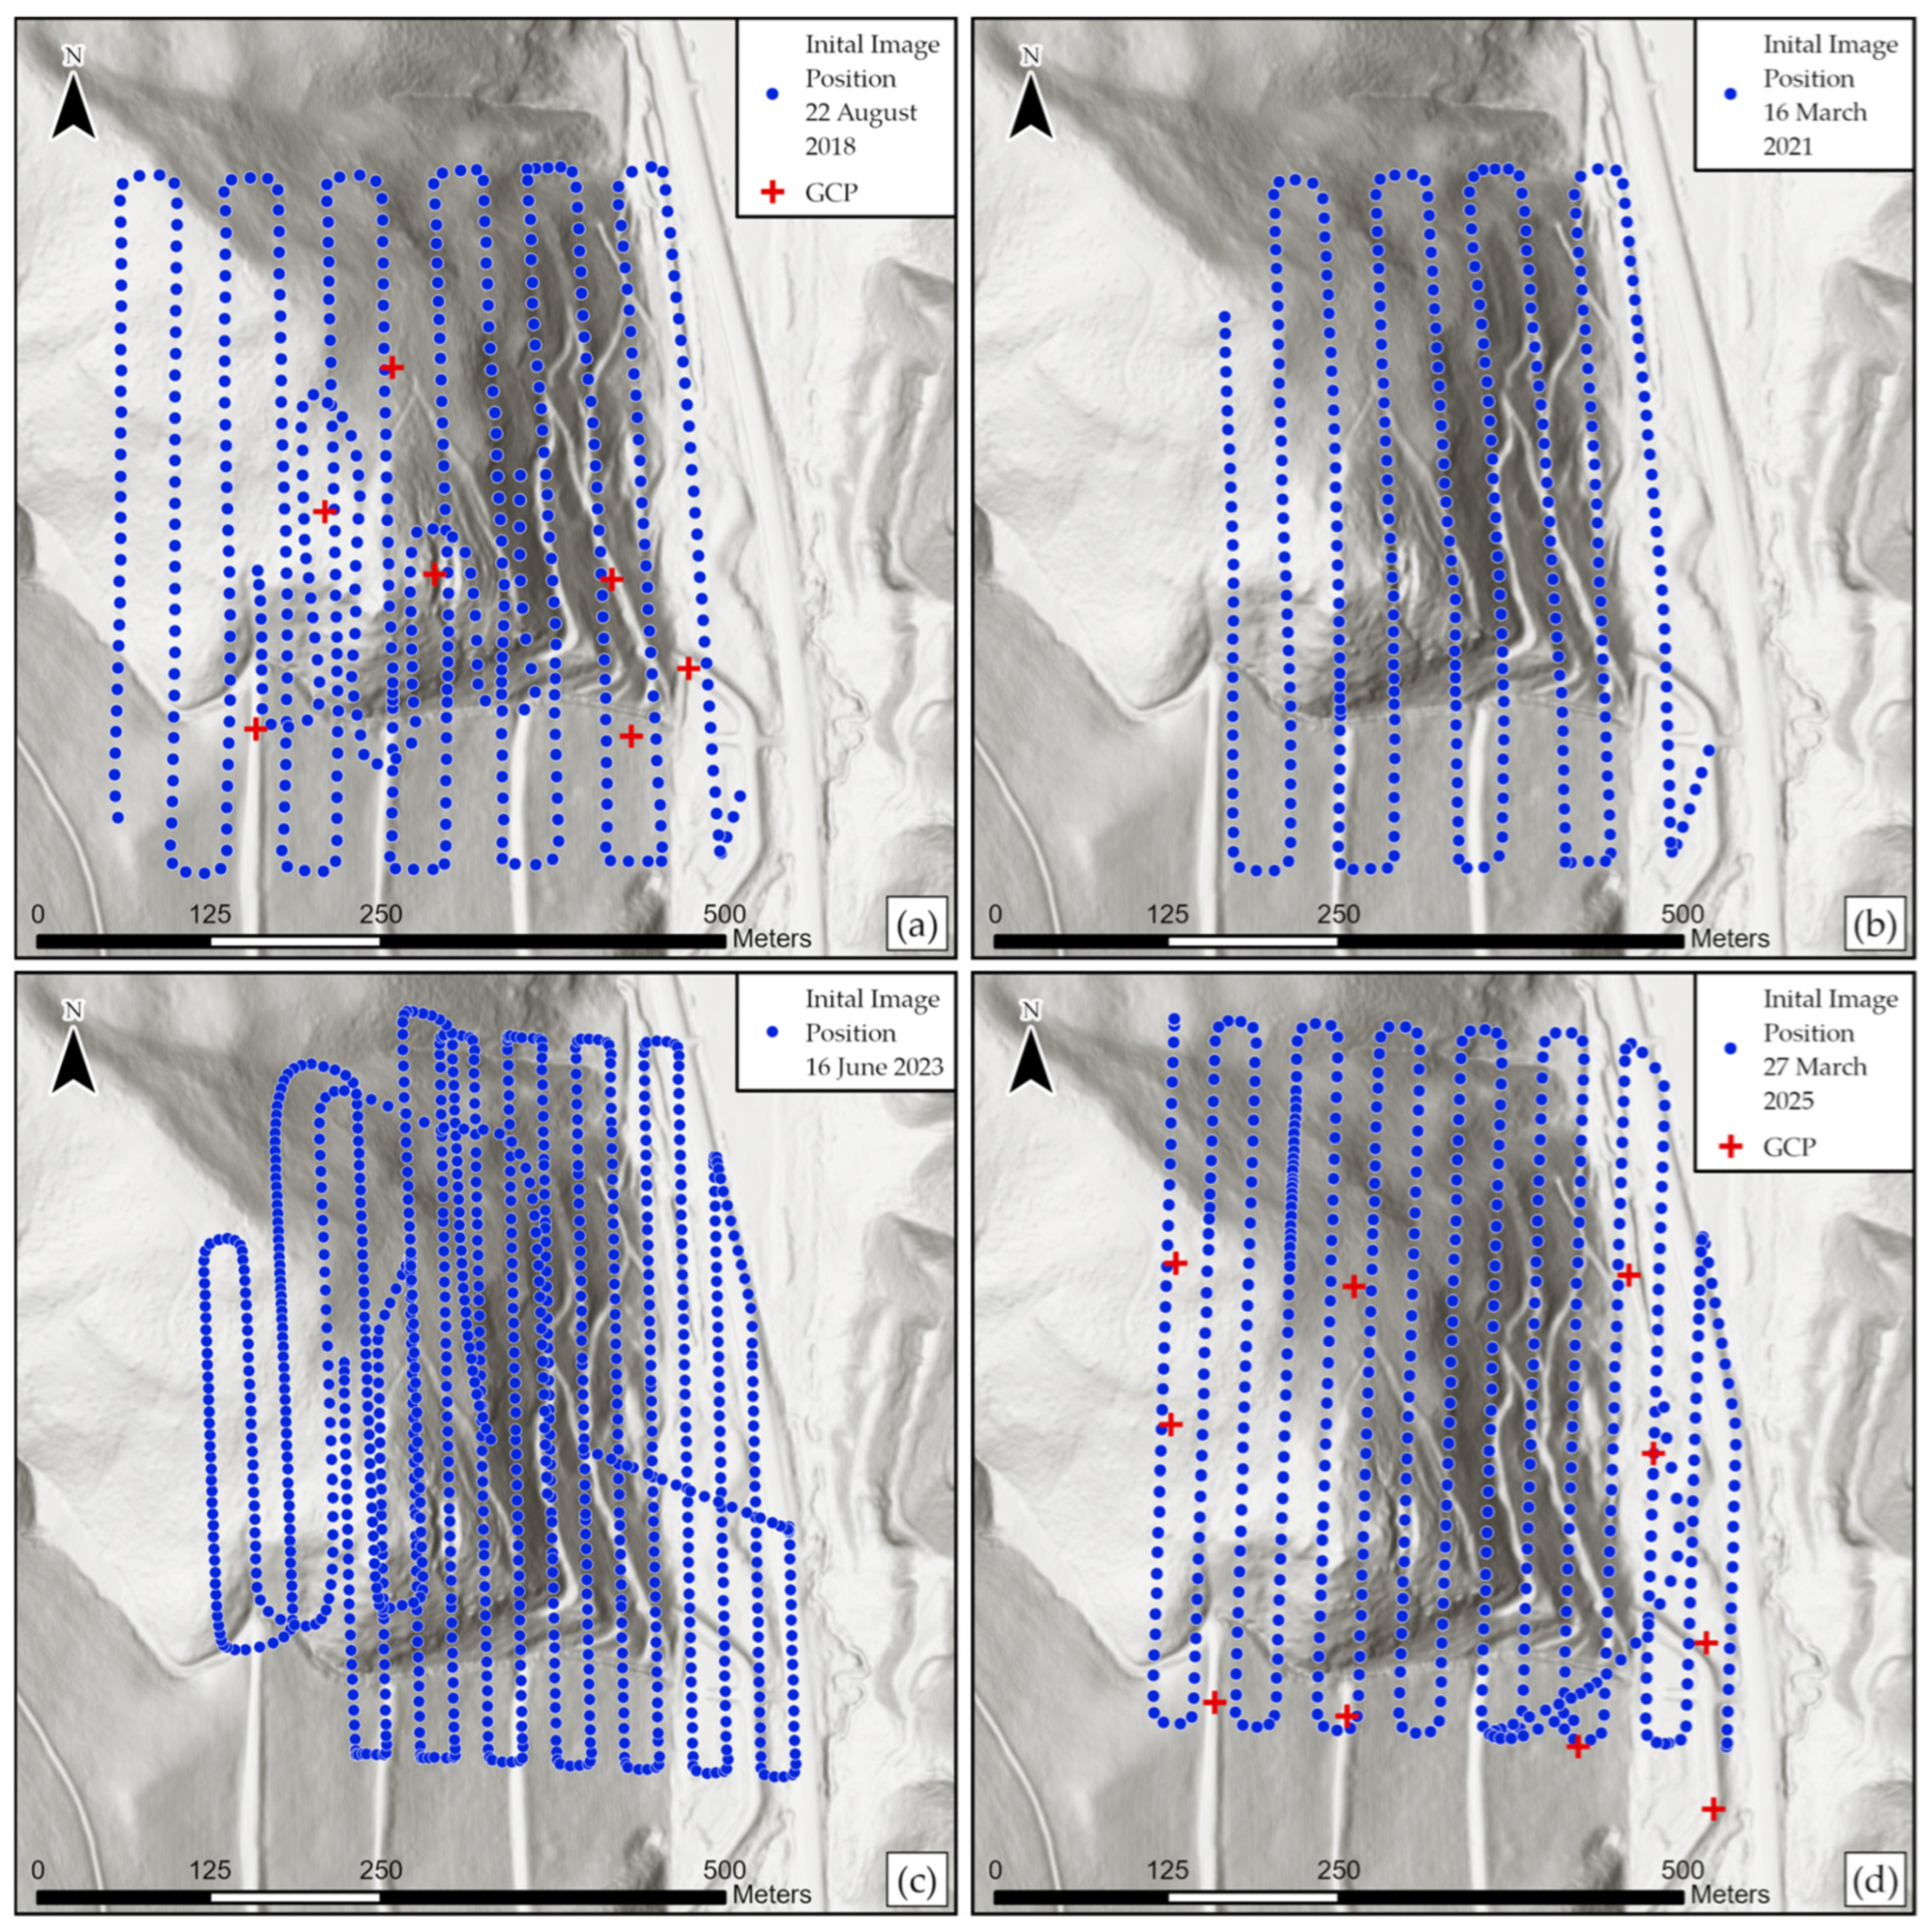
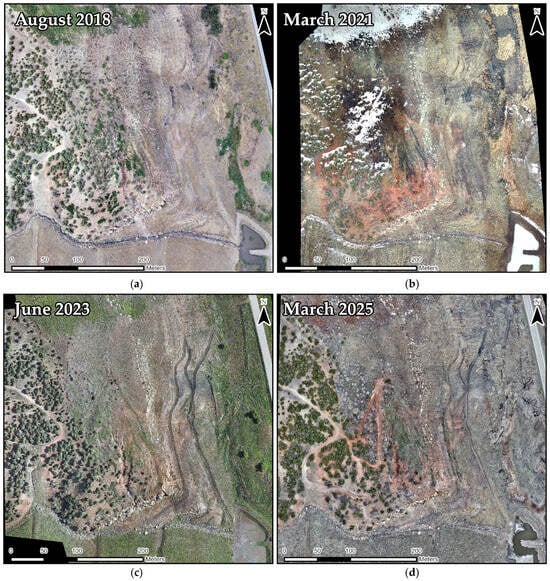
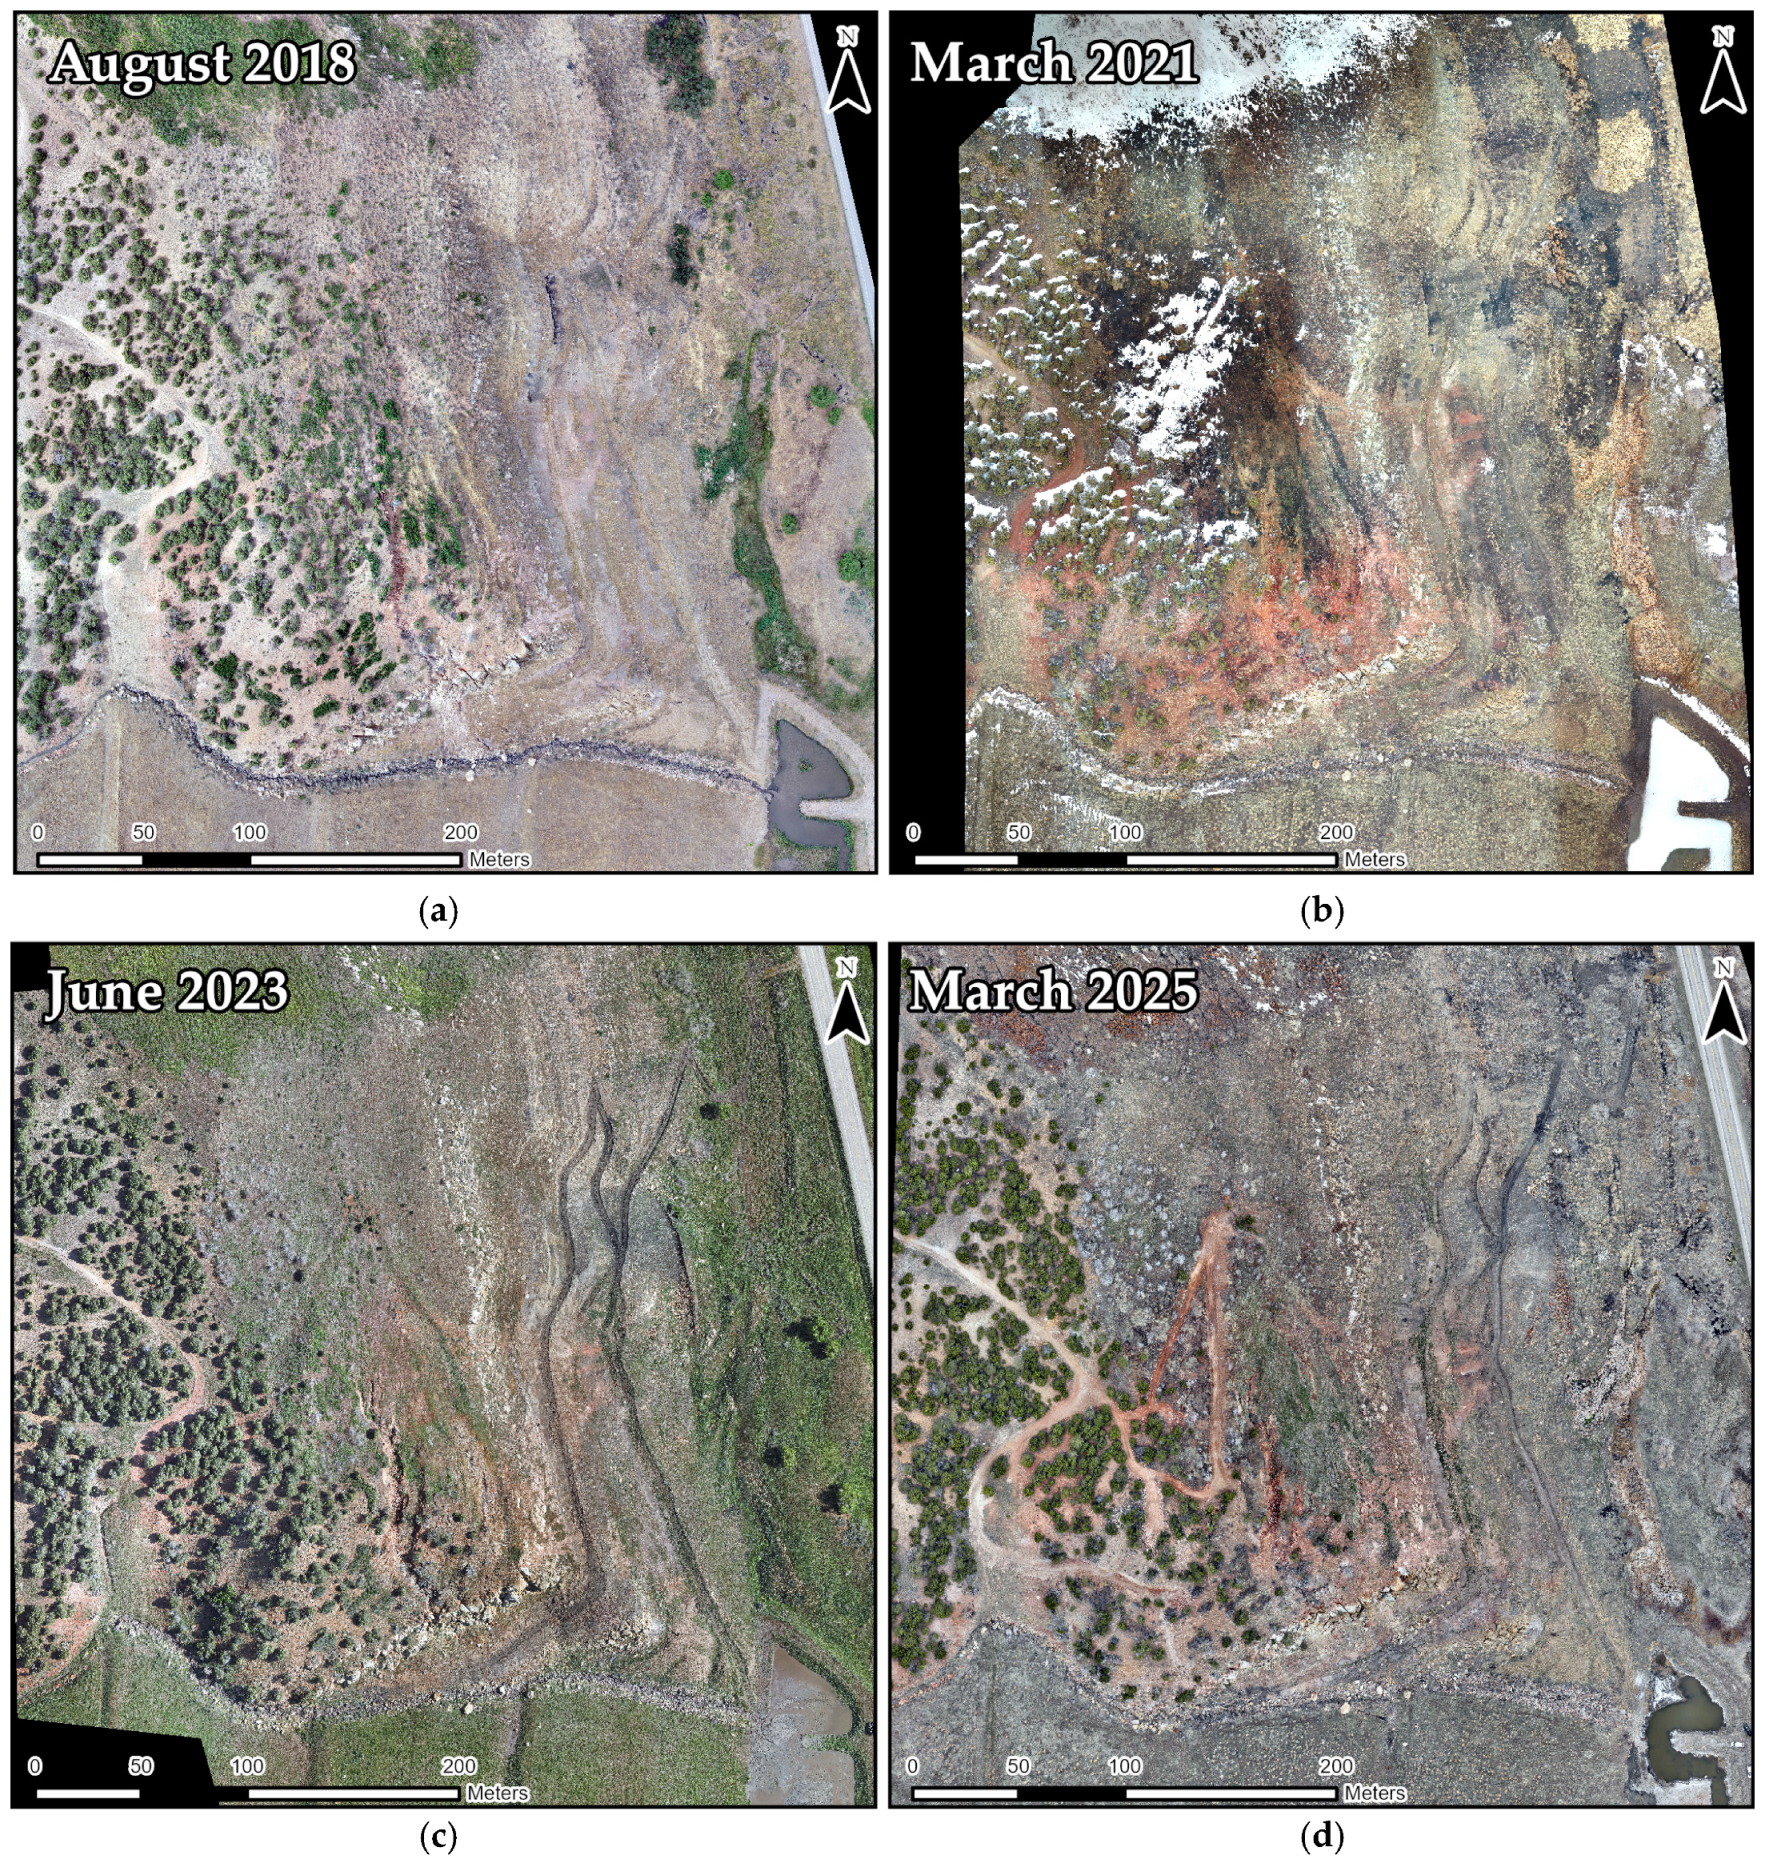
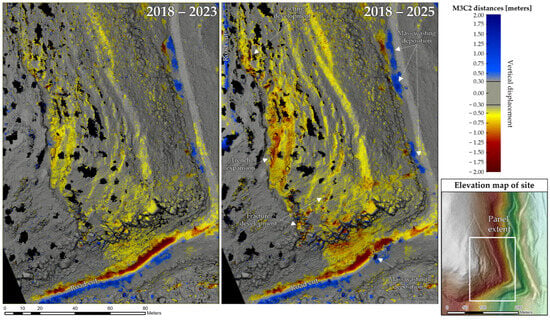
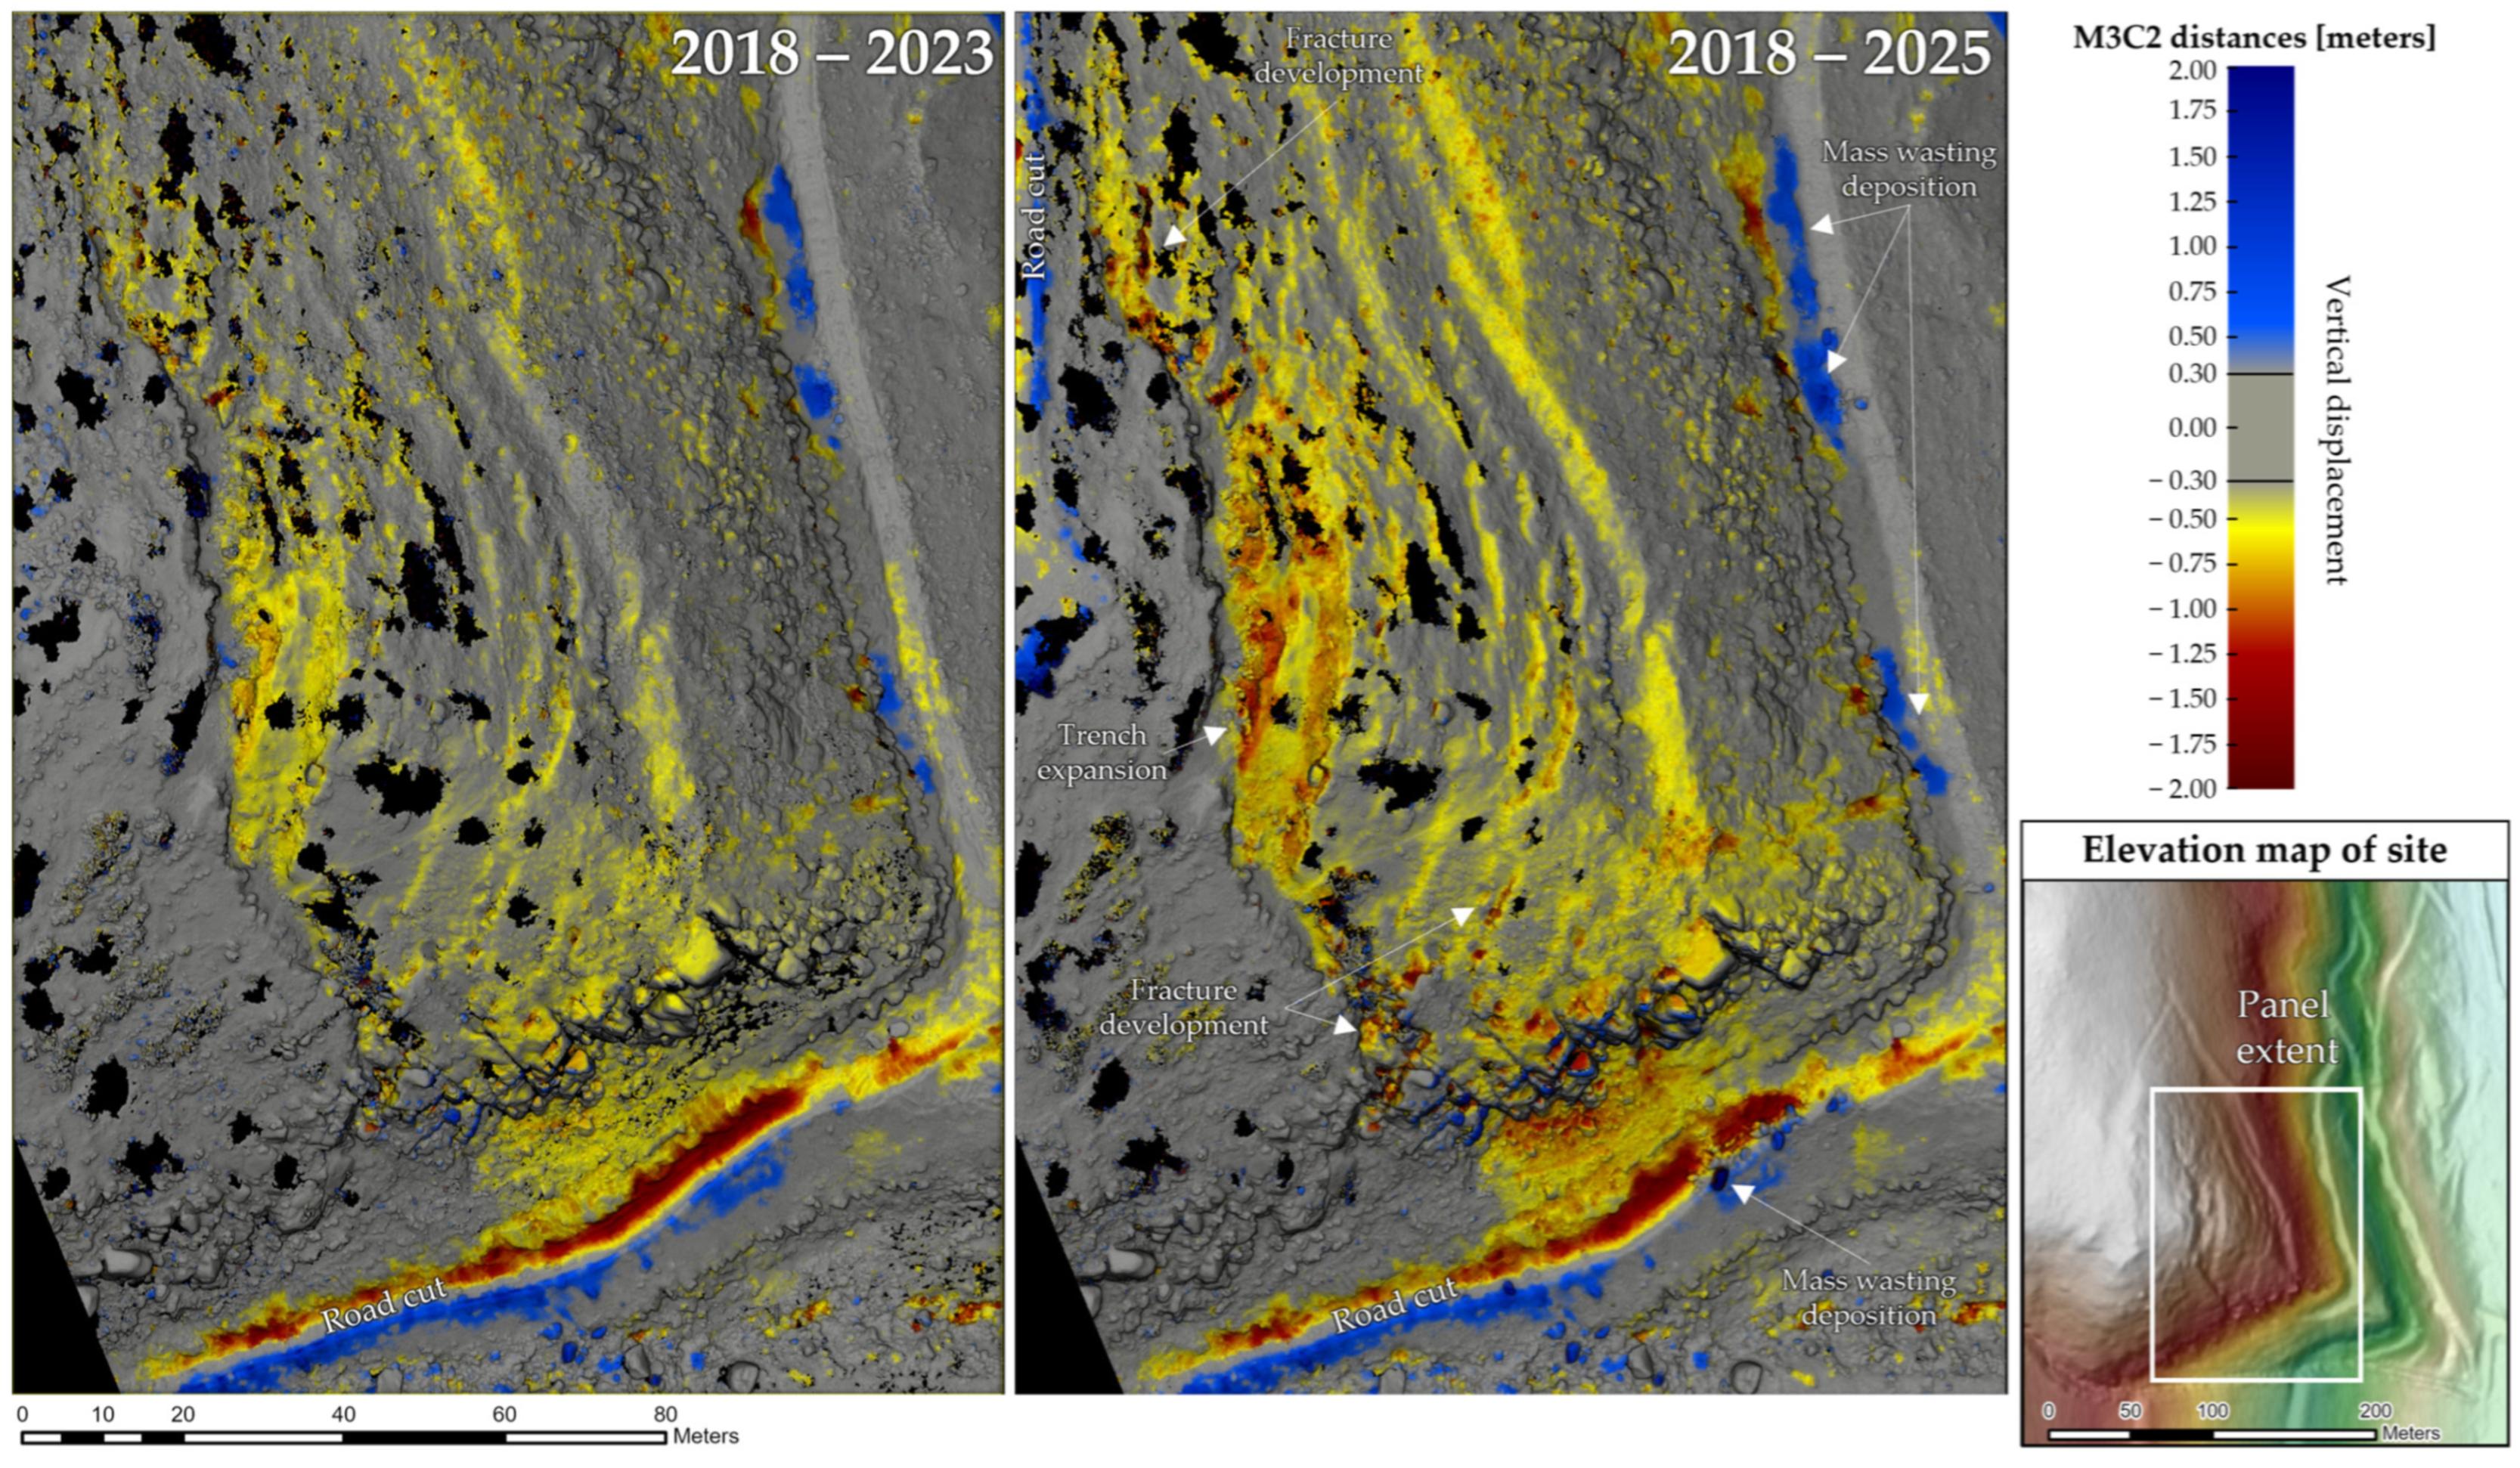
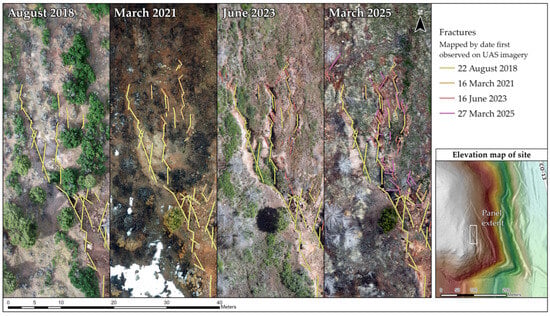
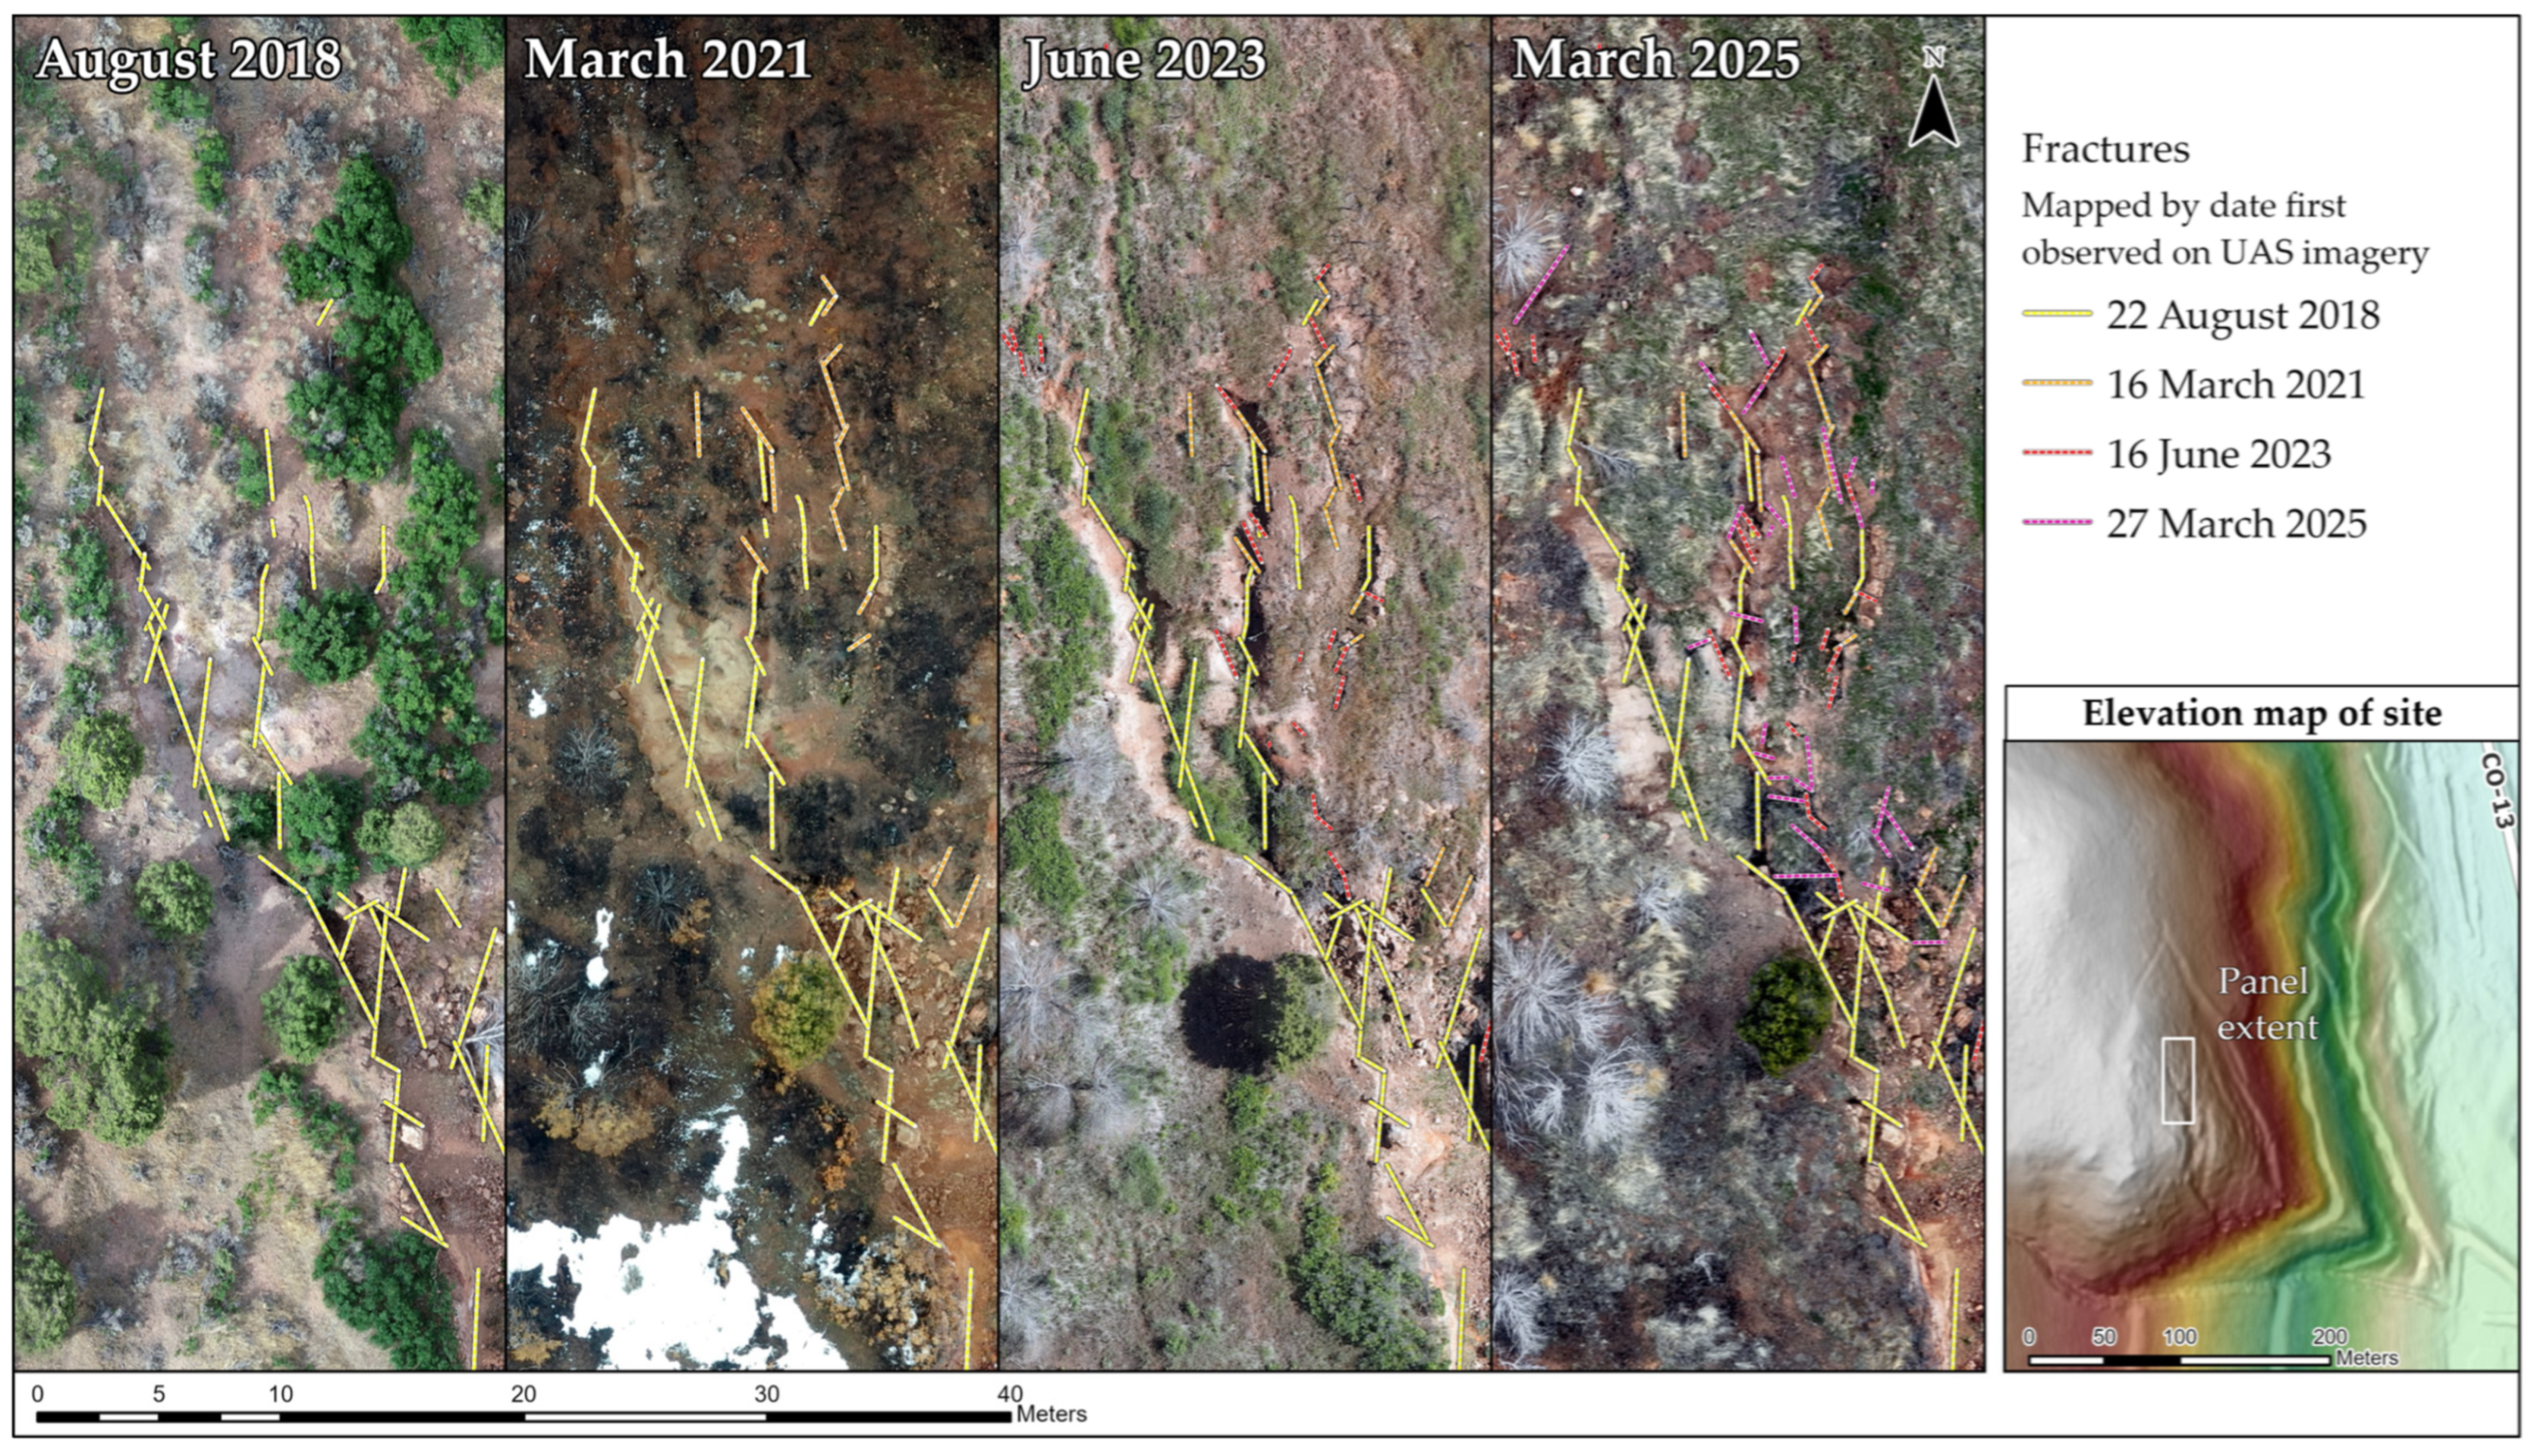
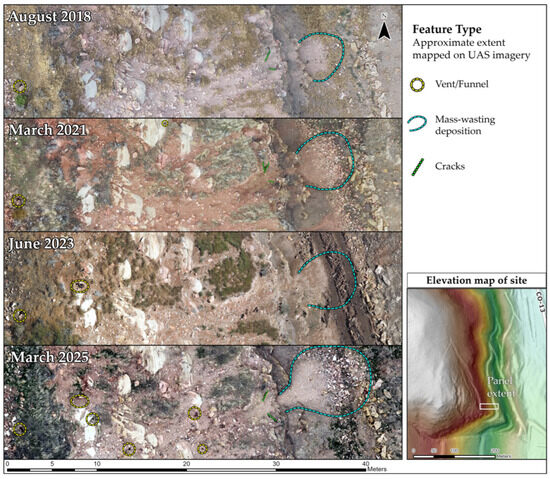
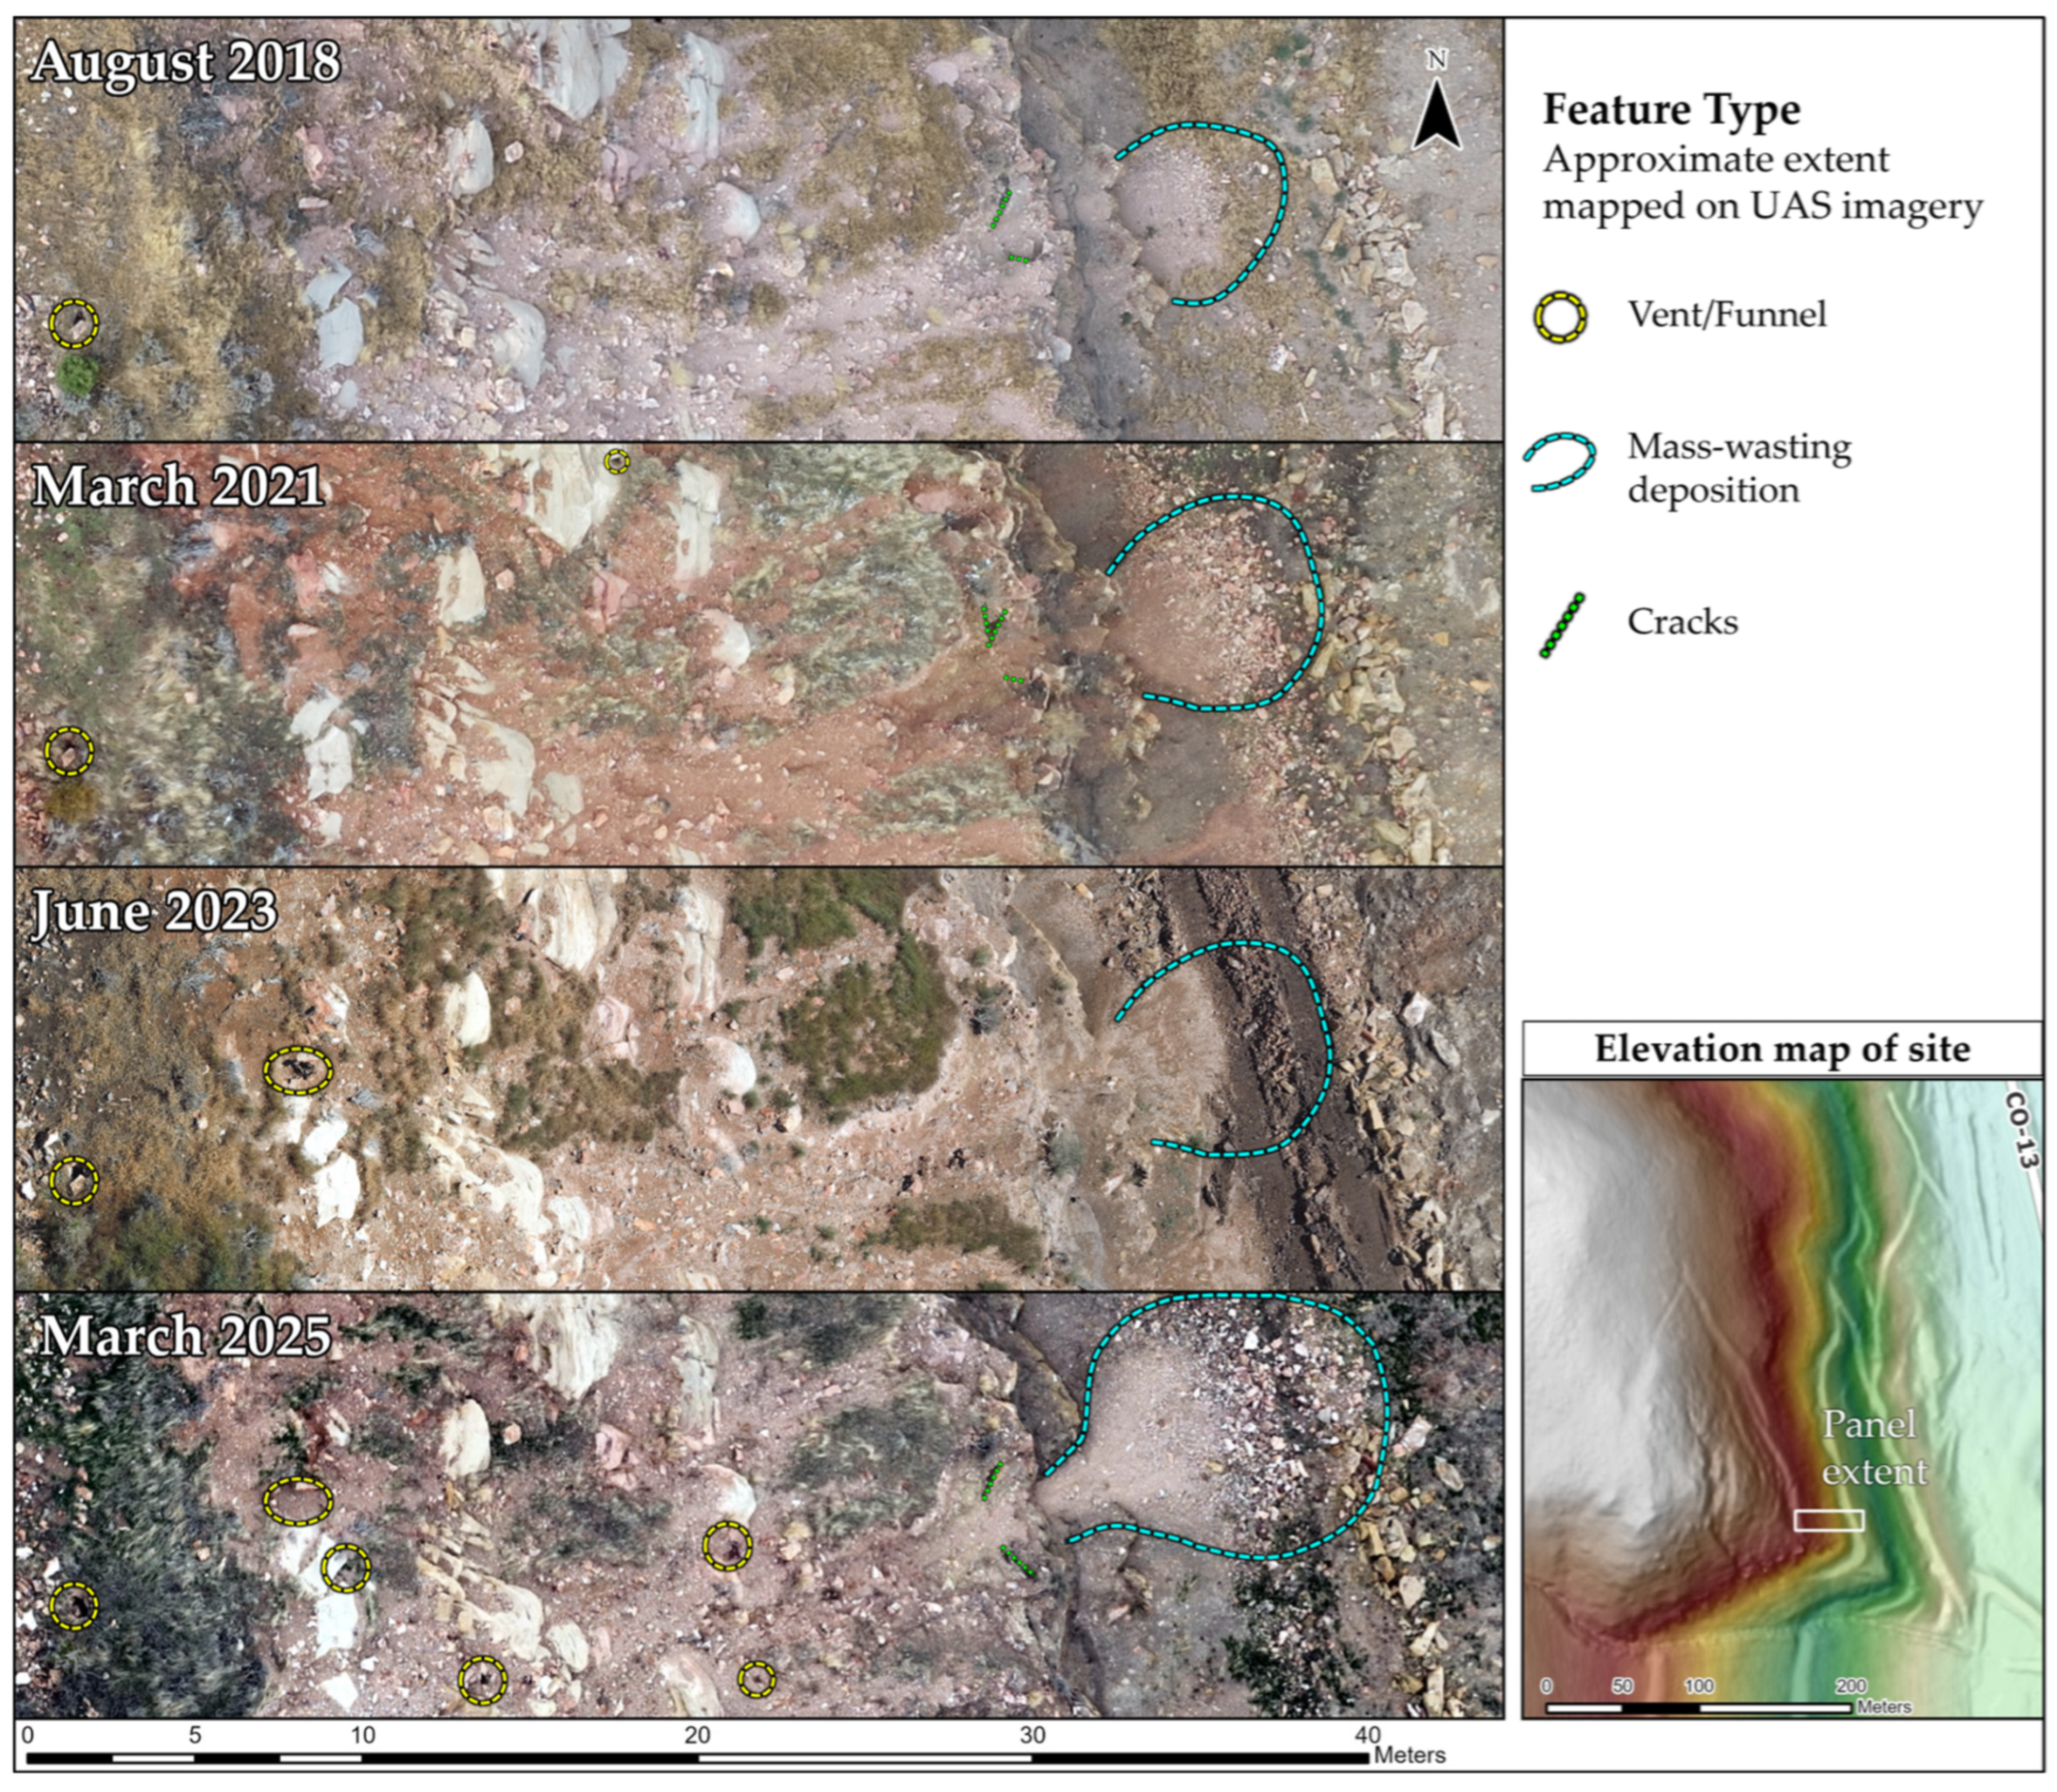

Disclaimer/Publisher’s Note: The statements, opinions and data contained in all publications are solely those of the individual author(s) and contributor(s) and not of MDPI and/or the editor(s). MDPI and/or the editor(s) disclaim responsibility for any injury to people or property resulting from any ideas, methods, instructions or products referred to in the content. |
© 2026 by the authors. Licensee MDPI, Basel, Switzerland. This article is an open access article distributed under the terms and conditions of the Creative Commons Attribution (CC BY) license.