


Highlights
What are the main findings?
- Developed a causal remote sensing framework integrating machine learning with counterfactual analysis to rigorously correct for observational selection bias.
- Identified the restoration program as the dominant driver for sand fixation, delivering a positive net ecological benefit (+6.02 t hm−2) despite the confounding effects of climate change.
What are the implications of the main findings?
- Long-term earth observation confirms that restoration functions primarily to mitigate degradation, significantly retarding degradation rates driven by adverse climatic shifts.
- Identifying abiotic thresholds via satellite monitoring necessitates a shift from uniform expansion to precision management guided by remote sensing-based spatial zoning.
Abstract
Disentangling the impacts of ecological restoration from climate change is an ongoing challenge in remote sensing since the traditional correlative approaches often cannot elucidate causal mechanisms. To overcome this, we introduce a Causal Remote Sensing Framework that uses multi-source satellite data (2000–2020), machine learning (XGBoost, SHAP) and causal inference (T-Learner) to build pixel-level counterfactuals. Using this framework, we assessed the Return Grazing to Grassland Program (RGGP) on the Qinghai–Tibet Plateau. Our results demonstrate that a warming and wetting climate improved Water yield (WY) while at the same time decreasing sand fixation (SF) in 83.6% of the region. Notably, the restoration project became the main factor that slowed this decline. After controlling for observational selection bias, the program had a net positive effect of (+6.02 t hm−2), reducing degradation in 64.6% of treated areas. This framework provides a practical way for the remote sensing community to go beyond change monitoring to allow the diagnosis of the causal mechanisms in complex human-environment systems.
1. Introduction
The Qinghai–Tibet Plateau (QTP), commonly known as the “Third Pole” and the “Water Tower of Asia”, is of great importance in regulating the global climate and providing water for billions of people downstream [1,2,3]. This high-altitude alpine ecosystem is extremely sensitive to global warming and human activities. In recent decades, rapid climate change and intensified anthropogenic pressures have worsened the degradation of grasslands and desertification [4,5], which threatens regional ecological security and stability of important ecosystem services (ESs), such as carbon sequestration (CS) and sand fixation, which are of considerable climatic significance [6,7]. Extensive meta-analyses show that overgrazing is one of the main factors driving carbon deficits on the plateau, causing a decrease in soil organic carbon stocks by about 12–14% in alpine meadows relative to non-grazed areas [8,9,10]
Since 2000, the Chinese government has initiated large-scale ecological restoration programs (ERPs) in order to reverse these trends. Notably, the Grain for Green Program (GGP) and the Return Grazing to Grassland Program RGGP use afforestation [11,12,13], fencing and non-grazing regimes to boost vegetation cover, decrease soil erosion and boost carbon sinks [14,15]. While extensive greening is documented across the plateau, it is difficult to attribute vegetation recovery to these programs. Remote sensing monitoring has been useful in providing extensive vegetation data [16], but it is difficult to distinguish the impacts of engineering interventions from simultaneous climate-driven changes, such as warming and increased precipitation [17].
Past attempts to unravel the complex causes of ecosystem change have used correlation analyses, Residual Trend Analysis (RESTREND) and geographic detectors [18,19]. However, these approaches are often based on linear assumptions that oversimplify the dynamics [20,21] of coupled human-natural systems [22].
Two important methodological gaps remain. First, ecosystem responses are nonlinear in nature. For example, the moderate disturbance hypothesis predicts that moderate grazing levels may stimulate compensatory growth, whereas overgrazing may push systems past a threshold, triggering degradation. Linear models have difficulty capturing these thresholds, which could result in misinformed management policies [23]. Second, statistical correlations do not mean causation [24]. Ecological engineering interventions are not distributed randomly; the most degraded areas are often chosen for restoration by policymakers. Comparing treated and untreated areas without controlling for differences in the baseline can lead to spurious correlations, which make interventions appear not to work [25,26]. Robust evaluation thus necessitates frameworks that integrate nonlinear modeling with counterfactual inference, validated through rigorous diagnostics such as covariate balance checks (Love plots) and sensitivity analyses (E-values) to ensure that causal estimates remain robust despite unmeasured confounding [27,28].
To overcome these challenges, we designed an integrated analytical framework that combines machine learning with causal inference, with a focus on carbon sequestration (CS) and sand fixation (SF) as primary outcomes [29], because these are the outcomes of interventions such as seeding and fencing. WY and habitat quality (HQ) were considered as background variables, which set the context for the climate and ecological baseline conditions, rather than as direct indicators of project success. Methodologically, we used extreme gradient boosting (XGBoost) to flexibly model complex nonlinear interactions in satellite-derived datasets [30,31], combined with Shapley Additive Explanations (SHAP) to understand feature contributions and build nonlinear response curves [32]. To isolate the causal effects, we implemented a T-Learner approach to estimate the counterfactual effects at the pixel level [33,34], validated the covariate balance using Love plots, and quantified the robustness of causal effects using E-values to rigorously estimate the net ecological effects of restoration projects.
This study has three main objectives: (1) to detect dominant natural and anthropogenic drivers of ecosystem service changes over the past two decades; (2) to highlight the existence of nonlinear tipping points of grazing intensity, which offer insights into how to manage grasslands sustainably; and (3) to unravel the causal net effects of RGGP from the concomitant climate variability. By going beyond simple correlations, this work quantifies unbiased treatment effects of human interventions on environmental outcomes, providing scientific evidence to optimize the spatial design of future ecological projects and advance the application of causal inference in remote sensing studies of coupled human–natural systems.
2. Materials and Methods
2.1. Study Area
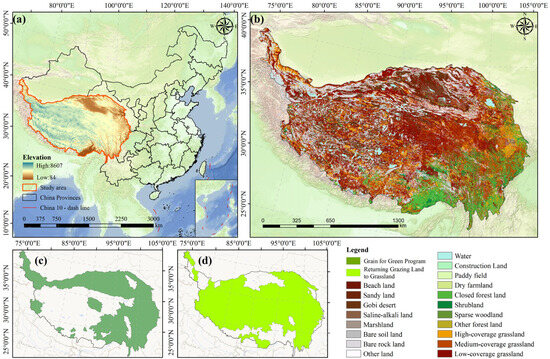
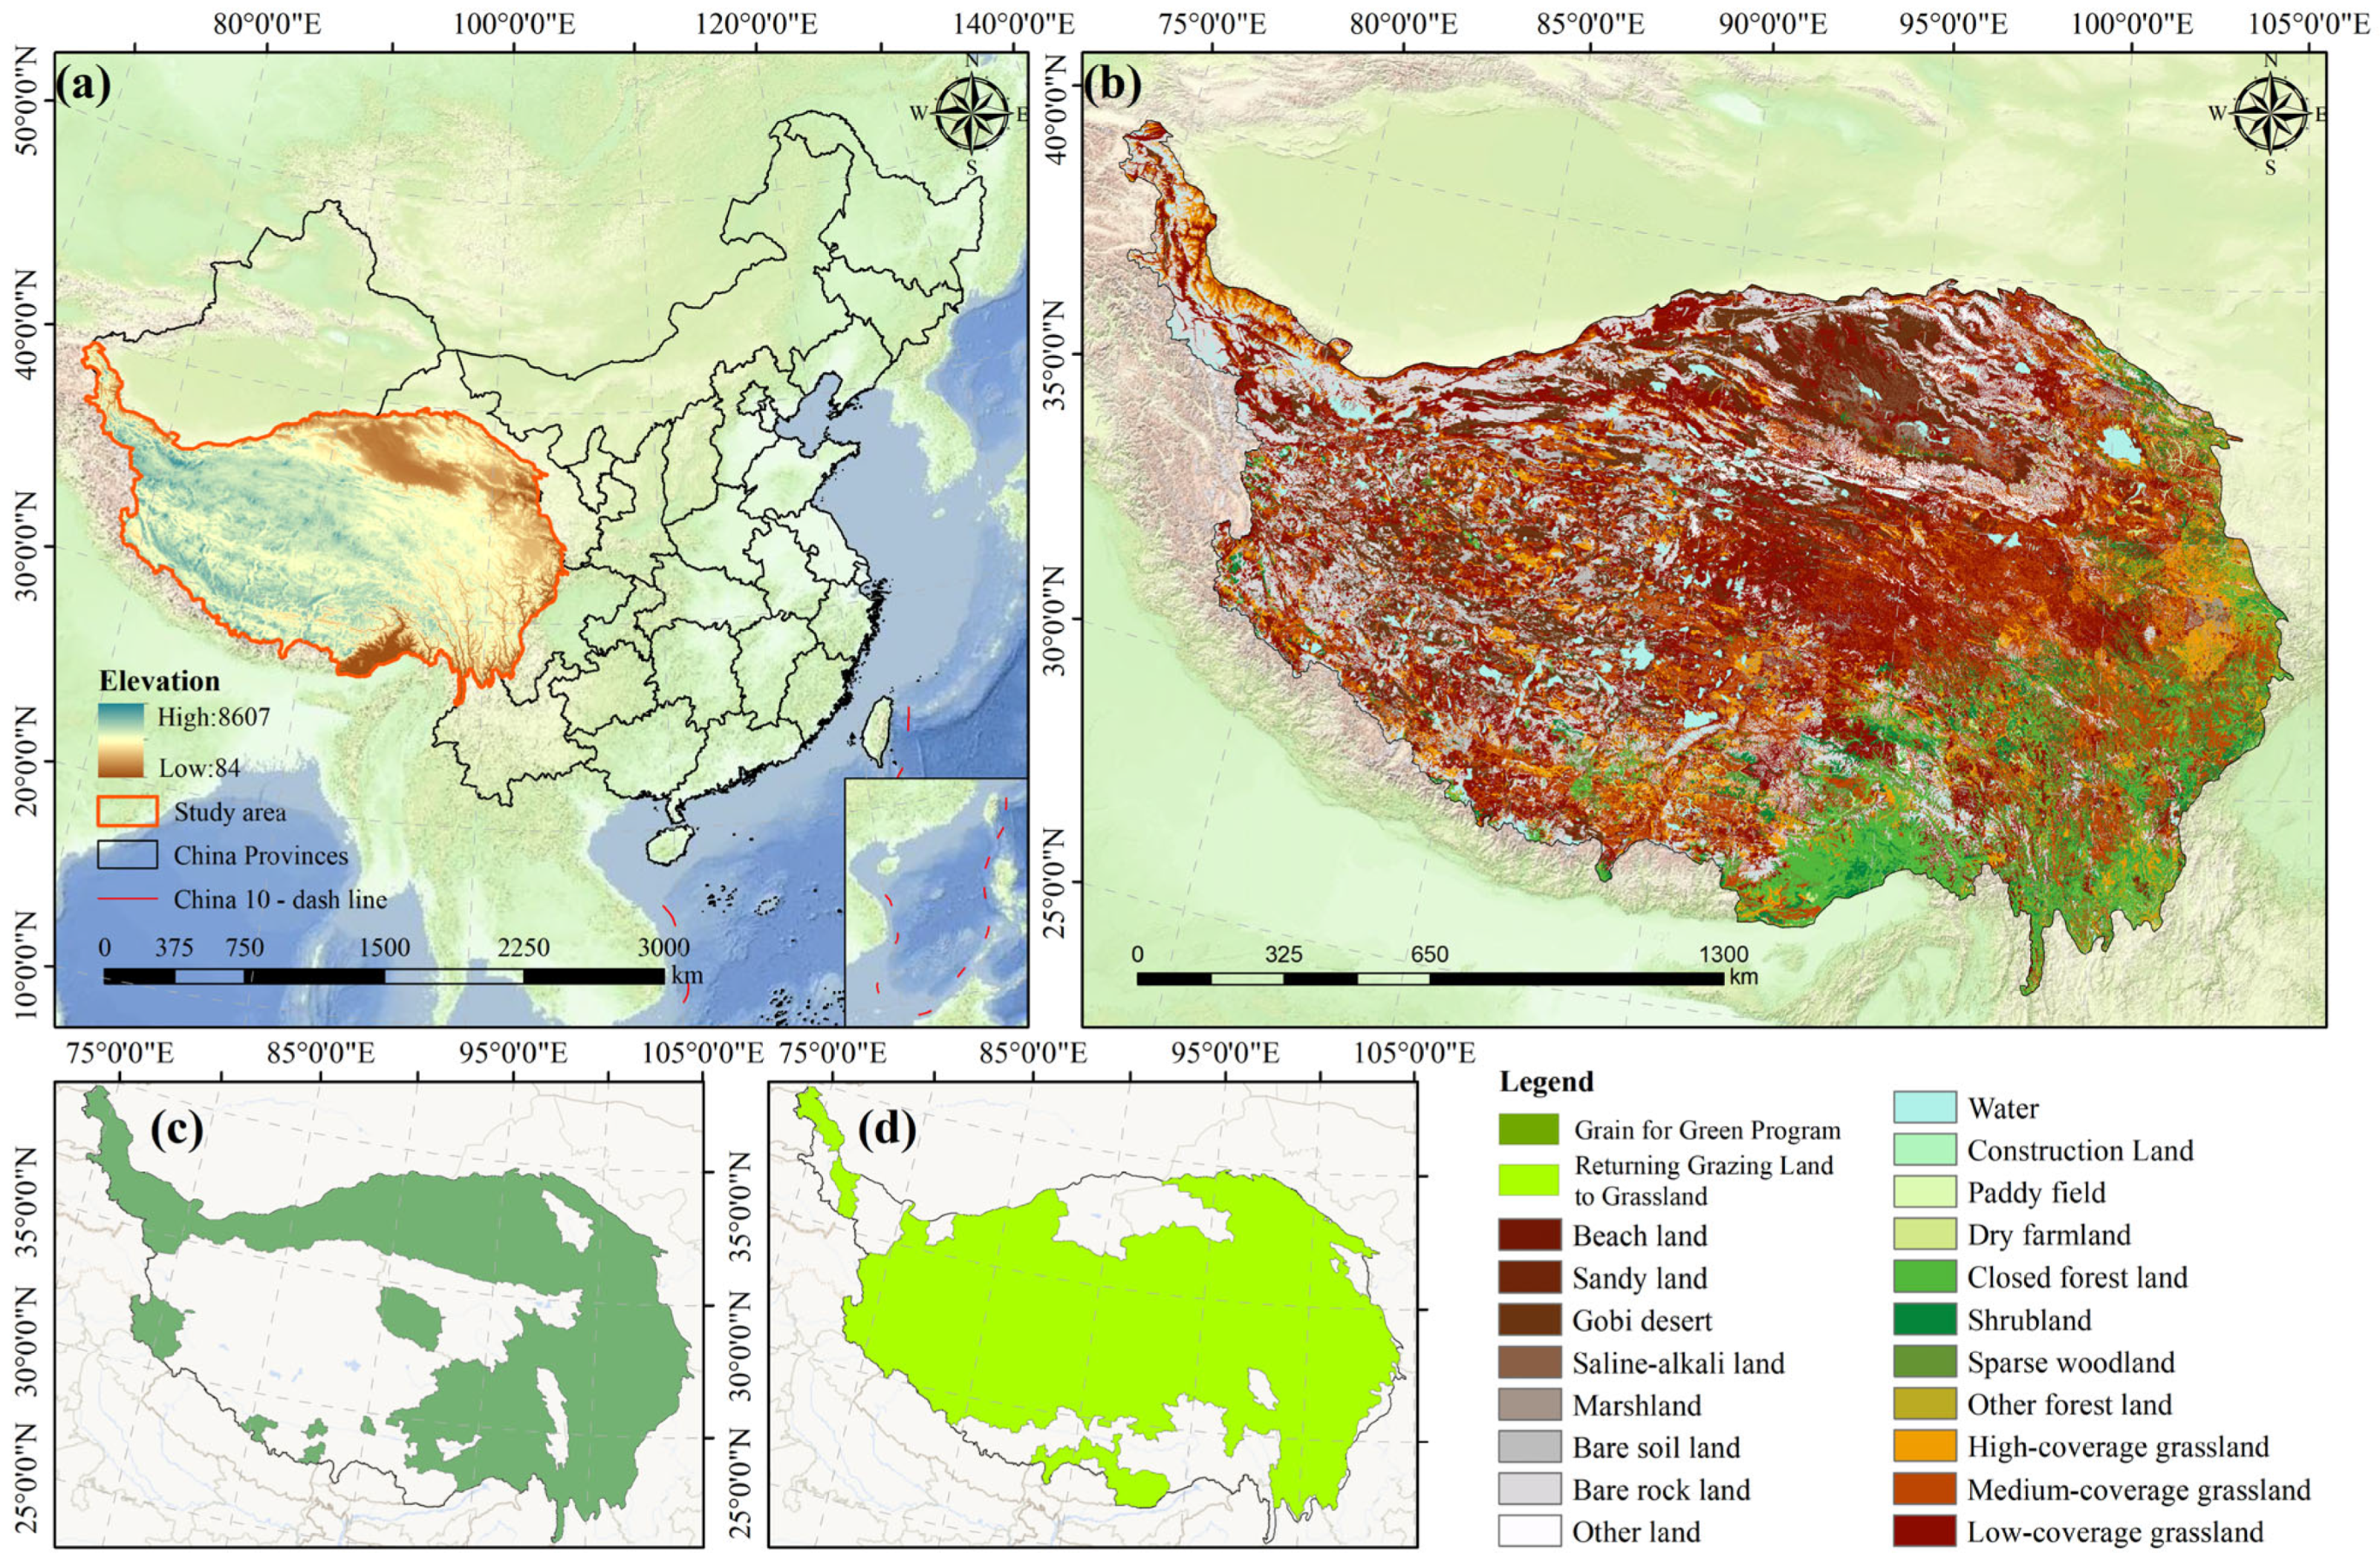
The QTP is situated in southwestern China (26°00′–39°47′N, 73°19′–104°47′E) and is popularly known as the “Third Pole” and the “Water Tower of Asia.” It includes the whole of Tibet Autonomous Region and Qinghai Province, and parts of Xinjiang, Gansu, Sichuan and Yunnan with an area of about 2.5 million km2 [35]. (Figure 1a). As shown in the picture, the QTP increases from altitudes of about 84 m at the southeastern margins to more than 8800 m in the Himalayas, with a mean altitude of more than 4000 m. This extreme topographic gradient is responsible for an alpine climate with low temperatures, high solar radiation, and a strong precipitation gradient with a decrease from southeast to northwest.
Figure 1.
Study area. (a) DEM; (b) land cover types; (c) The spatial extent of the GGP (variable Treat_TG); (d) The spatial extent of the RGGP (variable Treat_TM).
Hydrothermal conditions differ significantly on the plateau, leading to different spatial patterns of land cover (Figure 1b). In general, biome distributions follow the precipitation gradient closely, forests and shrublands being concentrated in the humid southeastern valleys; alpine meadows and steppes dominate the central and eastern plateau; the arid northwest is a mosaic of alpine desert and bare land [36]. These ecosystems offer important ecosystem services such as soil retention and carbon sequestration, but are highly susceptible to climate change as well as anthropogenic disturbance.
China has undertaken ecological engineering projects of unprecedented scope to curb widespread ecosystem degradation. This study focuses on two major interventions. The first is the GGP, which was intended to address soil erosion on steep slopes. Spatially, the program focuses on the conversion of cropland to forest or grassland in the agro-pastoral transition zone in the eastern and southeastern QTP (Figure 1c). The main policy instrument of the GGP is the reversion of cultivated land to natural or semi-natural vegetation.
The second intervention is the RGGP, which aims at restoring degraded pastures and controlling desertification in the large pastoral areas of the central and western plateau (Figure 1d). The RGGP is applied primarily in the form of grazing bans, fencing enclosures, and rotational grazing practices [37,38]. In this study, the vector boundaries of these two programs were used to build binary treatment variables for the causal inference models.
2.2. Datasets and Preprocessing
We created a multi-source remote sensing spatiotemporal panel dataset from 2000 to 2020 that combines climatic, topographic, and human-induced variables to analyze the dynamics of ecosystem services. To ensure reliability and reproducibility, we used authoritative datasets from established platforms.
For climate drivers, annual precipitation and temperature data were collected from the National QTP Science Data Centre. Vegetation dynamics were modeled by the NDVI product, MOD13A1, from the National Aeronautics and Space Administration (NASA) and the topographic data were based on the SRTM Digital Elevation Model (DEM). Anthropogenic pressure indicators were compiled using a multi-source synthesis: the data on grazing intensity were taken from the National Earth System Science Data Centre and combined with the Global Human Footprint Index and night-time light datasets to characterize human activities comprehensively. Complete metadata, including dataset version, spatial resolution and access links, are summarized in Table 1.
Table 1.
Data description and sources.
To ensure spatial consistency, all raster datasets were reprojected to the Albers equal-area conic projection. Continuous variables were resampled using bilinear interpolation, which maintains spatial gradients, and categorical data were resampled using the nearest neighbor algorithm, which maintains original classification codes. To harmonize resolution within multiple sources of data, a uniform spatial resolution of 500 m was adopted. This resolution maintains the fidelity of the baseline vegetation information, but minimizes information loss during the integration of land-use and meteorological data sets. After preprocessing, a regular pixel-level panel dataset was produced, which included approximately 7.7 million valid annual observations. This dataset formed the basis of further machine learning and causal modeling analyses.
2.3. Methods
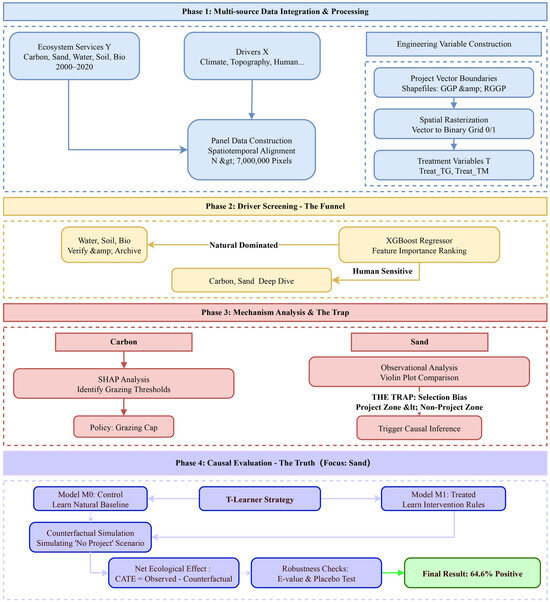
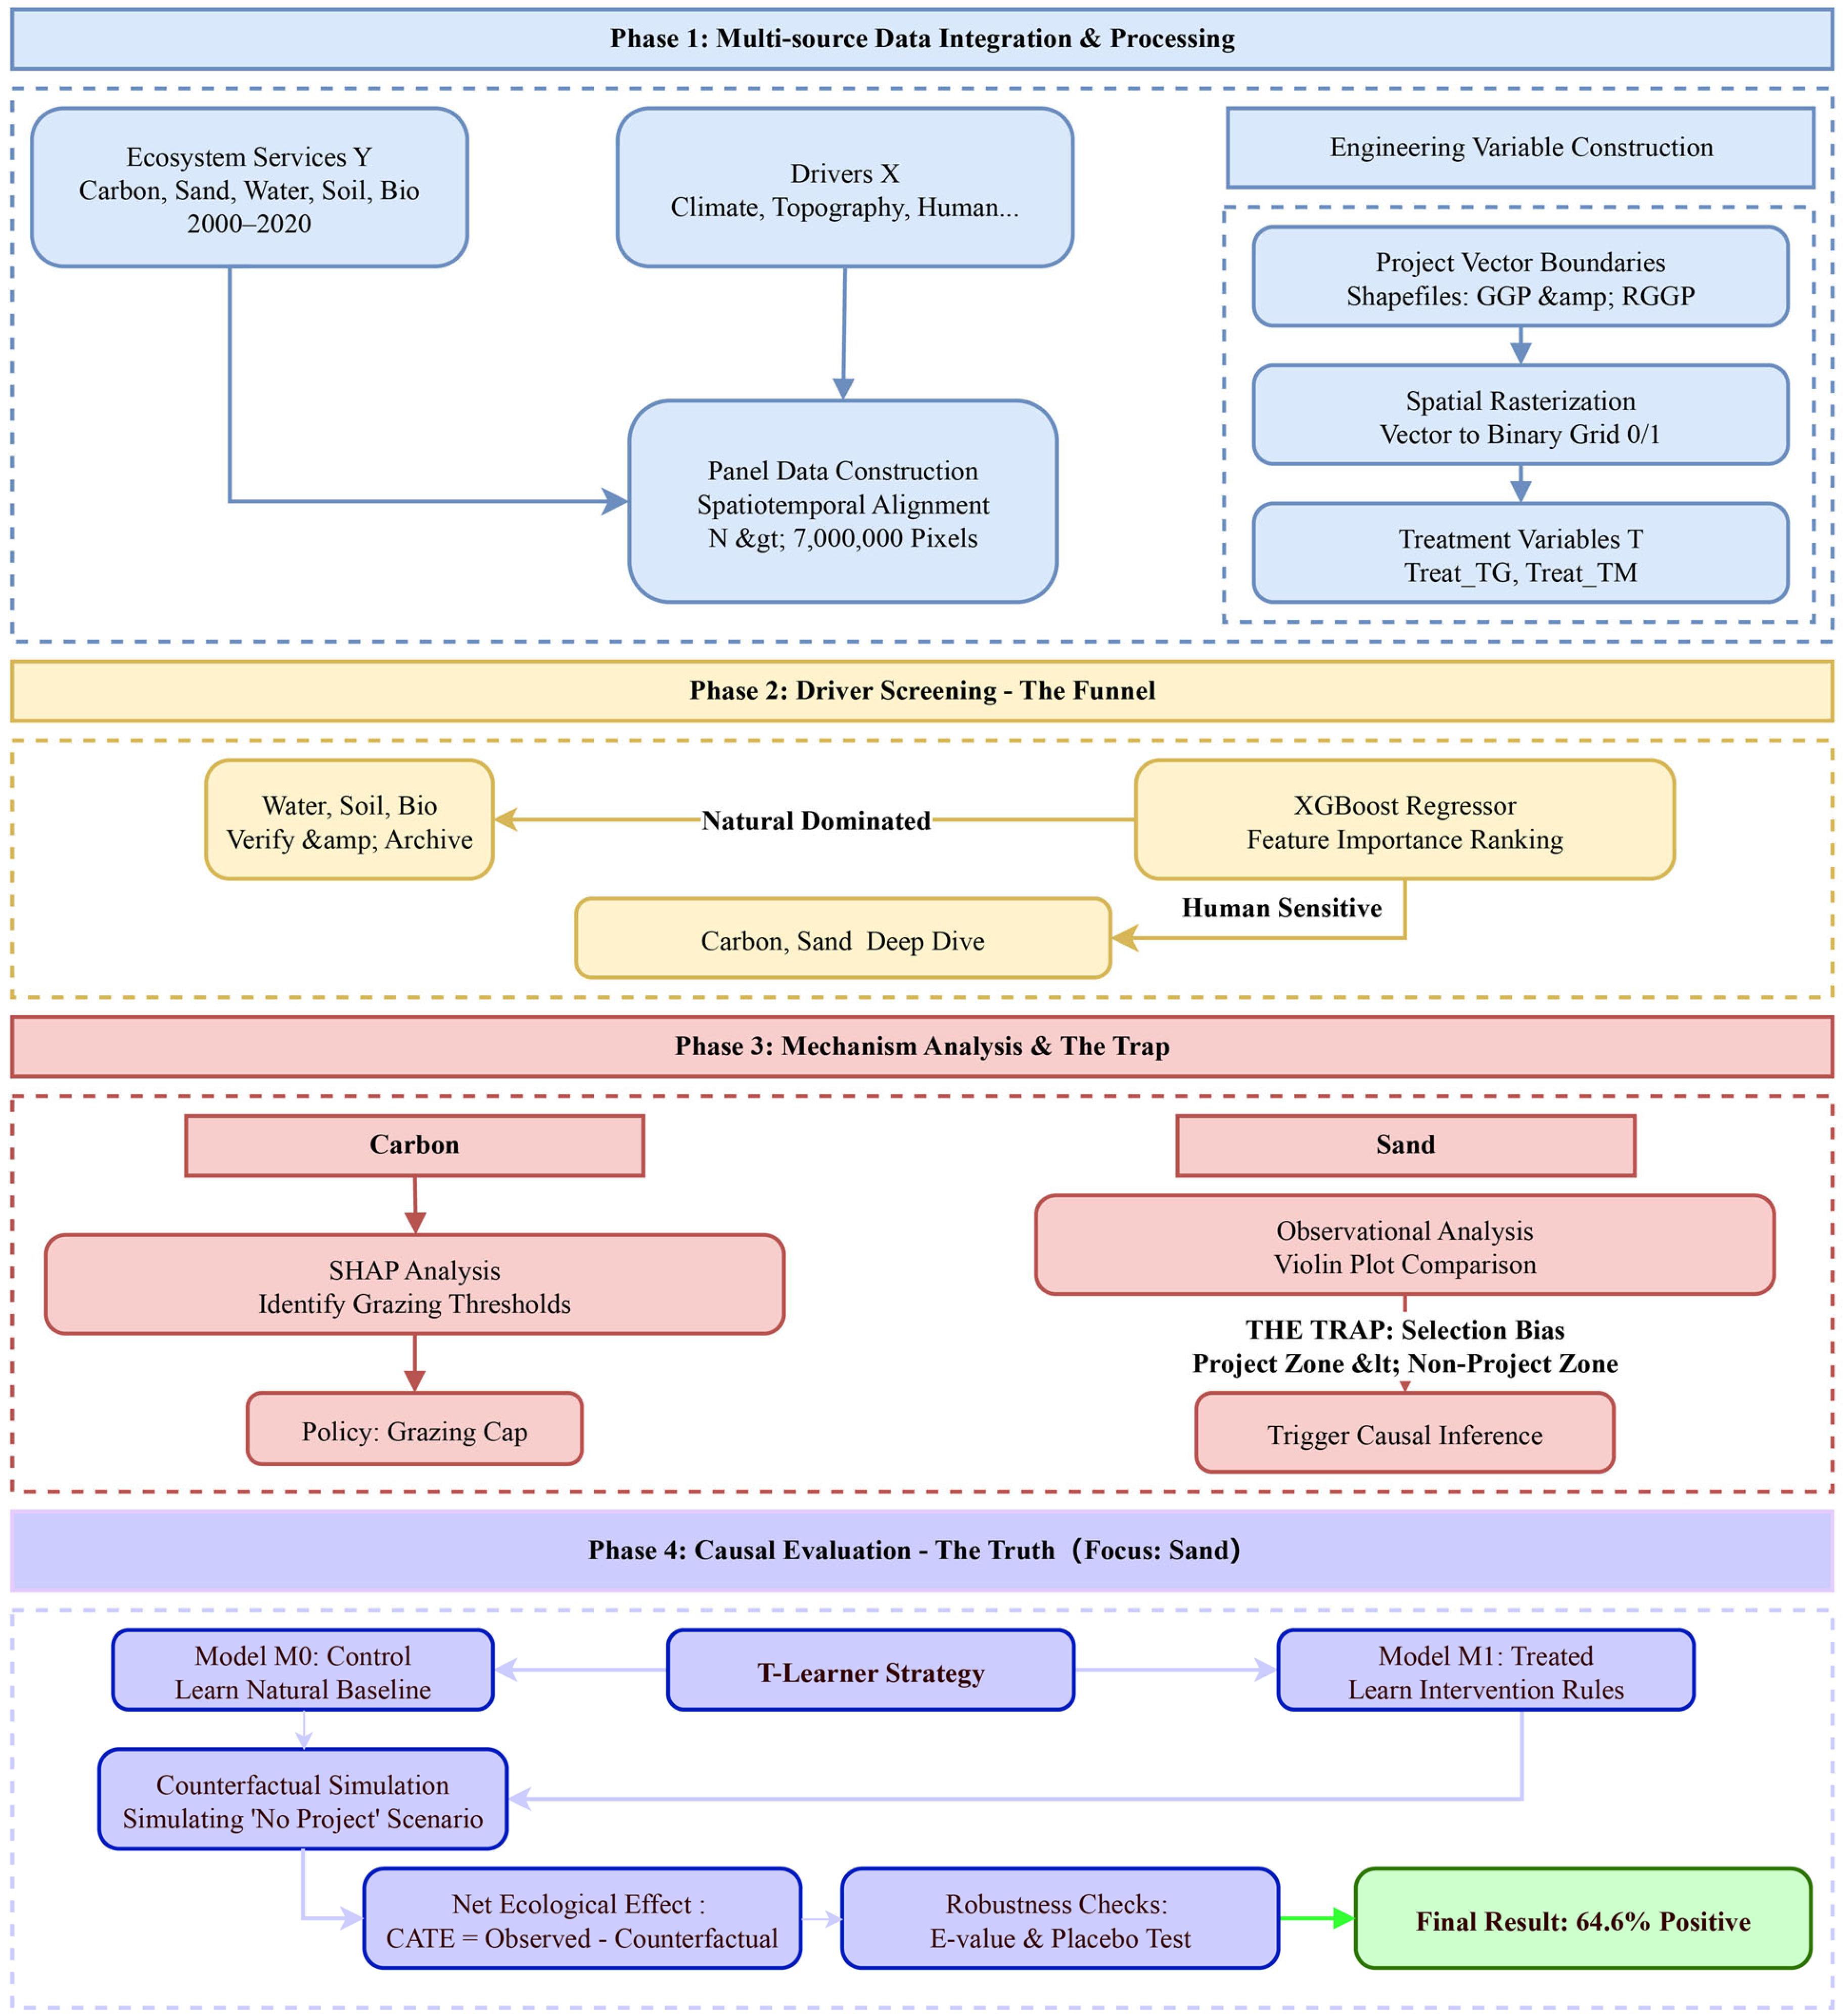
This study built a remote sensing analysis framework with causal inference to find drivers of ecosystem change and assess the results of ecological restoration interventions (Figure 2). The workflow includes four major steps: (1) integrating multi-source remote sensing and geospatial data to build a spatiotemporal panel dataset; (2) using the XGBoost algorithm for feature selection to identify the key drivers of ecosystem services; (3) using the SHAP interpretation framework to interpret the model outputs to identify response mechanisms of each factor; and (4) implementing the T-Learner causal inference approach to quantify the net ecological benefits of restoration projects while controlling for baseline environmental heterogeneity.
Figure 2.
A Framework for evaluating the net effects of ecological restoration based on causal machine learning.
2.3.1. Quantification of Ecosystem Services
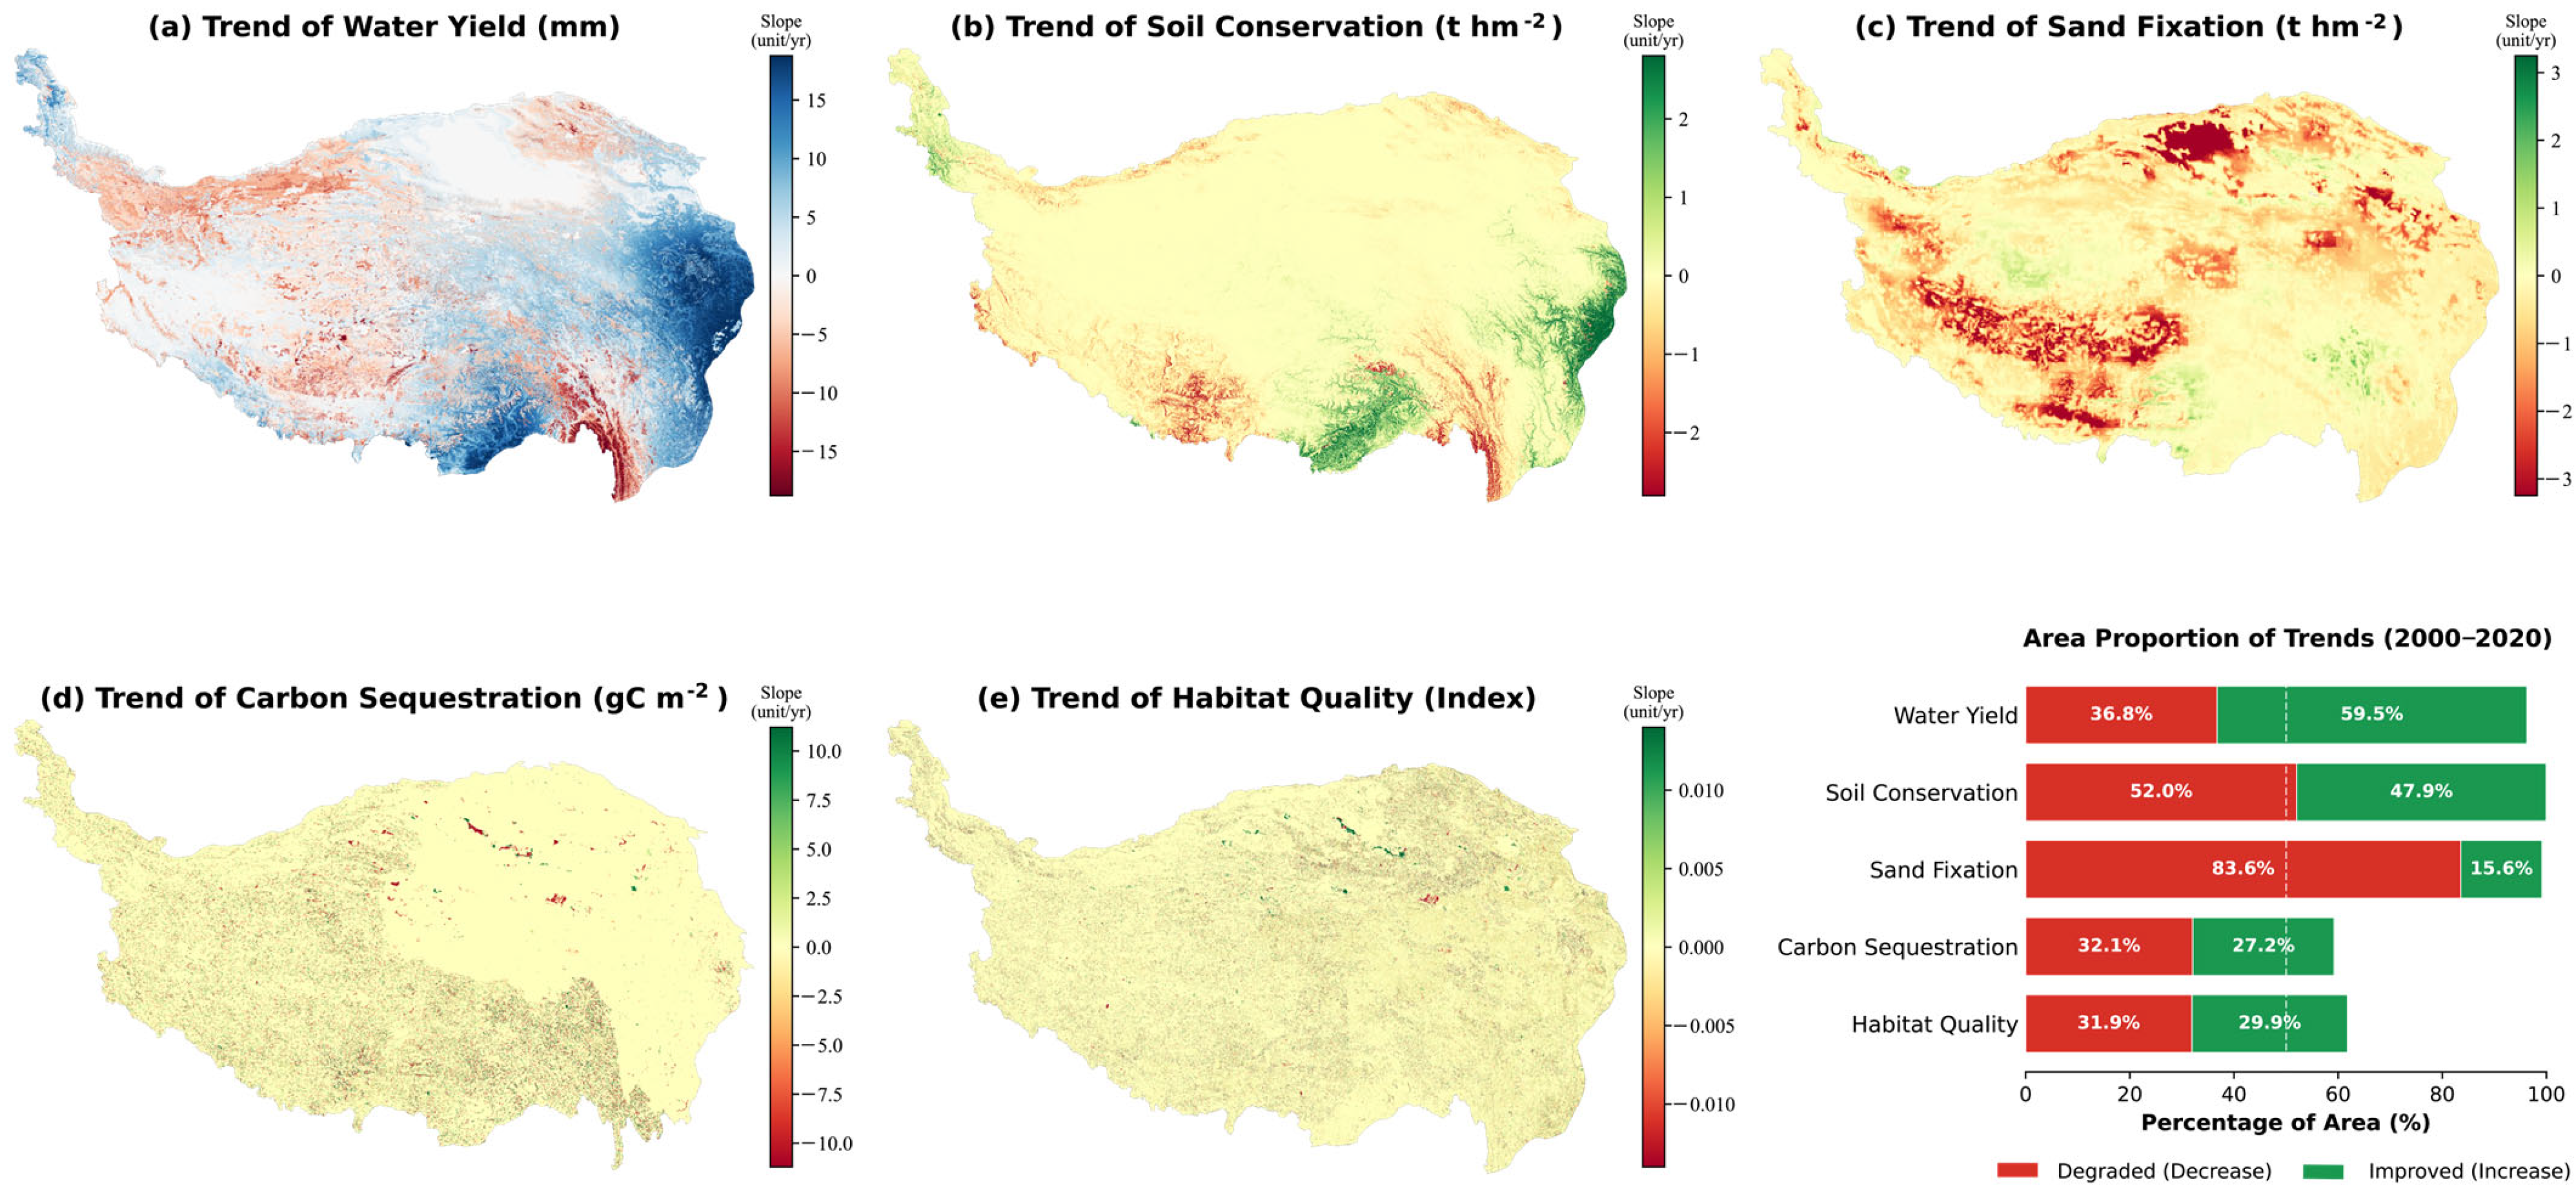
Five core indicators were chosen to reflect the ecological status of the QTP [39]: CS, SF, soil conservation (SC), HQ and WY. These indicators have been quantified with the help of standardized biophysical models using data from multiple sources of Earth observation. CS was estimated based on CASA model, SC was estimated using Revised Universal Soil Loss Equation (RUSLE) and both HQ and WY were estimated using Integrated Valuation of Ecosystem Services and Trade-offs (InVEST) model (Natural Capital Project, Stanford, CA, USA). SF was measured using the Revised Wind Erosion Equation (RWEQ), which was determined as the difference in potential wind erosion on bare soil and actual erosion under vegetated conditions. The pixel-level annual change rates of ecosystem services were estimated using the Theil–Sen slope estimator. Given the limited degrees of freedom (N = 5), we focus on the magnitude and direction of these trends to characterize the spatial dynamics of the plateau. The spatial maps and area proportions in Figure 3 incorporate all valid pixels to provide a continuous representation of the evolutionary trajectory. Detailed calculation methods, model equations and input parameters for all five services are presented in Supplementary Note S1, with additional model specifications available in [40].
Figure 3.
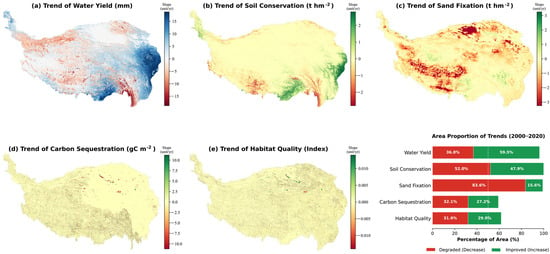
Spatiotemporal dynamics of five key ecosystem services on the QTP (2000–2020). (a–e) Spatial distribution of the annual rate of change (Theil-Sen slope) for WY, SC, SF, CS, and HQ. The color scale represents the continuous magnitude of change, where positive values indicate improvement and negative values indicate decline. (bottom right). Note: The spatial maps display the annual rate of change (Theil-Sen slope) for all valid pixels to ensure spatial continuity. The area proportions represent pixels with detectable directional changes, while pixels with negligible slopes (slope 0) are classified as stable and not included in the ‘improved’ or ‘degraded’ percentages.
2.3.2. Driver Screening with XGBoost Regressor
We used the Extreme Gradient Boosting (XGBoost) regression framework to quantify the impact of multidimensional drivers. Unlike traditional linear approaches (e.g., OLS, GWR), which assume that the variables are stationary, XGBoost is an ensemble learning algorithm based on gradient tree boosting, which can capture complex nonlinear interactions and higher-order dependencies among environmental drivers derived from satellite imagery [41,42]. The input feature space was set by continuous environmental gradients and indicators of anthropogenic pressure (Table 2). The dependent variables (Y) were the five ecosystem service indicators, and the independent variables (X) were the climatic factors, topographic variables and the human intensity indices. Categorical land use/cover data were only used in the initial quantification of ecosystem services (Section 2.3.1) and were not used in the XGBoost driver analysis to prevent sparsity problems with high cardinality categorical variables.
Table 2.
Description of variables used in the XGBoost Driver Screening and Causal Inference models.
We have taken a systematic approach to hyperparameter optimization, based on grid search, combined with five-fold cross-validation instead of relying on empirical selection. The final configuration was made to balance the predictive accuracy and the generalization of the model. Specifically, the number of estimators was set to 3000 to guarantee model convergence, and the maximum tree depth was limited to 8 (optimized within an initial range of 6–10) to capture local interaction features without overfitting. The minimum weight of the children was fixed at 5 to control the purity of the leaf nodes. The learning rate was set to 0.05, which was complemented by stochastic subsampling () to decrease variance. To mitigate overfitting in high-frequency remote sensing data, regularization parameters were explicitly tuned: , L1 regularization (), and L2 regularization ().
We thoroughly tested the robustness of the driver screening process in two ways. First, to check for possible multicollinearity, we calculated the Pearson correlation matrix of all predictor variables. The highest correlation coefficient was 0.72 (between precipitation and evapotranspiration), far below the usually accepted threshold of 0.8 (Figure S1), suggesting that multicollinearity did not bias the model. Second, in order to evaluate the stability of feature rankings, we performed a randomized stability test by retraining the model 50 times with different random seeds. The final global feature importance was computed as the average gain of these 50 iterations, with the standard deviation used to capture ranking uncertainty [43].
2.3.3. Unveiling Non-Linear Mechanisms via SHAP
Despite its high accuracy of prediction, the complex ensemble nature of XGBoost has a black box effect, which may reduce the physical interpretability of driver-response relationships in spatial data. In this regard, we used the SHAP framework. Based on the cooperative game theory, SHAP breaks down the model outputs into the marginal contributions of individual features, which can be used to understand the impact of each driver on ecosystem service responses clearly [44].
SHAP functions as an additive feature attribution method, approximating the original prediction model with an interpretable explanation model , as defined in Equation (1):
Here, represents the coalition vector, indicating the presence or absence of each feature, where denotes the total number of features. The parameter corresponds to the model’s baseline output, representing the average prediction, while denotes the SHAP value for feature , quantifying its contribution to the deviation from the mean prediction.
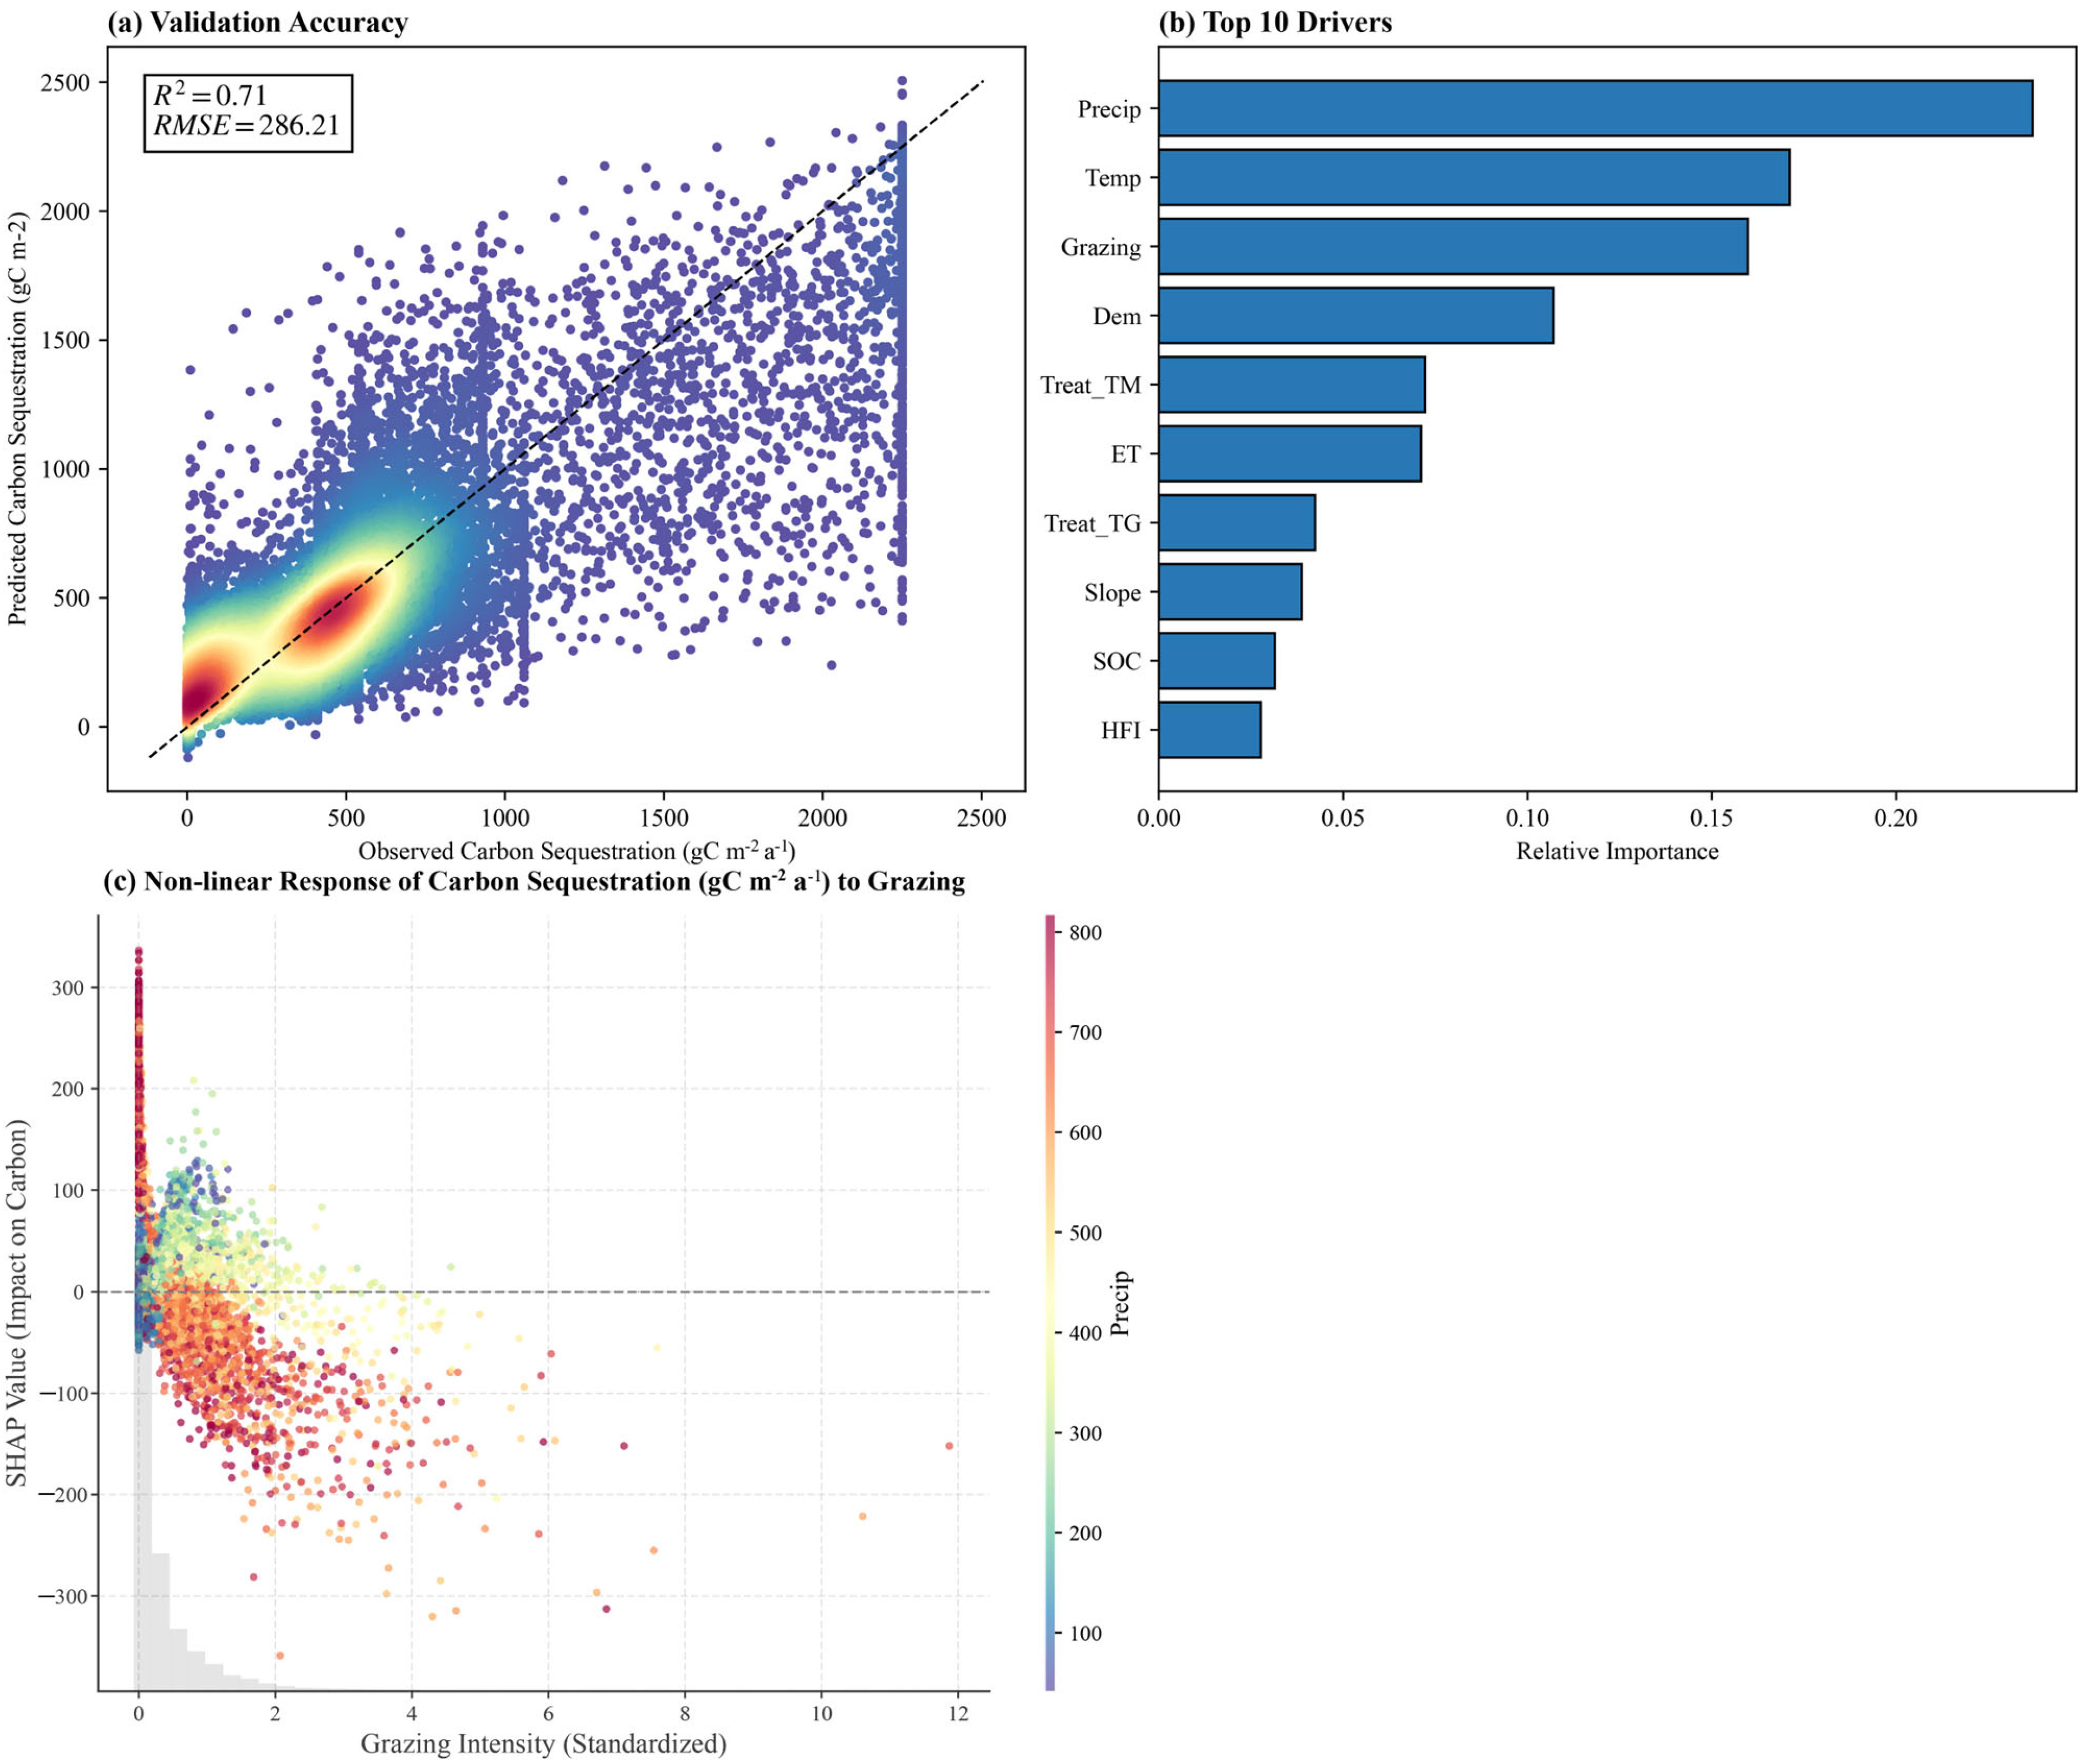
We also used SHAP dependence plots that could be used to visualise the non linear response of ecosystem services to anthropogenic pressures. We determined ecological thresholds or tipping points in which the direction or strength of influence of a driver is altered substantially by plotting feature values on the x-axis against the corresponding SHAP impact values on the y-axis [45]. In order to explain the underlying trends, we used the SHAP scatter plots, which were fitted with a polynomial (see Figure 4 in Results).
Figure 4.
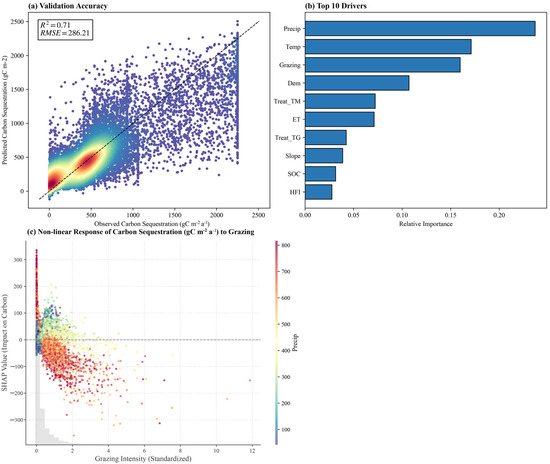
Predictive modeling and non-linear driver mechanisms for Carbon Sequestration (CS). (a) Model validation. (b) Top 10 dominant drivers by XGBoost. (c) SHAP dependence plot for Grazing Intensity. In panel (a), the color gradient from blue to red indicates increasing density of data points, and the black dashed line represents the 1:1 line of perfect prediction. In panel (c), the points are colored by annual precipitation (Precip), and the horizontal gray dashed line at zero indicates no impact on carbon sequestration.
2.3.4. Causal Inference Strategy: The T-Learner Framework
Ecological engineering projects are normally performed in degraded areas, which is likely to introduce selection bias in traditional observational comparisons. In order to strictly measure the net ecological benefits of restoration, we used the T-Learner (Two-Learner) meta-algorithm in a potential outcomes framework. In contrast to single-model methods, which consider interventions as dummy covariates, the T-Learner fits two distinct response functions, which allows a more precise approximation of pixel-level counterfactual outcomes [46].
We define as the observed outcome (e.g., sand fixation) for a given pixel , and as the vector of environmental covariates, including climatic and topographic drivers. The binary variable represents treatment status, with () for pixels located within ecological restoration project boundaries and for pixels in natural reference or control areas. The observed outcome can be expressed in terms of potential outcomes under treatment and control conditions, as formalized in Equation (2) [47].
Our primary objective is to estimate the Conditional Average Treatment Effect (CATE), denoted as . This metric represents the expected difference in outcomes for a given set of covariates, effectively controlling for confounding effects arising from environmental heterogeneity:
The implementation was performed in two stages. The dataset was initially subdivided by intervention status into a treated group () and a control group () using the boundaries of project vectors. The independent base learners , were then trained on XGBoost to predict the different response mechanisms of the natural and engineered systems:
Second, we produced a counterfactual prediction of the hypothetical outcome of the ecosystem service in the area of the restoration project (), had the project not been implemented. The CATE of treated pixels was then computed as the difference between the measured result and the estimated counterfactual:
A positive estimate of indicates a net gain in ecosystem services directly attributable to the engineering intervention, independent of natural background fluctuations. This counterfactual inference framework forms the core of causal identification in the study.
2.3.5. Diagnostic Protocols and Robustness Checks
In order to achieve the validity of causal inferences and reliability of the selection of driver factors, we adopted a strict diagnostic protocol to test model assumptions, control confounding, and test algorithmic stability. To identify the causal association, we checked the overlap (co-support) assumption by looking at the propensity score distributions of treatment and control groups (Figure S3), where we made sure that the control units chosen to reflect the potential counterfactual conditions are correctly represented. We also assessed covariate balance with standardized mean differences, which are graphically represented in a balance plot (Figure S4), and showed that the T-Learner framework is effective in reducing systematic inter-group differences. To select driver factors, we evaluated the stability of the XGBoost model by retraining the model 50 times with varying random seeds and computing the mean and standard deviation of the feature importance values (Figure S2), which proves the stability of the selection outcomes.
3. Results
3.1. Spatiotemporal Dynamics of Ecosystem Services
We estimated the slope of annual change rates in pixels at the pixel level between 2000 and 2020 using the Thiel–Sen slope estimation method. The findings indicate that there is strong spatial heterogeneity in the dynamics of ecosystems, with extensive vegetation recovery and the corresponding erosion of certain ecosystem service functions (Figure 3).
The regional tendency of warmer and wetter climatic conditions has led to widespread improvements in WY and HQ. WY capacity has been rising at a steady rate of 5.25 mm yr−1 with gains occurring disproportionately in the southeast and central parts of the country. Statistical analysis (Figure 3, bottom right) shows that 59.5% of the region shows an upward trend, and enhanced precipitation has effectively increased the hydrological regulation capacity of the basin. SC capacity reveals a similar positive trend (+0.68 t hm−2 yr−1), although improvements are still mostly limited to the eastern agro-pastoral transition zone. It is noteworthy that 52.0% of the region still has degraded SC capacity.
The trend in SF functions is in marked contrast to the general greening dynamics on the plateau. This region shows a constant yearly decrease of 0.77 t hm−2 yr−1. Despite the large-scale ecological restoration initiatives, 83.6% of the study area still exhibits signs of degradation (Figure 3c). Climatic stressors such as enhanced wind regimes and increasing aridification in the western plateau are offsetting local recovery efforts. CS data further underlines this complexity of ecosystem responses with an average annual decrease of 0.32 g C m−2, which contradicts the general trend of vegetation greening. While eastern meadow regions were stable or improved, about 32.1% of the study area, mostly western alpine steppes, showed significant decline. This disparity between greening of vegetation and loss of regulatory services highlights the importance of quantitative differentiation between natural climatic drivers and anthropogenic interventions.
3.2. Predictive Modeling and Driver Screening Strategy
An XGBoost regression model was fitted to all five ecosystem services, which showed there is a clear separation between climate-driven and human-influenced services. For water yield, SC and habitat quality, natural climatic variables were regularly the main drivers. Precipitation and temperature were ranked highest in importance, explaining most of the variance of the model (see Supplementary Figures S5–S7). In the driver screening analysis for Water Yield (WY), while meteorological factors remained influential, the intervention variables Treat-TG and Treat-TM emerged as the 2nd and 4th most important drivers, respectively (Figure S5). This highlights that restoration activities on the Qinghai–Tibet Plateau have a non-negligible impact on hydrological processes, explaining a significant portion of WY variability alongside climatic shifts. These response patterns are consistent with known ecological theories [48,49,50,51,52], supporting that the regional recovery of these services is largely controlled by natural factors.
CS and SF have a high sensitivity to human activities in a multi-featured spatial context. Analysis of CS drivers suggests that although climate is the most important driver, grazing intensity has become the dominant anthropogenic factor, the third most important in terms of overall contribution (Figure 4b). This underlines the great regulatory power of grazing on carbon sink functionality. To quantify this relationship, we used SHAP dependency plots to describe its nonlinear response (Figure 4c). The results show a strong compensatory growth effect where grazing intensity shows a positive relationship with carbon accumulation below 0.72 SU/ha, but once this threshold is surpassed the SHAP values quickly drop sharply into the negative range. This finding identifies a sustainable grazing threshold, which outlines the range within which grazing can be compatible with carbon sequestration, while intensities above this threshold cause rapid functional degradation.
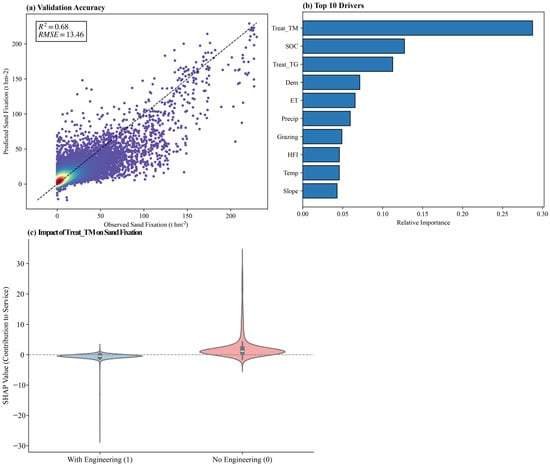
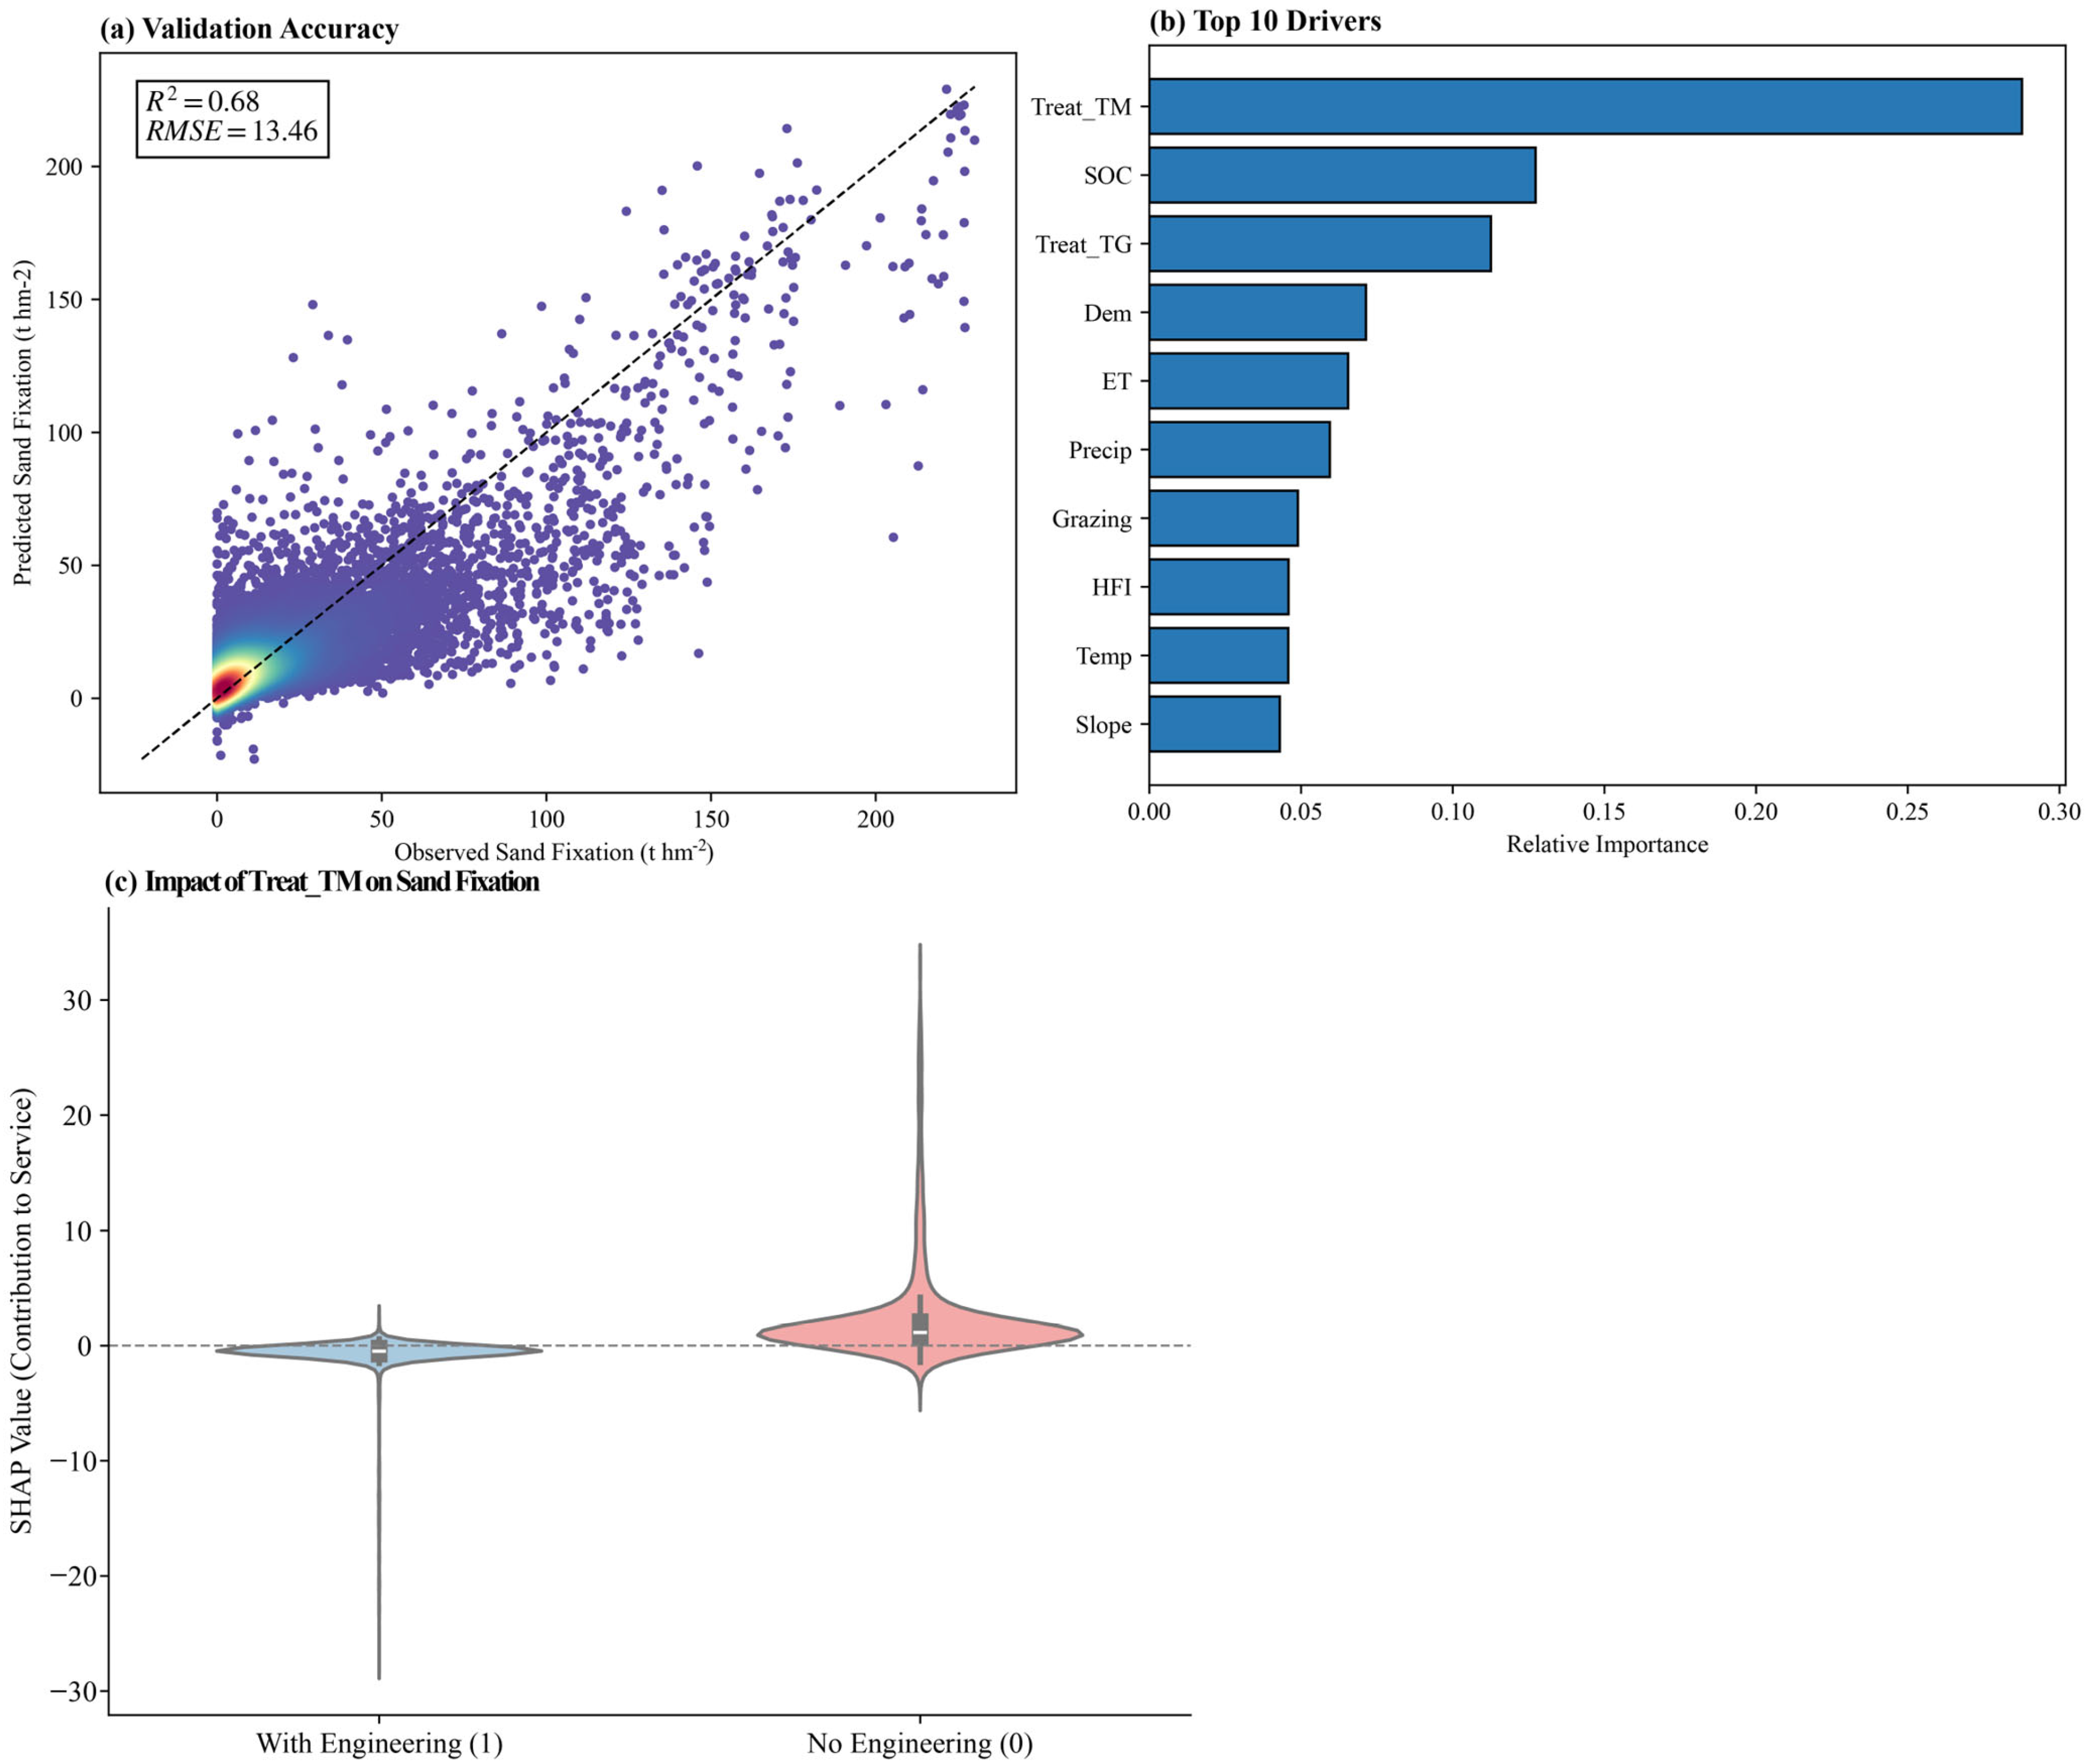
In the attribution analysis of the functions of windbreak and sand fixation, there are distinctive patterns in the results. The policy intervention variable, Treat_TM (RGGP), had the highest feature importance (Figure 5b) and a more significant influence than natural variables such as soil organic carbon and topography. This finding suggests that ecological engineering has become the major cause of the spatial differentiation of wind erosion in the plateau. However, an apparent selection bias is revealed in the analysis of observational data: ecosystem service values in engineered areas are often lower than they are in natural areas (Figure 5c). This paradox comes from the preference towards implementing ecological engineering in degraded areas with historically low baseline values. Accurately measuring the true efficacy of ecological restoration therefore requires going beyond predictive feature importance and using causal inference at the empirical level.
Figure 5.
Predictive modeling and observational biases for Sand Fixation (SF). (a) Model validation plot. (b) Top 10 dominant drivers. (c) A violin plot, engineering zones (Treat_TM = 1), natural zones (Treat_TM = 0). In panel (a), the color gradient represents the density of data points (warmer colors indicate higher density), and the black dashed line indicates the 1:1 perfect prediction line. In panel (c), the blue and pink violins represent the distribution of SHAP values for areas with and without engineering projects, respectively, and the gray dashed line at zero indicates a neutral contribution to the service.
3.3. Causal Evaluation of Ecological Restoration
Although predictive models highlight the importance of ecological restoration (Treat_TM), comparisons of observations show a significant selection bias due to differences in baseline conditions. To address this we applied the T-Learner causal inference framework.
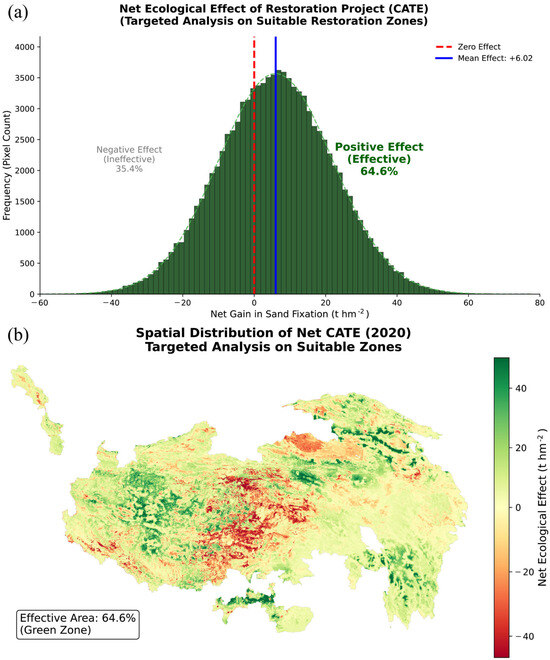
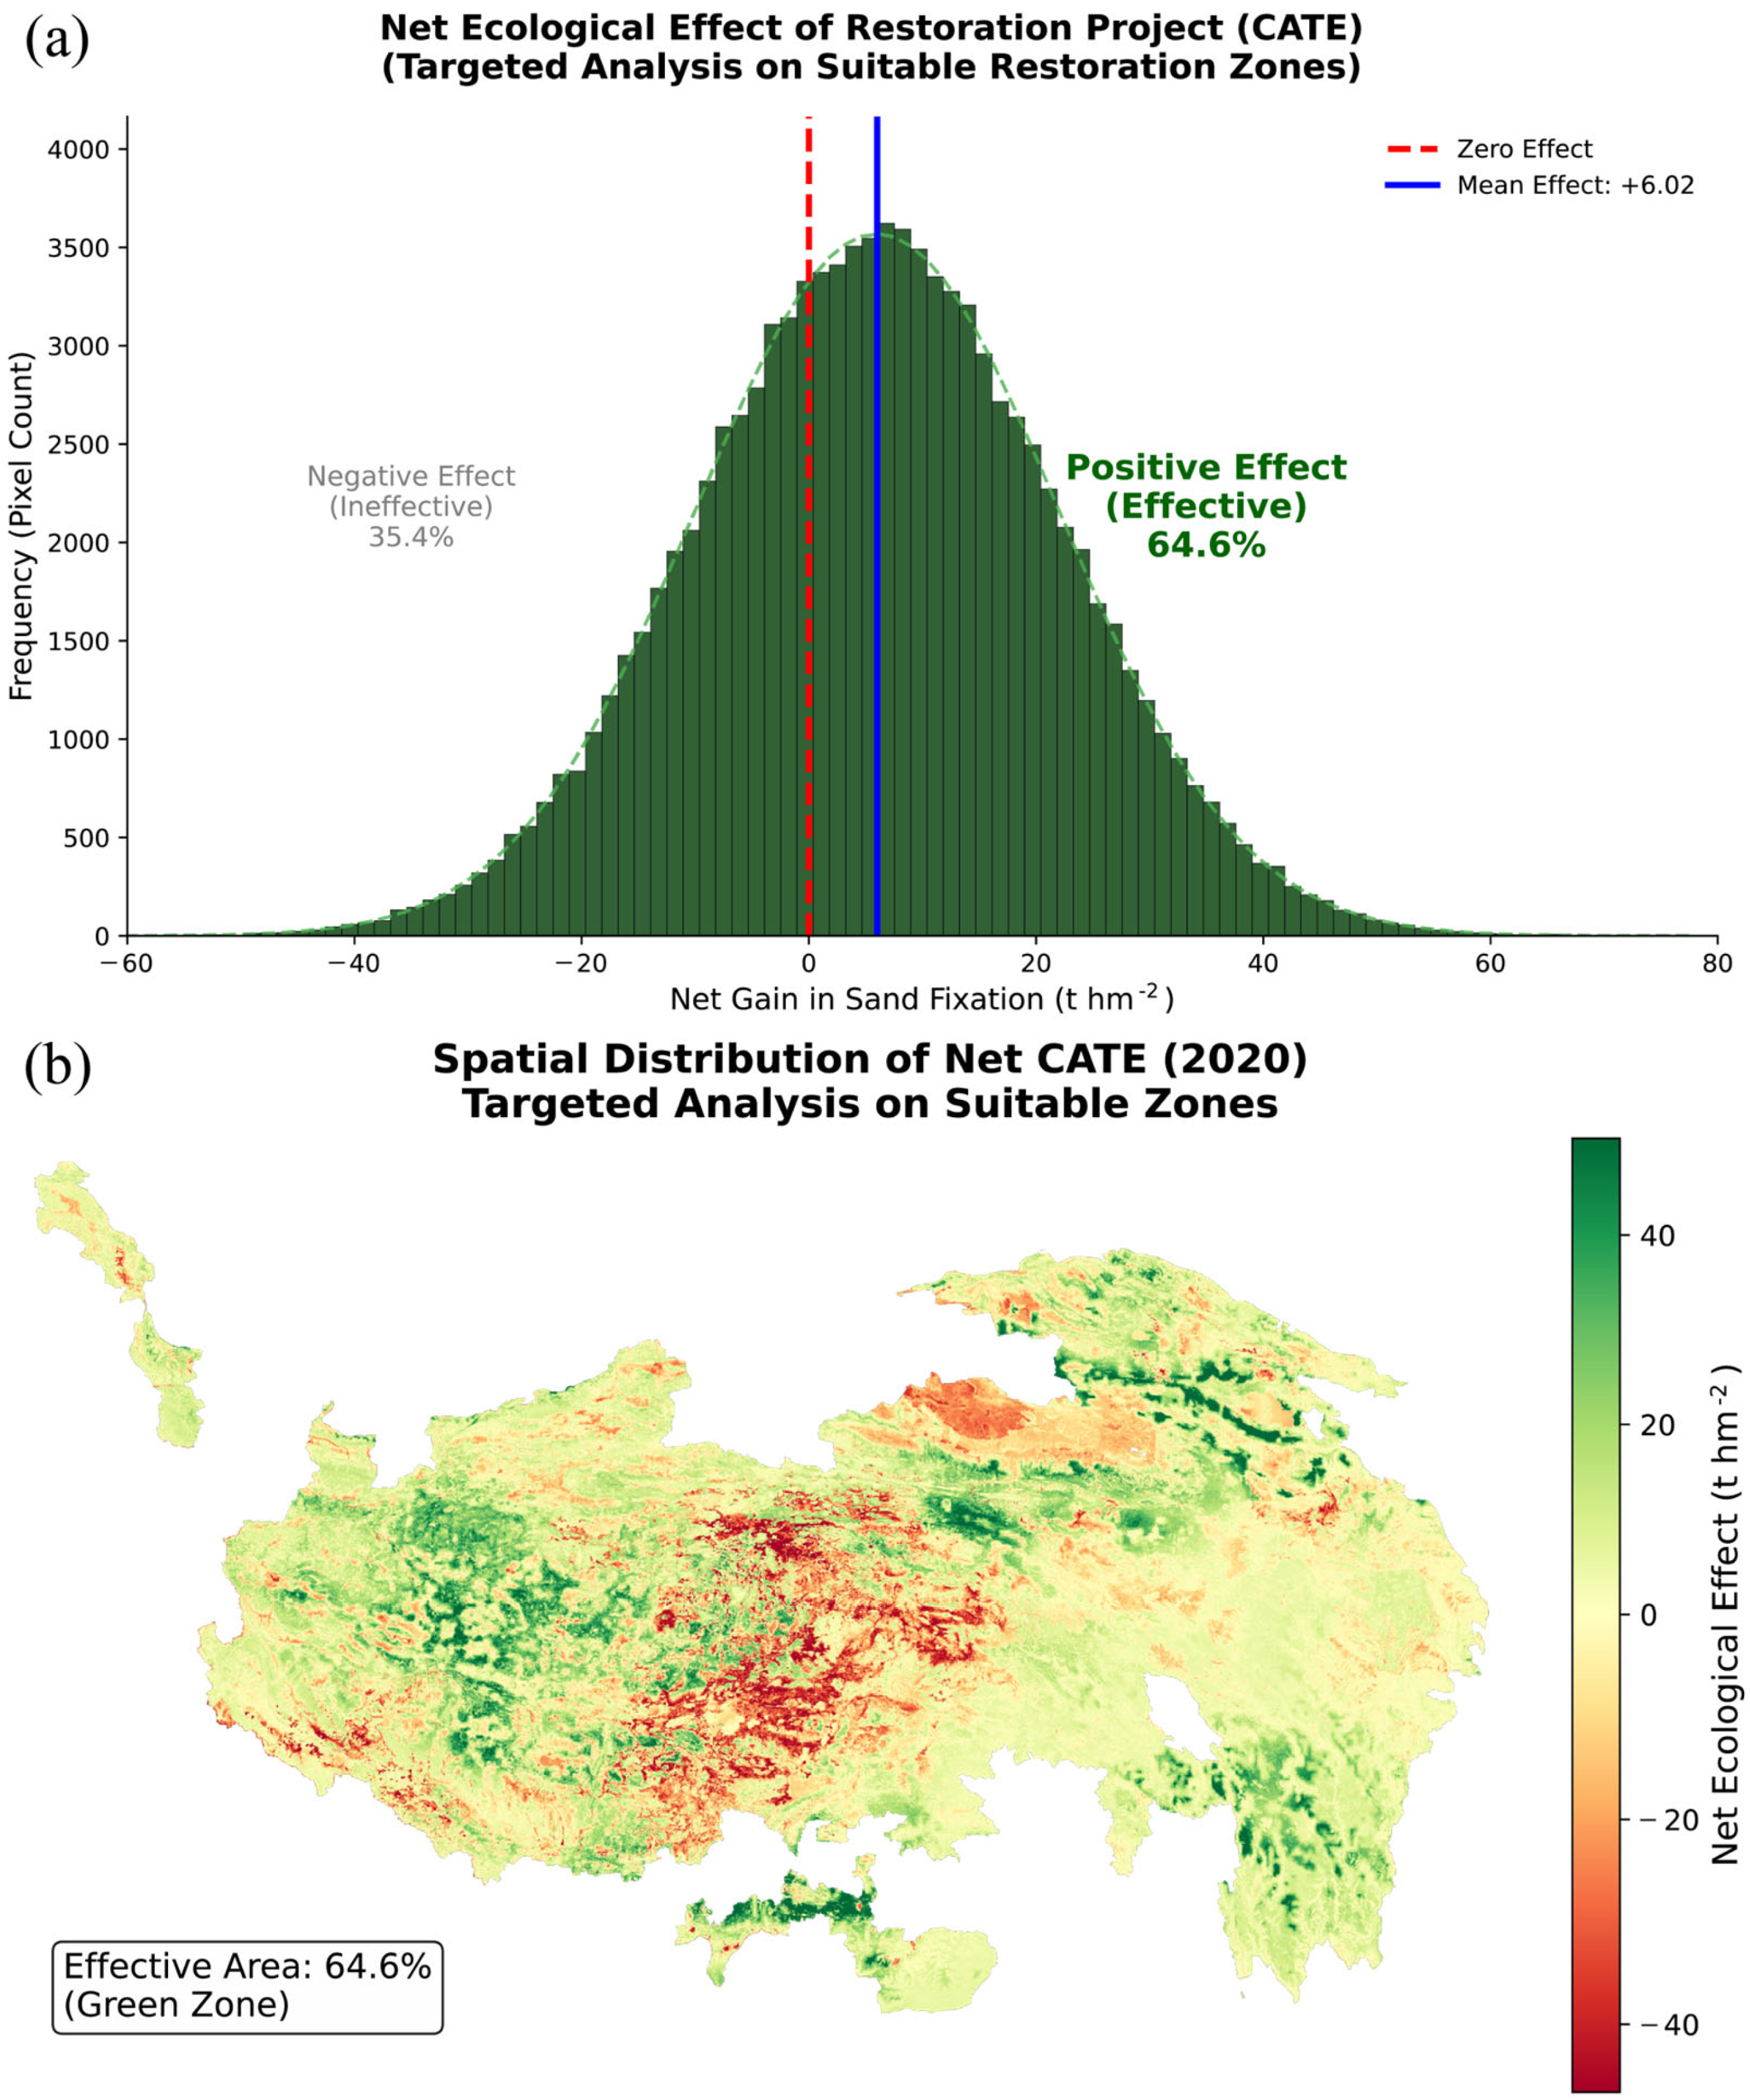
After controlling for heterogeneity of the environment, counterfactual analysis showed that the treatment effect was significant and positive. Ecological engineering interventions produced an average conditional mean treatment effect of +6.02 t hm−2 for SF capacity (Figure 6a). This value is the net treatment effect, the difference between observed outcomes and the counterfactual scenario where there was no intervention. Spatially, 64.6% of project areas showed positive net effects (green zones in Figure 6b), showing that ecological restoration measures were effective at increasing ecosystem resilience against wind erosion compared to natural baseline conditions in most managed areas.
Figure 6.
Causal evaluation of the net ecological effect of the RGGP on SF plot. (a) Histogram of (CATE). (b) Spatial distribution of the net ecological effect (CATE) in 2020. Green areas indicate effective zones. Red areas indicate ineffective zones.
Nevertheless, it is important to reconcile seemingly contradictory observations; although the project has a positive net effect, the overall temporal trend in windbreak and SF functions is still predominantly negative, with 83.6% of areas showing degradation (Figure 3c). This means that the RGGP works primarily to mitigate rather than absolute reversal of degradation. Macro-level stressors such as increasing aridification and increasing wind patterns in the western Tibetan Plateau have reduced the potential baseline of the region. Within this context, the positive conditional mean treatment effect shows that, in the absence of the RGGP intervention, the amount of degradation would have been much higher. While incapable of fully countering powerful climatic pressures, the engineering measures have been effective in slowing the rate of functional loss.
The spatial heterogeneity of CATE also further emphasizes the biophysical limits of restoration (Figure 6b). Negative net effects (red zones, accounting for 35.4%) are concentrated in extremely arid inland regions and ultra-high-altitude zones, suggesting environmental constraint thresholds. Beyond these thresholds, artificial interventions such as fencing, enclosure or reseeding not only find it difficult to promote ecological recovery but may worsen soil moisture deficits. Finally, to assess the robustness of these causal estimates against unobserved confounding and spurious correlations, we conducted rigorous diagnostic checks. The E-value analysis (Table S1) yielded a value of 1.94, suggesting that an unmeasured confounder would need a strong risk ratio (>1.94) to explain away the observed effect. Furthermore, the Placebo Test (Table S1) with 100 randomized runs showed a null effect, confirming that the detected restoration benefits are statistically significant () and not artifacts of random noise.
4. Discussion
4.1. Divergent Driving Mechanisms of Ecosystem Services
Our analysis of dominant drivers shows a clear split of ecosystem services on the QTP in climate-driven and anthropogenically influenced ecosystem services. Ecosystem services in the climate-controlled group are mainly controlled by precipitation and temperature, as suggested by our XGBoost models, in agreement with the satellite-observed trends of warming and wetting in recent decades [53]. In our analytical framework, Water Yield (WY) was initially positioned as a background hydrological variable to account for macro-scale hydro-climatic gradients, thereby allowing for a more precise isolation of the net restoration effects on Sand Fixation (SF) and Carbon Sequestration (CS). However, the substantial feature importance attributed to intervention variables in the WY driver ranking warrants a more rigorous interpretation. The observed SHAP dependence patterns suggest that ecological engineering interventions modulate WY through the interplay between vegetation dynamics and hydrological processes. Specifically, while increased vegetation cover promotes soil infiltration, it simultaneously drives higher evapotranspiration (ET) losses. The removal of abiotic limitations to plant growth resulting from warmer and wetter conditions has led to extensive recovery of vegetation [54,55]. In these areas, human interventions have a secondary role, which may alter local service provision but are subordinate to overarching climatic controls [56]. Consequently, the observed general enhancement of ecosystem services is not so much due to on-the-ground actions but to favorable climatic conditions captured by long-term Earth observation.
CS showed a strong response to pastoralism in the spatial feature space, which revealed a nonlinear pattern in line with the concept of compensatory growth in alpine systems. Our SHAP analysis revealed a sustainable grazing threshold, beyond which more grazing is harmful. At low grazing intensities, herbivory seems to be associated with carbon accumulation, possibly via compensatory growth: moderate grazing stimulates photosynthesis, eliminates senescent tissue, and improves nutrient cycling, which enhance spectral indices of net primary productivity [57]. However, if grazing pressure is above the threshold, biomass is removed at a faster rate than it can regenerate, resulting in soil compaction and subsequent decrease of carbon stocks, which can be detected in vegetation signals [58,59]. These results refute the simplistic view that grazing is inherently detrimental and highlight the importance of density-dependent management that utilizes the ecological benefits of moderate grazing.
SF showed a clear pattern with the restoration project variable (Treat_TM) having greater importance than natural variables in our machine learning analysis. This points to the peculiar physical mechanisms that control the process of wind erosion control: although biological services take time to develop physiologically, SF depends to a large extent on surface roughness and effective ground cover, parameters which are highly sensitive to remote sensing detection [60]. The RGGP uses fencing and reseeding to exclude livestock, stabilize the soil surface and break the cycle of degradation to enhance SF even under unfavorable climatic conditions [61].
4.2. Disentangling the Observational Selection Bias: A Causal Perspective
We found a counterintuitive result: the absolute SF was lower in restoration zones than in natural zones. This is a classic example of observational selection bias due to endogeneity [62], which is a common challenge in large-scale remote sensing assessments. As mentioned in environmental policy, decisions are not usually random and interventions are often focused on the worst degraded areas. Our satellite-based observational analysis (Figure 5c) picked up these baseline differences instead of the real treatment effect, giving a false impression of project failure. Traditional models, such as OLS, do not normally take this selection bias into account, leading to underestimation or misjudgment of the engineering efficacy based on surface monitoring [63]. To overcome this, we used the T-Learner framework, to build a counterfactual scenario for each treated pixel using time series of historical Earth observation data [64]. This approach enabled us to eliminate the confounding effect of the environmental background and isolate the net ecological gain (+6.02 t hm−2), moving our study from correlational to causal attribution and providing the rationale for investing in restoration efforts even in ecologically sensitive regions.
At the macro scale, however, the positive causal effect is in contrast to monitoring data on windbreak and SF functions, with 83.6% of the region showing a degradation trend. This discrepancy requires a re-evaluation of the success of ecological restoration on the Tibetan Plateau. The general degradation trend can be attributed to large-scale abiotic stressors, wind pattern changes and persistent aridification, which reduce the theoretical soil retention potential of the region [65]. In this context, the positive CATE values suggest that the RGGP does not cause absolute reversal but rather plays a critical role in reducing degradation (see conceptual illustration in Figure S8). The engineering measures acted like a brake, greatly slowing the rate of decline of ecosystem services compared to a non-intervention scenario predicted by counterfactual models [66]. This distinction is especially important under a changing climate. Remote sensing evaluation standards should therefore be based on relative success, how well degradation is slowed compared to a counterfactual baseline, rather than on “absolute” recovery as reflected in vegetation trends [67].
4.3. Spatial Heterogeneity and Adaptive Management Implications
The net ecological effect shows a strong spatial heterogeneity, as has been revealed by our pixel-level mapping, raising questions regarding the effectiveness of a uniform approach to restoration across the entire plateau. Positive CATE values are mostly found in semi-arid transition belts, suggesting that engineering interventions are most effective in particular climatic windows where there is sufficient water to support artificial vegetative growth. On the other hand, negative net effects are concentrated in hyper-arid inland and high altitude areas, pointing to biophysical constraints that can be detected using satellite-based drought monitoring. In water-limited ecosystems, aggressive biological measures are counter-productive and instead of mitigating wind erosion, they deplete limited soil moisture and worsen hydrological deficits [68,69]. Accordingly, ecosystem management should avoid such pitfalls. Optimal intervention strategies should move from broad expansion to precise targeted measures based on high-resolution remote sensing. We recommend limiting active restoration efforts to the identified maximum benefit zones (green areas in the causal effect map) while implementing a conservation-first approach in biophysically constrained zones (red areas), with a focus on nature reserve establishment in order to minimize human disturbance. This strategy minimizes waste of resources and irreversible ecological damage, which highlights the importance of spatial intelligence for the optimization of ecological patterns.
4.4. Methodological Advantages, Uncertainties, and Future Directions
This research proposes a novel methodological framework, which combines explainable artificial intelligence (XGBoost-SHAP) and causal inference (T-Learner) methods, to systematically separate the confounding effects of climate change and human interventions. Unlike traditional approaches to regression, which have difficulty with complex nonlinear interactions [43] and cannot adequately control for the selection bias common in non-randomized ecological engineering studies [63], our framework is able to identify nonlinear grazing thresholds and isolate the net ecological benefits of restoration from degraded baselines using a counterfactual approach [46]. Nevertheless, there are inherent limitations because of constraints on the scale of research and the availability of data.
Regarding spatial scale, this study has standardized all the datasets to 500 m resolution. Although there is some uncertainty in downscaling 1 km climate data, we believe this is a necessary trade-off. A resolution of 500 m is necessary to maintain the granularity of ecological engineering implementation (usually fragmented patch distributions) and to maintain the fidelity of the vegetation index signals. Since the climate variables are background fields at the macro-scale, the error introduced by the bilinear interpolation is small in comparison to the information loss that would occur by upscaling engineering heterogeneous data to the 1 km resolution. In defining intervention variables, we used a static binary variable (2000–2020) to represent the RGGP, as opposed to a time-varying dynamic variable (), because of the lack of publicly available spatially explicit data on the exact year of project implementation at the pixel level across the plateau. Consequently, our CATE estimates should be viewed as the “accumulated long-term effect” of policy exposure rather than an immediate annual response. Future research should focus on the digitization of archival records of engineering projects to allow for Staggered Difference-in-Differences (DID) designs [70], which would allow for more precise temporal decomposition of policy effects.
5. Conclusions
We have developed a causal-aware framework based on multi-source Earth observation data to analyze the ecosystem services on the Qinghai–Tibet Plateau. Our results show that climate warming and wetting observed by satellites were the main drivers of the recovery of water and biological resources. In contrast, RGGP was the greatest factor for sand fixation, more important than natural drivers. By using pixel-level counterfactual evaluation, we were able to correct for the observational selection bias that was present in the data, and found that the engineering intervention produced a positive net ecological gain of +6.02 t hm−2. Rather than creating an absolute reversal of degradation, the project served as a critical mechanism in mitigating environmental stressors. Notably, the detection of non-responsive areas, representing 35.4% of the area, highlights the biophysical limits of restoration in hyper-arid environments. Consequently, future management strategies should move away from homogeneous expansion towards spatially adaptive strategies based on remote sensing, optimizing the location of ecological security barriers.
Supplementary Materials
The following supporting information can be downloaded at: https://www.mdpi.com/article/10.3390/rs18030504/s1, Note S1: Detailed quantification methods for the five ecosystem services (WY, SC, SF, CS, HQ). Figure S1: Pearson correlation matrix of environmental predictors. Figure S2: Stability test of feature importance rankings across 50 random runs. Figure S3: Propensity score overlap diagnostics (Common Support). Figure S4: Covariate balance check (Love Plot). Figure S5: Driver attribution and model performance for Water Yield (WY). Figure S6: Driver attribution and model performance for Soil Conservation (SC). Figure S7: Driver attribution and model performance for Habitat Quality (HQ). Figure S8: Conceptual illustration of the “Mitigating Degradation” function. Table S1: Sensitivity analysis (E-values) for unmeasured confounding.
Author Contributions
Conceptualization, Z.L. and E.D.; methodology, Z.L.; software, Z.L.; validation, Z.L., E.D., S.X. and L.Z.; formal analysis, Z.L.; investigation, Z.L.; resources, E.D.; data curation, Z.L.; writing, original draft preparation, Z.L.; writing, review and editing, Z.L., E.D., S.X. and L.Z.; visualization, Z.L. and H.G.; supervision, L.Z. and H.G.; project administration, E.D.; funding acquisition, E.D. All authors have read and agreed to the published version of the manuscript.
Funding
This research was funded by Key R&D Program of Xizang Autonomous Region (Grant No. XZ202401ZY0089, XZ202501ZY0074, XZ202501ZY0091, XZ202401ZY0043); Science and Technology Projects of Lhasa, Xizang Autonomous Region (Grant No. LSKJ202436); Science and Technology Projects of Xizang Autonomous Region (Grant No. XZ202401JD0014); National Natural Science Foundation of China (Grant No. U23A2007); Natural Science Foundation of Xizang Autonomous Region (Grant No. XZ202401ZR0087).
Data Availability Statement
Data will be made available on request.
Acknowledgments
We gratefully acknowledge the constructive comments from the editors and reviewers, which have significantly contributed to the improvement of this paper.
Conflicts of Interest
The authors declare no conflicts of interest.
References
- Yao, T.; Bolch, T.; Chen, D.; Gao, J.; Immerzeel, W.; Piao, S.; Su, F.; Thompson, L.; Wada, Y.; Wang, L.; et al. The imbalance of the Asian water tower. Nat. Rev. Earth Environ. 2022, 3, 618–632. [Google Scholar] [CrossRef] [Scilit]
- Yao, T.; Thompson, L.; Yang, W.; Yu, W.; Gao, Y.; Guo, X.; Yang, X.; Duan, K.; Zhao, H.; Xu, B.; et al. Different glacier status with atmospheric circulations in Tibetan Plateau and surroundings. Nat. Clim. Chang. 2012, 2, 663–667. [Google Scholar] [CrossRef] [Scilit]
- Immerzeel, W.W.; Lutz, A.F.; Andrade, M.; Bahl, A.; Biemans, H.; Bolch, T.; Hyde, S.; Brumby, S.; Davies, B.J.; Elmore, A.C.; et al. Importance and vulnerability of the world’s water towers. Nature 2020, 577, 364–369. [Google Scholar] [CrossRef] [Scilit] [PubMed]
- Yao, T.; Xue, Y.; Chen, D.; Chen, F.; Thompson, L.; Cui, P.; Koike, T.; Lau, W.; Lettenmaier, D.; Mosbrugger, V.; et al. Recent Third Pole’s Rapid Warming Accompanies Cryospheric Melt and Water Cycle Intensification and Interactions between Monsoon and Environment: Multidisciplinary Approach with Observations, Modeling, and Analysis. Bull. Am. Meteorol. Soc. 2019, 100, 423–444. [Google Scholar] [CrossRef] [Scilit]
- Chen, H.; Zhu, Q.; Peng, C.; Wu, N.; Wang, Y.; Fang, X.; Gao, Y.; Zhu, D.; Yang, G.; Tian, J.; et al. The impacts of climate change and human activities on biogeochemical cycles on the Qinghai-Tibetan Plateau. Glob. Chang. Biol. 2013, 19, 2940–2955. [Google Scholar] [CrossRef] [Scilit]
- Yuan, M.; Han, F. Effects of grazing intensity on ecosystem services in arid grasslands and implications for management. Environ. Dev. 2026, 57, 101333. [Google Scholar] [CrossRef] [Scilit]
- Su, X.; Liu, Y.; Zhou, W.; Liu, G. An Overview on Status and Importance of Tibetan Plateau Steppe, China. In Imperiled: The Encyclopedia of Conservation; DellaSala, D.A., Goldstein, M.I., Eds.; Elsevier: Oxford, UK, 2022; pp. 144–150. [Google Scholar]
- Peng, F.; Xue, X.; You, Q.; Huang, C.; Dong, S.; Liao, J.; Duan, H.; Tsunekawa, A.; Wang, T. Changes of soil properties regulate the soil organic carbon loss with grassland degradation on the Qinghai-Tibet Plateau. Ecol. Indic. 2018, 93, 572–580. [Google Scholar] [CrossRef] [Scilit]
- Zhou, G.; Zhou, X.; He, Y.; Shao, J.; Hu, Z.; Liu, R.; Zhou, H.; Hosseinibai, S. Grazing intensity significantly affects belowground carbon and nitrogen cycling in grassland ecosystems: A meta-analysis. Glob Chang Biol 2017, 23, 1167–1179. [Google Scholar] [CrossRef] [Scilit]
- Deng, L.; Zhu, G.; Tang, Z.; Shangguan, Z.-p. Global patterns of the effects of land-use changes on soil carbon stocks. Glob. Ecol. Conserv. 2016, 5, 127–138. [Google Scholar] [CrossRef] [Scilit]
- Zhao, Z.; Dai, E. Vegetation cover dynamics and its constraint effect on ecosystem services on the Qinghai-Tibet Plateau under ecological restoration projects. J. Environ. Manage. 2024, 356, 120535. [Google Scholar] [CrossRef] [Scilit]
- Liu, Y.; Liu, S.; Wang, F.; Liu, H.; Li, M.; Sun, Y.; Wang, Q.; Yu, L. Identification of key priority areas under different ecological restoration scenarios on the Qinghai-Tibet Plateau. J. Environ. Manag. 2022, 323, 116174. [Google Scholar] [CrossRef] [Scilit]
- Kong, L.; Wu, T.; Xiao, Y.; Xu, W.; Zhang, X.; Daily, G.C.; Ouyang, Z. Natural capital investments in China undermined by reclamation for cropland. Nat. Ecol. Evol. 2023, 7, 1771–1777. [Google Scholar] [CrossRef] [Scilit] [PubMed]
- Yang, D.; Liu, Y. Heterogeneous impacts of human activities and climate change on transformed vegetation dynamics on the Qinghai-Tibet Plateau. J. Environ. Manage. 2025, 392, 126575. [Google Scholar] [CrossRef] [Scilit] [PubMed]
- Zhu, Z.; Piao, S.; Myneni, R.B.; Huang, M.; Zeng, Z.; Canadell, J.G.; Ciais, P.; Sitch, S.; Friedlingstein, P.; Arneth, A.; et al. Greening of the Earth and its drivers. Nat. Clim. Chang. 2016, 6, 791–795. [Google Scholar] [CrossRef] [Scilit]
- Zhou, G.; Ren, H.; Zhang, L.; Lv, X.; Zhou, M. Annual vegetation maps in the Qinghai–Tibet Plateau (QTP) from 2000 to 2022 based on MODIS series satellite imagery. Earth Syst. Sci. Data 2025, 17, 773–797. [Google Scholar] [CrossRef] [Scilit]
- Yu, Q.; Lu, H.; Yao, T.; Xue, Y.; Feng, W. Enhancing sustainability of vegetation ecosystems through ecological engineering: A case study in the Qinghai-Tibet Plateau. J. Environ. Manag. 2023, 325, 116576. [Google Scholar] [CrossRef] [Scilit]
- Yin, X.; Cao, D. Spatiotemporal variation and driving mechanisms of vegetation net primary productivity in Hunan Province from 2001 to 2023. Sci. Remote Sens. 2025, 12, 100269. [Google Scholar] [CrossRef] [Scilit]
- Zhang, Z.; Cui, Y.; Tang, W.; Li, S. Spatial-temporal heterogeneity of ecological quality changes across the Qinghai-Tibet Plateau under the influence of climate factors and human activities. Res. Cold Arid Reg. 2024, 16, 129–140. [Google Scholar] [CrossRef] [Scilit]
- Xu, B.; Li, J.; Liu, Y.; Zhang, T.; Luo, Z.; Pei, X. Disentangling the response of vegetation dynamics to natural and anthropogenic drivers over the Qinghai-Tibet Plateau using dimensionality reduction and structural equation model. For. Ecol. Manag. 2024, 554, 121677. [Google Scholar] [CrossRef] [Scilit]
- Li, Z.; Shen, Q.; Fan, W.; Dong, S.; Wang, Z.; Xu, Y.; Ma, T.; Cao, Y. Nature-Based Solutions vs. Human-Induced Approaches for Alpine Grassland Ecosystem: “Climate-Help” Overwhelms “Human Act” to Promote Ecological Restoration in the Three-River-Source Region of Qinghai–Tibet Plateau. Remote Sens. 2024, 16, 1156. [Google Scholar] [CrossRef] [Scilit]
- Xie, Z.; He, L.; Wan, W.; Song, X.; Wu, Z.; Liang, H.; Du, H.; Qin, M.; Xiong, Y.; Qian, Y.; et al. Shifting patterns of ecosystem service trade-offs and synergies: Evidence from the Yangtze River Economic Belt, China. Glob. Ecol. Conserv. 2026, 65, e04020. [Google Scholar] [CrossRef] [Scilit]
- Liu, N.; Guo, T.; Zhang, H.; Yang, G.; Wei, B.; Xu, H.; Ren, H.; Badgery, W.; Kemp, D.; Nie, Z.; et al. Optimized grazing management enhances multiple ecosystem services by maintaining plant diversity and dominance in grasslands. One Earth 2025, 8, 101319. [Google Scholar] [CrossRef] [Scilit]
- Ferraro, P.J. Counterfactual thinking and impact evaluation in environmental policy. New Dir. Eval. 2009, 2009, 75–84. [Google Scholar] [CrossRef] [Scilit]
- Ding, H.; Sun, R.; Pang, X.; Ding, X.; Jiang, W. Quantifying the independent contributions of ecological restoration projects: An efficacy evaluation study of Yimeng Mountain. Ecol. Eng. 2025, 219, 107699. [Google Scholar] [CrossRef] [Scilit]
- Schleicher, J.; Eklund, J.; Barnes, M.D.; Geldmann, J.; Oldekop, J.A.; Jones, J.P.G. Statistical matching for conservation science. Conserv. Biol. 2020, 34, 538–549. [Google Scholar] [CrossRef] [Scilit]
- Austin, P.C. An Introduction to Propensity Score Methods for Reducing the Effects of Confounding in Observational Studies. Multivar. Behav Res 2011, 46, 399–424. [Google Scholar] [CrossRef] [Scilit]
- VanderWeele, T.J.; Ding, P. Sensitivity Analysis in Observational Research: Introducing the E-Value. Ann Intern Med. 2017, 167, 268–274. [Google Scholar] [CrossRef] [Scilit]
- Pereira, P.; Inacio, M.; Barcelo, D.; Zhao, W. Ecosystem services mapping and modelling. Where is the validation? Geogr. Sustain. 2025, 6, 100286. [Google Scholar] [CrossRef] [Scilit]
- Bai, X.; Chen, W.; Li, F.; Bu, Z.; Dai, Q.; Dai, J. An explainable InVEST-XGB-LGB fusion model to inform ecosystem restoration: Deciphering long-term trade-offs and drivers of ecosystem services in the Eastern Qinghai-Tibet Plateau. Ecol. Eng. 2026, 223, 107846. [Google Scholar] [CrossRef] [Scilit]
- Wang, Q.; Huang, L.; Yang, M.; Wang, L.; Cao, W. Distinguishing dominant drivers on long-term vegetation dynamics across China considering time-lag and accumulation effects using machine learning techniques. J. Environ. Manag. 2025, 391, 126477. [Google Scholar] [CrossRef] [Scilit]
- Manley, K.; Nyelele, C.; Egoh, B.N. A review of machine learning and big data applications in addressing ecosystem service research gaps. Ecosyst. Serv. 2022, 57, 101478. [Google Scholar] [CrossRef] [Scilit]
- Athey, S.; Imbens, G. Recursive partitioning for heterogeneous causal effects. Proc. Natl. Acad. Sci. USA 2016, 113, 7353–7360. [Google Scholar] [CrossRef] [Scilit] [PubMed]
- Wager, S.; Athey, S. Estimation and Inference of Heterogeneous Treatment Effects using Random Forests. J. Am. Stat. Assoc. 2018, 113, 1228–1242. [Google Scholar] [CrossRef] [Scilit]
- Yang, J.; Fan, J.; Lan, Z.; Mu, X.; Wu, Y.; Xin, Z.; Miping, P.; Zhao, G. Improved Surface Soil Organic Carbon Mapping of SoilGrids250m Using Sentinel-2 Spectral Images in the Qinghai–Tibetan Plateau. Remote Sens. 2023, 15, 114. [Google Scholar] [CrossRef] [Scilit]
- Cao, R.; Xu, Z.; Chen, Y.; Chen, J.; Shen, M. Reconstructing High-Spatiotemporal-Resolution (30 m and 8-Days) NDVI Time-Series Data for the Qinghai–Tibetan Plateau from 2000–2020. Remote Sens. 2022, 14, 3648. [Google Scholar] [CrossRef] [Scilit]
- Zinda, J.A.; Trac, C.J.; Zhai, D.; Harrell, S. Dual-function forests in the returning farmland to forest program and the flexibility of environmental policy in China. Geoforum 2017, 78, 119–132. [Google Scholar] [CrossRef] [Scilit]
- Li, W.; Wang, W.; Chen, J.; Zhang, Z. Assessing effects of the Returning Farmland to Forest Program on vegetation cover changes at multiple spatial scales: The case of northwest Yunnan, China. J. Environ. Manage. 2022, 304, 114303. [Google Scholar] [CrossRef] [Scilit]
- Li, Y.; Li, C.; Zhou, W.; Wang, S.; Cao, Y.; Li, Z.; Lu, T.; Stringer, L.C. Identification of conservation priority areas on the Qinghai-Tibet Plateau considering habitat, biodiversity, ecosystem services, and human well-being. J. Environ. Manag. 2025, 393, 127113. [Google Scholar] [CrossRef] [Scilit]
- Jia, Z.; Wang, X.; Feng, X.; Ma, J.; Wang, X.; Zhang, X.; Zhou, J.; Sun, Z.; Yao, W.; Tu, Y. Exploring the spatial heterogeneity of ecosystem services and influencing factors on the Qinghai Tibet Plateau. Ecol. Indic. 2023, 154, 110521. [Google Scholar] [CrossRef] [Scilit]
- Chen, T.; Guestrin, C. XGBoost: A Scalable Tree Boosting System. In Proceedings of the 22nd ACM SIGKDD International Conference on Knowledge Discovery and Data Mining, San Francisco, CA, USA, 13–17 August 2016; pp. 785–794. [Google Scholar]
- Jerome, H.F. Greedy function approximation: A gradient boosting machine. Ann. Stat. 2001, 29, 1189–1232. [Google Scholar] [CrossRef] [Scilit]
- Lundberg, S.M.; Erion, G.; Chen, H.; DeGrave, A.; Prutkin, J.M.; Nair, B.; Katz, R.; Himmelfarb, J.; Bansal, N.; Lee, S.-I. From local explanations to global understanding with explainable AI for trees. Nat. Mach. Intell. 2020, 2, 56–67. [Google Scholar] [CrossRef] [Scilit]
- Lundberg, S.M.; Lee, S.-I. A unified approach to interpreting model predictions. In Proceedings of the 31st International Conference on Neural Information Processing Systems, Long Beach, CA, USA, 4–9 December 2017; pp. 4768–4777. [Google Scholar]
- Li, K.; Zhao, J.; Chen, G.; Lin, Y. Coupling response mechanisms of land use conflicts and ecosystem health using the GWRF-SHAP model: A structural and functional perspective. Ecol. Inform. 2025, 92, 103498. [Google Scholar] [CrossRef] [Scilit]
- Künzel, S.R.; Sekhon, J.S.; Bickel, P.J.; Yu, B. Metalearners for estimating heterogeneous treatment effects using machine learning. Proc. Natl. Acad. Sci. USA 2019, 116, 4156–4165. [Google Scholar] [CrossRef] [Scilit] [PubMed]
- Nie, X.; Wager, S. Quasi-oracle estimation of heterogeneous treatment effects. Biometrika 2021, 108, 299–319. [Google Scholar] [CrossRef] [Scilit]
- Li, Z.; Xue, J.; Si, L.; Du, F.; Gui, J.; Zhang, B. Ecosystem services driving factors and ecological conservation pattern construction, Qinghai-Tibet Plateau. Environ. Sustain. Indic. 2024, 24, 100512. [Google Scholar] [CrossRef] [Scilit]
- Wei, P.; Zhao, T.; Du, J.; Chen, S. Variations and drivers of ecosystem services in the frozen ground regions of the Qinghai-Tibet Plateau. Habitat Int. 2025, 166, 103579. [Google Scholar] [CrossRef] [Scilit]
- Lu, R.; Dai, E.; Wu, C. Spatial and temporal evolution characteristics and driving factors of soil conservation services on the Qinghai-Tibet Plateau. Catena 2023, 221, 106766. [Google Scholar] [CrossRef] [Scilit]
- Li, G.; Jiang, C.; Gao, Y.; Du, J. Natural driving mechanism and trade-off and synergy analysis of the spatiotemporal dynamics of multiple typical ecosystem services in Northeast Qinghai-Tibet Plateau. J. Clean Prod. 2022, 374, 134075. [Google Scholar] [CrossRef] [Scilit]
- Wu, Y.; Yang, J.; Li, S.; Mu, Y.; Marod, D.; Guo, C.; Yang, X.; Feng, H.; Wu, R.; Wu, H.; et al. Nonlinear Interactions and Spatial Heterogeneity of Ecosystem Service Transitions in an Ecologically Fragile Karst Region of Southwest China. Ecol. Evol. 2025, 15, e72401. [Google Scholar] [CrossRef] [Scilit]
- Pan, Y.; Wang, Y.; Zheng, S.; Huete, A.R.; Shen, M.; Zhang, X.; Huang, J.; He, G.; Yu, L.; Xu, X.; et al. Characteristics of Greening along Altitudinal Gradients on the Qinghai–Tibet Plateau Based on Time-Series Landsat Images. Remote Sens. 2022, 14, 2408. [Google Scholar] [CrossRef] [Scilit]
- Mao, C.; Ren, Q.; He, C.; Li, L. Coupling coordination relationship between human activities and water-related ecosystem services supply–demand in the Qinghai–Tibet Plateau. Environ. Sustain. Indic. 2025, 28, 100903. [Google Scholar] [CrossRef] [Scilit]
- Zhao, Z.; Fu, B.; Lü, Y.; Li, T.; Deng, L.; Wang, Y.; Lü, D.; Wang, Y.; Wu, X. Variable climatic conditions dominate decreased wetland vulnerability on the Qinghai-Tibet Plateau: Insights from the ecosystem pattern-process-function framework. J. Clean Prod. 2024, 458, 142496. [Google Scholar] [CrossRef] [Scilit]
- Li, H.-R.; Ma, S.; Zhang, M.; Yin, Y.-K.; Wang, L.-J.; Jiang, J. Determinants of ecological functional zones in the Qinghai-Tibet Plateau ecological shelter at different scales in 2000 and 2015: From the perspective of ecosystem service bundles. Ecol. Indic. 2023, 154, 110743. [Google Scholar] [CrossRef] [Scilit]
- McNaughton, S.J. Compensatory Plant Growth as a Response to Herbivory. Oikos 1983, 40, 329–336. [Google Scholar] [CrossRef] [Scilit]
- Huang, X.; Liu, X.; Liao, L.; Li, J.; Luo, G.; Li, B.; Ma, Z.; Wang, Z. Grazing decreases carbon storage in the Qinghai-Tibet Plateau grasslands. Commun. Earth Environ. 2025, 6, 198. [Google Scholar] [CrossRef] [Scilit]
- Hafner, S.; Unteregelsbacher, S.; Seeber, E.; Lena, B.; Xu, X.; Li, X.; Guggenberger, G.; Miehe, G.; Kuzyakov, Y. Effect of grazing on carbon stocks and assimilate partitioning in a Tibetan montane pasture revealed by 13CO2 pulse labeling. Glob. Chang. Biol. 2012, 18, 528–538. [Google Scholar] [CrossRef] [Scilit]
- Xu, D.; Li, D. Variation of wind erosion and its response to ecological programs in northern China in the period 1981–2015. Land Use Policy 2020, 99, 104871. [Google Scholar] [CrossRef] [Scilit]
- Huang, B.; Lu, F.; Wang, X.; Zheng, H.; Wu, X.; Zhang, L.; Yuan, Y.; Ouyang, Z. Ecological restoration is crucial in mitigating carbon loss caused by permafrost thawing on the Qinghai-Tibet Plateau. Commun. Earth Environ. 2024, 5, 341. [Google Scholar] [CrossRef] [Scilit]
- Li, Y.; Li, J.; Are, K.S.; Huang, Z.; Yu, H.; Zhang, Q. Livestock grazing significantly accelerates soil erosion more than climate change in Qinghai-Tibet Plateau: Evidenced from 137Cs and 210Pbex measurements. Agric. Ecosyst. Environ. 2019, 285, 106643. [Google Scholar] [CrossRef] [Scilit]
- Andam, K.S.; Ferraro, P.J.; Pfaff, A.; Sanchez-Azofeifa, G.A.; Robalino, J.A. Measuring the effectiveness of protected area networks in reducing deforestation. Proc. Natl. Acad. Sci. USA 2008, 105, 16089–16094. [Google Scholar] [CrossRef] [Scilit]
- Runge, J.; Gerhardus, A.; Varando, G.; Eyring, V.; Camps-Valls, G. Causal inference for time series. Nat. Rev. Earth Environ. 2023, 4, 487–505. [Google Scholar] [CrossRef] [Scilit]
- Zhi, Y.; Liu, S.; Wang, T.; Duan, H.; Kang, W. Quantifying the impact of natural and human activity factors on desertification in the Qinghai-Tibetan Plateau. Catena 2024, 246, 108392. [Google Scholar] [CrossRef] [Scilit]
- Yue, Q.; Shijin, W.; Shengyun, C.; Xingran, C. A systematic review of ecological restoration in China from 1991 to 2024: A bibliometric analysis. Ecol. Eng. 2026, 222, 107794. [Google Scholar] [CrossRef] [Scilit]
- Suding, K. Toward an Era of Restoration in Ecology: Successes, Failures, and Opportunities Ahead. Annu. Rev. Ecol. Evol. Syst. 2011, 42, 465–487. [Google Scholar] [CrossRef] [Scilit]
- Cao, S. Why Large-Scale Afforestation Efforts in China Have Failed To Solve the Desertification Problem. Environ. Sci. Technol. 2008, 42, 1826–1831. [Google Scholar] [CrossRef] [Scilit]
- Feng, X.; Fu, B.; Piao, S.; Wang, S.; Ciais, P.; Zeng, Z.; Lü, Y.; Zeng, Y.; Li, Y.; Jiang, X.; et al. Revegetation in China’s Loess Plateau is approaching sustainable water resource limits. Nat. Clim. Chang. 2016, 6, 1019–1022. [Google Scholar] [CrossRef] [Scilit]
- Callaway, B.; Sant’Anna, P.H.C. Difference-in-Differences with multiple time periods. J. Econom. 2021, 225, 200–230. [Google Scholar] [CrossRef] [Scilit]

Disclaimer/Publisher’s Note: The statements, opinions and data contained in all publications are solely those of the individual author(s) and contributor(s) and not of MDPI and/or the editor(s). MDPI and/or the editor(s) disclaim responsibility for any injury to people or property resulting from any ideas, methods, instructions or products referred to in the content. |
© 2026 by the authors. Licensee MDPI, Basel, Switzerland. This article is an open access article distributed under the terms and conditions of the Creative Commons Attribution (CC BY) license.