


Highlights
What are the main findings?
- Diversity hotspots remained clustered in core wetland waters in the breeding and post-fledging period, but shifted to a more dispersed and interannually variable pattern in the wintering and stopover period as the satellite-observed habitat mosaic reorganized.
- The characteristic response scale differed among functional groups. During the breeding and post-fledging period, both waterfowl and waders responded mainly within 800 m. During the wintering and stopover period, waterfowl shifted to broader scales of 1500 to 2000 m, whereas waders remained constrained to about 200 m in relation to locally mapped shallow-water and mudflat features.
What are the implications of the main findings?
- Using season-matched, multi-temporal satellite-derived maps avoids treating the landscape as a fixed background and helps pin down the scale at which birds actually respond; in contrast, a single static land-cover map may mischaracterize key associated factors and the relevant scale of response.
- For management, waders benefit most when shallow-water and mudflat areas remain well connected at about 200 m in the remotely sensed landscape mosaic. For waterfowl in the wintering and stopover period, it is important to also consider the broader landscape context at scales of 1.5 to 2.0 km captured by multi-temporal remote sensing.
Abstract
Seasonal dynamics in wetland landscapes are closely associated with habitat availability and are likely to influence the spatial organization and diversity of waterbird communities. However, most existing studies rely on static land-cover representations or single spatial scales, limiting our ability to characterize how waterbirds respond to seasonally shifting habitats across scales. Focusing on the Qilihai Wetland in Tianjin, China, we combined high-frequency waterbird surveys from 2019–2021 with multi-temporal, season-matched Sentinel-2 imagery and the Dynamic World dataset. Partial least squares regression (PLSR) was applied across a continuous spatial gradient (100–3000 m) to quantify scale-dependent statistical associations between landscape composition and configuration derived from satellite-mapped habitat mosaics on different functional groups. Waterbird diversity exhibited pronounced seasonal contrasts. During the breeding and post-fledging period, high-diversity assemblages were stably concentrated within core wetland areas, showing limited spatial variability. In contrast, during the wintering and stopover period, community distributions became increasingly dispersed, with elevated spatial heterogeneity and interannual variability associated with habitat reorganization. The scale of effect shifted systematically between seasons. In the breeding and post-fledging period, both waterfowl and waders responded predominantly to local-scale landscape factors (<800 m), consistent with nesting requirements and microhabitat conditions. During the wintering and stopover period, however, the characteristic response scale of waterfowl expanded to 1500–2000 m, suggesting stronger associations with broader landscape context, whereas waders remained closely linked to local-scale shallow-water and mudflat connectivity (~200 m). Functional traits played a key role in structuring these scale-dependent responses, with diving behavior and tarsus length being associated with strong constraints on habitat use. Overall, our results suggest that waterbird diversity patterns emerge from the interaction between seasonal habitat dynamics, landscape structure, and functional trait filtering, underscoring the need for phenology-informed, multi-scale conservation strategies that move beyond static spatial boundaries.
1. Introduction
Waterbirds are among the taxa most strongly dependent on wetlands and most tightly connected through migratory networks. Their population dynamics and spatial distributions therefore often serve as direct indicators of changes in wetland hydrological processes and habitat structure [1,2]. Unlike terrestrial ecosystems, which are relatively stable in structure and function, wetland habitats undergo pronounced seasonal succession associated with phenological rhythms, including fluctuations in hydrology and vegetation. These dynamics continuously reshape habitat patch area, boundary configuration, and spatial arrangement, resulting in strong scale dependence and temporal heterogeneity in waterbird distributions [3,4]. Accordingly, elucidating how seasonal habitat influences regulates waterbird distribution patterns across key spatial and temporal scales is essential for advancing our understanding of habitat–species coupling mechanisms and for improving the scientific basis of wetland conservation and management decisions [2,5].
With the development of landscape ecological theory and methodological frameworks, empirical studies across diverse wetland types and migratory corridors have consistently demonstrated that landscape composition and configuration can significantly influence waterbird diversity and spatial distribution by modulating resource availability, disturbance regimes, and spatial connectivity [6,7,8]. Research in this field has largely progressed from a scale-oriented perspective. At the spatial scale dimension, studies have evaluated landscape effects on species richness, community composition, and population density across hierarchical levels, ranging from local foraging patches and landscape mosaics to key nodes along migratory flyways [3,4,9]. The Qilihai Wetland, a National Nature Reserve in North China and a critical stopover node within the East Asian–Australasian Flyway (EAAF), represents a high-priority conservation area where these multi-scale interactions are particularly acute. At the scale-of-effect dimension, increasing attention has been devoted to identifying characteristic response scales and cross-scale transitions [5], revealing nonlinear responses and potential threshold effects of habitat area, fragmentation, edge effects, and connectivity on different waterbird groups [2,10]. These advances have facilitated a shift from descriptive correlations between single habitat elements and bird occurrence toward an integrated analysis of the “landscape structure–ecological process–distributional response” continuum [1].
Despite these advances, existing studies still face two pervasive methodological limitations when attempting to uncover the underlying processes and interaction mechanisms of avian responses: the homogenization of bird classification and the static representation of temporal dynamics [1,8]. At the biological classification level, waterbirds are often treated as a single assemblage or subdivided into only a few broad ecological groups. While such simplifications may capture general patterns, they tend to obscure the constraining effects of interspecific differences in key functional traits on habitat use [11]. For example, tarsus length in waders is closely related to exploitable foraging water depth and substrate conditions [12,13], whereas diving behavior in waterfowl closely associated with their dependence on water depth gradients and hydrological connectivity [9]. At the environmental characterization level, while previous multi-scale studies across the EAAF have attempted to identify spatial response patterns, they have predominantly relied on single-date or limited multi-date land-cover maps, which are poorly aligned with critical life-history stages such as breeding, migration stopover, and wintering [1,14]. This limitation is particularly pronounced in temperate monsoon wetlands, where strong seasonal dynamics and highly variable availability of shallow water and mudflat habitats cause waterbird responses to occur over short timeframes and to involve rapid spatial reorganization. Under such conditions, static land-cover maps or annual mean indicators may be insufficient to capture the process-based constraints shaping waterbird distributions [4,15]. In recent years, rapid advances in high spatiotemporal resolution remote sensing platforms, particularly the Sentinel satellite series, have substantially improved observation frequency, spatial resolution, and data accessibility. These developments have enabled continuous monitoring of land-cover dynamics and seasonal succession processes at fine spatial and temporal scales. Multi-temporal, high-revisit optical imagery allows the detection of rapid seasonal and sub-seasonal changes in key landscape elements such as hydrology and vegetation, thereby providing new opportunities to overcome the “static” limitation in environmental representation and to investigate scale-dependent waterbird responses to seasonal habitat dynamics [16,17].
In studies of avian responses to multi-scale landscape patterns, commonly used analytical approaches include ordinary least squares regression (OLS), generalized linear or additive models (GLM/GAM), and their stepwise variable-selection variants. These methods typically involve constructing separate models at discrete spatial scales and inferring key scales of effect based on model fit or statistical significance. While effective when variable numbers are limited and spatial scales are discrete and independent, such approaches face substantial challenges when applied to continuous scale gradients. Specifically, strong correlations among landscape metrics across adjacent scales can lead to severe multicollinearity [8,18], rendering regression coefficients highly sensitive to sample variation and variable entry order. This instability can compromise the robustness of scale-of-effect identification and even produce contradictory interpretations regarding response directionality [18]. Against this backdrop, partial least squares regression (PLSR) offers a more robust statistical framework for multi-scale landscape analysis. By extracting latent components that maximize covariance between predictors and response variables, PLSR projects highly correlated multi-scale landscape metrics into a reduced latent space, thereby maintaining stable parameter estimation and predictive performance even when predictor dimensionality exceeds sample size and multicollinearity is pronounced [19,20]. Unlike approaches that model each scale independently or rely on subjective scale preselection, PLSR enables the integrated characterization of landscape effects across continuous spatial gradients within a unified modeling framework. Moreover, variable importance in projection (VIP) scores allow quantitative assessment of the relative contributions of different landscape factors and their associated scales. Applying PLSR to the analysis of waterbird–landscape relationships thus not only mitigates statistical instability inherent in high-dimensional scale series but also reduces subjectivity in scale selection, providing a more reliable methodological basis for identifying key response scales and dominant landscape associated factors under complex landscape heterogeneity [5,20].
In this context, the present study focuses on the Qilihai Wetland in Tianjin, China, and integrates high-frequency field surveys of waterbirds conducted from 2019 to 2021. To overcome the widespread limitation of static environmental representation, we leveraged the Google Earth Engine platform to combine Sentinel-2 imagery with the near-real-time Dynamic World dataset, enabling detailed characterization of seasonal landscape succession and precise spatiotemporal alignment between biological observations and landscape dynamics [16,17]. On the biological response dimension, we adopted a functional-group framework based on behavioral and morphological traits, using key attributes such as tarsus length, body mass, and foraging strategy to interpret niche differentiation [11,21]. Methodologically, PLSR was applied across a continuous spatial gradient from 100 to 3000 m to quantify multi-scale relationships between landscape factors and waterbird diversity, with VIP scores used to evaluate the contribution of individual predictors [19,20]. Specifically, this study aims to address how seasonal landscape succession reshapes wetland habitat availability and at which spatial scales these changes are associated with variation in waterbird diversity and functional group structure, thereby providing an operational scientific basis for dynamic and fine-scale conservation and management of the Qilihai Wetland.
2. Materials and Methods
2.1. Study Area
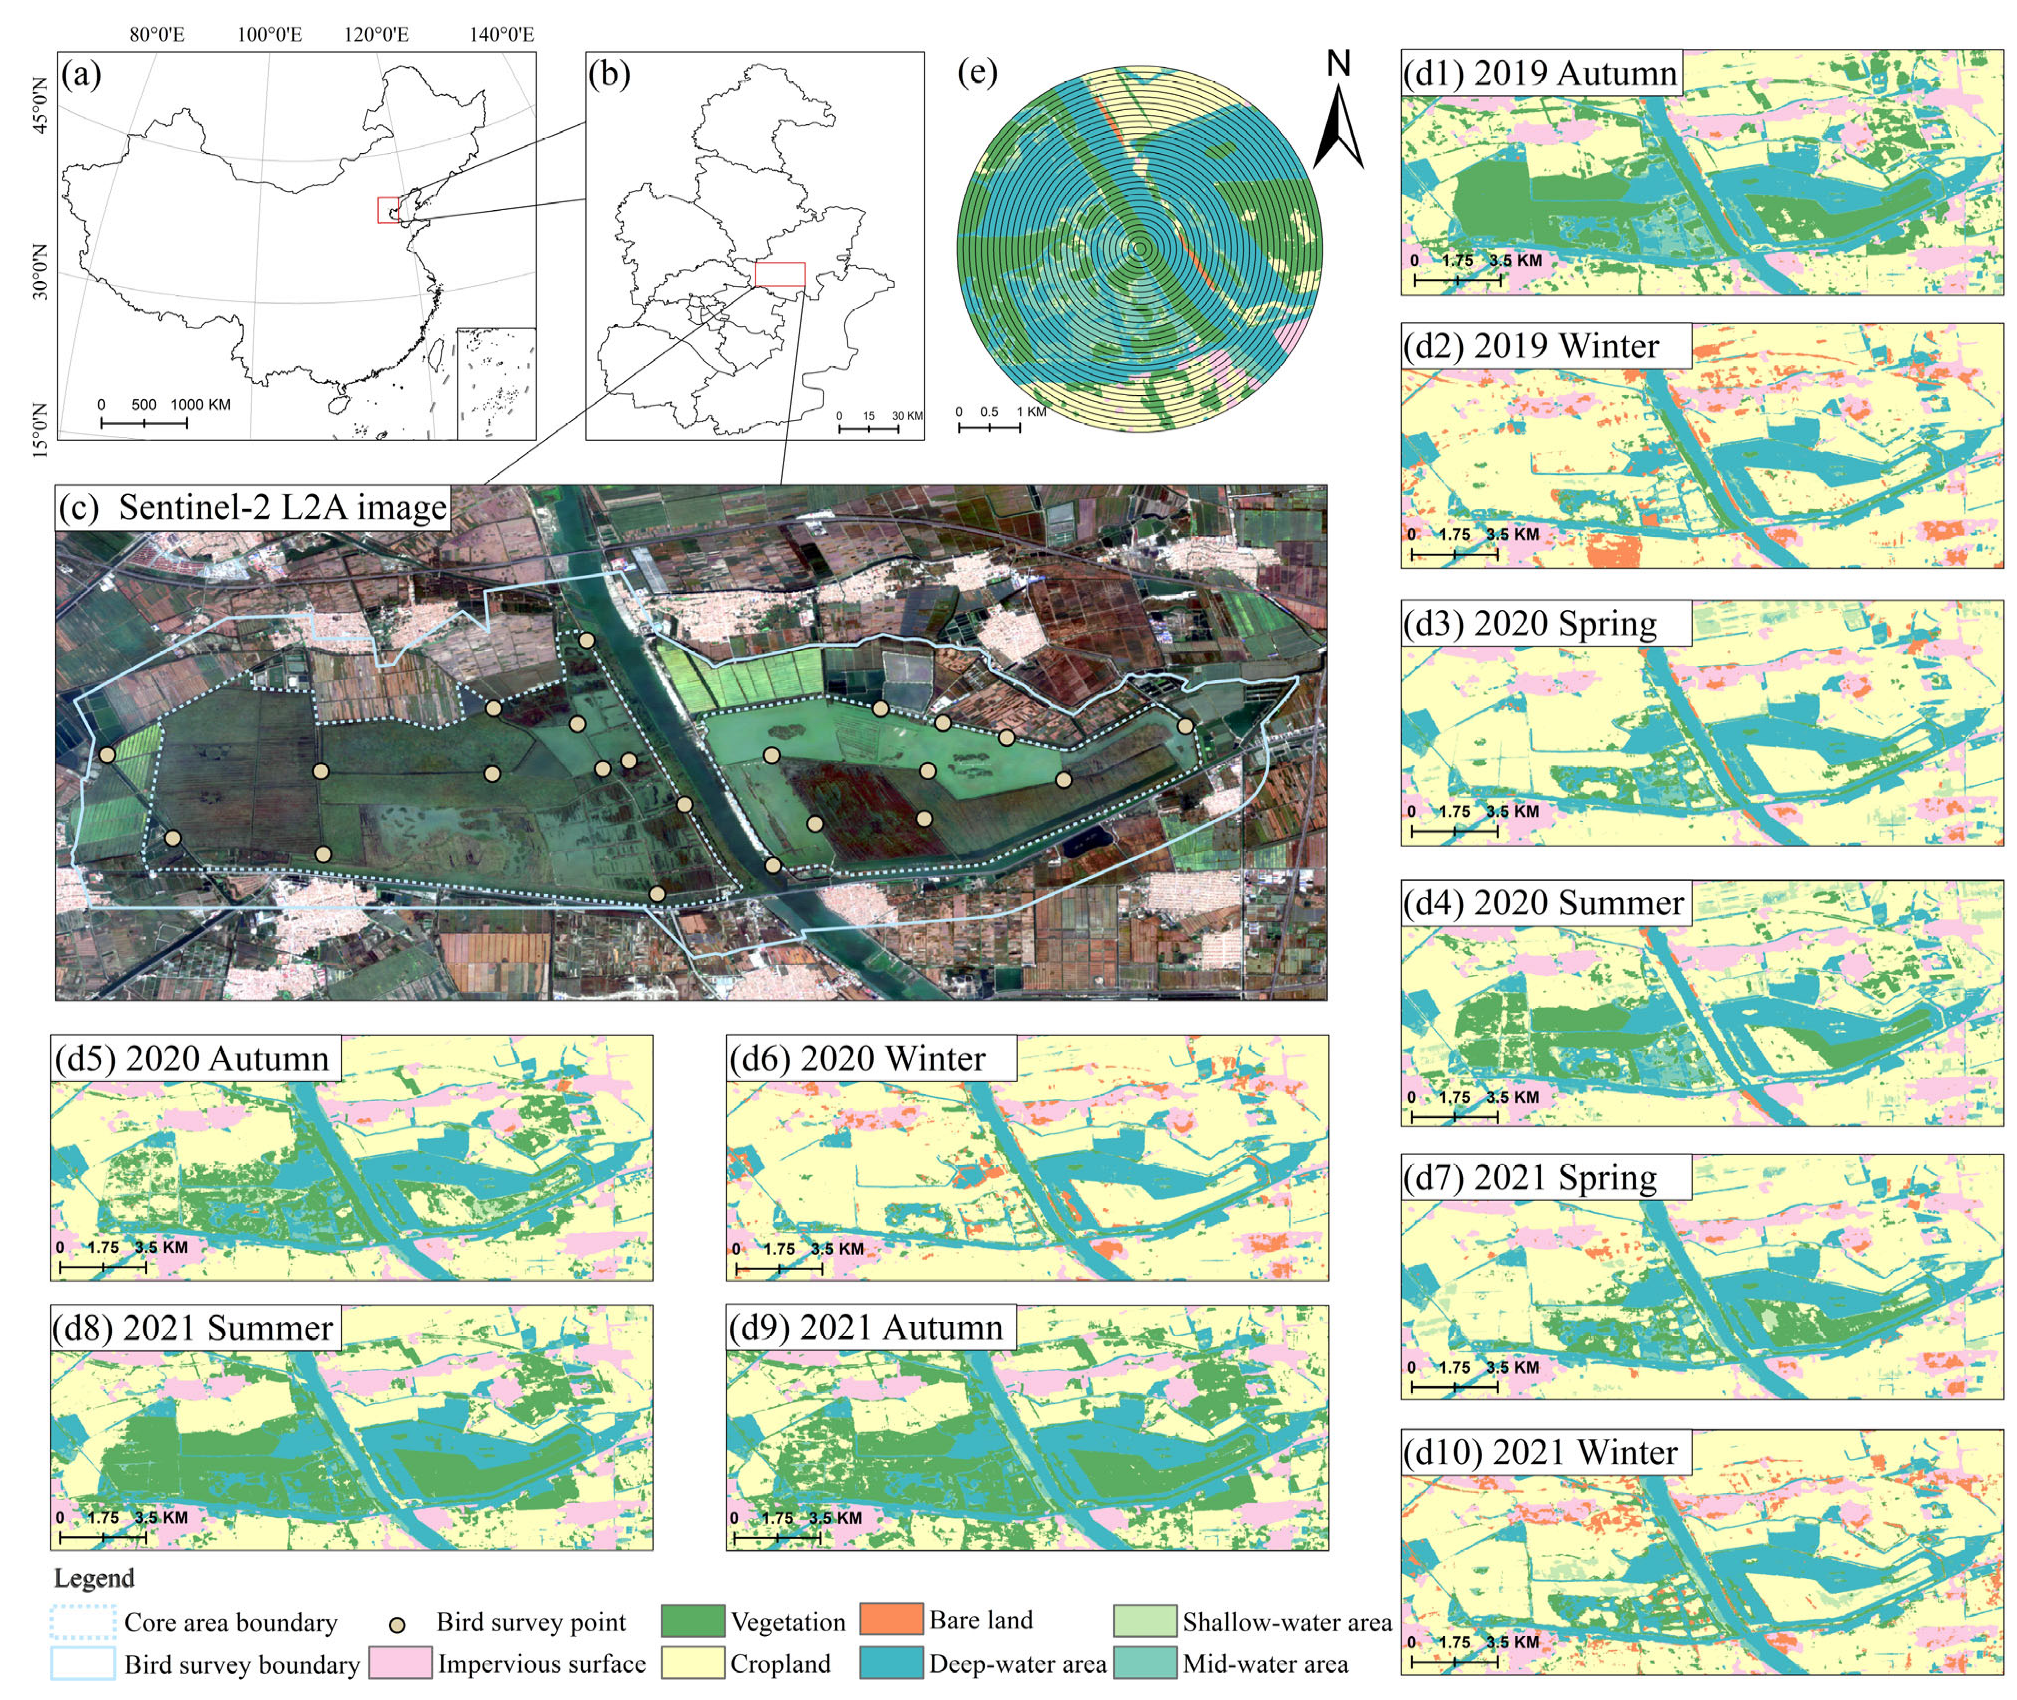
The Qilihai Wetland is located in Tianjin, China (Figure 1a,b), and occupies a strategic position along the EAAF. The region is strongly influenced by a temperate monsoon climate, characterized by pronounced seasonal hydrological fluctuations and vegetation phenological cycles. Sentinel-2 imagery reveals a highly heterogeneous landscape matrix composed of water bodies with contrasting depths, extensive reed beds, and surrounding croplands arranged in a mosaic pattern. The strong seasonal alternation between water inundation and vegetation succession provides an ideal natural setting for monitoring habitat heterogeneity using time-series remote sensing. To comprehensively capture bird community characteristics across different habitat types, survey sites were strategically distributed to represent this landscape heterogeneity (Figure 1c).
Figure 1.
Study area location, bird survey points, land cover changes, and buffer scales. (a,b) Geographic location of the study area at national and provincial levels. (c) Sentinel-2 L2A image showing the bird survey area (dashed line) and survey points (white circles). (d1–d10) Land cover maps from autumn 2019 to winter 2021. (e) Thirty concentric buffer zones (100–3000 m at 100 m intervals) centered on each survey point, used for multi-scale environmental analysis.
Time-series land-use analysis further quantified the pronounced spatiotemporal habitat dynamics of the study area (Figure 1d1–d10). Landscape structure exhibited clear seasonal fluctuations within each year. During the summer high-water period, water expansion coincided with vigorous vegetation growth, whereas in autumn and winter, water level recession not only reshaped depth gradients but also exposed extensive mudflats and bare ground. This dynamic habitat reconfiguration directly determined the seasonal availability of ecological niches for waterbirds, leading to qualitative shifts in habitat suitability from shallow foraging grounds for waders to deeper aquatic habitats for waterfowl.
Such highly dynamic and spatially heterogeneous habitat conditions suggest that single-scale or homogenized analytical approaches are insufficient to accurately resolve community responses. Accordingly, we adopted a multi-scale landscape analysis framework and classified waterbirds into functional groups based on foraging behavior and habitat-use traits, with the aim of identifying, across multiple spatial buffers, the key landscape factors associated with the distribution patterns of specific functional groups.
2.2. Remote Sensing and Landscape Metrics
To quantify seasonal habitat dynamics, we processed Sentinel-2 Level-2A surface reflectance data (10 m spatial resolution) using the Google Earth Engine (GEE) cloud computing platform (Google LLC, Mountain View, CA, USA). We employed the Dynamic World (DW) Version 1 dataset, a near-real-time, pixel-wise land-cover classification product generated by deep-learning models [17]. Although developed as a global product, the DW dataset has demonstrated particular robustness in delineating water and vegetation—the core components of wetland ecosystems—with a documented global top-1 accuracy of approximately 78% [17]. Its proven capacity to resolve rapid hydrological fluctuations and successional shifts provides a reliable methodological foundation for characterizing the complex landscape dynamics of the Qilihai Wetland [22]. For each bird survey season from 2019 to 2021, all available images within the corresponding period were compiled, and seasonal composite images were generated using a temporal mode compositing approach [16]. Specifically, for each pixel we assigned the class with the highest occurrence frequency during the season, which reduces residual cloud effects and transient classification noise and yields a stable representation of the dominant seasonal surface conditions.
To better characterize key habitat elements influencing waterbird distributions, we transformed the remote-sensing classification outputs into a functionally oriented wetland habitat scheme by integrating hydrological connectivity and vegetation structure [23]. First, we used the long-term probability of water occurrence at the pixel level as a remote-sensing proxy for hydrological persistence, and subdivided surface-water pixels into deep, intermediate, and shallow water classes, a strategy that facilitates differentiation of the ecological functions of waterbodies as habitats [4]. Second, grassland, shrubland, and forest were merged into a single “terrestrial vegetation” category to represent overall land-based vegetation cover. Cropland, impervious surfaces, and bare land were retained as separate classes to preserve distinct remote-sensing signatures associated with agricultural land use, built-up disturbance, and exposed substrates. This procedure produced a simplified, satellite-derived habitat map emphasizing water-depth gradients, vegetation cover, and anthropogenic disturbance, which served as the basis for subsequent spatial analyses.
Based on these remote-sensing-derived seasonal habitat maps, we established a multi-scale spatial analysis framework [7]. For each bird survey site, 30 concentric circular buffers with radii ranging from 100 m to 3000 m at 100 m intervals were generated. Within each buffer, landscape metrics were calculated using FRAGSTATS 4.0 [24]. Landscape characteristics were quantified from two complementary dimensions: (1) landscape composition, represented by the proportional area of each habitat type (PLAND); and (2) landscape configuration, characterized using patch density (PD), edge density (ED), largest patch index (LPI), patch cohesion index (COHESION), and Shannon’s diversity index (SHDI), capturing fragmentation, connectivity, and spatial heterogeneity in the satellite-derived landscape mosaic [8]. These configuration metrics were specifically selected to capture functional connectivity and edge complexity of the wetland mosaic, which are closely associated with waterbird foraging opportunities, refuge availability, and daily movement costs [25,26]. PD and ED quantify fragmentation and edge exposure, LPI represents the dominance of core patches, COHESION reflects patch connectedness, and SHDI summarizes landscape heterogeneity [24]. These multi-scale metrics collectively constituted the environmental predictor variables used in subsequent analyses (Table 1).
Table 1.
Description of landscape metric calculated within the buffer zones centered on each survey point.
2.3. Bird Surveys and Functional Traits
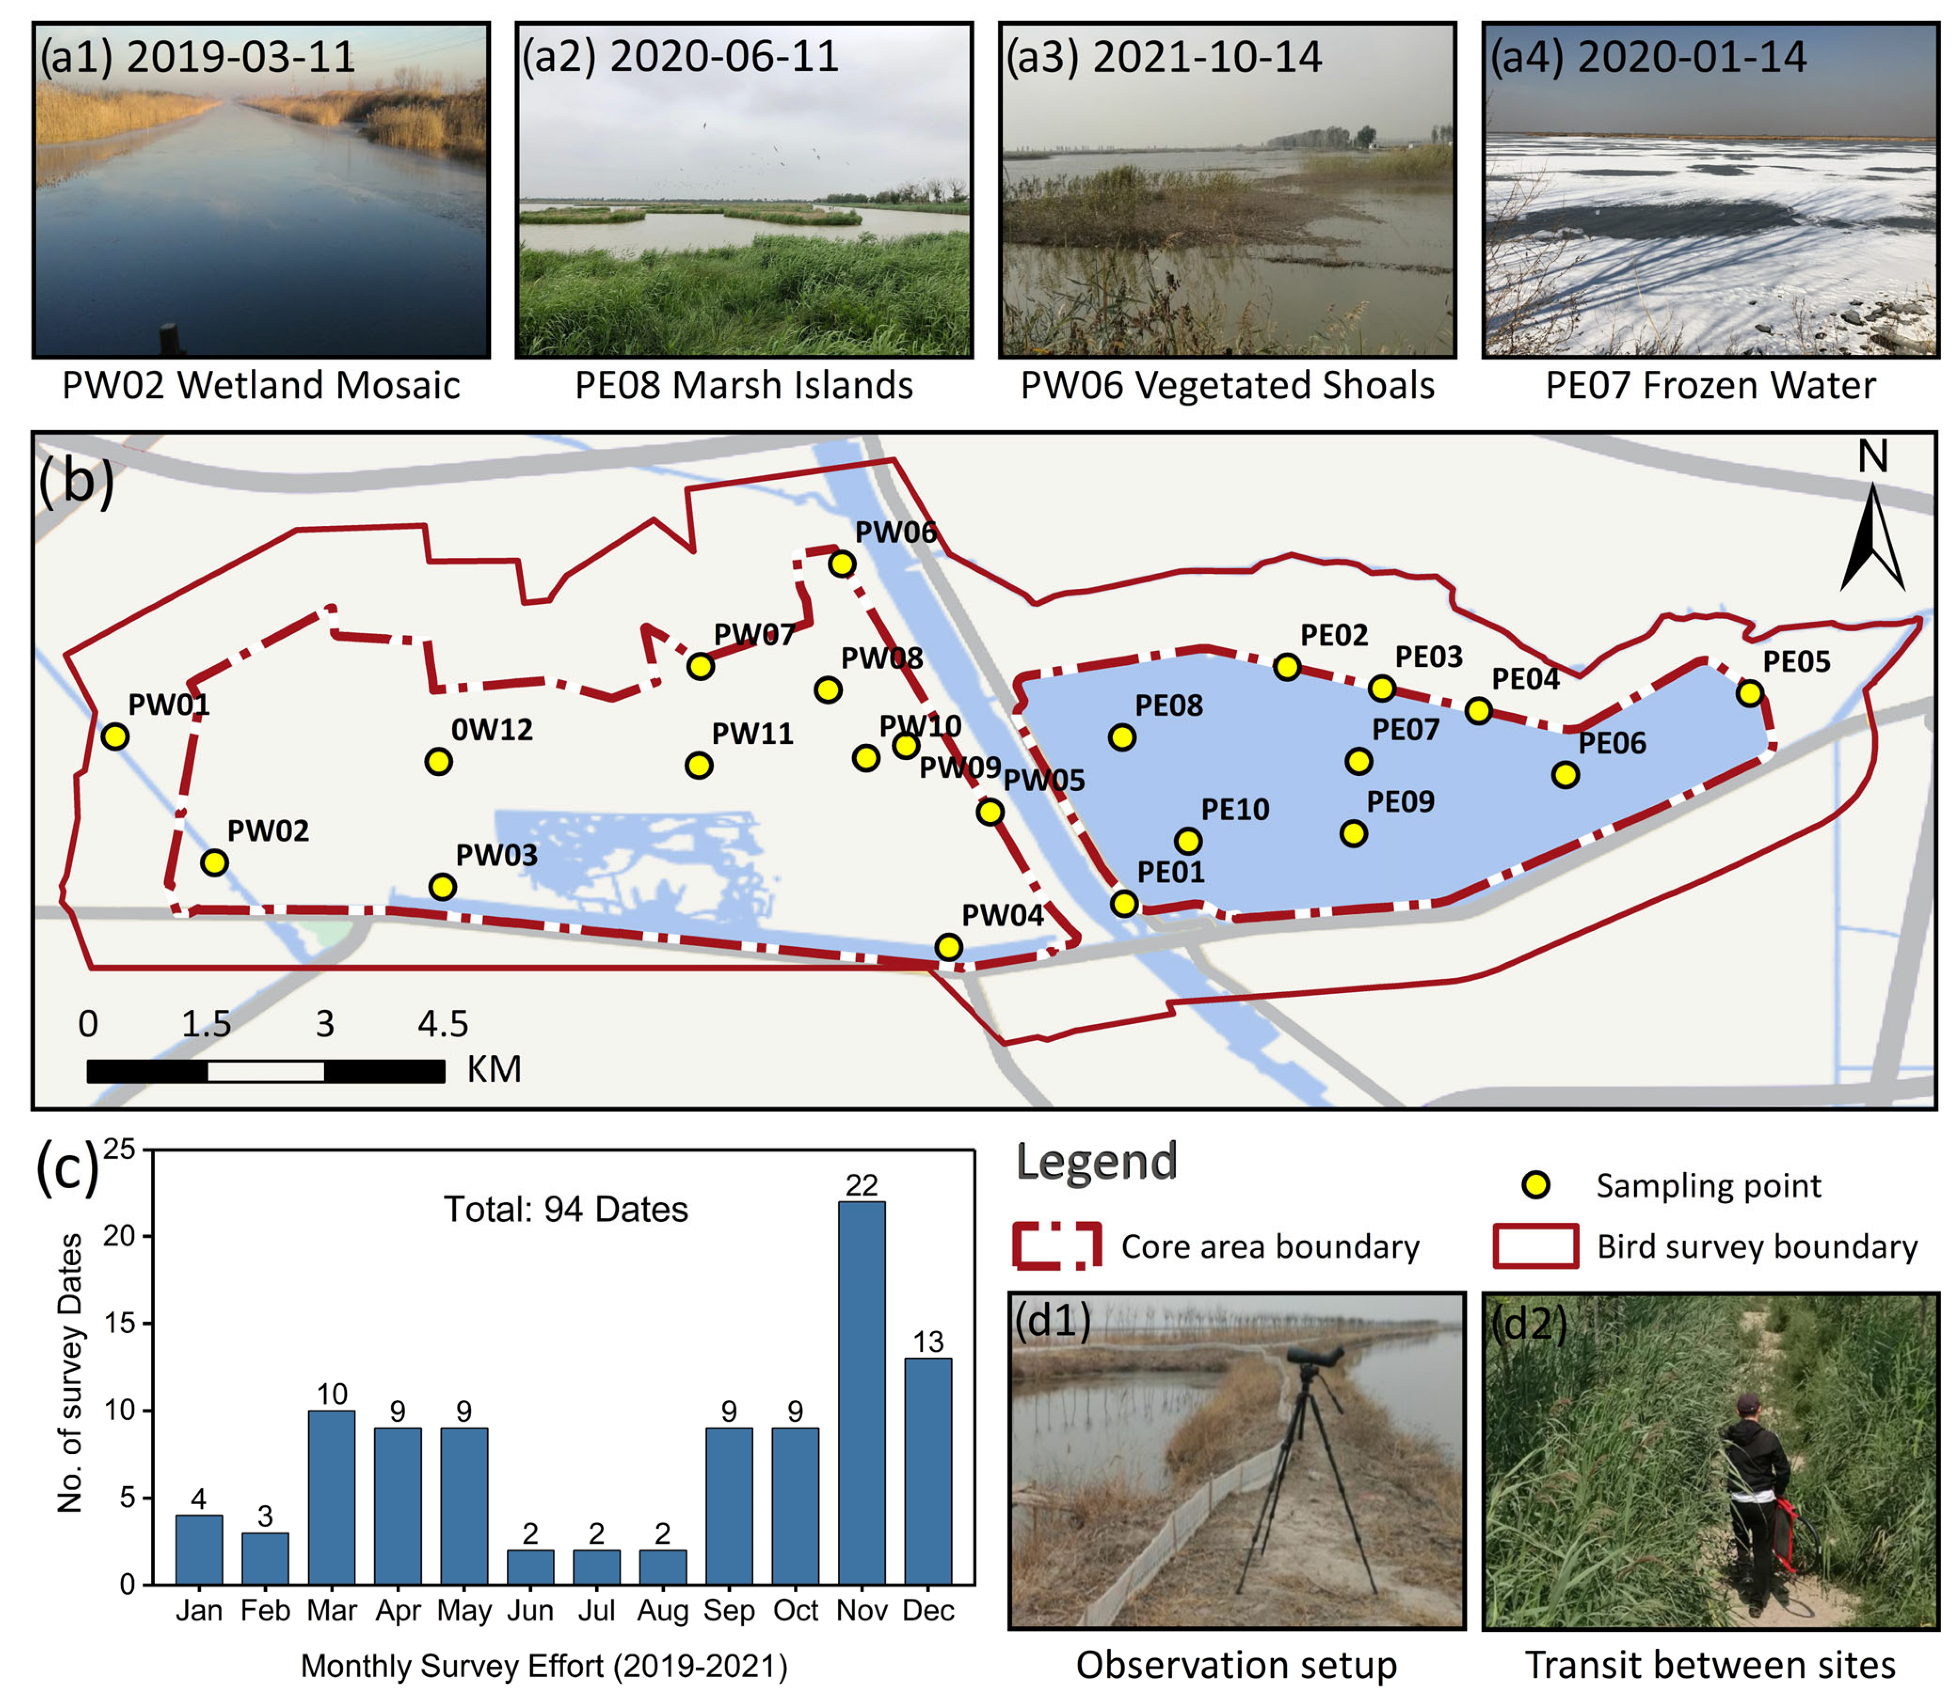
Systematic bird surveys were conducted in Qilihai Wetland from 2019 to 2021. To capture landscape heterogeneity, we established 22 fixed sampling points across the core area and surrounding functional zones (Figure 2c). Surveys followed a fixed-radius point-count protocol [27]. To accommodate contrasting habitat conditions, we used a two-tier observation radius of 200 m in densely vegetated areas and 500 m in open deep-water areas, with a 15–20 min residence time per point. All surveys were conducted at dawn or dusk under rain-free conditions with wind force below Beaufort 3, to minimize the effects of waves and ambient noise on detection and counting. Waterbirds actively using local habitats were counted individually using high-magnification spotting scopes and binoculars, and high-flying passers-by were excluded to ensure records reflected local habitat use [28].
Figure 2.
Bird survey design and field sampling overview in the Qilihai Wetland, Tianjin, China. (a1–a4) Representative habitat photos. (b) Sampling points and survey boundaries. (c) Monthly survey effort in 2019–2021. (d1,d2) Field survey scenes.
Because sampling points were widely distributed across difficult-to-access habitats including mudflats, reedbeds, and open deep-water areas, fieldwork rotated among dispersed sites across survey dates. Each visit followed the standardized point-count protocol and recording procedure. All observations were compiled into a raw dataset with observation date, point ID, species identity, and individual counts as the core fields. Community variability was greatest during spring and autumn migration, when species composition and abundance can change rapidly. Accordingly, surveys were conducted more frequently during key migration windows to capture short-term occurrence and turnover. To match waterbird records with seasonal remote-sensing composites, we summarized diversity at the functional-period level. For each point, we quantified species richness as the cumulative number of species detected across all surveys within the same functional period, representing the observed period-level richness under a fixed point-count protocol. This aggregation is particularly relevant during migration windows, when multiple visits are needed to approximate the period-level species pool. Over the three-year monitoring period, we conducted surveys on 93 dates and obtained 6749 valid records, providing a robust basis for subsequent phenological integration and functional-group analyses.
Given the seasonal phenology of wetland landscapes and the intrinsic continuity of waterbird life histories, we first divided the annual cycle into four baseline phenological stages [29] and then aggregated them into two functional periods: June–November as the breeding and post-fledging period, and December–May as the wintering and stopover period, during which water levels fluctuate markedly and mudflat exposure is extensive. This aggregation was supported by the high similarity of summer–autumn landscape structure in Qilihai and by the continuity of juvenile life-history stages. It was also aligned with the temporal windows used for seasonal remote-sensing composites to ensure temporal matching between biological records and environmental characterization. Because observed richness is conditional on survey effort and may increase with visit number through improved inventory completeness [30], we interpret absolute richness differences across functional periods with caution. Instead, our inference emphasizes within-period landscape–diversity relationships and the inferred scales of effect.
Habitat selection in birds fundamentally reflects long-term adaptation of morphological traits and behavioral strategies to multidimensional environmental conditions [1,31]. To examine differential responses to multi-scale landscapes, we developed a behavior–morphology based functional grouping framework. We first classified waterbirds by foraging mode into waterfowl and waders, and further separated waterfowl into diving waterfowl and non-diving waterfowl. Because morphology constrains niche use, we selected body mass and tarsus length as key trait indicators [12,21], and extracted all trait data from the AVONET global bird trait database [11]. To minimize subjectivity in defining thresholds, we applied K-means clustering to objectively bin trait values. Non-diving waterfowl were clustered by body mass into large-bodied, medium-bodied, and small-bodied subgroups, reflecting differences in dependence on open-water conditions. Waders were clustered by tarsus length into long-legged, medium-legged, and short-legged subgroups, corresponding to habitat use across different water depths. In total, we identified 10 major functional groups: waterfowl (WF), waders (WB), non-diving waterfowl (WF-ND), diving waterfowl (WF-DV), large-bodied non-diving waterfowl (WF-ND-LM), medium-bodied non-diving waterfowl (WF-ND-MM), small-bodied non-diving waterfowl (WF-ND-SM), long-legged waders (WB-LT), medium-legged waders (WB-MT), and short-legged waders (WB-ST). Species to group assignments are listed in Table 2.
Table 2.
Scientific name, annual counts, morphological traits, and ecological functional group of the waterbird species recorded during the survey period. The Count of Birds Observed indicates the number of individuals recorded in each year (2019–2021) and the total sum across all years. Morphological traits including Tarsus Length (mm) and Body Mass (g) were obtained from the AVONET global database. Each species was further categorized into an ecological functional group based on foraging mode, body mass, and tarsus length: WF-DV (diving waterfowl), WF-ND-LM/MM/SM (large-, medium-, or small-mass non-diving waterfowl), and WB-LT/MT/ST (long-, medium-, or short-tarsus waders).
2.4. Statistical Analysis and Modeling Approach
Survey sites were first assigned habitat attributes based on the dominant land-use type within a 500 m buffer. Given the inherent non-normality and heterogeneity of ecological survey data, a nonparametric bootstrap approach was adopted as the primary strategy for statistical inference [32]. Compared with traditional parametric tests, this method does not rely on assumptions of normality and offers greater statistical robustness. The analysis involved 2000 bootstrap resamples with replacement from the original observations to construct mean distributions of species richness and corresponding 95% confidence intervals (95% CI) for each habitat type. Following established inferential criteria [33], non-overlapping confidence intervals were used as the statistical basis for identifying significant differences among habitats, supplemented by violin and box plots to visually examine distributional shape and dispersion.
Building on the habitat differentiation analysis, partial least squares regression (PLSR) was employed to further investigate the continuous scale-dependent effects of landscape patterns on waterbird functional groups. PLSR was selected based on the multi-scale landscape metric series extracted above to address the strong autocorrelation and multicollinearity commonly present in such datasets [19]. Unlike ordinary least squares regression, PLSR extracts latent components that maximize covariance between predictors and response variables, thereby maintaining stable parameter estimation in high-dimensional settings where the number of predictors exceeds the sample size [20]. All analyses were implemented in Python 3.10 using the scikit-learn library (1.7.1). To eliminate dimensional heterogeneity among variables, both predictor and response variables were standardized using Z-score transformation prior to model fitting.
To ensure robust performance estimates given the limited sample size which precluded the use of an independent test set, we employed a repeated 5-fold cross-validation scheme with 50 repetitions. This approach maximizes data utilization for model calibration while strictly preventing data leakage. Model performance was systematically evaluated using the cumulative explained variance of the calibration set (R2Ycum), the cumulative cross-validated explained variance (Q2cum) and the Root Mean Square Error of Cross-Validation (RMSECV). Furthermore, the statistical significance of the models was assessed via permutation tests (n = 499 iterations). A model was considered statistically valid only if the permutation p-value was <0.05. Finally, for these valid models, key driving factors were identified based on variable importance in projection (VIP), with variables exhibiting VIP > 1 considered significant contributors [18]. Within this framework, the spatial scale at which a key variable reached its peak VIP value was defined as the characteristic scale of effect for the corresponding functional group [5].
3. Results
3.1. Temporal Dynamics and Functional Composition of Waterbird Communities
During the survey period (2019–2021), a total of 90 waterbird species were recorded, encompassing a wide range of ecological functional groups, highlighting the exceptionally high conservation value of the Qilihai Wetland as a key node along the East Asian–Australasian Flyway. Notably, population dynamics of threatened species exhibited clear recovery trends. The recorded numbers of individuals of Aythya baeri and Ciconia boyciana, both nationally protected species, showed a consistent year-on-year increase (Table 2), indicating an improving capacity of habitat quality in the study area to support endangered waterbird populations.
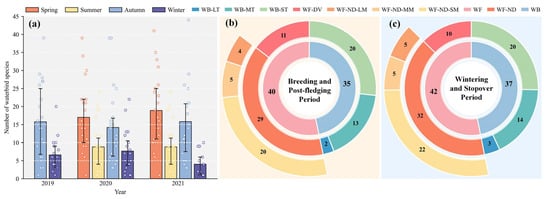
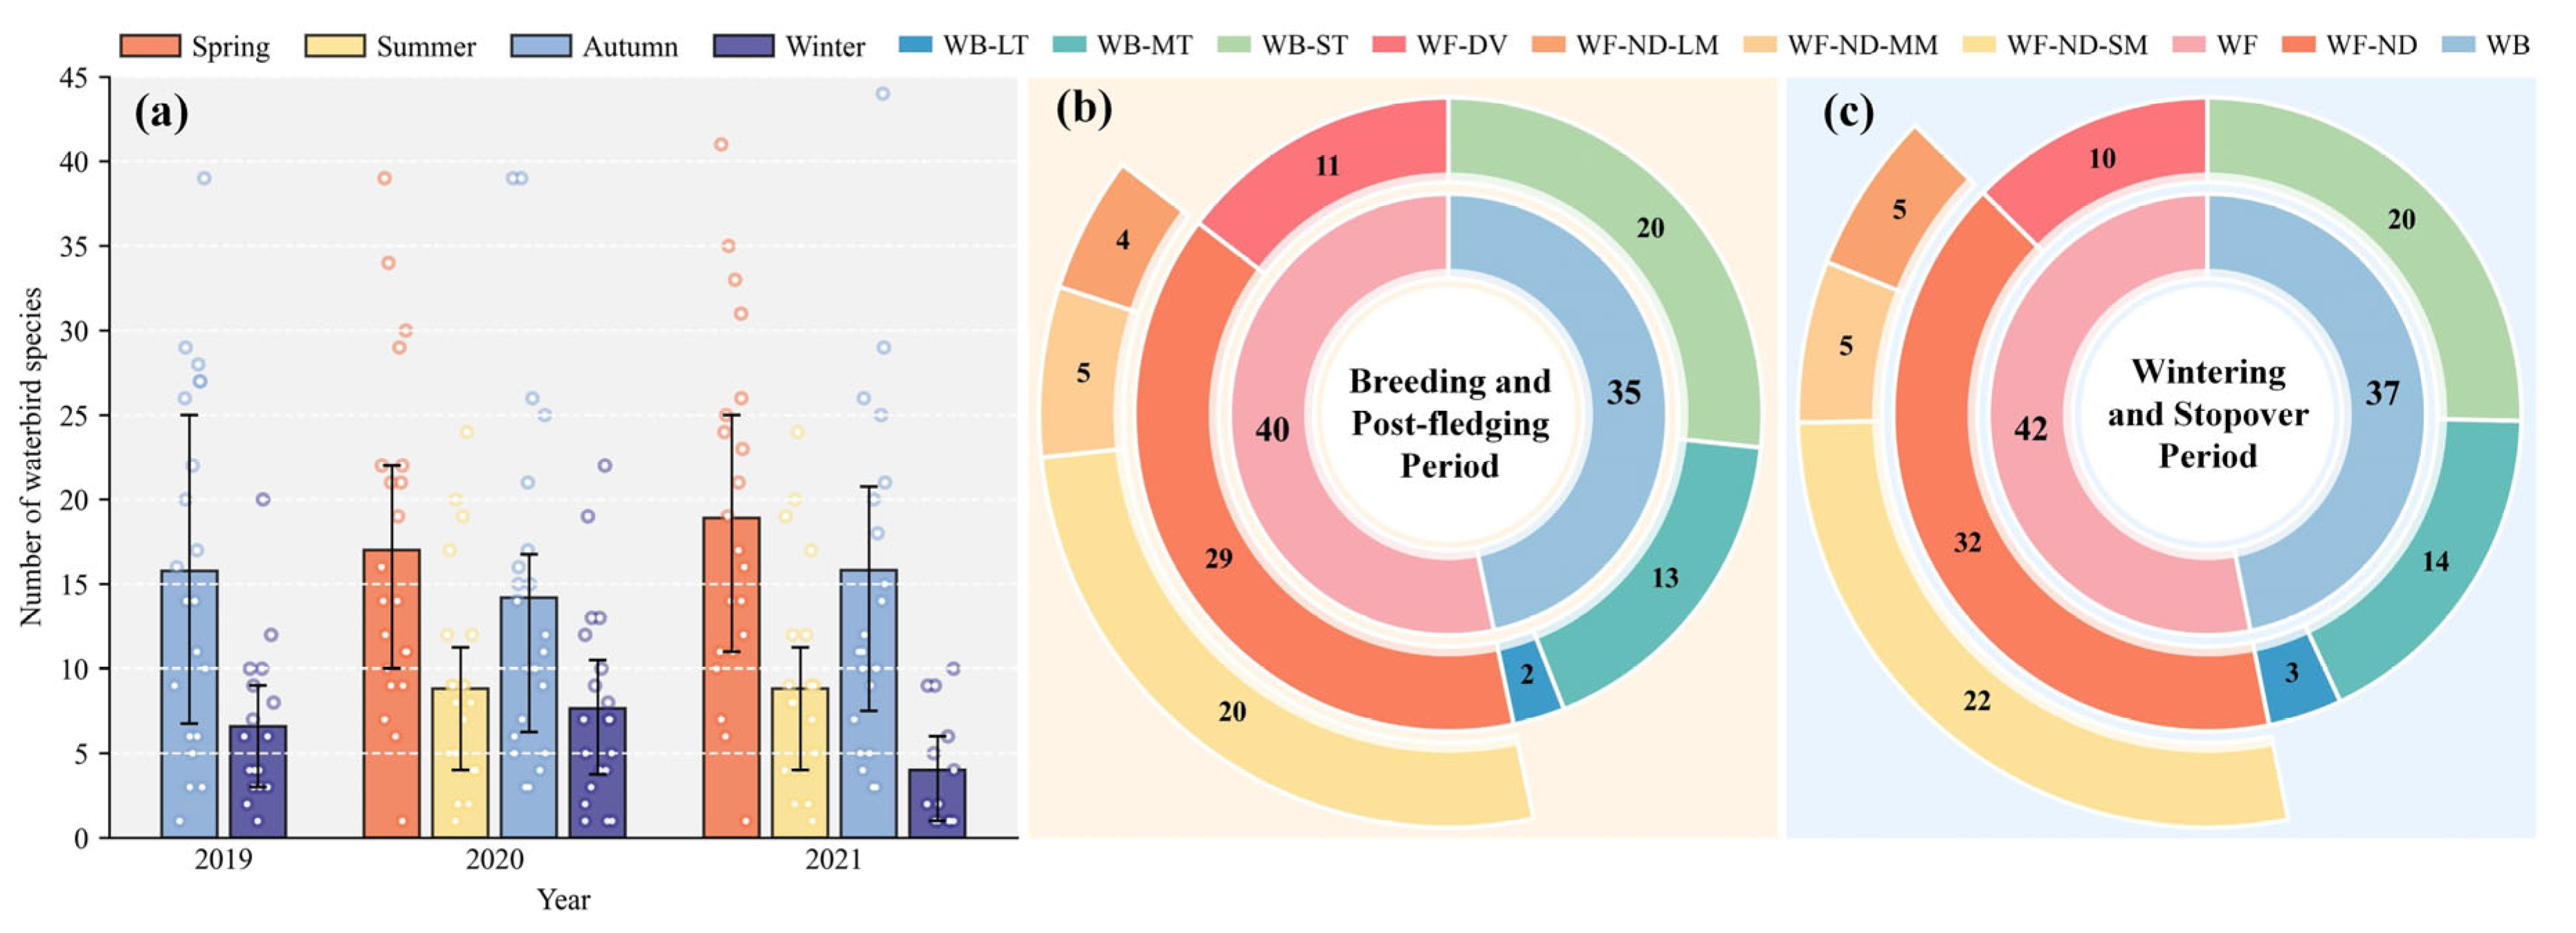
Bird communities exhibited pronounced seasonal variation (Figure 3). Species richness showed a typical bimodal migratory pattern and remained relatively stable during the breeding and post-fledging period, reflecting a consistent supply of ecological niches provided by core habitats. In contrast, species richness during the wintering and stopover period displayed high interannual and intra-annual variability (Figure 3a), likely associated with stochastic aggregation linked to wintering and stopover period water-level dynamics and climatic fluctuations. Despite seasonal turnover in species composition, the functional structure of the community remained highly consistent, with WF-ND-SM and WB-MT/ST dominating throughout the year (Figure 3b,c), forming the core functional groups underpinning ecosystem functioning in the wetland.
Figure 3.
Seasonal variation and functional group composition of waterbird species in the study area from 2019 to 2021. (a) Number of waterbird species recorded in spring, summer, autumn, and winter. Error bars represent standard deviation across survey replicates. (b,c) Functional group composition during the breeding and post-fledging period (b) and wintering and stopover period (c).
3.2. Spatial Patterns and Habitat Associations of Waterbird Diversity
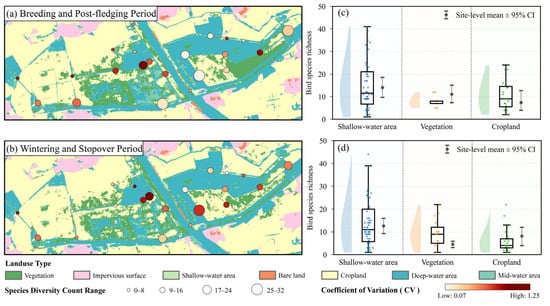
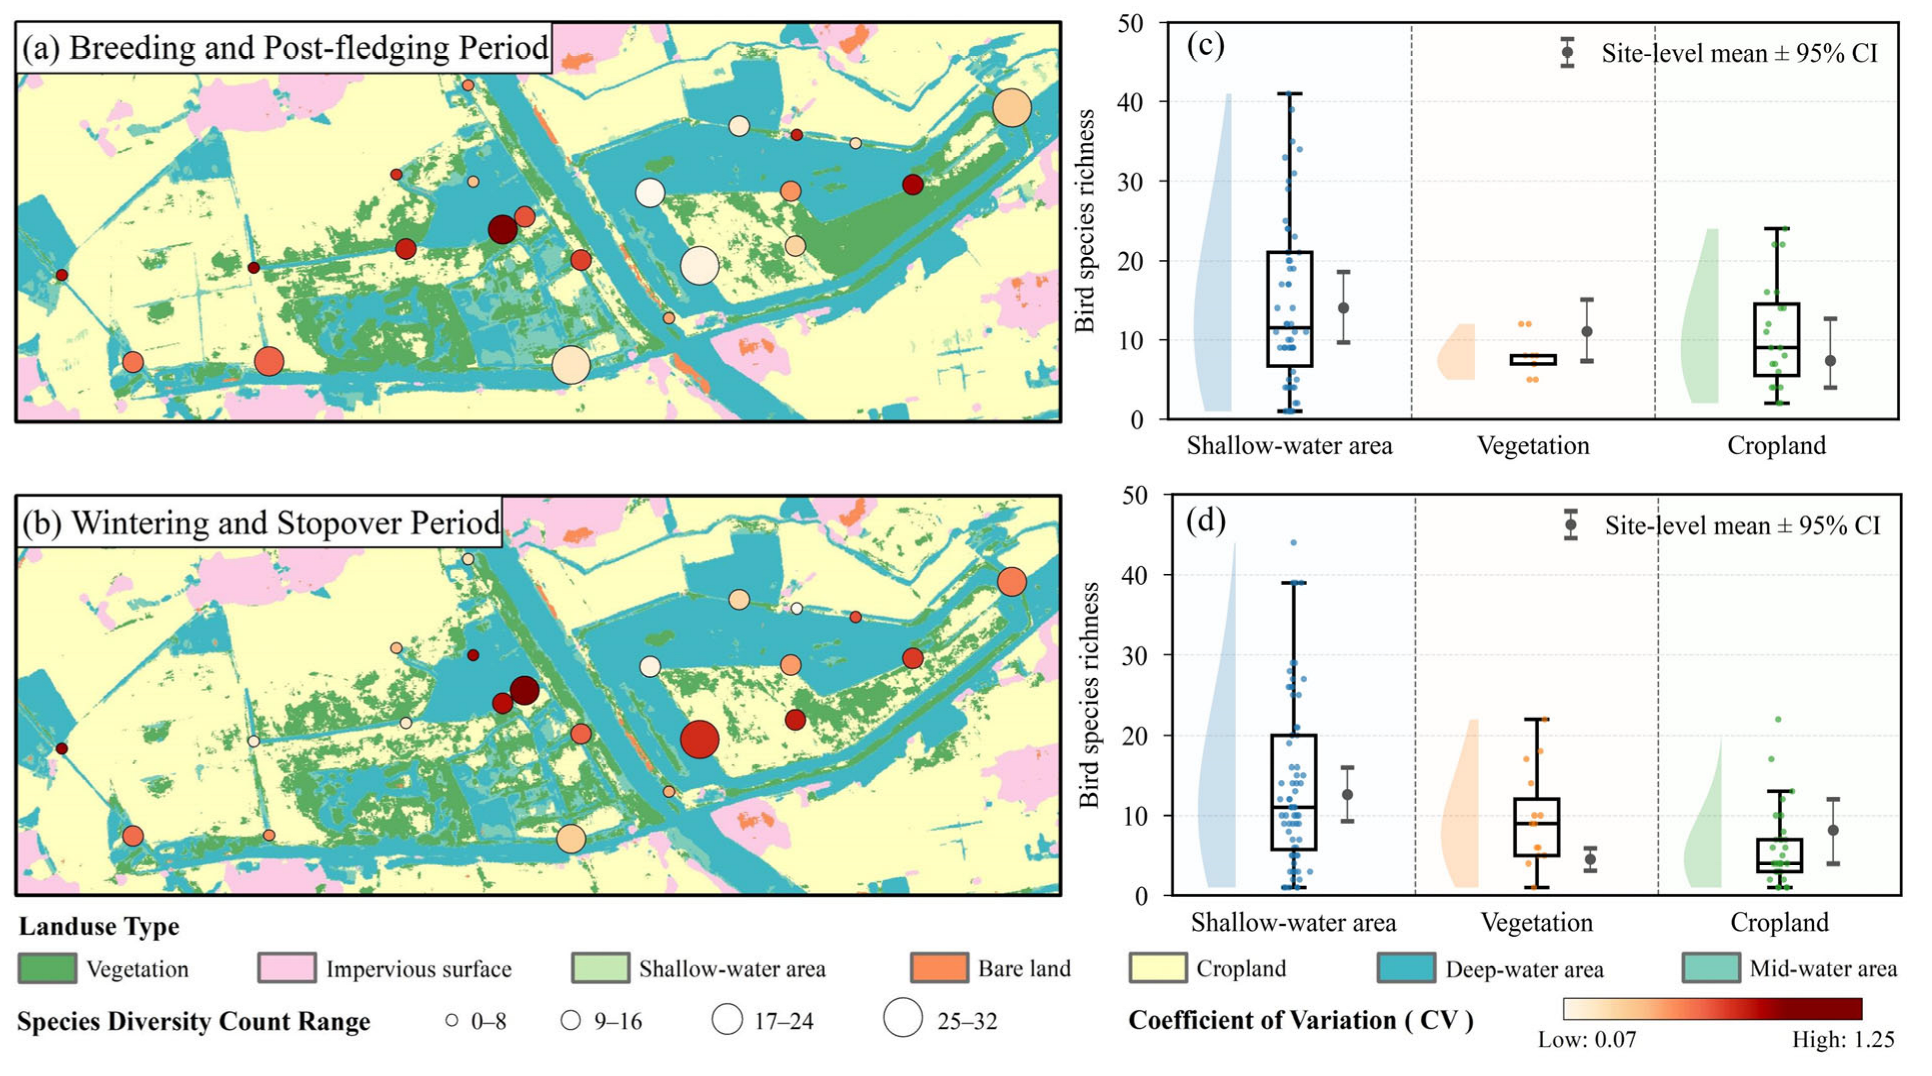
Waterbird species richness in the study area exhibited pronounced spatial heterogeneity and was strongly structured by seasonal rhythms (Figure 4a,b). Spatially, in both the breeding and post-fledging period and the wintering and stopover period, sites with high species richness were consistently clustered within core wetland patches and well-connected waterbodies, suggesting largely consistent spatial locations of biodiversity hotspots. In contrast, the temporal stability of the community, quantified by the coefficient of variation (CV), differed markedly between functional periods. During the breeding and post-fledging period (Figure 4a), CV values remained low at most high-richness sites, suggesting relatively stable richness patterns within core habitats and a more predictable pattern of space use. By comparison, CV values increased substantially during the wintering and stopover period (Figure 4b). Although core areas continued to support high mean species richness, the elevated dispersion suggested more dynamic temporal fluctuations in site-level richness during this season.
Figure 4.
Bird species richness patterns across functional periods. (a) Map: breeding and post-fledging period. (b) Map: wintering and stopover period. (c) Land-use comparison: breeding and post-fledging period. (d) Land-use comparison: wintering and stopover period. Circle size indicates site-level richness; circle color indicates CV. Violin plots show non-zero richness distributions with jittered points and boxplots; gray dumbbells indicate site-level mean ± 95% CI.
In terms of habitat associations, shallow-water habitats consistently supported high species richness across a broad range of habitat niche breadths, whereas vegetation and cropland exhibited contrasting seasonal trajectories in diversity responses (Figure 4c,d). During the breeding and post-fledging period (Figure 4c), cropland showed pronounced ecological flexibility, with species richness spanning a wide range and some sites recording relatively high values, indicating strong between-site variability in observed richness within cropland contexts. This pattern is consistent with more opportunistic use when local conditions make suitable foraging micro-sites accessible. In contrast, vegetation habitats during this period exhibited strong convergence and homogeneity: boxplots were highly compact and data points were tightly clustered, indicating relatively uniform or constrained use by waterbirds. The compact distribution suggests relatively consistent richness levels across vegetated sites during this period, potentially reflecting similar accessibility and structure of vegetation-associated habitats across surveyed points. This pattern reversed during the wintering and stopover period (Figure 4d). Species richness within vegetation habitats became markedly more dispersed, with a substantial expansion of the interquartile range, indicating increased site-to-site heterogeneity in observed richness. Conversely, cropland during the fallow period was strongly concentrated at low values, characterized by a clear floor effect and the absence of high-richness observations, consistent with reduced use and reduced suitability of cropland contexts for supporting diverse waterbird assemblages during the non-breeding season.
3.3. Scale Effects on Species Diversity of Waterbird Ecological Functional Groups
The PLSR models demonstrated robust statistical performance and generalization capabilities across most functional groups. As detailed in Table 3, 18 out of 20 models yielded statistically significant relationships (p < 0.05). The calibration metrics indicated strong explanatory power, with R2Ycum generally exceeding 0.80 for key groups. Crucially, despite the sample size constraints, Q2cum confirmed that the models could reliably predict species diversity across independent samples, validating the robustness of the established relationships.
Table 3.
Summary of PLSR model performance and validation metrics across waterbird functional groups and seasons.
However, WF-ND-LM exhibited poor model performance, revealing distinct stability issues. In the wintering and stopover period, the model failed to capture any significant statistical association (p = 0.536), indicating a lack of responsiveness to landscape metrics at the studied scale. In the breeding and post-fledging period, it exhibited predictive failure (Q2cum < 0). Given the lack of consistent statistical support and predictive ability, this subgroup was excluded from subsequent analyses aimed at identifying key associated landscape factors.
For the remaining statistically valid models, characteristic scales of effect were identified via peak VIP scores. This analysis unveiled a hierarchical structure of spatial responsiveness, demonstrating that waterbird sensitivity to landscape heterogeneity is functionally modulated rather than uniform.
3.3.1. General Patterns: Divergence Between Waterfowl and Waders
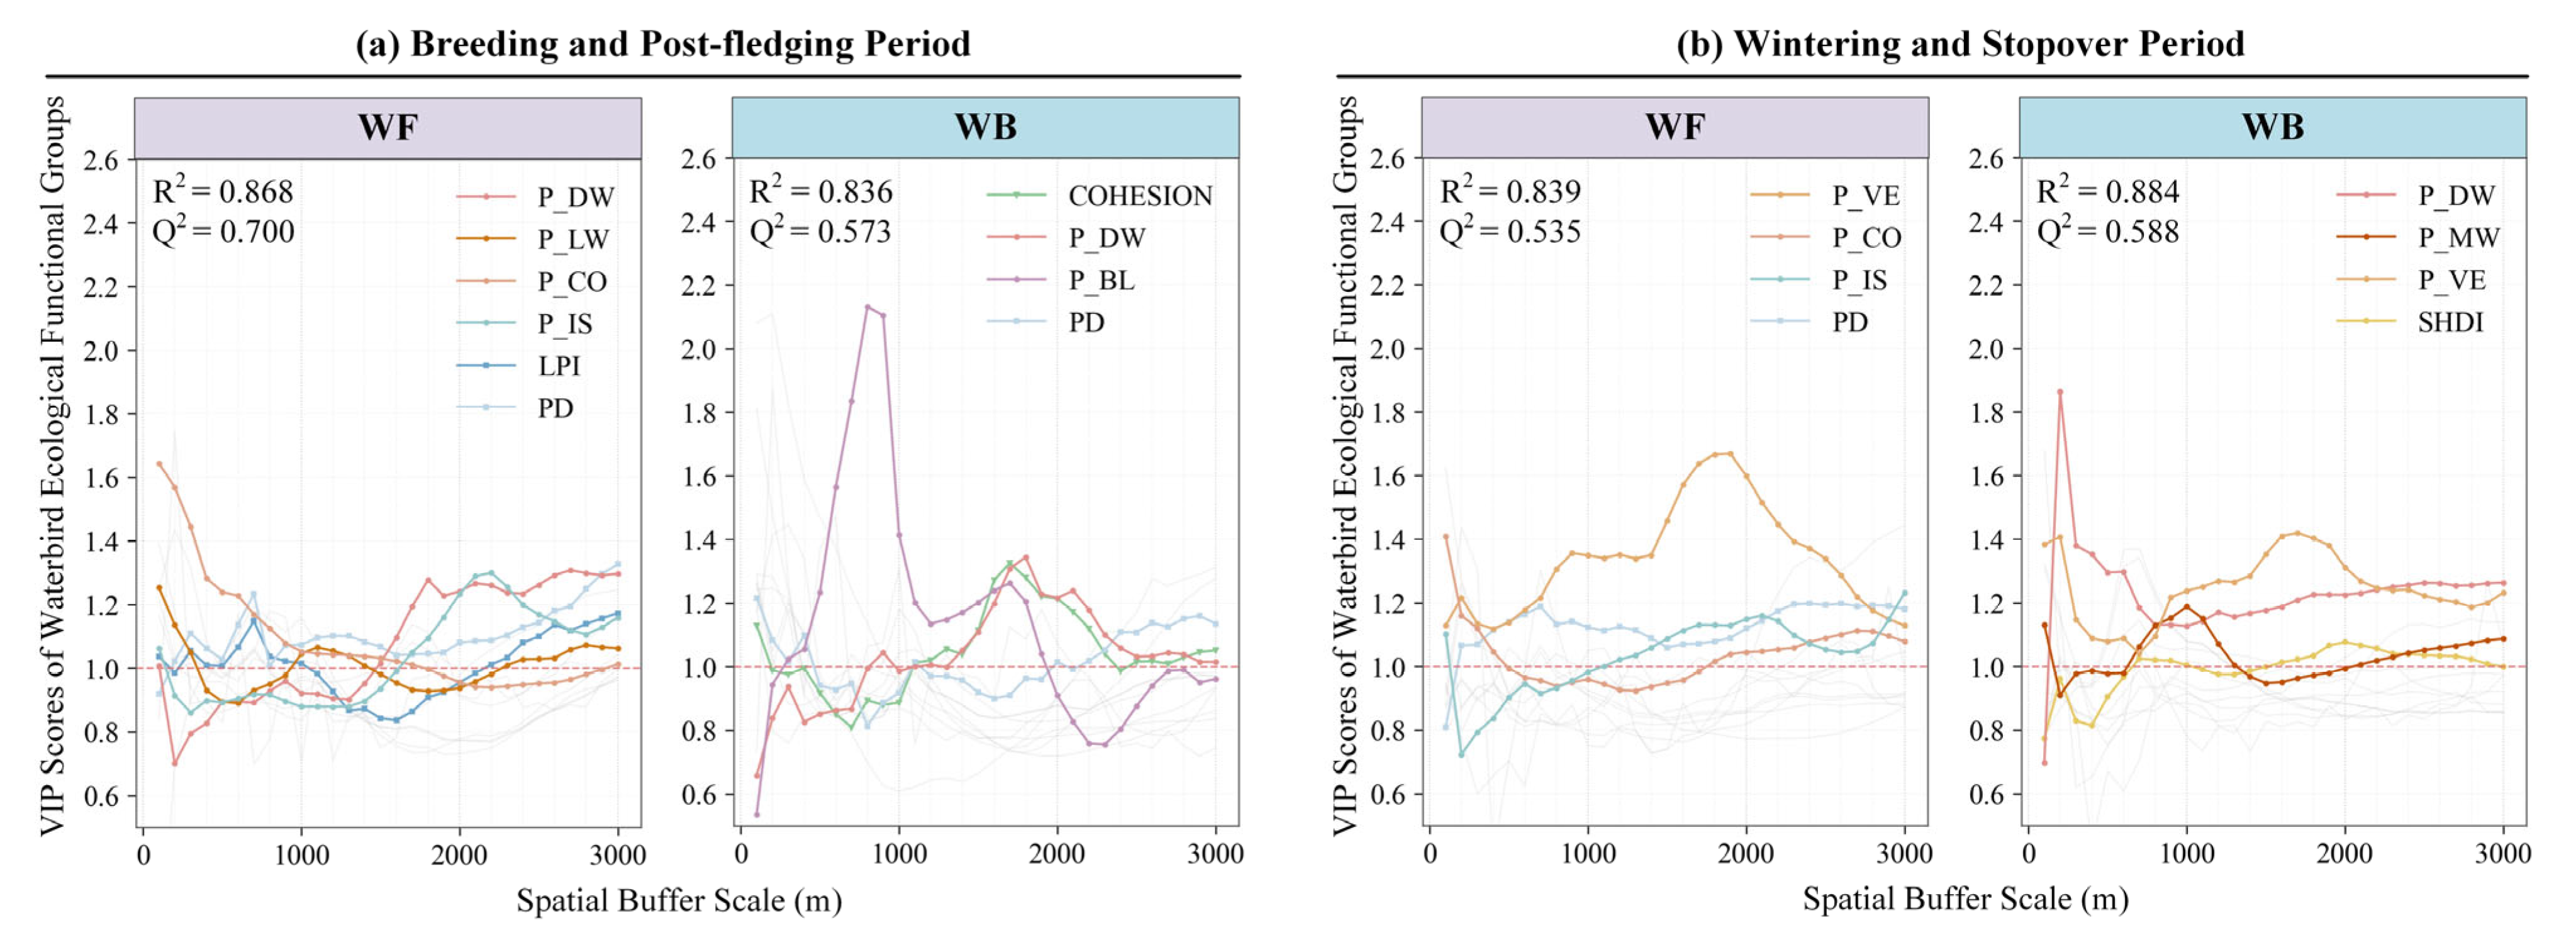
Scale-dependent responses of WF and WB exhibited a pronounced seasonal shift from local-scale convergence to scale differentiation (Figure 5). During the breeding and post-fledging period (Figure 5a), both groups showed strong convergence in their dominant associated factors, with effects concentrated within 800 m. WF diversity was most strongly associated with P_CO at 500 m, whereas WB responded most strongly to COHESION across 400–800 m. As spatial extent extended beyond 2000 m, the ecological scores of landscape variables approached neutrality, suggesting that local microhabitat quality was most closely associated with WB distributions during the breeding and post-fledging period.
Figure 5.
Effects of landscape structure on WF and WB across spatial scales and seasons. VIP curves derived from PLSR models illustrate the relative importance of landscape metrics across spatial buffer scales during (a) the breeding and post-fledging period and (b) the wintering and stopover period. Colored lines represent significant drivers (VIP > 1), while grey lines are non-significant.
During the wintering and stopover period (Figure 5b), this shared pattern became decoupled and responses diverged sharply. WF exhibited evident scale expansion, with its characteristic scale shifting to 1500–2000 m, accompanied by a transition in dominant associated factors from hydrological features to P_VE and P_IS. In contrast, WB showed no comparable shift in characteristic scale and remained closely linked to local hydrological dynamics, although SHDI began to contribute at 1800 m. Together, these patterns suggest that while WF increasingly draws on broader landscape resources as winter refugia, WB distributions remain more closely tied to the local configuration of available hydrological habitats.
3.3.2. Differentiation Within Waterfowl: Foraging Modes and Body Size
PLSR results suggested that for WF, foraging mode and body-size attributes were strongly associated with responses along multi-scale landscape gradients. This association pattern was not static but varied markedly with seasonal transitions: during the breeding and post-fledging period, responses were primarily associated with local habitat quality, whereas during the wintering and stopover period they increasingly corresponded to niche trade-offs between resource acquisition and refuge requirements across functional groups.
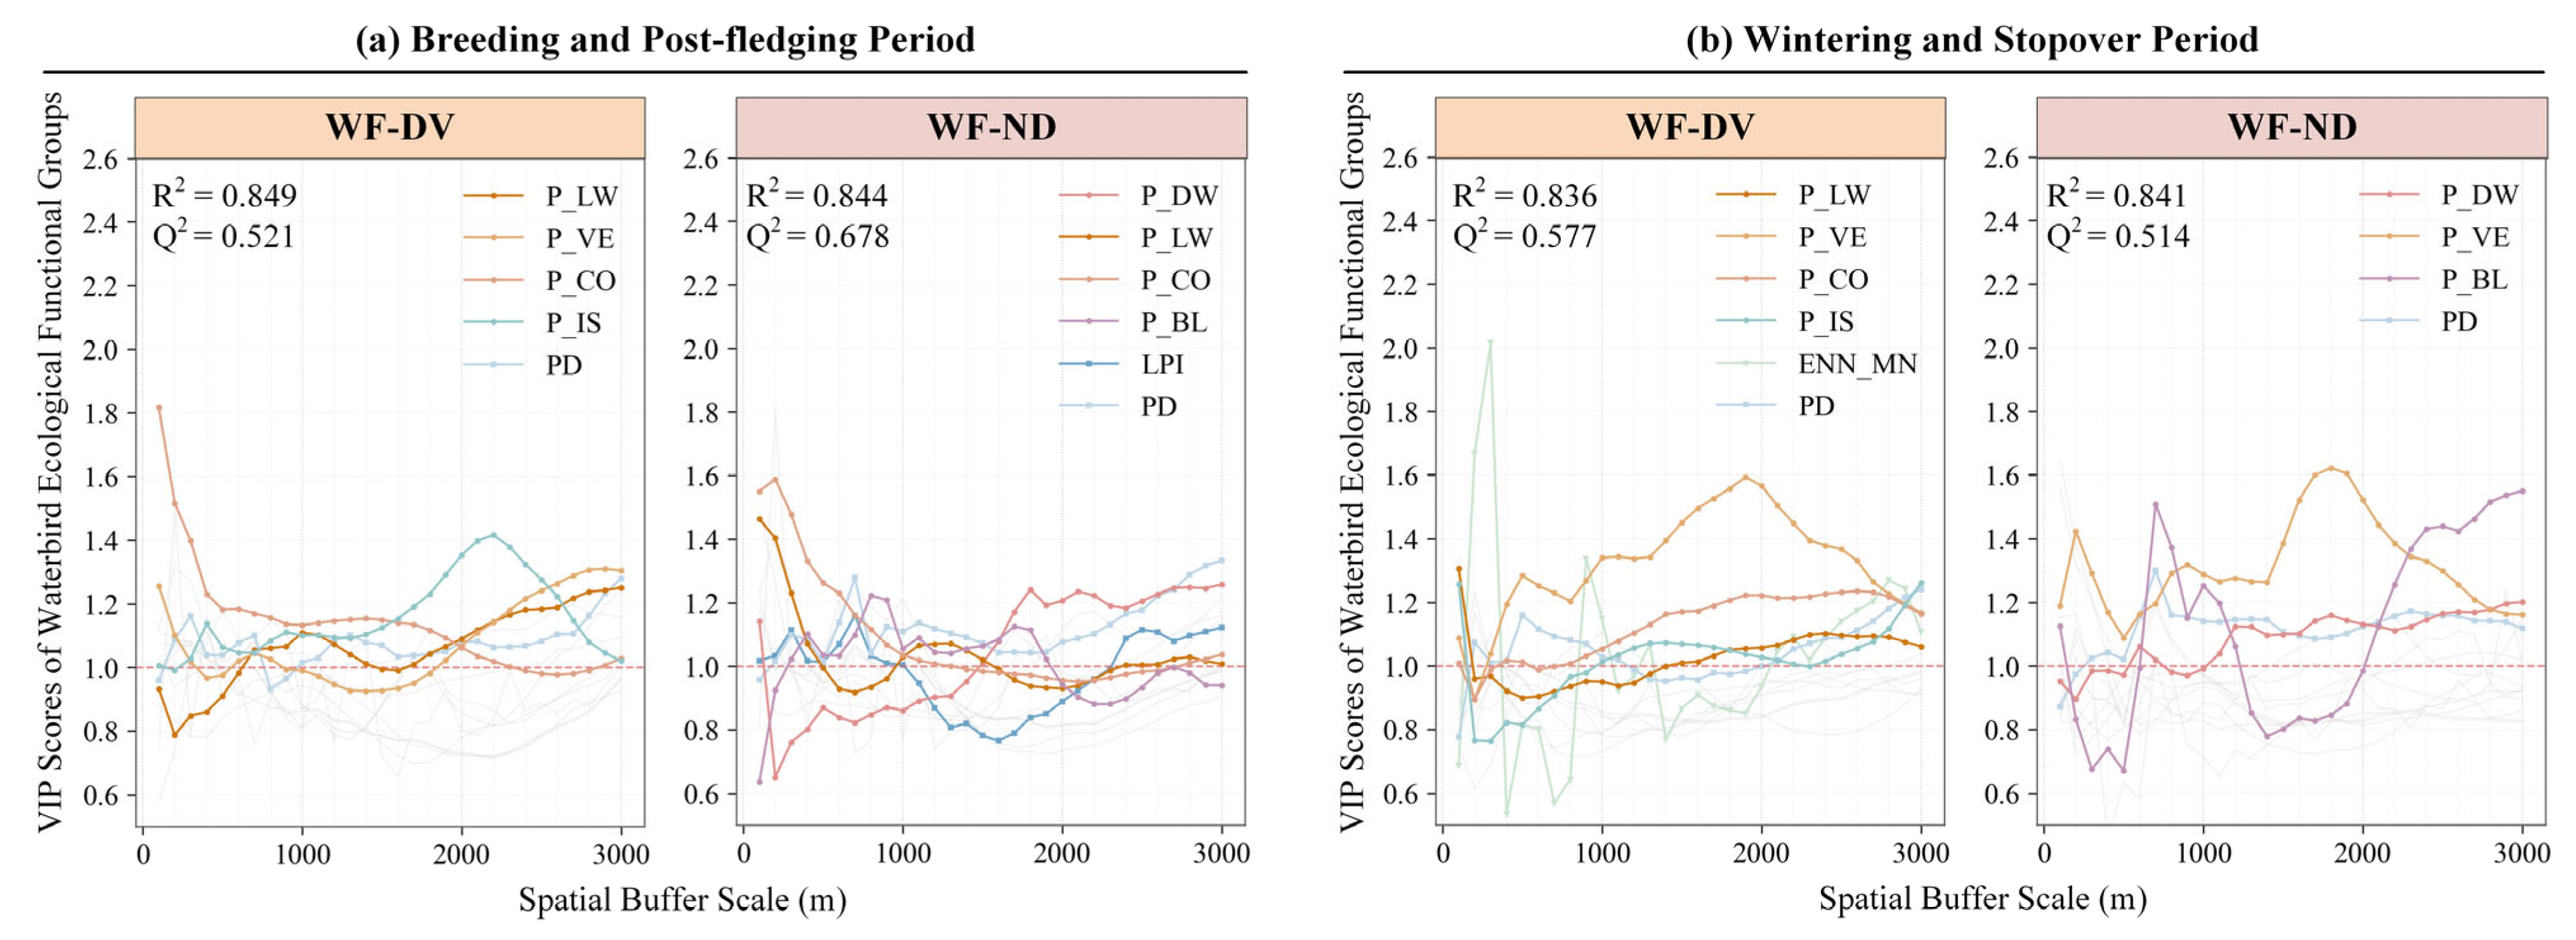
Constraints related to foraging mode on the scale of habitat use were mainly manifested through differentiated demands for waterbody openness and connectivity (Figure 6). During the breeding and post-fledging period (Figure 6a), diving and non-diving groups showed strong convergence in scale dependence, displaying a typical U-shaped pattern, and were predominantly associated with P_CO at 600 m, suggesting that habitat selection was largely linked to micro-environmental safety conditions associated with nesting sites. In the wintering and stopover period (Figure 6b), however, response patterns diverged sharply. WF-DV was extremely sensitive to landscape isolation, with the VIP peak of ENN_MN occurring at approximately 300 m, indicating a fine-scale association. This pattern highlights habitat fragmentation as a critical bottleneck for wintering diving species, as fragmented waterbodies may substantially increase energetic costs of diving foraging and exposure to predation risk. In contrast, WF-ND exhibited a more flexible space-use strategy: it was associated with P_BL at 600–1000 m, indicating preference for open bare habitats at intermediate extents, and shifted at approximately 1900 m toward a stronger association with P_VE as a broader-scale source of shelter.
Figure 6.
Effects of landscape structure on WF-DV and WF-ND across spatial scales and seasons. VIP curves derived from PLSR models illustrate the relative importance of landscape metrics across spatial buffer scales during (a) the breeding and post-fledging period and (b) the wintering and stopover period. Colored lines represent significant drivers (VIP > 1), while grey lines are non-significant.
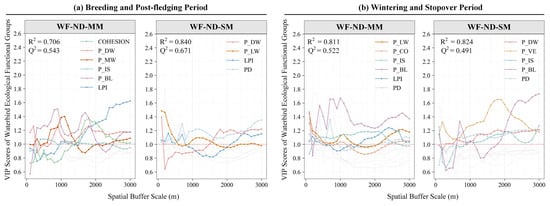
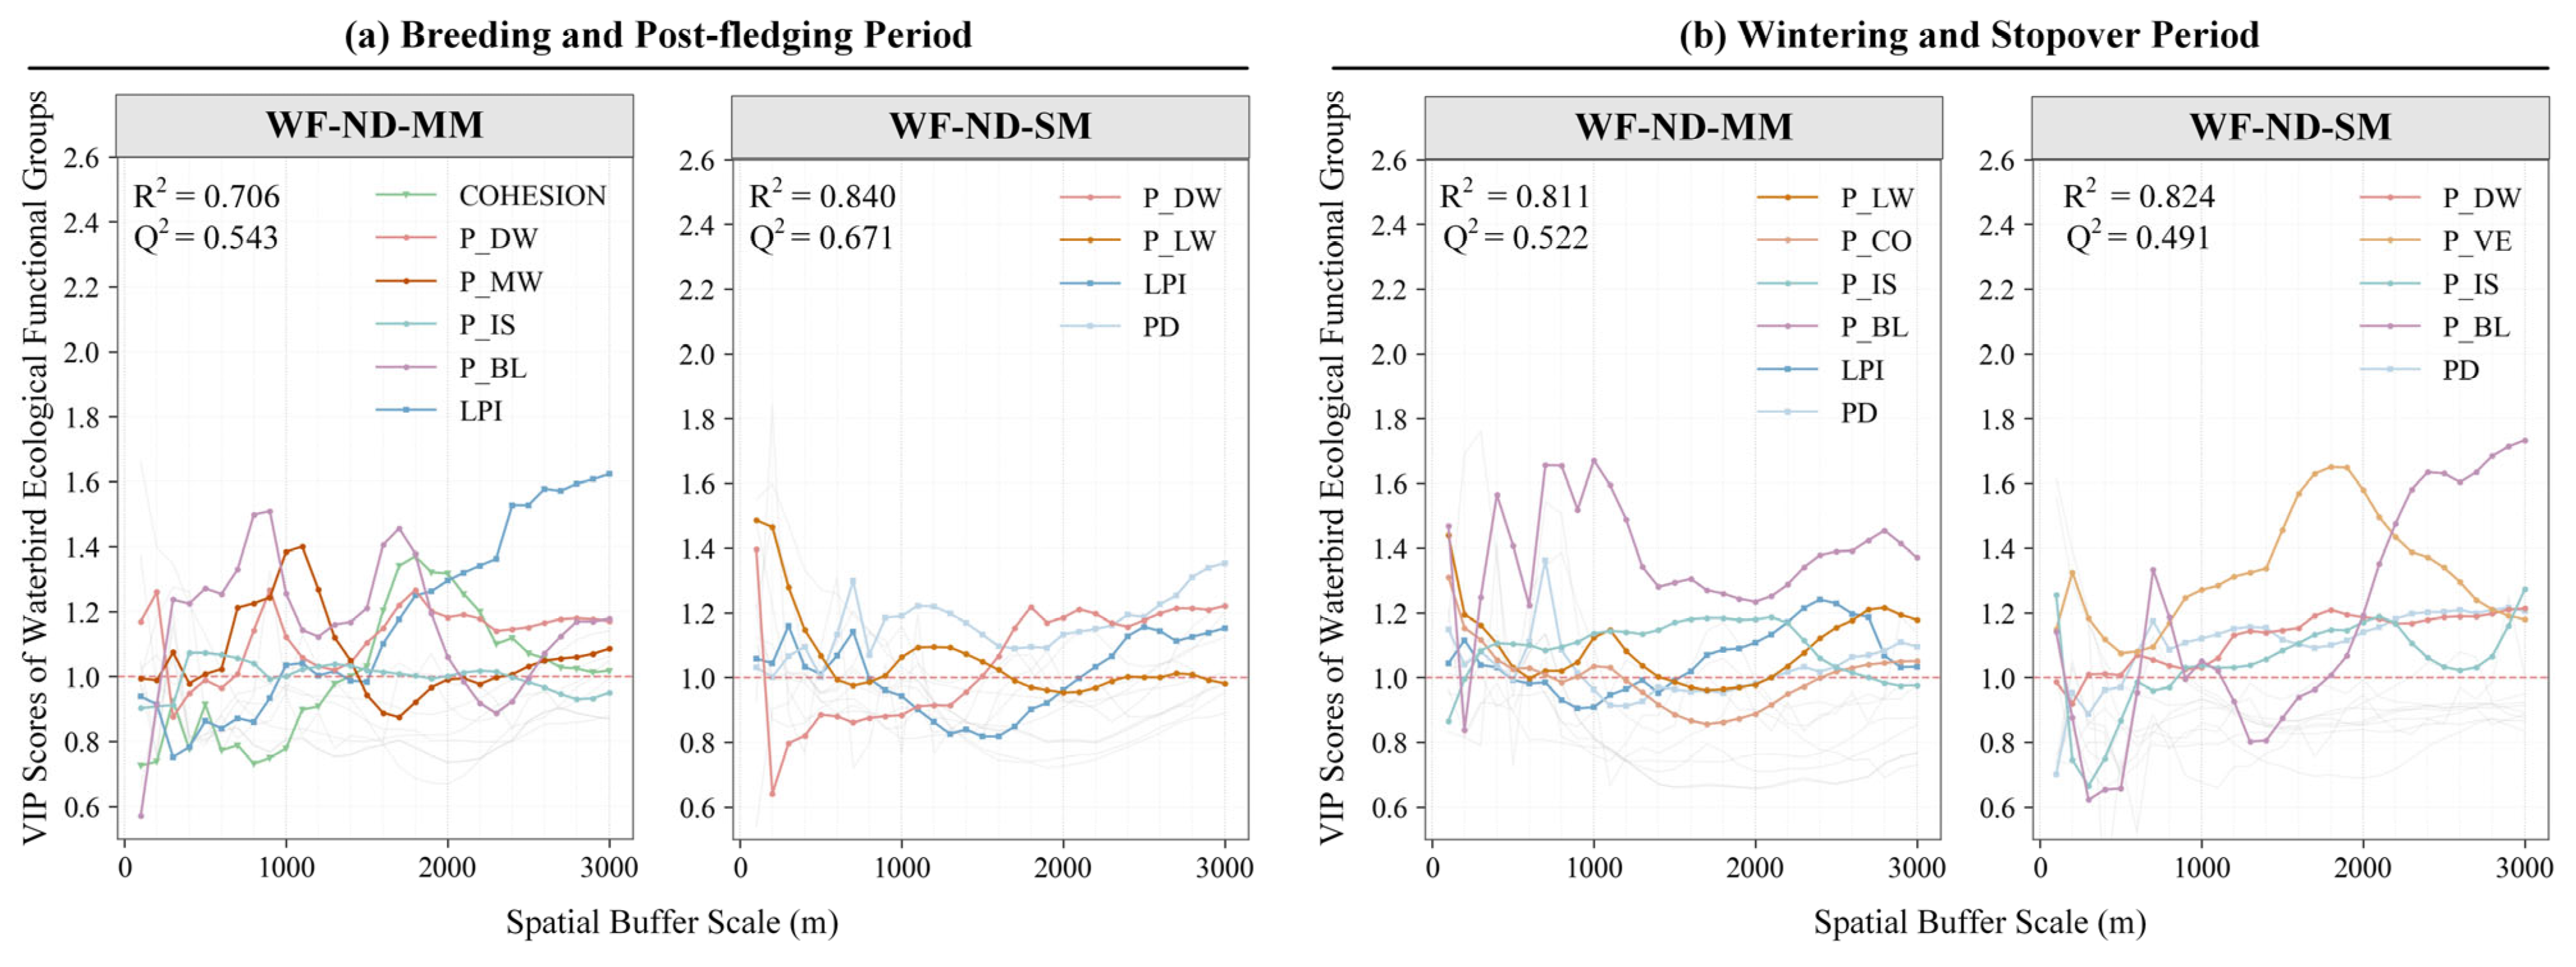
Body size represents a key biological trait in birds and exerted a strong filtering effect on the scale of habitat use, with particularly pronounced effects observed in small-bodied species (Figure 7). During the breeding and post-fledging period, WF-ND-SM was most strongly associated with shallow water availability P_LW at microhabitat scales below 500 m, consistent with limited dispersal capacity and a strong dependence on shallow foraging habitats (Figure 7a). As body size increased, WF-ND-MM showed progressively weaker dependence on local substrate conditions, suggesting greater environmental flexibility.
Figure 7.
Effects of landscape structure on WF-ND-MM and WF-ND-SM across spatial scales and seasons. VIP curves derived from PLSR models illustrate the relative importance of landscape metrics across spatial buffer scales during (a) the breeding and post-fledging period and (b) the wintering and stopover period. Colored lines represent significant drivers (VIP > 1), while grey lines are non-significant. WF-ND-LM was excluded from VIP analyses because the PLSR model was unreliable.
During the wintering and stopover period, small-bodied waterfowl exhibited a distinct scale shift (Figure 7b). Their dominant response extended from local habitats to broader spatial extents between 1500 and 2000 m and became primarily associated with vegetation cover P_VE. This seasonal transition is consistent with a hierarchical use of spatial resources, in which local foraging requirements are met while broader-scale vegetation may provide landscape-level shelter. In contrast, WF-ND-MM during the wintering and stopover period showed strong associations with bare land P_BL within spatial extents of 600–1000 m. These patterns suggest size-dependent differentiation in spatial resource use and refuge strategies during the wintering and stopover period: medium -bodied waterfowl tend to exploit open habitats within relatively confined spatial ranges and remain more strongly associated with local habitat patches, rather than tracking broader-scale landscape vegetation as observed in small-bodied species.
3.3.3. Differentiation Within Waders: Morphological Constraints
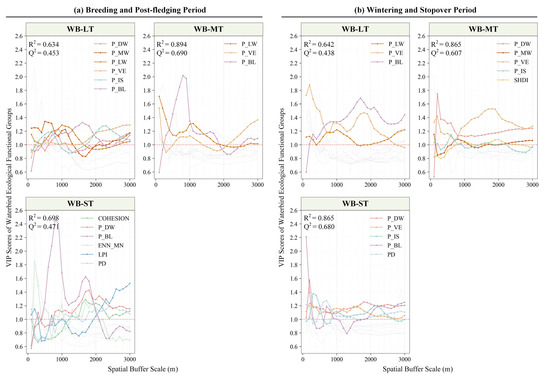
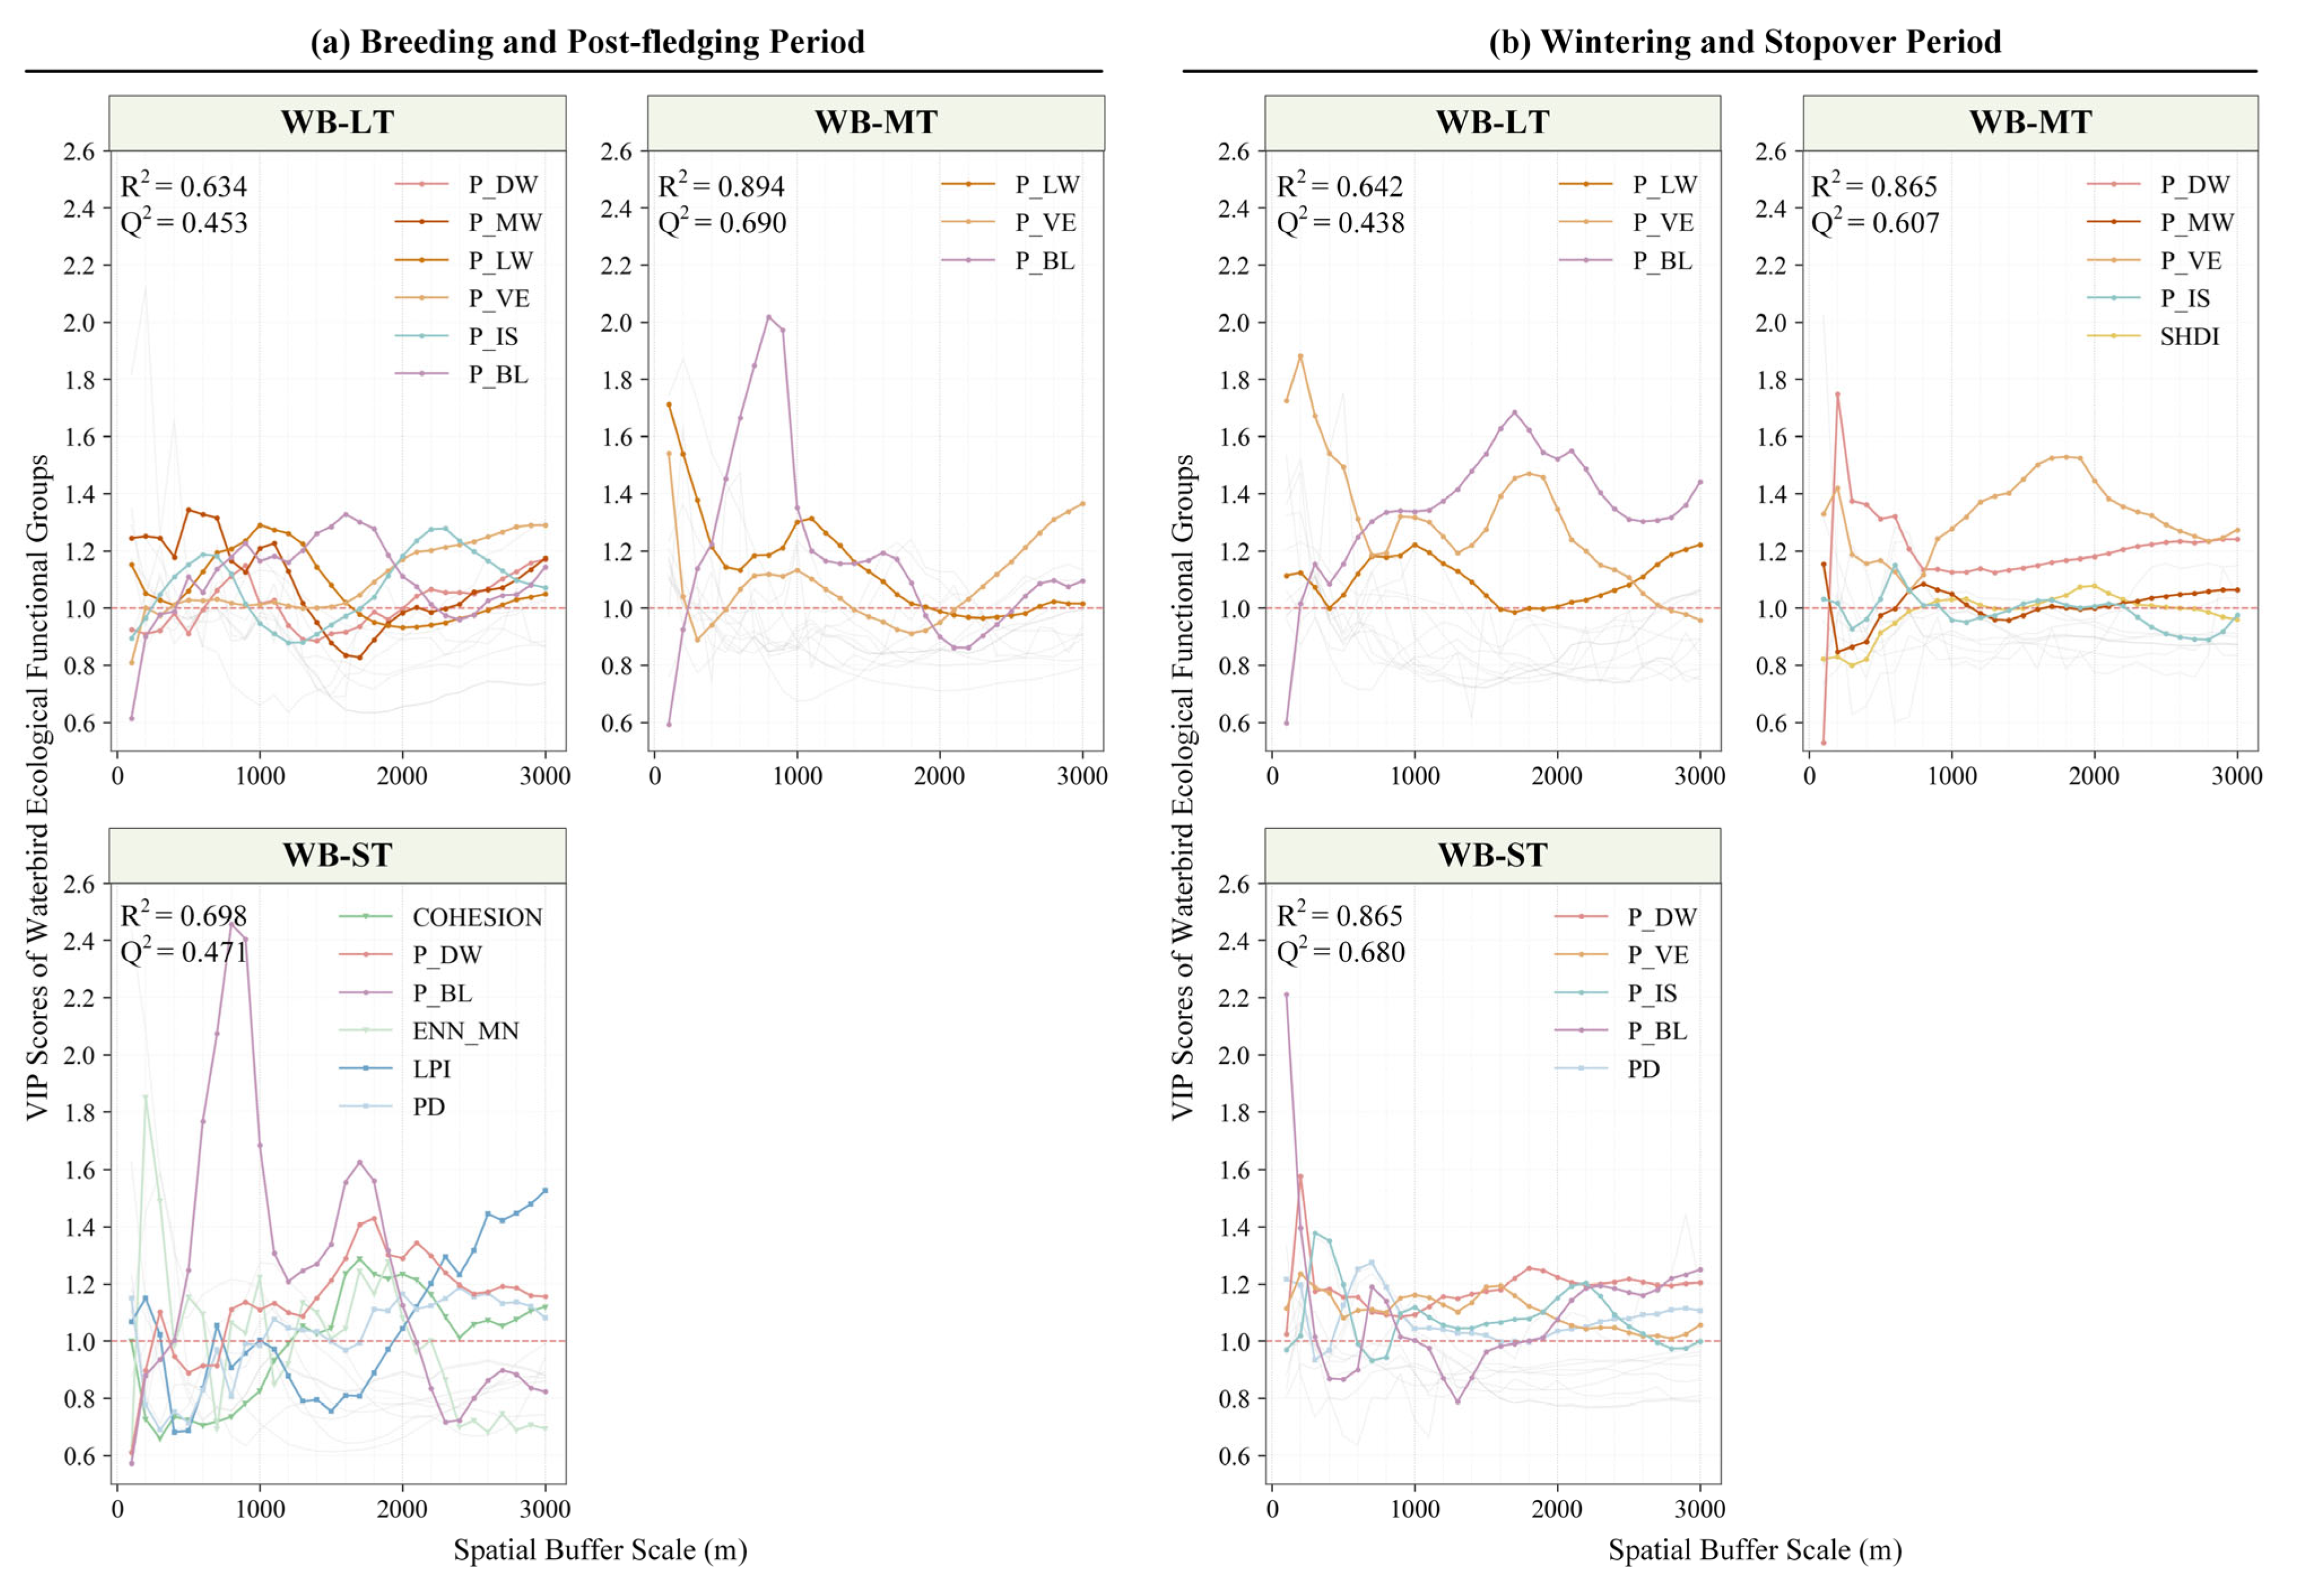
Tarsus Length, as an indicator of wading capacity, was strongly associated with the characteristic response domain of WB. WB-ST exhibited a typical specialist pattern (Figure 8). During the breeding and post-fledging period, they were highly sensitive to COHESION at around 200 m and to P_BL at 800 m (Figure 8a). This local dependence was further strengthened during the wintering and stopover period, when model performance was particularly high with R2 reaching 0.865 (Figure 8b). The effects of P_BL and P_DW peaked at 100–200 m and decayed rapidly with increasing distance, suggesting that immediate accessibility to mudflats and water edges was closely associated with their distributions.
Figure 8.
Effects of landscape structure on WB-LT, WB-MT, and WB-ST across spatial scales and seasons. VIP curves derived from PLSR models illustrate the relative importance of landscape metrics across spatial buffer scales during (a) the breeding and post-fledging period and (b) the wintering and stopover period. Colored lines represent significant drivers (VIP > 1), while grey lines are non-significant.
In contrast, WB-LT and WB-MT showed broader spatial integration capacity. While their responses at local scales were still closely linked to hydrological factors, during the wintering and stopover period their response domain extended to broader landscape contexts. At spatial extents of 1500 m and beyond, P_VE and P_BL emerged as the primary associated factors. Together, these results suggest that larger waders, which are less constrained by water-depth limitations, may integrate complementary resources across a wider landscape matrix, whereas smaller waders remain tightly tied to local habitat configuration.
4. Discussion
4.1. Seasonal Dynamics of the Scale of Effect
This study shows that the characteristic scales at which landscape structure is associated with waterbird communities shift systematically across phenological stages, with dominant associated factors transitioning from local core areas below 800 m during the breeding and post-fledging period to broader landscape extents of 1500–2000 m during the wintering and stopover period (Figure 5). These results suggest that waterbird diversity responses to landscape elements are not static properties operating uniformly through time, but rather reflect a dynamic adaptive process related to the interaction between spatiotemporal resource configuration and seasonally varying behavioral strategies.
These findings extend the current understanding of multi-scale responses of wetland birds by explicitly incorporating temporal dynamics. Although previous studies have documented scale-dependent effects of landscape factors [34,35], most analyses have been based on annual or cross-seasonal aggregates, and such temporal homogenization can mask ecological heterogeneity among phenological stages. Our results further suggest that this practice may lead to a systematic underestimation of habitat requirements during the wintering and stopover period, thereby potentially biasing assessments of wetland function and carrying capacity.
During the breeding and post-fledging period, the contraction of characteristic response scales to below 800 m may reflects strong spatial constraints imposed by reproductive activities. Nest-site centrality is associated with frequent movements between nests and foraging areas, while the limited mobility of juveniles and their heightened sensitivity to risk may further reduce the effective spatial domain of habitat use [36]. Under these conditions, habitat quality and anthropogenic disturbance within local areas around nesting sites can be especially influential in shaping waterbird distributions and diversity patterns. Similar scale contraction has been reported in taxa with constrained mobility or strong breeding-season spatial limitation, where responses to landscape structure are concentrated at relatively fine spatial scales [1,5].
Following the transition into the wintering and stopover period, the environmental matrix of the Qilihai Wetland is characterized by pronounced reorganization. Water-level recession exposes extensive bare ground and shallow-water areas, while emergent and herbaceous vegetation senesces and collapses, shifting resource availability from relatively continuous to highly fragmented and spatially discrete patterns. Freed from nesting constraints, waterbirds, particularly WF, may adopt a landscape complementation strategy, expanding functional activity ranges to integrate separated resource patches [6]. During this period, night-time roosts are often located on open water or deeper ponds, whereas profitable feeding sites are concentrated on exposed mudflats, shallow margins and surrounding cropland, which act as a critical energy buffer against natural resource depletion, so birds frequently move between spatially separated roosting and foraging areas [37,38]. Consequently, characteristic response scales expand to 1500–2000 m, suggesting integrated responses to resource configuration and connectivity at broader spatial levels. This pattern is consistent with work emphasizing the need to incorporate landscape-level resource arrangement into habitat quality assessment [1], and it also offers additional support from an inland-wetland context for mechanisms reported in the Bohai Bay region, where waterbirds expand movement ranges to buffer seasonal resource fluctuations [29].
4.2. Mechanisms of Functional Trait Filtering
Multi-scale analyses further suggest that scale-dependent response patterns are closely linked to functional traits and group-specific strategies. Differences in sensitivity to landscape fragmentation among functional groups may reflect the combined outcome of accessibility constraints, energetic budgets, and behavioral plasticity. Landscape structure can alter the spatial availability of resources and patterns of risk exposure, while trait combinations may influence how different groups differ in exploitable resource ranges, costs of cross-patch movement, and substitution strategies. These interactions may contribute to distinct dominant associated factors and characteristic scales of effect [39,40].
For waders, tarsus length is closely related to the usable water-depth window and thereby is expected to influence the set of accessible resources within the landscape. Our results show that WB-ST exhibits strong sensitivity to hydrological connectivity at around 200 m during the breeding and post-fledging period and displays clear selection for P_BL at approximately 800 m (Figure 8). During the wintering and stopover period, dependence on local shallow-water–mudflat mosaics becomes even more pronounced. Because wading depth is strictly limited, foraging and resting activities of WB-ST are concentrated along narrow water–land transition zones, where small-scale fluctuations in water level and microtopography rapidly alter habitat connectivity and exposure. Under such conditions, differences in resource continuity and accessibility may be amplified, corresponding to heightened sensitivity to local fragmentation [12,41]. In contrast, WB-MT and WB-LT are able to exploit a wider range of water depths and maintain higher cross-patch accessibility, may allow them to integrate shallow and deep water patches with bare land resources across broader spatial extents and to achieve spatial compensation beyond local scales [42,43].
Within waterfowl groups, foraging mode and associated energetic constraints may represent an important explanatory pathway for scale-dependent responses (Figure 6). WF-DV shows strong requirements for waterbody aggregation at around 300 m, suggesting that continuous or clustered water habitats are critical during the wintering and stopover period. Diving foraging entails high energetic costs and tight time budgets; when deep-water patches become dispersed, increased search effort and cross-patch movement may reduce net energetic gain, favoring selection for aggregated water structures at fine spatial scales. Although flight accounts for a small proportion of overall activity, its energetic cost is substantial, rendering patch configuration potentially relevant to energy balance and space use [9]. In contrast, WF-ND displays greater scale flexibility. During the wintering and stopover period, some WF-ND groups exploit vegetation cover at around 1900 m to compensate for seasonal shortages of local aquatic resources and make broader use of reedbeds, cropland edges, and other non-typical wetland habitats. This contrast suggests that higher behavioral plasticity and resource substitution capacity may buffer WF-ND against seasonal resource reorganization, allowing compensation through landscape-scale integration rather than confinement to local habitats [9,44]. In contrast, WF-ND-LM often shows regular commuting movements between open-water roosts and terrestrial feeding areas, with one-way foraging flights commonly spanning several kilometers [45]. Such broad-ranging, food-driven space use frequently involves croplands and can be sensitive to local depletion and human disturbance around roost–feeding complexes [46,47], which may weaken the correspondence between observed diversity patterns and the within-wetland landscape metrics used here and thereby contribute to the unstable PLSR performance for this subgroup.
4.3. Implications for Wetland Monitoring via Time-Series Remote Sensing
The results of this study suggest that the effectiveness of wetland monitoring is influenced not only on the spatial accuracy of land-cover classification, but more critically on whether temporal resolution is sufficient to match waterbird life-history rhythms and hydrological processes. Conventional wetland monitoring often relies on annual composite imagery or single-date snapshots, and such static perspectives can easily obscure transient habitat features that are nonetheless crucial for biological communities. In the Qilihai Wetland, water recession during the wintering and stopover period can rapidly reorganize the mosaic of shallow water and mudflats. Waders are highly sensitive to the timing, duration, and spatial connectivity of this habitat window. When annual composites or single-date land-cover maps are used as substitutes for process-based information, these dynamic shallow-water and mudflat elements are likely to be averaged out or misclassified as stable water bodies or bare land, which may result in underestimation of habitat availability and carrying capacity during key phenological periods.
Within this framework, the value of time-series remote sensing lies in advancing “wetland types” toward hydrological process variables that can be directly linked to ecological interpretation, thereby providing quantifiable boundaries for habitat windows [3]. By incorporating Dynamic World land-cover classifications derived from high-frequency Sentinel-2 data, this study successfully captured pulse-like expansions of transient habitats and identified the primary associated factors of waterbird diversity across multiple periods. These results further highlight that water-level regulation should not be treated merely as background environmental disturbance; rather, it represents a key management variable that directly governs the availability and intensity of use of shallow-water habitats [4,15].
Although high-frequency remote sensing provides valuable phenological insights, the reliance on a globally automated land-cover product inevitably introduces some class ambiguity in wetland transition zones at fine spatial scales [22,48]. In addition, cloud-induced observation gaps and mixed-pixel effects at 10 m resolution may reduce the geometric fidelity of narrow shorelines and small, temporary patches [49]. Consequently, such high-frequency automated land-cover data are better suited to extracting relative dynamics of habitat windows—such as timing of occurrence, persistence, spatial configuration, and episodic anomalies—rather than to deriving survey-grade estimates of absolute area for any single class or precise boundaries of small patches. Future work that integrates water-level records with targeted high-resolution imagery and/or field validation would further constrain classification uncertainty and strengthen process-based interpretation.
Accordingly, future wetland conservation practices should move beyond the delineation of static geographic boundaries and adopt dynamic management strategies grounded in phenological processes. Particular attention should be given to temporary wetland patches created by seasonal hydrological fluctuations, ensuring that these functional units—critical at the broader landscape scale for sustaining wintering waterbird communities—are effectively protected, thereby maintaining the ecological integrity of key nodes along the East Asian–Australasian Flyway [50].
5. Conclusions
By integrating multi-temporal remote sensing data with high-frequency bird surveys, this study shows that waterbird diversity in the Qilihai Wetland is nonlinearly associated with multi-scale landscape structure. Habitat selection is not well described by a single spatial scale, but instead appears to reflect interactions among seasonal rhythms, functional traits, and landscape scale.
Seasonal landscape succession is closely associated with shifts in community spatial organization. During the breeding and post-fledging period, bird communities exhibit relatively stable spatial distributions that are more closely linked to microhabitat quality around breeding sites. In contrast, during the wintering and stopover period, community distributions become highly dynamic and spatially dispersed. In particular, vegetation habitats show contrasting seasonal associations with diversity patterns, shifting from relatively homogeneous conditions during breeding to acting as key refugia in winter, where high-quality vegetation patches are associated with elevated species diversity.
Functional groups further exhibit differentiated scale-dependent response strategies with strong seasonal dependence. During the breeding and post-fledging period, responses of WF and WB converge at local scales and are primarily associated with habitat conditions within 800 m. During the wintering and stopover period, these responses diverge markedly: WB remains closely tied to fine-scale shallow-water habitats and hydrological connectivity, whereas WF shows pronounced scale expansion and is increasingly associated with vegetation cover and impervious surfaces at broader landscape scales.
Finally, behavioral and morphological traits are closely associated with characteristic scales of effect. Diving behavior is associated with higher sensitivity to landscape fragmentation, constraining WF-DV to aggregated waterbodies at fine spatial scales, whereas tarsus length is closely related to exploitable water depth in WB, resulting in reduced adaptive flexibility to local habitat change in WB-ST relative to WB-LT. Collectively, these findings highlight the necessity of adopting phenology-informed conservation strategies. From a management perspective, the identified characteristic scales and dominant associated factors can inform priorities for maintaining shallow-water and mudflat connectivity for waders during the breeding and post-fledging period, and for sustaining clustered deep-water roosting habitats and broader-scale landscape context for wintering waterfowl during the wintering and stopover period.
Author Contributions
Conceptualization, J.F., L.C. and Y.L.; methodology, J.F. and L.C.; software, J.F. and P.D.; formal analysis, J.F., L.C. and Y.R.; investigation, J.F., L.C. and X.M.; data curation, J.F., L.C. and X.M.; writing—original draft preparation, J.F. and L.C.; writing—review and editing, Y.L., P.D., X.M. and Z.Z.; visualization, J.F.; supervision, Y.L. and Z.Z.; funding acquisition, Y.L. and L.C. All authors have read and agreed to the published version of the manuscript.
Funding
This research was funded by the National Natural Science Foundation of China (Grant No. 42501422), the Natural Science Foundation of Xiamen Municipality (Grant No. 3502Z202473059), the 2025 Tianjin Municipal Bureau of Planning and Natural Resources Task-Oriented Open Competition Program (Grant No. 2025GHZYJB005).
Data Availability Statement
The raw data supporting the conclusions of this article will be made available by the authors on request.
Acknowledgments
We thank our research team members for their support in data analysis and methodological refinement. We are also grateful to our institution and collaborative platforms for providing resources and technical support throughout this study. We thank the anonymous reviewers for their constructive comments and suggestions.
Conflicts of Interest
The authors declare no conflicts of interest.
References
- Mott, R.; Prowse, T.A.; Jackson, M.V.; Rogers, D.J.; O’Connor, J.A.; Brookes, J.D.; Cassey, P. Measuring habitat quality for waterbirds: A review. Ecol. Evol. 2023, 13, e9905. [Google Scholar] [CrossRef] [Scilit] [PubMed]
- Becker, F.K.; Boyes, R.S.; Wittmer, H.U.; Inman, V.; Marsland, S. Landscape-wide pulse events predict trait-based responses among wetland birds in perennial channels of a dryland wetland. Ecol. Appl. 2024, 34, e2931. [Google Scholar] [CrossRef] [Scilit] [PubMed]
- Reiter, M.E.; Elliott, N.; Veloz, S.; Jongsomjit, D.; Hickey, C.M.; Merrifield, M.; Reynolds, M.D. Spatio-temporal patterns of open surface water in the Central Valley of California 2000–2011: Drought, land cover, and waterbirds. JAWRA J. Am. Water Resour. Assoc. 2015, 51, 1722–1738. [Google Scholar] [CrossRef] [Scilit]
- Schaffer-Smith, D.; Swenson, J.J.; Reiter, M.E.; Isola, J.E. Quantifying shorebird habitat in managed wetlands by modeling shallow water depth dynamics. Ecol. Appl. 2018, 28, 1534–1545. [Google Scholar] [CrossRef] [Scilit]
- Jackson, H.B.; Fahrig, L. Are ecologists conducting research at the optimal scale? Glob. Ecol. Biogeogr. 2015, 24, 52–63. [Google Scholar] [CrossRef] [Scilit]
- Dunning, J.B.; Danielson, B.J.; Pulliam, H.R. Ecological processes that affect populations in complex landscapes. Oikos 1992, 65, 169–175. [Google Scholar] [CrossRef] [Scilit]
- Gao, B.; Gong, P.; Zhang, W.; Yang, J.; Si, Y. Multiscale effects of habitat and surrounding matrices on waterbird diversity in the Yangtze River Floodplain. Landsc. Ecol. 2021, 36, 179–190. [Google Scholar] [CrossRef] [Scilit]
- Adler, K.; Jedicke, E. Landscape metrics as indicators of avian community structures—A state of the art review. Ecol. Indic. 2022, 145, 109575. [Google Scholar] [CrossRef] [Scilit]
- McDuie, F.; Casazza, M.L.; Overton, C.T.; Herzog, M.P.; Hartman, C.A.; Peterson, S.H.; Feldheim, C.L.; Ackerman, J.T. GPS tracking data reveals daily spatio-temporal movement patterns of waterfowl. Mov. Ecol. 2019, 7, 6. [Google Scholar] [CrossRef] [Scilit]
- Melo, I.; Ochoa-Quintero, J.M.; de Oliveira Roque, F.; Dalsgaard, B. A review of threshold responses of birds to landscape changes across the world. J. Field Ornithol. 2018, 89, 303–314. [Google Scholar] [CrossRef] [Scilit]
- Tobias, J.A.; Sheard, C.; Pigot, A.L.; Devenish, A.J.; Yang, J.; Sayol, F.; Neate-Clegg, M.H.; Alioravainen, N.; Weeks, T.L.; Barber, R.A. AVONET: Morphological, ecological and geographical data for all birds. Ecol. Lett. 2022, 25, 581–597. [Google Scholar] [CrossRef] [Scilit] [PubMed]
- Norazlimi, N.A.; Ramli, R. The relationships between morphological characteristics and foraging behavior in four selected species of shorebirds and water birds utilizing tropical mudflats. Sci. World J. 2015, 2015, 105296. [Google Scholar] [CrossRef] [Scilit] [PubMed]
- Aarif, K.; Zouhar, J.; Musilova, Z.; Musil, P.; Nefla, A.; Muzaffar, S.B.; Rubeena, K. Bill length of non-breeding shorebirds influences the water depth preferences for foraging in the west coast of India. Ecol. Evol. 2024, 14, e70396. [Google Scholar] [CrossRef] [Scilit] [PubMed]
- Li, J.; Hughes, A.C.; Dudgeon, D. Mapping wader biodiversity along the East Asian—Australasian flyway. PLoS ONE 2019, 14, e0215877, Erratum in PLoS ONE 2019, 14, e0210552. https://doi.org/10.1371/journal.pone.0210552. [Google Scholar] [CrossRef] [Scilit]
- Sesser, K.A.; Iglecia, M.; Reiter, M.E.; Strum, K.M.; Hickey, C.M.; Kelsey, R.; Skalos, D.A. Waterbird response to variable-timing of drawdown in rice fields after winter-flooding. PLoS ONE 2018, 13, e0204800. [Google Scholar] [CrossRef] [Scilit]
- Frantz, D. FORCE—Landsat + Sentinel-2 analysis ready data and beyond. Remote Sens. 2019, 11, 1124. [Google Scholar] [CrossRef] [Scilit]
- Brown, C.F.; Brumby, S.P.; Guzder-Williams, B.; Birch, T.; Hyde, S.B.; Mazzariello, J.; Czerwinski, W.; Pasquarella, V.J.; Haertel, R.; Ilyushchenko, S. Dynamic World, Near real-time global 10 m land use land cover mapping. Sci. Data 2022, 9, 251. [Google Scholar] [CrossRef] [Scilit]
- Chong, I.-G.; Jun, C.-H. Performance of some variable selection methods when multicollinearity is present. Chemom. Intell. Lab. Syst. 2005, 78, 103–112. [Google Scholar] [CrossRef] [Scilit]
- Wold, S.; Sjöström, M.; Eriksson, L. PLS-regression: A basic tool of chemometrics. Chemom. Intell. Lab. Syst. 2001, 58, 109–130. [Google Scholar] [CrossRef] [Scilit]
- Carrascal, L.M.; Galván, I.; Gordo, O. Partial least squares regression as an alternative to current regression methods used in ecology. Oikos 2009, 118, 681–690. [Google Scholar] [CrossRef] [Scilit]
- Winter, M.; Johnson, D.H.; Shaffer, J.A. Does body size affect a bird’s sensitivity to patch size and landscape structure? Condor 2006, 108, 808–816. [Google Scholar] [CrossRef]
- Xu, P.; Tsendbazar, N.-E.; Herold, M.; De Bruin, S.; Koopmans, M.; Birch, T.; Carter, S.; Fritz, S.; Lesiv, M.; Mazur, E. Comparative validation of recent 10 m-resolution global land cover maps. Remote Sens. Environ. 2024, 311, 114316. [Google Scholar] [CrossRef] [Scilit]
- Van Deventer, H.; Apleni, P.; Adams, J.B.; Riddin, T.; Whitfield, E.; Machite, A.; Van Niekerk, L.; Madasa, A. Assessing the feasibility of mapping changes of ecosystem functional groups in South African estuaries using Landsat and Sentinel images of 1990, 2014, 2018 and 2020. Wetl. Ecol. Manag. 2025, 33, 12. [Google Scholar] [CrossRef] [Scilit]
- McGarigal, K.; Cushman, S.A.; Ene, E. FRAGSTATS v4: Spatial Pattern Analysis Program for Categorical Maps, Computer software program produced by the authors; University of Massachusetts: Amherst, MA, USA, 2023. Available online: https://www.fragstats.org.
- Burke, D.; Nol, E. Landscape and fragment size effects on reproductive success of forest-breeding birds in Ontario. Ecol. Appl. 2000, 10, 1749–1761. [Google Scholar] [CrossRef] [Scilit]
- Taft, O.W.; Haig, S.M. Importance of wetland landscape structure to shorebirds wintering in an agricultural valley. Landsc. Ecol. 2006, 21, 169–184. [Google Scholar] [CrossRef] [Scilit]
- Bibby, C.J. Bird Census Techniques; Elsevier: Amsterdam, The Netherlands, 2000. [Google Scholar]
- Hutto, R.L. Habitat selection by nonbreeding, migratory land birds. In Habitat Selection in Birds; Academic Press, Inc.: Orlando, FL, USA, 1985. [Google Scholar]
- Yang, H.-Y.; Chen, B.; Barter, M.; Piersma, T.; Zhou, C.-F.; Li, F.-S.; Zhang, Z.-W. Impacts of tidal land reclamation in Bohai Bay, China: Ongoing losses of critical Yellow Sea waterbird staging and wintering sites. Bird Conserv. Int. 2011, 21, 241–259. [Google Scholar] [CrossRef] [Scilit]
- Gotelli, N.J.; Colwell, R.K. Quantifying biodiversity: Procedures and pitfalls in the measurement and comparison of species richness. Ecol. Lett. 2001, 4, 379–391. [Google Scholar] [CrossRef] [Scilit]
- Jackson, M.V.; Mott, R.; Delean, S.; Hunt, B.J.; Brookes, J.D.; Cassey, P.; Prowse, T.A. Shorebird habitat selection and foraging behaviour have important implications for management at an internationally important non-breeding wetland. Ecol. Solut. Evid. 2024, 5, e12316. [Google Scholar] [CrossRef] [Scilit]
- Efron, B.; Tibshirani, R.J. An Introduction to the Bootstrap; Chapman and Hall/CRC: Boca Raton, FL, USA, 1994. [Google Scholar]
- DiCiccio, T.J.; Efron, B. Bootstrap confidence intervals. Stat. Sci. 1996, 11, 189–228. [Google Scholar] [CrossRef] [Scilit]
- Chan, S.-F.; Severinghaus, L.L.; Lee, C.-K. The effect of rice field fragmentation on wintering waterbirds at the landscape level. J. Ornithol. 2007, 148, 333–342. [Google Scholar] [CrossRef] [Scilit]
- Peng, L.; Liu, Q.; Wang, Q.; Si, X.; Niu, H.; Zhang, H. Effects of urbanization and vegetation on bird diversity in a megacity of central China. Biol. Conserv. 2024, 297, 110718. [Google Scholar] [CrossRef] [Scilit]
- Bell, W.J. Central place foraging. In Searching Behaviour: The Behavioural Ecology of Finding Resources; Springer: Berlin/Heidelberg, Germany, 1990; pp. 171–187. [Google Scholar]
- Baldassarre, G.A.; Bolen, E.G. Field-feeding ecology of waterfowl wintering on the Southern High Plains of Texas. J. Wildl. Manag. 1984, 48, 63–71. [Google Scholar] [CrossRef] [Scilit]
- Laursen, K.; Kahlert, J.; Frikke, J. Factors affecting escape distances of staging waterbirds. Wildl. Biol. 2005, 11, 13–19. [Google Scholar] [CrossRef] [Scilit]
- Henle, K.; Davies, K.F.; Kleyer, M.; Margules, C.; Settele, J. Predictors of species sensitivity to fragmentation. Biodivers. Conserv. 2004, 13, 207–251. [Google Scholar] [CrossRef] [Scilit]
- Winter, M.; Johnson, D.H.; Shaffer, J.A.; Donovan, T.M.; Svedarsky, W.D. Patch size and landscape effects on density and nesting success of grassland birds. J. Wildl. Manag. 2006, 70, 158–172. [Google Scholar] [CrossRef] [Scilit]
- Taft, O.W.; Colwell, M.A.; Isola, C.R.; Safran, R.J. Waterbird responses to experimental drawdown: Implications for the multispecies management of wetland mosaics. J. Appl. Ecol. 2002, 39, 987–1001. [Google Scholar] [CrossRef] [Scilit]
- Baker, M.C. Morphological correlates of habitat selection in a community of shorebirds (Charadriiformes). Oikos 1979, 33, 121–126. [Google Scholar] [CrossRef] [Scilit]
- Ntiamoa-Baidu, Y.; Piersma, T.; Wiersma, P.; Poot, M.; Battley, P.; Gordon, C. Water depth selection, daily feeding routines and diets of waterbirds in coastal lagoons in Ghana. Ibis 1998, 140, 89–103. [Google Scholar] [CrossRef] [Scilit]
- Tajiri, H.; Ohkawara, K. The effects of flooding and plowing on foraging site selection by wintering dabbling ducks in rice fields. Ornithol. Sci. 2013, 12, 127–136. [Google Scholar] [CrossRef] [Scilit]
- Johnson, W.P.; Schmidt, P.M.; Taylor, D.P. Foraging flight distances of wintering ducks and geese: A review. Avian Conserv. Ecol. 2014, 9, 2. [Google Scholar] [CrossRef] [Scilit]
- VonBank, J.A.; Vasquez, J.P.; Loghry, J.P.; Kraai, K.J.; Cao, L.; Ballard, B.M. Wetland use by Greater White-fronted Geese and spatial overlap with waterfowl conservation priority areas in Mexico. Avian Conserv. Ecol. 2022, 17, 20. [Google Scholar] [CrossRef] [Scilit]
- Skyllberg, U.; Hansson, P.; Bernhardtson, P.; Naudot, E. The roost-feeding area complex of taiga bean goose Anser f. fabalis in the Ume River Delta Plains, Sweden—Foraging patterns in comparison with greylag goose Anser anser, whooper swan Cygnus cygnus and eurasian crane Grus grus. Ornis Svec. 2005, 15, 73–88. [Google Scholar] [CrossRef] [Scilit]
- Guo, M.; Li, J.; Sheng, C.; Xu, J.; Wu, L. A review of wetland remote sensing. Sensors 2017, 17, 777. [Google Scholar] [CrossRef] [Scilit]
- Wang, Y.; Zhou, X.; Ao, Z.; Xiao, K.; Yan, C.; Xin, Q. Gap-filling and missing information recovery for time series of modis data using deep learning-based methods. Remote Sens. 2022, 14, 4692. [Google Scholar] [CrossRef] [Scilit]
- Studds, C.E.; Kendall, B.E.; Murray, N.J.; Wilson, H.B.; Rogers, D.I.; Clemens, R.S.; Gosbell, K.; Hassell, C.J.; Jessop, R.; Melville, D.S. Rapid population decline in migratory shorebirds relying on Yellow Sea tidal mudflats as stopover sites. Nat. Commun. 2017, 8, 14895. [Google Scholar] [CrossRef] [Scilit]

Disclaimer/Publisher’s Note: The statements, opinions and data contained in all publications are solely those of the individual author(s) and contributor(s) and not of MDPI and/or the editor(s). MDPI and/or the editor(s) disclaim responsibility for any injury to people or property resulting from any ideas, methods, instructions or products referred to in the content. |
© 2026 by the authors. Licensee MDPI, Basel, Switzerland. This article is an open access article distributed under the terms and conditions of the Creative Commons Attribution (CC BY) license.