


Highlights
What are the main findings?
- Integrating 12 spectral features from multi-source remote sensing significantly improves landslide susceptibility modeling, increasing the AUC of tree-based ensemble models by up to 4.52%.
- A Stacking ensemble with Bagging_XGBoost as the meta-learner achieves the best performance (test AUC = 0.8611) and reveals that high and very high susceptibility zones are mainly concentrated in northeast Chongqing.
What are the implications of the main findings?
- The proposed framework demonstrates that spectral information is a valuable and underused data source for regional-scale landslide susceptibility mapping in complex mountainous terrain.
- This integrative modeling strategy is replicable and provides a scientific basis for refined risk zoning, early warning, and targeted mitigation planning in landslide-prone regions.
Abstract
Current research on landslide susceptibility modeling is often constrained by reliance on conventional topographic and geological features, potentially overlooking the discriminative power of surface material properties derived from multi-source remote sensing. This study aims to enhance the accuracy and reliability of susceptibility assessment by innovatively integrating spectral information and advanced machine learning techniques. Focusing on Chongqing, a landslide-prone mountainous region in China, this work conducted three innovative investigations: it (i) introduced 12 spectral features into the feature set; (ii) systematically evaluated spectral features contribution, redundancy, and set completeness through feature engineering; and (iii) implemented a comprehensive Stacking ensemble framework with multiple meta-learners and enhancement strategies (Bagging and Cross-Training) to identify the optimal integration scheme. The key results show that spectral features provided a significant positive impact, boosting the AUC of tree-based ensemble models by up to 4.52%. The optimal model, a Stacking ensemble with Bagging_XGBoost as the meta-learner, achieved a superior test AUC of 0.8611, outperforming all individual base learners. Furthermore, the spatial analysis revealed a concentration of high and very high susceptibility areas in Engineering Geological Zone I, which represents approximately 38% of such areas. This study provides a replicable framework for enhancing landslide susceptibility mapping through the integration of spectral features and ensemble learning, offering a scientific basis for targeted risk management and mitigation planning in complex mountainous terrains.
1. Introduction
Landslides represent one of the most devastating natural hazards globally, causing substantial economic losses and casualties annually, with climate change and intensified human activities exacerbating their frequency and magnitude [1]. The southwestern mountainous region of China, particularly Chongqing, exemplifies areas of exceptional landslide vulnerability due to its unique geomorphological setting at the transition zone between the first and second physiographic steps of China’s topographic staircase, characterized by steep terrain, complex geological structures dominated by sedimentary rock formations (predominantly Jurassic mudstone and sandstone interbedded sequences prone to weathering), deeply incised river valleys, and subtropical monsoon climate delivering concentrated precipitation [2,3,4,5,6]. The impoundment of the Three Gorges Reservoir since 2003 has further destabilized slopes through cyclic water level fluctuations (145–175 m elevation), inducing periodic saturation–drainage cycles that reduce effective stress and trigger bank failures, resulting in over 5000 documented landslide events within the reservoir region alone and affecting approximately 340,000 residents [7,8]. Against this backdrop of escalating hazard exposure, landslide susceptibility assessment, the spatial prediction of landslide occurrence probability based on geo-environmental conditioning features, has emerged as an indispensable tool for proactive disaster risk reduction, providing scientific foundations for land-use planning, engineering site selection, early warning system deployment, and emergency response resource allocation across regional to local scales [9,10,11,12].
The efficacy of landslide susceptibility assessment fundamentally depends on two critical components: the selection of conditioning features that capture slope instability mechanisms, and the modeling algorithms that translate these features into predictive susceptibility maps [9,13]. Regarding feature engineering, existing studies have predominantly adopted a standardized repertoire of topographic variables, geological features, hydrological indicators, and anthropogenic influences as predictor variables [14,15]. The conventional feature selection workflow follows a relatively rigid protocol: initial compilation of candidate variables based on literature precedent, computation of correlation coefficients among features, removal of variables exhibiting high inter-correlation to eliminate perceived redundancy, and subsequent model training with the filtered feature subset [16,17]. However, this established paradigm exhibits three critical knowledge gaps. First, despite the proven capability of satellite-derived spectral features to characterize land surface properties intimately linked to slope stability, the integration of multispectral remote sensing information into landslide susceptibility feature sets remains conspicuously underexplored [18]. Second, the prevailing practice of correlation-based redundancy removal, while intuitively appealing for reducing multicollinearity, lacks rigorous empirical validation in the landslide susceptibility context; this approach implicitly assumes that correlated features provide duplicative information, yet overlooks the possibility that ensemble learning algorithms, which constitute the current methodological mainstream, may leverage subtle distinctions among correlated variables to enhance predictive robustness through complementary decision pathways [19]. This assumption becomes particularly questionable in typical landslide studies characterized by limited sample sizes (hundreds to low thousands of events) relative to feature dimensionality, where the machine learning principle of “more data generally outperforms better algorithms” suggests that indiscriminate feature elimination may inadvertently discard valuable predictive signals [20]. Third, feature engineering strategies require reconsideration based on feature importance principles. An alternative approach involves progressive feature elimination based on importance rankings, sequentially removing the weakest-contributing variables and assessing model performance at each stage [21]. Such iterative feature reduction represents an intriguing methodological exploration that challenges the assumption that comprehensive feature incorporation invariably enhances model accuracy, particularly given the limited sample sizes typical of landslide studies [22]. Recent studies have begun exploring systematic feature engineering frameworks: Sahin (2023) [23] demonstrated that integrating feature transformation, binning, and weighting can improve model performance by 3.3% in AUC compared to raw features, while Ling et al. (2022) [24] showed that Random Forest-based feature selection using Gini Impurity metrics enhanced susceptibility mapping accuracy by 0.8–1.3%. Despite these promising developments, comprehensive evaluations comparing correlation-based elimination versus importance-driven selection remain scarce, and the integration of advanced feature engineering techniques—particularly for spectral remote sensing data—has not been systematically validated across diverse geological contexts. However, systematic evaluation of these contrasting feature engineering philosophies remains largely absent from the literature, representing a critical knowledge gap with direct implications for assessment accuracy.
Concerning predictive modeling approaches, the landslide susceptibility literature has witnessed a progressive evolution from statistical methods to machine learning algorithms, with recent research gravitating toward ensemble learning techniques that aggregate multiple base learners to achieve superior predictive performance and enhanced generalization capability [25,26]. Numerous studies have demonstrated the efficacy of bagging ensembles (Random Forest), boosting frameworks (XGBoost, LightGBM, CatBoost, AdaBoost), and homogeneous model aggregation strategies in improving susceptibility map accuracy compared to single classifiers [27,28,29]. Recent comparative studies have further substantiated these advantages: Kadavi et al. (2018) [30] showed that ensemble methods outperformed standalone models with AUC improvements of 2–8% across diverse geological settings, while Fang et al. (2021) [31] demonstrated that blending ensemble learning achieved 80.7% accuracy in large-scale regional assessments, confirming the robustness of ensemble approaches. However, investigations into Stacking ensemble architectures, which combine diverse heterogeneous base learners through a meta-model trained to optimally weight individual predictions, remain remarkably scarce despite their theoretical advantage of capturing complementary algorithmic perspectives on feature–target relationships [32,33,34]. For geologically complex regions like Chongqing, where landslide mechanisms range from deep-seated rotational slides in mudstone to shallow translational failures on colluvial slopes, algorithmic diversity is essential. The limited existing Stacking implementations typically employ simplistic configurations with 2–4 base learners and rudimentary meta-learner selection (often logistic regression), without systematic exploration of optimal base learner diversity, meta-model algorithm choice, or regularization strategies to prevent overfitting at the meta-level [35,36,37].
Emerging research has begun addressing these limitations through systematic investigations of meta-learner optimization strategies. Loon et al. (2024) [38] explored advanced meta-learner architectures for multi-view Stacking frameworks, systematically comparing seven meta-learner variants including non-negative ridge regression, elastic net, LASSO, adaptive LASSO, stability selection with LASSO, and forward selection. Li et al. (2025) [39] demonstrated that Bayesian hyperparameter optimization for individual base learners, combined with Stacking ensemble architectures integrating XGBoost, Random Forest, Gradient Boosting Decision Trees, and CatBoost, achieved superior predictive performance when linear regression was employed as the meta-learner. Their comparative analysis of multiple base learner configurations revealed that systematic hyperparameter tuning at both the base and meta levels substantially enhanced model accuracy compared to default parameter settings. Building upon this foundation, Pangestika et al. (2024) [40] conducted a comprehensive comparative study examining meta-learner algorithm selection, evaluating Stacking configurations with Random Forest, Gradient Boosting, XGBoost, Extra Trees, and LightGBM as base learners, paired with diverse meta-models including CATPCA-based logistic regression, Random Forest, Gradient Boosting, and standard logistic regression. Their results demonstrated that meta-learner choice critically impacts ensemble performance, with CATPCA-LR achieving 59.82% balanced accuracy and superior sensitivity (46.28%) compared to alternative meta-model architectures, though algorithm-specific advantages emerged across different evaluation metrics. Collectively, these studies underscore the critical yet underexplored role of meta-level architectural design and regularization strategies in Stacking ensemble frameworks, highlighting substantial opportunities for systematic optimization in landslide susceptibility modeling applications.
In summary, to address these identified knowledge gaps and advance the methodological rigor of landslide susceptibility assessment, this study conducts three innovative investigations using Chongqing as a geologically complex testbed: (i) introducing 12 Sentinel-2 derived spectral features alongside 12 conventional geo-environmental features to systematically evaluate the contribution of remote sensing spectral information to susceptibility prediction accuracy across eight machine learning models (RF, XGBoost, LightGBM, CatBoost, DT, MLPNN, SVM, KNN); (ii) implementing controlled feature engineering experiments to systematically assess the individual and combined effects of remote sensing spectral features, redundancy removal, and feature optimization on susceptibility prediction accuracy; and (iii) developing an optimized Stacking framework by generating out-of-fold (OOF) meta-features and applying two enhancement strategies, Bagging and Cross-Training, to six meta-learners. Through these systematic investigations, this research aims to provide evidence-based methodological guidance for spectral feature integration, feature selection protocols, and ensemble modeling strategies in landslide susceptibility assessment.
2. Study Area
2.1. Geography and Geological Conditions
Chongqing, located in southwestern China (105°11′–110°11′E, 28°10′–32°13′N), covers a total area of approximately 82,400 km2 (Figure 1a). It is situated in the eastern part of the Sichuan Basin, serving as a transitional zone between the Qinghai–Tibet Plateau and the Middle–Lower Yangtze Plains. The municipality is characterized by a complex topography where hills and mountains constitute about 91% of the total area. The general topography is higher in the northeast and southeast and lower in the center and west. The region straddles two major tectonic units: the Yangtze Para-platform and the Qinling Fold Belt. This complex geological setting has resulted in the development of intense folding and faulting, such as the Huayingshan and Qiyaoshan fault zones, which significantly influence regional geological stability (Figure 1b). The geomorphology is tectonically controlled, featuring a characteristic pattern of anticlines forming ridges and synclines forming valleys. The outcropping strata are predominantly composed of red-bed formations, including mudstone, sandstone, and sand–mudstone interbeds, as well as carbonate and clastic interbedded formations (Figure 1b).
Figure 1.
(a) Location of the study area within China; (b) distribution of stratigraphy, lithology, and tectonic structures in Chongqing; (c) engineering geological zoning and landslide distribution map of Chongqing. I–V: Chongqing engineering geology zoning.
Chongqing has a well-developed surface drainage system, dominated by the Yangtze River and its major tributaries, the Jialingjiang and Wujiang Rivers. Numerous secondary streams and rivers have incised the landscape, leading to strong topographic dissection. The region experiences a subtropical monsoon climate with an annual precipitation ranging from 1002 mm to 1666 mm. Rainfall is unevenly distributed, being generally higher in the east and south of the Yangtze River than in the west and north. Approximately 70% of the annual precipitation occurs during the flood season from May to October, which is a primary trigger for landslides. Intense human engineering activities, including urban expansion, road construction, and reservoir impoundment (e.g., the Three Gorges Reservoir Area), have significantly altered slope conditions. The combination of challenging natural geography, complex geology, and anthropogenic disturbances makes Chongqing one of the provinces in China most susceptible to geological hazards, particularly landslides (Figure 1c). Based on comprehensive analyses of topography, tectonic structures, lithological stratigraphy, and landslide distribution characteristics, the study area is divided into five zone (Figure 1c). Subregion I (Central to northeastern parallel ridge–valley red-bed area) is the most landslide-prone area. Failures are driven by reservoir water-level fluctuations in the Yangtze, intense rainfall, and slope excavation. Landslides include shallow colluvial slides on bedrock interfaces and translational rockslides along dip slopes. In Subregion II (Southeastern karst middle mountains), landslide occurrence is moderated by the competent carbonate bedrock but is locally triggered by the combined impact of heavy rainfall, karstic weathering, and road construction in colluvial-filled valleys (17.71%). Subregion III (Western red-bed hills and valleys) experiences primarily shallow, rainfall-induced failures in the weathered red-bed materials and thick Quaternary deposits. Deep-seated rotational slides can occur in thicker soil profiles. Landslides in Subregion IV (Northeastern (Daba mountain) karst mid-mountains), though less frequent, are often structurally controlled and severe. They are predominantly triggered by slope undercutting during road construction in the fractured and interbedded rock masses. Subregion V (Eastern karst gorge area) is a primary zone for large-scale, catastrophic rock slope failures. The dominant hazards are large rockslides and pervasive unstable rock masses (perilous rockfalls) on the steep gorge walls, triggered by rainfall and reservoir fluctuations. Their distinct characteristics are summarized in Table 1.
Table 1.
Geological environment, landslide materials, and structure characteristics in each zone.
2.2. Description and Analysis of Landslide Inventory
The landslide inventory used in this study was provided by the local government and comprises detailed records of landslide events spanning 1960–2024. This comprehensive dataset underpins the spatial and statistical analyses presented here. An analysis of 11,524 landslide events reveals clear spatial clustering, with 51.50% (Subregion I) concentrated in the parallel ridge–valley red-bed area, underscoring the extreme susceptibility of these slopes to the compounding effects of reservoir fluctuations, intense rainfall, and human activity. In contrast, the karst-dominated subregions (II, IV, V), which collectively account for 33.84% of landslides, exhibit a more variable pattern: generally stable carbonate bedrock is locally compromised by karst weathering and structural discontinuities, with failures often triggered by construction or heavy rainfall. The western red-bed hills (Subregion III, 14.39%) are characterized by widespread, shallow, rainfall-induced failures in weathered materials, while the northeastern karst mountains (Subregion IV) stand out for having the lowest frequency but a high severity of structurally controlled failures. A statistical overview of the key landslide characteristics is presented in Figure 2. The temporal distribution (Figure 2a) spans the entire study period, with notable peaks in 2014 (1232 events) and 2007 (854 events). The monthly distribution (Figure 2b) reveals strong seasonality, with the vast majority of landslides (>75%) occurring during the flood season May–September and peaking in July (3339 events). The geomorphic and impact-related parameters are summarized as follows. The slope angles at landslide locations (Figure 2c) have a mean value of approximately 29°, with an interquartile range (IQR) of 18–30°. Landslide volumes (Figure 2d) vary widely, with a median of 10,350 m3 and an IQR of 2880–33,600 m3, indicating a dataset dominated by small-to-medium-sized failures with a long tail of very large events. The elevation distribution (Figure 2e) shows that landslides are most frequently concentrated at moderate heights, with a median elevation of 525 m (IQR: 344–755 m). The economic impact, quantified by the value of threatened property (Figure 2f), also shows a highly skewed distribution. The median threatened property value is 1.1 million CNY, while the IQR ranges from 360,000 to 3,000,000 CNY, highlighting that while many landslides threaten modest assets, a subset poses a susceptibility to very high-value property.
Figure 2.
Landslide inventory statistics: (a) occurrence year, (b) occurrence month, (c) slope angle, (d) volume, (e) elevation, and (f) threatened property.
3. Materials and Methods
This study adopts a systematic four-stage methodological framework (Figure 3) designed to achieve methodological innovation and fulfill research objectives.
Figure 3.
Flowchart of proposed framework.
(i) Phase I: Data Construction integrated multi-source geospatial data to build a standardized feature set. This set combines static background conditioning factors, anthropogenic disturbance indicators, and dynamic surface process features, with the systematic inclusion of 12 Sentinel-2-derived spectral indices as a key innovation. A comprehensive landslide inventory for Chongqing (1960–2024) was used to construct the final training and global prediction datasets.
(ii) Phase II: Feature Engineering aimed to optimize the input feature space. Using eight baseline machine learning models, we systematically evaluated the contribution of spectral features, the impact of feature redundancy, and the completeness of the feature set to identify the optimal feature combination for modeling.
(iii) Phase III: Ensemble Learning Optimization focused on developing the optimal predictive model. All baseline models were first refined using Bayesian hyperparameter optimization. A Stacking ensemble framework was then constructed by generating meta-features from Out-of-Fold (OOF) predictions across multiple meta-learners. The top three meta-learners were further enhanced using Bagging and Cross-Training strategies to produce the final best-performing ensemble model.
(iv) Results analysis involved interpreting model outcomes and generating deliverables. The SHAP framework was applied to identify and explain key predictive features. The optimal model was applied to the global dataset to produce a landslide susceptibility classification map for Chongqing. A quantitative spatial analysis was conducted to examine the susceptibility structure within each engineering geological zone and its contribution to the municipality-wide susceptibility pattern, culminating in regional-scale susceptibility mapping and mechanistic interpretation.
3.1. Phase I: Multi-Source Data Collection
This section details the compilation and preprocessing of a multi-source geospatial dataset representing key predisposing features for landslides. Based on a comprehensive landslide inventory, 24 predictive features were selected and categorized into three groups: (i) static background conditioning features, (ii) anthropogenic disturbance features, and (iii) dynamic surface process features. A complete summary of all features is provided in Table 2.
Table 2.
Multi-source data description.
(i) Static background conditioning features
This group captures relatively invariant topographic, geological, and pedological settings that define the baseline susceptibility of slopes. A 30 m resolution SRTM Digital Elevation Model (DEM) served as the foundational dataset for quantifying terrain morphology. Primary topographic derivatives were computed, including slope and aspect, which govern gravitational driving forces and microclimatic influences on soil moisture, respectively. Curvature was calculated to identify zones of surface water convergence (concave) or divergence (convex), and the Topographic Position Index (TPI) was derived to classify landscape positions such as ridges, valleys, and midslopes. To provide synthesized geomorphic context, the ERGo landform classification dataset was incorporated [41]. Underlying material properties were represented using lithology maps from regional geological surveys and soil type classification. Additionally, distance to fault was computed as a proxy for zones of rock fracturing and structural weakness, which are more susceptible to weathering and slope failure.
(ii) Anthropogenic disturbance features
This group quantifies human activities that directly alter slope mechanics and hydrological regimes. Distance to road was derived from OpenStreetMap data, acknowledging that road construction often induces slope undercutting and loading, which are common landslide triggers. Land use data for 2024 were included to account for the differential impacts of various land cover types (e.g., urban, agricultural, forest) on slope stability. Distance to river was calculated to capture the influence of riverbank erosion and reservoir operations under regulated water levels. All features were reprojected to a common coordinate system and integrated into a unified geospatial database for subsequent landslide susceptibility modeling.
(iii) Dynamic surface process features
This group consists of spectral indices derived from Sentinel-2 MultiSpectral Instrument (MSI) Level-2A surface reflectance data spanning 2019–2024. A standardized preprocessing workflow was implemented in Google Earth Engine, which included cloud and cirrus masking using the QA60 band and the generation of annual median composites from images with less than 30% cloud cover to minimize atmospheric and phenological variability. The following twelve spectral indices were calculated to characterize vegetation vigor, surface moisture, and bare soil exposure.
Enhanced Vegetation Index (EVI): A robust metric for assessing canopy structure and photosynthetic activity, less prone to saturation in high-biomass regions. The EVI was calculated using the following formula:
Normalized Difference Vegetation Index (NDVI): A fundamental indicator of vegetation greenness and density. Healthy, dense vegetation, indicated by high NDVI values, often signifies stable slopes due to root reinforcement and soil moisture regulation. Conversely, low NDVI values can indicate sparse vegetation, bare ground, or stressed canopies, common characteristics of existing landslide scars and areas susceptible to failure. Annual median composites minimize seasonal variability, representing stable vegetation patterns relevant to long-term slope stability. The calculation function is as follows:
Normalized Burn Ratio (NBR): While originally developed for mapping fire severity, this study repurposes the NBR to detect surface disturbances characteristic of landslide scars. Fresh slope failures expose bare soil and rock, which drastically alters the spectral response in the near-infrared and short-wave infrared regions. A sharp decrease in NBR values effectively delineates these disturbed areas.
Normalized Difference Moisture Index (NDMI): Quantifies moisture content within vegetation and soil. Since elevated soil moisture is a primary trigger for landslides by increasing pore-water pressure, NDMI serves as a critical proxy for identifying water-saturated areas prone to failure. The index was computed using the standard formula:
The Tasseled Cap Transformation compresses multispectral data into three fundamental components related to physical landscape characteristics. These components were derived using Sentinel-2 specific coefficients [42]. Tasseled Cap Brightness (TCB) represents overall surface brightness, serving as a direct indicator of bare soil exposure. It is highly effective at identifying landslide scars, quarries, and construction sites. The index was calculated as:
Tasseled Cap Greenness (TCG) correlates strongly with the presence and vigor of green vegetation, complementing the information provided by NDVI and EVI. The index was calculated as:
Tasseled Cap Wetness (TCW): Highly responsive to moisture content in both soil and vegetation canopies. TCW is often considered superior to ratio-based indices for detecting subtle changes in surface and subsurface moisture conditions:
Soil Adjusted Vegetation Index (SAVI): Designed to minimize the influence of soil background brightness on vegetation signals. By incorporating a canopy background adjustment feature (L = 0.5), SAVI is particularly valuable for assessing vegetation in sparsely vegetated areas, such as regenerating landslide scars or agricultural lands, which are prevalent in the study area:
Bare Soil Index (BI): Specifically designed to highlight exposed soil by leveraging the spectral contrast between the SWIR1/Red and NIR/Blue bands. BI is crucial for identifying recent slope failures, mapping the extent of existing landslide bodies, and delineating areas stripped of protective vegetation cover that are susceptible to erosion and shallow slides. The index was computed using the standard formula:
Modified Soil Adjusted Vegetation Index (MSAVI): A refinement of SAVI that dynamically adjusts the soil background correction feature rather than using a fixed constant. MSAVI is well-suited for the heterogeneous terrain of the study area, where varying soil types and moisture levels can introduce significant background noise into standard vegetation indices. The index was calculated as:
Normalized Difference Water Index (NDWI): Sensitive to the presence of liquid water on surfaces. This index helps identify areas of high surface moisture or water accumulation that can indicate saturated soil conditions preceding slope instability. The index was calculated as follow:
Normalized Difference Built-up Index (NDBI): Exploits the unique spectral signature of artificial surfaces, which exhibit higher reflectance in the SWIR1 band compared to the NIR band. NDBI is essential for quantifying anthropogenic pressures, as urbanization and infrastructure development are major drivers of slope modification and instability:
In the formulas above, the symbols correspond to the surface reflectance of the following Sentinel-2 bands: ρ2 (Blue, 490 nm), ρ3 (Green, 560 nm), ρ4 (Red, 665 nm), ρ6 (Vegetation Red Edge 1, 740 nm), ρ8 (NIR, 842 nm), ρ8A (Vegetation Red Edge NIR, 865 nm), ρ11 (SWIR1, 1610 nm), and ρ12 (SWIR2, 2190 nm). All derived feature layers were resampled and co-registered to the same projected coordinate system to construct a unified geospatial database for subsequent landslide susceptibility modeling (Appendix A).
To balance computational efficiency with the adequate representation of regional-scale landslide conditioning features, the entire study area was discretized into a uniform grid of 300 m × 300 m pixels. The landslide inventory was spatially partitioned using a 70:30 split, allocating 16,131 samples to the training dataset and 6914 samples to the test dataset. To ensure robust model evaluation and mitigate overfitting, a 5-fold cross-validation strategy was implemented on the training set. Non-landslide samples were generated through stratified random sampling with spatial constraints, requiring all sampled locations to be situated beyond a 300 m buffer zone from any documented landslide point. This buffer-based exclusion strategy effectively reduces spatial autocorrelation and minimizes the selection of “pseudo-stable” pixels that may exhibit environmental characteristics similar to landslide-prone areas. To construct a balanced binary classification dataset, the number of non-landslide samples was set equal to the number of landslide samples, maintaining a 1:1 positive-to-negative ratio in both training and test partitions.
3.2. Phase II: Feature Engineering Process
3.2.1. Baseline Models
This study constructed a diversified ensemble framework by selecting eight machine learning algorithms representing distinct learning paradigms: tree-based models (Decision Tree, Random Forest, XGBoost, LightGBM, CatBoost), non-tree algorithms (K-Nearest Neighbors, Multilayer Perceptron Neural Network, Support Vector Machine). This heterogeneous model pool aims to maximize ensemble diversity and capture landslide occurrence patterns from complementary perspectives.
Tree-based models constitute the primary framework due to their inherent advantages in handling non-linear feature interactions and mixed-type variables. Decision Tree serves as the foundational weak learner, employing Gini impurity-based recursive partitioning with a maximum depth constraint of 10 to balance model complexity and generalization. Random Forest extends DT through bootstrap aggregating (Bagging) with dual randomization in both sample and feature subspace selection, effectively reducing variance through ensemble averaging. Gradient Boosting Decision Trees variants—XGBoost, LightGBM, and CatBoost—implement sequential error-correction strategies with algorithm-specific optimizations: XGBoost incorporates L1/L2 regularization in its objective function; LightGBM employs Gradient-based One-Side Sampling and Exclusive Feature Bundlingfor computational efficiency; CatBoost addresses prediction shift through Ordered Boosting and native categorical feature encoding.
Non-tree algorithms provide alternative decision boundaries to enhance ensemble heterogeneity. KNN implements instance-based learning through local majority voting in feature space. MLPNN captures complex non-linear mappings via hierarchical neuron layers with backpropagation training. SVM constructs optimal separating hyperplanes by maximizing class margins in kernel-transformed feature space, with soft-margin formulation tolerating partial misclassification.
To ensure experimental reproducibility, all models were configured with a unified random state of 42. Parallel computing capabilities were enabled for ensemble algorithms (RF, XGBoost, LightGBM) by setting n_jobs = −1 to utilize multi-core processing. Notably, feature standardization was intentionally omitted since tree-based models exhibit scale-invariance through threshold-based splitting mechanisms, and the final susceptibility mapping requires consistent predictions across the entire municipality-wide grid without preprocessing transformations.
3.2.2. Feature Analysis
Feature engineering aimed to optimize the input feature space through three systematic experiments addressing fundamental questions in landslide susceptibility modeling. While traditional assessments predominantly rely on topographic, geological, and hydrological factors, this study innovatively integrated 12 spectral-derived indices from remote sensing imagery to capture surface characteristics potentially relevant to slope instability. However, the contribution of spectral information to predictive performance remains unquantified. Moreover, correlation-based feature selection has become standard practice, with most studies removing one feature from highly correlated pairs under the assumption that correlation equals redundancy. This assumption, though widely adopted, has rarely been validated through empirical performance evaluation, two highly correlated features may capture complementary mechanisms, and indiscriminate removal could result in information loss. Finally, feature importance-based sequential elimination strategies presume that iteratively removing low-ranking features will converge to an optimal subset by eliminating noise. Yet importance scores are context-dependent, and whether this greedy removal approach truly identifies the best feature configuration requires systematic investigation.
To address these questions, we designed three comparative experiments using all eight baseline models with consistent evaluation protocols. The first experiment quantified spectral feature contribution through a controlled ablation study. Two configurations were established: containing all conditioning features, including 12 spectral indices, and with identical features except all spectral indices excluded.
The second experiment tested the impact of feature redundancy through correlation-based filtering. We computed Pearson correlation coefficients for all feature pairs and identified highly correlated pairs with |r| > 0.8. For each correlated pair, one feature was retained based on physical interpretability, data reliability, literature precedence, and preliminary feature importance scores. This produced two configurations: with the full feature set and after correlation-based removal. Both configurations underwent identical training and evaluation procedures to determine whether correlation filtering empirically improves predictive accuracy.
The third experiment implemented sequential backward elimination to assess feature set completeness. For five tree-based models capable of intrinsic importance estimation (DT, RF, XGBoost, LightGBM, CatBoost), we applied an iterative procedure: starting from the complete feature set, each model was trained via 5-fold cross-validation to extract feature importance scores, after which the lowest-ranked feature was removed. This process repeated until reaching a minimum threshold, with each iteration recording the current feature composition, feature count, and all performance metrics. The resulting performance-versus-feature_count curves identified optimal subset sizes where predictive accuracy peaked, revealing whether parsimonious configurations outperform exhaustive feature sets and quantifying the information contribution of marginal features.
3.3. Phase III: Ensemble Learning Optimization Framework
3.3.1. Bayesian Hyperparameter Optimization
Following feature set determination, further performance enhancement relies on meticulous hyperparameter tuning. Hyperparameters, parameters preset before training rather than learned from data, critically influence model learning capacity, generalization, and computational efficiency. Traditional optimization methods exhibit inherent limitations: grid search suffers exponential computational growth in high-dimensional parameter spaces, while random search lacks systematic exploration and may overlook optimal regions. Bayesian optimization, conversely, employs probabilistic surrogate models for sequential optimization, efficiently navigating parameter spaces to converge toward global optima within limited evaluations.
The Bayesian optimization framework treats hyperparameter tuning as black-box function optimization by constructing a probabilistic posterior distribution over the objective function, updated iteratively with each parameter evaluation. An acquisition function balances exploration (sampling high-uncertainty regions to gather information) and exploitation (sampling high-expected-performance regions to approach optima). This study implemented Tree-structured Parzen Estimator, which models parameter configurations above and below performance thresholds through separate probability densities, offering superior flexibility over Gaussian process surrogates when handling conditional and categorical parameters. Hyperparameter search spaces were systematically defined for all eight base learners, with TPE-guided optimization maximizing cross-validation AUC through iterative parameter refinement.
3.3.2. Stacking Ensemble Architecture and Enhancement Strategies
Stacking (stacked generalization) constitutes an advanced ensemble paradigm that constructs a two-tier learning architecture wherein a meta-learner integrates base learner predictions to exploit complementary information. Unlike simple voting schemes, the meta-learner learns optimal weighting strategies from base model outputs, capturing synergistic patterns across diverse algorithms.
Out-of-Fold (OOF) meta-feature generation forms the foundation of unbiased Stacking. Traditional approaches that train base learners on the full training set and directly feed predictions to the meta-learner induce information leakage—the meta-learner overfits to training set performance rather than true generalization capacity. To address this, we implemented 5-fold cross-validation for OOF generation: the training set was partitioned into five disjoint folds, with each base learner trained on four folds and predicting the fifth. After five iterations, every training sample received one prediction from a model that never observed it during training, ensuring meta-feature independence. For the test set, each base learner’s five fold-specific models generated predictions that were subsequently averaged. This mechanism guarantees the meta-learner receives genuine out-of-sample predictions reflecting base learner generalization. All eight Bayesian-optimized base learners (LightGBM, XGBoost, CatBoost, Random Forest, Decision Tree, MLP, SVM, KNN) participated in OOF generation, with 5-fold cross-validation AUC serving as individual performance benchmarks.
Six meta-learners were evaluated for optimal prediction integration: Logistic Regression, Decision Tree, Random Forest, XGBoost, LightGBM, and Naive Bayes. The meta-learner’s task differs fundamentally from base learners—rather than mapping raw features to landslide occurrence, it learns optimal combination rules from base learner probability outputs. To further enhance stability and robustness, two advanced strategies were implemented: Bagging enhancement and Cross-training. Bagging enhancement targets variance reduction through ensemble aggregation. The top-3 performing meta-learners were wrapped with Bagging Classifiers, which trained multiple meta-learner replicas on bootstrap-sampled subsets of meta-features (with simultaneous feature subsampling) and averaged their predictions. This implements Bootstrap Aggregating principles, effectively smoothing prediction variance for models sensitive to training data perturbations.
Cross-training addresses stochasticity in meta-learner training arising from random data partitioning, parameter initialization, and algorithmic randomness. Single training runs risk local optima or overfitting to coincidental patterns induced by random seeds. Cross-training mitigates this by executing 10 independent training runs with different random seeds controlling both 5-fold CV splits and parameter initialization. Test set predictions from all 10 runs were arithmetically averaged, simulating model ensembling to dampen stochastic fluctuations. The final Stacking model was retrained on the complete training set and evaluated on the held-out test set (30% holdout), with model weights, meta-learner parameters, and OOF predictions archived for subsequent susceptibility mapping across the global dataset. To address the “black-box” nature of ensemble models and elucidate the mechanistic contributions of environmental featuresto landslide susceptibility predictions, we employed SHAP (SHapley Additive exPlanations) framework [43] for post-hoc model interpretation. SHAP values quantify each feature’s marginal contribution to individual predictions by computing Shapley values from cooperative game theory, satisfying critical axioms of local accuracy, missingness, and consistency.
4. Results
4.1. Feature Analysis and Optimal Configuration Testing
Figure 4 presents the performance of eight machine learning models and quantifies the impact of spectral features on predictive accuracy. As shown in Figure 4a,b, among baseline models, LightGBM achieved optimal performance with mean cross-validation AUC of 0.8358 and test set AUC of 0.8468, while KNN exhibited the poorest performance with corresponding AUCs of 0.6421 and 0.6596. Ensemble learning algorithms (LightGBM, CatBoost, XGBoost, RF) significantly outperformed traditional machine learning methods (DT, SVM, MLP, KNN), all exceeding 0.83 test AUC. Figure 4c,d further quantify spectral feature contributions, revealing that 62.5% of models (five out of eight) benefited from spectral integration. XGBoost demonstrated the largest improvement (+4.52%), followed by LightGBM (+3.82%) and CatBoost (+3.67%). Only two models (MLP and KNN) exhibited slight degradation, with maximum decline of 2.64%. Tree-based models’ recursive partitioning naturally handles feature interactions and redundancy in high-dimensional spectral data, whereas KNN and MLP methods are more sensitive to the curse of dimensionality and correlated features. Collectively, these results validate the positive impact of spectral features on landslide susceptibility modeling, particularly for tree-based ensemble algorithms, confirming the effectiveness of multi-source remote sensing spectral information in geological hazard assessment.
Figure 4.
Performance analysis of baseline models and spectral feature impact: (a) baseline model AUC comparison, (b) baseline model test set ROC curve comparison, (c) performance improvement by, (d) heatmap of spectral features impact on model performance.
To investigate the influence of feature redundancy on model generalization, we systematically tested the effect of removing highly correlated features (Figure 5). Pearson correlation analysis (Figure 5a) identified eight highly correlated spectral indices (NBR, NDWI, MSAVI, BI, NDMI, SAVI, TCB, TCG) with maximum inter-correlation exceeding 0.95, indicating severe multicollinearity. The reduced feature set (Figure 5b) retained 16 features with no strong inter-correlations, achieving 42.1% dimensionality reduction. Performance comparison experiments (Figure 5c–f) revealed predominantly negative impacts from this strategy. Quantitative statistics showed 50% of models experienced accuracy decline with mean AUC reduction of 0.0028. Tree-based ensemble models demonstrated highest sensitivity: XGBoost declined most substantially (−0.0111, −1.32%) from 0.8417 to 0.8306, LightGBM decreased by 0.0062 (−0.73%) from 0.8468 to 0.8406, and CatBoost dropped 0.0070 (−0.84%) from 0.8458 to 0.8388. Only 37.5% of models achieved marginal improvements. These improvements remained below 0.3 percentage points and concentrated in originally weaker models, indicating limited benefits of feature simplification for basic algorithms. These findings demonstrate that for tree-based models with intrinsic feature selection mechanisms, retaining the complete feature set proves more advantageous than simple correlation-based filtering. Consequently, subsequent analyses adopted the full feature configuration to maximize model performance.
Figure 5.
Feature correlation and redundancy testing results: (a) correlation matrix of all features, (b) reduced feature set after removing high correlations, (c) model AUC with reduced features, (d) AUC change after correlation-based filtering, (e) performance change after removing highly correlated features, (f) test AUC before and after removing highly correlated features.
To identify critical environmental features influencing landslide susceptibility in Chongqing, feature importance analysis was conducted across five tree-based models (Figure 6). Topographic features dominated across all models, manifesting a core control pattern of “three topographic essentials.” DEM ranked within the top three across all five models, achieving highest importance in DT, LightGBM and CatBoost. Slope ranked within the top two in four models, securing first position in RF. TPI consistently ranked within the top five across all models with importance values. Spectral-derived vegetation indices demonstrated unexpectedly strong discriminative power. NBR ranked within the top four across all five models, even surpassing certain topographic factors. NDVI stably entered the top ten in four high-performance models. NDBI ranked within the top seven in LightGBM and CatBoost, reflecting urbanization influences. Land use exhibited anomalously high importance in XGBoost, substantially exceeding second-ranked DEM, but ranked relatively lower in other models. Lithology scored 0.0395 in XGBoost and 3.56 in CatBoost.
Figure 6.
Top 20 feature importance rankings for tree-based models: (a) DT model, (b) RF model, (c) XGBoost model, (d) LightGBM model, (e) CatBoost model.
To validate feature importance analysis and explore optimal feature subsets, sequential backward elimination experiments were conducted across five models (Figure 7). The five models exhibited distinct response patterns during feature elimination. Decision Tree displayed a “rise-then-fall” performance curve: after removing the 16 lowest-importance features, AUC improved from initial 0.754 to optimal 0.771; further elimination degraded performance, with AUC declining to 0.742 when retaining only the top five features. Random Forest demonstrated robustness to feature quantity: starting from the complete 24-feature set (AUC = 0.832), AUC exhibited continuous but gradual decline as features were eliminated, dropping to 0.809 after removing 15 features. XGBoost and LightGBM manifested similar feature dependency patterns, both achieving optimal performance with the complete feature set (XGBoost: AUC = 0.841; LightGBM: AUC = 0.846), with monotonic performance degradation following feature elimination. CatBoost exhibited the most distinctive response: after removing eight lowest-importance features, AUC improved from initial 0.845 to optimal 0.846, achieving a marginal but stable 0.1% gain; subsequent elimination induced performance decline. Synthesizing sequential elimination results across all five models, although DT and CatBoost achieved minor performance gains after pruning low-importance features, the practical significance of these improvements remains limited. Consequently, this study adopted the complete 24-feature set as input variables for subsequent ensemble modeling and susceptibility mapping.
Figure 7.
AUC performance during sequential backward elimination of lowest-importance features for tree-based models: (a) DT model, (b) RF model, (c) XGBoost model, (d) LightGBM model, (e) CatBoost model.
4.2. Ensemble Model Testing Results
Figure 8a compares test set AUC values for eight models before and after Bayesian optimization. All models demonstrated AUC improvements post-optimization, validating hyperparameter tuning efficacy (Appendix A). Among tree-based models, XGBoost exhibited the most significant enhancement, improving from 0.8417 to 0.8518 (+1.2%), followed by LightGBM (+0.7%) and CatBoost (+0.6%). RF experienced slight degradation from 0.8342 to 0.8300 (−0.5%). DT improved from 0.7528 to 0.7931 (+5.4%), though remaining substantially inferior to ensemble models. MLP demonstrated the most pronounced improvement, with AUC increasing from 0.6633 to 0.7421 (Figure 8b). SVM improved from 0.6754 to 0.6869 (+1.7%), and KNN from 0.6596 to 0.6933 (+5.1%), both exhibiting lower baseline performance but greater optimization potential. Post-optimization, LightGBM ranked first with test AUC of 0.8530, closely followed by XGBoost (0.8518) and CatBoost (0.8511). Figure 8c presents the evolution of optimal AUC across 100 iterations for all eight models. All models exhibited favorable convergence characteristics, with AUC curves plateauing after 70 iterations, indicating proximity to global optima. Overall, 100 iterations sufficiently satisfied optimal hyperparameter search requirements, with negligible marginal gains from subsequent iterations.
Figure 8.
Bayesian optimization performance evaluation for baseline models: (a) test AUC comparison between baseline and optimized models, (b) CV-AUC comparison, (c) hyperparameter optimization progress for all models.
To construct the Stacking framework, 5-fold cross-validation was performed on the eight optimized base learners to compute Out-of-Fold prediction performance. As shown in Figure 9a, base learner OOF AUC ranged from 0.6869 to 0.8530, consistent with previous results. Comparison of 12 Stacking ensemble strategies revealed that among basic single-meta-learner configurations, Decision Tree (AUC = 0.850) and Naive Bayes (AUC = 0.849) failed to achieve effective improvement over the optimal base learner, exhibiting slight degradation (Figure 9b–c). Applying Bagging and Cross-training strategies to the Logistic Regression meta-learner elevated AUC to 0.856 and 0.854, respectively. The Bagging_XGBoost strategy achieved optimal performance with AUC of 0.8611. Figure 9d presents confusion matrix comparisons between the optimal Stacking model and primary base learners. Results demonstrate that Stacking-Bagging_XGBoost achieved dual optimization in recall and specificity: recall reached 81.66%, improving 1.24 percentage points over XGBoost (80.42%) and 2.31%/2.43% over RF/DT; false negative rate decreased to 18.34%, reducing missed detections by 43 samples vs. XGBoost and 61 samples vs. LightGBM/CatBoost, effectively mitigating hazard warning omission risks; specificity attained 79.80%, improving 5.81–12.52% over base learners and significantly enhancing non-landslide area identification accuracy; overall accuracy reached 80.73%, surpassing XGBoost (77.21%) and CatBoost (76.96%) by 3.52 and 3.77 percentage points, respectively. Comparative analysis indicates that while ensemble learning models exhibited comparable recall but lower specificity, and single decision trees manifested deficiencies in both metrics, the Stacking framework achieved effective false positive control while maintaining high sensitivity through multi-model prediction fusion, providing a more reliable technical solution for landslide susceptibility mapping.
Figure 9.
Stacking model optimization: (a) base learner OOF AUC, (b) meta-learner strategy comparison, (c) optimal meta-learner versus optimal base model, (d) confusion matrix comparison.
Figure 10 presents SHAP framework-based interpretability analysis of the Stacking-Bagging_XGBoost model, revealing contribution mechanisms of environmental features to landslide susceptibility prediction. Global importance ranking in Figure 10a shows NBR ranking first with importance value of 0.141 and relative contribution of 18.92%, followed by Slope (10.17%), NDBI (9.02%), and TCG (7.52%). DEM and Land use both contributed approximately 7.47%. The SHAP beeswarm plot in Figure 10b reveals nonlinear relationships between feature values and SHAP values. Distribution characteristics indicate NBR exhibits significant positive contribution dominance (70.5% positive contribution samples), with mean SHAP of +0.044 and standard deviation of 0.162, demonstrating that low vegetation coverage areas (high NBR values, red points concentrated in positive SHAP regions) substantially elevate landslide probability. Slope’s SHAP distribution appears relatively balanced but exhibits standard deviation of 0.100, indicating differential impacts across regions. Figure 10c further illustrates feature value-SHAP value dependency curves for the top six factors. NBR generates positive contributions (promoting landslides) within the 0.25–0.40 range, transitioning to negative contributions beyond 0.40—this threshold corresponds to moderate vegetation degradation states. Slope maintains continuous positive contribution within the 8–25° range, validating the classical theory that moderate-to-steep slopes constitute high-risk landslide terrain. NDBI exhibits positive contribution within the −0.3 to −0.18 range (low building density), transitioning to negative beyond −0.18, indicating higher landslide risk in moderately human-modified areas while highly urbanized zones experience reduced risk due to engineering protection measures. TCG displays transitional characteristics with negative contributions <0.16 and positive contributions from 0.16–0.25, where moderate curvature zones (convex-concave transition belts) concentrate stress, increasing landslide susceptibility. DEM shows positive contribution dominance in low-elevation areas <500 m, with risk decreasing at high elevations due to lower temperatures and minimal human activity. For Land use, cropland (positive contribution) increases risk through soil structure disturbance, while forest (negative contribution) provides protective effects through root reinforcement. SHAP analysis confirms that the Stacking model successfully captures complex nonlinear interactions among environmental factors, providing scientific basis for landslide susceptibility mechanism interpretation and risk management.
Figure 10.
SHAP-based model interpretability analysis: (a) SHAP global importance ranking, (b) SHAP beeswarm plot, (c) feature value and SHAP value dependency plots.
4.3. Landslides Susceptibility Mapping
Figure 11 presents the final landslide susceptibility map of Chongqing derived from the optimized Stacking–Bagging_XGBoost ensemble model. The susceptibility classification reveals a spatially heterogeneous distribution pattern: very low (43.30%), low (19.95%), moderate (16.62%), high (13.75%), and very high (6.39%) susceptibility zones across the study area. High to very high susceptibility areas exhibit pronounced spatial clustering along the Yangtze River corridor, mountainous ridge zones, and the Wanxian syncline structural belt, reflecting the coupled influence of fluvial erosion, steep topographic relief, and active tectonic deformation.
Figure 11.
Landslide susceptibility mapping for different zones in Chongqing.
Susceptibility concentrations are particularly evident in structurally active zones characterized by intensive fault systems and fold structures. Notably, northeastern Zone I and southwestern Zone V demonstrate elevated landslide susceptibility, attributed to their geological settings within the tectonically complex Dabashan fold-thrust belt and the Huayingshan fault zone, respectively. These regions exhibit enhanced crustal instability due to ongoing Cenozoic tectonic uplift and frequent seismic activity, which generate pervasive rock mass fracturing and reduce slope stability. The predominance of very low to low susceptibility areas (63.25% combined) in the central basin regions contrasts sharply with the high-susceptibility periphery, underscoring the critical role of tectonic geomorphology in controlling landslide spatial distribution patterns across Chongqing.
Figure 12 presents the spatial distribution of landslide susceptibility across the five engineering geological zones in Chongqing. The probability density curves (Figure 12a) reveal distinct distribution patterns: Zones I, II, and III exhibit relatively concentrated distributions with peaks in the low-to-moderate range (0.2–0.4), while Zones IV and V show more dispersed patterns with extended left tails, indicating higher proportions of very low susceptibility areas. The sample distribution (Figure 12b) shows significant variation, with Zone I containing the largest sample size (274,325 samples), followed by Zones II (245,680) and III (242,680), while Zones IV (102,579) and V (48,925) have considerably fewer samples.
Figure 12.
Susceptibility proportion by zone: (a) probability density distribution by zone, (b) sample distribution by zone.
Statistical analysis reveals marked inter-zonal differences in susceptibility characteristics. Zone I exhibits the highest mean susceptibility (0.379) and displays a relatively balanced distribution across all levels (33.75% very low, 20.83% low, 19.85% moderate, 17.46% high, and 8.10% very high), resulting in a low susceptibility classification (CRI = 22.27). In contrast, Zones II-IV are dominated by very low susceptibility areas (43.50%, 44.15%, and 61.96%, respectively), with progressively decreasing proportions of high-susceptibility zones, classified as very low susceptibility (CRI = 17.76, 15.37, and 14.58, respectively). Zone V presents a unique bimodal pattern, with 52.23% very low susceptibility but simultaneously showing elevated high and very high susceptibility proportions (12.55% and 12.42%), yielding a low susceptibility classification (CRI = 21.85). The coefficient of variation ranges from 0.73 (Zone I) to 1.17 (Zone IV), indicating increasing spatial heterogeneity from east to west, which reflects the complex interplay between geological structure, topography, and rainfall patterns across the municipality.
Figure 13 quantifies the spatial contribution of each engineering geological zone to Chongqing’s overall landslide susceptibility distribution. Figure 13a illustrates each zone’s contribution to the municipality’s total susceptibility burden across different grades. Zone I, despite covering 30.01% of the study area, contributes the highest absolute proportions to Chongqing’s total susceptibility across nearly all grades: 10.13% of very low, 6.25% of low, 5.96% of moderate, 5.24% of high, and 2.43% of very high susceptibility areas. Notably, Zone II shows the highest contribution to very low susceptibility areas (11.69%), reflecting its extensive low-susceptibility terrain. Zone III contributes comparably in very low (11.72%) and low (6.19%) categories but shows declining contributions toward higher levels (moderate: 4.52%, high: 3.09%, very high: 1.02%). Zones IV and V, occupying smaller areas, exhibit progressively diminishing contributions across all grades, with Zone V contributing less than 1% to each susceptibility category.
Figure 13.
Proportion of each zone’s susceptibility relative to the entire Chongqing region: (a) each zone’s contribution to overall Chongqing susceptibility distribution, (b) hierarchical contribution by level.
The hierarchical contribution analysis (Figure 13b) reveals the relative importance of each zone within specific susceptibility grades. Zone I demonstrates dominant control over high-susceptibility areas, accounting for 38.10% of all high susceptibility pixels and 38.04% of all very high susceptibility pixels municipality-wide, underscoring its critical importance for disaster susceptibility management and warranting prioritized monitoring and mitigation resources. Zones II and III show relatively balanced contributions across grades: Zone II maintains consistent contributions of 23.38–27.47% across all levels, while Zone III exhibits stronger presence in lower levels but diminishing influence in high-susceptibility categories. Zones IV and V, despite their limited areal extent, contribute disproportionately to very high susceptibility, indicating spatially concentrated extreme-susceptibility hotspots. This hierarchical pattern reveals that while low-to-moderate susceptibility distributes relatively evenly across Zones I-III, high and very high susceptibility areas concentrate predominantly in Zone I, necessitating zone-specific susceptibility management strategies tailored to local hazard characteristics.
5. Discussion
This study conducts a comprehensive landslide susceptibility assessment in Chongqing, a high-incidence mountainous region in southwestern China, through three innovative methodological contributions. First, we constructed a novel spectral feature dataset by integrating multi-source remote sensing indices with conventional geoenvironmental variables, establishing an enriched predictor framework that captures both terrain-geological controls and land surface characteristics. Second, we performed systematic feature engineering experiments encompassing three sequential analyses. Third, we developed a three-tier ensemble learning architecture that hierarchically integrates base learner diversity with meta-model optimization. The collective findings demonstrate three critical insights: (i) spectral features significantly enhance model predictive accuracy by capturing dynamic land surface conditions associated with slope instability; (ii) the complete feature set yields superior performance compared to both redundancy-reduced and stepwise-eliminated configurations, indicating that ensemble algorithms effectively exploit the full spectrum of predictor information and successfully manage multicollinearity through their inherent regularization mechanisms; and (iii) the Stacking–Bagging_XGBoost model achieves optimal performance across all evaluation metrics, validating the efficacy of hierarchical ensemble architectures in managing complex nonlinear relationships inherent in landslide susceptibility systems.
5.1. Feature Importance and Application
Feature engineering, data quality, and model architecture constitute the three fundamental pillars of robust landslide susceptibility modeling [44,45]. This study systematically evaluates feature contributions through three sequential experiments: spectral feature integration, redundancy elimination, and stepwise feature removal, providing critical insights into optimal predictor configurations for regional-scale susceptibility assessment. Recent advances in Earth observation systems have enabled unprecedented integration of multi-source spectral information into geohazard assessment frameworks [46,47,48]. This study represents the first systematic application of comprehensive spectral features (NDVI, NDWI, MNDWI, NDBI, NBR, MSAVI, NDMI, SAVI, BI, and Tasseled Cap transformations) in landslide susceptibility modeling for southwestern China’s mountainous terrain. Quantitative evaluation demonstrates that five out of eight models achieved enhanced predictive accuracy following spectral feature integration, with tree-based ensemble algorithms exhibiting particularly pronounced gains: XGBoost (+4.52%), LightGBM (+3.82%), and CatBoost (+3.67%). These gradient boosting models effectively exploited nonlinear relationships between spectral signatures and slope instability through their hierarchical feature combination mechanisms. The NBR consistently ranked among the top four features across all five tree-based models, even surpassing certain conventional terrain features. The Normalized NDVI demonstrated robust performance, validating the established inverse relationship between vegetation density and landslide occurrence through mechanical reinforcement and hydrological regulation. The NDBI ranked within top seven features, reflecting substantial impacts of urbanization-induced landscape modifications on slope stability, with approximately 70% of documented landslides occurring in zones of intensive human activity. These results validate that multi-source remote sensing information significantly enhances landslide susceptibility modeling when coupled with ensemble learning algorithms capable of exploiting complex nonlinear feature interactions.
A longstanding convention in statistical modeling advocates removing highly correlated features to mitigate multicollinearity effects [49,50]. However, our systematic evaluation reveals that this practice yields counterproductive outcomes when applied to ensemble learning algorithms in landslide susceptibility contexts [51]. Following removal of eight highly intercorrelated spectral features, 50% of tested models experienced accuracy degradation. Gradient boosting models exhibited pronounced sensitivity: XGBoost declined by 1.32%, LightGBM by 0.73%, and CatBoost by 0.84%. Conversely, only 37.5% of models achieved slight improvements, offering minimal practical benefit while sacrificing information completeness. These findings challenge conventional protocols that routinely implement correlation-based filtering, suggesting such preprocessing constitutes unnecessary and potentially detrimental intervention when employing modern ensemble algorithms with adequate sample sizes.
To rigorously validate feature importance rankings, we conducted stepwise elimination experiments progressively removing lowest-importance features. The comprehensive analysis converges on a clear recommendation: retention of the complete 24-feature set optimizes model performance. This conclusion rests on three integrated considerations: (i) Theoretically, landslide occurrence emerges from complex multi-featural interactions where each feature captures distinct dimensions, ensuring complete feature retention maintains model adaptability across geological-geomorphological heterogeneity; (ii) Algorithmically, modern ensemble methods incorporate multiple overfitting safeguards (regularization, depth constraints, early stopping) enabling robust learning in moderate-dimensional spaces without manual selection, where human-guided elimination susceptibility s disrupting self-adaptive processes. These findings advocate context-aware feature engineering: within regional-scale landslide susceptibility assessment characterized by moderate feature dimensionality, adequate sample sizes, and offline processing workflows, marginal computational savings through feature reduction are vastly outweighed by information integrity and model performance benefits of complete feature retention.
5.2. Ensemble Learning Architecture and Regional-Scale Landslide Susceptibility Mapping
Ensemble learning represents a paradigm shift in landslide susceptibility assessment, transitioning from reliance on single-model predictions to systematic integration of diverse algorithmic perspectives [52,53]. This study implements a three-tier modeling hierarchy—individual base learners, Bayesian-optimized models, and Stacking meta-ensembles—to explore how architectural complexity influences predictive performance and model generalization capacity for regional-scale geohazard mapping. The universal performance improvement observed across all eight models following Bayesian optimization validates the critical role of hyperparameter tuning in unlocking algorithm potential. This finding reinforces the fundamental tenet of ensemble learning theory: diversity in model architecture and training strategies generates complementary error patterns that, when properly aggregated, yield superior generalization compared to optimizing individual learners in isolation.
The Stacking framework represents the culmination of ensemble learning philosophy, systematically combining predictions from diverse base learners through trainable meta-models to exploit complementary strengths while mitigating individual weaknesses [54]. Our comparative evaluation of 12 Stacking configurations reveals critical insights into meta-learner selection and training strategies for landslide susceptibility contexts. Basic Stacking strategies employing single meta-learners (Decision Tree: 0.850, Naive Bayes: 0.849) failed to surpass the best individual base learner (LightGBM: 0.8530), demonstrating that naive prediction aggregation without sophisticated meta-learning architectures provides insufficient value. This counterintuitive result stems from information bottlenecks: when meta-learners possess limited representational capacity or strong independence assumptions, they cannot effectively model the complex correlation structures among base learner predictions, essentially reducing the ensemble to weighted averaging that discards valuable interaction information. In contrast, advanced Stacking strategies incorporating regularization and diversification mechanisms achieved substantial performance gains. The Stacking-Bagging_XGBoost meta-learner attained optimal performance (AUC: 0.8611), representing a 0.95% improvement over the best base learner, seemingly modest in percentage terms but translating to approximately 30–50 fewer misclassified cells per 1000 assessed units in high-resolution susceptibility mapping. The confusion matrix analysis (Figure 9d) reveals that Stacking’s advantages extend beyond aggregate AUC metrics to encompass balanced error distribution across both classes. The Stacking-Bagging_XGBoost model achieved simultaneous optimization of sensitivity (81.66%) and specificity (79.80%), a challenging objective where improvements in one metric typically trade off against the other. Compared to the best base learner, Stacking reduced false negatives by 43 instances while decreasing false positives by 183 instances. The 3.52–3.77% overall accuracy gains over individual gradient boosting models demonstrate that heterogeneous model integration, when properly architected, extracts incremental information that single algorithms, regardless of optimization sophistication, cannot access.
5.3. Spatial Patterns of Landslide Susceptibility and Regional Geological Controls
Chongqing’s susceptibility distribution exhibits a distinctive peripheral concentration pattern, with discontinuous high-susceptibility arcs along northeastern (Zone I), southeastern (Zone II), and southwestern (Zone V) margins, while the central-western basin interior remains predominantly stable [55]. Zone I demonstrates the strongest susceptibility signal, accounting for 38.10% of high susceptibility pixels despite occupying only 30.01% of total area, with mean susceptibility of 0.379. This exceptional vulnerability reflects its location within the Dabashan fold-thrust belt, where anticline-syncline alternations create dip-slope configurations aligning gravitational stresses with bedding planes. Unlike previous studies that attributed high susceptibility solely to topographic factors, our model reveals that structural geometry exerts pervasive control across all susceptibility levels, indicating systematic geological predisposition rather than isolated hazard hotspots. Zone V exhibits a distinctive bimodal distribution—the second-lowest mean susceptibility coexists with disproportionately high contributions to very high susceptibility. This pattern, newly identified in this study, reflects the Three Gorges’ extreme topographic relief where canyon margins concentrate hazards while plateau surfaces remain stable, demonstrating that localized extreme conditions can dominate regional profiles despite limited spatial extent.
The susceptibility map reveals systematic lithological control previously underemphasized in regional assessments. Zone II’s carbonate terrain shows moderated susceptibility despite rugged topography, while Zone III’s red-bed sequences exhibit comparable mean susceptibility on gentler slopes. Probability density curves (Figure 12a) quantify this control: Zones I–III display concentrated distributions, while Zones IV–V show broader distributions extending to higher values. This differential pattern reflects fundamental weathering behavior differences: carbonates develop massive structures resisting disaggregation, whereas red-beds generate thick weathering profiles prone to rainfall-induced failure. Zone I’s composite geology combining competent carbonate cores with Jurassic red-bed flanks creates soft–hard interbedding that generates numerous weak interfaces [56,57], a failure mechanism our model successfully captures through spatial learning. Our results advance understanding by: (i) quantifying structural control beyond topographic factors in fold-thrust belts; (ii) identifying bimodal susceptibility distributions in canyon landscapes; and (iii) demonstrating that lithological transitions govern susceptibility patterns more strongly than slope gradient alone in certain geological settings.
5.4. Current Research Limitations and Future Directions
While this study advances landslide susceptibility assessment through ensemble learning integration and comprehensive feature engineering, several methodological limitations warrant explicit acknowledgment. Temporal offset between spectral data and landslide inventory. A critical limitation concerns the temporal mismatch between our spectral features (derived from 2019–2024 imagery) and a substantial portion of the historical landslide inventory, particularly events occurring during peak activity periods such as 2007. This temporal offset raises the concern that spectral signatures may reflect post-failure recovery conditions rather than pre-failure susceptibility states. While our SHAP dependency patterns suggest that spectral features capture terrain-controlled persistent surface characteristics rather than transient scar signatures, we acknowledge this limitation requires more rigorous verification. Future research should employ multi-temporal spectral analysis using historical satellite archives (Landsat 1984-present, Sentinel-2 2015-present) to explicitly test whether spectral features represent permanent terrain-controlled characteristics versus transient post-failure signatures by comparing spectral-topographic relationships across pre-failure, post-failure, and recovery time windows. The 300 m resampling resolution adopted in this study, while necessary for computational feasibility across the entire 82,400 km2 study area, inevitably results in information loss for small-to-medium scale landslides. Future investigations should leverage high-performance computing infrastructure or hierarchical modeling strategies (coarse regional screening followed by fine-resolution local modeling) to preserve critical spatial details while maintaining regional coverage.
Future research should transition toward temporally explicit susceptibility modeling that incorporates time-varying environmental covariates and distinguishes between background susceptibility (controlled by quasi-static geological features) and dynamic susceptibility modulated by changing rainfall patterns, reservoir operations, and land-use evolution. Multi-temporal susceptibility mapping—generating sequential susceptibility surfaces for discrete time intervals (e.g., decadal epochs)—would enable quantification of susceptibility trends and identification of emerging high-risk zones before catastrophic failures occur. Such temporal frameworks require longitudinal landslide databases with precise occurrence dating, currently unavailable for most study regions but increasingly feasible through continuous satellite monitoring programs (Sentinel-1/2, Planet Labs) that enable rapid post-event landslide mapping.
6. Conclusions
This study conducts three innovative investigations to advance machine learning-based landslide susceptibility assessment in Chongqing, China. First, we introduce 12 spectral features derived from Sentinel-2 imagery into the susceptibility feature set, expanding traditional geomorphological and geological variables to incorporate land surface characteristics. Second, we implement systematic feature engineering protocols that rigorously evaluate spectral feature effectiveness through comparative model training with and without spectral features, assess redundant feature removal strategies via Pearson correlation analysis, and validate complete dataset reliability through sequential worst-performing feature elimination experiments. Third, we adopt an ensemble modeling framework comparing eight machine learning algorithms (RF, XGBoost, LightGBM, CatBoost, DT, SVM, MLPNN, KNN) with Bayesian hyperparameter optimization, followed by Stacking architecture construction that integrates optimized base learners.
The systematic feature engineering analysis yields three critical findings. Integration of spectral features significantly enhances model predictive accuracy, validating the effectiveness of multi-source remote sensing information in landslide susceptibility assessment. Conversely, redundant feature removal strategies based on high correlation thresholds prove counterproductive. Sequential feature elimination experiments confirm the complete 24 feature dataset as optimal, with systematic removal of low-importance features causing progressive performance deterioration across all models. Following Bayesian optimization, the Stacking-Bagging_XGBoost ensemble achieves superior predictive performance (AUC = 0.8611). The final susceptibility map classifies Chongqing as very low (43.30%), low (19.95%), moderate (16.62%), high (13.75%), and very high (6.39%) susceptibility, with critical high-risk corridors concentrated along the Yangtze River valley system, Dabashan fold-thrust belt, and southeastern karst mountain periphery.
Future research should explore temporal dynamics through multi-temporal spectral analysis capturing seasonal vegetation and moisture variations, incorporate physically-based rainfall triggering thresholds for operational early warning systems, evaluate deep learning architectures for spatial context modeling, and integrate societal vulnerability analysis to transition from hazard assessment to comprehensive disaster risk evaluation.
Author Contributions
Methodology, T.Z. and L.W. (Linfeng Wang); Software, G.C.; Investigation, H.C.; Data curation, S.Y.; Writing—original draft, Y.T. and T.Z.; Visualization, T.Z.; Funding acquisition, L.W. (Ligang Wang). All authors have read and agreed to the published version of the manuscript.
Funding
This research was funded by the Postdoctoral Fellowship Program of CPSF (GZC20250310), the General Program of the Chongqing Natural Science Foundation (CSTB2025NSCQ-GPX0837), Special Funding of the Chongqing Postdoctoral Research Project (2020925020), the China Postdoctoral Science Foundation (2024MD764034), and the Science and Technology Research Program of the Chongqing Municipal Education Commission (Grant No. KJZD-K202400708).
Data Availability Statement
The datasets generated during and/or analyzed during the current study are available from the corresponding author on reasonable request.
Acknowledgments
We thank the reviewers for their suggestions that improved the quality of this paper.
Conflicts of Interest
The authors declare no conflicts of interest.
Appendix A
Figure A1.
Static background conditioning features and anthropogenic disturbance features: (a) DEM, (b) Landforms, (c) Curvature, (d) Soil type, (e) Land use, (f) Lithology, (g) Aspect, (h) Slope, (i) Distance to river, (j) Distance to road, (k) Distance to road, (l) TPI.
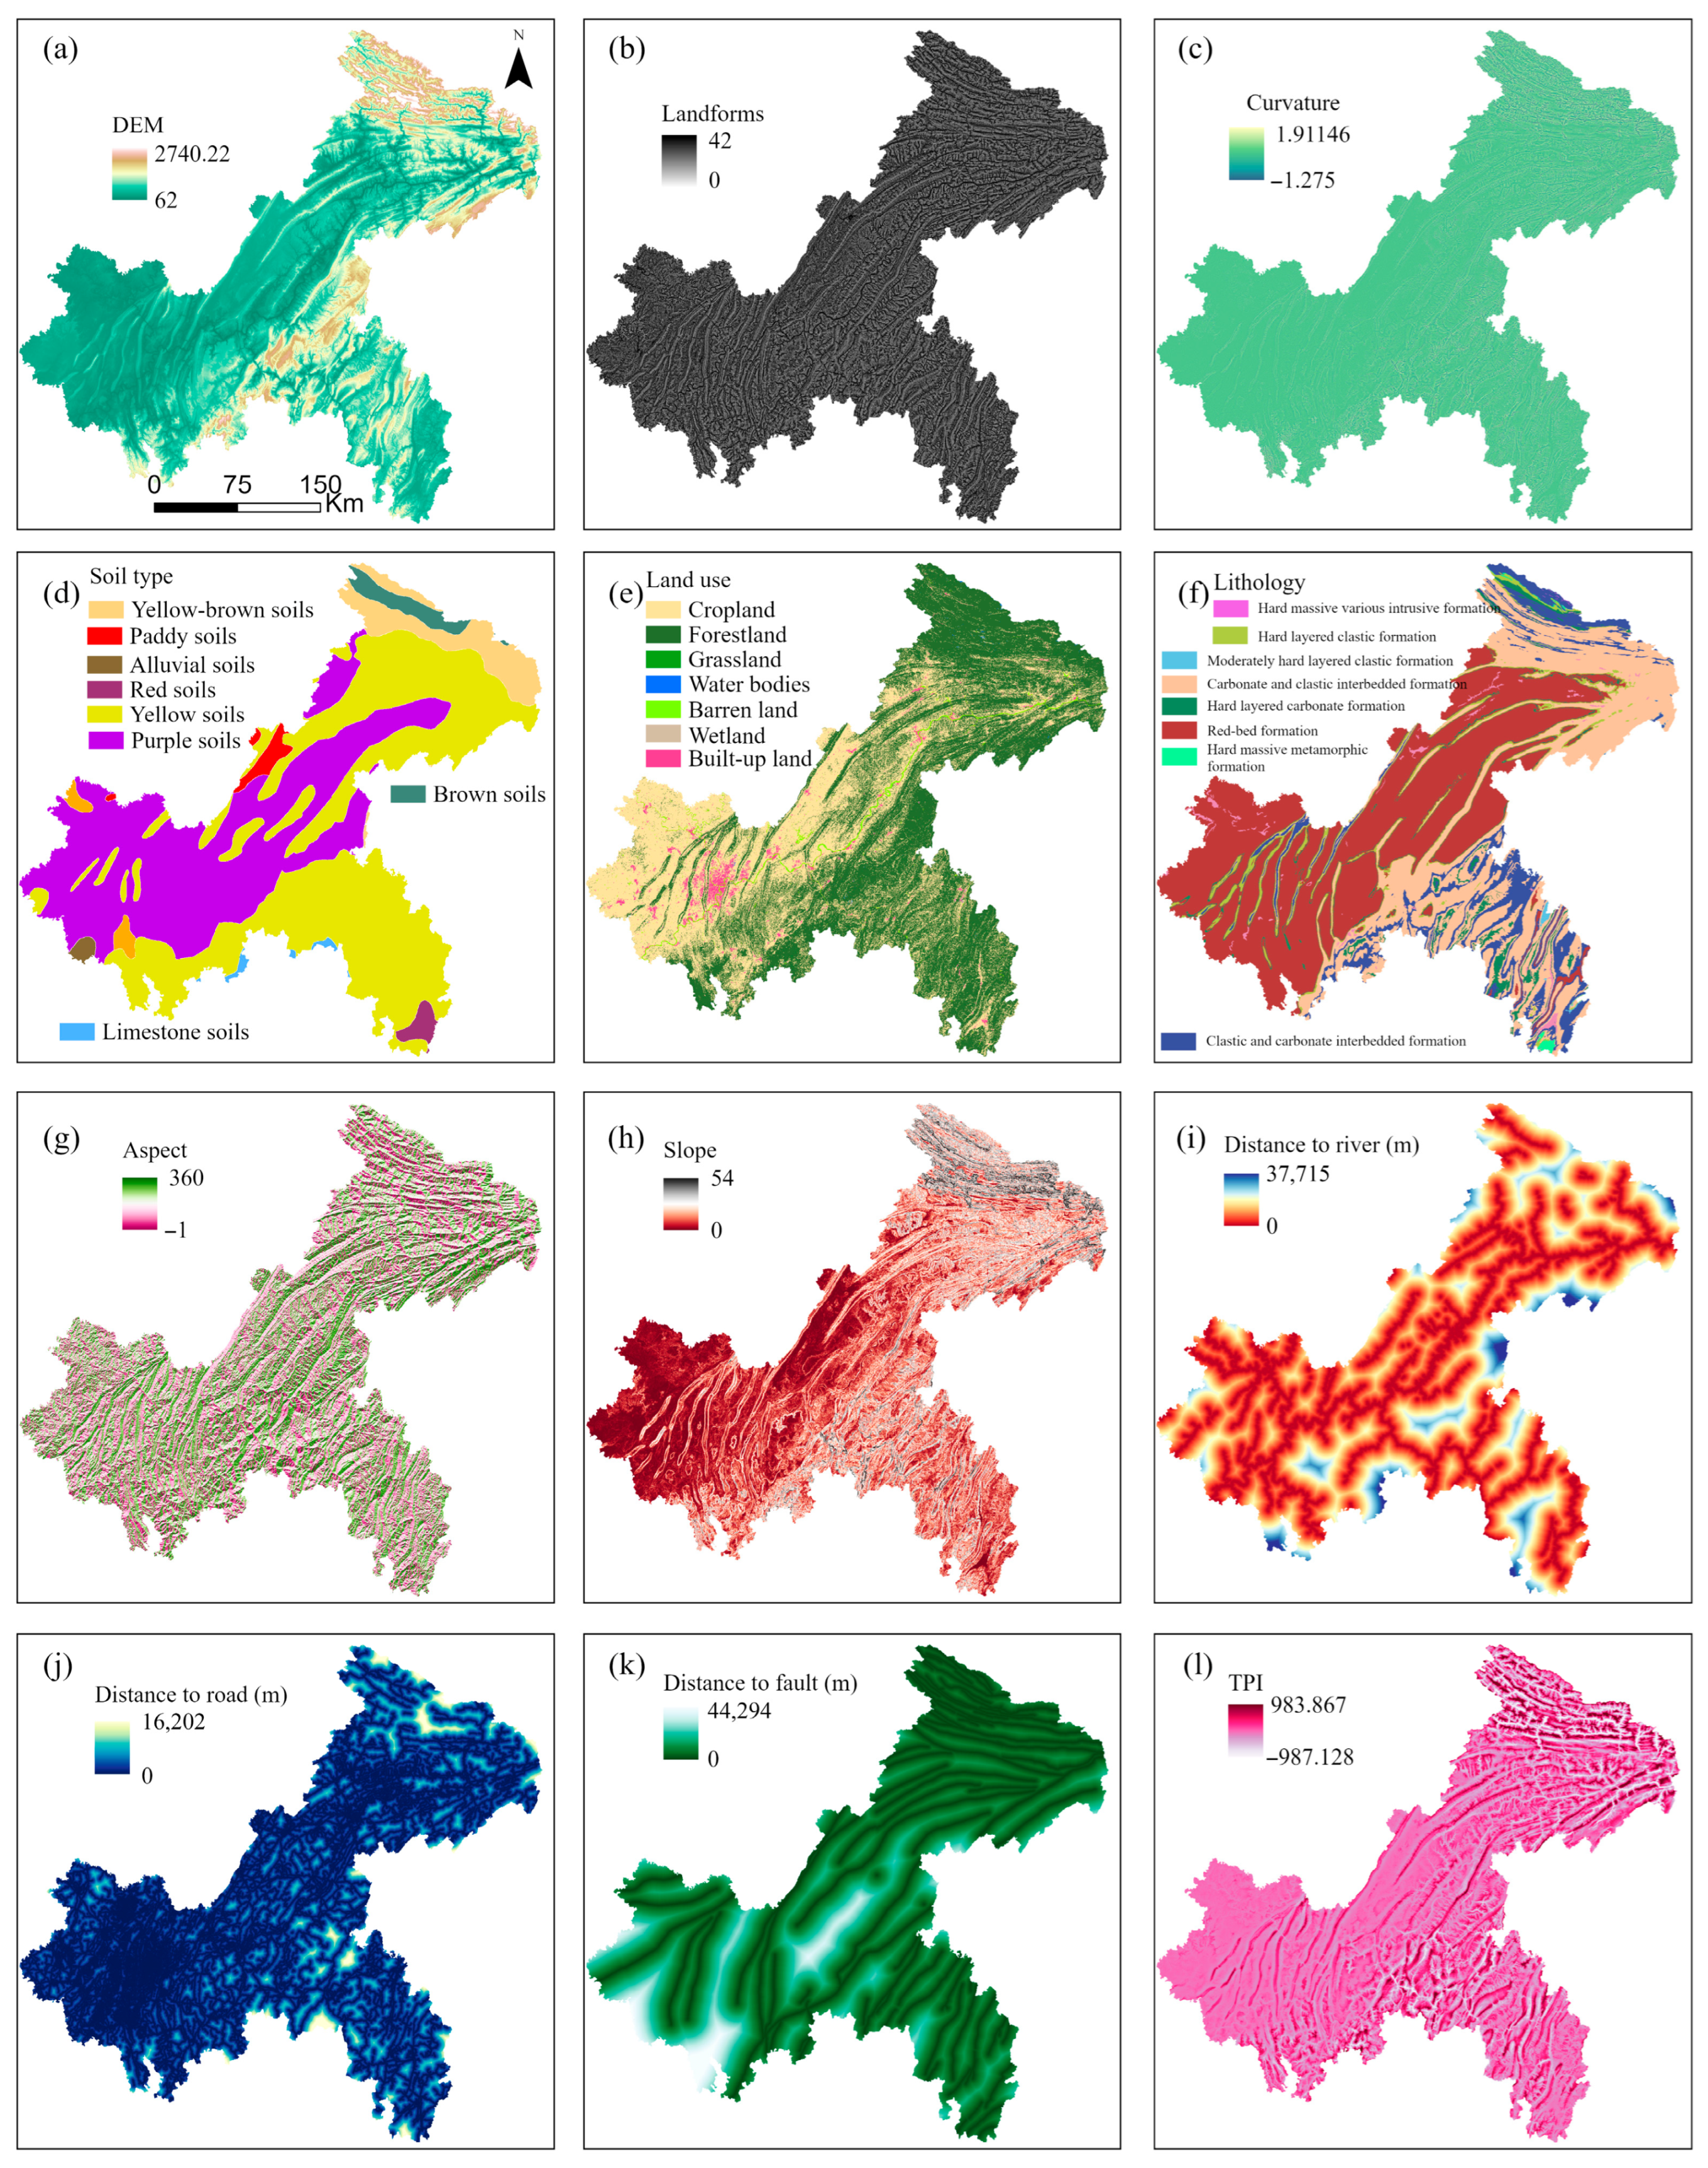
Figure A2.
Dynamic surface process features: (a) TCW, (b) TCG, (c) TCB, (d) EVI, (e) NDBI, (f) SAVI, (g) NDMI, (h) MSAVI, (i) BI, (j) NDWI, (k) NBR, (l) NDVI.
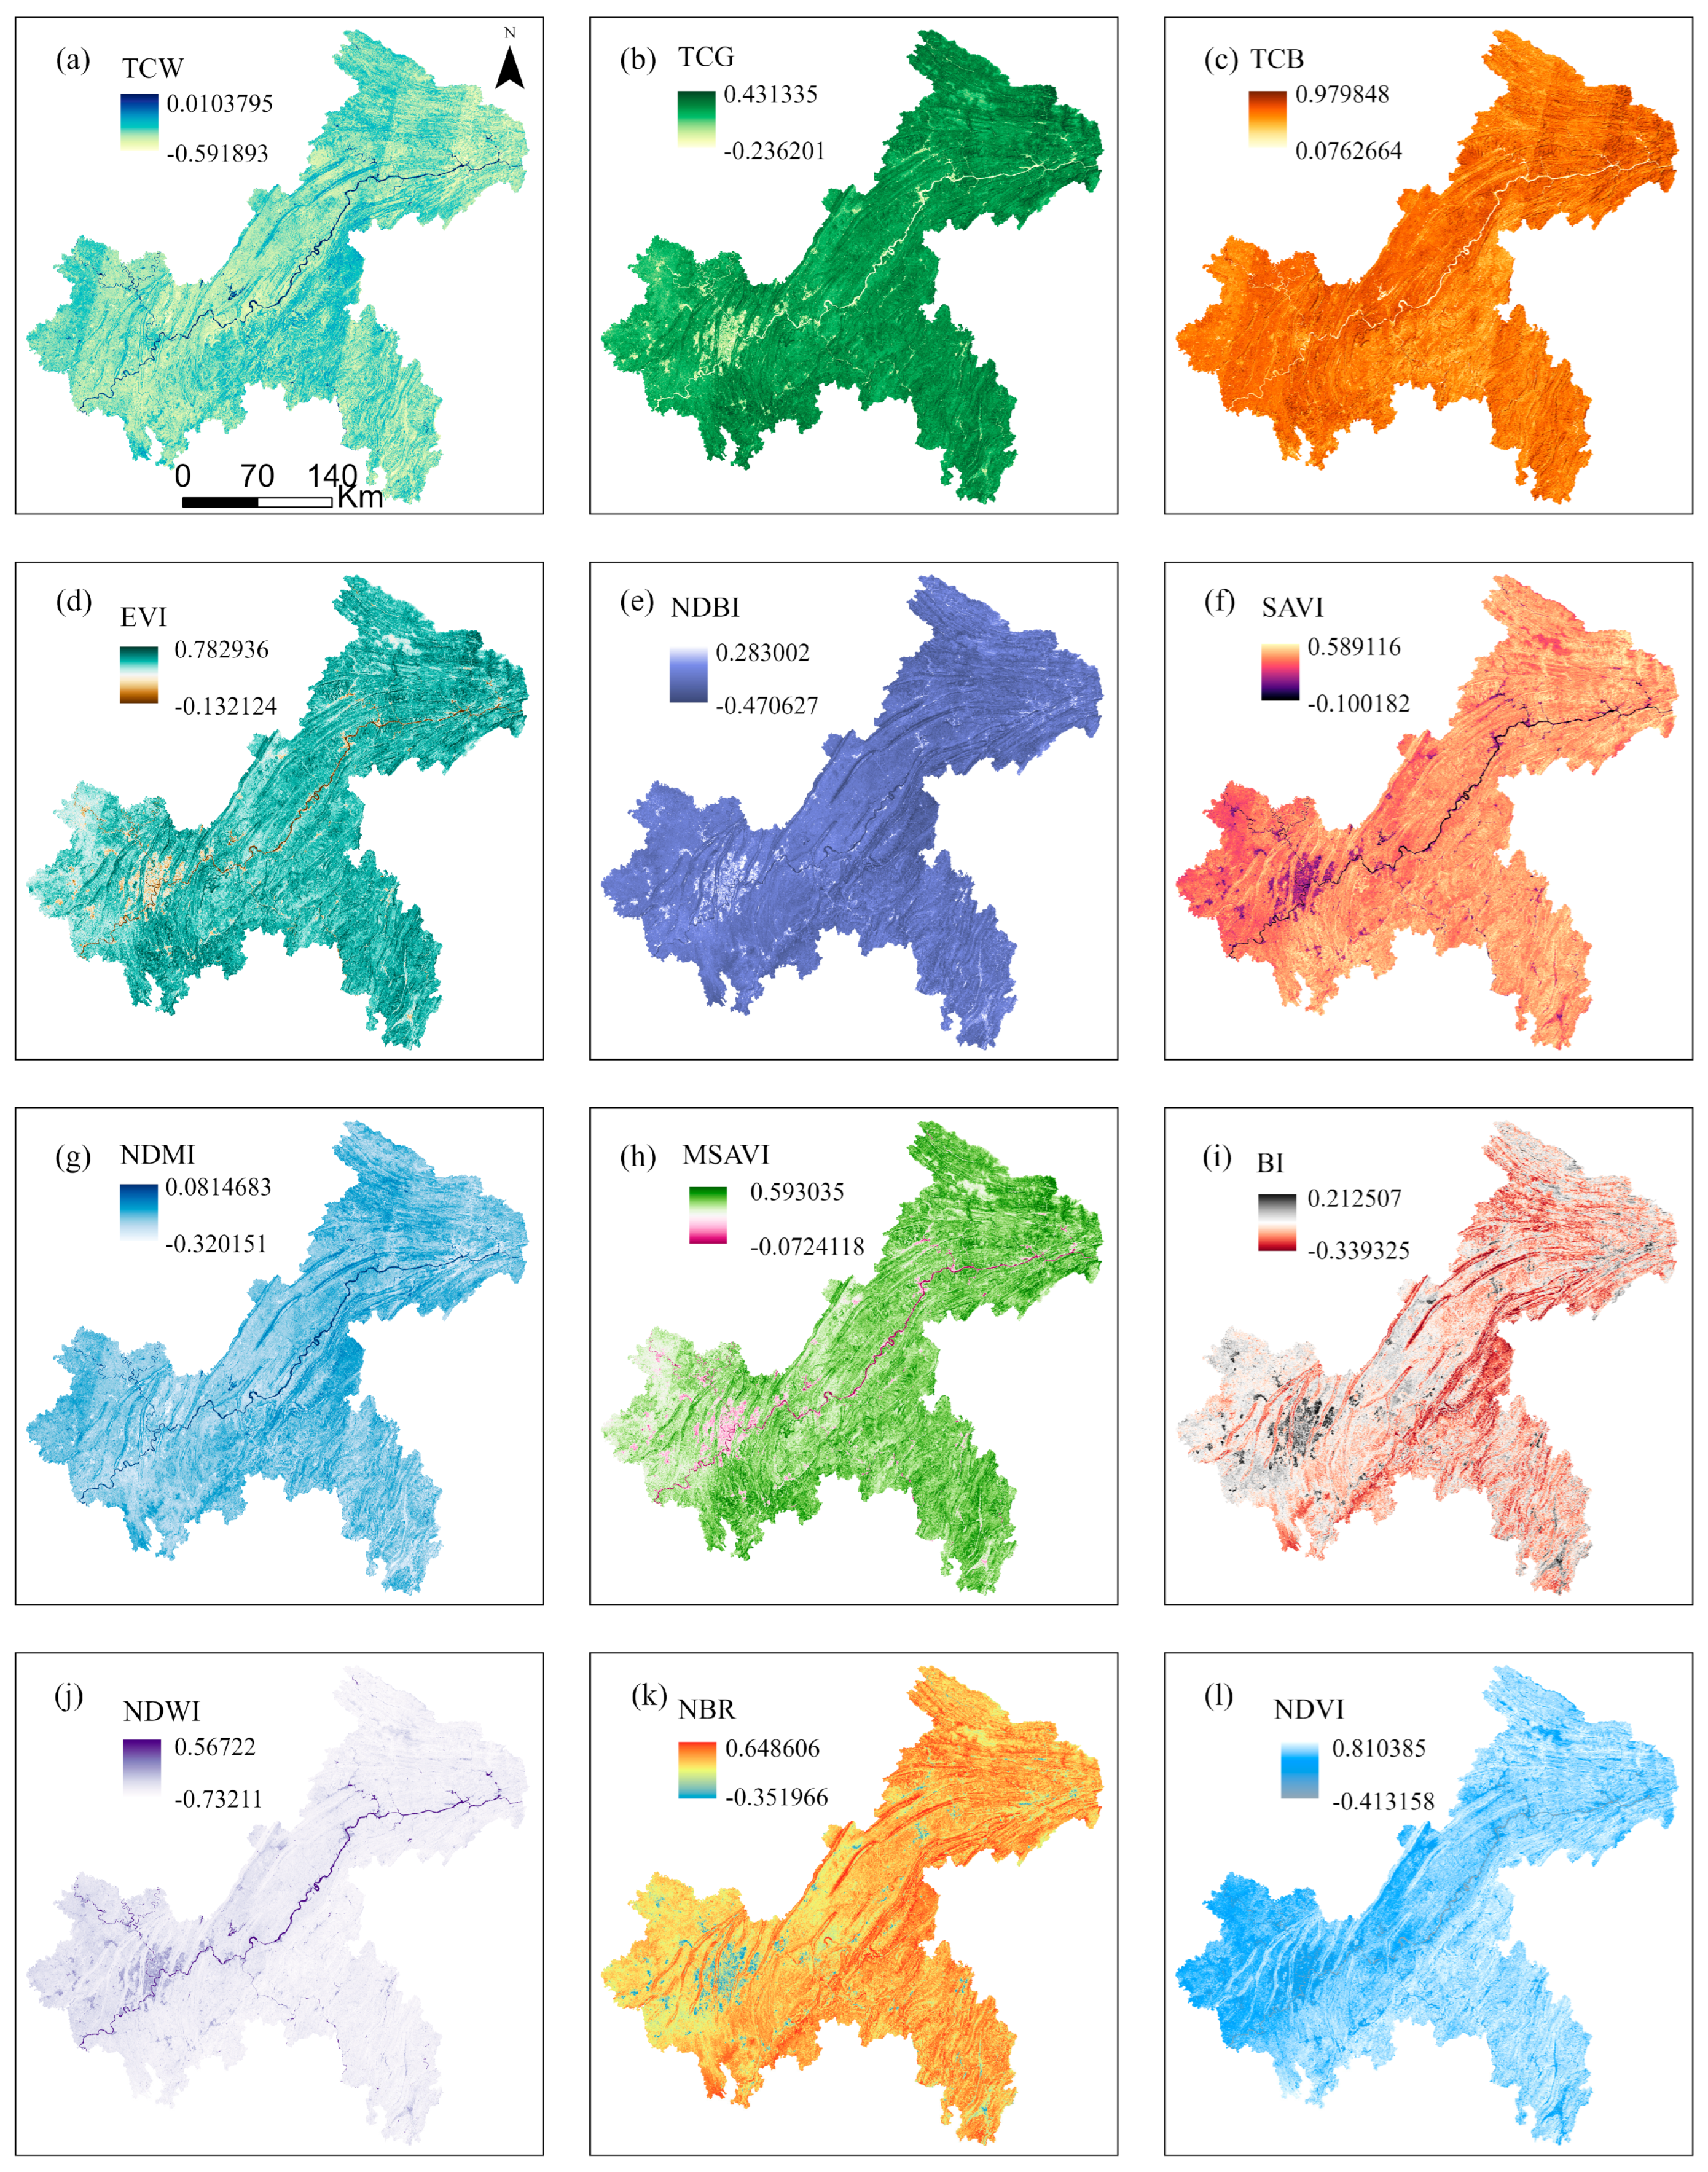
Table A1.
Hyperparameter configuration and optimization results for Bayesian optimization.
References
- Hungr, O.; Leroueil, S.; Picarelli, L. The Varnes Classification of Landslide Types, an Update. Landslides 2014, 11, 167–194. [Google Scholar] [CrossRef] [Scilit]
- Ye, X.; Zhu, H.-H.; Wu, B.; Tian, F.; Zhang, W.; Hu, X.; Schenato, L.; Pasuto, A.; Catani, F. Near-Surface Soil Hydrothermal Response Feedbacks Landslide Activity and Mechanism. Eng. Geol. 2024, 341, 107690. [Google Scholar] [CrossRef] [Scilit]
- Chang, F.; Dong, S.; Yin, H.; Ye, X.; Wu, Z.; Zhang, W.; Zhu, H. 3D Displacement Time Series Prediction of a North-Facing Reservoir Landslide Powered by InSAR and Machine Learning. J. Rock Mech. Geotech. Eng. 2025, 17, 4445–4461. [Google Scholar] [CrossRef] [Scilit]
- Zeng, T.; Lai, Y.; Li, Y.; Yu, W.; Li, Y.; Hayakawa, Y.S.; Glade, T.; Donta, P.K.; Yin, K.; Peduto, D. The Integration of Slow-Moving Landslide Features, MT-InSAR Data, Damage Survey Results and Deep Learning Algorithms for Building Vulnerability Zoning and Forecast. Eng. Geol. 2025, 359, 108449. [Google Scholar] [CrossRef] [Scilit]
- Wang, Y.; Sun, X.; Wen, T.; Wang, L. Step-like Displacement Prediction of Reservoir Landslides Based on a Metaheuristic-Optimized KELM: A Comparative Study. Bull. Eng. Geol. Environ. 2024, 83, 322. [Google Scholar] [CrossRef] [Scilit]
- Wang, Y.; Tang, H.; Huang, J.; Wen, T.; Ma, J.; Zhang, J. A Comparative Study of Different Machine Learning Methods for Reservoir Landslide Displacement Prediction. Eng. Geol. 2022, 298, 106544. [Google Scholar] [CrossRef] [Scilit]
- Taorui, Z.; Hongwei, J.; Qingli, L.; Kunlong, Y. Landslide Displacement Prediction Based on Variational Mode Decomposition and MIC-GWO-LSTM Model. Stoch. Environ. Res. Risk Assess. 2022, 36, 1353–1372. [Google Scholar] [CrossRef] [Scilit]
- Tang, H. Mechanism of the coevolution of landslides and river valleys in the Three Gorges Reservoir area. Chin. Sci. Bull. 2025, 70, 3505–3515. [Google Scholar] [CrossRef] [Scilit]
- Jin, B.; Liu, S.; Zeng, T.; Li, Y.; Wang, T.; Gui, L.; Zhao, B.; Yin, K. Spatio-Temporal Forecasting of Landslide Hazard in Chongqing National Transmission Protection Regions, China. Int. J. Digit. Earth 2024, 17, 2392843. [Google Scholar] [CrossRef] [Scilit]
- Guo, Z.; Zeng, T.; Zhang, Y.; Yu, W.; Wang, L.; Guo, Z.; Glade, T. A Novel Hybrid Model Integrating High Resolution Remote Sensing and Stacking Ensemble Techniques for Landslide Susceptibility Mapping: Application to Event-Based Landslide Inventory. Geomorphology 2025, 486, 109886. [Google Scholar] [CrossRef] [Scilit]
- Zeng, T.; Gong, Q.; Wu, L.; Zhu, Y.; Yin, K.; Peduto, D. Double-Index Rainfall Warning and Probabilistic Physically Based Model for Fast-Moving Landslide Hazard Analysis in Subtropical-Typhoon Area. Landslides 2024, 21, 753–773. [Google Scholar] [CrossRef] [Scilit]
- Zeng, T.; Guo, Z.; Wang, L.; Xu, C.; Wu, F.; Jin, B.; Peduto, D. Hazard Prediction Modeling for Typhoon-Triggered Shallow Landslides by Integrating Physically-Based Model and Extreme Rainfall Analysis. Bull. Eng. Geol. Environ. 2025, 84, 356. [Google Scholar] [CrossRef] [Scilit]
- Zeng, T.; Jin, B.; Glade, T.; Xie, Y.; Li, Y.; Zhu, Y.; Yin, K. Assessing the Imperative of Conditioning Factor Grading in Machine Learning-Based Landslide Susceptibility Modeling: A Critical Inquiry. Catena 2024, 236, 107732. [Google Scholar] [CrossRef] [Scilit]
- Huang, F.; Liu, K.; Jiang, S.; Catani, F.; Liu, W.; Fan, X.; Huang, J. Optimization Method of Conditioning Factors Selection and Combination for Landslide Susceptibility Prediction. J. Rock Mech. Geotech. Eng. 2025, 17, 722–746. [Google Scholar] [CrossRef] [Scilit]
- Huang, F.; Xiong, H.; Jiang, S.-H.; Yao, C.; Fan, X.; Catani, F.; Chang, Z.; Zhou, X.; Huang, J.; Liu, K. Modelling Landslide Susceptibility Prediction: A Review and Construction of Semi-Supervised Imbalanced Theory. Earth-Sci. Rev. 2024, 250, 104700. [Google Scholar] [CrossRef] [Scilit]
- Zhang, L.; Zeng, T.; Wang, L.; Li, L. Advancing Seismic Landslide Susceptibility Modeling: A Comparative Evaluation of Deep Learning Models through Particle Swarm Optimization. Earth Sci. Inform. 2024, 17, 3547–3566. [Google Scholar] [CrossRef] [Scilit]
- Jin, B.; Zeng, T.; Liu, S.; Li, Y.; Gui, L.; Zhao, B.; Yin, K.; Catani, F.; Peduto, D. Quantitative Risk Assessment for Rainfall-Induced Landslides of Transmission Line Towers: The Case of Chongqing National Transmission Protection Regions. Int. J. Disaster Risk Reduct. 2025, 128, 105715. [Google Scholar] [CrossRef] [Scilit]
- Zhang, Q.; Wang, T. Deep Learning for Exploring Landslides with Remote Sensing and Geo-Environmental Data: Frameworks, Progress, Challenges, and Opportunities. Remote Sens. 2024, 16, 1344. [Google Scholar] [CrossRef] [Scilit]
- Weaver, C.P.; Lempert, R.J.; Brown, C.; Hall, J.A.; Revell, D.; Sarewitz, D. Improving the Contribution of Climate Model Information to Decision Making: The Value and Demands of Robust Decision Frameworks. WIRES Clim. Chang. 2013, 4, 39–60. [Google Scholar] [CrossRef] [Scilit]
- Rajashekharam, B.; Alapati, M. Impact of Feature Selection on Predictive Damage Identification in Beams Using Free Vibration Data-Based Machine Learning Algorithm. Innov. Infrastruct. Solut. 2025, 10, 581. [Google Scholar] [CrossRef] [Scilit]
- Amanda, L.R.; Anasanti, M.D.; Sumalatha, R. Assessing Performance Across Various Machine Learning Algorithms with Integrated Feature Selection for Fetal Heart Classification. Int. J. Artif. Intell. Res. 2024, 8, 1. [Google Scholar] [CrossRef] [Scilit]
- Seitllari, A. Exploring Cracking Resistance in Modified Asphalt Mixtures through a Comparative Assessment of Mechanical Behavior and Performance Screening Indicators. Constr. Build. Mater. 2025, 464, 140187. [Google Scholar] [CrossRef] [Scilit]
- Sahin, E.K. Implementation of Free and Open-Source Semi-Automatic Feature Engineering Tool in Landslide Susceptibility Mapping Using the Machine-Learning Algorithms RF, SVM, and XGBoost. Stoch. Environ. Res. Risk Assess. 2023, 37, 1067–1092. [Google Scholar] [CrossRef] [Scilit]
- Ling, X.; Zhu, Y.; Ming, D.; Chen, Y.; Zhang, L.; Du, T. Feature Engineering of Geohazard Susceptibility Analysis Based on the Random Forest Algorithm: Taking Tianshui City, Gansu Province, as an Example. Remote Sens. 2022, 14, 5658. [Google Scholar] [CrossRef] [Scilit]
- Yang, Z.; Wu, R.; Shao, W.; Guo, C.; Wang, X.; Yang, H. Influence of Landslide Activity Characteristics on Landslide Susceptibility Assessment: A Case Study in the Upper Jinsha River. Remote Sens. 2025, 17, 3335. [Google Scholar] [CrossRef] [Scilit]
- Ersayin, K. The Influence of Sampling Strategies on Shallow Landslide Susceptibility Modelling in a Mountainous Area. Landslides 2025. [Google Scholar] [CrossRef] [Scilit]
- Zeng, T.; Wu, L.; Peduto, D.; Glade, T.; Hayakawa, Y.S.; Yin, K. Ensemble Learning Framework for Landslide Susceptibility Mapping: Different Basic Classifier and Ensemble Strategy. Geosci. Front. 2023, 14, 101645. [Google Scholar] [CrossRef] [Scilit]
- Sun, D.; Wu, X.; Wen, H.; Gu, Q. A LightGBM-Based Landslide Susceptibility Model Considering the Uncertainty of Non-Landslide Samples. Geomat. Nat. Hazards Risk 2023, 14, 2213807. [Google Scholar] [CrossRef] [Scilit]
- Meena, S.R.; Hussain, M.A.; Ullah, H.; Ullah, I. Landslide Susceptibility Mapping Using Hybrid Machine Learning Classifiers: A Case Study of Neelum Valley, Pakistan. Bull. Eng. Geol. Environ. 2025, 84, 242. [Google Scholar] [CrossRef] [Scilit]
- Kadavi, P.R.; Lee, C.-W.; Lee, S. Application of Ensemble-Based Machine Learning Models to Landslide Susceptibility Mapping. Remote Sens. 2018, 10, 1252. [Google Scholar] [CrossRef] [Scilit]
- Fang, Z.; Wang, Y.; Peng, L.; Hong, H. A Comparative Study of Heterogeneous Ensemble-Learning Techniques for Landslide Susceptibility Mapping. Int. J. Geogr. Inf. Sci. 2021, 35, 321–347. [Google Scholar] [CrossRef] [Scilit]
- Cui, C.; Hu, M.; Weir, J.D.; Wu, T. A Recommendation System for Meta-Modeling: A Meta-Learning Based Approach. Expert Syst. Appl. 2016, 46, 33–44. [Google Scholar] [CrossRef] [Scilit]
- Bonissone, P.P.; Xue, F.; Subbu, R. Fast Meta-Models for Local Fusion of Multiple Predictive Models. Appl. Soft Comput. 2011, 11, 1529–1539. [Google Scholar] [CrossRef] [Scilit]
- Bansal, Y.; Lillis, D.; Kechadi, M.-T. A Neural Meta Model for Predicting Winter Wheat Crop Yield. Mach. Learn. 2024, 113, 3771–3788. [Google Scholar] [CrossRef] [Scilit]
- Uplopwar, A.; Vashisth, R.; Kushwaha, A. Cardiovascular Disease Detection Using Stacking Meta-Learner with Pipeline Machine Learning. Neural Comput. Applic 2025, 37, 18219–18232. [Google Scholar] [CrossRef] [Scilit]
- Vasan, D.; Alazab, M.; Venkatraman, S.; Akram, J.; Qin, Z. MTHAEL: Cross-Architecture IoT Malware Detection Based on Neural Network Advanced Ensemble Learning. IEEE Trans. Comput. 2020, 69, 1654–1667. [Google Scholar] [CrossRef] [Scilit]
- Zeng, T.; Wu, X.; Lai, Y.; Wu, L.; Glade, T.; Yin, K.; Peduto, D. Assessing Soil Thickness and Distribution in Subtropical Typhoon Areas: An Integration of Advanced Geomorphological Surveys and Ensemble Learning Approaches. Geoenviron. Disasters 2025, 12, 31. [Google Scholar] [CrossRef] [Scilit]
- Van Loon, W.; Fokkema, M.; Szabo, B.; De Rooij, M. View Selection in Multi-View Stacking: Choosing the Meta-Learner. Adv. Data Anal. Classif. 2024, 19, 579–617. [Google Scholar] [CrossRef] [Scilit]
- Li, Q.; Wang, X. Bayesian Optimization of Stacking Ensemble Learning Model for HPC Compressive Strength Prediction. Expert Syst. Appl. 2025, 288, 128281. [Google Scholar] [CrossRef] [Scilit]
- Pangestika, D.E.; Fitrianto, A.; Sadik, K. Classification Performance of Stacking Ensemble with Meta-Model of Categorical Principal Component Logistic Regression on Food Insecurity Data. Sci. J. Inform. 2024, 11, 1085–1098. [Google Scholar] [CrossRef] [Scilit]
- Theobald, E.J.; Ettinger, A.K.; Burgess, H.K.; DeBey, L.B.; Schmidt, N.R.; Froehlich, H.E.; Wagner, C.; HilleRisLambers, J.; Tewksbury, J.; Harsch, M.A.; et al. Global Change and Local Solutions: Tapping the Unrealized Potential of Citizen Science for Biodiversity Research. Biol. Conserv. 2015, 181, 236–244. [Google Scholar] [CrossRef] [Scilit]
- Shi, T.; Xu, H. Derivation of Tasseled Cap Transformation Coefficients for Sentinel-2 MSI At-Sensor Reflectance Data. IEEE J. Sel. Top. Appl. Earth Obs. Remote Sens. 2019, 12, 4038–4048. [Google Scholar] [CrossRef] [Scilit]
- Lundberg, S.; Lee, S.-I. A Unified Approach to Interpreting Model Predictions. arXiv 2017, arXiv:1705.07874. [Google Scholar] [CrossRef] [Scilit]
- Ye, C.; Wu, H.; Oguchi, T.; Tang, Y.; Pei, X.; Wu, Y. Physically Based and Data-Driven Models for Landslide Susceptibility Assessment: Principles, Applications, and Challenges. Remote Sens. 2025, 17, 2280. [Google Scholar] [CrossRef] [Scilit]
- Al-Najjar, H.A.H.; Pradhan, B.; Kalantar, B.; Sameen, M.I.; Santosh, M.; Alamri, A. Landslide Susceptibility Modeling: An Integrated Novel Method Based on Machine Learning Feature Transformation. Remote Sens. 2021, 13, 3281. [Google Scholar] [CrossRef] [Scilit]
- Sousa, J.J.; Liu, G.; Fan, J.; Perski, Z.; Steger, S.; Bai, S.; Wei, L.; Salvi, S.; Wang, Q.; Tu, J.; et al. Geohazards Monitoring and Assessment Using Multi-Source Earth Observation Techniques. Remote Sens. 2021, 13, 4269. [Google Scholar] [CrossRef] [Scilit]
- Li, Z.; Zhang, C.; Yu, C.; Ding, M.; Zhu, W.; Hoey, T.B.; Chen, B.; Du, J.; Li, X.; Peng, J. Comprehensive Geohazard Detection along the Qinghai-Tibet Plateau Transportation Corridor Based on Multi-Sourced Earth Observations. Int. J. Appl. Earth Obs. Geoinf. 2025, 143, 104811. [Google Scholar] [CrossRef] [Scilit]
- Zhu, H.-H.; Ye, X.; Pei, H.-F.; Zhang, W.; Cheng, G.; Li, Z.-L. Probing Multi-Physical Process and Deformation Mechanism of a Large-Scale Landslide Using Integrated Dual-Source Monitoring. Geosci. Front. 2024, 15, 101773. [Google Scholar] [CrossRef] [Scilit]
- Chan, J.Y.-L.; Leow, S.M.H.; Bea, K.T.; Cheng, W.K.; Phoong, S.W.; Hong, Z.-W.; Chen, Y.-L. Mitigating the Multicollinearity Problem and Its Machine Learning Approach: A Review. Mathematics 2022, 10, 1283. [Google Scholar] [CrossRef] [Scilit]
- Garg, A.; Tai, K. Comparison of Statistical and Machine Learning Methods in Modelling of Data with Multicollinearity. Int. J. Model. Identif. Control. 2013, 18, 295. [Google Scholar] [CrossRef] [Scilit]
- Di Napoli, M.; Carotenuto, F.; Cevasco, A.; Confuorto, P.; Di Martire, D.; Firpo, M.; Pepe, G.; Raso, E.; Calcaterra, D. Machine Learning Ensemble Modelling as a Tool to Improve Landslide Susceptibility Mapping Reliability. Landslides 2020, 17, 1897–1914. [Google Scholar] [CrossRef] [Scilit]
- Sharma, N.; Saharia, M.; Ramana, G.V. High Resolution Landslide Susceptibility Mapping Using Ensemble Machine Learning and Geospatial Big Data. Catena 2024, 235, 107653. [Google Scholar] [CrossRef] [Scilit]
- Wang, Z.; Kong, Y.; Xiao, K.; Cao, C.; Li, Y.; Wu, Y.; Xie, M.; Tang, R.; Li, C.; Gong, C. An Interpretable Ensemble Learning Framework Based on Remote Sensing for Ecological–Geological Environment Evaluation: The Case of Laos. Remote Sens. 2025, 17, 3240. [Google Scholar] [CrossRef] [Scilit]
- Garouani, M.; Barhrhouj, A.; Teste, O. XStacking: An Effective and Inherently Explainable Framework for Stacked Ensemble Learning. Inf. Fusion 2025, 124, 103358. [Google Scholar] [CrossRef] [Scilit]
- Huang, J.; Wen, H.; Li, Z.; Zhang, Y. Landslide-Oriented Disaster Resilience Evaluation in Mountainous Cities: A Case Study in Chongqing, China. Resilient Cities Struct. 2024, 3, 34–51. [Google Scholar] [CrossRef] [Scilit]
- Zhou, C.; Yang, X.; Liang, Y.; Du, Z.; Liu, Z.; Huang, W.; Ming, W. Classification of Red-Bed Rock Mass Structures and Slope Failure Modes in South China. Geosciences 2019, 9, 273. [Google Scholar] [CrossRef] [Scilit]
- Yigen, Q.; Genlan, Y.; Bangyu, L.; Jinxing, X. Study on Deformation and Failure Mechanism of Low-Dip Red Bed Slope with Soft-Hard Interbedded Structure: A Case Study of Chishui, China. Nat. Hazards 2024, 120, 10539–10557. [Google Scholar] [CrossRef] [Scilit]
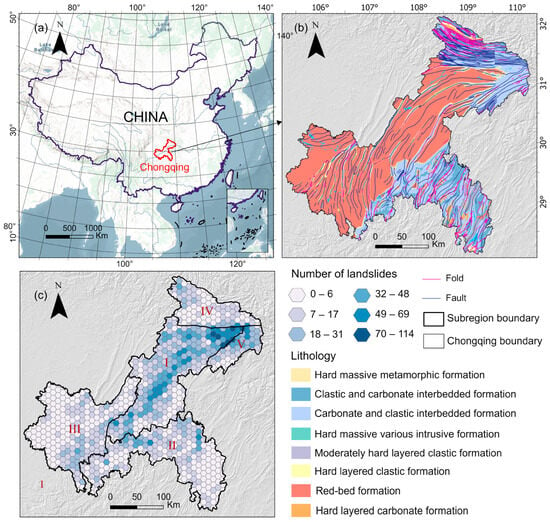
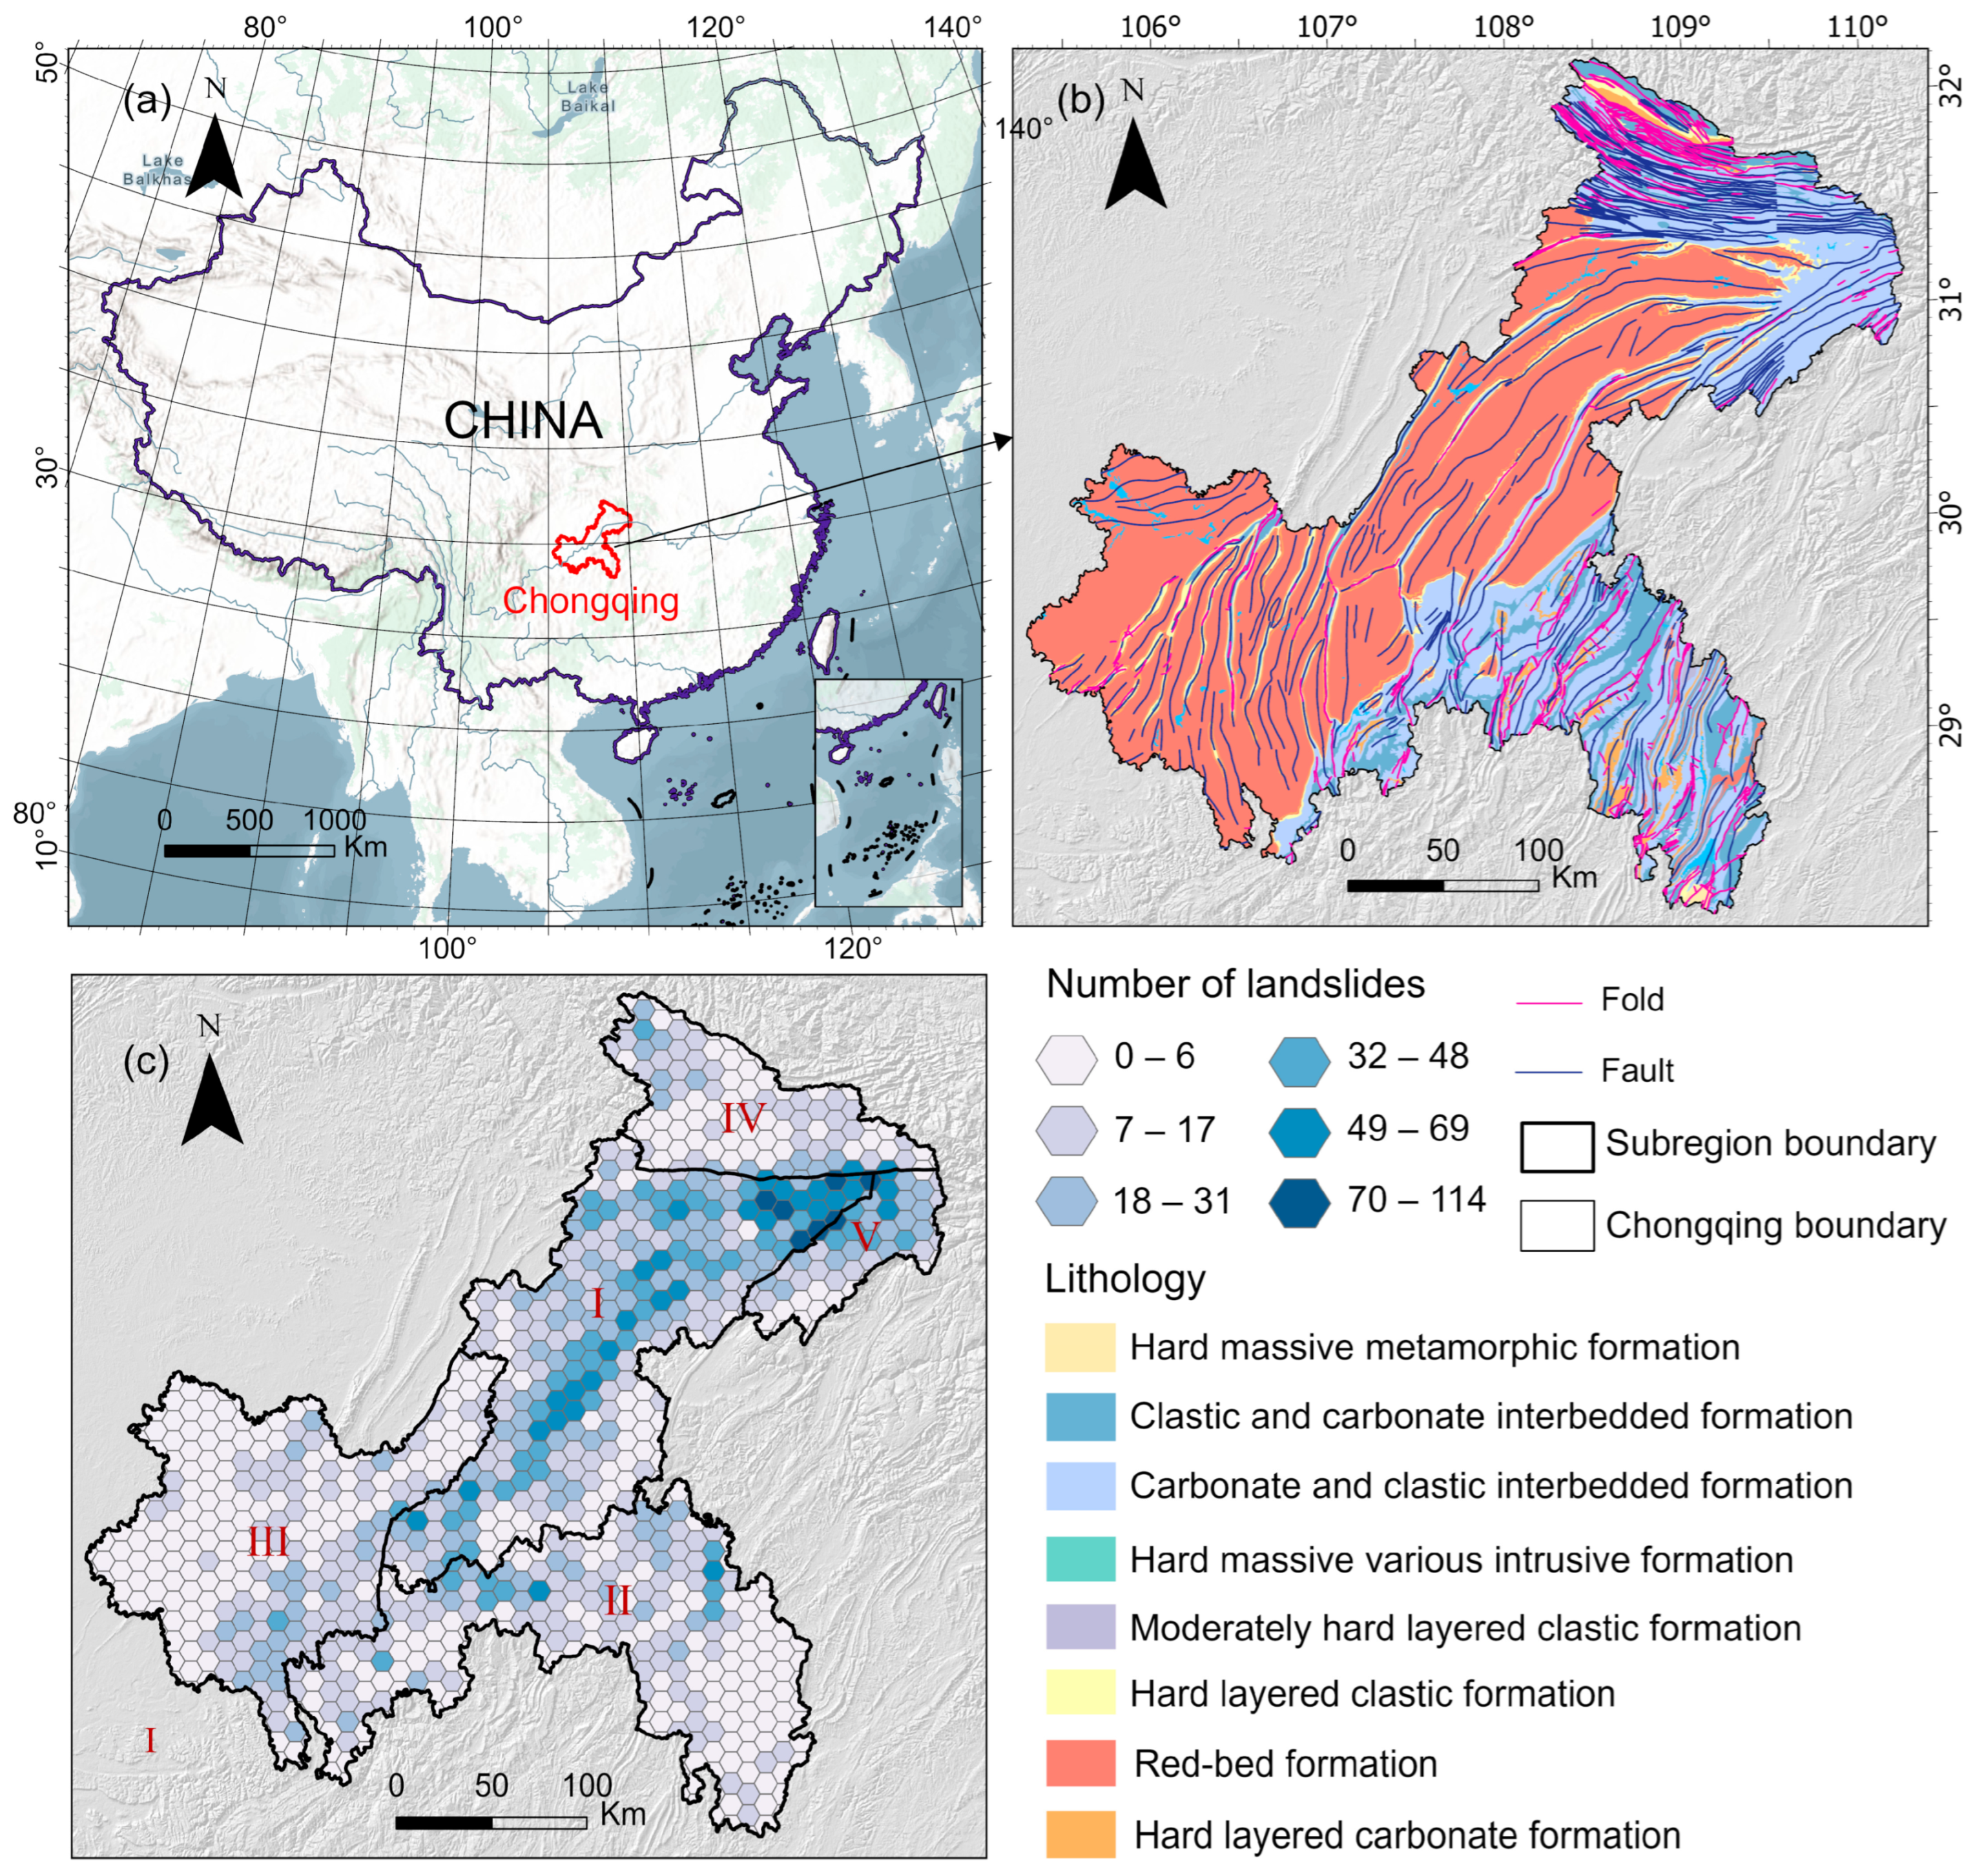
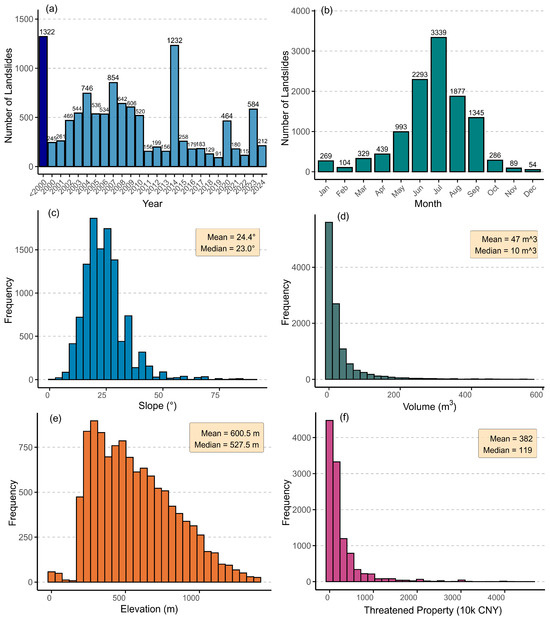
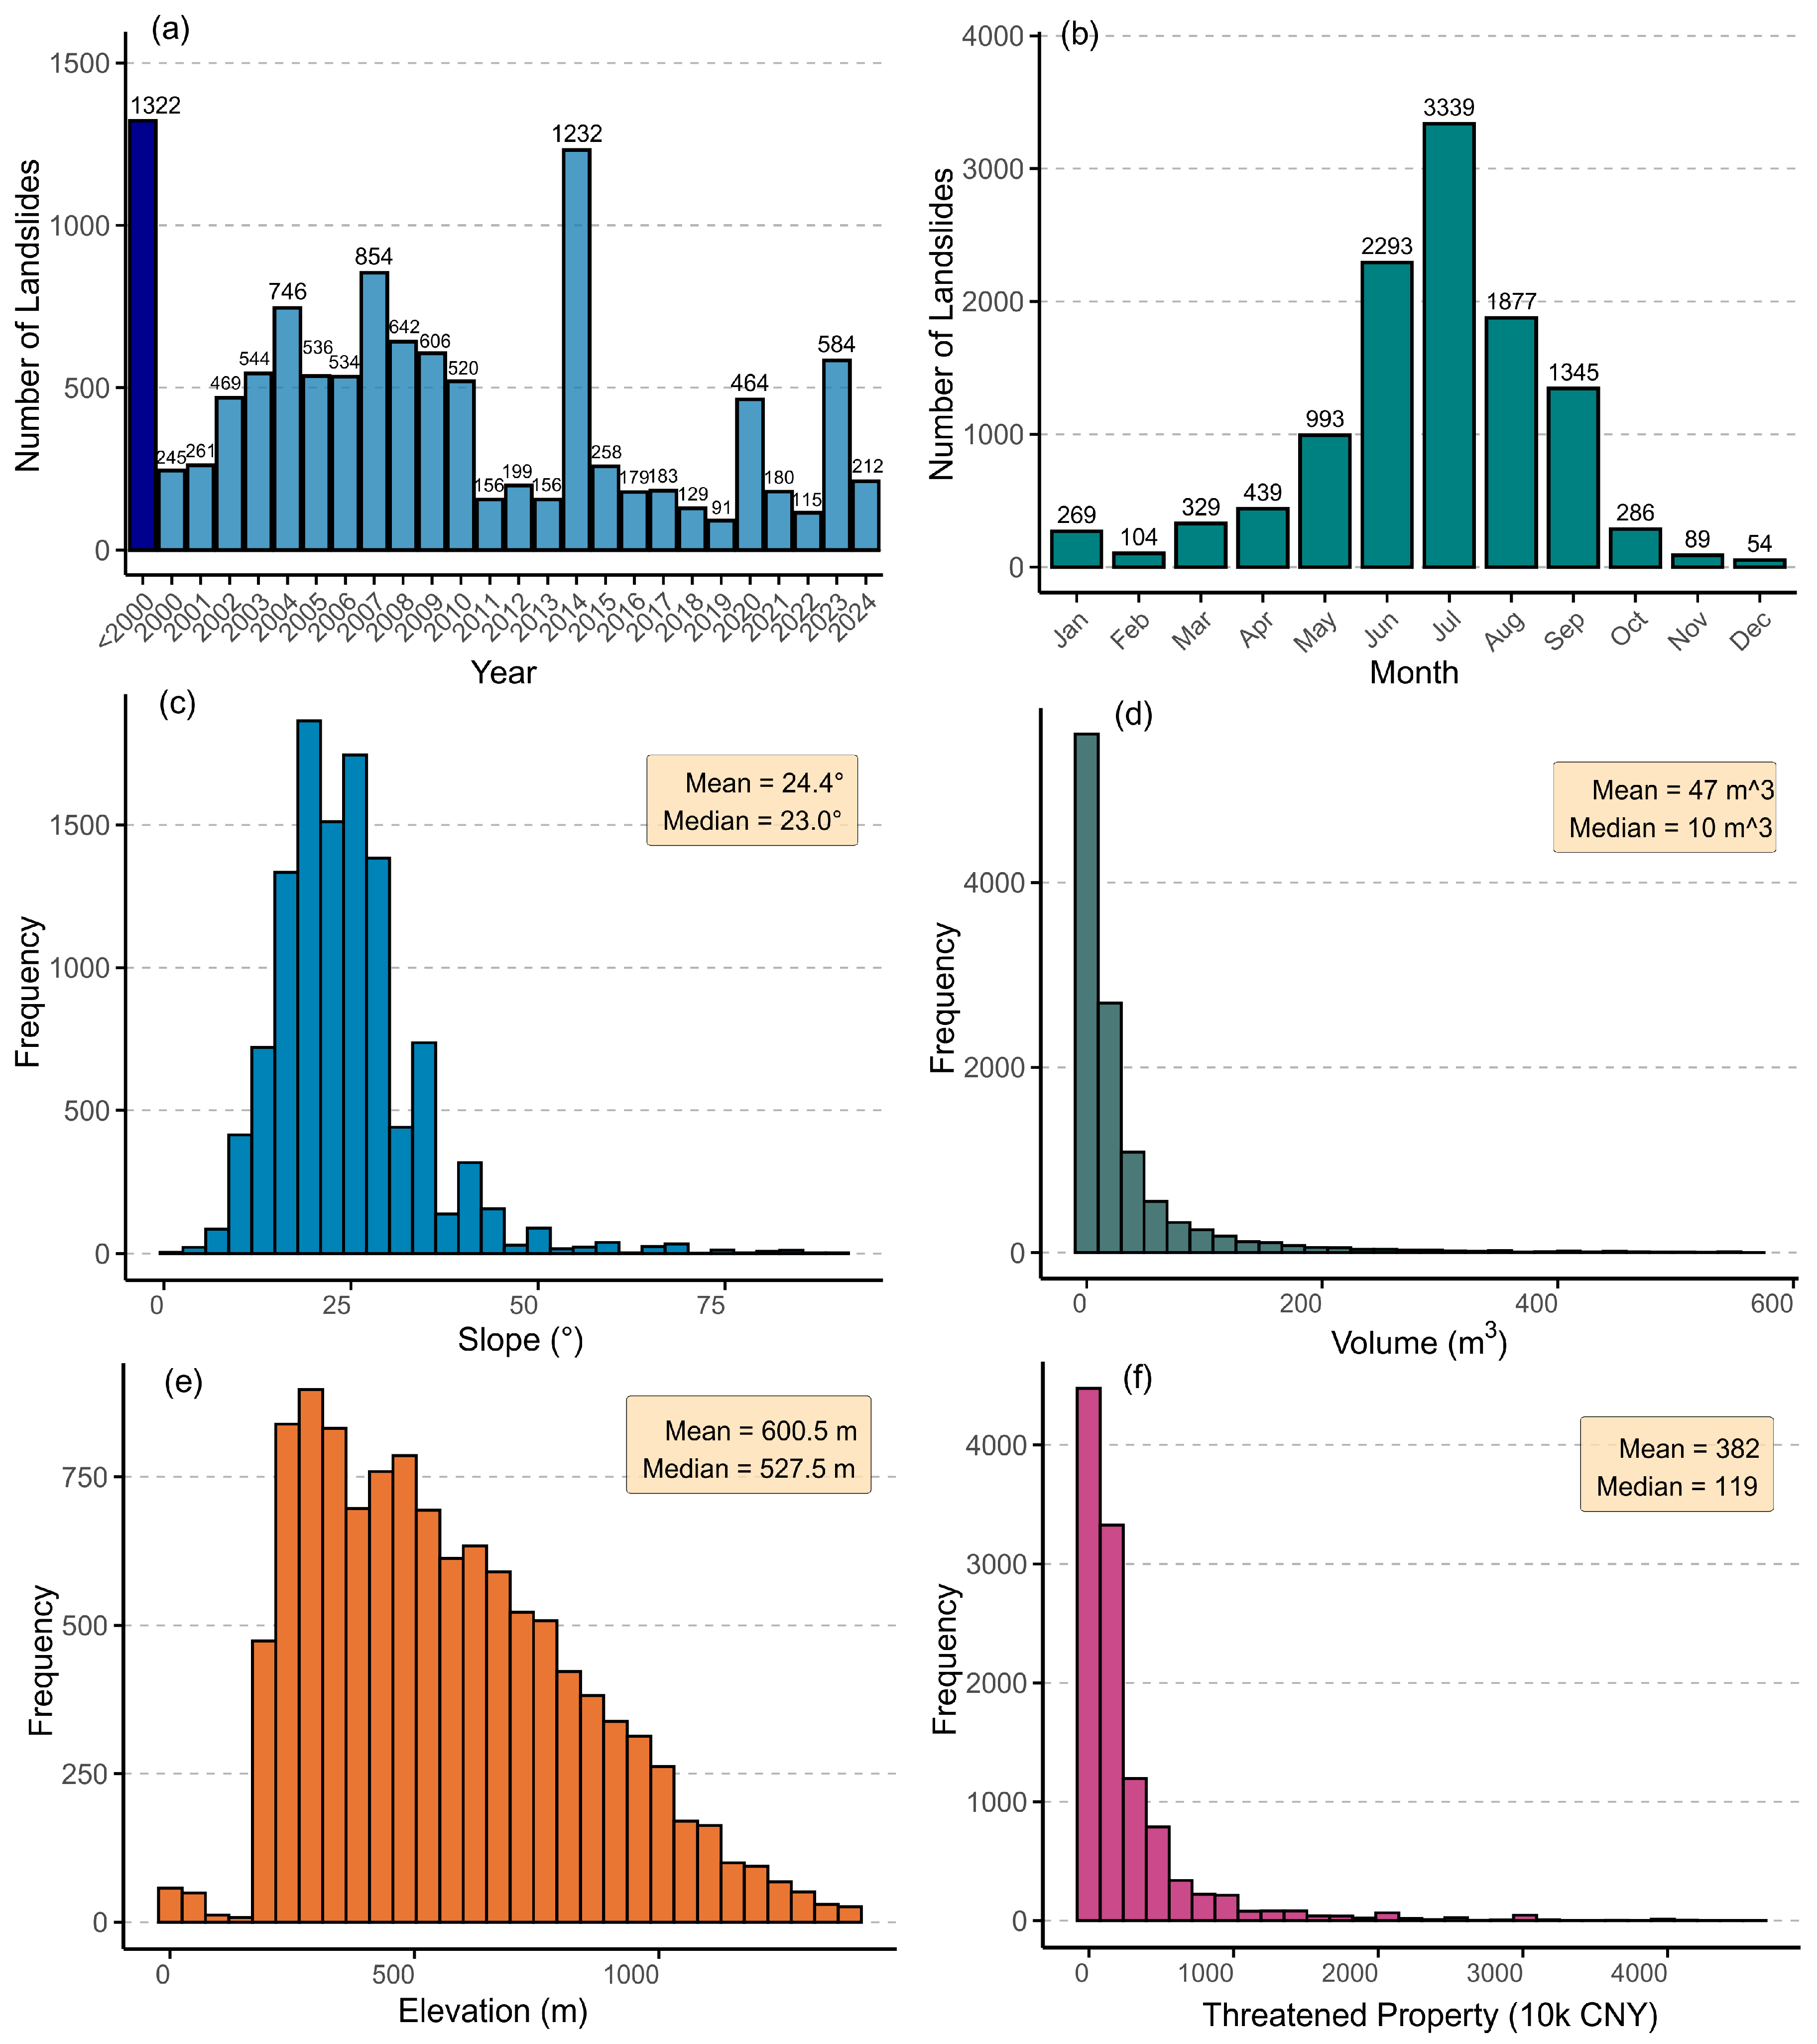
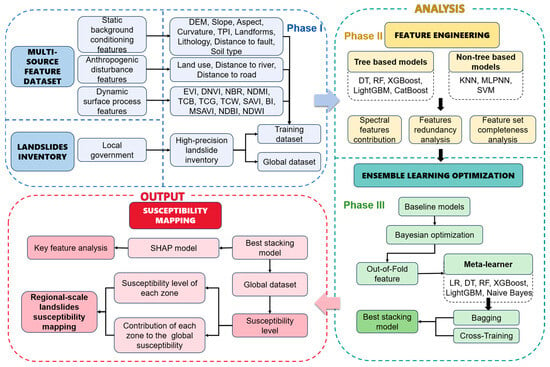
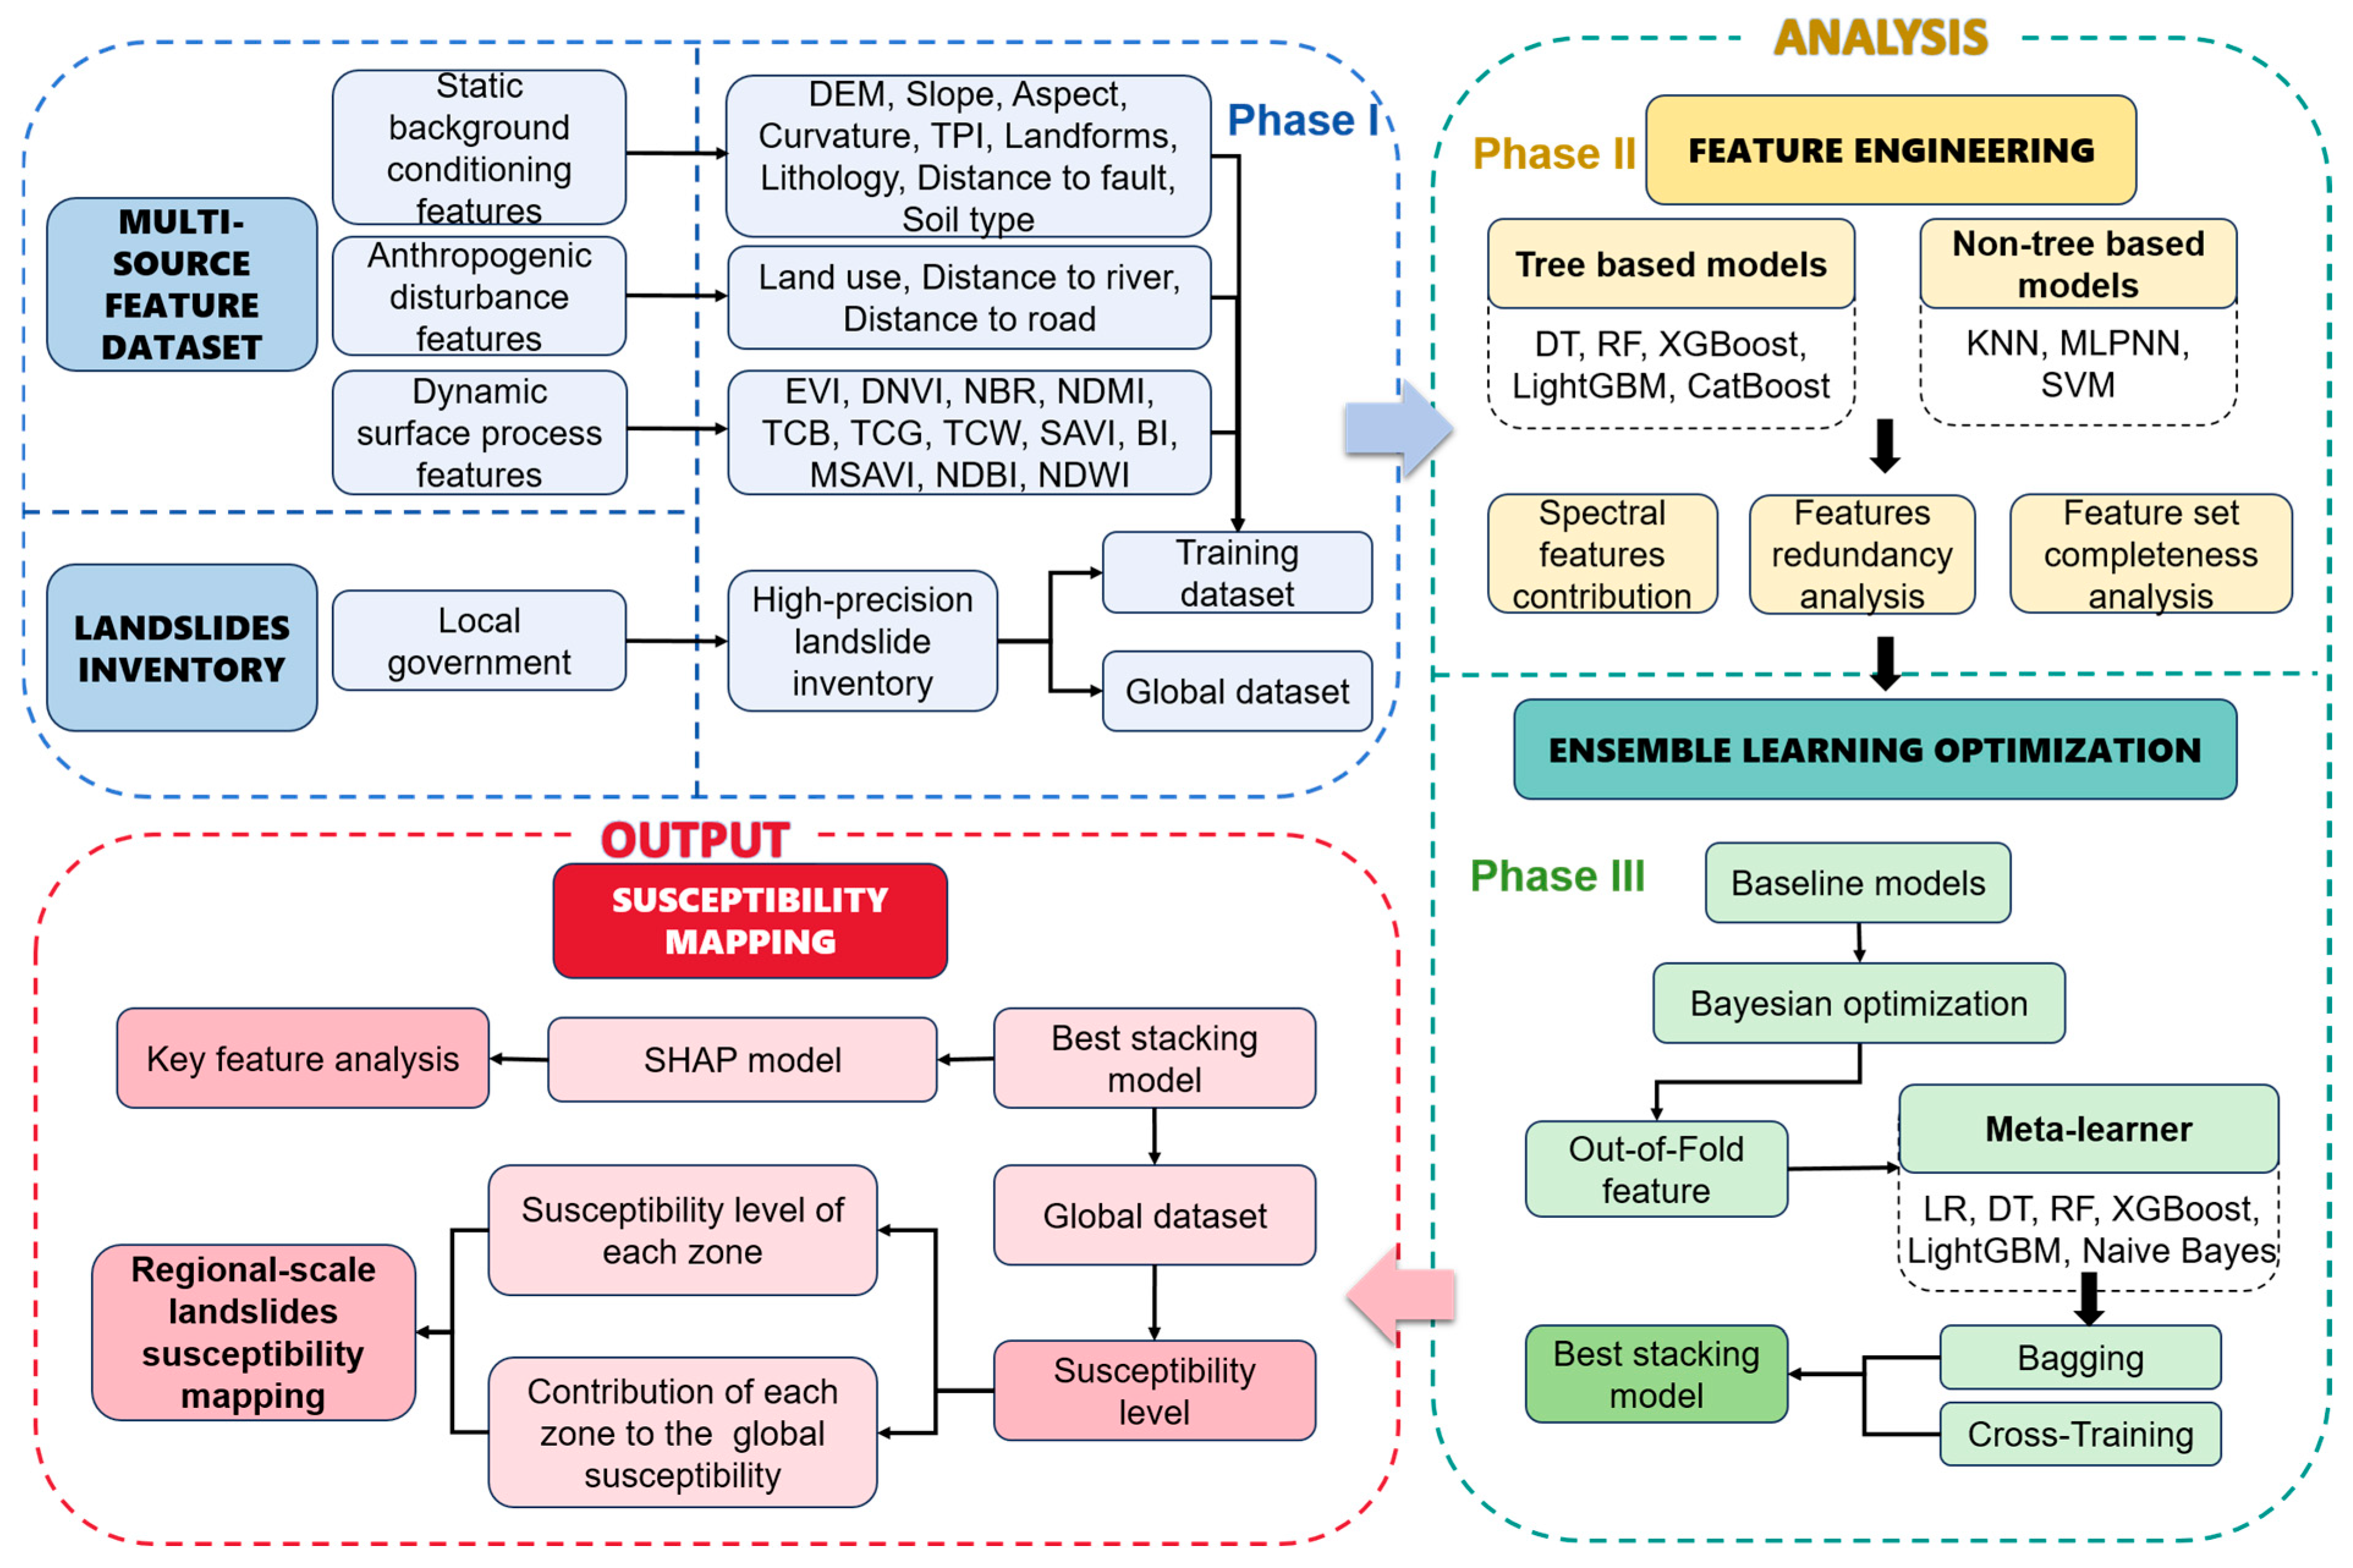
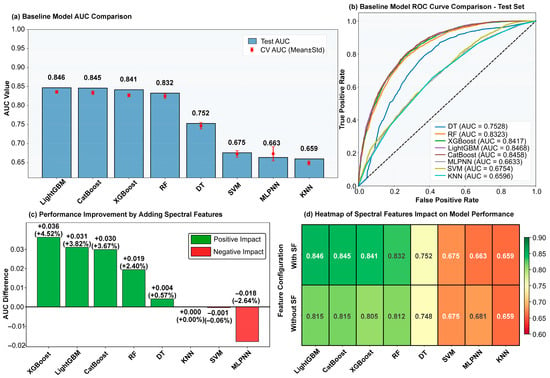
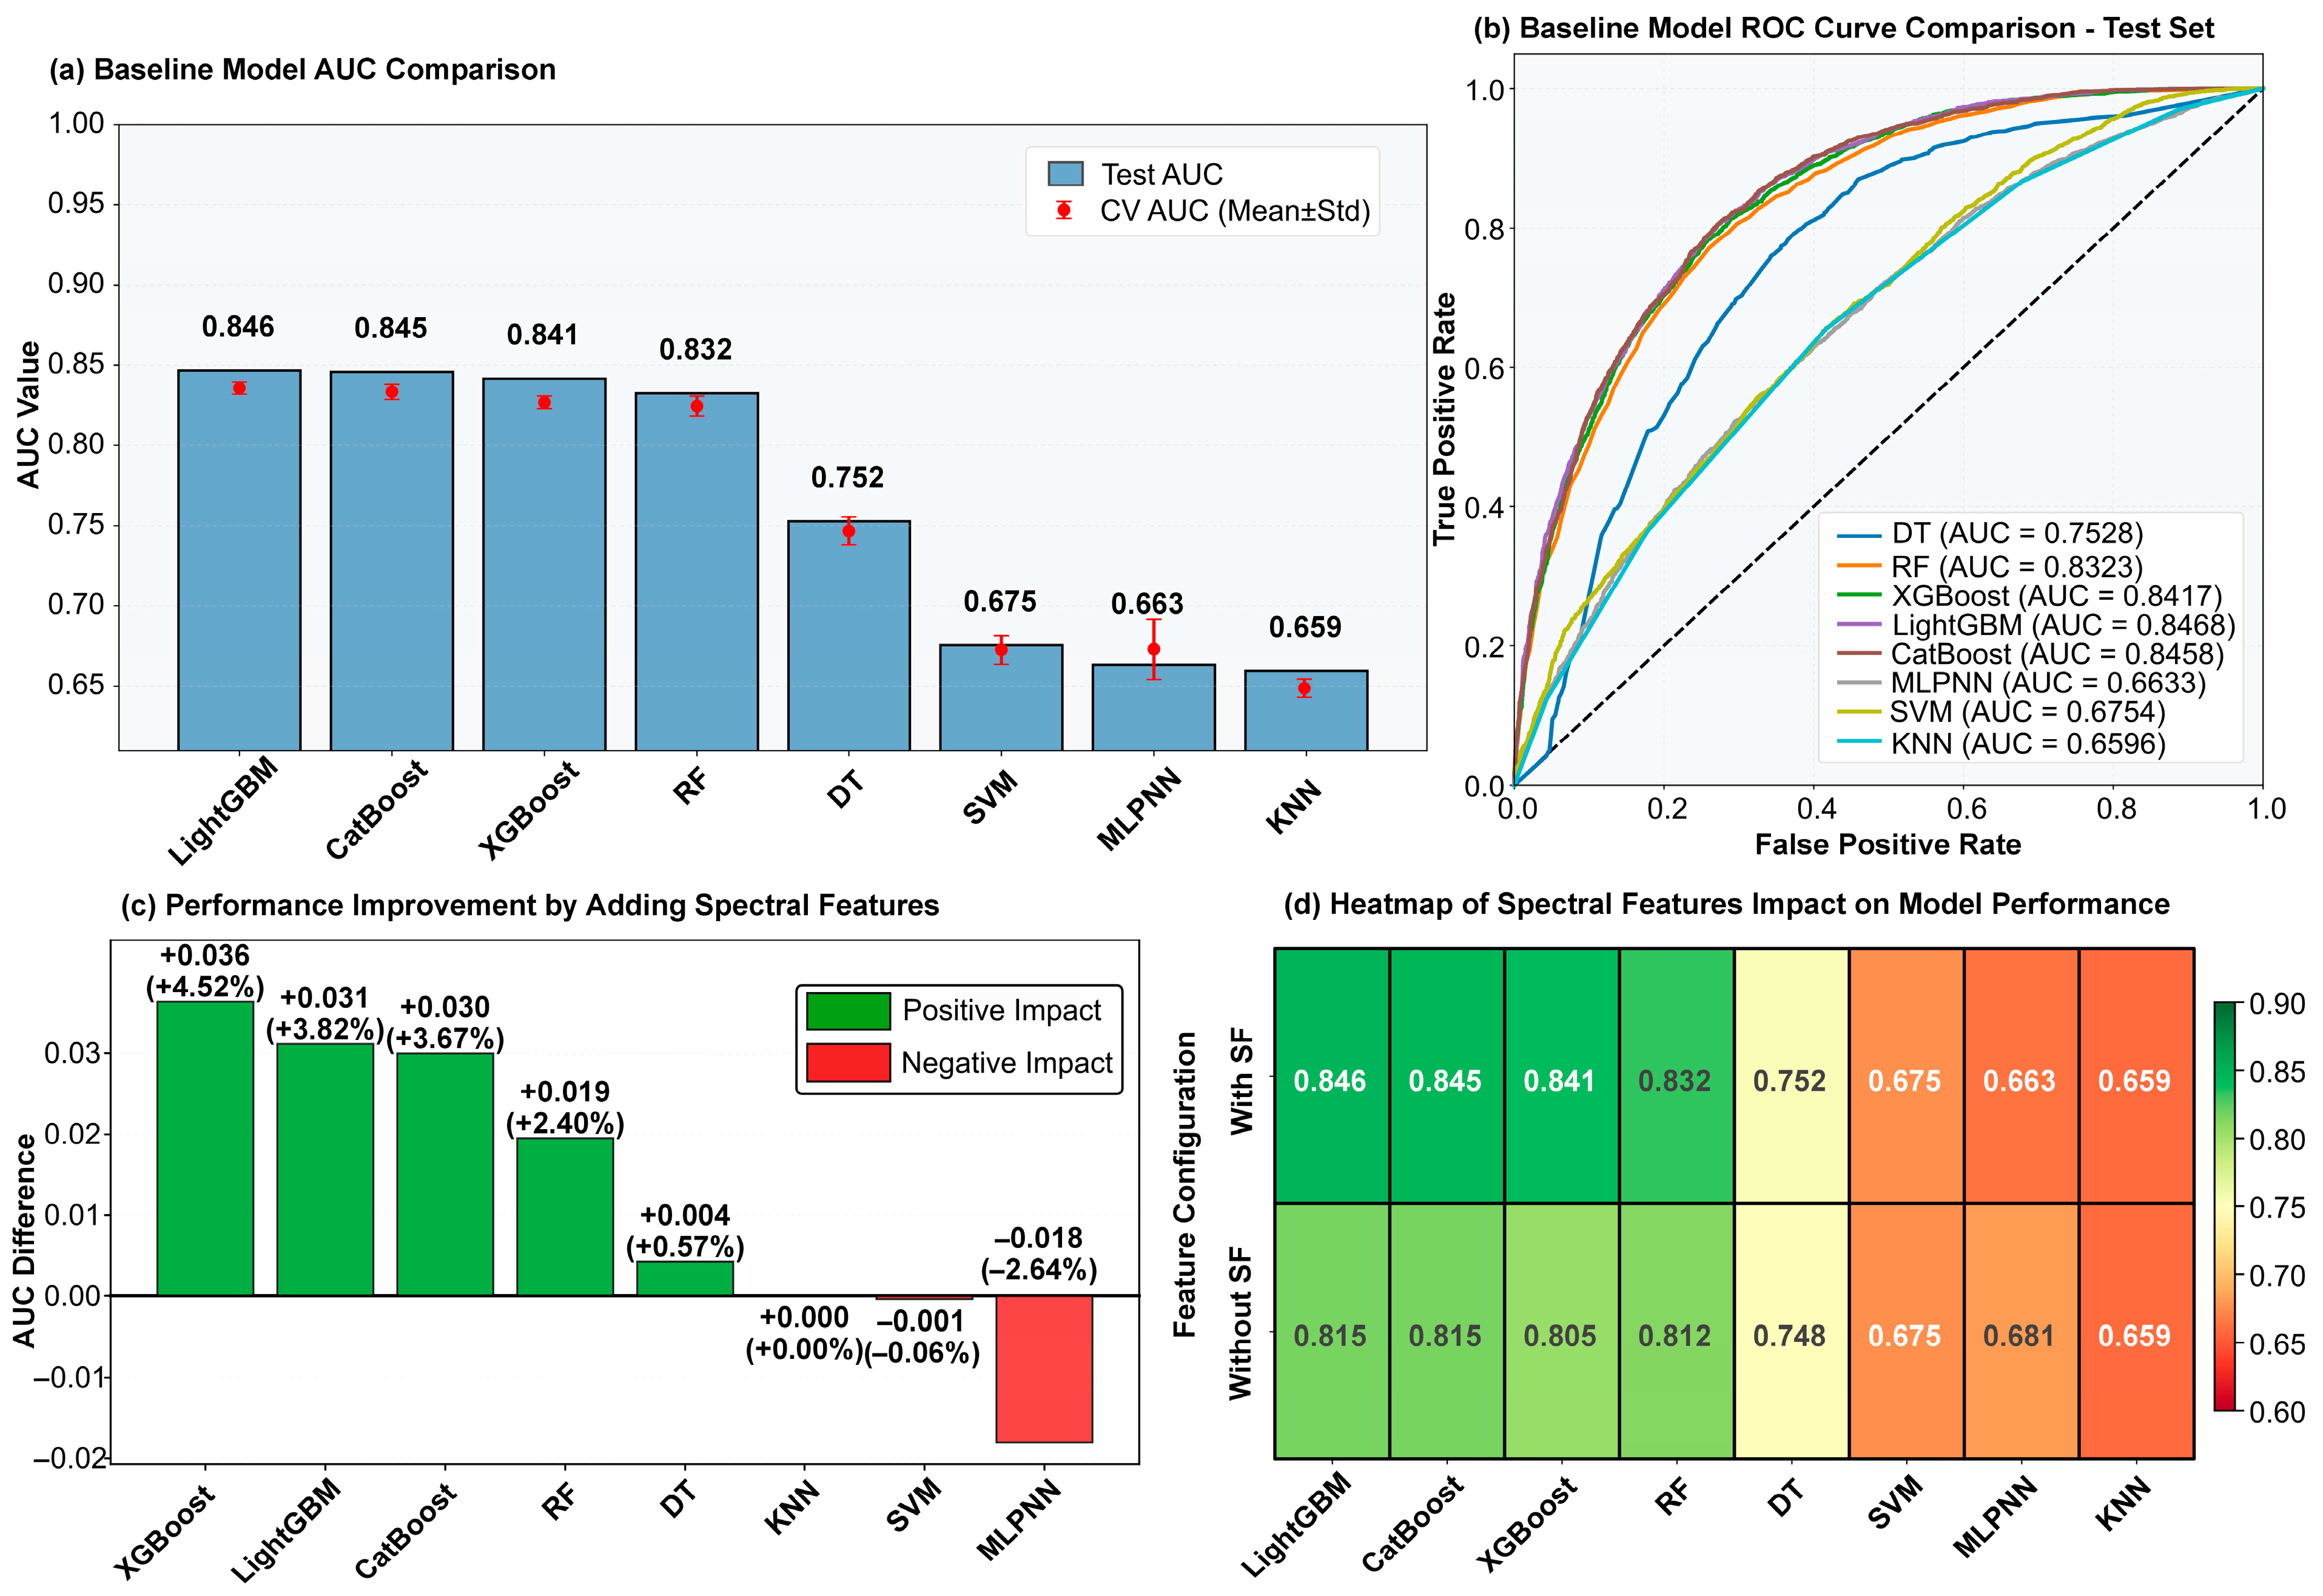
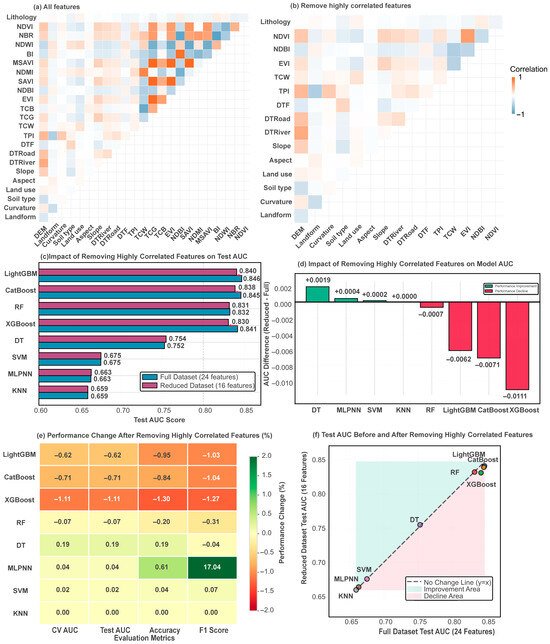
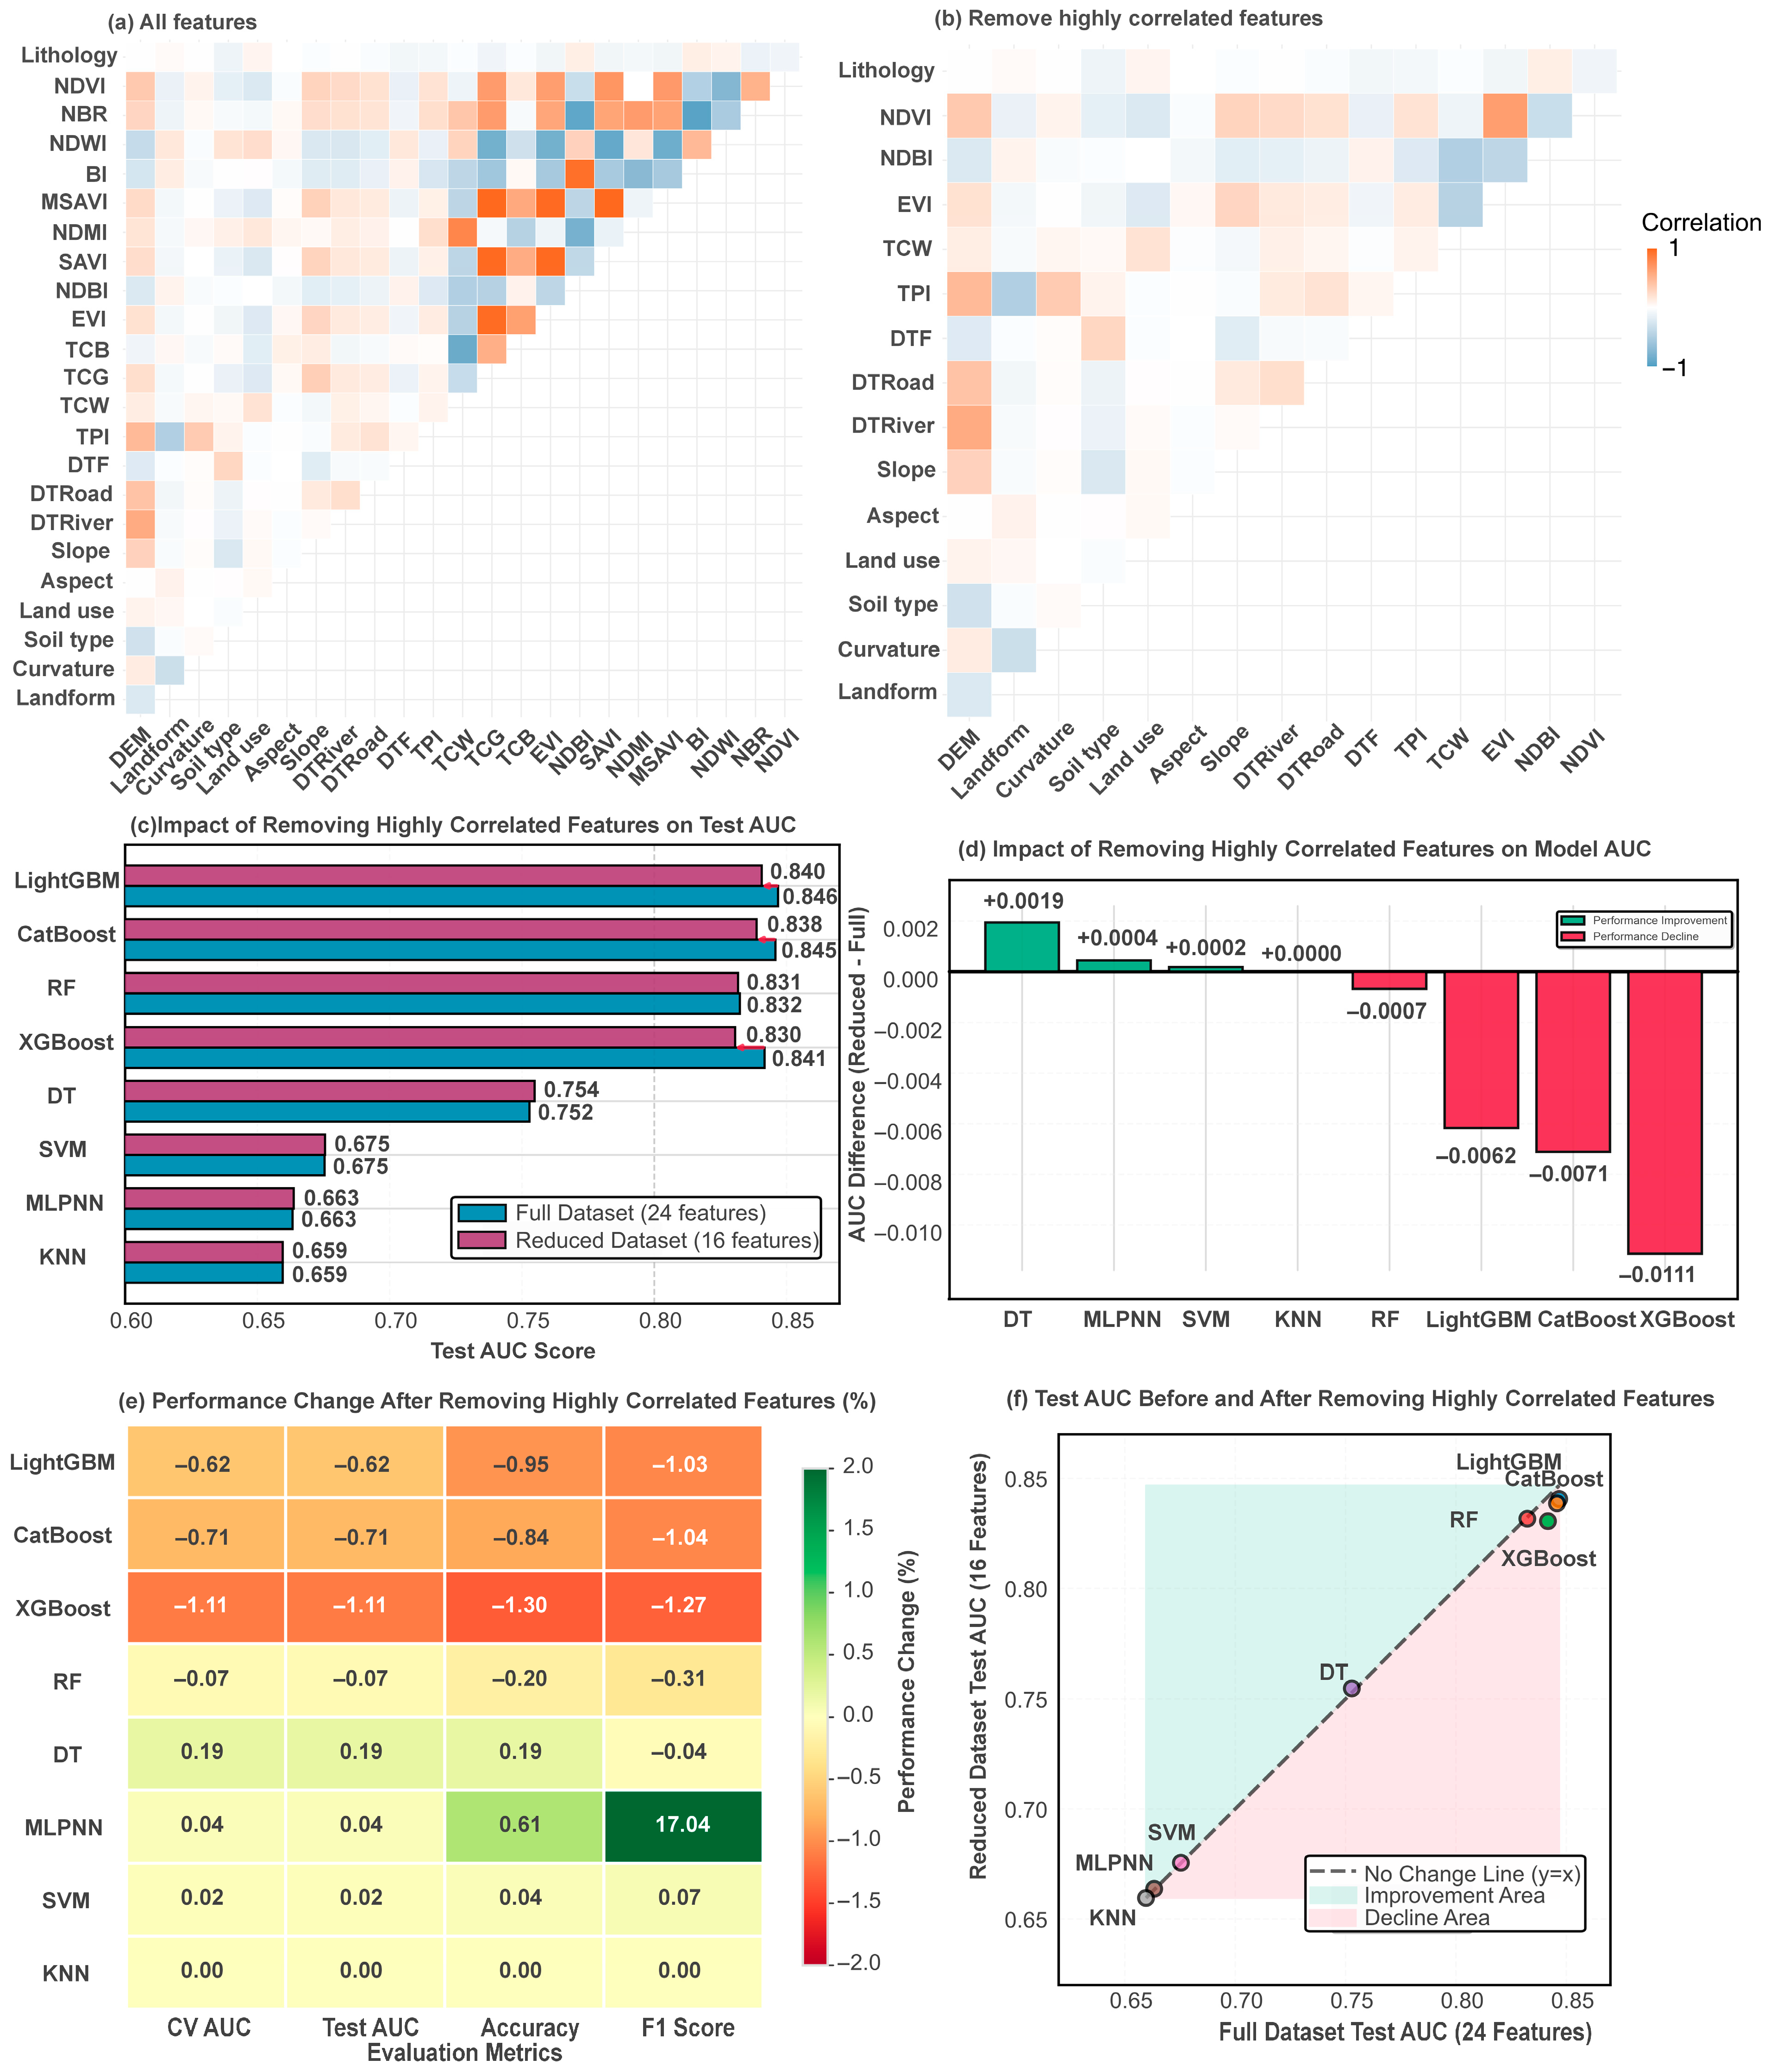
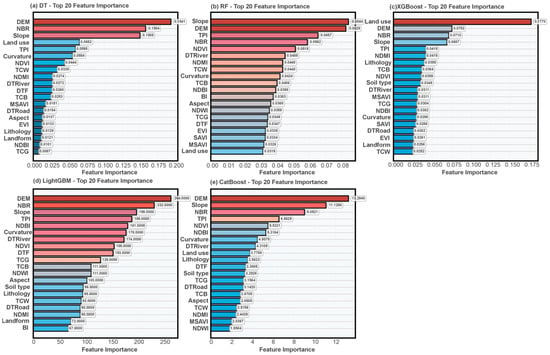
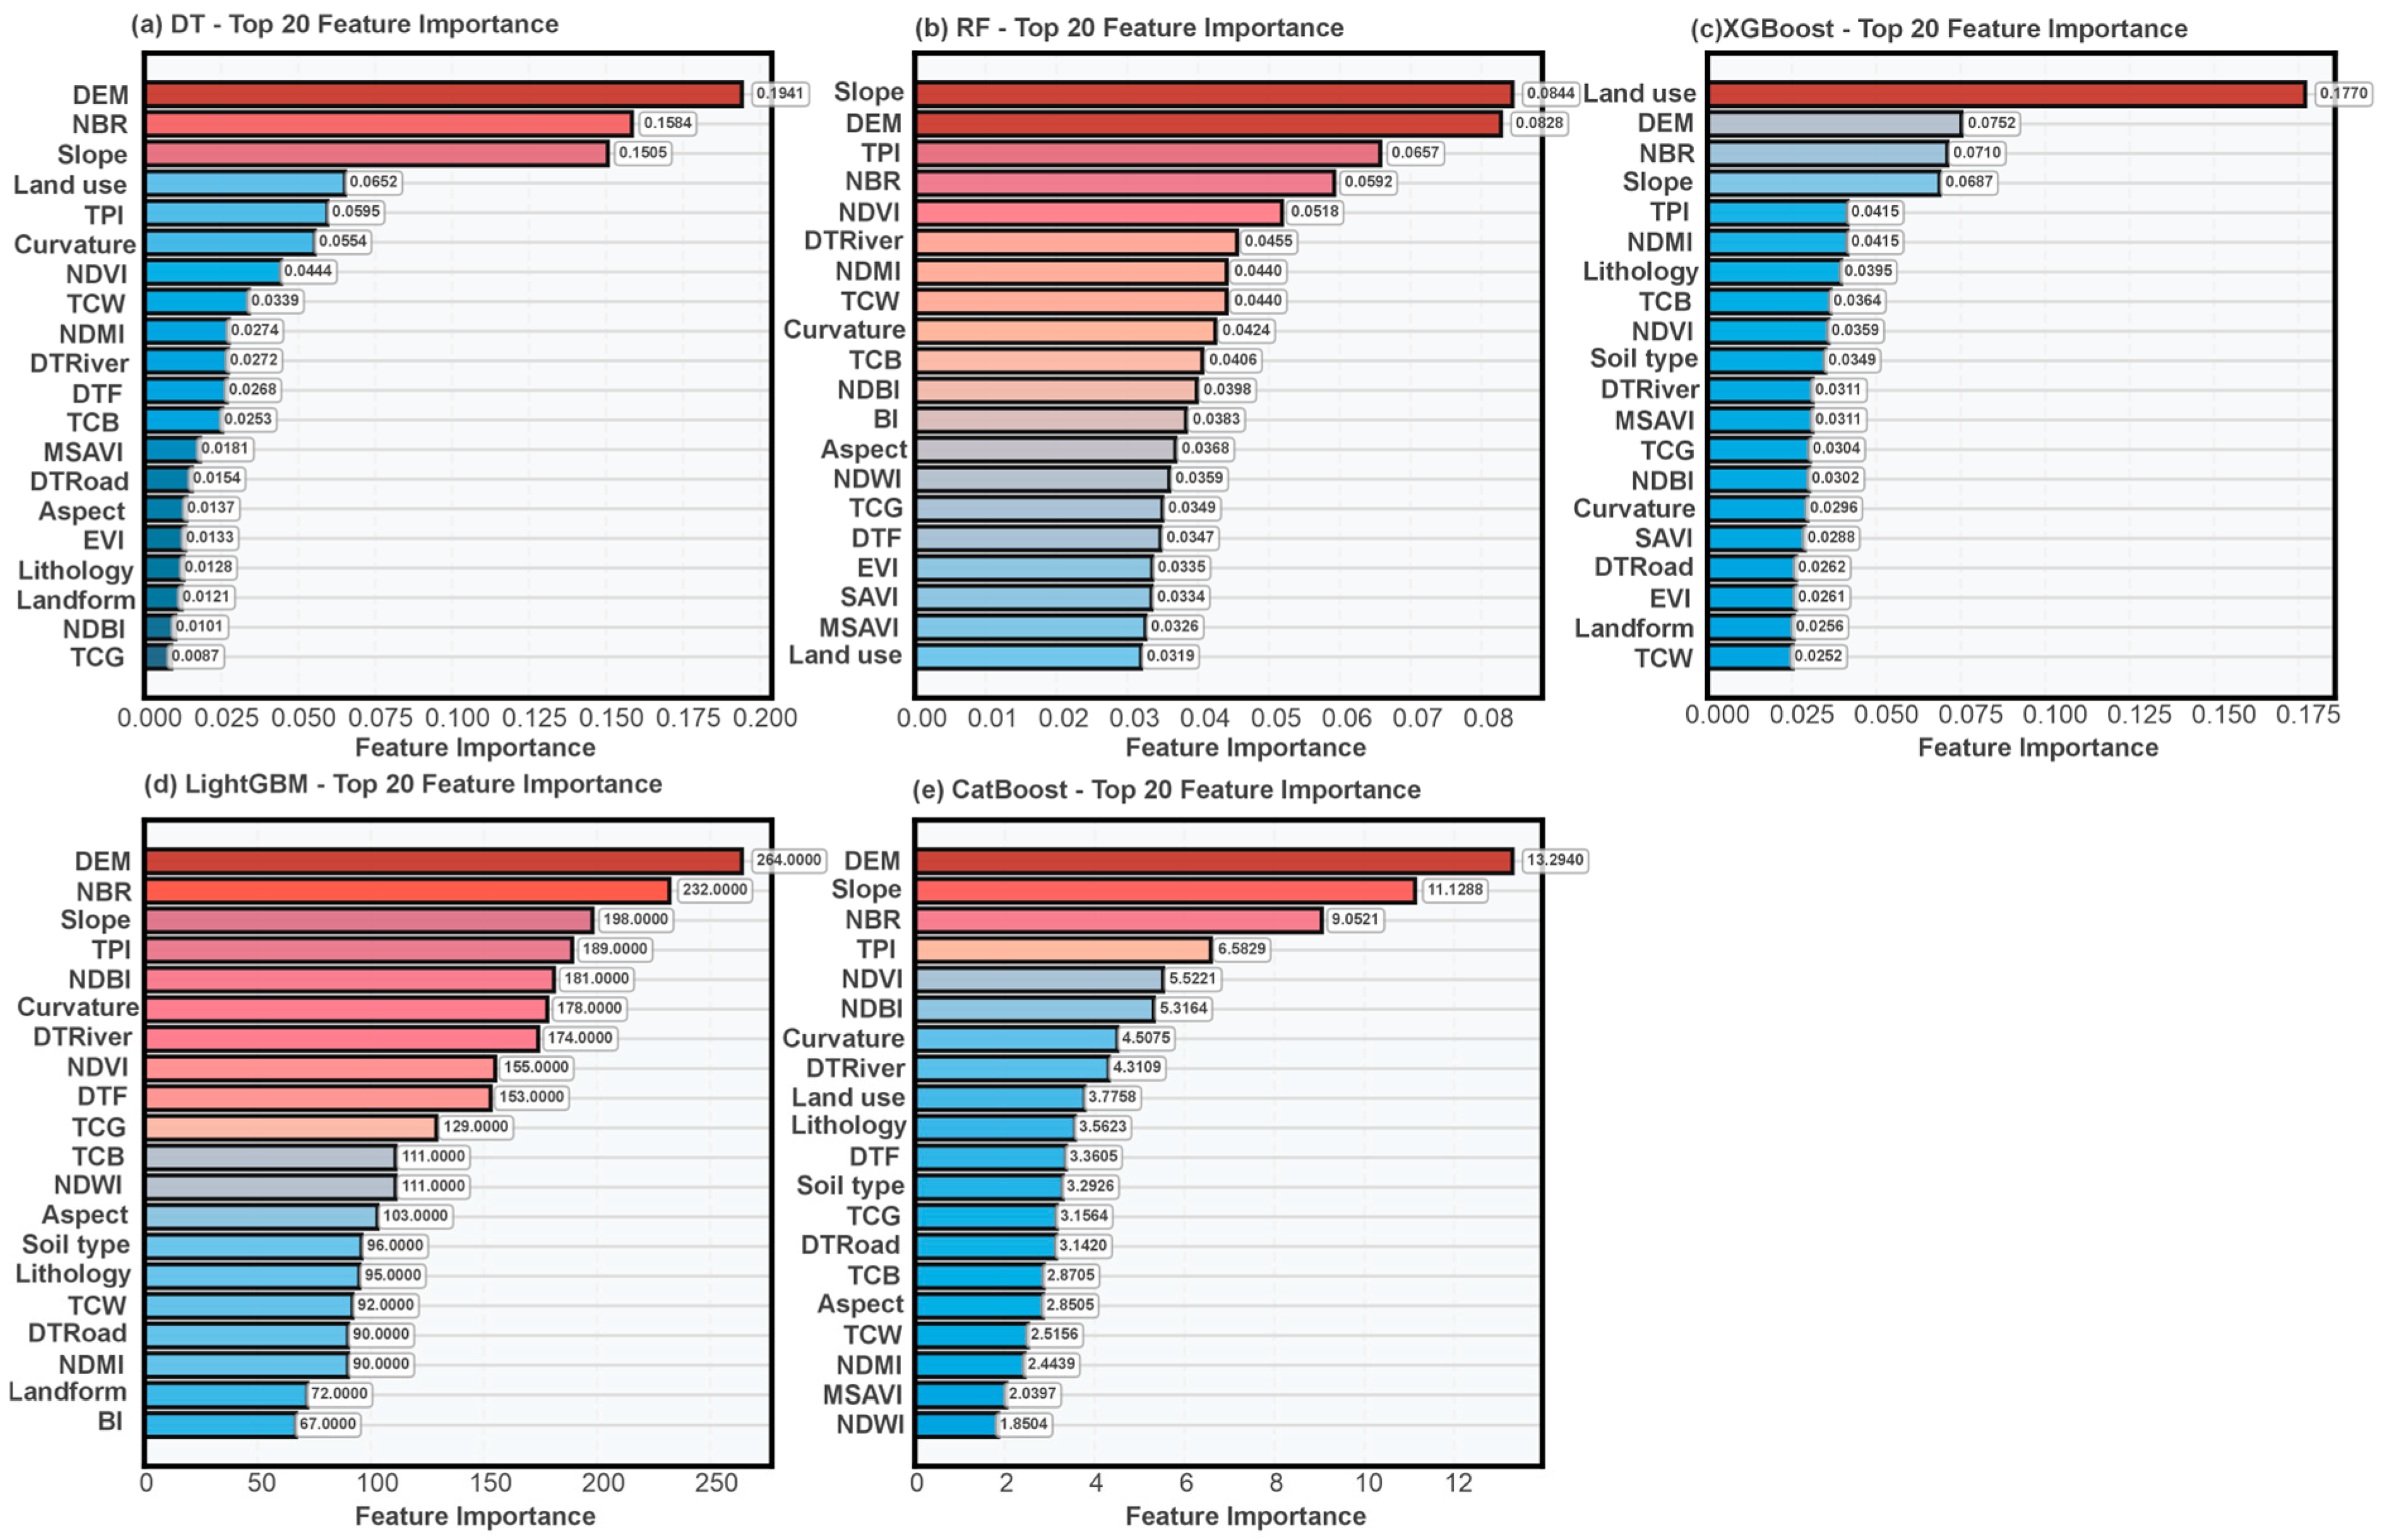
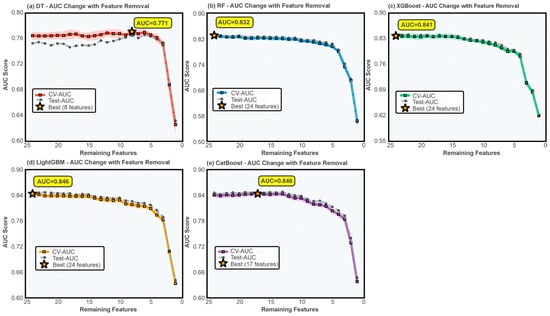
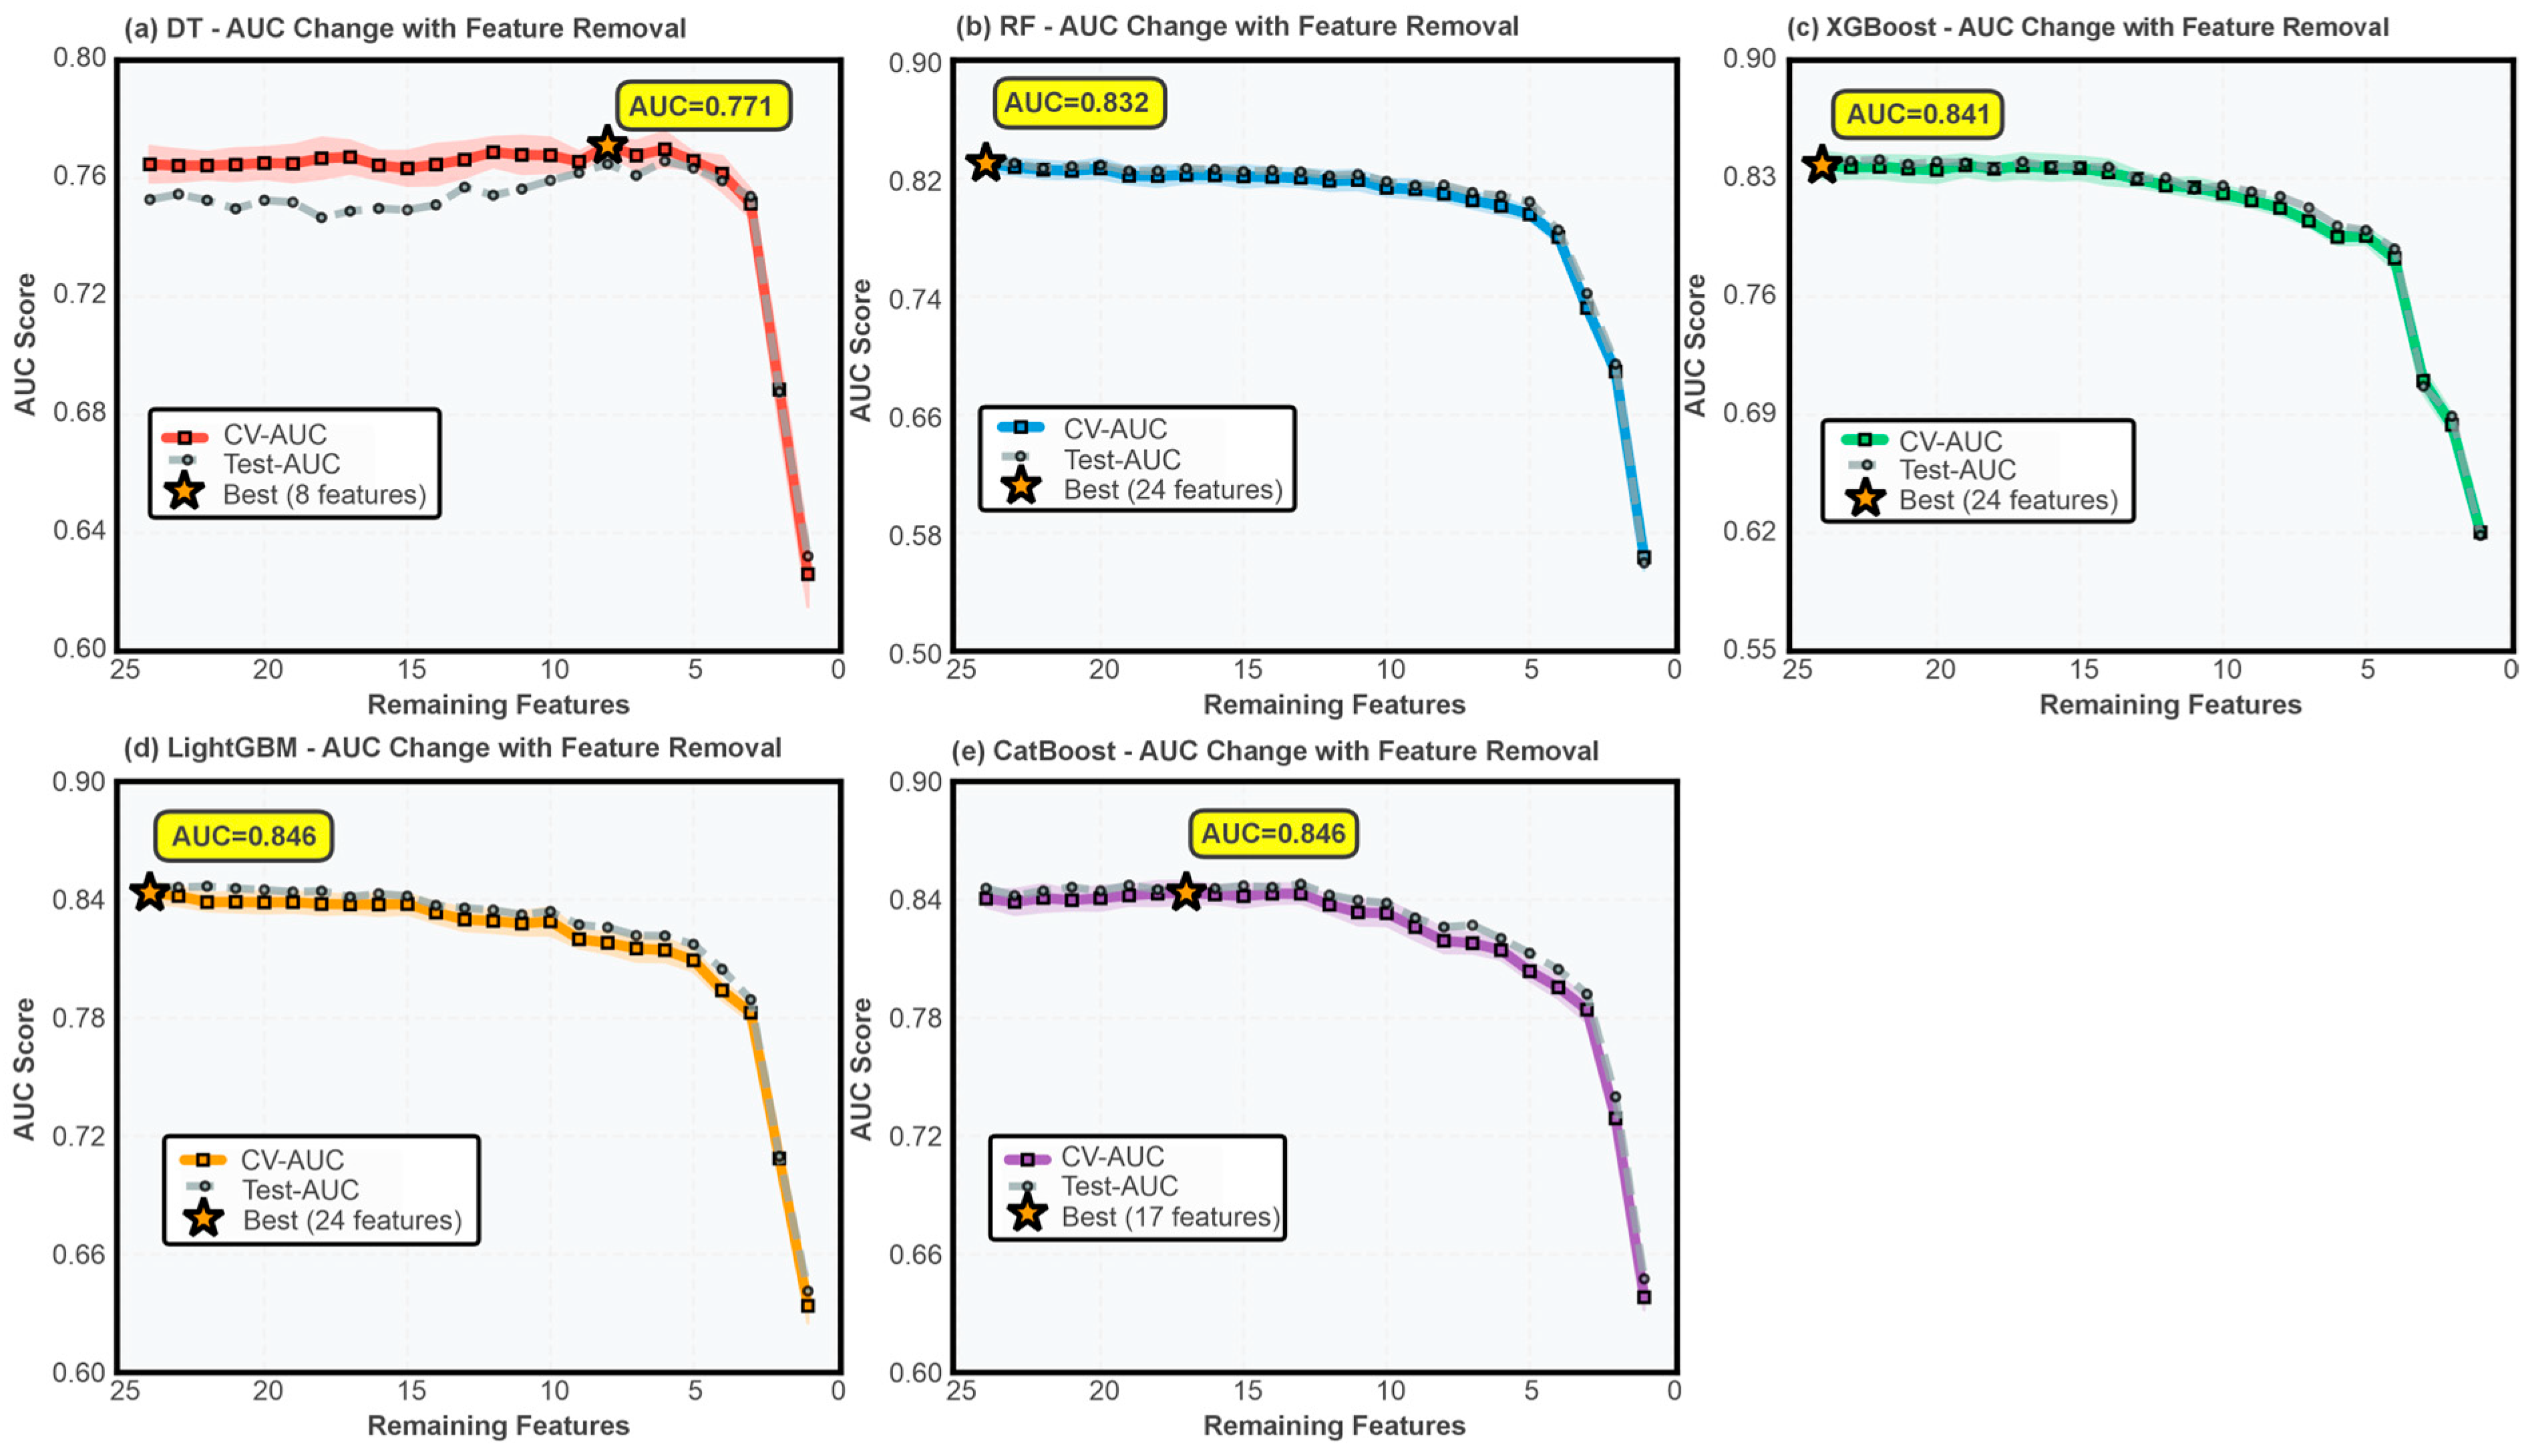
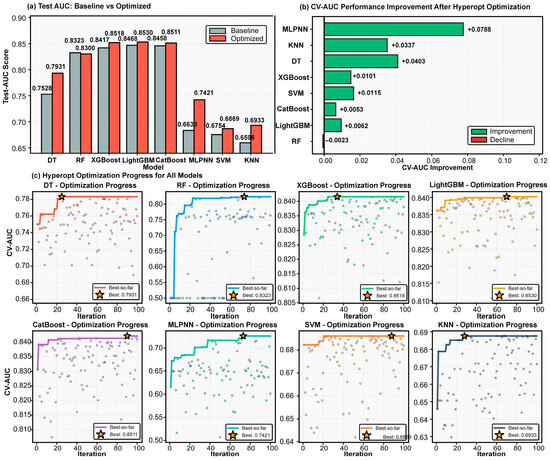
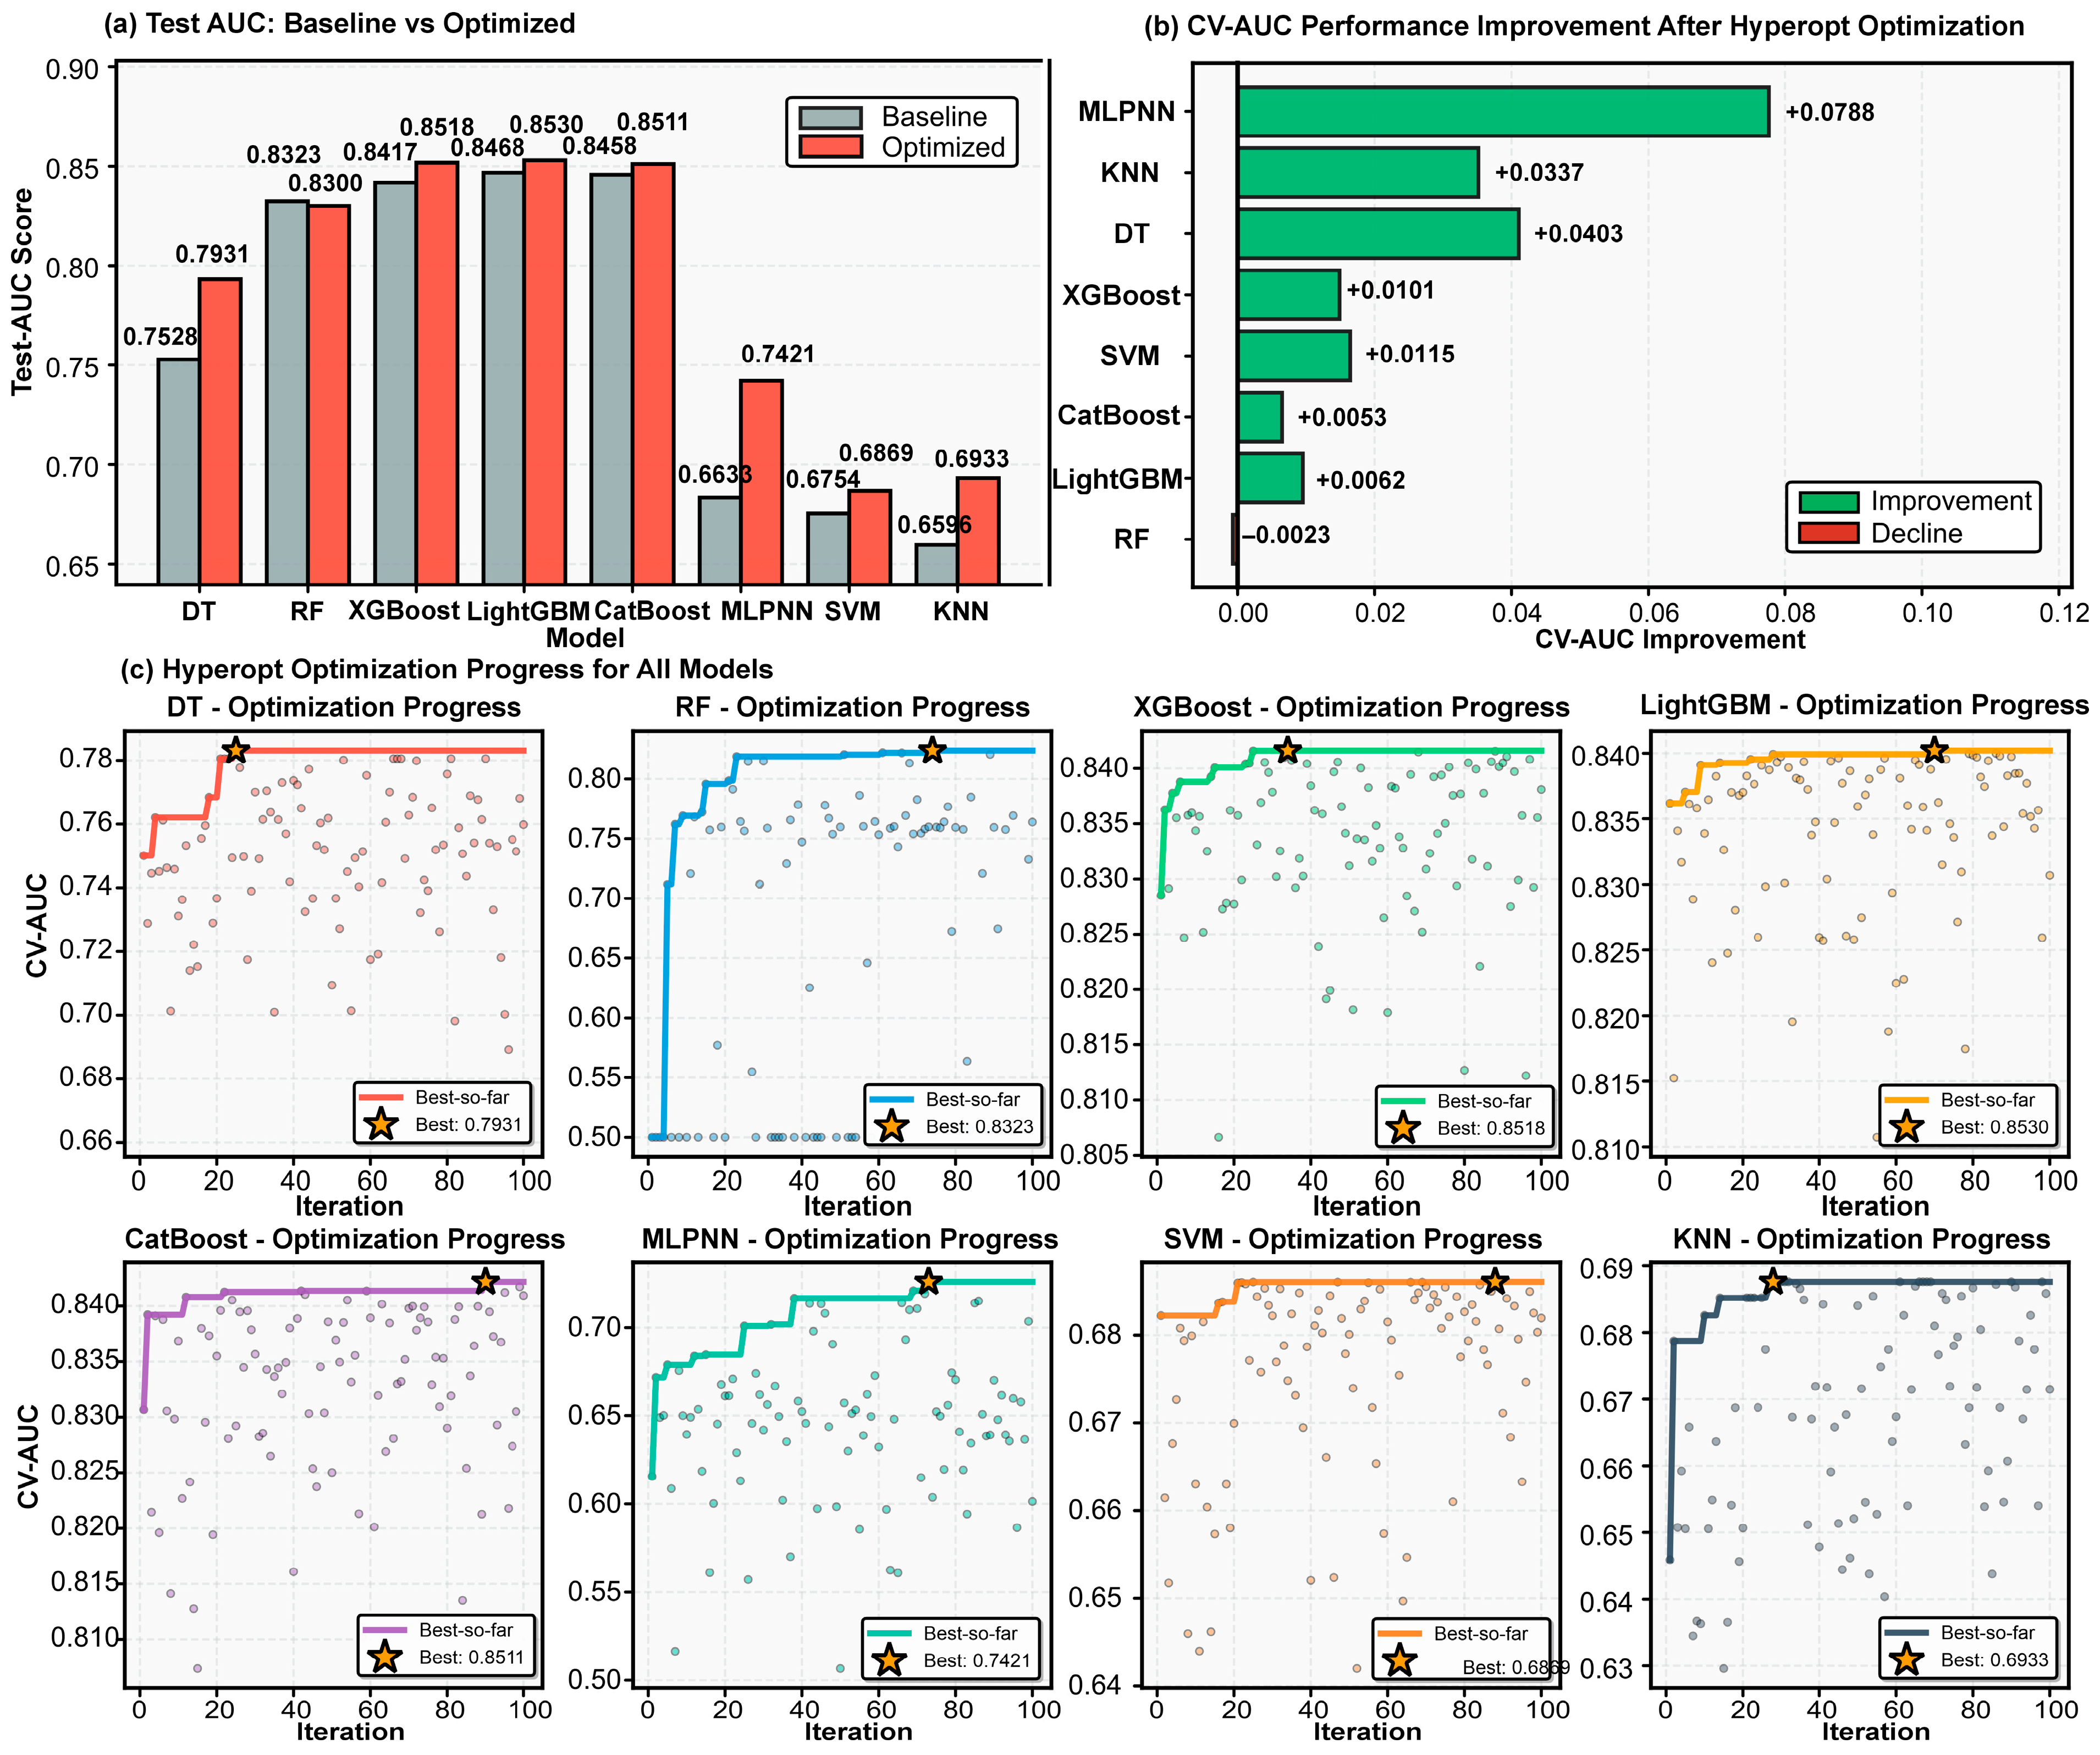
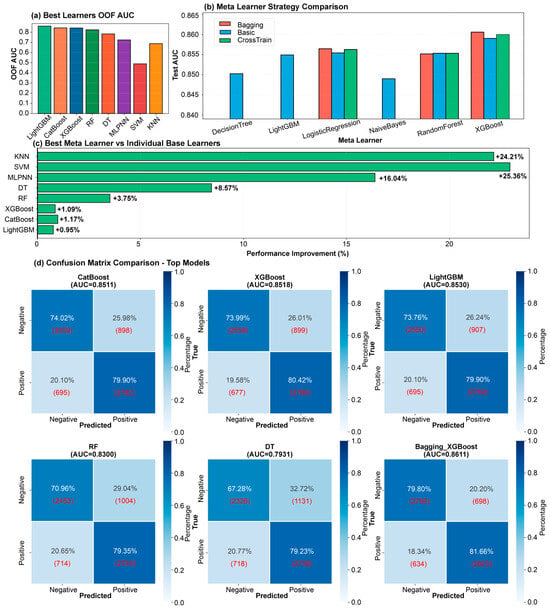
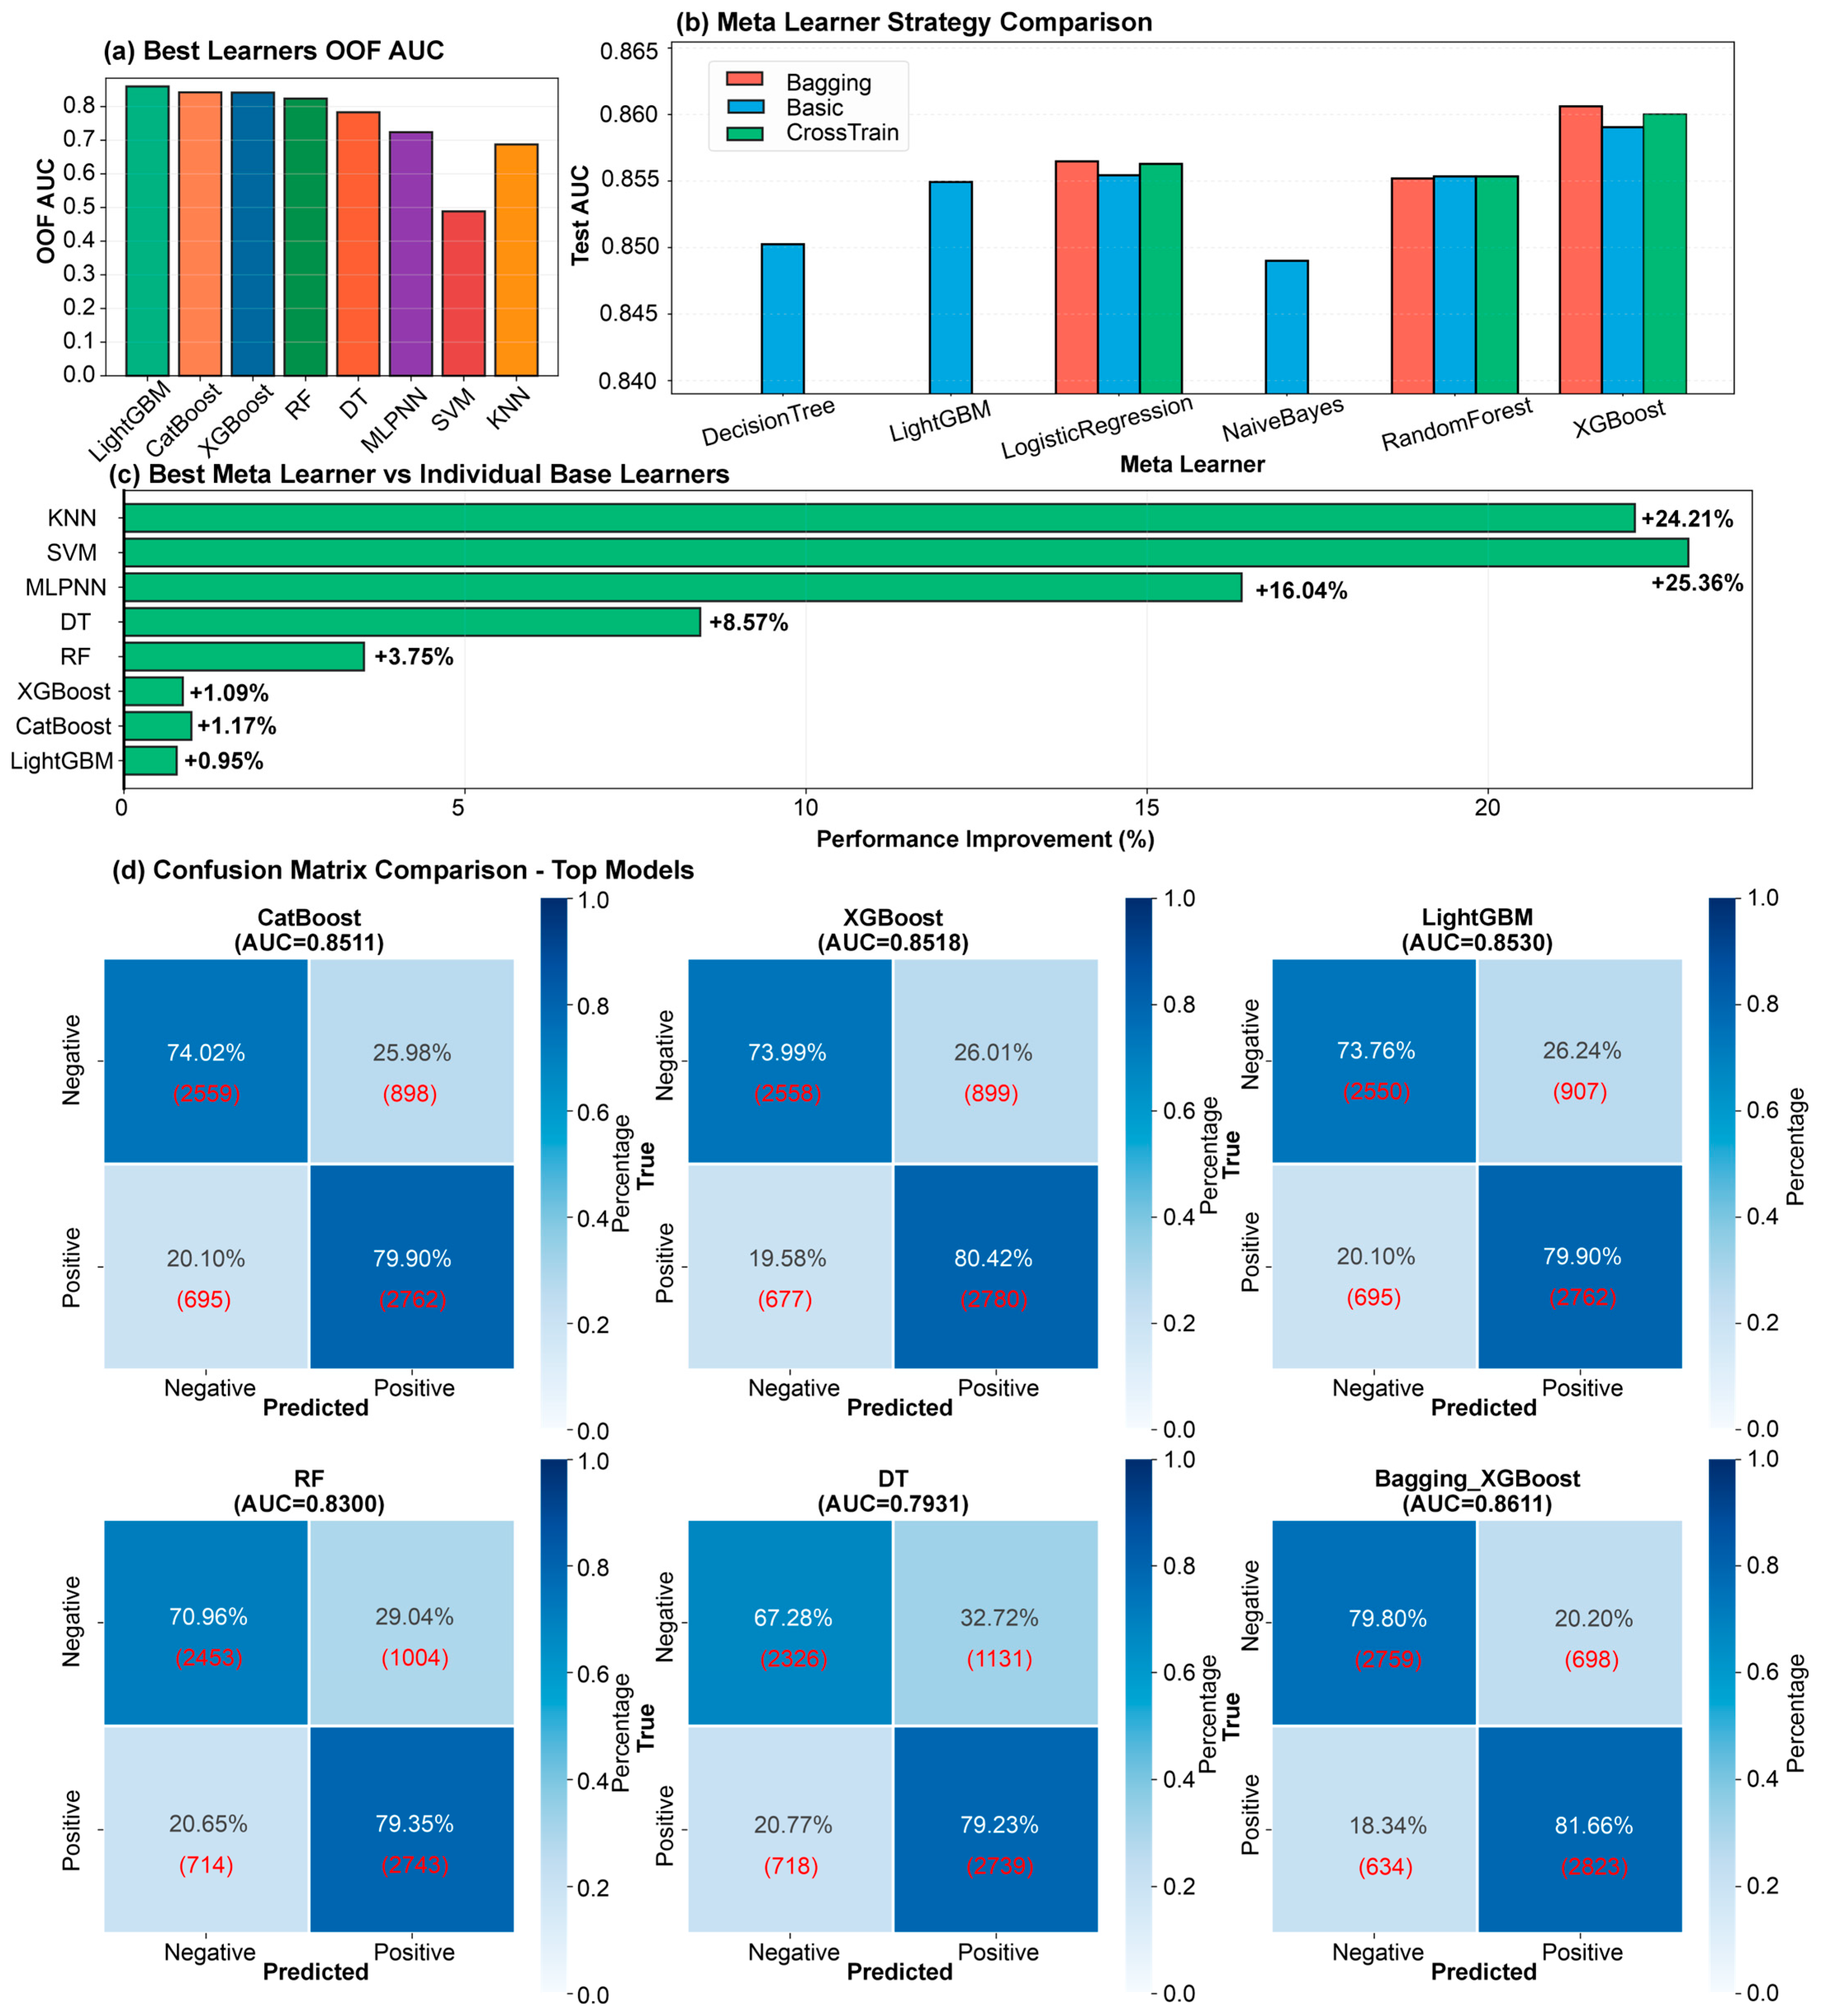
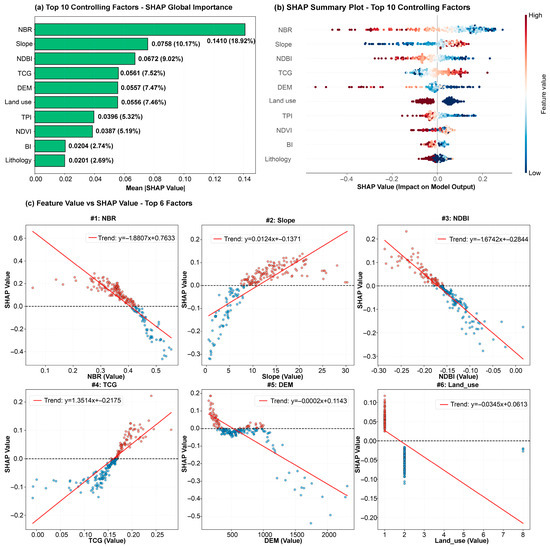
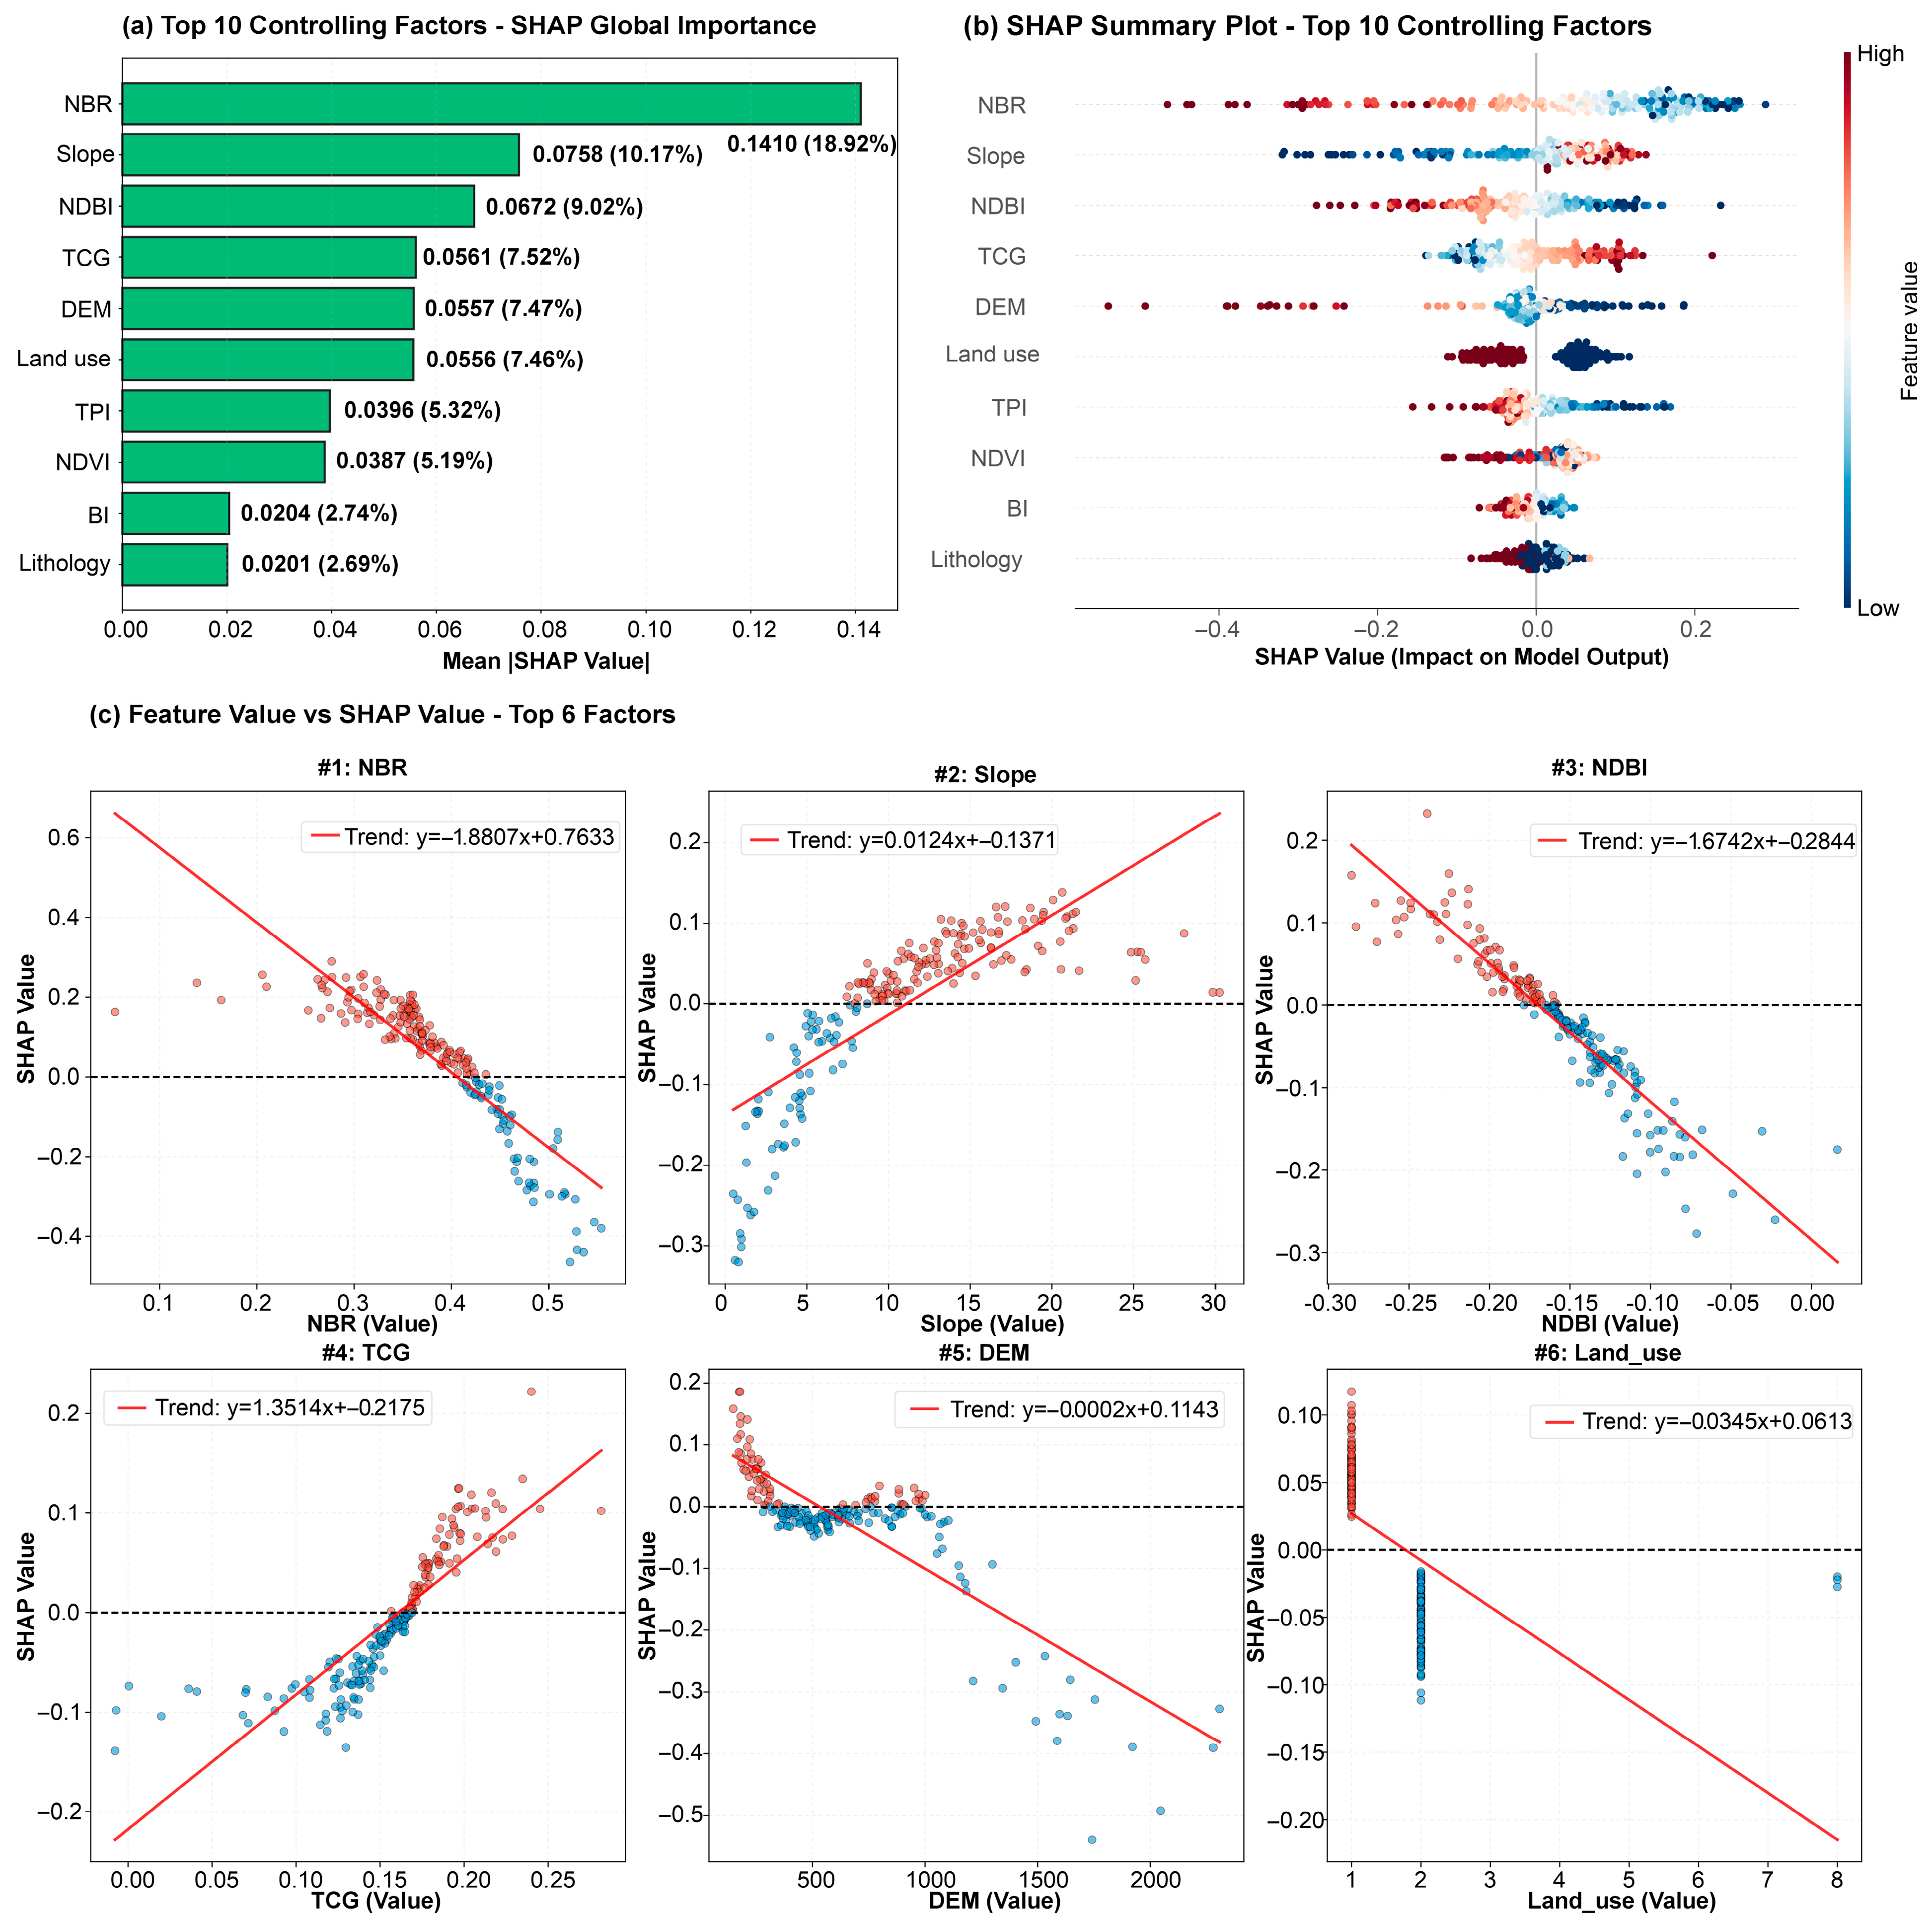
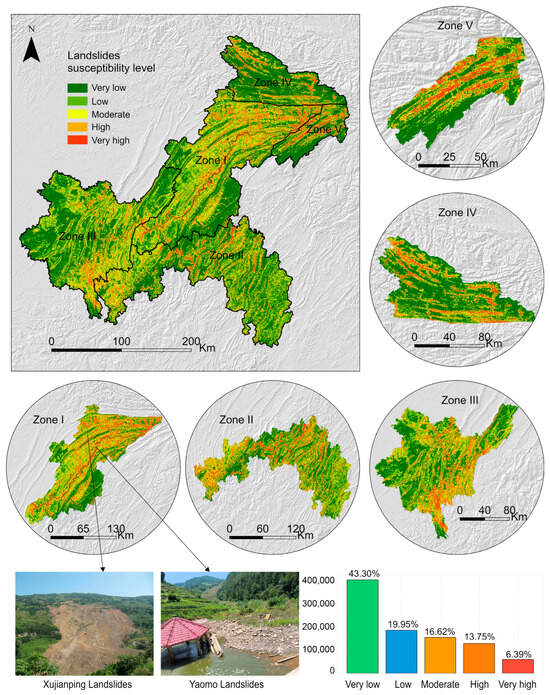
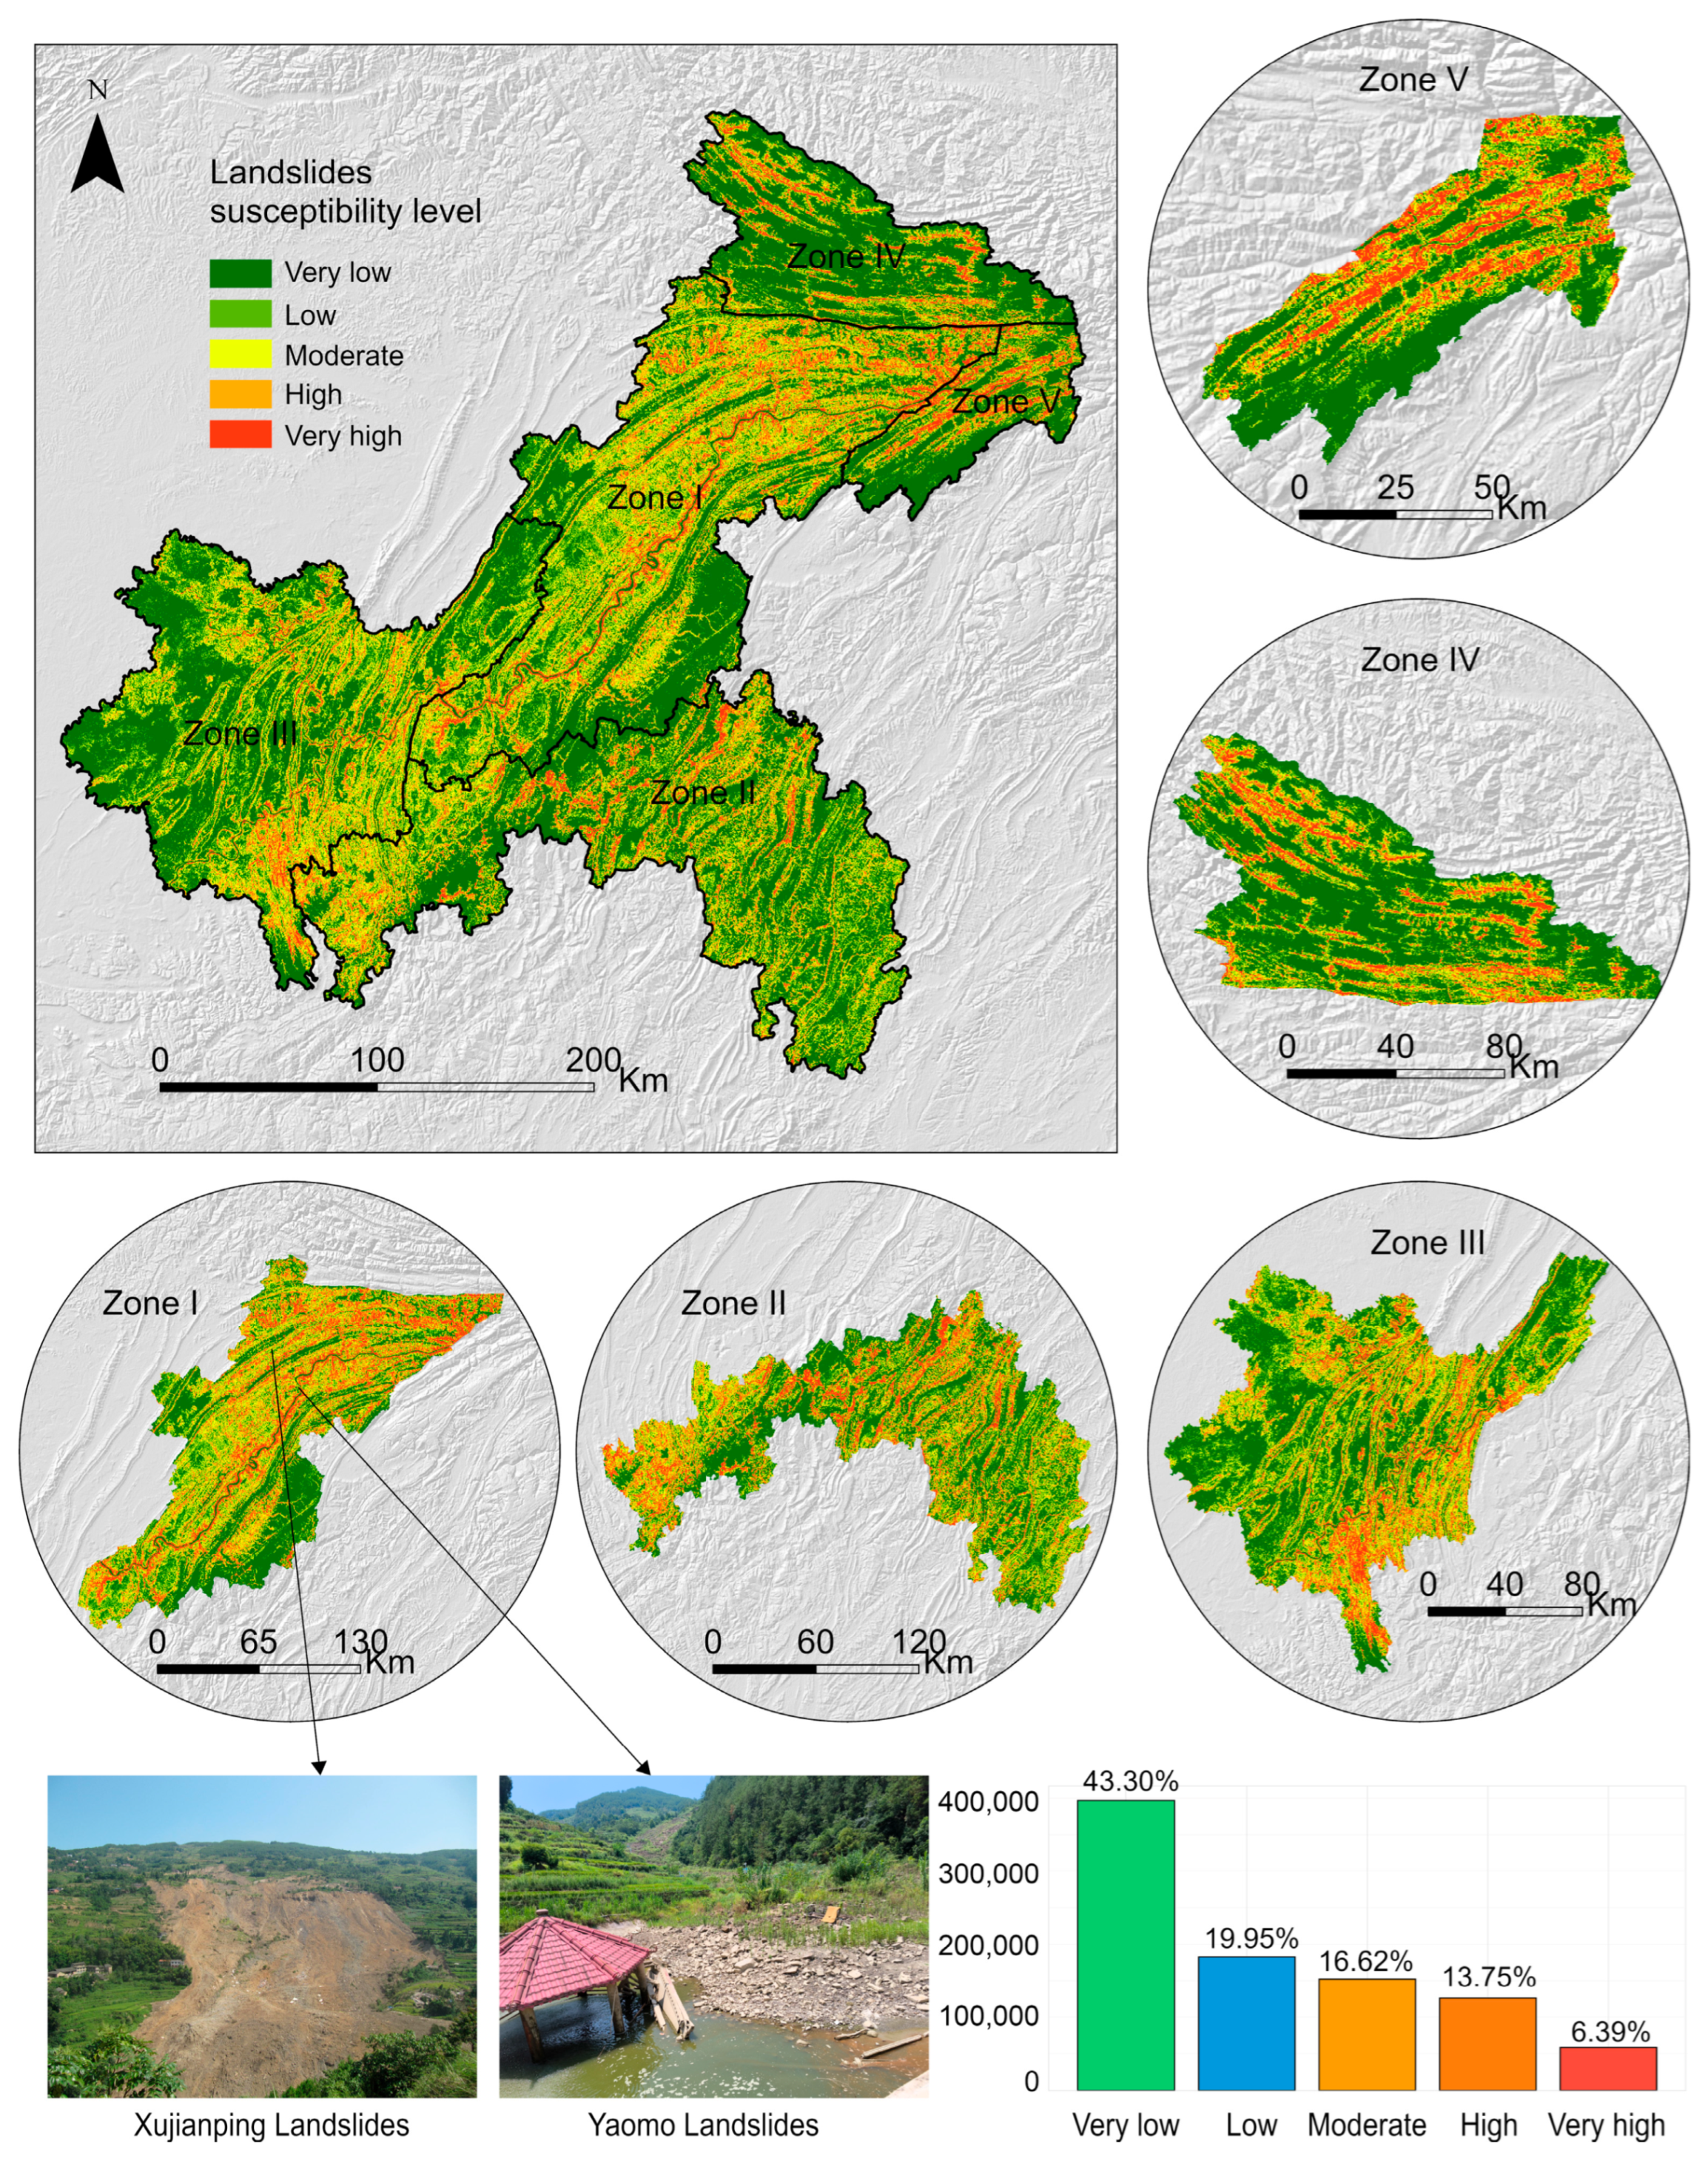
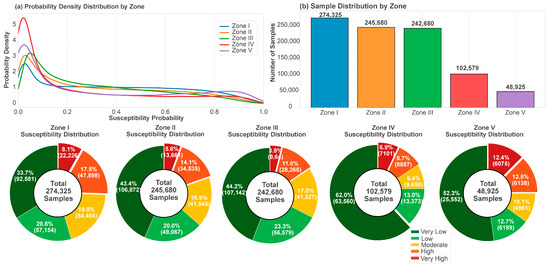
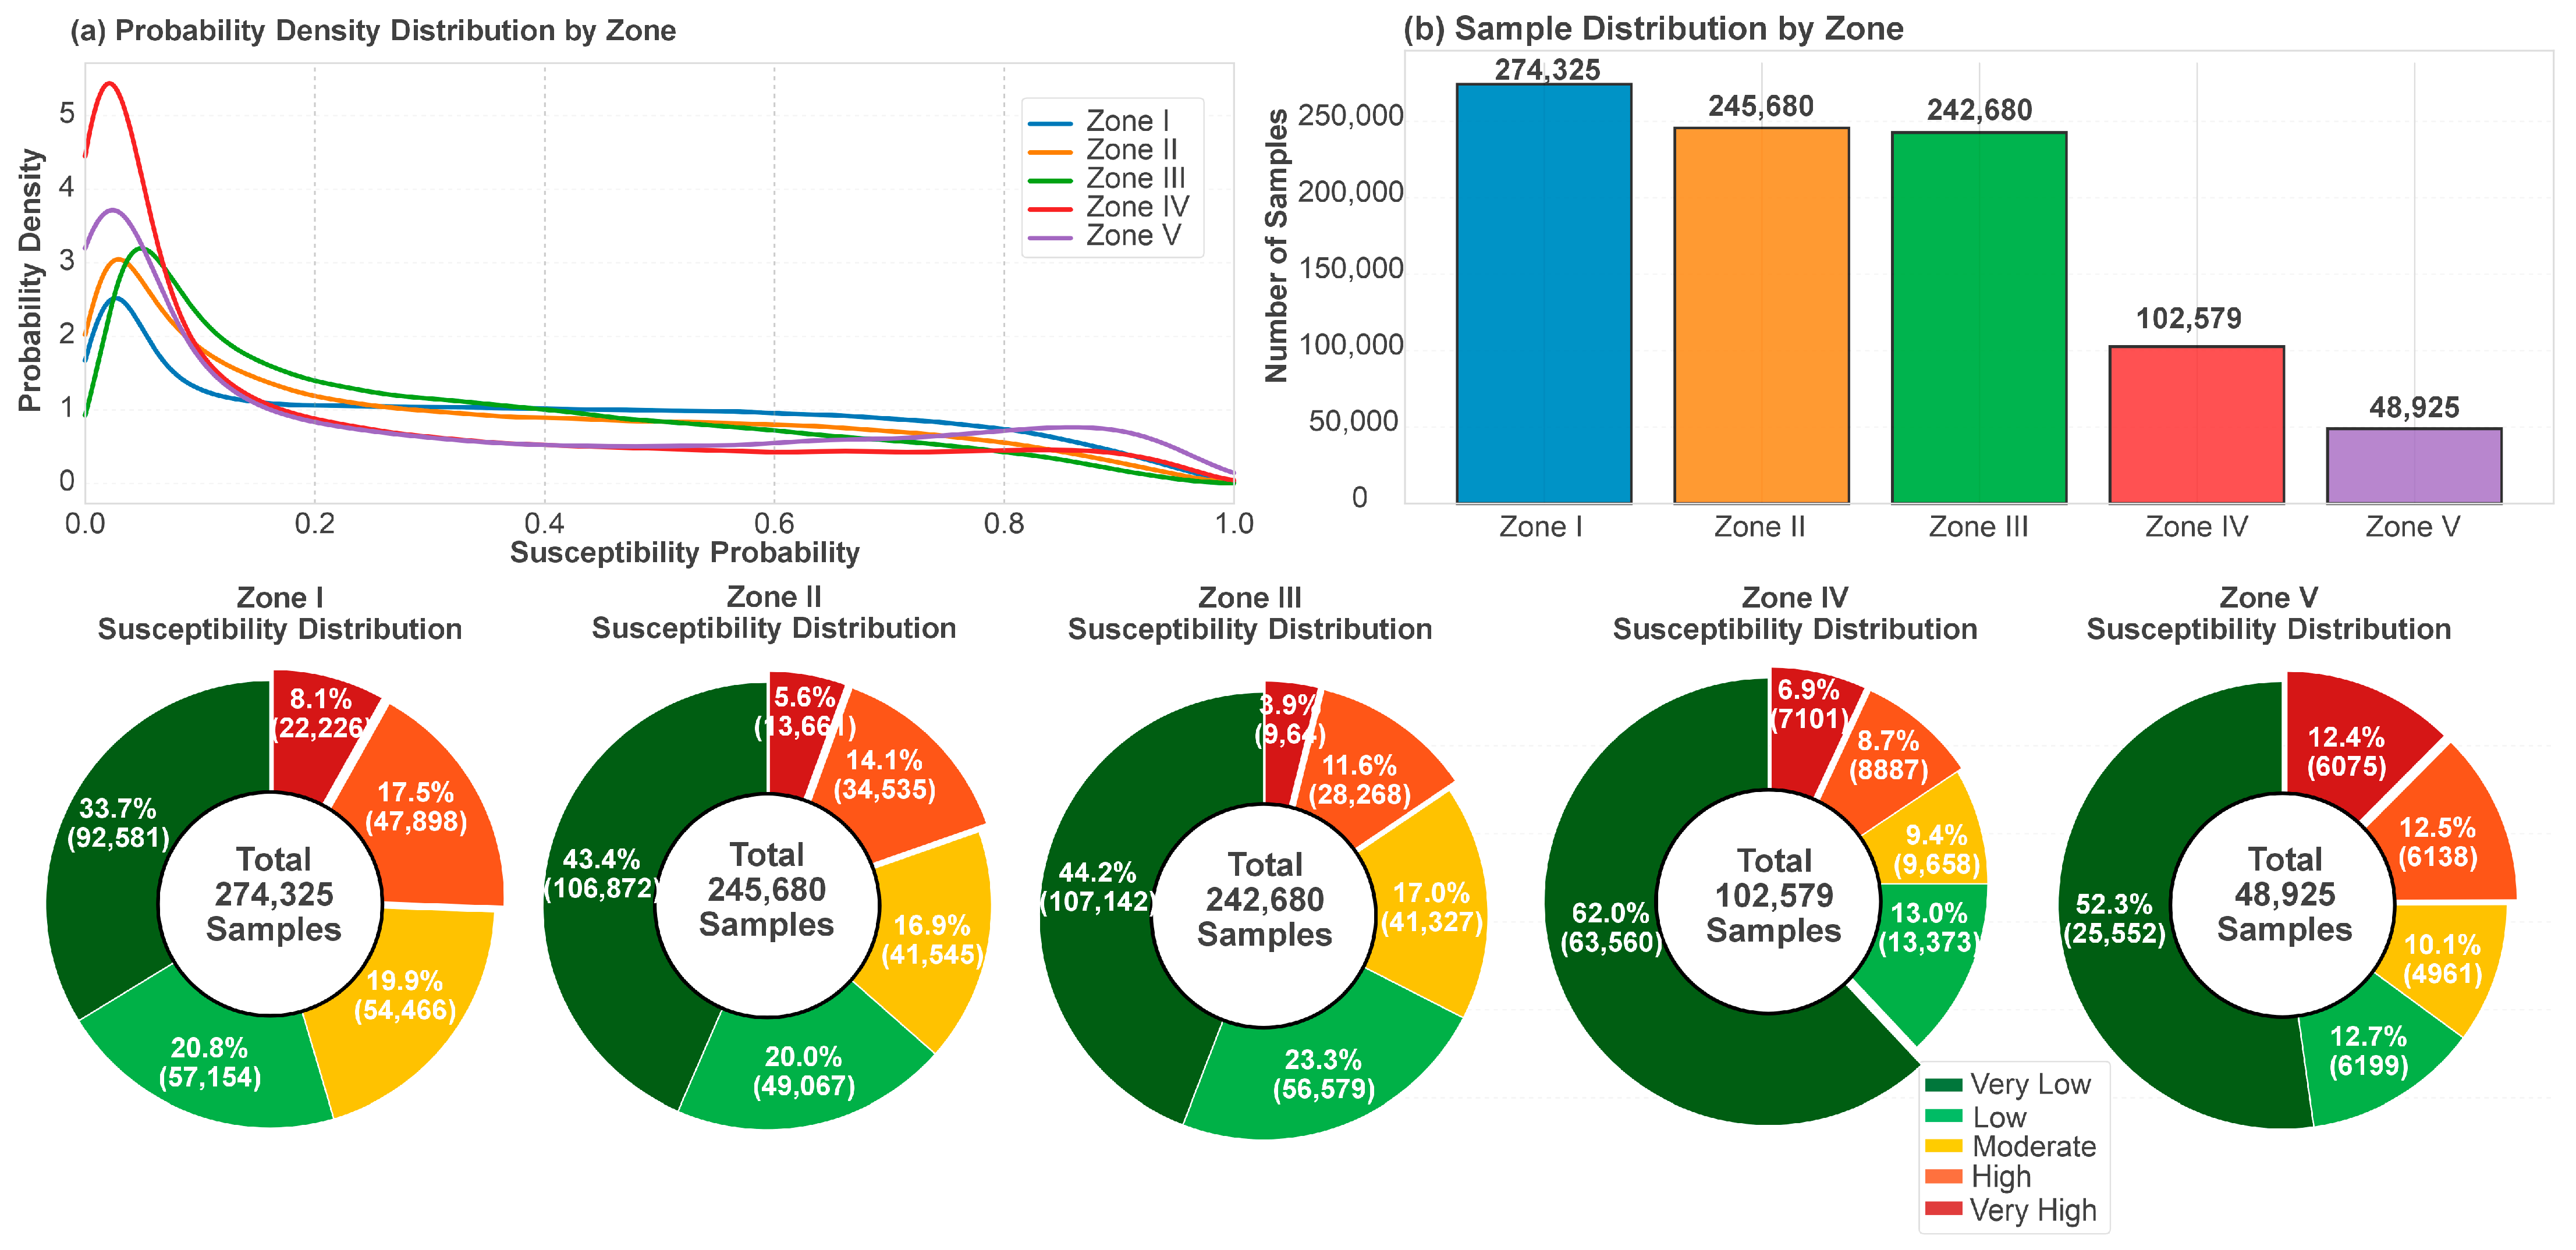
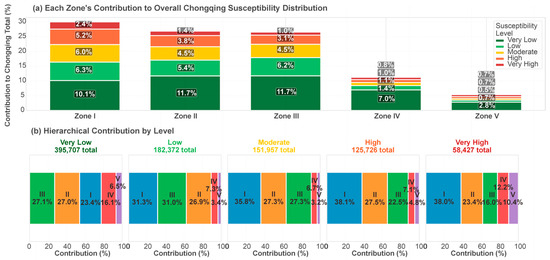
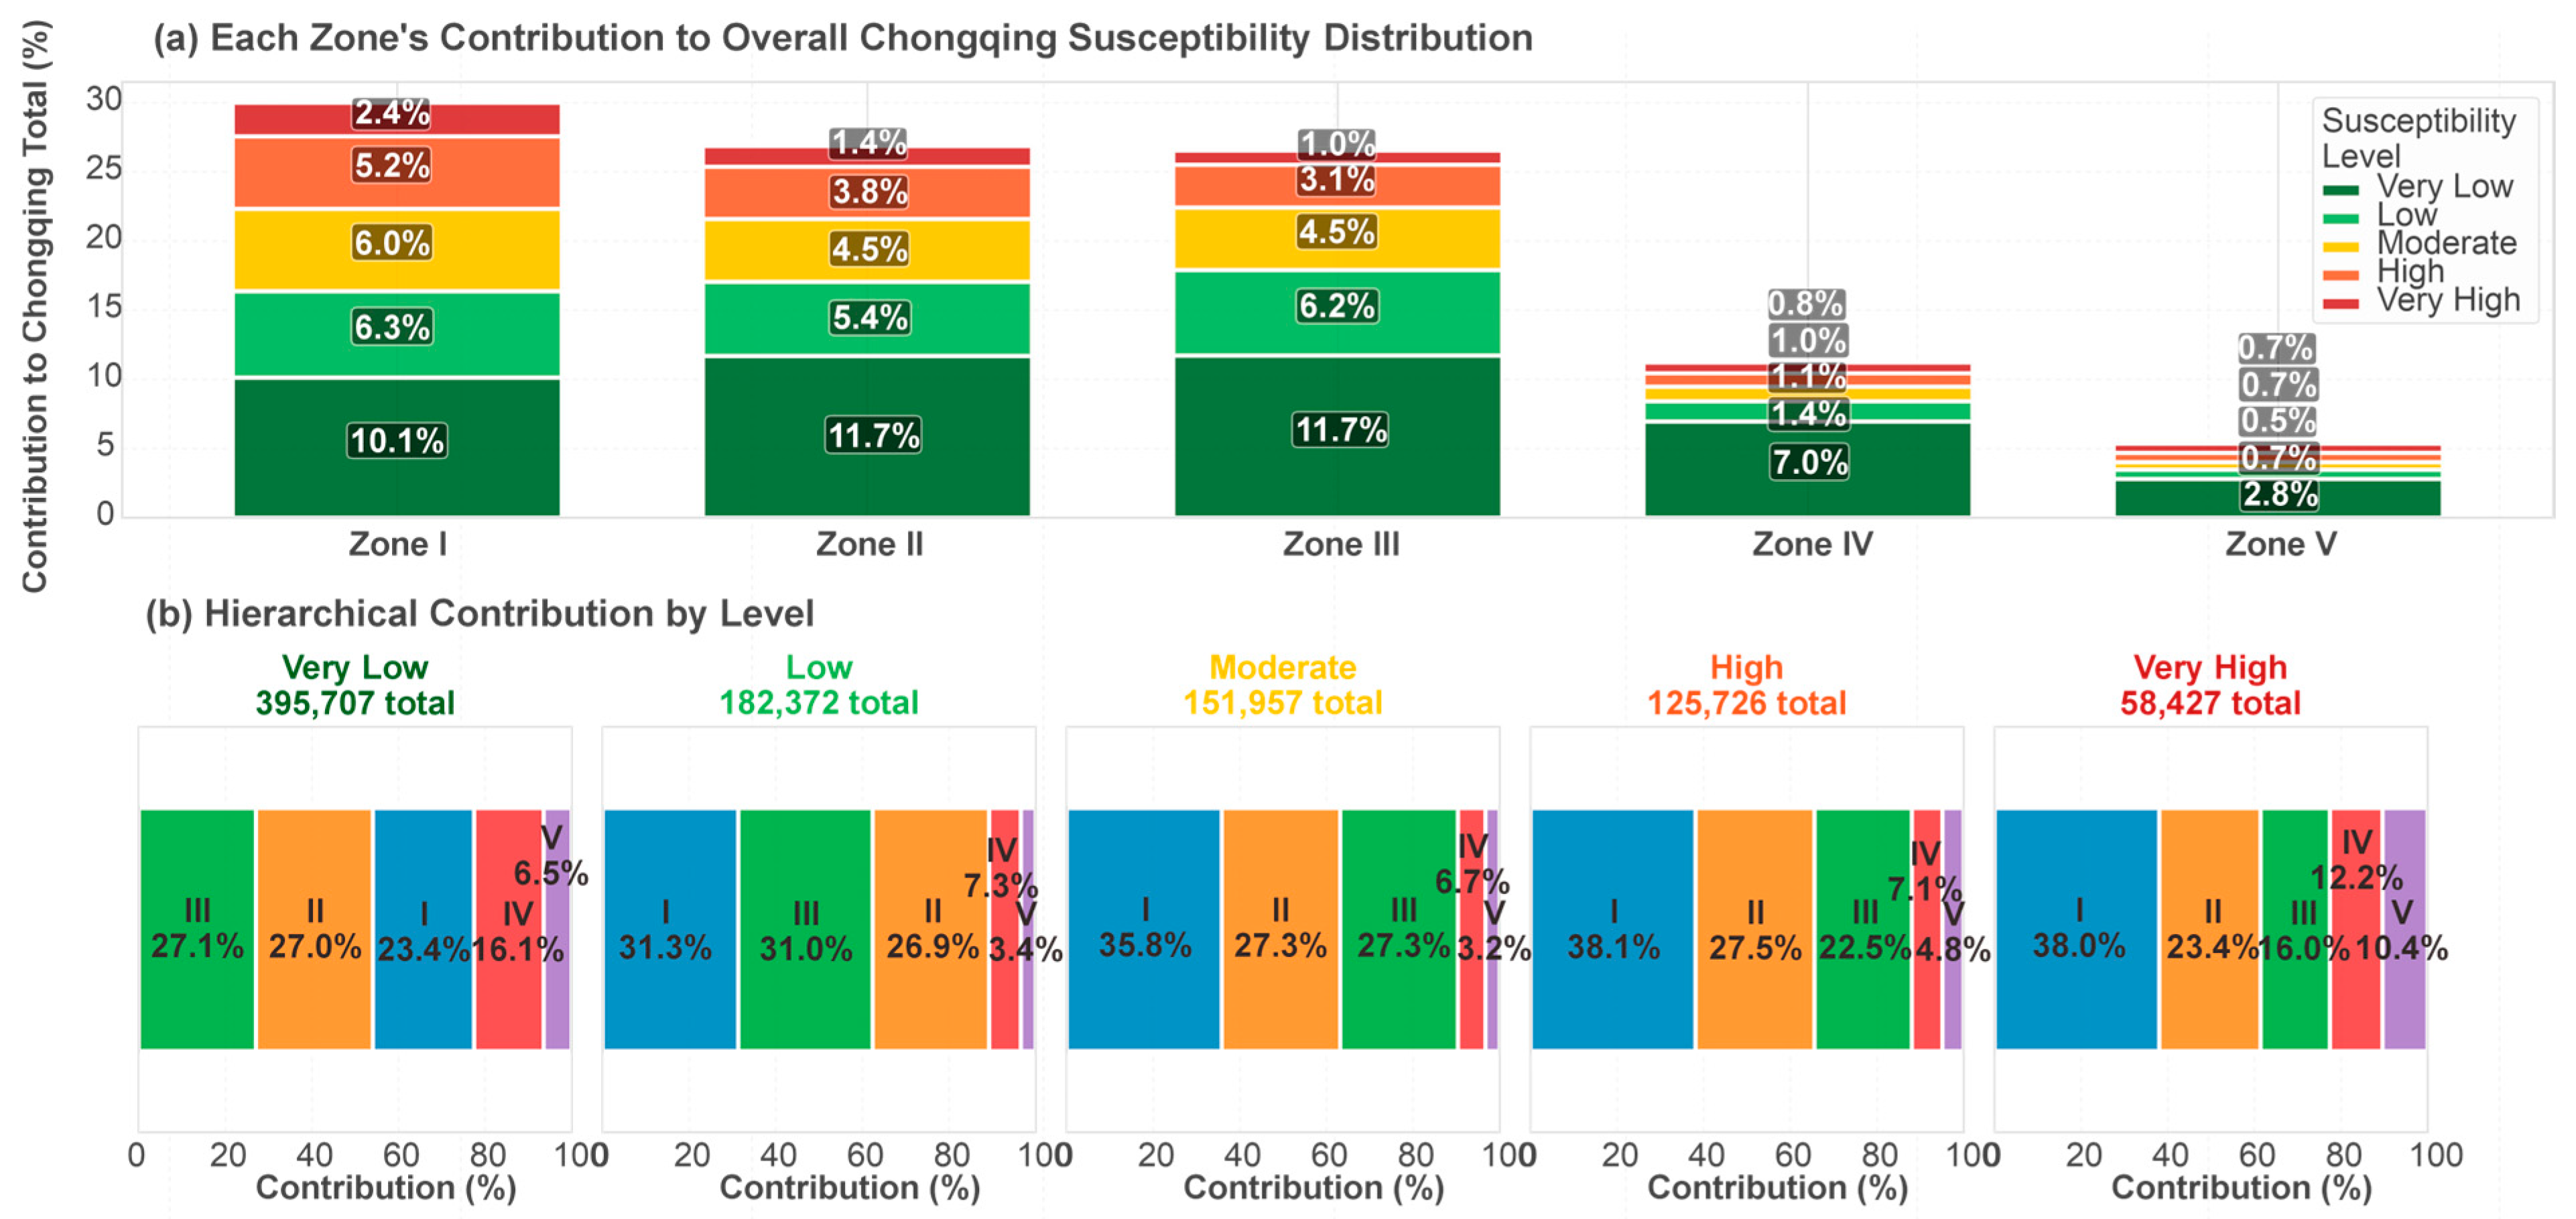

Disclaimer/Publisher’s Note: The statements, opinions and data contained in all publications are solely those of the individual author(s) and contributor(s) and not of MDPI and/or the editor(s). MDPI and/or the editor(s) disclaim responsibility for any injury to people or property resulting from any ideas, methods, instructions or products referred to in the content. |
© 2026 by the authors. Licensee MDPI, Basel, Switzerland. This article is an open access article distributed under the terms and conditions of the Creative Commons Attribution (CC BY) license.