


Highlights
What are the main findings?
- •
- Multi-source observations characterize fault geometry, deformation, and geomorphological responses.
- •
- FRSDO links fault features to supporting evidence, provenance, and processing dependencies.
What are the implications of the main findings?
- •
- Heterogeneous measurements retain their distinct meanings, spatial assignments, and sources.
- •
- Thermal-profile tests verify dependency tracing and nonthermal-record retention.
Abstract
Multi-source remote sensing provides complementary observations of fault position, geometry, and kinematic features, but measurements differ in spatial meaning, evidence source, and processing history. This study combines multi-source fault characterization with a Fault Remote Sensing Dynamic Ontology (FRSDO) to organize and update remote sensing-derived fault features. DEM, Landsat-9, Sentinel-1 SAR, and GF-1/GF-6 data were analyzed along the middle and northern portions of the Yadong–Gulu Fault using established methods and manual interpretation. Feature instances representing fault-location evidence, geometric measurements, LOS deformation patterns, and geomorphological responses were mapped to fault-object or fault-segment levels and linked to supporting records. A directed acyclic graph (DAG) records processing dependencies and identifies downstream nodes affected by source-data or parameter changes. Changes in interpretation criteria or manually interpreted feature boundaries are linked to corresponding instances and attributes for manual review. A thermal-width update experiment identified affected records, revised three segment-level thermal-width attributes, retained predefined nonthermal controls, and preserved provenance. An equivalent relational implementation reproduced all six updated width estimates with a maximum absolute difference of 0 m. FRSDO provides a domain-specific framework for fault-feature representation, evidence linkage, provenance, and controlled dependency-based updating.
1. Introduction
Faults are major geological structures associated with crustal deformation and are closely related to earthquakes and other geological hazards. Characterizing fault geometry and kinematics is important for understanding regional tectonic deformation and supporting seismic hazard and engineering-geological assessments [1,2,3].
Remote sensing provides a synoptic and repeatable means of observing fault-related topographic, geomorphological, thermal, spectral, and deformation signals over large areas. Existing studies have developed methods for extracting fault traces, geometric attributes, and kinematic indicators from multi-source imagery and geospatial data. The resulting fault remote sensing features may differ in measurement definitions, spatial assignments, supporting evidence, and processing histories. These differences require a structured approach to organizing fault remote sensing features that preserves their distinct meanings rather than treating them as interchangeable measurements.
Remote sensing studies have used diverse observations to identify fault traces and characterize geometric features [4,5,6,7,8,9,10,11], while geomorphological evidence, including displaced channels and other offset landforms, can support interpretations of fault geometry and kinematics [12,13,14]. However, an observed or measured fault remote sensing feature is not necessarily equivalent to the geological attribute inferred from it. A feature may support an interpretation without uniquely determining the corresponding fault attribute. The relationship between each feature and its geological interpretation therefore needs to be explicitly represented, together with the supporting evidence and interpretation records.
Existing geological maps and GIS databases provide established means of representing and managing fault geometries, attributes, and related geological information. Geological information models, such as GeoSciML, also support structured descriptions and data exchange [15]. A national-scale example is the China Active Faults Database (CAFD), which integrates data from 120 regional project databases, together with active-fault research, earthquake surface-rupture investigations, and published literature accumulated over the past two decades. It compiles fault traces, activity ages, and geometric and kinematic information. Its associated web-based system supports browsing, querying, and downloading, and provides Open Geospatial Consortium (OGC) Web Feature Service (WFS) and Web Map Service (WMS) interfaces [16]. These established resources demonstrate substantial capabilities for compiling, managing, and disseminating active-fault information. The issue addressed here is therefore not their inability to store remote sensing-derived data, but the need for an explicit, domain-specific representation of how individual fault remote sensing feature instances map to fault objects or segments and their attributes, retain their measurement definitions and supporting records, and depend on upstream data and processing steps. The FRSDO addresses this need by using an ontology to represent relationships among fault remote sensing features, supporting evidence, processing records, and fault attributes, and a directed acyclic graph (DAG) to record processing dependencies.
This study characterizes fault-location, geometric, and kinematic features along the middle and northern portions of the Yadong–Gulu Fault using established multi-source remote sensing methods and manual interpretation, and organizes the resulting measurements and interpretations within the FRSDO. The case study illustrates how the resulting feature instances are assigned to fault-object and fault-segment levels and linked to supporting records. It also evaluates the updating mechanism through a controlled thermal-anomaly-width experiment, examining whether affected downstream records can be identified and revised while predefined nonthermal records are retained and the specified provenance information for updated thermal-width measurements is preserved.
2. Fault Remote Sensing Dynamic Ontology: Structure, Mapping, and Updating
2.1. Dynamic Ontology Concept and Computational Mechanism for Fault Remote Sensing
Ontologies provide formal representations of domain concepts and their relationships [17,18,19,20,21]. In the FRSDO, the ontology represents domain-level relationships among fault remote sensing feature instances, their supporting observations, processing records, and associated fault attributes. A directed acyclic graph (DAG) separately represents the input–output dependencies among data sources, processing operators, feature instances, and downstream fault attributes. The ontology defines how these entities are related within the fault remote sensing domain, whereas the DAG records the dependencies through which feature results are derived from upstream data and processing steps. Together, these representations provide a basis for provenance tracking and controlled revision of affected records.
In this study, “dynamic” refers to controlled, instance- and attribute-level revisions of feature values, associated fault attributes, evidence links, and processing records in response to changes in source data, processing parameters, or interpretation criteria. When source data or processing parameters change, the corresponding DAG dependencies are traversed to identify affected downstream processing operators, feature instances, and associated fault attributes. When interpretation criteria or the delineation of a manually interpreted feature changes, the affected feature instance is identified through its associated interpretation information, and the fault attribute it supports is identified through the feature-to-attribute mapping described in Section 2.2. The feature is then subject to manual review rather than automatic regeneration. Thus, “dynamic” refers to controlled updating and review of represented instances and attributes, rather than real-time fault monitoring or automatic changes to the ontology schema.
The FRSDO represents remote sensing processing as a set of interdependent sub-processes. Each sub-process OPi has a modeling representation and an executable representation . At the framework level, the state-transition function fc denotes the mapping from the modeling representation to its executable representation:
The modeling representation describes the processing logic before execution. It is organized into three coupled stages: data loading and retrieval , analysis and computation , and result publication , such as through map services or interactive layers:
Here, ∘ denotes process coupling rather than strict functional composition. Each stage may contain one or more task-specific processing operators linked through input–output dependencies. These dependencies are represented in the DAG, as described in Section 2.3. The case study implements and evaluates the thermal-profile updating branch of this framework, rather than a general-purpose automatic transformation from arbitrary modeling representations to executable programs.
2.2. Structure and Feature Mapping of the FRSDO
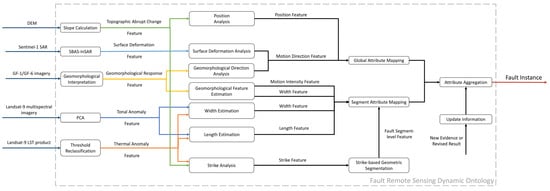
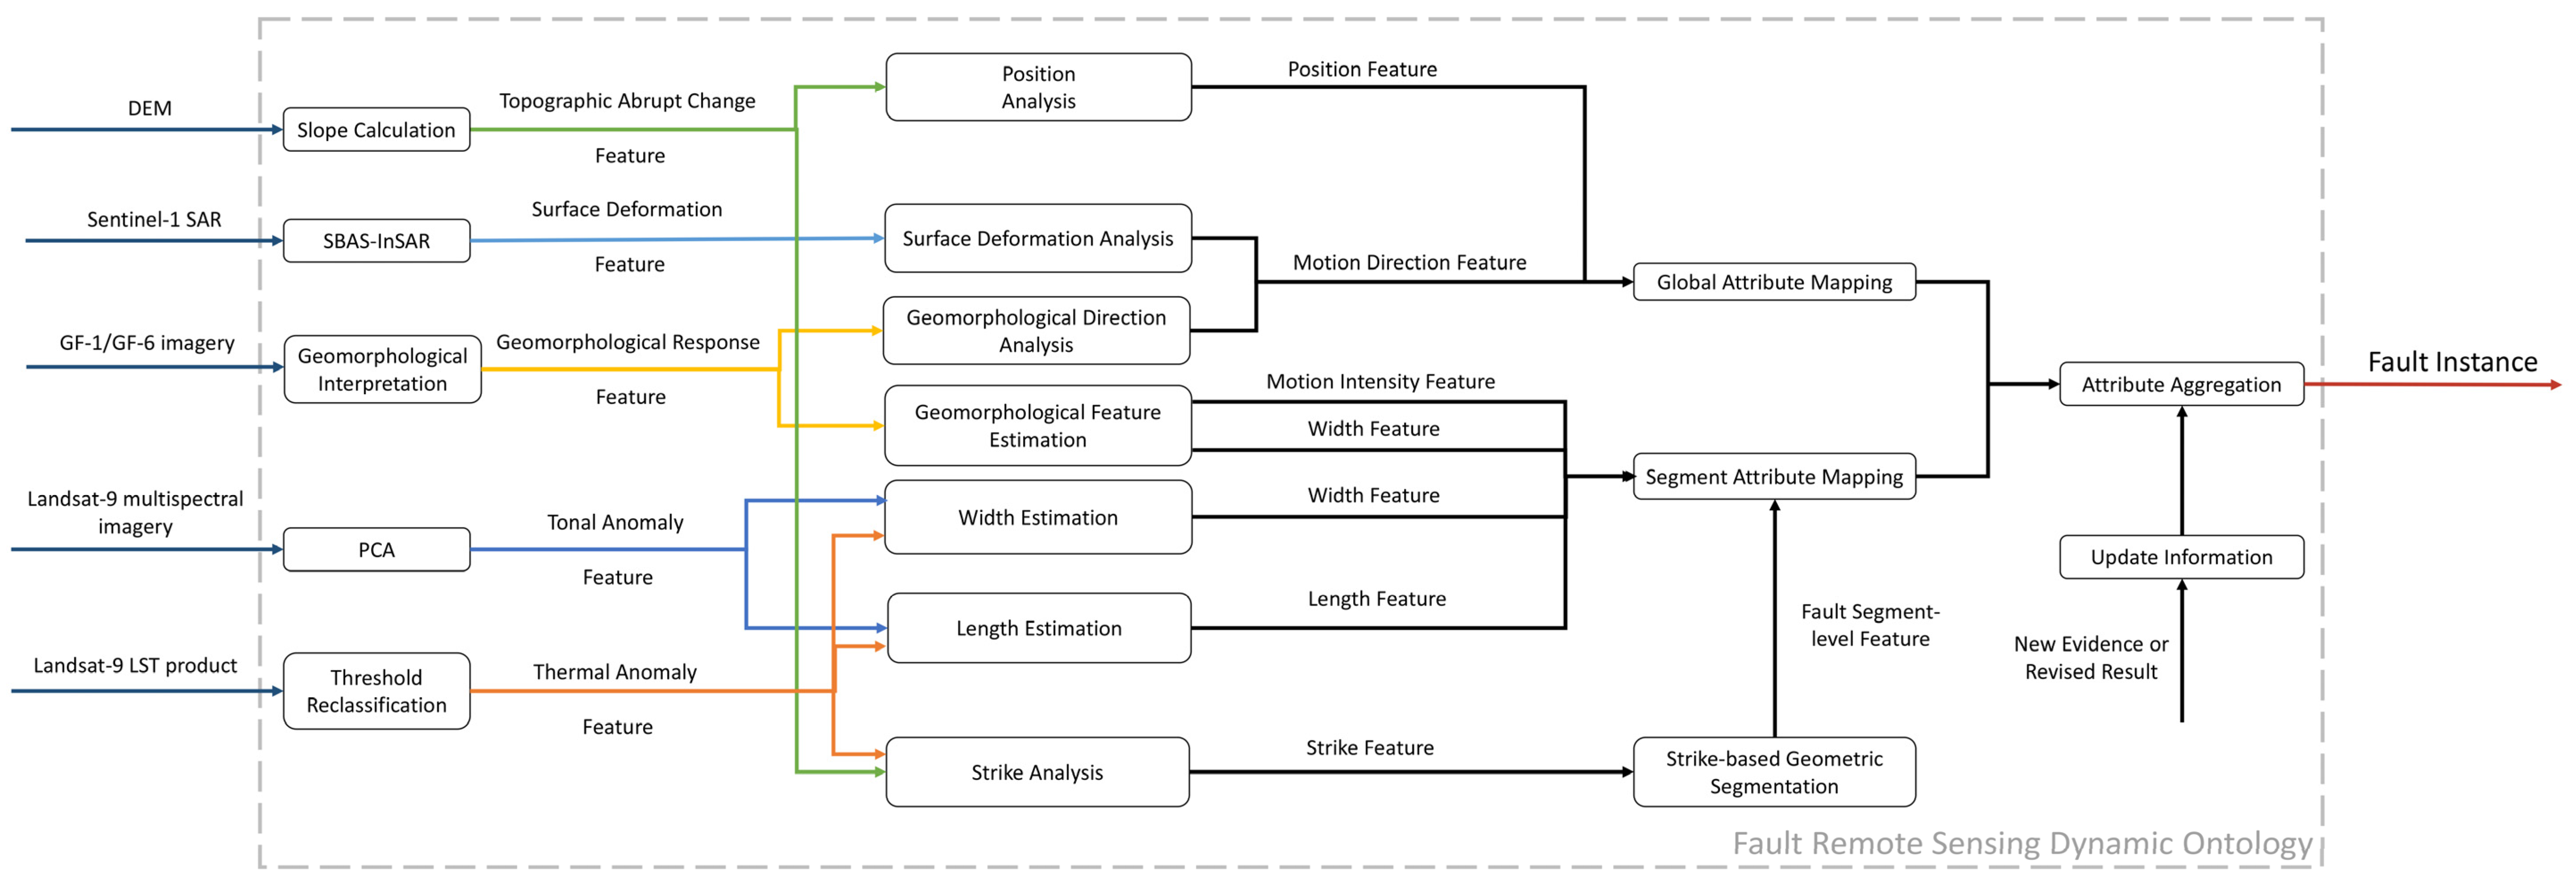
The FRSDO organizes multi-source remote sensing observations, feature instances, supporting evidence, processing records, and fault attributes through explicit relationships defined for the fault remote sensing domain (Figure 1). Table 1 summarizes the main components used in this study, including fault objects, fault segments, fault attributes, evidence types, feature instances, data sources, processing operators, processing records, and update information. For manually interpreted features, the relevant interpretation criteria are associated with the corresponding feature instances rather than represented as a separate ontology component.
Figure 1.
Structure of the Fault Remote Sensing Dynamic Ontology (FRSDO). The FRSDO links multi-source remote sensing data, evidence generation, feature analysis, attribute mapping and aggregation, processing records, and update information to form a traceable fault representation.
Table 1.
Main components of the FRSDO.
The FRSDO applies explicit hierarchical mapping rules to assign fault-related feature instances to the fault-object or fault-segment level according to the spatial scope of the attributes they support (Table 2). Fault location and interpreted motion direction are represented at the fault-object level because they describe the overall fault position and kinematic interpretation, whereas segment length, width, strike, and geomorphological response indicators are assigned to the fault-segment level to preserve segment-specific characteristics.
Table 2.
Hierarchical mapping of remote sensing feature instances to fault attributes in the FRSDO.
Feature instances are maintained as distinct records from the fault attributes they support. A single fault attribute may be associated with multiple feature instances, each retaining its own measurement definition and supporting evidence. For manually interpreted features, the relevant interpretation criteria are associated with the corresponding feature instance. The corresponding source data and processing history remain traceable through the data-source links and DAG dependencies. For the segment-width attribute, tonal and thermal anomaly widths are recorded as separate measurements, whereas local geomorphological extents are associated as contextual evidence of the segment’s surface expression. These associations reflect the relevance of the observations to fault-segment geometry; they do not imply that the measurements or extents are equivalent measures of physical fault-zone width. No combined width is calculated.
2.3. DAG-Based Execution, Provenance, and Attribute Updating
In the FRSDO, the processing dependency network is represented as a directed acyclic graph (DAG). Its nodes correspond to data sources, processing operators, feature instances, and fault attributes, while directed edges record their input–output dependencies:
Here, fc denotes the mapping from the modeling state of the FRSDO to its DAG-based executable representation, whereas FDAG denotes the resulting DAG representation rather than the transformation function itself. The resulting graph records the dependency relationships linking source data and processing operators to feature instances and their associated fault attributes. Processing records document the methods, parameters, and provenance associated with these operations and results.
During ontology modeling, proxy operators record the declarations for each processing step, including the operator name, inputs, processing parameters, expected outputs, and dependencies, without executing the underlying remote sensing computation at that stage. These declarations define the input–output and dependency links in the DAG. They also preserve provenance links from source data and processing steps to the resulting feature instances and associate those instances with the fault-object or fault-segment attributes they support, following the mapping rules in Section 2.2.
When an input dataset or processing parameter changes, the corresponding DAG dependencies are traversed to identify affected downstream processing operators, feature instances, and associated fault attributes. Processing-derived results within the affected branch can then be recomputed using the revised inputs or parameters. By contrast, when interpretation criteria or the delineation of a manually interpreted feature changes, the affected feature instance is identified through its associated interpretation information, and the fault attribute it supports is identified through the feature-to-attribute mapping in Section 2.2. The feature is then subject to manual review rather than automatic regeneration. Following recomputation or review, confirmed revisions are reflected in the affected feature instances and their associated fault attributes at their assigned spatial levels. Records outside the affected processing branches or manual-review scope are retained.
The practical role of the FRSDO is assessed against three criteria. First, measurements associated with the same fault attribute are represented as distinct feature instances, preserving their individual measurement definitions, spatial assignments, and supporting evidence rather than being merged into an undifferentiated value. Second, each feature result is linked to its supporting data and relevant processing records to preserve its processing provenance; for manually interpreted features, the associated interpretation criteria are retained with the corresponding feature instance. Third, when source data or processing parameters change, DAG dependencies are traversed to identify affected processing-derived measurements and attributes for recomputation. When interpretation criteria or the delineation of a manually interpreted feature changes, the associated interpretation information identifies the feature instance requiring review, and the feature-to-attribute mapping identifies the supported fault attribute. Confirmed revisions can then be checked for consistency across linked records, while records outside the affected processing branches or manual-review scope are retained where appropriate. These criteria address domain-specific feature organization, provenance, and controlled updating rather than the accuracy of the underlying remote sensing measurements.
Attribute updating was evaluated using a case-specific implementation of the thermal-profile branch of the FRSDO. The original manually measured thermal anomaly widths were imported unchanged as the initial records. Two update trials applied revised boundary-temperature threshold parameters of 19 °C and 21 °C, respectively, to the same temperature profiles. The updated widths were recalculated using the explicit discrete-sample boundary-selection rule described in Section 3.3.2, rather than the original manual point-selection procedure. Each threshold setting triggered boundary selection, distance calculation, and remapping of the affected fault-segment attributes. The dependency network identified the affected nodes, and the updated records preserved the specified profile-level provenance, including sample references, processing methods, applied parameters, and links to preceding records. An equivalent relational implementation used the same inputs, boundary-selection rule, processing operators, entity types, dependency links, and provenance fields, with affected records identified through a recursive dependency query. The comparison assessed whether the FRSDO and relational implementations produced matching updated width estimates, retained the predefined nonthermal records, and preserved the specified profile-level provenance. Detailed procedures and results are presented in Section 3.3.2.
3. Case Study: Middle and Northern Portions of the Yadong–Gulu Fault
3.1. Study Area and Remote Sensing Data
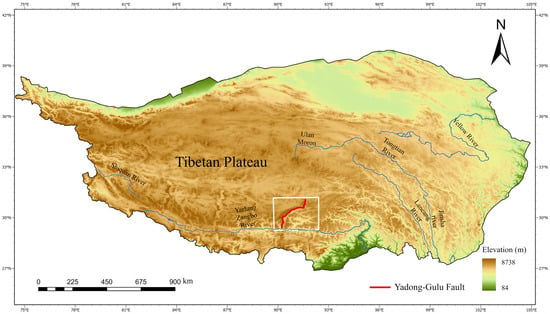
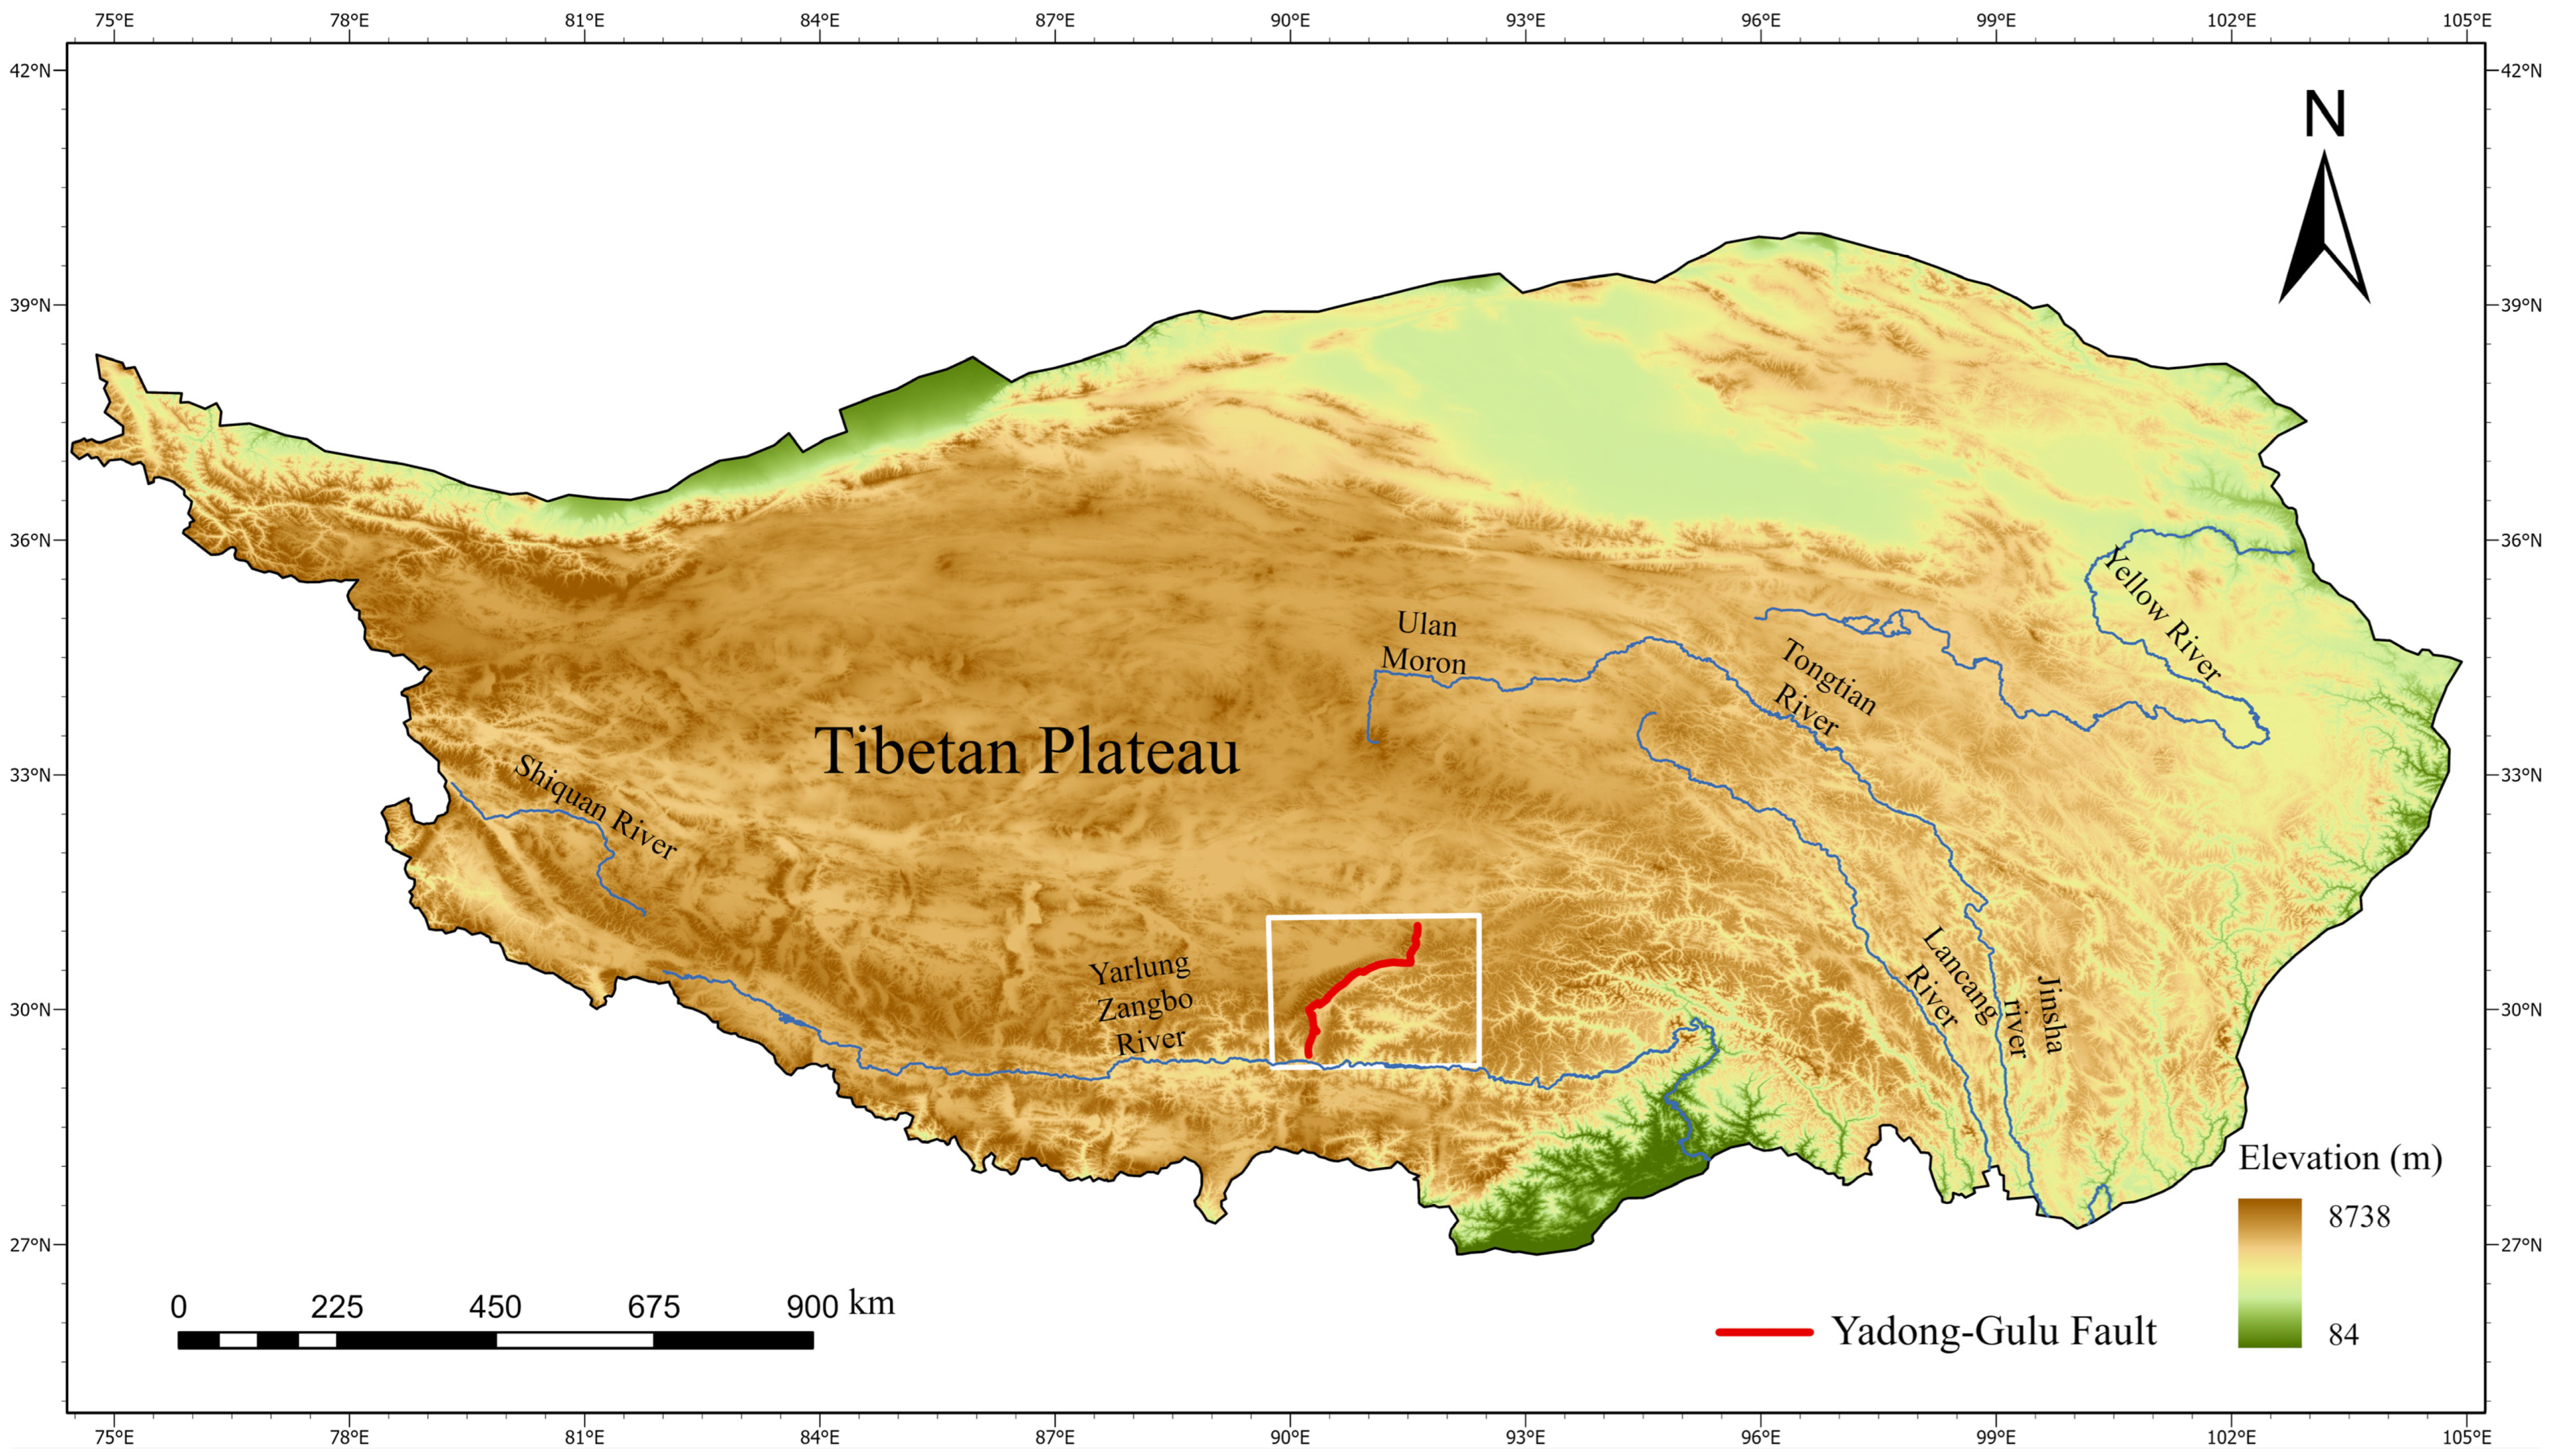
Active deformation in southern Tibet is closely related to the India–Eurasia collision [22,23,24]. South of the Bangong–Nujiang Suture Zone, a series of nearly north–south-trending normal faults accommodate east–west extension [25,26,27]. The Yadong–Gulu Fault is a major N–S-trending extensional fault in this region (Figure 2). It extends for approximately 500 km from Yadong County northward through Qingcuo, Yangbajing, and Damxung and shows clear along-strike geometric variations [28,29]. Previous studies have divided the fault into northern, middle, and southern segments [30]. This study focuses on the middle and northern portions of the Yadong–Gulu Fault.
Figure 2.
Location of the study area along the Yadong–Gulu Fault on the Tibetan Plateau. The white box marks the middle and northern portions of the fault, the red line denotes the Yadong–Gulu Fault, and the DEM serves as the basemap.
The northern portion of the fault extends from Yangyi Village to the Gulu region, from approximately 30°N to 31.1°N. It lies mainly along mountain-front and piedmont zones and is about 220 km long. The middle portion lies between Yangyi Village and the Yarlung Zangbo River, from approximately 29.2°N to 30°N. For FRSDO instantiation, the study area is represented as one fault object comprising three fault segments: Seni, Damxung, and Nyemo.
The study used 2023 Landsat-9 Collection 2 Level-2 surface reflectance and surface temperature products provided on 30 m grids, with a native thermal resolution of 100 m. Sentinel-1 data comprised 84 ascending-orbit IW SLC images acquired from January 2022 to October 2024, with a nominal single-look resolution of approximately 5 m × 20 m. The interferometric products were generated through ASF DAAC HyP3 using GAMMA and provided on a 40 m grid for subsequent SBAS-InSAR analysis. NASADEM data at approximately 30 m resolution were used for topographic feature extraction, while Copernicus DEM GLO-30 was used during HyP3 processing. GF-1/GF-6 fused imagery at 2 m resolution was used for local geomorphological measurements. The Yadong–Gulu Fault vector dataset was obtained from the Seismic Active Fault Survey Data Center. It was introduced only after the remote sensing-derived interpretations had been generated and was used as a spatial reference for comparing interpreted fault locations, segment lengths, and strikes.
3.2. Multi-Source Fault Feature Extraction
Multi-source remote sensing data were analyzed to characterize the position, geometry, and motion-related features of the middle and northern portions of the Yadong–Gulu Fault. The analysis includes fault location, segment length, segment strike, segment width, motion direction, and geomorphological response indicators. The resulting measurements and interpretations were then mapped to the corresponding FRSDO attributes and linked to their supporting evidence and processing records according to the mapping rules in Section 2.2.
3.2.1. Fault Location
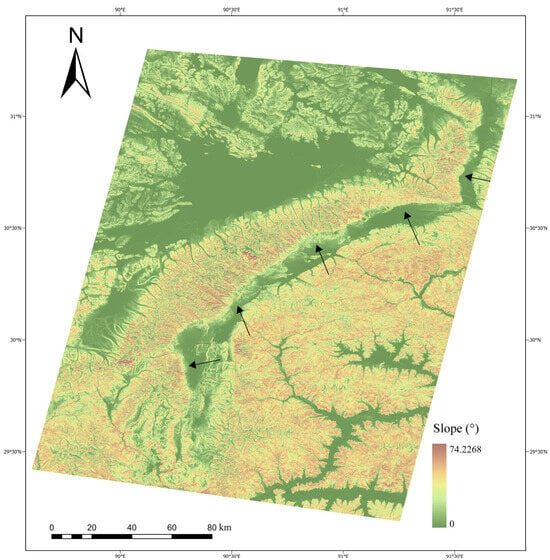
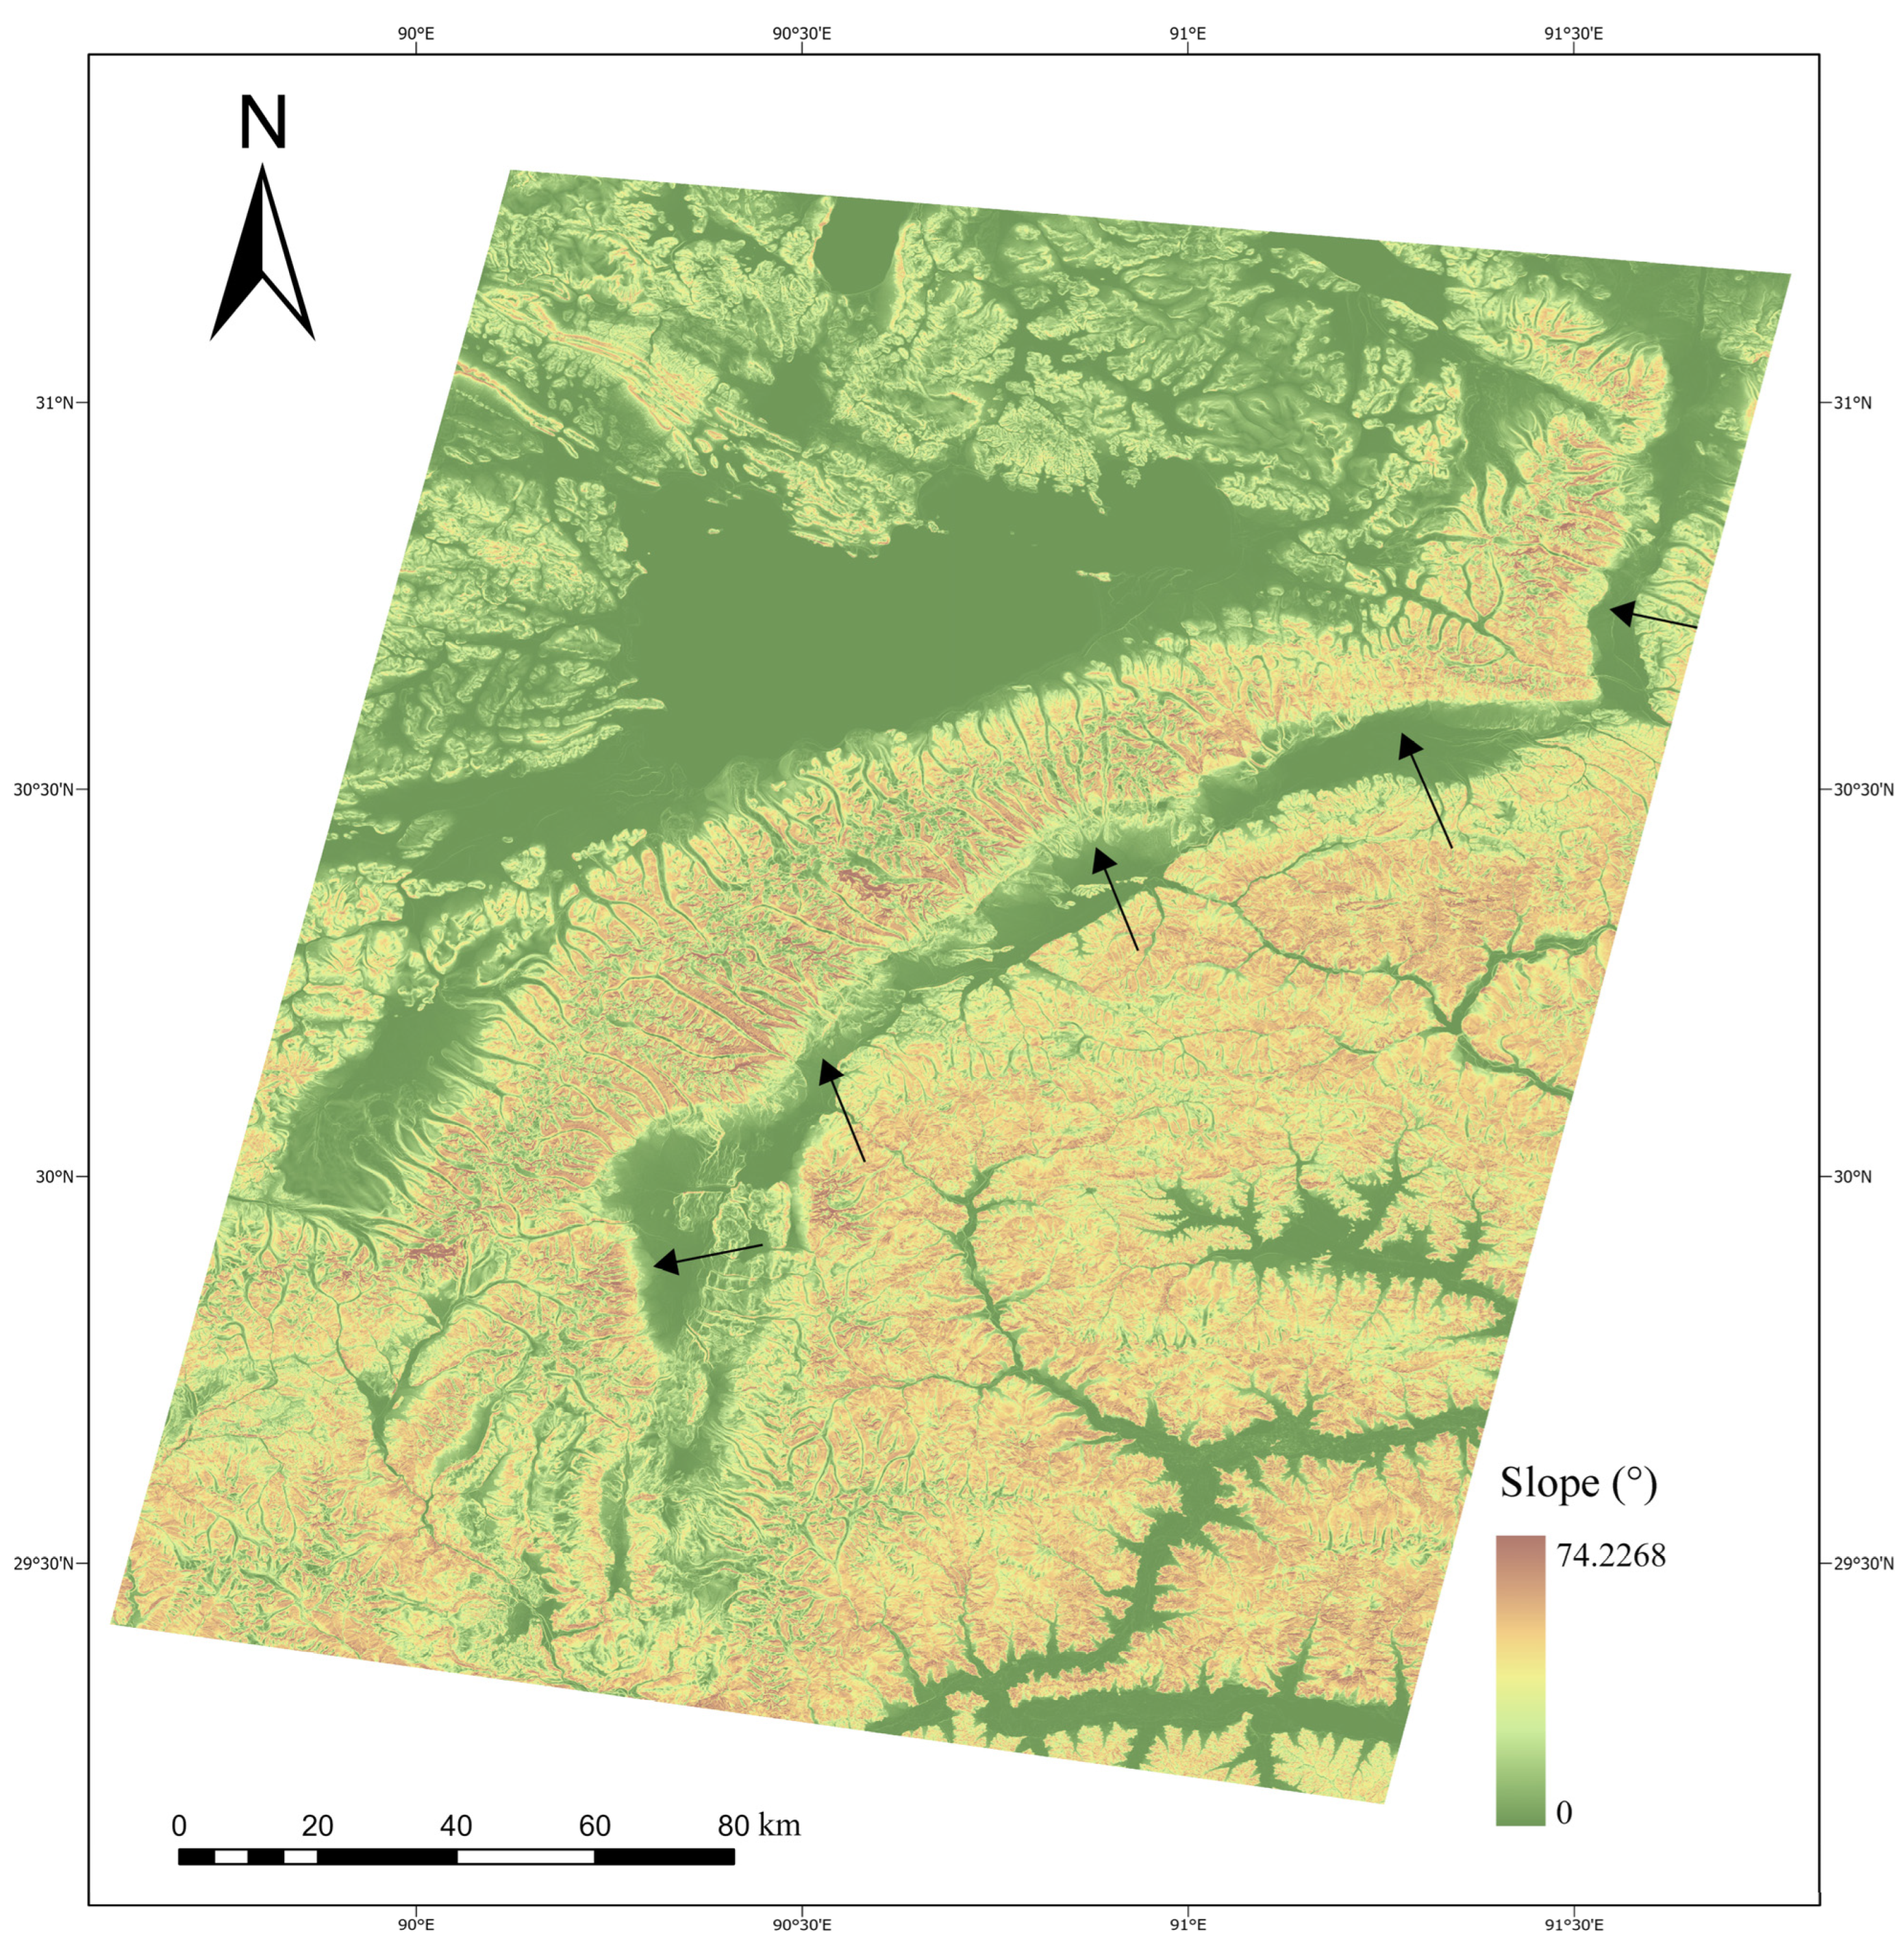
Fault location was interpreted by visually examining the DEM-derived slope map (Figure 3). The interpretation focused on spatially continuous belts of abrupt slope change, considering their linear distribution and local geomorphological setting. These slope-break zones may correspond to fault-related scarps, mountain-front boundaries, or piedmont breaks. In the FRSDO, the interpreted zones are treated as feature instances in the Topographic Abrupt Change evidence category and linked to the fault-location attribute. The interpreted slope-break zones extend from approximately 29.4°N to 31.1°N and from 90.2°E to 91.6°E, passing through the Seni, Damxung, and Nyemo areas. They show a broadly linear distribution with local bends and branches around major ridges and valleys and are generally consistent with the reference Yadong–Gulu Fault vector.
Figure 3.
DEM-derived slope map and interpreted slope-break zones along the middle and northern portions of the Yadong–Gulu Fault. Black arrows indicate the interpreted slope-break zones.
3.2.2. Segment Length
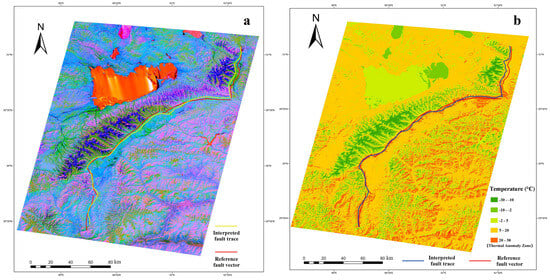
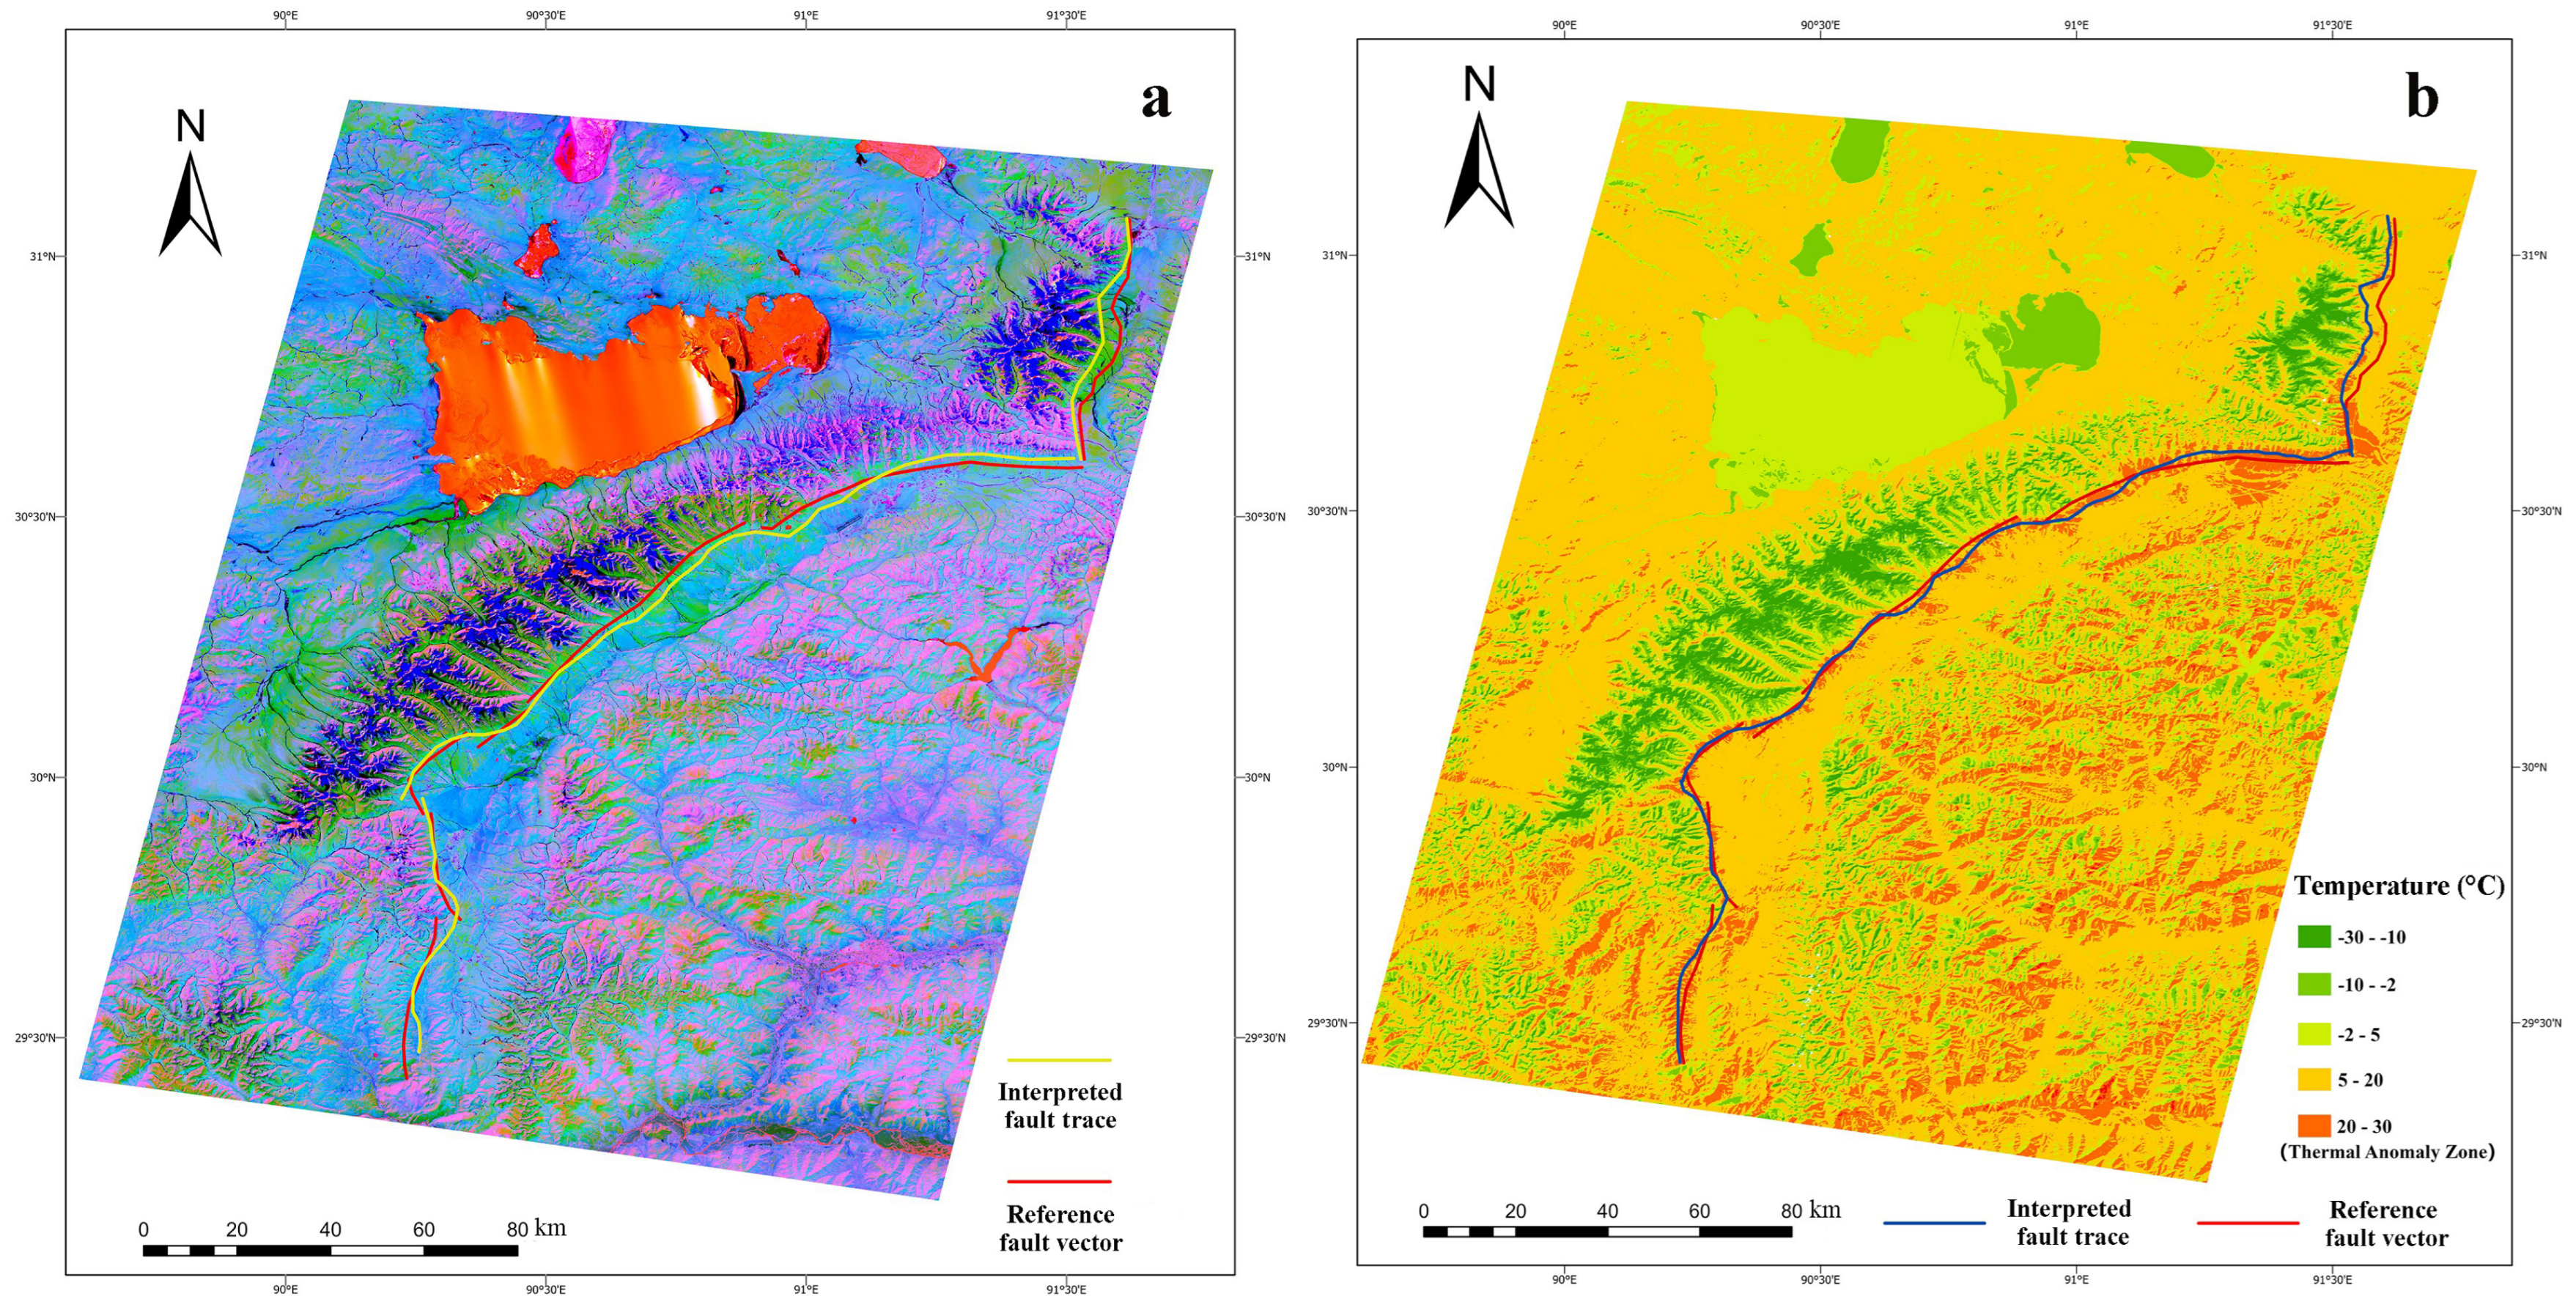
Segment lengths were estimated by measuring the mapped traces of PCA-derived tonal anomaly zones and thermal anomaly zones (Figure 4). In the FRSDO, these anomaly zones are treated as feature instances supporting the segment-length attribute. The PCA-derived tonal anomaly zones were identified by manual visual interpretation of the Landsat-9 PCA imagery based on tonal contrast with the surroundings and spatial continuity. The main tonal anomaly traces were then delineated and vectorized, while short secondary traces and isolated anomalies were excluded from the length calculation. From the tonal anomaly zones, the estimated lengths of the Seni, Damxung, and Nyemo segments are 54.3, 156.9, and 46.6 km, respectively, with a total length of 257.8 km. The corresponding lengths derived from the thermal anomaly zones are 53.5, 162.8, and 52.8 km, totaling 269.1 km. These totals differ from the 265 km reference fault length by −2.7% and +1.5%, respectively. The vectorized anomaly traces and their measured lengths are retained as evidence for the corresponding fault-segment-level length attributes.
Figure 4.
Segment length estimation from PCA-derived tonal anomaly zones and thermal anomaly zones. (a) PCA-derived tonal anomaly zones from Landsat-9 multispectral imagery; (b) thermal anomaly zones from the Landsat-9 LST product. Red lines denote the reference Yadong–Gulu Fault vector, and the interpreted anomaly traces were used for length measurement.
3.2.3. Segment Strike
Segment strike was estimated from the linear orientations of thermal anomaly zones and DEM-derived slope-break zones (Table 3). In the FRSDO, these two types of linear features are treated as feature instances supporting the segment-strike attribute. The thermal anomaly zones were derived from the Landsat-9 LST product, whereas the slope-break zones were interpreted from DEM-derived slope information. For each fault segment, the dominant orientation of the interpreted linear features was measured and compared with the reference Yadong–Gulu Fault vector. The estimates are close to the reference values for the Seni segment, whereas larger differences occur in the Damxung and Nyemo segments. These differences may reflect local fault curvature, branch development, or differences in the surface expressions captured by the two data sources. The two types of linear evidence provide complementary constraints for representing segment strike at the fault-segment level in the FRSDO.
Table 3.
Segment strike estimates from thermal anomaly zones, DEM-derived slope-break zones, and the reference fault vector.
3.2.4. Segment Width
Faulting can produce spatially distributed surface expressions through deformation, landscape adjustment, and changes in surface materials and fluid conditions. River and ridge deflections may record local geomorphological adjustment, while alluvial fans reflect sediment transfer and deposition in topography influenced by uplift and subsidence [31]. Surface-material contrasts can produce tonal anomalies, and fault-related fluid pathways may contribute to thermal anomalies [32,33]. These responses provide the basis for examining their spatial extents around fault segments.
Tonal anomaly widths, thermal anomaly widths, and local geomorphological extents were therefore examined as distinct observations relevant to fault-segment geometry. They differ in physical origin, measurement direction, and boundary definition; tonal and thermal anomaly widths are retained as separate measurements, while local geomorphological extents provide contextual evidence of surface expression. These observations are not combined or interpreted as direct estimates of physical fault-zone width.
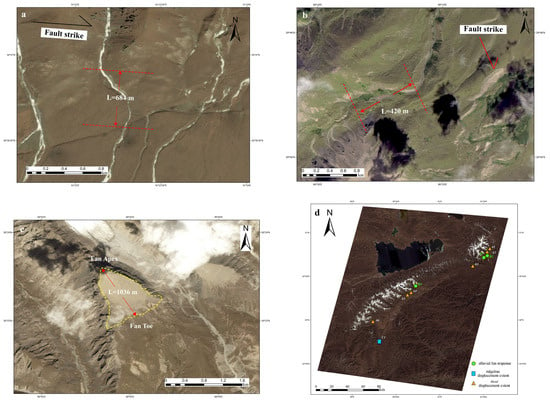
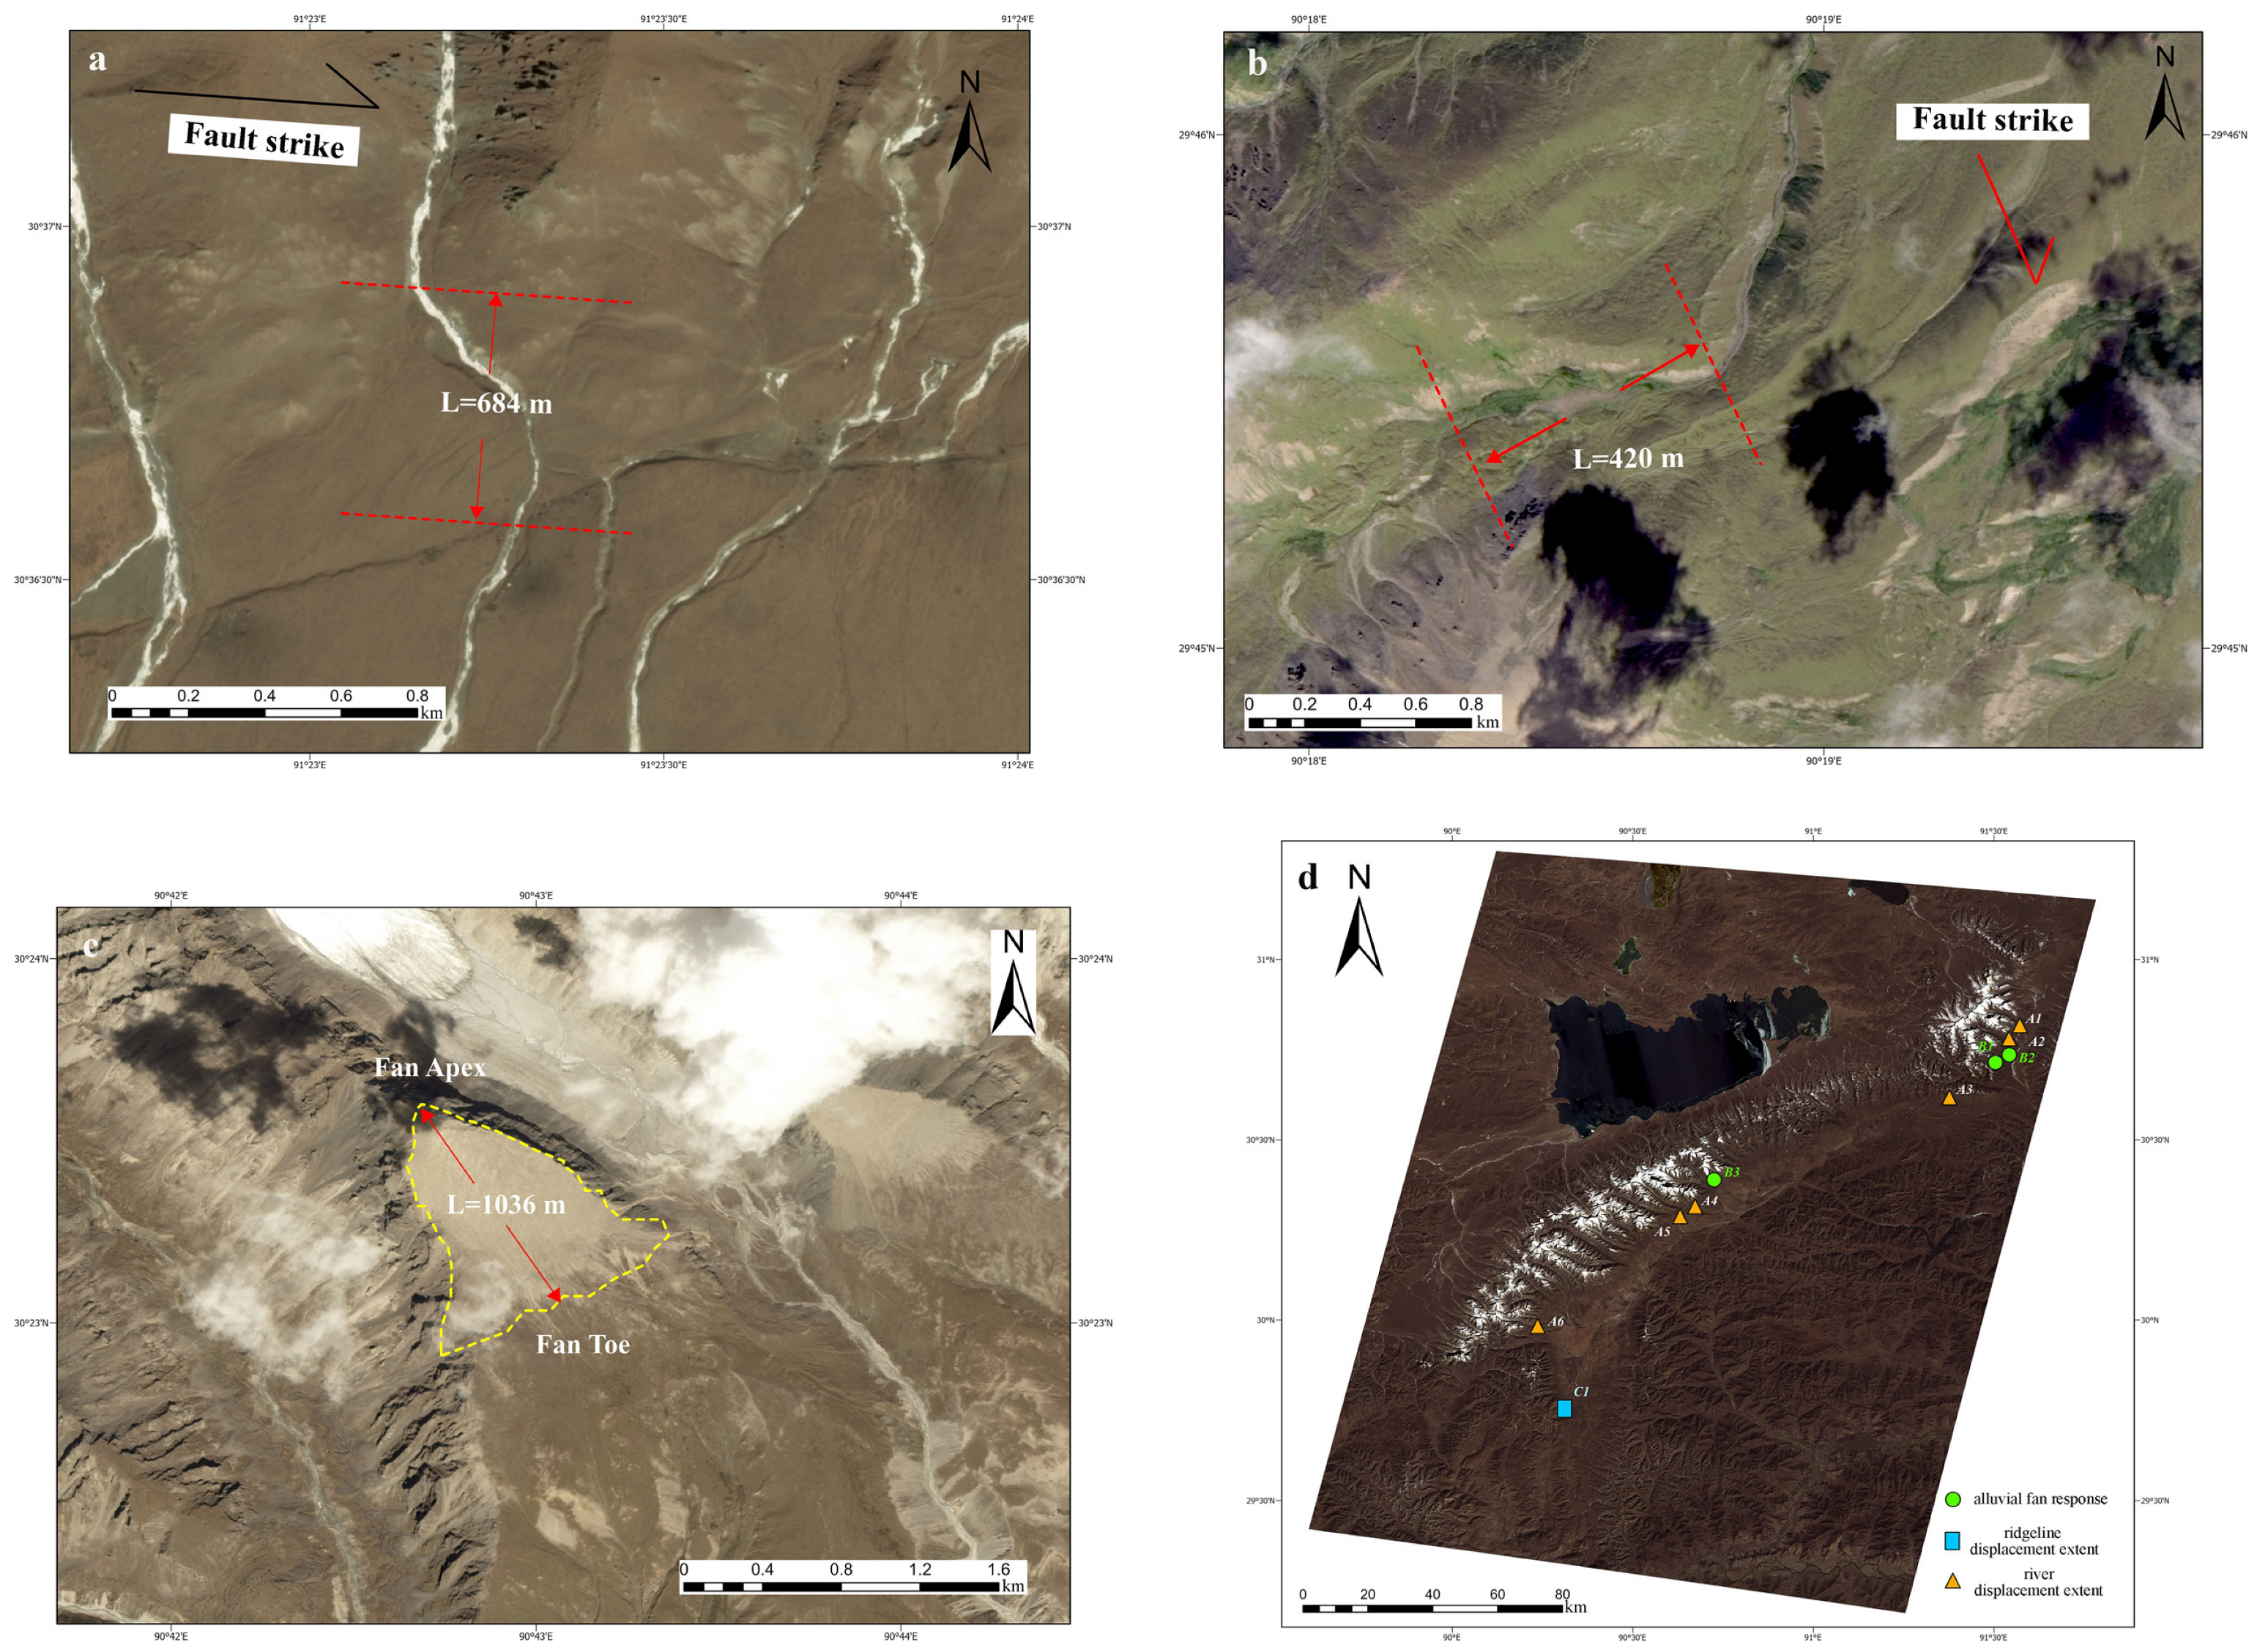
Local geomorphological extents were measured from river-deflection zones, ridge-deflection zones, and alluvial fans (Figure 5). River displacement extent was measured as the lateral width of the river-deflection zone across the fault, using reference lines approximately parallel to the fault strike and a transverse measurement across the zone (Figure 5a). Ridgeline displacement extent was measured across localized ridge-deflection zones (Figure 5b), and alluvial fan response was measured from the fan apex to the fan toe (Figure 5c). The river displacement extent reported here describes the transverse width of the river-deflection zone and is distinct from the horizontal river displacement magnitude in Section 3.2.6, which is measured as the perpendicular distance between reference lines through paired channel-deflection points. These measurements represent local geomorphological extents, with their values summarized in Table 4, Panel a, and their spatial distribution shown in Figure 5d.
Figure 5.
Measurements of local geomorphological extents. (a) River displacement extent; (b) ridgeline displacement extent; (c) alluvial fan response measured from the apex to the toe; (d) spatial distribution of measurement sites along the middle and northern portions of the Yadong–Gulu Fault.
Table 4.
Remote sensing anomaly-zone widths and local geomorphological extents along the middle and northern portions of the Yadong–Gulu Fault.
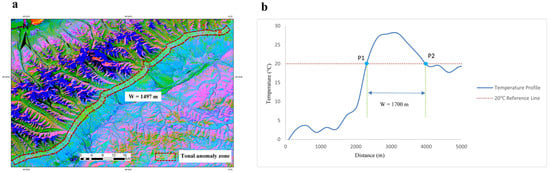
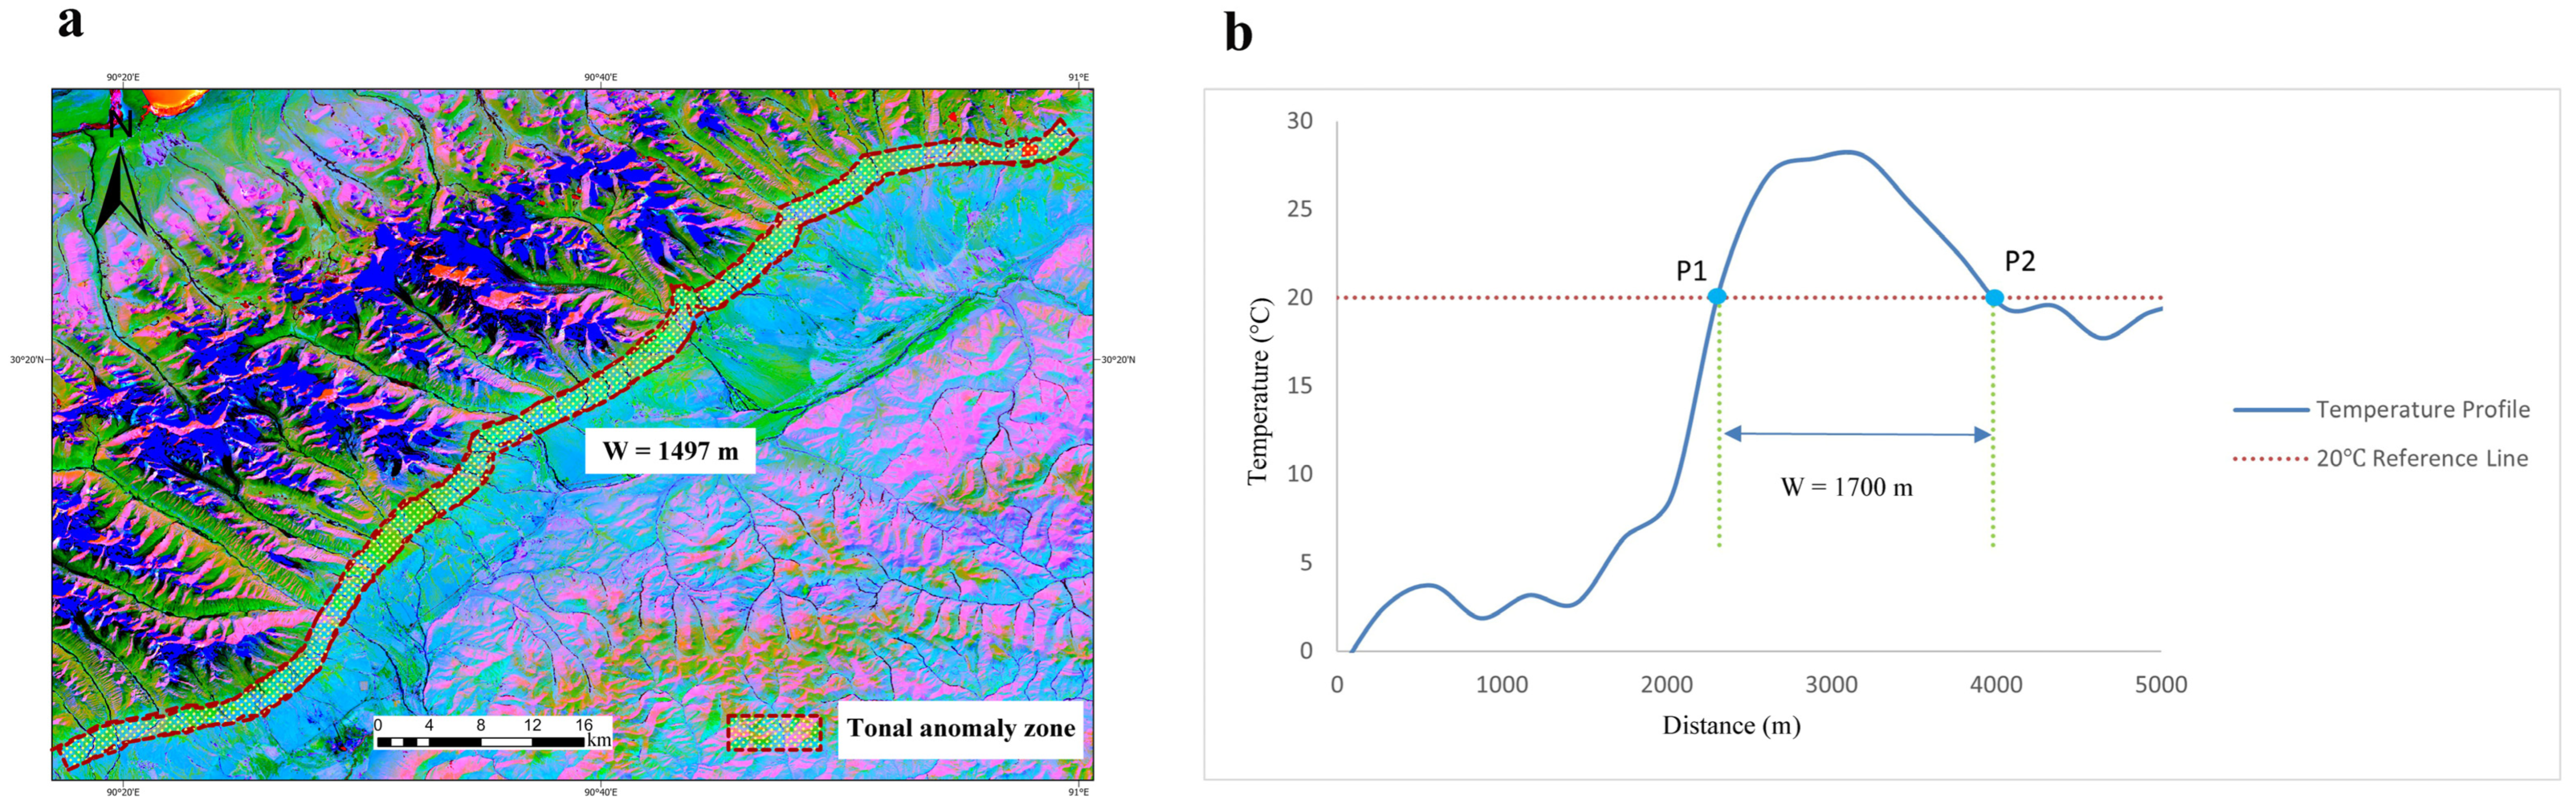
Tonal anomaly width was measured from the anomaly zones manually delineated from the Landsat-9 PCA imagery (Figure 6a). The lateral boundaries were identified from the visible tonal contrast between each anomaly zone and its surroundings. The cross-strike distance between these boundaries was used as the corresponding tonal anomaly width.
Figure 6.
Remote sensing anomaly-zone width measurements. (a) Tonal anomaly width in the Damxung segment, derived from PCA of Landsat-9 multispectral imagery; (b) thermal anomaly width in the Seni segment, derived from the Landsat-9 LST product.
Thermal anomaly width was estimated from discrete temperature profiles extracted from the Landsat-9 LST product. The 20 °C criterion was selected empirically by visually examining the contrast between local high-temperature zones and adjacent lower-temperature portions. For the original 20 °C measurement, two profile samples closest to the criterion were selected manually, and the distance between them was measured as the thermal anomaly width (Figure 6b). The criterion was used only to delineate the thermal expression in these profiles and was not treated as a physical fault-zone boundary.
The tonal anomaly widths of the Seni, Damxung, and Nyemo segments are 1729, 1497, and 1447 m, respectively, while the corresponding thermal anomaly widths are 1700, 1500, and 1400 m (Table 4, Panel b). Both measurements follow the same segment-wise ordering: widths are largest in Seni, intermediate in Damxung, and smallest in Nyemo.
In the FRSDO, the anomaly-width measurements and associated geomorphological evidence retain their individual definitions, data sources, interpretation or processing methods, and fault-segment assignments.
3.2.5. Motion Direction
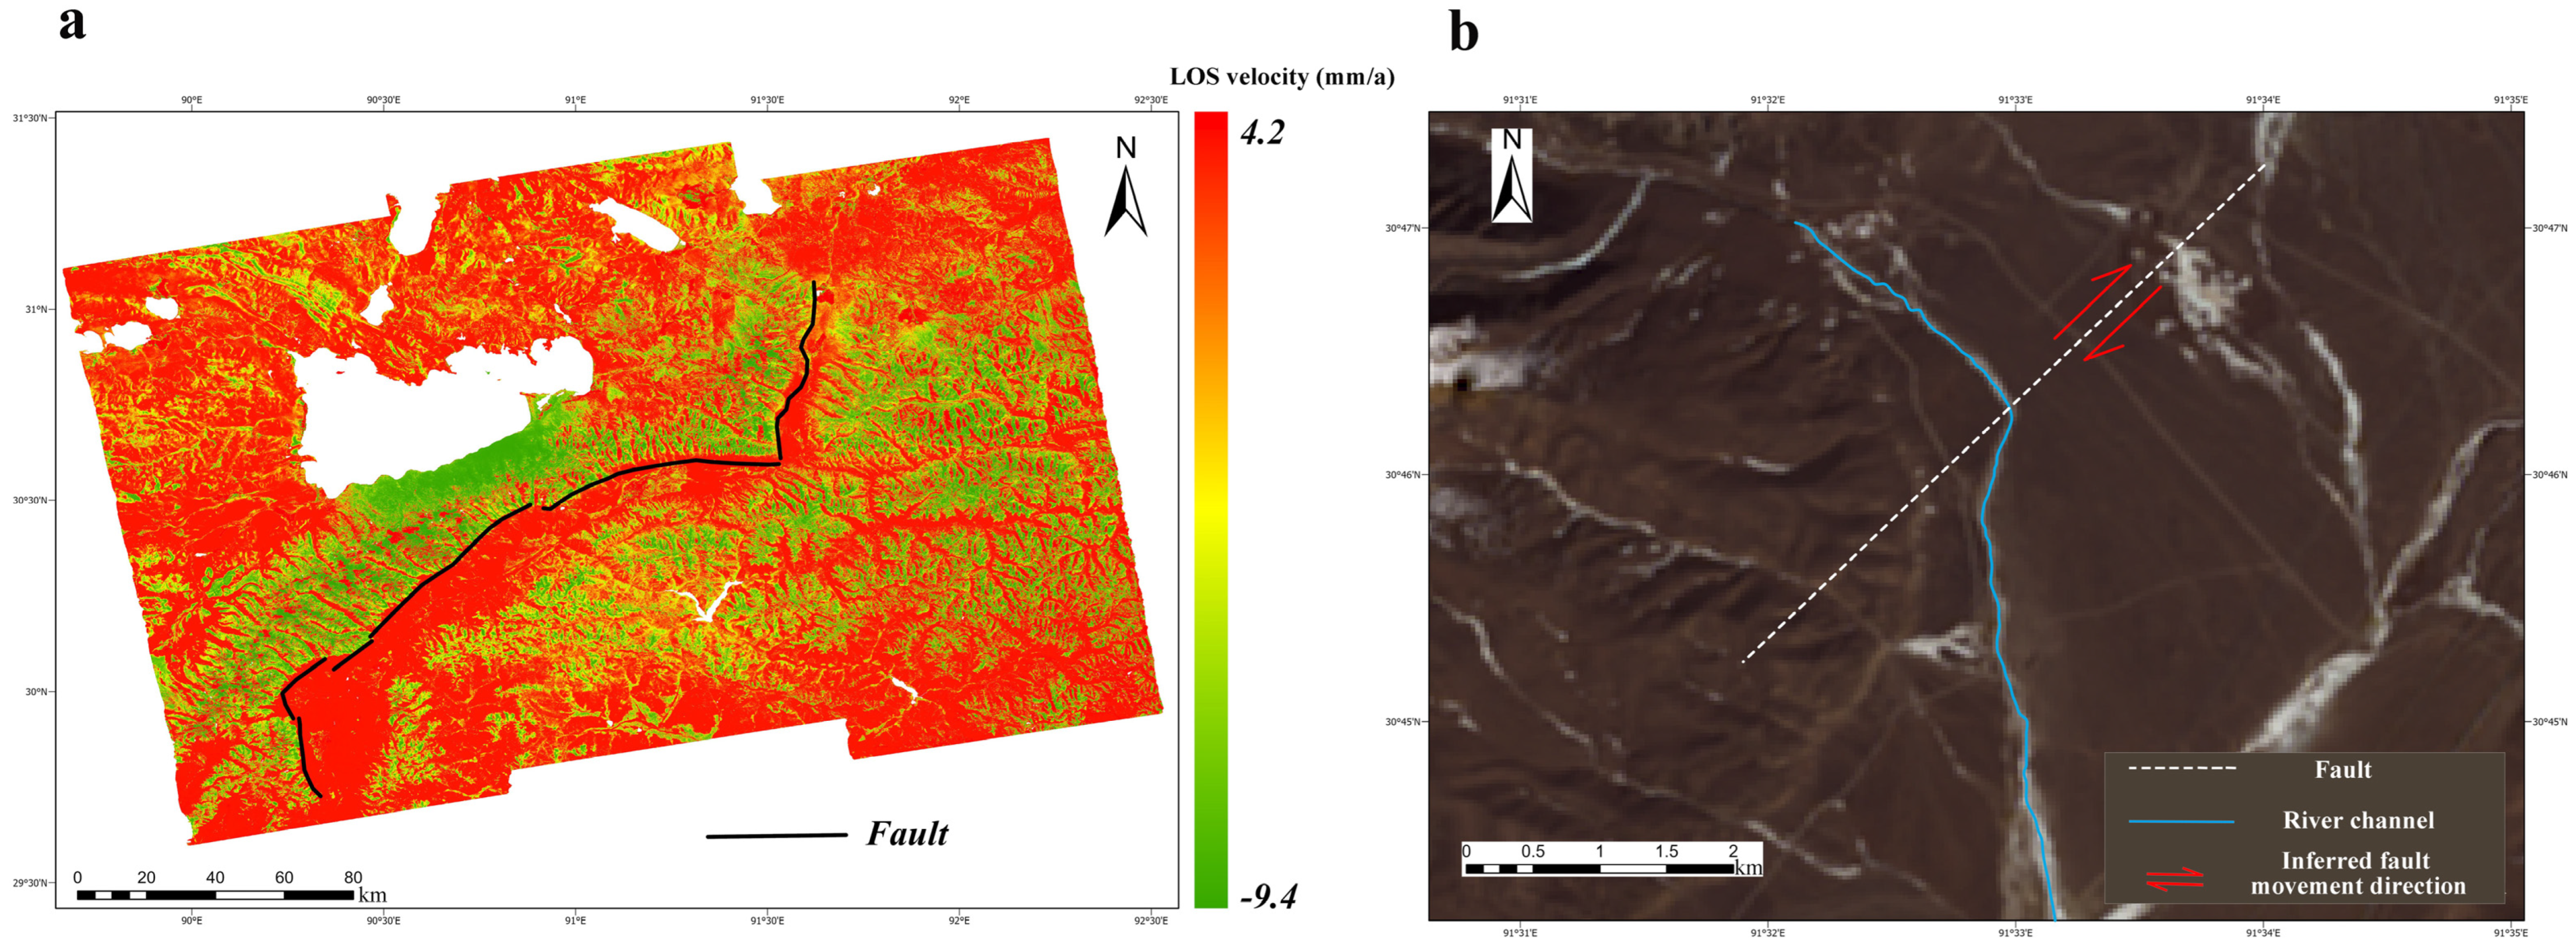
Motion direction was interpreted using the Small Baseline Subset Interferometric Synthetic Aperture Radar (SBAS-InSAR)-derived line-of-sight (LOS) velocity field [34] and geomorphological evidence (Figure 7). Positive LOS velocities indicate motion toward the satellite, whereas negative LOS velocities indicate motion away from the satellite. These velocities describe the component of surface motion projected onto the satellite line of sight. In the FRSDO, Surface Deformation is used as the main evidence category, and the LOS velocity pattern is treated as a feature instance supporting the fault-object-level motion-direction attribute. The LOS velocity field shows a clear deformation contrast across the middle and northern portions of the Yadong–Gulu Fault, with predominantly negative values on the western side and positive values on the eastern side. This spatial contrast provides an independent deformation constraint on the relative movement of the fault blocks.
Figure 7.
Motion-direction interpretation using SBAS-InSAR-derived LOS velocity and channel deflection. (a) LOS velocity field derived from Sentinel-1 SAR observations using the SBAS-InSAR technique. Positive LOS velocities indicate motion toward the satellite, whereas negative LOS velocities indicate motion away from the satellite. (b) Channel deflection near the fault trace, with red arrows indicating the inferred fault movement direction.
Geomorphological observations provide complementary evidence for interpreting the horizontal motion component. Several channels near the fault trace show systematic deflection patterns broadly consistent with dextral strike-slip motion [35] (Figure 7b). For the vertical component, the LOS deformation pattern was interpreted together with fault scarps and linear alluvial fan sequences. The western side shows a relative subsiding tendency, whereas the eastern side shows an uplifting tendency, a pattern consistent with a normal-faulting component. Taken together, the deformation and geomorphological evidence support an interpretation of coupled dextral strike-slip and normal-faulting motion along the middle and northern portions of the Yadong–Gulu Fault. In the FRSDO, this interpretation is retained together with its supporting deformation and geomorphological evidence.
Only ascending-orbit Sentinel-1 observations were used in this study, so the LOS velocities provide a single projection of surface motion and cannot independently separate horizontal and vertical components. The motion trends described above are therefore interpreted from the combined deformation and geomorphological evidence rather than from a uniquely resolved three-dimensional displacement field. Quantifying individual motion components would require additional viewing geometries or independent geodetic observations.
3.2.6. Geomorphological Response Indicators
Horizontal river displacement magnitude and DEM-derived slope-gradient response were used as descriptive geomorphological response indicators relevant to fault-motion interpretation. Channel deflections may preserve geomorphological expressions of cumulative horizontal displacement, whereas slope-gradient variations provide topographic context for interpreting possible fault-related deformation. Because the two indicators represent different processes and timescales, they are evaluated separately rather than combined into a single kinematic metric. In the FRSDO, both are assigned to the kinematic category at the fault-segment level and linked to their supporting data, with the relevant interpretation criteria associated with the corresponding feature instances.
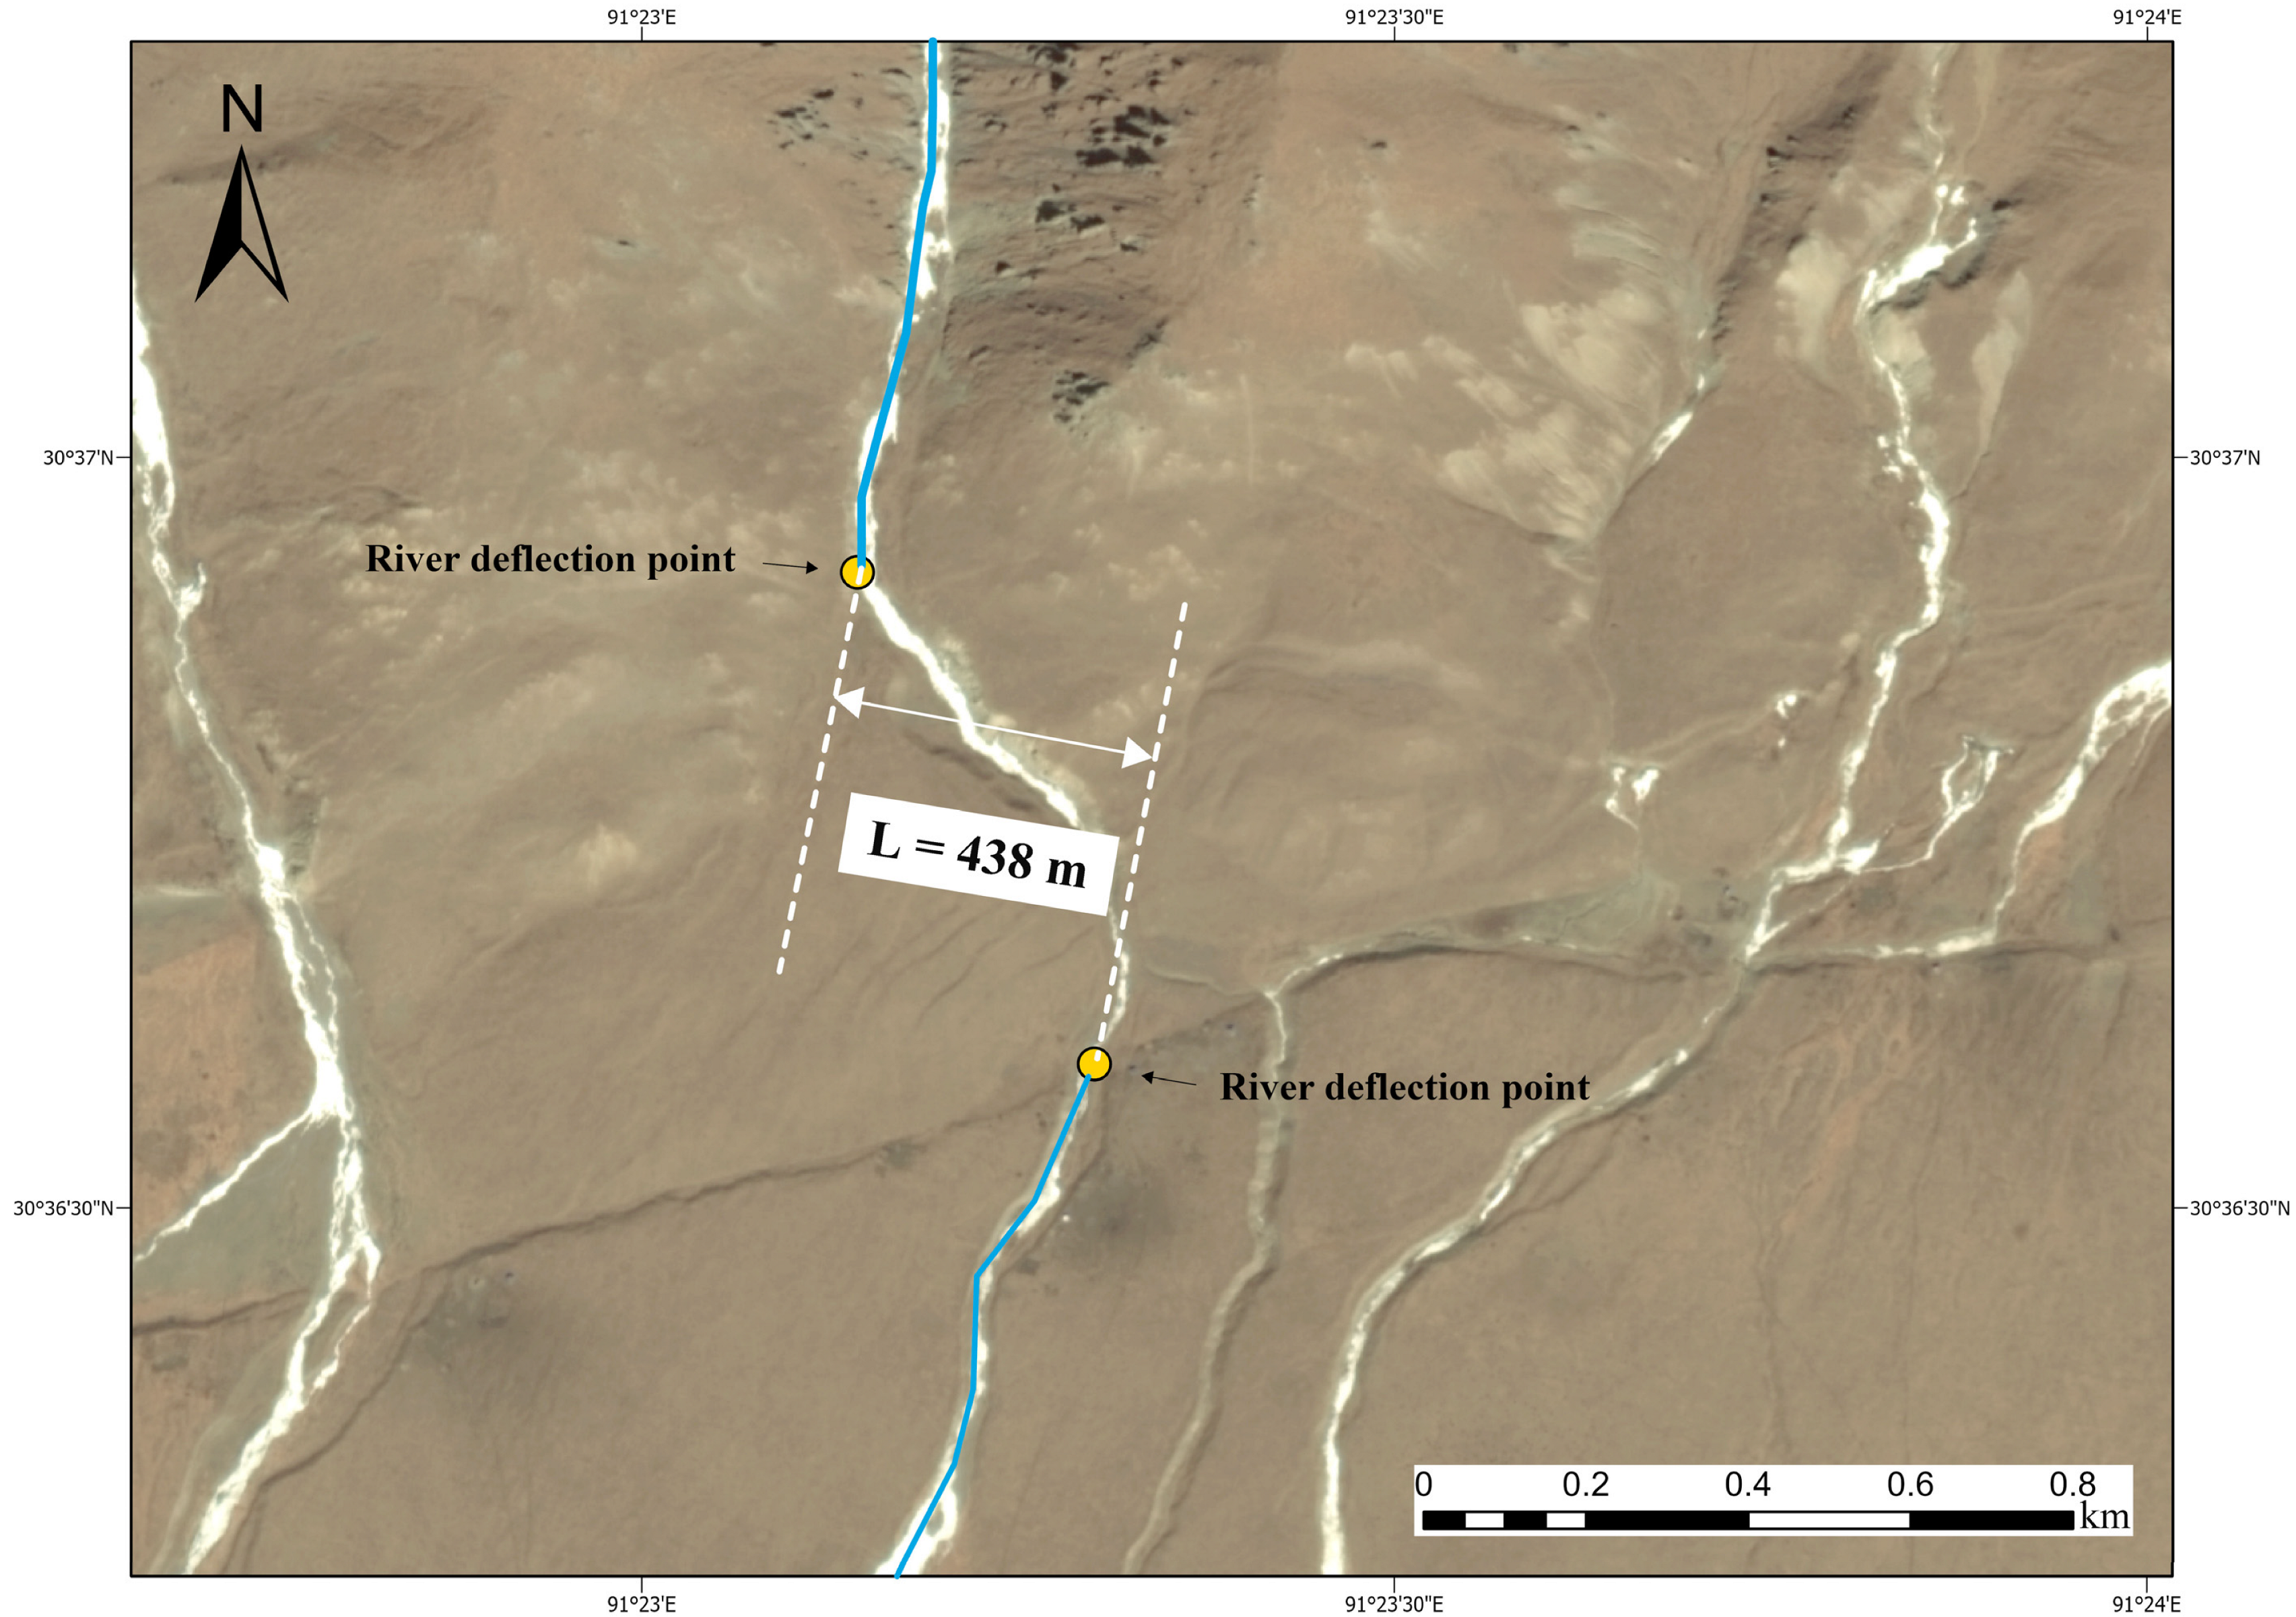
Horizontal river displacement magnitude was measured from channel deflections identified in GF-1/GF-6 fused imagery (Figure 8; Table 5). At each site, paired channel-deflection points were identified near the fault trace, and two approximately parallel reference lines were constructed through the corresponding points. The perpendicular distance between these reference lines was measured as the horizontal river displacement magnitude. This measurement is distinct from the river displacement extent described in Section 3.2.4, which represents the lateral width of the river-deflection zone. The measurements range from 438 to 2502 m, with the largest value at site A4 in the Damxung segment. Values of 2085 and 1986 m were measured at site A1 in the Seni segment and site A6 in the Nyemo segment, respectively.
Figure 8.
Measurement of horizontal river displacement magnitude at river site A3 in the Damxung segment, as a geomorphological response indicator for fault-motion interpretation. Paired channel-deflection points were identified near the fault trace, and the perpendicular distance between two approximately parallel reference lines was measured as the horizontal river displacement magnitude.
Table 5.
Horizontal river displacement magnitudes measured from channel deflections.
DEM-derived slope-gradient response was used to characterize topographic differences among the measured areas. The mean values are 17.1° for the Nyemo segment, 15.5° for the Damxung segment, and 7.9° for the Seni segment. The higher values in Nyemo and Damxung indicate steeper average slopes in the measured areas than in Seni. These differences describe spatial variations in the local topographic response and provide supporting geomorphological context for interpreting fault-related deformation.
These indicators do not directly estimate slip rate or differences in tectonic activity among fault segments. Their tectonic significance requires independent field and chronological constraints.
3.3. FRSDO Instantiation and Attribute Updating
3.3.1. Multi-Source Feature Instantiation
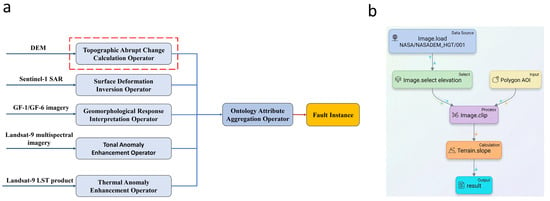
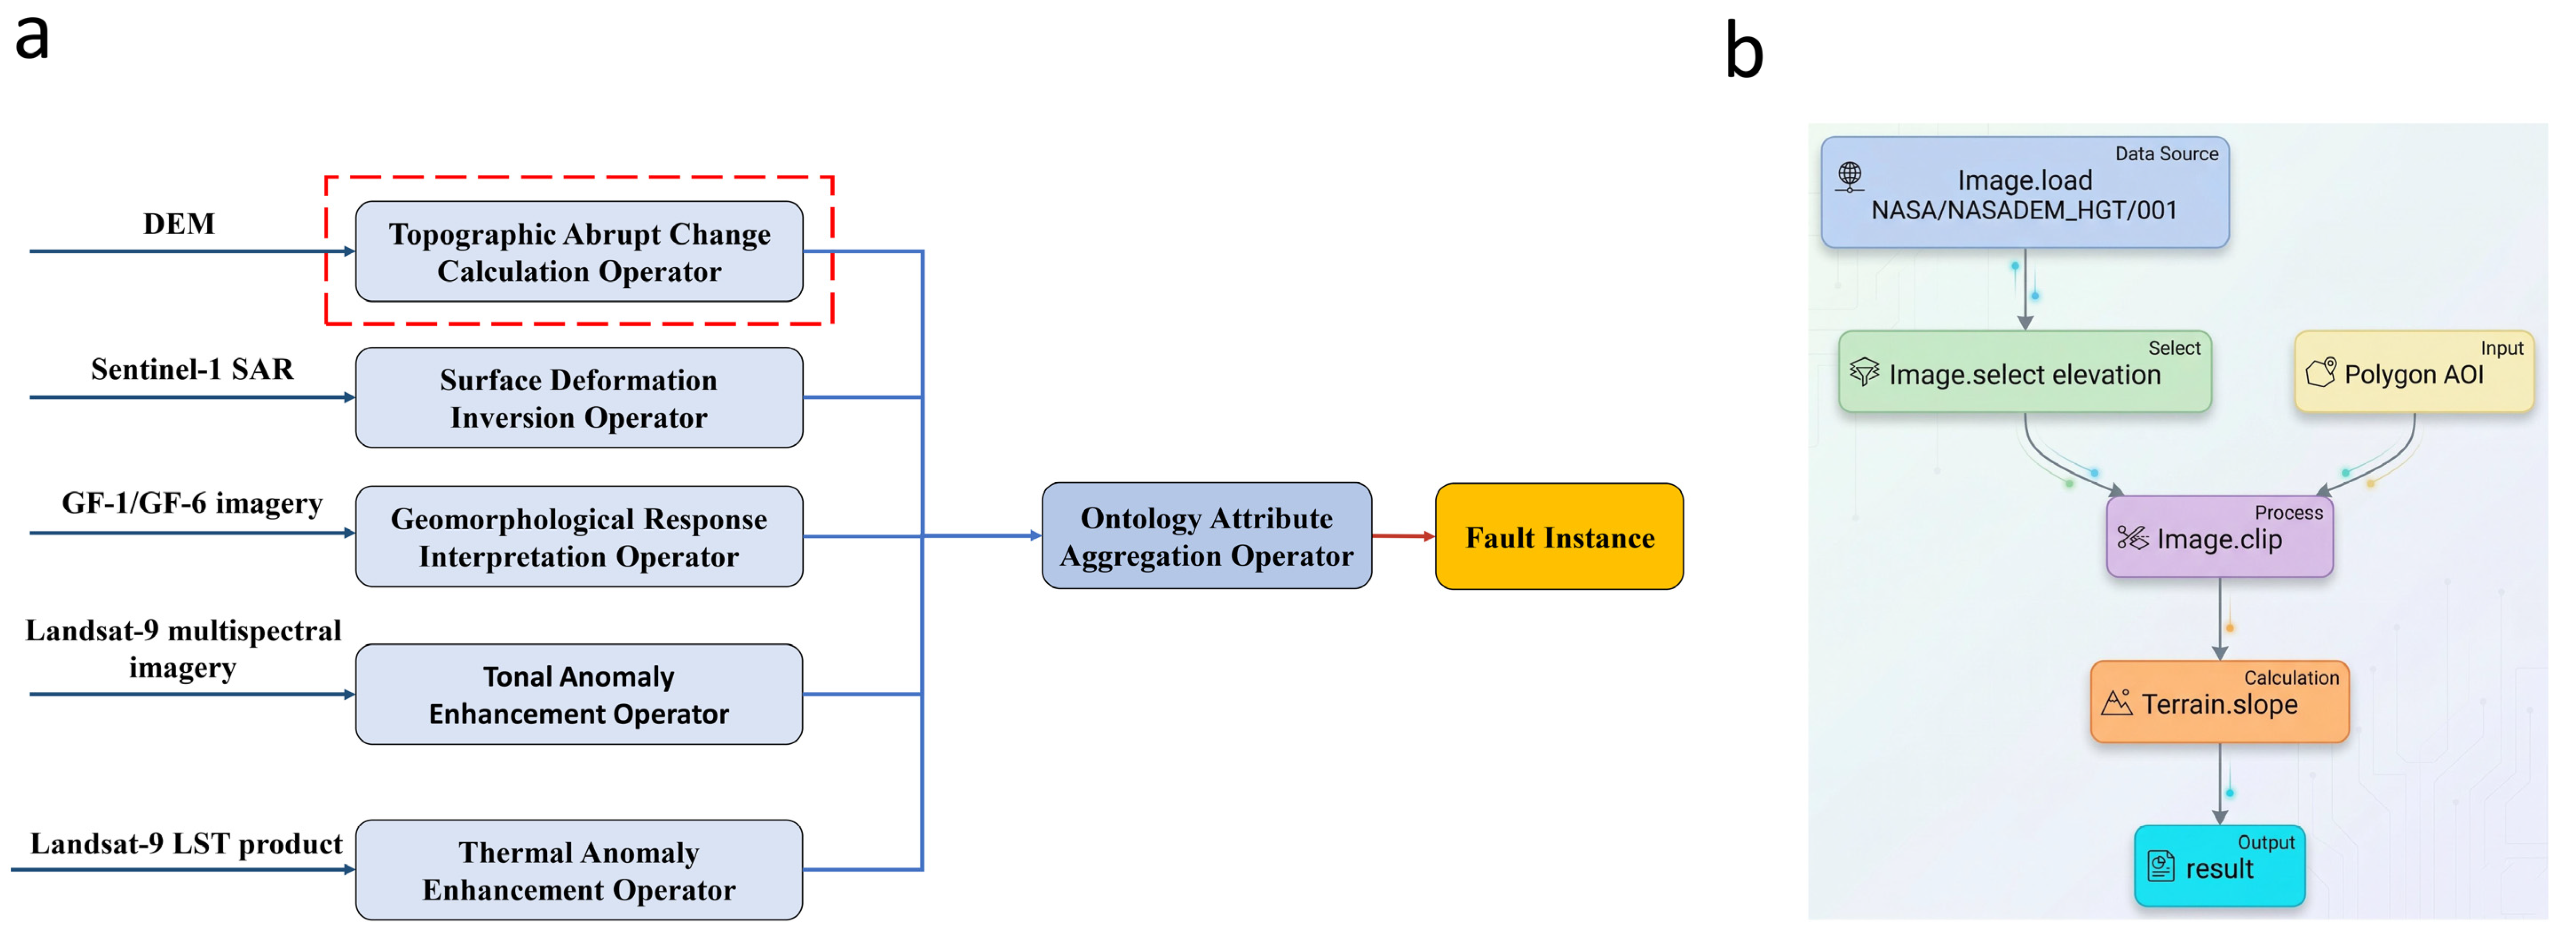
The feature instances derived from the remote sensing analyses and manual interpretations in Section 3.2.1, Section 3.2.2, Section 3.2.3, Section 3.2.4, Section 3.2.5 and Section 3.2.6 were instantiated in the FRSDO according to the hierarchical mapping rules in Table 2. Each feature instance was associated with the corresponding fault object or fault segment and the relevant fault attribute, together with links to its supporting observations and source datasets. Processing provenance was retained through the associated processing records and DAG dependencies, while, for manually interpreted features, the relevant interpretation criteria were associated with the corresponding feature instances. When multiple measurements supported the same attribute, they remained separately identifiable, preserving their individual measurement definitions and supporting evidence. The resulting DAG-based instantiation workflow is shown in Figure 9.
Figure 9.
DAG-based FRSDO instantiation workflow. (a) Overall workflow linking source datasets and processing operators, together with manually interpreted geomorphological response feature instances, to the ontology attribute aggregation operator and the FRSDO fault instance. The interpretation criteria for manually interpreted features are associated with the corresponding feature instances and are not represented as executable DAG operators. The dashed red box marks the topographic abrupt change calculation operator expanded in (b). (b) Micro-execution subgraph of the DEM-derived topographic abrupt change calculation operator, showing DEM loading, elevation-band selection, AOI clipping, and slope calculation to produce the slope layer used for subsequent manual interpretation of slope-break zones. The corresponding fault-object and fault-segment attribute mappings are summarized in Table 6.
As shown in Figure 9a, source datasets were linked to their corresponding processing branches or interpreted feature instances. Processing operators recorded their inputs, methods, and outputs, while manually interpreted geomorphological response feature instances retained links to their GF-1/GF-6 source imagery and associated interpretation criteria. The ontology attribute aggregation operator then associated these feature instances with the relevant fault-object or fault-segment attributes according to the hierarchical mapping rules in Table 2. The resulting representation retained each feature instance’s links to its supporting observations and source data, with processing provenance recorded through the DAG and associated processing records. For manually interpreted features, interpretation criteria were associated with the corresponding feature instances rather than represented as separate ontology components or executable DAG nodes. Measurements with different definitions therefore remained separately identifiable rather than being merged into a single value.
Figure 9b expands the DEM-derived topographic abrupt change operator into a micro-execution subgraph. DEM loading, elevation-band selection, AOI clipping, and slope calculation produce the slope layer used for subsequent manual interpretation of slope-break zones. In the instantiated FRSDO, the interpreted slope-break zones are linked to the fault-location attribute and, together with the thermal anomaly zones, support the segment-strike attribute. Their source layer and processing provenance are traceable through the DEM-processing branch of the DAG, while the interpretation criteria are associated with the corresponding slope-break feature instances. Changes in source data or processing steps can be traced through the DAG to identify the affected processing branch, whereas changes in interpretation criteria or delineation can be traced to the corresponding feature instances, which are then subject to manual review.
The workflow produced a case-specific FRSDO instance for the study area, comprising one fault object and three fault segments (Seni, Damxung, and Nyemo). Table 6 summarizes the mappings among source datasets, linked evidence or feature instances, fault attributes, instantiated entities, and ontology levels. Processing records for derived results remain linked through the DAG, whereas interpretation criteria for manually interpreted features are associated with the corresponding feature instances.
Table 6.
Instantiated fault attributes and linked evidence in the FRSDO.
For the Damxung segment, the tonal and thermal anomaly widths are 1497 and 1500 m, respectively (Table 4(b)). Although both are linked to the same segment-width attribute, they remain distinct feature instances with separate measurement definitions and evidence links. The tonal anomaly width was measured from the anomaly zone manually delineated in the Landsat-9 PCA imagery, whereas the thermal anomaly width was estimated from discrete temperature profiles extracted from the Landsat-9 LST product using the 20 °C boundary criterion described in Section 3.2.4. Their similar values do not make these measurements interchangeable or establish the physical width of the fault zone.
3.3.2. Validation of Thermal-Width Attribute Updating
To evaluate whether the FRSDO could identify affected dependency nodes, update the corresponding thermal-width records, preserve predefined nonthermal control records, and retain the required provenance information, an attribute-update experiment was conducted for the thermal anomaly widths of the Seni, Damxung, and Nyemo segments. The implementation used the feature, evidence, and processing-record types defined in the FRSDO and assigned the width measurements to the fault-segment level according to Table 2. The original manually measured widths in Table 4(b), obtained using the 20 °C criterion, were imported unchanged as the initial records. Two independent update trials were initiated separately from the same imported 20 °C records: one used a boundary-temperature threshold parameter set to 19 °C, and the other used the same parameter set to 21 °C for the same temperature profiles. Unlike the original manual point-selection procedure, the updated widths were recalculated using the explicit discrete-sample boundary-selection rule described below. In these trials, the 19 °C and 21 °C values were treated as input parameters of the predefined thermal-profile operators; the resulting estimates were recorded as updated measurements, while the original manually measured 20 °C records remained unchanged.
Each profile contained 21 temperature samples, with sample spacings of 290, 220, and 240 m for Seni, Damxung, and Nyemo, respectively. Updated widths were estimated directly from the sampled temperatures and distances without smoothing or interpolation. For each threshold setting, the contiguous interval at or above the threshold containing the highest-temperature sample was identified. At each boundary, the adjacent inside and outside samples were compared, and the sample with the smallest absolute temperature difference from the threshold was selected. Exact ties were resolved using the sample at the smaller along-profile distance. Because the selection is based on discrete samples, a selected boundary sample may lie slightly above or below the nominal threshold. The distance between the selected left and right samples defined the updated width.
The updated estimates are reported in Table 7. The initial 20 °C widths were obtained by manual point selection, whereas the 19 °C and 21 °C estimates were calculated using the discrete-sample boundary-selection rule described above. Differences between the initial and updated values therefore reflect both the revised temperature criteria and the change from manual point selection to the specified discrete-sample rule. These differences should not be interpreted as evidence of changes in the fault itself. The experiment evaluates the controlled updating of existing thermal-width records and their associated dependencies.
Table 7.
Original thermal anomaly width records and updated estimates for the three fault segments.
In each trial, the corresponding threshold setting was applied to all three profile-width branches. Dependency-based tracing identified 18 downstream nodes: nine processing or mapping operators and nine evidence, measurement, or attribute records. The nine record nodes comprised one boundary-evidence record, one thermal-width measurement instance, and one segment-level thermal-width attribute record for each of the Seni, Damxung, and Nyemo segments. All nine operators were executed, and the three segment-level thermal-width attribute records were updated. The original profiles, fault and segment identities, and archived manual measurements remained unchanged. The 12 predefined nonthermal records—three tonal anomaly widths, six horizontal river displacement magnitudes, and three mean slope-gradient responses—were treated as frozen control records: their original values and associated metadata were checked against the baseline and retained unchanged, and their original feature-extraction operators were not rerun in this experiment.
The relational comparator used the same inputs, discrete-sample boundary-selection rule, processing and mapping operators, dependency links, and provenance fields. Affected records were identified through a recursive dependency query. Across the six updated width estimates, the two implementations produced identical results, with a maximum absolute difference of 0 m. Both implementations retained all 12 predefined nonthermal control records in each trial and preserved all specified profile-level provenance fields for the three updated measurements (Table 8). These results demonstrate consistency in updating and record maintenance between the two implementations under the tested conditions, but do not establish a performance advantage of the FRSDO.
Table 8.
Update scope, record retention, and provenance checks for each update trial.
The predefined provenance fields included fault-segment assignment, measurement type and unit, source Excel file identifier and hash, worksheet, selected sample rows, distances and temperatures, temperature criterion, method identifier, script hash, record version, creation time, preceding measurement-record reference, and operator execution index. Together, these fields link each updated width estimate to its supporting samples and processing records. Validation was limited to the thermal-profile update branch and the specified nonthermal controls, with traceability assessed from the supplied profile tables to the updated segment-level attributes. The full remote sensing processing chain and original LST scene metadata were outside the scope of this experiment, and the experiment did not evaluate whether the temperature criterion represents a geological fault-zone boundary.
4. Discussion
4.1. Multi-Source Constraints and Interpretation of Fault Features
Remote sensing-derived fault features differ in physical meaning, spatial scale, and interpretation uncertainty. Fault deformation and subsequent landscape adjustment may modify drainage and ridge geometry. Fault-controlled relief and subsidence can also influence sediment transfer and alluvial fan development [31]. These processes explain why local geomorphological extents are relevant to fault-segment characterization. However, their mapped extents do not necessarily coincide with structural fault-zone boundaries. They provide context for the surface expression of a segment, while tonal and thermal anomaly widths remain separate measurements defined by their respective interpretation criteria.
Tonal anomalies can arise where faulting juxtaposes different rock units or produces fractured and altered materials that affect weathering, soil development, moisture, and vegetation. These surface differences may generate spectral contrasts that can be highlighted through PCA of multispectral imagery [36]. The linear continuity of the interpreted anomalies and their spatial correspondence with known fault structures support their interpretation as fault-related observations, although PCA alone cannot determine the origin of a spectral contrast. Tonal anomaly width therefore represents the mapped extent of the interpreted surface contrast rather than a physical fault-zone width.
Thermal anomalies near faults may reflect the influence of fractures and permeable zones on groundwater circulation and heat transfer [32]. Heated groundwater rising toward the shallow subsurface can transfer heat to surrounding materials and contribute to elevated surface temperatures, a process reported in the Damxung–Yangbajain basin [33]. Because LST is also influenced by solar radiation, terrain, and surface conditions, the thermal anomaly width reported from the original measurements represents the mapped temperature pattern delineated using the empirically selected 20 °C criterion, rather than a physical fault-zone boundary.
The reference fault vector was introduced only after the remote sensing results had been generated and was used for spatial comparison. Agreement in location, orientation, and mapped extent supports the association of the interpreted features with known fault structures, but does not by itself determine anomaly origin or positional accuracy.
Motion direction is interpreted from multiple lines of evidence. Channel deflection patterns record cumulative geomorphological responses but can be modified by erosion, deposition, lithology, and local topography. The SBAS-InSAR-derived LOS velocity field provides an independent deformation constraint, although the ascending-orbit observations cannot independently separate horizontal and vertical components or resolve the full three-dimensional displacement field. The combined deformation and geomorphological evidence supports an interpretation of coupled dextral strike-slip and normal-faulting motion along the middle and northern portions of the Yadong–Gulu Fault.
The Yadong–Gulu rift is primarily characterized by extensional and normal-faulting deformation [37], so channel-deflection measurements are treated here as supplementary evidence for possible local horizontal motion rather than as indicators of the dominant regional kinematics. Horizontal river displacement magnitude and slope-gradient response also represent different processes and timescales: channel deflections may preserve cumulative geomorphological changes, whereas slope gradients describe the terrain recorded in the DEM. They therefore remain distinct geomorphological lines of evidence that complement the LOS velocity field derived for the Sentinel-1 observation period but are not directly comparable with it. Assessing their tectonic significance or relating differences among segments to slip rate or tectonic activity requires independent field and chronological constraints.
4.2. Fault Feature Organization, Updating, and Comparison with Existing Approaches
Multi-source fault characterization produces measurements and manually interpreted features that differ in spatial meaning and rely on different supporting observations. Their organization therefore requires a representation that distinguishes fault attributes from the feature instances used to characterize them, while retaining the supporting observations and, where applicable, the interpretation criteria associated with each instance, rather than storing only final attribute values.
Existing approaches provide complementary capabilities for different aspects of fault-information management. At the spatial and record-management level, traditional geological maps represent fault geometries and selected attributes, whereas GIS platforms and relational databases organize spatial entities and associated records through spatial queries, related tables, keys, and metadata. With suitable schemas and application-level logic, they can also maintain record versions and trace dependencies. At the national database level, the China Active Faults Database (CAFD) integrates active-fault survey results and organizes fault traces, activity ages, and geometric and kinematic information [16]. Wu et al. [16] report that the CAFD database was transferred to the China Earthquake Disaster Prevention Center in 2019 in connection with the establishment of the Data Center for Seismic Active Fault Surveys. The Seismic Active Fault Survey Data Center’s Active Fault Distribution Map v1.0 provides map-based visualization, querying, and sharing of mapped active-fault information [38]. At the geological information-modeling level, GeoSciML supports structured geological descriptions and information exchange [15], while knowledge graphs represent semantic relationships among entities. For data provenance and process management, PROV-O describes data derivations and provenance relationships [39], whereas workflow systems such as Snakemake record processing dependencies and rerun affected tasks [40]. These approaches address complementary management tasks and can also be used in combination. For multi-source fault characterization, their application involves specifying how fault entities, remote sensing feature instances, measurement definitions, supporting evidence, and processing dependencies are related. Table 9 compares the roles of these approaches with that of the FRSDO.
Table 9.
Design comparison of approaches and resources relevant to organizing and updating multi-source fault features.
The case study illustrates how these relationships are applied to fault-feature organization. In the case representation, the middle and northern portions of the Yadong–Gulu Fault were modeled as one fault object comprising three segments (Seni, Damxung, and Nyemo). Fault location and motion direction were assigned at the fault-object level, whereas segment length, strike, width, and geomorphological-response indicators were assigned at the fault-segment level (Table 2 and Table 6). For the Damxung segment, the tonal and thermal anomaly widths (1497 and 1500 m, respectively) are associated with the same segment-width attribute as separate feature instances. Each retains its own measurement definition and evidence links; their similar values do not make them interchangeable or establish the physical width of the fault zone. The DAG links source data and processing operators to the resulting feature instances and associated fault attributes. When an input dataset or processing parameter changes, the recorded dependencies identify downstream processing steps, feature instances, and attributes that may be affected; processing-derived results can then be considered for recalculation. When interpretation criteria or the delineation of a manually interpreted feature changes, the corresponding feature instance is identified for manual review rather than automatic regeneration. The required update response therefore depends on how each feature instance was derived, rather than treating all affected records as requiring the same operation.
The distinction is therefore not that the FRSDO provides functions unavailable in existing database or workflow systems. Similar functions could be implemented in an extended GIS database or through a combination of a knowledge graph and a workflow system. The equivalent relational implementation in Section 3.3.2 further demonstrates that the tested update operations can also be implemented relationally, producing the same six updated width estimates under the tested conditions. The contribution of the FRSDO lies instead in an explicit, integrated, domain-specific specification of the relationships among fault objects and segments, feature instances, fault attributes, supporting evidence, and processing dependencies. This specification defines how feature instances are assigned to the fault-object or fault-segment level and how changes are handled differently for processing-derived results requiring recalculation and manually interpreted features requiring review. Accordingly, the contribution is one of domain-specific modeling and integration, rather than a new database operation or a demonstrated performance advantage. Table 9 presents a design-level comparison of these approaches, not a quantitative benchmark of computational efficiency, maintenance cost, or interpretation accuracy.
The thermal-width experiment provides a case-specific test of this updating mechanism. As detailed in Section 3.3.2, the FRSDO and the equivalent relational implementation identified the same affected downstream nodes, produced identical results across all six updated width estimates, and retained the predefined nonthermal control records and specified profile-level provenance fields. These results support the consistency of dependency-based updating and record maintenance under the tested conditions.
The case study primarily demonstrates how the FRSDO organizes and updates remote sensing-derived fault features, rather than proposing a new tectonic interpretation of the Yadong–Gulu Fault. The update validation was limited to controlled record updating in the implemented thermal-profile branch and the predefined nonthermal control records; it did not cover the full upstream remote sensing processing chain or assess whether the temperature criterion delineates a geological fault-zone boundary. Further evaluation across other feature types, datasets, interpretation revisions, and fault systems is needed.
5. Conclusions
This study characterized the middle and northern portions of the Yadong–Gulu Fault using multi-source remote sensing observations and developed the FRSDO to organize remote sensing-derived fault features and their relationships to supporting observations, processing records, and fault attributes, while supporting controlled dependency-based updating of affected feature instances and attributes. The main conclusions are as follows.
(1) The FRSDO provides a domain-specific framework for organizing remote sensing-derived fault features and their relationships to fault objects and segments, supporting observations, processing records, and associated fault attributes. Its hierarchical mapping rules assign feature instances to the fault-object or fault-segment level according to the spatial scope of the attributes they support. The DAG records input–output dependencies linking data sources and processing operators to feature instances and their associated fault attributes. Together, these structures preserve feature definitions and provenance links. When source data or processing parameters change, the DAG dependencies are traversed to identify affected downstream processing operators, feature instances, and associated fault attributes for recomputation. By contrast, when interpretation criteria or the delineation of a manually interpreted feature changes, the associated interpretation information identifies the feature instance requiring review, while the feature-to-attribute mapping identifies the fault attribute it supports. The feature is then subject to manual review rather than automatic regeneration. Confirmed revisions are reflected in the affected feature instances and associated fault attributes, while records outside the affected processing branches or manual-review scope are retained.
(2) Multi-source observations provided complementary evidence for characterizing fault location and segment geometry and for interpreting motion-related features along the middle and northern portions of the Yadong–Gulu Fault. DEM-derived slope-break zones, tonal and thermal anomaly zones, LOS deformation, and local geomorphological observations contributed different types of evidence at different spatial levels. The FRSDO organized these features with their individual measurement definitions, spatial assignments, and supporting records. In particular, tonal and thermal anomaly widths remained separate measurements, while local geomorphological extents and motion-related indicators retained their distinct physical meanings. Tonal and thermal anomaly widths and local geomorphological extents should not be treated as direct measures of physical fault-zone width. Horizontal river displacement magnitude and DEM-derived slope-gradient response provide descriptive geomorphological evidence rather than direct estimates of slip rate or tectonic activity.
(3) The thermal-width update experiment provided a case-specific validation of dependency-based attribute updating in the implemented thermal-profile branch. In each of the two update trials, dependency-based tracing identified 18 affected downstream nodes, comprising nine processing or mapping operators and nine evidence, measurement, or attribute records. All nine operators were executed, and three segment-level thermal-width attribute records were updated. Both the FRSDO and the equivalent relational implementation retained all 12 predefined nonthermal control records in each trial and preserved all specified profile-level provenance fields for the three updated measurements. The two implementations produced identical values for all six updated width estimates, with a maximum absolute difference of 0 m. This comparison demonstrates consistency in update results and record maintenance under the tested conditions, but does not establish advantages in computational performance, maintenance cost, or geological interpretation accuracy for the FRSDO.
The validation was confined to updating the implemented thermal-profile branch and checking the retention of predefined nonthermal control records and the specified profile-level provenance fields; the full remote sensing processing chain was not tested. Further work should evaluate the framework across other fault-feature types, data sources, and fault systems and investigate further automation of feature extraction, interpretation-record management, and attribute updating.
Author Contributions
Conceptualization, Z.L. and J.W.; methodology, Z.L.; software, L.S.; validation, J.C.; formal analysis, Z.L.; investigation, Z.L. and J.C.; resources, J.W.; data curation, Z.L. and J.C.; writing—original draft preparation, Z.L.; writing—review and editing, T.F. and J.W.; visualization, Z.L., T.F. and J.W.; supervision, L.S. and J.W.; project administration, L.S. and J.W.; funding acquisition, J.W. All authors have read and agreed to the published version of the manuscript.
Funding
This research was funded by the Department of Science and Technology of Hebei Province, grant number 252Y5402D.
Institutional Review Board Statement
Not applicable.
Informed Consent Statement
Not applicable.
Data Availability Statement
The 2023 Landsat-9 multispectral imagery and land surface temperature (LST) products are available from the USGS GloVis platform (http://glovis.usgs.gov/(accessed on 1 November 2026)). Sentinel-1 SAR imagery is available from the NASA Alaska Satellite Facility Distributed Active Archive Center (https://search.asf.alaska.edu/(accessed on 1 November 2026)). NASADEM digital elevation model (DEM) data are openly available from NASA Earthdata (https://earthdata.nasa.gov/(accessed on 1 November 2026)). The Yadong–Gulu Fault vector data are publicly accessible through the Seismic Active Fault Survey Data Center (https://www.activefault-datacenter.cn/map(accessed on 1 November 2026)). The GF-1/GF-6 fused imagery cannot be made publicly available due to third-party restrictions. The multi-source remote sensing data-processing scripts, visualization pipelines, and structured DAG output results are available at https://github.com/Wulala816/RS-Fault-Ontology(accessed on 1 November 2026).
Acknowledgments
The authors are grateful to Jiahe Wang and Dayong Zhu for their helpful discussions and technical support during data processing and analysis. During the preparation of this manuscript, the authors usedGoogle Gemini(Gemini 2.5 Pro) andOpenAI ChatGPT (GPT-6) for the purposes of grammar correction, language editing, and structural refinement. The authors have reviewed and edited the output and take full responsibility for the content of this publication.
Conflicts of Interest
Tong Feng is employed by Guojiao Space Information Technology (Beijing) Co., Ltd. The remaining authors declare no conflicts of interest.
Abbreviations
The following abbreviations are used in this manuscript:
| FRSDO | Fault Remote Sensing Dynamic Ontology |
| DAG | Directed Acyclic Graph |
| GIS | Geographic Information System |
| DEM | Digital Elevation Model |
| LST | Land Surface Temperature |
| SAR | Synthetic Aperture Radar |
| PCA | Principal Component Analysis |
| SBAS-InSAR | Small Baseline Subset Interferometric Synthetic Aperture Radar |
| LOS | Line of Sight |
| AOI | Area of Interest |
References
- Peacock, D.C.P.; Knipe, R.J.; Sanderson, D.J. Glossary of normal faults. J. Struct. Geol. 2000, 22, 291–305. [Google Scholar] [CrossRef] [Scilit]
- Barnhart, W.D.; Gold, R.D.; Hollingsworth, J. Localized fault-zone dilatancy and surface inelasticity of the 2019 Ridgecrest earthquakes. Nat. Geosci. 2020, 13, 699–704. [Google Scholar] [CrossRef] [Scilit]
- Xu, S.Q.; Fukuyama, E.; Yamashita, F.; Kawakata, H.; Mizoguchi, K.; Takizawa, S. Fault strength and rupture process controlled by fault surface topography. Nat. Geosci. 2023, 16, 94–100. [Google Scholar] [CrossRef] [Scilit]
- Li, Y.H.; Wu, Z.H.; Ye, P.S.; Ma, D.; Liu, Y.H.; Jiang, Y.; Li, J.C.; Zhou, C.J. The geomorphologic and geological marks of the active left-lateral strike-slip fault and the characteristics of geometry and kinematics along the Yushu fault zone in southeastern Xizang. Geol. Bull. China 2013, 32, 1410–1422. [Google Scholar]
- Wei, Y.M.; Wei, X.H.; Li, D.W.; Chen, Y.; Shen, X.M.; Sun, C.B. Remote sensing imagery features and activity analyses of Heqing-Eryuan Fault Zone in the northwestern area of Yunnan Province. Quat. Sci. 2017, 37, 234–249. Available online: https://html.rhhz.net/DSJYJ/20170203.htm (accessed on 1 November 2026). [CrossRef]
- Wu, Z.H.; Zhang, X.D.; Han, S.; Shi, Y.R.; Gao, Y.; Ye, Q.; Nima, C. Quaternary faulting and deformation mechanism of the western Qiangtang Block in northern Ngari, Tibet. Acta Geol. Sin. 2022, 96, 3760–3783. [Google Scholar] [CrossRef]
- Wei, Y.M.; Lin, Q.Z.; Xiao, S.; Chen, Y.; Wang, Q.J.; Liu, Q.J.; Wei, X.H. Remote sensing identification of geological structures at different scales in Western Junggar, Xinjiang and its prospecting significance. Geotecton. Metallog. 2015, 39, 76–92. [Google Scholar] [CrossRef]
- Brozzetti, F.; Cirillo, D.; de Nardis, R.; Cardinali, M.; Lavecchia, G.; Orecchio, B.; Presti, D.; Totaro, C. Newly identified active faults in the Pollino seismic gap, southern Italy, and their seismotectonic significance. J. Struct. Geol. 2017, 94, 13–31. [Google Scholar] [CrossRef] [Scilit]
- Kashani, R.; Partabian, A.; Nourbakhsh, A. Tectonic implication of geomorphometric analyses along the Saravan Fault: Evidence of a difference in tectonic movements between the Sistan Suture Zone and Makran Mountain Belt. J. Mt. Sci. 2019, 16, 1023–1034. [Google Scholar] [CrossRef] [Scilit]
- Li, P.P.; Chen, G.X.; Liu, S.D.; Li, Z.C.; Xue, Z.L.; Lu, M.Y. Identification of fault structures in GF-1 remote sensing image and its application in 3D geological modeling. J. Hefei Univ. Technol. Nat. Sci. 2020, 43, 680–687. [Google Scholar] [CrossRef]
- He, M.; Zhang, J.F.; Wei, J.C.; Luo, Y.; Wang, X.; Xia, R.; Ge, F.G.; Yang, B. Fine interpretation of faults in the Eastern Graben of Yishu Fault Zone from multi-source remote sensing images. Earthquake 2022, 42, 137–148. [Google Scholar] [CrossRef]
- Zhang, Z.W.; Fu, B.H.; Awata, Y. Late Quaternary systematic stream offsets along the Fuyun right-lateral strike-slip fault, Altay Mountains, China. Quat. Sci. 2008, 28, 273–279. [Google Scholar]
- Ma, D.; Wu, Z.H.; Li, J.C.; Li, Y.H.; Jiang, Y.; Liu, Y.H.; Zhou, C.J. Geometric distribution and Quaternary activity of Litang active fault zone based on remote sensing. Acta Geol. Sin. 2014, 88, 1417–1435. [Google Scholar] [CrossRef]
- Huang, S.T.; Tian, Q.J.; Li, Z.M.; Li, W.Q.; Fu, G.C.; Yin, X. Interpretation of high-resolution remote sensing image of offset landform in Dezhou segment of the Riyueshan Fault, Qinghai Province. Earthquake 2016, 36, 87–98. [Google Scholar]
- Open Geospatial Consortium. OGC Geoscience Markup Language 4.1 (GeoSciML), OGC Document 16-008. 2017. Available online: https://docs.ogc.org/is/16-008/16-008.html (accessed on 7 October 2026).
- Wu, X.; Xu, X.; Yu, G.; Ren, J.; Yang, X.; Chen, G.; Xu, C.; Du, K.; Huang, X.; Yang, H.; et al. The China Active Faults Database (CAFD) and its web system. Earth Syst. Sci. Data 2024, 16, 3391–3417. [Google Scholar] [CrossRef] [Scilit]
- Gruber, T.R. A translation approach to portable ontology specifications. Knowl. Acquis. 1993, 5, 199–220. [Google Scholar] [CrossRef] [Scilit]
- Sun, S.; Wang, L.; Ranjan, R.; Wu, A. Semantic analysis and retrieval of spatial data based on the uncertain ontology model in Digital Earth. Int. J. Digit. Earth 2015, 8, 3–16. [Google Scholar] [CrossRef] [Scilit]
- Flouris, G.; Manakanatas, D.; Kondylakis, H.; Plexousakis, D.; Antoniou, G. Ontology change: Classification and survey. Knowl. Eng. Rev. 2008, 23, 117–152. [Google Scholar] [CrossRef] [Scilit]
- Wang, N.; Jiang, Z.H. Research overview on dynamic ontology construction at home and abroad. J. Mod. Inf. 2020, 40, 159–166. [Google Scholar] [CrossRef]
- Shi, M.; Janowicz, K.; Liu, Z.; Karimi, M.; Majic, I.; Fortacz, A. The geography of evolving concepts: Quantifying spatial, temporal, and semantic consequences of ontology changes. Int. J. Digit. Earth 2026, 19, 2605865. [Google Scholar] [CrossRef] [Scilit]
- Molnar, P.; Tapponnier, P. Active tectonics of Tibet. J. Geophys. Res. 1978, 83, 5361–5375. [Google Scholar] [CrossRef] [Scilit]
- Li, J.J.; Wen, S.X.; Zhang, Q.S.; Wang, F.B.; Zheng, B.X.; Li, B.Y. Discussion on the age, amplitude and pattern of the Qinghai-Xizang Plateau uplift. Sci. Sin. 1979, 9, 608–616. [Google Scholar]
- Molnar, P.; England, P.; Martinod, J. Mantle dynamics, uplift of the Tibetan Plateau, and the Indian Monsoon. Rev. Geophys. 1993, 31, 357–396. [Google Scholar] [CrossRef] [Scilit]
- Armijo, R.; Tapponnier, P.; Mercier, J.L.; Han, T.L. Quaternary extension in southern Tibet: Field observations and tectonic implications. J. Geophys. Res. 1986, 91, 13803–13872. [Google Scholar] [CrossRef] [Scilit]
- Chen, Q.; Freymueller, J.T.; Wang, Q.; Yang, Z.; Xu, C.; Liu, J. A deforming block model for the present-day tectonics of Tibet. J. Geophys. Res. 2004, 109, B01403. [Google Scholar] [CrossRef] [Scilit]
- Tian, Z.; Yang, Z.Q.; Bendick, R.; Zhao, J.L.; Wang, S.D.; Wu, X.L.; Shi, Y.Q. Present-day distribution of deformation around the southern Tibetan Plateau revealed by geodetic and seismic observations. J. Asian Earth Sci. 2019, 171, 321–333. [Google Scholar] [CrossRef] [Scilit]
- Liu, Z.; Tian, X.B.; Yuan, X.H.; Liang, X.F.; Chen, Y.; Zhu, G.H.; Zhang, H.S.; Li, W.; Tan, P.; Zuo, S.C.; et al. Complex structure of upper mantle beneath the Yadong-Gulu Rift in Tibet revealed by S-to-P converted waves. Earth Planet. Sci. Lett. 2020, 531, 115954. [Google Scholar] [CrossRef] [Scilit]
- Bian, S.; Gong, J.F.; Zuza, A.V.; Yang, R.; Chen, L.; Ji, J.Q.; Yu, X.J.; Tian, Y.H.; Yu, Z.Q.; Cheng, X.G.; et al. Along-strike variation in the initiation timing of the north-trending rifts in southern Tibet as revealed from the Yadong-Gulu rift. Tectonics 2022, 41, e2021TC007091. [Google Scholar] [CrossRef] [Scilit]
- Ha, G.H.; Wu, Z.H.; Liu, F. Late Quaternary vertical slip rates along the Southern Yadong–Gulu Rift, Southern Tibetan Plateau. Tectonophysics 2019, 755, 75–90. [Google Scholar] [CrossRef] [Scilit]
- Whipple, K.X.; Trayler, C.R. Tectonic control of fan size: The importance of spatially variable subsidence rates. Basin Res. 1996, 8, 351–366. [Google Scholar] [CrossRef] [Scilit]
- Caine, J.S.; Evans, J.P.; Forster, C.B. Fault zone architecture and permeability structure. Geology 1996, 24, 1025–1028. [Google Scholar] [CrossRef] [Scilit]
- Li, X.; Jiang, G.; Tang, X.; Zuo, Y.; Hu, S.; Zhang, C.; Wang, Y.; Wang, Y.; Zheng, L. Detecting Geothermal Anomalies Using Multi-Temporal Thermal Infrared Remote Sensing Data in the Damxung–Yangbajain Basin, Qinghai–Tibet Plateau. Remote Sens. 2023, 15, 4473. [Google Scholar] [CrossRef] [Scilit]
- Cai, J.A.; Ming, D.P.; Liu, F.; Ling, X.; Liu, N.J.; Zhang, L.; Xu, L.; Li, Y.; Zhu, M.Y. Change detection of slow-moving landslide with multi-source SBAS-InSAR and Light-U2Net. Int. J. Appl. Earth Obs. Geoinf. 2025, 136, 104387. [Google Scholar] [CrossRef] [Scilit]
- Xie, X.P.; Bai, M.W.; Chen, Z.C.; Liu, W.B.; Xi, S.N. Remote sensing image interpretation and tectonic activity study of the active faults along the northeastern segment of the Longmenshan Fault. Remote Sens. Nat. Resour. 2019, 31, 237–246. [Google Scholar] [CrossRef]
- Árvai, V.; Albert, G. Lightweight Deep Learning Approaches for Lithological Mapping in Vegetated Terrains of the Vălioara Valley, Romania. ISPRS Int. J. Geo-Inf. 2025, 14, 350. [Google Scholar] [CrossRef] [Scilit]
- Chevalier, M.-L.; Tapponnier, P.; van der Woerd, J.; Leloup, P.H.; Wang, S.; Pan, J.; Bai, M.; Kali, E.; Liu, X.; Li, H. Late Quaternary Extension Rates Across the Northern Half of the Yadong–Gulu Rift: Implication for East–West Extension in Southern Tibet. J. Geophys. Res. Solid Earth 2020, 125, e2019JB019106. [Google Scholar] [CrossRef] [Scilit]
- Seismic Active Fault Survey Data Center. Active Fault Distribution Map v1.0. Available online: https://www.activefault-datacenter.cn/map (accessed on 30 October 2026). (In Chinese)
- Lebo, T.; Sahoo, S.; McGuinness, D. (Eds.) PROV-O: The PROV Ontology. W3C Recommendation. 2013. Available online: https://www.w3.org/TR/prov-o/ (accessed on 7 October 2026).
- Mölder, F.; Jablonski, K.P.; Letcher, B.; Hall, M.B.; Tomkins-Tinch, C.H.; Sochat, V.; Forster, J.; Lee, S.; Twardziok, S.O.; Kanitz, A.; et al. Sustainable data analysis with Snakemake. F1000Research 2021, 10, 33. [Google Scholar] [CrossRef] [Scilit]

Disclaimer/Publisher’s Note: The statements, opinions and data contained in all publications are solely those of the individual author(s) and contributor(s) and not of MDPI and/or the editor(s). MDPI and/or the editor(s) disclaim responsibility for any injury to people or property resulting from any ideas, methods, instructions or products referred to in the content. |
© 2026 by the authors. Licensee MDPI, Basel, Switzerland. This article is an open access article distributed under the terms and conditions of the Creative Commons Attribution (CC BY) license.