


Highlights
What are the main findings?
- A 1993–2024 multi-mission DInSAR record confirms persistent deformation patterns at Somma–Vesuvio and reveals a distinct post-2001 regime that persists, with temporal modulation, through 2024.
- Variational Bayesian ICA separates volcanic deformation from shallow and anthropogenic signals, identifying a circum-Vesuvian subsidence transient, groundwater-related deformation in eastern Naples, and a post-2001 volcanic subsidence pattern.
What are the implications of the main findings?
- Long-term DInSAR time series can disentangle superimposed volcanic, hydrogeological, and shallow deformation processes that may be difficult to distinguish in shorter datasets.
- The persistent post-2001 deformation and its consistency with independent geophysical observations support a long-term change in the volcanic system and motivate further modelling of its deep source.
Abstract
We analyse three decades of ground displacement time series at Somma–Vesuvio volcano (Italy), derived from a multi-mission Differential Interferometric Synthetic Aperture Radar (DInSAR) dataset combining ERS/ENVISAT (1993–2010), RADARSAT-2 (2010–2015), and Sentinel-1 (2015–2024) acquisitions. The DInSAR measurements are referenced to a site at Marigliano, approximately 12 km north of the summit, and are validated against continuous GNSS observations and analysed at representative sites spanning the summit area, the circum-Vesuvian ring, eastern Naples, and the volcanic apron. In addition, we apply Variational Bayesian Independent Component Analysis jointly to quasi-vertical and eastward displacements within 16 km of the summit. The results identify (i) a spatially confined, exponentially decaying subsidence transient along the circum-Vesuvian ring, previously identified from shorter ERS/ENVISAT time series; (ii) deformation in eastern Naples consistent with post-industrial groundwater rebound; (iii) a marked change in the regional deformation regime around 2001–2002, also previously identified from shorter ERS/ENVISAT time series; and (iv) a progressive subsidence slowdown after approximately 2014–2015, particularly along the southern flank. Together, the spatial and temporal coherence of these signals with published seismic, tilt, fumarolic, and groundwater–geochemical observations supports the interpretation of a persistent deep-seated contribution to the long-term deformation of the volcano, while the vbICA decomposition demonstrates that substantial shallow and anthropogenic contributions are superimposed on the volcanic signal. More generally, the results show that long-term multi-mission DInSAR combined with statistical source separation can help disentangle coexisting deformation processes in complex volcanic environments.
1. Introduction
Somma–Vesuvio is one of the most densely populated and hazardous volcanic areas in the world, with hundreds of thousands of people living in areas historically affected by its most explosive eruptions [1]. Continuous, long-term monitoring of surface deformation is therefore essential both to investigate the dynamics of the shallow and deep magmatic-hydrothermal system and to support volcanic hazard assessment in a densely urbanised environment extending into the eastern periphery of Naples.
Differential Interferometric Synthetic Aperture Radar (DInSAR) has become a key tool in volcano geodesy, providing spatially dense measurements that complement the spatially sparser observations from continuous GNSS networks (e. g., [2,3]). At Somma–Vesuvio, however, deformation rates are generally small compared with those observed at other actively deforming volcanic systems, such as the nearby Campi Flegrei (e. g., [4,5]).
Using ERS observations spanning 1992–2000, ref. [6] identified several localised areas of pronounced subsidence along a circum-Vesuvian ring. Analysis of ERS data acquired between 1992 and 2001 by [4] confirmed these subsiding areas and additionally revealed uplift rates of 1–3 mm/year along the northern apron of Somma–Vesuvio. Based on ERS/ENVISAT observations spanning 1993–2010, ref. [7] showed that the localised subsidence followed an exponentially decaying trend and documented a marked change in the regional deformation regime around 2001–2002 (see also [5]). These studies provided important constraints on the spatial and temporal structure of the deformation, but their relatively short observation windows limited the assessment of the persistence of the post-2001 deformation regime over subsequent decades and the distinction between short-lived transients and longer-term deformation trends.
Here, we extend the observation period to three decades (1993–2024) by combining ERS/ENVISAT, RADARSAT-2, and Sentinel-1 observations into a single multi-mission DInSAR time-series dataset, following the processing and cross-calibration strategy described by [8]. This extended dataset allows us to investigate the persistence and temporal evolution of previously identified deformation patterns over a substantially longer period, while providing a more robust basis for distinguishing regional deformation from localised signals and for identifying transient departures from longer-term trends.
We adopt two complementary approaches. First, we analyse quasi-vertical and eastward displacement time series at representative locations sampling the main deformation domains. Second, we apply Variational Bayesian Independent Component Analysis (vbICA) jointly to the two displacement components within a 16 km radius of the Gran Cono, the younger active volcanic cone within the caldera of the older Mount Somma volcano. This approach extracts the dominant independent spatio-temporal patterns directly from the observations, without prescribing their number or spatial structure a priori.
The specific objectives of this study are to: (i) validate the multi-mission DInSAR time series against independent continuous GNSS observations in the Vesuvio area; (ii) characterise the temporal evolution of displacement across the main deformation domains, including the summit, circum-Vesuvian ring, eastern Naples, and surrounding volcanic apron; (iii) identify the dominant independent spatio-temporal deformation patterns within the three-decade dataset using vbICA; and (iv) examine the consistency of these patterns with independent seismological, tilt, and geochemical observations reported in the literature.
2. Study Area
The Somma–Vesuvio volcano is located on the eastern shore of the Gulf of Naples, adjacent to the eastern outskirts of Naples and surrounded by densely populated municipalities. The complex includes the older Somma volcano, which has developed since 39.3 ka [9]. The current morphology results from prevailing open-conduit activity punctuated by several Plinian eruptions at 18 ka, 9000 ka, 4800 ka, and in AD 79 [10]. These multiple summit-collapse episodes have exposed internal stratovolcano structures characterised by lava flows and Strombolian deposits crosscut by dykes and cone-sheets [11,12]. Since the AD 79 eruption, a new composite cone (Gran Cono) has developed through different building and disruption phases associated with sub-Plinian eruptions (e.g., AD 472; AD 1631; AD 1906). The last eruption occurred in 1944, ending centuries of open-conduit activity and shifting to closed-conduit activity [13,14]. The volcano is currently characterised by shallow, low-energy seismicity [15], mild fumarolic activity, and prevailing subsidence affecting the Gran Cono.
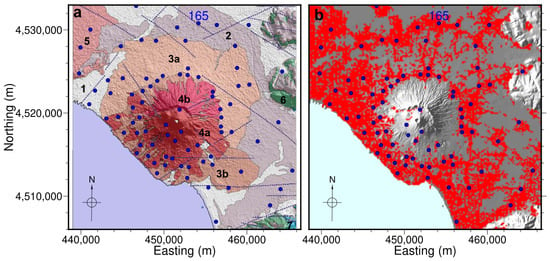
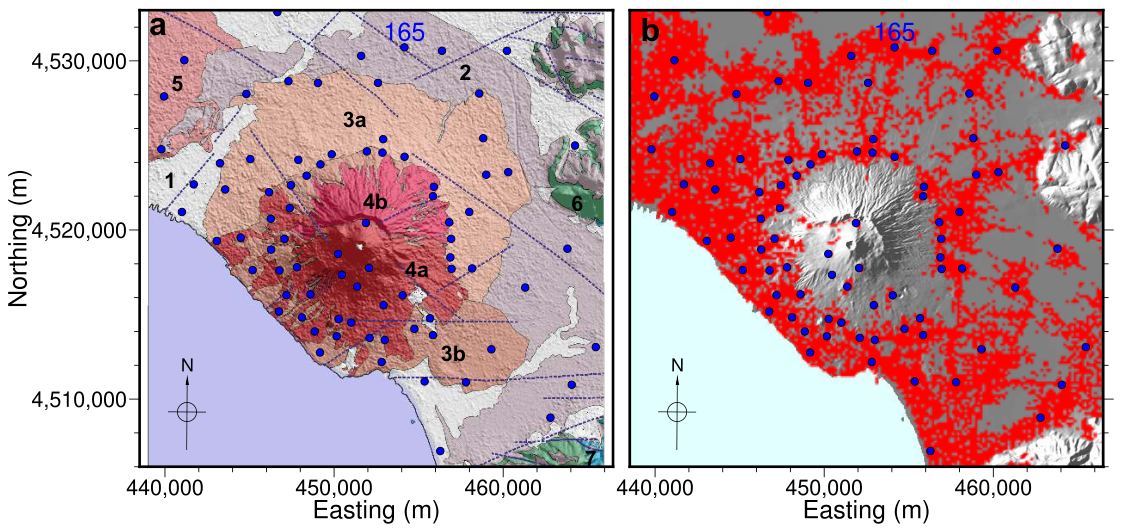
The volcanic and sedimentary rocks exposed in the study area (Figure 1a, [16]) comprises, from the volcano outward: (4a) lavas and pyroclastic rocks of Vesuvio (AD 79–AD 1944) and pyroclastic rocks of San Giuseppe Vesuviano (AD 1631); (4b) ancient lavas and pyroclastic rocks (39.3 ka–AD 79); (3a) alternating pyroclastic and alluvional Upper Holocene–Recent deposits; (3b) lavas and pyroclastic rocks of Villa Inglese-San Pietro (AD 472–AD 1631), pyroclastic rocks of Pollena (AD 472), and pyroclastic rocks of Pompei (AD 79); (1) Pleistocene–Recent deposits; (2) pyroclastic rocks (<39.8 ka); (5) Campi Flegrei pyroclastic fall deposits (15 ka–AD 1538); (6) Cretaceous carbonates; (7) Jurassic carbonates. The sites investigated in this study are distributed across both volcanic-rock outcrops and areas dominated by Quaternary sediments.
Figure 1.
Maps of the study area in UTM coordinates (WGS84, Zone 33N). (a) Locations of the 80 selected points relative to the surface geology, showing the main geological units discussed in Section 2 (units 1, 2, 3a, 3b, 4a, 4b, 5, 6, and 7). Dotted blue lines indicate faults (modified after [16]). (b) Locations of the same points relative to the DInSAR pixel grid, with a pixel size of 150 m, from which continuous time series covering 1993–2024 were obtained. All DInSAR time series are referenced to six pixels located within 200 m of point 165.
The eastern sector of Naples is also relevant from a hydrogeological perspective. Intensive groundwater withdrawal by industrial wells during the 1970s–1980s produced an artificial depression cone several metres deep in the local water table. Following the progressive closure of industrial activities, groundwater levels rapidly rebounded during the 1990s and 2000s, at rates of approximately 50–80 cm/year, before stabilising near the pre-industrial natural level around 2008 [17].
3. Materials and Methods
3.1. Multi-Mission DInSAR Dataset
ERS/ENVISAT, RADARSAT-2, and Sentinel-1 all operate at C-band, providing a consistent basis for obtaining a long-term deformation record. Over the Vesuvio region, however, ERS/ENVISAT line-of-sight (LOS) geometries are characterized by significantly lower incidence angles (~21°–24°) than those of RADARSAT-2 and Sentinel-1 (~33°–37°). Following [5], we therefore represent each dataset by two displacement components derived from the available LOS observations: a quasi-eastward horizontal component () and a quasi-vertical component (). The geometry and sign convention are defined consistently across the three missions. To a good approximation, is oriented eastward, whereas is inclined by approximately from the vertical and therefore includes a minor southward horizontal component. This representation enables the displacement fields from the three datasets to be integrated into a common long-term record.
The ERS-1/2 and ENVISAT missions provide SAR observations spanning 1992–2011. Owing to minor differences in radar frequency, however, the two sensors are not easily interoperable for interferometric processing [18]. The ERS/ENVISAT LOS displacement time series used in this study were generated following the methodology described by [18], and the corresponding quasi-vertical and eastward component time series cover the period 1993–2010. In particular, we exploited 74 ERS-1/2 and 64 ENVISAT (IS2) acquisitions, relevant to ascending orbits (Track 129), and 95 ERS-1/2 and 60 ENVISAT (IS2) acquisitions, relevant to descending orbits (Track 222), spanning the time periods 1993–2010 and 1992–2010, respectively. The applied multi-temporal DInSAR approach is based on an extension of the original Small BAseline Subset (SBAS) technique [19], tailored to the multi-sensor ERS-ENVISAT SAR image time series, which is described in [18]. In this case the identified interferometric data pairs were characterised by a (perpendicular) baseline value smaller than 400 m and a maximum temporal separation of about 1500 days, while we assumed a Doppler centroid variation not greater than 1000 Hz. Precise satellite orbital information and a Shuttle Radar Topography Mission (SRTM) digital elevation model (DEM) of the study area were used for removing (flattening) the topographic phase contribution. The overall analysis was carried out on DInSAR products obtained following a complex multi-look operation with 4 looks in the range direction and 20 in the azimuth one; we remark that this multi-look step permit mitigation of the speckle noise effects and reduction in the data volumes to be processed [19].
For RADARSAT-2, we use an enhanced version of the 2010–2015 LOS displacement time series developed by [20]. In particular, we exploited the Parallel Small BAseline Subset (P-SBAS) technique [21] to process 31 ascending and 32 descending SAR data acquired from 11 September 2010 to 19 April 2015. To identify the analyzed DInSAR data pairs we considered a maximum baseline separation of 500 m and a maximum temporal separation of 400 days. Furthermore, the generated interferograms were flattened by using a SRTM DEM and then multi-looked by considering factors of 5 and 20 along the range and azimuth directions, respectively.
Sentinel-1 observations extend the record from 2015 to 2024. In particular, we analyzed 449 ascending (Track 44) and 446 descending (Track 22) orbit data acquired by the Sentinel-1 constellation from 24 March 2015 to 7 January 2025. The ascending and descending SAR acquisitions were independently processed through the P-SBAS algorithm [22]. We underline that the P-SBAS algorithm exploits Sentinel-1 Single Look Complex (SLC) data that are co-registered, on a burst-by-burst basis, to a common reference image according to the procedure described in [23]. The differential interferograms were selected by imposing a temporal baseline constraint of 350 days and flattened by using a SRTM DEM of the area. Also note that, because of the limited orbital tube diameter of the Sentinel-1 constellation (200 m), no constrains are needed for what concerns the perpendicular baselines [22]. Moreover, a multi-look operation, with a factor of 10 along the range and 2 along azimuth direction, respectively, was applied for the DInSAR interferogram generation. We further remark that the rather small perpendicular and temporal baselines, characterizing most of the exploited Sentinel-1 interferograms, permit maximization of their coherence (thus limiting the decorrelation noise effects), with respect to those obtained from the ERS/ENVISAT and RADARSAT-2 data.
For the exploited data of the four SAR sensors, the generated differential interferograms were unwrapped through the EMCF approach [24] and subsequently inverted to retrieve the LOS displacement time series and the corresponding mean velocity for each coherent pixel. Finally, the Atmospheric Phase Screen (APS) artifacts were removed from the retrieved displacement time series by applying a space-time filtering step, originally introduced in the SBAS approach [19].
The processing chain and the inter-mission cross-calibration procedure adopted to merge the three datasets are described in detail in [8]. Due to the differing incidence angles, the accuracy of is approximately 1.5 times lower than that of for RADARSAT-2 and Sentinel-1, and 2.5 times lower for ERS/ENVISAT. The resulting eastward and quasi-vertical component time series are sampled on a regular grid with a nominal pixel spacing of 150 m. All time series are referenced to six pixels located within 200 m of point 165 in Figure 1, rather than to the farther Qualiano reference site adopted for the Campi Flegrei analysis of [8]. These six pixels are located in Marigliano, approximately 12 km north of the Vesuvio cone. This site was selected as the reference area because of its persistent urban character over several decades. The stability of the reference is further assessed through the GNSS comparisons described below.
Figure 1b shows the spatial distribution of pixels for which a continuous 1993–2024 time series could be obtained, together with the 80 representative points selected for the point-by-point analysis described in Section 3.3.
3.2. DInSAR Time Series Validation
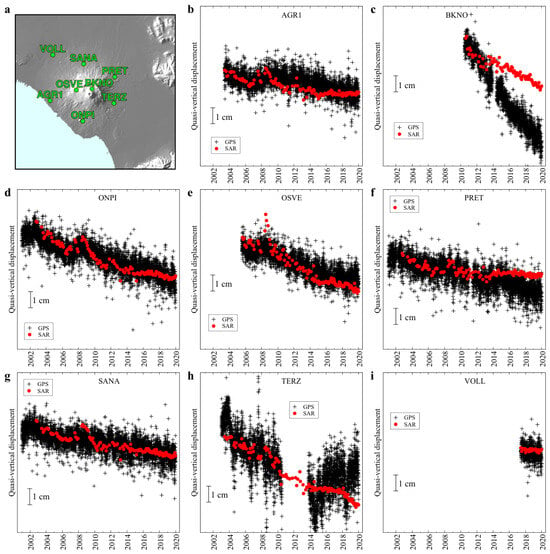
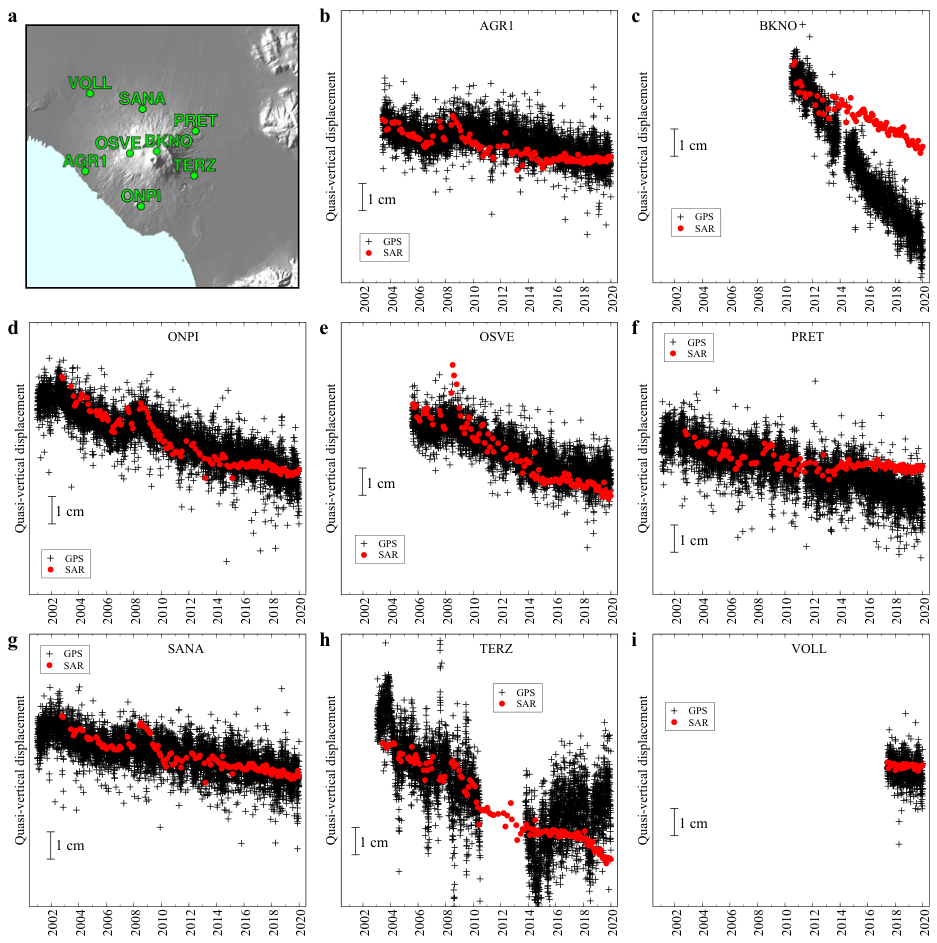
We validate the DInSAR time series against daily GNSS observations from [25]. The analysis was carried out at eight stations (AGR1, BKNO, ONPI, OSVE, PRET, SANA, TERZ, and VOLL) among the nine Neapolitan Volcano Continuous GPS (NeVoCGPS) stations located in the Somma–Vesuvio area and operated by the Istituto Nazionale di Geofisica e Vulcanologia–Osservatorio Vesuviano (INGV-OV). The eight selected stations are distributed around the volcano, and at least one DInSAR pixel was available within 500 m of each station (Figure 2a). Prior to quantitative comparison, GNSS daily data were filtered using a 3-point moving average, and the filtered time series was linearly interpolated at the DInSAR time series epochs. The oldest continuous GNSS stations, however, only began operating in 2000, limiting the direct validation of the DInSAR time series before this date. The quality of the quasi-vertical ERS/ENVISAT DInSAR displacements over the 1993–2010 period was independently demonstrated by [7] through comparison with the vertical displacements measured at 16 levelling benchmarks from [26].
Figure 2.
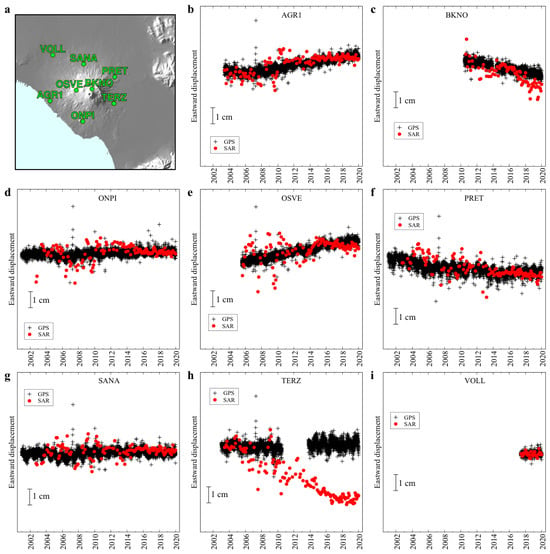
Comparison of DInSAR and daily GNSS displacement time series projected along the same quasi-vertical direction at eight continuous GNSS stations around Somma–Vesuvio. (a) Location of the eight GNSS stations for which at least one DInSAR pixel was available within 500 m, in the same geographic area as in Figure 1. (b–i) GNSS (black pluses) and DInSAR (red dots). Note the long data gaps in the BKNO, PRET, and TERZ GNSS series, which result in arbitrary offsets in the post-gap segments. The reported uncertainty of daily GNSS vertical displacement measurements is 1 cm [25], whereas the uncertainty of the DInSAR measurements, estimated from the residuals between the DInSAR and GNSS time series, is approximately 0.5 cm (see Supplementary Information Table S1).
3.3. Point-by-Point Time-Series Analysis
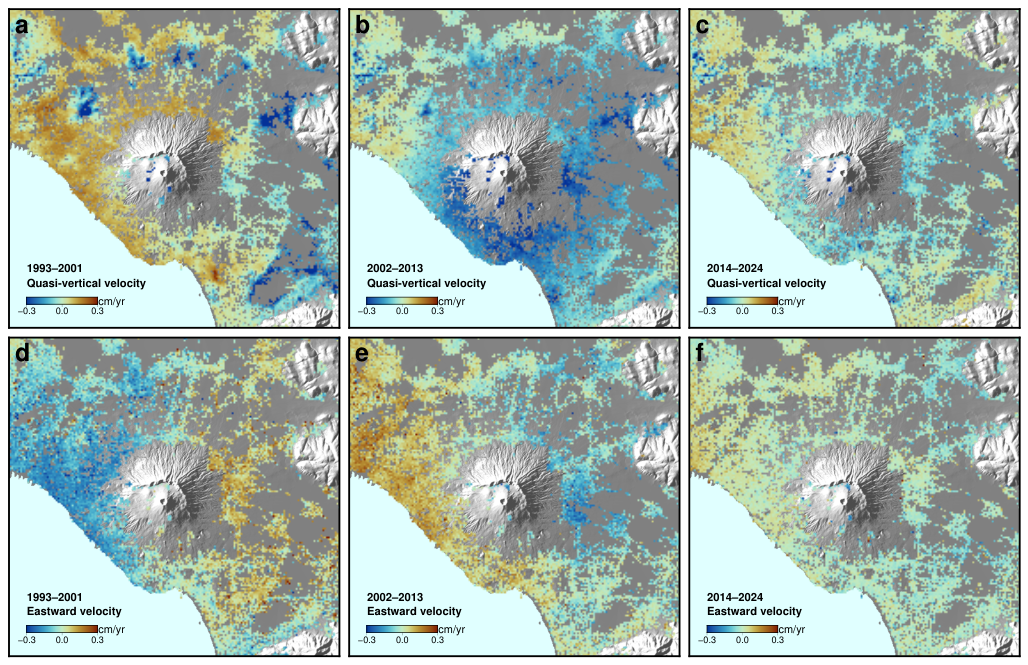
Eighty representative points were selected across the study area (Figure 1) to sample the volcano’s summit area; the circum-Vesuvian ring, located approximately 10 km from the crater, where previous shorter time series had suggested anomalous subsidence [6,7]; the eastern sector of Naples, potentially affected by the hydrogeological process described in Section 2; and the remainder of the volcanic apron. Quasi-vertical displacement time series at these points were visually inspected and grouped according to their qualitative temporal behaviour, as detailed in Section 4.3. Average quasi-vertical and eastward velocity maps were also computed for three sub-periods (1993–2001, 2002–2013, and 2014–2024), selected to bracket the regime changes identified from the point-by-point analysis and previous studies based on shorter time series [5,7].
3.4. Variational Bayesian Independent Component Analysis (vbICA)
To complement the point-by-point inspection with a statistically driven, data-adaptive decomposition, we applied Variational Bayesian Independent Component Analysis (vbICA; [27,28]) jointly to the quasi-vertical and eastward displacement fields within a circular area of 16 km radius centred on the Gran Cono. The analysis was performed in spatial mode, in which the independent components are expressed as spatial patterns and their associated temporal evolution is represented by the corresponding columns of the mixing matrix. The observations were arranged in a data matrix , with rows corresponding to observation epochs and columns corresponding to the concatenated quasi-vertical and eastward displacement values at all pixels. Thus, for N observation epochs and P pixels, has dimensions , with the first P columns containing and the remaining P columns containing .
Within the vbICA framework, the observations are represented through a probabilistic linear mixing model involving a mixing matrix and a source matrix , with the residual variability represented by a noise term . In the present spatial-mode formulation, has dimensions , where K is the number of independent components retained in the decomposition, whereas has dimensions . Each row of therefore defines one independent spatial pattern, including its quasi-vertical and eastward contributions, while the corresponding column of describes the temporal evolution of that pattern over the observation epochs. Both and are treated probabilistically, and their posterior distributions are estimated within the Variational Bayesian framework [27,28]. The contribution of the jth independent component to the observational matrix is given by the outer product of the jth column of and the jth row of ,
which has dimensions . The observational matrix can therefore be expressed as
where represents the residual/noise contribution. The effective number of components K should not be interpreted necessarily as the number of physically distinct deformation sources. Rather, it defines the dimensionality of the latent independent-component representation retained by the vbICA decomposition. In the Bayesian framework, this dimensionality can be assessed through model-selection procedures such as automatic relevance determination (ARD), as implemented by [28], although the resulting number of components may depend on the statistical structure of the data and on the adopted selection criterion.
Before decomposition, the two displacement components were independently centred by subtracting, at each epoch, their respective spatial mean values computed over all pixels within the analysis circle. This preprocessing step isolated the spatially varying component of the signal; the removed spatial-mean time series are shown separately.
Following [5,28], the optimal number of independent components (ICs) was evaluated by monitoring the ARD hyper-parameter across a dimensionality range from to . Finally, we applied vbICA again, using only the chosen number of components and performing a whitening preprocessing step, attributing to each principal component the same variance using results from a Principal Component Analysis [29]. The order in which vbICA provides the independent components is not significant.
3.5. Inversion of the Spatial Pattern of the Second Independent Component
We investigate the degree to which the spatial patterns of the second independent component, namely the quasi-vertical and eastward displacement components, can be reproduced by a simple inflating-source model. Specifically, we consider the pressurization of a very small (point) spheroidal source embedded in a homogeneous elastic half-space with a Poisson ratio of 0.25. Ground displacements are computed following [30].
The spheroid symmetry axis is assumed to be vertical, while the source position, polar-to-equatorial axis ratio, and potency are treated as free parameters in the best-fit procedure. Because the spatial patterns obtained from vbICA have zero mean by construction, the modelled displacement fields are shifted accordingly before the comparison.
We minimize two alternative objective functions: the sum of squared residuals, which is the standard least-squares criterion, and the sum of absolute residuals, which reduces the sensitivity of the fit to outliers. In both cases, the minimization is performed using adaptive simulated annealing [31].
4. Results
4.1. DInSAR–Levellings Comparison
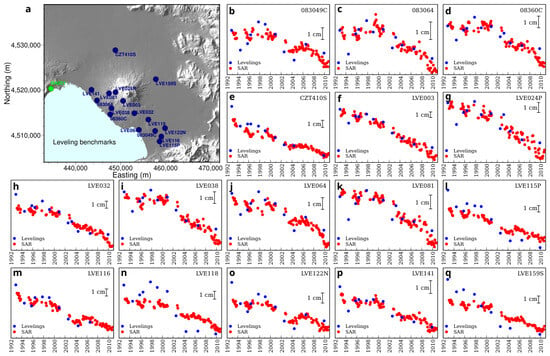
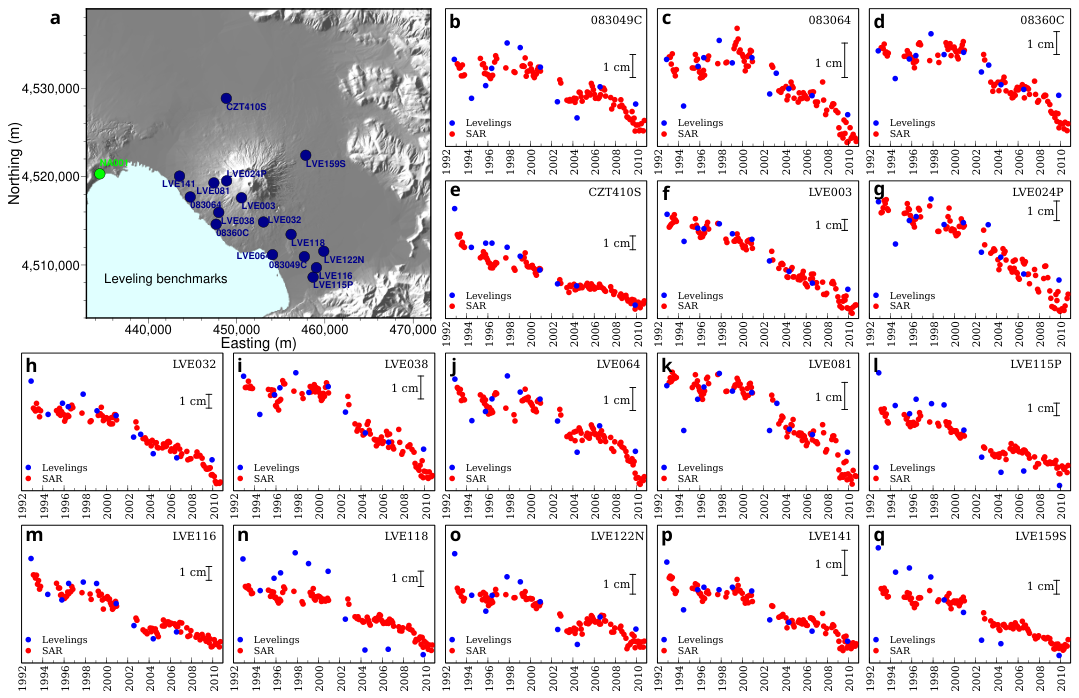
As mentioned in Section 3.2, the comparison between quasi-vertical ERS/ENVISAT DInSAR displacements over the 1993–2010 period and the vertical displacements measured at 16 levelling benchmarks from [26] was already carried out by [7]. For the sake of completeness and clearness, we repropose here their results as Figure 3. Good overall agreement is observed at all benchmarks, which generally show a remarkable subsidence from 2001–2002.
Figure 3.
Comparison of levelling data [26] and ERS/ENVISAT quasi-vertical displacements. Both DInSAR and levelling displacements are relative to the levelling benchmark NA001 (green dot in (a)). (a) Blue dots and labels, levelling benchmarks whose altitude time series are plotted with respect to NA001 in [26]. (b–q) Blue dots, levelling data; red dots, DInSAR quasi-vertical displacements. The vertical bar corresponds to 1 cm displacement. Modified from [7].
4.2. DInSAR–GNSS Comparison
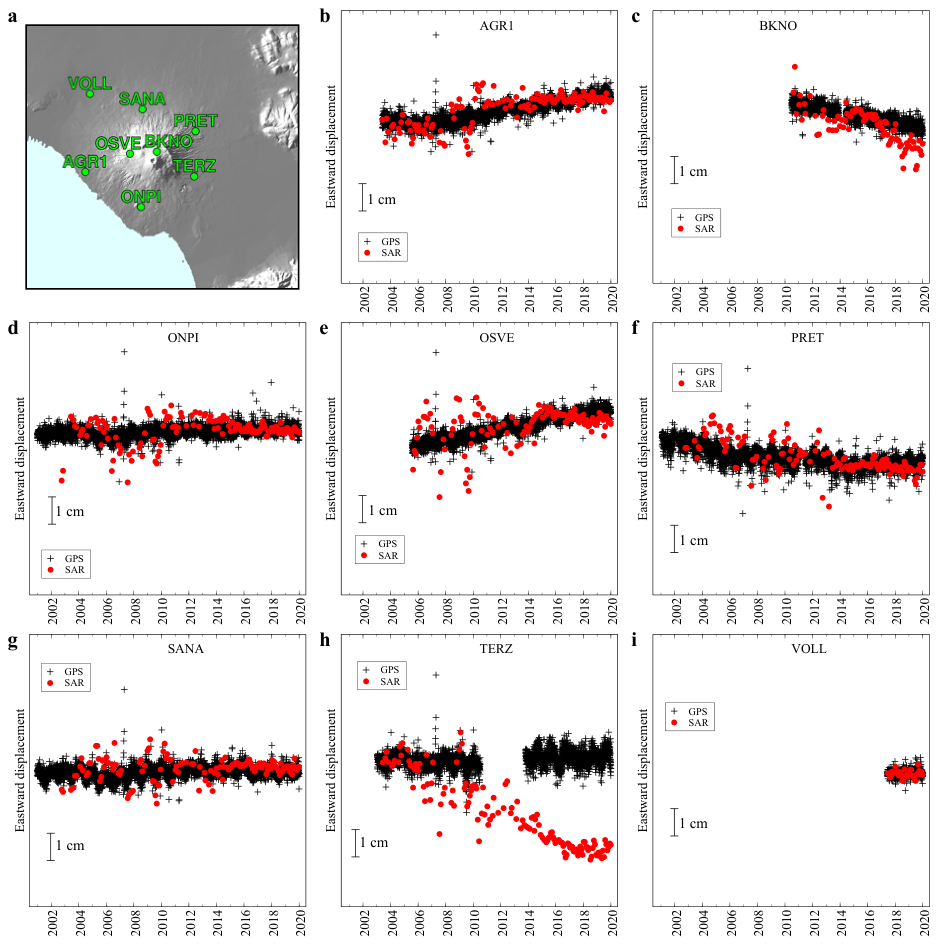
Figure 2 and Figure 4 compare the quasi-vertical and eastward DInSAR displacement time series, respectively, with continuous GNSS observations at the eight stations listed in Section 3.2.
Figure 4.
Comparison of DInSAR and daily GNSS displacement time series projected along the eastward direction at eight continuous GNSS stations around Somma–Vesuvio. (a) Location of the eight GNSS stations for which at least one DInSAR pixel was available within 500 m, in the same geographic area as in Figure 1. (b–i) GNSS (black pluses) and DInSAR (red dots). Note the long data gaps in the BKNO, PRET, and TERZ GNSS series, which result in arbitrary offsets in the post-gap segments. The reported uncertainty of daily GNSS horizontal displacement measurements is 0.3 cm [25], whereas the uncertainty of the DInSAR measurements, estimated from the residuals between the DInSAR and GNSS time series, is approximately 0.5 cm (see Supplementary Information Table S2).
Three GNSS series (BKNO, PRET, and TERZ) contain temporal gaps ranging from about six months to three years; consequently, their absolute post-gap displacement levels may be arbitrarily shifted. In addition, TERZ exhibits a marked discrepancy between the GNSS and DInSAR time series, particularly following the interruption of the GNSS record in 2010.
Statistical metrics were computed over the common observation intervals of the GNSS and DInSAR datasets to ensure a consistent temporal basis for comparison. The results are reported in Supplementary Information Tables S1 and S2 for four different observation periods: the full GNSS record (whose duration varies among stations; see Figure 2 and Figure 4), the ERS/ENVISAT period, the RADARSAT-2 period, and the Sentinel-1 period.
Considering the full GNSS observation period and excluding stations BKNO, PRET, and TERZ because of their extended data gaps, the standard deviation of the differences between GNSS- and DInSAR-derived displacement velocities is approximately 0.05 cm/yr for the quasi-vertical component and 0.02 cm/yr for the eastward component. Similarly, the average standard deviation of the GNSS-DInSAR displacement differences across the selected stations is approximately 0.5 cm for both components.
Overall, these results provide a quantitative assessment of the agreement between the two independent datasets and demonstrate a good level of consistency, particularly considering the relatively low deformation rates investigated in this study. Notably, these findings are also consistent with those reported for the Campi Flegrei area (e.g., [20,32]), further supporting the reliability of the multi-mission SAR dataset.
4.3. Time Series at Selected Points
The spatial distribution of the eighty representative points, relative both to the surface geology and to the DInSAR pixel grid, is shown in Figure 1. Four qualitatively distinct types of temporal behaviour were identified. The classification is descriptive and is based on the temporal evolution of the quasi-vertical component; it is not intended as a formal clustering of the full displacement dataset.
4.3.1. Summit Area
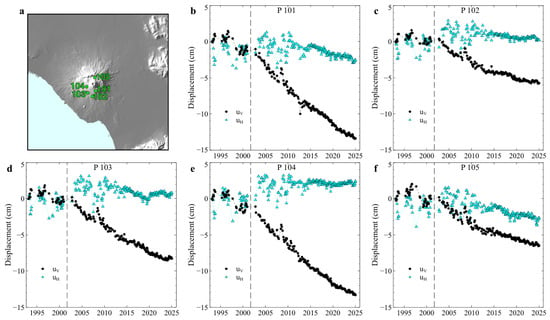
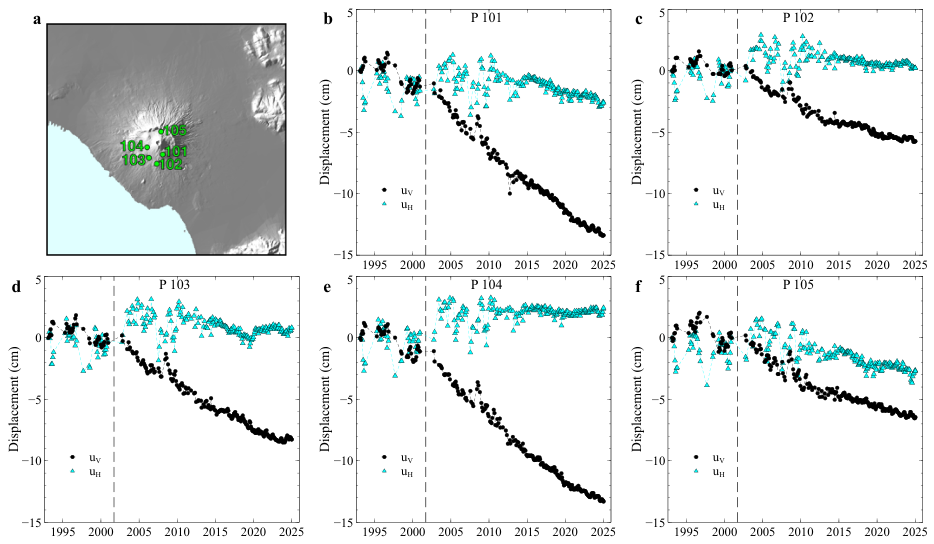
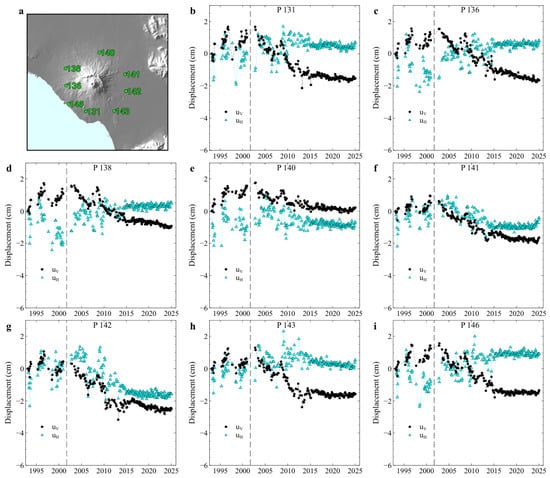
Points located in the southern part of the summit area are in continuous subsidence throughout the 1993–2024 period, with a marked increase in subsidence rate around 2001–2002 (Figure 5).
Figure 5.
Displacement time series at five representative points located in the summit area. (a) Location of the five representative points, in the same geographic area as in Figure 1. (b–f) Quasi-vertical (black dots) and eastward (cyan triangles) displacements. Vertical dashed lines indicate the reference date within a data gap used to compare the subsidence rates before and after the gap.
4.3.2. Circum-Vesuvian Ring
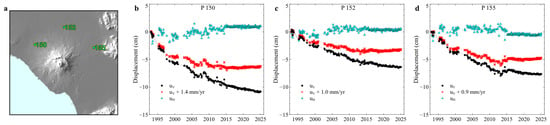
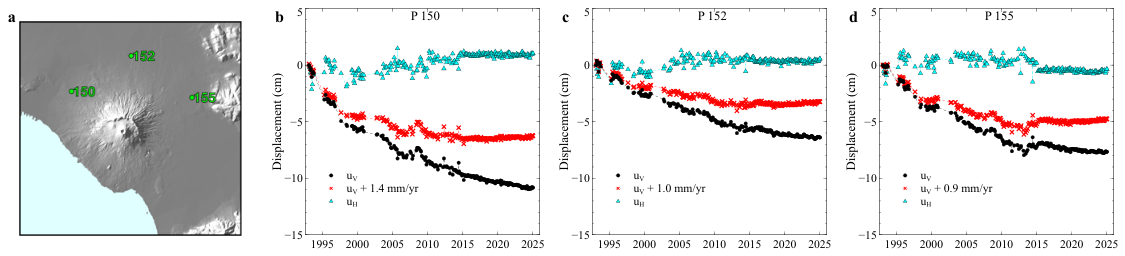
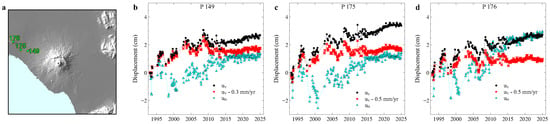
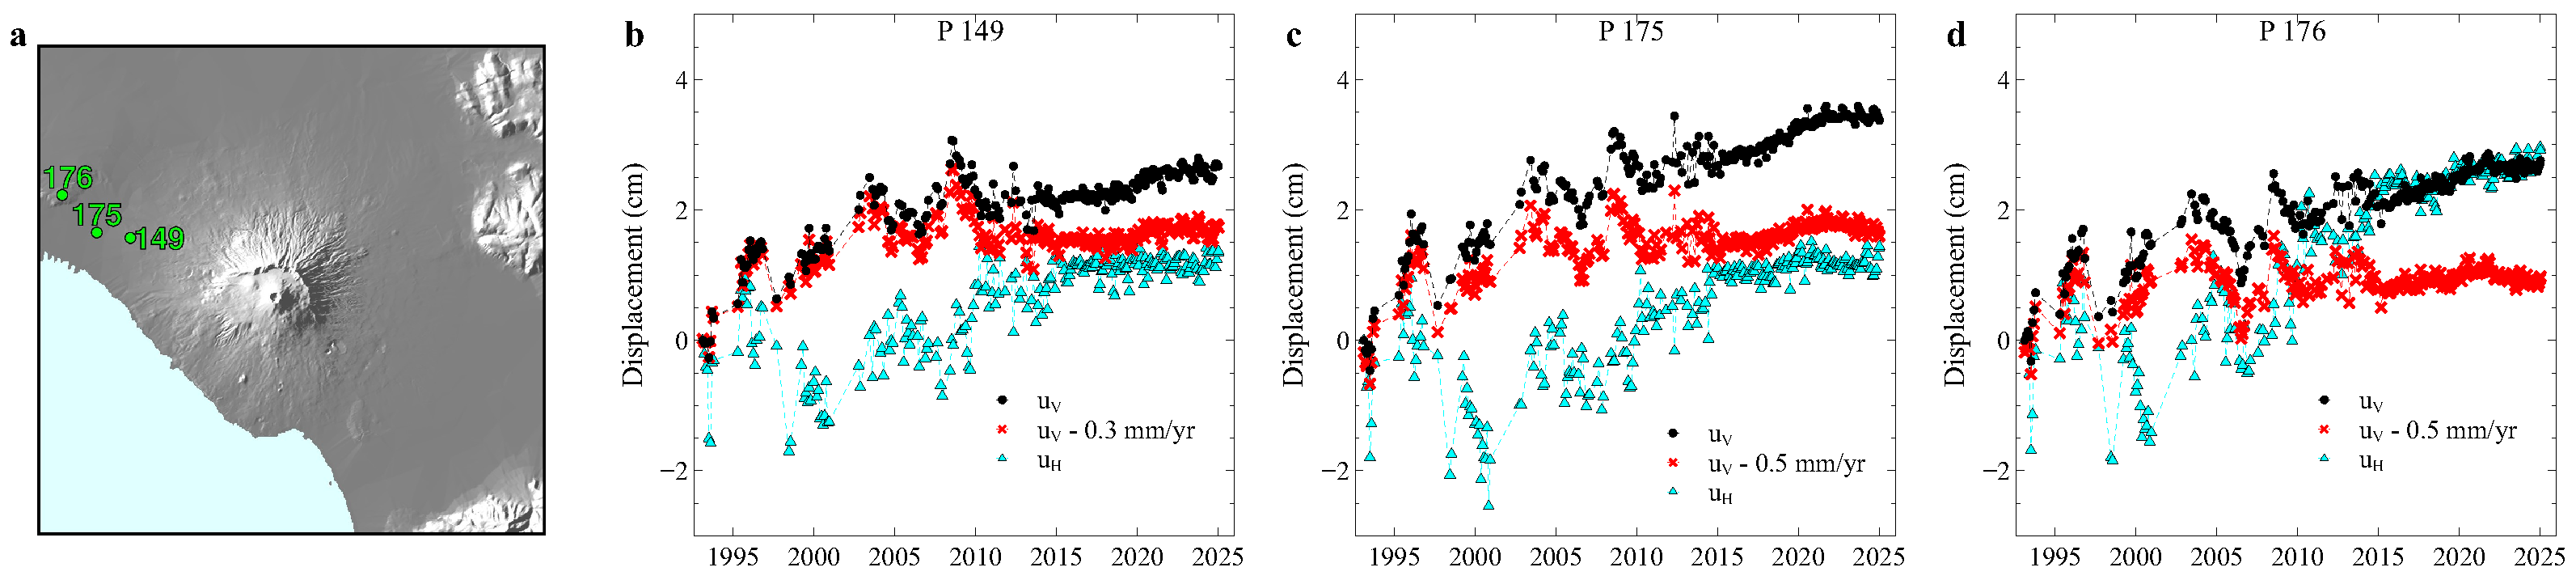
A number of small areas located approximately 10 km from the crater, along a circum-Vesuvian ring, show subsidence with a rate that decreases quasi-exponentially with time before tending towards a constant, lower value; this behaviour is clearly resolved at several points (Figure 6). The areas shown in Figure 6 lie close to the boundary between the 3a (Late Holocene–Recent alternating pyroclastic and alluvial deposits) and 2a (pyroclastic rocks younger than the Campanian Ignimbrite, <39.8 ka) units of the geological map shown in Figure 1a.
Figure 6.
Displacement time series at three points along the circum-Vesuvian ring. (a) Location of the three representative points, in the same geographic area as in Figure 1. (b–d) Quasi-vertical (black dots) and eastward (cyan triangles) displacements. Red dots: quasi-vertical displacements after subtraction of a constant velocity, chosen for each point to remove the long-term linear trend and highlight the initial transient subsidence.
4.3.3. Eastern Naples Area
Points located in the eastern sector of Naples show uplift at a decreasing rate until approximately 2008, followed by subsidence at an approximately constant rate (Figure 7). As summarised in Section 2, well-log data (e. g., [17]) indicate that the water table in this sector was close to its natural, pre-industrial level during the 1930s–1940s; intense industrial groundwater withdrawal during the 1970s–1980s produced an artificial depression cone several metres deep; and following the closure of industrial activity, a rapid groundwater rebound occurred during the 1990s and 2000s, at rates of up to 50–80 cm/year, with the water table restabilising close to its historical, pre-industrial level around 2008. The close temporal correspondence between this hydrogeological history and the uplift-then-subsidence pattern observed in the DInSAR time series strongly suggests that the latter is a poroelastic response to groundwater-level changes, rather than a volcanic or tectonic signal.
Figure 7.
Displacement time series at three points in the eastern sector of Naples. (a) Location of the three representative points, in the same geographic area as in Figure 1. (b–d) Quasi-vertical (black dots) and eastward (cyan triangles) displacements. Red dots: quasi-vertical displacements after subtraction of a constant velocity, chosen for each point to remove the long-term linear trend and highlight the initial transient uplift.
4.3.4. Remaining Points
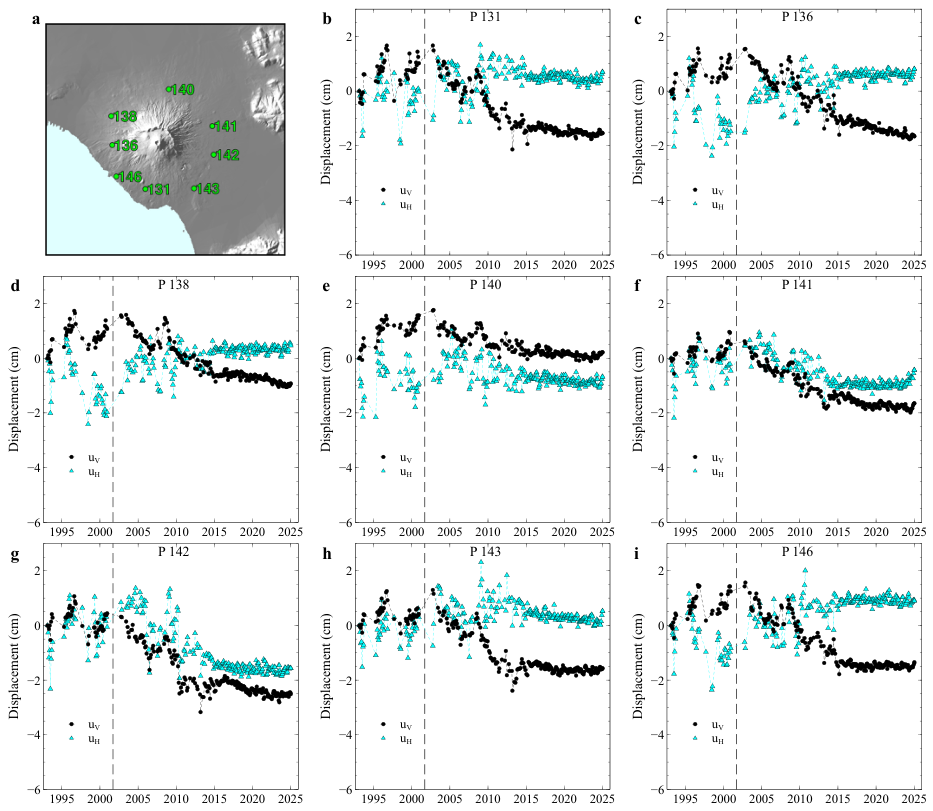
At the remaining selected points, the quasi-vertical displacement is approximately constant, or shows slight uplift, before approximately 2001, followed by subsidence at an approximately constant, though not spatially uniform, rate; a slight, quasi-generalised deceleration is observed from around 2014 onward (Figure 8).
Figure 8.
Examples of displacement time series at eight representative points outside the summit area, the circum-Vesuvian ring, and the eastern Naples sector. (a) Location of the eight representative points, in the same geographic area as in Figure 1. (b–i) Quasi-vertical (black dots) and eastward (cyan triangles) displacements. Vertical dashed lines indicate the reference date within a data gap used to compare the subsidence rates before and after the gap.
4.4. Average Velocity Fields
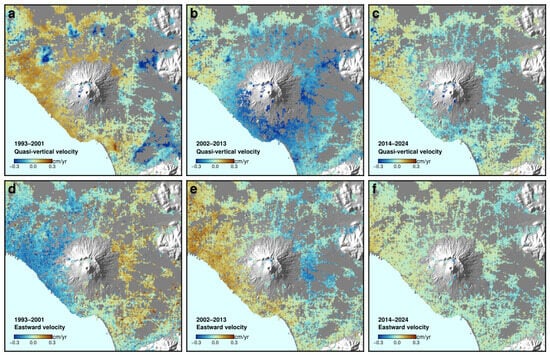
Average quasi-vertical and eastward velocity maps computed for the three sub-periods 1993–2001, 2002–2013, and 2014–2024 (Figure 9) are fully consistent with the point-by-point behaviour described in Section 4.3. Both quasi-vertical and eastward velocities exhibit a marked difference between the 1993–2001 and 2002–2013 sub-periods. In particular, the 2002–2013 quasi-vertical velocity map shows markedly enhanced subsidence rates compared with 1993–2001, except in the localised areas of decaying subsidence along the circum-Vesuvian ring. The 2014–2024 sub-period displays a pattern broadly similar to that observed in 2002–2013, but with lower velocity magnitudes. The eastward velocities during 1993–2001 show no significant anomalies around the areas of pronounced subsidence, further supporting the interpretation of this deformation as a localised compaction process.
Figure 9.
Average quasi-vertical (a–c) and eastward (d–f) velocity maps for the periods 1993–2001, 2002–2013 and 2014–2024. Same geographic area as in Figure 1.
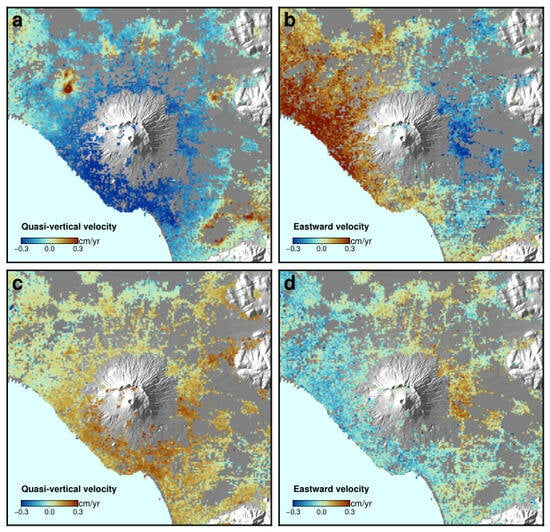
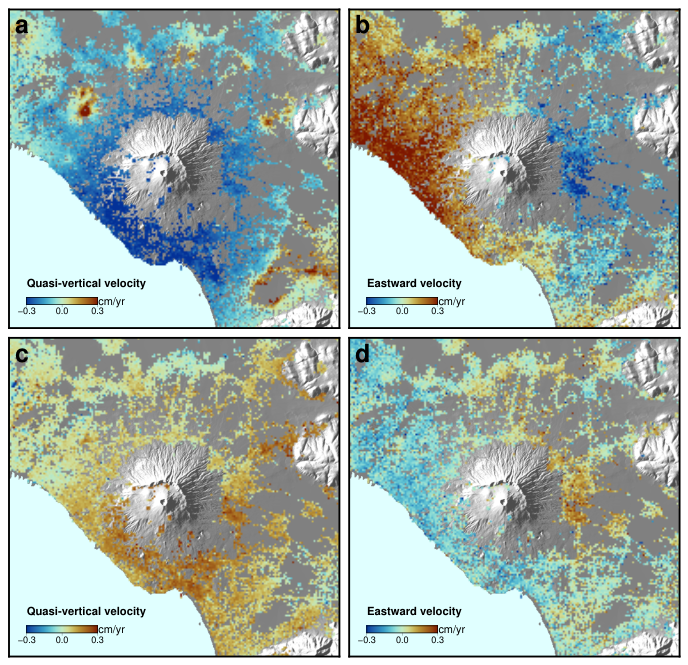
The difference between the average velocity fields of the 2002–2013 and 1993–2001 periods (Figure 10a,b) is dominated, along the circum-Vesuvian ring, by the strong transient subsidence described in Section 4.3.2. Outside this ring, however, the velocity-difference pattern closely resembles the surface deformation field expected from the depressurisation of a source located at several kilometres depth beneath the volcano, providing a first indication of a change in a deep deformation source around 2001 (further discussed in Section 5.4).
Figure 10.
Difference between the average velocity fields over successive observation periods. (a,b) Differences between the 2002–2013 and 1993–2001 mean velocity fields for the quasi-vertical and eastward components, respectively. (c,d) Differences between the 2014–2024 and 2002–2013 mean velocity fields for the quasi-vertical and eastward components, respectively. Same geographic area as in Figure 1.
Figure 10c,d show that, after 2014, the deformation pattern possibly associated with a deep source undergoes a further change, characterised by a reduction in the magnitude of the velocity components. In particular, along the southern flank, the quasi-vertical velocity component decreases by approximately 0.3 cm/yr relative to the 2002–2013 period. This difference is substantially larger than its estimated one-standard-deviation uncertainty of approximately 0.05 cm/yr. Similarly, the eastward velocity component exhibits differences exceeding 0.2 cm/yr along the volcanic flanks, also substantially larger than the corresponding uncertainty of approximately 0.02 cm/yr.
4.5. vbICA Decomposition
4.5.1. Component Selection and Pre-Processing
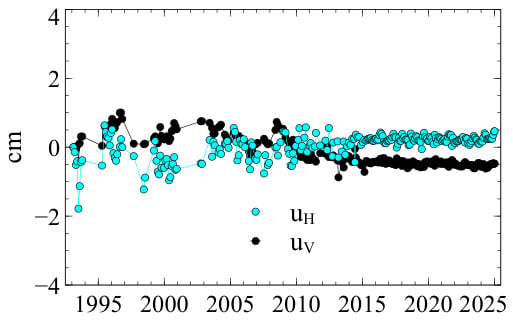
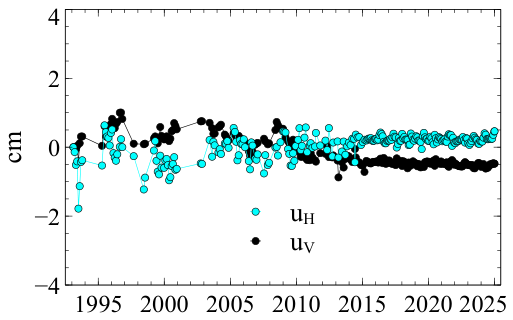
As described in Section 3.4, the quasi-vertical and eastward displacement fields were independently centred prior to decomposition by subtracting, at each epoch, their respective spatial means over the analysis circle (Figure 11). Both spatial means remain small over the analysed period.
Figure 11.
Spatial-mean displacement subtracted from every pixel at each epoch, separately for the quasi-vertical (, black points) and eastward (, cyan points) components, prior to vbICA decomposition.
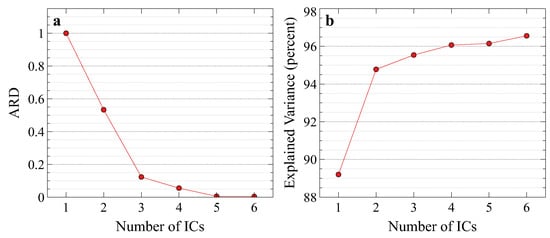
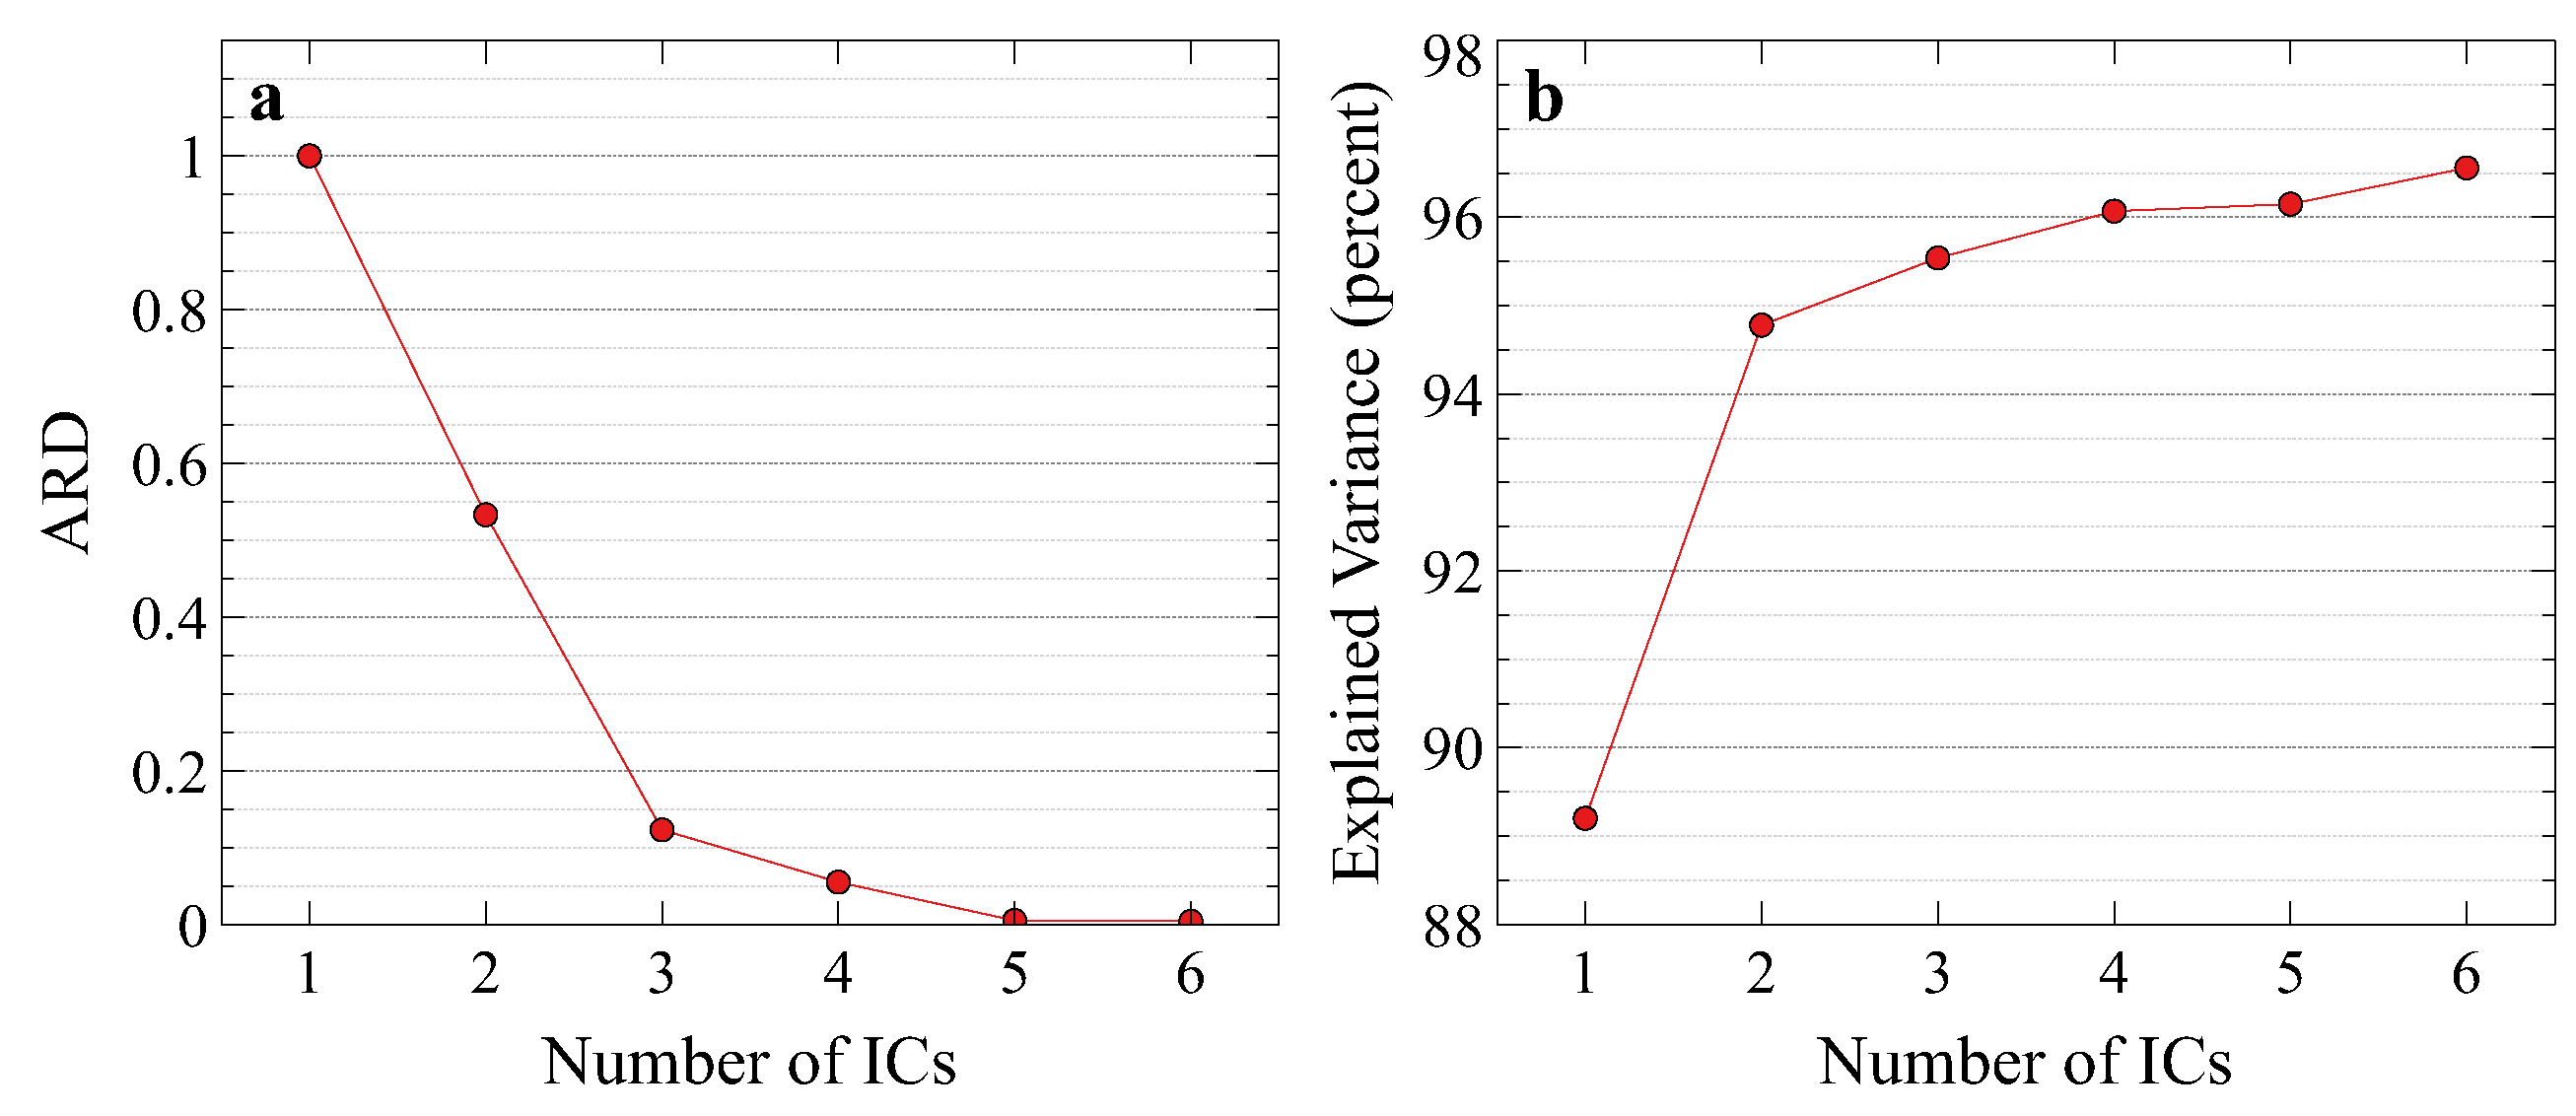
The ARD parameters exhibit a pronounced decrease, reaching ∼0.1 at and ∼0.05 at , and approaching zero for higher dimensions (Figure 12a). This behaviour alone does not uniquely identify the physically appropriate model dimensionality. We therefore selected as the most parsimonious representation of the main coherent deformation signals, based on the combined evidence from the ARD analysis, the percentage of explained variance, the stability of IC1 across model dimensionalities, the spatial coherence of the two-component solution, and the reconstruction test described below.
Figure 12.
Selection of the number of independent components. (a) Automatic relevance determination (ARD) as a function of the number of independent components (ICs) used in the vbICA decomposition; (b) percentage of explained variance of the dataset in relation to the number of ICs.
Higher-dimensional solutions were retained as a sensitivity test rather than interpreted as evidence for additional independent physical processes. In particular, the solution separates a topographically correlated pattern and distributes the main volcanic deformation signal between two highly correlated components, without providing a comparably clear physical separation. This limited improvement in physical interpretability is also reflected in the explained variance, which increases from approximately 94.8% for to 96.1% for , reaching only 96.6% for (Figure 12b). These results indicate that increasing the number of components beyond two yields only a marginal improvement in the reconstruction of the overall dataset. On this basis, is adopted here as the simplest model that captures the dominant, spatially coherent deformation patterns relevant to the present analysis.
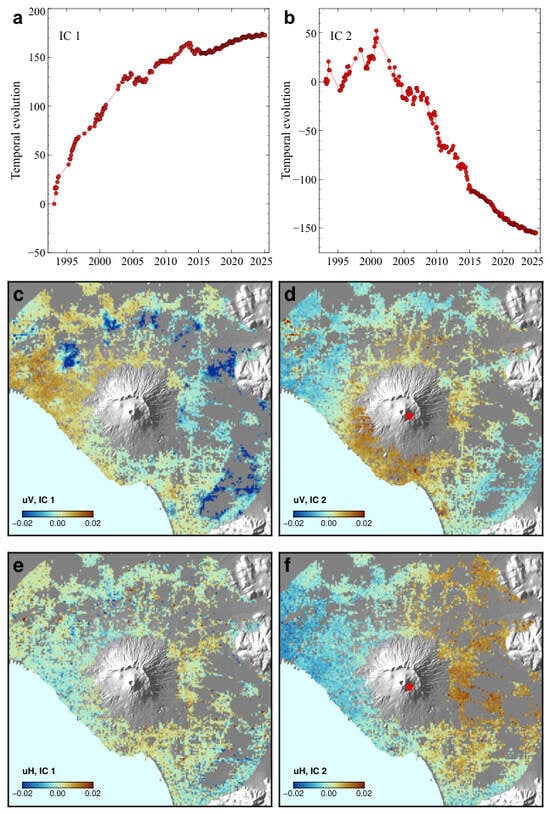
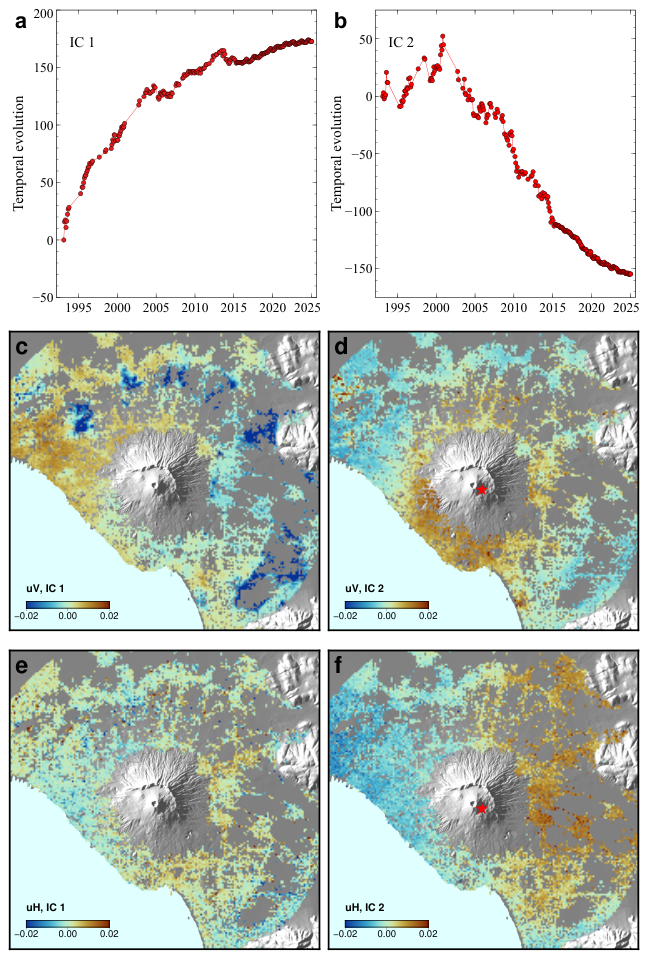
For , the algorithm identifies two stable and spatially distinct spatio-temporal modes (Figure 13):
Figure 13.
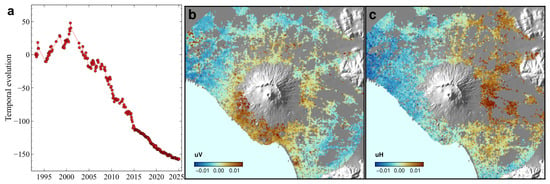
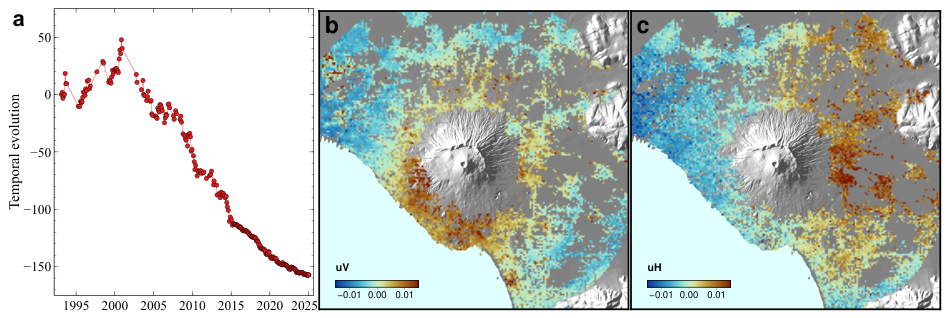
Results of the two-components vbICA analysis. (a,b) Temporal evolutions of the two independent components (IC1, IC2). (c,e) Spatial patterns of the first independent component (IC1) for the quasi-vertical and eastward displacements. (d,f) Spatial patterns of the second independent component (IC2) for the quasi-vertical and eastward displacements; the red star gives the best-fit planimetric source position. Each pattern has zero spatial mean by construction. The contribution of each independent component to the ground displacement time series (in centimetres) at each pixel is obtained by multiplying the component’s temporal evolution by its spatial pattern value at that pixel. Same geographic area as in Figure 1.
- IC1: This component describes the exponentially decaying subsidence transient along the circum-Vesuvian ring together with the transient uplift signal in eastern Naples, consistent with the point-by-point results presented in Section 4.3.2 and Section 4.3.3. The spatial confinement and temporal behaviour of these signals indicate that IC1 is dominated by non-volcanic contributions.
- IC2: This component maps an inflationary/deflationary spatial pattern centred on the Somma–Vesuvio volcano, with a temporal evolution characterised by slight pre-2001 uplift followed by continuous post-2001 subsidence. Its spatial and temporal characteristics identify IC2 as the component most closely associated with the regional volcanic deformation pattern.
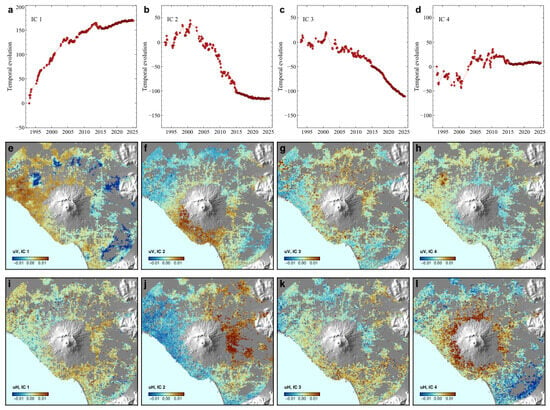
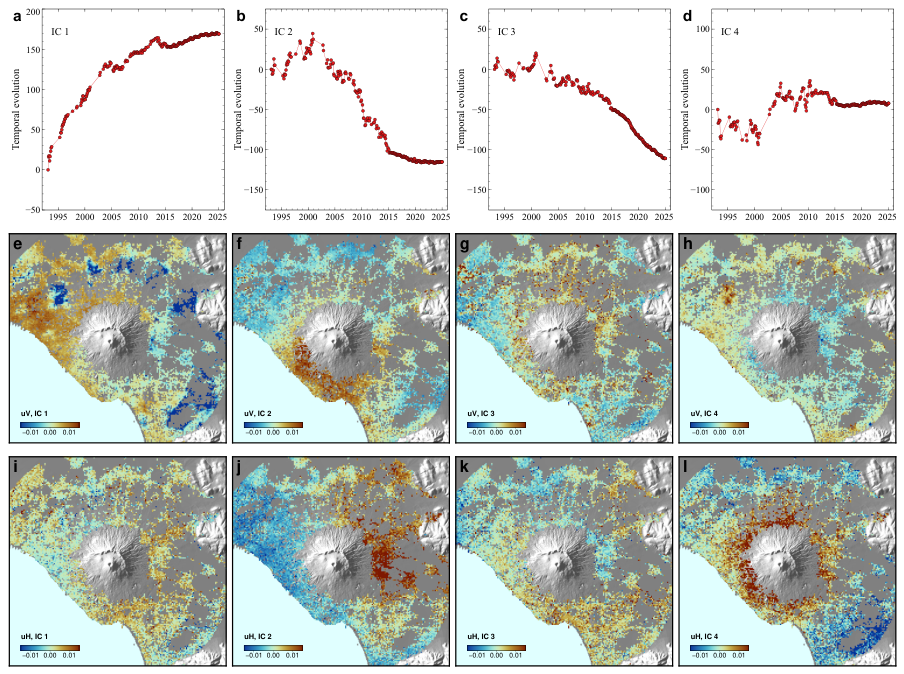
To test whether higher-dimensional models provide a physically meaningful separation of systematic noise from the volcanic signal, we compared the parsimonious solution with the higher-order solution (Figure 14). IC1 remains stable across model dimensionalities (, , not shown for brevity, and ), supporting its identification as a robust and highly coherent deformation signal.
Figure 14.
Results of the four-component vbICA analysis. (a–d) Temporal evolutions of the four independent components (IC1–IC4). (e,i) Spatial patterns of the first independent component (IC1) for the quasi-vertical and eastward displacements. (f,j) Spatial patterns of the second independent component (IC2) for the quasi-vertical and eastward displacements. (g,k) Spatial patterns of the third independent component (IC3) for the quasi-vertical and eastward displacements. (h,l) Spatial patterns of the fourth independent component (IC4) for the quasi-vertical and eastward displacements. Each pattern has zero spatial mean by construction. The contribution of each independent component to the ground displacement time series (in centimetres) at each pixel is obtained by multiplying the component’s temporal evolution by its spatial pattern value at that pixel. Same geographic area as in Figure 1.
In the solution, the algorithm isolates a topographically correlated spatial pattern in IC4 (Figure 14h,l), particularly evident in and possibly associated with stratified tropospheric delays. At the same time, the primary volcanic deformation signal is distributed between two highly correlated components, IC2 and IC3 (Figure 14f,g,j,k). This apparent splitting may reflect the representation of a single underlying deformation signal by multiple components, potentially because time-varying magmatic and hydrothermal processes within volcanic environments such as the Somma–Vesuvio complex are not fully captured by the assumptions of the vbICA decomposition.
To test whether the apparent splitting of the volcanic deformation between IC2 and IC3 represents a robust separation of distinct signals, we linearly recombined these components into a rank-2 matrix using Equations (1) and (2), and extracted its dominant mode through an economy-size Singular Value Decomposition (SVD) using Octave v.11.1.0.
The leading singular-vector pair provided the optimal rank-1 approximation of the recombined volcanic deformation. This reconstruction was virtually identical to the IC2 obtained with the simpler model (Figure 15). Taken together, these tests indicate that the additional components in the solution do not provide a robust separation of independent physical deformation sources. We therefore adopt the more parsimonious configuration as the core model for the geophysical interpretation. The posterior standard deviations of the spatial distributions of IC1 and IC2 are shown in Supplementary Information Figure S1.
Figure 15.
Reconstruction of the volcanic deformation based on the dominant SVD model derived from the linear recombination of the IC2 and IC3 independent components (Figure 14). (a) Temporal evolution. (b,c) Spatial patterns for the quasi-vertical and eastward displacements. The contribution of the dominant SVD model to the ground displacement time series (in centimetres) at each pixel is obtained by multiplying its temporal evolution by its spatial pattern value at that pixel. Same geographic area as in Figure 1.
4.5.2. Inversion of the Spatial Pattern of IC2
The spatial patterns of IC2 (Figure 13d,f) exhibit the displacement signs expected for an inflating source, while their temporal evolution is governed by the time function shown in Figure 13b, which indicates inflation before 2001 followed by deflation from 2001 onwards. We inverted these spatial patterns (quasi-vertical and eastward displacements) using the inflating-source model described in Section 3.5, and obtained the best-fit parameters for a very small (point) pressurised spheroidal source embedded in a homogeneous elastic half-space.
The inversion yields a source geometry broadly consistent with that reported by [7], who obtained their solution by inverting the second PCA mode (referred to as EOF in [7]) within a circular region of 9-km radius. In particular, both the polar-to-equatorial axis ratio (≈1.1) and the planimetric source location (red star in Figure 13d,f), a few hundred metres southeast of the Gran Cono, are in close agreement with their results. The estimated source depth, however, is somewhat greater in our inversion, at about 9000–10,000 m compared with 7000–8000 m in [7]. It is worth noting that the planimetric source location and the polar-to-equatorial axis ratio are the only parameters well constrained by our inversion, whereas the source depth is associated with an uncertainty of several hundred metres.
The quality of the inversion and the associated uncertainties are further assessed through the misfit analysis shown in Supplementary Information Figure S2, which reports the inversion misfit as a function of source depth. The misfit, defined as the standard deviation of the residuals between the IC2 spatial distribution and the corresponding modelled distribution, is approximately 20% larger than the posterior standard deviation of the IC2 spatial distribution (dashed line in Supplementary Information Figure S2). The latter provides a model-dependent measure of uncertainty in the estimated spatial distribution, conditional on the probabilistic assumptions and variational approximation adopted by the vbICA framework. Although these two quantities represent distinct aspects of the inversion results, their comparable magnitudes indicate that the residual misfit is of the same order as the uncertainty associated with the estimated IC2 spatial distribution.
5. Discussion
Both the direct time-series inspection and the vbICA decomposition consistently support the following interpretations.
5.1. The Exponentially Decaying Transient Along the Circum-Vesuvian Ring
The point-by-point analysis (Section 4.3.2, Figure 6) and the spatial pattern of IC1 (Figure 13c,e) confirm, over the extended three-decade multi-mission dataset, the existence of localised areas of anomalous subsidence arranged along a ring at approximately 10 km distance from the summit, characterised by an exponentially decaying transient. This behaviour was already suggested by [7] on the basis of the shorter 1993–2010 ERS/ENVISAT series; the present analysis extends the observation window to 2024 and incorporates two additional SAR missions, providing independent evidence that the transient remains identifiable in the longer record. The occurrence of analysed sites on the 2a and 3a geological units (Figure 1a) suggest a possible role of lithological and hydrological heterogeneities in localising or modulating this transient, although the precise mechanism remains to be established through dedicated modelling, which is beyond the scope of the present study.
5.2. Groundwater-Driven Deformation in Eastern Naples
The uplift-then-subsidence pattern observed at points in the eastern sector of Naples (Section 4.3.3, Figure 7) closely tracks the independently documented groundwater history of the area [17]: an artificial depression of the water table caused by industrial pumping through the 1970s–1980s, followed by a rapid post-industrial rebound during the 1990s–2000s and re-stabilisation around 2008. This correspondence, together with the confinement of this signal to the eastern Naples sector (well outside the volcanic edifice) and its clear expression in IC1 (Figure 13c,e), indicates that this component of the deformation field is of anthropogenic–hydrogeological rather than volcanic origin. Recognising and separating such contributions is essential for interpreting complex deformation fields in volcanic areas. More generally, long-term DInSAR observations combined with statistical source separation can help disentangle coexisting volcanic, hydrogeological, and shallow deformation processes.
5.3. Comparison of PCA- and vbICA-Derived Deformation Components
The PCA analysis presented in [7] was performed over a circular region with a radius of 9 km, whereas the vbICA analysis presented here covers a larger area, extending to a radius of 16 km. Extending the PCA analysis to this larger region did not provide a satisfactory separation between the large-scale deformation, possibly associated with a deep source, and the exponentially decaying subsidence observed at distances of approximately 10 km from the crater. In addition, the vbICA analysis excludes the summit area and is restricted to pixels that remain coherent across the ERS/ENVISAT, RADARSAT-2, and Sentinel-1 datasets. The two analyses also cover different time intervals, spanning 1993–2010 for PCA and 1993–2024 for vbICA.
These differences in spatial coverage, temporal extent, and data selection preclude a direct quantitative comparison of the individual spatial and temporal factors associated with IC2 and the second principal component (PC2). Nevertheless, the two components exhibit good qualitative agreement in both their spatial patterns and temporal evolutions over the common spatial domain and overlapping time interval. This correspondence is further supported by Pearson correlation coefficients of 0.76 and 0.84 for the quasi-vertical and eastward displacement spatial patterns, respectively, and 0.92 for their temporal evolutions. It should be noted, however, that correlation coefficients quantify the similarity of spatial distributions and temporal variations, but do not establish equivalence in amplitude.
To extend the comparison beyond the similarity of the individual spatial and temporal factors, we reconstructed the displacement fields associated with IC2 in vbICA and PC2 in PCA by combining their respective spatial patterns and temporal evolutions. At each epoch, we calculated the spatial standard deviation of each reconstructed displacement field over the common set of pixels and compared its temporal evolution over the overlapping observation period (Supplementary Information Figure S3). Expressed in centimetres, this metric quantifies the spatial variability of the displacement contribution associated with each component at a given epoch. Since it is calculated from the reconstructed displacement fields, it is independent of the normalisation adopted for the individual spatial and temporal factors, provided that their product is preserved.
A further aspect to consider in comparing the two results is the source depth. For the comparison with the observations, the modelled spatial patterns reported in [7] were calculated assuming a source depth of 7.3 km. In the present study, however, the inversion misfit varies only marginally for source depths greater than approximately 7.5 km (Supplementary Information Figure S2), indicating that the available data provide limited constraints on this parameter. Accordingly, the difference between the depth adopted in [7] and the approximately 9–10 km depth estimated here should be interpreted in the context of this limited depth resolution, rather than as evidence of a substantial inconsistency between the two results.
Overall, IC2 and PC2 represent deformation components derived from different statistical decomposition methods and datasets with different spatial and temporal coverage. Their spatial patterns, temporal evolutions, and reconstructed displacement contributions show meaningful similarities, supporting a correspondence between the two components. However, this correspondence does not imply that they are uniquely defined or strictly equivalent representations of an independent physical process.
5.4. The 2001 Change in Deformation Regime
Both the velocity-difference map (Figure 10) and the spatial pattern of IC2 (Figure 13d,f) indicate a marked change in the regional deformation regime around 2001, superimposed on, but distinct from, the more localised circum-Vesuvian transient and the eastern Naples hydrogeological signal. This change had already been suggested by [5,7] on the basis of the shorter ERS/ENVISAT series; the extended dataset presented here shows that the associated deformation pattern remains detectable, albeit with temporal modulation, through 2024. Because of its small amplitude and temporal modulation, this signal may go undetected when only short time series are analysed [20].
The spatial pattern associated with this regime change resembles the surface deformation field expected from depressurisation of a source located at several kilometres’ depth [7]. This similarity is consistent with a deep-seated contribution to the observed deformation.
The point-by-point analysis also indicates that, outside the circum-Vesuvian ring and the strictly summit area, the pre-2001 velocity field is characterised by very small vertical motion but a substantial horizontal component. This component is directed eastward in a lobe east of the volcano and westward in a lobe to the west (Figure 9a,d). In the post-2001 period, both the quasi-vertical and eastward velocity components reverse sign, while the relative contribution of the vertical component becomes more significant compared with that of the horizontal component. The difference suggests a change in deformation style, which may reflect either the superposition of multiple processes (e.g., a long-term process continuing beyond 2001 and a second process initiated around that time) or a temporal change in the geometry or physical properties of a single deformation source. In particular, the pre-2001 pattern is consistent with spreading of the volcanic edifice, as previously suggested by [33] on independent grounds.
The geodetically inferred change around 2001 is also temporally consistent with independent geophysical observations. Local seismicity beneath Vesuvio underwent a substantial change around 2001, characterised by a marked, generalised reduction in the number of events and, in particular, by the near-disappearance of earthquakes deeper than about 2 km—depths that had been regularly reached by seismicity before 2001, when hypocentres extended down to about 5 km [15]. The three tiltmeters operating across the turn of the millennium recorded a substantial change in tilt behaviour between the years before and after 2000 [34]; although a straightforward physical interpretation of this change is not possible, in part because of the strong correlation between measured tilt and temperature, its temporal coincidence with the deformation-style change identified here is noteworthy. Fumarolic gas and well-water geochemical measurements independently indicate an increase in the ratio starting around 2002–2003 [35,36]. Caliro et al. [35] suggested that the geochemical variation results from an increase in the relative amount of magmatic fluids in the hydrothermal system. Furthermore, ref. [37] proposed that at least part of the seismic activity at Vesuvio is triggered by diffusion of the degassing pressure front.
Taken together, these independent multi-parametric observations support the interpretation that the deformation regime changed around 2001, in temporal association with changes documented in the deeper magmatic–hydrothermal system of Vesuvio. The available observations, however, do not uniquely determine the physical mechanism responsible for the deformation. In this light, the second independent component (Figure 13b,d,f) indicates that the pre-2001 deformation is compatible with small magma intrusions, whereas the subsequent subsidence may be related to degassing and/or viscoelastic relaxation (e.g., [38]).
These interpretations must be regarded as non-unique. In our analysis, each independent component describes the temporal evolution of a deformation field with a stationary spatial pattern. However, the strong spatial overlap and similar geometries of the pre- and post-2001 deformation fields make it difficult to distinguish between concurrent processes and temporal changes in the properties of a single source using blind source separation techniques. Moreover, the inversion is inherently non-unique, as different source configurations or physical mechanisms may produce comparable displacement patterns. For this reason, we deliberately limit our interpretation to the similarity between the observed deformation field and the displacement pattern expected from a deep, nearly spherical source, without assigning this resemblance a specific physical meaning. Further constraints on the geometry, depth, and physical mechanism of the underlying process will require dedicated source modelling.
5.5. The Post-2014 Slowdown
The point-by-point time series (Section 4.3, Figure 8), the mean velocity maps (Figure 9b,c), and the IC2 temporal evolution (Figure 13b) indicate a moderate slowdown of the post-2001 subsidence trend beginning around 2014–2015, most evident on the southern flank of the volcano. This period is also characterised by an increase in the number of detected earthquakes, with seismicity concentrated mostly within the uppermost 2 km beneath the volcano [15]. Because earthquake detectability and catalogue completeness changed over the study period, however, the temporal coincidence should not be interpreted as evidence of a direct causal relationship. While a comprehensive mechanistic explanation of any geodetic–seismic relationship would require dedicated source modelling beyond the scope of the present study, the temporal correspondence motivates further investigation of possible coupling between the deformation field and the brittle response of the edifice. This possibility warrants further investigation using independent, higher-resolution datasets.
5.6. Methodological Considerations and Limitations
The generally good agreement between the DInSAR and GNSS time series (Section 4.2, Figure 2 and Figure 4) supports the reliability of the multi-mission dataset for the analyses presented here, although residual scatter and, at some stations, data gaps in the GNSS series limit the precision of this validation at the sub-mm/year level. The decomposition into quasi-vertical and eastward components is also subject to the available ascending/descending viewing geometries and to the assumption that the horizontal displacement can be adequately represented by a predominantly eastward component. Consequently, the recovered components should not be interpreted as a complete three-dimensional displacement field, particularly where north–south motion may be significant. In addition, the vbICA analysis is applied after removal of the spatial mean at each epoch and therefore isolates spatially variable deformation; any spatially coherent, nearly uniform component is not represented in the independent spatial patterns. Accordingly, the absence of a spatially uniform contribution from the independent components should not be interpreted as evidence that such a contribution is absent from the deformation field. The vbICA results presented here should therefore be regarded as a separation of spatially variable deformation patterns rather than as a complete decomposition of all sources contributing to the observed displacement.
6. Conclusions
We have presented an analysis of three decades (1993–2024) of multi-mission DInSAR displacement time series at Somma–Vesuvio, combining direct time-series inspection with Variational Bayesian Independent Component Analysis. The multi-mission dataset, validated against levelling and continuous GNSS observations, confirms and extends previous findings based on shorter ERS/ENVISAT series and shows that the long-term deformation field results from the superposition of processes with different spatial and temporal characteristics.
Four main features are identified: (i) a localised, exponentially decaying subsidence transient along a circum-Vesuvian ring at approximately 10 km from the summit; (ii) a distinct, non-volcanic deformation signal in eastern Naples associated with post-industrial groundwater rebound; (iii) a marked change in the regional deformation regime around 2001, spatially consistent with a deep-seated contribution and temporally associated with independent seismic, tilt, and geochemical observations; and (iv) a moderate slowdown of the post-2001 subsidence trend after approximately 2014–2015.
The vbICA decomposition provides a statistically coherent separation of the main spatially variable deformation patterns, isolating the circum-Vesuvian and eastern Naples signals from the deformation pattern centred on the volcano. The latter is consistent with a deep-seated contribution, although the available observations do not uniquely constrain its source geometry, depth, or physical mechanism. The temporal correspondence with seismic, tilt, and geochemical observations provides independent support for a change in the state of the volcanic system, while the DInSAR decomposition demonstrates that shallow and anthropogenic processes contribute substantially to the observed displacement field.
Overall, the results show that long-term DInSAR observations combined with statistical source separation can help disentangle coexisting volcanic, hydrogeological, and shallow deformation processes that would otherwise be superimposed in the observed deformation field. Future work should focus on physical modelling of the deep source responsible for the post-2001 regime and on a more detailed characterisation, including possible hydrological or structural modelling, of the shallow mechanisms driving the circum-Vesuvian transient.
Supplementary Materials
The following supporting information can be downloaded at https://www.mdpi.com/article/10.3390/rs18223885/s1.
Author Contributions
Conceptualization, A.A. and L.C.; methodology, A.A. and L.C.; software, A.A., L.C., F.C. and R.L.; validation, A.A. and L.C.; formal analysis, A.A. and L.C.; investigation, A.A., L.C. and S.V.; resources, A.A., L.C., F.C. and R.L.; data curation, F.C. and R.L.; writing—original draft preparation, A.A. and L.C.; writing—review and editing, A.A., L.C., F.C., R.L. and S.V.; visualization, A.A. and L.C.; supervision, A.A. and L.C.; project administration, L.C. All authors have read and agreed to the published version of the manuscript.
Funding
This work was partly supported by the IREA-DPC (2025–2027) agreement; moreover, we underline that the contents of this paper represent the authors’ ideas and do not necessarily correspond to the official opinion and policies of the Italian Civil Protection Department (DPC)—Presidency of the Council of Ministers.
Data Availability Statement
The displacement time series used in this study are provided in the Supplementary Materials. Continuous GNSS daily position time series are available from the public repository cited in [25]. Further information may be obtained from the corresponding author.
Acknowledgments
We thank the European Space Agency for making the RADARSAT-2 SAR images available to us in the framework of project PP0094512, entitled “Campi Flegrei caldera evolution in between ERS/ENVISAT and Sentinel-1 missions”. We would also like to express our gratitude to Adriano Gualandi for the vbICA code (https://doi.org/10.5281/zenodo.4322548, accessed on 26 September 2026) and to Pasquale Striano for his work on the RADARSAT-2 data processing. We also thank the authors and maintainers of the open-source software used for this study, including GNU Octave (https://octave.org/, accessed on 3 June 2026), GMT (https://www.generic-mapping-tools.org/, accessed on 3 June 2026), Veusz (https://veusz.github.io/, accessed on 3 June 2026), LibreOffice (https://libreoffice.org, accessed on 3 June 2026), and Inkscape (https://inkscape.org/, accessed on 3 June 2026). The authors have reviewed and edited the output and take full responsibility for the content of this publication.
Conflicts of Interest
The authors declare no conflicts of interest.
Abbreviations
The following abbreviations are used in this manuscript:
| DInSAR | Differential Interferometric Synthetic Aperture Radar |
| EOF | Empirical Orthogonal Function |
| GNSS | Global Navigation Satellite System |
| GPS | Global Positioning System |
| IC | Independent Component |
| LOS | Line of Sight |
| NeVoCGPS | Neapolitan Volcano Continuous GPS network |
| PCA | Principal Component Analysis |
| SAR | Synthetic Aperture Radar |
| SBAS | Small BAseline Subset |
| SVD | Singular Value Decomposition |
| vbICA | Variational Bayesian Independent Component Analysis |
References
- Marzocchi, W.; Sandri, L.; Gasparini, P.; Newhall, C.; Boschi, E. Quantifying probabilities of volcanic events: The example of volcanic hazard at Mount Vesuvius. J. Geophys. Res. Solid Earth 2004, 109, B11201. [Google Scholar] [CrossRef] [Scilit]
- Fernández, J.; Pepe, A.; Poland, M.P.; Sigmundsson, F. Volcano Geodesy: Recent developments and future challenges. J. Volcanol. Geotherm. Res. 2017, 344, 1–12. [Google Scholar] [CrossRef] [Scilit]
- Corsa, B.; Barba-Sevilla, M.; Tiampo, K.; Meertens, C. Integration of DInSAR Time Series and GNSS Data for Continuous Volcanic Deformation Monitoring and Eruption Early Warning Applications. Remote Sens. 2022, 14, 784. [Google Scholar] [CrossRef] [Scilit]
- Vilardo, G.; Ventura, G.; Terranova, C.; Matano, F.; Nardò, S. Ground deformation due to tectonic, hydrothermal, gravity, hydrogeological, and anthropic processes in the Campania Region (Southern Italy) from Permanent Scatterers Synthetic Aperture Radar Interferometry. Remote Sens. Environ. 2009, 113, 197–212. [Google Scholar] [CrossRef] [Scilit]
- Amoruso, A.; Gualandi, A.; Crescentini, L. On the Initial Phase of the Ongoing Unrest at Campi Flegrei and Its Relation with Subsidence at Vesuvio (Italy). Remote Sens. 2024, 16, 1717. [Google Scholar] [CrossRef] [Scilit]
- Lanari, R.; De Natale, G.; Berardino, P.; Sansosti, E.; Ricciardi, G.; Borgstrom, S.; Capuano, P.; Pingue, F.; Troise, C. Evidence for a peculiar style of ground deformation inferred at Vesuvius volcano. Geophys. Res. Lett. 2002, 29, 1292. [Google Scholar] [CrossRef] [Scilit]
- Amoruso, A.; Crescentini, L. DInSAR Data Reveal an Intriguing Contemporaneous Onset of Deep Deflation below Vesuvio and the Ongoing Campi Flegrei Uplift. Remote Sens. 2023, 15, 3038. [Google Scholar] [CrossRef] [Scilit]
- Amoruso, A.; Crescentini, L.; Casu, F.; Lanari, R. Kinematic Decomposition of Three Decades of Multi-Mission DInSAR Time Series Reveals Persistent Ground Deformation Geometry at Campi Flegrei Caldera. Remote Sens. 2026, 18, 2476. [Google Scholar] [CrossRef] [Scilit]
- Santacroce, R.; Sbrana, A.; Sulpizio, R.; Zanchetta, G.; Perrone, V.; Bravi, S. Note Illustrative della Carta Geologica d’Italia Alla Scala 1:50.000, F. 448 Ercolano. 2011. Available online: https://www.openaccessrepository.it/records/211760 (accessed on 23 September 2026).
- Cioni, R.; Santacroce, R.; Sbrana, A. Pyroclastic deposits as a guide for reconstructing the multi-stage evolution of the Somma-Vesuvius caldera. Bull. Volcanol. 1999, 60, 207–222. [Google Scholar] [CrossRef] [Scilit]
- Porreca, M.; Acocella, V.; Massimi, E.; Mattei, M.; Funiciello, R.; De Benedetti, A.A. Geometric and kinematic features of the dike complex at Mt. Somma, Vesuvio (Italy). Earth Planet. Sci. Lett. 2006, 245, 389–407. [Google Scholar] [CrossRef] [Scilit]
- Tramparulo, F.D.A.; Vitale, S.; Isaia, R.; Tadini, A.; Bisson, M.; Prinzi, E.P. Relation between alternating open/closed-conduit conditions and deformation patterns: An example from the Somma-Vesuvius volcano (southern Italy). J. Struct. Geol. 2018, 112, 138–153. [Google Scholar] [CrossRef] [Scilit]
- Cole, P.D.; Scarpati, C. The 1944 eruption of Vesuvius, Italy: Combining contemporary accounts and field studies for a new volcanological reconstruction. Geol. Mag. 2010, 147, 391–415. [Google Scholar] [CrossRef] [Scilit]
- Natale, J.; Falasconi, A.; Grillo, T.O.; Bevilacqua, A.; Buono, G.; Favalli, M.; Fornaciai, A.; Frontoni, A.; Giordano, G.; Intrieri, E.; et al. Volcaniclastic deposit failure as a source of pyroclastic density currents during the 1944 eruption of Vesuvius. Volcanica 2026, 9, 497–520. [Google Scholar] [CrossRef] [Scilit]
- Dalla Via, G.; Tramelli, A.; Lo Bascio, D.; Ricciolino, P. Fifty years of seismicity of Mt. Vesuvius. Sci. Rep. 2026, 16, 5973. [Google Scholar] [CrossRef] [Scilit] [PubMed]
- Vitale, S.; Ciarcia, S. Tectono-stratigraphic setting of the Campania region (southern Italy). J. Maps 2018, 14, 9–21. [Google Scholar] [CrossRef] [Scilit]
- Allocca, V.; Coda, S.; Calcaterra, D.; De Vita, P. Groundwater rebound and flooding in the Naples’ periurban area (Italy). J. Flood Risk Manag. 2022, 15, e12775. [Google Scholar] [CrossRef] [Scilit]
- Pepe, A.; Sansosti, E.; Berardino, P.; Lanari, R. On the generation of ERS/ENVISAT DInSAR time-series via the SBAS technique. IEEE Geosci. Remote Sens. Lett. 2005, 2, 265–269. [Google Scholar] [CrossRef] [Scilit]
- Berardino, P.; Fornaro, G.; Lanari, R.; Sansosti, E. A new algorithm for surface deformation monitoring based on small baseline differential SAR interferograms. IEEE Trans. Geosci. Remote Sens. 2002, 40, 2375–2383. [Google Scholar] [CrossRef] [Scilit]
- Amoruso, A.; Salicone, G.; Crescentini, L. Campi Flegrei and Vesuvio, Italy: Ground Deformation Between ERS/ENVISAT and Sentinel-1 Missions from RADARSAT-2 Imagery. Remote Sens. 2025, 17, 3268. [Google Scholar] [CrossRef] [Scilit]
- Casu, F.; Elefante, S.; Imperatore, P.; Zinno, I.; Manunta, M.; De Luca, C.; Lanari, R. SBAS-DInSAR Parallel Processing for Deformation Time-Series Computation. IEEE J. Sel. Top. Appl. Earth Obs. Remote Sens. 2014, 7, 3285–3296. [Google Scholar] [CrossRef] [Scilit]
- Manunta, M.; De Luca, C.; Zinno, I.; Casu, F.; Manzo, M.; Bonano, M.; Fusco, A.; Pepe, A.; Onorato, G.; Berardino, P.; et al. The parallel SBAS approach for Sentinel-1 interferometric wide swath deformation time-series generation: Algorithm description and products quality assessment. IEEE Trans. Geosci. Remote Sens. 2019, 57, 6229–6281. [Google Scholar] [CrossRef] [Scilit]
- Sansosti, E.; Berardino, P.; Manunta, M.; Serafino, F.; Fornaro, G. Geometrical SAR image registration. IEEE Trans. Geosci. Remote Sens. 2006, 44, 2861–2870. [Google Scholar] [CrossRef] [Scilit]
- Pepe, A.; Lanari, R. On the Extension of the Minimum Cost Flow Algorithm for Phase Unwrapping of Multitemporal Differential SAR Interferograms. IEEE Trans. Geosci. Remote Sens. 2006, 44, 2374–2383. [Google Scholar] [CrossRef] [Scilit]
- De Martino, P.; Dolce, M.; Brandi, G.; Scarpato, G.; Tammaro, U. The Ground Deformation History of the Neapolitan Volcanic Area (Campi Flegrei Caldera, Somma–Vesuvius Volcano, and Ischia Island) from 20 Years of Continuous GPS Observations (2000–2019). Remote Sens. 2021, 13, 2725. [Google Scholar] [CrossRef] [Scilit]
- Pingue, F.; Bottiglieri, M.; Godano, C.; Obrizzo, F.; Tammaro, U.; Esposito, T.; Serio, C. Spatial and temporal distribution of vertical ground movements at Mt. Vesuvius in the period 1973–2009. Ann. Geophys. 2013, 56, S0451. [Google Scholar] [CrossRef] [Scilit]
- Choudrey, R.; Roberts, S. Variational mixture of Bayesian independent component analyzers. Neural Comput. 2003, 15, 213–252. [Google Scholar] [CrossRef] [Scilit] [PubMed]
- Gualandi, A.; Liu, Z. Variational Bayesian independent component analysis for InSAR displacement time-series with application to central California, USA. J. Geophys. Res. Solid Earth 2021, 126, e2020JB020845. [Google Scholar] [CrossRef] [Scilit]
- Jolliffe, I.T. Principal Component Analysis, 2nd ed.; Springer: New York, NY, USA, 2002. [Google Scholar]
- Amoruso, A.; Crescentini, L.; Sabbetta, I.; De Martino, P.; Obrizzo, F.; Tammaro, U. Clues to the cause of the 2011–2013 Campi Flegrei caldera unrest, Italy, from continuous GPS data. Geophys. Res. Lett. 2014, 41, 3081–3088. [Google Scholar] [CrossRef] [Scilit]
- Ingber, L. Simulated annealing: Practice versus theory. Math. Comput. Model. 1993, 18, 29–57. [Google Scholar] [CrossRef] [Scilit]
- Giudicepietro, F.; Casu, F.; Bonano, M.; De Luca, C.; De Martino, P.; Di Traglia, F.; Di Vito, M.; Macedonio, G.; Manunta, M.; Monterroso, F.; et al. First evidence of a geodetic anomaly in the Campi Flegrei caldera (Italy) ground deformation pattern revealed by DInSAR and GNSS measurements during the 2021–2023 escalating unrest phase. Int. J. Appl. Earth Obs. Geoinf. 2024, 132, 104060. [Google Scholar] [CrossRef] [Scilit]
- Borgia, A.; Tizzani, P.; Solaro, G.; Manzo, M.; Casu, F.; Luongo, G.; Pepe, A.; Berardino, P.; Fornaro, G.; Sansosti, E.; et al. Volcanic spreading of Vesuvius, a new paradigm for interpreting its volcanic activity. Geophys. Res. Lett. 2005, 32, L03303. [Google Scholar] [CrossRef] [Scilit]
- Ricco, C.; Aquino, I.; Borgstrom, S.E.P.; Del Gaudio, C. 19 years of tilt data on Mt. Vesuvius: State of the art and future perspectives. Ann. Geophys. 2013, 56, S0453. [Google Scholar] [CrossRef] [Scilit]
- Caliro, S.; Chiodini, G.; Avino, R.; Minopoli, C.; Bocchino, B. Long time-series of chemical and isotopic compositions of Vesuvius fumaroles: Evidence for deep and shallow processes. Ann. Geophys. 2011, 54, 137–149. [Google Scholar] [CrossRef] [Scilit]
- Federico, C.; Madonia, P.; Cusano, P.; Petrosino, S. Groundwater geochemistry of the Mt. Vesuvius area: Implications for volcano surveillance and relationship with hydrological and seismic signals. Ann. Geophys. 2013, 56, S0447. [Google Scholar] [CrossRef] [Scilit]
- Saccorotti, G.; Ventura, G.; Vilardo, G. Seismic swarms related to diffusive processes: The case of Somma-Vesuvius volcano, Italy. Geophysics 2002, 67, 199–203. [Google Scholar] [CrossRef] [Scilit]
- Yamasaki, T.; Kobayashi, T.; Wright, T.J.; Fukahata, Y. Viscoelastic crustal deformation by magmatic intrusion: A case study in the Kutcharo caldera, eastern Hokkaido, Japan. J. Volcanol. Geotherm. Res. 2018, 349, 128–145. [Google Scholar] [CrossRef] [Scilit]
Disclaimer/Publisher’s Note: The statements, opinions and data contained in all publications are solely those of the individual author(s) and contributor(s) and not of MDPI and/or the editor(s). MDPI and/or the editor(s) disclaim responsibility for any injury to people or property resulting from any ideas, methods, instructions or products referred to in the content. |
© 2026 by the authors. Licensee MDPI, Basel, Switzerland. This article is an open access article distributed under the terms and conditions of the Creative Commons Attribution (CC BY) license.