


Highlights
What are the main findings?
- •
- A multi-temporal UAV LiDAR and leveling integration framework was developed for monitoring mining-induced surface subsidence in thick unconsolidated-layer coal–cropland areas.
- •
- An LoD95-based uncertainty assessment method was established to distinguish significant elevation changes from measurement noise in UAV LiDAR-derived DEM differences.
What are the implications of the main findings?
- •
- LiDAR-derived subsidence showed a strong relationship with leveling measurements at six strong-subsidence points (R2 = 0.87; RMSE = 29.9 mm), but a weak relationship at six weak-subsidence points (R2 = 0.15).
- •
- Leveling measurements confirmed continued residual subsidence at seven representative points after mining cessation, while UAV LiDAR mapping revealed an increase in the area where cumulative subsidence exceeded 150 mm between December 2025 and June 2026; the mapped area varied with the selected threshold.
Abstract
Mining-induced subsidence affects cropland use and land management in coal–cropland overlapping areas. Leveling provides high-precision subsidence time series but limited spatial sampling, whereas multi-temporal unmanned aerial vehicle light detection and ranging (UAV LiDAR) provides spatially continuous terrain-change information, although the uncertainty of digital elevation model (DEM) differencing must be assessed. Three UAV LiDAR surveys (30 May 2025, 25 December 2025, and 14 June 2026) and leveling measurements (March 2025–April 2026) were combined to analyze subsidence at the 32311 working face of Xutuan Coal Mine, Anhui Province, China, during working-face advance and after mining cessation. The level of detection at the 95% confidence level (LoD95) was calculated from elevation residuals in stable areas, and LiDAR-derived subsidence was validated against leveling measurements at 12 points. The LoD95 values of the two cross-sensor differencing periods were 131.9 and 148.8 mm, indicating that changes smaller than approximately 0.13–0.15 m could not be reliably distinguished from measurement error in this study. Leveling-derived cumulative subsidence at these points ranged from 19.76 to 392.95 mm during 30 May–19 December 2025, comprising 19.76–69.75 mm at the six weak-subsidence points and 185.13–392.95 mm at the six strong-subsidence points. LiDAR-derived subsidence showed a strong relationship with leveling measurements at the six strong-subsidence points (R2 = 0.87, RMSE = 29.9 mm), whereas the relationship was weak at the six weak-subsidence points (R2 = 0.15). At seven representative leveling points, post-cessation residual subsidence accounted for 15.9–31.2% (mean 20.8%) of the final cumulative subsidence recorded during the leveling period. Relative to 30 May 2025, the area with subsidence exceeding 150 mm increased from 15.31 ha on 25 December 2025 to 16.73 ha on 14 June 2026. The two techniques thus provide complementary temporal and spatial information: leveling measurements reveal the persistence of post-cessation subsidence, while UAV LiDAR characterizes changes in the spatial distribution of cumulative subsidence. Continued monitoring after mining cessation is therefore necessary to capture ongoing surface movement and its spatial characteristics.
1. Introduction
Coal resource development helps ensure energy supply but also causes overburden movement and surface subsidence, with lasting impacts on the ecological environment of mining areas and regional sustainability. In coal–cropland overlapping areas, where coal extraction and agricultural production occupy overlapping spaces, underground mining may cause surface subsidence and cropland damage, further intensifying the tension between energy development and food production [1,2]. Accurately characterizing the magnitude, spatial extent, and spatiotemporal evolution of surface subsidence is therefore important for subsidence mitigation, cropland-damage assessment, and land-resource protection [1,2,3]. In the plains of eastern China, coal–cropland overlapping areas are generally characterized by flat terrain and high groundwater tables; mining subsidence can therefore cause water logging and cropland loss, while seasonal crop cover, tillage, field ridges, and drainage ditches continually alter surface conditions and observation quality [1,2,3]. By contrast to coal–cropland overlapping areas, loess gully areas are characterized by complex slope–gully configurations and pronounced local relief. Mining-induced subsidence may overlap with slope deformation and erosion processes. Previous studies have indicated that loess-slope morphology and overburden structure influence mining-induced ground movement, while complex gully terrain also increases the difficulty of ground-point extraction and high-accuracy DEM generation [4,5]. Monitoring strategies and interpretation of results must therefore be tailored to the specific geomorphological and land-cover conditions.
Traditional mine-subsidence monitoring relies primarily on ground-based surveying methods, such as leveling and the global navigation satellite systems (GNSSs). These established methods provide relatively high measurement accuracy and can quantify surface subsidence through repeated observations at fixed monitoring points, thereby generating time series for analyzing surface deformation during working-face advance and after mining cessation [6,7]. However, observations generally depend on discrete points or survey lines, and spatial coverage is constrained by field deployment conditions. Consequently, these methods cannot readily provide continuous characterization of the overall morphology of a subsidence basin, the expansion of its boundaries, or spatial differences across the affected area. Interferometric synthetic aperture radar (InSAR) has been widely used for regional surface-deformation monitoring because it offers broad spatial coverage, repeat observations, and time-series analysis [8,9,10], and it has also been applied to mine-subsidence detection and integrated multi-source monitoring [11,12,13,14]. In agricultural environments, however, crop growth and changes in canopy structure may alter radar backscatter and interferometric coherence. Surface disturbances caused by tillage and harvesting, as well as changes in soil moisture, may also reduce data quality or introduce signals unrelated to deformation, making InSAR deformation time series more difficult to interpret [15,16]. Therefore, in farmland areas with rapidly changing surface cover or low coherence, InSAR-derived deformation should still be validated against ground observations or other high-resolution data.
UAV photogrammetry can acquire high-spatial-resolution imagery at relatively low cost and reconstruct three-dimensional surface geometry using methods such as structure-from-motion (SfM) [17,18]. It has been used for topographic mapping and mine-subsidence monitoring [19,20]. However, photogrammetry depends on image texture, illumination conditions, and multi-view image matching. Ground-elevation reconstruction may be affected when crop canopies obscure the ground, surface texture is insufficient, or image-matching quality deteriorates. In contrast, UAV LiDAR can acquire dense three-dimensional point clouds and may capture some ground returns under certain vegetation-cover conditions, providing three-dimensional observations for ground-point identification and DEM construction [21,22]. Previous studies have applied UAV LiDAR to mine-subsidence monitoring, point-cloud registration, and multi-temporal surface-change analysis [23,24,25,26].
Multi-temporal UAV LiDAR can be used to derive surface-elevation changes through DEM differencing, providing spatially continuous information for analyzing subsidence magnitude, basin morphology, and the extent of affected areas [23,24,25,26]. However, DEM-differencing results contain both actual surface changes and elevation differences unrelated to subsidence. Their uncertainty may arise from differences in sensors and acquisition conditions, point-cloud registration, ground-point classification, DEM interpolation, and local surface disturbances [27,28,29,30]. When the magnitude of actual subsidence is similar to the differencing error, observational noise may be misidentified as surface change. Previous studies have assessed statistical thresholds for topographic-change detection by comparison with high-accuracy check data to distinguish actual terrain changes from measurement errors [31]. Accordingly, multi-temporal LiDAR monitoring of mine subsidence requires not only DEM differencing but also an assessment of differencing uncertainty based on stable areas and validation of the extracted subsidence using independent ground-monitoring data.
Surface movement in mining areas covered by thick unconsolidated layers may continue over time, and residual subsidence may occur after working-face advance has ceased. Previous studies have examined surface-movement and deformation characteristics under thick unconsolidated-layer conditions [32], and post-mining residual subsidence is also relevant to subsequent land-damage assessment [33]. In coal–cropland overlapping areas where cropland is the dominant surface cover, further targeted research is needed to integrate high-precision time series, spatially continuous observations, and uncertainty assessment of DEM differencing, while independently validating areas of significant subsidence.
To address these issues, this study focuses on the 32311 working face at Xutuan Coal Mine in Anhui Province, China, and integrates leveling measurements with multi-temporal UAV LiDAR data to analyze the evolution of surface subsidence during working-face advance and after mining cessation in a coal–cropland overlapping area covered by a thick unconsolidated layer. The specific objectives are to: (1) construct a subsidence time series from leveling observations and analyze working-face advance, changes in subsidence rate, and residual subsidence after mining cessation; (2) determine LoD95 using multi-temporal UAV LiDAR DEM differencing and residual statistics from stable areas, and use leveling measurements to validate the range over which LiDAR-derived subsidence estimates are reliable; and (3) combine the time-series and spatial-differencing results to analyze changes in the subsidence basin and in areas belonging to different subsidence classes.
Rather than proposing a new monitoring technique, this case study (i) assesses the uncertainty and change-detection threshold of cross-sensor UAV LiDAR DEM differencing using stable-area residuals and evaluates the resulting subsidence estimates against leveling measurements across different subsidence magnitudes, and (ii) combines point-based leveling time series with area-based differencing to document post-cessation residual subsidence and its spatial expansion. This study aims to describe the observed spatiotemporal characteristics of subsidence at this working face under its specific geological and mining conditions, and to provide a methodological reference for subsidence monitoring and land-damage assessment in mining areas dominated by cropland.
2. Study Area and Data Acquisition
2.1. Study Area
The study area is located in Xutuan Town, Mengcheng County, Bozhou City, Anhui Province, China. The study site is the 32311 working face of the Xutuan Coal Mine, operated by Huaibei Mining Group. The ground surface is dominated by cropland, and underground coal extraction spatially overlaps with intensive agricultural production, making the area a typical coal–cropland overlapping area (Figure 1).
Figure 1.
Location of the study area and layout of leveling and UAV LiDAR monitoring for the 32311 working face.
The 32311 working face is located in the No. 33 mining district of the Xutuan Coal Mine. It has a strike length of 1301.5 m and a dip length of 240.5 m. The coal seam is approximately 1.8–3.0 m thick, and the average mining depth is 680 m. The working face was mined using fully mechanized longwall mining along strike, with the full-caving method adopted for roof control. Face advance began from the open-off cut in March 2024, and extraction ceased on 14 July 2025. The principal period during which the working face advanced beneath the surface movement monitoring area and directly affected the monitoring network extended from March to July 2025.
The overburden strata above the working face consist primarily of mudstone, siltstone, and fine sandstone. The area is covered by a thick unconsolidated layer approximately 340 m in thickness, composed mainly of fine sand, clay, and sandy clay. The thick unconsolidated layer and the cropland-dominated surface may jointly influence mining-induced subsidence and surface-deformation characteristics, making the area suitable for investigating the spatiotemporal evolution of mining subsidence.
The mining-affected area of the 32311 working face was selected as the primary study area. Figure 1 illustrates the spatial relationships among the working face, the surface monitoring area, and the UAV LiDAR coverage. The 3239 working face is located west of the 32311 working face. Mining at the 3239 working face ceased in November 2020, approximately 4 years before the first leveling survey in this study. Because continuous monitoring data for the 3239 working face are unavailable, it remains uncertain whether residual surface deformation had completely ceased. Subsidence induced by the 3239 working face has resulted in extensive perennial surface waterlogging west of the 32311 working face, making this area unsuitable for the installation of leveling points and the acquisition of UAV LiDAR data. In addition, the 32311 working face is the final working face in the No. 33 mining district, with no adjacent working faces to its east, where cropland and villages are more concentrated. Therefore, this study focuses on the 32311 working face and analyzes the spatiotemporal evolution of surface subsidence during the monitoring period. Because the leveling network was located east of the 32311 working face, on the side opposite the 3239 working face and separated from it by the 32311 panel (dip length 240.5 m), and because the waterlogged area above the 3239 working face was excluded from the LiDAR-derived area statistics (Section 3.5), any residual deformation from the 3239 working face is expected to have had a limited influence on the results, although it cannot be completely ruled out.
2.2. Acquisition of Leveling Data
To obtain high-precision time-series observations of surface subsidence, a surface movement monitoring station was established in the area affected by the 32311 working face of the Xutuan Coal Mine. Fourth-order leveling surveys were conducted using a Leica Sprinter 150M digital level (Leica Geosystems AG, Heerbrugg, Switzerland), with a measurement accuracy of ±1.5 mm km−1. The observation frequency was adjusted according to the stage of subsidence development, averaging one to two surveys per month during the early monitoring period and one survey every two months during the later period. The leveling observations covered the key stages of active mining and post-cessation subsidence, extending from March 2025 to April 2026.
Owing to field constraints associated with cropland, drainage ditches, and other surface features, leveling points could not be installed across the entire subsidence basin. The monitoring network was therefore concentrated mainly east of the 32311 working face. Five monitoring lines were established, including four east–west lines and one north–south line. A total of 53 survey points were installed, comprising three control points and 50 monitoring points. To adequately capture the morphology of the subsidence basin, the spacing between adjacent monitoring points was maintained at 40–50 m. The locations of the leveling points are shown in Figure 1.
2.3. Acquisition of Multi-Temporal UAV LiDAR Data
The study area is a typical coal–cropland overlapping area dominated by agricultural land. Seasonal crop canopies can obstruct observations of the ground surface, making it difficult for conventional aerial photogrammetry to directly retrieve reliable bare-earth elevations. UAV LiDAR was therefore employed because, as an active ranging technique, it can obtain ground returns through gaps in low vegetation and crop residue and is less dependent on image texture and illumination than photogrammetry.
To improve consistency in data acquisition across survey periods, the same flight parameters were adopted during UAV LiDAR data acquisition, including a flight altitude of 100 m, a flight speed of 10 m/s, a forward overlap of 80%, and a side overlap of 40%. RGB images were also recorded by the integrated cameras, mainly for point-cloud colorization; because the flight configuration (e.g., the 40% side overlap) was designed for LiDAR acquisition rather than photogrammetric reconstruction, these images were not used for SfM reconstruction, and no quantitative comparison between LiDAR and photogrammetry-derived DEMs was performed. Detailed information on the point cloud datasets is provided in Table 1. However, The UAV LiDAR data were acquired using two different LiDAR systems: an EasyScan X10 system (EPiC LiDAR Tech Co., Ltd., Wuhan, China) and a Zenmuse L2 system (SZ DJI Technology Co., Ltd., Shenzhen, China).Although consistent flight parameters helped reduce differences in acquisition conditions, they could not completely eliminate systematic errors associated with sensor differences. All three surveys were conducted during periods of low crop cover: the May 2025 and June 2026 surveys were conducted shortly after the winter-wheat harvest, when the fields were mainly covered by stubble and crop residue, whereas the December 2025 survey was conducted during the early growth stage of winter wheat, when the seedlings were short. Even when small amounts of crop residue remained, some laser pulses could pass through gaps in the vegetation and reach the ground, generating ground returns that facilitated ground-point extraction. Points reflected from stubble, crop residue, and wheat seedlings were treated as non-ground points during ground filtering (Section 3.3); no additional crop-height correction was applied, and the possible influence of residual low-vegetation returns is discussed in Section 5.3.
Table 1.
Data acquisition and quality parameters of UAV LiDAR point clouds.
All point counts and point densities were calculated within the common LiDAR monitoring area shown in Figure 1, with a total area of 398,125.81 m2.
UAV LiDAR effectively complements the limited spatial sampling of leveling surveys by providing a basis for spatially continuous monitoring of surface changes and analysis of subsidence patterns.The UAV LiDAR systems used in the three surveys and the field acquisition process are shown in Figure 2.
Figure 2.
Field acquisition of multi-temporal UAV LiDAR data.
3. Materials and Methods
3.1. Integrated Multi-Source Monitoring Framework
Mining-induced surface subsidence exhibits pronounced spatiotemporal evolution, and a single monitoring technique cannot simultaneously provide high-precision time-series measurements and spatially continuous information across large spatial extents. To exploit the complementary advantages of different observation techniques, this study integrated leveling measurements with multi-temporal UAV LiDAR observations and developed an integrated multi-source framework for monitoring mining-induced subsidence.
The framework consists of three core components. First, DEMs were generated from the multi-temporal UAV LiDAR datasets and differenced to derive spatially continuous elevation changes, while elevation residuals in stable areas were statistically analyzed to determine reliable change-detection thresholds. Second, leveling measurements were used to construct a high-precision subsidence time series and independently validate the spatial subsidence estimates derived from UAV LiDAR. Finally, the temporal information obtained from leveling and the spatial information derived from UAV LiDAR were jointly analyzed to characterize subsidence evolution during working-face advance and after mining cessation. The overall workflow is illustrated in Figure 3. The arrows indicate the processing sequence and data flow, and the differently colored boxes represent data processing and analysis, validation, and spatial characterization, respectively.
Figure 3.
Technical workflow for spatiotemporal analysis of surface subsidence based on leveling monitoring and UAV LiDAR data.
3.2. Construction of the Leveling-Derived Subsidence Time Series and Analysis of the Response to Working-Face Advance
The leveling observations obtained on 8 March 2025 were used as the initial elevations, and the cumulative subsidence at each monitoring point during the observation period was calculated relative to this initial survey. The leveling points were located mainly east of the 32311 working face and were arranged along monitoring lines A, B, C, D, and E. The cumulative subsidence derived from leveling measurements therefore represents the cumulative change relative to the initial survey on 8 March 2025 and does not include subsidence that occurred before that date. Thus, it should not be interpreted as the total subsidence since mining commenced in 2024.
First, the elevation stability of control points K1, K2, and K3 was assessed. Taking the initial elevation as the reference, the elevation change at each control point during each survey was calculated, and its range and standard deviation were used to evaluate the stability of the leveling reference:
where is the elevation change at control point j during survey t relative to the initial survey; and and are the elevations of control point j during the initial and t-th surveys, respectively.
After confirming the stability of the control points, the cumulative subsidence at each monitoring point was calculated as follows:
where is the cumulative subsidence at monitoring point i during survey t, expressed in millimeters; is the initial elevation measured on 8 March 2025; and is the elevation measured during survey t. In this study, indicates downward surface displacement.
To characterize the development of subsidence, the interval subsidence and interval-averaged subsidence rate between two consecutive surveys were calculated as follows:
where is the subsidence occurring between two consecutive surveys, is the corresponding interval-averaged subsidence rate, and is the number of days between the two surveys.
To further investigate the relationship between working-face advance and surface subsidence, records of the working-face front position and advance distance at different stages were obtained from the mine operator. The positions of the monitoring points and the working-face front were projected onto the direction of face advance. When the dates of the working-face records did not coincide with the leveling-survey dates, linear interpolation was used to estimate the position of the working-face front on the corresponding observation date. The projected distance between monitoring point i and the working-face front during survey t was calculated as follows:
where is the projected position of monitoring point i along the direction of face advance, and is the projected position of the working-face front during survey t. A value of indicates that the working face had not yet reached the projected position of the monitoring point, whereas indicates that the working face had already passed that position.
The cumulative subsidence and interval-averaged subsidence rates at each monitoring point were used to identify the onset, rapid-development, and deceleration stages of surface subsidence. The midpoint of the observation interval containing the maximum interval-averaged subsidence rate was taken as the approximate time of the peak response. Because Equation (4) yields interval-averaged rather than instantaneous rates, this timing is uncertain by up to half of the corresponding survey interval (approximately 5–9 days during the active mining stage). The response time lag between the peak subsidence rate and the passage of the working face was calculated as follows:
where is the approximate time at which the maximum interval-averaged subsidence rate occurred at monitoring point i, and is the time at which the working face passed the projected position of that point. The surface response to working-face advance was analyzed by combining the response time lag with the relative position of the working face when the peak subsidence rate occurred. The calculations were performed for all valid monitoring points, and representative points with pronounced subsidence responses were selected for detailed analysis.
Mining at the 32311 working face ceased on 14 July 2025, and the final leveling survey was conducted on 7 April 2026. For each representative leveling point, the cumulative subsidence at the mining cessation date was estimated by linear interpolation between the two consecutive leveling surveys bracketing that date. Post-cessation residual subsidence was calculated as the difference between cumulative subsidence at the final leveling survey and the interpolated cumulative subsidence at mining cessation. The residual-subsidence ratio was calculated as the post-cessation residual subsidence divided by the final cumulative subsidence, expressed as a percentage. The final cumulative subsidence was referenced to the initial leveling survey on 8 March 2025. These calculations were performed for seven representative leveling points.
3.3. Multi-Temporal UAV LiDAR Subsidence Monitoring and Uncertainty Assessment
The three point-cloud datasets were processed using TerraScan CONNECT Edition, version 18.4 (Terrasolid Ltd., Helsinki, Finland), running within MicroStation CONNECT Edition (Bentley Systems, Inc., Exton, PA, USA), following a consistent workflow. Noise points were removed, and ground points were classified using the progressive TIN densification algorithm. The automatically classified point clouds were subsequently inspected, and misclassified points were manually corrected. Triangulated irregular networks were then constructed from the classified ground points, and DEMs with a spatial resolution of 0.5 m were generated using linear interpolation.
To ensure comparability among the multi-temporal datasets, all three DEMs were referenced to the same China Geodetic Coordinate System 2000 (CGCS2000) horizontal coordinate system and a consistent ellipsoidal-height reference. DEM differencing and the associated uncertainty assessment were subsequently performed.
It should be noted that, despite the use of a consistent processing workflow and spatial reference system for all three datasets, differences in point-sampling characteristics remain among the sensors. Consequently, multi-temporal DEM differencing results may still be affected by sensor characteristics, ground-point extraction, and interpolation. The uncertainty of the differencing results was assessed using elevation-difference residual statistics from stable areas, and these limitations were considered when interpreting the results.
The DEM acquired on 30 May 2025 was used as the initial reference for subsidence monitoring. The cumulative subsidence derived from leveling measurements and that derived from LiDAR differencing are referenced to their respective initial observation dates. Therefore, the cumulative-change periods represented by the two datasets are not exactly the same.
Cumulative elevation changes over the two monitoring periods were calculated as follows:
where , , and , are the elevations at location (x,y) in the DEMs acquired in May 2025, December 2025, and June 2026, respectively. and represent the cumulative elevation changes during the two monitoring periods. A value of indicates surface subsidence. In addition, the DEM difference between 25 December 2025 and 14 June 2026, , which was derived from two datasets acquired with the same sensor model (Zenmuse L2), was used only to compare the stable-area residuals of same-sensor and cross-sensor differencing (Section 4.1); Equations (9)–(12) were applied to in the same way (t = 3).
Because the LiDAR datasets were acquired using different sensor systems, the elevation residuals in the stable areas exhibited a certain degree of spatial variability. A single constant vertical correction could not adequately remove this spatially heterogeneous error. Therefore, no uniform vertical shift was applied to the DEMs. Instead, sensor-related differences, ground-point classification errors, DEM interpolation errors, and other sources of uncertainty were jointly incorporated into the uncertainty assessment of the DEM-differencing results.
Concrete pavements located outside the mining-affected area were selected as stable areas. These surfaces showed no evidence of reconstruction, excavation, or substantial surface modification during the monitoring period. The stable areas were distributed across different parts of the study area, while road edges, drainage ditches, and other potentially unstable features were excluded. The same stable-area boundaries were used for all three DEM-differencing results to ensure the comparability of the uncertainty estimates. Their locations are shown in Figure 1. A total of 11 stable-area polygons were selected, and all were included in the uncertainty assessment. Their total area was 2649.69 m2, with individual polygon areas ranging from 76.305 to 699.043 m2 (mean: 240.881 m2).
Assuming that no actual elevation change occurred within the stable areas during the monitoring period, the elevation residual at the j-th valid pixel in the t-th DEM-differencing result was defined as
The mean error and standard deviation were used to characterize the systematic bias and dispersion of the stable-area residuals, respectively:
where is the mean error of the stable-area residuals for the t-th DEM-differencing result, is the corresponding standard deviation, and n is the number of valid pixels.
Given that the residuals in the stable areas were approximately normally distributed, a conservative level-of-detection threshold incorporating both the mean residual bias and random dispersion was calculated as follows:
where is the conservative level of detection at the 95% confidence level for the t-th DEM-differencing result. Pixels whose absolute elevation changes did not exceed the corresponding threshold were classified as areas of non-significant elevation change:
3.4. Agreement Assessment of Multi-Source Subsidence Measurements
To evaluate the reliability of incremental subsidence extracted from DEM differencing, the result, representing the DEM difference between 30 May 2025 and 25 December 2025, was selected for comparison with the corresponding leveling-derived subsidence. The UAV LiDAR data and leveling measurements on 30 May 2025 were acquired on the same day, whereas the UAV LiDAR survey on 25 December 2025 was conducted 6 days after the corresponding leveling survey (19 December 2025). Leveling measurements showed that the maximum interval-averaged subsidence rate during the preceding observation interval (19 November–19 December 2025) was 0.35 mm d−1. Assuming that the subsidence rate during the subsequent 6 days did not exceed this value, the potential subsidence change associated with the temporal offset was estimated to range from 0 to 2.1 mm. This upper bound is less than 1% of the mean leveling-derived subsidence of the strong-subsidence group (305.4 mm) and less than 2% of the LoD95 of (131.9 mm), suggesting that the temporal offset had a limited influence on the consistency assessment between UAV LiDAR-derived and leveling-derived subsidence. Therefore, the two datasets were considered sufficiently close in time for comparison in the validation analysis.
The UAV LiDAR-derived subsidence at each leveling point was extracted from the DEM-differencing result using the corresponding point coordinates. To reduce the influence of errors associated with individual DEM pixels, a buffer with a radius of 1 m was established around each leveling point. The mean value of all valid pixels within the buffer was used as the UAV LiDAR-derived incremental subsidence at that point:
where is the incremental subsidence derived from UAV LiDAR at the i-th leveling point, is the number of valid pixels within the 1 m-radius buffer surrounding that point, and is the DEM-differencing value of the p-th valid pixel within the buffer.
The corresponding leveling-derived incremental subsidence is denoted by and was calculated as the difference between the cumulative leveling-derived subsidence values at the beginning and end of the comparison period (30 May and 19 December 2025, respectively). The difference between the UAV LiDAR-derived and leveling-derived results was calculated as follows:
where is the difference between the UAV LiDAR-derived and leveling-derived subsidence at leveling point i, is the UAV LiDAR-derived incremental subsidence, and is the corresponding leveling-derived incremental subsidence.
The mean error, mean absolute error, root mean square error, and coefficient of determination were used to assess the agreement between the two datasets:
where n is the number of leveling points included in the validation. was used to identify any systematic bias in the UAV LiDAR-derived results, whereas and were used to quantify the magnitude of the differences between the two datasets. The Pearson correlation coefficient (r) and the corresponding p-value were used to evaluate the direction, strength, and statistical significance of the linear association between UAV LiDAR-derived and leveling-derived subsidence values. The coefficient of determination (R2), calculated as the square of r (Equation (19)), was used to describe the goodness of fit of the linear relationship between the two datasets.
3.5. Spatial Characterization and Statistical Analysis of UAV LiDAR-Derived Subsidence
Spatial distribution maps of incremental subsidence were generated for the two monitoring periods using the and DEM-differencing results defined in Section 3.3. Specifically, represents the incremental subsidence from 30 May to 25 December 2025 and characterizes the spatial pattern of subsidence from the late stage of working-face extraction to the early post-cessation period. represents the incremental subsidence over the entire UAV LiDAR monitoring period from 30 May 2025 to 14 June 2026 and was used to characterize the overall development of the subsidence basin during the monitoring period. Here, incremental subsidence refers to the subsidence accumulated since the reference LiDAR survey of 30 May 2025.
To ensure comparability among the spatial subsidence results, maps for the different monitoring periods were produced using a consistent classification scheme. Subsidence contours based on the same threshold levels were superimposed on each map to facilitate comparison of the spatial expansion of the subsidence basin, the location of the subsidence center, and the development of high-subsidence zones during the different monitoring periods.
To reduce the influence of localized anomalous pixels on the estimation of maximum subsidence, connected-component analysis was first applied to the subsidence patches in the DEM-differencing results. Isolated patches containing fewer than 10 pixels were regarded as noise and removed. The 99th percentile of the remaining subsidence pixels was then defined as the robust maximum incremental subsidence for the corresponding monitoring period.
Before calculating the subsidence-affected areas, the waterlogged area above the 3239 working face was excluded from the statistical region. Areas in which incremental subsidence exceeded the specified classification thresholds were extracted from the DEM-differencing results, and the subsidence-affected area corresponding to each threshold was calculated as
where is the area in which incremental subsidence exceeds threshold T, is the number of valid pixels satisfying the corresponding threshold, and s is the DEM pixel size.
4. Results
4.1. Uncertainty in Multi-Temporal UAV LiDAR DEM Differencing and Assessment of the Subsidence-Detection Threshold
The DEM-differencing result for 30 May–25 December 2025 contained 10,361 valid residual pixels, with a mean error (ME) of −14.7 mm and a standard deviation (SD) of 59.8 mm. The DEM-differencing result for 30 May 2025–14 June 2026 contained 10,399 valid residual pixels, with corresponding ME and SD values of −22.8 mm and 64.3 mm. The DEM-differencing result for 25 December 2025–14 June 2026 contained 10,460 valid residual pixels, with an ME of −7.9 mm and an SD of 25.8 mm. The statistical characteristics of the elevation-difference residuals and the corresponding LoD95 values are summarized in Table 2.
Table 2.
Statistical characteristics and levels of detection of DEM difference residuals in stable areas.
The three DEM-differencing results obtained from the selected stable areas showed that the LoD95 values for the cross-sensor differencing periods from 30 May 2025 to 25 December 2025 and from 30 May 2025 to 14 June 2026 were 131.9 and 148.8 mm, respectively, whereas the LoD95 for the differencing period from 25 December 2025 to 14 June 2026, using data acquired with the same Zenmuse L2 model, was 58.4 mm. For the first two differencing periods, the sensor combination remained unchanged. Because the three differences form a closed loop ( = + ), their stable-area statistics can be used to approximate the error contributions of individual surveys. This variance decomposition assumes that the selected stable areas experienced no actual elevation changes during the observation periods and that the survey-specific errors at the three acquisition epochs were mutually independent, such that cross-epoch covariance terms could be neglected. Under this assumption, the variance of each difference can be approximated by the sum of the error variances of the two surveys involved. If shared systematic errors or correlated errors exist between surveys, this variance relationship may not strictly hold. Therefore, the resulting survey-specific standard deviations should be interpreted as approximate estimates conditional on the independence assumption.
Based on this decomposition, the estimated standard deviations were approximately 59.4 mm for the May 2025 EasyScan X10 survey, 7.3 mm for the December 2025 Zenmuse L2 survey, and 24.7 mm for the June 2026 Zenmuse L2 survey. The May 2025 survey accounted for most of the estimated variance in both cross-sensor differences (approximately 98% for and 85% for ). The 16.9 mm increase in LoD95 from to may be partly associated with the relative bias between the December 2025 and June 2026 surveys (ME of = −7.9 mm) and the larger estimated error dispersion of the June 2026 survey. In addition, the lower ground-point density in June 2026 (9.35 points m−2), compared with December 2025 (11.58 points m−2), may have reduced the spatial sampling support for DEM interpolation and contributed to the larger error dispersion. Furthermore, the May 2025 survey had a substantially lower ground-point density (1.92 points m−2) than the two Zenmuse L2 surveys (9.35–11.58 points m−2), together with differences in sensor model and acquisition conditions. These factors may jointly influence DEM-differencing uncertainty; however, their independent contributions cannot be quantitatively isolated using the available data.
As shown in Figure 4, the two residual distributions (30 May–25 December 2025 and 30 May 2025–14 June 2026) exhibit unimodal, approximately bell-shaped patterns, with most values concentrated around zero and no clear multimodal structure. These characteristics are consistent with an approximately normal distribution of the stable-area residuals, supporting the use of normal-distribution-based statistics to assess uncertainty in DEM differencing. Compared with the residuals for 30 May 2025–25 December 2025, those for 30 May 2025–14 June 2026 show a slight shift in the distribution center toward negative values, accompanied by an increase in SD of 4.5 mm. Nevertheless, the overall distribution shapes and degrees of dispersion are similar, indicating comparable uncertainty levels for these two cross-sensor DEM-differencing periods.
Figure 4.
Frequency distributions of DEM difference residuals in stable areas: (a) 30 May–25 December 2025; (b) 30 May 2025–14 June 2026.
Given that the LoD95 values for the two cross-sensor DEM-differencing periods were 131.9 and 148.8 mm, respectively, a conservative common threshold of 150 mm was adopted for subsequent mapping of the spatial distribution of subsidence and calculation of subsidence-affected areas. This threshold was selected to ensure comparability among monitoring periods and does not imply that all periods have the same LoD95. Areas exceeding nested thresholds of 150, 300, and 600 mm were further extracted to characterize the spatial expansion of subsidence during different monitoring periods.
4.2. Validation of UAV LiDAR-Derived Subsidence Against Leveling Measurements
The elevation-stability statistics for the control points are presented in Table 3. Control points K1, K2, and K3 exhibited only minor elevation variations during the observation period, with standard deviations of 0.58, 0.80, and 1.21 mm, respectively. These results confirm that the control points remained stable and were suitable for calculating the leveling-derived subsidence.
Table 3.
Elevation stability statistics of control points K1, K2, and K3.
To validate the UAV LiDAR-derived subsidence estimates after accounting for uncertainty, representative leveling points were selected as independent validation samples. The points were classified into strong and weak-subsidence groups according to the subsidence magnitudes measured by leveling. Considering that the LoD95 values for the two DEM-differencing periods were 131.9 mm and 148.8 mm, respectively, a threshold of 150 mm was adopted for grouping. The selection also considered the spatial distribution of points across different monitoring lines and locations within the study area, while maintaining equal sample sizes in the two groups. A total of 12 points were selected, including six points with leveling-derived subsidence exceeding 150 mm in the strong-subsidence group and six points with subsidence clearly below this threshold in the weak-subsidence group. Detailed results are presented in Table 4.
Table 4.
Comparison between leveling-derived (30 May–19 December 2025) and UAV LiDAR derived (30 May–25 December 2025) subsidence at the validation points.
Based on the leveling measurements, cumulative subsidence ranged from 185.13 to 392.95 mm in the strong-subsidence group and from 19.76 to 69.75 mm in the weak-subsidence group. The 12 validation points covered an overall subsidence range of 19.76–392.95 mm. The signed differences between LiDAR and leveling measurements ranged from −36.87 to 42.18 mm in the strong-subsidence group and from −63.62 to 77.70 mm in the weak-subsidence group, indicating differences in point-wise agreement between the two measurement methods under different subsidence magnitudes.
Equation (4) yields interval-averaged rates and does not assume that subsidence developed linearly over the whole monitoring period, which was clearly nonlinear. In the validation, Equation (4) was used only to bound the effect of the 6-day offset between the leveling and LiDAR surveys in December 2025 (Section 3.4). This offset fell within the deceleration stage. The maximum interval-averaged subsidence rate during the preceding observation interval (19 November–19 December 2025) was 0.35 mm d−1, and the rates decreased further in the following interval (19 December 2025–3 February 2026). Assuming that the subsidence rate during the subsequent 6 days did not exceed this observed maximum, the potential subsidence change associated with the temporal offset was estimated to range from 0 to 2.1 mm. For the strong-subsidence group, the mean subsidence was 305.4 mm from leveling (30 May–19 December 2025, 203 days) and 314.0 mm from UAV LiDAR (30 May–25 December 2025, 209 days); when each value was normalized by its own observation period, both corresponded to a mean rate of approximately 1.50 mm d−1. This agreement supports the comparability of the two datasets, whereas the temporal evolution of subsidence was characterized using the stage-specific interval-averaged rates rather than a single linear rate.
The 12 points were selected as representative samples according to the objectives of this study and did not include all available leveling points. Because the selection focused on comparing monitoring results under strong and weak-subsidence conditions, the validation conclusions mainly apply to the selected subsidence magnitude ranges and should not be interpreted as an overall accuracy assessment of all leveling points.
As shown in Figure 5, the leveling-derived and UAV LiDAR-derived subsidence values in the strong-subsidence group showed a strong positive correlation (r = 0.93, p < 0.01; ME = 8.66 mm, MAE = 26.62 mm, RMSE = 29.87 mm; Figure 5a). This strong linear relationship indicates that UAV LiDAR reliably captured surface-subsidence variations in areas where the magnitude of subsidence clearly exceeded the change-detection threshold. The two monitoring methods also showed broadly consistent variation patterns, indicating that the uncertainty-constrained DEM-differencing results effectively captured the principal subsidence signals. The RMSE of this group (29.87 mm) is considerably smaller than the pixel-level LoD95 (131.9 mm), partly because the LiDAR values were averaged within a 1 m buffer around each point (Section 3.4), which reduces random pixel-level noise.
Figure 5.
Consistency comparison between leveling and UAV LiDAR-derived subsidence measurements: (a) scatter comparison and linear fitting; (b) residual distribution of subsidence estimates.The dashed gray horizontal line in panel (b) indicates zero residual.
In contrast, the relationship between the two datasets was substantially weaker in the weak-subsidence group, showing a weak and statistically non-significant negative correlation (r = −0.38, p = 0.45; ME = −10.83 mm, MAE = 48.67 mm, RMSE = 51.55 mm). This result indicates that agreement between UAV LiDAR and leveling measurements decreased when the subsidence magnitude was below the LoD95 threshold. All six LiDAR-derived values in this group (−1.45 to 117.58 mm) were below the LoD95 of and would therefore be classified as non-significant changes, which is consistent with the uncertainty assessment. This reduction in agreement can mainly be attributed to the similar magnitudes of the weak subsidence signal, DEM-differencing uncertainty, microtopographic changes, and localized environmental disturbances, which made it difficult to reliably distinguish actual subsidence from observational noise.
Overall, the reliability of UAV LiDAR-based subsidence monitoring was strongly dependent on the magnitude of subsidence. In the principal subsidence-affected areas, where elevation changes exceeded the change-detection threshold, multi-temporal UAV LiDAR provided reliable spatially continuous subsidence information. In areas of weak deformation below the detection threshold, however, UAV LiDAR-derived changes should be interpreted cautiously and evaluated in conjunction with ground-based observations or other remote-sensing data.
4.3. Spatial Evolution Characteristics of Subsidence Derived from UAV LiDAR
Based on the LoD95 uncertainty-assessment results, a threshold of 150 mm was adopted as the lower limit for identifying effective subsidence. Areas exceeding three nested thresholds (150, 300, and 600 mm) were further extracted to analyze the spatial distribution and extent of subsidence during different monitoring periods. In addition, representative profiles were extracted from the cumulative incremental subsidence result for 30 May 2025–14 June 2026 to further characterize the morphology of the subsidence basin at the end of the monitoring period.
In Table 5, the areas corresponding to D > 140 mm, D > 150 mm, D > 160 mm, D > 300 mm, and D > 600 mm represent the areas where cumulative subsidence exceeded the respective thresholds during each monitoring period. To evaluate the influence of the 150 mm subsidence threshold on the statistical results of the subsidence-affected area, additional sensitivity analyses were conducted using two adjacent thresholds of 140 and 160 mm. The results are presented in Table 5. From May 2025 to December 2025, the areas where subsidence exceeded 140, 150, and 160 mm were 15.82, 15.31, and 14.81 ha, respectively. From May 2025 to June 2026, the corresponding areas increased to 17.38, 16.73, and 16.13 ha, with area increases of 1.56, 1.42, and 1.32 ha, respectively, corresponding to relative increases of 9.9%, 9.3%, and 8.9%. Overall, within the threshold range of 140–160 mm, the mapped subsidence areas showed an increasing trend, indicating that the direction of spatial change was relatively consistent, although the specific mapped areas were affected by threshold selection.
Table 5.
Areas exceeding different subsidence thresholds extracted from UAV LiDAR data.
As shown in Figure 6, the subsidence-affected area exhibited an overall spatial pattern of outward expansion from the mined-out area toward the surrounding areas. As shown in Table 5, under the two higher subsidence thresholds of 300 and 600 mm, the mapped areas also increased by 0.90 and 0.46 ha, corresponding to relative increases of 9.5% and 15.1%, respectively. Meanwhile, the robust maximum incremental subsidence increased from 1062 to 1149 mm, an increase of 87 mm (8.2%). The mapped areas exceeding the selected cumulative-subsidence thresholds were larger in June 2026 than in December 2025. Areas with pronounced subsidence were mainly concentrated in the central part of the mined-out area, whereas areas with relatively low subsidence were mainly distributed in the peripheral transition zone.
Figure 6.
Spatial distribution and evolution of mining subsidence based on multi-temporal UAV LiDAR: (a) May 2025–December 2025; (b) May 2025–June 2026. The dated lines indicate the mining advance positions on 10 March, 29 May, and 14 July 2025, while the working-face boundary delineates the 32311 working face.
To further characterize the profile morphology of the subsidence basin, representative profiles were extracted from the cumulative incremental subsidence result for May 2025–June 2026 along the direction of working-face advance and the direction perpendicular to face advance. As shown in Figure 7, the subsidence basin exhibited a distinct spatial morphology characterized by a deep center and gently sloping margins. The extracted profiles passed through the location of maximum subsidence and clearly illustrated the basin width, the position of the subsidence center, and the variation in subsidence gradients, which is consistent with the basin-shaped spatial pattern shown in Figure 6. Along the direction of working-face advance, the profile changed relatively continuously, and the transition from the high-subsidence zone toward the peripheral area was clearly defined. In contrast, the profile perpendicular to face advance exhibited more pronounced local undulations, especially within the high-subsidence zone and its transitional area. This suggests that subsidence in different directions may be locally affected by cropland microtopography, field ridges, and drainage ditches, although the overall pattern still showed a gradual decrease in subsidence from the basin center toward the periphery.
Figure 7.
Typical subsidence profiles extracted from UAV LiDAR DEM differencing results: (a) strike-direction profile; (b) dip-direction profile.
Overall, the multi-temporal UAV LiDAR results indicate that mining-induced subsidence was characterized by changes in the spatial extent and basin morphology of the cumulative subsidence area. The cumulative subsidence profiles further revealed the spatial structure of the subsidence basin at the end of the monitoring period. These results provide a spatial basis for subsequent land-damage assessment.
4.4. Temporal Evolution of Subsidence and Its Response to Mining Revealed by Leveling Measurements
4.4.1. Temporal Evolution of Subsidence
Based on the leveling observations obtained up to 7 April 2026, the maximum cumulative subsidence occurred at point B1, reaching 548.13 mm. The cumulative subsidence values at points E1, E2, A1, C1, and B2 were 527.84, 490.12, 408.38, 360.40, and 339.05 mm, respectively, indicating substantial spatial differences in subsidence magnitude among the monitoring locations.
As shown in Figure 8a, within 500 m of the starting point of each monitoring line, cumulative subsidence decreased rapidly from the initial end toward the distal end. The largest subsidence occurred near the starting ends of lines B and E, whereas line D exhibited relatively small subsidence overall. The principal subsidence gradients along the monitoring lines were concentrated within the first 200 m, while subsidence generally remained at a relatively low level beyond approximately 300 m.
Figure 8.
Spatial and temporal characteristics of surface subsidence revealed by leveling monitoring: (a) final cumulative subsidence profiles along monitoring lines A–E; (b) cumulative subsidence time series at representative leveling points.
As shown in Figure 8b, cumulative subsidence at the monitoring points increased rapidly during the early monitoring period as the working face continued to advance, and the plotted subsidence curves showed a pronounced downward trend. Monitoring points closer to the mining center experienced greater subsidence and more substantial cumulative changes. After mining cessation, the subsidence rates gradually decreased; however, cumulative subsidence continued to increase at all monitoring points, indicating that surface movement did not cease immediately.
Figure 9 further quantifies the intensity of subsidence development during the different observation intervals. From 8 March to 8 May 2025, surface subsidence developed slowly. During the period from 8 May to 16 July 2025, both the maximum interval subsidence and the maximum interval-averaged subsidence rate at point E1 reached their highest values over the entire observation period, indicating that this was the most intensive stage of surface subsidence. After 14 August 2025, both interval subsidence and interval-averaged subsidence rates remained relatively low, and surface subsidence gradually entered the deceleration stage.
Figure 9.
Maximum stage subsidence increment and maximum stage subsidence rate during different observation intervals.
Overall, the subsidence processes observed at the different monitoring points demonstrate pronounced temporal persistence. The continued surface response after mining cessation therefore requires evaluation through sustained monitoring.
4.4.2. Response to Working-Face Advance and Evolution of Post-Cessation Residual Subsidence
Figure 10a shows the relationship between working-face advance and the maximum cumulative subsidence. Beginning on 10 March 2025, the working face entered the principal period of influence on the surface movement monitoring station. By the cessation of mining on 14 July 2025, the cumulative advance distance had reached 382.34 m. During working-face advance, the maximum cumulative subsidence increased rapidly with increasing advance distance and had reached approximately 428.4 mm by the time mining ceased. After mining cessation, the advance distance remained unchanged, whereas the maximum cumulative subsidence continued to increase, reaching 548.13 mm by 7 April 2026. This result indicates that surface subsidence continued to develop after extraction had ceased.
Figure 10.
Response characteristics of leveling-derived subsidence to the advance of the 32311 working face: (a) temporal relationship between cumulative face advance and maximum cumulative subsidence; (b) migration of peak subsidence response along the face advance direction.
To further characterize the surface response during working-face advance, representative monitoring points D1, E3, C1, E2, B1, E1, and A1 were selected, and their maximum interval-averaged subsidence rates and response time lags were analyzed for different stages of face advance. As shown in Figure 10b and Table 6, the maximum interval-averaged subsidence rates at these monitoring points ranged from 2.24 to 7.72 mm d−1, with marked differences among locations. Point E1 exhibited the highest peak subsidence rate, reaching 7.72 mm d−1, whereas point D1 had the lowest value of 2.24 mm d−1. The timing of the peak response at each monitoring point was not fully synchronized with working-face advance, and several points exhibited a response time lag. These results indicate that the surface-subsidence response varied spatially according to the relative position of the advancing working face.
Table 6.
Working-face advance response and post-cessation residual subsidence at seven representative leveling points.
From mining cessation on 14 July 2025 to the final leveling survey on 7 April 2026, post-cessation residual subsidence at the seven representative leveling points ranged from 20.3 to 129.8 mm, with a mean of 80.9 mm. The residual-subsidence ratio, calculated relative to the final cumulative subsidence at each point, ranged from 15.9% to 31.2%, with a mean of 20.8%. Points A1 and E1 exhibited relatively high residual-subsidence ratios of 31.2% and 24.6%, respectively. The highest ratio, at A1, is consistent with its location beyond the stopping line, which the working face did not pass (Table 6). These results apply only to the seven selected leveling points and should not be extrapolated to the entire subsidence basin.
In summary, a clear response relationship existed between working-face advance and surface subsidence. During active mining, subsidence was primarily governed by working-face advance and was characterized by relatively high subsidence rates. After mining cessation, although the working face no longer advanced, residual subsidence of varying magnitudes continued at the monitoring points, demonstrating that the surface movement process did not terminate immediately.
5. Discussion
5.1. Improved Spatiotemporal Characterization of Mining-Induced Subsidence Through Integrated Multi-Source Monitoring
A single monitoring technique cannot fully capture the long-term evolution of mining-induced surface subsidence under thick unconsolidated-layer conditions. Leveling measurements revealed the temporal response of surface subsidence during working-face advance and after mining cessation, providing high-precision constraints for analyzing the subsidence process. Multi-temporal UAV LiDAR data further complemented these observations by capturing the expansion of the subsidence basin, spatial variations in subsidence magnitude, and changes in the distribution of different subsidence classes. Together, these datasets extended the characterization of mining-induced subsidence from discrete point observations to spatially continuous, area-wide representation.
Because spatial-change estimates derived from UAV LiDAR are affected by data-acquisition and processing errors, their reliability depends on an appropriate uncertainty assessment of the DEM-differencing results. In this study, a change-detection threshold was established from residual statistics in stable areas, and the resulting subsidence estimates were validated against leveling measurements. At the validation points selected for this study, LiDAR-derived estimates agreed well with leveling measurements in the strong-subsidence group, whereas agreement was weaker in the weak-subsidence group. These findings indicate that, under the data conditions considered here, uncertainty-constrained DEM differencing can reliably identify pronounced subsidence areas, whereas low-magnitude deformation close to the change-detection threshold should be interpreted cautiously.
5.2. Spatiotemporal Evolution of Mining-Induced Subsidence Under Thick Unconsolidated-Layer Conditions and Its Implications
Leveling measurements showed that surface subsidence developed as the working face advanced. However, the timing of maximum interval-averaged subsidence rates varied among monitoring points, and some points reached their peak response after the working face had passed. This indicates that the surface response to mining is stage-dependent and spatially heterogeneous, and that working-face position and surface deformation are not simply synchronized. After mining ceased, the working face no longer advanced, but cumulative subsidence continued to increase at some monitoring points, indicating that ground movement did not cease immediately when mining stopped.
Spatial analysis of UAV LiDAR data further revealed changes in the spatial extent of cumulative subsidence across different observation periods. The threshold sensitivity analysis showed that the subsidence-affected area increased under all tested subsidence thresholds, although the specific extent varied with threshold selection. It should be noted that both DEM differencing periods used the May 2025 survey as the common reference. Therefore, the results reflect differences in the spatial distribution of cumulative subsidence at different observation times. Accordingly, changes in the area mapped from LiDAR cannot be directly interpreted as evidence of continued subsidence after mining ceased. The persistence of post-mining subsidence is assessed primarily based on the time series of leveling measurements, whereas the UAV LiDAR results provide complementary information on the spatial distribution and changes in cumulative subsidence. Together, the two datasets characterize the evolution of surface subsidence in the study area from temporal and spatial perspectives.
The continued post-mining deformation observed in the study area is consistent with previous findings on the evolution of surface movement under thick unconsolidated-layer conditions [32]. Related studies have also highlighted the need to monitor residual surface subsidence above abandoned longwall panels [33]. However, the thick unconsolidated layer represents the geological setting of this study rather than a factor independently tested through a controlled comparison. The available results are therefore insufficient to attribute post-mining deformation solely to the thickness of the unconsolidated layer. Working-face geometry, mining progress, overburden structure, and other geological conditions may also jointly influence the surface response.
5.3. Applicability and Limitations of the Proposed Method
The LoD95 used in this study was calculated from elevation residuals over stable concrete-paved road surfaces. It characterizes DEM-differencing uncertainty for the selected stable areas under the current data-processing conditions, but may not fully represent error levels over cropland. Microtopography, field ridges, and ditches on agricultural land may produce different residual characteristics during ground-point classification and DEM differencing. Accordingly, this threshold should be regarded as a reference for change detection under the data conditions of this study, rather than as a uniform accuracy metric applicable to all land-cover types. In addition, crop conditions differed among the surveys (stubble and residue in May 2025 and June 2026 versus winter-wheat seedlings in December 2025). Low-vegetation returns that were not completely removed during ground filtering could introduce small positive elevation biases over cropland that are not captured by the stable-area statistics.
The LoD95 for the DEM difference between 25 December 2025 and 14 June 2026, based on data acquired using the same Zenmuse L2 sensor model, was 58.4 mm. By contrast, the two cross-sensor DEM differences using the EasyScan X10 data acquired on 30 May 2025 as the reference yielded LoD95 values of 131.9 and 148.8 mm, respectively. The relatively higher LoD95 values associated with cross-sensor differencing suggest that sensor-related differences may be one factor contributing to DEM-differencing uncertainty. However, the ground-point densities differed among the three surveys (1.92, 11.58, and 9.35 points m−2 for May 2025, December 2025, and June 2026, respectively), and the observation intervals and data-acquisition conditions also differed. Errors may also have been introduced during point-cloud classification and DEM generation. Therefore, the available results are insufficient to quantitatively isolate the independent contribution of sensor differences from those of other factors.
The threshold sensitivity analysis in Table 5 shows that the direction of increase in the subsidence-affected area remained consistent across different statistical thresholds, although the specific extent was affected by threshold selection. Considering the LoD95 values for the two cross-sensor DEM differences, the 140 mm threshold was below the LoD95 estimated for the second period (148.8 mm), while the 150 mm threshold exceeded it by only 1.2 mm. This indicates that some areas identified under these two thresholds may be affected by DEM-differencing uncertainty. Although the 160 mm threshold was higher than the LoD95 values estimated for both periods, differences in error characteristics between cropland and stable concrete-paved surfaces cannot be fully ruled out because the LoD95 was estimated from stable concrete-paved surfaces. Therefore, the threshold sensitivity analysis is primarily used to evaluate the consistency of spatial area-change trends across different statistical thresholds, while the specific extent of subsidence should be interpreted in conjunction with the LoD95 estimates and surface conditions.
In addition, this study focused on a single working face and did not quantitatively assess the relative contributions of geological and mining-related factors through comparisons across different mining depths, mining heights, and unconsolidated-layer thicknesses. The analysis primarily characterized the geometry of surface deformation and did not incorporate geotechnical structural parameters to further explain the mechanisms underlying subsidence development. Future studies should combine long-term, multi-temporal observations from multiple working faces with geological and mining parameters to further evaluate the applicability of the proposed method under different surface and mining conditions.
6. Conclusions
Taking the 32311 working face of Xutuan Coal Mine, Anhui Province, China, as the study area, this study integrated leveling measurements and multi-temporal UAV LiDAR data, combined DEM differencing uncertainty assessment with validation using leveling points, and analyzed the temporal variations and spatial distribution of surface subsidence during working-face advance and after mining cessation. The main conclusions are as follows:
(1) Leveling measurements and multi-temporal UAV LiDAR are complementary for mining-induced subsidence monitoring. Leveling measurements revealed the development of subsidence during working-face advance and the residual deformation after mining cessation, while UAV LiDAR provided additional information on the spatial morphology of the subsidence basin and the distribution of areas with different subsidence levels. Integrating these two data sources enabled the joint characterization of temporal subsidence series and regional spatial patterns, providing an effective monitoring approach for analyzing the spatiotemporal characteristics of mining-induced subsidence in coal–cropland overlapping areas.
(2) The LoD95 assessment based on elevation residuals in stable areas provides uncertainty constraints for change detection using multi-temporal DEM differencing. The LoD95 values for the three DEM-differencing periods (30 May–25 December 2025, 30 May 2025–14 June 2026, and 25 December 2025–14 June 2026) were 131.9 mm, 148.8 mm, and 58.4 mm, respectively; the uncertainty of the two cross-sensor differences was dominated by the May 2025 survey. The 12 validation points covered leveling-derived cumulative subsidence of 19.76–392.95 mm during 30 May–19 December 2025, including 19.76–69.75 mm for the weak-subsidence group and 185.13–392.95 mm for the strong-subsidence group. For the six strong-subsidence points, LiDAR-derived subsidence showed a strong relationship with leveling measurements (R2 =0.87; RMSE = 29.9 mm), whereas the relationship was weak for the six weak-subsidence points (R2 = 0.15). These results indicate that, under the data conditions of this study, UAV LiDAR differencing exhibited a strong linear relationship with leveling measurements in areas of pronounced subsidence, whereas reliable detection of weak subsidence remained limited. The LoD95 values reflect the uncertainty of change detection under the specific data combinations and stable-area conditions examined in this study and should not be regarded as uniform accuracy thresholds applicable to different land-cover types.
(3) During the observation period, surface subsidence developed rapidly during working-face advance. Although the subsidence rate gradually decreased after mining cessation, residual deformation continued. At seven representative leveling points, post-mining residual subsidence accounted for 15.9–31.2% of the final cumulative subsidence recorded during the leveling monitoring period, with an average of 20.8%. Meanwhile, cumulative subsidence mapping referenced to 30 May 2025 showed that the area with subsidence exceeding 150 mm increased from 15.31 ha on 25 December 2025, to 16.73 ha on 14 June 2026. The leveling time series demonstrates that surface subsidence continued after mining cessation, while the UAV LiDAR results show that the mapped area of cumulative subsidence above the selected thresholds increased between the December 2025 and June 2026 surveys. These complementary temporal and spatial findings should be considered in mine-subsidence monitoring and land-damage assessment.
Author Contributions
Conceptualization, B.D. and C.G.; methodology, B.D. and C.G.; investigation, B.D., C.G., Q.H., Z.S., R.H. and J.G.; data acquisition, C.G., Q.H., Z.S., R.H. and J.G.; data curation, B.D.; UAV LiDAR data processing and analysis, B.D.; leveling data processing and subsidence analysis, B.D.; validation, B.D. and C.G.; formal analysis, B.D.; visualization, B.D.; writing—original draft preparation, B.D.; writing—review and editing, B.D. and C.G.; supervision, C.G.; project administration, C.G.; funding acquisition, C.G. All authors have read and agreed to the published version of the manuscript.
Funding
The APC was funded by the Coal Industry Engineering Research Center of Mining Area Environmental and Disaster Cooperative Monitoring (Anhui University of Science and Technology) (grant number KSXTJC202302), and the National Natural Science Foundation of China, grant number 52204182.
Data Availability Statement
The datasets presented in this study are not publicly available due to restrictions related to the mining site and data ownership. Reasonable requests for access to the data may be considered by the corresponding author.
Acknowledgments
The authors would like to thank Xutuan Coal Mine of Huaibei Mining Group for its support during the implementation of this project.
Conflicts of Interest
Author Ruimin He is employed by CHN Energy Shendong Coal Group Co., Ltd. Author Ziheng Song is employed by China National Coal Association. The remaining authors declare that the research was conducted in the absence of any commercial or financial relationships that could be construed as a potential conflict of interest.
References
- Chen, Y.; Hu, Z.; Li, P.; Li, G.; Yuan, D.; Guo, J. Assessment and Effect of Mining Subsidence on Farmland in Coal–Crop Overlapped Areas: A Case of Shandong Province, China. Agriculture 2022, 12, 1235. [Google Scholar] [CrossRef] [Scilit]
- Bai, E.; Guo, W.; Zhang, H.; Tan, Y.; Li, X.; Wei, Z. Degradation Mechanism of Cultivated Land and Its Protection Technology in the Central Coal-Grain Overlapped Area of China. J. Clean. Prod. 2024, 468, 143075. [Google Scholar] [CrossRef] [Scilit]
- Wang, Z.H.; Wu, S.X.; Li, J.L.; Sun, W.C.; Wang, Z.F.; Liu, P.J. Surface Subsidence and Its Reclamation of a Coal Mine Locating at the High Groundwater Table, China. Int. J. Environ. Sci. Technol. 2023, 20, 13635–13654. [Google Scholar] [CrossRef] [Scilit]
- Zheng, B.; Song, S.; Cheng, X.; Niu, R.; Cheng, X.; Ruan, H.; Li, G. The Influence of Coal Mining Subsidence on the Movement and Deformation of Loess Slope in the Loess Gully Area of Northern Shaanxi. Front. Earth Sci. 2023, 11, 1273389. [Google Scholar] [CrossRef] [Scilit]
- Yang, Q.; Tang, F.; Tian, Z.; Xue, J.; Zhu, C.; Su, Y.; Li, P. Intelligent Processing of UAV Remote Sensing Data for Building High-Precision DEMs in Complex Terrain: A Case Study of Loess Plateau in China. Int. J. Appl. Earth Obs. Geoinf. 2024, 134, 104187. [Google Scholar] [CrossRef] [Scilit]
- Cai, Y.; Jin, Y.; Wang, Z.; Chen, T.; Wang, Y.; Kong, W.; Xiao, W.; Li, X.; Lian, X.; Hu, H. A Review of Monitoring, Calculation, and Simulation Methods for Ground Subsidence Induced by Coal Mining. Int. J. Coal Sci. Technol. 2023, 10, 32. [Google Scholar] [CrossRef] [Scilit]
- Zhu, M.; Yu, X.; Tan, H.; Yuan, J. Integrated High-Precision Monitoring Method for Surface Subsidence in Mining Areas Using D-InSAR, SBAS, and UAV Technologies. Sci. Rep. 2024, 14, 12445. [Google Scholar] [CrossRef] [Scilit] [PubMed]
- Crosetto, M.; Monserrat, O.; Cuevas-González, M.; Devanthéry, N.; Crippa, B. Persistent Scatterer Interferometry: A Review. ISPRS J. Photogramm. Remote Sens. 2016, 115, 78–89. [Google Scholar] [CrossRef] [Scilit]
- Ferretti, A.; Prati, C.; Rocca, F. Permanent Scatterers in SAR Interferometry. IEEE Trans. Geosci. Remote Sens. 2001, 39, 8–20. [Google Scholar] [CrossRef] [Scilit]
- Raucoules, D.; Maisons, C.; Carnec, C.; Le Mouelic, S.; King, C.; Hosford, S. Monitoring of Slow Ground Deformation by ERS Radar Interferometry on the Vauvert Salt Mine (France): Comparison with Ground-Based Measurement. Remote Sens. Environ. 2003, 88, 468–478. [Google Scholar] [CrossRef] [Scilit]
- Wang, S.; Bai, Z.; Lv, Y.; Zhou, W. Monitoring Extractive Activity-Induced Surface Subsidence in Highland and Alpine Opencast Coal Mining Areas with Multi-Source Data. Remote Sens. 2022, 14, 3442. [Google Scholar] [CrossRef] [Scilit]
- Tang, W.; Wang, M.; Li, P.; Wang, G.; Yan, Y.; Yan, W. Ground Subsidence Associated with Mining Activity in the Ningdong Coal Base Area, Northwestern China Revealed by InSAR Time Series Analysis. Front. Earth Sci. 2023, 11, 1132890. [Google Scholar] [CrossRef] [Scilit]
- Shang, H.; Zhan, H.-Z.; Ni, W.-K.; Liu, Y.; Gan, Z.-H.; Liu, S.-H. Surface Environmental Evolution Monitoring in Coal Mining Subsidence Area Based on Multi-Source Remote Sensing Data. Front. Earth Sci. 2022, 10, 790737. [Google Scholar] [CrossRef] [Scilit]
- Zhu, M.; Yu, X.; Tan, H.; Xie, S.; Yang, X.; Han, Y. Prediction Parameters for Mining Subsidence Based on Interferometric Synthetic Aperture Radar and Unmanned Aerial Vehicle Collaborative Monitoring. Appl. Sci. 2023, 13, 11128. [Google Scholar] [CrossRef] [Scilit]
- Nasirzadehdizaji, R.; Cakir, Z.; Balik Sanli, F.; Abdikan, S.; Pepe, A.; Calò, F. Sentinel-1 Interferometric Coherence and Backscattering Analysis for Crop Monitoring. Comput. Electron. Agric. 2021, 185, 106118. [Google Scholar] [CrossRef] [Scilit]
- Jiang, J.; Lohman, R.B. Coherence-Guided InSAR Deformation Analysis in the Presence of Ongoing Land Surface Changes in the Imperial Valley, California. Remote Sens. Environ. 2021, 253, 112160. [Google Scholar] [CrossRef] [Scilit]
- James, M.R.; Robson, S. Straightforward Reconstruction of 3D Surfaces and Topography with a Camera: Accuracy and Geoscience Application. J. Geophys. Res. Earth Surf. 2012, 117, F03017. [Google Scholar] [CrossRef] [Scilit]
- Westoby, M.J.; Brasington, J.; Glasser, N.F.; Hambrey, M.J.; Reynolds, J.M. ‘Structure-from-Motion’ Photogrammetry: A Low-Cost, Effective Tool for Geoscience Applications. Geomorphology 2012, 179, 300–314. [Google Scholar] [CrossRef] [Scilit]
- Zhang, Y.; Lian, X.; Ge, L.; Liu, X.; Du, Z.; Yang, W.; Wu, Y.; Hu, H.; Cai, Y. Surface Subsidence Monitoring Induced by Underground Coal Mining by Combining DInSAR and UAV Photogrammetry. Remote Sens. 2022, 14, 4711. [Google Scholar] [CrossRef] [Scilit]
- Zhao, J.; Yang, X.; Zhang, Z.; Niu, Y.; Zhao, Z. Mine Subsidence Monitoring Integrating DS-InSAR with UAV Photogrammetry Products: Case Studies on Hebei and Inner Mongolia. Remote Sens. 2023, 15, 4998. [Google Scholar] [CrossRef] [Scilit]
- Wallace, L.; Lucieer, A.; Watson, C.; Turner, D. Development of a UAV-LiDAR System with Application to Forest Inventory. Remote Sens. 2012, 4, 1519–1543. [Google Scholar] [CrossRef] [Scilit]
- Höfle, B.; Rutzinger, M. Topographic Airborne LiDAR in Geomorphology: A Technological Perspective. Z. Geomorphol. 2011, 55, 1–29. [Google Scholar] [CrossRef] [Scilit]
- Liu, J.; Liu, X.; Lv, X.; Wang, B.; Lian, X. Novel Method for Monitoring Mining Subsidence Featuring Co-Registration of UAV LiDAR Data and Photogrammetry. Appl. Sci. 2022, 12, 9374. [Google Scholar] [CrossRef] [Scilit]
- An, S.; Yuan, L.; Xu, Y.; Wang, X.; Zhou, D. Ground Subsidence Monitoring in Based on UAV-LiDAR Technology: A Case Study of a Mine in the Ordos, China. Geomech. Geophys. Geo-Energ. Geo-Resour. 2024, 10, 57. [Google Scholar] [CrossRef] [Scilit]
- Dong, Y.; Wang, D.; Liu, F.; Wang, J. A New Data Processing Method for High-Precision Mining Subsidence Measurement Using Airborne LiDAR. Front. Earth Sci. 2022, 10, 858050. [Google Scholar] [CrossRef] [Scilit]
- Liu, X.; Zhu, W.; Lian, X.; Xu, X. Monitoring Mining Surface Subsidence with Multi-Temporal Three-Dimensional Unmanned Aerial Vehicle Point Cloud. Remote Sens. 2023, 15, 374. [Google Scholar] [CrossRef] [Scilit]
- Wheaton, J.M.; Brasington, J.; Darby, S.E.; Sear, D.A. Accounting for uncertainty in DEMs from repeat topographic surveys: Improved sediment budgets. Earth Surf. Processes Landf. 2010, 35, 136–156. [Google Scholar] [CrossRef] [Scilit]
- James, M.R.; Robson, S.; Smith, M.W. 3-D Uncertainty-Based Topographic Change Detection with Structure-from-Motion Photogrammetry: Precision Maps for Ground Control and Directly Georeferenced Surveys. Earth Surf. Processes Landf. 2017, 42, 1769–1788. [Google Scholar] [CrossRef] [Scilit]
- Lague, D.; Brodu, N.; Leroux, J. Accurate 3D Comparison of Complex Topography with Terrestrial Laser Scanner: Application to the Rangitikei Canyon (N-Z). ISPRS J. Photogramm. Remote Sens. 2013, 82, 10–26. [Google Scholar] [CrossRef] [Scilit]
- Li, P.; Li, D.; Hu, J.; Fassnacht, F.E.; Latifi, H.; Yao, W.; Gao, J.; Chan, F.K.S.; Dang, T.; Tang, F. Improving the Application of UAV-LiDAR for Erosion Monitoring through Accounting for Uncertainty in DEM of Difference. CATENA 2024, 234, 107534. [Google Scholar] [CrossRef] [Scilit]
- Brasington, J.; Langham, J.; Rumsby, B. Methodological Sensitivity of Morphometric Estimates of Coarse Fluvial Sediment Transport. Geomorphology 2003, 53, 299–316. [Google Scholar] [CrossRef] [Scilit]
- Peng, L.; Jiang, Q.; Hua, X.; Yang, X.; Li, H.; Guo, G.; Sun, W. Investigation on the Characteristics of Surface Movement and Deformation in Mining under Thick Unconsolidated Layer in Jining Area, China. Sci. Rep. 2025, 15, 17315. [Google Scholar] [CrossRef] [Scilit] [PubMed]
- Cui, X.; Zhao, Y.; Wang, G.; Zhang, B.; Li, C. Calculation of Residual Surface Subsidence Above Abandoned Longwall Coal Mining. Sustainability 2020, 12, 1528. [Google Scholar] [CrossRef] [Scilit]
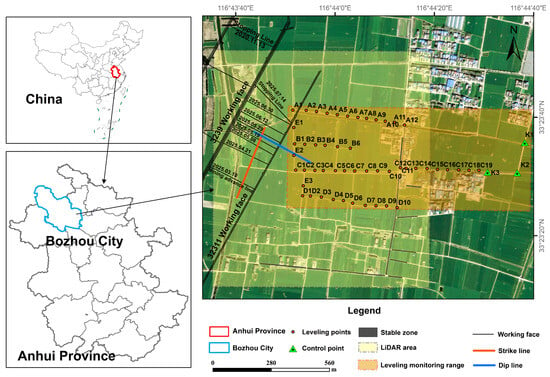
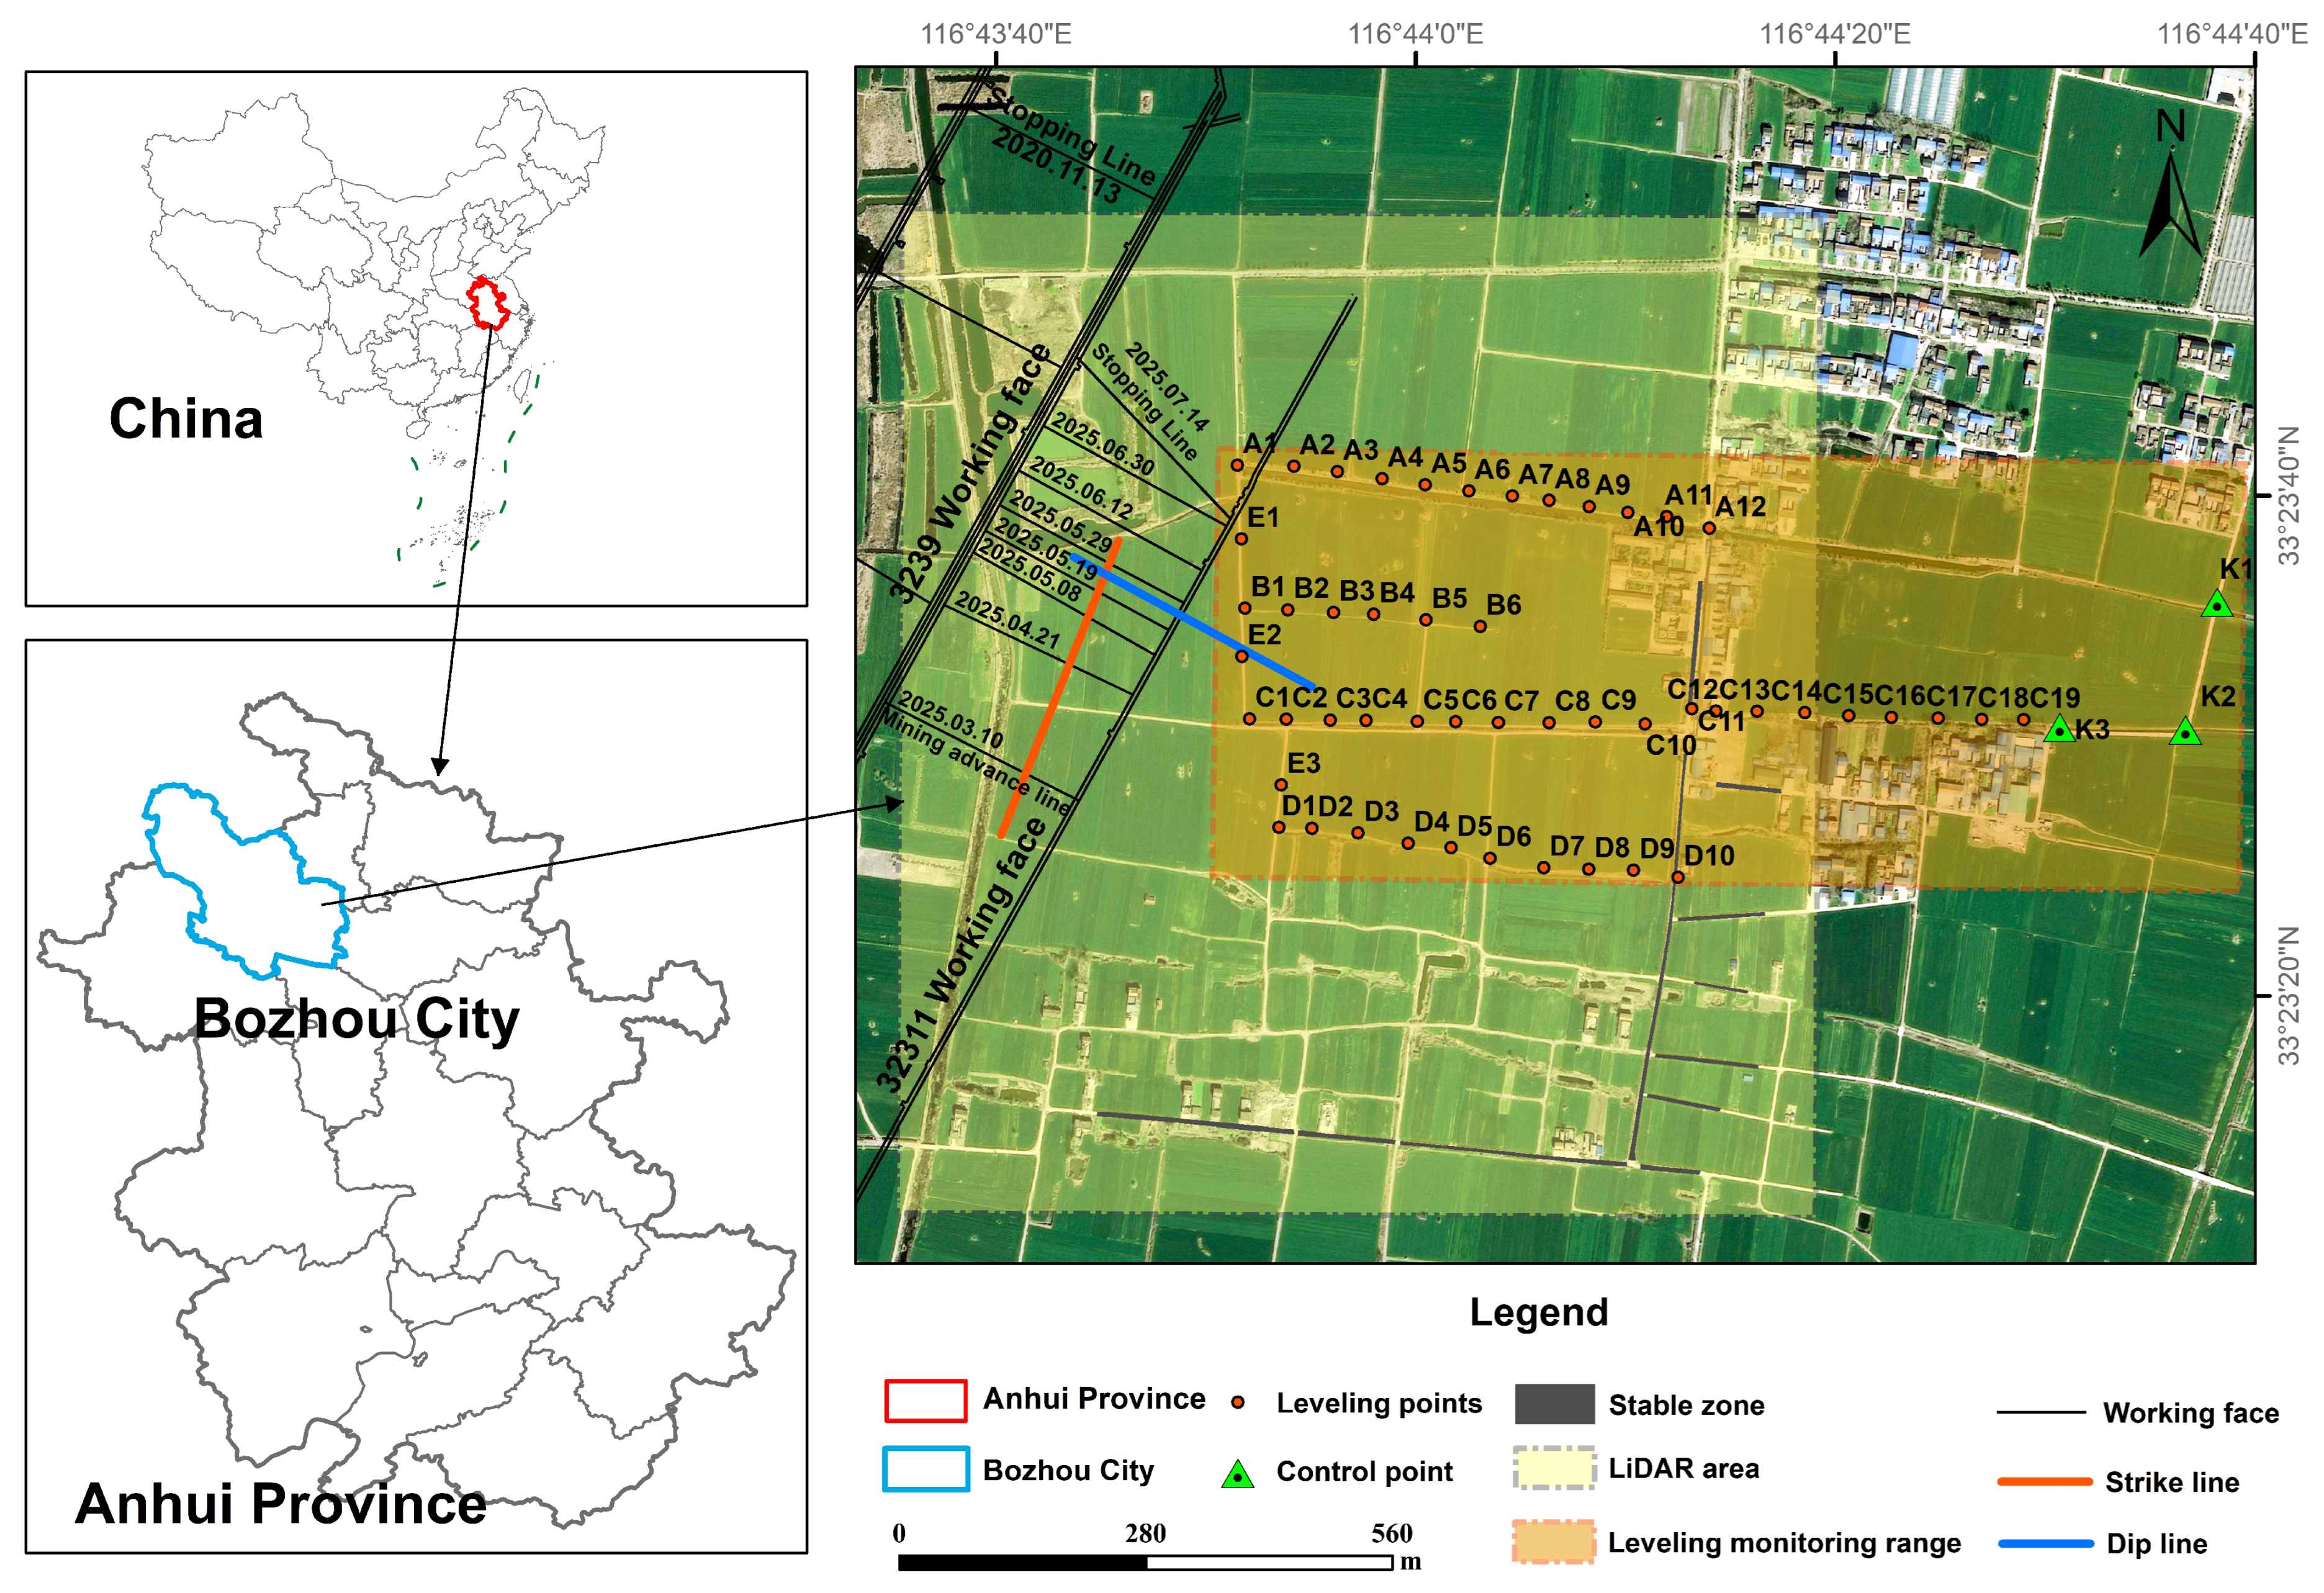
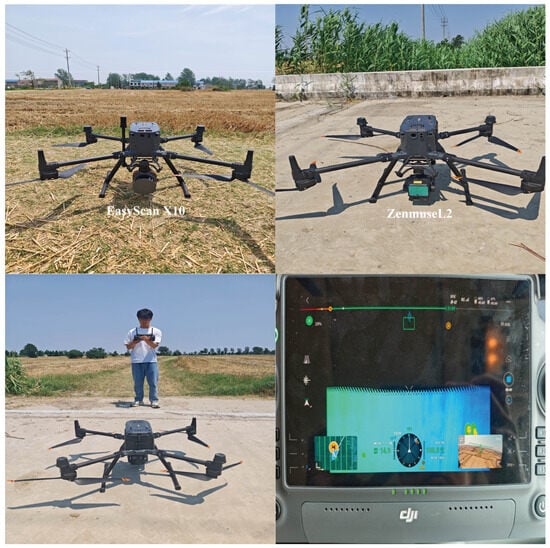
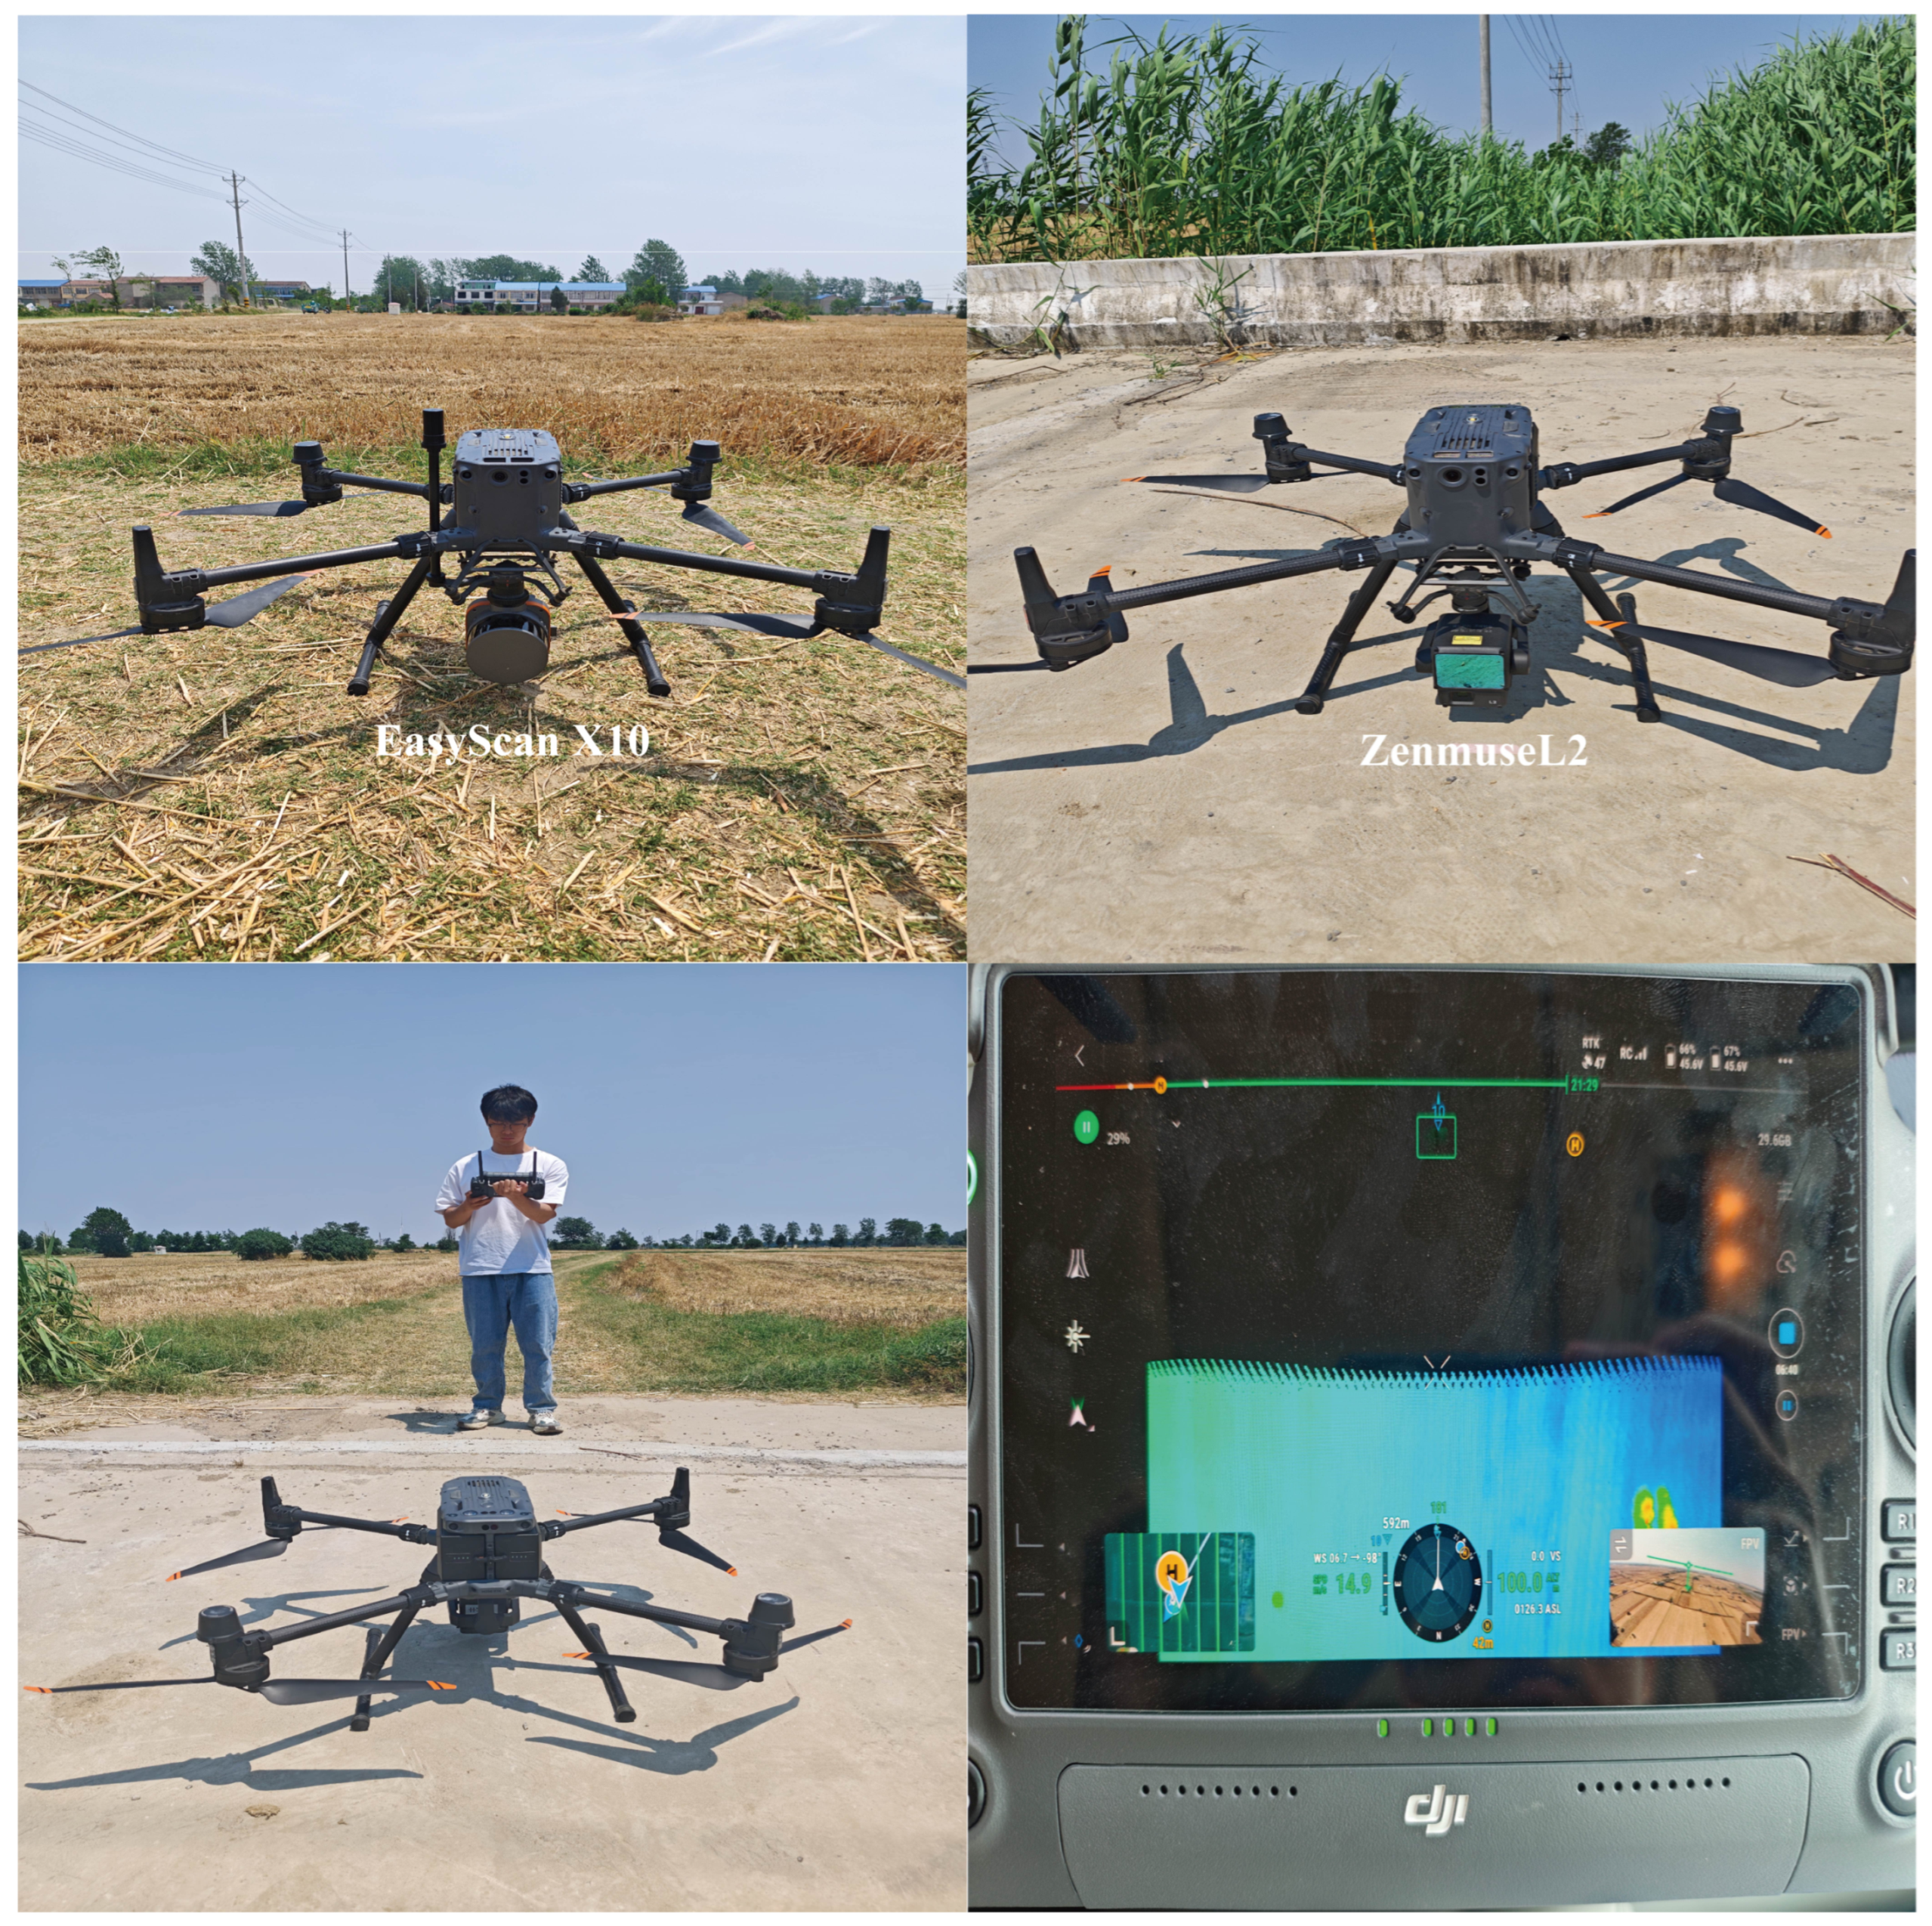
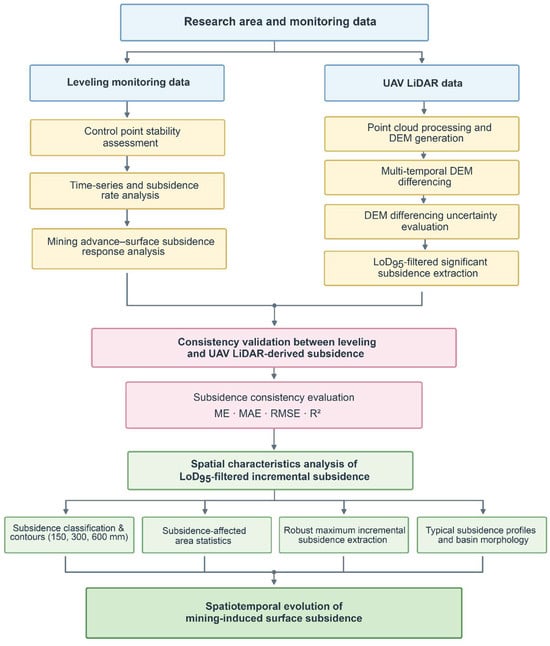
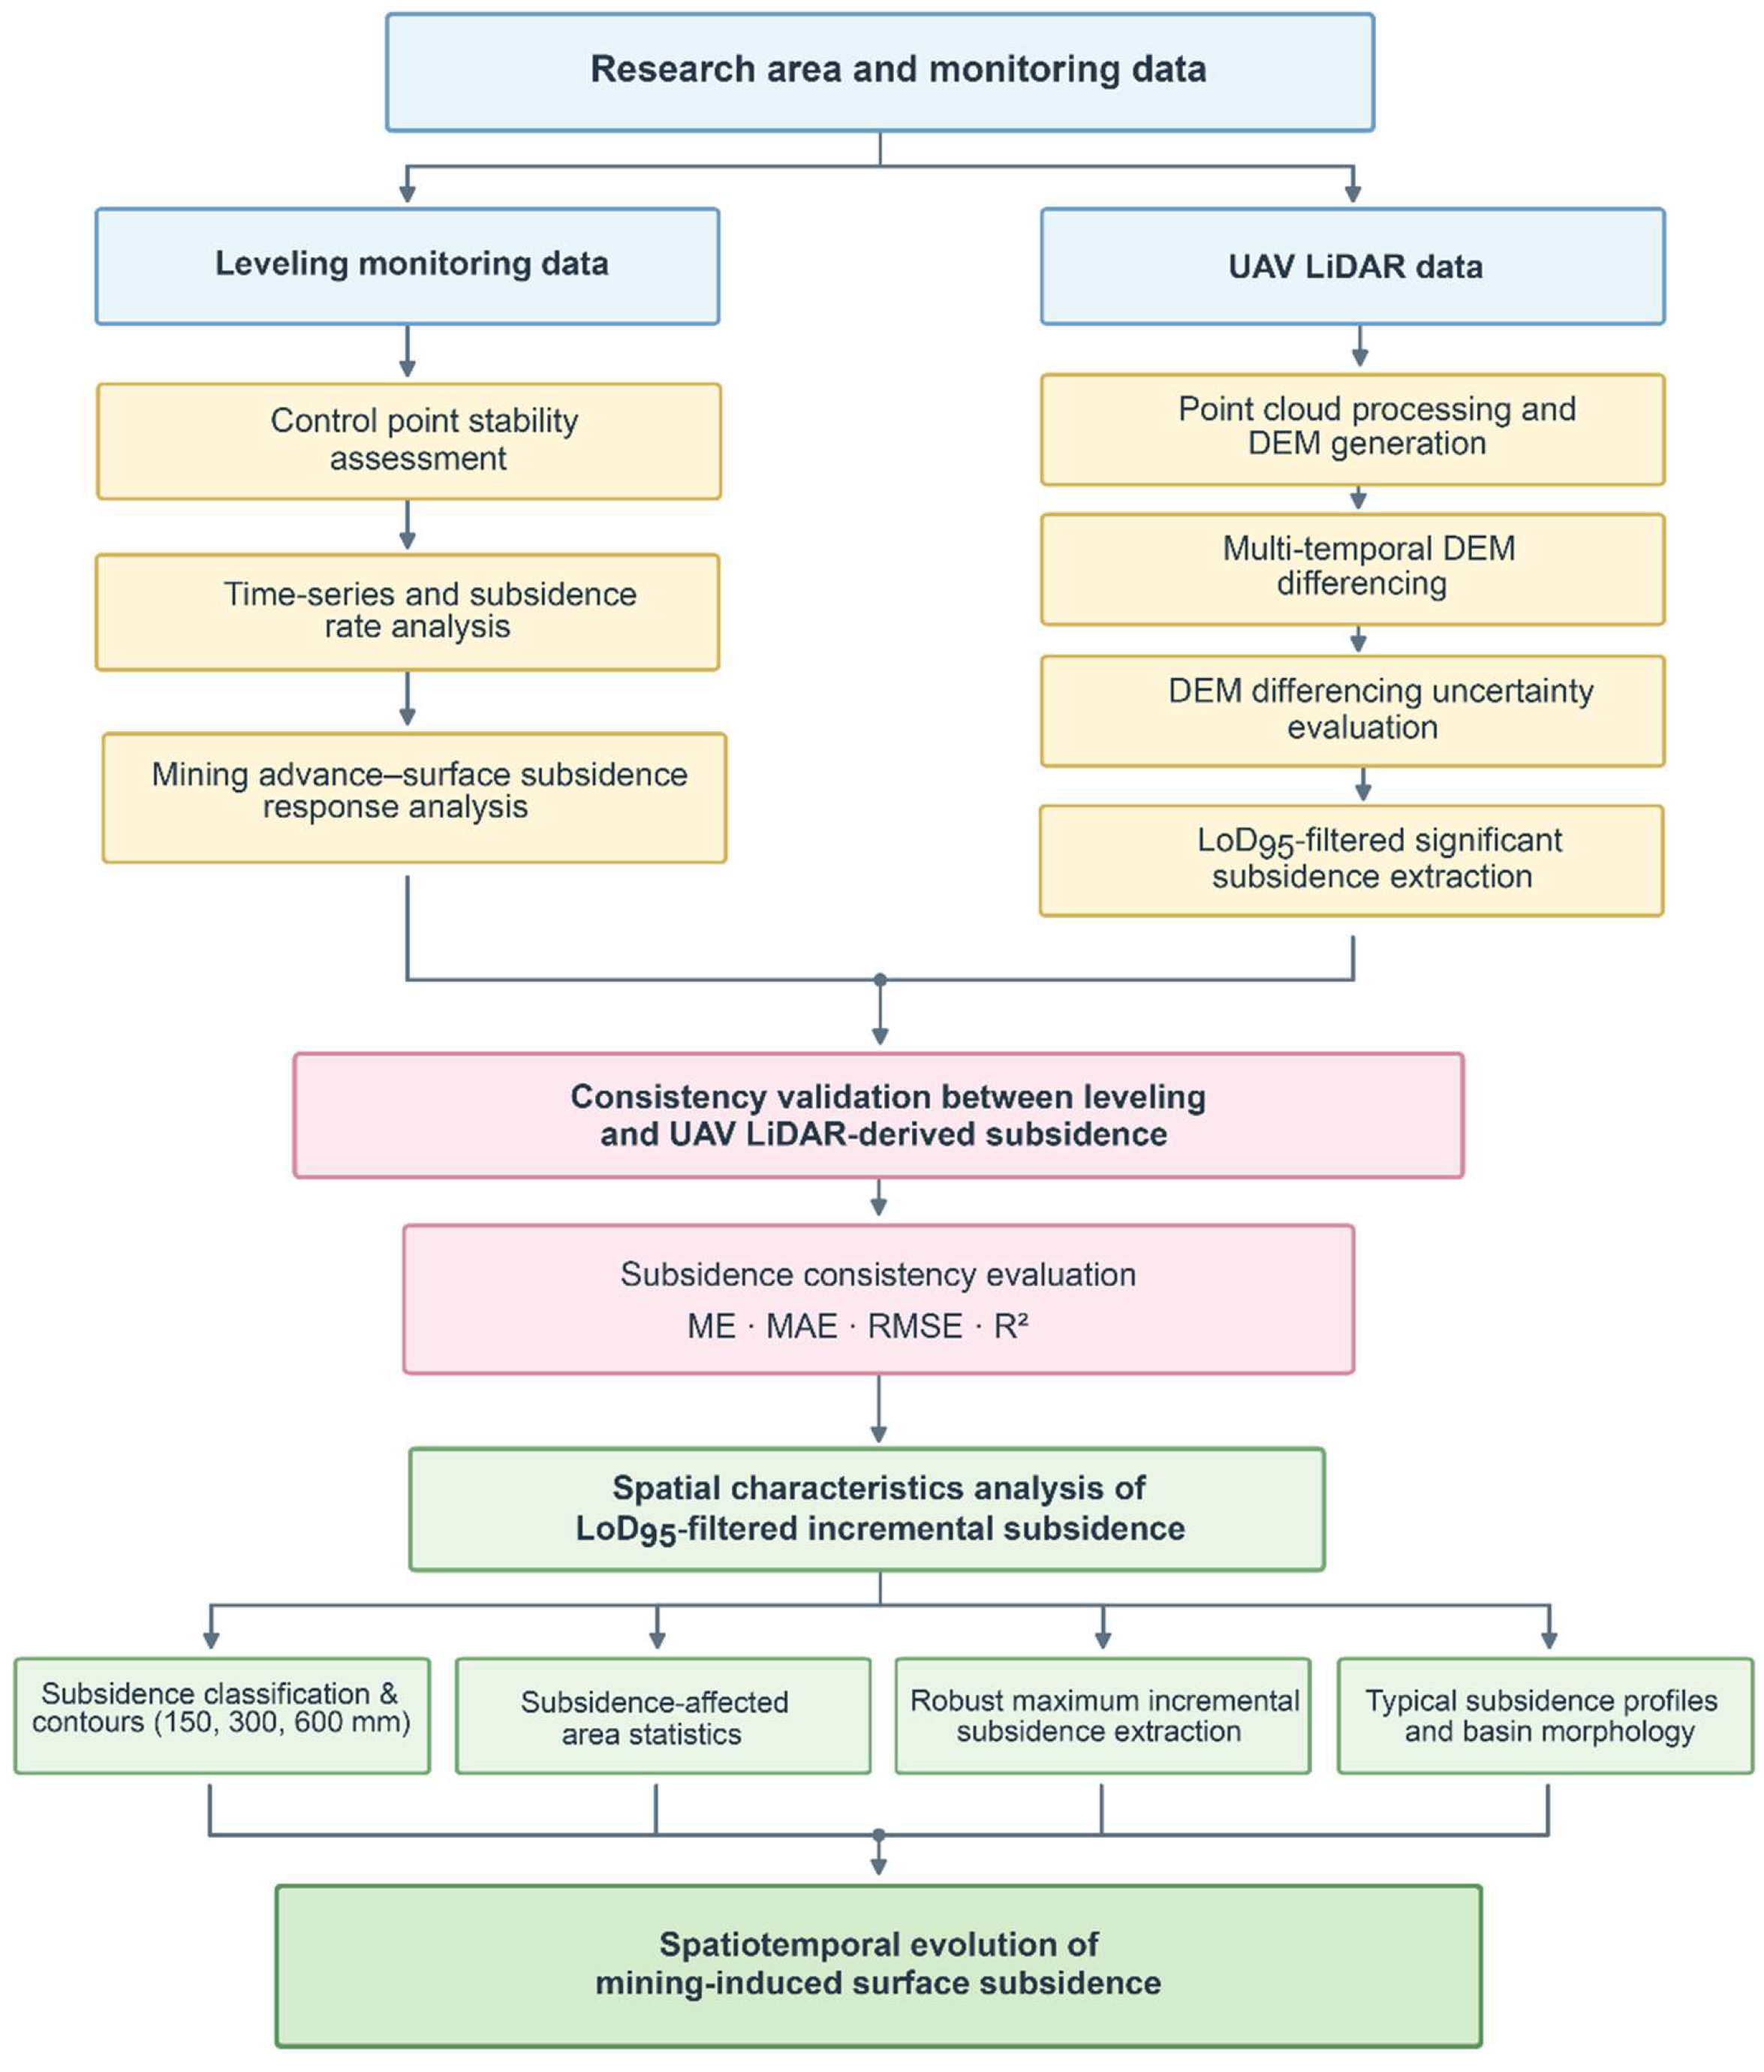
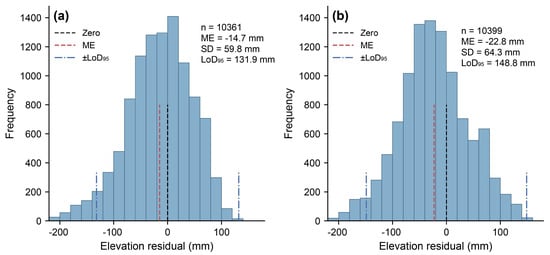
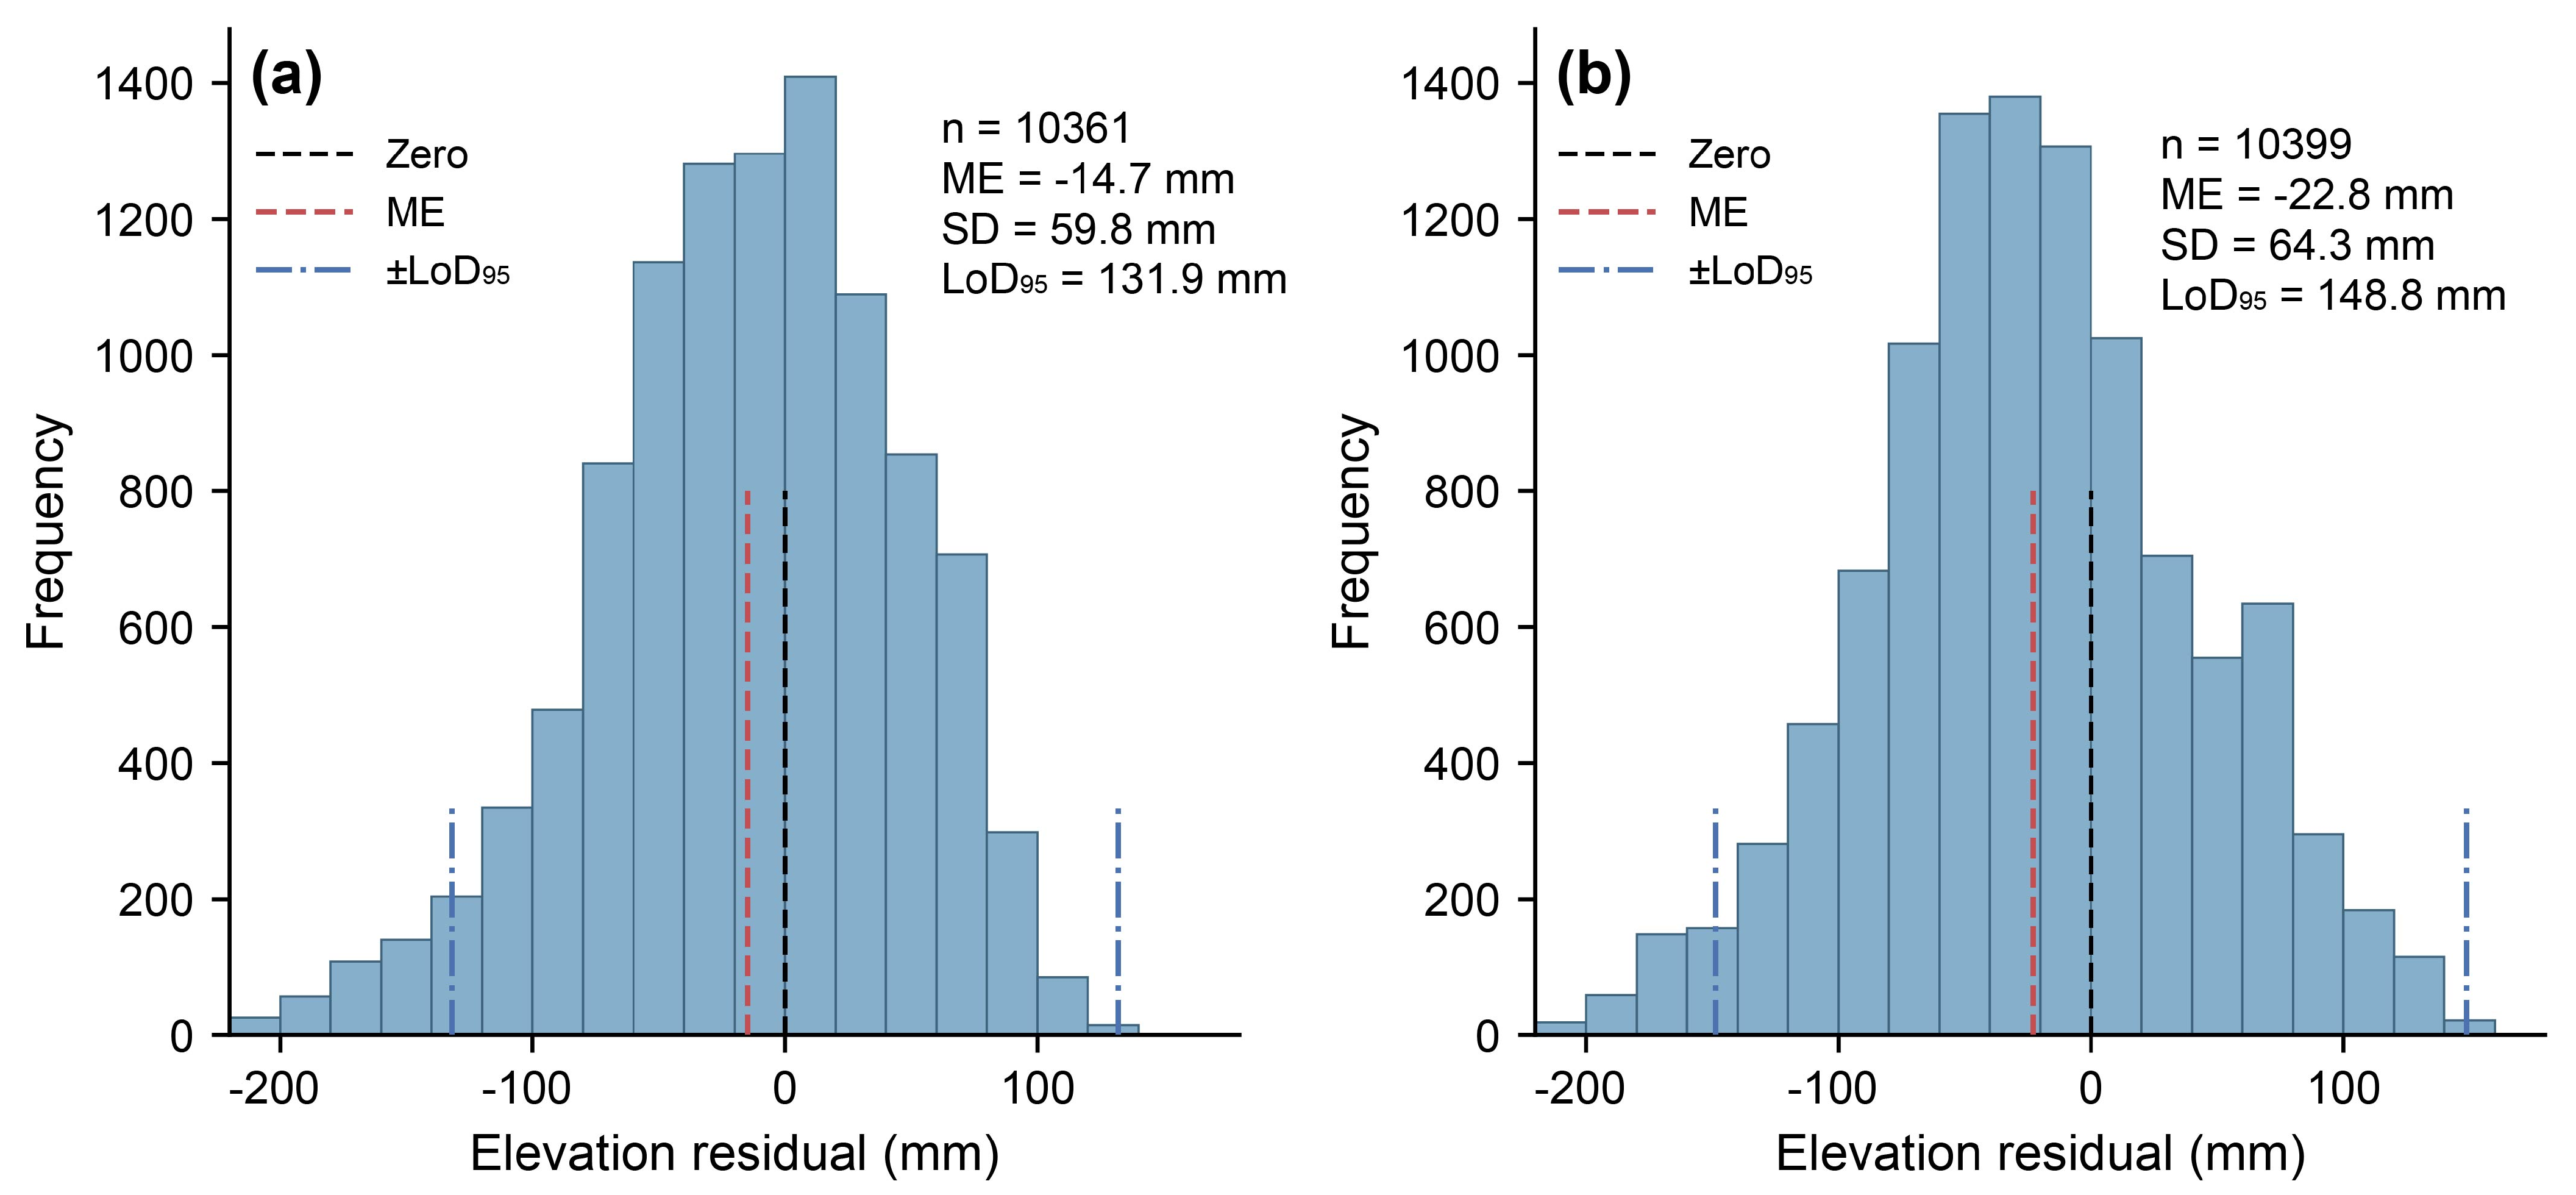
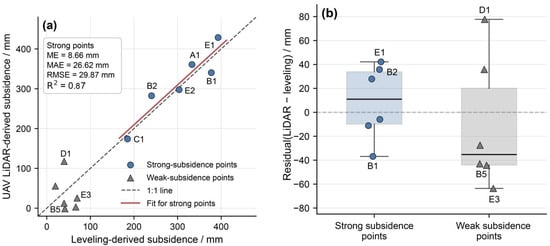
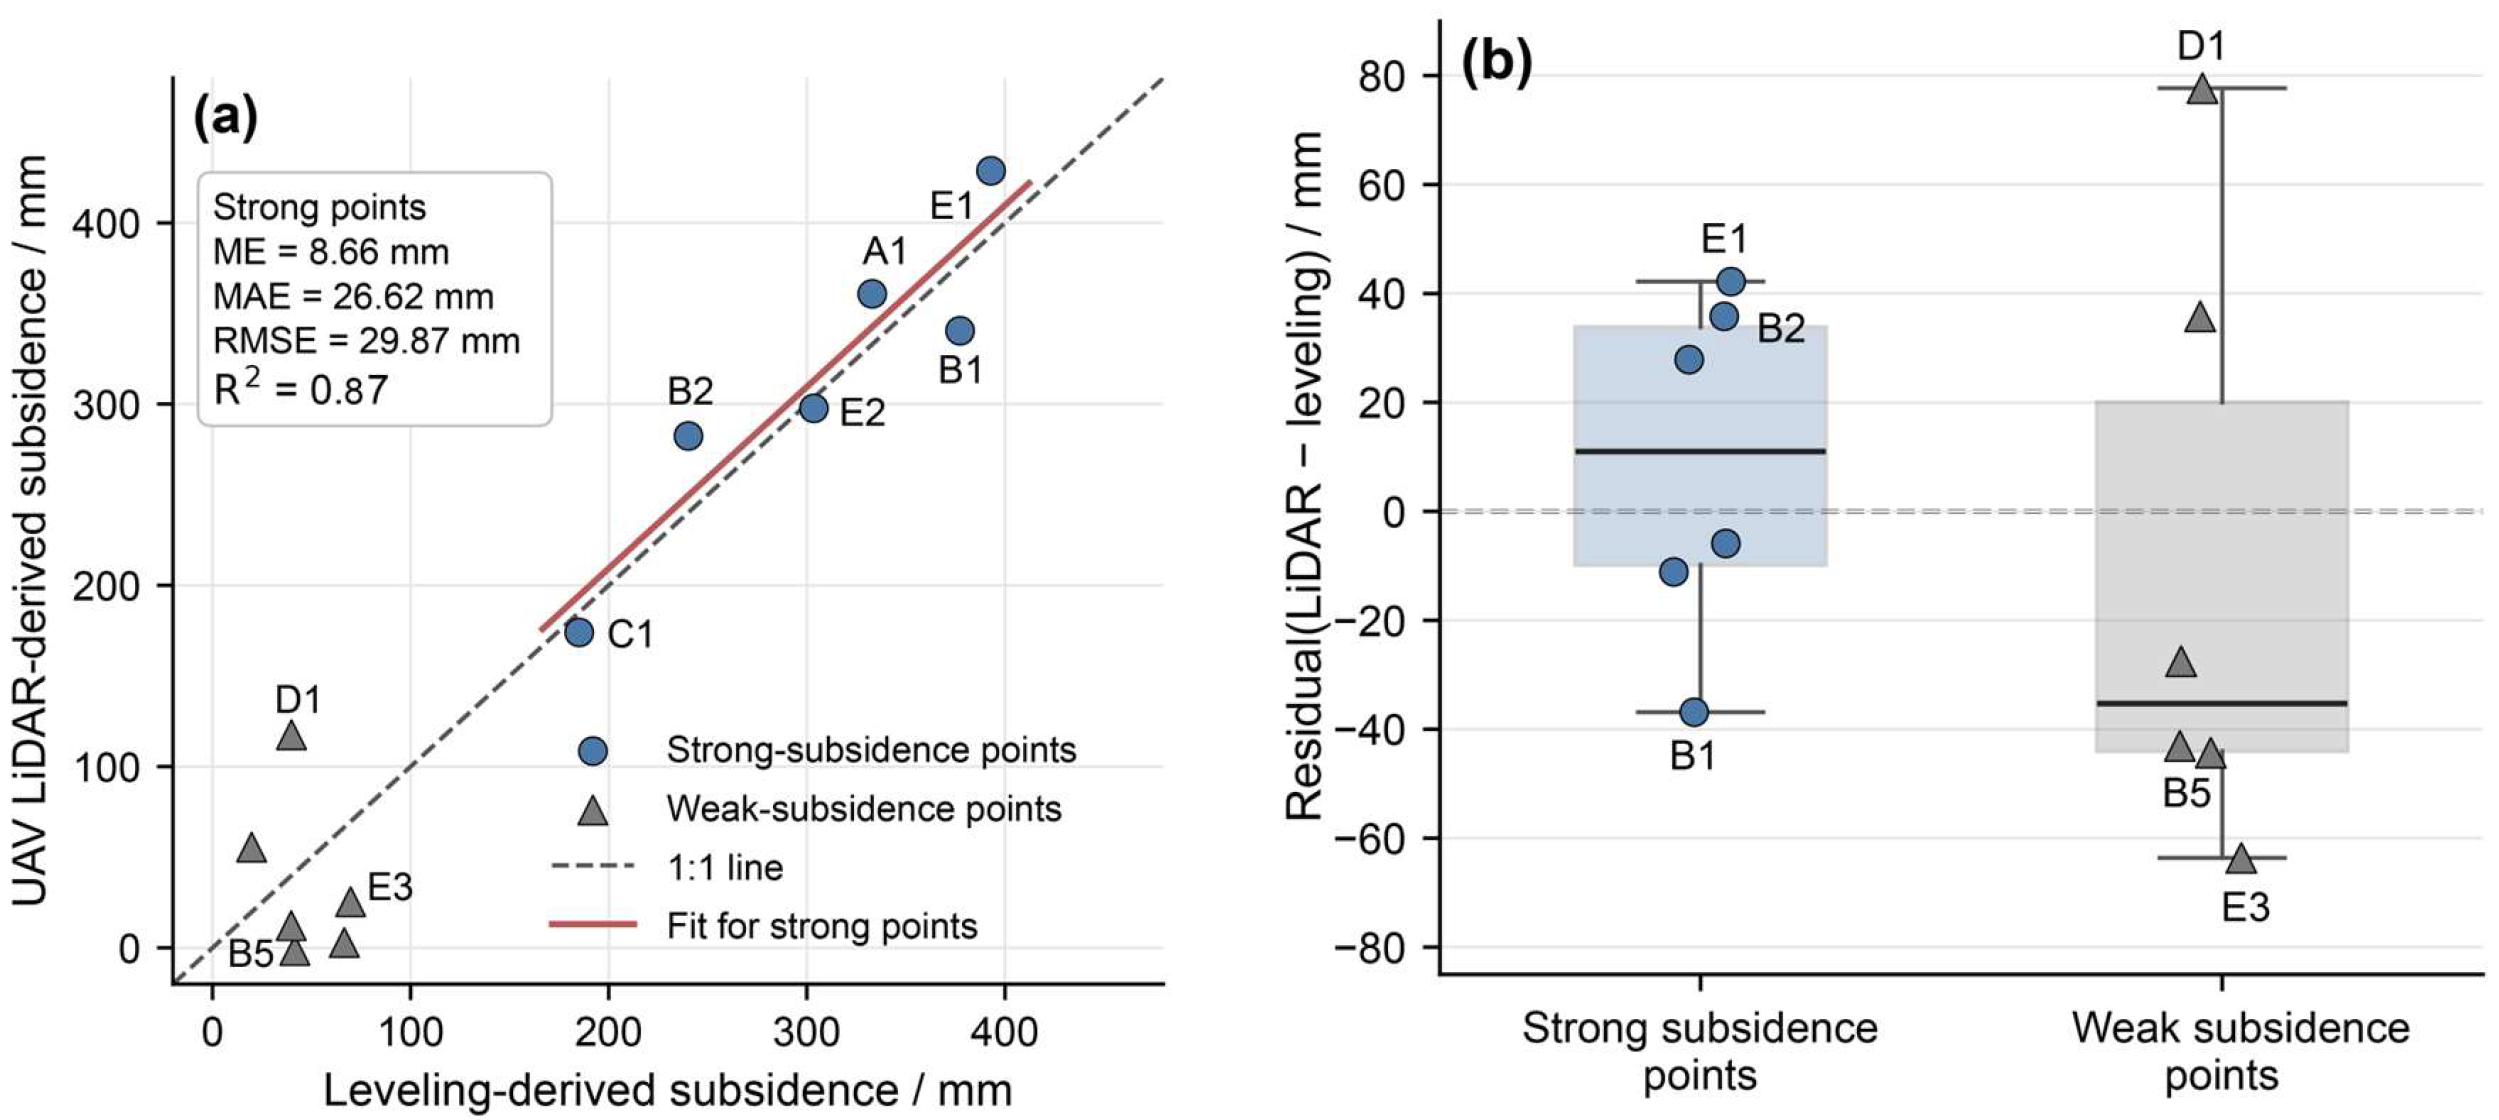
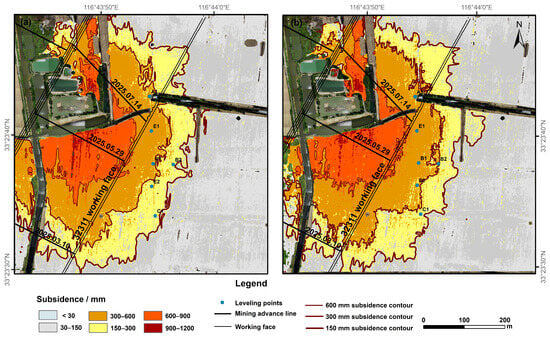
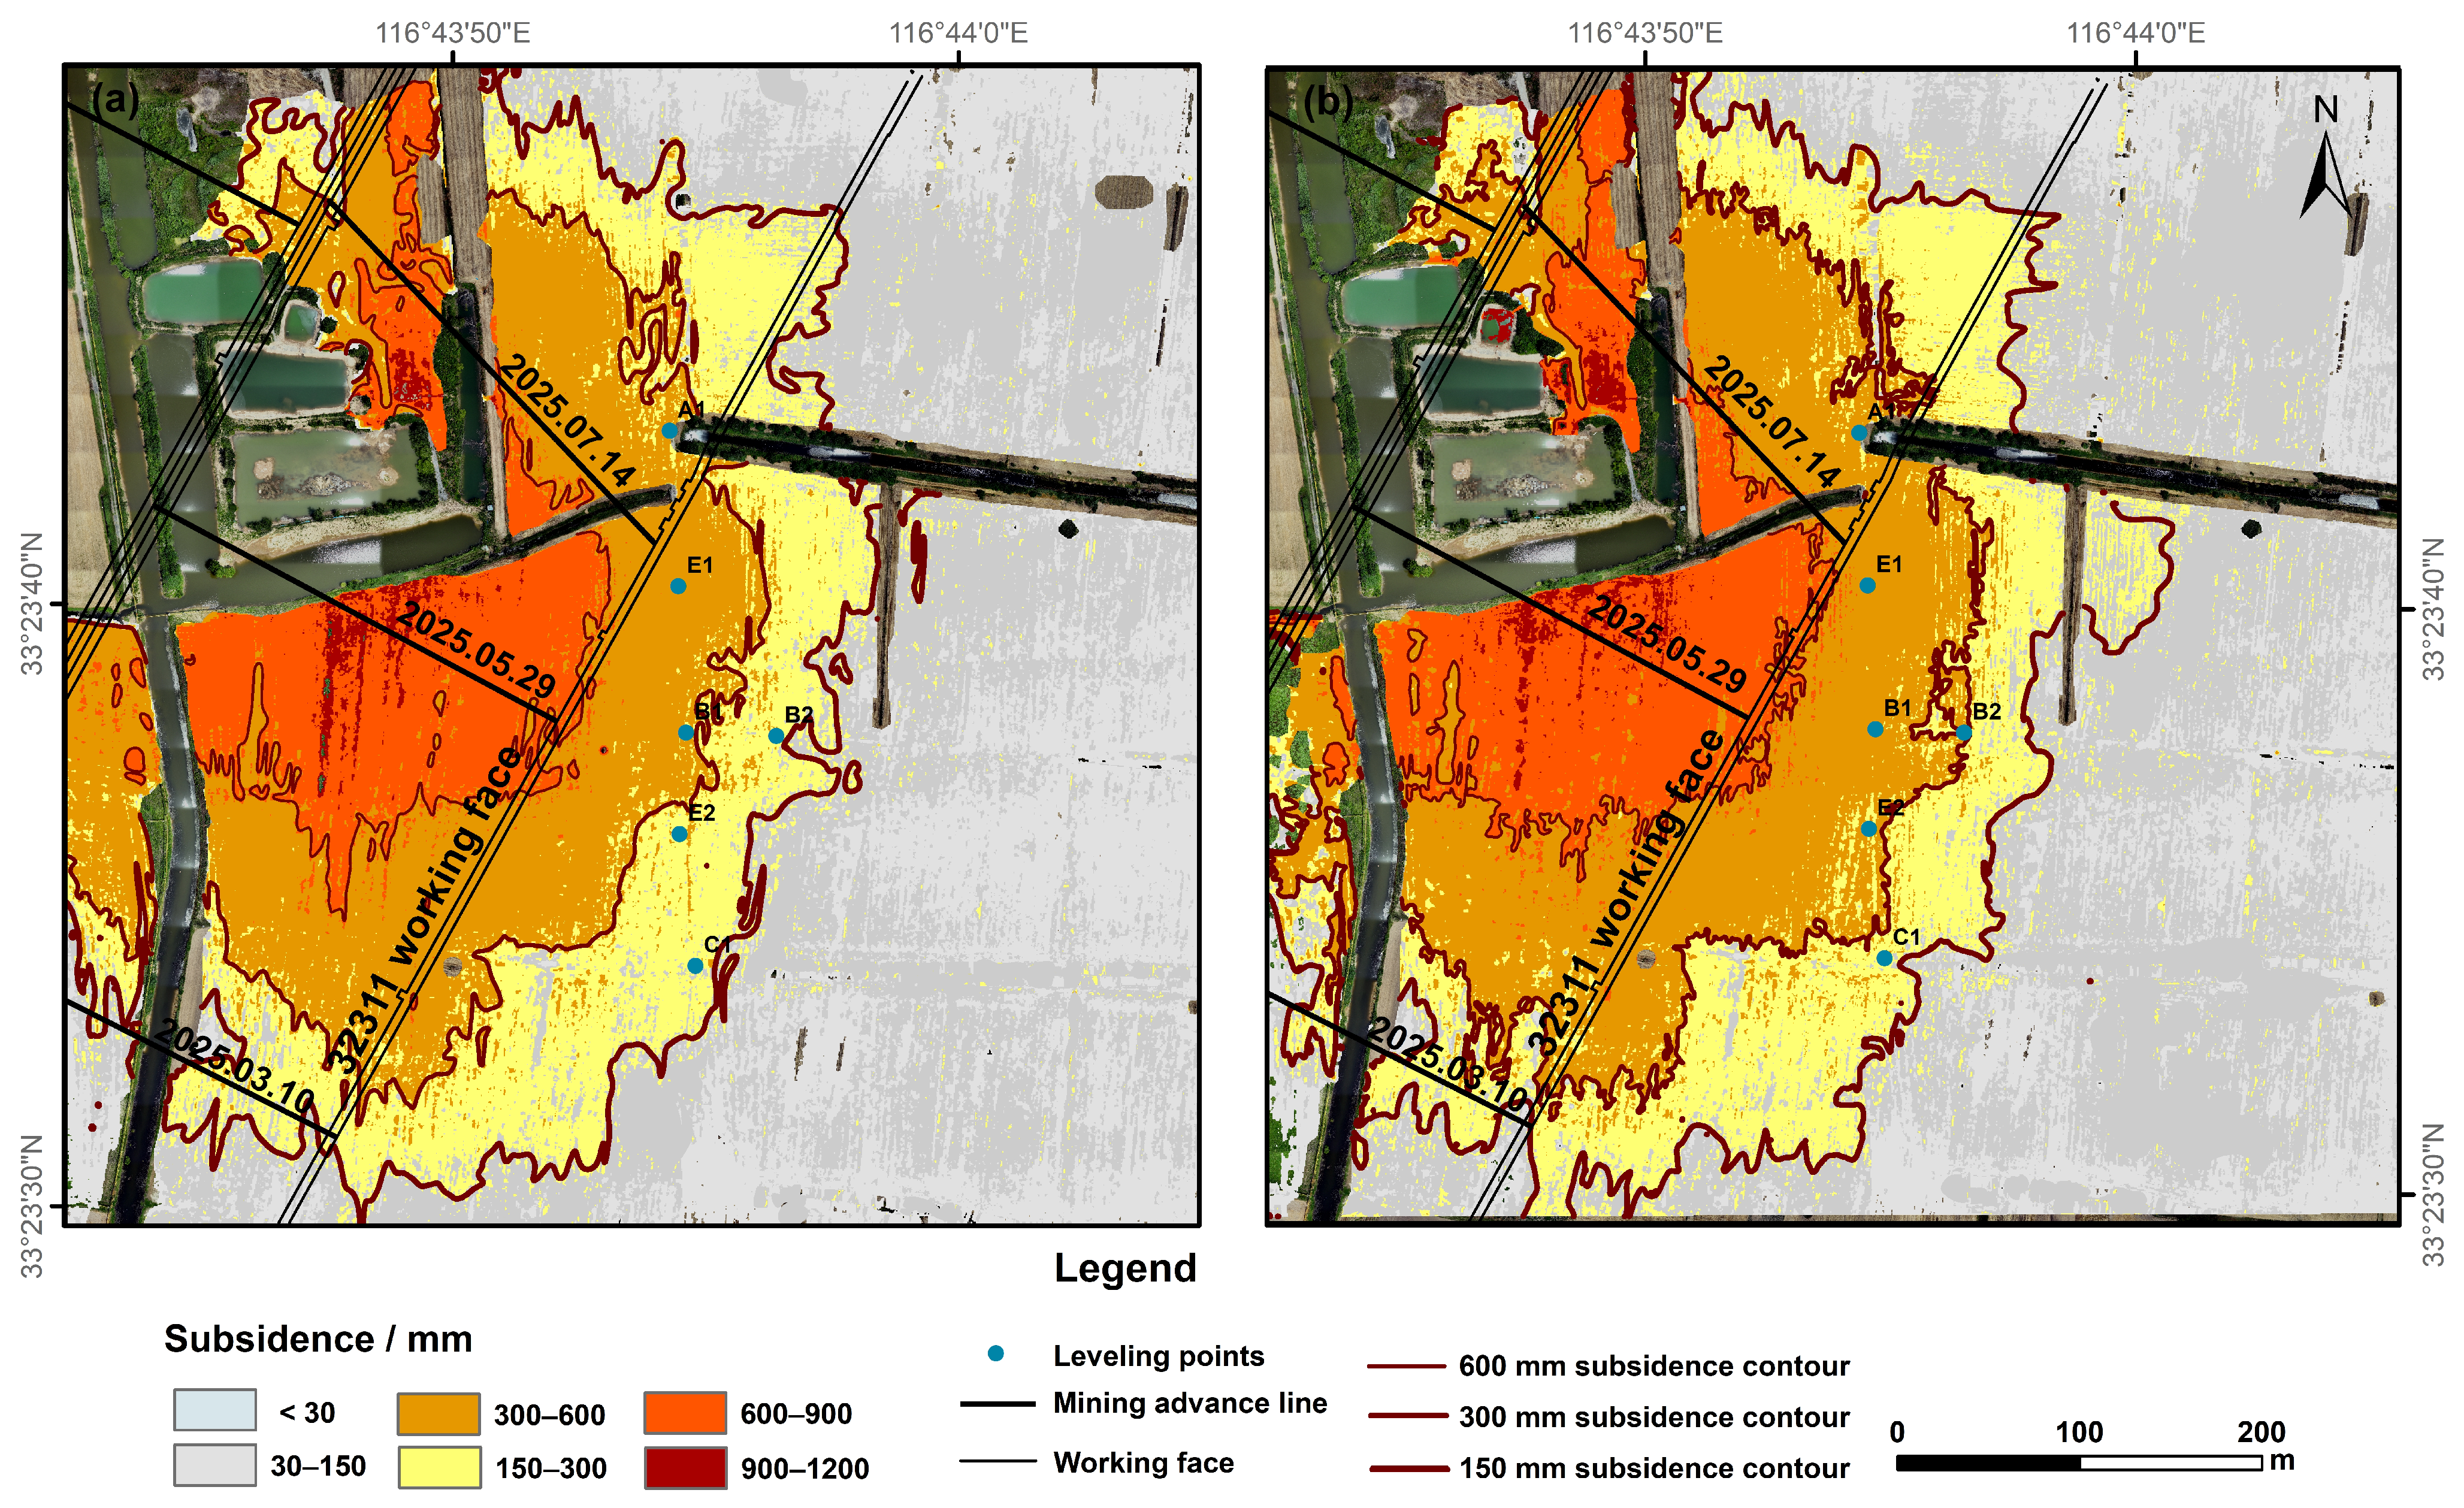
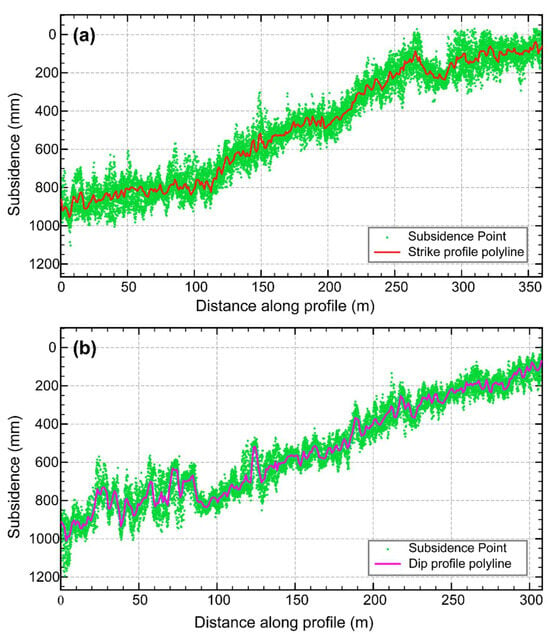
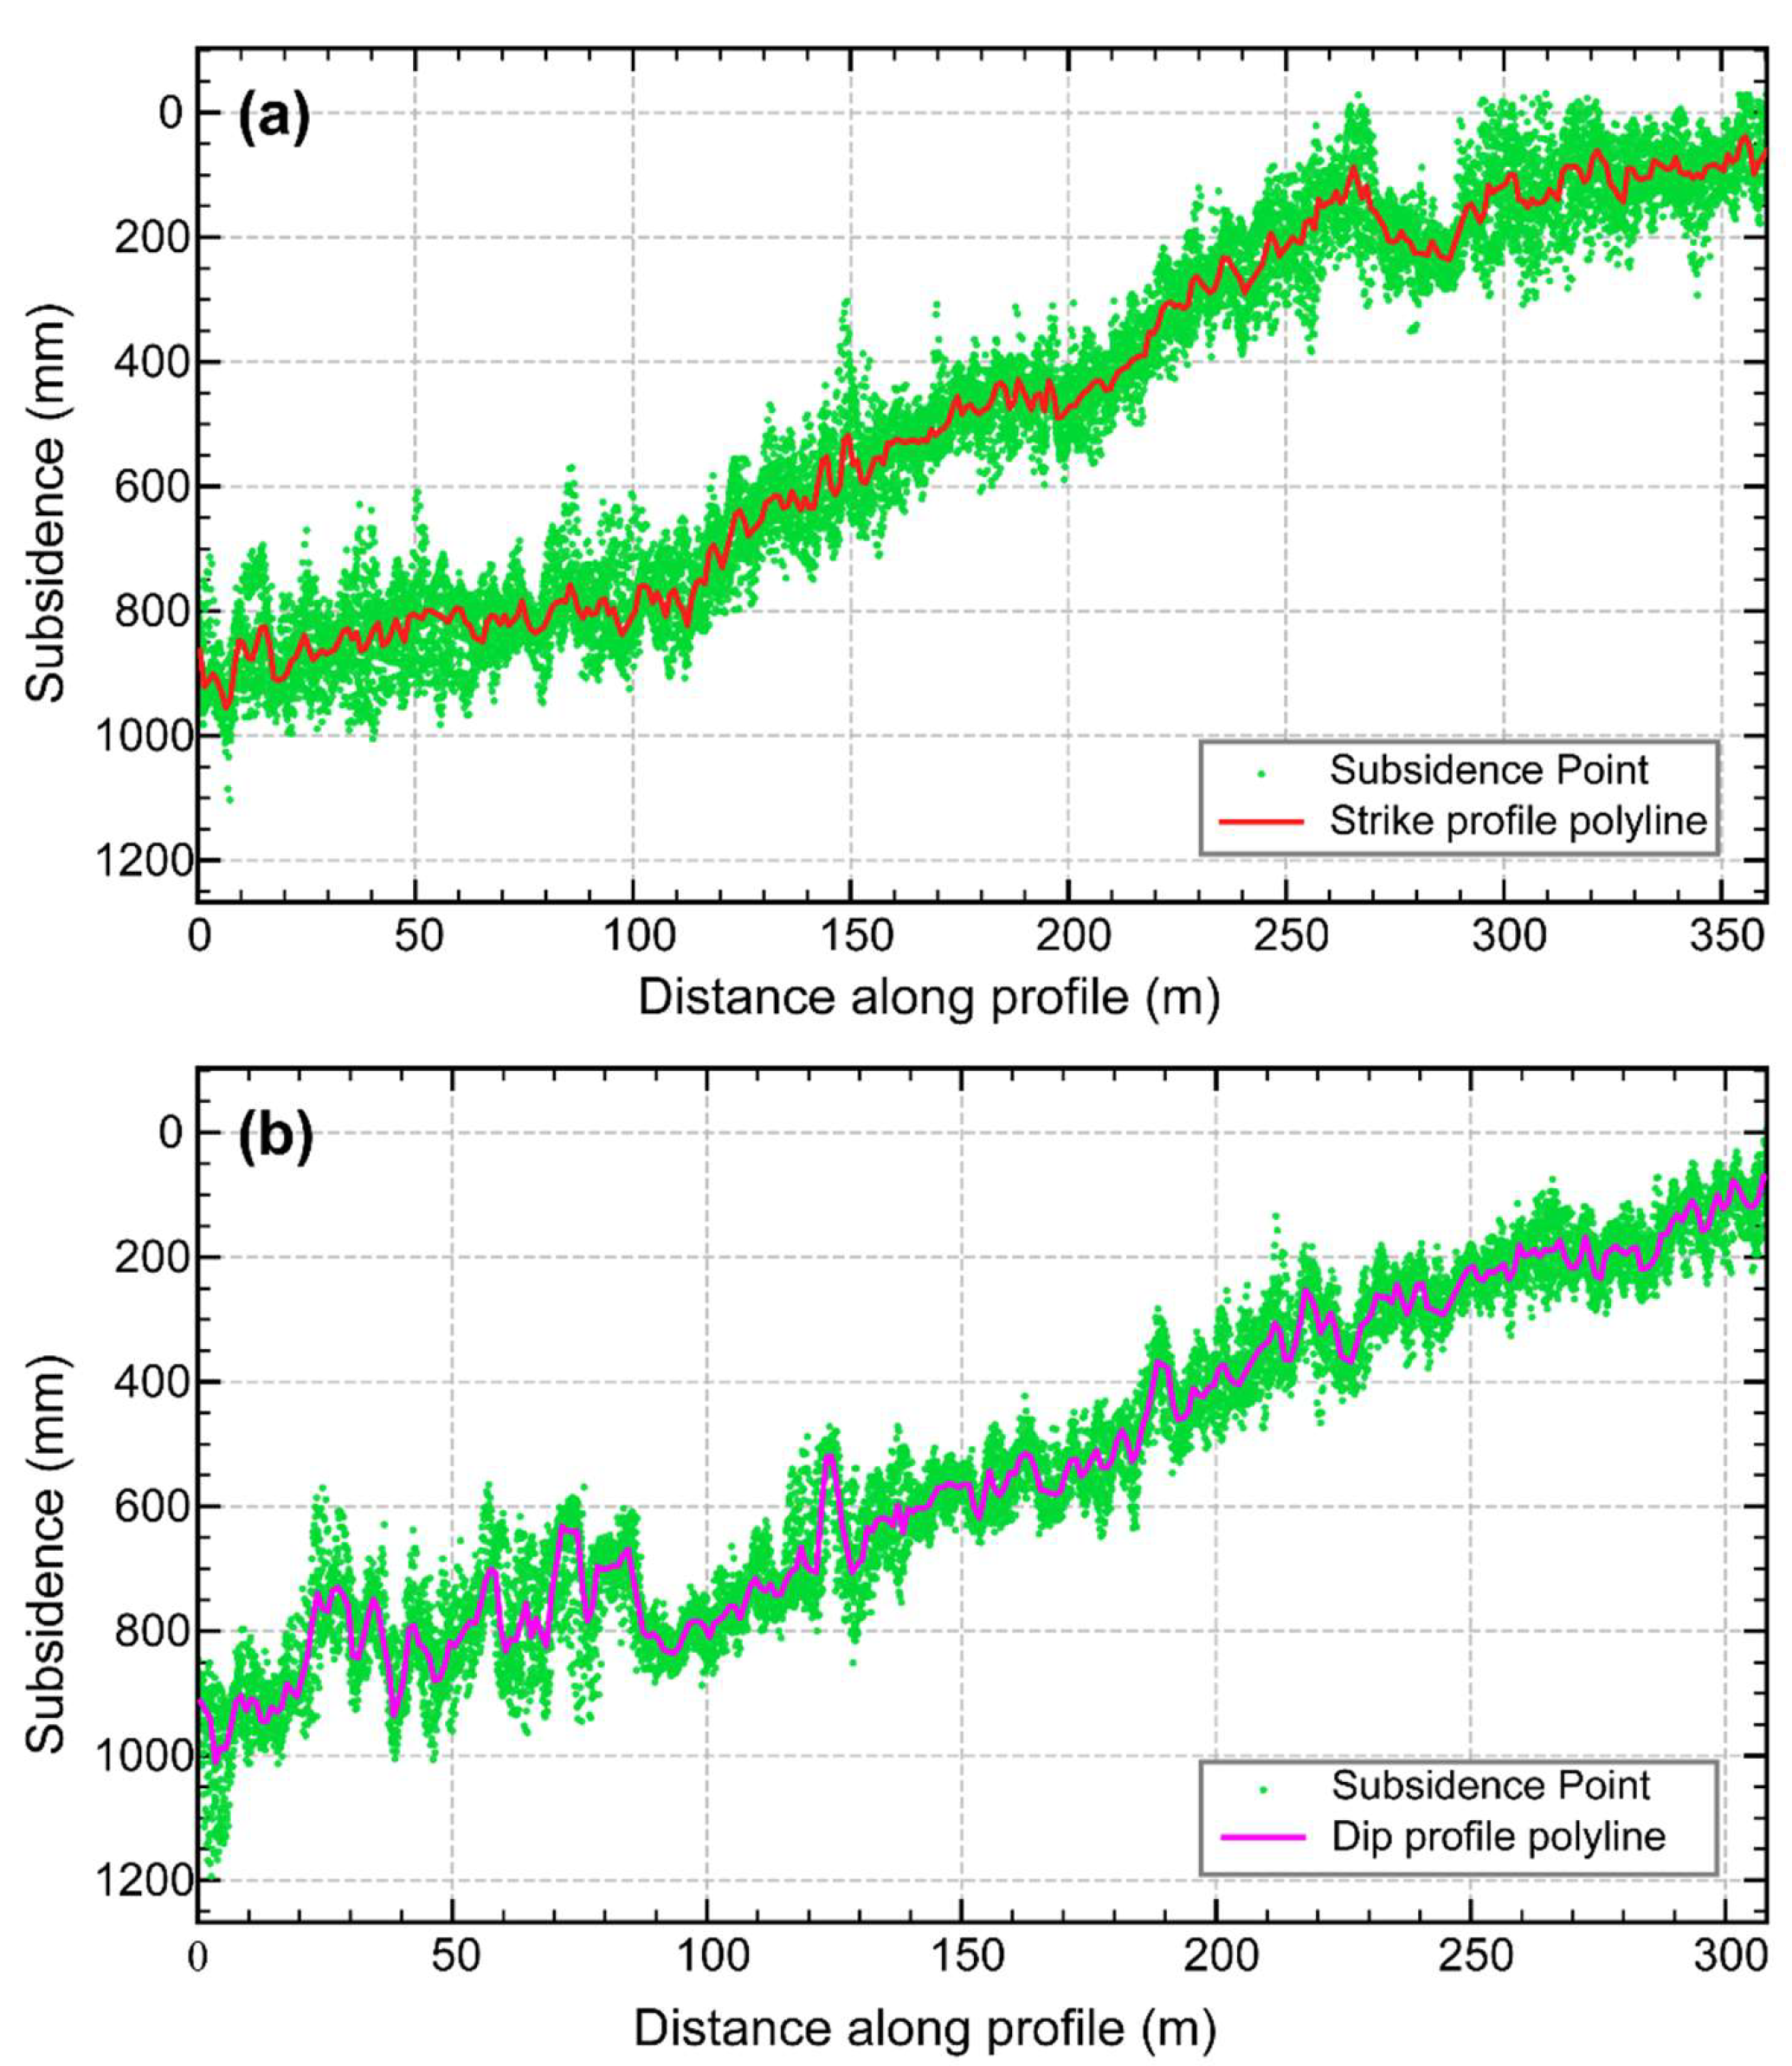
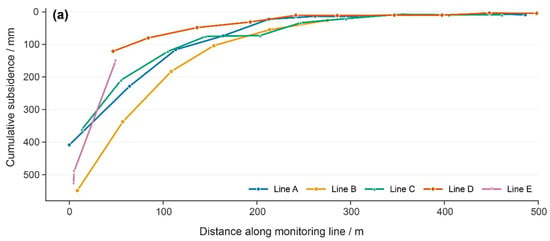
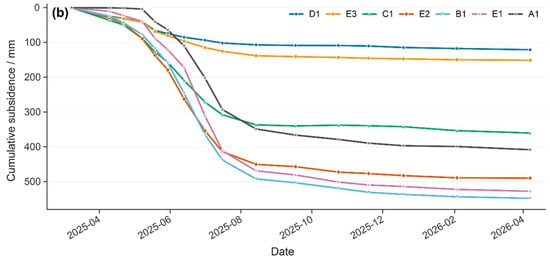
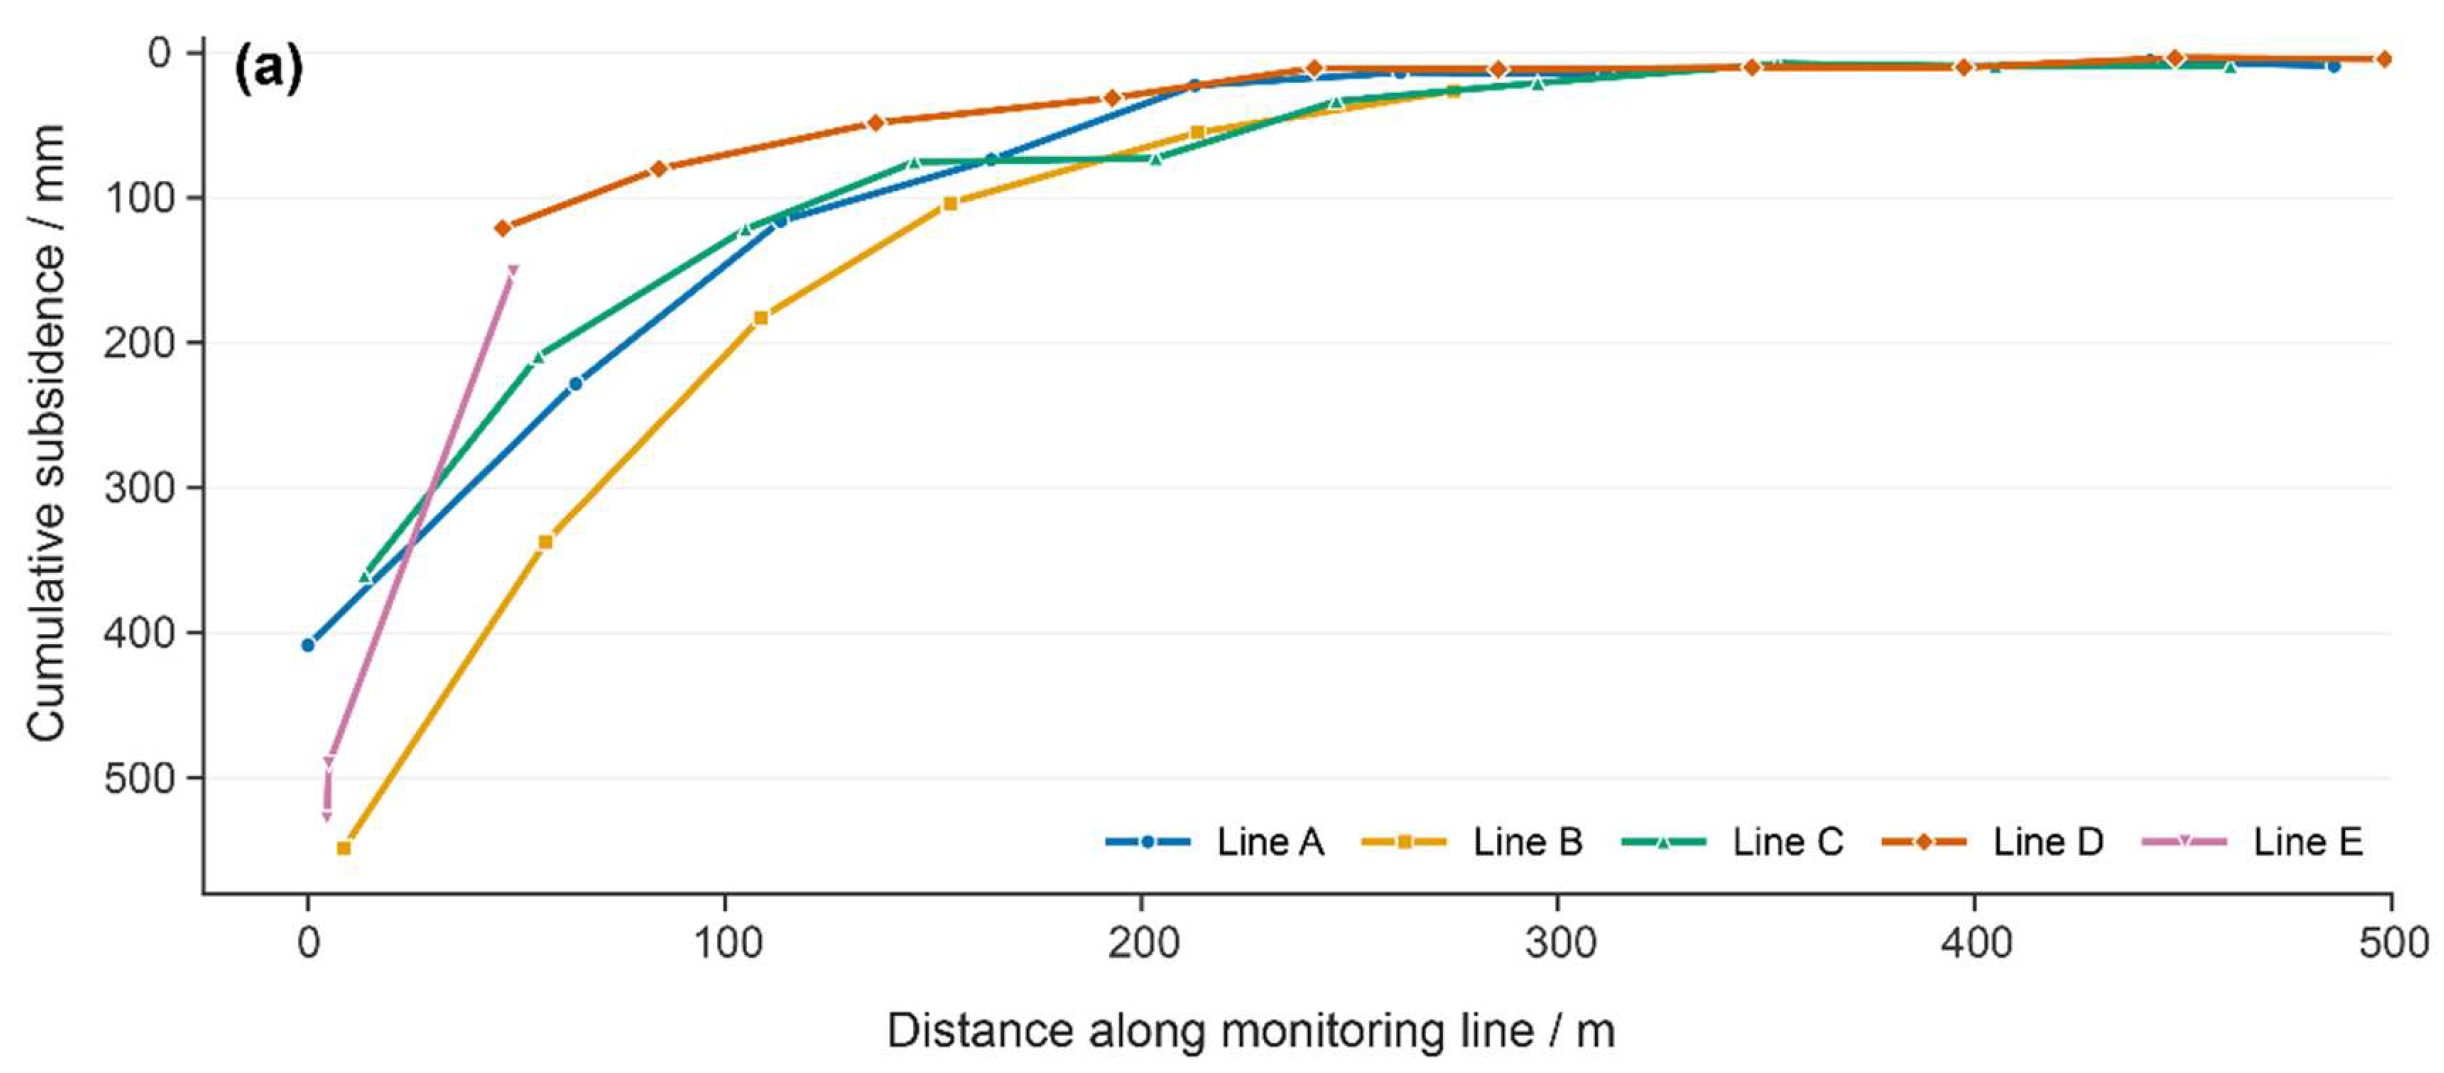
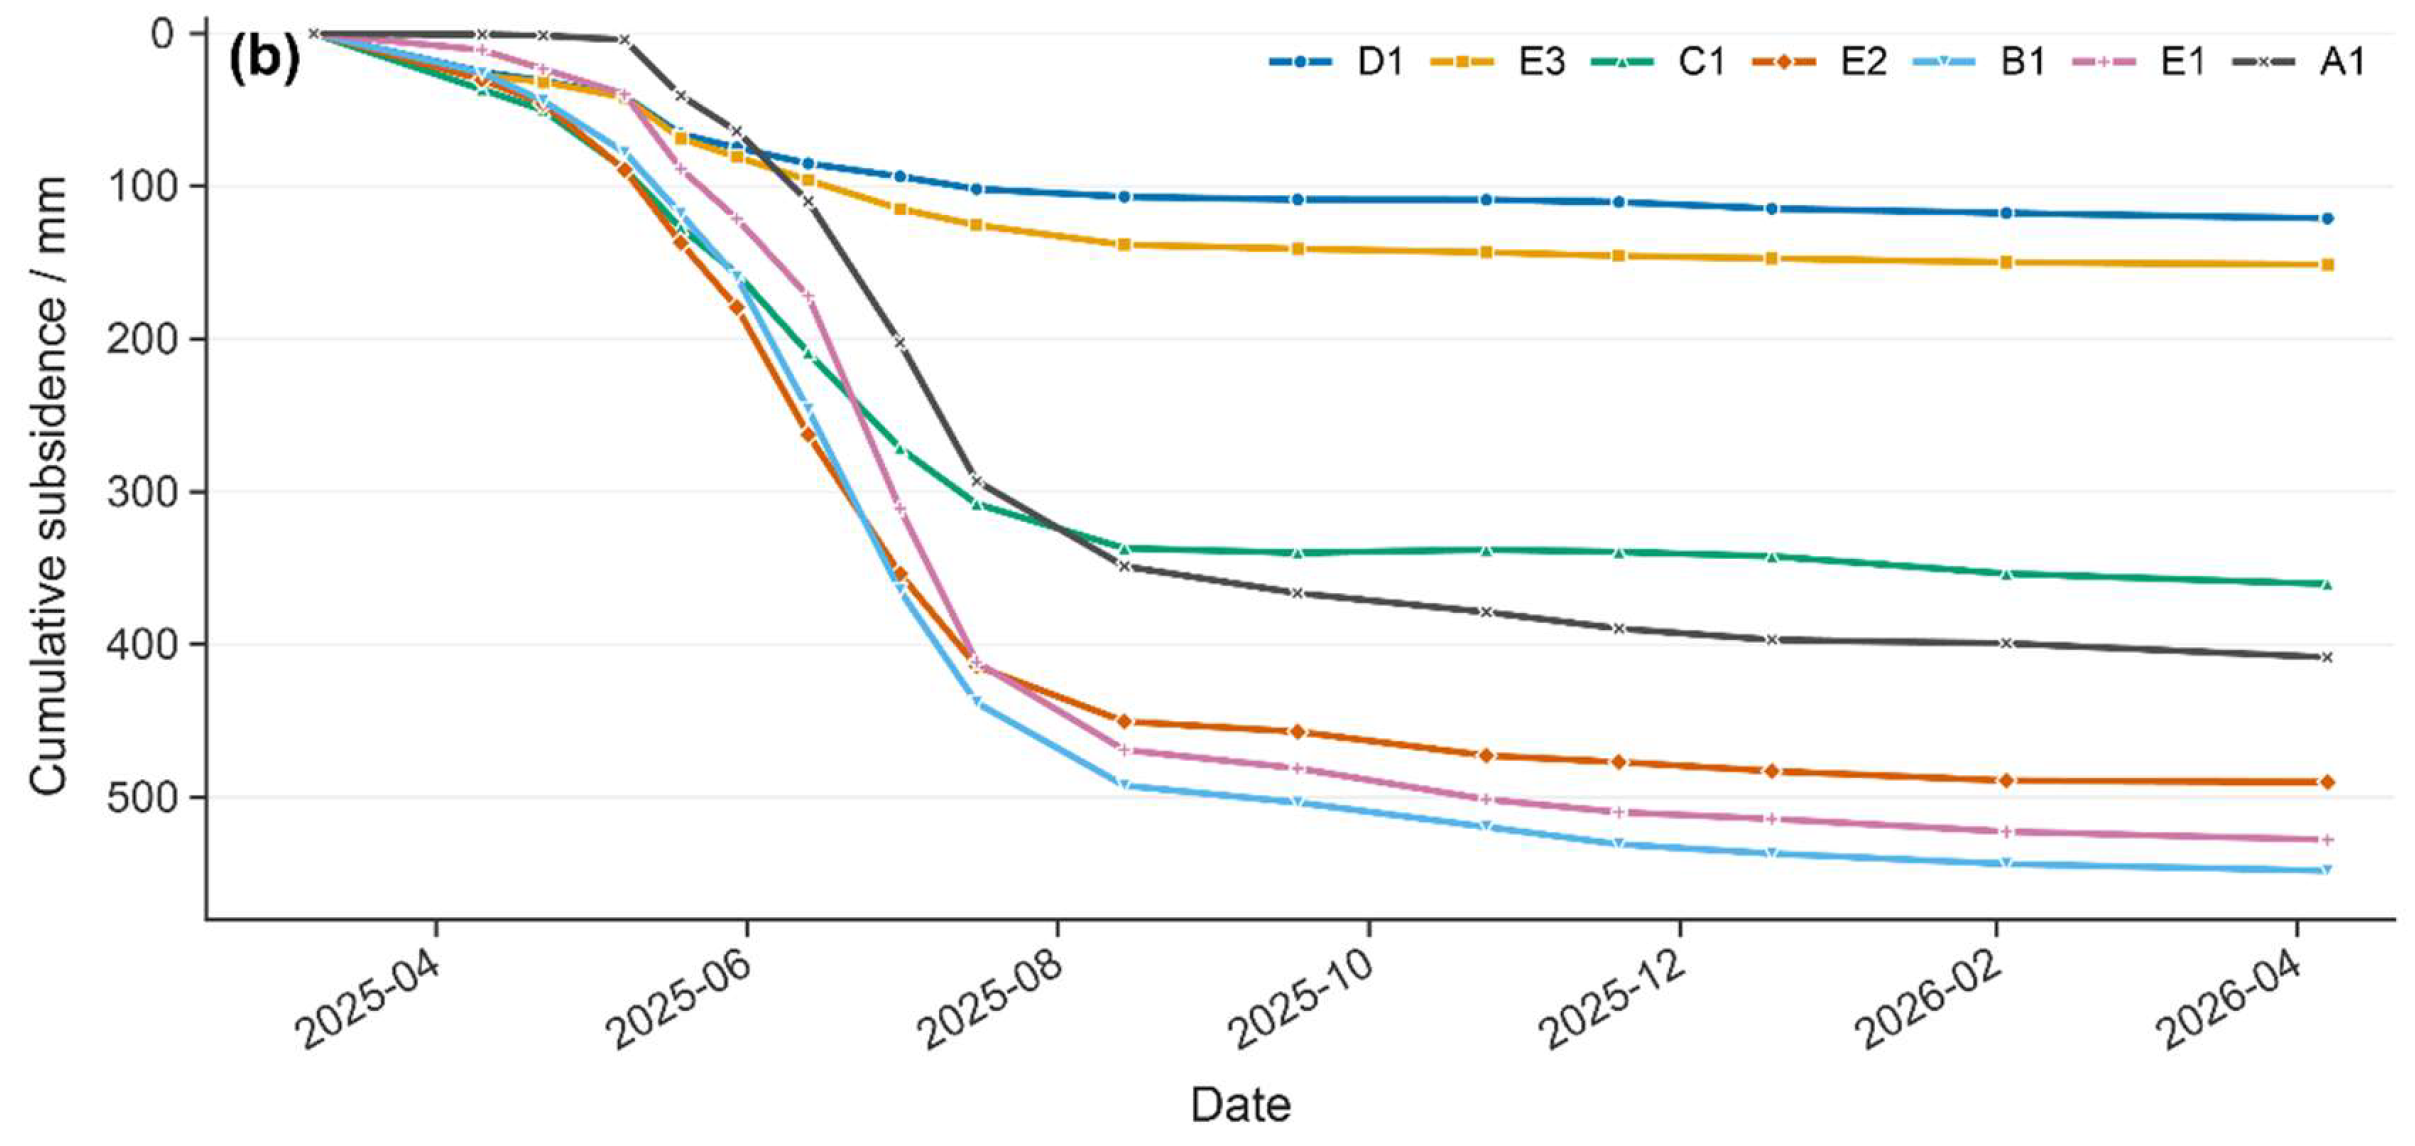
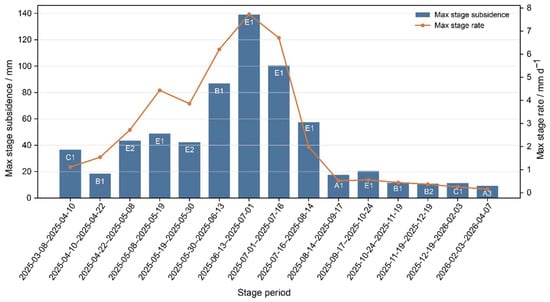
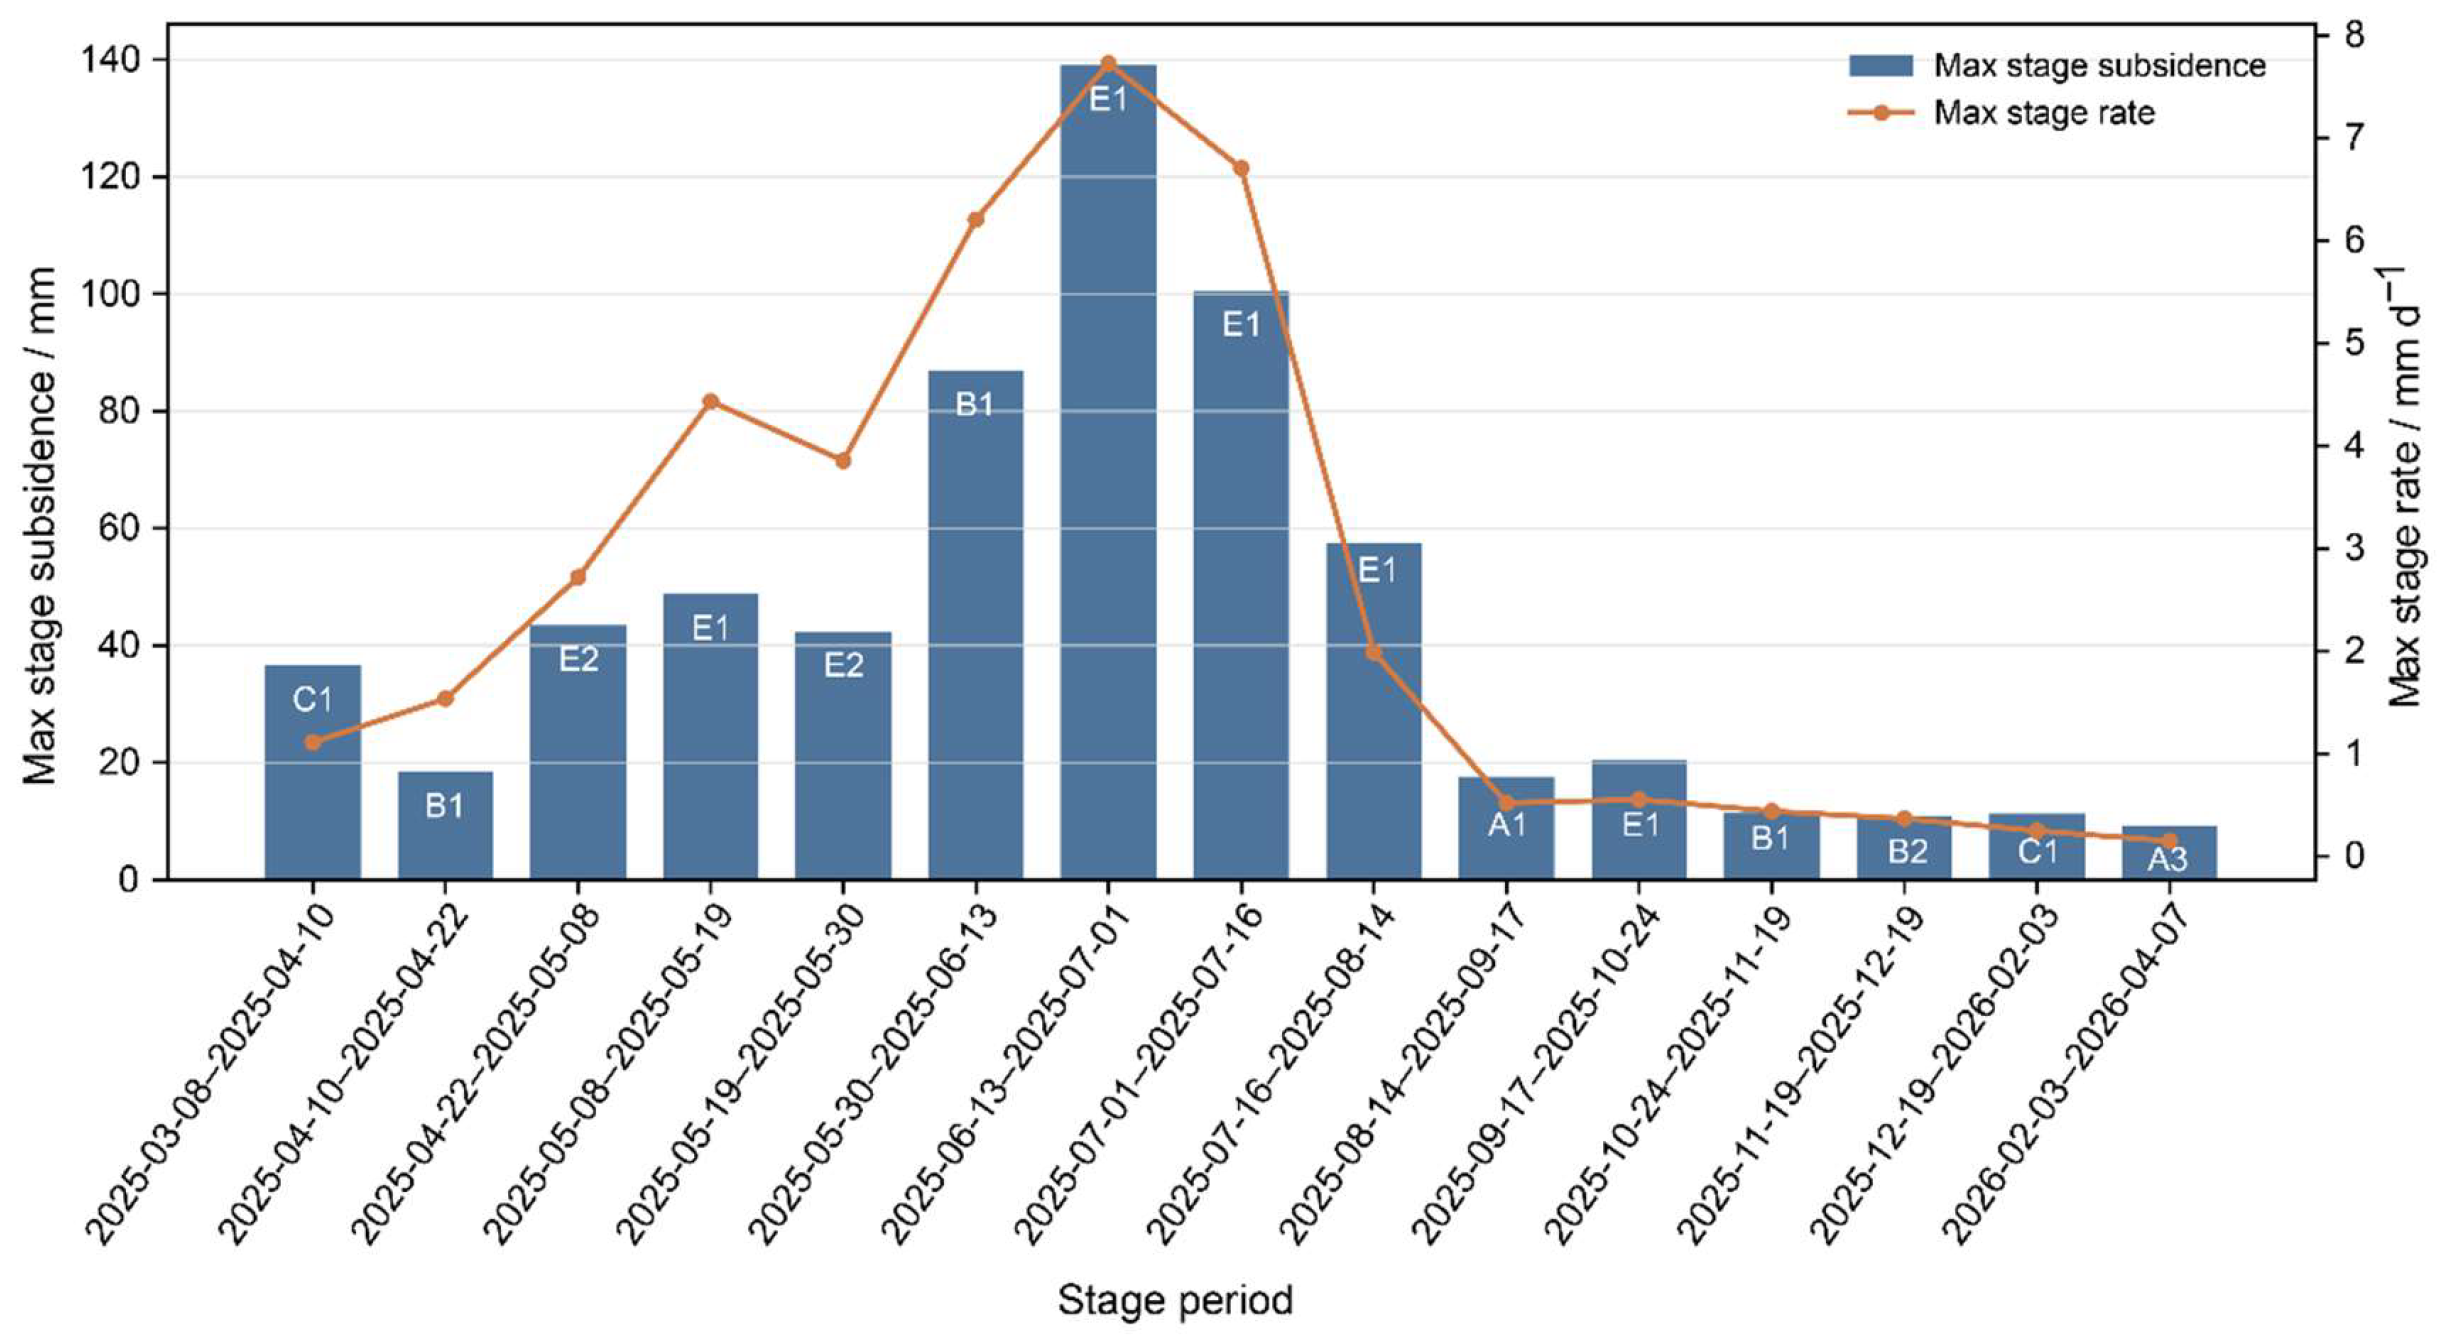
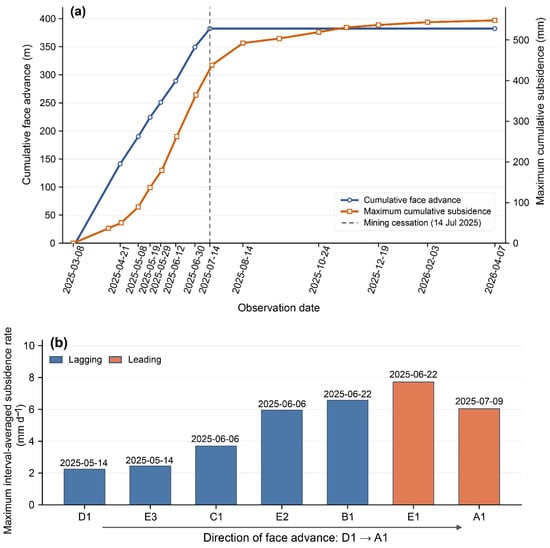
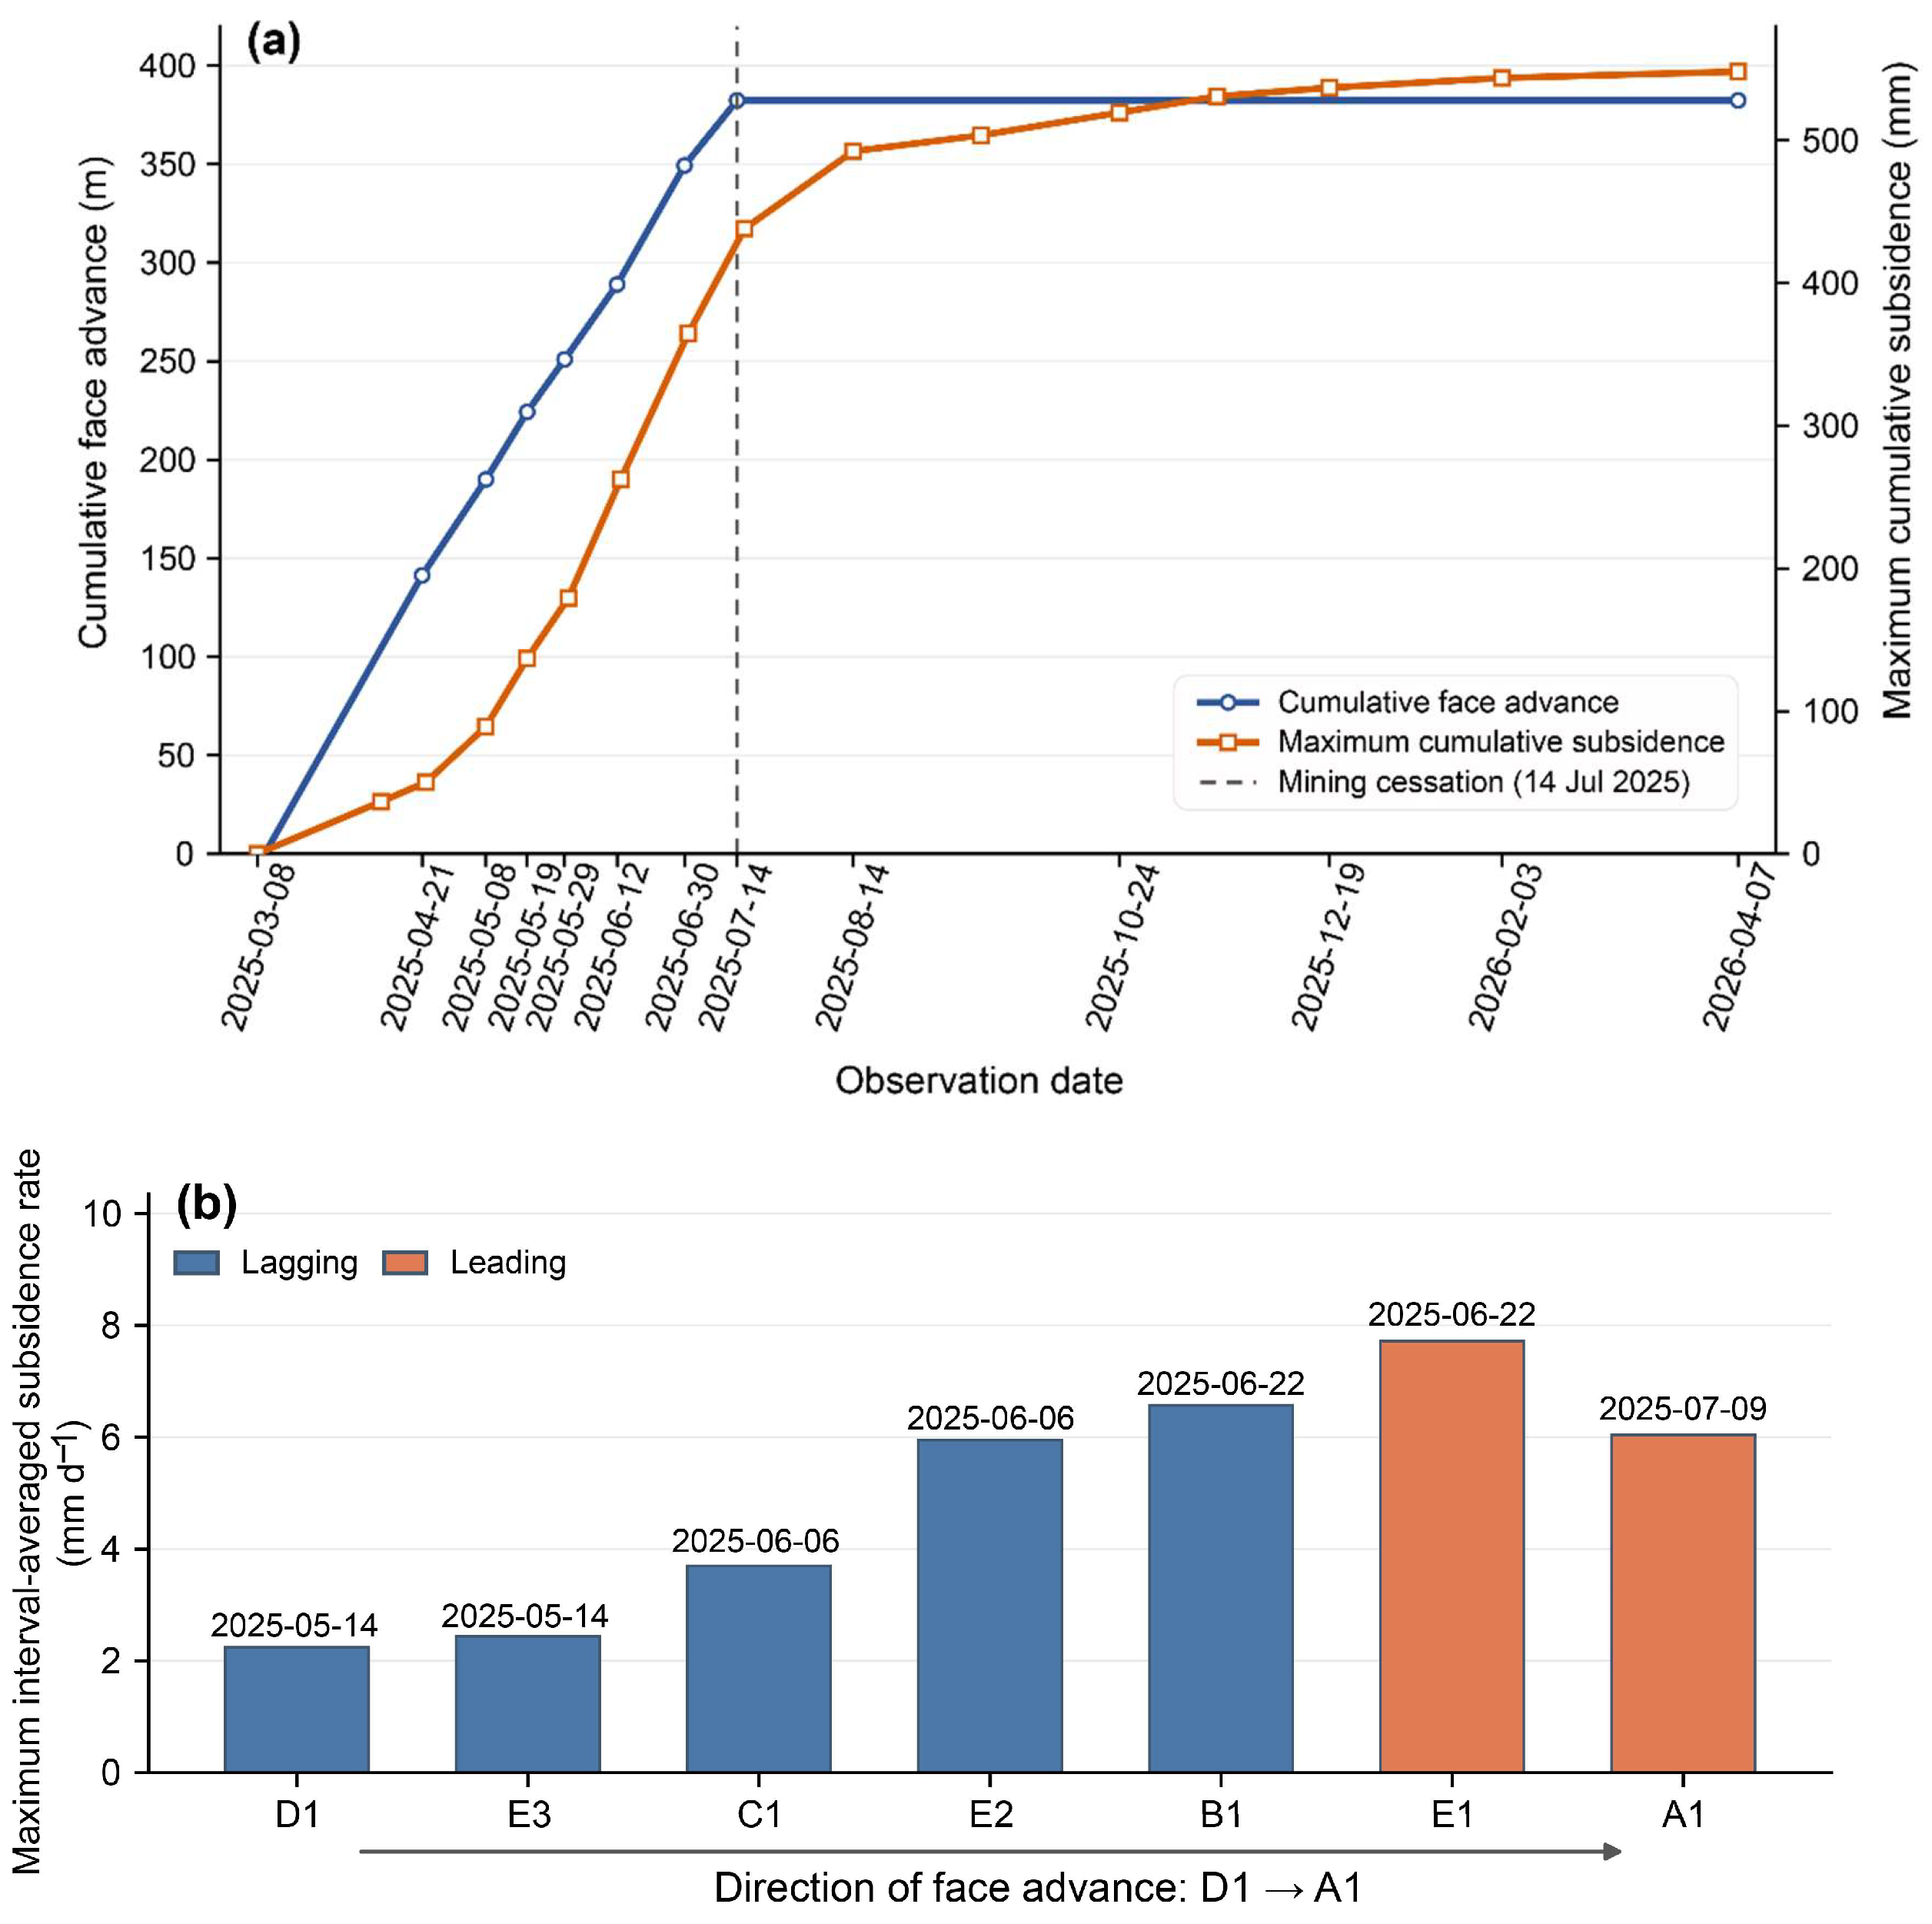

Disclaimer/Publisher’s Note: The statements, opinions and data contained in all publications are solely those of the individual author(s) and contributor(s) and not of MDPI and/or the editor(s). MDPI and/or the editor(s) disclaim responsibility for any injury to people or property resulting from any ideas, methods, instructions or products referred to in the content. |
© 2026 by the authors. Licensee MDPI, Basel, Switzerland. This article is an open access article distributed under the terms and conditions of the Creative Commons Attribution (CC BY) license.