


Highlights
What are the main findings?
- A GNSS tomography-based framework identifies and tracks three-dimensional water vapor preferential zones and matches them with precipitation regions.
- Across 16 events, 416 matched pairs show a mean precursor time lag of 231.5 min at rainfall onset and mean centroid distances of 52–55 km across precipitation stages.
What are the implications of the main findings?
- Localized moisture aggregation can be characterized through object boundaries, centroids, vertical structure, and life cycles.
- The framework provides a quantitative basis for examining three-dimensional moisture organization and its spatiotemporal association with precipitation in complex terrain.
Abstract
Conventional water vapor–precipitation studies rely on column-integrated or single-site observations, which cannot capture the three-dimensional (3D) structure of moisture aggregation and its role in precipitation triggering in complex terrain where convective, frontal, and orographic rainfall coexist. Using Ningxia Continuously Operating Reference Station (NXCORS) Global Navigation Satellite System (GNSS) observations (2018–2021), we develop a 3D water vapor tomography model (5 km × 6 km × 1 km computational grid; 5 min retrieval interval), validated against independent radiosonde and ERA5 data (r = 0.953/0.881; RMSE = 1.998/1.949 g m−3). We propose 3D Water Vapor Preferential Zones (WVPZs) and an object-based framework using stratified dual-percentile thresholds (99%/97%) and 3D connected-component tracking to identify, track, and match WVPZs with rainfall regions under temporal (≤6 h prior) and spatial (≤100 km centroid distance) constraints. Across 16 events, WVPZs were present in 94.97% of 5 min time steps. In 416 matched pairs, WVPZs typically formed 2–6 h before rainfall, with a mean precursor time lag of 231.5 min at onset. Mean centroid distances were 52–55 km (mean minimum centroid distance: 39.4 km). By rainfall type, convective rainfall had the shortest precursor time lag (220.6 min) but largest distance (55.7 km); frontal rainfall showed the tightest coupling (49.1 km); orographic rainfall had the longest precursor time lag (254.0 min). Sample-derived precursor-lag and spatial-proximity ranges are 3–5 h and 30–60 km. This framework shifts moisture diagnosis from continuous fields to discrete, trackable water vapor objects, providing a quantitative 3D indicator for characterizing pre-precipitation moisture organization and supporting precipitation monitoring in complex terrain.
1. Introduction
In the context of global climate change, extreme precipitation events have increased in frequency and intensity over most land areas since the 1950s [1,2], often triggering flash floods, debris flows, landslides, and urban waterlogging [3,4,5,6,7]. Their abrupt onset, localized impacts, and rapid evolution place greater demands on fine-scale forecasts of rainfall location, initiation timing and intensity evolution.
Atmospheric water vapor is the fundamental source of precipitation and controls its location, intensity, and evolution through transport, convergence, vertical distribution, and local aggregation [8,9,10,11,12]. Research has evolved from humidity monitoring and synoptic diagnosis [13,14] to heavy precipitation identification [15,16,17], short-term forecasting and warning [18,19,20], and data assimilation [21,22,23]. In most of these studies, however, water vapor is treated as a background environmental variable, an auxiliary indicator, or an assimilated observational constraint. Consequently, research has largely emphasized water vapor transport, moisture sources, and their statistical relationships with precipitation under long-term or large-scale backgrounds [8,9,24,25,26,27], whereas the direct spatiotemporal correspondence between localized three-dimensional (3D) water vapor structures and subsequent precipitation development remains comparatively underexplored [18,28,29].
The types of observational data commonly used—radiosonde measurements [30], satellite retrievals [31,32], radar-based products [33,34], Global Navigation Satellite System (GNSS)-derived precipitable water vapor (PWV), and other two-dimensional water vapor retrieval products [35,36] —all have limitations. Radiosonde, satellite, and radar observations often lack adequate temporal and spatial continuity [37,38,39,40,41]. PWV and its time-series features (e.g., thresholds, abrupt increases) have been widely used in precipitation identification and forecasting [19,42,43,44], but they reflect only column-integrated or single-site conditions and cannot distinguish the vertical location, horizontal extent, or 3D morphology of water vapor anomalies. This limitation is critical because precipitation processes depend not only on the total water vapor amount but also on the altitude, thickness, and temporal evolution of moisture anomalies. Lower troposphere water vapor enrichment and flux convergence favor lifting and convection [45]; mid-tropospheric moisture modulates dry-air entrainment and convective organization [46,47]; and 3D features such as tilted moist layers can substantially influence heavy precipitation distribution [48,49,50]. Thus, the key challenge in short-term precipitation forecasting is not merely whether water vapor is sufficient, but whether coherent 3D water vapor anomaly structures with spatiotemporal persistence exist before precipitation and whether they are systematically related to subsequent precipitation location and evolution.
GNSS water vapor tomography [51,52,53,54,55,56,57] has made it feasible to retrieve 3D water vapor density fields at minute and kilometer scales from slant-path wet delays of ground-based GNSS networks. This capability allows the spatiotemporal relationships between water vapor anomaly evolution and precipitation response to be investigated from a 3D structural perspective. Nevertheless, existing GNSS tomography studies have focused mainly on methodological improvements and data assimilation [29,55,58]. Systematic quantitative investigations on the 3D identification and continuous tracking of pre-precipitation water vapor anomaly regions and their spatiotemporal matching with precipitation events remain sparse.
Northwest China, especially the Ningxia Hui Autonomous Region, is a typical westerly–monsoon transition zone with complex terrain and is jointly influenced by the East Asian summer monsoon and mid-latitude westerlies [59,60]. Short-duration heavy rainfall and localized rainstorms occur frequently in summer, triggering flash floods and geological hazards [61,62]. Although the Ningxia Continuously Operating Reference Station network (NXCORS) has been established across this region, a GNSS water vapor tomography system covering the entire study area has not yet been developed, and systematic research on the quantitative relationship between 3D water vapor structures and precipitation remains lacking.
Accordingly, this study aims to (i) detect whether persistent 3D moisture aggregation structures (WVPZs) exist prior to precipitation; (ii) quantify their temporal and spatial predictability for short-term forecasting; and (iii) compare these predictive relationships across convective, frontal, and orographic rainfall types. To answer these questions, we develop and validate a GNSS water vapor tomography model using NXCORS observations. Based on the reconstructed 3D moisture fields, we propose the concept of 3D Water Vapor Preferential Zones (WVPZs) and establish a spatiotemporal matching framework between WVPZs and precipitation events. This framework allows quantitative diagnosis of the predictive relationships of WVPZs with the initiation, peak, and ending stages of different precipitation types. By transforming water vapor enrichment from continuous fields into identifiable, trackable, and matchable object-based indicators, this study provides a new quantitative basis for short-term extreme precipitation warnings in complex terrain transition zones.
The remainder of this paper is organized as follows. Section 2 describes the study area, datasets, and methods. Section 3 presents the validation of the GNSS tomography model and the analysis of WVPZ occurrence characteristics, topographic clustering, predictability, and precipitation-type differences. Section 4 discusses the physical implications, advantages of the object-based approach, potential applications, and limitations. Section 5 summarizes the main conclusions.
2. Materials and Methods
2.1. Study Area
Ningxia Hui Autonomous Region (35°14′N–39°23′N, 104°17′E–107°39′E) is a narrow, north–south oriented inland region in Northwest China. The Helan Mountains lie in the north, while the Liupan Mountains and Loess Hills dominate the south. The central, eastern and western parts consist of plains, basins and Loess Plateau transition zones. Annual rainfall increases from ~170 mm in the north to ~800 mm in the south [63], with precipitation mainly in summer. Orographic effects of the Helan and Liupan Mountains frequently trigger short-duration heavy rainfall and localized rainstorms, leading to flash floods and geological hazards [61,62]. Most of Ningxia has a temperate continental semi-arid climate, except for the semi-humid southern part of Guyuan City. The study area lies near the northern boundary of the East Asian summer monsoon and is strongly influenced by westerlies–monsoon interactions [59,64]. It therefore serves as an ideal natural laboratory for investigating the spatiotemporal correspondence between 3D water vapor aggregation and precipitation evolution under complex terrain and westerly–monsoon interactions, and as a representative case for short-term precipitation warnings in the climate transition zone of Northwest China.
2.2. Data Sources and Preprocessing
2.2.1. GNSS Observations and Processing
GNSS observations were initially available from 28 NXCORS stations (average inter-station spacing of ~53.6 km), with no external International GNSS Service (IGS) stations. We used GPS-only observations during the 2018–2021 flood seasons (June–September), sampled at 15-s intervals. Three stations (nxlw, nxxj and nxzn) were excluded because of substantial observation gaps during the 16 selected precipitation-event periods. The remaining 25 stations, with a mean nearest-neighbor distance of approximately 41.7 km, were used consistently for all tomographic reconstructions (Figure 1 and Table S1). The files were preprocessed with Translation, Editing and Quality Checking (TEQC) software [65], and tropospheric delays were derived using GAMIT [66] as primary tomography input; detailed GAMIT processing and network-configuration settings are summarized in Table S10.
Figure 1.
Location of the study area, observation networks, and GNSS tomography domain. (a) Spatial distribution of GNSS stations, precipitation gauges, prefecture-level cities, and the GNSS tomography domain over the Ningxia region, shown with topographic background and major terrain features. (b) Location of the study area within China and its relationship to the westerlies, East Asian monsoon region, and monsoon marginal zone. The inset illustrates the three-dimensional tomography grid configuration used in this study.
2.2.2. Radiosonde and ERA5 Data
Radiosonde data were obtained from the University of Wyoming and the Integrated Global Radiosonde Archive [67]. Within Ningxia, only Yinchuan station (38.48°N, 106.21°E) provides long-term continuous soundings (0800 and 2000 Beijing Time). We used 2007–2017 historical soundings to construct the vertical a priori water-vapor profile for the tomography model, and 2018–2021 event-period soundings exclusively for validation of the retrieved profiles. ERA5 reanalysis [68], produced by the European Centre for Medium-Range Weather Forecasts (ECMWF), has hourly temporal resolution, 0.25° × 0.25° horizontal resolution, and 37 pressure levels from 1000 hPa to 1 hPa, and was primarily used to validate the 3D spatial distribution of tomographically retrieved water vapor fields. Water vapor density was calculated from dew point temperature [69] and the ideal gas law [70].
2.2.3. Precipitation Data
Precipitation observations are 5-min records from 1089 rain gauges provided by the Ningxia Meteorological Observatory. Sixteen precipitation events during the 2018–2021 flood seasons were selected. Inverse distance weighting (IDW) was used to interpolate station observations onto a 0.01° × 0.01° grid. Cross-validation showed good agreement: average R2 ≈ 0.9, RMS < 0.175 mm (5 min)−1, and MAE < 0.025 mm (5 min)−1. Interpolation uncertainty may be spatially heterogeneous outside the main rain-gauge coverage; therefore, the interpretation of precipitation structures is restricted to areas within that coverage.
Precipitation in Ningxia is influenced by local convective activity, passing synoptic weather systems, and terrain-induced lifting around the Helan and Liupan Mountains. These influences produce contrasting precipitation characteristics in terms of intensity, duration, spatial extent, and terrain dependence, providing a regional basis for the convective–frontal–orographic comparison [62,71]. Based on precipitation duration, intensity characteristics, spatial evolution, and digital elevation model (DEM) data, the 16 events were classified into three types: convective (short duration, high intensity, pronounced peaks, limited coverage); frontal (long duration, broad coverage, one-dimensional propagation); and orographic (rainfall increasing with elevation, clear topographic lifting). This classification was used to compare WVPZ structural evolution, precursor time lags, and spatial correspondence with rainfall among different precipitation types. Since only 16 precipitation events were analyzed, the classification thresholds were derived from the empirical distribution of rainfall segments identified within these event windows and were intended for comparative analysis among different precipitation processes within the study region rather than as universal meteorological classification criteria. Detailed indicators and classification procedures are provided in Text S2. In addition, event rainfall categories were estimated using rainfall thresholds and station-proportion criteria adapted from the Chinese meteorological industry standard QX/T 489–2019, as summarized in Table S2 [72]. The precipitation types and estimated rainfall categories of the 16 events are presented in Table 1, while summary statistics by precipitation type, including event counts, proportions, mean duration, mean rainfall intensity, and mean coverage, are provided in Table 2.
Table 1.
Classification of precipitation events.
Table 2.
Summary statistics of the 16 selected precipitation events by precipitation type.
2.3. Methodology
We developed a GNSS 3D water vapor tomography model for Ningxia using NXCORS observations, with a computational grid spacing of 5 km × 6 km × 1 km and a retrieval interval of 5 min. The tomography results were validated against radiosonde (vertical profiles) and ERA5 (3D distributions). Precipitation stages were divided into pre-precipitation (Pre), start (Start), peak (Peak), end (End), and post-precipitation (Post). Mean 3D water vapor states were constructed for each stage, and stage differences were analyzed.
To extract trackable water vapor structures from continuous 3D fields, we propose an identification and tracking framework for WVPZs. A stratified dual-percentile threshold (99% for cores, 97% for peripheral zones) approach was used, followed by 3D connected-region tracking to generate WVPZ trajectories. Rainfall regions were identified and tracked from 5-min gridded precipitation fields. A spatiotemporal matching framework was established with two constraints: (1) at least one valid WVPZ snapshot occurs within the 6-h window ending at precipitation onset, and (2) horizontal centroid distance ≤100 km. Event-based WVPZ–rainfall pairs were constructed. Statistical associations were evaluated using occurrence frequency (Rocc), precursor time lag (), centroid distance (), structural characteristics, and precipitation-type dependence. Figure 2 illustrates the overall methodological framework.
Figure 2.
Flowchart of the methodology. Panels (a,b) summarize the conventional data processing and GNSS tomography procedures, whereas panels (c–f) present the extended workflow proposed in this study, including WVPZ identification and tracking, precipitation-region tracking, WVPZ–rainfall matching, and statistical analysis of precursor relationships. Black solid arrows connecting workflow elements indicate processing steps. Blue dashed arrows indicate the transfer of input data and tomographic products to the identification modules, while orange dashed arrows indicate the transfer of identified WVPZs and precipitation regions to the matching module. Thick red solid arrows connect analytical outputs to the research questions summarized in panel (f). Abbreviations and symbols: SWV, slant water vapor; SART, simultaneous algebraic reconstruction technique; WVPZ, water vapor preferential zone; IoU, intersection over union; P, prominence; CV, coefficient of variation; PMR, peak-to-mean ratio; FWHM, full width at half maximum; RMSSD, root mean square of successive differences; and d, centroid distance.
2.3.1. Construction and Validation of the GNSS Water Vapor Tomography Model
Slant-path wet delay (SWD) from GNSS signals is converted into slant-path water vapor content using the wet-delay-to-water-vapor conversion factor [73,74,75] (Text S3), and discretized into a 3D tomographic grid based on ray-path intersection lengths with voxels. The ray–voxel intersections and corresponding path lengths were determined using a three-dimensional Digital Differential Analyzer (DDA) ray-tracing method. The tomography domain covers the study area using the Universal Transverse Mercator (UTM) Zone 48N projection. Considering the north–south elongated geometry of the study area, the tomography domain was discretized using a computational grid spacing of 5 km × 6 km horizontally and 1 km vertically, resulting in a grid size of 61 × 84 × 10. The 5 km × 6 km spacing represents the computational discretization rather than the effective observational resolution; owing to the spatially heterogeneous GNSS ray geometry, the effective horizontal resolving scale is approximately 30–60 km (Text S4). One tomographic epoch is produced every 5 min. For each reconstruction, all available valid slant observations sampled at 15-s intervals within the corresponding 5-min window are assembled into an observation system using their respective azimuths and elevation angles. Each 5-min reconstruction uses approximately 3420 valid GNSS rays on average (Table S7). To mitigate uneven GNSS ray distribution and rank-deficiency [53], horizontal, vertical and prior constraints are introduced [76]. The resulting tomographic equation system can be expressed as Equation (1).
where A denotes the observation matrix composed of GNSS ray-path lengths within individual voxels; H, V and P represent the horizontal, vertical and prior constraint matrices, respectively; x denotes the water vapor density in a voxel to be retrieved; slant water vapor (SWV) is the water vapor content along the slant path; bprior represents the 50th percentile of water vapor density at each altitude level derived from the 2007–2017 historical radiosonde observations.
To further evaluate the identifiability and numerical conditioning of the observation system, singular-value diagnostics were performed for the DDA-derived observation matrix. Across the 15,552 tomography epochs, the median structural rank was 1534, while the median effective condition number at a relative singular-value threshold of 10−6 was 3.88 × 10⁵ (Text S4).
The tomographic equations are solved using the Simultaneous Algebraic Reconstruction Technique (SART) [54,77], yielding 3D water vapor density fields every 5 min. Validation uses radiosonde observations and ERA5 data, with metrics including root mean square error (RMSE), mean absolute error (MAE), Bias, and the Pearson correlation coefficient (r). Detailed formulas are provided in Text S1.
2.3.2. Classification of Precipitation Evolution Stages and Analysis of Water Vapor Field Evolution
Five characteristic stages are defined along the precipitation life cycle: Pre (3 h before onset), Start (onset), Peak, End (cessation), and Post (3 h after end). For each stage, a 30-min analysis window (15 min before/after the reference time) is used to compute mean water vapor density per voxel. Composite 3D fields are generated by weighted averaging of the corresponding stage fields across precipitation processes within the 16 selected event windows. Each process is assigned a weight of 1/M, where M is the number of precipitation processes within the original event window, with weights normalized over valid contributors. Differences between adjacent stages (Start−Pre, Peak−Start, End−Peak, Post−End) and overall change (Post−Pre) are calculated. Vertical dependence is compared at 1 km and 6 km above ground.
To examine the rainfall distributions accompanying these water vapor changes, precipitation is accumulated from the 5-min gridded fields over the Pre–Start, Start–Peak, Peak–End, End–Post, and Pre–Post intervals for each precipitation process. The interval accumulations are then composited using the same process weights as the water vapor fields. For each stage pair, both composites use the same eligible precipitation processes, allowing their spatial patterns to be compared over corresponding intervals.
2.3.3. Identification and Tracking of WVPZs and Rainfall Regions
Unlike traditional continuous-field analyses, this object-based framework converts 3D water vapor fields into discrete, trackable WVPZs with three innovations: (a) stratified dual-threshold (99%/97%) per vertical layer, avoiding altitude bias; (b) 3D connected-component labeling and tracking using horizontal intersection-over-union (IoU) and centroid distance d; (c) multi-metric fluctuation indicators—including peak prominence (P), full width at half maximum (FWHM), peak-to-mean ratio (PMR), coefficient of variation (CV), and root mean square of successive differences (RMSSD)—to quantify temporal dynamics.
- Selection of the Identification Thresholds
A WVPZ is defined as a 3D-continuous moisture-enriched structure with water vapor density notably higher than the ambient environment at its layer. Because water vapor density decreases with altitude, layer-dependent percentile thresholds are adopted to avoid altitude-related biases. These percentiles are derived separately for each vertical layer from all available reconstructed water vapor density fields within the 16 selected precipitation-event periods in 2018–2021 and remain fixed throughout the WVPZ identification period. The threshold criterion for voxel (z, y, x) at time t is
where is the identification result, is the threshold at altitude level , and is the water vapor density of the corresponding voxel.
A dual-threshold approach is adopted to overcome the limitations of a single threshold, which can cause either fragmented or overly broad identified areas if set too high or too low. The higher threshold defines the cores of WVPZs, while the lower threshold connects the surrounding peripheral regions. During 3D connected-region identification, only regions containing voxels above the higher threshold are retained, preventing spurious large-scale regions formed solely by voxels meeting the lower threshold. In addition, candidate regions are further filtered using structural and temporal constraints, including minimum voxel number, vertical continuity, and persistence duration. Five candidate pairs (98%/95%, 98%/96%, 99%/96%, 99%/97%, 99%/98%) were compared using the bridging fractions, thin-structure fraction, and identified-region fraction shown in Figure S1 to assess connectivity, structural characteristics, and regional extent. With the core threshold fixed at 99%, the 96% peripheral threshold yielded higher bridging fractions than the 97% threshold, whereas the 98% peripheral threshold produced greater variability in the thin-structure fraction and a smaller identified-region fraction. The 99%/97% combination was therefore selected as a balance between reducing bridging, limiting thin structures, and retaining regional extent (Figure S1). In all 16 repeats of leave-one-event-out aggregation, the 99%/97% pair retained lower bridging fractions than the 99%/96% pair and a lower thin-structure fraction than the 99%/98% pair (Table S3). These comparisons also held when event means were used instead of medians.
- Identification and Tracking Methods
Using the 99%/97% dual-threshold, identification results are connected into 3D regions using the 26-neighborhood connectivity criterion [78]. Regions with <50 voxels or <2 vertical layers are excluded. The remaining regions are WVPZs. For each WVPZ, we compute horizontal centroid coordinates, projection area, volume, mean water vapor density, centroid height, and the fraction of water vapor density in the lowest three layers (Bottom3 fraction).
To evaluate the observational support of the identified WVPZs, the DDA-derived ray–voxel intersections were mapped to the WVPZ voxels at each 5-min epoch. A WVPZ voxel crossed by at least one valid GNSS ray was regarded as directly ray-supported, and the corresponding direct-support ratio was calculated for each WVPZ snapshot. Because ray coverage varies with altitude, non-WVPZ voxels matched to the vertical distribution of WVPZ voxels were used as a background reference. The proximity of WVPZ voxels to directly ray-supported voxels was also evaluated in both voxel-index space and three-dimensional physical distance. Detailed definitions, calculation procedures, and statistical results are provided in Text S5, Figure S3, and Tables S7 and S8.
For WVPZs in adjacent time steps, horizontal IoU and the centroid distance are
where denotes the horizontal projection of a WVPZ, and indicate the numbers of WVPZs, x, y and z denote the centroid coordinates, and and represent the two adjacent time steps.
Correspondence between WVPZs in adjacent time steps is established by selecting pairs with maximum IoU and minimum centroid distance, linking them into trajectories. Trajectories with a duration shorter than 30 min are excluded, yielding stable WVPZ evolution sequences.
Along each trajectory, we extract mean water vapor density, volume, centroid height and Bottom3 fraction, and construct four bivariate relationships. Five fluctuation metrics for time series are introduced to quantify the evolutionary dynamics: peak prominence (P) [79], full width at half maximum (FWHM) [79], peak-to-mean ratio (PMR) [80], coefficient of variation (CV) [81], and root mean square of successive differences (RMSSD) [82]. These characterize peak intensity, duration of high values, relative intensification amplitude, overall dispersion, and short-term fluctuation intensity during the evolution of WVPZs, and are used for comparative analysis across different precipitation types.
Precipitation regions are identified from 5-min gridded precipitation fields by applying a threshold of ≥0.1 mm (5 min)−1 to identify rainy grid cells and using spatial connectivity to delineate precipitation regions. These regions are then tracked across time steps considering spatial proximity, area overlap, and intensity variations. Rainfall intensity is quantified as domain-averaged precipitation intensity.
2.3.4. Matching and Statistical Analysis of WVPZs and Rainfall Regions
To quantify the statistical relationship, WVPZ trajectories and rainfall regions are spatiotemporally matched to construct event-based paired samples. Previous studies show that moisture increases 3–6 h before precipitation occurrence [19,35,36], and 100-km scale water vapor differences affect precipitation probability and intensity [83,84]. Sensitivity analyses examined incremental pre-precipitation intervals (0–3, 3–6, 6–9, and 9–12 h) and distance thresholds of 20–160 km in 20-km steps (Texts S6 and S8; Figures S5 and S7). Most newly identified candidate associations occurred within the first 6 h, whereas extending the spatial limit beyond 100 km yielded additional associations comparable in number to those under event-conditioned temporal randomization. Accordingly, a 6-h pre-precipitation window and a horizontal centroid distance ≤ 100 km were adopted for subsequent matching. The robustness of the resulting associations to these prescribed matching constraints was further evaluated using complementary randomization tests (Text S7 and Figure S6). Leave-one-event-out analysis further showed that excluding any single precipitation event changed the stage-specific mean precursor time lags and corresponding mean centroid distances by at most 6.85 min and 3.38 km, respectively, indicating that these overall mean statistics were relatively insensitive to individual events (Table S6). As parameter selection and association analysis used the same 16-event sample, independent evaluation using additional events or longer time series is needed. For applications in other regions, we recommend evaluating candidate time windows and distance thresholds using local event samples and randomized references, while considering GNSS network geometry, tomographic resolving scale, terrain, and precipitation characteristics.
For each precipitation trajectory, WVPZ trajectories with at least one valid snapshot within the 6-h window ending at rainfall onset are considered as candidates. Each valid snapshot is compared with the rainfall region at its onset. IoU and horizontal centroid distance are calculated between the WVPZ horizontal projection mask and the rainfall-region mask, and snapshots with centroid distance ≤100 km are retained. For each candidate trajectory pair, a representative snapshot is selected using IoU as the primary criterion and smaller centroid distance to resolve approximately equal IoU values. Each WVPZ trajectory is then assigned to its best precipitation candidate using the same ranking rule; a precipitation trajectory may be associated with multiple WVPZ trajectories. Spatiotemporal metrics are subsequently calculated separately for each matched trajectory pair, which is included as one sample in the statistical analysis. A matched sample represents a spatiotemporal association between a precipitation trajectory and a WVPZ trajectory rather than a one-to-one correspondence between a precipitation event and a WVPZ. Due to the temporal evolution and spatial organization of precipitation systems, a single precipitation event may contain multiple precipitation trajectories and may be associated with different moisture aggregation structures during its development.
Because water vapor and precipitation usually exhibit phase-specific correspondences [85,86,87], we compare three key stages—Start, Peak and End—to quantify the temporal relationship between WVPZs and precipitation. Precursor time lag at a given stage is:
where and represent the time of the rainfall region and WVPZ at a given key stage (min), respectively. Precursor time lags for the Start, Peak and End stages are calculated separately and denoted as , and , respectively.
Similarly, horizontal centroid distance , , , and the minimum centroid distance () for each pair of samples over the entire evolution are computed. These metrics provide the statistical basis for analyzing precursor time lag, spatial proximity, coupling differences among precipitation types, and distance threshold sensitivity.
3. Results
3.1. Accuracy Validation of the GNSS Tomography Model
The 3D water vapor density fields retrieved from the GNSS tomography model are validated against independent radiosonde observations and ERA5 reanalysis data to establish their reliability for subsequent WVPZ identification.
3.1.1. Validation Against Radiosonde Observations
The 16 selected precipitation events covered 54 event-influenced days. Radiosonde observations were available twice daily at 0800 and 2000 Beijing Time (0000 and 1200 UTC), yielding 108 independent sounding profiles. For each sounding, the tomography profiles at 5 min before and 5 min after the nominal sounding time were extracted and compared separately with the same radiosonde profile. This procedure produced 216 radiosonde–tomography profile comparisons from the 108 soundings. The tomographic water vapor density profiles capture the general decrease in water vapor with altitude and exhibit high consistency with radiosonde-derived profiles across different sounding times (Figure 3a,b). Compared with radiosonde observations, the tomography results yield an RMSE of 1.998 g m−3, an MAE of 1.529 g m−3, a Bias of −1.067 g m−3, and a Pearson correlation coefficient (r) of 0.953, indicating good agreement but an overall underestimation.
Figure 3.
Validation of GNSS tomography results against radiosonde observations. (a,b) Comparison of water vapor density profiles at two typical sounding times (08:00 and 20:00 BT). (c,d) Vertical profiles of RMSE and Bias derived from the valid paired samples.
The vertical distributions of RMSE and Bias show that underestimation is mainly concentrated in the lower and middle troposphere (1–5 km), where water vapor content is relatively high (Figure 3c,d). This indicates that the tomography model effectively captures the vertical decrease in water vapor density, though biases remain in the high-humidity lower troposphere, likely due to strong spatial gradients, elevation differences between radiosonde stations and tomographic voxels, and smoothing effects in the inversion. Because the radiosonde comparison is limited to Yinchuan, these results demonstrate local vertical consistency and do not constitute an independent validation of the full three-dimensional structure across the study domain. The following ERA5 comparison provides a complementary assessment of spatial consistency across the domain.
3.1.2. Validation Against ERA5 Data
Tomographic water vapor densities during 2018–2021 are compared with ERA5 at corresponding grid locations and times (Figure 4a). A common comparison grid was established through the following temporal matching and spatial interpolation procedures. Temporally, only tomographic epochs coinciding with hourly ERA5 timestamps were used, yielding 1296 matched epochs without temporal interpolation. Spatially, ERA5 horizontal coordinates were transformed to WGS84/UTM Zone 48N. Pressure-level geopotential heights were calculated as , where is geopotential and ; the horizontal mean height of each pressure level was used as its vertical coordinate. Water vapor density was transformed using , mapped to the centers of the 5 km × 6 km × 1 km tomographic grid through joint three-dimensional linear interpolation, and then back-transformed. Here, is the source water vapor density, and is one hundredth of its minimum positive value at each epoch. No extrapolation was performed outside the source-point convex hull. Comparisons used paired valid values above the DEM-derived terrain surface.
Figure 4.
Comparison of tomography-derived water vapor density with ERA5 and vertical distributions of validation errors. (a) Density scatterplot of tomography-derived water vapor density against ERA5 water vapor density based on 56,723,328 valid matched grid-point samples. Colors indicate sample counts on a logarithmic scale. The blue dashed line denotes the 1:1 reference line, and the orange solid line represents the least-squares regression fit; the regression equation, coefficient of determination (R2), and sample size (N) are shown in the upper-left corner. (b,c) Vertical profiles of the root-mean-square error (RMSE) and Bias, respectively, between the tomography-derived and ERA5 water vapor densities.
The pooled grid-point samples show a strong positive correlation, with a Pearson correlation coefficient (r) of approximately 0.881 and a linear-fit R2 of 0.776. Across 1296 matched hourly epochs and 56,723,328 valid grid-point pairs, the mean hourly Bias, MAE, and RMSE are −1.118 ± 0.864, 1.447 ± 0.565, and 1.949 ± 0.632 g m−3, respectively (mean ± standard deviation). The grid-point pair count represents the comparison coverage rather than independent observations because the fields exhibit spatial and temporal dependence. Across the 16 events, event-mean RMSE ranges from 1.399 to 2.455 g m−3, and event-mean correlation coefficients range from 0.748 to 0.972 (Table S4). Negative event-mean Bias occurs in 15 of the 16 events, indicating predominant underestimation.
Vertical distributions of RMSE and Bias peak in the 2–3 km layer and decrease with altitude (Figure 4b,c), indicating that tomographic errors are concentrated in the lower-to-middle troposphere where water vapor variability is strongest. The mean hourly RMSE is 3.172 ± 1.282 g m−3 at 2.5 km and decreases to 0.283 ± 0.144 g m−3 at 9.5 km above mean sea level, further illustrating the height dependence and temporal variability of the reconstruction errors (Table S5).
Horizontal distributions show a south-to-north gradient: larger errors in the south and low-elevation regions, smaller errors near the Helan Mountains, Liupan Mountains, and Loess Plateau margins (Figure 5).
Figure 5.
Horizontal distributions of column-averaged tomography errors relative to ERA5 and their topographic context. (a) Root-mean-square error (RMSE) and (b) bias of tomography-derived water vapor density. Black lines denote the provincial boundary. Gray terrain contours show elevation, with major contours at 1000-m intervals and minor contours at 500-m intervals above 2000 m. The Helan Mountains, Liupan Mountains, and Loess Plateau are labeled for geographic reference.
Overall, validation against both radiosonde and ERA5 demonstrates that the GNSS tomography model reliably reproduces the vertical gradient and spatial distribution of 3D water vapor density over the study region. The Pearson correlation coefficient (r) exceeds 0.88 for both independent validation datasets. Despite systematic underestimation, the accuracy is sufficient for subsequent WVPZ identification and spatiotemporal coupling analysis.
3.2. Prevalence and Topographic Clustering of WVPZs
Composite difference analyses of water vapor density at different precipitation stages for the 16 precipitation events show that water vapor variations are not spatially uniform but exhibit pronounced vertical differences and localized patchy characteristics. Low-level water vapor density generally decreases before onset (Start−Pre, Figure 6(a1)) and over the entire precipitation evolution (Post−Pre, Figure 6(a5)). Upper-level moisture variations are more spatially heterogeneous and complementary to low-level patterns (Figure 6(b1–b3,b5)). The corresponding precipitation composites show greater accumulations during the Start–Peak and Peak–End intervals, with larger Pre–Post totals in southern Ningxia (Figure 6c).
Figure 6.
Composite water vapor density differences at (a) 1 km and (b) 6 km above ground level (AGL), and (c) composite accumulated precipitation over the corresponding intervals. Column labels denote stage-to-stage differences in (a,b) and accumulation intervals in (c); for example, Peak−Start in (c) denotes rainfall accumulated from Start to Peak. The precipitation panels show weighted composite means using a continuous color scale.
The composite fields, however, cannot resolve detailed generation, development, and dissipation of localized moisture aggregation cores or their associations with rainfall. Therefore, we identify and track WVPZs for the 16 precipitation events, yielding 1553 valid WVPZ trajectories. Statistical results show substantial differences in the lifetime and generation frequency of WVPZs among precipitation events. The mean lifetime of WVPZs for individual precipitation events ranges from 48.2 min to 202.2 min, with an overall mean lifetime of 98.6 min (median value 70 min). Most trajectories last <200 min, and few exceed 400 min. The number of trajectories per event ranges from 14 to 234 (Figure 7a–c).
Figure 7.
Statistical characteristics and spatial distribution of WVPZs during the 16 precipitation events. (a) WVPZ lifetime by precipitation event; (b) frequency distribution of WVPZ lifetime; (c) number of WVPZ tracks identified for each event; (d) WVPZ occurrence rate for each event; and (e) spatial density of WVPZ centroids, with colors denoting centroid counts. Major terrain features are shown for reference.
Despite this variability, at least one WVPZ was present in 94.97% of the analyzed 5-min time steps across the 16 event periods (Figure 7d), indicating that WVPZs are not isolated features but a common 3D organizational pattern of water vapor during precipitation. Their short mean lifetimes and high generation frequencies reflect rapid generation–dissipation cycles and continuous replacement characteristics of water vapor aggregation during precipitation events.
The spatial distribution of the WVPZ centroid frequency is not uniform or random but concentrated in several stable high-frequency regions (Figure 7e). These hotspots lie along pronounced terrain gradients: the Helan Mountains in the north, the Liupan Mountains in the south, and the transitional zones along the eastern and western margins of the Loess Plateau. These high-frequency regions correspond well with areas of strong water vapor density variations during precipitation development and dissipation stages (Figure 6). Although GNSS ray penetration density also varies spatially, particularly in the lower tomographic layers, areas of relatively dense ray coverage do not show consistent spatial correspondence with the WVPZ centroid hotspots (Figure S4). This spatial mismatch suggests that the observed hotspot pattern is unlikely to be explained solely by the nonuniform GNSS ray coverage. In contrast, the closer correspondence of the hotspots with major terrain gradients suggests that terrain-related modulation of moisture transport and accumulation is likely a more important spatial control on WVPZ formation and maintenance, although the potential influence of spatially varying observational sensitivity cannot be completely excluded. Although WVPZs are nearly ubiquitous during precipitation events, their temporal and spatial predictive utility remains to be quantified—a task addressed in the following section through systematic matching with rainfall regions.
3.3. Spatiotemporal Coupling Relationships Between WVPZs and Precipitation
Using the method described in Section 2.3.4, WVPZ trajectories are paired with rainfall regions under the determined temporal and spatial matching constraints, and their spatiotemporal coupling is quantitatively analyzed.
3.3.1. Construction of Matched Samples
Across the 16 precipitation events, 1553 WVPZ trajectories were identified, of which 416 satisfied the spatiotemporal matching criteria and were associated with precipitation trajectories, while 1137 remained unmatched. Treating unmatched WVPZ trajectories as false alarms within this retrospective matching framework yielded a false alarm rate (FAR) of approximately 73.2% and a critical success index (CSI) of approximately 0.27. The 416 matched samples represented individual spatiotemporal associations between WVPZ trajectories and precipitation trajectories rather than independent precipitation events. Frontal rainfall events accounted for the largest number (216), followed by convective rainfall (180), and orographic rainfall (20). Unmatched cases fell into two scenarios: (1) precipitation was too localized, discontinuous, or short-lived to form a stable trajectory; (2) a valid WVPZ developed but failed to match due to the distance constraint.
3.3.2. Temporal Lead Relationship
WVPZs consistently appear prior to precipitation at the Start, Peak, and End stages (Table 3). For the Start stage, mean precursor time lag is 231.47 min (median 220.00 min; interquartile range ~108.75–345 min), indicating that WVPZs typically form 2–6 h before precipitation. Mean precursor time lags for the Peak and End stages are 204.1 min and 177.2 min, respectively (median 205 min and 185 min). The gradual decrease in precursor time lag from Start to End suggests that WVPZ strengthening and weakening processes systematically precede the corresponding surface precipitation response. The temporal association was further evaluated using the randomization test. The observed matched WVPZ fraction exceeded approximately 94% of the randomized realizations, with an empirical value of 0.060 (Figure S6a), indicating a modest enrichment relative to randomized temporal configurations.
Table 3.
Statistics of precursor time lag and centroid distance between WVPZs and rainfall regions (overall precipitation type).
3.3.3. Spatial Correspondence Between WVPZs and Precipitation Regions
The horizontal centroid distance between WVPZs and rainfall regions is spatially proximate but not fully overlapping. Mean centroid distances for the Start, Peak and End stages are 52.53 km, 54.50 km, and 54.27 km, respectively (median 48.53 km, 50.86 km, 51.47 km), with interquartile ranges mostly within 25–78 km. These results indicate that WVPZs and rainfall regions usually maintain spatial correspondence on the scale of tens of kilometers. The minimum centroid distance within each event window is substantially smaller: mean 39.40 km, median 38.13 km, indicating that the two approach more closely at certain stages. The spatial association was further evaluated using the randomization test. The observed mean centroid distances at the Start, Peak, and End stages, together with , all fell below the 5th percentile of their corresponding randomized distributions (Figure S6b), indicating that the observed spatial proximity is not simply imposed by the prescribed 100-km distance constraint.
Overall, WVPZs exhibit stable temporal lead and spatial proximity relative to precipitation, suggesting they can serve as a 3D moisture precursor indicator for precipitation.
3.4. Structural Characteristics of WVPZs and Coupling Differences Among Precipitation Types
Despite general temporal lead and spatial proximity, WVPZ structural morphology, evolution, and coupling with rainfall differ among convective, frontal, and orographic precipitation. We compare structural indicators (mean water vapor density, volume, centroid height, and Bottom3 fraction) and predictability metrics (precursor time lag, centroid distance).
3.4.1. Structural Differences in WVPZs Across Precipitation Types
Across all three precipitation types, water vapor density is positively correlated with volume; increases in both typically accompany a decrease in centroid height and an increase in Bottom3 fraction (Figure 8a–d), indicating pronounced low-level water vapor aggregation. This is also evident in the 3D evolution of typical WVPZ structures (Figure 8(e1–e3)).
Figure 8.
Relationships and evolution of WVPZ structural indicators for different precipitation types. (a) Relationship between water vapor density and WVPZ volume, (b) relationship between water vapor density and centroid height, (c) relationship between water vapor density and bottom-three-layer fraction, and (d) relationship between WVPZ volume and centroid height for frontal, convective, and orographic precipitation events. Blue, red, and green points represent frontal, convective, and orographic cases, respectively. Panels (e1–e3) show the 3D evolution of a representative WVPZ (shown in blue) from the start stage to the peak and end stages, with the WVPZ projected over the study-area boundary.
Despite these common characteristics, notable differences exist among precipitation types:
Frontal rainfall: WVPZs under similar water vapor density conditions exhibit large variations in volume while maintaining relatively stable centroid heights (Figure 8a,b). In addition, the FWHM values of both volume and centroid height are relatively larger, whereas their P values, CV and RMSSD values remain relatively low (Figure 9). This indicates persistent water vapor aggregation with weak short-term fluctuations—stable broad-peak structures.
Figure 9.
Temporal fluctuation characteristics of WVPZ structural indicators for different precipitation types. Radar charts show the normalized temporal fluctuation metrics of four WVPZ structural indicators: (a) water vapor density, (b) volume, (c) centroid height, and (d) bottom-three-layer fraction. The five axes represent prominence, full width at half maximum (FWHM), peak-to-mean ratio, coefficient of variation (CV), and root mean square of successive differences (RMSSD), corresponding to burst intensity, duration, extremity, variability, and short-term jitter, respectively. Blue, red, and green lines denote frontal, convective, and orographic precipitation events, respectively.
Convective rainfall: WVPZs exhibit stronger abruptness and variability. P, PMR, CV, and RMSSD are all relatively high (Figure 9), indicating pronounced main peaks, strong deviations from the mean, and intense short-term fluctuations. Scatterplots reveal a "dual-branch" characteristic (Figure 8a,d): one branch shows rapid centroid descent with increasing water vapor density but small volume; the other shows simultaneous increases in both volume and density after the centroid descends.
Orographic rainfall: WVPZs are more spatially confined and structurally stable. Water vapor density and volume are generally smaller, centroid heights are concentrated, and the Bottom3 fraction is lower than in other types (Figure 8). P, PMR, and CV values are lower, indicating weaker variability and short-term fluctuations of water vapor aggregation processes. However, FWHM values of volume and centroid height are not small, suggesting prolonged persistence of some structural characteristics.
3.4.2. Differences in Precursor Time Lag and Spatial Coupling Among Precipitation Types
Precursor time lags differ by precipitation type (Table 4). For the Start stage, convective rainfall has the shortest mean precursor time lag (220.61 min), frontal rainfall intermediate (238.43 min), and orographic rainfall the longest (254.00 min). For orographic rainfall, the mean precursor time lags for Start, Peak and End stages are all the longest among the three types. Frontal rainfall shows intermediate precursor time lag at Start, but shorter precursor time lags at Peak and End, indicating that WVPZ evolution is more synchronized with precipitation for frontal systems.
Table 4.
Precursor time lag of WVPZs relative to key precipitation stages by different precipitation types.
The spatial correspondence analysis further indicates that the spatial proximity between WVPZs and rainfall regions differs among precipitation types (Table 5). Frontal rainfall has the smallest mean centroid distances at all stages (≈49–51 km) and the smallest median minimum distance (28.1 km), indicating the tightest spatial coupling. Convective rainfall exhibits larger mean distances at Peak and End (58.4 km and 58.1 km), reflecting greater spatial dispersion. Orographic rainfall has a relatively large centroid distance at the Start stage but the longest precursor time lag, suggesting that moisture accumulation forced by fixed terrain provides a longer precursor interval.
Table 5.
Centroid distances between WVPZs and rainfall regions by different precipitation types.
Despite convective, frontal, and orographic rainfall exhibiting differences in precursor time lags and centroid distances, the mean and median precursor time lags at the Start stage are primarily within the 3–5 h range for all types, and the mean centroid distances at the Start, Peak, and End stages generally fall within 49–60 km, whereas the median values of minimum centroid distances during the event evolution window are approximately 28–43 km. Thus, a temporal window of 3–5 h and a spatial scale of 30–60 km may serve as characteristic ranges in the present sample for WVPZ-based short-term precipitation identification.
The differences in water vapor aggregation characteristics offer a physical interpretation of the type-dependent precursor time lags and spatial coupling. Convective rainfall exhibits highly variable and rapidly evolving aggregation, as indicated by the relatively high P, PMR, CV, and RMSSD values (Figure 9). This abrupt evolution is consistent with localized moisture buildup and rapidly changing convective development, helping explain the shortest mean precursor time lag at the Start stage and the greater centroid distances at the Peak and End stages. Frontal rainfall shows relatively stable centroid heights across a wide range of WVPZ volumes (Figure 8), together with weaker short-term fluctuations (Figure 9). These features are consistent with persistent moisture supply and organized frontal lifting, which may maintain closer spatial correspondence between moisture aggregation and rainfall and explain the smaller centroid distances. For orographic rainfall, the smaller, more persistent WVPZ structures suggest stronger terrain control around the Helan and Liupan Mountains. Sustained moisture accumulation preceding terrain-enhanced rainfall provides a possible explanation for the longer precursor time lags, while moisture transport and the location of terrain-induced ascent may maintain an offset between the moisture and rainfall centroids. The orographic results are based on 20 matched WVPZ–precipitation pairs from only two events and warrant further validation in future studies.
3.5. Sensitivity of Predictive Relationships to Spatial Proximity
To examine the influence of spatial proximity on temporal predictability, we use distance-binning and threshold sensitivity analyses based on Start-stage precursor time lag () and minimum centroid distance () per matched sample.
Samples are grouped into six distance bins: 0–20, 20–40, 40–60, 60–80, 80–100, and >100 km. The binning variable is the minimum trajectory-centroid distance over the event evolution window, which can exceed 100 km because the matching constraint applies to the projected-mask centroid distance at the selected matching time. The distribution of in each bin (Figure S2) shows that median precursor time lags exceed 100 min in five of the six bins, indicating that WVPZs generally precede rainfall across distance bins. The values of tend to decrease with increasing , suggesting that, on average, closer spatial proximity tends to co-occur with longer precursor time lags, though large dispersion and overlap between adjacent bins indicate that spatial proximity alone is a weak predictor of precursor time lags at the individual event level.
Further analyses using thresholds of 30, 50, 80, and 100 km (Figure 10) show that the proportion of samples with ≥3 h gradually decreases as the threshold increases, while the proportion with of 3–5 h remains stable at ~28–29%. Thus, smaller centroid distances favor relatively longer precursor time lags, but the benefit is mainly reflected in the proportion of samples with of ≥3 h and does not substantially affect the stability of the 3–5 h window.
Figure 10.
Sensitivity of temporal precursor statistics to the WVPZ–precipitation centroid distance threshold. The 3–5 h window fraction and ≥3 h precursor time lag fraction are shown for centroid distance thresholds of 30, 50, 80, and 100 km. Blue and orange denote the 3–5 h window and ≥3 h lead criteria, respectively.
Overall, spatial proximity between WVPZs and rainfall regions can enhance predictive capability to some extent but cannot independently determine precursor time lag. In operational short-term forecasting, centroid distance is more appropriately used as an auxiliary criterion for identifying effective WVPZ precursor signals, combined with precipitation types, moisture transport, terrain forcing, and other environmental factors.
4. Discussion
4.1. Physical Linkages Between WVPZs and Precipitation Triggering Mechanisms
This study shows that 3D water vapor aggregation structures (WVPZs) form 2–6 h prior to precipitation and maintain a spatial proximity of 30–60 km to rainfall regions. These relationships are statistical hindcast associations rather than independently validated forecasting lead times, and the identified temporal and spatial scales may serve as potential monitoring indicators in complex terrain.
The WVPZ is defined as a spatially connected, temporally continuous moisture enrichment structure. From a precipitation-triggering perspective, moisture accumulation enhances low- and middle-level humidity, providing a necessary but not sufficient foundation for condensation and latent heat release. Observable precipitation develops only when moisture accumulation interacts with dynamical forcing (e.g., orographic lifting, frontal lifting, and low-level convergence). The relatively high FAR (~73%) is consistent with moisture accumulation alone being insufficient for rainfall. WVPZs therefore indicate moisture-preconditioned regions, with precipitation occurrence also depending on dynamical triggering.
The 3–5 h reference precursor time lag and 30–60 km spatial proximity scale can be interpreted through the lagged relationship among moisture accumulation, dynamical triggers, and surface precipitation response. Temporally, the 3–5 h lag does not correspond to a single microphysical process but reflects the integrated timescale from moisture anomaly organization, convergence intensification, fulfillment of triggering conditions, to the development of cloud and precipitation systems and eventual surface rainfall [88,89,90,91,92]. Spatially, the offset between WVPZ centroids and rainfall centers is expected. For convective rainfall, this may relate to boundary-layer convergence, updraft locations, and cell movement [93,94]. For orographic rainfall, moisture converges ahead of or at the foot of slopes, while precipitation occurs on windward slopes [90,95]. For frontal rainfall, moisture accumulates on the warm-moist side ahead of the front, while precipitation occurs near the frontal lifting zone [96,97].
Alongside these physical interpretations, the proximity scale should be considered in relation to the effective horizontal resolving scale of the tomography system. Although both are approximately 30–60 km, they describe different quantities. WVPZ centroids characterize the geometric positions of objects represented on the 5 × 6 × 1 km computational grid, whereas the PSF-based resolving scale describes spatial spreading in the reconstruction (Text S4), without imposing a fixed minimum separation between object centroids. The minimum centroid distances extend from below 20 km to beyond 100 km. Moreover, the observed mean centroid distances fall below the 5th percentile of randomized references under the same matching rules (Text S7; Figure S6b), supporting spatial correspondence beyond that expected from the matching constraints alone. Tomographic smoothing may influence object boundaries and centroid positions, so the reported proximity represents a characteristic association scale under the present configuration. Previous studies have implemented GNSS tomography using different horizontal grid spacings [54,98], and the WVPZ identification and tracking framework can similarly be adapted through adjustments to its structural criteria. Denser networks and higher-resolution tomography in other regions could further refine WVPZ structures and their spatial correspondence with rainfall.
Taken together, the spatiotemporal relationships between WVPZs and precipitation are consistent with the temporal lag and spatial offset among moisture preconditioning, the evolution of triggering conditions, and surface precipitation response. From a 3D structural perspective, WVPZs provide an effective representation of organized pre-precipitation moisture and provide potentially useful precursor information for short-term precipitation nowcasting in complex terrain.
4.2. Paradigm Shift from Moisture Fields to Moisture Objects and Implications for Nowcasting
The establishment of temporal-precedence and spatial proximity relationships between WVPZs and precipitation relies fundamentally on identifying water vapor aggregation structures within 3D water vapor fields as discrete objects with well-defined boundaries, centroids, volumes and life cycles. Traditional GNSS-based moisture–precipitation studies mostly rely on the zenith total delay (ZTD), PWV, and their time series—column-integrated quantities that do not directly resolve the three-dimensional geometry and evolution of localized moisture structures or their correspondence with specific precipitation objects [19,99,100]. Although GNSS tomography provides continuous 3D water vapor fields [57,98], field-average analyses cannot directly quantify the movement, duration, or precipitation-matching of localized moisture structures.
Object-based methodologies have been widely applied in thunderstorm identification [101], convective storm tracking [102,103], and atmospheric river detection [104,105]. Following this framework, we define WVPZs and establish an integrated framework for object identification, tracking, and precipitation-event matching, converting continuous water vapor field into identifiable, trackable, and matchable objects. In contrast to traditional PWV-based studies that only indicate “whether” moisture is increasing, the WVPZ framework answers “where”, “when”, and “how long” moisture aggregation persists, thereby providing a richer set of object-based characteristics for quantifying the statistical association between moisture organization and precipitation.
This paradigm shift redirects moisture diagnostics from bulk content variations toward the spatial organization and temporal evolution of moisture structures. WVPZ boundaries, centroids, volumes, vertical structures, and life cycles make localized moisture aggregation explicitly identifiable and trackable. Matching these trajectories with rainfall regions allows precursor time lags and centroid distances to be calculated for individual pairs, providing a common framework for evaluating temporal precedence and spatial correspondence. These object-based characteristics complement column-integrated moisture indicators and provide a quantitative basis for event-based diagnostics, with potential applications in precipitation monitoring and nowcasting.
4.3. Limitations and Future Work
Several limitations remain in model accuracy, identification and matching strategy, and regional representativeness.
First, GNSS water vapor tomography depends strongly on station distribution and satellite ray geometry, causing uncertainties in the lower troposphere and in sparsely covered areas. The reconstruction uses a 5 km × 6 km × 1 km computational grid and a 5-min retrieval interval, with an effective horizontal resolving scale of approximately 30–60 km (Text S4). Smaller-scale or shorter-duration moisture perturbations may be smoothed [106,107]. Ray-coverage stratification showed no monotonic increase in low-level WVPZ occurrence, although higher coverage was associated with greater identified voxel fractions and object counts (Text S5 and Table S9), indicating that observational support should be considered when interpreting low-level structure extent and abundance. Denser networks, improved tomographic constraints, and multi-source water vapor fusion are needed for higher-resolution retrievals and more accurate WVPZ identification.
Second, WVPZ identification and matching involve empirical choices. The layer-dependent dual-percentile threshold and the temporal-window/centroid-distance matching framework yield well-defined statistical samples, but fixed thresholds, one-to-one matching rules, and gauge-based precipitation interpolation uncertainty may affect individual cases. Future work should adopt adaptive identification based on background moisture anomalies and more flexible matching strategies (e.g., one-to-many, many-to-one, and splitting-merging processes), drawing on radar-echo verification, satellite precipitation object comparison, and storm tracking [108,109,110].
Third, the results are regionally specific to Ningxia, where the Helan Mountains, Liupan Mountains, and Loess Plateau margins strongly modulate moisture aggregation and precipitation. The 3–5 h precursor-lag and 30–60 km proximity scales should be further evaluated in other climatic and geographic regions. Comparative validations across diverse settings are needed to establish regionally adaptive WVPZ parameters.
Finally, the analysis uses moisture fields only and excludes dynamic triggers such as low-level convergence, convective available potential energy (CAPE), and vertical wind shear; WVPZs should therefore be interpreted as moisture-preconditioning indicators rather than direct triggers. The analyzed event windows include non-precipitation periods before precipitation onset and after cessation, during which WVPZs are also identified and tracked. Nevertheless, the sample remains conditioned on selected precipitation events, and a systematic evaluation of the ability of WVPZs to discriminate between precipitation and non-precipitation conditions over long continuous records is still needed. Unmatched WVPZ trajectories were treated as false alarms in the retrospective matching framework, so the resulting FAR and CSI are framework-specific and not operational forecast scores. Operational evaluation of FAR, POD, and CSI requires forward validation using continuous datasets containing both precipitation and non-precipitation periods, with each WVPZ occurrence treated as a forecast starting point.
5. Conclusions
Based on the GNSS network over Ningxia, we develop a 3D GNSS water vapor tomography model and propose a framework for the identification and tracking of WVPZs and their matching with rainfall regions. Using this framework, we quantitatively investigate the precursor relationships of WVPZs with precipitation occurrence and evolution. The main conclusions are as follows.
(1) A GNSS-based 3D water vapor tomography model suitable for the Ningxia region was successfully developed and validated. The model provides 5-min retrievals of 3D water vapor density fields. Validation against radiosonde observations along the corresponding vertical profiles yielded an RMSE of 1.998 g m−3, an MAE of 1.529 g m−3, a Bias of −1.067 g m−3, and a Pearson correlation coefficient (r) of 0.953. Validation against ERA5 data over the entire tomographic domain produced an RMSE of 1.949 g m−3, an MAE of 1.447 g m−3, a Bias of −1.118 g m−3, and a Pearson correlation coefficient (r) of 0.881. Overall, the tomography results show good agreement with the independent reference datasets. Despite systematic underestimation, the accuracy is sufficient for analyzing 3D moisture structures and identifying WVPZs.
(2) WVPZs can serve as a potential moisture precursor indicator for precipitation at spatiotemporal scales of approximately 30–60 km and 3–5 h. From 16 precipitation events, 1553 valid WVPZ trajectories are identified, with at least one WVPZ present in 94.97% of the analyzed 5-min time steps. For the Start stage, the mean precursor time lag is 231.5 min (median 220.0 min; interquartile range ~108.75–345 min, approximately 2–6 h). By precipitation type, mean and median precursor time lags at the Start stage are concentrated within the 3–5 h range, suggesting this as a reference window for forecasting. Spatially, mean centroid distances between WVPZs and rainfall regions are ~52–55 km, and the mean minimum centroid distance within events is 39.4 km. For different precipitation types, centroid distances are generally within 30–60 km, indicating this as a representative spatial proximity scale. However, substantial interquartile ranges (e.g., 108–345 min for precursor time lag) indicate that event-specific variability is large, and operational thresholds should be considered as reference guidelines rather than fixed deterministic rules.
(3) WVPZs provide a new 3D quantitative indicator for short-term warning of extreme precipitation in complex terrain. High-frequency WVPZ occurrences are concentrated in regions with pronounced terrain gradients (Helan Mountains, Liupan Mountains, Loess Plateau margins), highlighting the role of complex topography in modulating local moisture aggregation. Coupling characteristics vary by precipitation type: convective rainfall has shorter precursor time lags and greater spatial dispersion; frontal rainfall exhibits the tightest spatial coupling; orographic rainfall has the longest precursor time lag. Sensitivity analysis shows that higher spatial proximity increases the proportion of long precursor-lag samples. Overall, the proposed WVPZ framework transforms localized moisture enrichment structures into identifiable, trackable, and matchable object-based indicators, providing a new quantitative basis for further monitoring and evaluation of extreme precipitation in complex terrain.
Supplementary Materials
The following supporting information can be downloaded at: https://www.mdpi.com/article/10.3390/rs18213851/s1, Text S1: Definitions of validation metrics; Text S2: Definitions of precipitation classification indicators and threshold determination; Text S3: GNSS tomography model formulation and constraint construction; Text S4: Observation-matrix diagnostics and effective horizontal resolving scale; Text S5: DDA ray penetration and observational support assessment for WVPZ identification; Text S6: Sensitivity analysis of temporal matching window; Text S7: Complementary randomization tests for the WVPZ–precipitation matching framework; Text S8: Sensitivity analysis of the spatial matching threshold; Text S9: Pseudocode for WVPZ identification, tracking, precipitation matching, and statistical analysis (Algorithms S1–S7); Figure S1: Evaluation of WVPZ identification results under different dual-percentile threshold combinations; Figure S2: Distance-binning statistics of the start-stage precursor time lag within different minimum centroid-distance bins; Figure S3: GNSS ray penetration and observational support for WVPZ identification; Figure S4: Mean number of GNSS ray crossings per voxel during each 5-min tomography epoch at different altitude levels; Figure S5: Sensitivity analysis of the temporal matching window for WVPZ–precipitation associations; Figure S6: Complementary randomization tests for the WVPZ–precipitation matching framework; Figure S7: Sensitivity of WVPZ–precipitation candidate associations to the spatial matching threshold; Table S1: Information on the GNSS stations used for tomography; Table S2: Daily rainfall thresholds and station-proportion criteria used for rainfall categorization with reference to QX/T 489–2019; Table S3: Full-sample medians and leave-one-event-out ranges of WVPZ identification diagnostics for five dual-percentile threshold pairs; Table S4: Event-specific ERA5–tomography validation metrics summarized across hourly epochs; Table S5: Height-dependent ERA5–tomography errors summarized across hourly epochs; Table S6: Leave-one-event-out stability of the overall WVPZ–precipitation association statistics; Table S7: DDA ray-penetration statistics for the 16 precipitation events; Table S8: Overall GNSS ray-support characteristics of WVPZ voxels across the 16 precipitation events; Table S9: Low-level WVPZ characteristics across event-specific ray-coverage groups; Table S10: GAMIT processing strategies and parameter settings used for GNSS data processing.
Author Contributions
Conceptualization, J.W., Z.Q. and H.L. (Haoyue Lei); methodology, Z.Q., H.L. (Haoyue Lei) and J.W.; software, Z.Q. and H.L. (Haoyue Lei); validation, Y.C., W.J. and J.J.; formal analysis, H.L. (Haoyue Lei), Y.C. and Z.Q.; investigation, Z.Q., H.L. (Haijun Li) and Z.C.; resources, J.W., Y.C. and W.J.; data curation, Z.C., J.Q. and Z.Q.; writing—original draft preparation, H.L. (Haoyue Lei) and Z.Q.; writing—review and editing, J.W., Z.Q., Y.C., Z.C., H.L. (Haijun Li) and J.J.; visualization, H.L. (Haoyue Lei) and Z.Q.; supervision, J.W.; project administration, J.W., Y.C., W.J. and Z.Q.; funding acquisition, J.W., Y.C. and W.J. All authors have read and agreed to the published version of the manuscript.
Funding
This work was funded by the Ningxia Key Research and Development Program (2024BEG02034, 2025BEG01010), the Science and Technology Innovation Team of Ningxia for Research and Application of Intelligent Digital Forecasting Technology (2024CXTD006), and the Ningxia Leading Talents of Science and Technology Innovation (2021GKLRLX05).
Data Availability Statement
The NXCORS GNSS observations and 5-min rain-gauge records used in this study were provided by the Ningxia Meteorological Observatory. Inquiries regarding access to these observations should be directed to the data provider. ERA5 meteorological reanalysis data are available from the Copernicus Climate Change Service at https://cds.climate.copernicus.eu/datasets/reanalysis-era5-pressure-levels (accessed on 29 July 2025) [68]. Sounding data are available from University of Wyoming at https://weather.uwyo.edu/upperair (accessed on 29 March 2025) and Integrated Global Radiosonde Archive (IGRA) at https://www.ncei.noaa.gov/pub/data/igra/data (accessed on 1 August 2025). The derived WVPZ trajectory and matching products are subject to the same data-sharing restrictions and are not available for public distribution.
Acknowledgments
The authors acknowledge the Qinghai University and Ningxia Meteorological Observatory for institutional support. The authors thank ECMWF/Copernicus and IGRA for providing the datasets used in this study. The authors also thank the Academic Editor and the reviewers for their constructive comments, which improved the clarity, methodological transparency, and reproducibility of the manuscript.
Conflicts of Interest
The authors declare no conflicts of interest.
Abbreviations
The following abbreviations are used in this manuscript:
| GNSS | Global Navigation Satellite System |
| 3D | Three-dimensional |
| NXCORS | Ningxia Continuously Operating Reference Station network |
| ERA5 | Fifth-generation ECMWF reanalysis |
| RMSE | Root mean square error |
| WVPZ | Water vapor preferential zone |
| PWV | Precipitable water vapor |
| IGS | International GNSS Service |
| GPS | Global Positioning System |
| TEQC | Translation, Editing and Quality Checking |
| GAMIT | GPS Analysis at MIT |
| ECMWF | European Centre for Medium-Range Weather Forecasts |
| IDW | Inverse distance weighting |
| RMS | Root mean square |
| MAE | Mean absolute error |
| DEM | Digital elevation model |
| SWV | Slant water vapor |
| SART | Simultaneous Algebraic Reconstruction Technique |
| IoU | Intersection over union |
| CV | Coefficient of variation |
| PMR | Peak-to-mean ratio |
| FWHM | Full width at half maximum |
| RMSSD | Root mean square of successive differences |
| SWD | Slant-path wet delay |
| DDA | Digital Differential Analyzer |
| UTM | Universal Transverse Mercator |
| UTC | Coordinated Universal Time |
| BT | Beijing Time |
| FAR | False alarm ratio |
| CSI | Critical success index |
| ZTD | Zenith total delay |
| CAPE | Convective available potential energy |
| POD | Probability of detection |
| IGRA | Integrated Global Radiosonde Archive |
References
- Myhre, G.; Alterskjær, K.; Stjern, C.W.; Hodnebrog, Ø.; Marelle, L.; Samset, B.H.; Sillmann, J.; Schaller, N.; Fischer, E.; Schulz, M.; et al. Frequency of Extreme Precipitation Increases Extensively with Event Rareness under Global Warming. Sci. Rep. 2019, 9, 16063. [Google Scholar] [CrossRef] [Scilit] [PubMed]
- IPCC. Climate Change 2023: Synthesis Report. Contribution of Working Groups I, II and III to the Sixth Assessment Report of the Intergovernmental Panel on Climate Change, 1st ed.; Lee, H., Romero, J., Eds.; Intergovernmental Panel on Climate Change (IPCC): Geneva, Switzerland, 2023. [Google Scholar]
- Westra, S.; Fowler, H.J.; Evans, J.P.; Alexander, L.V.; Berg, P.; Johnson, F.; Kendon, E.J.; Lenderink, G.; Roberts, N.M. Future Changes to the Intensity and Frequency of Short-Duration Extreme Rainfall. Rev. Geophys. 2014, 52, 522–555. [Google Scholar] [CrossRef] [Scilit]
- Kendon, E.J.; Blenkinsop, S.; Fowler, H.J. When Will We Detect Changes in Short-Duration Precipitation Extremes? J. Clim. 2018, 31, 2945–2964. [Google Scholar] [CrossRef] [Scilit]
- Sun, X.; Luo, Y.; Gao, X.; Wu, M.; Li, M.; Huang, L.; Zhang, D.-L.; Xu, H. On the Localized Extreme Rainfall over the Great Bay Area in South China with Complex Topography and Strong UHI Effects. Mon. Weather Rev. 2021, 149, 2777–2801. [Google Scholar] [CrossRef] [Scilit]
- Chen, Y.; Liao, Z.; Shi, Y.; Li, P.; Zhai, P. Greater Flash Flood Risks from Hourly Precipitation Extremes Preconditioned by Heatwaves in the Yangtze River Valley. Geophys. Res. Lett. 2022, 49, e2022GL099485. [Google Scholar] [CrossRef] [Scilit]
- Chuphal, D.S.; Malik, I.; Singh, R.; Vangala, G.; Niranjannaik, M.; Vegad, U.; Dilip K, N.; Mukhopadhyay, P.; Selvan, J.P.; Kapadia, V.; et al. Multi-Day Extreme Precipitation Caused Major Floods in India during Summer Monsoon of 2024. Earth’s Future 2025, 13, e2024EF005497. [Google Scholar] [CrossRef] [Scilit]
- Hu, Q.; Zhao, Y.; Huang, A.; Ma, P.; Ming, J. Moisture Transport and Sources of the Extreme Precipitation over Northern and Southern Xinjiang in the Summer Half-Year during 1979–2018. Front. Earth Sci. 2021, 9, 770877. [Google Scholar] [CrossRef] [Scilit]
- Liu, B.; Tan, X.; Gan, T.Y.; Chen, X.; Lin, K.; Lu, M.; Liu, Z. Global Atmospheric Moisture Transport Associated with Precipitation Extremes: Mechanisms and Climate Change Impacts. WIREs Water 2020, 7, e1412. [Google Scholar] [CrossRef] [Scilit]
- Raghuvanshi, A.S.; Agarwal, A. Unraveling Atmospheric Moisture Transport Linkages to Extreme Precipitation Events and Associated Synoptic Features over India. J. Hydrol. 2023, 626, 130290. [Google Scholar] [CrossRef] [Scilit]
- Kunkel, K.E.; Stevens, S.E.; Stevens, L.E.; Karl, T.R. Observed Climatological Relationships of Extreme Daily Precipitation Events with Precipitable Water and Vertical Velocity in the Contiguous United States. Geophys. Res. Lett. 2020, 47, e2019GL086721. [Google Scholar] [CrossRef] [Scilit]
- Neelin, J.D.; Martinez-Villalobos, C.; Stechmann, S.N.; Ahmed, F.; Chen, G.; Norris, J.M.; Kuo, Y.-H.; Lenderink, G. Precipitation Extremes and Water Vapor. Curr. Clim. Change Rep. 2022, 8, 17–33. [Google Scholar] [CrossRef] [Scilit]
- Lin, Y.-L.; Chiao, S.; Wang, T.-A.; Kaplan, M.L.; Weglarz, R.P. Some Common Ingredients for Heavy Orographic Rainfall. Weather Forecast. 2001, 16, 633–660. [Google Scholar] [CrossRef] [Scilit]
- Kuligowski, R.J.; Barros, A.P. Experiments in Short-Term Precipitation Forecasting Using Artificial Neural Networks. Mon. Weather Rev. 1998, 126, 470–482. [Google Scholar] [CrossRef] [Scilit]
- Xian, T.; Su, K.; Zhang, J.; Hu, H.; Wang, H. Precipitable Water Vapor Retrieval Based on GNSS Data and Its Application in Extreme Rainfall. Remote Sens. 2025, 17, 2301. [Google Scholar] [CrossRef] [Scilit]
- Kim, Y.-J.; Jee, J.-B.; Lim, B. Investigating the Influence of Water Vapor on Heavy Rainfall Events in the Southern Korean Peninsula. Remote Sens. 2023, 15, 340. [Google Scholar] [CrossRef] [Scilit]
- Estébanez-Camarena, M.; Curzi, F.; Taormina, R.; van de Giesen, N.; ten Veldhuis, M.-C. The Role of Water Vapor Observations in Satellite Rainfall Detection Highlighted by a Deep Learning Approach. Atmosphere 2023, 14, 974. [Google Scholar] [CrossRef] [Scilit]
- Benevides, P.; Catalao, J.; Miranda, P.M.A. On the Inclusion of GPS Precipitable Water Vapour in the Nowcasting of Rainfall. Nat. Hazards Earth Syst. Sci. 2015, 15, 2605–2616. [Google Scholar] [CrossRef] [Scilit]
- Yao, Y.; Shan, L.; Zhao, Q. Establishing a Method of Short-Term Rainfall Forecasting Based on GNSS-Derived PWV and Its Application. Sci. Rep. 2017, 7, 12465. [Google Scholar] [CrossRef] [Scilit] [PubMed]
- Manandhar, S.; Lee, Y.H.; Meng, Y.S.; Yuan, F.; Ong, J.T. GPS-Derived PWV for Rainfall Nowcasting in Tropical Region. IEEE Trans. Geosci. Remote Sens. 2018, 56, 4835–4844. [Google Scholar] [CrossRef] [Scilit]
- Rohm, W.; Guzikowski, J.; Wilgan, K.; Kryza, M. 4DVAR Assimilation of GNSS Zenith Path Delays and Precipitable Water into a Numerical Weather Prediction Model WRF. Atmos. Meas. Tech. 2019, 12, 345–361. [Google Scholar] [CrossRef] [Scilit]
- Torcasio, R.C.; Mascitelli, A.; Realini, E.; Barindelli, S.; Tagliaferro, G.; Puca, S.; Dietrich, S.; Federico, S. The Impact of Global Navigation Satellite System (GNSS) Zenith Total Delay Data Assimilation on the Short-Term Precipitable Water Vapor and Precipitation Forecast over Italy Using the Weather Research and Forecasting (WRF) Model. Nat. Hazards Earth Syst. Sci. 2023, 23, 3319–3336. [Google Scholar] [CrossRef] [Scilit]
- Christophersen, H.; Ruston, B.; Baker, N.L. Assimilation of GNSS Zenith Total Delay in NAVGEM. J. Geophys. Res. Atmos. 2023, 128, e2022JD037502. [Google Scholar] [CrossRef] [Scilit]
- Li, X.; Chang, Y.; Yu, C.; Gong, Z.; Li, Y.; Zhang, Z.; Che, S. Quantitative Study on the Water Vapor Transport Characteristics of an Extreme Precipitation Event in North China. Atmos. Sci. Lett. 2024, 25, e1269. [Google Scholar] [CrossRef] [Scilit]
- Shi, K.; Lang, Q.; Huang, Y.; Zhao, J.; Wang, H.; Chen, G.; Zhang, Q.; Yin, H.; Su, Y.; Wang, P. Analysis of the Water-Vapor Sources in Rainstorm Processes in Tianjin City Based on the Trajectory Method. Atmos. Sci. Lett. 2024, 25, e1196. [Google Scholar] [CrossRef] [Scilit]
- Guo, H.; Hu, W.; Yang, C.; Wan, F. Moisture Sources and Atmospheric Circulation Patterns for Extreme Rainfall Event over North China Plain from 29 July to 2 August 2023. Earth Space Sci. 2024, 11, e2024EA003956. [Google Scholar] [CrossRef] [Scilit]
- Zhang, S.; Zhang, G.; Gong, G.; Gan, T.Y.; Chen, D.; Liu, J. Moisture Sources and Pathways of Annual Maximum Precipitation in the Lancang-Mekong River Basin. Geophys. Res. Lett. 2024, 51, e2023GL107622. [Google Scholar] [CrossRef] [Scilit]
- Zheng, Y.; Lu, C.; Wu, Z.; Guan, Z.; Li, J.; Wang, Z.; Liu, C. Assimilation of High-Resolution GNSS Tropospheric Delays and Its Effects on a Severe Convective Event Nowcasting. Atmos. Res. 2025, 314, 107785. [Google Scholar] [CrossRef] [Scilit]
- Vaquero-Martínez, J.; Antón, M. Review on the Role of GNSS Meteorology in Monitoring Water Vapor for Atmospheric Physics. Remote Sens. 2021, 13, 2287. [Google Scholar] [CrossRef] [Scilit]
- Xu, G. A Review of Remote Sensing of Atmospheric Profiles and Cloud Properties by Ground-Based Microwave Radiometers in Central China. Remote Sens. 2024, 16, 966. [Google Scholar] [CrossRef] [Scilit]
- Cai, X.; Bao, Y.; Petropoulos, G.P.; Lu, F.; Lu, Q.; Zhu, L.; Wu, Y. Temperature and Humidity Profile Retrieval from FY4-GIIRS Hyperspectral Data Using Artificial Neural Networks. Remote Sens. 2020, 12, 1872. [Google Scholar] [CrossRef] [Scilit]
- Song, Z.; Bai, W.; Zhang, Y.; Wang, Y.; Xu, X.; Xin, J. Evaluation of Satellite-Derived Atmospheric Temperature and Humidity Profiles and Their Application as Precursors to Severe Convective Precipitation. Remote Sens. 2024, 16, 4638. [Google Scholar] [CrossRef] [Scilit]
- Feng, Y.-C.; Hsu, H.-W.; Weckwerth, T.M.; Lin, P.-L.; Liou, Y.-C.; Wang, T.-C.C. The Spatiotemporal Characteristics of Near-Surface Water Vapor in a Coastal Region Revealed from Radar-Derived Refractivity. Mon. Weather Rev. 2021, 149, 2853–2873. [Google Scholar] [CrossRef] [Scilit]
- Weckwerth, T.M.; Pettet, C.R.; Fabry, F.; Park, S.J.; LeMone, M.A.; Wilson, J.W. Radar Refractivity Retrieval: Validation and Application to Short-Term Forecasting. J. Appl. Meteorol. 2005, 44, 285–300. [Google Scholar] [CrossRef] [Scilit]
- Li, H.; Wang, X.; Wu, S.; Zhang, K.; Chen, X.; Qiu, C.; Zhang, S.; Zhang, J.; Xie, M.; Li, L. Development of an Improved Model for Prediction of Short-Term Heavy Precipitation Based on GNSS-Derived PWV. Remote Sens. 2020, 12, 4101. [Google Scholar] [CrossRef] [Scilit]
- Giannadaki, D.; Oikonomou, C.; Haralambous, H. Correlation of Precipitable Water Vapor and Heavy Rainfall over Cyprus Using GNSS Sensors Network. Front. Signal Process. 2025, 5, 1622256. [Google Scholar] [CrossRef] [Scilit]
- Trent, T.; Boesch, H.; Somkuti, P.; Scott, N.A. Observing Water Vapour in the Planetary Boundary Layer from the Short-Wave Infrared. Remote Sens. 2018, 10, 1469. [Google Scholar] [CrossRef] [Scilit]
- Lai, A.; Gao, J.; Koch, S.E.; Wang, Y.; Pan, S.; Fierro, A.O.; Cui, C.; Min, J. Assimilation of Radar Radial Velocity, Reflectivity, and Pseudo–Water Vapor for Convective-Scale NWP in a Variational Framework. Mon. Weather Rev. 2019, 147, 2877–2900. [Google Scholar] [CrossRef] [Scilit]
- Schröder, M.; Lockhoff, M.; Fell, F.; Forsythe, J.; Trent, T.; Bennartz, R.; Borbas, E.; Bosilovich, M.G.; Castelli, E.; Hersbach, H.; et al. The GEWEX Water Vapor Assessment Archive of Water Vapour Products from Satellite Observations and Reanalyses. Earth Syst. Sci. Data 2018, 10, 1093–1117. [Google Scholar] [CrossRef] [Scilit] [PubMed]
- Weaver, D.; Strong, K.; Walker, K.A.; Sioris, C.; Schneider, M.; McElroy, C.T.; Vömel, H.; Sommer, M.; Weigel, K.; Rozanov, A.; et al. Comparison of Ground-Based and Satellite Measurements of Water Vapour Vertical Profiles over Ellesmere Island, Nunavut. Atmos. Meas. Tech. 2019, 12, 4039–4063. [Google Scholar] [CrossRef] [Scilit]
- Ferreira, A.P.; Nieto, R.; Gimeno, L. Completeness of Radiosonde Humidity Observations Based on the Integrated Global Radiosonde Archive. Earth Syst. Sci. Data 2019, 11, 603–627. [Google Scholar] [CrossRef] [Scilit]
- Kim, S.; Sharma, A.; Wasko, C.; Nathan, R. Linking Total Precipitable Water to Precipitation Extremes Globally. Earth’s Future 2022, 10, e2021EF002473. [Google Scholar] [CrossRef] [Scilit]
- Zhang, Z.; Lou, Y.; Zhang, W.; Liang, H.; Bai, J.; Song, W. Correlation Analysis between Precipitation and Precipitable Water Vapor over China Based on 1999–2015 Ground-Based GPS Observations. J. Appl. Meteorol. Climatol. 2022, 61, 1669–1683. [Google Scholar] [CrossRef] [Scilit]
- Li, H.; Wang, X.; Wu, S.; Zhang, K.; Fu, E.; Xu, Y.; Qiu, C.; Zhang, J.; Li, L. A New Method for Determining an Optimal Diurnal Threshold of GNSS Precipitable Water Vapor for Precipitation Forecasting. Remote Sens. 2021, 13, 1390. [Google Scholar] [CrossRef] [Scilit]
- Marquis, J.N.; Varble, A.C.; Robinson, P.; Nelson, T.C.; Friedrich, K. Low-Level Mesoscale and Cloud-Scale Interactions Promoting Deep Convection Initiation. Mon. Weather Rev. 2021, 149, 2473–2495. [Google Scholar] [CrossRef] [Scilit]
- Schiro, K.A.; Neelin, J.D. Deep Convective Organization, Moisture Vertical Structure, and Convective Transition Using Deep-Inflow Mixing. J. Atmos. Sci. 2019, 76, 965–987. [Google Scholar] [CrossRef] [Scilit]
- Giangrande, S.E.; Biscaro, T.S.; Peters, J.M. Seasonal Controls on Isolated Convective Storm Drafts, Precipitation Intensity, and Life Cycle as Observed during GoAmazon2014/5. Atmos. Chem. Phys. 2023, 23, 5297–5316. [Google Scholar] [CrossRef] [Scilit]
- Yoshida, S.; Sakai, T.; Nagai, T.; Seko, H.; Kato, T.; Shiraishi, K.; Shimizu, S. Observation of a Slanted Moisture Structure with Weak Updraft Leading to Localized Heavy Rainfalls. Sci. Rep. 2025, 15, 22979. [Google Scholar] [CrossRef] [Scilit] [PubMed]
- Tsuji, H.; Takayabu, Y.N.; Shibuya, R.; Kamahori, H.; Yokoyama, C. The Role of Free-Tropospheric Moisture Convergence for Summertime Heavy Rainfall in Western Japan. Geophys. Res. Lett. 2021, 48, e2021GL095030. [Google Scholar] [CrossRef] [Scilit]
- Liu, T.; Chen, Y.; Chen, S.; Li, W.; Zhang, A. Mechanisms of the Transport Height of Water Vapor by Tropical Cyclones on Heavy Rainfall. Weather Clim. Extrem. 2023, 41, 100587. [Google Scholar] [CrossRef] [Scilit]
- Bevis, M.; Businger, S.; Herring, T.A.; Rocken, C.; Anthes, R.A.; Ware, R.H. GPS Meteorology: Remote Sensing of Atmospheric Water Vapor Using the Global Positioning System. J. Geophys. Res. Atmos. 1992, 97, 15787–15801. [Google Scholar] [CrossRef] [Scilit]
- Flores, A.; Ruffini, G.; Rius, A. 4D Tropospheric Tomography Using GPS Slant Wet Delays. Ann. Geophys. 2000, 18, 223–234. [Google Scholar] [CrossRef]
- Flores, A.; Vilà-Guerau de Arellano, J.; Gradinarsky, L.P.; Rius, A. Tomography of the Lower Troposphere Using a Small Dense Network of GPS Receivers. IEEE Trans. Geosci. Remote Sens. 2001, 39, 439–447. [Google Scholar] [CrossRef]
- Bender, M.; Dick, G.; Ge, M.; Deng, Z.; Wickert, J.; Kahle, H.-G.; Raabe, A.; Tetzlaff, G. Development of a GNSS Water Vapour Tomography System Using Algebraic Reconstruction Techniques. Adv. Space Res. 2011, 47, 1704–1720. [Google Scholar] [CrossRef] [Scilit]
- Rohm, W. The Ground GNSS Tomography—Unconstrained Approach. Adv. Space Res. 2013, 51, 501–513. [Google Scholar] [CrossRef] [Scilit]
- Zhang, B.; Fan, Q.; Yao, Y.; Xu, C.; Li, X. An Improved Tomography Approach Based on Adaptive Smoothing and Ground Meteorological Observations. Remote Sens. 2017, 9, 886. [Google Scholar] [CrossRef] [Scilit]
- Hu, H.; Liu, M.; Zhong, J.; Deng, X.; Cao, Y.; Fang, P. A Case Study of the 3D Water Vapor Tomography Model Based on a Fast Voxel Traversal Algorithm for Ray Tracing. Remote Sens. 2021, 13, 2422. [Google Scholar] [CrossRef] [Scilit]
- Tayfehrostami, A.; Amerian, Y.; Izanlou, S.; Azadi, M. TOMO4D Operator for Assimilation of GNSS Tomography-Derived Water Vapor Fields into the WRFDA 4DVAR System to Improve Regional Rainfall Forecasting. J. Adv. Model. Earth Syst. 2026, 18, e2025MS005610. [Google Scholar] [CrossRef] [Scilit]
- Xiao, S.; Peng, X.; Tian, Q.; Ding, A.; Xie, J.; Su, J. Interaction between the East Asian Summer Monsoon and Westerlies as Shown by Tree-Ring Records. Clim. Past 2024, 20, 1687–1701. [Google Scholar] [CrossRef] [Scilit]
- Li, X.-J.; Zhu, B.-Q. Interaction between the Westerlies and Asian Monsoons in the Middle Latitudes of China: Review and Prospect. Atmosphere 2024, 15, 274. [Google Scholar] [CrossRef] [Scilit]
- Yang, H.; Xiao, H.; Guo, C.; Sun, Y.; Gao, R. Innovative Trend Analysis of Annual and Seasonal Precipitation in Ningxia, China. Atmos. Ocean. Sci. Lett. 2020, 13, 308–315. [Google Scholar] [CrossRef] [Scilit]
- Chen, Y.; Li, J.; Li, X.; Zhang, S.; Yang, Y.; Su, Y.; Yao, S.; Liu, J. Spatio-Temporal Distribution of the Rainstorm in the East Side of the Helan Mountain and the Possible Causes of Its Variability. Atmos. Res. 2021, 252, 105469. [Google Scholar] [CrossRef] [Scilit]
- Ding, X.; Zhang, H.; Wang, Z.; Shang, G.; Huang, Y.; Li, H. Analysis of the Evolution Pattern and Driving Mechanism of Lakes in the Northern Ningxia Yellow Diversion Irrigation Area. Water 2022, 14, 3658. [Google Scholar] [CrossRef] [Scilit]
- Chen, J.; Huang, W.; Jin, L.; Chen, J.; Chen, S.; Chen, F. A Climatological Northern Boundary Index for the East Asian Summer Monsoon and Its Interannual Variability. Sci. China Earth Sci. 2018, 61, 13–22. [Google Scholar] [CrossRef] [Scilit]
- Estey, L.H.; Meertens, C.M. TEQC: The Multi-Purpose Toolkit for GPS/GLONASS Data. GPS Solut. 1999, 3, 42–49. [Google Scholar] [CrossRef] [Scilit]
- Herring, T.A.; King, R.W.; Floyd, M.A.; McClusky, S.C. GAMIT Reference Manual, Release 10.7; Department of Earth, Atmospheric and Planetary Sciences, Massachusetts Institute of Technology: Cambridge, MA, USA, 2018; p. 168. [Google Scholar]
- Durre, I.; Yin, X.; Vose, R.S.; Applequist, S.; Arnfield, J. Enhancing the Data Coverage in the Integrated Global Radiosonde Archive. J. Atmos. Ocean. Technol. 2018, 35, 1753–1770. [Google Scholar] [CrossRef] [Scilit]
- Copernicus Climate Change Service. ERA5 Hourly Data on Pressure Levels from 1940 to Present. 2018. Available online: https://cds.climate.copernicus.eu/datasets/reanalysis-era5-pressure-levels?tab=overview (accessed on 29 July 2025).
- Alduchov, O.A.; Eskridge, R.E. Improved Magnus Form Approximation of Saturation Vapor Pressure. J. Appl. Meteorol. 1996, 35, 601–609. [Google Scholar] [CrossRef] [Scilit]
- Zhou, X.; Gao, T.; Takle, E.S.; Zhen, X.; Suyker, A.E.; Awada, T.; Okalebo, J.; Zhu, J. Air Temperature Equation Derived from Sonic Temperature and Water Vapor Mixing Ratio for Turbulent Airflow Sampled through Closed-Path Eddy-Covariance Flux Systems. Atmos. Meas. Tech. 2022, 15, 95–115. [Google Scholar] [CrossRef] [Scilit]
- Cao, N.; Yao, Z.; Shu, Z.; Chang, Z.; Mu, J.; Zhu, H.; Lin, T. Topographic Effects on Stratiform Precipitation Observed by Vertically Pointing Micro Rain Radars at Ridge and Valley Sites in the Liupan Mountains Area, Northwest China. Water 2023, 15, 134. [Google Scholar] [CrossRef] [Scilit]
- QX/T 489–2019; Grade of Rainfall Process. China Meteorological Administration: Beijing, China, 2019.
- Yao, Y.; Sun, Z.; Xu, C. Applicability of Bevis Formula at Different Height Levels and Global Weighted Mean Temperature Model Based on Near-Earth Atmospheric Temperature. J. Geod. Geoinf. Sci. 2020, 3, 1–11. [Google Scholar] [CrossRef]
- Mekik, C.; Deniz, I. Modelling and Validation of the Weighted Mean Temperature for Turkey. Meteorol. Appl. 2017, 24, 92–100. [Google Scholar] [CrossRef] [Scilit]
- Wang, M.; Chen, J.; Han, J.; Zhang, Y.; Fan, M.; Yu, M.; Sun, C.; Xie, T. Region-Specific and Weather-Dependent Characteristics of the Relation between GNSS-Weighted Mean Temperature and Surface Temperature over China. Remote Sens. 2023, 15, 1538. [Google Scholar] [CrossRef] [Scilit]
- Xia, P.; Ye, S.; Jiang, P.; Pan, L.; Guo, M. Assessing Water Vapor Tomography in Hong Kong with Improved Vertical and Horizontal Constraints. Ann. Geophys. 2018, 36, 969–978. [Google Scholar] [CrossRef] [Scilit]
- Andersen, A.H.; Kak, A.C. Simultaneous Algebraic Reconstruction Technique (SART): A Superior Implementation of the ART Algorithm. Ultrason. Imaging 1984, 6, 81–94. [Google Scholar] [CrossRef] [Scilit]
- Bouix, S.; Siddiqi, K. Divergence-Based Medial Surfaces. In Proceedings of the Computer Vision—ECCV 2000; Vernon, D., Ed.; Springer: Berlin/Heidelberg, Germany, 2000; pp. 603–618. [Google Scholar]
- Virtanen, P.; Gommers, R.; Oliphant, T.E.; Haberland, M.; Reddy, T.; Cournapeau, D.; Burovski, E.; Peterson, P.; Weckesser, W.; Bright, J.; et al. SciPy 1.0: Fundamental Algorithms for Scientific Computing in Python. Nat. Methods 2020, 17, 261–272. [Google Scholar] [CrossRef] [Scilit] [PubMed]
- Yee, E.; Biltoft, C.A. Concentration Fluctuation Measurements in a Plume Dispersing through a Regular Array of Obstacles. Bound.-Layer Meteorol. 2004, 111, 363–415. [Google Scholar] [CrossRef] [Scilit]
- Kesteven, G.L. The Coefficient of Variation. Nature 1946, 158, 520–521. [Google Scholar] [CrossRef] [Scilit] [PubMed]
- Shaffer, F.; Ginsberg, J.P. An Overview of Heart Rate Variability Metrics and Norms. Front. Public Health 2017, 5, 258. [Google Scholar] [CrossRef] [Scilit] [PubMed]
- Mapes, B.E.; Chung, E.S.; Hannah, W.M.; Masunaga, H.; Wimmers, A.J.; Velden, C.S. The Meandering Margin of the Meteorological Moist Tropics. Geophys. Res. Lett. 2018, 45, 1177–1184. [Google Scholar] [CrossRef] [Scilit]
- Trier, S.B.; Chen, F.; Manning, K.W. A Study of Convection Initiation in a Mesoscale Model Using High-Resolution Land Surface Initial Conditions. Mon. Weather Rev. 2004, 132, 2954–2976. [Google Scholar] [CrossRef] [Scilit]
- Minallah, S.; Steiner, A.L. Role of the Atmospheric Moisture Budget in Defining the Precipitation Seasonality of the Great Lakes Region. J. Clim. 2021, 34, 643–657. [Google Scholar] [CrossRef] [Scilit]
- Lopez-Marti, F.; Wu, L.; Messori, G.; Rutgersson, A. Moisture Sources throughout the Life Cycle of an Atmospheric River: Storm Dennis Case Study. J. Geophys. Res. Atmos. 2025, 130, e2024JD042876. [Google Scholar] [CrossRef] [Scilit]
- Li, J.; Zhao, Y.; Chen, D.; Zhao, P.; Zhang, C.; Wang, Y. The Quantitative Role of Moisture and Vertical Motion in Shaping Summer Heavy Rainfall over North China under Two Distinct Large-Scale Weather Patterns. J. Clim. 2024, 37, 2655–2672. [Google Scholar] [CrossRef] [Scilit]
- Binder, H.; Boettcher, M.; Joos, H.; Wernli, H. The Role of Warm Conveyor Belts for the Intensification of Extratropical Cyclones in Northern Hemisphere Winter. J. Atmos. Sci. 2016, 73, 3997–4020. [Google Scholar] [CrossRef] [Scilit]
- Xue, Y.; Wang, L.-P.; Grabowski, W.W. Growth of Cloud Droplets by Turbulent Collision–Coalescence. J. Atmos. Sci. 2008, 65, 331–356. [Google Scholar] [CrossRef] [Scilit]
- Roe, G.H. Orographic Precipitation. Annu. Rev. Earth Planet. Sci. 2005, 33, 645–671. [Google Scholar] [CrossRef] [Scilit]
- Wang, P.K.; Pruppacher, H.R. Acceleration to Terminal Velocity of Cloud and Raindrops. J. Appl. Meteorol. 1977, 16, 275–280. [Google Scholar] [CrossRef] [Scilit]
- Li, X.-Y.; Brandenburg, A.; Svensson, G.; Haugen, N.E.L.; Mehlig, B.; Rogachevskii, I. Condensational and Collisional Growth of Cloud Droplets in a Turbulent Environment. J. Atmos. Sci. 2020, 77, 337–353. [Google Scholar] [CrossRef] [Scilit]
- Liu, S.; Sindhu, K.D.; Kirshbaum, D.J. Observations of Boundary Layer Convergence Lines and Associated Updrafts in the U.S. Southern Great Plains. J. Atmos. Sci. 2023, 80, 2947–2968. [Google Scholar] [CrossRef] [Scilit]
- Gupta, S.; Wang, D.; Giangrande, S.E.; Biscaro, T.S.; Jensen, M.P. Lifecycle of Updrafts and Mass Flux in Isolated Deep Convection over the Amazon Rainforest: Insights from Cell Tracking. Atmos. Chem. Phys. 2024, 24, 4487–4510. [Google Scholar] [CrossRef] [Scilit]
- Colle, B.A. Sensitivity of Orographic Precipitation to Changing Ambient Conditions and Terrain Geometries: An Idealized Modeling Perspective. J. Atmos. Sci. 2004, 61, 588–606. [Google Scholar] [CrossRef] [Scilit]
- Dacre, H.F.; Clark, P.A. A Kinematic Analysis of Extratropical Cyclones, Warm Conveyor Belts and Atmospheric Rivers. npj Clim. Atmos. Sci. 2025, 8, 97. [Google Scholar] [CrossRef] [Scilit]
- Wan, Y.; Wang, D.; Wang, D. Comparison of Preconvective Environments between Warm-Sector and Frontal Heavy Rainfall Events in South China. Front. Earth Sci. 2025, 13, 1598866. [Google Scholar] [CrossRef] [Scilit]
- Miranda, P.M.A.; Mateus, P. A New Unconstrained Approach to GNSS Atmospheric Water Vapor Tomography. Geophys. Res. Lett. 2021, 48, e2021GL094852. [Google Scholar] [CrossRef] [Scilit]
- Liu, Y.; Zhao, Q.; Li, Z.; Yao, Y.; Li, X. GNSS-Derived PWV and Meteorological Data for Short-Term Rainfall Forecast Based on Support Vector Machine. Adv. Space Res. 2022, 70, 992–1003. [Google Scholar] [CrossRef] [Scilit]
- Adavi, Z.; Ghassemi, B.; Weber, R.; Hanna, N. Machine Learning-Based Estimation of Hourly GNSS Precipitable Water Vapour. Remote Sens. 2023, 15, 4551. [Google Scholar] [CrossRef] [Scilit]
- Raupach, T.H.; Martynov, A.; Nisi, L.; Hering, A.; Barton, Y.; Martius, O. Object-Based Analysis of Simulated Thunderstorms in Switzerland: Application and Validation of Automated Thunderstorm Tracking with Simulation Data. Geosci. Model Dev. 2021, 14, 6495–6514. [Google Scholar] [CrossRef] [Scilit]
- Raut, B.A.; Jackson, R.; Picel, M.; Collis, S.M.; Bergemann, M.; Jakob, C. An Adaptive Tracking Algorithm for Convection in Simulated and Remote Sensing Data. J. Appl. Meteorol. Climatol. 2021, 60, 513–526. [Google Scholar] [CrossRef] [Scilit]
- Han, F.; Wang, X. An Object-Based Method for Tracking Convective Storms in Convection Allowing Models. Atmosphere 2021, 12, 1535. [Google Scholar] [CrossRef] [Scilit]
- Guan, B.; Waliser, D.E. Tracking Atmospheric Rivers Globally: Spatial Distributions and Temporal Evolution of Life Cycle Characteristics. J. Geophys. Res. Atmos. 2019, 124, 12523–12552. [Google Scholar] [CrossRef] [Scilit]
- Collow, A.B.M.; Shields, C.A.; Guan, B.; Kim, S.; Lora, J.M.; McClenny, E.E.; Nardi, K.; Payne, A.; Reid, K.; Shearer, E.J.; et al. An Overview of ARTMIP’s Tier 2 Reanalysis Intercomparison: Uncertainty in the Detection of Atmospheric Rivers and Their Associated Precipitation. J. Geophys. Res. Atmos. 2022, 127, e2021JD036155. [Google Scholar] [CrossRef] [Scilit]
- Speidel, J.; Vogelmann, H.; Behrendt, A.; Lange, D.; Mauder, M.; Reichardt, J.; Wolz, K. The ATMONSYS Water Vapor DIAL: Advanced Measurements of Short-Term Variability in the Planetary Boundary Layer. Atmos. Meas. Tech. 2025, 18, 4923–4948. [Google Scholar] [CrossRef] [Scilit]
- Lin, G.; Wang, Z.; Ziegler, C.; Hu, X.-M.; Xue, M.; Geerts, B.; Chu, Y. A Comparison of Convective Storm Inflow Moisture Variability between the Great Plains and the Southeastern United States Using Multiplatform Field Campaign Observations. J. Atmos. Ocean. Technol. 2023, 40, 539–556. [Google Scholar] [CrossRef] [Scilit]
- Davis, C.A.; Brown, B.G.; Bullock, R.; Halley-Gotway, J. The Method for Object-Based Diagnostic Evaluation (MODE) Applied to Numerical Forecasts from the 2005 NSSL/SPC Spring Program. Weather Forecast. 2009, 24, 1252–1267. [Google Scholar] [CrossRef] [Scilit]
- Li, Z.; Wright, D.B.; Zhang, S.Q.; Kirschbaum, D.B.; Hartke, S.H. Object-Based Comparison of Data-Driven and Physics-Driven Satellite Estimates of Extreme Rainfall. J. Hydrometeorol. 2020, 21, 2759–2776. [Google Scholar] [CrossRef] [Scilit] [PubMed]
- Ebert, E.E.; Gallus, W.A. Toward Better Understanding of the Contiguous Rain Area (CRA) Method for Spatial Forecast Verification. Weather Forecast. 2009, 24, 1401–1415. [Google Scholar] [CrossRef] [Scilit]
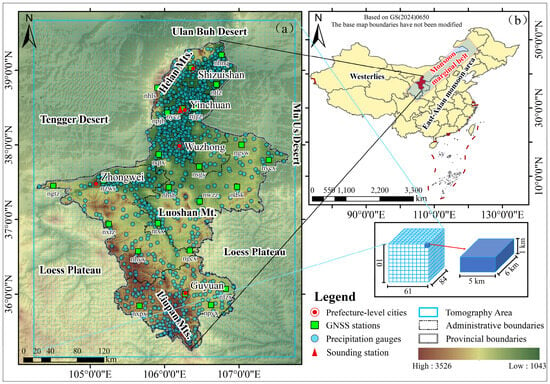
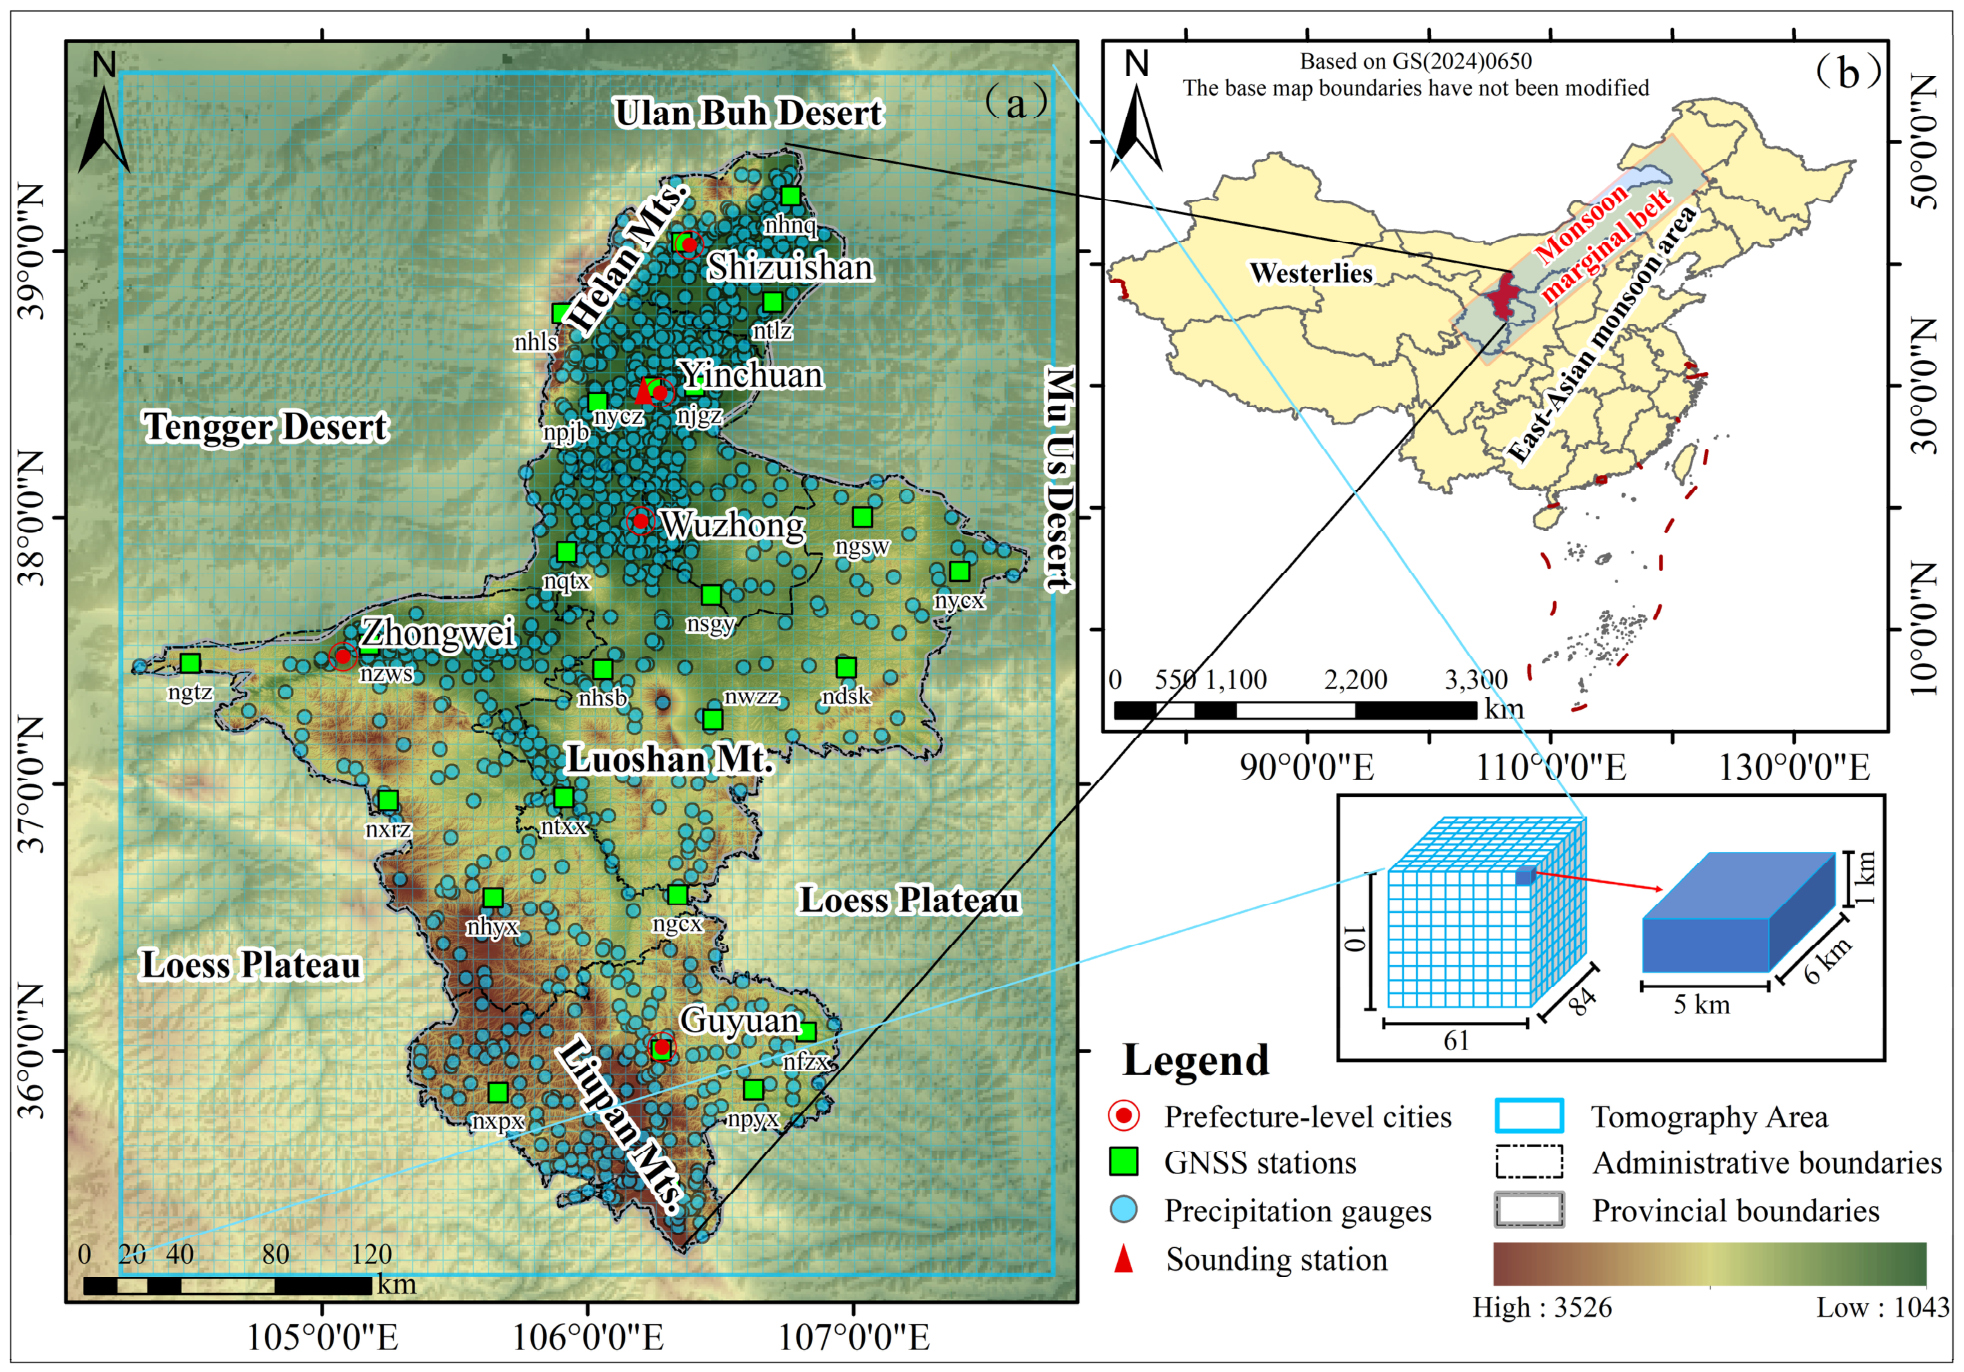
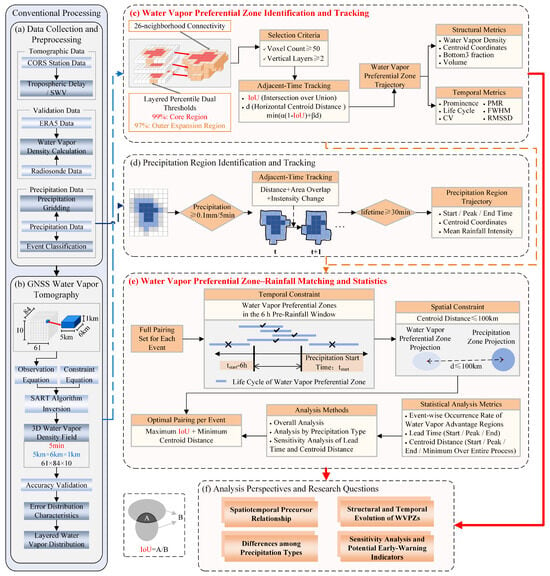
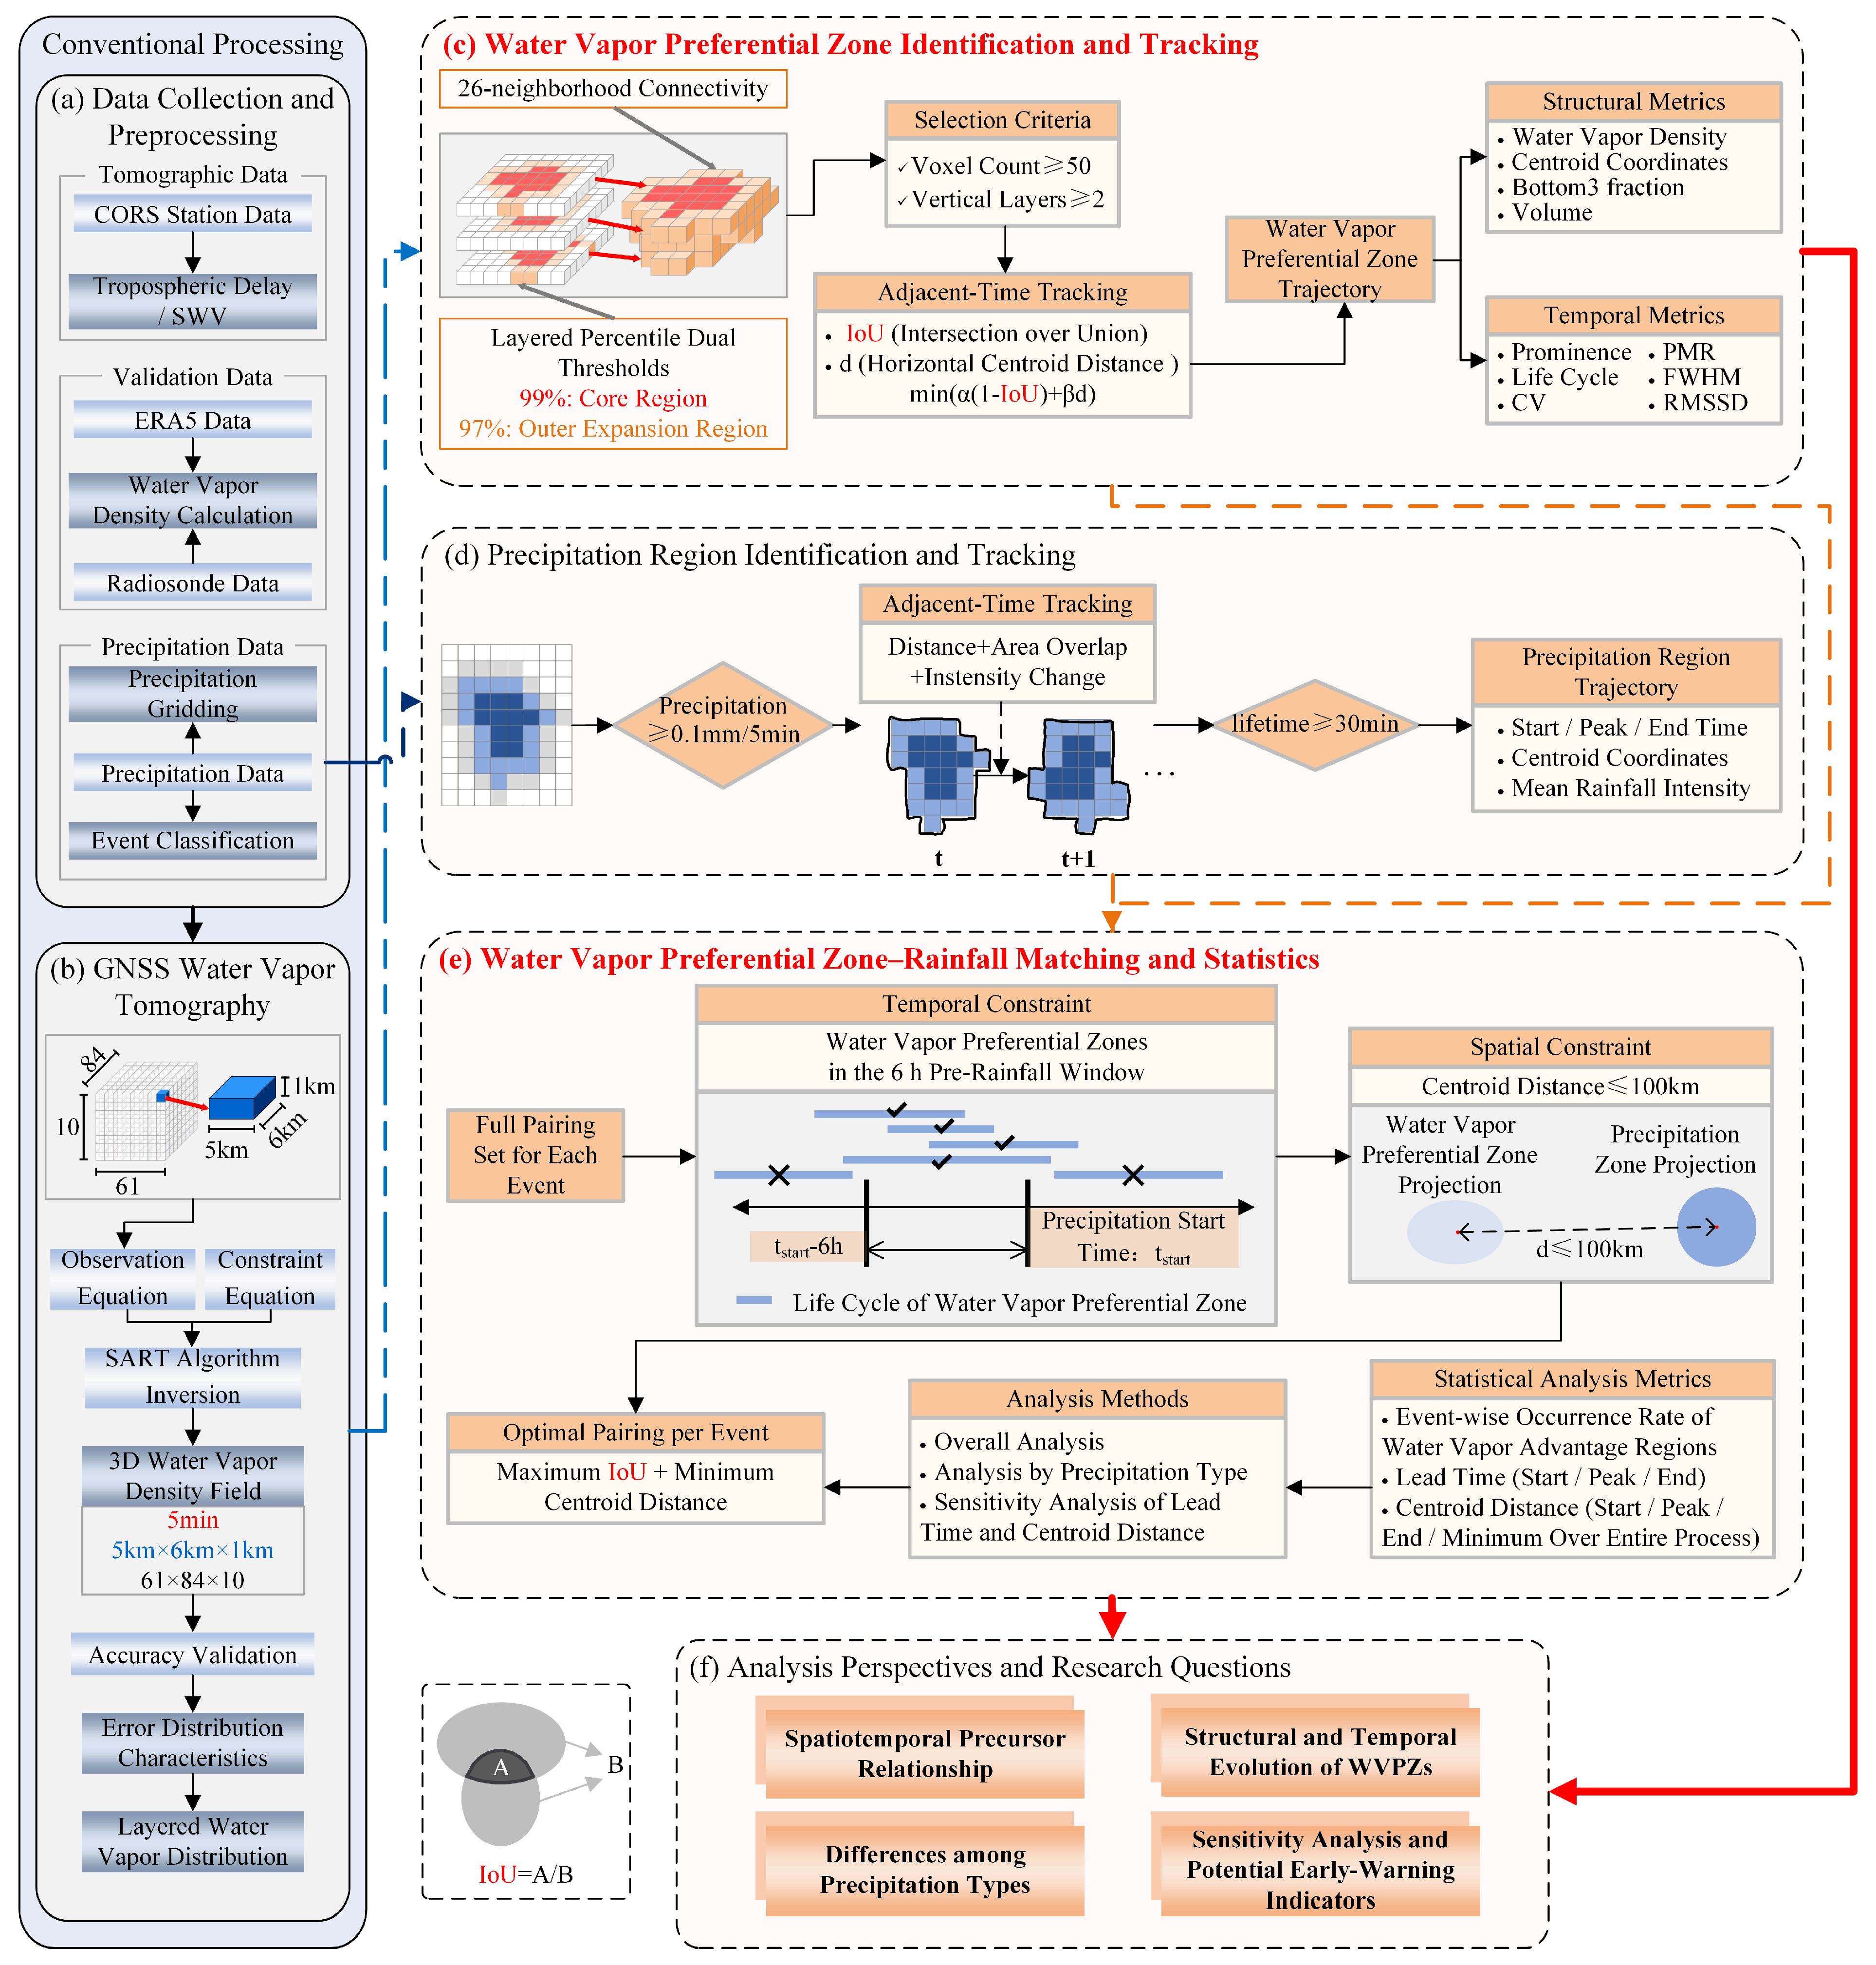
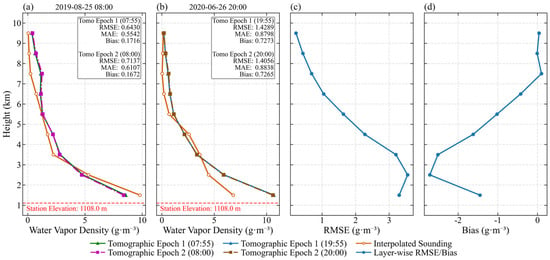
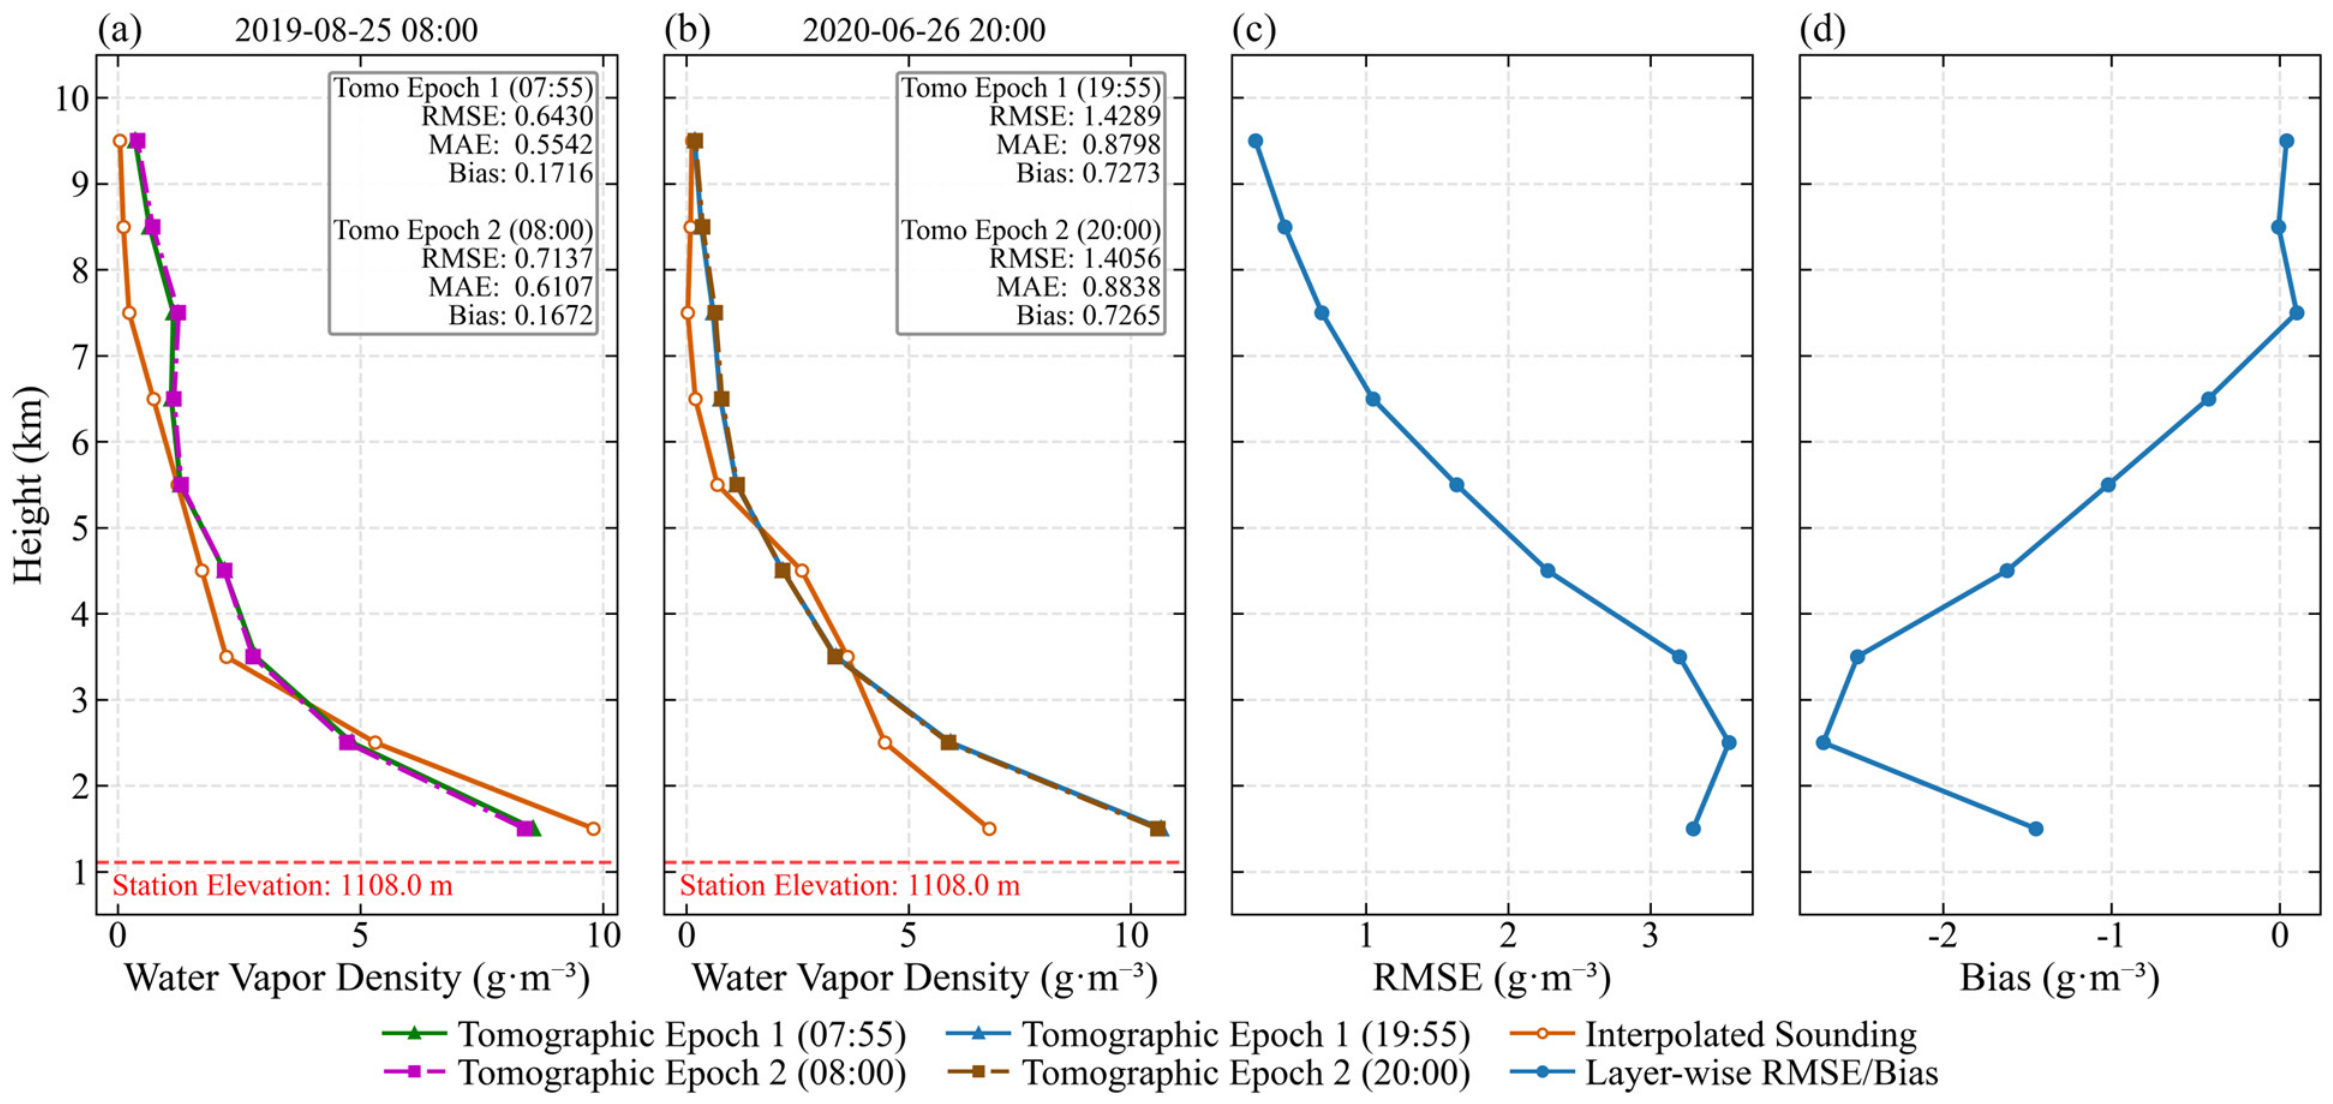
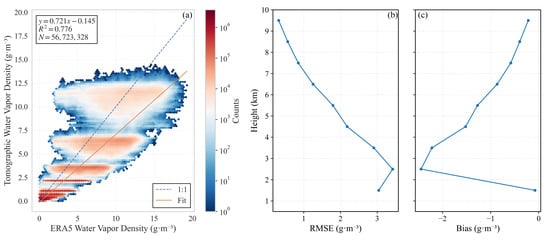
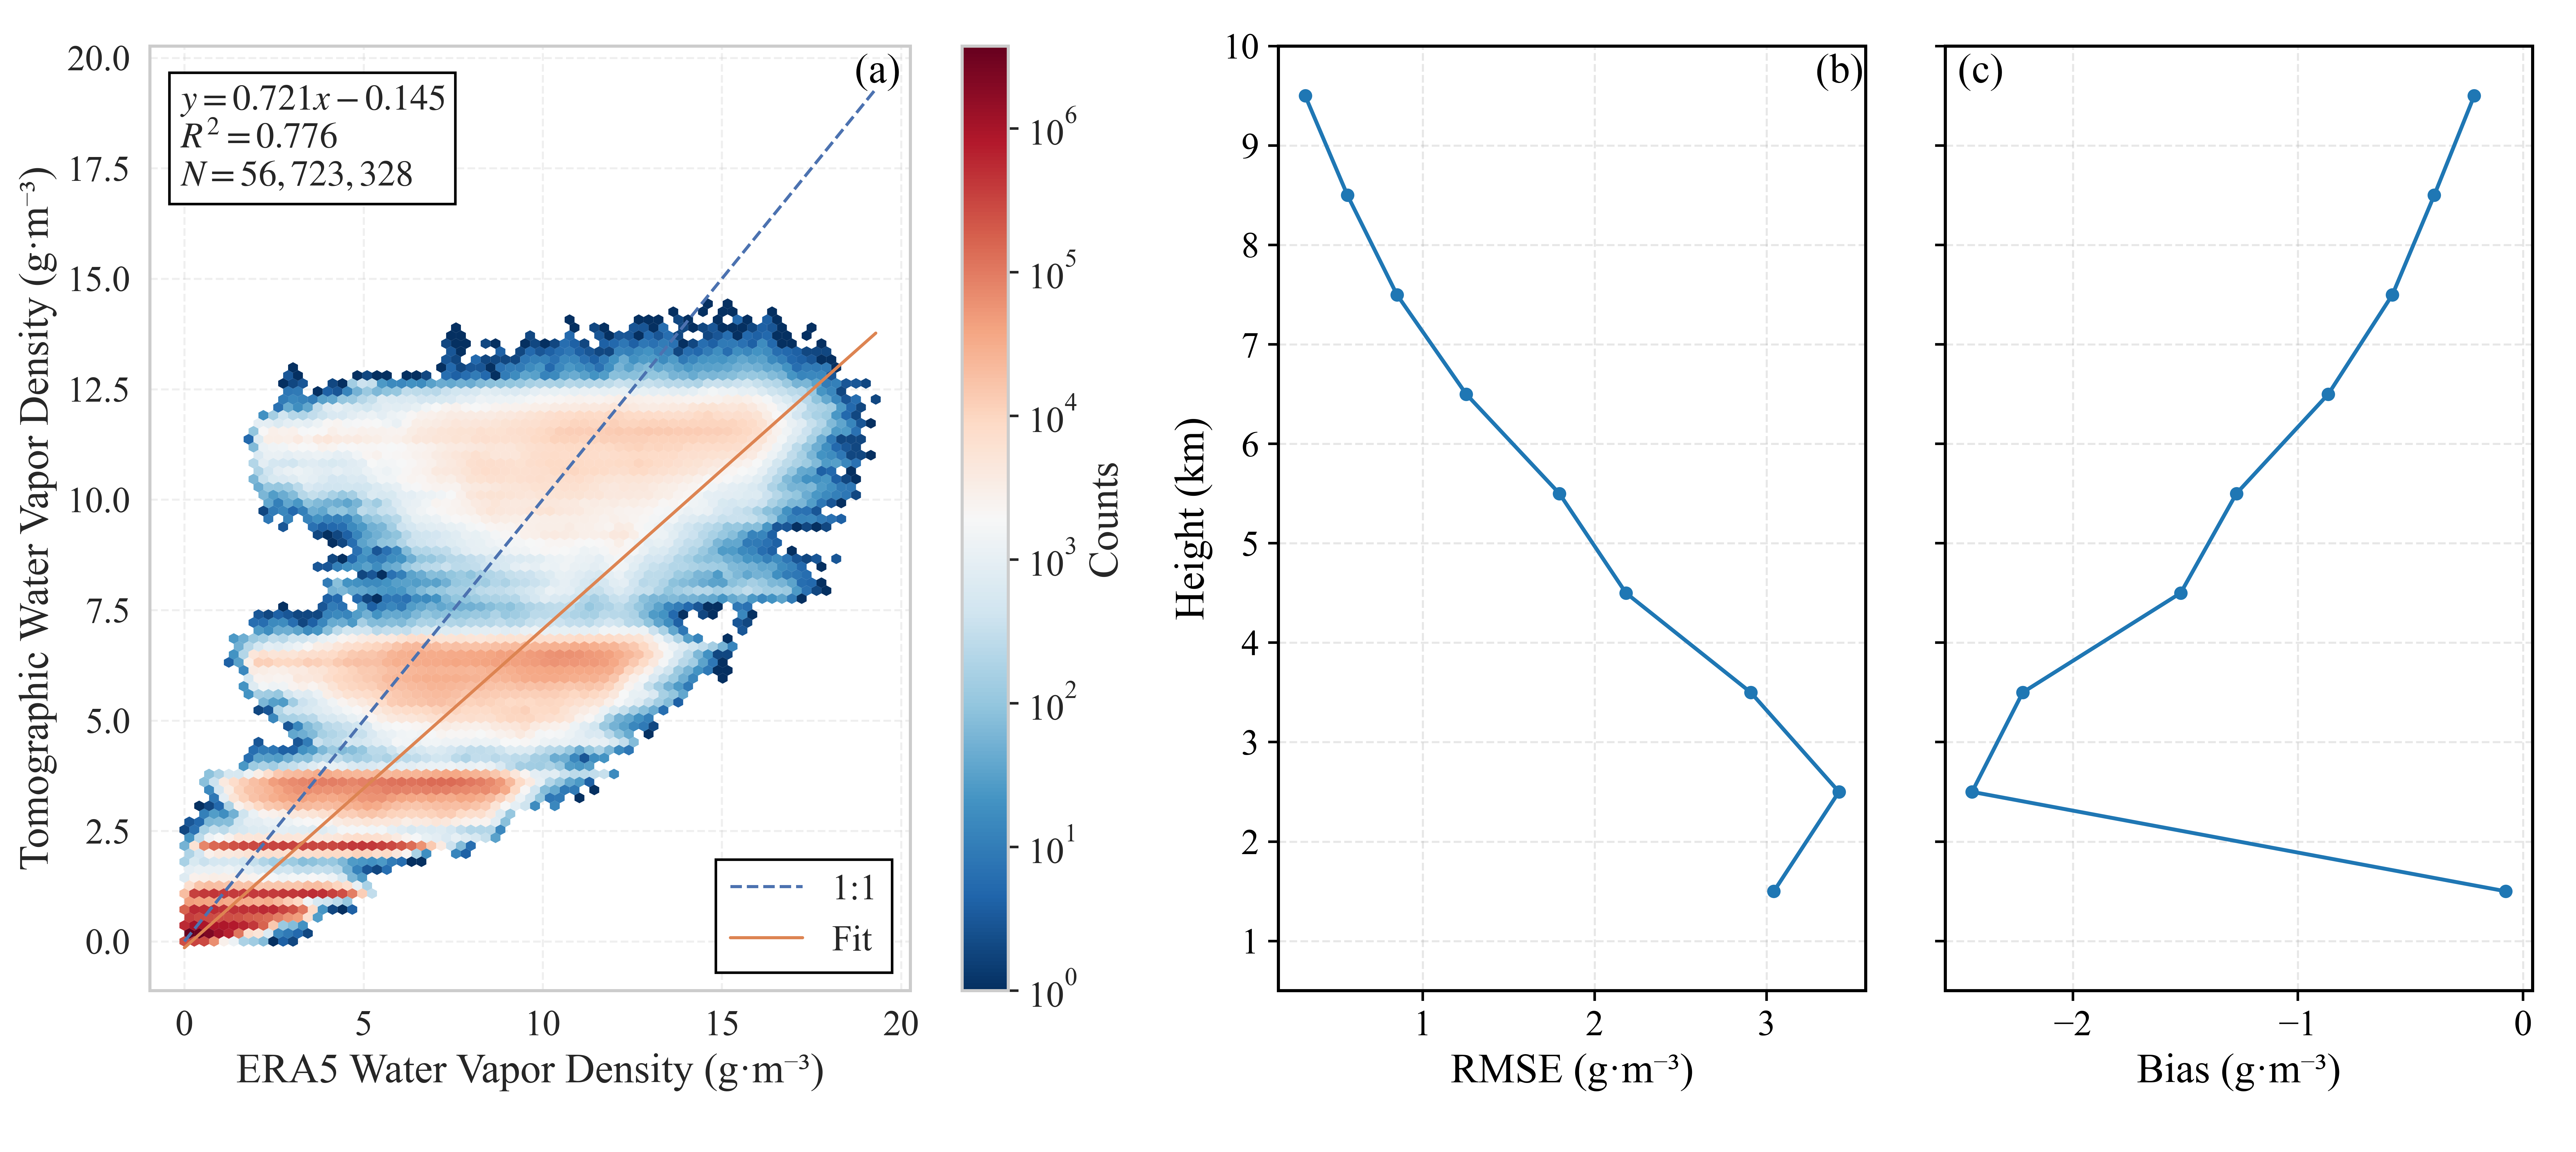
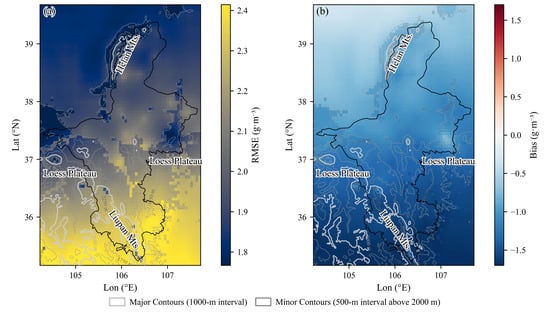
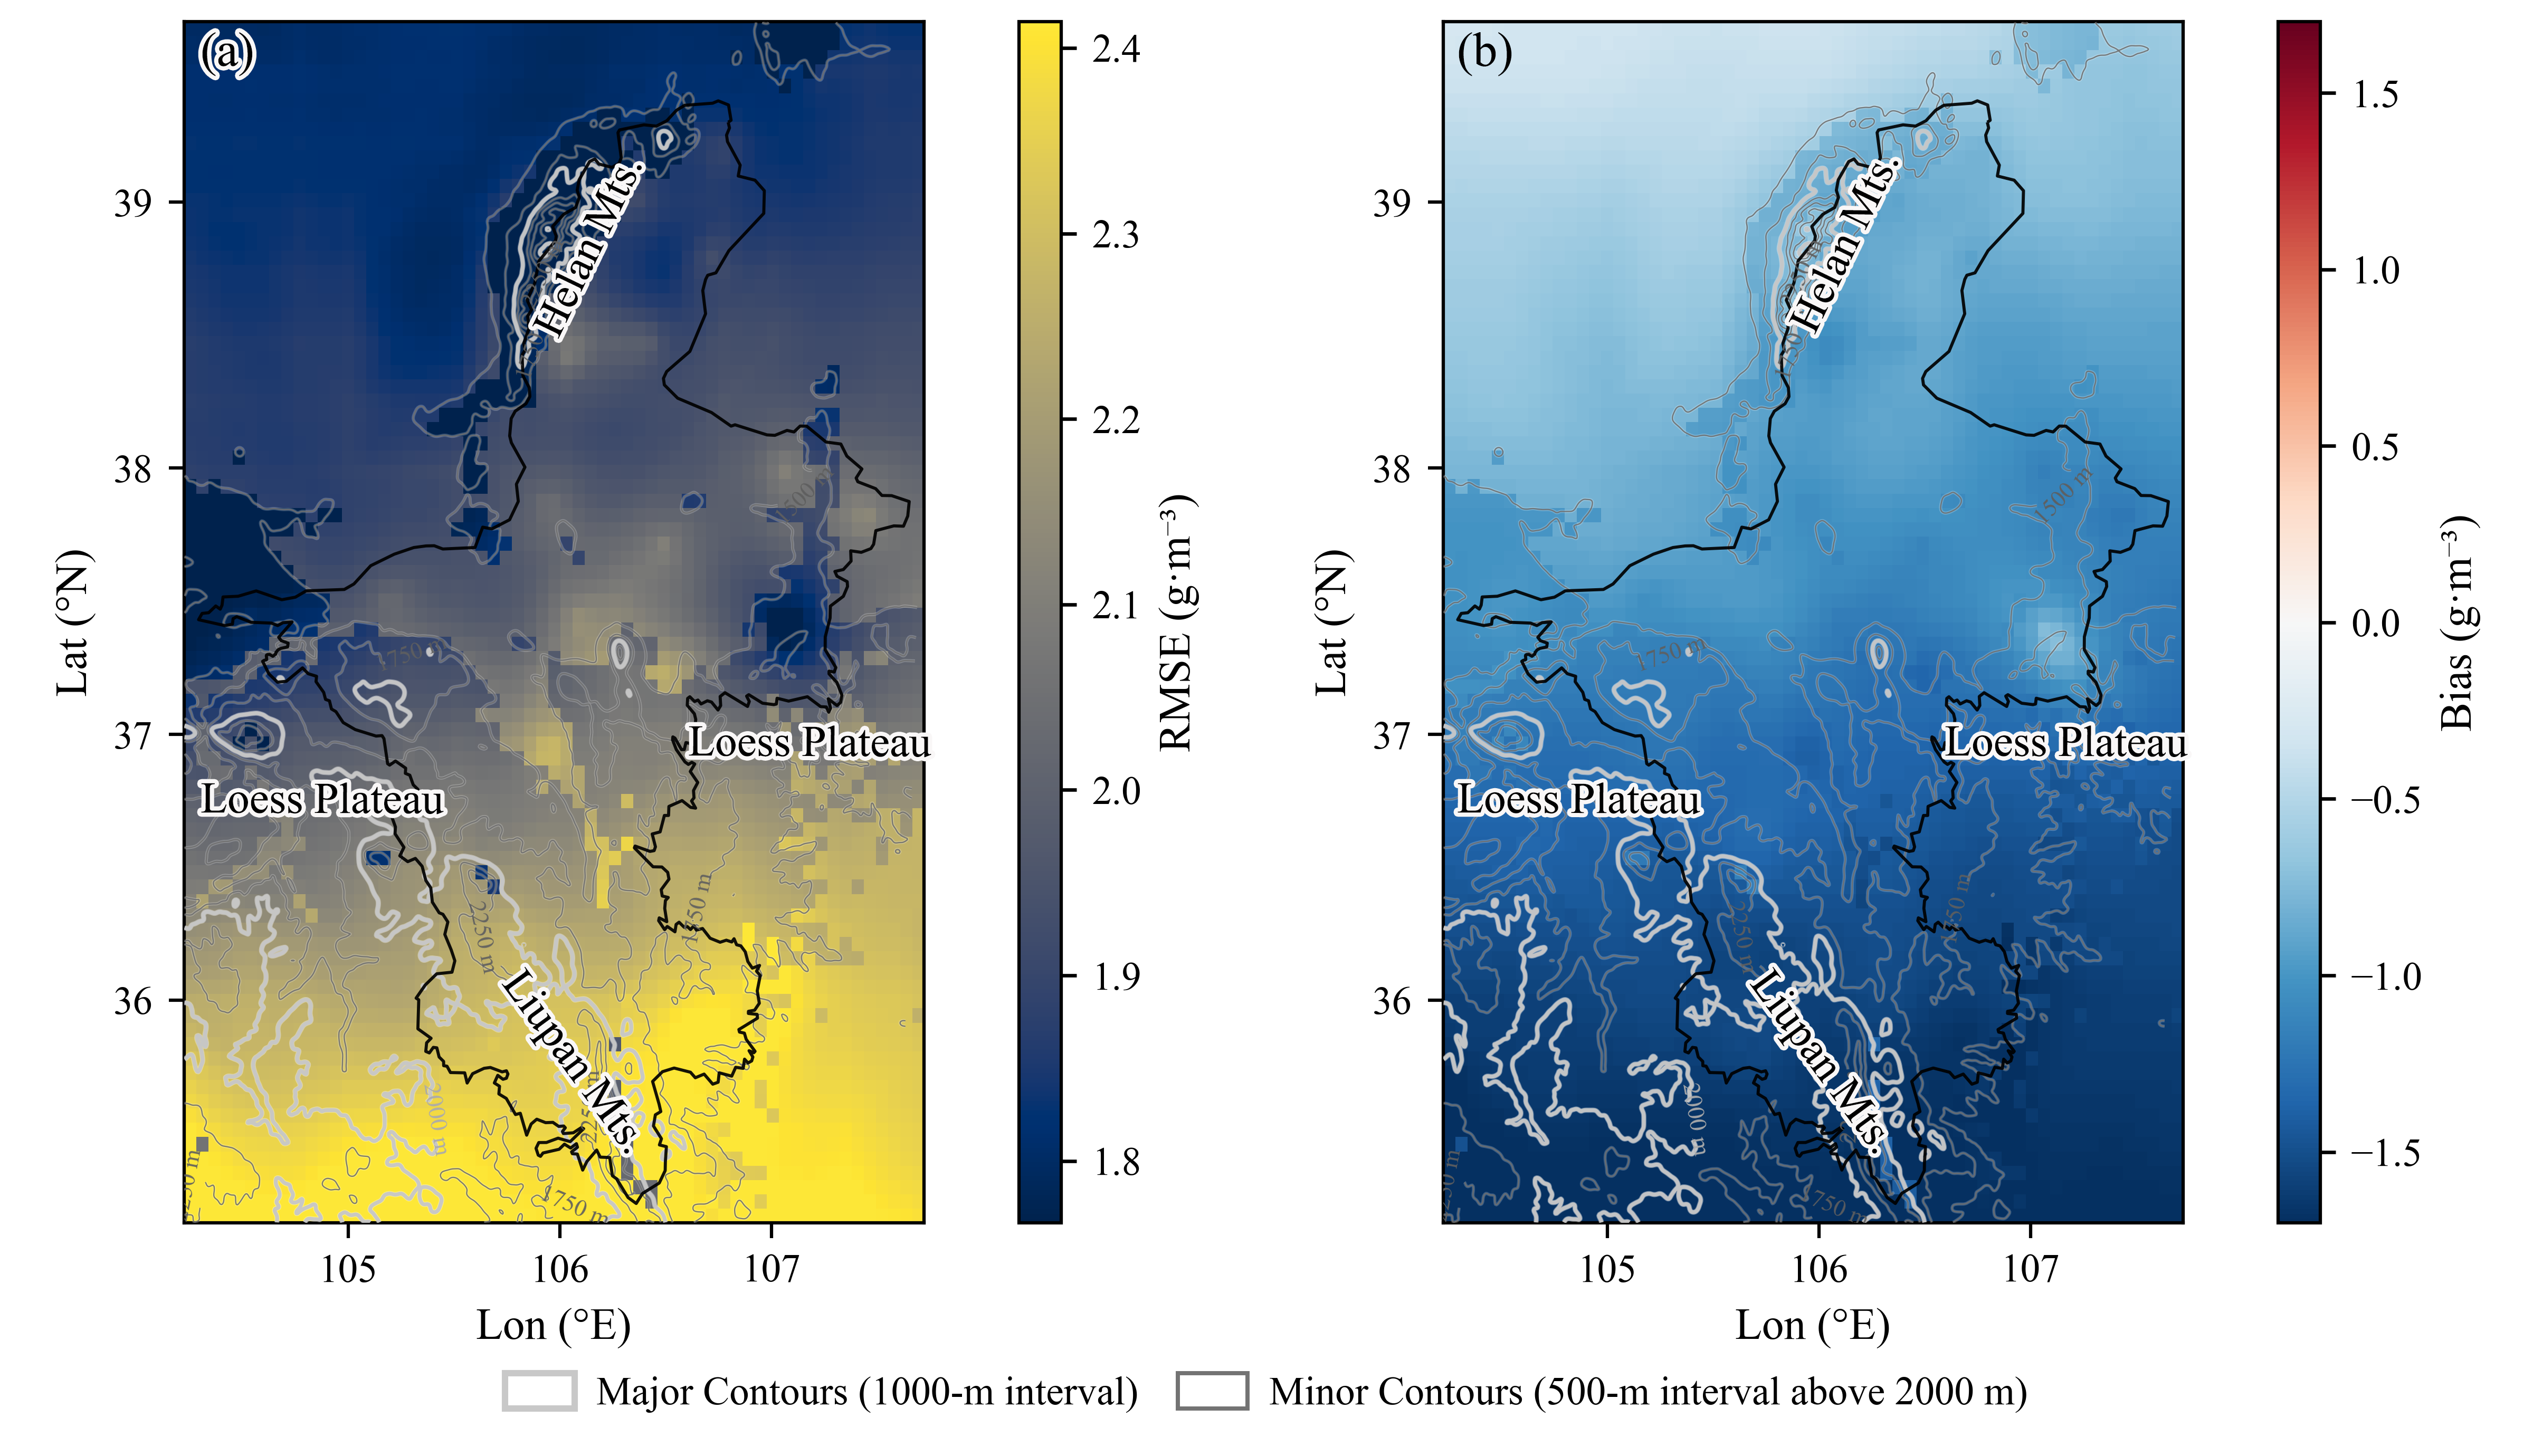
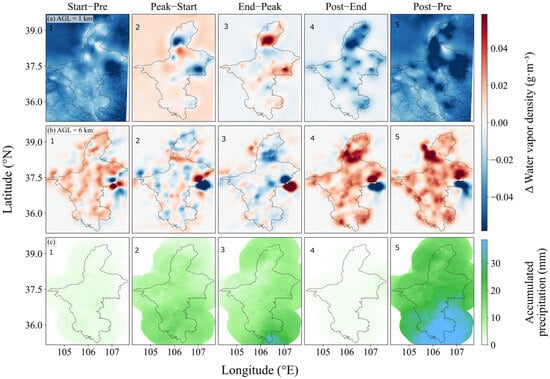
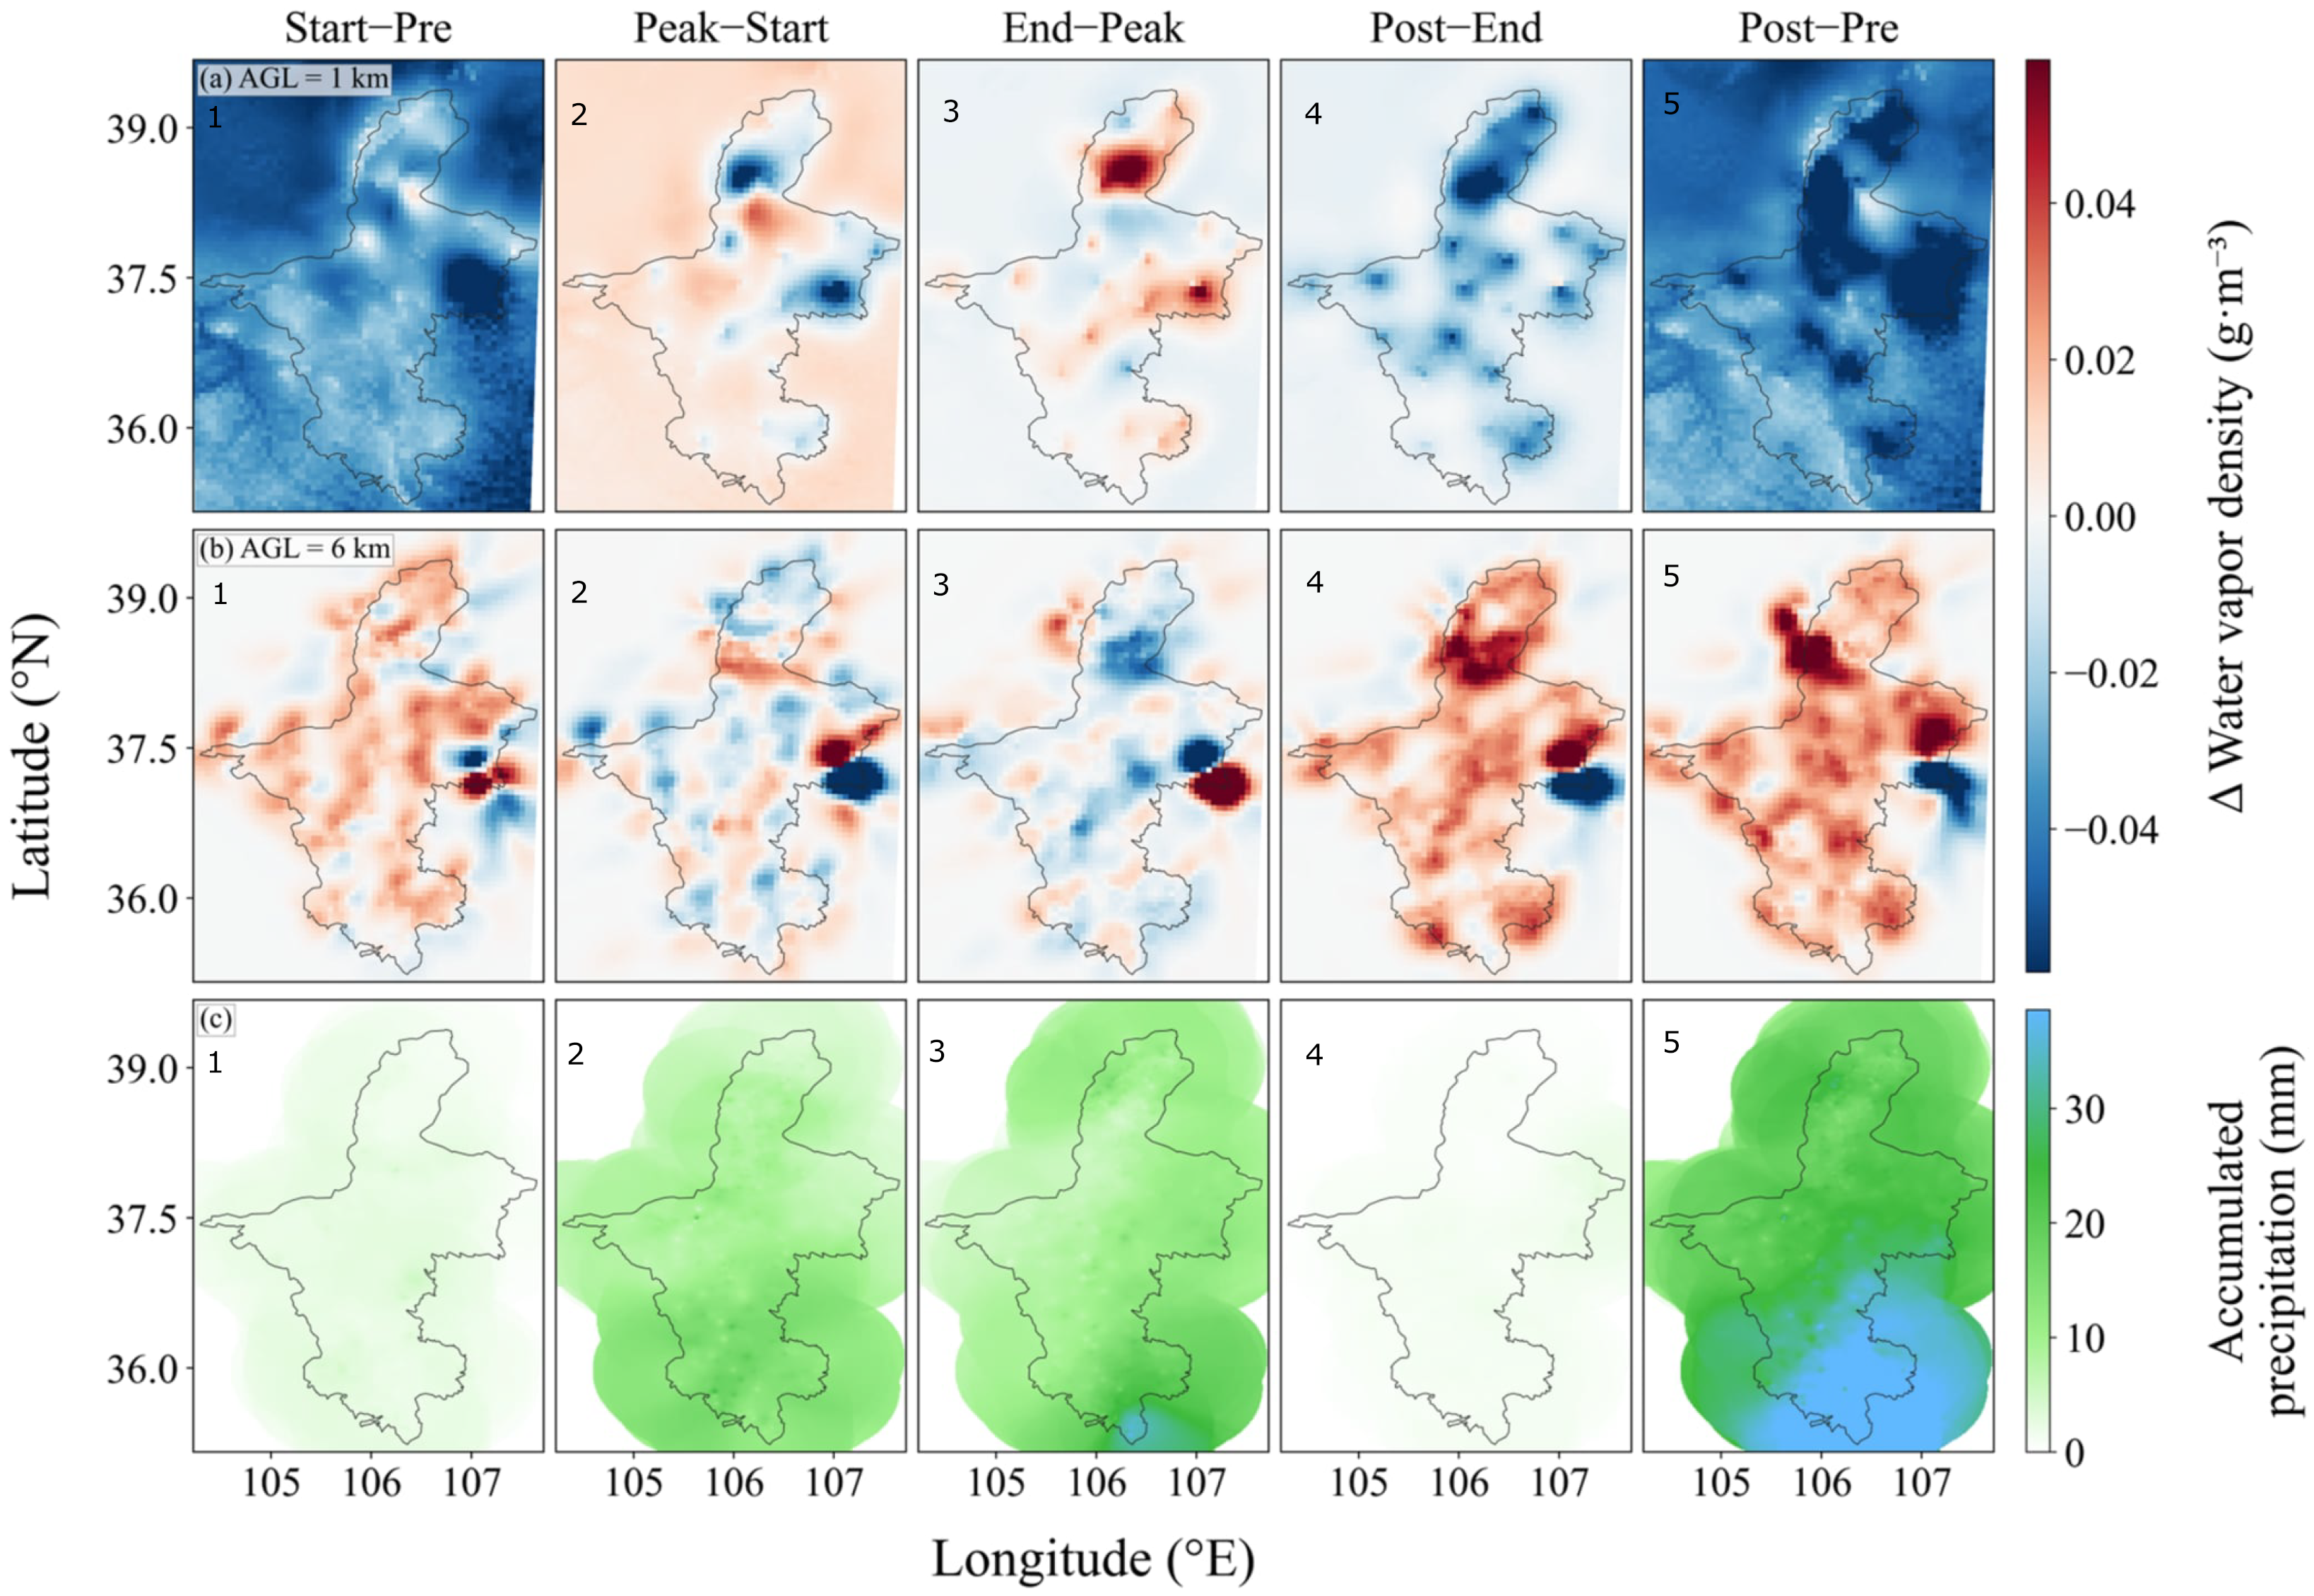
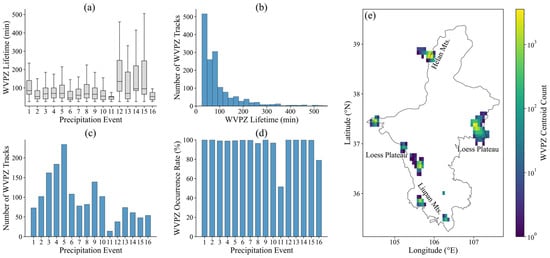
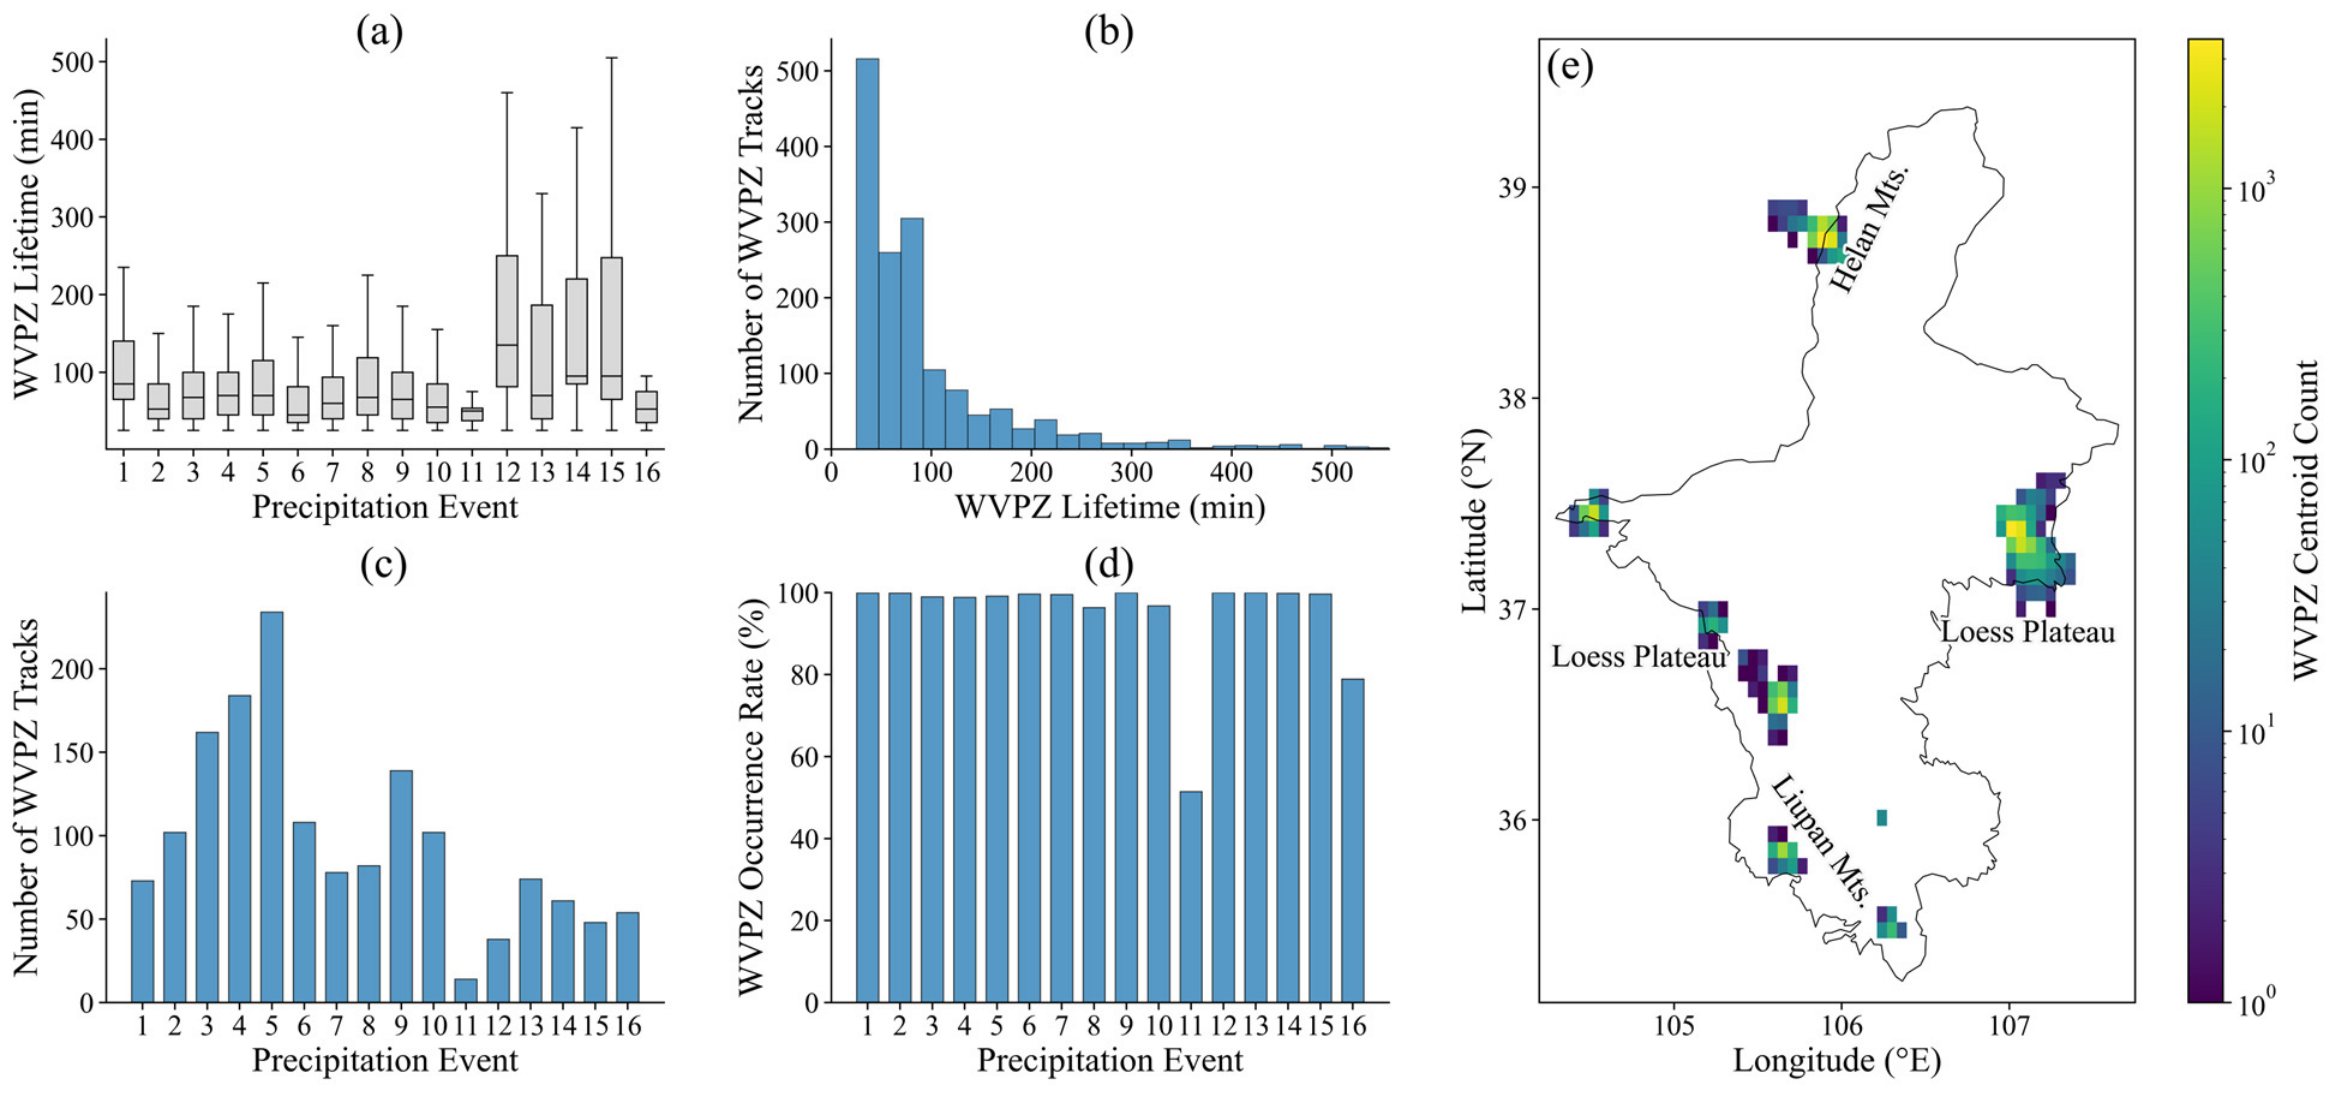
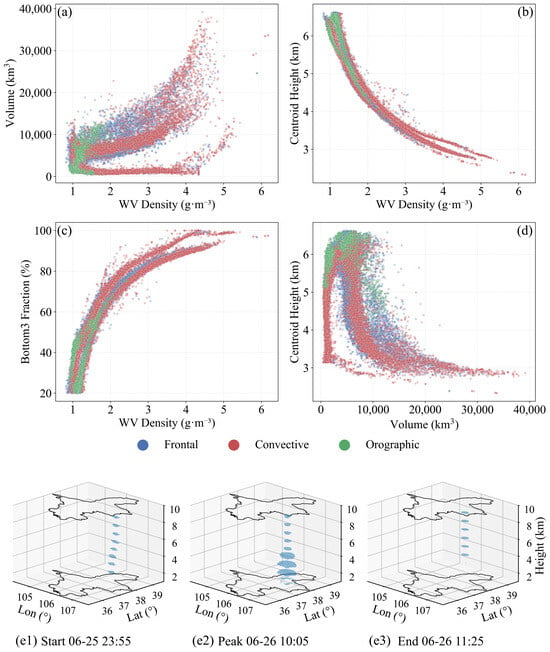
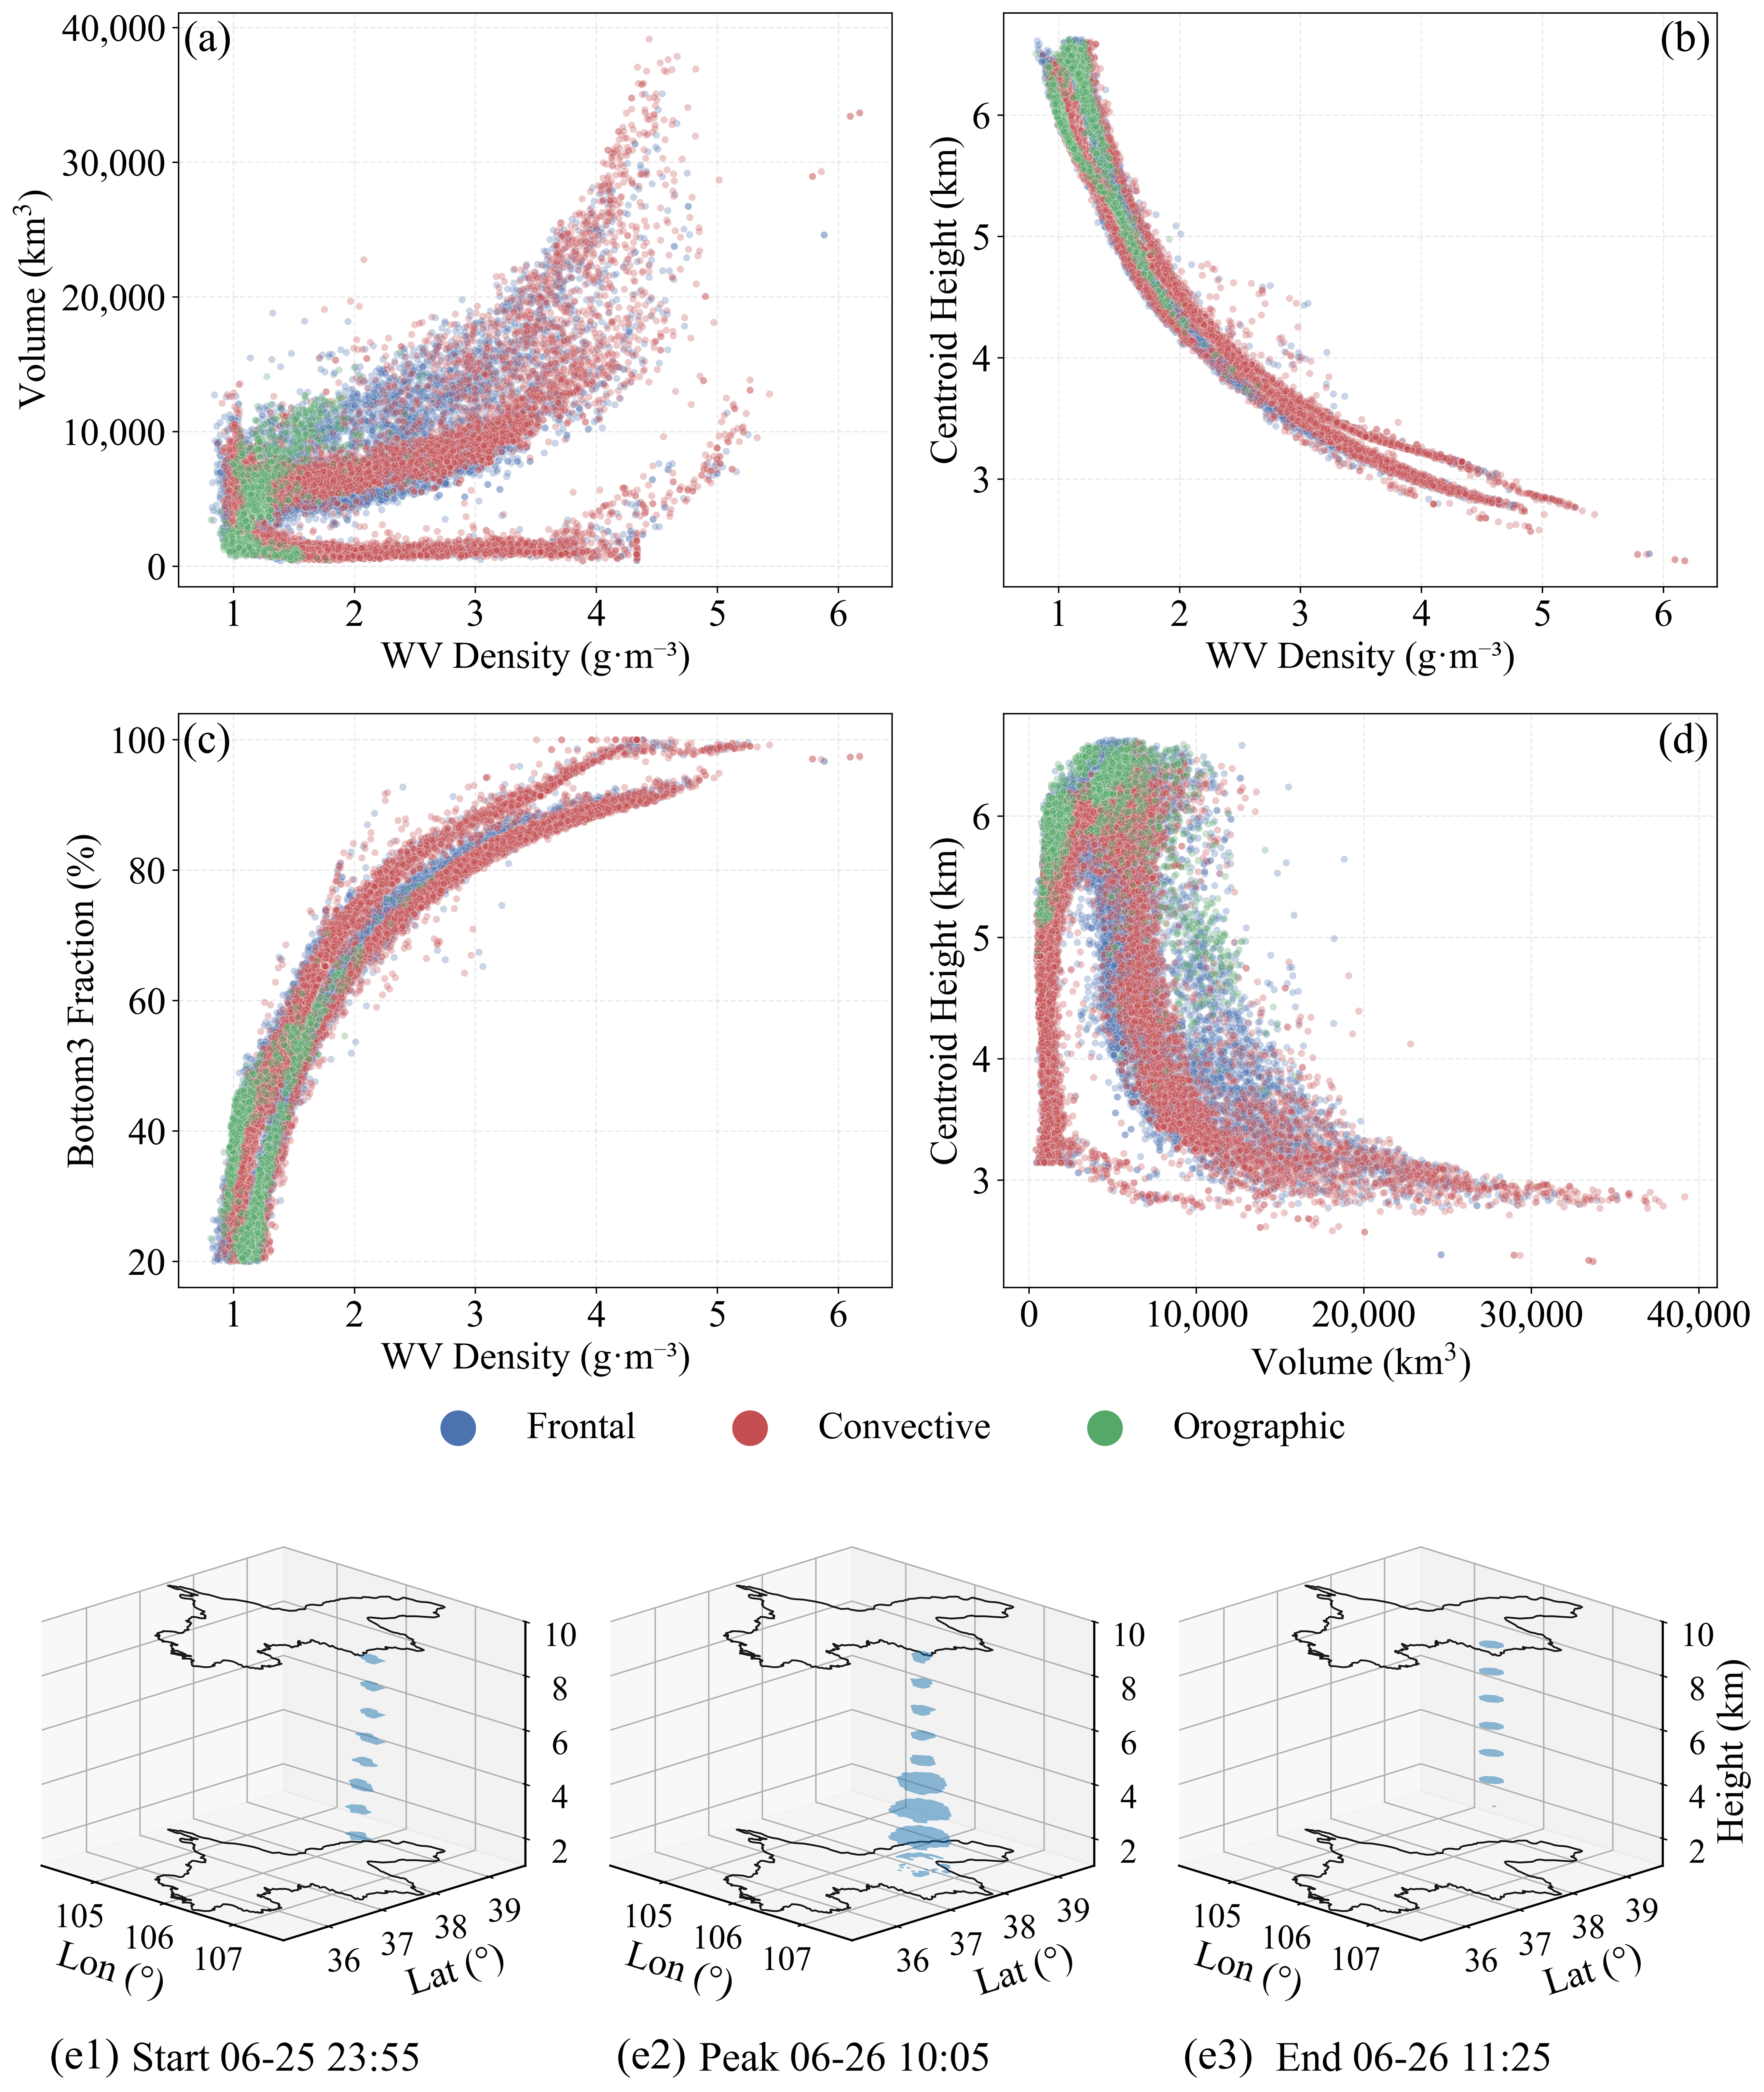
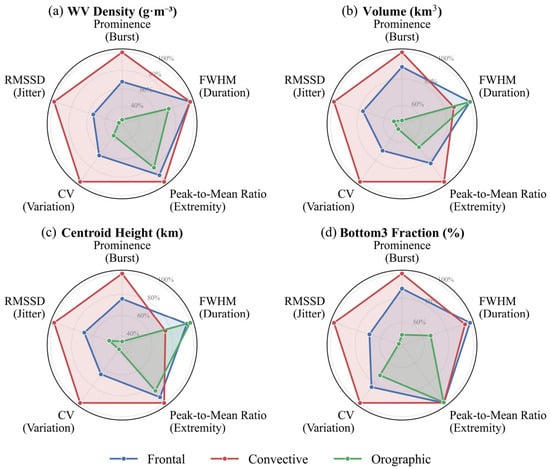
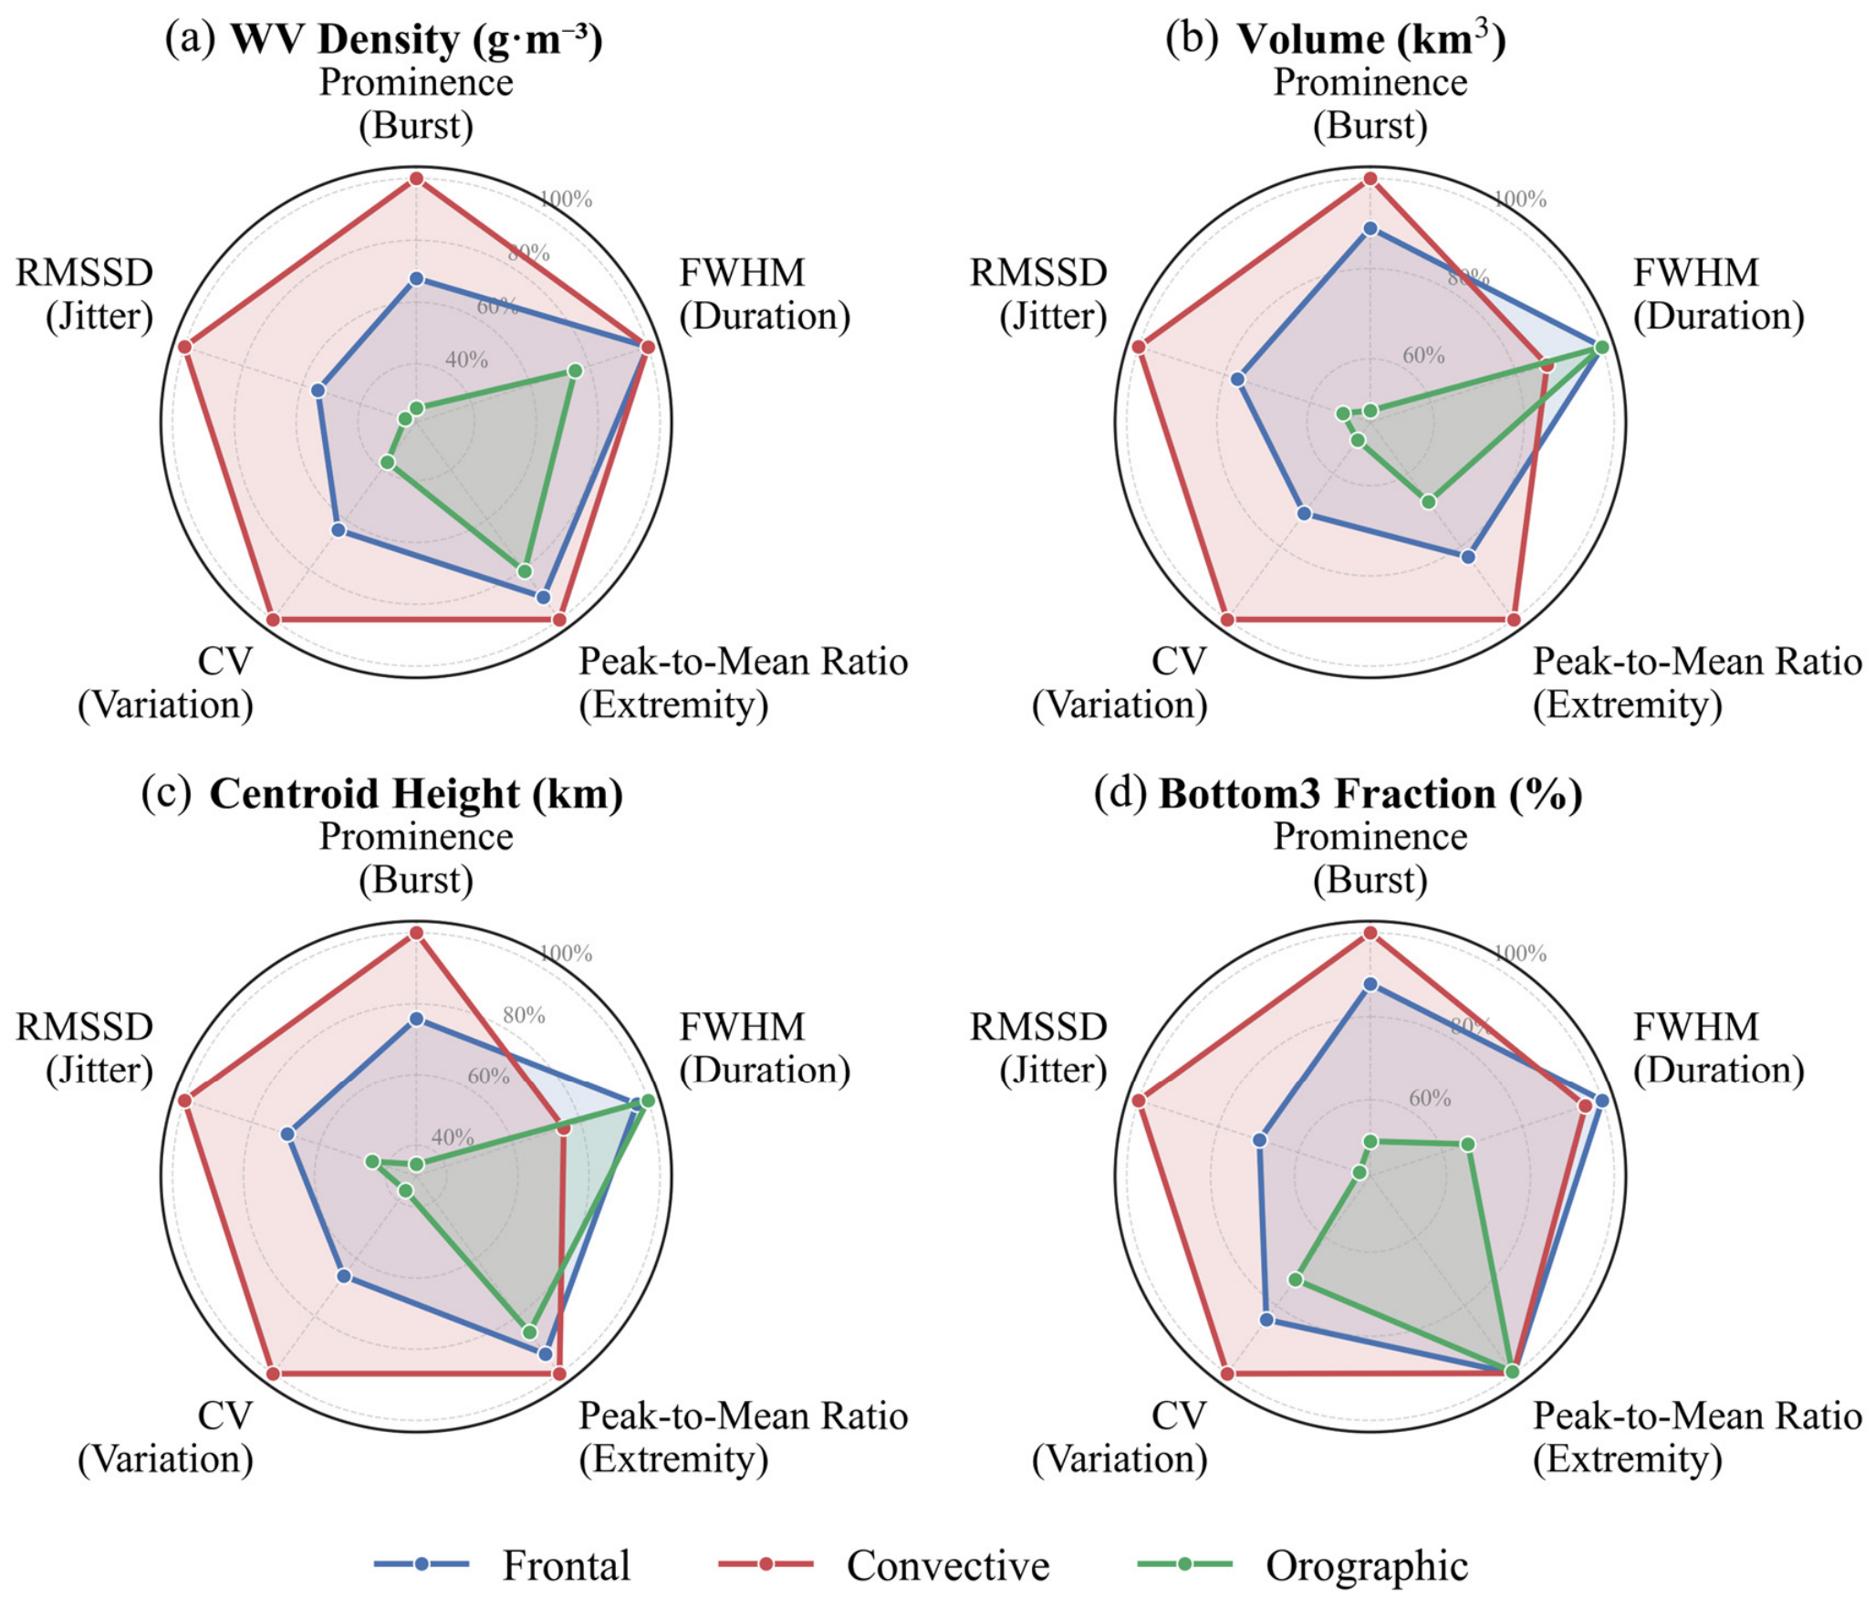
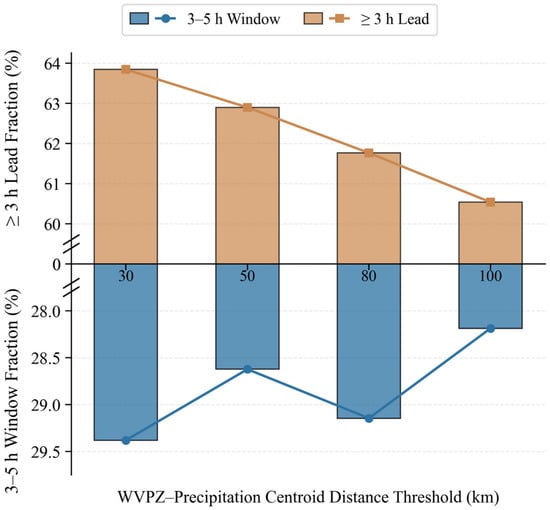
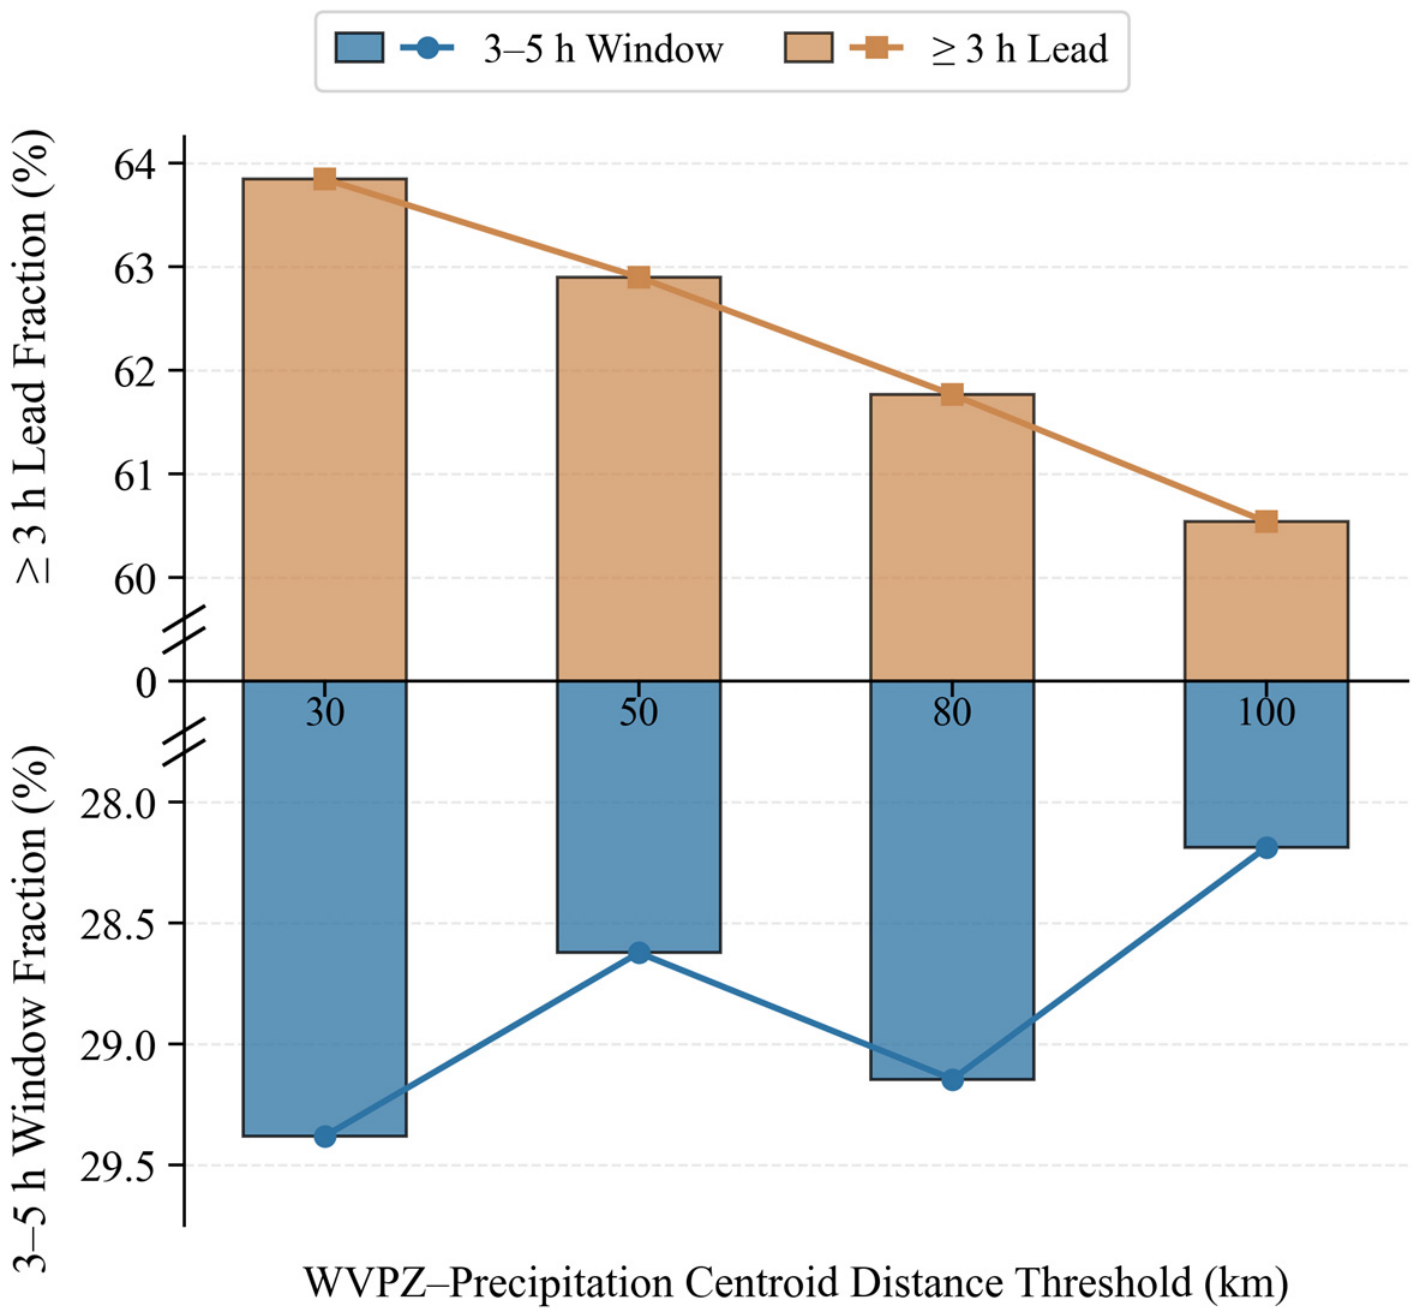

Disclaimer/Publisher’s Note: The statements, opinions and data contained in all publications are solely those of the individual author(s) and contributor(s) and not of MDPI and/or the editor(s). MDPI and/or the editor(s) disclaim responsibility for any injury to people or property resulting from any ideas, methods, instructions or products referred to in the content. |
© 2026 by the authors. Licensee MDPI, Basel, Switzerland. This article is an open access article distributed under the terms and conditions of the Creative Commons Attribution (CC BY) license.