


Highlights
What are the main findings?
- Desertification underwent expansion, fluctuation, and recovery, with an overall improvement trend across northern China and Mongolia from 2000 to 2024.
- The XGBoost–SHAP model revealed nonlinear predictive associations and transition points, with interactions among climate, soil, and grazing generally exceeding individual effects.
What are the implications of the main findings?
- The multidimensional framework enables consistent long-term monitoring of desertification across large transboundary dryland regions.
- The identified nonlinear responses and interactions provide a basis for targeted restoration and adaptive land management under coupled climatic and anthropogenic pressures.
Abstract
Northern China and Mongolia are among the core regions most significantly affected by desertification globally. Desertification in these areas not only triggers frequent transboundary dust storms but also severely threatens the ecological security and sustainable development of both countries and the Northeast Asian region. It has become a key bottleneck for achieving the regional SDG 15.3 target of land degradation neutrality. However, existing large-scale desertification monitoring faces limitations, including the lack of unified transboundary standards and the inability of single vegetation indices to comprehensively characterize the complex surface evolution of arid and semi-arid regions. To bridge this gap, a multidimensional desertification assessment framework that integrated machine learning methods and six monitoring indicators, including MSAVI, Albedo, TGSI, EVI, WET, and BSI, were introduced to analyze the spatiotemporal evolution of desertification across northern China and Mongolia from 2000 to 2024, and then the XGBoost–SHAP model was used to quantitatively identify the factors associated with desertification patterns. The main results are as follows: (1) The random forest method obtained the highest classification performance of the degree of desertification compared with the other methods, with an overall accuracy of 87.79% and a Kappa coefficient of 0.84. (2) From 2000 to 2024, desertification of the study area experienced a process of expansion, fluctuation, and reversal, with recovery being the dominant trend overall. Specifically, in northern China, the proportion of non-desertification consistently remained above 27%, while Mongolia was dominated by moderate and heavy desertification. (3) The area of severe desertification significantly decreased, and was largely converted to lighter desertification degrees. (4) Precipitation and livestock density emerged as key predictors of desertification patterns, with their relative contributions varying across ecological domains. The XGBoost–SHAP analysis further revealed nonlinear predictive associations and interactions among climatic and socioeconomic variables, highlighting the spatial heterogeneity of factors associated with desertification. The results provided scientific evidence and methodological support for the construction of the China–Mongolia–Russia Economic Corridor and the regional achievement of the land degradation neutrality (LDN) goal.
1. Introduction
Over the past decades, global environmental sustainability has faced serious challenges under the combined influence of global climate change and intensive human activities [1,2]. Among these challenges, desertification, which is closely associated with dryland degradation, has become one of the most prominent environmental issues [3]. It not only reduces land productivity and threatens the stability of regional ecosystems and biodiversity, but also significantly increases the frequency and scope of extreme disasters such as dust storms. To better address this serious challenge, the United Nations Convention to Combat Desertification (UNCCD) proposed the concept of land degradation neutrality (LDN) in 2015. Subsequently, LDN was incorporated into SDG 15.3 as a specific target for 2030, aiming to establish a world with zero net land degradation [4,5]. Northern China and Mongolia are located in the interior of the Eurasian continent and contain extensive arid and semi-arid regions. Characterized by arid climates, sparse vegetation, and fragile ecosystems, these regions are most severely affected by desertification [6]. Meanwhile, differences in socioeconomic development patterns between the two regions have also partially shaped their desertification dynamics [7,8,9]. This extensive transboundary ecological degradation has markedly increased the frequency and intensity of dust events between China and Mongolia [10]. A representative example is a series of severe dust storm events that affected northern China and other parts of East Asia during the springs from 2021 to 2025 [11,12,13]. These events demonstrate the massive impacts of desertification and highlight the importance of transboundary monitoring. However, most existing studies focus on a single country or specific local regions [14,15]. In contrast, the transboundary region between China and Mongolia exhibits strong natural geographical connectivity, while it shows significant differences in socioeconomic and ecological policies. Long-term comparative studies of desertification dynamics in this region using consistent quantitative criteria remain scarce. Meanwhile, as a key component of the China–Mongolia–Russia Economic Corridor, the ecological stability and land carrying capacity of this region are critical to the ecological security and sustainable development in Northeast Asia. Therefore, scientifically and quantitatively assessing desertification and its drivers is essential for achieving the SDG 15.3 goal of land degradation neutrality (LDN) in the region.
Traditional desertification monitoring methods mainly use a combination of visual interpretation and field surveys to detect the specific manifestations of desertification. However, these methods are inefficient for large-scale regional monitoring, and their interpretation accuracy is easily subject to various subjective factors [16]. By enhancing the accuracy and robustness of desertification assessment in complex regions, remote sensing classification has become a key tool for precise dynamic monitoring [17]. Currently, most studies only rely on a single vegetation indicator, such as the Normalized Difference Vegetation Index (NDVI) or Fractional Vegetation Cover (FVC), for desertification assessment, ignoring soil background and comprising overall accuracy [18,19]. Hence, these methods cannot accurately and comprehensively characterize desertification dynamics in the study area due to the complexity of desertification [20]. To overcome its limitations, researchers have proposed a series of desertification monitoring models that integrate multidimensional features. Among them, feature space models, such as the Albedo-NDVI model and the point-point model, have been widely used [21,22]. However, relying on only two indicators may not adequately capture the complex dynamics of desertification [16]. In recent years, the development of machine learning algorithms has provided a new approach for multi-indicator integrated modeling. By integrating the complementary information provided by multiple indicators, these approaches could reduce soil background interference in sparsely vegetated arid and semi-arid regions and enhance the identification of complex surface types, enabling more accurate and robust assessments of desertification [23,24]. Meanwhile, with the emergence of remote sensing cloud computing platforms, such as Google Earth Engine (GEE), the availability of massive geospatial datasets and efficient cloud-based parallel computing has greatly reduced the computational cost and complexity of long-term and large-scale geoscientific analyses [25,26]. It can provide essential computational support for this study to analyze the spatiotemporal dynamics of desertification in northern China and Mongolia. Therefore, developing a multi-indicator machine learning framework on the Google Earth Engine (GEE) platform is essential for accurately characterizing desertification dynamics across northern China and Mongolia.
Previous studies on desertification-driving mechanisms have primarily relied on statistical methods, such as correlation analysis and the geographical detector model [27]. Although the geographical detector has certain advantages in characterizing spatial stratified heterogeneity, desertification evolution is not a simple linear process. As a result, it is difficult for this method to focus on the driving mechanisms in areas with significant desertification changes. Moreover, they also fail to effectively capture the interactive and synergistic effects among high-dimensional features, while exhibiting significant limitations in identifying the direction of desertification-driving effects. Recently, to address these limitations, many studies have adopted the XGBoost–SHAP model for attribution analysis [28]. This approach not only captures complex nonlinear interactions among high-dimensional features but also provides interpretable insights into predictive contributions, enhancing model transparency and understanding of desertification dynamics [29]. Additionally, desertification is a gradual and continuous process, resulting in transitional features and ambiguous boundaries between adjacent desertification classes. Consequently, to overcome the random noise introduced by mixed pixels and indistinct class boundaries in large-scale attribution modeling, this study introduced an ecological class reduction and reconstruction strategy before conducting XGBoost–SHAP analysis, which can not only identify the direction of individual driving factors, but also capture their nonlinear response characteristics.
Based on what we discussed above, the specific objectives of this study were: (1) map desertification dynamics across northern China and Mongolia using multi-indicator classification framework based on GEE; (2) characterize the spatiotemporal evolution of desertification across northern China and Mongolia from 2000 to 2024; and (3) reveal the multidimensional associations of between desertification degree and natural and anthropogenic factors by quantifying the contributions, effect directions, and nonlinear responses of natural and human factors. The results of this study provide a theoretical basis and data support for ecological security construction in the China–Mongolia–Russia Economic Corridor. In addition, it also offers valuable insights into ecological security management along the Belt and Road Initiative and the realization of the land degradation neutrality (LDN) target.
2. Materials and Methods
2.1. Study Area
The study region is located in the interior of the Eurasian continent (73°46′-135°05′ E, 31°42′-53°33′ N), and plays a vital role in maintaining ecological security in Northeast Asia [30]. The region is characterized by a geomorphological framework dominated by plateaus, basins, and mountain ranges, with elevation generally decreasing from west to east. Most of the area features a typical temperate continental climate, with long and cold winters and short and hot summers. Precipitation is limited and unevenly distributed, generally decreasing from southeast to northwest, with annual totals ranging from 50 to 450 mm across most areas [31]. Mean annual temperature generally ranges from approximately −2 to 15 °C across this region, while annual mean wind speed typically varies between 2 and 5 m s−1, with higher values occurring in the Gobi Desert and the China–Mongolia border region [32,33]. Vegetation types exhibit clear zonal differentiation across the region, transitioning from forests in the southeast to typical steppes, desert steppes, and deserts in the northwest. The dominant soil types include aeolian sandy soils, chestnut soils, and calcic brown soils. Notable differences in ecological governance have emerged across the national border. Since the late twentieth century, in northern China, ecological restoration programs, including grazing exclusion and the conversion of cropland to forests and grasslands, have played an important role in curbing desertification. By contrast, rising market demand for livestock products resulted in the continuous increase in livestock in Mongolia, which increased the risk of grassland degradation in Mongolia [34]. These differences in policy orientation and livelihood strategies have constituted the key social driving factors for desertification dynamics across China and Mongolia.
2.2. Data Source
To accurately monitor desertification dynamics across northern China and Mongolia from 2000 to 2024, the MOD09A1 surface reflectance product (MODIS/061/MOD09A1) with a 500 m resolution was used as the primary remote sensing data source. This dataset was used to extract the spatial distribution of desertification for six periods, including 2000, 2005, 2010, 2015, 2020, and 2024. An approximately five-year interval was adopted to capture long-term regional changes while balancing temporal resolution and computational efficiency. All MODIS images of the growing season (June to September) were filtered on GEE with cloud masking, quality screening and snow cover removing. Subsequently, a median compositing method was applied to reduce the influence of extreme reflectance values and obtain representative growing season surface reflectance for each observation year covering the entire study area. Additionally, the global surface water dataset released by the Joint Research Centre [35] was used to mask and remove water bodies, enhancing the accuracy of desertification mapping. To further analyze the associations of between desertification degree and natural and anthropogenic factors in northern China and Mongolia, a comprehensive driving indicator system was established from three dimensions, including climate, vegetation, and human activities (Table 1). With the exception of static factors including soil properties, the remaining factors were temporally matched to the desertification datasets across the six observation years. When data for a target year were unavailable, data from the nearest available year were used to ensure data completeness. All driving factors were uniformly resampled to a spatial resolution of 500 m and projected into the same coordinate reference system.
Table 1.
Data types and sources of driving factors.
2.3. Methods
2.3.1. Desertification Characterization Indicators
A multidimensional remote sensing indicators system was constructed in this study. The primary indicators included the Modified Soil-Adjusted Vegetation Index (MSAVI), surface albedo (Albedo), the Topsoil Grain Size Index (TGSI), the Enhanced Vegetation Index (EVI), the Tasseled Cap Wetness (WET), and the Bare Soil Index (BSI). These indicators cover information on vegetation, soil, and hydrology, comprehensively reflecting desertification dynamics. The main calculation formulas are as follows:
where Blue, Green, Red, NIR, NIR2, SWIR1, and SWIR2 represent the reflectance of the blue, green, red, near-infrared, second near-infrared first shortwave infrared, and second shortwave infrared bands in the MODIS imagery, respectively.
Albedo = 0.160Red + 0.291Nir + 0.243Blue + 0.116Green
+ 0.112Swir1 + 0.081Swir2 − 0.0015
+ 0.112Swir1 + 0.081Swir2 − 0.0015
TGSI = (Red − Blue)/(Red + Blue + Green)
WET = 0.1147Red + 0.2489NIR + 0.2408Blue + 0.3132Green
− 0.3122NIR2 − 0.6416SWIR1 − 0.5087SWIR2
− 0.3122NIR2 − 0.6416SWIR1 − 0.5087SWIR2
EVI = 2.5 × (NIR − Red)/(NIR + 6Red − 7.5Blue + 1)
BSI = (Red + SWIR1 − NIR − Blue)/(Red + SWIR1 + NIR + Blue)
In addition to vegetation and soil indicators, elevation and slope were introduced as topographic constraints in machine learning models to reduce false desertification classifications caused by mountain shadows or cold alpine climatic conditions.
2.3.2. Desertification Classification Methods
Four machine learning algorithms, including Classification and Regression Tree (CART), Support Vector Machine (SVM), Random Forest (RF), and Minimum Distance (MD), together with the Albedo–MSAVI feature space model, were compared. Then, we evaluated the performance of these five models under complex arid surface conditions to select the optimal approach for extracting high-accuracy desertification information. The Albedo–MSAVI feature space model was built on the physical coupling relationship between decreasing vegetation cover and increasing surface albedo during desertification processes [38]. The evaluated models represent different classification strategies with distinct advantages for desertification mapping. The key parameter settings and preprocessing procedures for each method are summarized in Table 2. Following the comparison of the five classification methods, the best performing classifier was selected for historical desertification mapping. Given the limited availability of historical reference samples, a model-based temporal sample-transfer approach was employed.
Table 2.
Key parameter settings of the desertification classification methods.
2.3.3. Model Performance Assessment Indicators
To ensure the representativeness of sampling points, we first masked the water bodies and used the K-means method to classify the MSAVI across the study area into five classes. Subsequently, 240 points were randomly generated within each class of the MSAVI, resulting in 1180 valid samples after screening. The spatial distribution of the 1180 sampling points is illustrated in Figure 1. According to the classification standards of existing studies, desertification was classified into five levels: none, light, moderate, heavy, severe. The characteristics of the desertified landscapes for each level of desertification are listed in Table 3. Combined with the Google Earth high-resolution images during the same period and historical field survey data, we labeled the 1180 sampling points with five desertification levels. The 2024 reference samples comprised 447 none, 239 light, 171 moderate, 178 heavy, and 145 severe desertification samples. In GEE, the 1180 reference samples were randomly divided into training (70%) and validation (30%) subsets using a random seed of 42. To minimize the influence of sample partitioning on classification performance, random five-fold cross-validation was conducted on the training subset to evaluate the five classification methods.
Figure 1.
Study area and Landscape photographs of desertification. (a) Geographical location and extent of the study area in Northern China and Mongolia; (b) Spatial distribution of elevation based on the digital elevation model (DEM); (c) Spatial distribution of land-cover types, fieldwork points, and sampling points; (d) light; (e) moderate; (f) heavy; (g) severe.
Table 3.
Landscape characteristics of desertification in northern China and Mongolia.
To address the limited availability of temporally matched reference data, we employed a model-based temporal sample-transfer approach for historical desertification classification. Specifically, the selected higher performance classifier trained on the 2024 reference samples was applied to the MODIS imagery of each historical observation year. Predictions with a maximum class probability greater than 0.80 were selected as high-confidence pseudo-labeled samples. Class stratified random sampling was subsequently applied, with a maximum of 800 samples per desertification class for each historical observation year. The resulting pseudo-labeled samples were combined with the candidate stable reference samples identified from the 2024 dataset to construct year-specific training datasets. The corresponding target-year remote sensing features were then extracted to train year-specific selected classifiers. The classifiers were then trained to generate the desertification maps for the historical observation years.
Model performance assessment indicators include Overall Accuracy (OA), the Kappa coefficient, Producer’s Accuracy (PA), and User’s Accuracy (UA). OA represents the proportion of correctly classified samples relative to the total number of samples and provides an overall measure of classification accuracy. The Kappa coefficient ranges from −1 to +1, where higher values indicate better agreement between the classified results and reference data. The Kappa value above 0.80 is generally considered to represent excellent classification performance [39]. PA measures the probability that a ground truth reference is correctly classified. Meanwhile, UA represents the probability that a sample classified into a given category on the map actually belongs to that category [40]. The detailed calculation formulas are as follows:
where k denotes the category, T represents the total number of samples, Nii represents the number of diagonal elements of the confusion matrix, Ni+ represents the sum of the columns of the category, and N+i represents the sum of the rows of the category.
2.3.4. Intensity Analysis
Intensity analysis is a hierarchical framework for quantitatively characterizing the dynamic evolution of land categories [41]. The category level and transition level are two key levels in intensity analysis model. The category level aims to reveal the activity level of each desertification class during a specific period. It determines the dynamic characteristics of each category by comparing its actual change intensity with an assumed uniform change intensity. If the actual intensity exceeds the uniform line, the category is regarded as “active”; otherwise, it is regarded as “dormant.” The calculation formulas are as follows:
where Gti is the gain intensity of category j for time interval [Yt, Yt+1], and Lti is the loss intensity of category i for time interval [Yt, Yt+1].
The transition level is intended to quantitatively describe the directional characteristics and intensity of transitions among desertification categories during a specific period. By comparing the observed transition intensity of each category with the uniform transition intensity, whether the transition of each category is significant can be determined. The formulas are as follows:
where Rtin is the annual intensity of transition from category i to category n during time interval [Yt, Yt+1], and Wtn is the average intensity of all transition from category i to category n during time interval [Yt, Yt+1].
2.3.5. Identification of Desertification-Driving Forces
Extreme Gradient Boosting (XGBoost) was employed to identify the predictive association between environmental and socioeconomic factors and desertification. Its core idea involves iteratively training multiple Classification and Regression Trees (CART), where each newly generated weak learner is fitted to the residuals of the previous model. Ultimately, the optimal prediction result is achieved through weighted accumulation [42]. The modeling dataset comprised fixed spatial samples observed in 2000, 2005, 2010, 2015, 2020, and 2024. For each sampling location and observation year, the corresponding desertification degree was used as the response variable, while environmental and socioeconomic factors from the same location and year were used as predictors. Therefore, the XGBoost model characterized the spatial associations between driving factors and desertification degree across the six study years. A dataset consisting of n spatial samples and m driving factors was used. The formula is as follows:
where K is the total number of decision trees; fk is the expression of the k-th independent decision tree; and xi is the feature vector of driving factors for the i-th spatial sample. represents the functional space containing all possible classification and regression trees.
To overcome the inherent “black-box” feature of XGBoost, SHAP was applied to quantify the contribution of each feature to model predictions through Shapley values, enabling both global and local interpretation of the underlying driving mechanisms [43]. To characterize nonlinear feature responses, SHAP dependence plots were smoothed using locally weighted scatterplot smoothing [44]. Model-derived predictive breakpoints were identified as the feature values at which the LOWESS-smoothed SHAP response crossed zero, with their positions estimated by linear interpolation between adjacent fitted points. The SHAP framework adopted in this study can be expressed as follows:
where represents the predicted model output for the i-th sample and class c; ϕ0,c denotes the baseline model output for class c; ϕi,j,c represents the SHAP value of the j-th feature for the i-th sample and class c, quantifying its contribution to the model prediction; and M is the total number of desertification-driving features used in model training (e.g., precipitation, potential evapotranspiration, and livestock density).
3. Results
3.1. Classification Accuracy of Different Desertification Extraction Models
To compare the class performance of different machine learning models in desertification classification, a random five-fold cross-validation procedure was adopted in this study. Table 4 presents the accuracy of different machine learning and feature space models in recognizing each desertification. Compared with the other models, the RF model achieved the best classification performance, with an overall accuracy of 87.79% and a kappa coefficient of 0.84. For none-desertification identification, its UA and PA was high at 94.54% and 95.48%, respectively. It maintained a high recognition rate across all desertification levels, effectively overcoming the confusion issues typical of traditional models in land cover transition zones. The CART model ranked second, achieving an OA of 86.90%. However, this model showed classification limitations in handling the boundaries of specific desertification levels. In particular, the classification performance for light desertification was relatively weak, with a UA of 78.31%. Next, the PA of the SVM model for recognizing severe desertification was 65.36%, indicating that it had obvious errors especially in identifying severe desertification. Additionally, the OA of both the MD model and the Albedo–MSAVI feature space model were below 80%. The Albedo–MSAVI feature space model recorded the lowest overall accuracy of 72.92%.
Table 4.
Comparison of accuracy assessment of different desertification information extraction models.
To further evaluate the classification performance of the RF classifier under spatially separated conditions, we performed five-fold spatial block cross-validation. The study area was divided into 30 km spatial blocks, and samples from the same block were assigned to the same fold. The RF model achieved a mean overall accuracy of 84.96% and a mean Kappa coefficient of 0.80 across the five spatial folds. Given its highest performance among the other models in the random five-fold cross-validation, together with its evaluated spatial generalization in the spatial block cross-validation, the RF model was selected as the final classifier for mapping desertification degrees across northern China and Mongolia.
3.2. Spatiotemporal Distributions of Desertification in Northern China and Mongolia
3.2.1. Spatial Distributions of Desertification
Based on the RF model, the degree of desertification was extracted from 2000 to 2024 in northern China and Mongolia (Figure 2), which showed the desertification exhibited obviously a severer trend from east to west. Over the past 24 years, non-desertification was mainly located in high-latitude humid mountainous areas, including the Greater Khingan Mountains and Changbai Mountains in northeastern China, the Altai Mountains in northwestern China, and the Khangai Mountains and Khentii Mountains in northern Mongolia. Light desertification was predominantly distributed around the edges of the eastern plains and within the high-latitude buffer zones in the north, including the margins of the Hulunbuir Grassland and the eastern provinces of Mongolia. Moderate desertification was mainly located in the extensive ecological transition zone in the central region, covering areas such as Xilin Gol League, Ulaanqab in northern China, and the margins of the Great Lakes Depression in Mongolia. Heavy desertification was primarily distributed in the peripheral zones surrounding areas of severe desertification and in the central western part of the study area. Severe desertification was mainly observed in the marginal areas surrounding major deserts and Gobi landscapes in the western study area, especially around the Tarim Basin in northern China and the Gobi regions of southern Mongolia.
Figure 2.
The distribution of desertification degree in northern China and Mongolia from 2000 to 2024.
Temporally, desertification in the study area exhibited clear phased changes from 2000 to 2024 (Figure 3a). Although the overall area of each desertification class remained relatively stable, there were significant differences in the internal transitions among different desertification levels between the two countries. In northern China (Figure 3b), the spatial pattern of non-desertification and light desertification remained relatively stable and showed signs of improvement. Over the past 24 years, the proportion of non-desertification consistently remained above 27%. Meanwhile, the proportion of light desertification steadily increased from 9% to 17% in the period of 2000–2024. In contrast, the desertification structure of Mongolia (Figure 3c) showed greater fluctuations, with moderate and heavy desertification consistently dominating throughout the study period. In particular, moderate and heavy desertification expanded in 2015, accounting for 34% and 38% of the total area, respectively. Overall, the ecological barrier regions in eastern parts of the study area remained relatively stable and showed localized improvement over the past 24 years, while the central transitional zone and the interior regions of Mongolia continued to exhibit high ecological vulnerability and remained exposed to substantial risks of land degradation.
Figure 3.
Proportions of desertified area in northern China and Mongolia from 2000 to 2024.
3.2.2. Intensity Changes in Desertification
Based on the category intensity analysis (Figure 4), the overall desertification process exhibited a pattern of expansion, fluctuation, and reversal in northern China and Mongolia from 2000 to 2024. From 2000 to 2005, non-desertification and light and severe desertification lands expanded, while moderate and heavy desertification declined (Figure 4(a1,a2)). The area of severe desertification increased by 0.18 × 10⁵ km2, indicating ecological deterioration in some regions. From 2005 to 2010 (Figure 4(b1,b2)), non-desertification and moderate and severe desertification lands maintained a net increase. The gain intensities of light and moderate desertification lands were the most active, reaching 7.26% and 5.9%, respectively. Concurrently, the loss intensity of heavy desertification land was prominent, showing a continuous transition into other classes. From 2010 to 2015 (Figure 4(c1,c2)), the gain area of light desertification land increased rapidly, with a gain intensity of 9.97%, which was much higher than its loss area. Meanwhile, the areas of moderate and severe desertification lands decreased significantly. From 2015 to 2020 (Figure 4(d1,d2)), the non-desertification and severe desertification categories again exhibited a net increase. Conversely, light, moderate, and heavy desertification lands experienced a net decrease. From 2020 to 2024 (Figure 4(e1,e2)), light desertification land experienced a net increase, while severe desertification land showed a net decrease. These results indicated desertification severity generally decreased and ecological conditions were improved during this period.
Figure 4.
Category intensity analysis for six stages: (a) 2000–2005; (b) 2005–2010; (c) 2010–2015; (d) 2015–2020; (e) 2020–2024; (f) 2000–2024; 1 and 2 represent gains and losses. The bar graph on the left of the zero axis represents the area of the annual gain of each category; the bar graph on the right of the zero axis represents the annual gain intensity of each category. If the intensity bar ends on the left side of the uniform line, the change in that category is relatively dormant during that interval. If the intensity bar extends to the right of the uniform line, the change in the category is relatively active during the time interval.
Table 5 presents the transition level analysis results. The non-desertification and moderate desertification levels for all periods were mainly converted into the light desertification level, and the total area of conversion reached 2.06 × 10⁵ and 5.48 × 10⁵ km2, respectively. Light desertification level mainly was converted into non-desertification land, with a total area of 1.66 × 10⁵ km2. However, from 2005 to 2010, light desertification was mainly converted into moderate desertification land, with a transition area of 2.03 × 10⁵ km2. Heavy desertification land was mainly transformed into moderate desertification land during most periods. Nevertheless, from 2015 to 2020, heavy desertification land was converted into severe desertification land, with a transition area of 1.83 × 10⁵ km2. Overall, the coexistence of substantial transitions toward both higher and lower desertification levels reflected the dynamic feature of desertification evolution, providing further evidence that the regional desertification process underwent successive stages of expansion, fluctuation, and reversal.
Table 5.
Major category conversions and areas (×105 km2) during different periods.
3.3. Factors Associated with Desertification Patterns
Desertification is a gradual and continuous process, resulting in transitional features and ambiguous boundaries between adjacent desertification classes, to overcome the random noise introduced by mixed pixels and indistinct class boundaries in large-scale attribution modeling. Consequently, the five original desertification classes were clustered into three major ecological domains. Specifically, non-desertification and light desertification lands were merged into the stable and light zone. Moderate desertification land was defined as the transitional vulnerable zone. Heavy and severe desertification lands were combined into the severe-degradation zone (Figure 5). The three zones occupied 34.27%, 20.72%, and 35.91% of the study area, respectively, while the remaining 9.10% consisted of water and desert areas. Meanwhile, multicollinearity among the nine explanatory variables was assessed using the variance inflation factor (VIF) before XGBoost model training. All variables exhibited VIF values below 3 (1.113–2.962), indicating no substantial linear multicollinearity. Subsequently, to prevent information leakage arising from repeated observations at the same locations across the six study years, the dataset was partitioned into training (60%), validation (20%), and testing (20%) subsets using a location-based stratified group splitting strategy, with Point_ID as the grouping variable. Subsequently, the Optuna optimization framework was employed to perform automated hyperparameter tuning of the XGBoost model through 50 trials. The model achieved an overall accuracy of 87.16%, a macro-averaged F1-score of 0.84, and a Cohen’s kappa coefficient of 0.80. Consequently, this provided a foundation of a high-performance model for the subsequent global and local SHAP mechanism explanation.
Figure 5.
Spatial distribution of desertification ecological zones in northern China and Mongolia from 2000 to 2024.
3.3.1. Key Factors Associated with Desertification Across Northern China and Mongolia
Desertification dynamics in northern China and Mongolia were affected by nonlinear interactions among soil properties, climate conditions, and local human activities. Furthermore, as the degree of ecological degradation changed, the dominant role of each factor exhibited significantly dynamic evolution at different stages (Figure 6). In the stable and light zone, the five most important factors, ranked by contribution rate, were Preci (42.9%), PET (15.1%), livestock density (11.2%), GDP density (9.3%), and speed (5.9%). In the transitional vulnerable zone, the importance of livestock increased substantially and ranked first among all factors, with a contribution rate of 36.1%. Preci (24.7%) and PET (9.8%) ranked second and third, respectively. In the severe-degradation zone, Preci remained the most important predictor (37.3%), followed by livestock density (23.2%), PET (14.4%), GDP density (9.1%), and sand content (4.7%). These results indicated that natural environmental factors were consistently associated with desertification patterns throughout the desertification evolution process. In contrast, human activities, particularly grazing pressure, may have had a certain influence on ecosystem balance, although their specific effects on transitions between desertification stages remain uncertain.
Figure 6.
SHAP global feature contribution.
SHAP dependence analysis demonstrated substantial differences in the direction and magnitude of feature contributions among ecological domains. In the stable and light zone, higher precipitation values were predominantly associated with positive SHAP values, whereas lower precipitation values generally exhibited negative contributions, indicating a stronger positive contribution to the model prediction for this class under wetter conditions. In contrast, higher PET values tended to exhibit negative SHAP contributions, while higher GDP density values were generally associated with positive contributions. In the transitional vulnerable zone, higher livestock density values were mainly associated with positive SHAP values, whereas lower values exhibited predominantly negative contributions. Preci showed an opposite pattern, with lower precipitation values generally corresponding to positive SHAP contributions and higher values associated with negative contributions. In the severe-degradation zone, lower precipitation and livestock density values were predominantly associated with positive SHAP values, while higher values generally corresponded to negative contributions. Conversely, higher PET values tended to exhibit positive SHAP contributions, indicating a positive association with the model prediction for this class. GDP density generally exhibited negative SHAP contributions at higher values, while wind speed and soil properties showed more heterogeneous contribution patterns across the three domains. Overall, these results indicate that the predictive associations of climatic and socioeconomic variables vary across ecological domains.
3.3.2. Nonlinear Responses and Model-Derived Predictive Breakpoints of Key Factors
Based on Figure 6, SHAP dependence plots of several highly important natural and socioeconomic variables were generated for individual features (Figure 7). The results indicated that both the direction and magnitude of the effects of driving factors exhibited pronounced nonlinear patterns and model-derived predictive breakpoint. In the stable and light zone, SHAP values generally increased with precipitation, changing from negative to positive at approximately 309.65. In the transitional vulnerable zone, precipitation (Preci) showed a non-monotonic relationship, with SHAP values becoming positive at approximately 155.57 and returning to negative values at approximately 375.31. In contrast, Preci exhibited a predominantly decreasing relationship with SHAP values in the severe-degradation zone, crossing zero at approximately 226.17. PET also displayed nonlinear patterns across the three domains. In the stable and light zone, SHAP values increased from negative to positive at approximately 427.9, reached a maximum at intermediate PET values, and subsequently declined, becoming negative again at approximately 848.1. In the transitional vulnerable zone, SHAP values generally decreased with increasing PET, crossing zero at approximately 370.0, followed by a local recovery toward zero around 840.3–908.3. In the severe-degradation zone, PET exhibited a U-shaped relationship, with SHAP values changing from positive to negative at approximately 407.3 and returning to positive values at approximately 965.4. These findings indicate that the predictive contributions of precipitation and PET vary considerably among ecological domains. Among the socioeconomic variables, GDP density and livestock density also exhibited nonlinear predictive relationships. In the stable and light zone, GDP density was generally associated with positive SHAP contributions beyond approximately 0.04, although the magnitude of these contributions gradually decreased at higher values. In contrast, GDP density showed predominantly negative SHAP contributions across much of its observed range in the transitional vulnerable and severe-degradation zones, with sharp declines at low values. Livestock density exhibited more heterogeneous patterns. In the stable and light zone, SHAP contributions remained relatively close to zero across much of the observed livestock range, with a gradual increase toward positive values at higher livestock densities. In the transitional vulnerable zone, SHAP values increased sharply at low livestock densities, crossing zero at approximately 27.36 before gradually stabilizing at positive values. Conversely, in the severe-degradation zone, SHAP values declined rapidly with increasing livestock density, crossing zero at approximately 16.88 and remaining predominantly negative at higher values. These contrasting patterns highlight the spatial heterogeneity of socioeconomic predictors in the fitted model.
Figure 7.
Single feature dependence plots for key factors.
3.3.3. Interaction Effects of Factors Associated with Desertification
SHAP interaction effect analysis showed that the evolution of desertification was primarily affected by interactions among multiple factors rather than individual variables in this region (Figure 8). However, Preci and livestock density exhibited relatively strong main effects in certain ecological domains, suggesting that the relative importance of main and interaction contributions varied among predictors and regions. Specifically, in the stable and light zone, Preci exhibited the largest main effect (1.29) and interaction contribution (1.32), with comparable magnitudes. PET showed a considerably larger interaction contribution (1.08) than its main effect (0.41). Similarly, the interaction contributions of livestock density (0.72), GDP density (0.66), and population density (0.60) exceeded their respective main effects. In the transitional vulnerable zone, livestock density exhibited the largest main effect (0.78), slightly exceeding its interaction contribution (0.72), whereas Preci showed the highest interaction contribution (0.83), followed by livestock density (0.72) and PET (0.66). In the severe-degradation zone, Preci remained the most prominent predictor in terms of both main effect (1.43) and interaction contribution (1.39), followed by livestock density (0.92 and 0.88, respectively). In contrast, PET exhibited a substantially greater interaction contribution (1.23) than its main effect (0.45), while GDP density, sand content, and population density also showed relatively stronger interaction contributions. In conclusion, these results highlight substantial heterogeneity in the relative importance of main and interaction contributions across ecological domains. Preci consistently exhibited strong predictive contributions, while livestock density was particularly prominent in the transitional vulnerable and severe-degradation zones. Meanwhile, PET and several socioeconomic and soil-related variables were characterized by relatively greater interaction contributions.
Figure 8.
Comparison of main and interaction effects. (a) the stable and light zone; (b) the transitional zone; (c) the severe degradation zone.
The SHAP interaction matrix further revealed substantial differences in the magnitude and relative importance of pairwise feature interactions across the three ecological domains (Figure 9). Overall, interactions involving precipitation (Preci), potential evapotranspiration (PET), and livestock density were relatively prominent, although the strengths and rankings of individual feature pairs varied among ecological domains. Specifically, in the stable and light zone, the strongest interaction was observed between Preci and PET, with an interaction value of 0.327, followed by Preci–livestock density (0.240) and Preci–GDP density (0.235). These results indicate that Preci-related interactions accounted for the largest pairwise interaction magnitudes in this domain. In the transitional vulnerable zone, Preci–PET remained the strongest interaction (0.206), followed by livestock density–Preci (0.181) and livestock density-population density (0.144). Compared with the stable and light zone, the interaction magnitudes of Preci–PET and Preci–livestock density were lower, while livestock density remained involved in several of the relatively important interaction pairs. In the severe-degradation zone, Preci–PET exhibited the highest interaction magnitude (0.411), followed by Preci–livestock density (0.276) and livestock density–PET (0.200). The Preci–PET and Preci–livestock density interactions were stronger in this domain than in the other two domains, indicating greater contributions from these specific feature interactions to the corresponding model predictions. In conclusion, these findings demonstrate that Preci-associated interactions are consistently dominant, while the magnitudes of pairwise SHAP interactions exhibit spatial heterogeneity across ecological domains. Although the Preci–PET interaction was the strongest pair in all three domains, livestock-related interactions also made substantial contributions to model predictions, especially within the transitional vulnerable and severe-degradation zones.
Figure 9.
Composite matrix of feature interaction effects.
4. Discussion
4.1. Large-Scale Desertification Information Extraction and Indicator Selection
Northern China and Mongolia are characterized by extensive arid and semi-arid landscapes with strong spatial connectivity of desertification processes. However, accurately extracting desertification information in such large-scale regions relies on scientific and effective remote sensing monitoring methods and robust indicators. It is difficult to achieve high-precision, large-scale desertification information extraction using only traditional field surveys or single-scene image processing [16]. Meanwhile, the selection of appropriate indicators is fundamental to the construction of reliable desertification monitoring models. Therefore, based on the GEE platform, this study developed a multidimensional indicator framework integrating MSAVI, Albedo, TGSI, EVI, WET, and BSI. By exploiting complementary information on vegetation, soil, and moisture conditions, the framework effectively reduces soil background effects and improves the discrimination of desertification severity across heterogeneous landscapes. Specifically, MSAVI and EVI effectively reduced spectral interference from exposed soil backgrounds and enhanced sensitivity to sparse vegetation, while TGSI and Albedo effectively captured soil coarsening and surface radiation changes associated with land degradation [45,46,47]. Moreover, northern China and Mongolia cover a vast area with significant internal geographical differences. We also introduced elevation and slope as topographical environmental constraint features. This provided an underlying surface foundation for accurately extracting desertification information. The integration of vegetation, soil, moisture, and topographic information provided complementary insights into desertification processes, effectively reducing spectral confusion and improving the discrimination and robustness of desertification classification across the study region. The extensive geographic coverage and environmental heterogeneity of northern China and Mongolia present major challenges for desertification mapping. In complex transitional landscapes, adjacent desertification classes may exhibit similar soil and vegetation spectral characteristics, making them difficult to distinguish. Consequently, traditional feature space models, such as Albedo–MSAVI and TGSI–MSAVI feature space models, may not adequately capture subtle differences between desertification classes, thereby limiting their classification accuracy [38,48]. Among these evaluated methods, RF achieved the highest classification accuracy. Benefiting from bootstrap aggregation and random feature selection, RF can effectively capture complex nonlinear relationships while reducing the risk of overfitting [49]. Unlike CART, which relies on a single decision tree structure, RF integrates the predictions of numerous trees, resulting in greater stability and generalization capability. Furthermore, compared with SVM, RF is less sensitive to parameter settings and can better accommodate highly heterogeneous environmental conditions across large geographic regions. Conversely, MD assumes relatively simple statistical separability among classes and is less effective in representing the nonlinear characteristics of desertification processes. The superior performance of RF also reflects its ability to exploit complementary information from multiple indicators simultaneously. By integrating vegetation, soil, moisture, and topographic, variables, the model captures the complex interactions underlying desertification dynamics that are difficult to represent using low-dimensional approaches. Consequently, the model achieved an overall accuracy of 87.79% and a kappa coefficient of 0.84, indicating its suitability for long-term and large-scale monitoring of desertification dynamics in arid environments. By integrating multidimensional indicators into machine learning approaches on the GEE platform, this study improved the accuracy and robustness of large-scale desertification mapping.
4.2. Differences in Desertification Evolution Between Northern China and Mongolia
Despite sharing similar geographical and climatic backgrounds, northern China and Mongolia exhibited markedly divergent desertification trajectories over the past 25 years. Based on the research results, from 2000 to 2005, desertification dynamics exhibited considerable spatial heterogeneity across northern China and Mongolia, with improvements observed in some regions and deterioration occurring in others, which is consistent with previous studies [50]. From 2005 to 2020, northern China exhibited signs of ecological improvement, as reflected by a reduction in heavy and an expansion of non-desertified land. This improvement coincided with the implementation of a series of ecological restoration strategies, including the Three-North Shelterbelt Program, the Beijing–Tianjin Sand Source Control Project, and the grazing regulation measures [51,52]. Therefore, the observed improvement may be associated with the combined influences of ecological restoration measures and climatic conditions. Although extreme drought events after 2020 caused localized land degradation in northern China, the overall recovery trend remained stable. By contrast, Mongolia exhibited more complex desertification dynamics, with fluctuations across different desertification categories and localized deterioration despite improvements in some areas. Although the total desertified area declined slightly after 2005, desertification hotspots gradually shifted northward after 2015, with increasing degradation observed in parts of northeastern Mongolia. This trend was largely associated with increasing grazing pressure during the country’s economic transition period, which accelerated vegetation degradation in ecologically vulnerable areas [53]. In addition, extensive mining activities may further damage fragile soil surface and intensify ecological imbalance across the region [54,55]. In summary, the differences in desertification evolution between northern China and Mongolia suggest that land management policies and human activities may have contributed to regional differences alongside climatic factors. The experience of northern China, particularly in ecological restoration, adaptive grazing management, and targeted policy implementation, may provide a valuable reference for Mongolia and help Mongolia formulate adaptive desertification control strategies and achieve the United Nations goal of land degradation neutrality.
4.3. Factors Associated with Desertification Patterns in Northern China and Mongolia
The XGBoost–SHAP framework employed in this study provided distinct advantages over the traditional geodetector approach in handling the complex nonlinear relationship underlying desertification dynamics in northern China and Mongolia. The results further indicate that climate change and human activities are the major drivers of desertification dynamics, consistent with previous studies [56]. However, the influence of these drivers varies across different temporal and spatial contexts. Among natural driving factors, climate warming plays a dominant role in shaping desertification patterns. The Mongolian Plateau exhibited a significant warming and drying trend, with mean annual temperatures increasing at a rate of approximately 0.03–0.05 °C yr−1 [34]. The process reduced vegetation cover and weakened surface resistance to wind erosion, thereby accelerating land degradation [57]. However, precipitation remains a critical constraint on the spatial distribution of desertification across northern China and Mongolia. Areas receiving relatively abundant rainfall, particularly eastern northern China and northern Mongolia, generally exhibited lower levels of desertification. In contrast, the inland regions of the western parts of northern China and southwestern Mongolia were increasingly exposed to the combined effects of declining precipitation and rising temperatures, resulting in intensified land degradation and a gradual shift in desertification hotspots toward these arid regions. These results indicate that climatic conditions establish the fundamental pattern of regional desertification. Human activities further influence regional differences in desertification trajectories. Northern China and Mongolia exhibit systematic differences in land ownership, grazing policies, and ecological governance, which has led to the differentiated evolution of desertification between the two regions. Since the economic transition in the 1990s, Mongolia has experienced a rapid increase in livestock numbers, rising from approximately 25 million to nearly 70 million head, resulting in intensified grazing pressure and widespread grassland degradation [58,59]. In contrast, many regions of northern China, particularly Inner Mongolia, have implemented comprehensive grassland management measures, including grazing bans, seasonal grazing exclusion, and rotational grazing systems. These measures have enhanced vegetation recovery and reduced wind erosion, contributing to the reversal of desertification trends in many areas [7]. The relative importance of climatic and anthropogenic factors also varies with the environmental characteristics of different ecological domains. The stable and light zone is generally characterized by relatively continuous vegetation cover, limited soil exposure, and comparatively favorable moisture conditions, indicating a less degraded ecological environment. The transitional vulnerable zone exhibits more heterogeneous ecological conditions, characterized by fragmented vegetation, partially bare soils, and potentially varying livestock grazing pressure, resulting in more complex associations between climatic and anthropogenic factors. In contrast, the severe-degradation zone is typically characterized by sparse vegetation, extensive bare surfaces, and more pronounced moisture limitations, where climatic variability, wind conditions, and soil properties may be associated with distinct patterns of desertification. Overall, the results reveal complex nonlinear predictive associations between desertification patterns and climatic and socioeconomic factors across northern China and Mongolia, with the relative importance and interaction contributions of these factors varying substantially across ecological domains. Key predictors, especially precipitation, livestock density, and potential evapotranspiration (PET), show heterogeneous nonlinear relationships and model-derived predictive breakpoints, offering valuable insights into the spatial variability of desertification patterns and supporting ecological assessment and land management strategies.
4.4. Limitations and Uncertainties
This study constructs a reliable and efficient large-scale regional desertification assessment framework and identifies their associations with environmental and anthropogenic factors across northern China and Mongolia. However, there are some limitations that need to be addressed. The 500 m MODIS data provide consistent observations across the extensive study region, making them suitable for characterizing broad-scale desertification patterns. However, mixed spectral responses from vegetation and exposed soil may increase classification uncertainty in heterogeneous landscapes, particularly when distinguishing adjacent desertification classes in grassland–desert transition zones. Similarly, regarding temporal resolution, the approximately five-year observation interval was adopted to capture medium- to long-term desertification changes. Desertification is a complex process involving vegetation degradation, soil deterioration, and interactions between climatic and anthropogenic factors, with some changes accumulating over multiple years. Meanwhile, considering the extensive geographical coverage of our study area and the computational requirements of large-scale remote sensing classification, an approximately five-year observation interval provides a practical approach for characterizing broad regional patterns of long-term desertification, consistent with previous studies in northern China and Mongolia [60,61,62,63]. Although interannual climatic variability and extreme events may cause short-term disturbances, some of their ecological effects can persist for several years and may therefore be reflected in subsequent observations [64]. Conversely, ecosystems may recover from certain short-term disturbances, causing their temporary effects to diminish before the next observation. Consequently, while the six temporal snapshots provide a reasonable basis for assessing broad regional patterns and medium- to long-term changes, they cannot fully capture short-term fluctuations or the complete degradation and recovery processes occurring between observation years. Future research incorporating annual observations could provide a more detailed understanding of short-term variability and the temporal persistence of desertification processes. Second, the limited availability of historical reference data presents challenges for long-term desertification mapping. To address this issue, a temporal sample-transfer approach integrating the 2024 reference samples, high-confidence pseudo-labels, and historical remote sensing features was adopted. Although this approach facilitates historical classification, changes in land-surface characteristics over time may introduce some uncertainty into the transferred samples, affecting the resulting maps. Therefore, independent reference datasets could be incorporated in future studies to further assess model generalization across different regions and historical periods. Finally, the XGBoost–SHAP framework provides valuable insights into the relative predictive importance and nonlinear relationships of factors associated with desertification. Although variance inflation factor (VIF) analysis indicated low linear multicollinearity, potential nonlinear dependencies among explanatory variables may still influence SHAP contributions. Moreover, SHAP values describe model-based associations rather than direct causal relationships. Therefore, the identified feature interactions and predictive breakpoints should not be interpreted as independently verified ecological mechanisms or thresholds. Further integration of ecological observations and complementary analytical approaches could improve the interpretation of these relationships.
5. Conclusions
This study developed a multidimensional desertification assessment framework by integrating long-term MODIS imagery, machine learning algorithms, intensity analysis, and the XGBoost–SHAP model on the GEE platform to assess the spatiotemporal dynamics and the factors associated with desertification patterns across northern China and Mongolia from 2000 to 2024. Among the evaluated approaches, the RF model achieved the highest classification accuracy for desertification classification, with an overall accuracy of 87.79% and a Kappa coefficient of 0.84. The results revealed that desertification of the study area experienced a process of expansion, fluctuation, and reversal, with recovery being the dominant trend overall. Specifically, desertification displayed a clear pattern of increasing severity from east to west. The area of severe desertification declined significantly and was mainly transformed into lower desertification classes. Moreover, desertification patterns were associated with complex nonlinear relationships and interactions among climatic and socioeconomic factors, with precipitation, livestock density, and potential evapotranspiration (PET) emerging as key predictors whose relative contributions varied across ecological domains. The differences in desertification patterns between northern China and Mongolia may also be associated with variations in ecological restoration policies, land management practices, and grazing intensity. These findings provide scientific support for regional desertification assessment and sustainable land management in the arid and semi-arid regions of East Asia.
Author Contributions
Y.L.: Writing—original draft, Writing—review and editing, Methodology, Formal analysis. H.D.: Writing—review and editing, Methodology, Funding acquisition. Y.F.: Writing—review and editing, Investigation, Resources. S.Y.: Formal analysis, Validation, Visualization. All authors have read and agreed to the published version of the manuscript.
Funding
This work was financially supported by the National Natural Science Foundation of China (grant number: 42271016).
Data Availability Statement
Data will be made available on reasonable request.
Acknowledgments
The authors thank the reviewers and editorial team for their careful review and valuable feedback. We also appreciate the time and effort they devoted to improving this manuscript.
Conflicts of Interest
The authors declare no conflicts of interest.
References
- Rabiei, J.; Khademi, M.S.; Bagherpour, S.; Ebadi, N.; Karimi, A.; Ostad-Ali-Askari, K. Investigation of Fire Risk Zones Using Heat-Humidity Time Series Data and Vegetation. Appl. Water Sci. 2022, 12, 216. [Google Scholar] [CrossRef] [Scilit]
- Shobande, O.A.; Ogbeifun, L.; Tiwari, A.K. Re-Evaluating the Impacts of Green Innovations and Renewable Energy on Carbon Neutrality: Does Social Inclusiveness Really Matters? J. Environ. Manag. 2023, 336, 117670. [Google Scholar] [CrossRef] [Scilit] [PubMed]
- Burrell, A.L.; Evans, J.P.; De Kauwe, M.G. Anthropogenic Climate Change Has Driven over 5 Million Km2 of Drylands towards Desertification. Nat. Commun. 2020, 11, 3853. [Google Scholar] [CrossRef] [Scilit] [PubMed]
- Cowie, A.L.; Orr, B.J.; Castillo Sanchez, V.M.; Chasek, P.; Crossman, N.D.; Erlewein, A.; Louwagie, G.; Maron, M.; Metternicht, G.I.; Minelli, S.; et al. Land in Balance: The Scientific Conceptual Framework for Land Degradation Neutrality. Environ. Sci. Policy 2018, 79, 25–35. [Google Scholar] [CrossRef] [Scilit]
- Debonne, N.; van Vliet, J.; Metternicht, G.; Verburg, P. Agency Shifts in Agricultural Land Governance and Their Implications for Land Degradation Neutrality. Glob. Environ. Change 2021, 66, 102221. [Google Scholar] [CrossRef] [Scilit]
- Wang, S.; Yu, Y.; Zhang, X.-X.; Lu, H.; Zhang, X.-Y.; Xu, Z. Weakened Dust Activity over China and Mongolia from 2001 to 2020 Associated with Climate Change and Land-Use Management. Environ. Res. Lett. 2021, 16, 124056. [Google Scholar] [CrossRef] [Scilit]
- Bryan, B.A.; Gao, L.; Ye, Y.; Sun, X.; Connor, J.D.; Crossman, N.D.; Stafford-Smith, M.; Wu, J.; He, C.; Yu, D.; et al. China’s Response to a National Land-System Sustainability Emergency. Nature 2018, 559, 193–204. [Google Scholar] [CrossRef] [Scilit] [PubMed]
- Li, J.; Xu, B.; Yang, X.; Qin, Z.; Zhao, L.; Jin, Y.; Zhao, F.; Guo, J. Historical Grassland Desertification Changes in the Horqin Sandy Land, Northern China (1985–2013). Sci. Rep. 2017, 7, 3009. [Google Scholar] [CrossRef] [Scilit] [PubMed]
- Sternberg, T. Environmental Challenges in Mongolia’s Dryland Pastoral Landscape. J. Arid Environ. 2008, 72, 1294–1304. [Google Scholar] [CrossRef] [Scilit]
- Qiu, P.; Guan, X.; Huang, J.; Da, P.; Ding, Y.; Jin, Z. A Transboundary Air Quality Co-Benefit of Ecological Restoration in Mongolia. J. Geophys. Res. Atmos. 2026, 131, 7. [Google Scholar] [CrossRef] [Scilit]
- Chen, S.; Zhao, D.; Huang, J.; He, J.; Chen, Y.; Chen, J.; Bi, H.; Lou, G.; Du, S.; Zhang, Y.; et al. Mongolia Contributed More than 42% of the Dust Concentrations in Northern China in March and April 2023. Adv. Atmos. Sci. 2023, 40, 1549–1557. [Google Scholar] [CrossRef] [Scilit]
- Filonchyk, M.; Peterson, M.P.; Zhang, L.; Yan, H. An Analysis of Air Pollution Associated with the 2023 Sand and Dust Storms over China: Aerosol Properties and PM10 Variability. Geosci. Front. 2024, 15, 101762. [Google Scholar] [CrossRef] [Scilit]
- Xing, Y.; Liu, B.; Wagner, L.E.; Qu, J. Source Shifting and Contributions to Central East Asia Dust Events during 2000–2023. Sci. China Earth Sci. 2025, 68, 3804–3816. [Google Scholar] [CrossRef] [Scilit]
- Meng, X.; Gao, X.; Li, S.; Li, S.; Lei, J. Monitoring Desertification in Mongolia Based on Landsat Images and Google Earth Engine from 1990 to 2020. Ecol. Indic. 2021, 129, 107908. [Google Scholar] [CrossRef] [Scilit]
- Shao, W.; Li, L.; Yan, M.; Meng, Z.; Zhang, L.; Zhang, Q.; Chen, Y. Thirty Years’ Spatio-Temporal Evolution of Desertification Degrees and Driving Factors in Turpan–Hami Basin, Xinjiang, China. Ecol. Indic. 2024, 166, 112484. [Google Scholar] [CrossRef] [Scilit]
- Duan, H.; Wang, T.; Xue, X.; Yan, C. Dynamic Monitoring of Aeolian Desertification Based on Multiple Indicators in Horqin Sandy Land, China. Sci. Total Environ. 2019, 650, 2374–2388. [Google Scholar] [CrossRef] [Scilit] [PubMed]
- Wang, Z.; Shi, Y.; Zhang, Y. Review of Desert Mobility Assessment and Desertification Monitoring Based on Remote Sensing. Remote Sens. 2023, 15, 4412. [Google Scholar] [CrossRef] [Scilit]
- Bezerra, F.G.S.; Aguiar, A.P.D.; Alvala, R.C.S.; Giarolla, A.; Bezerra, K.R.A.; Lima, P.V.P.S.; do Nascimento, F.R.; Arai, E. Analysis of Areas Undergoing Desertification, Using EVI2 Multi-Temporal Data Based on MODIS Imagery as Indicator. Ecol. Indic. 2020, 117, 106579. [Google Scholar] [CrossRef] [Scilit]
- Wei, H.; Wang, J.; Cheng, K.; Li, G.; Ochir, A.; Davaasuren, D.; Chonokhuu, S. Desertification Information Extraction Based on Feature Space Combinations on the Mongolian Plateau. Remote Sens. 2018, 10, 1614. [Google Scholar] [CrossRef] [Scilit]
- Zhou, Y.; Hu, Z.; Geng, Q.; Ma, J.; Liu, J.; Wang, M.; Wang, Y. Monitoring and Analysis of Desertification Surrounding Qinghai Lake (China) Using Remote Sensing Big Data. Environ. Sci. Pollut. Res. 2022, 30, 17420–17436. [Google Scholar] [CrossRef] [Scilit] [PubMed]
- Pickup, G.; Chewings, V.H.; Nelson, D.J. Estimating Changes in Vegetation Cover over Time in Arid Rangelands Using Landsat MSS Data. Remote Sens. Environ. 1993, 43, 243–263. [Google Scholar] [CrossRef] [Scilit]
- Wu, R.; Yiliqi; Er, D.; Yang, C.-Y.; Zhao, M.; Zhou, R.-P. Study on Desertification in Acukeerqin Banner Based on Albedo-NDVI Feature Space, ENVI, GIS and Computer. In Proceedings of the Communications, Signal Processing, and Systems; Liang, Q., Mu, J., Jia, M., Wang, W., Feng, X., Zhang, B., Eds.; Springer: Singapore, 2018; Volume 463, pp. 449–455. [Google Scholar] [CrossRef] [Scilit]
- Meng, X.; Li, S.; Akhmadi, K.; He, P.; Dong, G. Trends, Turning Points, and Driving Forces of Desertification in Global Arid Land Based on the Segmental Trend Method and SHAP Model. GISci. Remote Sens. 2024, 61, 2367806. [Google Scholar] [CrossRef] [Scilit]
- Xi, L.; Qi, Z.; Feng, Y.; Cao, X.; Zou, J.; Han, J. An Explainable Machine Learning Approach (SHAP) to Assessing Desertification Risk and Its Drivers in the Ring-Tarim Basin, 1990–2020. Environ. Impact Assess. Rev. 2026, 118, 108309. [Google Scholar] [CrossRef] [Scilit]
- Karra, K.; Kontgis, C.; Statman-Weil, Z.; Mazzariello, J.C.; Mathis, M.; Brumby, S.P. Global Land Use/Land Cover with Sentinel 2 and Deep Learning. In Proceedings of the 2021 IEEE International Geoscience and Remote Sensing Symposium, Brussels, Belgium, 11–16 July 2021; IEEE: Piscataway, NJ, USA, 2021; pp. 4704–4707. [Google Scholar] [CrossRef] [Scilit]
- Potapov, P.; Turubanova, S.; Hansen, M.C.; Tyukavina, A.; Zalles, V.; Khan, A.; Song, X.-P.; Pickens, A.; Shen, Q.; Cortez, J. Global Maps of Cropland Extent and Change Show Accelerated Cropland Expansion in the Twenty-First Century. Nat. Food 2021, 3, 19–28. [Google Scholar] [CrossRef] [Scilit] [PubMed]
- Zhao, S.; Ding, J.; Wang, J.; Ge, X.; Han, L.; Wang, R.; Qin, S. Central Asia’s Desertification Challenge: Recent Trends and Drives Explored with Google Earth Engine. J. Clean. Prod. 2024, 460, 142595. [Google Scholar] [CrossRef] [Scilit]
- Li, M.; Avirmed, B.; Bayanmunkhd, G.; Liu, Y.; Wang, Y.; Yang, X.; Zhang, Y.; Yu, Q. Assessment, Driving Mechanism Identification and Future Scenario Projection of Desertification Vulnerability in the Mongolian Plateau: An Integrated Study Using Multi-Source Data and Machine Learning. Ecol. Indic. 2025, 180, 114340. [Google Scholar] [CrossRef] [Scilit]
- Batunacun; Wieland, R.; Lakes, T.; Nendel, C. Using Shapley Additive Explanations to Interpret Extreme Gradient Boosting Predictions of Grassland Degradation in Xilingol, China. Geosci. Model Dev. 2021, 14, 1493–1510. [Google Scholar] [CrossRef] [Scilit]
- Lv, Z.; Li, S.; Fan, J.; Liu, G.; Wang, H.; Meng, X. Natural restoration potential of vegetation in Mongolia. J. Desert Res. 2021, 41, 192–201. [Google Scholar] [CrossRef]
- Na, Y.; Qin, F.; Jia, G.; Yang, J.; Bao, Y. Change trend and regional differentiation of precipitation over the Mongolian Plateau in recent 54 years. Arid Land Geogr. 2019, 42, 1253–1261. [Google Scholar] [CrossRef]
- Guan, Q.; Sun, X.; Yang, J.; Pan, B.; Zhao, S.; Wang, L. Dust Storms in Northern China: Long-Term Spatiotemporal Characteristics and Climate Controls. J. Clim. 2017, 30, 6683–6700. [Google Scholar] [CrossRef] [Scilit]
- Han, J.; Dai, H.; Gu, Z. Sandstorms and Desertification in Mongolia, an Example of Future Climate Events: A Review. Environ. Chem. Lett. 2021, 19, 4063–4073. [Google Scholar] [CrossRef] [Scilit] [PubMed]
- Wang, J.; Wei, H.; Cheng, K.; Ochir, A.; Davaasuren, D.; Li, P.; Chan, F.K.S.; Nasanbat, E. Spatio-Temporal Pattern of Land Degradation from 1990 to 2015 in Mongolia. Environ. Dev. 2020, 34, 100497. [Google Scholar] [CrossRef] [Scilit]
- Pekel, J.-F.; Cottam, A.; Gorelick, N.; Belward, A.S. High-Resolution Mapping of Global Surface Water and Its Long-Term Changes. Nature 2016, 540, 418–422. [Google Scholar] [CrossRef] [Scilit] [PubMed]
- Kummu, M.; Kosonen, M.; Masoumzadeh Sayyar, S. Downscaled Gridded Global Dataset for Gross Domestic Product (GDP) per Capita PPP over 1990–2022. Sci. Data 2025, 12, 178. [Google Scholar] [CrossRef] [Scilit] [PubMed]
- Chen, Z.; Liao, L.; Wang, C.; Shi, K.; Yu, B. The 1992–2024 Global NPP-VIIRS-like Nighttime Light Annual Data from Deep Learning Super-Resolution Reconstruction. J. Remote Sens. 2026, 6, 0874. [Google Scholar] [CrossRef] [Scilit]
- Alghababsheh, A. A Multi-Scale Assessment of Desertification Severity in the Eastern Mediterranean Region Based on Albedo-MSAVI Feature Space. Environ. Monit. Assess. 2024, 196, 1163. [Google Scholar] [CrossRef] [Scilit] [PubMed]
- Landis, J.; Koch, G. Measurement of Observer Agreement for Categorical Data. Biometrics 1977, 33, 159–174. [Google Scholar] [CrossRef] [Scilit]
- Fan, Z.; Li, J.; Yue, T.; Zhou, X.; Lan, A. Scenarios of Land Cover in Karst Area of Southwestern China. Environ. Earth Sci. 2015, 74, 6407–6420. [Google Scholar] [CrossRef] [Scilit]
- Na, R.; Du, H.; Na, L.; Shan, Y.; He, H.S.; Wu, Z.; Zong, S.; Yang, Y.; Huang, L. Spatiotemporal Changes in the Aeolian Desertification of Hulunbuir Grassland and Its Driving Factors in China during 1980-2015. Catena 2019, 182, 104123. [Google Scholar] [CrossRef] [Scilit]
- Chen, T.; Guestrin, C. XGBoost: A Scalable Tree Boosting System. In Proceedings of the 22nd ACM SIGKDD International Conference on Knowledge Discovery and Data Mining, San Francisco, CA, USA, 13–17 August 2016; Association for Computing Machinery: New York, NY, USA, 2016; pp. 785–794. [Google Scholar] [CrossRef] [Scilit]
- Antonini, A.S.; Tanzola, J.; Asiain, L.; Ferracutti, G.R.; Castro, S.M.; Bjerg, E.A.; Ganuza, M.L. Machine Learning Model Interpretability Using SHAP Values: Application to Igneous Rock Classification Task. Appl. Comput. Geosci. 2024, 23, 100178. [Google Scholar] [CrossRef] [Scilit]
- Cleveland, W.S. Robust Locally Weighted Regression and Smoothing Scatterplots. J. Am. Stat. Assoc. 1979, 74, 829–836. [Google Scholar] [CrossRef]
- Liang, S. Narrowband to Broadband Conversions of Land Surface Albedo I: Algorithms. Remote Sens. Environ. 2001, 76, 213–238. [Google Scholar] [CrossRef] [Scilit]
- Liu, Q.; Liu, G.; Huang, C. Monitoring Desertification Processes in Mongolian Plateau Using MODIS Tasseled Cap Transformation and TGSI Time Series. J. Arid Land 2018, 10, 12–26. [Google Scholar] [CrossRef] [Scilit]
- Qi, J.; Chehbouni, A.; Huete, A.; Kerr, Y.; Sorooshian, S. A Modified Soil Adjusted Vegetation Index. Remote Sens. Environ. 1994, 48, 119–126. [Google Scholar] [CrossRef] [Scilit]
- Qian, K.; Yuan, Q.; Han, J.; Leng, R.; Wang, Y.; Zhu, K.; Lin, S.; Ren, P. A Remote Sensing Monitoring Method for Alpine Grasslands Desertification in the Eastern Qinghai-Tibetan Plateau. J. Mt. Sci. 2020, 17, 1423–1437. [Google Scholar] [CrossRef] [Scilit]
- Belgiu, M.; Dragut, L. Random Forest in Remote Sensing: A Review of Applications and Future Directions. ISPRS J. Photogramm. Remote Sens. 2016, 114, 24–31. [Google Scholar] [CrossRef] [Scilit]
- Wang, Y.; Guo, E.; Kang, Y.; Ma, H. Assessment of Land Desertification and Its Drivers on the Mongolian Plateau Using Intensity Analysis and the Geographical Detector Technique. Remote Sens. 2022, 14, 6365. [Google Scholar] [CrossRef] [Scilit]
- Jia, X.; Fu, B.; Feng, X.; Hou, G.; Liu, Y.; Wang, X. The Tradeoff and Synergy between Ecosystem Services in the Grain-for-Green Areas in Northern Shaanxi, China. Ecol. Indic. 2014, 43, 103–113. [Google Scholar] [CrossRef] [Scilit]
- Wu, Z.; Wu, J.; Liu, J.; He, B.; Lei, T.; Wang, Q. Increasing Terrestrial Vegetation Activity of Ecological Restoration Program in the Beijing-Tianjin Sand Source Region of China. Ecol. Eng. 2013, 52, 37–50. [Google Scholar] [CrossRef] [Scilit]
- Li, S.G.; Harazono, Y.; Oikawa, T.; Zhao, H.L.; He, Z.Y.; Chang, X.L. Grassland Desertification by Grazing and the Resulting Micrometeorological Changes in Inner Mongolia. Agric. For. Meteorol. 2000, 102, 125–137. [Google Scholar] [CrossRef] [Scilit]
- Sodnomdarjaa, E.; Lehmkuhl, F.; Karthe, D.; Knippertz, M.; Ganbat, G. Assessment of Soil Loss Using RUSLE around Mongolian Mining Sites: A Case Study on Soil Erosion at the Baganuur Lignite and Erdenet Copper-Molybdenum Mines. Environ. Earth Sci. 2023, 82, 230. [Google Scholar] [CrossRef] [Scilit]
- Zhang, L.; Zhai, Z.; Zhou, Y.; Liu, S.; Wang, L. The Landscape Pattern Evolution of Typical Open-Pit Coal Mines Based on Land Use in Inner Mongolia of China during 20 Years. Sustainability 2022, 14, 9590. [Google Scholar] [CrossRef] [Scilit]
- Ren, X.; Dong, Z.; Hu, G.; Zhang, D.; Li, Q. A GIS-Based Assessment of Vulnerability to Aeolian Desertification in the Source Areas of the Yangtze and Yellow Rivers. Remote Sens. 2016, 8, 626. [Google Scholar] [CrossRef] [Scilit]
- Filei, A.A.; Slesarenko, L.A.; Boroditskaya, A.V.; Mishigdorj, O. Analysis of Desertification in Mongolia. Russ. Meteorol. Hydrol. 2018, 43, 599–606. [Google Scholar] [CrossRef] [Scilit]
- Liang, X.; Li, P.; Wang, J.; Chan, F.K.S.; Togtokh, C.; Ochir, A.; Davaasuren, D. Research Progress of Desertification and Its Prevention in Mongolia. Sustainability 2021, 13, 6861. [Google Scholar] [CrossRef] [Scilit]
- Saizen, I.; Maekawa, A.; Yamamura, N. Spatial Analysis of Time-Series Changes in Livestock Distribution by Detection of Local Spatial Associations in Mongolia. Appl. Geogr. 2010, 30, 639–649. [Google Scholar] [CrossRef] [Scilit]
- Wu, G.; Tian, J.; Feng, X.; Ren, Y.; Bao, W.; He, C.; Yu, T.; Wu, J. Spatiotemporal Variation and Driving Factors of Ecological Vulnerability in Arid and Semi-Arid Regions: A Case Study of Ningxia, China. Catena 2025, 259, 109378. [Google Scholar] [CrossRef] [Scilit]
- Xifeng, J.; Junling, H.; Qi, Z.; Saitiniyazi, A. Evolution Pattern and Driving Mechanism of Eco-Environmental Quality in Arid Oasis Belt—A Case Study of Oasis Core Area in Kashgar Delta. Ecol. Indic. 2023, 154, 110866. [Google Scholar] [CrossRef] [Scilit]
- Ullah, H.; Wang, X.; Ali, S.; Kong, D.; Wang, X.; Yang, S.; Zhang, J. Significant Spatiotemporal Shifts of Land Cover over the Mongolian Plateau through the Past Three Decades. Sci. Total Environ. 2025, 999, 180364. [Google Scholar] [CrossRef] [Scilit] [PubMed]
- Zhu, H.; Li, J.; Xiao, H.; Pan, Q.; Xin, Z.; Wang, S. Dynamics of Oases in East Asia in the 21st Century: Insights from China and Mongolia. Ecol. Indic. 2026, 187, 114955. [Google Scholar] [CrossRef] [Scilit]
- Hoover, D.L.; Pfennigwerth, A.A.; Duniway, M.C. Drought Resistance and Resilience: The Role of Soil Moisture–Plant Interactions and Legacies in a Dryland Ecosystem. J. Ecol. 2021, 109, 3280–3294. [Google Scholar] [CrossRef] [Scilit]
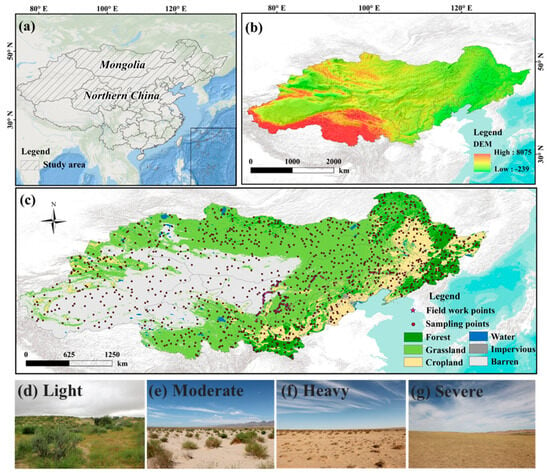
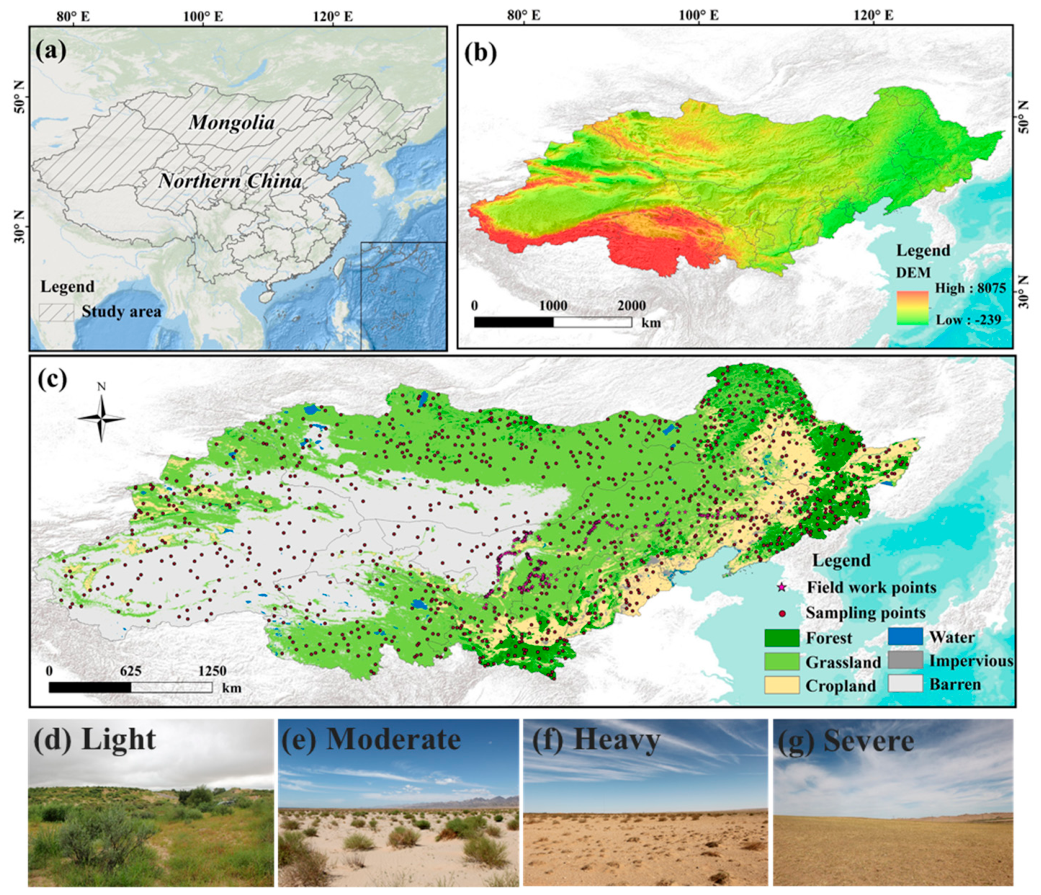
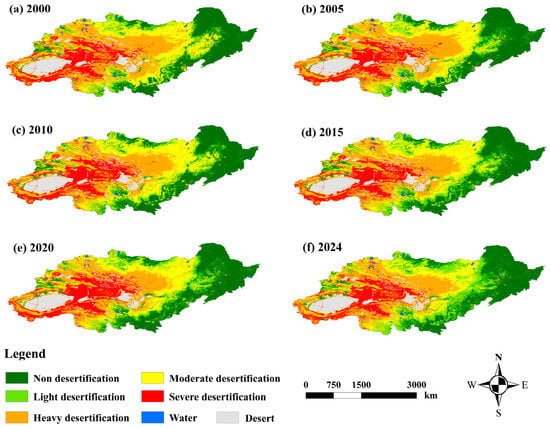
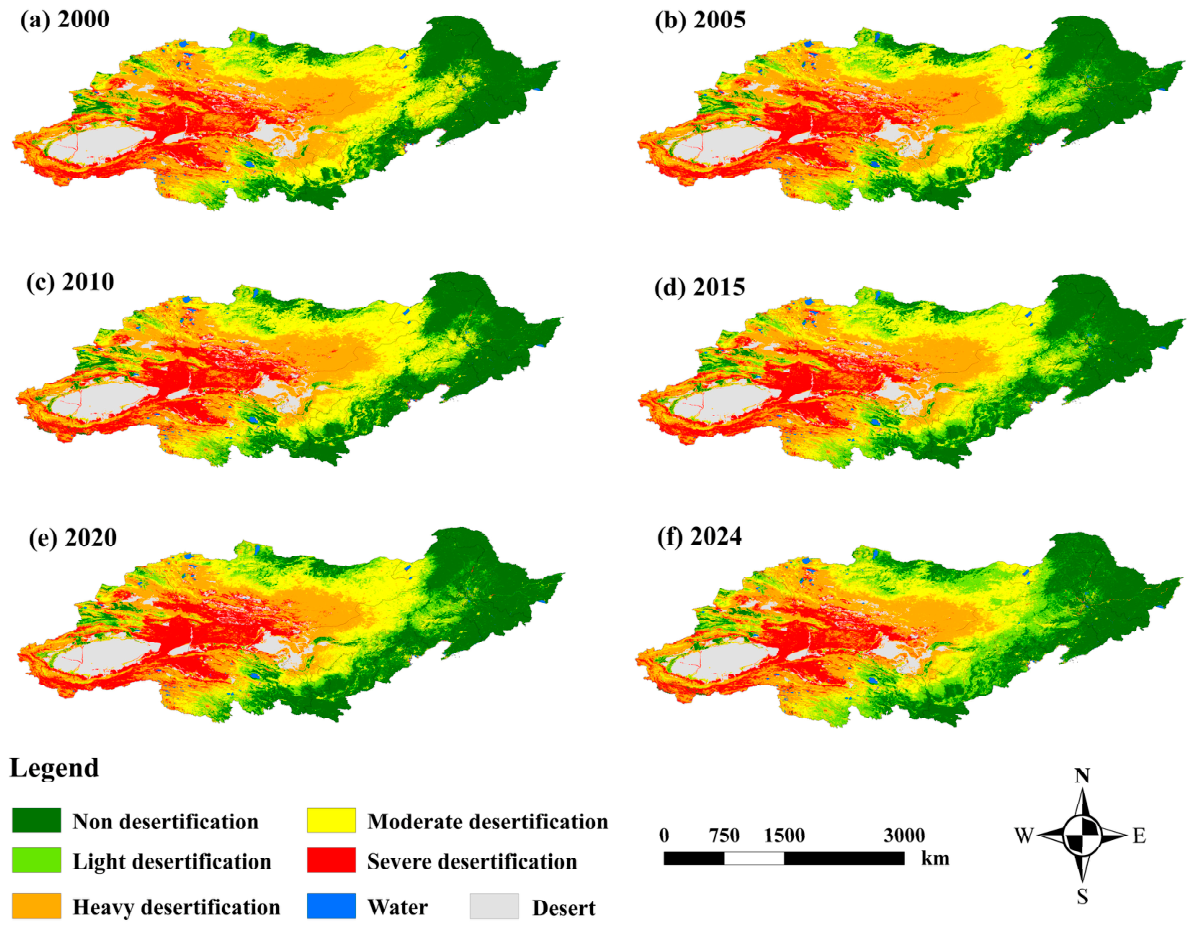
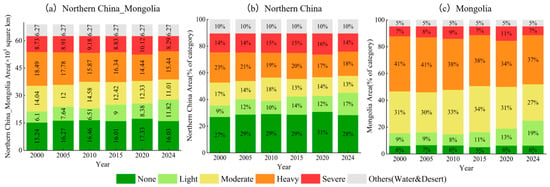
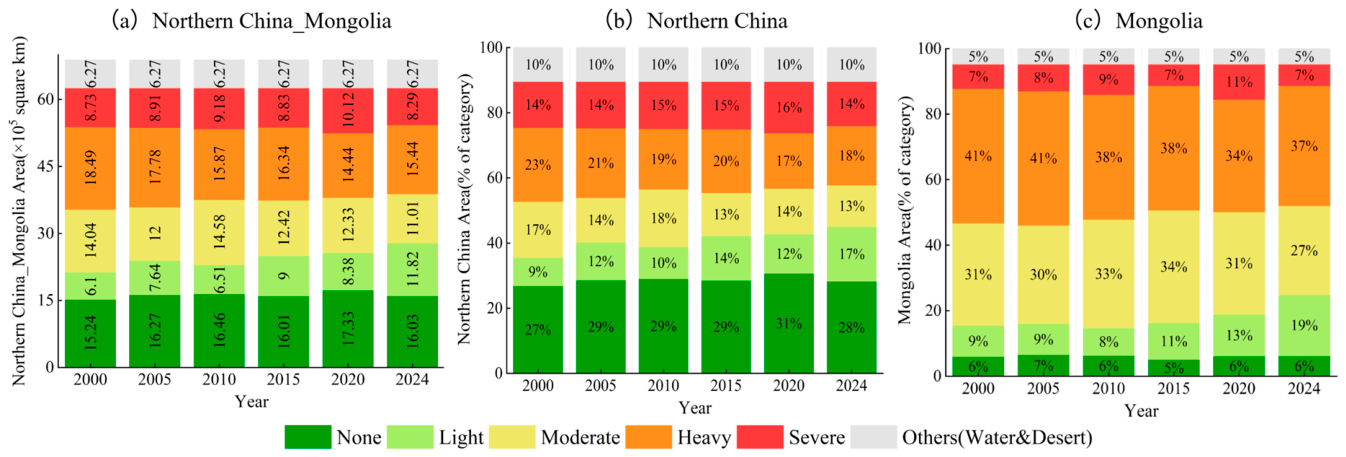
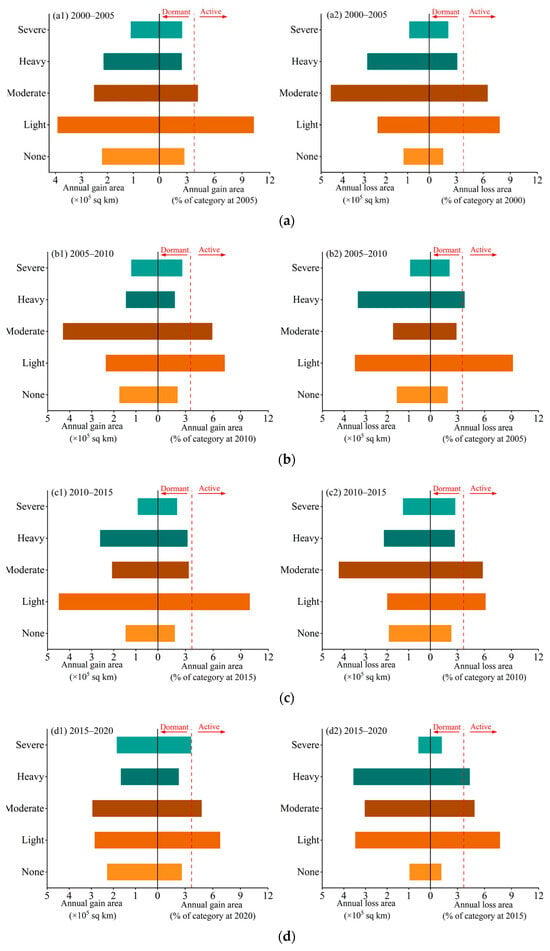
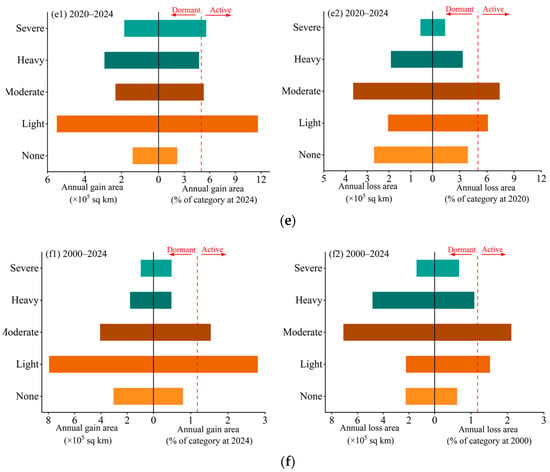
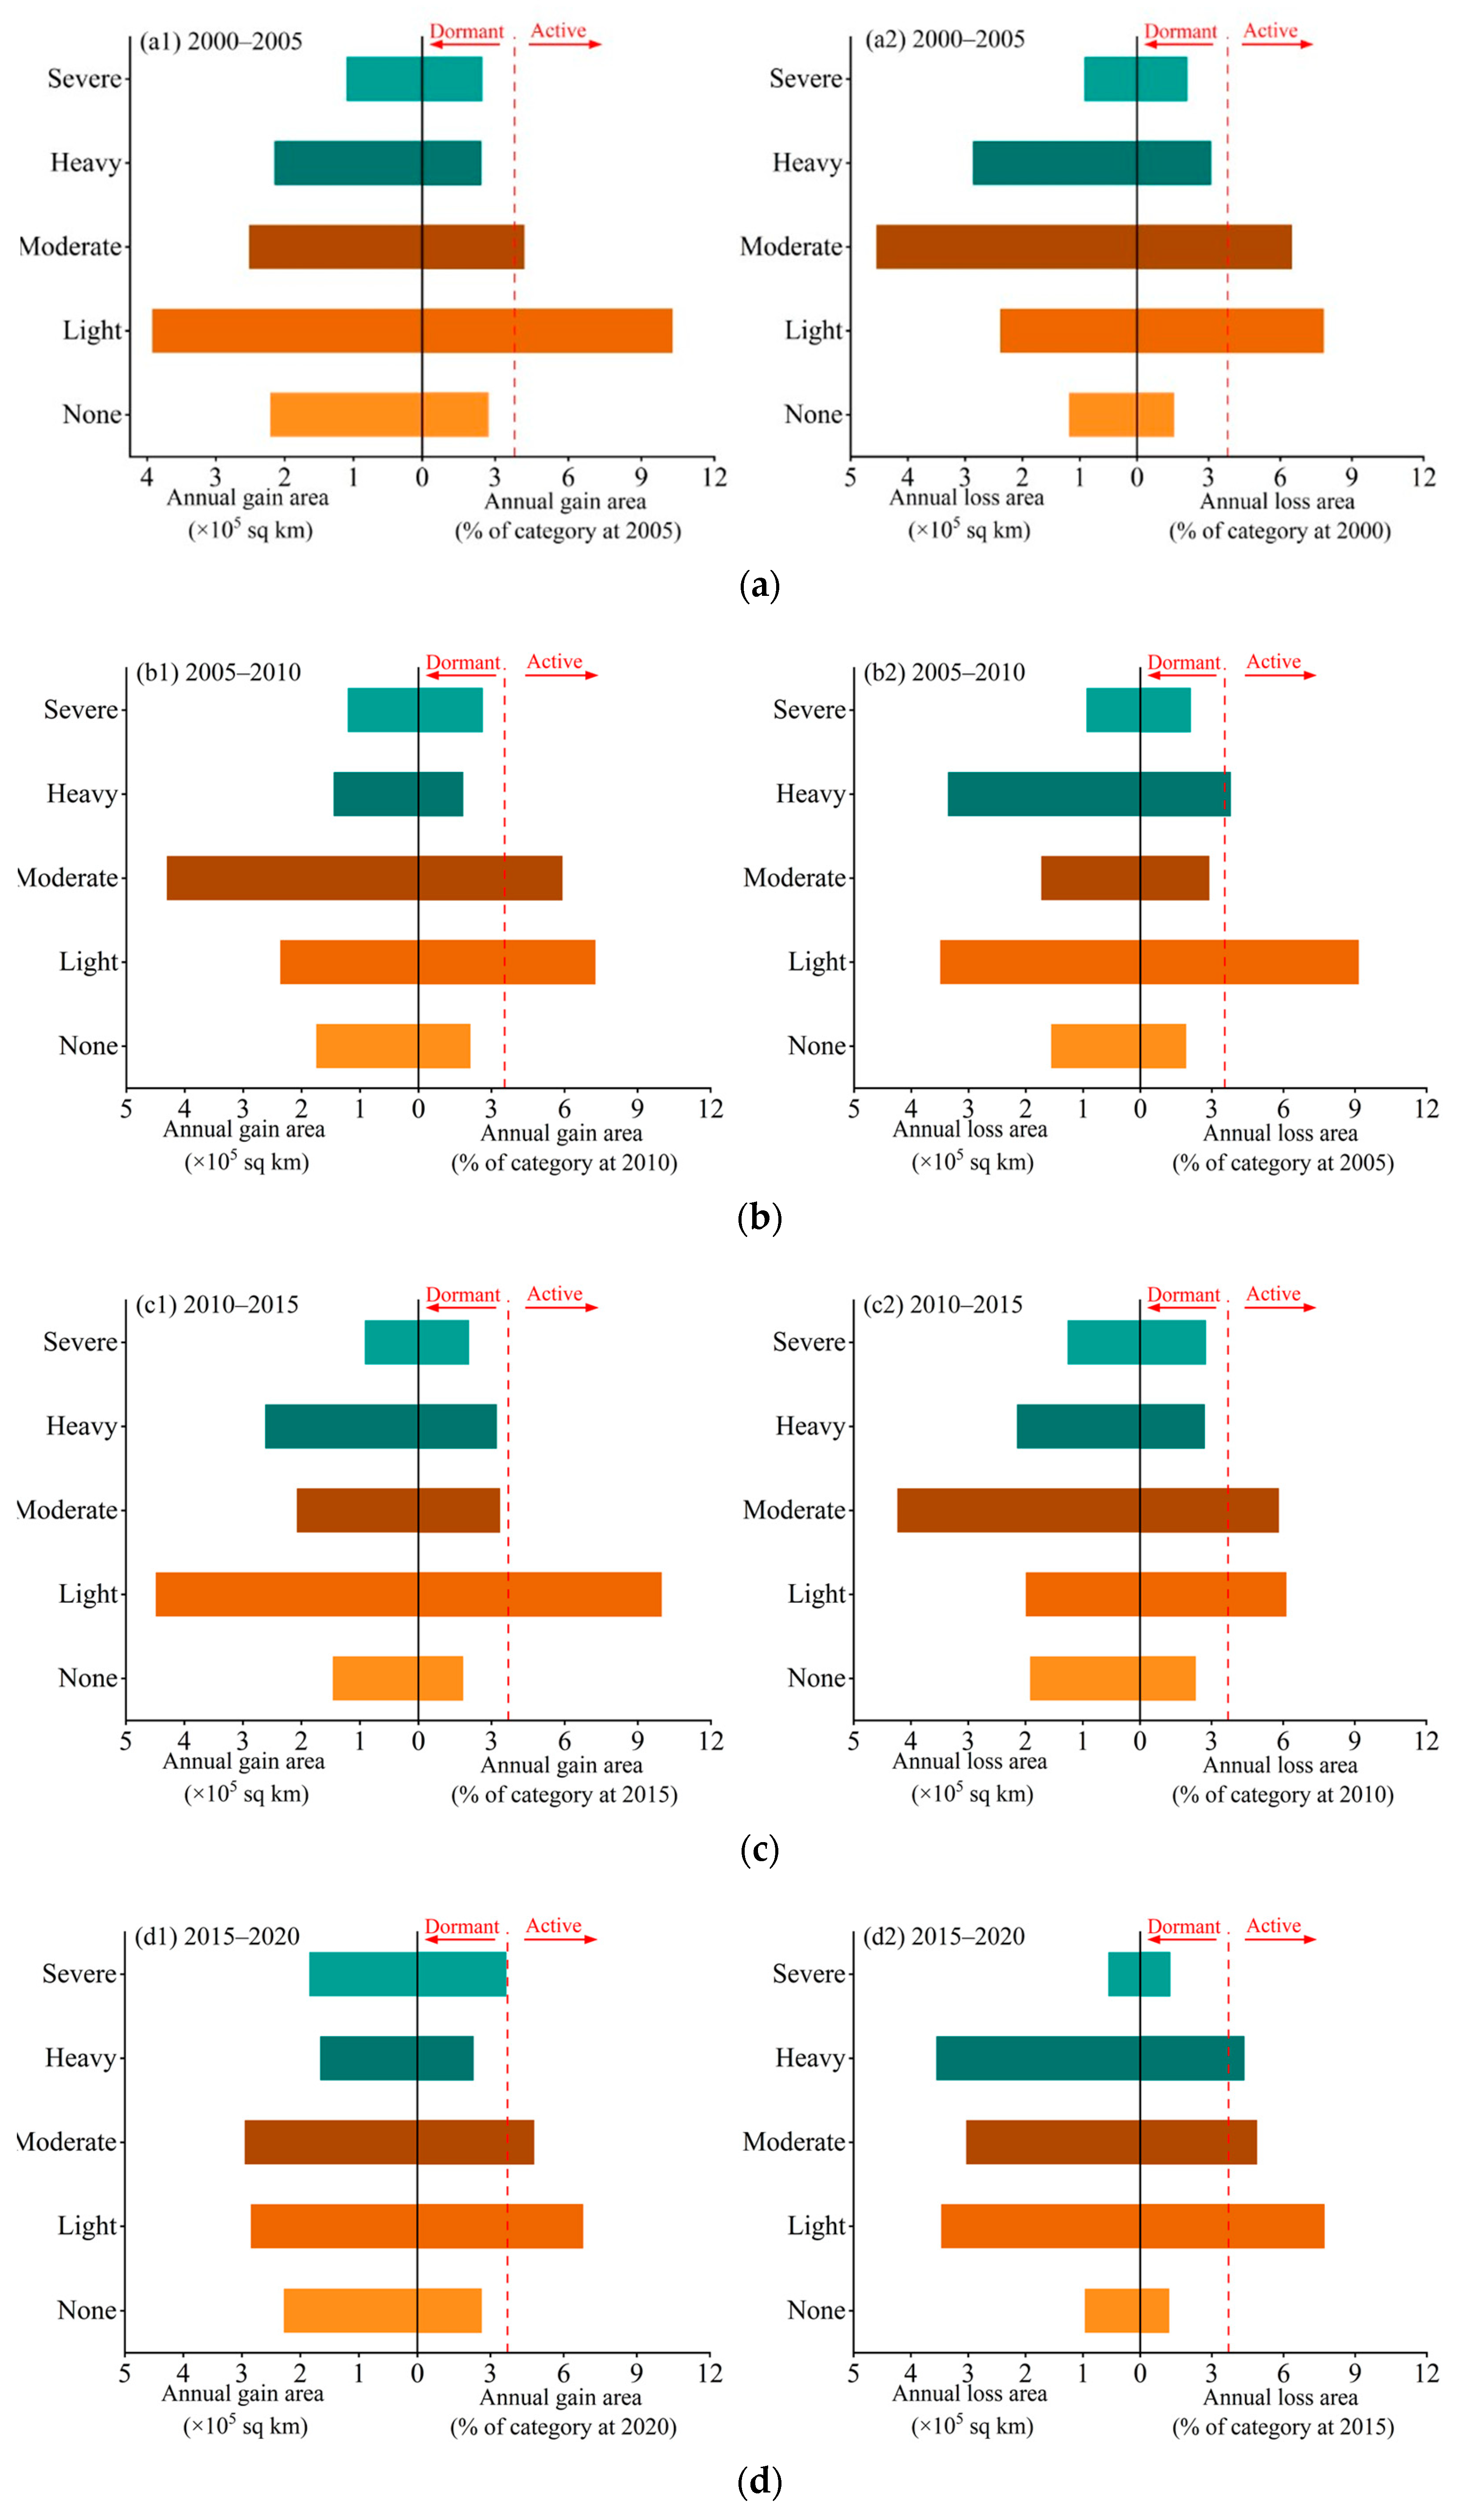
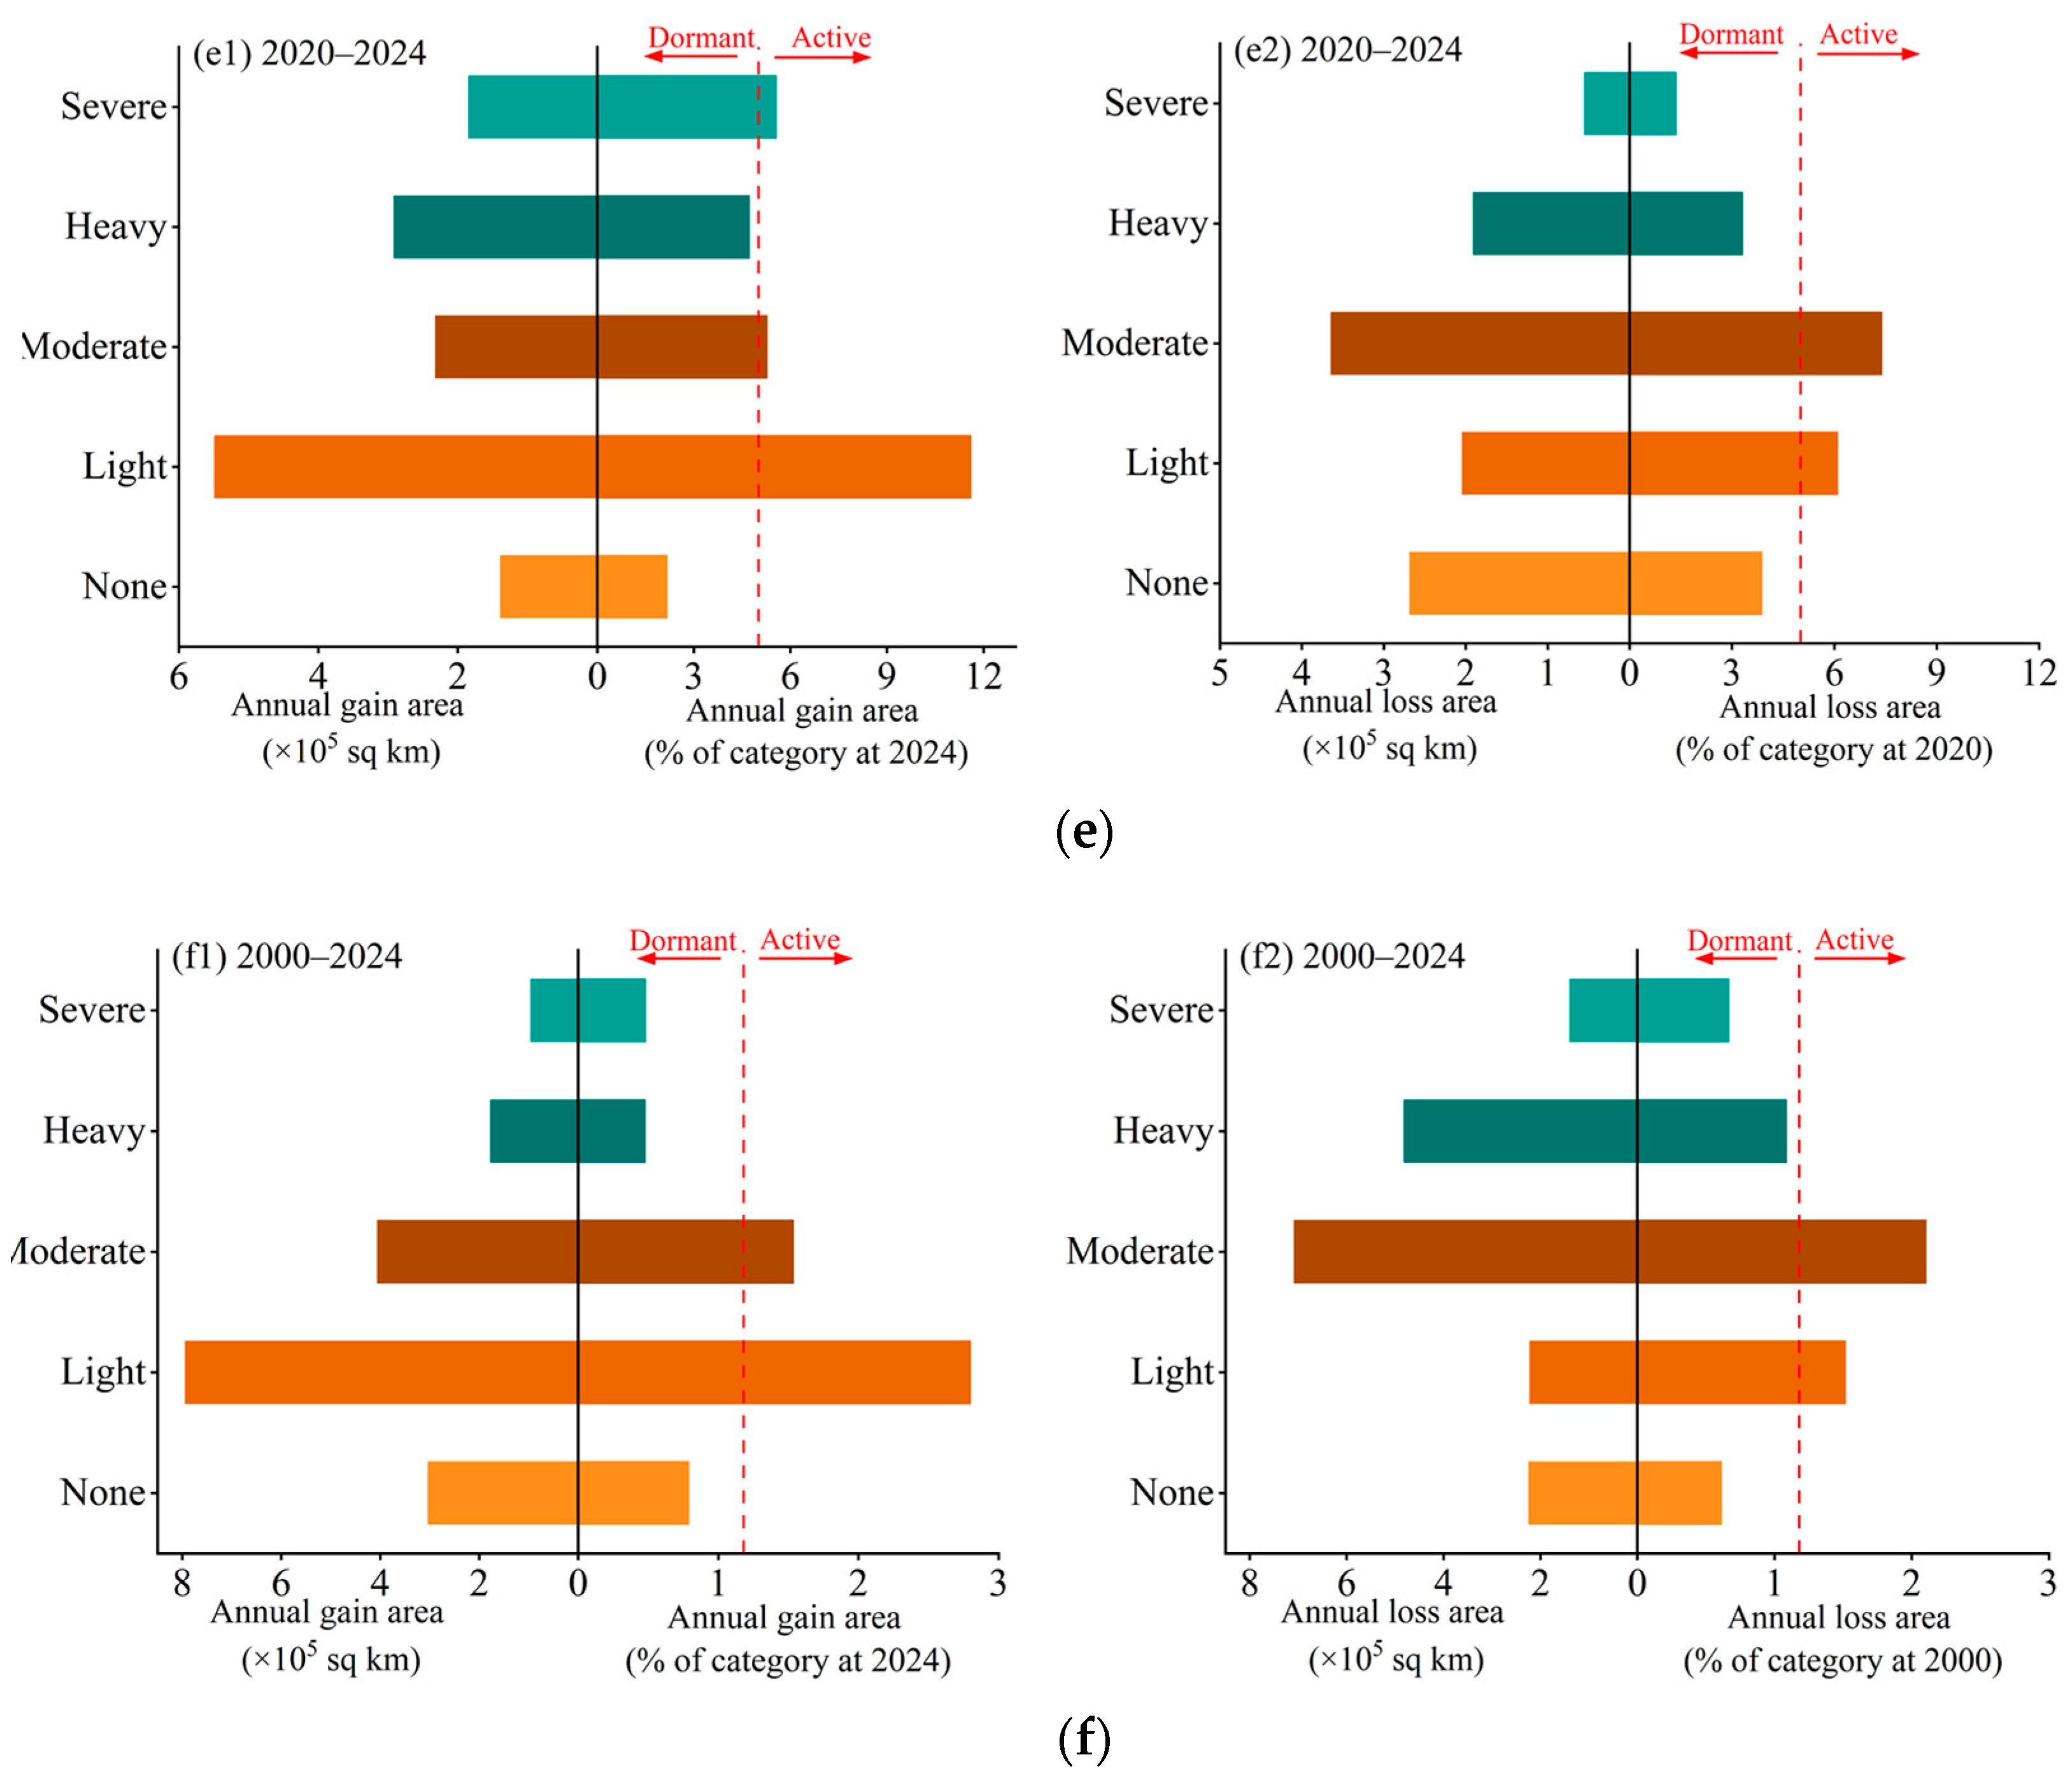
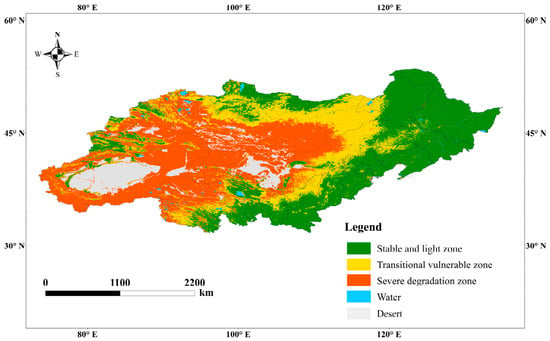
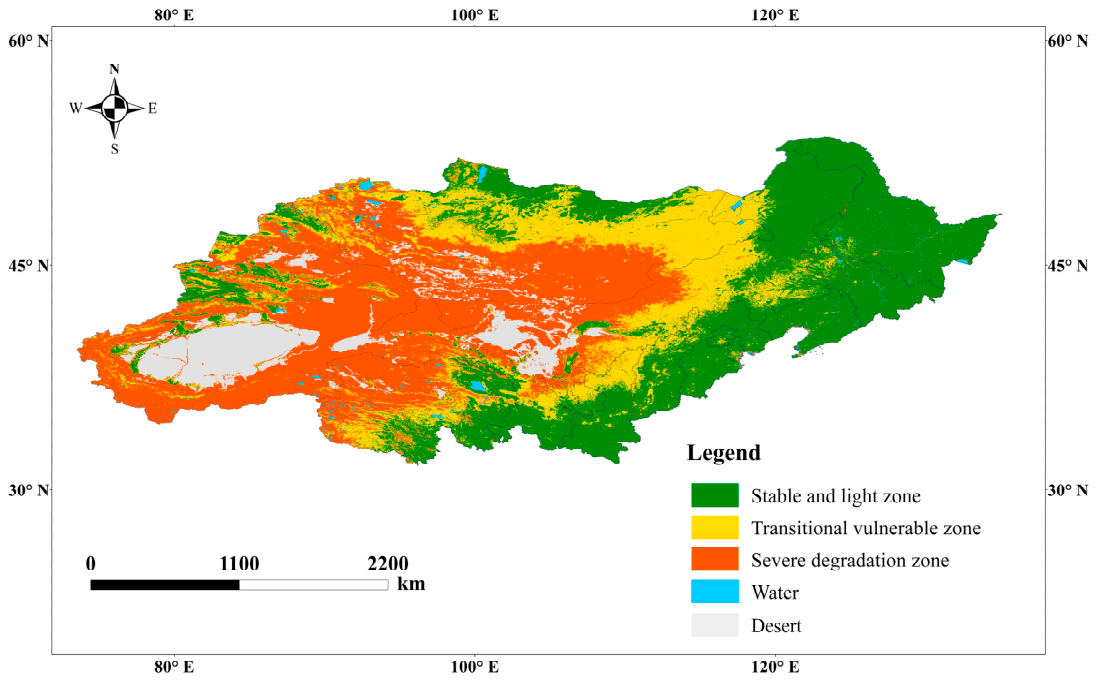
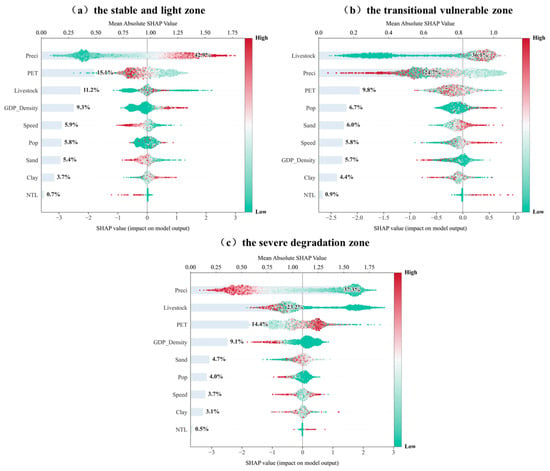
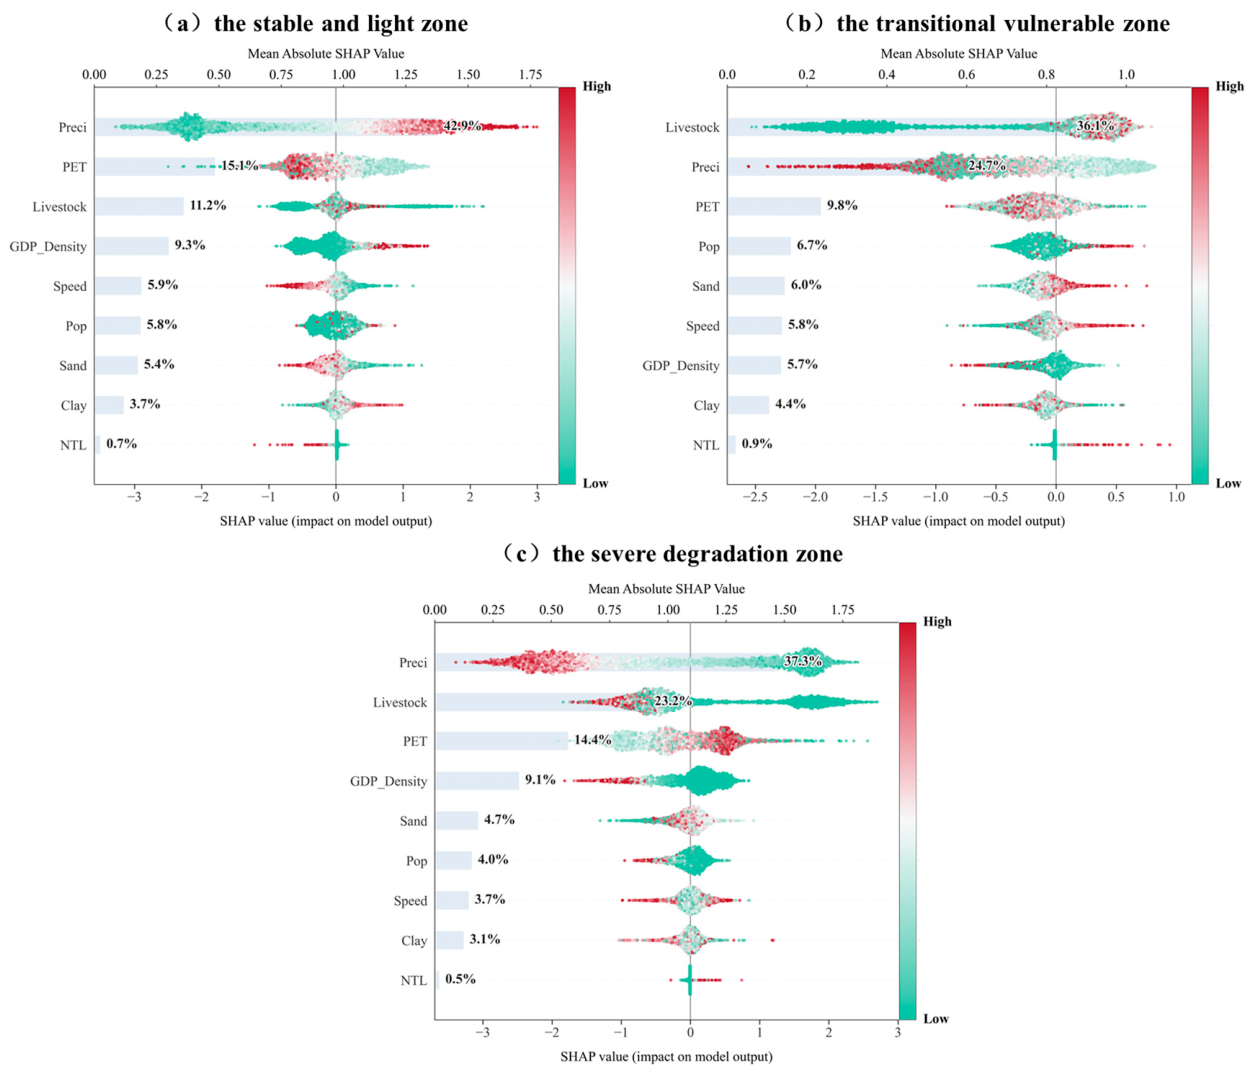
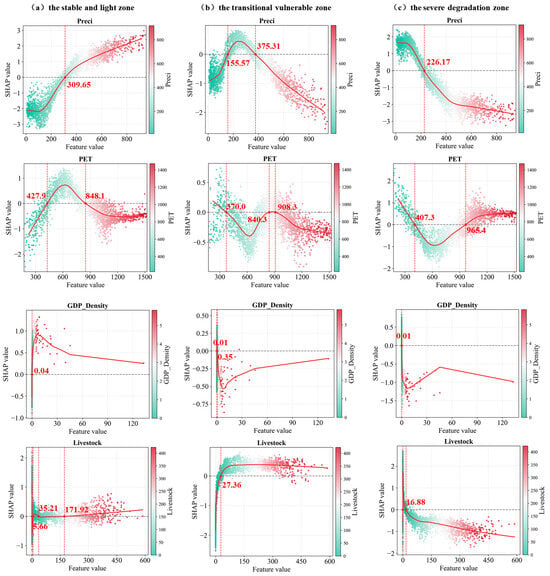
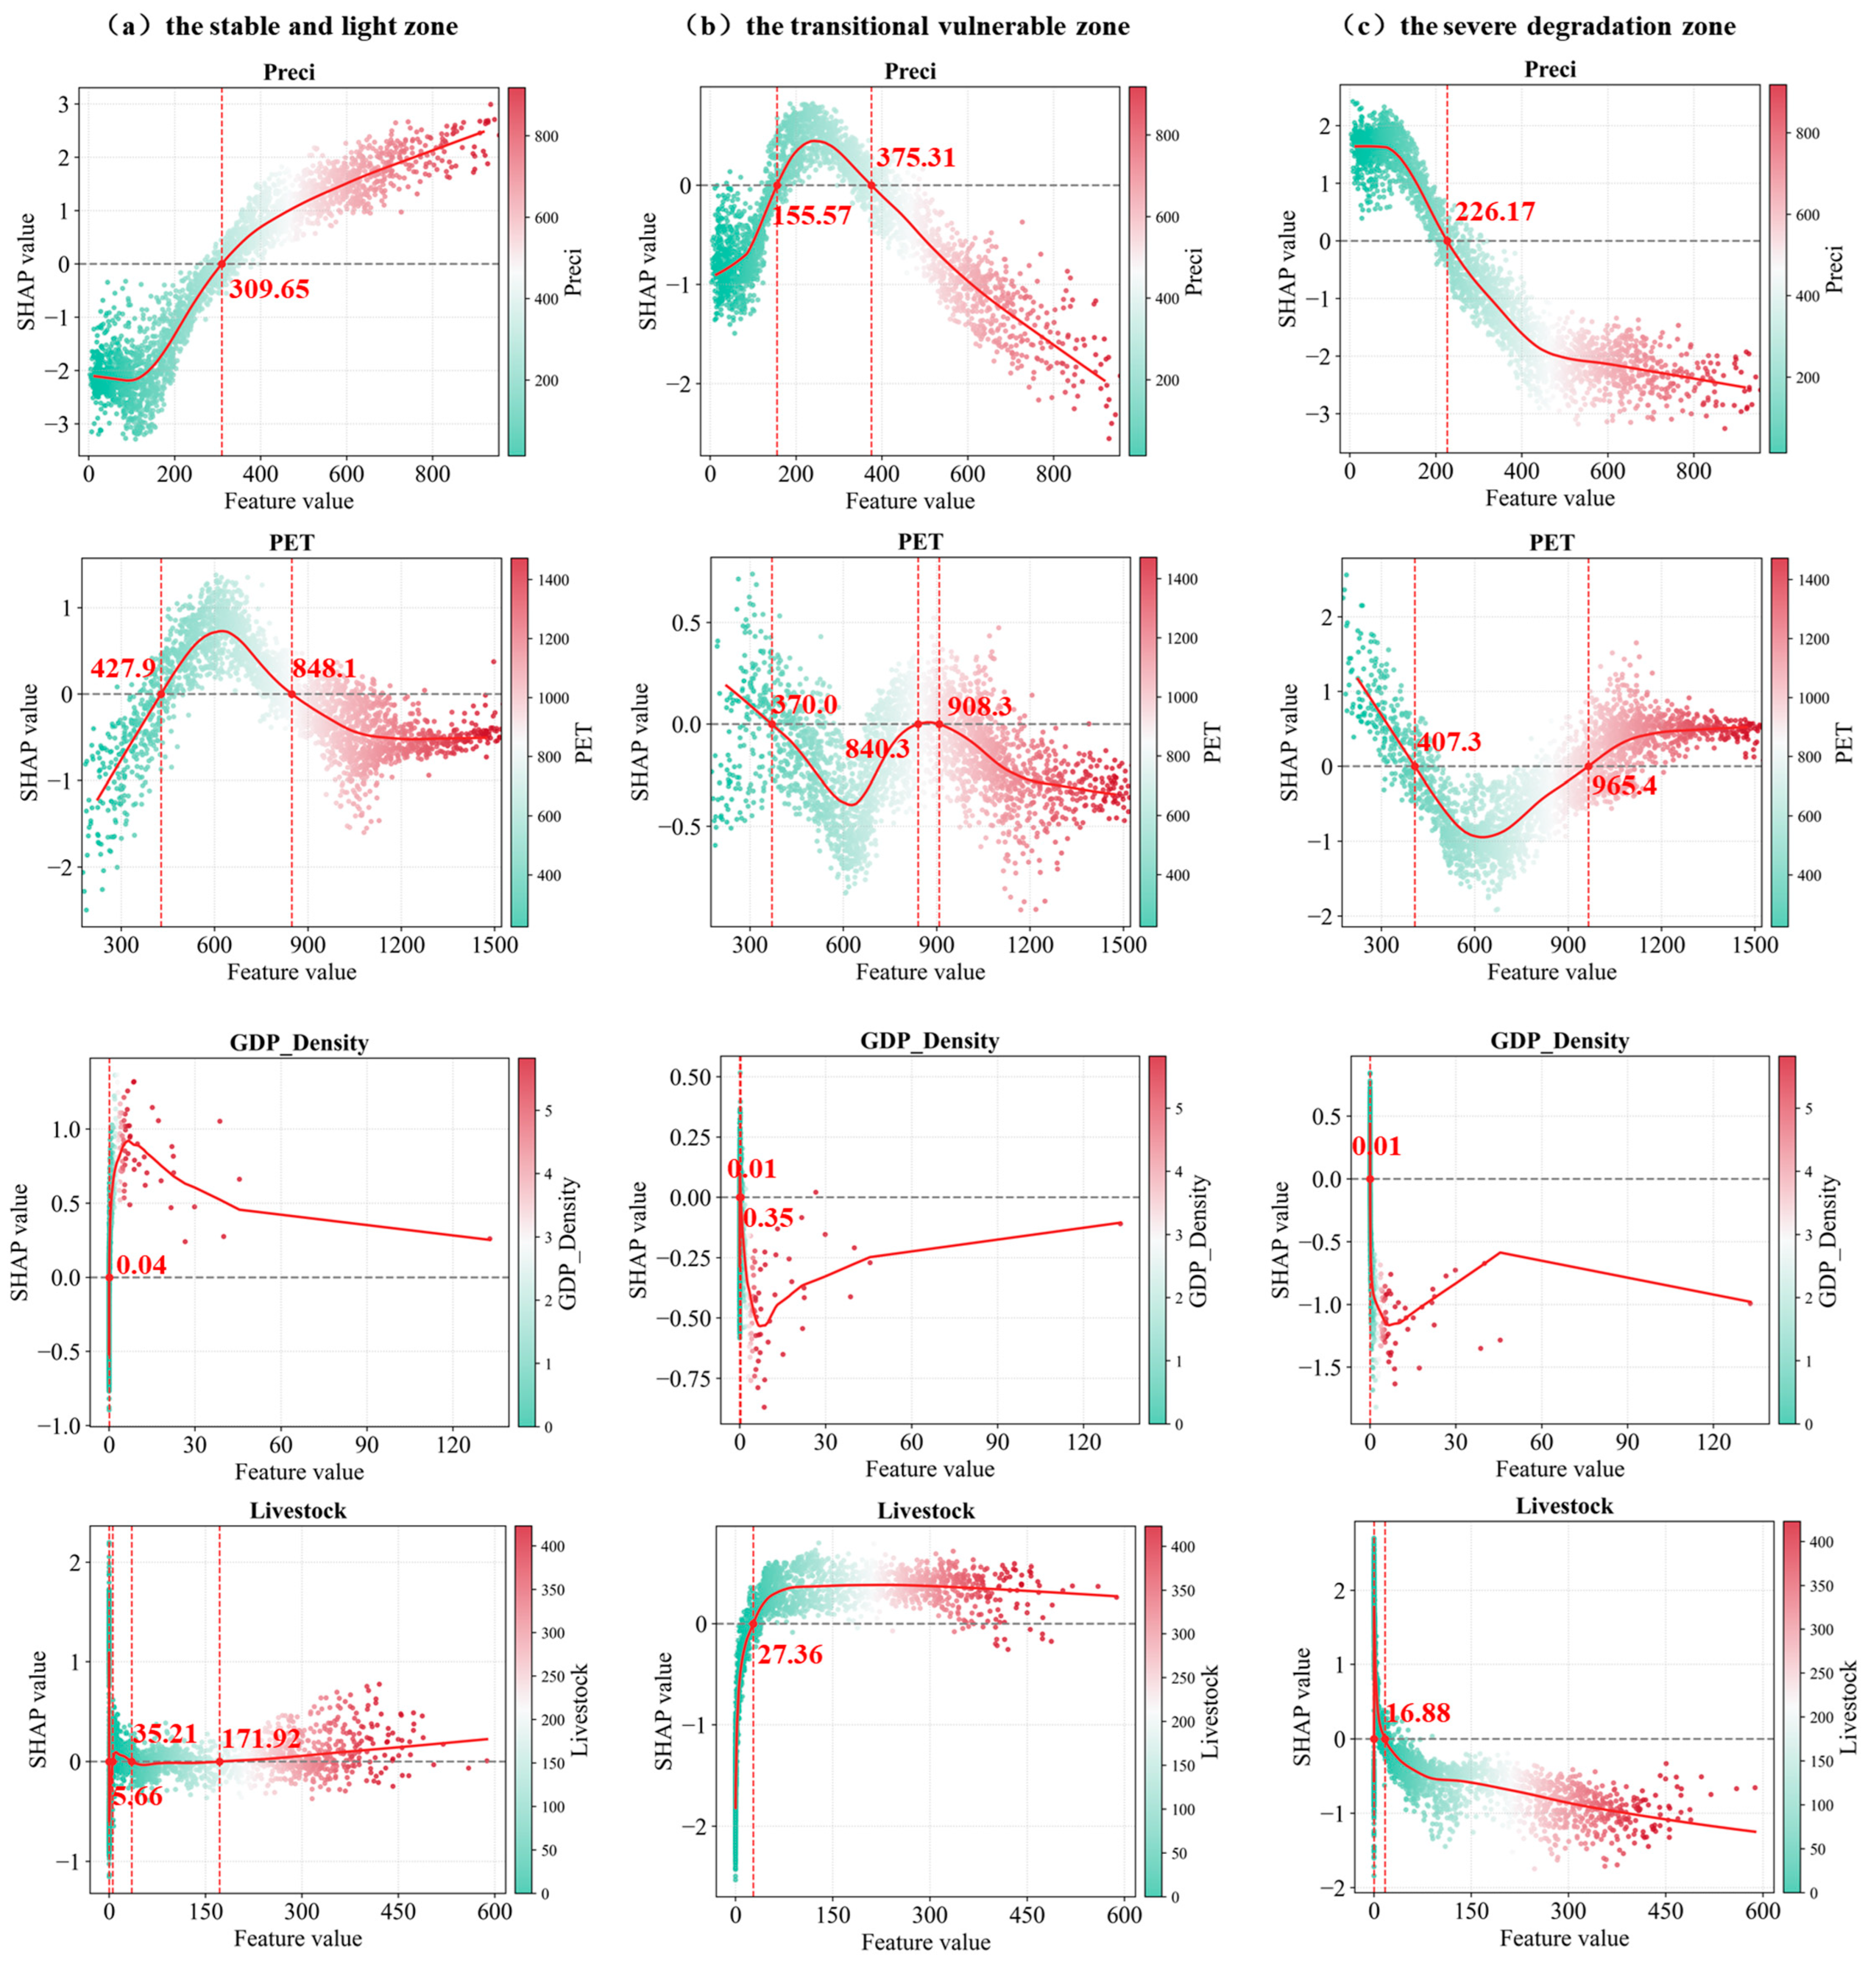
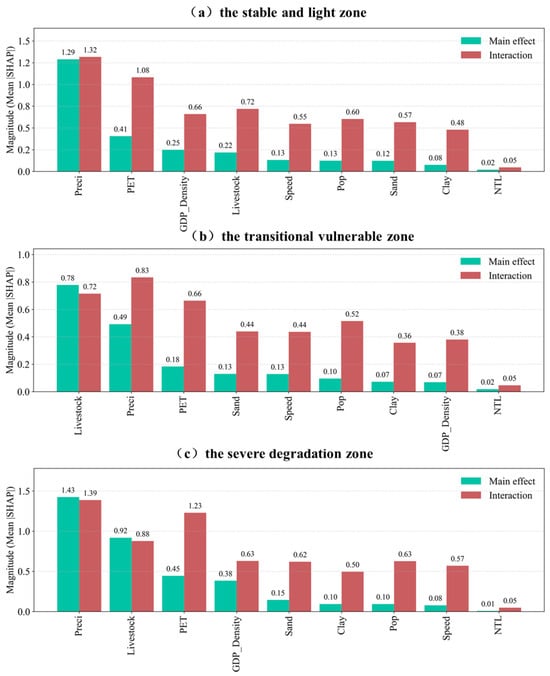
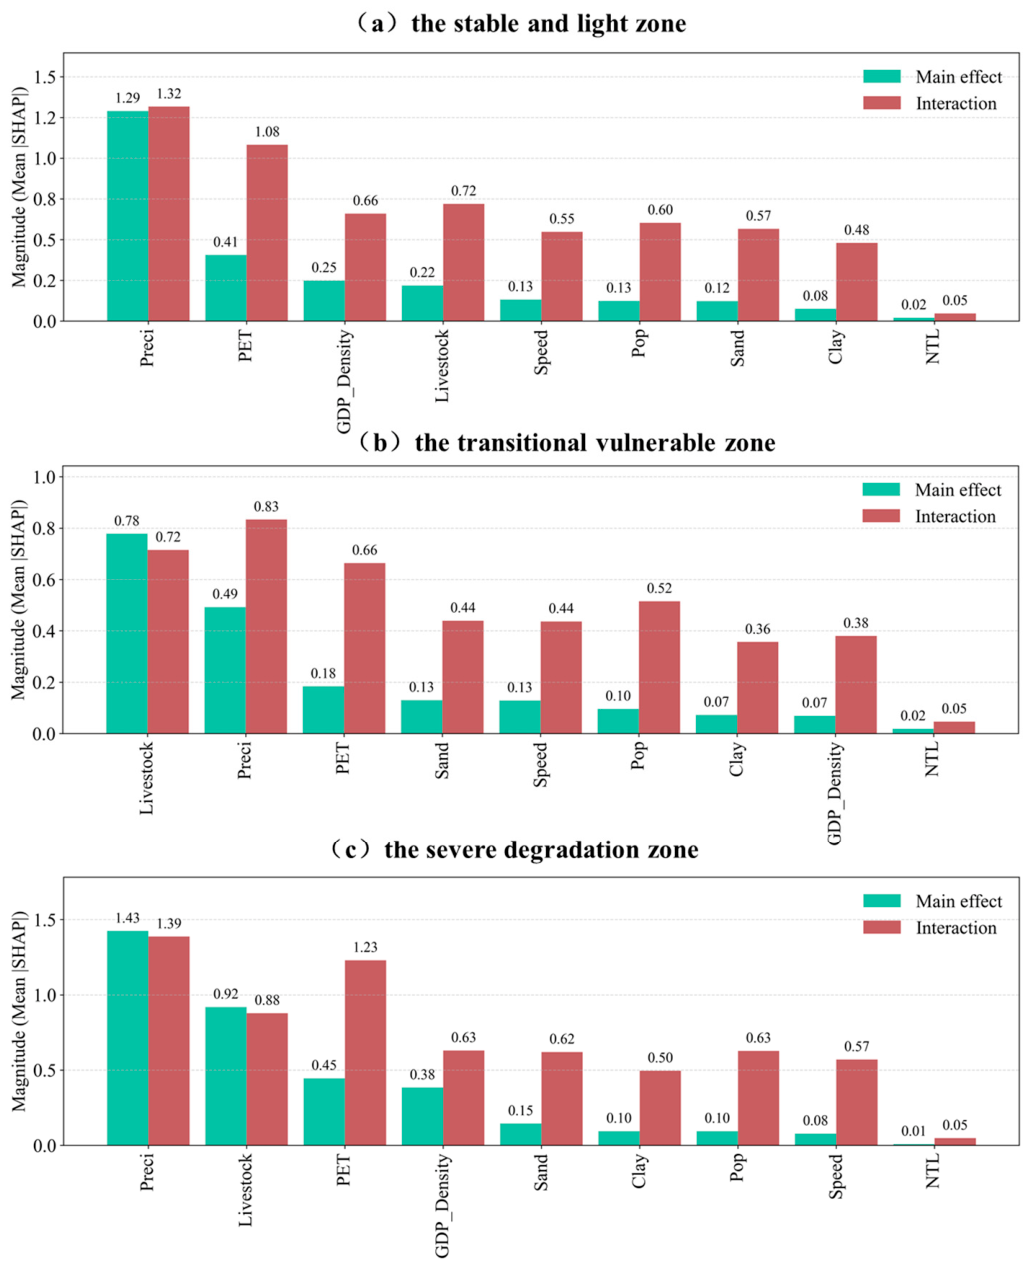
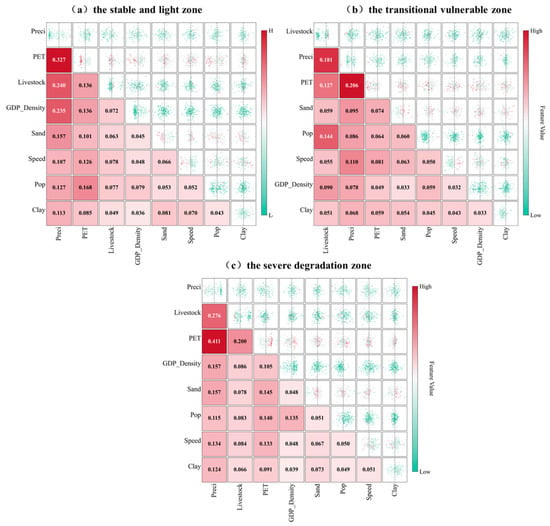
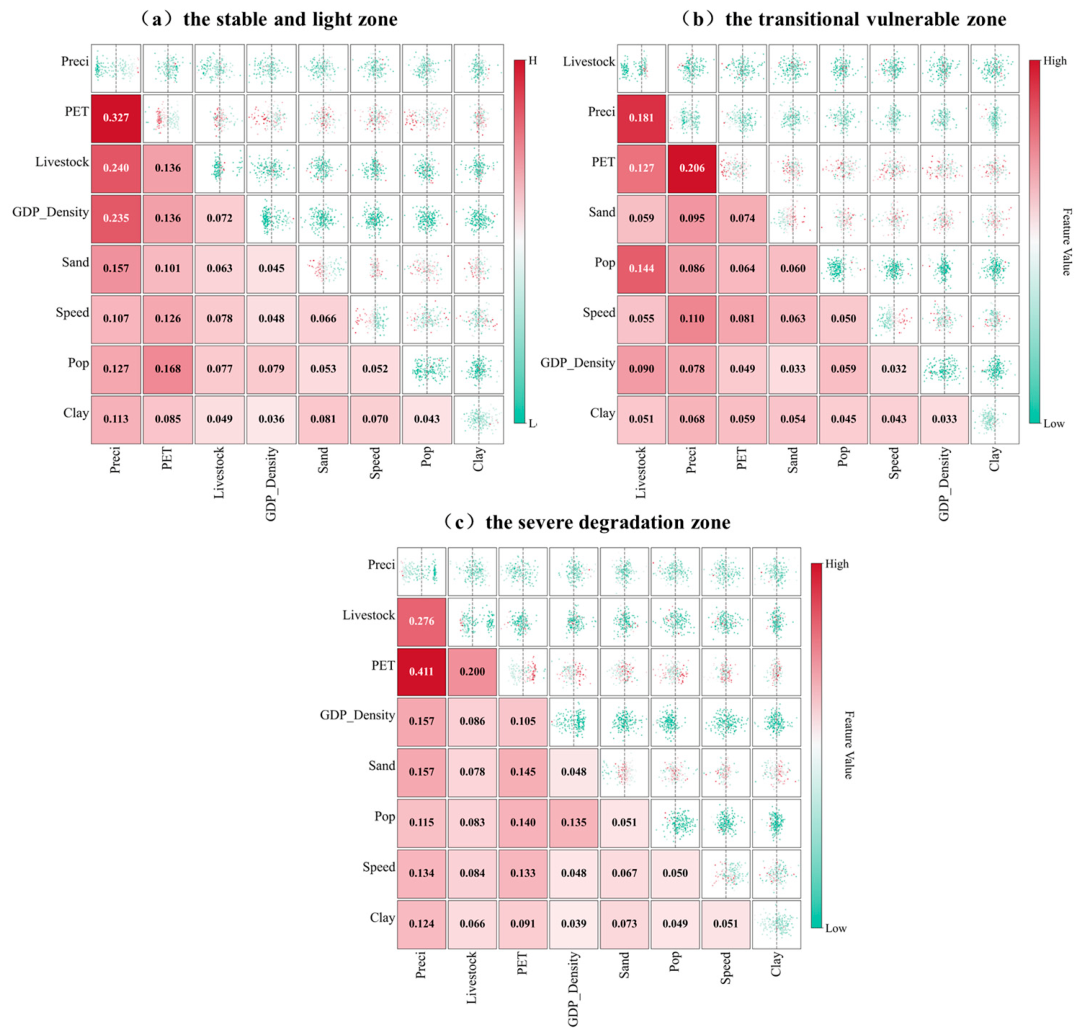

Disclaimer/Publisher’s Note: The statements, opinions and data contained in all publications are solely those of the individual author(s) and contributor(s) and not of MDPI and/or the editor(s). MDPI and/or the editor(s) disclaim responsibility for any injury to people or property resulting from any ideas, methods, instructions or products referred to in the content. |
© 2026 by the authors. Licensee MDPI, Basel, Switzerland. This article is an open access article distributed under the terms and conditions of the Creative Commons Attribution (CC BY) license.