


Highlights
What are the main findings?
- A Canadian wildfire smoke plume was followed along a dynamically connected transport pathway from its source to Romania with PACE polarimetry; its optical depth decayed from 0.9 to 0.2–0.3, while the lidar ratio and depolarisation ratio retrieved by HARP2 matched the derived lidar ratio and measured depolarisation ratio of the RADO-Cluj lidar (52 vs. 50 sr; 0.042 vs. 0.042) in this episode.
- At the site, the three PACE optical depth products disagreed by 0.2 around an AERONET value of 0.1, and the NATALI typing networks returned three different classes (Continental, Dust, and Continental Polluted): an aged, diluted plume was quantifiable by neither satellite nor ground-based typing alone.
What are the implications of the main findings?
- For faint, aged smoke, intensive polarimetric and vertical quantities (lidar ratio, depolarisation, layer height) identify the aerosol after optical depth and Ångström exponent no longer can.
- In this case, pairing satellite polarimeters and ground-based lidars on those intensive quantities first, before optical depth, proved more robust than the optical depth route and merits testing on further episodes.
Abstract
Smoke from the Canadian wildfires of August 2025 reached Cluj-Napoca, Romania, on 6–9 August as a thin layer at 5–8 km. We followed the plume from its source with the multi-angle polarimeters HARP2 and SPEXone and the OCI radiometer on NASA’s PACE and characterised it at the RADO-Cluj ACTRIS National Facility with a multiwavelength depolarisation lidar, a ceilometer, AERONET photometry, GRASP inversions, and HYSPLIT trajectories. Along the air mass trajectory, the HARP2 retrievals resolved the ageing of the smoke: an optical depth decaying from 0.9 to 0.2–0.3, a layer rising to 10 km and descending to 5 km, growth of the fine-mode radius, and a single-scattering albedo consistent with brown carbon loss. At the site, the lidar ratio and particle depolarisation ratio retrieved by HARP2 (52 sr, 0.042) agreed with the lidar’s derived lidar ratio and measured depolarisation (50 sr, 0.042), whereas the three satellite optical depths differed by 0.2 around an AERONET value of 0.1 and the NATALI typing networks returned three different classes. For this faint, aged plume, intensive polarimetric and vertical quantities could no longer be identified for the aerosol by its optical depth and Ångström exponent, which motivates testing an intensive-first pairing of satellite polarimetry with ground-based lidar on further episodes.
1. Introduction
Atmospheric aerosols represent key components of the Earth system, driving a significant influence on both the planetary radiative budget and regional climate dynamics, while concurrently posing severe threats to public health through the induction and amplification of respiratory and cardiovascular pathologies [1,2]. Because their atmospheric residence times can span from several days to multiple weeks in the free troposphere, particulate matter can exhibit advection over thousands of kilometers away from initial emission sources [2,3,4]. Consequently, the total columnar aerosol concentration observed over a given monitoring location frequently represents a complex, polygenic mixture of local anthropogenic emissions, regional background, and long-range transported plumes [2].
Synoptic-scale transport episodes documented across Europe include Saharan mineral dust outbreaks [2,5,6], volcanic ash dispersal [2], and carbon-rich aerosols emitted by massive wildfires [2]. In particular, severe biomass burning (BB) events across boreal forests in North America and Siberia generate intense convective motions capable of injecting massive volumes of black carbon, brown carbon, organic carbon, and gaseous precursors directly into the upper troposphere and lower stratosphere [7,8,9]. Once elevated above the planetary boundary layer (PBL), these particulates bypass rapid boundary layer wet and dry deposition processes and are efficiently transported by strong tropospheric jet streams and prevailing westerlies across intercontinental distances [3,10].
During August 2025, boreal wildfires across Canada attained exceptional dimensions, burning over 6.32 million hectares—a figure approximately three times higher than the 25-year historical average [11]—and resulting in the highest wildfire emissions recorded in over two decades [12]. The resulting dense smoke plumes traversed the North Atlantic toward the European continent [12].
Long-range transported wildfire smoke has been characterised over Europe on many occasions, most extensively during the record 2017 Canadian episode, when multiwavelength Raman lidars measured the lidar ratio and the particle depolarisation ratio of aged smoke at all three standard wavelengths and showed tropospheric smoke particles to be compact, nearly spherical and weakly depolarising, in contrast to the strongly depolarising smoke lofted into the stratosphere [13]. Systematic compilations of such intensive optical properties show, however, that aged smoke, continental pollution, and their mixtures populate overlapping regions of the lidar ratio, depolarisation, and Ångström-exponent space [14] so that automated typing schemes cannot separate them unambiguously once the input parameters exhibit substantial retrieval uncertainty. A decade of observations at the eastern border of the Aerosol, Clouds, and Trace Gases Research Infrastructure (ACTRIS) confirms that fresh and aged BB layers over Romania vary systematically in altitude, depolarisation, and Ångström exponent and that mixed classes, such as continental smoke, dominate the layers identified by neural network typing [15]. Far from the source, dispersion in the free troposphere breaks a plume into segmented thin layers whose optical depth diminishes while their intensive properties, lidar ratio, and depolarisation are negligibly altered [16] so that the signal available for typing weakens faster than the signature it is supposed to reveal. The difficulty is compounded when the plume is less concentrated: for thin layers with a low signal-to-noise ratio, even the operational spaceborne lidar classification struggles to distinguish high-altitude smoke from polluted continental aerosol [17].
Passive satellite-based remote sensing has, until recently, faced the same limitation from the other side: single-angle radiometers retrieve the aerosol optical depth (AOD) but only weakly constrain particle size, absorption, and shape. The multi-angle polarimeters launched on NASA’s Plankton, Aerosol, Cloud, and Ocean Ecosystem (PACE) mission in 2024, the Spectro-Polarimeter for Planetary EXploration one (SPEXone), and the Hyper-Angular Rainbow Polarimeter (HARP2) retrieve these microphysical quantities globally for the first time in more than a decade [18], although their retrieval uncertainty increases as the number of usable viewing geometries decreases [19]. Whether such retrievals can follow an ageing smoke plume across an ocean and a continent, and whether they still resolve its nature once it has thinned to a diffuse layer above a polluted continental background, is an open question that this study investigates alongside the ground-based evidence.
The primary objective of the present study is to investigate vertical profiles, classify and analyse the aerosols by their optical and microphysical properties, and validate the source attribution of the transcontinental Canadian BB intrusion episode observed over Cluj-Napoca, Romania, between 6 and 9 August 2025, with columnar inversions extending to 10 August. To achieve this, a synergistic observation strategy is deployed combining active ground-based remote sensing (multiwavelength depolarisation lidar and ceilometer), passive ground-based remote sensing (sun/lunar photometry of the Aerosol Robotic Network, AERONET), an aerosol typing neural network (Neural Network Aerosol Typing Algorithm based on Lidar Data, NATALI), inversion algorithms (Generalized Retrieval of Aerosol and Surface Properties, GRASP, and AERONET), air mass backward modeling (NOAA Hybrid Single-Particle Lagrangian Integrated Trajectory model, HYSPLIT), and a satellite-derived chemical air mass transport model (Copernicus Atmosphere Monitoring Service, CAMS). In addition to confirming the source attribution, the study follows how the retrieved properties of the plume evolve with age along its transport path and documents the limits that current ground-based and spaceborne techniques, and the typing algorithms built on them, reach when the transported layer becomes attenuated and mixes with continental aerosol.
The remainder of this paper is organised as follows. Section 2 describes the observational infrastructure and data: the RADO-Cluj ACTRIS National Facility in Cluj-Napoca with its multiwavelength depolarisation lidar and ceilometer (Section 2.1), the AERONET photometer and the GRASP inversion configuration (Section 2.2), the spaceborne polarimetric observations from the NASA PACE mission used to follow the plume along its transport path (Section 2.3), and the analysis chain that combines these with HYSPLIT back-trajectories and CAMS reanalysis fields (Section 2.4). Section 3 presents the results: the vertical structure and evolution of the aerosol layers seen by the ceilometer and the lidar (Section 3.1 and Section 3.3), the columnar optical properties (Section 3.2), the automated aerosol typing (Section 3.4), the source attribution (Section 3.5), the comparison of GRASP and AERONET microphysical retrievals (Section 3.6), and the satellite view of how the plume’s properties evolved between the source region and Romania (Section 3.7). Section 3.8 discusses the findings, and Section 3.9 examines the limitations that ground-based and spaceborne techniques face when the signal of an aged, diluted smoke layer approaches their detection and typing thresholds. Section 4 summarises the conclusions.
2. Methodology
Experimental observations were performed in Cluj-Napoca, located in the Transylvanian Basin of northwestern Romania [20,21]. The measurement infrastructure is affiliated with the ACTRIS research infrastructure [22]. The observational setup spans two closely spaced urban facilities shown in Figure 1.
Figure 1.
Location map of the RADO-Cluj ACTRIS National Facility station and the Cluj-UBB photometer in a European context (centre) and at the local scale (top left).
2.1. RADO-Cluj ACTRIS National Facility
Located at 46.768°N, 23.540°E (462 m a.s.l.) on Uliului Street [23,24] (Figure 1), this facility houses the active optical remote sensing instruments that will be used in this study, the lidar system (CLOP), and the Lufft CHM 15k “Nimbus”.
2.1.1. CLOP Lidar System
CLOP is a high-resolution, multi-channel depolarisation Raman lidar affiliated with the European Aerosol Research Lidar Network (EARLINET) [24]. CLOP utilises an Nd:YAG laser emitting at 30 Hz across the ultraviolet (355 nm), visible (532 nm), and near-infrared (1064 nm) spectral regions, delivering an altitude resolution of 3.75 m [24]. The backscattered radiation is captured by a Cassegrain telescope configured with seven detection channels: five elastic channels (355 nm parallel/cross, 532 nm parallel/cross, and 1064 nm) and two inelastic nitrogen Raman channels (387 nm and 607 nm) [24].
Signal inversion was performed using Lidar Processing V6.0.0, a software developed at the National Institute of Research and Development for Optoelectronics (INOE) [25]. The presence of clouds during the measurements limited the use of the standardised Single Calculus Chain (SCC), particularly for analysing the temporal evolution of the high-altitude aerosol layers. Since this was a particularly interesting event, we used Lidar Processing V6.0.0, which allowed us to better examine the vertical structure and temporal evolution of these layers. The software is based on the same inversion principles used by the SCC developed within EARLINET and ACTRIS and has been internally validated against SCC results. It is generally used only in cases where the standard SCC processing cannot be applied due to operational limitations. The processing provided aerosol backscatter coefficient profiles at 355, 532, and 1064 nm. Extinction coefficient profiles at 355 and 532 nm were subsequently estimated using the Cloud and Aerosol Layer/Raman Classification Algorithm (CLARA) model [26] to support aerosol classification. The retrieval used a vertical resolution of 3.75 m and 20 s temporal resolution, averaged over 08:38–10:38 UTC. The Klett inversion used reference windows at 7.8–8.1 km, assumed to be near-aerosol-free, immediately below the cirrus base at each wavelength; profiles were exported at the native 3.75 m resolution, and NATALI applied its own 700 m filter window for layer detection, retaining layers deeper than 300 m (Section 3.4).
CLARA is an automated machine learning classification framework designed to perform objective typing of aerosol layers using multiwavelength Raman lidar profiles within coordinated observational networks, such as EARLINET and ACTRIS [22,27]. By utilising vertically resolved optical data, the tool mitigates the classification subjectivity intrinsic to user-defined decision thresholds across complex, multi-component atmospheric plumes [26,27].
Rather than utilising raw range-corrected backscatter intensities, CLARA operates on layer-averaged, intensive optical parameters that depend exclusively on particle microphysics, morphology, and chemical composition [26]: extinction-to-backscatter ratios (lidar ratios), colour ratios and indices, extinction Ångström exponent, linear particle depolarisation ratio, and geometric properties (layer base, top, and mean altitude) [26,28]. Based on these parameters, we could get the extinction profiles that we did not initially have because the lidar measurements were realised during daylight.
NATALI 1.4.1 is an automated software tool that identifies atmospheric layer boundaries using the gradient method applied to the second derivative of smoothed 1064 nm backscatter profiles, retaining layers thicker than 300 m to preserve an adequate signal-to-noise ratio [28,29], with its neural networks having been trained on intensive parameters computed from the Optical Properties of Aerosols and Clouds (OPAC) aerosol components [30]. Layer typing is executed strictly on intensive optical parameters calculated within the central core of each layer, including the extinction Ångström exponent (AE355/532), colour ratios (CRs), colour indices (CIs), lidar ratios (S355, S532), and, optionally, the linear particle depolarisation ratio (δ532) to evaluate particle non-sphericity [26,29]. When δ532 is available and optical parameter uncertainties remain below 20%, high-resolution typing resolves 13 aerosol categories; otherwise, low-resolution modes retrieve 5 to 6 predominant aerosol types [29]. Finally, an election algorithm evaluates scrambled parameter ensembles within experimental error bounds, accepting network predictions that satisfy confidence and stability thresholds before selecting the consensus aerosol type through a weighted vote [29].
2.1.2. Lufft CHM 15k “Nimbus”
A diode laser ceilometer operated continuously (24/7) within Cloudnet/ACTRIS [31,32]. It emits at 1064 nm (1 ns pulse width, repetition rate 5–7 kHz), providing a vertical range up to 15 km at 15 m resolution and 30 s temporal integration [2,31]. The ceilometer ensures continuous tracking of the boundary layer diurnal evolution and aerosol stratification in the free troposphere [2].
2.2. CLUJ UBB Photometer Station
Positioned approximately 0.8 km eastward at the Faculty of Environmental Science and Engineering (46.768°N, 23.551°E, 405 m a.s.l.) on Fântânele Street [21], this station operates a Cimel CE 318T multi-spectral sun/sky/lunar photometer within AERONET [33,34]. Direct solar and lunar irradiance measurements are acquired across nine spectral channels (340–1640 nm) [33]. Data utilised in this study conform to quality-assured Level 2.0 criteria [35].
The GRASP algorithm is an open-source inversion model [36] built on the retrieval principles and concepts originally implemented in AERONET [37]. For this paper, we used the configuration GRASPpac [38], which uses as input sun photometer data: AERONET V3 [39] L1.5 total optical thickness and almucantar measurements at 440, 675, 870, and 1020 nm, inverted with 30 min ceilometer backscatter profiles at 1064 nm and retrieved at the same time interval as the passive photometer data. The measurements processing, running GRASP, and the plotting were done on DIVA (Demonstration of an Integrated approach for the Validation and exploitation of Atmospheric missions) [40]. This research environment is an open, collaborative, Python (v3.11.8)-based platform with standard Jupyter Notebooks 3.6.8 giving researchers access to multiple aerosol/cloud remote sensing data and preinstalled algorithms, including GRASP. The output consists of column-integrated parameters at 440, 675, 870, 1020, and 1064 nm and vertical profiles at 1064 nm for the total aerosol mixture, as particle component separation is not possible using a one-wavelength classical inversion configuration. Table 1 summarises the inputs and outputs used for this study.
Table 1.
GRASP inputs and outputs.
2.3. Spaceborne Polarimetric Observations (PACE)
The plume was followed with Level-2 aerosol products from NASA’s PACE mission, launched in February 2024 into a 676 km sun-synchronous orbit with a 13:00 local time ascending node [41]. Of its three instruments, the Ocean Color Instrument (OCI) measures reflected radiance from 345 to 890 nm at 5 nm resolution with 1 km nadir pixels across a 2660 km swath; its aerosol product is on an ∼8 km grid, its near-ultraviolet extension provides the aerosol index and a constraint on absorption, and the oxygen A-band and near-UV channels yield aerosol layer height (ALH) [42]. HARP2 is a broad-swath (1550 km) imaging polarimeter viewing each ground pixel from up to 60 along-track angles at 670 nm and 10 at 440, 550, and 870 nm (nominal band centres); its native 1.3 km × 2 km pixels are binned to 5 km before retrieval. SPEXone measures intensity and degree of linear polarisation hyperspectrally from 385 to 770 nm at five viewing angles, but only within a 100 km sampling strip [43]. Multi-angle polarimetry roughly doubles the information content of a single-view spectrum, which is what allows size, absorption, refractive index, and non-sphericity to be retrieved rather than assumed [44].
Three operational Level-2 suites were used: the OCI Unified Aerosol Algorithm (UAA) product (version 3.1), providing spectral AOD, SSA, near-UV aerosol index, and ALH; the HARP2 ocean and land products (version 4.0) from the FastMAPOL algorithm, an optimal estimation retrieval with neural network forward models [19,45], returning fine- and coarse-mode spectral AOD, SSA, and refractive index at 440, 550, 670, and 870 nm, effective radius, spherical fraction, and ALH (defined above the local surface), a fit residual (χ2), with the viewing angles surviving cloud and specular reflection, and a quality flag combining them; and the SPEXone ocean and land products (version 4.0) from RemoTAP, which exploits the full hyperspectral polarimetric information and transfers formal confidence intervals to most parameters [18,43]. All granules intersecting 110°W–40°E, 35–70°N on 3–12 August 2025 were obtained from the NASA Ocean Biology DAAC and composited per orbit pass onto a 0.1° grid by binned averaging, keeping a per-cell pixel count per variable. HARP2 retrievals were kept at quality flag ≤ 3 (χ2 ≤ 2 and ≥30 usable angles in intensity and polarisation), with the operational recommendation of indicator ≤ 1 (χ2 ≤ 1.5, ≥60 angles) as a sensitivity case; SPEXone at its best indicator only. Relaxing the flag from ≤1 to ≤3 adds retrievals with fewer usable viewing angles or a poorer fit; its effect is quantified in Table S2: along the transport path, the flag ≤ 1 medians of fine-mode fraction (FMF), SSA, Ångström exponent, effective radius, spherical fraction, and ALH fall within the flag ≤ 3 interquartile range on every day, and AOD on nine of ten days, with median absolute differences of 0.02 in AOD, 0.007 in SSA, and 0.3 km in ALH. Because HARP2 requires a homogeneous land or water surface within its 5 km cell, almost none exists within 5 km of a coastline, few within 10 km, and only isolated ones over inland waters; SPEXone flags land–water proximity effects and retrieves closer to the coast.
2.4. Data Analysis
To determine the optical properties, vertical structure, and advection pathway of the aerosol plume, a synergistic approach was implemented [2,46]. First, continuous monitoring was performed using the ceilometer to detect early backscatter anomalies in the free troposphere, well above the PBL [2,46]. AERONET direct irradiance measurements are processed via the Beer–Lambert–Bouguer law [34] to yield spectral AOD (AODλ). Particle size characterisation is performed using the Ångström exponent (α440–870), where values exceeding 1.5 identify fine-mode combustion particles [47,48]. Spectral Deconvolution Algorithm (SDA) retrievals separate fine- and coarse-mode optical depth at 500 nm [49]. Multiwavelength elastic backscatter signals (355, 532, and 1064 nm) acquired by the CLOP lidar are inverted using Lidar Processing by INOE, V6.0.0 to resolve layer geometric boundaries and optical backscatter coefficients [24,50].
Three-dimensional 168 h (7 days) air mass backward trajectories are simulated using the HYSPLIT model of the NOAA Air Resources Laboratory utilising the Global Data Assimilation System (GDAS) reanalysed meteorological fields [51] at receptor arrival altitudes of 1000, 6000, and 8000 m a.g.l.
Also, to strengthen the conclusions, this study will use NATALI 1.4.1. It is an automated tool developed to identify aerosol types from multiwavelength Raman lidar profiles [26,29], integrated in a Python software application; it is primarily optimised for standardised EARLINET measurements.
Organic matter AOD fields from CAMS [12] are used to trace the spatio-temporal evolution of the plume from the Canadian wildfire clusters to Eastern Europe.
Table 2 distinguishes measured, retrieved, model-derived, and assumed quantities, a distinction that matters for the comparisons in Section 3.7.
Table 2.
Nature of the quantities used in this study.
The PACE products described in Section 2.3 are analysed in three steps. First, the transport corridor is divided into three longitude stages, the source region over central and eastern Canada (110–50°W), the North Atlantic (50–10°W), and Europe (10°W–40°E), and for each day, the quality-screened HARP2 retrievals in every stage are reduced to distributions of AOD, FMF, SSA at 440 nm, Ångström exponent, fine-mode effective radius, spherical fraction, and ALH so that the evolution of the plume’s intensive properties with transport time can be read as a succession of stage means. The corridor of ±300 km around the 6000 and 8000 m trajectories is a simple envelope, not a trajectory ensemble; the Lagrangian series, therefore, describes the aerosol in the dynamically connected pathway rather than a strictly conserved air parcel. Second, the fraction of pixels in which a retrieval succeeded, and the distribution of the quality indicator among those that did, are tracked along the same path as a measure of how the detectability of the plume degrades as it thins. Third, over a target box covering central Europe, Romania, and the western Black Sea (10–38°E, 42–52°N), the retrievals from the daily overpasses of 6–10 August are collocated with the ground-based observations at Cluj-Napoca wherever quality-screened retrievals exist within 50 km of the site (the nearest HARP2 pixel lies 2.2–2.9 km from the site on 8–10 August, and the AERONET observation nearest to each of those overpasses is within ±7 min, with 17–19 observations in the ±60 min window; the sensitivity of the comparison to the collocation radius, 10–100 km, is given in Table S1): HARP2 ALH is compared with the layer boundaries from the ceilometer and the lidar, AOD, Ångström exponent, and SSA, with the AERONET and GRASP columnar values, and the HARP2 lidar ratio and depolarisation ratio, which the FastMAPOL retrieval reports for the extracted size–shape–refractive index solution, with the depolarisation ratio measured and the lidar ratio derived (Section 2.1.1) from the CLOP lidar; where SPEXone crossed the target box, its black and brown carbon volume fractions are used as a separate indicator of a BB origin.
3. Results and Discussion
At Cluj-Napoca, the episode can be followed over five days. The ceilometer first detected the smoke around 18 UTC on 6 August, above 6000 m (all heights in this paper are above ground level unless stated; the station is at 462 m a.s.l.), and AERONET lunar observations during the following night already gave an AOD500 of 0.367, almost twice the August climatology. The plume was densest on 7 August, with a dense layer at 5000–6000 m and an upper layer near 8000 m, when AERONET measured in solar mode and the CLOP lidar sampled the column between 08:38 and 10:38 UTC. On 8 August, the layer descended throughout the day, and on 9 August, only a thin layer near 4000 m was present; GRASP inversions were obtained from 8 to 10 August. Table 3 lists which instrument delivered a quality-screened observation on each day, and the following sections present them in that order.
Table 3.
Observations available at Cluj-Napoca on each day of the episode, 6–10 August 2025. ✓: available; –: not available.
Table 4.
Columnar optical properties measured over Cluj-Napoca on August 6–7, 2025 compared with the decadal August baseline (2013–2023) [21].
3.1. Vertical Structure and Diurnal Evolution of the Backscatter Coefficient
Continuous attenuated backscatter measurements from the CHM 15k ceilometer from 6 until 9 August 2025 (Figure 2) showcase the layer’s evolution. On August 6, the layer can first be observed around 18 UTC at over 6000 m. Then, this layer reaches its maximum concentration on August 7, a day that revealed striking aerosol stratification [52]. While the local PBL remained confined below 2000 m a.g.l., unusually high-altitude layers were observed across the free troposphere: a dense layer spanning 5000–6000 m and an upper layer residing near 8000 m [52]. On 8 August, the layer descends throughout the day; on 9 August, only a thin layer at 3.8–4.3 km is seen; it is last detected near 3.5 km before 06 UTC on 10 August, and no elevated layer is present during the daytime of 10 August, including at the time of the satellite overpass. This thin layer first appears at 4.4–4.8 km late on 8 August, about four hours after the descending layer was last seen, and is, therefore, a second, trailing portion of the transported aerosol rather than a continuation of the first.
Figure 2.
Ceilometer backscatter coefficient measurements recorded from 6 to 9 August at Cluj-Napoca, RADO-Cluj ACTRIS National Facility [52]; heights above ground level.
During August 7, between 04:00 and 11:00 UTC, the 8000 m layer exhibited intense localised backscatter enhancement corresponding to the emergence of thin Cirrus clouds [52]. The temporal coincidence indicates that advected carbonaceous smoke particles served as efficient ice-nucleating particles, triggering heterogeneous ice crystallisation under upper-tropospheric supersaturated conditions.
3.2. Columnar Microphysical and Optical Properties
AERONET Level 2.0 observations recorded during the night of August 6/7 (lunar mode) and daytime August 7 (solar mode) differed significantly from the typical August values (2013–2023), where the typical mean AOD500 is 0.20 and the mean α440–870 is 1.60 [21].
As detailed in Table 4, AOD500 nearly doubled, while shortwave AOD340 reached 0.616 [35]. The high Ångström exponent (α440–870 = 1.742) in tandem with an SDA FMF exceeding 95% provides conclusive evidence of fine-mode combustion particles, ruling out coarse-mode desert dust or maritime air masses [47,49].
3.3. Multiwavelength Lidar Profiling
Range-corrected backscatter signals acquired by the CLOP lidar on August 7 (08:38–10:38 UTC) (Figure 3) across 355, 532, and 1064 nm provided refined vertical differentiation [24]: the PBL is characterised by two distinct sub-layers with higher relative backscatter at 532 and 1064 nm, indicative of standard continental/urban background particles containing localised coarse constituents. Also, a mid-tropospheric diffuse aerosol layer exhibiting moderate backscatter can be observed at 4800–6000 m. This feature is most visible in the 532 nm range-corrected signal (Figure 3c) and weak in the 355 and 1064 nm cross-sections, but the backscatter profiles (Figure 3a) show it at all three wavelengths; it coincides with the 5000–6000 m layer seen by the ceilometer at 1064 nm (Section 3.1) and with NATALI layers 3 and 4 (Table 5), so it is a real, optically thin feature rather than noise.
Figure 3.
Measurements of the CLOP lidar on 7 August 2025, 08:38–10:38 UTC. (a) Vertical profiles of the particle backscatter coefficient at 355, 532, and 1064 nm (2 h average; shading is the uncertainty). Coloured horizontal bands in (a) mark the Klett reference windows at 355, 532, and 1064 nm. (b–d) Time–height cross-sections of the range-corrected signal at 355 nm (parallel channel), 532 nm (parallel), and 1064 nm. All heights are above ground level; the station is at 462 m a.s.l.
Table 5.
Aerosol layer boundaries reported by each instrument and algorithm during the episode. All heights above ground level (station 462 m a.s.l.).
The upper-tropospheric plume between 6400 and 6800 m is a sharply defined, stratified layer detected across all three wavelengths (355, 532, and 1064 nm). Its robust detection at 1064 nm highlights significant particle volume. Spectral features indicate aerosol ageing, during which organic vapours condense and particles undergo coagulation, transitioning toward spherical shapes and a slightly larger radius relative to fresh smoke [7,9,47]. Also, considering its high altitude, it can indicate the possibility of it being long-range transported. In addition, the cirrus clouds above 7200 m have intense optical returns indicative of ice crystal scattering.
3.4. Aerosol Typing
As mentioned before, in order to get the aerosol typing from NATALI, we must have the backscatter (355, 532, and 1064 nm) and extinction (355 and 532 nm) lidar profiles. Because it was daytime, we could retrieve only the backscatter profiles, so we used CLARA to model the extinction profiles from the lidar ratio and the depolarisation. The extinction profiles supplied to NATALI were constructed from the elastic backscatter with a lidar ratio close to 50 sr at both wavelengths, so the layer-mean lidar ratios that NATALI reports (48 sr at 355 nm and 50 sr at 532 nm for the 5.9–7.1 km layer, with an in-layer scatter of about 1 sr) are derived rather than measured quantities, whereas the particle depolarisation ratio of 0.042 at 532 nm in the same layer is measured. Using the NATALI algorithm with modelled data was an assumed risk that is reflected in the results. The results can be considered as high uncertainty because of the data that was used. As shown in Figure 4, the algorithm found six layers thicker than 300 m, five of which could be typed; for the 5.9–7.1 km layer, the three backscatter-only networks returned Continental, Dust, and Continental Polluted with comparable confidence, the consensus vote selected Continental, and the depolarisation-based networks did not execute.
Figure 4.
Aerosol typing based on NATALI 1.4.1 software showing six layers: the PBL considered as “Continental Polluted”, four free-tropospheric layers as “Continental”, and the cirrus layer above 7.9 km untyped (N/A). The horizontal axis spans the 2 h averaging window of the CLOP profiles (7 August 2025, 08:38–10:38 UTC), and only the classes present are shown.
3.5. Aerosol Source Identification
HYSPLIT 168 h backward trajectories (Figure 5) ending over Cluj-Napoca on August 7 at 09:00 UTC outline two distinct transport regimes [51]: the low-level 1000 m parcel remained strictly continental within Central/Eastern Europe, confirming that boundary layer aerosols were locally derived. In contrast, the 6000 and 8000 m trajectories demonstrate rapid zonal transport across North America and the North Atlantic Ocean within the westerlies. The 8000 m trajectory underwent rapid pyro-convective lifting from the boundary layer over western/central Canada on 2 August 2025, followed by sustained transport between 6000 and 8000 m altitude before arriving over Romania.
Figure 5.
The 168 h backward trajectory generated from the RADO-Cluj ACTRIS National Facility, starting on August 7, 09:00 UTC for altitudes of 1000, 6000, and 8000 m [51].
The lowest layer, according to NATALI (Figure 4), is a mix of continental and local pollution aerosols, which is expected. But the other layers are classified as continental aerosols [53]. The most important layer, the one between 6000 and 7000 m, is the one we identified as smoke, but the algorithm’s consensus vote qualifies it as continental. This may be because of the high uncertainty of the extinction profiles, and the aged smoke is quite similar in its properties to the continental aerosol [53]. Also, this smoke is assumed to have been long-range transported, so it would have suffered ageing processes that would have modified its initial properties and would have interacted with continental particles as it travelled over most of the European continent (Figure 5). The fact that it is actually smoke is also confirmed by the CAMS dispersion model that showcases the plume’s route (Figure 6).
Figure 6.
Transport of the air mass of Canadian BB (purple) in August 2025: August 1 00:00 UTC (upper left), August 5 00:00 UTC (upper right), August 7 00:00 UTC (lower left), and August 9 00:00 UTC (lower right) [12].
Copernicus CAMS organic matter optical depth (Figure 6) reanalyses tracked this plume continuously from Canadian wildfire clusters (August 1) across the North Atlantic (August 5) to the Carpathian Basin (August 7) [12].
3.6. Analysis of GRASP Columnar Aerosol Properties
While the data retrieved on 7 August 2025 is the initial period considered for the study, GRASP retrievals via DIVA could not be obtained due to the unavailability of a suitable inversion, similarly to the lack of AERONET inversion products on the same date. The analysis was, therefore, extended to 8, 9, and 10 August 2025, considering the continuity of the Canadian BB plume episode transported over Cluj-Napoca. For this time period, a total of 21 GRASP inversions were possible: four in the morning, 10 midday, and seven in the afternoon. The high number of midday and afternoon inversions can be associated with higher solar elevation and a broader range of scattering angles, which can enhance the reliability of almucantar retrievals.
Figure 7a shows the GRASP-retrieved AOD compared with AERONET for 8, 9, and 10 August, respectively, at different wavelengths and colour-coded by time of day. In all three cases, the AOD shows a negative spectral dependence: higher AOD values at low wavelengths, gradually decreasing toward higher wavelengths, for both GRASP and AERONET-retrieved data. Comparing the two types of retrievals, the results generally show higher AOD values for GRASP, especially for 8 August, where the discrepancies are considerably higher, possibly due to the different inversion frameworks, surface reflectance assumptions, and constraints.
Figure 7.
(a): GRASP and AERONET-retrieved AOD for 8, 9, and 10 August 2025, respectively, at different wavelengths, colour coded according to the time of day, with orange, green, and blue denoting morning, midday, and afternoon retrievals, respectively. (b–e): GRASP–AERONET bias distribution for SSA, AAOD, RRI, and IMRI, respectively, at 440, 675, 870, and 1020 nm for morning (orange), midday (green), and afternoon (blue). The boxes show the interquartile range compared to the zero-bias dashed horizontal line, while the median is indicated with the central line. The whiskers represent the distribution beyond the interquartile range, and the individual observations plotted outside the boxplot whiskers are outliers.
Figure 7b–e illustrate the difference between GRASP and AERONET retrievals for SSA, AAOD, RRI, and IMRI as a function of wavelengths and time of day for all three days (8, 9, 10 August). The values are expressed as GRASP minus AERONET, meaning positive values indicate higher GRASP values. Overall, the best agreement is found for SSA (Figure 7b) at 440 nm, where all three time of day runs cluster tightly around 0, with only two outliers. Starting with 675 nm, there is a persistent negative bias, where GRASP retrieves lower SSA than AERONET, meaning more absorbing particles, which is in line with the AAOD results (Figure 7c), as a lower SSA implies more absorption. At 440 nm, the bias is relatively small, growing substantially at 675 and 870 nm, where GRASP overestimates the AAOD values. At 1020 nm, the morning and midday bias remains high, while the afternoon values decrease close to 0. In terms of RRI (Figure 7d), the afternoon values are consistently the closest to zero, but also the most variable, with the biggest box plots and whiskers reaching or surpassing the 0 value. The RRI morning bias displays the largest bias and the most stable one, suggesting a consistent difference in the retrieval process, possibly linked to the morning geometry rather than a wavelength dependence. Similarly, IMRI (Figure 7e) displays the most negative bias in the morning, while the afternoon is closest to 0 and increases with wavelength.
The Ångström exponent calculated between 440 and 870 nm for each GRASP and AERONET run is shown in Figure 8a. A total of 20 out of 21 GRASP-derived values are perfectly time-correlated with the Ångström exponent from AERONET, ensuring a 1:1 comparison. GRASP retrieved considerably lower values of the Ångström exponent in the first part of the event: the afternoon of 8 August, the morning of 9 August, and its midday value, with the exception being the morning and midday values of 10 August. At the end of the event (midday and afternoon of 10 August), both GRASP and AERONET display the highest Ångström exponent values, which can be correlated to the dropping of the BB plume into the boundary layer and the local influences providing fresh, finer BB particles. The interference with local sources can also be seen in the higher values of AOD for 10 August compared to the other two days.
Figure 8.
(a): GRASP-derived Ångström exponent corresponding with AERONET retrievals at 440–870 nm. The 21 GRASP runs are represented according to their date (circle for 8 August, square for 9 August, and triangle for 10 August) and time of day (orange for morning, green for midday, and blue for afternoon). The 20 corresponding AERONET inversions are represented with black crosses. The horizontal axis gives the run number (1–21), (b) GRASP and AERONET-retrieved Volume Size distribution for 8 August 2025 (left), 9 August 2025 (middle), 10 August 2025 (right)). (b): GRASP and AERONET-retrieved volume size distribution represented as dV/dlnr as a function of particle radius r, shown on a logarithmic scale. Each curve is a retrieval run, with its colour palette representing the time of day category: orange for morning, green for midday, and blue for afternoon.
Figure 8b shows the volume size distribution comparisons between GRASP and AERONET, colour coded by time of day. In all three plots, the logarithmic concentrations from GRASP are higher at midday (green-coloured lines) compared to morning (orange palette) and afternoon (blue lines). On the first day (8 August), the AERONET inversions show a balanced fine/coarse fraction, while GRASP retrieved more disproportioned fractions, predominantly coarse, both in the midday and afternoon runs. On the next day, the fine/coarse proportions remain the same in the morning, reaching a coarse peak midday (run 8) and afterwards decreasing with the increase in concentrations of finer particles. On 10 August, the morning data for both GRASP and AERONET display a balanced fine/coarse fraction, with a sharp increase in the finer particles midday (starting with run 17), most likely due to the local sources providing fresh BB particles into the atmosphere. In the afternoon of 10 August, the fine/coarse fraction rebalances, reaching even lower values compared to the morning ones, which signals the presence of aerosol sinks, deposition, or fresh air. Overall, the GRASP-retrieved VSD is significantly higher than the values provided by AERONET, which is in line with the higher AOD presented previously in Figure 7a.
3.7. Satellite Perspective on the Ageing Plume
Figure 9 places the plume on the map. The OCI near-UV aerosol index exceeds 2 on 3 August in a continuous band from Saskatchewan and Manitoba across northern Ontario to Quebec; on 5 August, the band has moved north over Hudson Bay and northern Quebec, with a filament of index near 1 already propagating across the Atlantic to Iberia and France; on 7 August, a band of positive index enters the target region from the northeast; on 8 August, only a faint residual remains over Romania and the Black Sea. Where the index is highest, on 3 and 5 August over Canada, HARP2 returns a quality-screened retrieval in only 5 and 6% of those pixels: in 88–95% of them, the algorithm returns no retrieval at all, with the OCI cloud fraction being ≥0.5 in 62–73%, and of those retrieved, the quality flag removes a tenth on 3 August and a half on 5 August. Where retrievals exist at the edge of the dense band, they give an AOD of 0.6–0.8 at 550 nm, rising to 1.1–1.4 inside it. Over the Atlantic and Europe, the quality-screened coverage is 5–9% and 13–19% of the pixels on any day, and the diluted plume that reaches Romania on 8 August produces an AOD of 0.25–0.38 against a background of similar amplitude (0.20–0.37 over Europe outside Romania), without the index contrast that identifies it on the OCI panel.
Figure 9.
PACE view of the plume along its transport path: (a) HARP2 AOD550 on 3 August 2025; (b) OCI near-UV aerosol index on 3 August 2025; (c) HARP2 AOD550 on 5 August 2025; (d) OCI near-UV aerosol index on 5 August 2025; (e) HARP2 AOD550 on 7 August 2025; (f) OCI near-UV aerosol index on 7 August 2025; (g) HARP2 AOD550 on 8 August 2025; and (h) OCI near-UV aerosol index on 8 August 2025. In the left column, HARP2 AOD550 is shown for quality flag ≤ 3, with merged land and ocean products and daily composite over a 0.1° grid; grey areas indicate no quality-screened retrieval. In all panels, dashed meridians mark the source (50° W), North Atlantic (10° W), and Europe stage boundaries used in Figure 10; the solid black rectangle denotes the target region of Figure 11 and Figure 12; the open star marks Cluj-Napoca. Dashed black lines indicate HYSPLIT 6000 m (circles) and 8000 m (squares) back-trajectories ending at Cluj-Napoca on 7 August 09:00 UTC (Figure 5), with star symbols marking the parcel positions at 00:00 UTC of each day.
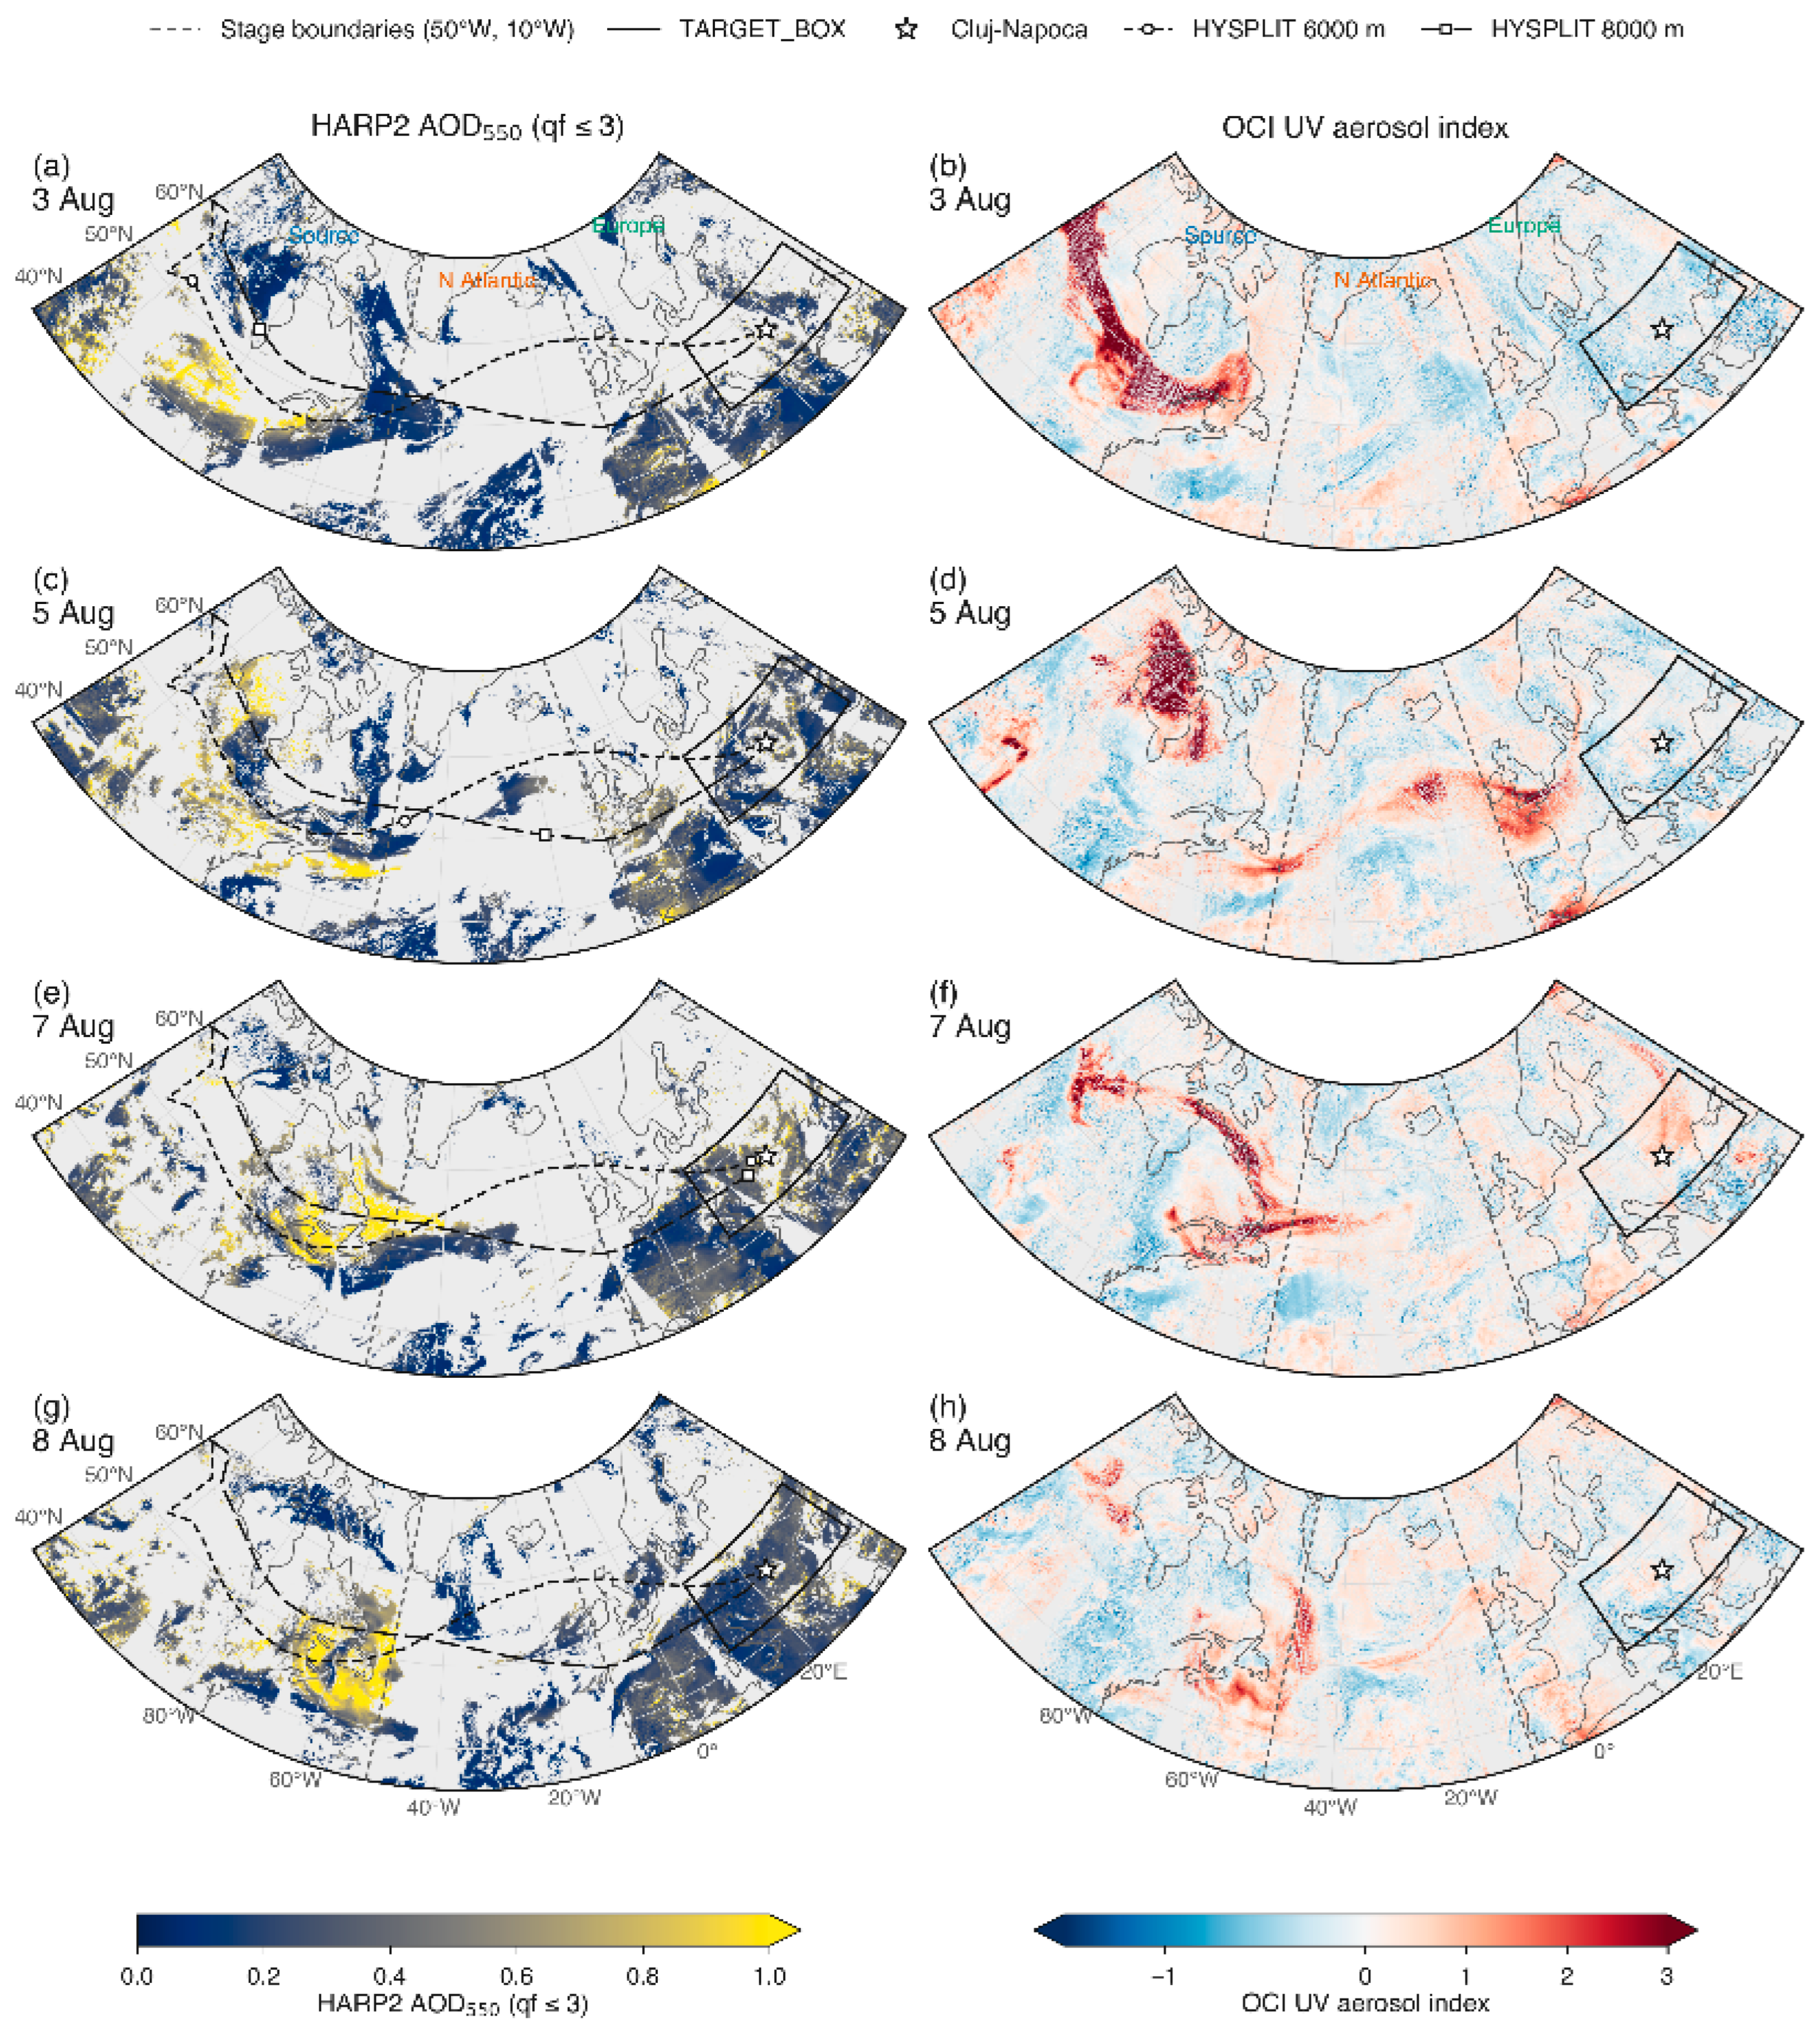
Figure 10.
Evolution of HARP2 retrievals along the transport path, 3–12 August 2025. The coloured line follows the transport pathway: on 3–7 August, quality flag ≤ 3 pixels within 300 km of the HYSPLIT 6000 and 8000 m back-trajectories ending at Cluj-Napoca on 7 August 09:00 UTC (digitised from Figure 5), coloured by the stage the parcel is in; from 8 August, pixels within the target region. Pixels are further required to have a collocated OCI aerosol index ≥ 0.5, OCI cloud fraction < 0.5, and not the dust signature (spherical fraction < 0.5, Ångström exponent < 0.7 and FMF < 0.5). (a) AOD at 550 nm, (b) FMF, (c) SSA at 440 nm, (d) Ångström exponent 440–870 nm, (e) fine-mode effective radius, (f) spherical fraction, (g) ALH, (h) fraction of plume pixels with a retrieval, split by quality flag; numbers in (h) are pixel counts in thousands. Lines are daily medians with interquartile shading; dotted lines use quality flag ≤ 1; open markers have fewer than 200 pixels. From 9 August, the plume pixels are mostly over land, where the HARP2 SSA carries the land retrieval caveat discussed in Section 3.9.
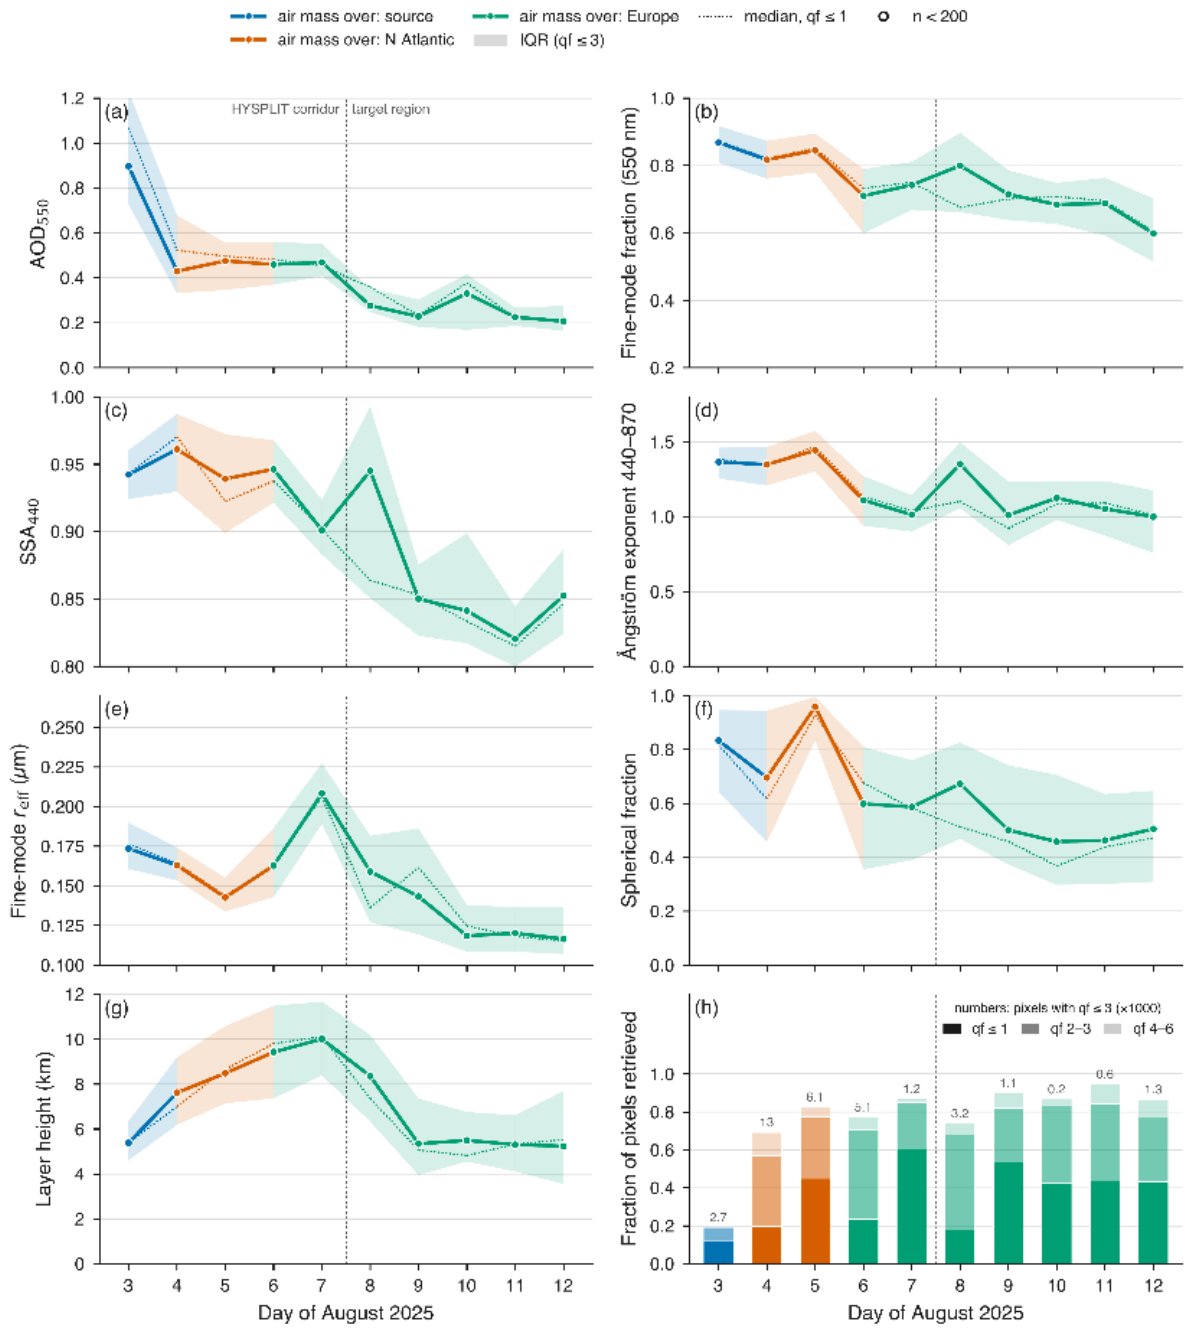
Figure 11.
HARP2 retrievals over the target region on 7 August 10:33 UTC (top) and 8 August 11:08 UTC (bottom): (a,d) AOD at 550 nm, (b,e) ALH, (c,f) SSA at 440 nm, all at quality flag ≤ 3. Hatching marks OCI cloud fraction ≥ 0.5; the rectangle is the Romania box; the star is Cluj-Napoca; the narrow track is SPEXone, with its flag-0 pixels coloured by AOD in (a,d) and the median black plus brown carbon volume share given in the panel.
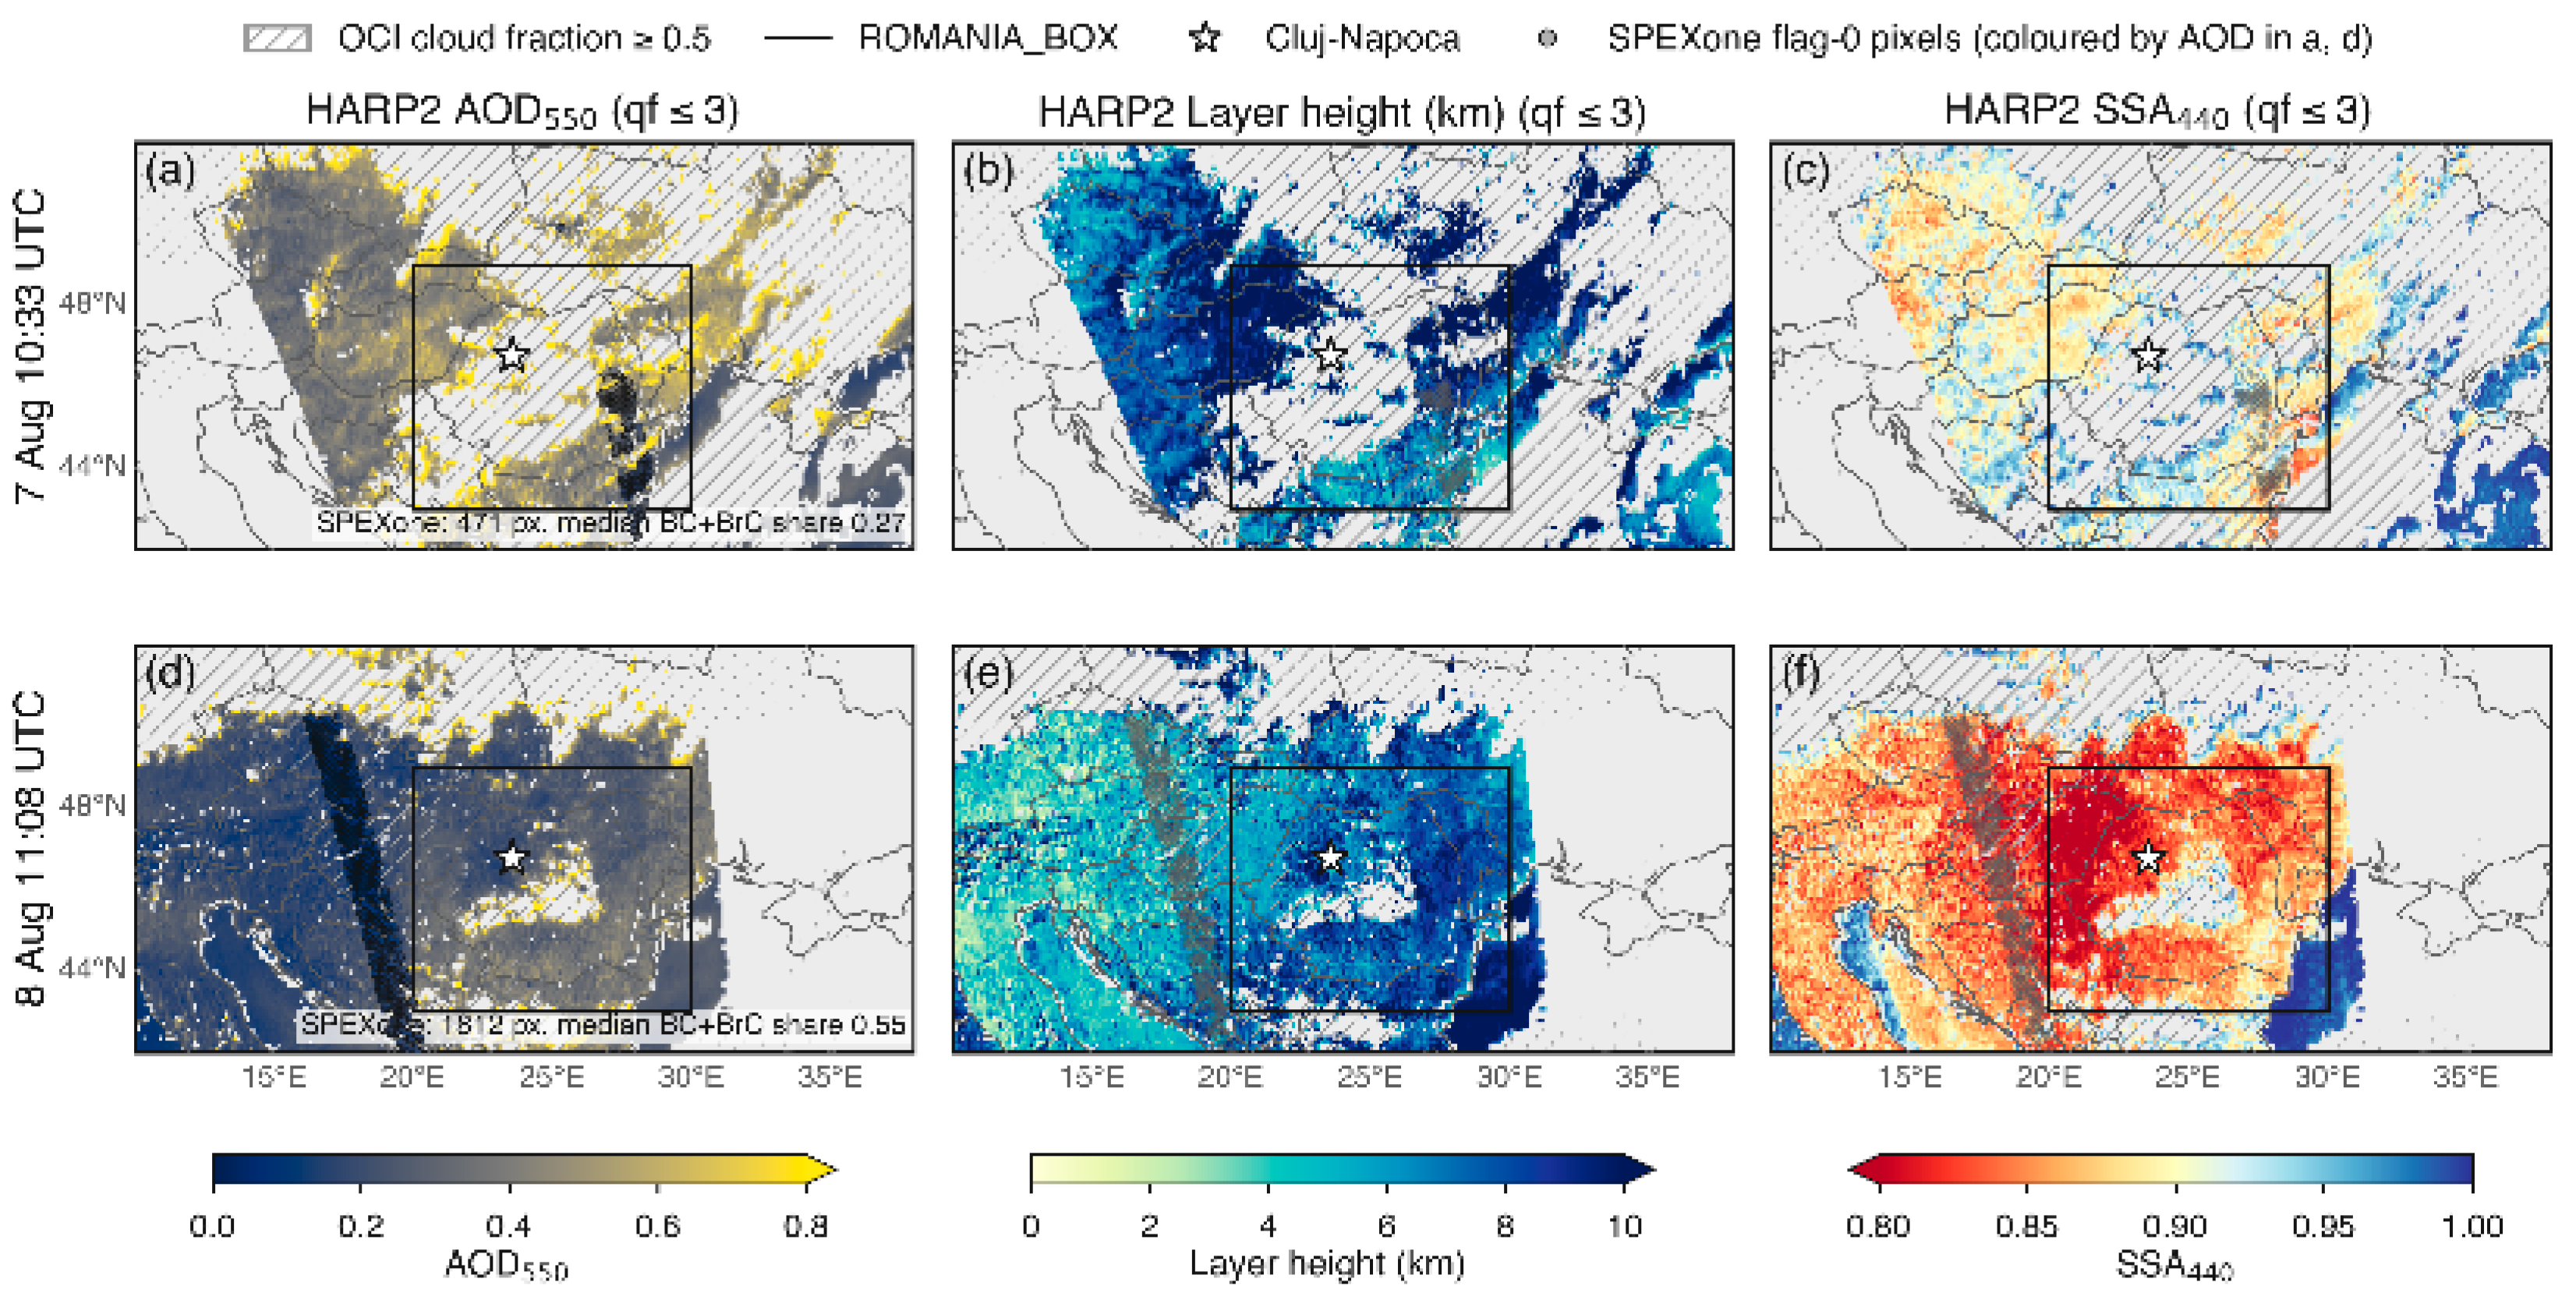
Figure 12.
Collocation of PACE retrievals within 50 km of Cluj-Napoca with the ground-based observations, 6–10 August 2025. (a) Spectral AOD from AERONET Level 2.0 within ± 60 min of each overpass (median and interquartile range), HARP2 (quality flag ≤ 3), and OCI; SPEXone has no flag-0 pixel within 50 km on any day, so its 90 flag-0 pixels within 100 km on 10 August are shown (open squares). (b) HARP2 ALH (median and interquartile range) against the layer boundaries reported by the ceilometer, the CLOP lidar, and the NATALI typing; all heights are above ground level, with the HARP2 ALH being the centre of the retrieved aerosol profile above the local surface [19]. (c) HARP2 lidar ratio and particle depolarisation ratio at 440.2 and 549.5 nm against the CLOP lidar’s derived lidar ratio and measured depolarisation ratio at 532 nm for the 5.9–7.1 km layer (filled square) and the two layers below it (open squares). The 549.5 and 532 nm values are compared without spectral adjustment: for aged tropospheric smoke, the lidar ratio rises only from 68 to 82 sr between 532 and 1064 nm [13], which implies a change of less than 1 sr between 532 and 549.5 nm.
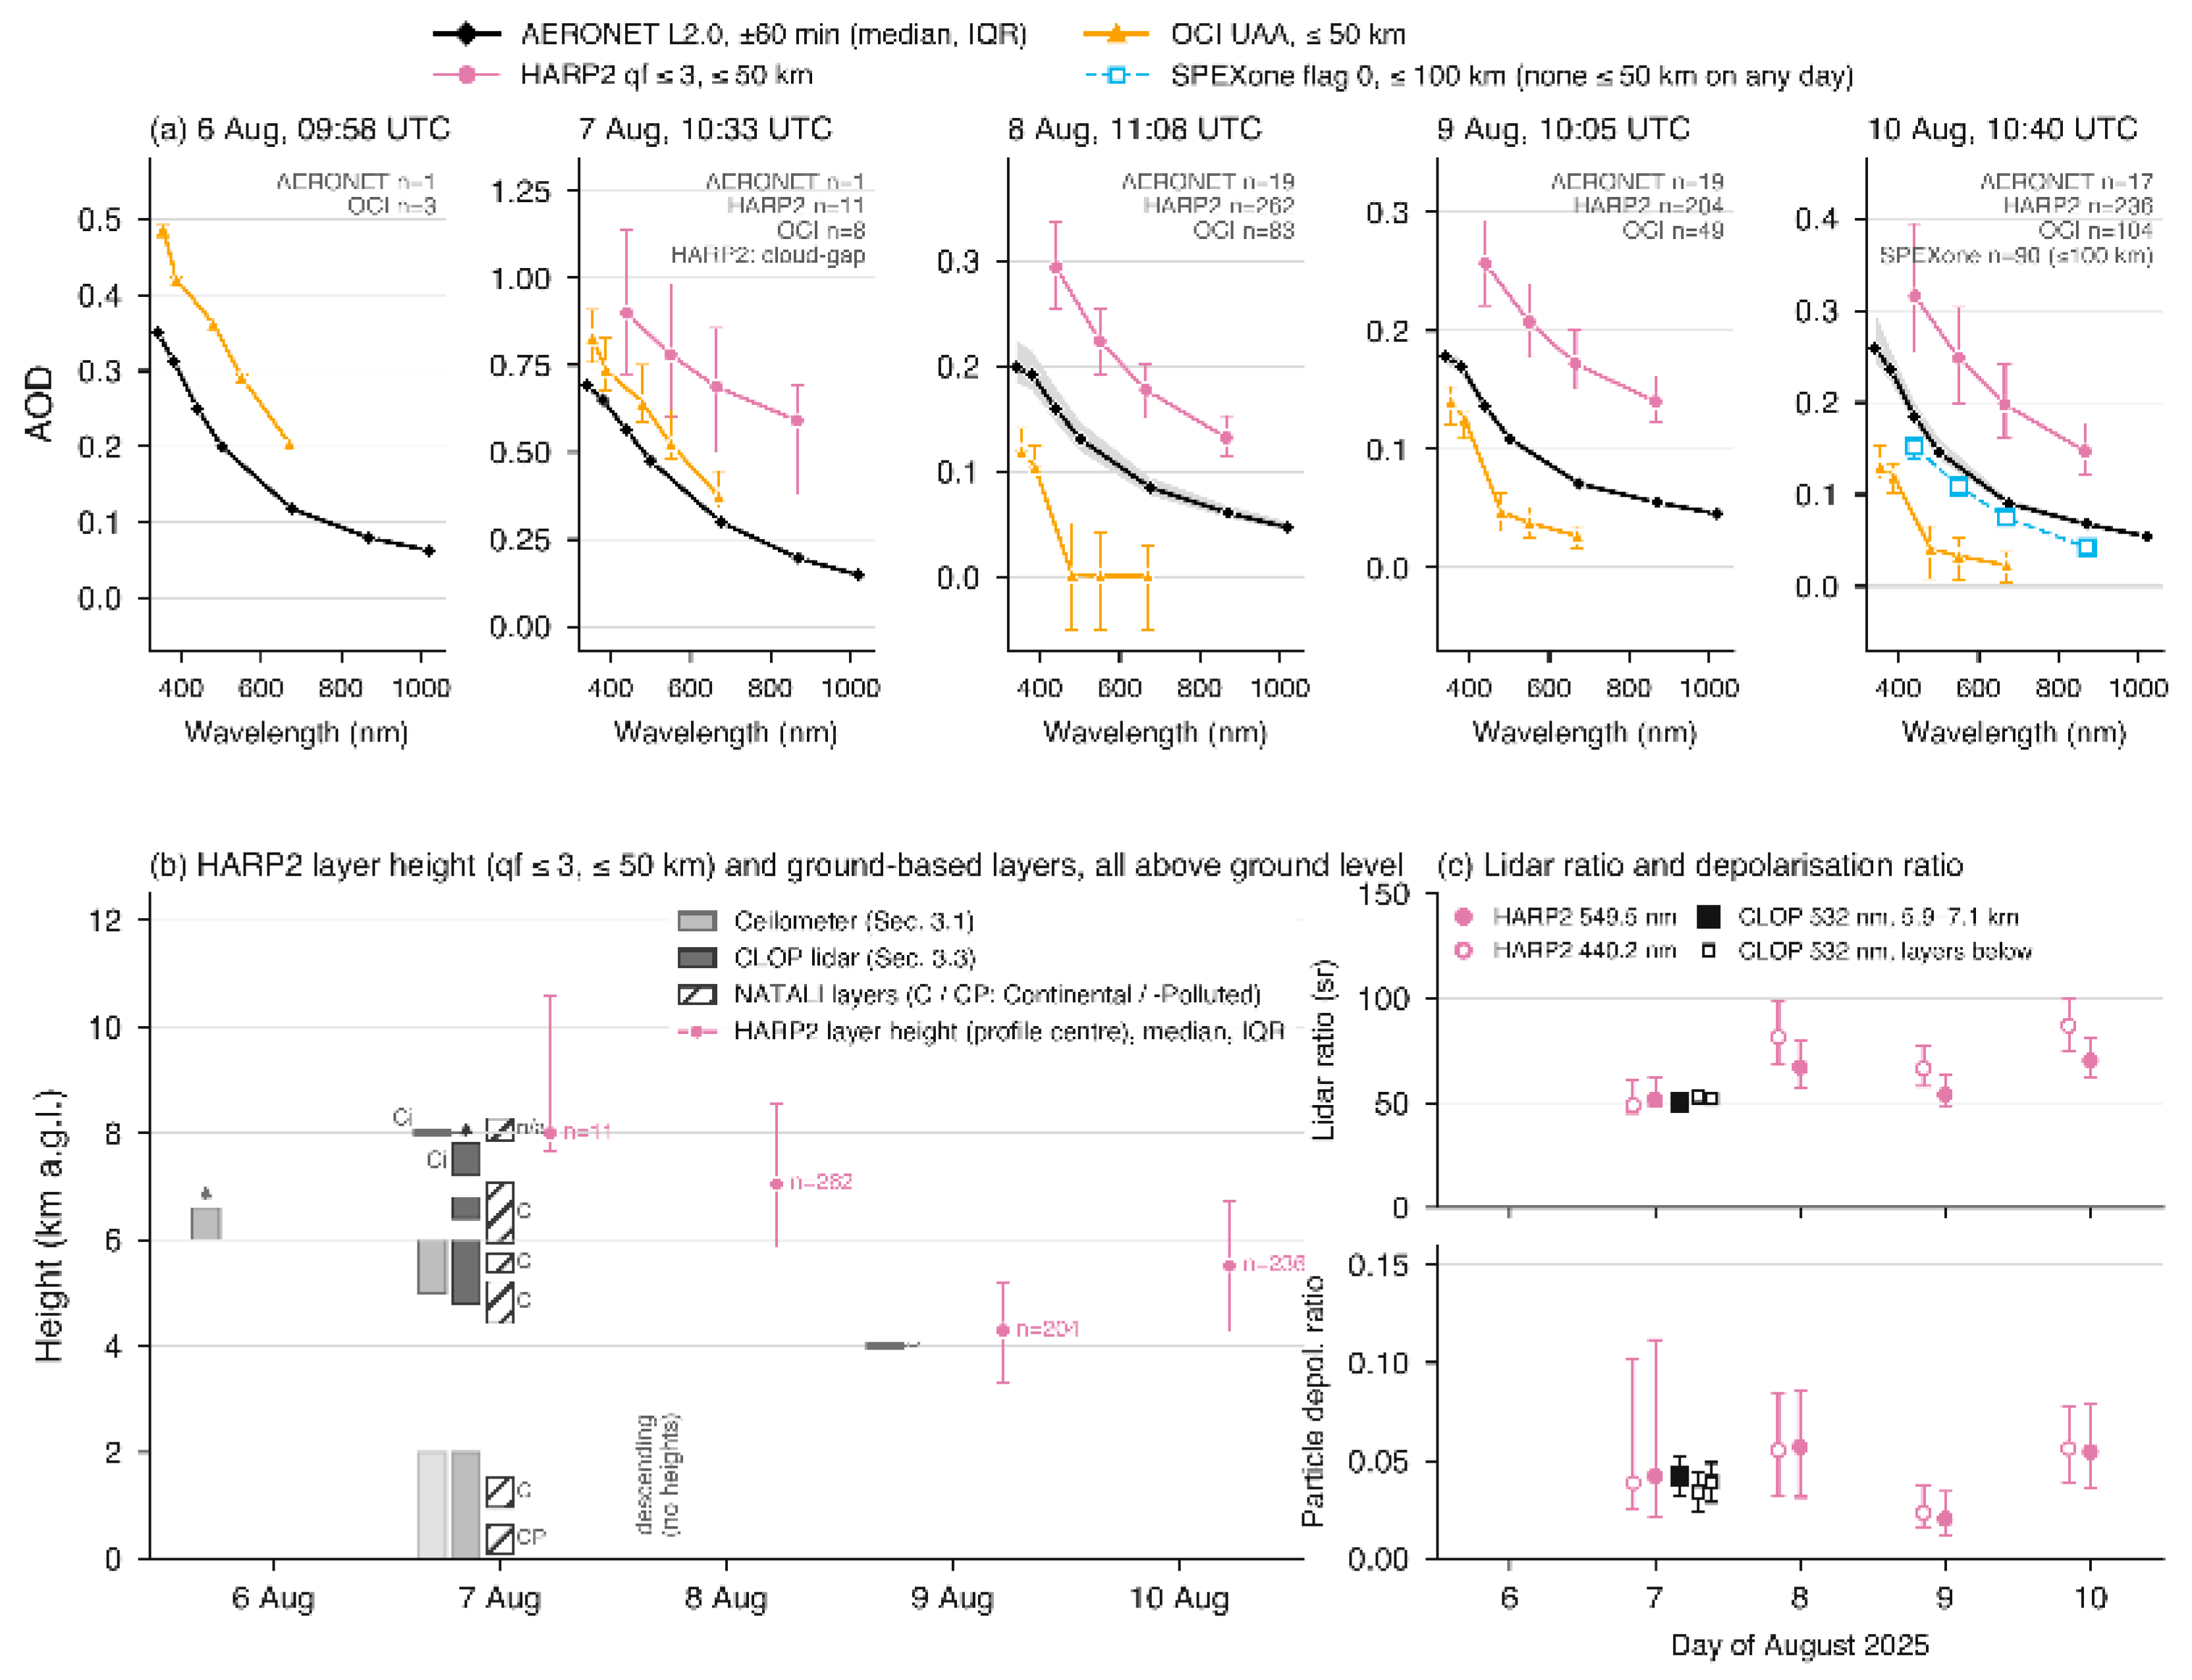
Figure 10 follows the transport pathway. Within the trajectory corridor, the quality-screened HARP2 AOD at 550 nm falls from 0.90 over the source (3 August) to 0.43–0.48 over the Atlantic (4–5 August), 0.46–0.47 over central Europe and then Hungary and Romania (6–7 August), and, once the selection switches to the target region, 0.28 (8 August) and 0.23 (9 August). The HARP2 ALH rises from 5.4 km over the source to 7.6, 8.5, and 9.4 km on 4, 5, and 6 August, reaches a maximum at 10.0 km on 7 August, and lowers to 8.4 km on 8 August and 5.4–5.5 km on 9–10 August, which is in step with the descent seen by the ceilometer on 8 August and the thin layer near 4 km on 9 August (Section 3.1). The fine-mode effective radius falls from 0.17 to 0.14 µm between 3 and 5 August, peaks at 0.21 µm on 7 August, and returns to 0.12–0.16 µm over the target region; the FMF stays between 0.7 and 0.9 until 9 August and falls to 0.60–0.69 on 10–12 August; the spherical fraction lies between 0.59 and 0.96 within the corridor and falls to 0.46–0.67 over the target region; and the SSA at 440 nm stays at 0.94–0.96 until 8 August, apart from 0.90 on 7 August, and declines to 0.84–0.85 on 9–10 August, when the plume pixels are mostly over land. In panel (h), the share of plume pixels with a quality flag ≤ 1 retrieval is 12–45% along the transport pathway and 18–54% over the target region, except on 8 August, when it falls to 18% and 74% of the measurements carrying flags 2 or 3, with four-fifths of them having fewer than 60 usable viewing angles.
Figure 11 shows the two overpasses that matter for the ground-based record. On 7 August at 10:33 UTC (within the lidar window of Figure 3), the OCI cloud fraction within 50 km of Cluj-Napoca has a median of 1.0 and exceeds 0.5 in 96% of the pixels, yet HARP2 retrieves 11 quality flag ≤ 3 pixels in the cloud gaps, with the nearest being 16.5 km away, with a median AOD of 0.78 at 550 nm, and SPEXone, crossing eastern Romania, returns 471 flag-0 pixels 257–610 km from the site with a median black plus brown carbon volume share of 0.27. On 8 August at 11:08 UTC, the scene is largely clear, and HARP2 delivers 40,555 quality-screened retrievals over the target region (14,600 over the Romania box, 262 within 50 km of the site), with an AOD of 0.25–0.38 at 550 nm across Romania, an ALH of 6.4–8.6 km, and an SSA at 440 nm of 0.87–0.88 over land against 0.997–0.999 over the adjacent Black Sea, a step of 0.12 at 10–30, 30–60, and 60–100 km from the shore that fails to diminish with distance and is, therefore, attributable to the two retrieval branches rather than to a change in the aerosol. SPEXone on the same pass returns 1812 flag-0 pixels 361–663 km from the site, along a track west of Romania, at 16–20°E, with a median share of 0.55; over the target region, 90% of the HARP2 land and 76% of the ocean retrievals pass quality flag ≤ 3, and over the Romania box, half of the land but only 4% of the ocean retrievals reach flag ≤ 1.
Figure 12 compares the satellite retrievals with the ground-based measurements at the site. In panel (a), the AERONET, HARP2, and OCI AOD at 550 nm are 0.114, 0.224, and 0.001 on 8 August, 0.095, 0.207, and 0.038 on 9 August, and 0.126, 0.248, and 0.033 on 10 August (AERONET within ±60 min of the overpass, HARP2 within 50 km; OCI negative in 40 of 83 pixels on 8 August). HARP2, therefore, exceeds AERONET by 0.11–0.12 on each clear day, and OCI falls short by 0.06–0.11; the HARP2 Ångström exponent is 1.18 and 0.89 on 8 and 9 August against 1.43 and 1.33. SPEXone returns no flag-0 pixel within 50 km of the site; on 10 August, the only day its sampling strip comes within 100 km, its 90 flag-0 pixels (75–100 km from the site, Figure 12a) give an AOD of 0.109, an Ångström exponent of 1.87, and a black plus brown carbon share of 0.47, against 0.126 and 1.52 from AERONET. On 7 August, the single AERONET observation gives 0.41, the 11 cloud-gap HARP2 pixels 0.78, and OCI 0.52. In panel (b), the HARP2 ALH is 8.0 km (interquartile range 7.7–10.6 km) on 7 August against the lidar layer at 5.9–7.1 km, with cirrus above 7.9 km; it is 7.0 km (5.9–8.6) on 8 August as the ceilometer layer descends; 4.3 km (3.3–5.2) on 9 August against the thin layer near 4 km seen by the ceilometer; and 5.5 km (4.3–6.7) on 10 August with no elevated layer detected from the ground during the daytime. In panel (c), the HARP2 lidar ratio at 549.5 nm on 7 August is 52 sr, and the particle depolarisation ratio is 0.042, against 50 sr and 0.042 from the CLOP lidar at 532 nm in the 5.9–7.1 km layer (48 sr at 355 nm); on the following days, the lidar ratio rises to 67 sr (8 August), 54 sr (9 August), and 70 sr (10 August), with depolarisation ratios of 0.06, 0.02, and 0.055.
3.8. Discussion
The picture that emerges from Section 3.1, Section 3.2, Section 3.3, Section 3.4, Section 3.5, Section 3.6 and Section 3.7 is of a plume that is optically prominent yet challenging to classify. Along the trajectory corridor, the quality-screened HARP2 retrievals describe a smoke layer whose optical depth decayed from about 0.9 over central Canada to 0.45 over the Atlantic and to 0.2–0.3 when it arrived over the Carpathian basin five to six days later, while its height rose from about 5 km to 10 km and then subsided to about 5 km over Romania (Figure 10). Both the magnitude of the decay and the vertical excursion are typical of trans-Atlantic boreal smoke: the 2017 Canadian plumes, lofted to 8–12 km, dispersed into discrete thin layers over Europe [16], and descended into the marine boundary layer of the eastern Atlantic within about two weeks [54]. Over Cluj-Napoca, the columnar optical depth fell from 0.39 at 500 nm on 7 August, about twice the August mean of 0.20 for the site, to 0.11–0.15 on 8–10 August (Table 4 and Figure 12a); that is, back to the level of the regional background.
The intensive properties that HARP2 retrieved along the way behave as an ageing smoke airmass is expected to. The fine-mode effective radius was 0.17 µm over the source and 0.21 µm after four days of transport, the growth by coagulation and condensation that is observed within hours downwind of wildfires [55] and that produces the 0.22–0.32 µm radii reported for smoke transported across North America [56]; the organic vapour condensation and oligomerisation behind it continue for days [7,9]. The SSA at 440 nm of 0.94–0.96 in the corridor, 0.90 on 7 August, matches the 0.92–0.95 measured in aged Canadian smoke over the Atlantic [54] and is consistent with the loss of brown carbon absorption that leaves black carbon as the residual absorber in boreal plumes after four to ten days [57]. The lidar ratio and particle depolarisation ratio that FastMAPOL reports for its retrieved solution, 52 sr and 0.042 at 549.5 nm in the cloud gaps of 7 August, agree with the CLARA-derived lidar ratio of 50 sr and the measured particle depolarisation ratio of 0.042 of the CLOP lidar at 532 nm in the 5.9–7.1 km layer, and both fall inside the range of aged tropospheric smoke established by multiwavelength Raman lidar, low depolarisation, and lidar ratios of 40–80 sr [13,16]; the lidar ratio agreement is a consistency check rather than a validation since the CLOP value is CLARA-derived (Table 2), whereas the depolarisation agreement rests on a measured quantity. The plume that arrived over Romania was thus, by every intensive measure available, aged BB aerosol.
The same measurements explain why it could not be named as such by the tools designed to do so. A lidar ratio near 50 sr, a depolarisation ratio below 0.05 and an Ångström exponent between 1 and 2 place the layer in the region of the intensive parameter space where aged smoke, continental pollution, and their mixtures intersect [14], a region that the decade-long climatology at the eastern edge of ACTRIS finds to be dominated by such mixed classes [15]. The three NATALI networks that ran on the 5.9–7.1 km layer returned three different answers, Continental, Dust, and Continental Polluted, with comparable confidence, and the consensus vote fell to Continental (Section 3.4). This is not a shortcoming specific to the algorithm. An aged plume that has accumulated secondary sulphate, nitrate, and organic material during transport is internally mixed with the continental aerosol it encountered [58], so its intensive properties align with those of its surroundings at the same time as its extensive signal fades.
The attenuation of the extensive signal is what defeats the satellite quantification. At a columnar optical depth of about 0.1, the plume sits at the level where every satellite-based aerosol product is known to be least accurate. Daytime spaceborne lidar does not detect free-tropospheric layers below roughly 0.02–0.08 in optical depth [59,60]; the best-validated polarimetric product currently available, SPEXone, has a root mean square error of 0.053 over land [18]; and the over land HARP2 retrieval is at an early stage: the only peer-reviewed validation we are aware of, for a research retrieval over China in 2024, reports a root mean square error of 0.15 against AERONET [61], while the operational land product used here has, to our knowledge, not yet been validated in the peer-reviewed literature. Against this background, the spread of the three PACE products at Cluj-Napoca on 8–10 August, OCI 0.00–0.04, HARP2 0.21–0.25, and SPEXone 0.11 on the one day its sampling strip came within 100 km, around an AERONET value of 0.10–0.13 (Figure 12a), is the state of the art at low aerosol load rather than an outlier of this case, and the discontinuity in SSA where the HARP2 land and ocean branches meet at the Black Sea coast (Figure 11f) is the kind that arises when two retrievals with different surface models meet [62]. What the polarimeter got right was not the amount of aerosol but its nature and its altitude: the ALH that tracked the ceilometer to within 0.3 km on 9 August, inside the ∼1 km that passive height products achieve [63], the lidar ratio and depolarisation that matched the ground-based lidar, and the black plus brown carbon volume fraction of 0.27–0.55 that SPEXone retrieved along its tracks through the region, although these tracks lay 75–660 km from the site, and only on 7 August did a third of their pixels fall under an OCI aerosol index above 0.5, so this fraction characterises the regional aerosol in which the plume was embedded rather than the plume itself. The rise of that fraction from 0.27 on 7 August to 0.55 on 8 August while the total AOD along the tracks fell from 0.28 to 0.08 is consistent with dilution of a smoke-enriched column into a background of higher carbon share, not with ageing; the carbon volume itself more than halved. The single-angle radiometer, by contrast, detected the plume at every stage through its near-UV index but could not quantify it once the index contrast had diminished. The information that identifies aged smoke thus survives longer in the polarimetric and vertical channels than in the optical depth itself, which is the quantity most retrievals, and most typing frameworks, start from. The specific limitations under which these conclusions hold are set out next.
3.9. Limitations
Ground-based observations. Throughout this study, several limitations were encountered, arising from technical constraints, unfavourable meteorological conditions, and data scarcity. Due to local infrastructural aspects and persistent low-level cloud cover on multiple days, routine daily measurements with the CLOP lidar could not be performed. This resulted in data gaps regarding the detailed backscatter coefficient profiles across several smoke intrusion events over Cluj-Napoca. CLARA’s weakest point is still data and training dependence. NATALI’s typing quality depends strongly on input optical quality, signal-to-noise ratio, and calibration, and mixture retrieval becomes less reliable when observation accuracy drops below about 20% [26,64]. In the present case, the extinction profiles fed to NATALI were themselves modelled from an assumed lidar ratio because the daytime measurement provided backscatter only, and the depolarisation-based networks did not run (Section 3.4); the typing result is, therefore, that of the three backscatter-only networks. The lidar inversion itself is reference height-dependent: the reference windows lay at 7.8–8.1 km, immediately below a cirrus layer, and no SCC-processed profile exists for this cloud-affected period against which the layer boundaries could be checked. In the future, the deployment of a high-power, automated lidar system capable of continuous operation is envisioned to prevent such extended observational gaps. Consequently, this work relies on the synergy between lidar and ceilometer observations, as the latter—despite its lower pulse energy—provides continuous measurements that offer key indications of substantial aerosol loadings.
Furthermore, unfavourable weather conditions and overcast skies not only hinder active lidar acquisitions but also preclude conclusive sun photometer retrievals due to insufficient direct solar irradiance reaching the detector. For this reason, valuable AERONET inversion products—such as the SSA, which would have provided a more detailed microphysical characterisation of the advected smoke particles—could not be retrieved on August 7. In terms of GRASP, the biggest limitation is the inversion quality that significantly drops when AOD (440) is lower or equal to 0.4 because the signal-to-noise ratio of the radiance measurements degrades, leading to unreliable aerosol properties. This is also the criterion for AERONET’s level 2.0 almucantar inversions, a condition that was unmet in the present study, and consequently, the GRASP-AERONET comparison was made with Level 1.5 products. Another source of uncertainty is the retrieval geometry of morning almucantars scanning at different scattering angles compared to the midday and afternoon scans, introducing a retrieval bias independent of the aerosol concentrations. Lastly, GRASP and the AERONET V3 algorithm do not partition spherical and non-spherical fractions identically, leading to systematic offsets in both parts of the refractive index.
Spaceborne observations. The satellite-based observations carry constraints of their own. The HARP2 over land AOD at the site exceeded AERONET by a factor of about two on every clear day, with an Ångström exponent that is 0.25–0.44 lower, so HARP2 AOD over land is only used here in a qualitative sense; the OCI product returned near-zero and negative values under the same conditions. HARP2 retrievals over the target region reached the operational quality recommendation (flag ≤ 1) in only 1% of ocean pixels and 43% of land pixels on 8 August, and the analysis is based on the relaxed flag ≤ 3 described in Section 2.3; version 4.0 of the product provides no per-pixel uncertainty with which this relaxation could be weighted. The polarimetric retrieval delivers nothing within 5 km of a coastline and little within 10 km, and its land and ocean branches disagree in SSA by 0.12 at the Black Sea, so absorption cannot be compared across the shoreline. In the dense part of the plume over Canada, 94–95% of pixels returned no quality-screened retrieval, so the source region values in Figure 10 describe the edges of the plume rather than its core. SPEXone, the only instrument with formal uncertainties and a carbon component retrieval, crossed the target region on a 100 km swath and returned no flag-0 pixel within 50 km of the site. On 7 August, the day of the lidar profile, the HARP2 values near the site rest on 11 cloud gap pixels.
4. Conclusions
This study followed a single plume of Canadian wildfire smoke from its source to Cluj-Napoca with ground-based active and passive remote sensing, trajectory and reanalysis models, and, for the first time, to our knowledge, for such an event over Eastern Europe, the multi-angle polarimetric retrievals of the PACE mission. Three results carry added value.
First, the plume was tracked along a dynamically connected transport pathway rather than as a sequence of isolated observations. Along the HYSPLIT corridor, the HARP2 retrievals resolved the ageing of the smoke daily, in its decaying optical depth, the rise and descent of the layer, the growth of the fine-mode radius, and the SSA of brown carbon-depleted smoke (Section 3.7). No single-angle sensor and no single ground station can produce this record.
Second, the intensive properties agreed across stations where the extensive ones did not. The lidar ratio and particle depolarisation ratio that the FastMAPOL retrieval reports for its solution, 52 sr and 0.042, matched the CLOP lidar’s derived lidar ratio of 50 sr and measured depolarisation ratio of 0.042 in the 5.9–7.1 km layer, while the three satellite optical depth products disagreed with each other by 0.2 at the site and the three typing networks disagreed among themselves. The quantities that identify aged smoke persisted in the polarimetric and vertical channels after they had become ineffective in the optical depth and the Ångström exponent.
Third, the incapacity to name the layer as smoke was shown to be a property of the aged aerosol and of the low signal, not of any one instrument. At a columnar optical depth near 0.1, an internally mixed plume with a lidar ratio of 50 sr and depolarisation of 0.04 falls where smoke and continental classes overlap in the classification schemes considered here and where every satellite optical depth product is at the limit of its accuracy.
For this episode, the findings suggest a change in order in how such events should be characterised. Classification frameworks built on intensive lidar parameters [65] and on polarimetric retrievals of absorption, size, and shape [66] each have been demonstrated on their own platform; the present case suggests that the two can be joined. A satellite polarimeter that retrieves lidar ratio, depolarisation, ALH, and, where its swath allows, a carbon component fraction can be combined with a ground-based lidar on exactly those quantities, and agreement on them can be used to confirm a layer’s type before, and independently of, its optical depth. For thin, aged plumes, this intensive-first collocation proved more robust here than the classical route of validating AOD and Ångström exponent first, which in this case would have rejected the satellite data altogether. Three developments would make it operational: night-time Raman measurements that provide measured rather than modelled extinction, so that the typing networks can use all of their inputs; a HARP2 over land product with per-pixel uncertainties, which would allow the relaxed quality screening used here to be weighted rather than applied as a limit; and a chain of ACTRIS stations along the transport path, so that the satellite corridor of Figure 10 can be anchored to ground-based intensive measurements at more than one point. Whether this holds beyond a single episode and a single receptor site remains to be tested. The Cluj-Napoca station, an ACTRIS National Facility for aerosol and cloud remote sensing, one of the few in Eastern Europe, is well placed to serve as the eastern anchor of such a chain.
Supplementary Materials
The following supporting information can be downloaded at: https://www.mdpi.com/article/10.3390/rs18213776/s1, Table S1: Sensitivity of the satellite–ground collocation at Cluj-Napoca (46.77°N, 23.55°E) to the collocation radius, 6–10 August 2025. Radius columns: number of quality-screened pixels within the radius and their median aerosol optical depth (AOD) at 550 nm (0: none). Overpass = the Hyper-Angular Rainbow Polarimeter (HARP2) granule with the most flag-≤ 3 pixels within 50 km (as in Figure 12); Ocean Color Instrument (OCI) and Spectro-Polarimeter for Planetary EXploration one (SPEXone) from the granule with the same time stamp. Nearest: great-circle distance from the site to the nearest quality-screened pixel of that granule, at any distance. Aerosol Robotic Network (AERONET): Level 2.0 observation nearest to the overpass (Δt = observation minus overpass time), number of observations within ±60 min and their median AOD at 550 nm. Screening: HARP2 quality flag ≤ 3 (sensitivity ≤ 1), SPEXone flag 0, OCI pixels flagged as cloud or ice, or with high sensor or solar zenith angle, excluded; Table S2: Sensitivity of the HARP2 retrievals to the quality flag: flag ≤ 3 (used in the main text; χ2 ≤ 2 and ≥30 usable viewing angles) versus the operational recommendation flag ≤ 1 (χ2 ≤ 1.5, ≥60 angles). Land and ocean products merged pixel by pixel, all granules of each day. Transport path: the Lagrangian series of Figure 10 (3–7 August within ±300 km of the Hybrid Single-Particle Lagrangian Integrated Trajectory (HYSPLIT) 6000 and 8000 m trajectories, from 8 August the target region; OCI aerosol index ≥ 0.5, OCI cloud fraction < 0.5, dust signature excluded). Target region: all pixels in 10–38°E, 42–52°N on 8–10 August. (a) Daily medians, flag ≤ 3/flag ≤ 1, with the pixel counts; *: the flag ≤ 1 median lies outside the flag ≤ 3 interquartile range (IQR) of the same day. (b) Per parameter: days on which the flag ≤ 1 median lies within the flag ≤ 3 IQR, median and maximum absolute difference between the two daily medians, and median width of the flag ≤ 3 IQR. Parameters: AOD and fine-mode fraction (FMF) at 550 nm, single-scattering albedo (SSA) at 440 nm, Ångström exponent between 440 and 870 nm, fine-mode effective radius, spherical fraction, and aerosol layer height (ALH) above the local surface.
Author Contributions
Conceptualisation, N.A. and A.M.; methodology, A.-M.C.; software, A.M., C.T. and L.B.; formal analysis, A.-M.C., A.M., C.G., H.-I.Ș., C.T. and L.B.; investigation, A.-M.C., C.G., H.-I.Ș., A.-T.R., C.T. and L.B.; data curation, A.M.; writing—original draft preparation, A.-M.C., A.M. and C.G.; writing—review and editing, N.A., H.-I.Ș. and A.-T.R.; visualisation, A.M. and A.-T.R.; supervision, N.A.; project administration, N.A.; funding acquisition, N.A. All authors have read and agreed to the published version of the manuscript.
Funding
This work was was financed by Smart Growth, Digitization and Financial Instruments Program (PoCIDIF) 2021–2027, Action 1.3 Integration of the national RDI ecosystem in the European and international Research Space, project “Supporting the operation of facilities in Romania within the ACTRIS ERIC research infrastructure”, SMIS code 309113.This work was supported by a grant of the Ministry of Research, Innovation and Digitization, CNCS-UEFISCDI, project number PN-IV-P2-2.1-TE-2023-1587, within PNCDI IV.
Data Availability Statement
Data from AERONET are available at https://aeronet.gsfc.nasa.gov/new_web/index.html (accessed on 20 July 2026) CLOUDNET data available at https://cloudnet.fmi.fi/search/visualizations?site=cluj (accessed on 17 October 2025). The HYSPLIT back-trajectory is available at https://www.ready.noaa.gov/HYSPLIT.php (accessed on 20 October 2025). GRASP-OPEN code supported by GRASP SAS is available at https://www.grasp-open.com/ (accessed on 15 September 2026). For more information about the DIVA platform, see www.diva-platform.com, and the platform is available by request through GRASP-Cloud registration. PACE Level-2 aerosol products are distributed by the NASA Ocean Biology DAAC: OCI AER_UAA (https://doi.org/10.5067/PACE/OCI/L2/AER_UAA/3.1), HARP2 MAPOL_OCEAN and MAPOL_LAND, and SPEXone AER_RTAPOCEAN and AER_RTAPLAND (version 4.0; https://doi.org/10.5067/PACE/HARP2/L2/MAPOL_OCEAN/4.0, https://doi.org/10.5067/PACE/HARP2/L2/MAPOL_LAND/4.0, https://doi.org/10.5067/PACE/SPEXone/L2/AER_RTAPOCEAN/4.0, https://doi.org/10.5067/PACE/SPEXone/L2/AER_RTAPLAND/4.0).
Acknowledgments
During the preparation of this manuscript, the authors used Google Gemini 3.8 Flash for translation and drafting of parts of the text and Anthropic’s Claude Opus 5 and Fable 5 for language editing, writing, and running the data processing and figure generation code of the satellite analysis, and literature retrieval. The authors have reviewed and edited all output and take full responsibility for the content of this publication.
Conflicts of Interest
The authors declare no conflicts of interest. The funders had no role in the design of the study; in the collection, analyses, or interpretation of data; in the writing of the manuscript; or in the decision to publish the results.
References
- Almetwally, A.A.; Bin-Jumah, M.; Allam, A.A. Ambient air pollution and its influence on human health and welfare: An overview. Environ. Sci. Pollut. Res. 2020, 27, 24815–24830. [Google Scholar] [CrossRef] [Scilit] [PubMed]
- Szkop, A.; Pietruczuk, A. Analysis of aerosol transport over southern Poland in August 2015 based on a synergy of remote sensing and backward trajectory techniques. J. Appl. Remote Sens. 2017, 11, 016039. [Google Scholar] [CrossRef] [Scilit]
- Ahrens, D.C.; Henson, R. Meteorology Today: An Introduction to Weather, Climate, and the Environment, 12th ed.; Cengage Learning: Belmont, CA, USA, 2019. [Google Scholar]
- Ştefan, S.; Nicolae, D.; Caian, M. Secretele Aerosolului Atmosferic în Lumina Laserilor; Editura Ars Docendi: Bucharest, Romania, 2008. [Google Scholar]
- Choobari, O.A.; Zawar-Reza, P.; Sturman, A. The global distribution of mineral dust and its impacts on the climate system: A review. Atmos. Res. 2014, 138, 152–165. [Google Scholar] [CrossRef] [Scilit]
- Kok, J.F.; Storelvmo, T.; Karydis, V.A.; Adebiyi, A.A.; Mahowald, N.M.; Evan, A.T.; He, C.; Leung, D.M. Mineral dust aerosol impacts on global climate and climate change. Nat. Rev. Earth Environ. 2023, 4, 71–86. [Google Scholar] [CrossRef] [Scilit]
- He, Y.; Zhao, B.; Wang, S.; Valorso, R.; Chang, X.; Yin, D.; Feng, B.; Camredon, M.; Aumont, B.; Dearden, A.; et al. Formation of secondary organic aerosol from wildfire emissions enhanced by long-time ageing. Nat. Geosci. 2024, 17, 124–129. [Google Scholar] [CrossRef] [Scilit]
- Jacobson, M.Z. Strong radiative heating due to the mixing state of black carbon in atmospheric aerosols. Nature 2001, 409, 695–697. [Google Scholar] [CrossRef] [Scilit] [PubMed]
- Zhou, S.; Collier, S.; Jaffe, D.A.; Briggs, N.L.; Hee, J.; Sedlacek, A.J., III; Kleinman, L.; Onasch, T.B.; Zhang, Q. Regional influence of wildfires on aerosol chemistry in the western US and insights into atmospheric aging of biomass burning organic aerosol. Atmos. Chem. Phys. 2017, 17, 2477–2493. [Google Scholar] [CrossRef] [Scilit]
- Holloway, A.M.; Wayne, R.P. Atmospheric Chemistry; Royal Society of Chemistry: London, UK, 2010. [Google Scholar]
- Government of Canada. Canadian Wildland Fire Information System: National Wildland Fire Summary 2025; Technical Report; Natural Resources Canada: Ottawa, ON, Canada, 2025. [Google Scholar]
- Copernicus Atmosphere Monitoring Service (CAMS). Highest Wildfire Emissions in at Least 23 Years for Europe After a Hectic Summer; Technical Report; ECMWF: Reading, UK, 2025; Available online: https://atmosphere.copernicus.eu/highest-wildfire-emissions-least-23-years-europe-after-hectic-summer (accessed on 16 October 2025).
- Haarig, M.; Ansmann, A.; Baars, H.; Jimenez, C.; Veselovskii, I.; Engelmann, R.; Althausen, D. Depolarization and lidar ratios at 355, 532, and 1064 nm and microphysical properties of aged tropospheric and stratospheric Canadian wildfire smoke. Atmos. Chem. Phys. 2018, 18, 11847–11861. [Google Scholar] [CrossRef] [Scilit]
- Floutsi, A.A.; Baars, H.; Engelmann, R.; Althausen, D.; Ansmann, A.; Bohlmann, S.; Heese, B.; Hofer, J.; Kanitz, T.; Haarig, M.; et al. DeLiAn—A growing collection of depolarization ratio, lidar ratio and Ångström exponent for different aerosol types and mixtures from ground-based lidar observations. Atmos. Meas. Tech. 2023, 16, 2353–2379. [Google Scholar] [CrossRef] [Scilit]
- Nicolae, D.; Ciocan, G.-A.; Nemuc, A.; Nicolae, V.; Talianu, C.; Vasilescu, J.; Dandocsi, A.; Radu, C.; Cazacu, M.-M.; Vulturescu, V.; et al. Examining the characteristics of aerosols: A statistical analysis based on a decade of lidar and photometer observations at the Eastern border of ACTRIS. Atmos. Meas. Tech. 2026, 19, 1179–1199. [Google Scholar] [CrossRef] [Scilit]
- Vaughan, G.; Draude, A.P.; Ricketts, H.M.A.; Schultz, D.M.; Adam, M.; Sugier, J.; Wareing, D.P. Transport of Canadian forest fire smoke over the UK as observed by lidar. Atmos. Chem. Phys. 2018, 18, 11375–11388. [Google Scholar] [CrossRef] [Scilit]
- Li, Z.; Painemal, D.; Schuster, G.; Clayton, M.; Ferrare, R.; Vaughan, M.; Josset, D.; Kar, J.; Trepte, C. Assessment of tropospheric CALIPSO Version 4.2 aerosol types over the ocean using independent CALIPSO–SODA lidar ratios. Atmos. Meas. Tech. 2022, 15, 2745–2766. [Google Scholar] [CrossRef] [Scilit]
- Fu, G.; Rietjens, J.; Laasner, R.; van der Schaaf, L.; van Hees, R.; Yuan, Z.; van Diedenhoven, B.; Hannadige, N.; Landgraf, J.; Smit, M.; et al. Aerosol Retrievals From SPEXone on the NASA PACE Mission: First Results and Validation. Geophys. Res. Lett. 2025, 52, e2024GL113525. [Google Scholar] [CrossRef] [Scilit]
- Gao, M.; Franz, B.A.; Zhai, P.-W.; Knobelspiesse, K.; Sayer, A.M.; Xu, X.; Martins, J.V.; Cairns, B.; Castellanos, P.; Fu, G.; et al. Simultaneous retrieval of aerosol and ocean properties from PACE HARP2 with uncertainty assessment using cascading neural network radiative transfer models. Atmos. Meas. Tech. 2023, 16, 5863–5881. [Google Scholar] [CrossRef] [Scilit]
- Ajtai, N.; Ștefănie, H.; Ozunu, A. Description of aerosol properties over Cluj-Napoca derived from AERONET sun-photometric data. Environ. Eng. Manag. J. 2013, 12, 227–232. [Google Scholar] [CrossRef] [Scilit]
- Ştefănie, H.I.; Radovici, A.; Mereuţă, A.; Arghiuş, V.; Cămărăşan, H.; Costin, D.; Botezan, C.; Gînscă, C.; Ajtai, N. Variation of aerosol optical properties over Cluj-Napoca, Romania, based on 10 years of AERONET data and MODIS MAIAC AOD product. Remote Sens. 2023, 15, 3072. [Google Scholar] [CrossRef] [Scilit]
- Laj, P.; Myhre, C.L.; Riffault, V.; Amiridis, V.; Fuchs, H.; Eleftheriadis, K.; Petäjä, T.; Salameh, T.; Kivekäs, N.; Juurola, E.; et al. Aerosol, Clouds and Trace Gases Research Infrastructure (ACTRIS): The European research infrastructure supporting atmospheric science. Bull. Amer. Meteor. Soc. 2024, 105, E1098–E1136. [Google Scholar] [CrossRef] [Scilit]
- Cloudnet Data Portal. Cluj-Napoca Observation Site. 2025. Available online: https://cloudnet.fmi.fi/site/cluj (accessed on 17 October 2025).
- Ştefănie, H.I.; Radovici, A.; Mereuţă, A.; Cămărăşan, H.; Ajtai, N. Detection of local and long-range transported aerosol intrusions over Cluj-Napoca, Romania using multiwavelength lidar measurements in spring 2022. In Proceedings of the 22nd SGEM International Multidisciplinary Scientific GeoConference; STEF92 Technology: Vienna, Austria, 2022; pp. 295–302. [Google Scholar]
- Nicolae, D.; Talianu, C.; Cazacu, M.; Carstea, E.; Radu, R. Saharan dust event over Bucharest observed by an elastic backscatter lidar. Proc. SPIE 2007, 6750, 67501C. [Google Scholar] [CrossRef] [Scilit]
- Nicolae, D.; Vasilescu, J.; Talianu, C.; Binietoglou, I.; Nicolae, V.; Andrei, S.; Antonescu, B. A neural network aerosol-typing algorithm based on lidar data. Atmos. Chem. Phys. 2018, 18, 14511–14537. [Google Scholar] [CrossRef] [Scilit]
- Papagiannopoulos, N.; Mona, L.; Amodeo, A.; D’Amico, G.; Grumetto, S.; Amiridis, V. An automatic aerosol classification for EARLINET: Application and results. Atmos. Meas. Tech. 2020, 13, 4275–4295. [Google Scholar]
- Belegante, L.; Nicolae, D.; Nemuc, A.; Talianu, C.; Derognat, C. Retrieval of the boundary layer height from active and passive remote sensors. Comparison with a NWP model. Acta Geophys. 2014, 62, 276–289. [Google Scholar] [CrossRef] [Scilit]
- Nicolae, D.; Talianu, C.; Vasilescu, J.; Nicolae, V.; Stachlewska, I.S. Strengths and limitations of the NATALI code for aerosol typing from multiwavelength Raman lidar observations. EPJ Web Conf. 2018, 176, 05005. [Google Scholar] [CrossRef] [Scilit]
- Hess, M.; Koepke, P.; Schult, I. Optical properties of aerosols and clouds: The software package OPAC. Bull. Amer. Meteor. Soc. 1998, 79, 831–844. [Google Scholar] [CrossRef] [Scilit]
- Câțu, A. UBB CHM 15k. 2025. Available online: https://instrumentdb.out.ocp.fmi.fi/instrument/d6bf209b-c48b-48a4-bbfb-fed713b27832 (accessed on 17 October 2025).
- Stachlewska, I.S.; Piądłowski, M.; Migacz, S.; Szkop, A.; Zielińska, A.J.; Swaczyna, P.L. Ceilometer observations of the boundary layer over Warsaw, Poland. Acta Geophys. 2012, 60, 1386–1412. [Google Scholar] [CrossRef] [Scilit]
- Cimel Electronique. CE318-T: Sun-Sky-Lunar Multispectral Photometer. 2025. Available online: https://www.cimel.fr (accessed on 17 October 2025).
- Holben, B.N.; Eck, T.F.; Slutsker, I.; Tanré, D.; Buis, J.P.; Setzer, A.; Vermote, E.; Reagan, J.A.; Kaufman, Y.J.; Nakajima, T.; et al. AERONET—A federated instrument network and data archive for aerosol characterization. Remote Sens. Environ. 1998, 66, 1–16. [Google Scholar] [CrossRef] [Scilit]
- NASA. AERONET Aerosol Optical Depth Data Display Interface: Site CLUJ_UBB Level 2.0. NASA GSFC. 2025. Available online: https://aeronet.gsfc.nasa.gov (accessed on 20 July 2026).
- Dubovik, O.; Lapyonok, T.; Litvinov, P.; Herman, M.; Fuertes, D.; Ducos, F.; Lopatin, A.; Chaikovsky, A.; Torres, B.; Derimian, Y.; et al. GRASP: A Versatile Algorithm for Characterizing the Atmosphere. SPIE Newsroom 2014. ahead of print. [Google Scholar] [CrossRef] [Scilit]
- Dubovik, O.; King, M.D. A flexible inversion algorithm for retrieval of aerosol optical properties from Sun and sky radiance measurements. J. Geophys. Res. Atmos. 2000, 105, 20673–20696. [Google Scholar] [CrossRef] [Scilit]
- Román, R.; Benavent-Oltra, J.A.; Casquero-Vera, J.A.; Lopatin, A.; Cazorla, A.; Lyamani, H.; Denjean, C.; Fuertes, D.; Pérez-Ramírez, D.; Torres, B.; et al. Retrieval of aerosol profiles combining sunphotometer and ceilometer measurements in GRASP code. Atmos. Res. 2018, 204, 161–177. [Google Scholar] [CrossRef] [Scilit]
- Sinyuk, A.; Holben, B.N.; Eck, T.F.; Giles, D.M.; Slutsker, D.S.; Korkin, I.; Schafer, J.S.; Smirnov, A.; Sorokin, M.; Lyapustin, A. The AERONET Version 3 aerosol retrieval algorithm, associated uncertainties and comparisons to Version 2. Atmos. Meas. Tech. 2020, 13, 3375–3411. [Google Scholar] [CrossRef] [Scilit]
- Torres, B.; Fuertes, D.; Nicolae, D.; Dubovik, O.; Goloub, P.; Lopatin, A.; Binietoglou, I.; Belegante, L.; Ene, D.; Cede, A.; et al. DIVA: Demonstration of an integrated approach for the validation and exploitation of atmospheric missions. AGU Fall Meet. Abstr. 2019, 2019, A13K-2968. [Google Scholar]
- Werdell, P.J.; Cairns, B.; Caplan, S.A.; Cetinić, I.; Foley, S.R.; Franz, B.A.; Gao, M.; Fasnacht, Z.T.; Huemmrich, K.F.; Ibrahim, A.; et al. Advancing Earth System Science with the NASA Plankton, Aerosol, Cloud, Ocean Ecosystem (PACE) Satellite Mission. Glob. Change Biol. 2026, 32, e70869. Available online: https://ui.adsabs.harvard.edu/abs/2019AGUFM.A13K2968T/abstract (accessed on 17 October 2025). [CrossRef] [Scilit] [PubMed]
- Remer, L.A.; Davis, A.B.; Mattoo, S.; Levy, R.C.; Kalashnikova, O.V.; Coddington, O.; Chowdhary, J.; Knobelspiesse, K.; Xu, X.; Ahmad, Z.; et al. Retrieving Aerosol Characteristics From the PACE Mission, Part 1: Ocean Color Instrument. Front. Earth Sci. 2019, 7, 152. [Google Scholar] [CrossRef] [Scilit]
- Hasekamp, O.P.; Fu, G.; Rusli, S.P.; Wu, L.; Di Noia, A.; de Brugh, J.A.; Landgraf, J.; Smit, J.M.; Rietjens, J.; van Amerongen, A. Aerosol measurements by SPEXone on the NASA PACE mission: Expected retrieval capabilities. J. Quant. Spectrosc. Radiat. Transf. 2019, 227, 170–184. [Google Scholar] [CrossRef] [Scilit]
- Remer, L.A.; Knobelspiesse, K.; Zhai, P.-W.; Xu, F.; Kalashnikova, O.V.; Chowdhary, J.; Hasekamp, O.; Dubovik, O.; Wu, L.; Ahmad, Z.; et al. Retrieving Aerosol Characteristics From the PACE Mission, Part 2: Multi-Angle and Polarimetry. Front. Environ. Sci. 2019, 7, 94. [Google Scholar] [CrossRef] [Scilit]
- Gao, M.; Franz, B.A.; Knobelspiesse, K.; Zhai, P.-W.; Martins, V.; Burton, S.; Cairns, B.; Ferrare, R.; Gales, J.; Hasekamp, O.; et al. Efficient multi-angle polarimetric inversion of aerosols and ocean color powered by a deep neural network forward model. Atmos. Meas. Tech. 2021, 14, 4083–4110. [Google Scholar] [CrossRef] [Scilit]
- Adam, M.; Fragkos, K.; Binietoglou, I.; Wang, D.; Stachlewska, I.S.; Belegante, L.; Nicolae, V. Towards early detection of tropospheric aerosol layers using monitoring with ceilometer, photometer, and air mass trajectories. Remote Sens. 2022, 14, 1217. [Google Scholar] [CrossRef] [Scilit]
- Dubovik, O.; Holben, B.N.; Eck, T.F.; Smirnov, A.; Kaufman, Y.J.; King, M.D.; Tanré, D.; Slutsker, I. Variability of absorption and optical properties of key aerosol types observed in worldwide locations. J. Atmos. Sci. 2002, 59, 590–608. [Google Scholar] [CrossRef] [Scilit]
- Eck, T.F.; Holben, B.N.; Reid, J.S.; Dubovik, O.; Smirnov, A.; O’Neill, N.T.; Slutsker, I.; Kinne, S. Wavelength dependence of the optical depth of biomass burning, urban, and desert dust aerosols. J. Geophys. Res. Atmos. 1999, 104, 31333–31349. [Google Scholar] [CrossRef] [Scilit]
- O’Neill, N.T.; Eck, T.F.; Smirnov, A.; Holben, B.N.; Thulasiraman, S. Spectral discrimination of coarse and fine mode optical depth. J. Geophys. Res. Atmos. 2003, 108, 4559. [Google Scholar] [CrossRef] [Scilit]
- D’Amico, G.; Mattis, I.; Binietoglou, I.; Baars, H.; Mona, L.; Amato, F.; Kokkalis, P.; Rodríguez-Gómez, A.; Soupiona, O.; Pappalardo, G. EARLINET Single Calculus Chain: New products overview. EPJ Web Conf. 2018, 176, 09014. [Google Scholar] [CrossRef] [Scilit]
- Stein, A.F.; Draxler, R.R.; Rolph, G.D.; Stunder, B.J.B.; Cohen, M.D.; Ngan, F. NOAA’s HYSPLIT atmospheric transport and dispersion modeling system. Bull. Amer. Meteor. Soc. 2015, 96, 2059–2077. [Google Scholar] [CrossRef] [Scilit]
- Câţu, A. Summary—Lidar Data from Cluj-Napoca—Cloudnet Data Portal. 2025. Available online: https://cloudnet.fmi.fi (accessed on 17 October 2025).
- INOE. Aerosol Climatology from Remote Sensing Measurements to Deep Learning (CLARA); National Institute of R&D for Optoelectronics (INOE 2000): Bucharest, Romania, 2020; Available online: https://environment.inoe.ro/aerosol-climatology-from-remote-sensing-measurements-to-deep-learning-clara/ (accessed on 17 October 2025).
- Zheng, G.; Sedlacek, A.J.; Aiken, A.C.; Feng, Y.; Watson, T.B.; Raveh-Rubin, S.; Uin, J.; Lewis, E.R.; Wang, J. Long-range transported North American wildfire aerosols observed in marine boundary layer of eastern North Atlantic. Environ. Int. 2020, 139, 105680. [Google Scholar] [CrossRef] [Scilit] [PubMed]
- Kleinman, L.I.; Sedlacek, A.J., III; Adachi, K.; Buseck, P.R.; Collier, S.; Dubey, M.K.; Hodshire, A.L.; Lewis, E.; Onasch, T.B.; Pierce, J.R.; et al. Rapid evolution of aerosol particles and their optical properties downwind of wildfires in the western US. Atmos. Chem. Phys. 2020, 20, 13319–13341. [Google Scholar] [CrossRef] [Scilit]
- Eck, T.F.; Holben, B.N.; Reid, J.S.; Sinyuk, A.; Giles, D.M.; Arola, A.; Slutsker, I.; Schafer, J.S.; Sorokin, M.G.; Smirnov, A.; et al. The extreme forest fires in California/Oregon in 2020: Aerosol optical and physical properties and comparisons of aged versus fresh smoke. Atmos. Environ. 2023, 305, 119798. [Google Scholar] [CrossRef] [Scilit]
- Laing, J.R.; Jaffe, D.A.; Hee, J.R. Physical and optical properties of aged biomass burning aerosol from wildfires in Siberia and the Western USA at the Mt. Bachelor Observatory. Atmos. Chem. Phys. 2016, 16, 15185–15197. [Google Scholar] [CrossRef] [Scilit]
- Lee, J.Y.; Xian, P.; Selimovic, V.; Booth, P.-P.M.; Anderson, B.G.; Liu, J.; Pratt, K.A. Observation of wildfire smoke particles that accumulated secondary aerosol during long-range transport. ACS Earth Space Chem. 2025, 9, 2440–2454. [Google Scholar] [CrossRef] [Scilit]
- Rogers, R.R.; Vaughan, M.A.; Hostetler, C.A.; Burton, S.P.; Ferrare, R.A.; Young, S.A.; Hair, J.W.; Obland, M.D.; Harper, D.B.; Cook, A.L.; et al. Looking through the haze: Evaluating the CALIPSO level 2 aerosol optical depth using airborne high spectral resolution lidar data. Atmos. Meas. Tech. 2014, 7, 4317–4340. [Google Scholar] [CrossRef] [Scilit]
- Toth, T.D.; Campbell, J.R.; Reid, J.S.; Tackett, J.L.; Vaughan, M.A.; Zhang, J.; Marquis, J.W. Minimum aerosol layer detection sensitivities and their subsequent impacts on aerosol optical thickness retrievals in CALIPSO level 2 data products. Atmos. Meas. Tech. 2018, 11, 499–514. [Google Scholar] [CrossRef] [Scilit] [PubMed]
- Man, W.; Tao, M.; Xu, X.; Wang, J.; Zhou, S.; Tang, Z.; Wang, Y.; Wang, L.; Kim, J.; Chen, L. First aerosol retrieval from PACE HARP2 over land with physics-informed deep learning method. IEEE Trans. Geosci. Remote Sens. 2026, 64, 4108510. [Google Scholar] [CrossRef] [Scilit]
- Sayer, A.M.; Govaerts, Y.; Kolmonen, P.; Lipponen, A.; Luffarelli, M.; Mielonen, T.; Patadia, F.; Popp, T.; Povey, A.C.; Stebel, K.; et al. A review and framework for the evaluation of pixel-level uncertainty estimates in satellite aerosol remote sensing. Atmos. Meas. Tech. 2020, 13, 373–404. [Google Scholar] [CrossRef] [Scilit]
- Kim, H.; Chen, X.; Wang, J.; Lu, Z.; Zhou, M.; Carmichael, G.R.; Park, S.S.; Kim, J. Aerosol layer height (ALH) retrievals from oxygen absorption bands: Intercomparison and validation among different satellite platforms, GEMS, EPIC, and TROPOMI. Atmos. Meas. Tech. 2025, 18, 327–349. [Google Scholar] [CrossRef] [Scilit]
- Nicolae, D.; Vasilescu, J.; Talianu, C.; Dandocsi, A. Independent retrieval of aerosol type from lidar. EPJ Web Conf. 2016, 119, 18002. [Google Scholar] [CrossRef] [Scilit]
- Burton, S.P.; Ferrare, R.A.; Hostetler, C.A.; Hair, J.W.; Rogers, R.R.; Obland, M.D.; Butler, C.F.; Cook, A.L.; Harper, D.B.; Froyd, K.D. Aerosol classification using airborne High Spectral Resolution Lidar measurements—Methodology and examples. Atmos. Meas. Tech. 2012, 5, 73–98. [Google Scholar] [CrossRef] [Scilit]
- Russell, P.B.; Kacenelenbogen, M.; Livingston, J.M.; Hasekamp, O.P.; Burton, S.P.; Schuster, G.L.; Johnson, M.S.; Knobelspiesse, K.D.; Redemann, J.; Ramachandran, S.; et al. A multiparameter aerosol classification method and its application to retrievals from spaceborne polarimetry. J. Geophys. Res. Atmos. 2014, 119, 9838–9863. [Google Scholar] [CrossRef] [Scilit]
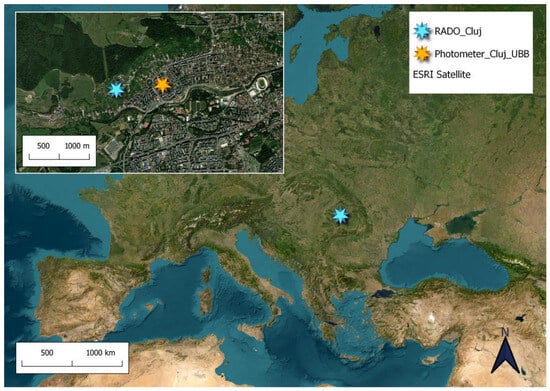
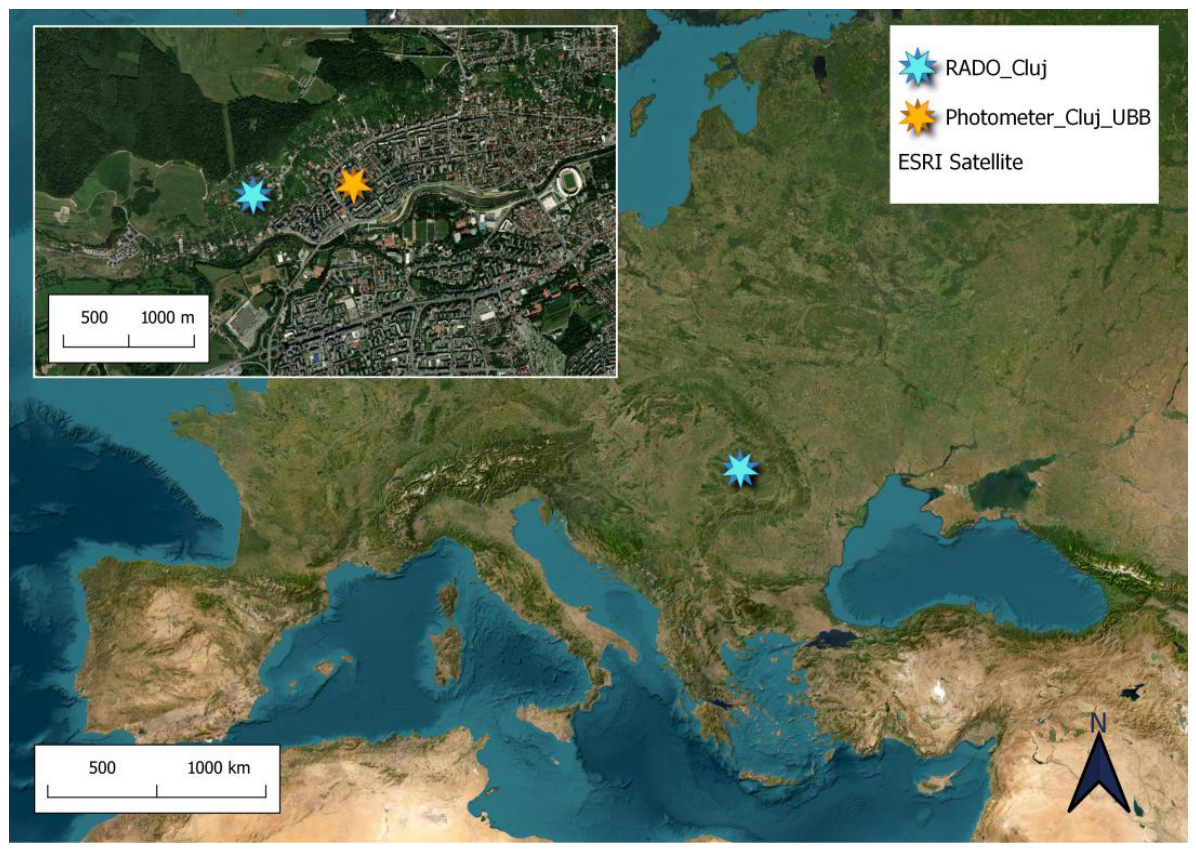
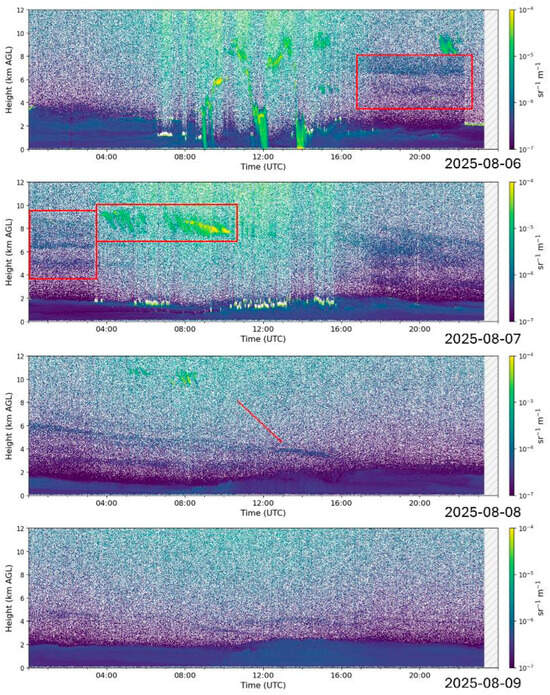
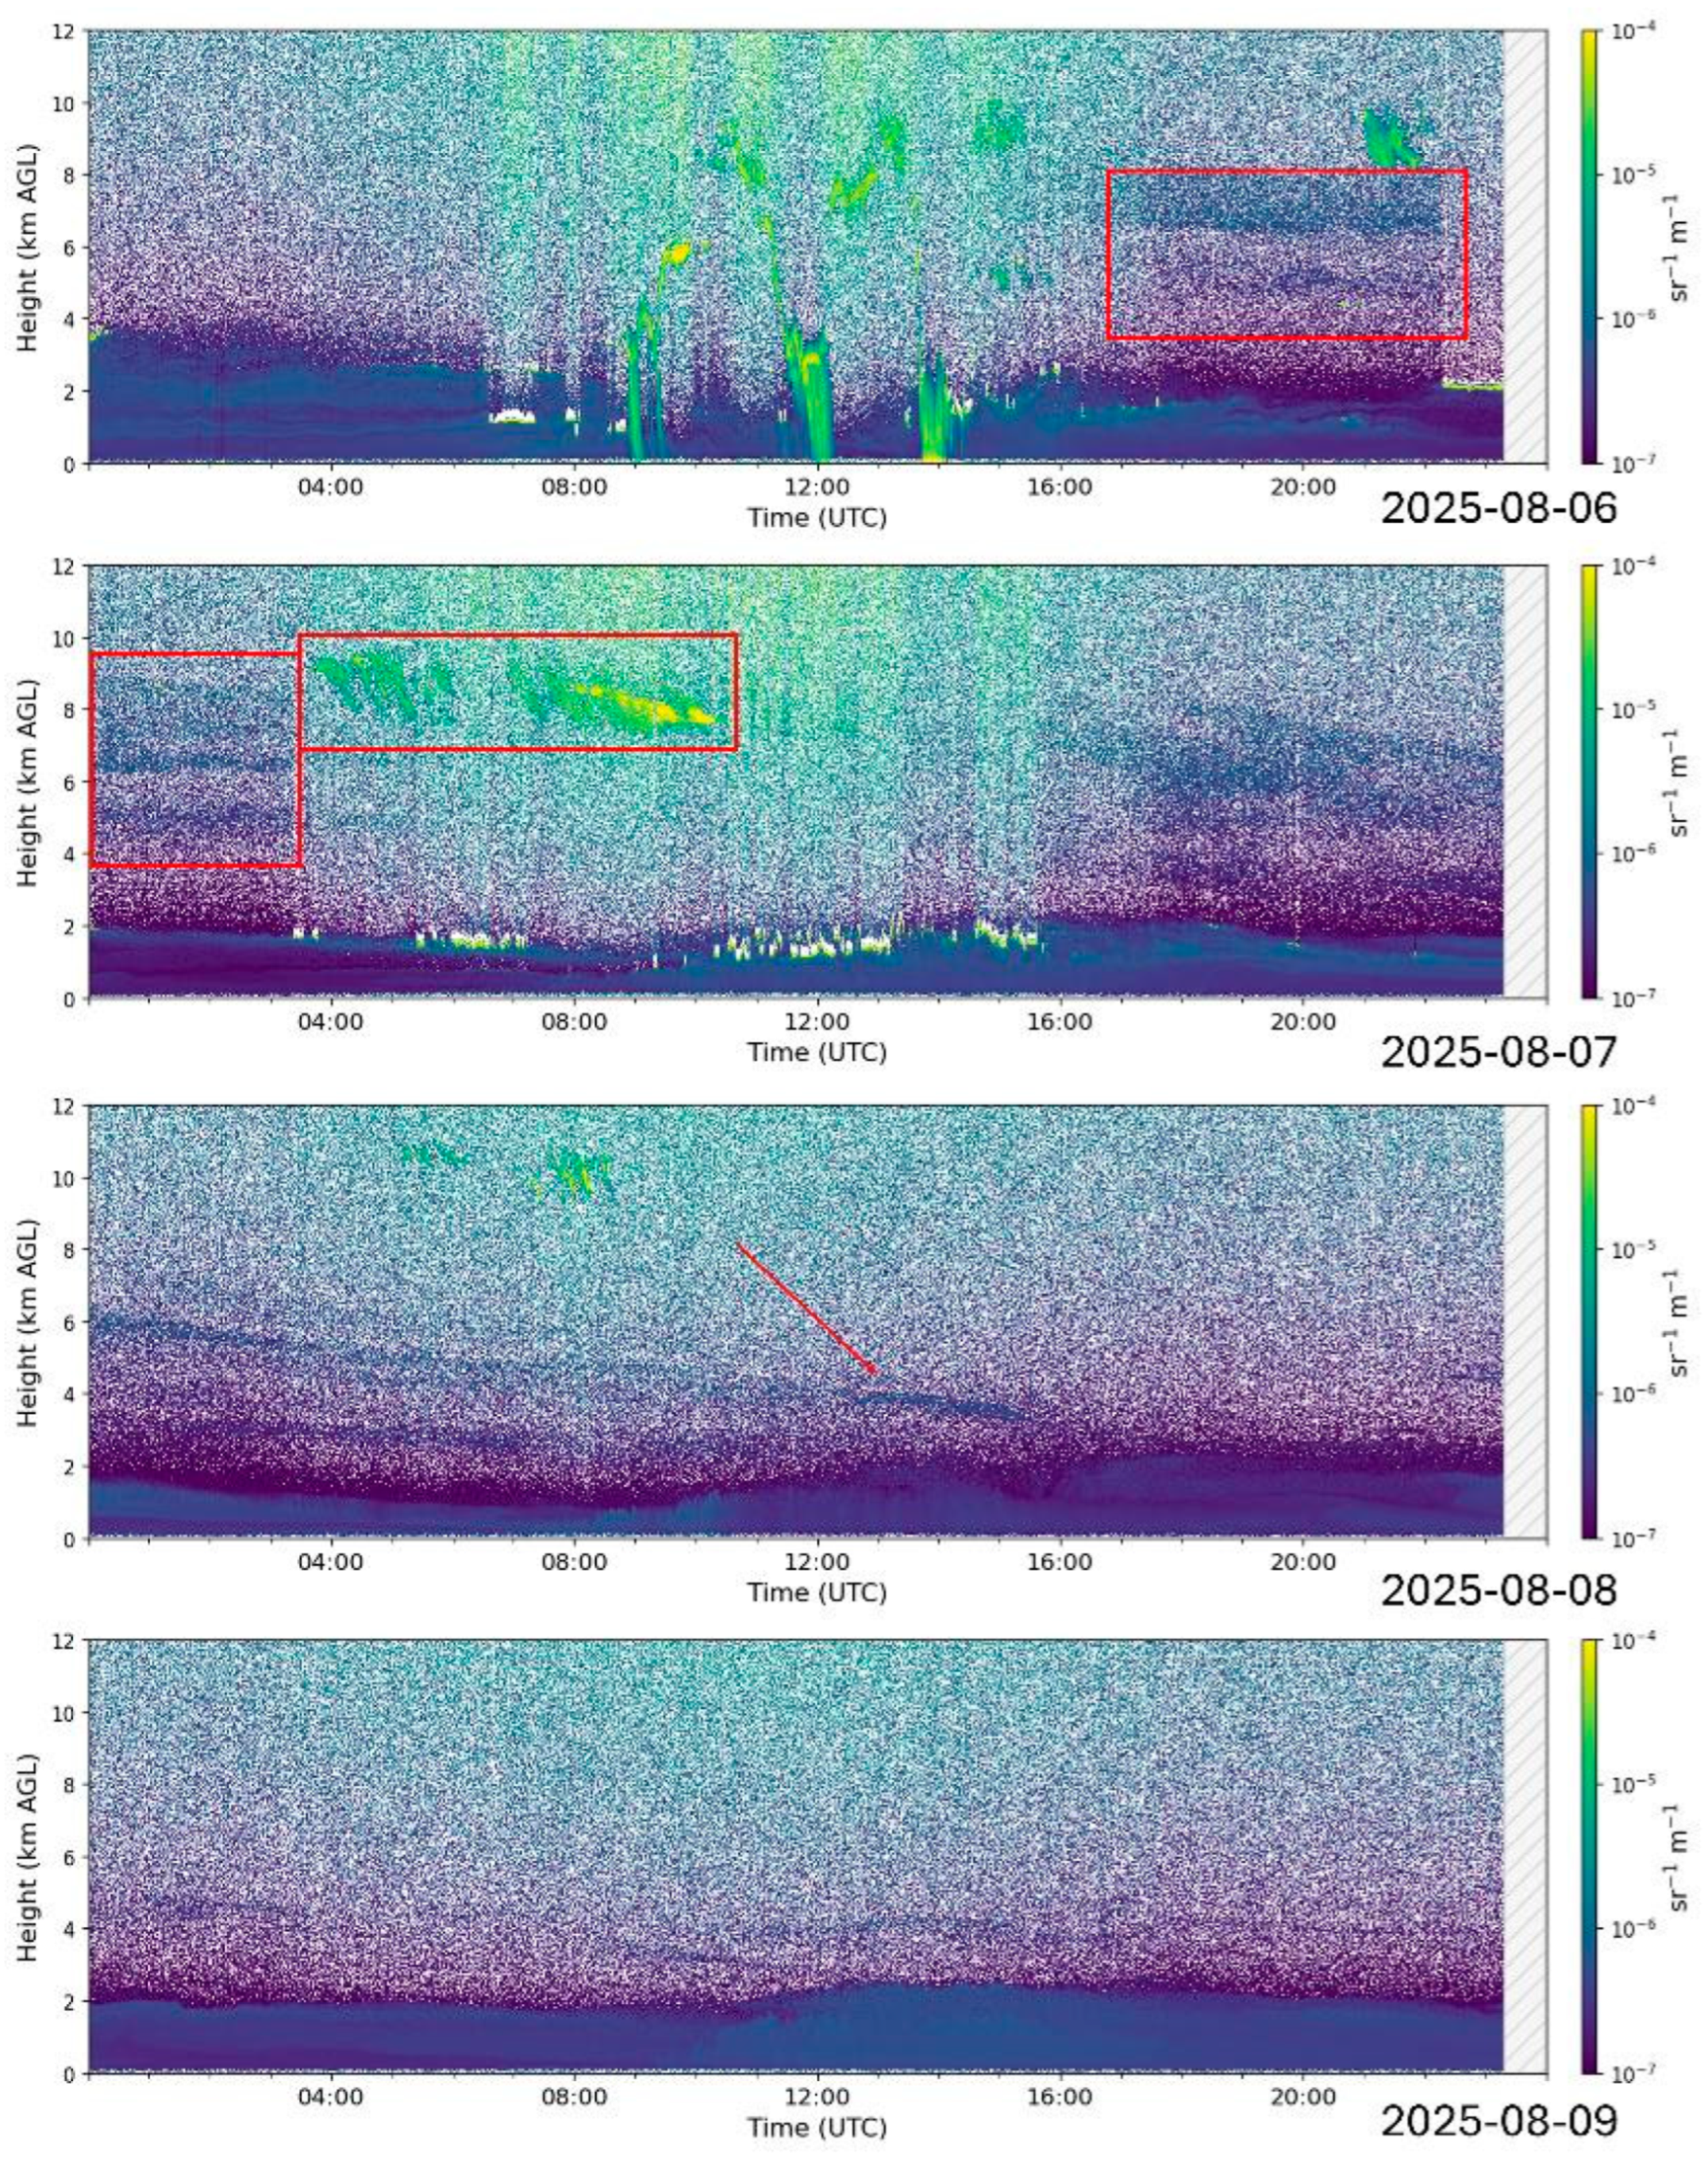
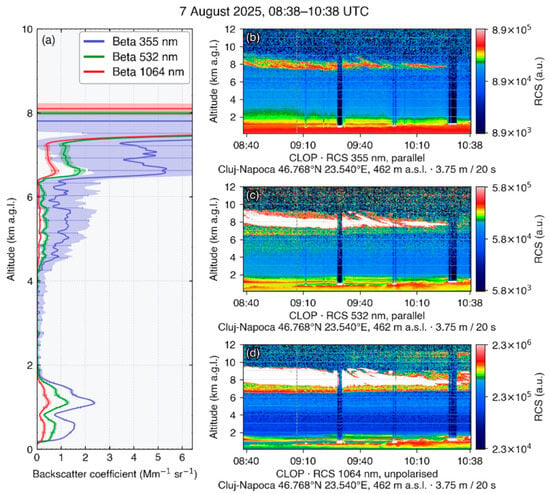
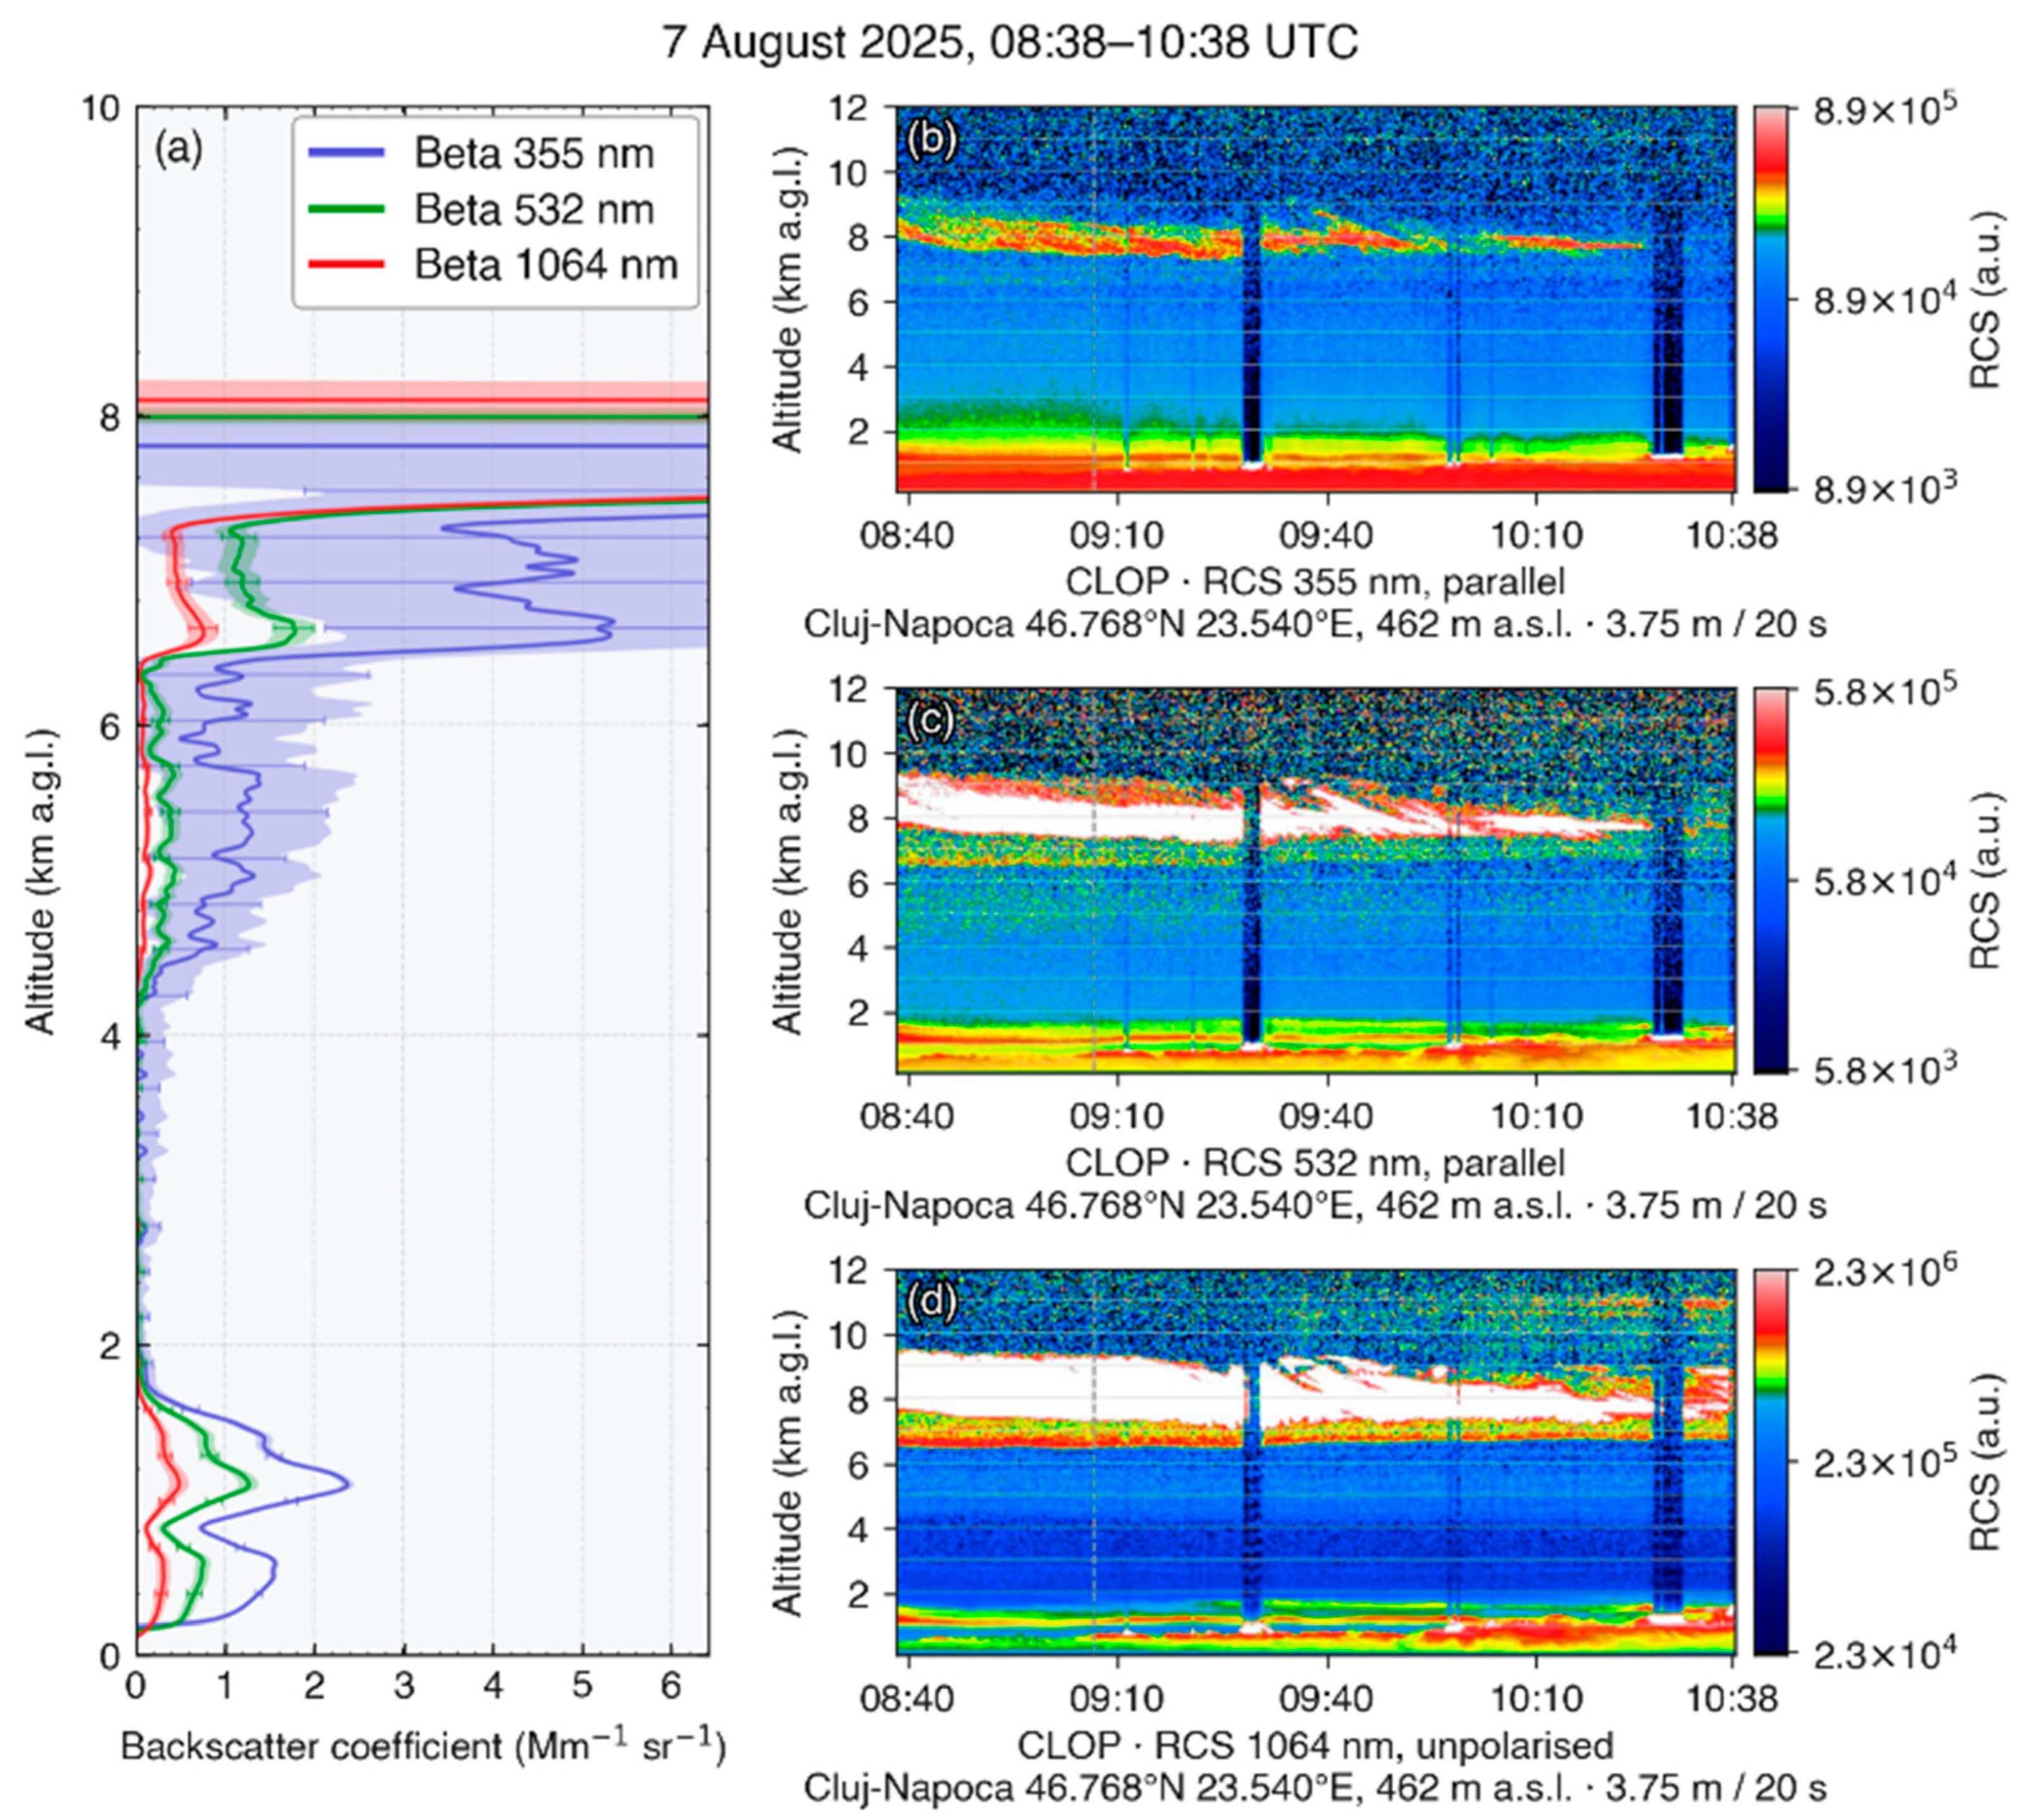
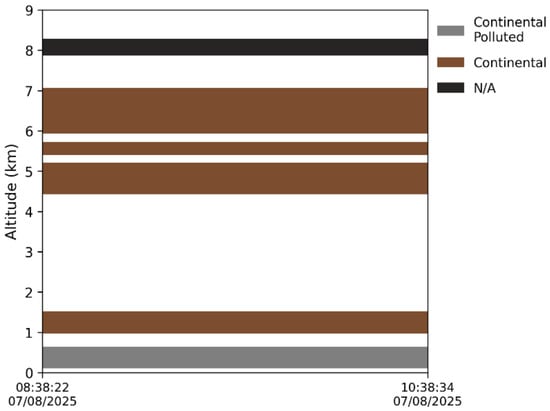
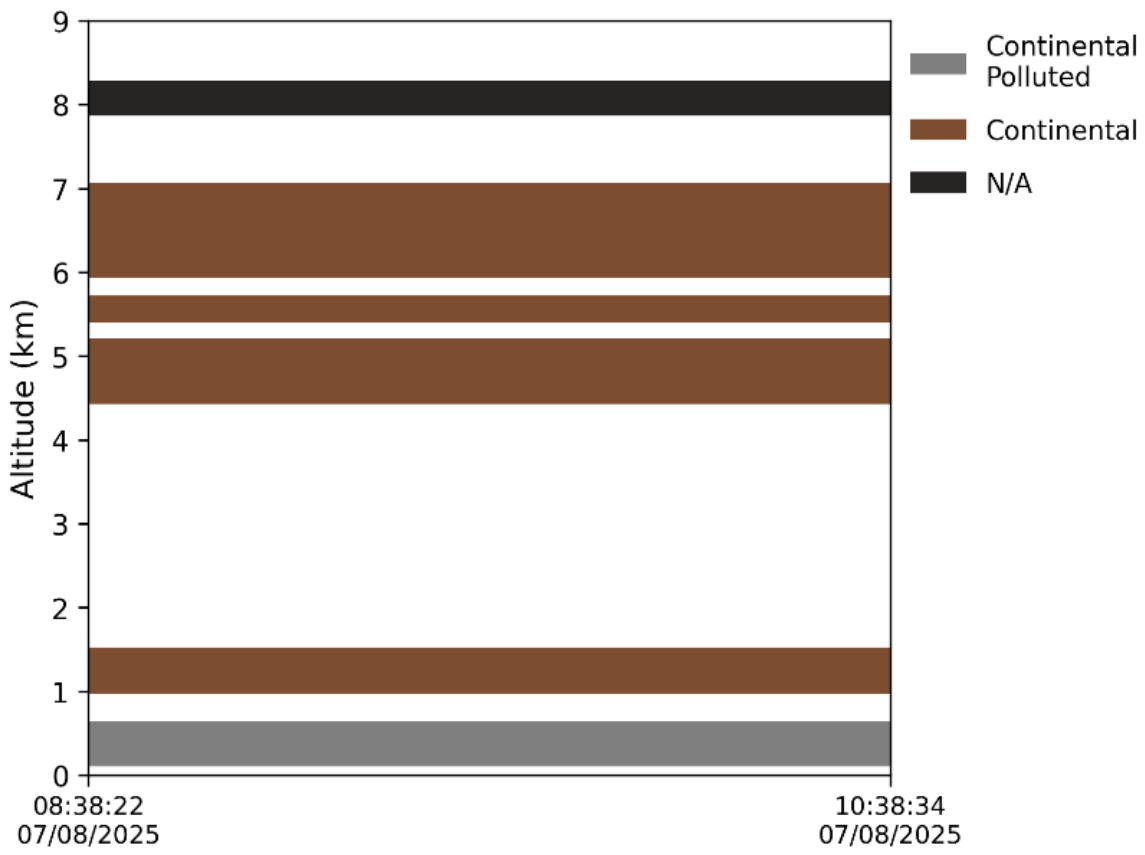
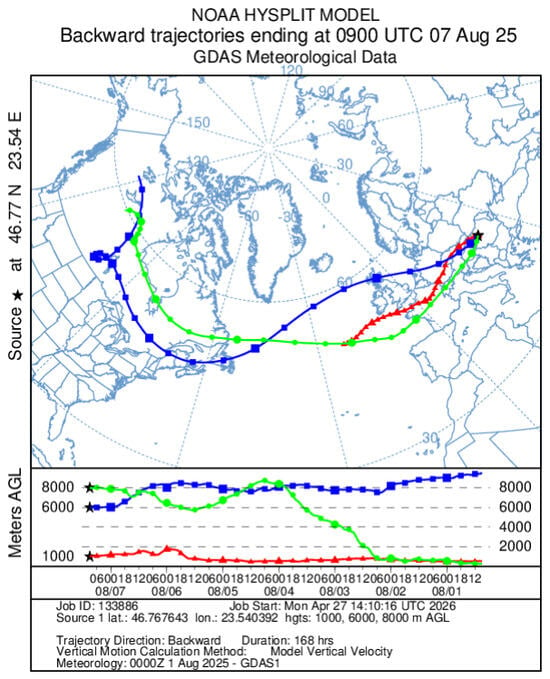
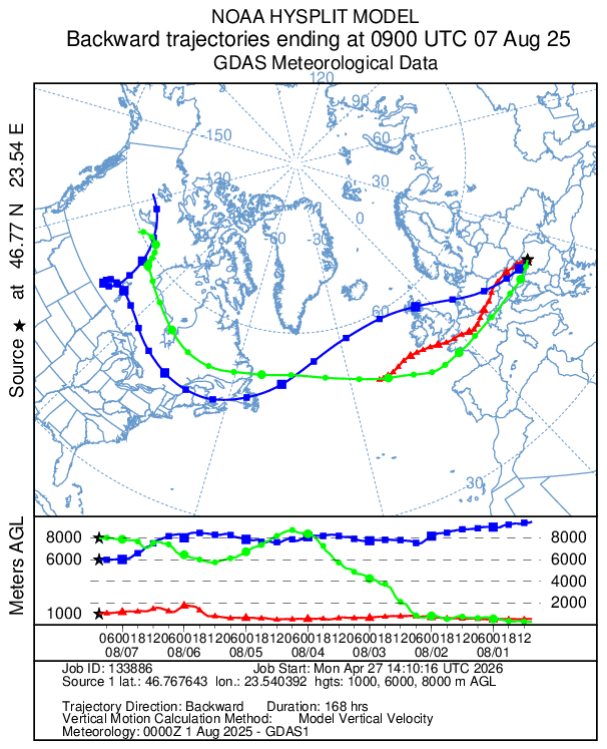
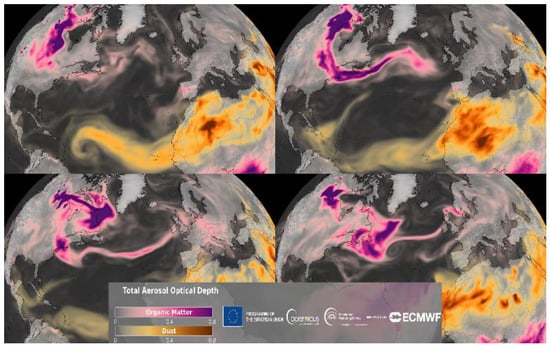
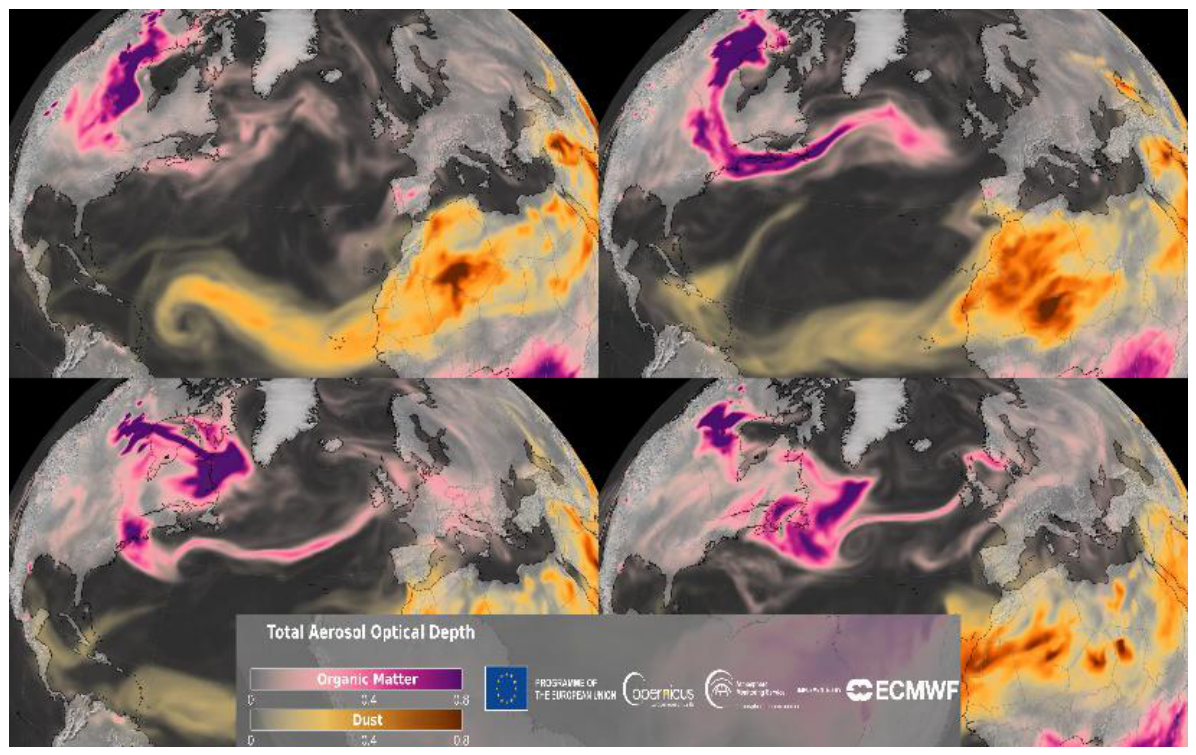
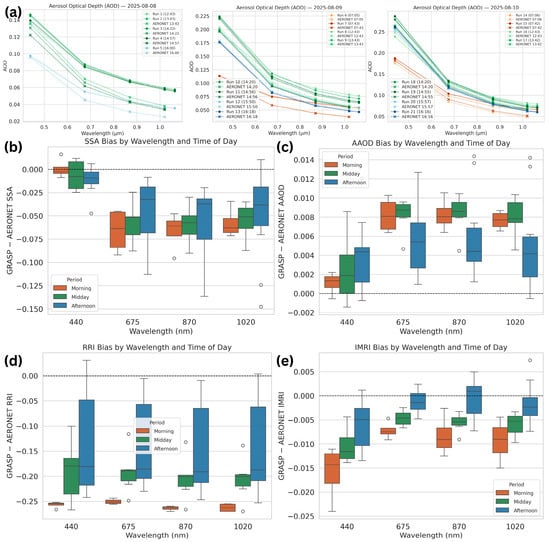
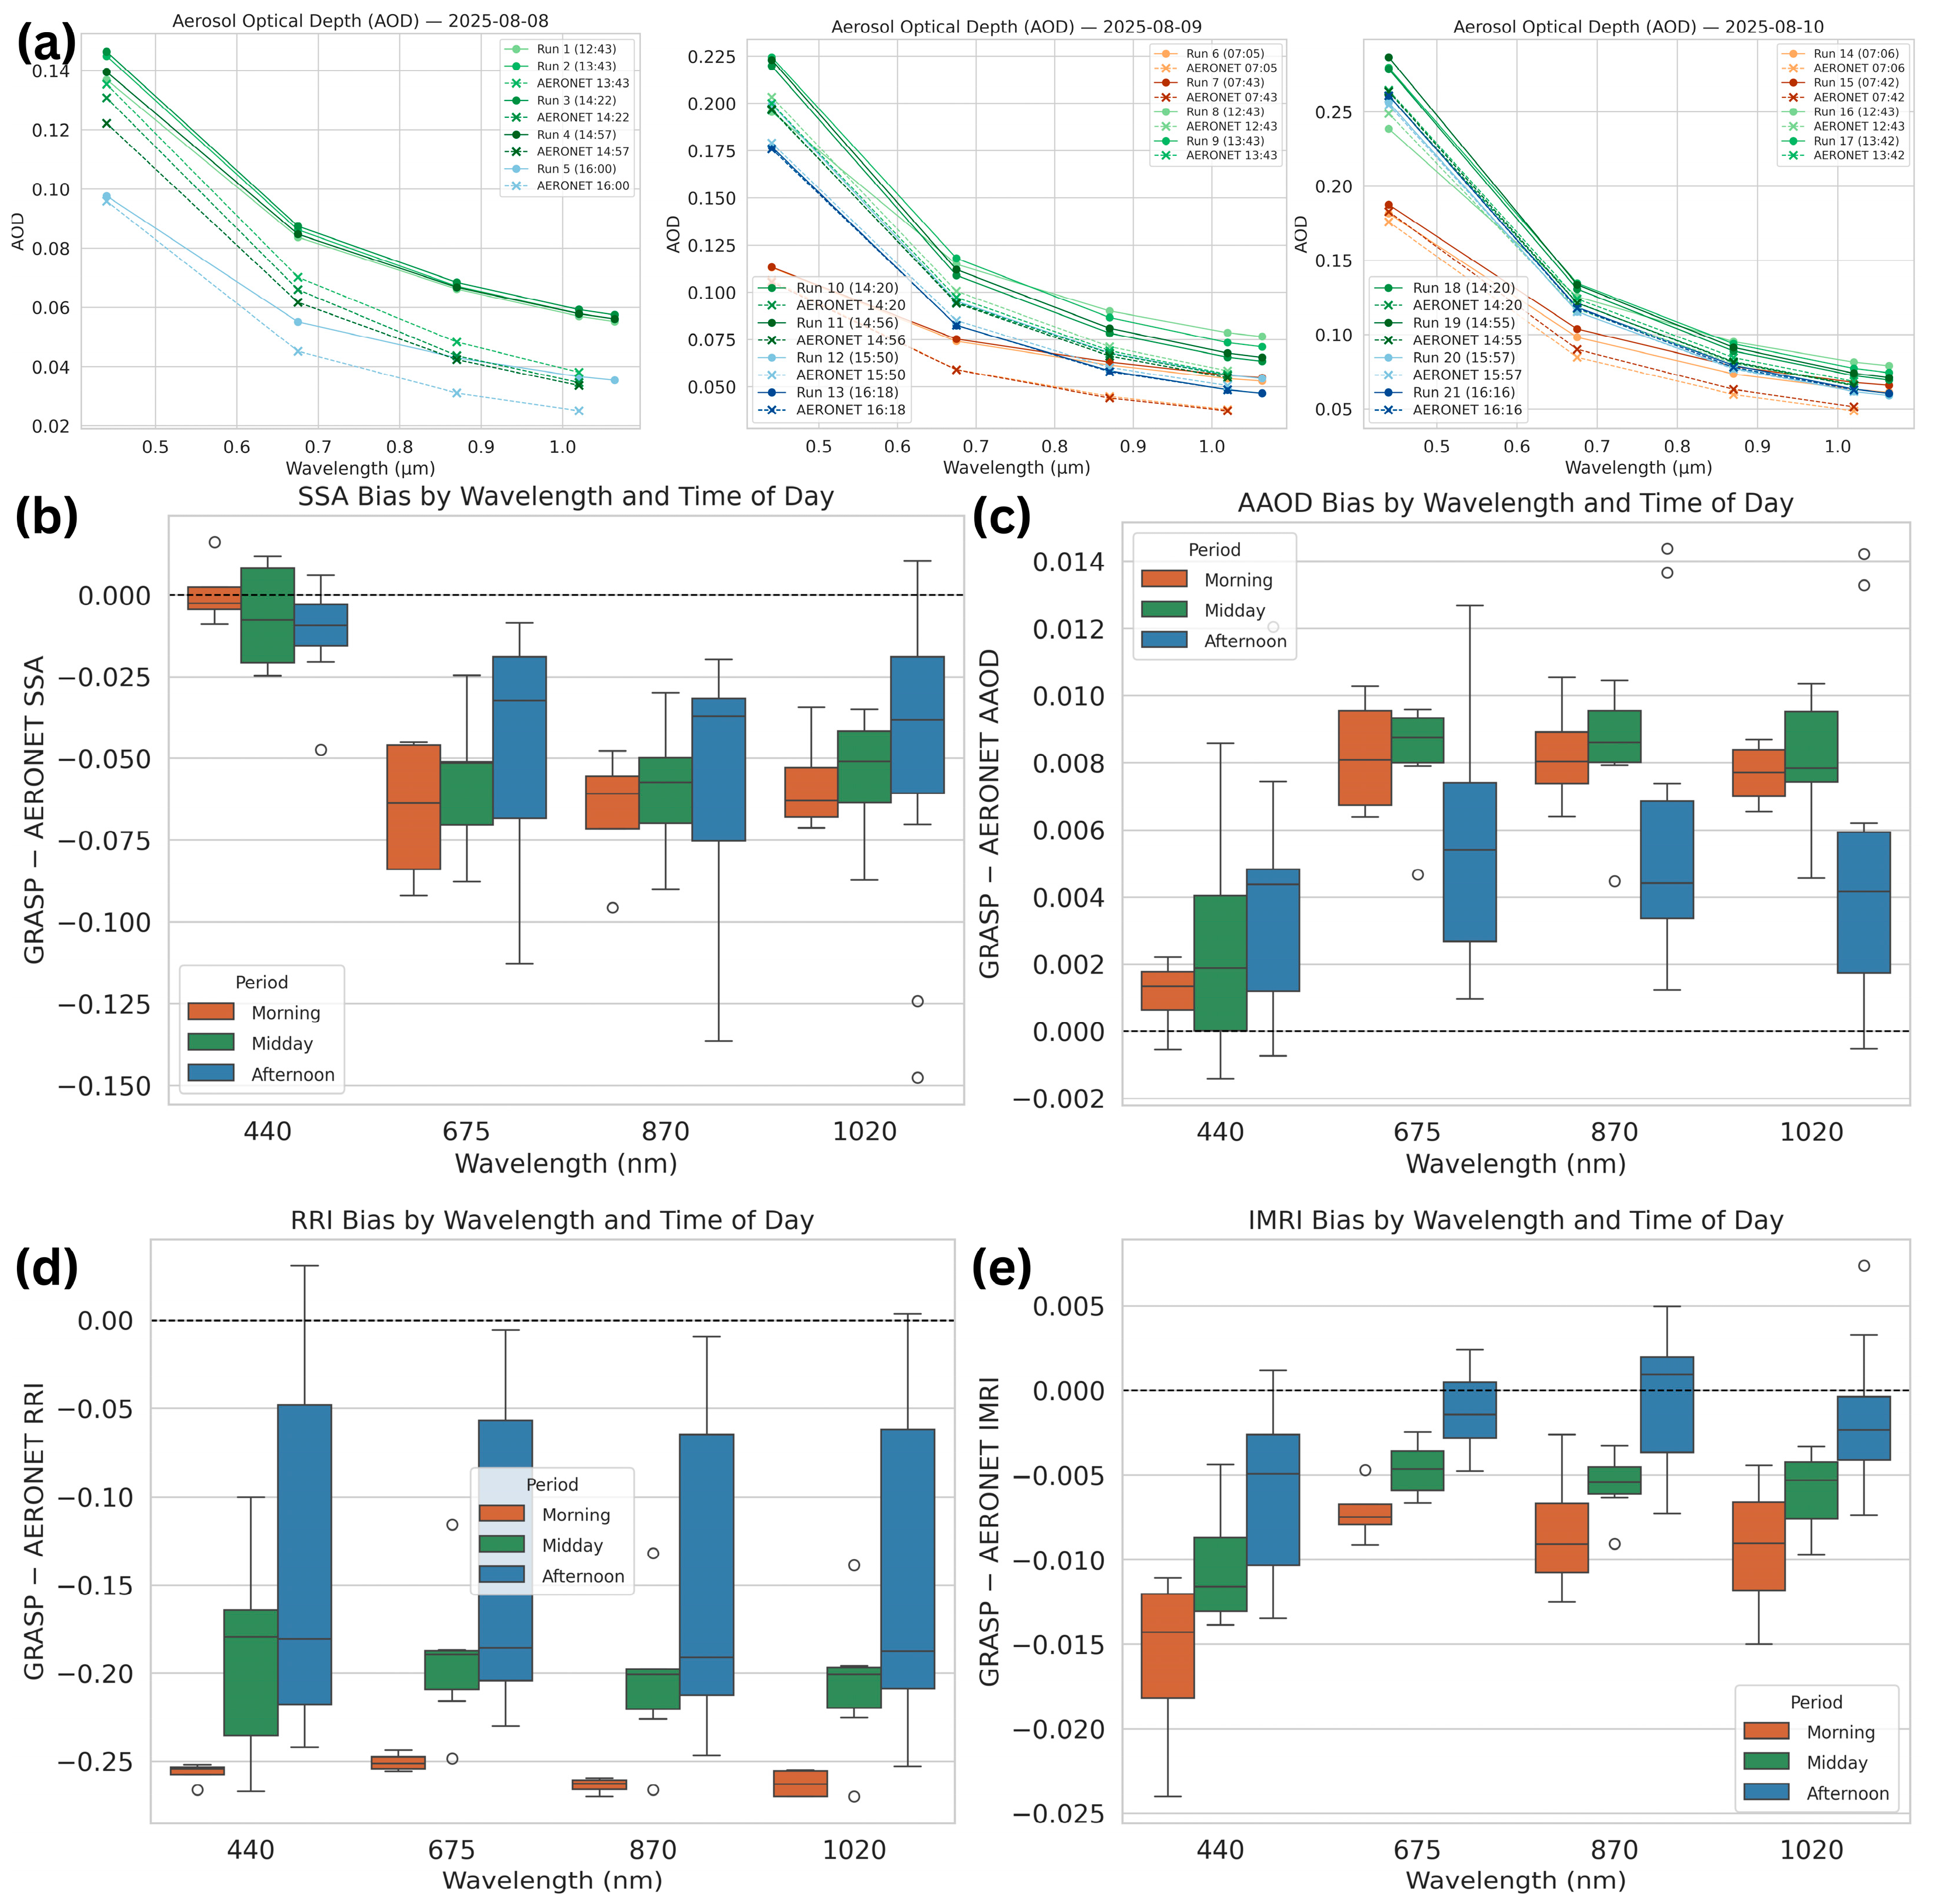
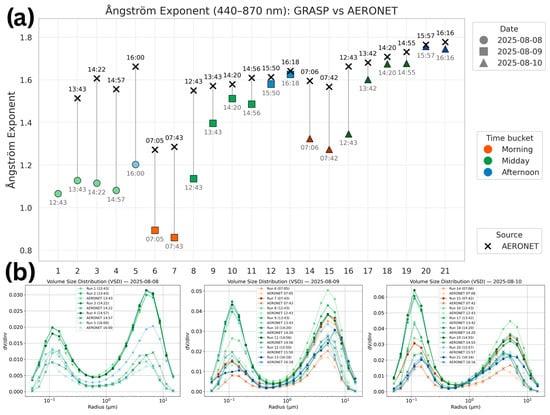
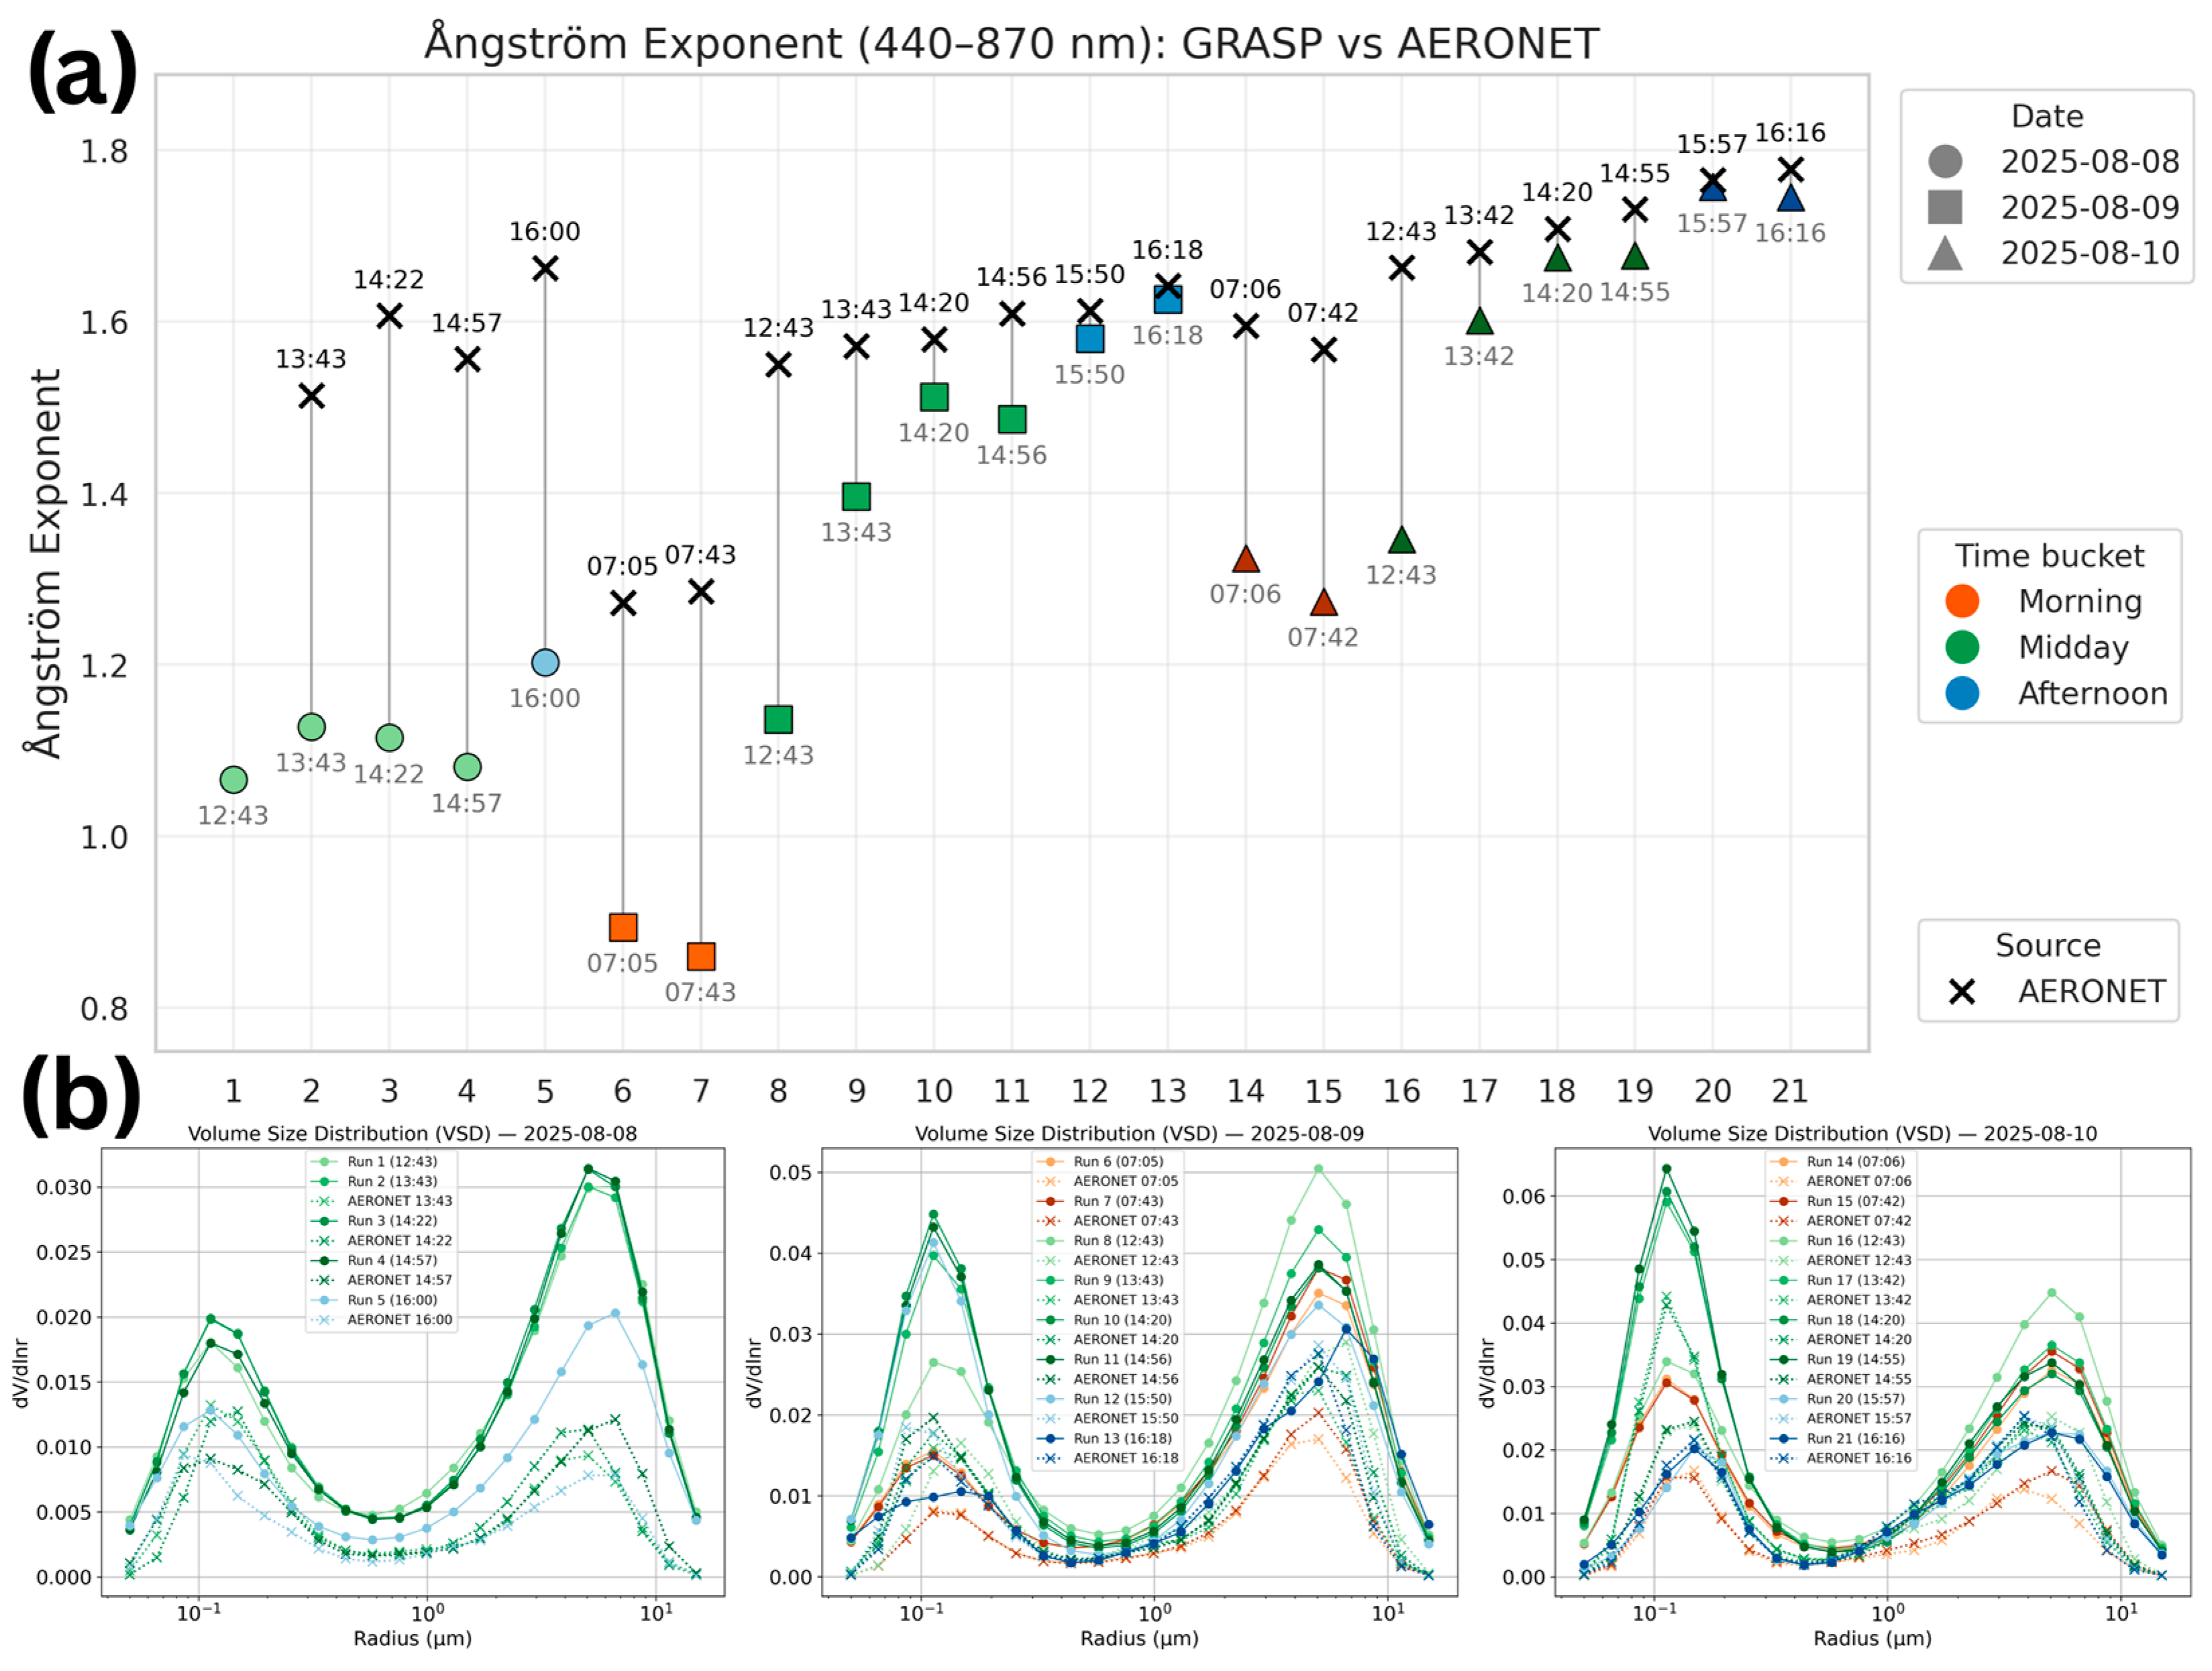

Disclaimer/Publisher’s Note: The statements, opinions and data contained in all publications are solely those of the individual author(s) and contributor(s) and not of MDPI and/or the editor(s). MDPI and/or the editor(s) disclaim responsibility for any injury to people or property resulting from any ideas, methods, instructions or products referred to in the content. |
© 2026 by the authors. Licensee MDPI, Basel, Switzerland. This article is an open access article distributed under the terms and conditions of the Creative Commons Attribution (CC BY) license.