


Highlights
What are the main findings?
- MODIS NDVI time series reveal advancing wheat SOS in both Greece and Cyprus, with contrasting EOS and LOS trends between the two regions.
- Rising atmospheric CO2 is statistically associated with later EOS and prolonged LOS in Greece, but not in Cyprus.
What are the implications of the main findings?
- Long-term satellite observations reveal a region-specific CO2 signal in crop phenology that warrants mechanistic testing in field and experimental studies.
- Integrating geographic, climatic and atmospheric variables improves phenology modeling in support of targeted adaptation strategies for Mediterranean agroecosystems.
Abstract
Accurate assessment of crop phenology under changing climate conditions is essential for agricultural planning and food security, particularly in regions where wheat production is sensitive to temperature and water availability. This study examines the long-term phenological responses of wheat across six sites in Greece and five in Cyprus over a 24-year period (2001–2024), using MODIS-derived NDVI time series to extract start of season (SOS), end of season (EOS) and length of season (LOS). SOS advanced consistently in both countries, while EOS was delayed in Greece but advanced in Cyprus. As a result, LOS increased across Greek sites but showed mixed responses in Cyprus, with no significant average change. Spatial differences were associated with latitude, with higher-latitude Greek sites exhibiting later SOS and EOS, whereas temporal trends were linked to climatic variability. Linear mixed-model analyses identified temperature as the dominant climatic driver of SOS and EOS in both regions, with precipitation exerting additional, but region-specific influences. A key finding is that atmospheric CO2 emerged as an additional statistical predictor of EOS in Greece, where it was associated with later EOS, offsetting the climate-driven advance in the model, and was marginally associated with LOS extension. In contrast, no CO2 association was detected for Cyprus, possibly reflecting more constrained environmental conditions. These findings highlight the importance of integrating geographic, climatic and atmospheric variables to capture crop-specific responses and support region-specific adaptation strategies in Mediterranean agroecosystems vulnerable to climate change.
1. Introduction
Vegetation phenology concerns the timing of recurring biological events in a plant’s life cycle [1], such as germination, flowering, leaf emergence and senescence, and has been central to agricultural planning since the dawn of farming civilizations. In recent decades, phenology has gained renewed scientific attention due to its sensitivity to climatic conditions and its role in regulating ecosystem productivity, carbon fluxes and food security [2,3,4]. Shifts in vegetation phenological stages—driven by climate variability and long-term change—have been documented globally, with implications for yield stability, resource use efficiency and adaptation strategies [5].
Traditionally, phenology has been monitored through field observations, which offer detailed insights but are limited in temporal and spatial coverage. Remote sensing (RS) techniques provide a powerful alternative, enabling the monitoring of vegetation dynamics across large areas and over extended time periods [6]. Satellite-derived land surface phenology (LSP) metrics—such as the start of season (SOS), end of season (EOS) and length of season (LOS)—are commonly extracted from time series of vegetation indices like the normalized difference vegetation index (NDVI) and enhanced vegetation index (EVI). These metrics can be used as valuable proxies for the determination of key vegetation phenological stages.
While LSP studies have primarily focused on natural vegetation and especially deciduous forest ecosystems, recent efforts have extended these methods to agricultural landscapes [7,8,9,10,11]. However, crop-specific responses to climate drivers remain underexplored, particularly in regions with complex topography and diverse agro-climatic zones that may be highly vulnerable to climate change, such as the Mediterranean region [12,13].
Across the relevant literature, SOS exhibits the most consistent responses across different ecosystems (forests, croplands, grasslands) and geographic regions, with a prevailing trend toward earlier onset [5,14,15]. This advancement is primarily attributed to increased temperatures, which accelerate physiological development and trigger earlier leaf emergence or germination [2,3]. In contrast, EOS displays more variable patterns, with both delays and advances reported, depending on ecosystem type, climatic regime and stress exposure [16,17]. Delayed EOS is often observed in temperate and boreal systems where extended photosynthetic activity is supported by warmer autumns [18,19], whereas advanced EOS tends to occur in arid or drought-prone regions due to water limitations and heat stress [20,21]. Despite this variability, LOS generally elongates in most cases, reflecting the combined effect of earlier SOS and delayed EOS [16]. This growing season extension has important ecological and agronomic implications, including altered carbon uptake dynamics, shifts in resource allocation and potential changes in crop yield and management timing. These patterns underscore the need for ecosystem-specific phenological models that account for both climatic drivers and physiological thresholds.
Concerning agroecosystems, large-scale, multi-year satellite studies across different continents and crops identify temperature as the dominant climatic driver of crop phenology [22,23], with precipitation and management practices exerting additional roles that are usually crop- and region-specific. As in natural ecosystems, the most consistent effect is the advancement of growth onset driven by rising temperatures, while both advances and delays have been recorded for the end of the growing period. Nevertheless, the duration of the growing period elongates in most cases. In addition, precipitation patterns—particularly the timing and distribution of rainfall—may play a crucial role in shaping crop development, especially in rainfed systems [24,25,26]. These variable EOS responses and species- or region-specific effects underscore the need for more targeted studies, especially in fragmented landscapes, underrepresented regions, and climate change-vulnerable regions.
As a globally cultivated cereal and a staple crop in Mediterranean agriculture, wheat plays a critical role in food security and rural economies. Accordingly, monitoring wheat phenology is essential for anticipating climate-driven impacts and guiding adaptive management. Greece and Cyprus, located in the eastern Mediterranean, offer an ideal setting to investigate these dynamics because they are characterized by strong interannual climatic variability and growing vulnerability to climate change, particularly increasing heat extremes, drought frequency and water scarcity [27,28]. To address this gap, this study uses a 24-year (2001–2024) MODIS-derived NDVI time series across multiple sites in Greece and Cyprus to characterize spatial and temporal patterns in wheat SOS, EOS and LOS and to evaluate how these patterns respond to temperature, precipitation and atmospheric CO2. In particular, the length of this satellite record makes it possible to test whether the sustained rise in atmospheric CO2 over the past two decades is detectable as an additional statistical predictor of phenological timing, beyond climatic variability, an effect demonstrated experimentally under controlled conditions (FACE, OTC) but, to our knowledge, not previously identified in long-term satellite observations of crop phenology. By combining this atmospheric perspective with an assessment of climatic and geographic drivers, this work provides one of the first long-term, satellite-based assessments of wheat phenology in Mediterranean agroecosystems, which remain underrepresented in global phenology research [12,29], with direct implications for crop management, food security and the development of resilient regional adaptation strategies under future climate change.
2. Materials and Methods
2.1. Species and Study Sites
Sites containing wheat (Triticum spp.) farms in Greece and Cyprus were studied over a 24-year period (2001–2024). Wheat was selected as the study species due to its socioeconomic value and compatibility with remote sensing (RS) techniques. As a globally cultivated cereal and a staple crop in Mediterranean agriculture, wheat plays a critical role in food security and rural economies [30,31].
From a technical perspective, wheat’s growth cycle and homogeneous canopy structure make it highly suitable for RS-based phenological monitoring [32]. Its seasonal development allows the clear detection of key land surface phenology (LSP) metrics using vegetation indices such as NDVI. Moreover, wheat is typically grown in contiguous, dense and homogeneous stands, ensuring reliable signal extraction from RS data. It should be noted that, unlike studies on deciduous forest species in the Northern Hemisphere, where SOS and EOS typically correspond to spring leaf-out and autumn senescence, wheat follows a winter-growing cycle, with SOS occurring in autumn and EOS in spring.
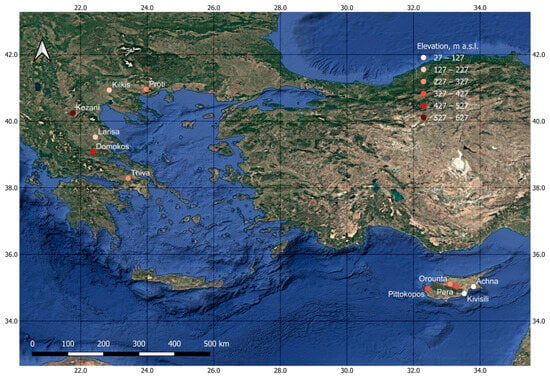
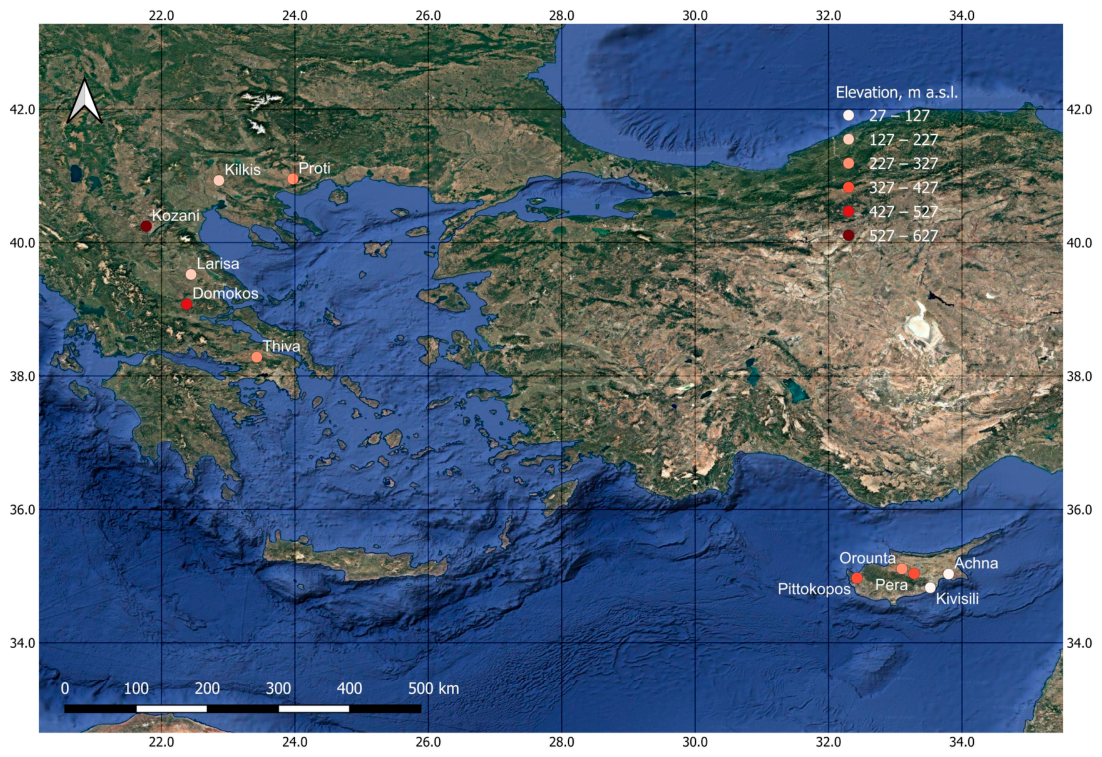
The Greek study sites were determined using a relevant wheat-fraction classification map from the Ministry of Rural Development and Food of Greece (https://www.minagric.gr), while the sites in Cyprus were selected using a wheat map provided by the Cyprus Agricultural Payments Organization (CAPO, https://www.capo.gov.cy). Six and five sites were selected in Greece and Cyprus, respectively, to capture the dominant agro-climatic gradients in each country, including variations in temperature, precipitation and elevation, as shown in Figure 1 and Table 1. The latitude of the Greek sites ranges between 38.28° and 40.95° and the altitude ranges between 140 and 609 m a.s.l., while the latitude for the Cyprus sites ranges between 34.83° and 35.11° and the altitude ranges between 27 and 340 m a.s.l. During the growing season (September–May), the Cypriot sites are considerably warmer than the Greek sites (mean Tmin 12.0 vs. 7.2 °C, mean Tmax 22.9 vs. 16.5 °C), whereas growing-season precipitation is similar in the two regions (469 vs. 473 mm). This similarity arises because almost all annual rainfall in Cyprus falls during the growing season (98–100%), compared to 77–93% at the Greek sites, which also receive part of their rainfall in summer (Table 1).
Figure 1.
The study sites in Greece and Cyprus. Background map: Google Satellite (Imagery © 2024 TerraMetrics, Map Data © 2024).
Table 1.
Coordinates, elevation, growing season (September–May) mean minimum (Tmin) and maximum temperature (Tmax), total precipitation, share of annual precipitation falling during the growing season, and number of MODIS pixels for the studied sites. The climatic data are means ± SD over the 24 growing seasons of the study period (September 2000–May 2024).
2.2. Satellite Data
For the purposes of the study, MODIS vegetation index products MOD13Q1 and MYD13Q1, from the Terra and Aqua satellites, respectively, were used. These products are freely available from the NASA ORNL DAAC website (https://modis.ornl.gov/globalsubset/, accessed on 22 February 2025), which provides spatially and temporally customized outputs in CSV format. MOD13Q1 and MYD13Q1 are Level 3 16-day composite products at a spatial resolution of 250 m, including NDVI values, along with associated quality assurance layers.
For each study site, MODIS data corresponding to a square with sides ranging from 4 to 6 km were downloaded. In Greece, the selected sites were spatially homogeneous and predominantly covered by farms, so data for all pixels within the square were included in the analysis. However, the Cypriot sites showed greater spatial fragmentation: wheat is cultivated in small, irregular parcels forming a mosaic with other crops, fallow land, natural vegetation and settlements, so many 250 m pixels contain a mixture of land covers. Accordingly, to ensure phenological signal integrity, an additional pixel selection step was implemented for Cyprus: the CAPO wheat map was overlaid on the MODIS pixel grid, and only pixels fully or predominantly (>50%) occupied by wheat farms were retained for analysis. As a result of these landscape differences, the number of pixels used per site was higher for Greece than for Cyprus (Table 1). This approach ensured consistency in phenological signal quality while accounting for regional differences in land cover heterogeneity. While this resulted in a smaller pixel sample for Cyprus, the retained pixels represent all pixels meeting the purity criteria within the selected study sites, and the 24-year temporal record provides substantial replication for trend estimation independent of spatial sample size. The linear mixed-model framework used here (Section 2.5) is specifically suited to this kind of unbalanced, repeated-measures sampling structure. Since NDVI was averaged across the pixels of each site before phenology extraction, each site contributes one value per metric and year to the statistical analyses, irrespective of its pixel number; pixel number therefore affects the noise level of the site signal but not its weight in the models. Nevertheless, residual sub-pixel mixing with other land covers cannot be fully excluded at 250 m resolution, particularly in Cyprus, and is a limitation of this study. Higher-resolution sensors (e.g., Sentinel-2) could reduce it but do not provide the multi-decadal record required here.
For each study site, Terra and Aqua data were filtered for the presence of clouds and snow using the quality flags contained in the products. Subsequently, the average NDVI for the total number of pixels at each site (Table 1) was calculated for every acquisition date, and the Terra and Aqua data were merged into a unified time series with an effective 8-day temporal resolution. This fusion approach enhanced temporal continuity and reduced data gaps, improving the reliability of phenological signal detection. Finally, the NDVI time series of each site was smoothed using the Savitzky–Golay filter and subsequently interpolated to daily resolution via linear interpolation.
To quantify the influence of NDVI noise on phenology extraction, the standard deviation of the residuals between the raw and smoothed NDVI time series was computed for each site. The smoothed NDVI curve was then perturbed by ±1 SD, and SOS, EOS and LOS were re-extracted (see next section). Across all sites, uncertainty in the derived phenology metrics ranged from 1.5 to 4 days for SOS, 1 to 3 days for EOS, and 2 to 5 days for LOS. These values are minor relative to the interannual variability of the phenological metrics, indicating that NDVI noise has a limited effect on SOS, EOS and LOS. Despite their smaller number of pixels, the Cypriot sites showed uncertainties similar to or lower than those of the Greek sites (SOS: 1.5–3 vs. 2–4 days; EOS: 1–2 vs. 2–3 days; LOS: 2–4 vs. 2–5 days for Cyprus and Greece respectively), and uncertainty was not correlated with pixel number across sites (Spearman ρ ≤ 0.29, p ≥ 0.39), indicating that pixel number did not systematically affect the precision of phenology extraction.
2.3. Phenology
This study focuses on three key phenological events: SOS (date), EOS (date) and LOS (number of days). Several methods have been proposed in the literature for determining SOS and EOS in deciduous and agricultural ecosystems, each with its own advantages and limitations. For the purposes of this analysis, SOS and EOS dates were estimated using the amplitude threshold method [33], applying both a dynamic and a static threshold approach per site, as outlined below.
For the dynamic threshold approach, the minimum and maximum NDVI values were identified per growing period (year) for each site, and a year-specific threshold was defined as the midpoint between these values.
For the static threshold approach, an average annual NDVI profile was generated for each site from the daily NDVI time series spanning 24 years. The site-specific minimum and maximum NDVI values were extracted from this multi-year profile, and a static threshold was defined as their midpoint.
The two threshold approaches were subsequently used to determine relative SOS and EOS dates for each year from the full NDVI time series. Relative LOS was calculated as the number of days between EOS and SOS. These phenology metrics are considered relative, as threshold-based methods detect transitions in canopy greenness rather than absolute biological events corresponding to specific agronomic growth stages. Specifically, SOS marks the onset of rapid canopy green-up and sustained photosynthetic activity, while EOS marks the onset of sustained canopy senescence, rather than discrete phenological stages such as emergence, tillering or physiological maturity. Assigning these transitions to specific growth stages would require field-based phenological observations, which are beyond the scope of this study. The metrics are instead used to characterize relative interannual and regional patterns in canopy development and senescence.
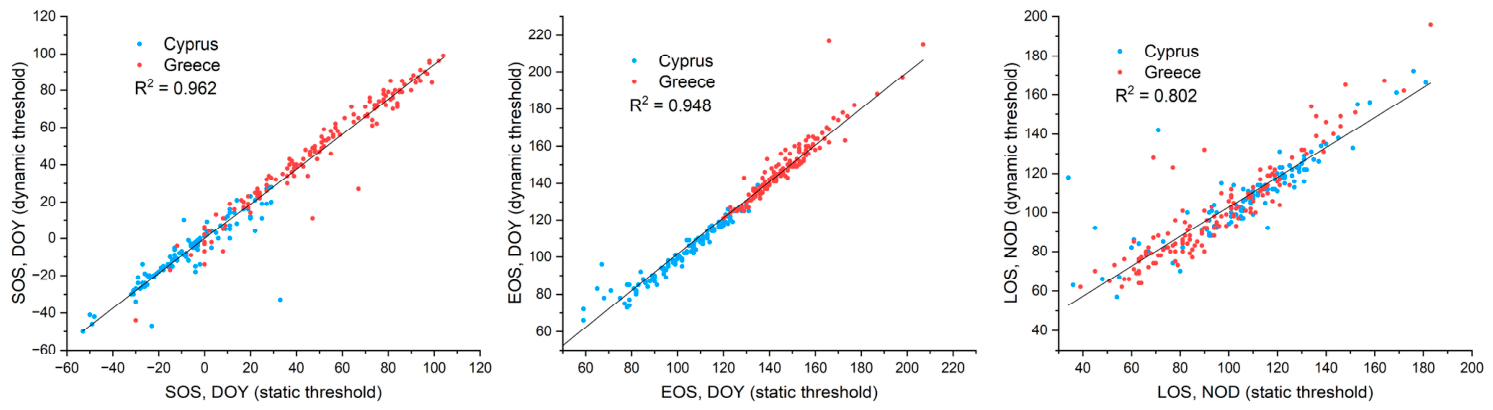
As shown in Appendix A, the phenology metrics produced by the two threshold approaches show high correlations, indicating that the multi-year threshold effectively captures interannual variability without introducing systematic bias. Accordingly, the static threshold approach was preferred over the dynamic approach, since the latter may “mask” important signal responses during extreme years. For example, in a year with unusually low NDVI amplitude, the dynamic threshold is lowered, which can artificially shift SOS earlier and make an anomalous year appear phenologically normal. In contrast, the static multi-year threshold identifies the date when the canopy reaches a consistent NDVI level across years, thereby preserving the signal of delayed development under adverse climatic conditions.
Phenological metrics were derived from 24 years of NDVI data for all sites, with the exception of Orounta. At this site, the 2008 NDVI time series marginally failed to exceed the static threshold required for phenology extraction, resulting in a total of 23 valid years of data. This was not due to data limitations, as the NDVI values in 2008 were consistent with those of surrounding years. A similar, though less pronounced, NDVI depression was also observed at a nearby site (Pera), suggesting that the reduced NDVI amplitude in 2008 likely reflects extreme climatic conditions that suppressed canopy development.
2.4. Climatic and CO2 Data
The climatic data used in this study were obtained from the TerraClimate dataset (http://www.climatologylab.org/terraclimate.html, accessed on 15 April 2025), which provides monthly data at a global scale with a spatial resolution of approximately 4 km [34]. TerraClimate integrates high-resolution climatological data with reanalysis outputs, offering robust coverage for terrestrial regions from 1958 onward.
For each study site, the extracted dataset included mean minimum and maximum monthly air temperatures and total monthly precipitation. The average monthly temperature was calculated as the mean of the minimum and maximum values. Data were spatially matched to the coordinates of each study site used in the phenological analysis, ensuring consistency between vegetation and climate signals.
Atmospheric CO2 concentration data were obtained from the NOAA Global Monitoring Laboratory (https://gml.noaa.gov/ccgg/trends/, accessed on 17 June 2025) and consist of globally averaged annual means [35].
2.5. Statistics
The relationships between phenological and geographic parameters were assessed using single linear regression analyses. The influence of climatic parameters and atmospheric CO2 was examined using a linear mixed-model (LMM) framework. LMMs are well suited for hierarchical and temporally structured datasets because they accommodate correlated observations, repeated measures and unbalanced sampling designs [36]. Climatic variables and atmospheric CO2 concentration were included as fixed-effect terms, while year was incorporated as a random effect term to account for interannual variability common to all sites. Atmospheric CO2 consists of globally averaged annual means, so it is spatially uniform and varies only between years; it increases monotonically and is almost perfectly correlated with time (R = 0.998, Appendix C). The year random intercept absorbs interannual deviations shared by all sites, but it does not model a systematic trend. The CO2 coefficient therefore represents any long-term trend in phenology not explained by the climatic predictors, and unobserved gradual changes, such as cultivar replacement, changes in sowing dates, irrigation expansion, fertilization or policy-driven management shifts, may contribute to it. To further evaluate whether CO2 added explanatory power beyond the climatic predictors, alternative model formulations excluding CO2 were also fitted (Appendix B).
Collinearity among predictors was assessed using pairwise Pearson correlations, as variance inflation factors are not directly applicable to LMMs (Appendix C). Model fit was evaluated using marginal and conditional R2 according to [37]. Marginal R2 represents the variance explained by fixed effects (climate variables and CO2), whereas conditional R2 represents the variance explained by both fixed and random effects (interannual variability). In addition, the predictive performance of the models was assessed by the predictive R2 between observed and model-predicted phenology values. Climatic parameters were examined for different monthly intervals, concurrent and lagged, in relation to the corresponding phenological event, extending up to six months prior for SOS and up to nine months prior for EOS and LOS. For each phenological metric and region, all monthly predictors and CO2 were entered simultaneously in a single model, without stepwise or iterative selection, so that each coefficient is estimated conditionally on all other predictors (full list in Appendix B, Table A2). An association between CO2 and phenology was tested as a specific a priori hypothesis, represented by a single predictor, and its contribution was additionally assessed by model comparison (AIC, BIC; Appendix B). Associations with temperature and precipitation were also expected a priori, but the months in which they would be expressed were not specified in advance; they were therefore evaluated across multiple monthly windows, and the individual monthly associations were treated as exploratory. No formal correction for multiple testing was applied to the climatic predictors, since such corrections markedly inflate Type II errors when predictors are numerous and intercorrelated, as monthly climatic variables are [38,39]. Their interpretation was instead based on the sign, magnitude and physiological consistency of the coefficients, together with the overall explanatory power of the models. All statistical analyses were performed using the jamovi v2.6.44 statistical software (The jamovi project, 2024 [40]).
3. Results
3.1. Phenology
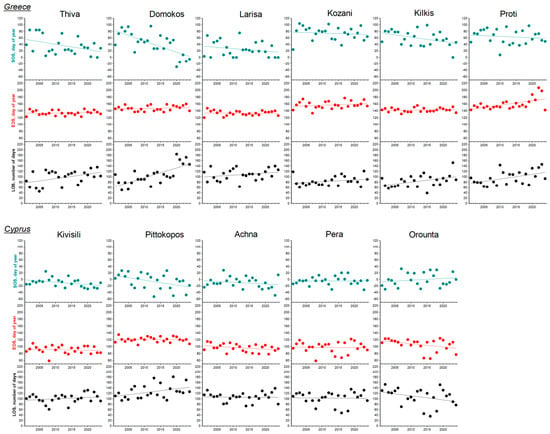
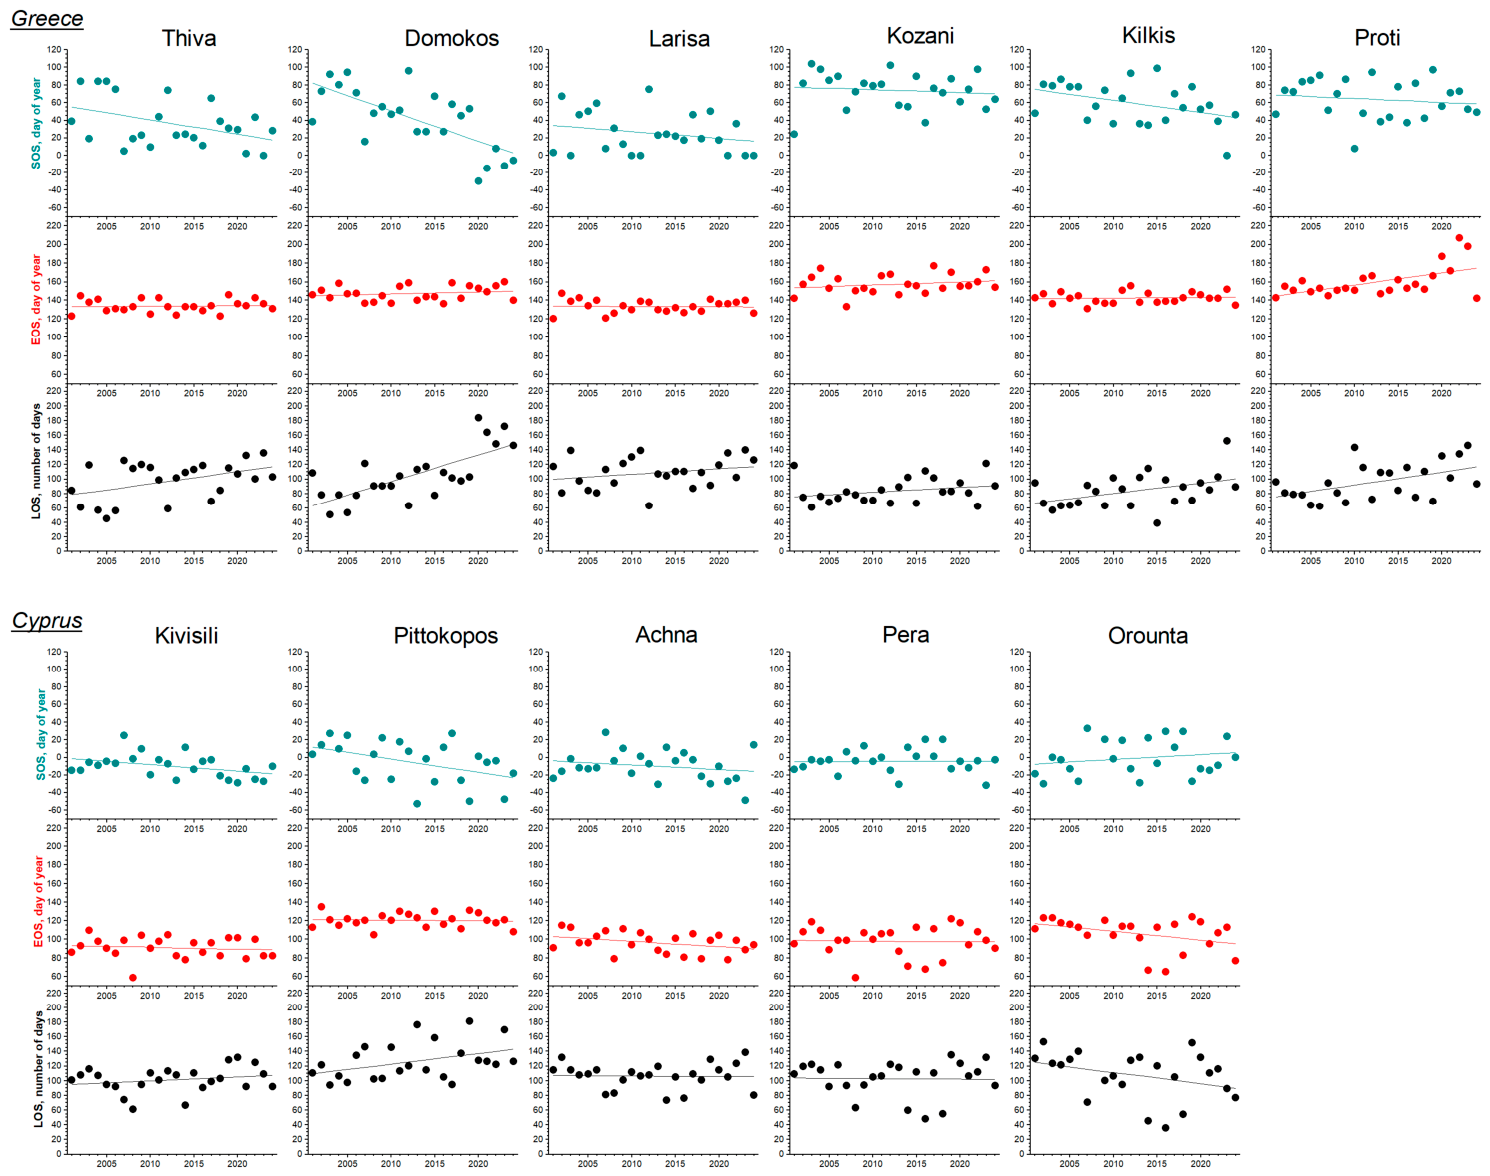
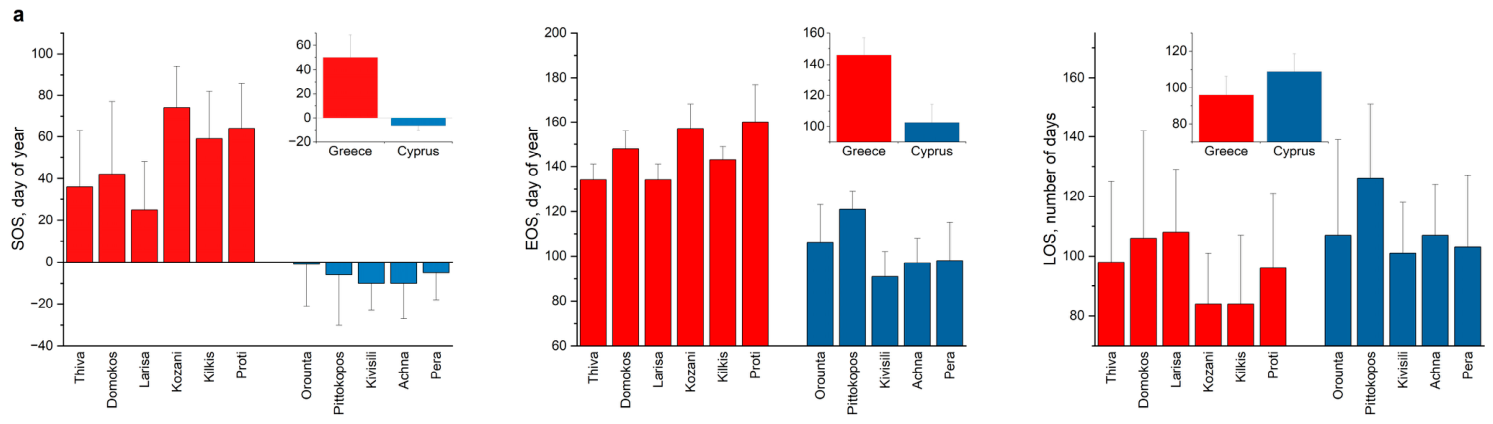
Τhe interannual variability of SOS, EOS and LOS, along with their corresponding statistics, is presented in Figure 2 and Figure 3. Based on the average SOS and EOS dates per country (Figure 3a insets), the growing season in the Greek sites occurs later than in Cypriot sites, with a difference of 56 days in SOS and 43 days in EOS. Specifically, the average SOS in Greece corresponds to 19 February (DOY 50), while for Cyprus, it corresponds to 24 December (DOY –6). Accordingly, the average EOS is 26 May (DOY 146) for Greece and 12 April (DOY 103) for Cyprus. These differences result in a 13-day longer LOS in Cyprus.
Figure 2.
Interannual fluctuation of SOS, EOS and LOS for the Greek (top) and Cypriot (bottom) sites. Lines correspond to the linear regressions of the phenological parameters in time, and their statistics are presented in Figure 3.
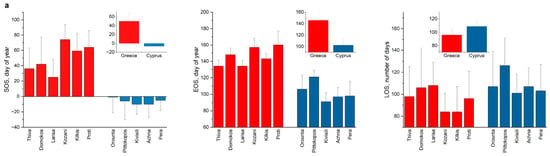
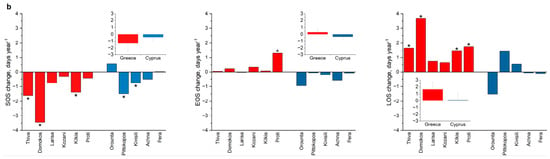
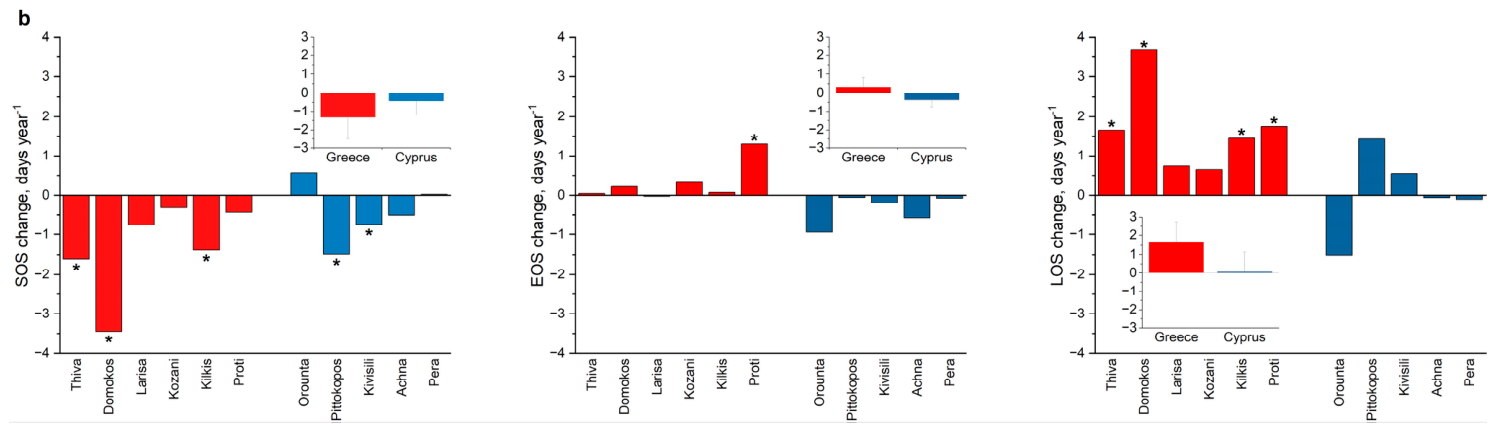
Figure 3.
(a) Timing (SOS, EOS, day of year) and duration (LOS, number of days) of the phenological events for the Greek and Cypriot sites. (b) Annual change in the phenological metrics (days per year) over the 24-year study period. Insets display average values for each country. Asterisks in panel (b) denote statistically significant trends at p < 0.05.
Temporal shifts in phenological parameters reveal distinct patterns between Greek and Cypriot sites (Figure 3b). All Greek sites and three out of the five Cypriot sites exhibit a trend toward earlier SOS, with average shifts of 1.3 and 0.4 days per year, respectively. In contrast, EOS trends diverge between the two countries: Greek sites show a tendency for later EOS, with an average delay of 0.3 days per year, while Cypriot sites show the opposite trend, with EOS occurring 0.4 days earlier per year on average. EOS trends are generally weaker than those for SOS, with only one out of 11 sites showing statistically significant change compared to five out of 11 for SOS. As a combined result of SOS and EOS shifts, all Greek sites show an extension in LOS by an average of 1.7 days per year, while Cypriot sites show mixed responses, with a modest average LOS extension of 0.1 days per year. Notably, LOS trends are statistically significant in four out of six Greek sites, whereas none of the Cypriot sites show a significant change.
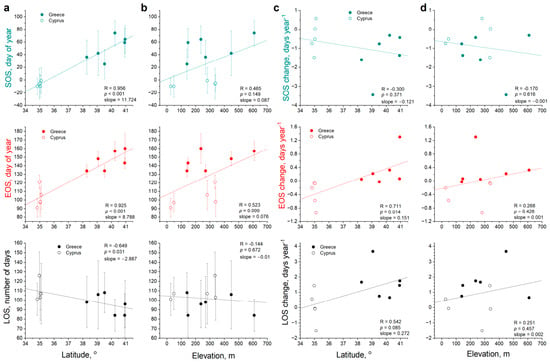
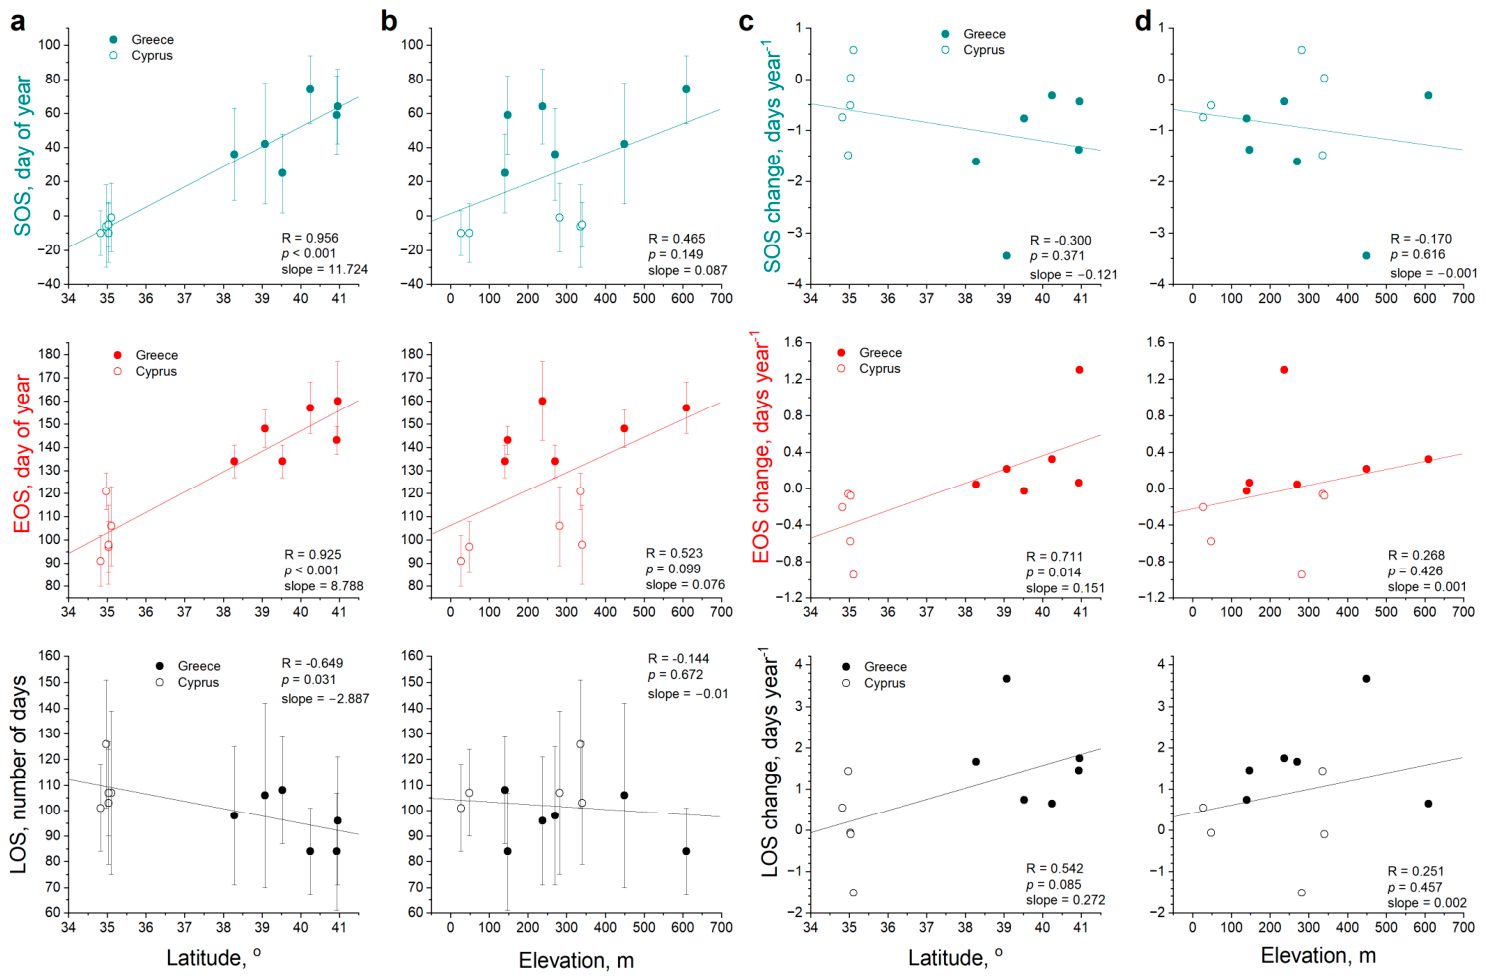
In Figure 4, the geographic influences (latitude, elevation) on phenological timing across Greek and Cypriot sites are presented. SOS timing shows a strong positive correlation with latitude (R = 0.956, p < 0.001) and moderate correlation with elevation (R = 0.465, p = 0.149), indicating later season onset at higher latitudes and higher elevations (Figure 4a). EOS timing is also strongly correlated with latitude (R = 0.925, p < 0.001) and moderately correlated with elevation (R = 0.523, p = 0.099), suggesting delayed EOS at higher latitudes and altitudes. In contrast, LOS exhibits a weak negative correlation with latitude (R = −0.649, p = 0.031) and no significant correlation with elevation (R = −0.144, p = 0.672), indicating limited geographic control over seasonal duration. These results highlight latitude as a dominant driver of phenological timing, particularly for SOS and EOS, while elevation exerts a secondary and less consistent influence.
Figure 4.
Correlations between phenological parameters (a,b) and their change in time (c,d) with site latitude (a,c) and elevation (b,d).
Temporal trends in phenological change show much weaker geographic influences (Figure 4b). Among the three phenological metrics, only EOS shows a statistically significant positive correlation with latitude (R = 0.711, p = 0.014), indicating that seasonal extension is more pronounced in northern (Greek) sites. In contrast, SOS and LOS trends show no significant correlations with either latitude or elevation, suggesting that their temporal trends cannot be attributed to geographic gradients.
3.2. Phenology and Climate
To assess the influence of climatic factors and atmospheric CO2 concentration on phenological timing and their temporal trends, LMM analyses were conducted separately for the Greek and Cypriot sites. The models included average monthly temperature (Tavg), total monthly precipitation (ppt) and atmospheric CO2 concentration as fixed-effect variables, while year was incorporated as a random effect term. Climatic variables were evaluated for both concurrent and lagged monthly intervals preceding each phenological event—up to six months prior for SOS and up to 9 months for EOS and LOS—to account for potential delayed responses.
The correlation matrix (Appendix C) showed that CO2 was only weakly to moderately correlated with climatic predictors (R ≤ 0.433), indicating that the CO2 term is not confounded with temperature or precipitation trends. Correlations among climatic variables themselves were moderate to high in some cases (maximum R = 0.723), but they remained below commonly accepted thresholds for problematic multicollinearity, confirming that the fixed-effect structure of the LMM is statistically stable.
For all phenological parameters, the most significant predictors (p ≤ 0.05) from the LMM analyses, along with their statistics (t, p), are presented in Table 2, while the full list of evaluated variables is provided in Appendix B. Additionally, the conditional, marginal and predictive R2 values of each model, as well as the observed (Figure 3b) and model-predicted temporal trends for each phenological metric, are reported in Table 2.
Table 2.
The most significant (p ≤ 0.05) fixed-effect variables explaining the variability of the phenological parameters, as determined by the linear mixed-model analysis, along with their corresponding statistics (t, p), model R2 values (conditional, marginal and predictive), and observed versus model-predicted phenology trends for Greece and Cyprus. Climatic variables follow the nomenclature Aaaa_BBB, where Aaaa denotes the variable (Tavg for average temperature and ppt for precipitation) and BBB the first three letters of the corresponding month. Variables are ranked in order of decreasing significance. The CO2 term for LOS in Greece (p = 0.054, in italics) is included as marginally significant.
In both regions, warmer winter conditions advance SOS (negative temperature effect), but the timing differs between them by one month (January for Greece and December for Cyprus). This shift is consistent with the earlier SOS observed in Cyprus, which occurs approximately two months before that of Greece (Figure 3a). Autumn precipitation (September in Greece, October and November in Cyprus) also advances SOS in both regions (negative precipitation effect), whereas winter precipitation (January for Greece, December for Cyprus) shows opposite effects between the two regions (delay in Greece, advance in Cyprus). Overall, model performance for SOS showed higher explanatory power for Greece (conditional R2 = 0.745) than for Cyprus (conditional R2 = 0.524), while the advancement trends were accurately reproduced for both regions.
EOS modeling revealed a major contrast between the two regions. Even though temperature advances EOS in both regions, in Greece CO2 emerged as the most significant predictor, with a positive coefficient (later EOS) that statistically offsets the advancing influence of temperature. In Greece, EOS is additionally affected by winter precipitation, with higher January rainfall delaying EOS and February rainfall advancing it. In Cyprus, EOS is driven exclusively by temperature, with strong advancing effects from September and April temperatures. Model performance was high for both regions, with slightly higher explanatory power in Cyprus (conditional R2 = 0.818) than in Greece (conditional R2 = 0.788), and the observed EOS trends were accurately reproduced in both cases.
Similar to EOS, CO2 was also associated with LOS in Greece only, albeit with marginal significance (p = 0.054), consistent with an overall extension of the growing period. LOS in Greece is further influenced by precipitation, with higher rainfall in September, March and April associated with longer growing seasons. Similar to Greece, precipitation effects for Cyprus are positive, with higher rainfall in October, December and March extending LOS. Temperature also plays a role in Cyprus, but with contrasting effects: warmer December temperatures lengthen LOS, whereas warmer September temperatures shorten it. Model performance was moderate to high for both regions, with higher explanatory power in Greece (conditional R2 = 0.743) compared to Cyprus (conditional R2 = 0.605), and the observed LOS trends were accurately reproduced by the models.
To evaluate whether the CO2 term added explanatory power beyond the climatic predictors, the full model was compared with an alternative formulation excluding CO2. These sensitivity analyses showed that CO2 improved model fit clearly for EOS in Greece (ΔAIC = −7) and marginally for LOS in Greece (ΔAIC = −2), while no improvement was observed for SOS in Greece or for any phenological metric in Cyprus (Appendix B). Importantly, the significant climatic predictors (p < 0.05) remained the same between the two model versions.
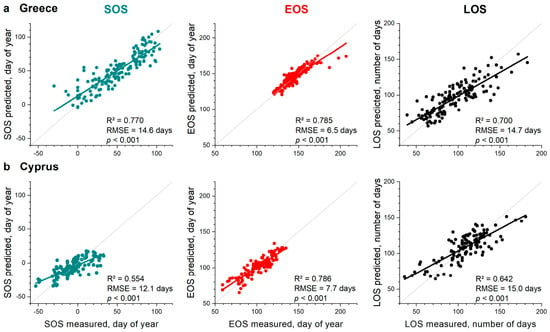
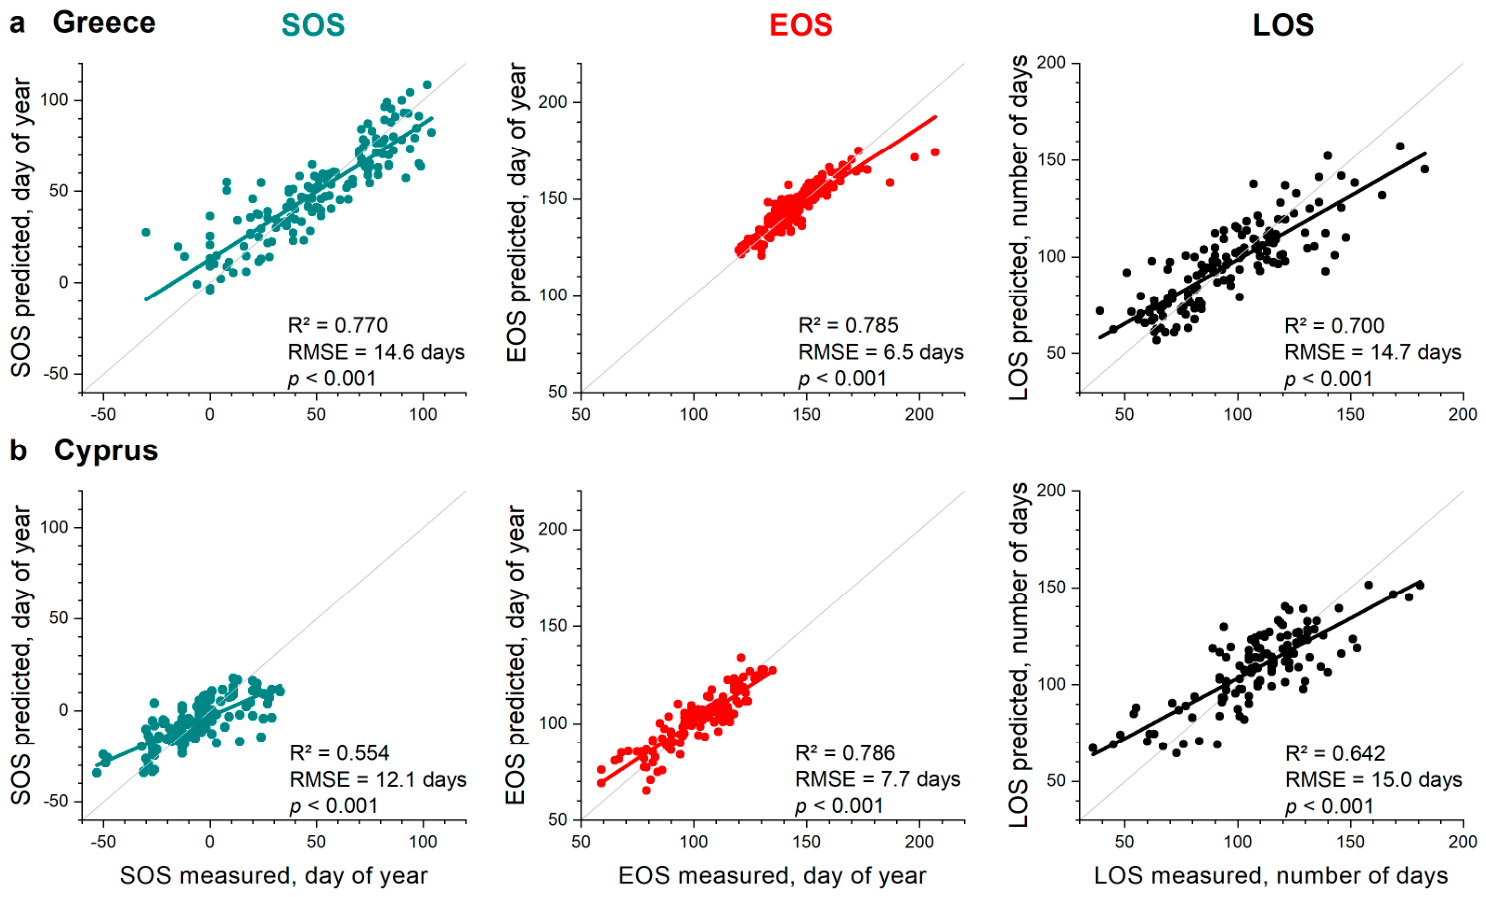
In Figure 5, the observed vs modeled values for the phenology metrics of the two regions are shown. All metrics demonstrated strong model performance in both regions, with clustering around the 1:1 line and moderate to high predictive R2 values, indicating accurate reconstruction of interannual variability. Overall, metrics for Greece showed better performance compared to Cyprus. Across all metrics and both regions, the models captured the observed interannual patterns (Figure 5) and trends (Table 2) with high consistency.
Figure 5.
Measured (MODIS-derived) versus predicted phenological parameters (SOS, EOS, and LOS) for the two studied regions, as estimated by the linear mixed-model analysis (Table 2).
4. Discussion
4.1. Phenological Patterns Between Greece and Cyprus
This study provides an assessment of wheat phenology across Greece and Cyprus, revealing distinct spatial and temporal patterns driven by climatic and geographic factors. The growing season in Cyprus begins and ends substantially earlier than in Greece, with SOS occurring 56 days earlier and EOS 43 days earlier on average, aligning with the milder winter conditions of Cyprus. Despite these differences, Cyprus exhibited a 13-day longer LOS, indicating that earlier establishment does not necessarily lead to earlier termination but rather to an extended growing period.
Temporal trends further highlight divergent phenological patterns. Greek sites consistently showed SOS advancement and EOS delay, resulting in LOS extension by 1.7 days per year. Cypriot sites displayed weaker and more variable trends, with a modest advancement in both SOS and EOS resulting in no significant LOS changes. These differences suggest that Greek wheat systems are undergoing a more pronounced phenological reorganization, potentially reflecting stronger climatic pressures or greater sensitivity to interannual variability. Overall, the observed trends—earlier SOS, delayed EOS and extended LOS—are consistent with broader global findings of growing season elongation under climate change [5,18,41], yet the differences between the two study regions may reflect Mediterranean climatic peculiarities. However, the magnitude of the Greek LOS extension (1.7 days per year) is larger than rates reported for other Mediterranean and European cereal systems, which are typically on the order of 0.2–1.1 days per year [42]. As LOS is a remote-sensing-based measure of canopy greenness duration rather than a direct measure of grain-filling duration or physiological maturity, this extension is best regarded as an indicator of prolonged canopy activity, to be considered alongside the broader climatic and agronomic changes occurring in Greece over the study period.
4.2. Geographic Control
Latitude emerged as a dominant geographic driver of phenological timing, strongly correlating with both SOS and EOS, while elevation played a secondary and less consistent role. These relationships are aligned with the temperature gradients across the two regions, where northern and higher-elevation sites experience cooler conditions that delay both onset and senescence. In contrast, LOS showed only weak geographic dependence, suggesting that the duration of the growing season is shaped more by local climatic conditions than by spatial gradients.
Temporal trends, however, were much less influenced by geography. Only EOS trends showed a significant correlation with latitude, indicating that seasonal extension is more pronounced in northern sites. These findings imply that the observed geographical effects on phenology timing and temporal trends may not be a direct effect of location but rather a proxy for underlying climatic conditions that vary between locations. It has to be noted that this latitudinal correlation is derived from a small number of sites that fall into two climatically distinct national groups (Greece and Cyprus) rather than a continuous geographic gradient. It should therefore be interpreted as a broad indicator of the climatic contrast between the two regions rather than evidence of a fine-grained or independently verified geographic control on phenology.
4.3. Climatic Drivers
Accordingly, the LMM analysis revealed distinct climatic controls on phenology between the two regions. In both Greece and Cyprus, temperature exerted a negative effect on SOS and EOS, with warmer conditions advancing both metrics. This consistent negative effect of temperature aligns with established physiological responses of wheat to thermal accumulation [22,43,44]. Autumn precipitation also showed a negative effect on SOS in both regions, with wetter conditions advancing growth. However, a pronounced regional contrast was revealed for EOS. In Greece, atmospheric CO2 was identified as the most significant predictor, with a positive association with EOS that statistically offsets the advancing influence of temperature and precipitation. In contrast, EOS in Cyprus was driven exclusively by temperature, with warmer conditions advancing senescence. Furthermore, LOS dynamics reflected the combined influence of SOS and EOS climatic drivers, while CO2 was marginally associated with longer LOS, again only in Greece. These differences highlight how the same crop species can exhibit distinct climatic sensitivities depending on local environmental constraints.
It is worth noting that the modest strength of precipitation effects, compared to those of temperature, may partly reflect supplemental irrigation practices, which can be common in Mediterranean wheat systems and are typically applied during spring, when rainfall may become scarce and crop water demands peak. Where irrigation buffers soil moisture during this period, precipitation becomes a less reliable proxy for plant-available water. As management practices are not available for this study, this influence cannot be isolated directly, though its interannual component may be partly absorbed by the year random effect in the LMM analyses.
The CO2 association found for EOS and LOS at the Greek sites may reflect physiological responses associated with elevated CO2, such as enhanced photosynthetic efficiency and water-use regulation [45,46,47,48]. CO2 fertilization has been widely documented across natural ecosystems, contributing to enhanced net primary productivity (NPP) and water-use efficiency [49,50] as atmospheric CO2 concentrations have progressively risen over recent decades. Satellite-based studies have attributed a substantial portion of global greening, particularly in forests, savannas and grasslands, to CO2 fertilization [51]. However, the extent to which elevated CO2 can counteract the negative effects of rising temperatures is highly variable and often constrained by nutrient (especially nitrogen and phosphorus) and water availability [52,53]. Concerning crops, similar results have been reported by studies evaluating temperature and CO2 [54,55,56]. However, these studies concern Free-Air CO2 Enrichment (FACE) and Open-Top Chamber (OTC) experiments. Even though these approaches provide the mechanistic basis for the counteracting effects of CO2 in relation to temperature, they do not fully represent real-world conditions, as they impose abrupt CO2 elevations, alter the microclimate, operate over limited time scales, and cover restricted geographic areas. To our knowledge, this study is the first long-term satellite-based analysis to detect a statistical association between atmospheric CO2 and both later EOS and longer LOS in crops, which, in the models, offsets the advancing effect of temperature and precipitation. However, our results do not imply physiological causation, which would require long-term field-level physiological, management, or yield data that are not available for the study regions. Instead, the findings should be interpreted as a statistical association in which atmospheric CO2 is linked to delayed EOS and extended LOS in Greece after accounting for climatic variability. Notably, this association emerges only in Greece and not in Cyprus, despite both regions experiencing the same monotonic CO2 increase. This excludes long-term trends common to both regions as an explanation, but not trends specific to Greece, such as changes in cultivars or management, as discussed below.
Accordingly, the differential CO2 association between Greece and Cyprus may reflect underlying ecological thresholds or interactions with temperature, moisture regimes and nutrient availability. Although growing-season precipitation is similar in the two regions (Table 1), the considerably higher temperatures in Cyprus imply a higher evaporative demand, so that wheat is typically grown under more persistent water-limited conditions than in Greece, while its soils are predominantly shallow and low in fertility [57]. Under such conditions, plants may already exhibit near-maximal stomatal closure, rendering any additional CO2-induced regulation of stomatal conductance and water-use efficiency [45,58] largely ineffective as a means of further extending the growing season. This offers a plausible explanation for why a CO2-related signal is detected in Greece but not in Cyprus and may be presented as a hypothesis consistent with known physiological mechanisms rather than a finding established by this study, which is not designed to isolate physiological pathways.
Across all phenological metrics, the LMMs demonstrated strong performance, accurately reproducing both interannual variability and long-term trends. Predictive R2 values were moderate to high, with generally better performance in Greece than in Cyprus. This difference may reflect the stronger climatic signals and more consistent phenological trends observed at Greek sites.
The accurate reconstruction of observed trends suggests that the models capture the main sources of variability in wheat phenology in the region, particularly winter temperature, autumn precipitation and the CO2-related trend, although, given the correlative design, this does not establish the underlying mechanisms. These findings have important implications for understanding how Mediterranean wheat systems may respond to ongoing climate change. Earlier SOS and extended LOS in Greece indicate a shift toward longer growing seasons, potentially increasing yield but also exposing crops to late-season heat or water stress. In Cyprus, weaker and more variable trends suggest a more complex interplay between warming, moisture availability and crop development.
However, it is important to note that wheat phenology is also shaped by agronomic management practices and varietal characteristics, which were not explicitly represented in this study due to the lack of long-term, spatially resolved datasets for Greece and Cyprus. Changes in sowing dates, nitrogen fertilization regimes, irrigation use and the adoption of improved cultivars can substantially influence phenological timing and may interact with temperature, moisture and CO2 responses. Such management-driven variability likely contributes to part of the interannual variation not explained by the climate-based models of this study. In the linear mixed models, the year random intercept absorbs management variability that is common to all sites in a given year and fluctuates between years, such as a nationwide shift in sowing dates in a particular season. It does not capture management that differs between sites, nor gradual changes that progress steadily over time, such as cultivar replacement, changes in seeding rates or the expansion of supplemental irrigation. Because CO2 also increases steadily, such gradual changes would be partly absorbed by the CO2 term, and they may therefore contribute to the CO2 association detected in Greece. Disentangling these influences would require long-term, site-level records of cultivars and management, which are not available for the study regions. Accordingly, the climate and CO2 coefficients reported here should be interpreted as statistical associations rather than confirmed causal mechanisms, and the possibility that unmeasured management trends partially covary with the climatic or atmospheric predictors cannot be fully excluded. Moreover, because each model evaluated a large number of monthly predictors without formal correction for multiple testing (Section 2.5), individual monthly associations, particularly those with p-values close to 0.05, should be regarded as exploratory and warrant confirmation with independent datasets. Incorporating detailed management and cultivar information into future phenology analyses might therefore help reduce unexplained variance and provide a more integrated understanding of climatic and agronomic controls on crop development.
Overall, this study demonstrates the value of combining long-term remote sensing, climatic and atmospheric data, and integrative modeling to unravel the complex drivers of crop phenology, particularly under future climate change scenarios where temperature and CO2 levels are expected to rise further. The regional contrasts between Greece and Cyprus highlight the need for site-specific adaptation strategies, accounting for thermal, hydrological and soil sensitivities. Future work could explore nonlinear modeling approaches, incorporate soil and management variables, and assess phenological responses under projected climate and CO2 trajectories to better inform agricultural planning and resilience.
5. Conclusions
This study provides a long-term assessment of wheat phenology across Greece and Cyprus using MODIS-derived NDVI time series over a 24-year period. The results revealed consistent trends toward earlier SOS in both regions and divergent trends for LOS and EOS, with Greece showing delayed EOS and extended LOS and Cyprus displaying weaker and more variable responses. It should be noted that the satellite-derived LOS reflects the duration of canopy greenness detected by NDVI, rather than the physiological duration of crop development or the grain-filling period that determines yield; the reported LOS extension should therefore not be directly interpreted as a change in yield potential. Geographic factors such as latitude and elevation primarily explain the spatial distribution of phenological timing, while temporal trends are associated with climatic and atmospheric variability.
Linear mixed-model analyses identified temperature as the dominant climatic driver of SOS and EOS in both regions, with warmer conditions consistently advancing phenological transitions. Precipitation also influenced phenology, particularly during autumn and winter, but with region-specific effects that reflect local water-availability constraints. A key finding of this study is the emergence of atmospheric CO2 as an additional statistical predictor of EOS and LOS in Greece, where it was associated with later EOS and marginally longer LOS, offsetting climate-driven advances in the models. In contrast, no such CO2 association was detected for Cyprus, possibly reflecting more constrained environmental conditions. Since this signal is correlative and cannot be fully separated from other long-term trends, its physiological basis remains to be confirmed by field-level studies.
These findings underscore the importance of integrating geographic, climatic and atmospheric variables to accurately model crop phenology under changing environmental conditions. The differences between Greece and Cyprus emphasize the need for region-specific adaptation strategies, particularly in Mediterranean agroecosystems, which are ranked among the most vulnerable to climate change globally. Future research could explore nonlinear modeling approaches and incorporate soil, management and physiological data to further refine predictions and support resilient agricultural planning.
Funding
This research received no external funding.
Data Availability Statement
Data available on request from the author.
Acknowledgments
The author would like to thank the Cyprus Agricultural Payments Organization for providing the wheat cultivation map of Cyprus within the framework of the LIFE AgrOasis project (LIFE21 CCA/CY/101074744) “Regenerative approaches for building climate change resilience in EU agricultural regions prone to desertification”, co-funded by the European Union LIFE Programme. Appreciation is also extended to the teams who make valuable scientific datasets freely available (NASA’s ORNL group, the TerraClimate team and the NOAA Global Monitoring Laboratory). The research was conducted in the operating framework of the University of Thessaly Innovation, Technology Transfer Unit and Entrepreneurship Center “One Planet Thessaly”, under the “University of Thessaly Grants for Scientific Publication Support” action and was funded by the Special Account of Research Grants of the University of Thessaly.
Conflicts of Interest
The author declares no conflicts of interest.
Appendix A
Comparison of the phenology metrics determined by the static and dynamic threshold approaches.
Figure A1.
Comparison of the phenology metrics (SOS, EOS, and LOS) determined by the static (multi-year) and dynamic (per year) threshold approaches for all study sites.
Appendix B
This appendix presents the sensitivity analyses used to evaluate the contribution of atmospheric CO2 to the main models and whether this contribution is consistent across regions and phenological metrics. For each phenological metric and region, the full linear mixed models including CO2 (+CO2) are compared with otherwise identical models excluding CO2 (−CO2). Model performance is assessed using marginal and conditional R2 (and their associated p-values), log-likelihood, Akaike information criterion (AIC) and Bayesian information criterion (BIC) (Table A1). To examine how CO2 influences the temporal structure of the data, the variance of the random year intercept, the residual variance and the intraclass correlation coefficient (ICC) are also reported. A substantial reduction in year-level variance when CO2 is included indicates that CO2 captures temporal variability previously absorbed by the random effect.
For Greece, the inclusion of CO2 improves model fit strongly for EOS (ΔAIC = −7, ΔBIC = −3) and marginally for LOS (ΔAIC = −2, ΔBIC = +1), as indicated by higher marginal R2 values and the AIC and BIC scores of the +CO2 models. For EOS in particular, CO2 results in a marked reduction in the year-level variance, showing that part of the long-term temporal structure absorbed by the random year effect in the −CO2 models is now explained by CO2. In contrast, SOS in Greece and all phenological metrics in Cyprus show minimal differences between the +CO2 and −CO2 models, with nearly identical R2 values, likelihoods, and random-effect variances. This pattern demonstrates that the CO2 association is selective rather than universal, which argues against an artifact of long-term trends common to both regions; trends specific to Greece, however, cannot be excluded (Section 4.3).
Full fixed-effect statistics (t-values, p-values) are provided in Table A2. It is worth noting that the climatic predictors that appear as significant in the +CO2 models are the same as those identified in the −CO2 models, demonstrating that the inclusion of CO2 does not change the underlying climate–phenology relationships or the ranking of the most influential variables.
Table A1.
Sensitivity analysis comparing full models including CO2 (+CO2) and alternative models excluding CO2 (−CO2) for each phenological metric and region.
Table A2.
Fixed-effect variables used in the linear mixed-model analysis including CO2 (+CO2) and excluding CO2 (−CO2) for each phenological metric and region, along with their corresponding statistics (t, p). Climatic variables follow the nomenclature Aaaa_BBB, where Aaaa denotes the variable (Tavg for average temperature and ppt for precipitation) and BBB the first three letters of the corresponding month. Variables are ranked in order of decreasing significance. Variables with p ≤ 0.05 in at least one of the two model versions are shown in color; within each phenological metric, the same color identifies the same variable in the +CO2 and −CO2 models, to facilitate their comparison. The significant variables of the +CO2 models are also reported in Table 2.
Appendix C
Table A3.
Correlation matrix between variables used in the linear mixed-model analysis for Greece and Cyprus. Cell colors indicate the sign and strength of the correlation coefficients (green: positive; red: negative), with color intensity increasing with the absolute value of the coefficient, according to the color scale shown beside each matrix.
References
- Lieth, H. Purposes of a Phenology Book. In Phenology and Seasonality Modeling; Lieth, H., Ed.; Ecological Studies; Springer: Berlin/Heidelberg, Germany, 1974; Volume 8, pp. 3–19. [Google Scholar] [CrossRef] [Scilit]
- Richardson, A.D.; Keenan, T.F.; Migliavacca, M.; Ryu, Y.; Sonnentag, O.; Toomey, M. Climate Change, Phenology, and Phenological Control of Vegetation Feedbacks to the Climate System. Agric. For. Meteorol. 2013, 169, 156–173. [Google Scholar] [CrossRef] [Scilit]
- Zhang, F.; Jia, Z.; Guo, L.; Song, Z.; Cui, S. Joint Effects of Climate and Phenology on Agricultural and Ecological Resource Productivity. Agronomy 2025, 15, 2486. [Google Scholar] [CrossRef] [Scilit]
- Zhou, R.; Wen, G.; Li, H.; Zhu, S.; Li, Y.; Wang, X. Evolution of Vegetation Phenology Research under Climate Change: A Comprehensive Bibliometric Study. Front. For. Glob. Change 2025, 8, 1688384. [Google Scholar] [CrossRef] [Scilit]
- Piao, S.; Liu, Q.; Chen, A.; Janssens, I.A.; Fu, Y.; Dai, J.; Liu, L.; Lian, X.; Shen, M.; Zhu, X. Plant Phenology and Global Climate Change: Current Progresses and Challenges. Glob. Change Biol. 2019, 25, 1922–1940. [Google Scholar] [CrossRef] [Scilit]
- Zeng, L.; Wardlow, B.D.; Xiang, D.; Hu, S.; Li, D. A Review of Vegetation Phenological Metrics Extraction Using Time-Series, Multispectral Satellite Data. Remote Sens. Environ. 2020, 237, 111511. [Google Scholar] [CrossRef] [Scilit]
- Chakraborty, D.; Sehgal, V.K.; Dhakar, R.; Das, D.K.; Sahoo, R.N. Trends and Change-Point in Satellite Derived Phenology Parameters in Major Wheat Growing Regions of North India during the Last Three Decades. J. Indian Soc. Remote Sens. 2018, 46, 59–68. [Google Scholar] [CrossRef] [Scilit]
- Gobin, A.; Sallah, A.-H.M.; Curnel, Y.; Delvoye, C.; Weiss, M.; Wellens, J.; Piccard, I.; Planchon, V.; Tychon, B.; Goffart, J.-P.; et al. Crop Phenology Modelling Using Proximal and Satellite Sensor Data. Remote Sens. 2023, 15, 2090. [Google Scholar] [CrossRef] [Scilit]
- Meroni, M.; d’Andrimont, R.; Vrieling, A.; Fasbender, D.; Lemoine, G.; Rembold, F.; Seguini, L.; Verhegghen, A. Comparing Land Surface Phenology of Major European Crops as Derived from SAR and Multispectral Data of Sentinel-1 and -2. Remote Sens. Environ. 2021, 253, 112232. [Google Scholar] [CrossRef] [Scilit]
- Misra, G.; Cawkwell, F.; Wingler, A. Status of Phenological Research Using Sentinel-2 Data: A Review. Remote Sens. 2020, 12, 2760. [Google Scholar] [CrossRef] [Scilit]
- Schreier, J.; Ghazaryan, G.; Dubovyk, O. Crop-Specific Phenomapping by Fusing Landsat and Sentinel Data with MODIS Time Series. Eur. J. Remote Sens. 2021, 54, 47–58. [Google Scholar] [CrossRef] [Scilit]
- Mirgol, B.; Dieppois, B.; Northey, J.; Jarlan, L.; Khabba, S.; Le Page, M.; Eden, J.; Ekolu, J.; El Hazdour, I.; Mahe, G. Interplay among Recent Trends in Climate Extremes, Vegetation Phenology, and Crop Production in the Southern Mediterranean Region. Int. J. Climatol. 2025, 45, e8768. [Google Scholar] [CrossRef] [Scilit]
- Yoldi-Achalandabaso, A.; Vicente, R.; Muñoz-Rueda, A.; Pérez-López, U. Unveiling Herbaceous Plant Responses to Future Triple Interaction of Drought and Elevated Temperature and [CO2]: Systematic Review and Meta-Analysis. Physiol. Plant. 2025, 177, e70125. [Google Scholar] [CrossRef] [Scilit]
- Fang, H.; Sha, M.; Xie, Y.; Lin, W.; Qiu, D.; Tu, J.; Tan, X.; Li, X.; Sha, Z. Shifted Global Vegetation Phenology in Response to Climate Changes and Its Feedback on Vegetation Carbon Uptake. Remote Sens. 2023, 15, 2288. [Google Scholar] [CrossRef] [Scilit]
- Menzel, A.; Sparks, T.H.; Estrella, N.; Koch, E.; Aasa, A.; Ahas, R.; Alm-Kübler, K.; Bissolli, P.; Braslavská, O.; Briede, A.; et al. European Phenological Response to Climate Change Matches the Warming Pattern. Glob. Change Biol. 2006, 12, 1969–1976. [Google Scholar] [CrossRef] [Scilit]
- Li, Y.; Zhang, Y.; Gu, F.; Liu, S. Discrepancies in Vegetation Phenology Trends and Shift Patterns in Different Climatic Zones in Middle and Eastern Eurasia between 1982 and 2015. Ecol. Evol. 2019, 9, 8664–8675. [Google Scholar] [CrossRef] [Scilit]
- Wang, Y.; Zhou, R.; Xiao, J.; Li, X.; Niu, S. Cumulative and Legacy Effects of Droughts on Global Photosynthetic Phenology. In Phenology: An Integrative Environmental Science; Schwartz, M.D., Ed.; Springer Nature Switzerland: Cham, Switzerland, 2024; pp. 531–551. ISBN 978-3-031-75027-4. [Google Scholar]
- Calinger, K.; Curtis, P. A Century of Climate Warming Results in Growing Season Extension: Delayed Autumn Leaf Phenology in North Central North America. PLoS ONE 2023, 18, e0282635. [Google Scholar] [CrossRef] [Scilit]
- Crabbe, R.A.; Dash, J.; Rodriguez-Galiano, V.F.; Janous, D.; Pavelka, M.; Marek, M.V. Extreme Warm Temperatures Alter Forest Phenology and Productivity in Europe. Sci. Total Environ. 2016, 563–564, 486–495. [Google Scholar] [CrossRef] [Scilit]
- Ding, H.; Ge, W.; Wang, C.; Li, X. Evaluation of the Spatial Responses in Vegetation Phenology to Drought and the Analysis of Their Driving Factors in China. Front. Earth Sci. 2024, 12, 145928. [Google Scholar] [CrossRef] [Scilit]
- Nie, X.; Zhang, X.; Hao, F.; Li, X.; De Boeck, H.J.; Fu, Y.H. Turning Points in Vegetation Phenology Trends and Their Relationship to Climate in Arid Central Asia. J. Geophys. Res. BiogEOSciences 2024, 129, e2023JG007989. [Google Scholar] [CrossRef] [Scilit]
- Ren, S.; Qin, Q.; Ren, H. Contrasting Wheat Phenological Responses to Climate Change in Global Scale. Sci. Total Environ. 2019, 665, 620–631. [Google Scholar] [CrossRef] [Scilit]
- Yang, Y.; Ren, W.; Tao, B.; Ji, L.; Liang, L.; Ruane, A.C.; Fisher, J.B.; Liu, J.; Sama, M.; Li, Z.; et al. Characterizing Spatiotemporal Patterns of Crop Phenology across North America during 2000–2016 Using Satellite Imagery and Agricultural Survey Data. ISPRS J. Photogramm. Remote Sens. 2020, 170, 156–173. [Google Scholar] [CrossRef] [Scilit]
- Anwar, M.R.; Liu, D.L.; Farquharson, R.; Macadam, I.; Abadi, A.; Finlayson, J.; Wang, B.; Ramilan, T. Climate Change Impacts on Phenology and Yields of Five Broadacre Crops at Four Climatologically Distinct Locations in Australia. Agric. Syst. 2015, 132, 133–144. [Google Scholar] [CrossRef] [Scilit]
- Azmat, M.; Ilyas, F.; Sarwar, A.; Huggel, C.; Vaghefi, S.A.; Hui, T.; Qamar, M.U.; Bilal, M.; Ahmed, Z. Impacts of Climate Change on Wheat Phenology and Yield in Indus Basin, Pakistan. Sci. Total Environ. 2021, 790, 148221. [Google Scholar] [CrossRef] [Scilit]
- Lebrini, Y.; Boudhar, A.; Laamrani, A.; Htitiou, A.; Lionboui, H.; Salhi, A.; Chehbouni, A.; Benabdelouahab, T. Mapping and Characterization of Phenological Changes over Various Farming Systems in an Arid and Semi-Arid Region Using Multitemporal Moderate Spatial Resolution Data. Remote Sens. 2021, 13, 578. [Google Scholar] [CrossRef] [Scilit]
- Cramer, W.; Guiot, J.; Fader, M.; Garrabou, J.; Gattuso, J.-P.; Iglesias, A.; Lange, M.A.; Lionello, P.; Llasat, M.C.; Paz, S.; et al. Climate Change and Interconnected Risks to Sustainable Development in the Mediterranean. Nat. Clim. Change 2018, 8, 972–980. [Google Scholar] [CrossRef] [Scilit]
- Giorgi, F.; Lionello, P. Climate Change Projections for the Mediterranean Region. Glob. Planet. Change 2008, 63, 90–104. [Google Scholar] [CrossRef] [Scilit]
- Hassan, T.; Gulzar, R.; Hamid, M.; Ahmad, R.; Waza, S.A.; Khuroo, A.A. Plant Phenology Shifts under Climate Warming: A Systematic Review of Recent Scientific Literature. Env. Monit. Assess. 2023, 196, 36. [Google Scholar] [CrossRef] [Scilit]
- Shiferaw, B.; Smale, M.; Braun, H.-J.; Duveiller, E.; Reynolds, M.; Muricho, G. Crops That Feed the World 10. Past Successes and Future Challenges to the Role Played by Wheat in Global Food Security. Food Sec 2013, 5, 291–317. [Google Scholar] [CrossRef] [Scilit]
- Fuglie, K.O.; Echeverria, R.G. The Economic Impact of CGIAR-Related Crop Technologies on Agricultural Productivity in Developing Countries, 1961–2020. World Dev. 2024, 176, 106523. [Google Scholar] [CrossRef] [Scilit]
- Cavalaris, C.; Megoudi, S.; Maxouri, M.; Anatolitis, K.; Sifakis, M.; Levizou, E.; Kyparissis, A. Modeling of Durum Wheat Yield Based on Sentinel-2 Imagery. Agronomy 2021, 11, 1486. [Google Scholar] [CrossRef] [Scilit]
- White, M.A.; Nemani, R.R. Real-Time Monitoring and Short-Term Forecasting of Land Surface Phenology. Remote Sens. Environ. 2006, 104, 43–49. [Google Scholar] [CrossRef] [Scilit]
- Abatzoglou, J.T.; Dobrowski, S.Z.; Parks, S.A.; Hegewisch, K.C. Terraclimate, a High-Resolution Global Dataset of Monthly Climate and Climatic Water Balance from 1958–2015. Sci. Data 2018, 5, 170191. [Google Scholar] [CrossRef] [Scilit]
- Lan, X.; Tans, P.; Thoning, K.W. Trends in Globally-Averaged CO2 Determined from NOAA Global Monitoring Laboratory Measurements. NOAA Global Monitoring Laboratory, Boulder, CO, USA. Available online: https://gml.noaa.gov/ccgg/trends/global.html (accessed on 17 June 2025).
- West, B.T.; Welch, K.B.; Galecki, A.T. Linear Mixed Models: A Practical Guide Using Statistical Software, 3rd ed.; Chapman and Hall/CRC: New York, NY, USA, 2022; ISBN 978-1-003-18106-4. [Google Scholar]
- Nakagawa, S.; Schielzeth, H. A General and Simple Method for Obtaining R2 from Generalized Linear Mixed-Effects Models. Methods Ecol. Evol. 2013, 4, 133–142. [Google Scholar] [CrossRef] [Scilit]
- Moran, M.D. Arguments for rejecting the sequential Bonferroni in ecological studies. Oikos 2003, 100, 403–405. [Google Scholar] [CrossRef] [Scilit]
- Nakagawa, S. A farewell to Bonferroni: The problems of low statistical power and publication bias. Behav. Ecol. 2004, 15, 1044–1045. [Google Scholar] [CrossRef] [Scilit]
- The jamovi Project. jamovi, Version 2.6 [Computer Software]; The jamovi Project: Sydney, Australia, 2024; Available online: https://www.jamovi.org (accessed on 17 December 2024).
- Linderholm, H.W. Growing Season Changes in the Last Century. Agric. For. Meteorol. 2006, 137, 1–14. [Google Scholar] [CrossRef] [Scilit]
- Benito-Verdugo, P.; González-Zamora, Á.; Martínez-Fernández, J. Recent Cereal Phenological Variations under Mediterranean Conditions. Remote Sens. 2024, 16, 1879. [Google Scholar] [CrossRef] [Scilit]
- Bogale, T.; Degefa, S.; Dalle, G. Phenological Responses of Wheat (Triticum Aestivum l.) Crop to Climate Variability and Change: Review. Agric. For. Fish. 2025, 14, 91–104. [Google Scholar] [CrossRef] [Scilit]
- Kanapickas, A.; Vagusevičienė, I.; Juknys, R.; Sujetovienė, G. Effects of Climatic and Cultivar Changes on Winter Wheat Phenology in Central Lithuania. Int. J. Biometeorol. 2022, 66, 2009–2020. [Google Scholar] [CrossRef] [Scilit]
- Dahal, K.; Milne, M.A.; Gervais, T. The Enhancement of Photosynthetic Performance, Water Use Efficiency and Potato Yield under Elevated CO2 Is Cultivar Dependent. Front. Plant Sci. 2023, 14, 1287825. [Google Scholar] [CrossRef] [Scilit]
- Leakey, A.D.B.; Ainsworth, E.A.; Bernacchi, C.J.; Rogers, A.; Long, S.P.; Ort, D.R. Elevated CO2 Effects on Plant Carbon, Nitrogen, and Water Relations: Six Important Lessons from FACE. J. Exp. Bot. 2009, 60, 2859–2876. [Google Scholar] [CrossRef] [Scilit]
- Prior, S.A.; Runion, G.B.; Marble, S.C.; Rogers, H.H.; Gilliam, C.H.; Torbert, H.A. A Review of Elevated Atmospheric CO2 Effects on Plant Growth and Water Relations: Implications for Horticulture. HortScience 2011, 46, 158–162. [Google Scholar] [CrossRef] [Scilit]
- Zhan, W.; Lian, X.; Jiangong, L.; Han, J.; Huang, Y.; Yang, H.; Zhan, C.; Winkler, A.; Gentine, P. Reduced Water Loss Rather than Increased Photosynthesis Controls CO2-Enhanced Water-Use Efficiency. Nat. Ecol. Evol. 2025, 9, 1571–1584. [Google Scholar] [CrossRef] [Scilit]
- Haverd, V.; Smith, B.; Canadell, J.G.; Cuntz, M.; Mikaloff-Fletcher, S.; Farquhar, G.; Woodgate, W.; Briggs, P.R.; Trudinger, C.M. Higher than Expected CO2 Fertilization Inferred from Leaf to Global Observations. Glob. Change Biol. 2020, 26, 2390–2402. [Google Scholar] [CrossRef] [Scilit]
- Zhu, Z.; Piao, S.; Myneni, R.B.; Huang, M.; Zeng, Z.; Canadell, J.G.; Ciais, P.; Sitch, S.; Friedlingstein, P.; Arneth, A.; et al. Greening of the Earth and Its Drivers. Nat. Clim. Change 2016, 6, 791–795. [Google Scholar] [CrossRef] [Scilit]
- Piao, S.; Wang, X.; Park, T.; Chen, C.; Lian, X.; He, Y.; Bjerke, J.W.; Chen, A.; Ciais, P.; Tømmervik, H.; et al. Characteristics, Drivers and Feedbacks of Global Greening. Nat. Rev. Earth Env. 2020, 1, 14–27. [Google Scholar] [CrossRef] [Scilit]
- Tian, F.; Wang, L.; Yuan, Y.; Chen, J. Large Offsets in the Impacts between Enhanced Atmospheric and Soil Water Constraints and CO2 Fertilization on Dryland Ecosystems. Remote Sens. 2024, 16, 4733. [Google Scholar] [CrossRef] [Scilit]
- Wang, S.; Zhang, Y.; Ju, W.; Chen, J.M.; Ciais, P.; Cescatti, A.; Sardans, J.; Janssens, I.A.; Wu, M.; Berry, J.A.; et al. Recent Global Decline of CO2 Fertilization Effects on Vegetation Photosynthesis. Science 2020, 370, 1295–1300, Erratum in Science 2021, 371. https://doi.org/10.1126/science.abg8637. [Google Scholar] [CrossRef] [Scilit]
- Fitzgerald, G.J.; Tausz, M.; O’Leary, G.; Mollah, M.R.; Tausz-Posch, S.; Seneweera, S.; Mock, I.; Löw, M.; Partington, D.L.; McNeil, D.; et al. Elevated Atmospheric [CO2] Can Dramatically Increase Wheat Yields in Semi-arid Environments and Buffer against Heat Waves. Glob. Change Biol. 2016, 22, 2269–2284. [Google Scholar] [CrossRef] [Scilit]
- Kimball, B.A. Crop Responses to Elevated CO2 and Interactions with H2o, n, and Temperature. Curr. Opin. Plant Biol. 2016, 31, 36–43. [Google Scholar] [CrossRef] [Scilit]
- Zhang, P.; Lenka, N.K.; Song, Y. Editorial: Sustaining CO2 Fertilization Gains under Water and Nutrient Stress in Crop Plants. Front. Plant Sci. 2024, 15, 1375175. [Google Scholar] [CrossRef] [Scilit]
- Camera, C.; Zomeni, Z.; Noller, J.S.; Zissimos, A.M.; Christoforou, I.C.; Bruggeman, A. A High Resolution Map of Soil Types and Physical Properties for Cyprus: A Digital Soil Mapping Optimization. Geoderma 2017, 285, 35–49. [Google Scholar] [CrossRef] [Scilit]
- Adireddy, R.G.; Anapalli, S.S.; Reddy, K.N.; Mubvumba, P.; George, J. Possible Impacts of Elevated CO2 and Temperature on Growth and Development of Grain Legumes. Environments 2024, 11, 273. [Google Scholar] [CrossRef] [Scilit]

Disclaimer/Publisher’s Note: The statements, opinions and data contained in all publications are solely those of the individual author(s) and contributor(s) and not of MDPI and/or the editor(s). MDPI and/or the editor(s) disclaim responsibility for any injury to people or property resulting from any ideas, methods, instructions or products referred to in the content. |
© 2026 by the author. Licensee MDPI, Basel, Switzerland. This article is an open access article distributed under the terms and conditions of the Creative Commons Attribution (CC BY) license.