


Highlights
What are the main findings?
- Asynchronous SAR–optical fusion improved early- and mid-season crop classification and decision earliness; on PASTIS-R Fold 2, GCAT increased Macro-F1 by up to 11.31 percentage points and reduced the mean decision waiting time for jointly accepted parcels by 7.55 days.
- In the frozen Brandenburg 2019 evaluation, relative classification and earliness gains were retained, whereas the development-year confidence–risk relationship degraded, showing that discrimination and decision reliability did not transfer identically across years.
What are the implications of the main findings?
- In-season crop monitoring should be evaluated jointly in terms of classification accuracy, decision earliness, and decision reliability, because earlier acceptance does not necessarily imply lower error risk.
- Cross-year deployment of SAR–optical classifiers should include renewed probability calibration and risk validation rather than relying only on transferred accuracy or fixed acceptance thresholds.
Abstract
In-season crop identification requires accurate, timely, and reliable predictions from asynchronous SAR and optical observations that accumulate progressively during early and middle calendar checkpoints. This study proposes a progressive SAR–optical fusion framework with selective risk control for parcel-level crop monitoring. A Gated Cross-Attention Temporal Network (GCAT) integrates complementary Sentinel-1 and Sentinel-2 time-series information, while random-prefix training and real day-of-year encoding accommodate asynchronous and unequal-length observations. Probability calibration and a sequential ACCEPT/DEFER strategy further allow uncertain predictions to be deferred until a predefined acceptance criterion is satisfied. Experiments on PASTIS-R show that GCAT achieves a full-season Macro-F1 of 80.57 ± 0.83% across five official folds, outperforming unimodal and multimodal fusion baselines. In the primary Fold-2 evaluation, GCAT provides larger gains than the Sentinel-2-only model at early- and mid-season operational checkpoints, reaches acceptance 7.55 days earlier on average among jointly accepted parcels, and increases accepted coverage. Cross-year evaluation on Brandenburg shows that the classification and earliness advantages of multimodal fusion are partially retained, whereas the confidence–risk relationship degrades markedly. These results highlight the value of SAR–optical fusion for earlier in-season decisions while emphasizing the need for renewed calibration and reliability assessment across years.
1. Introduction
Crop-type information is fundamental to cropping-structure surveys, yield forecasting, agricultural resource management, and in-season monitoring. Multitemporal remote sensing can capture spectral and phenological changes from emergence through growth to maturity and has been widely used for regional crop mapping [1,2]. However, end-of-season classification accuracy does not indicate whether useful results can be obtained within the time window required for agricultural management. In-season monitoring therefore requires not only accurate crop identification, but also consideration of when a prediction becomes practically usable and what uncertainty and error risk accompany an early decision. Accordingly, in-season crop identification should be evaluated in terms of classification accuracy, decision earliness, and reliability.
Sentinel-2 provides multispectral information in the visible, red-edge, and near-infrared regions and is well suited to characterizing crop canopy condition and phenological development, although the availability of valid optical observations varies over time. Sentinel-1 synthetic aperture radar (SAR), in contrast, provides information related to canopy structure, water content, and scattering behavior and offers all-weather observation capability. Their different imaging mechanisms and information content make the two sensors complementary [3,4,5]. Because of differences in revisit cycles, orbit directions, and valid-observation availability, Sentinel-1 ascending, Sentinel-1 descending, and Sentinel-2 observations generally occur on different dates and have different sequence lengths. Forcing date matching or temporal interpolation may introduce additional temporal assumptions. Direct modeling of asynchronous and unequal-length sequences is therefore a key issue for multimodal in-season crop identification [6]. In this study, asynchronous observations are acquisitions from different modalities recorded on non-coincident dates, whereas unequal-length sequences contain different numbers of valid acquisitions because sensor revisit and availability differ.
Satellite time-series classification has progressed from recurrent and convolutional encoders [7,8,9,10,11,12] to attention-based and transformer representations [13,14,15,16,17,18,19,20,21]. SAR–optical fusion extends temporal modeling through complementary sensor features and cross-modal interaction [22,23,24,25,26,27,28,29,30,31,32,33]. For in-season recognition, variable-length training and early-classification methods such as ELECTS support predictions before the season ends [25,34,35,36,37]. However, early prediction alone does not establish when a class decision is sufficiently reliable for release.
An earlier class output does not necessarily imply an acceptable error risk. Existing early crop-classification methods mainly track classification accuracy over time or learn when to stop observing, whereas less attention has been paid to which predictions should be accepted and to the error proportion within the accepted set. Selective classification allows a model to defer a current prediction when evidence is insufficient and to release it only after a confidence criterion is satisfied, thereby explicitly representing the trade-off between coverage and error risk [38]. Probability calibration can improve the correspondence between predicted confidence and actual correctness [39,40], while finite-sample risk control on independent calibration data can be used to select an acceptance threshold [41,42]. In-season crop identification can therefore be formulated as a sequential acceptance problem: accept the prediction when the current evidence is sufficient; otherwise, wait for subsequent observations [43].
Cross-year deployment further amplifies this issue. Existing cross-region and cross-year studies have mainly examined whether classification performance is preserved under new spatiotemporal conditions [25,44,45,46], whereas the transferability of the confidence–error–risk relationship established on development data remains insufficiently tested. Interannual changes in phenology, class composition, and observation distributions may alter the risk meaning of a fixed confidence threshold even when relative classification performance remains favorable [47,48]. Transfer of classification performance, decision earliness, and risk calibration should therefore be evaluated separately; classification accuracy in a new year alone is insufficient to establish that acceptance decisions retain the reliability observed during development.
Motivated by these issues, this study addresses parcel-level in-season crop classification from asynchronous and progressively accumulated SAR–optical time series, with joint consideration of classification accuracy, decision earliness, and reliability. The contributions are three-fold. First, unequal-length Sentinel-1 ascending, Sentinel-1 descending, and Sentinel-2 sequences are modeled directly without forced temporal alignment, with GCAT serving as the multimodal fusion backbone and evaluated against unimodal, simple-fusion, and non-gated attention baselines. Second, progressive crop classification is combined with probability calibration and sequential ACCEPT/DEFER risk control under a first-accept-and-lock policy. Third, classification accuracy, decision earliness, and decision reliability are evaluated separately through spatial-fold analysis and a frozen cross-year assessment.
2. Materials and Methods
2.1. Study Datasets
2.1.1. PASTIS-R
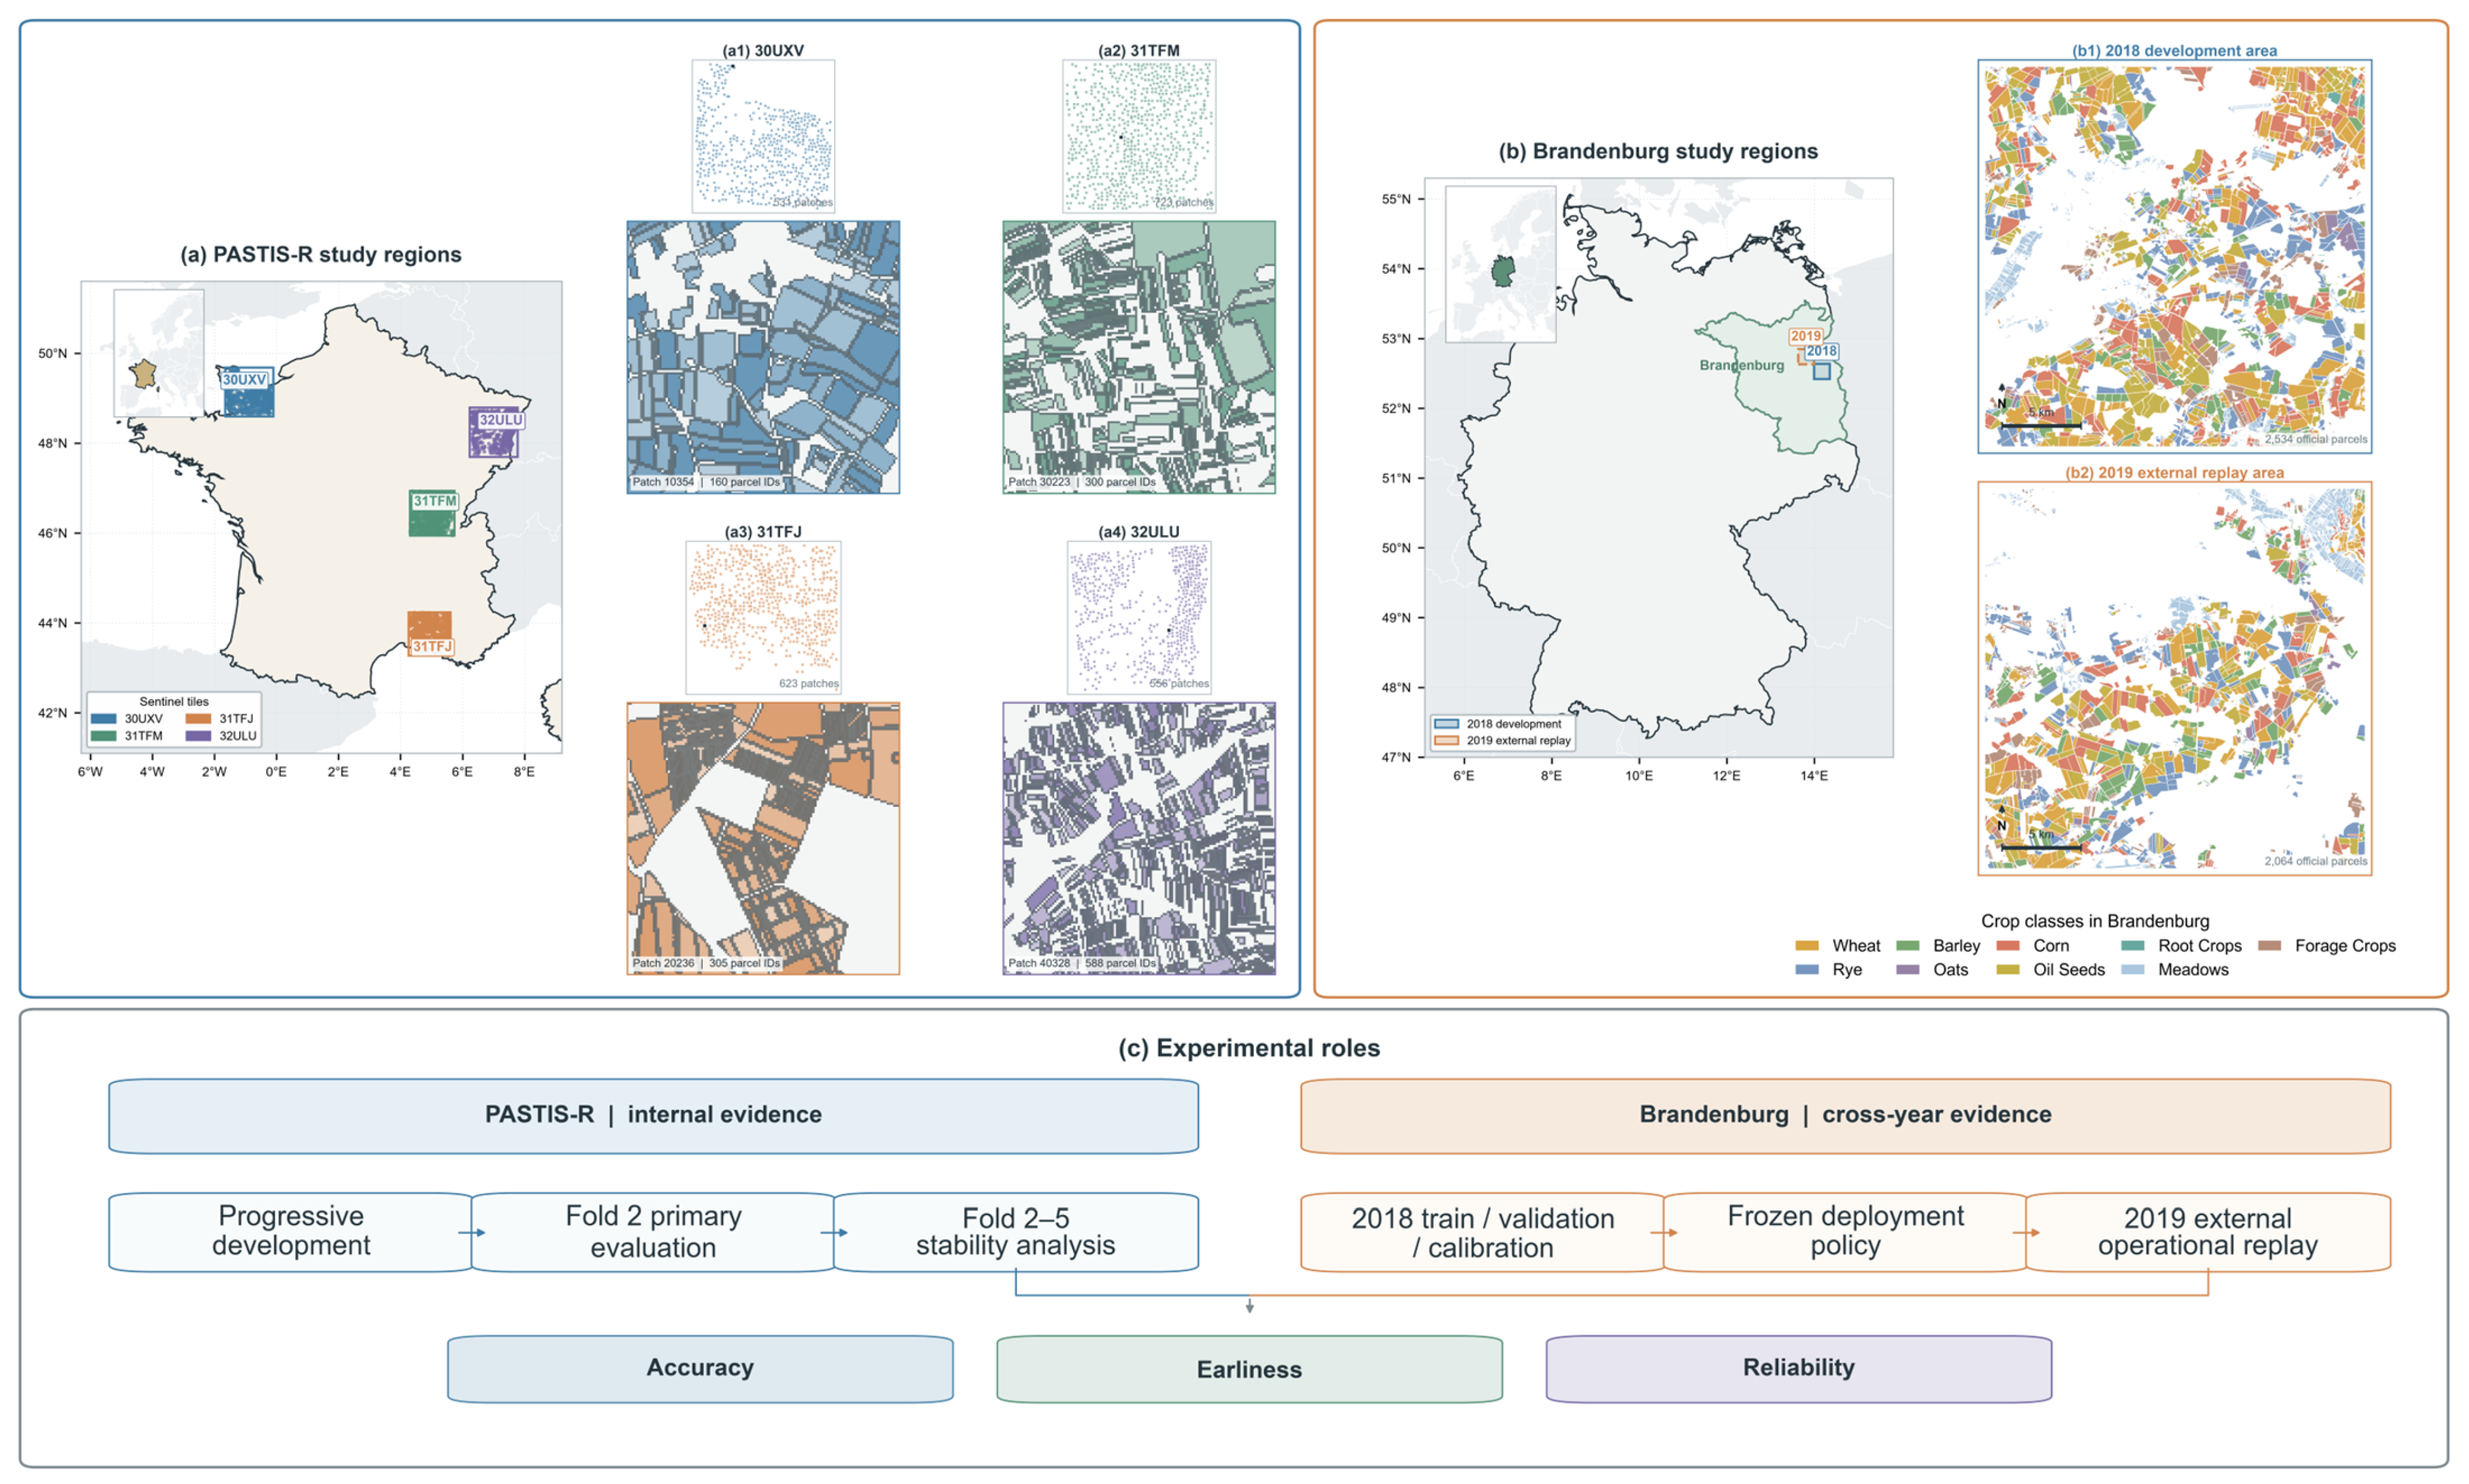
PASTIS-R is a public multimodal agricultural benchmark containing 2433 patches (~1.28 km × 1.28 km) across four regions in France, with Sentinel-2, Sentinel-1 ascending/descending time series, semantic labels, and parcel-instance annotations [22,49]. The three sensor streams retain their original, unequal observation lengths. The classes span autumn-established cereals and oilseeds, spring- and summer-sown crops, grassland, perennial woody crops, and heterogeneous aggregate classes. Accordingly, a fixed checkpoint is a calendar date rather than a common phenological stage: winter cereals may already be well developed in April while maize, sunflower, soybean, and sorghum are much earlier in their seasonal trajectories (Table 1).
Table 1.
Agronomic context and approximate crop calendars of the study areas.
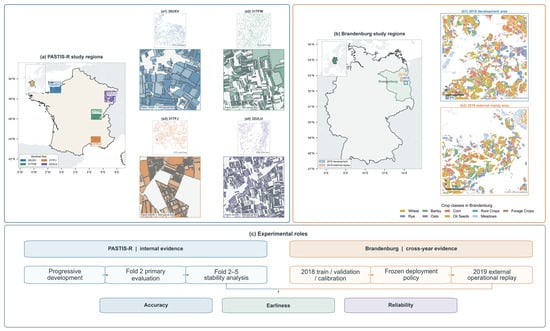
Instance annotations were used to construct 85,951 valid parcels from 18 target crop classes after excluding the supplied semantic background/void labels and non-target instances. The distribution was strongly imbalanced: Meadow comprised 31,292 parcels (36.41%), whereas Potatoes comprised 551 (0.64%), a largest-to-smallest ratio of 56.79:1. The 2019 season was evaluated at six checkpoints (30 April to 30 September), with full-season data used only as a classification reference. This is supervised crop classification with known parcel boundaries and an in-scope target mask; operational use therefore requires an external parcel registry or delineation layer and a mechanism for parcels outside the trained nomenclature. Figure 1a summarizes the study regions and representative parcel structure.
Figure 1.
Study regions, local parcel structure, and experimental roles of PASTIS-R and Brandenburg.
2.1.2. Brandenburg Cross-Year Dataset
For cross-year evaluation, we used the ESA Fusion Competition Brandenburg dataset [50], which provides parcel labels with Sentinel-1 ascending/descending and Sentinel-2 time series for 2018 and 2019. The public dataset contains 2534 parcels in 2018 and 2064 in 2019 across nine crop classes. The study area is dominated by arable cereals together with maize, oilseeds, grassland, and forage crops. Several dataset labels aggregate crop types with distinct calendars (for example, winter and spring forms of Barley and heterogeneous Oilseeds).
The 2018 parcels were split spatially into 1769 training, 380 validation, and 385 calibration parcels; all 2064 parcels from 2019 formed the frozen cross-year test set. This setting evaluates temporal transfer within Brandenburg rather than zero-shot transfer from PASTIS-R (Figure 1b).
The GCAT fusion backbone was retained for Brandenburg, with an adapted Sentinel-1 input and a nine-class Linear(256, 9) output layer (Wheat, Rye, Barley, Oats, Corn, Oilseeds, Root Crops, Meadows, and Forage Crops). Model fitting and normalization used only the 2018 training parcels; checkpoint selection and temperature scaling used 2018 validation, and acceptance thresholds used 2018 calibration. All model and decision parameters were frozen for the 2019 evaluation, without retraining or recalibration.
2.2. Parcel-Level Feature Construction and Preprocessing
Each parcel retains its original asynchronous Sentinel-2 (S2), Sentinel-1 ascending (S1-Asc), and descending (S1-Desc) sequences. PASTIS-R S2 Level-2A inputs comprise ten bands (B02, B03, B04, B05, B06, B07, B08, B8A, B11, and B12), bilinearly resampled to 10 m, excluding the 60 m bands B01, B09, and B10. Parcel-level means and standard deviations yield 20 S2 features per acquisition. Each PASTIS-R S1 orbit uses VV, VH, and the stored ratio channel in the benchmark dB representation, yielding six features per acquisition. Brandenburg uses the same S2 bands, while its S1 VV/VH statistics in linear GAMMA0_TERRAIN units are log1p-transformed and standardized using orbit-specific 2018 training statistics. No optical time steps are removed, and no cross-sensor temporal interpolation is applied.
Normalization uses training-fold statistics only: parcel means are z-score-normalized, and standard deviations are divided by the corresponding training-channel standard deviations. Weighted cross-entropy uses training-only class frequencies to calculate inverse-frequency weights, subsequently normalized to a mean of one and capped at five. The compact mean-and-standard-deviation representation reduces computational complexity but excludes within-parcel texture and spatial arrangement, as discussed in Section 4.
PASTIS-R follows the official five-fold spatial partition, with complete patches kept within individual partitions. Fold 2 serves as the primary evaluation, while Folds 3–5 assess spatial stability. For each test fold, the preceding fold provides Validation, Calibration-A, and Calibration-B subsets, and the remaining three folds form Training. Validation is used for model selection and temperature scaling, Calibration-A for auxiliary uncertainty analysis, and Calibration-B for acceptance-threshold selection. Test data remain isolated until all model and decision parameters are frozen (Table 2).
Table 2.
PASTIS-R dataset partitioning.
2.3. Progressive SAR–Optical Classification Framework
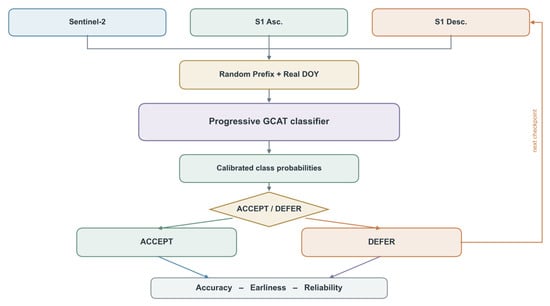
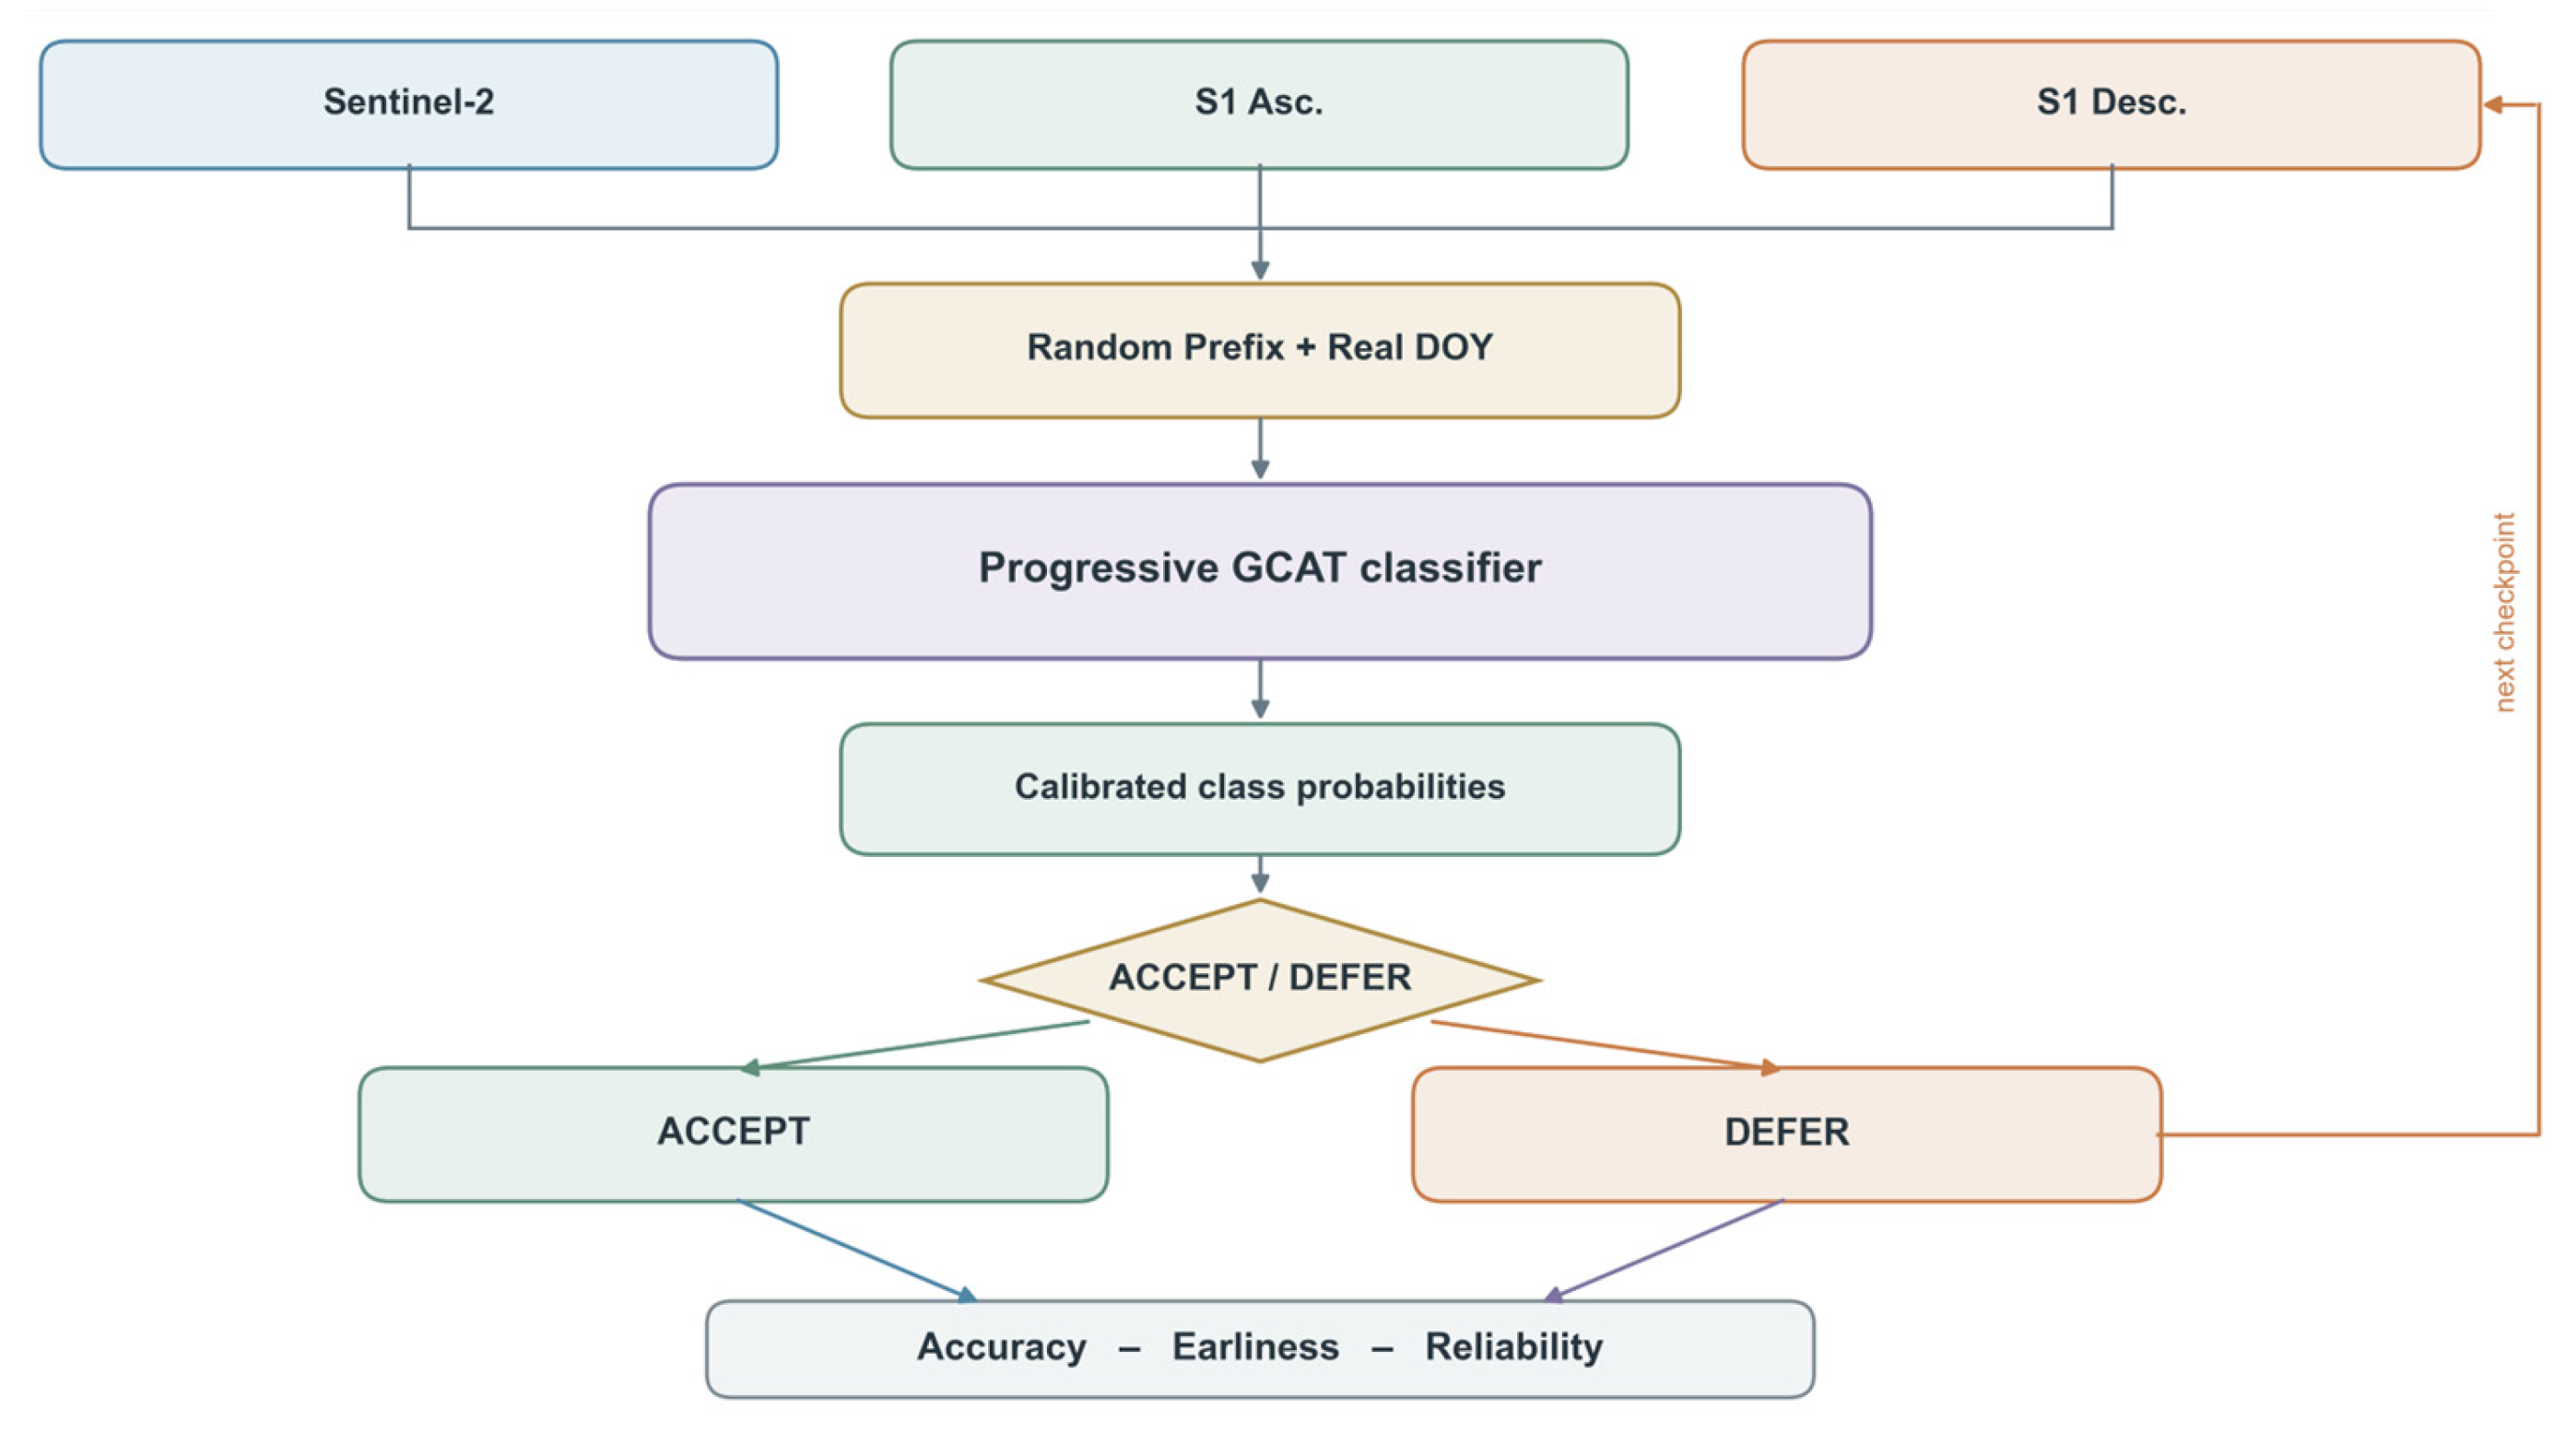
At each checkpoint, the framework uses only the Sentinel-2, Sentinel-1 ascending, and Sentinel-1 descending observations acquired by that date, without forced cross-sensor alignment. Available sequences pass through GCAT, probability calibration, and the sequential ACCEPT/DEFER policy (Figure 2). The first accepted class and date are locked; training details are given in Section 2.5.
Figure 2.
Overall framework of progressive SAR–optical crop classification and sequential risk control.
2.4. Asynchronous Multimodal Feature Fusion
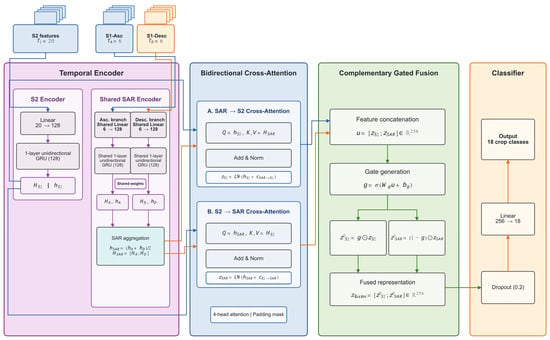
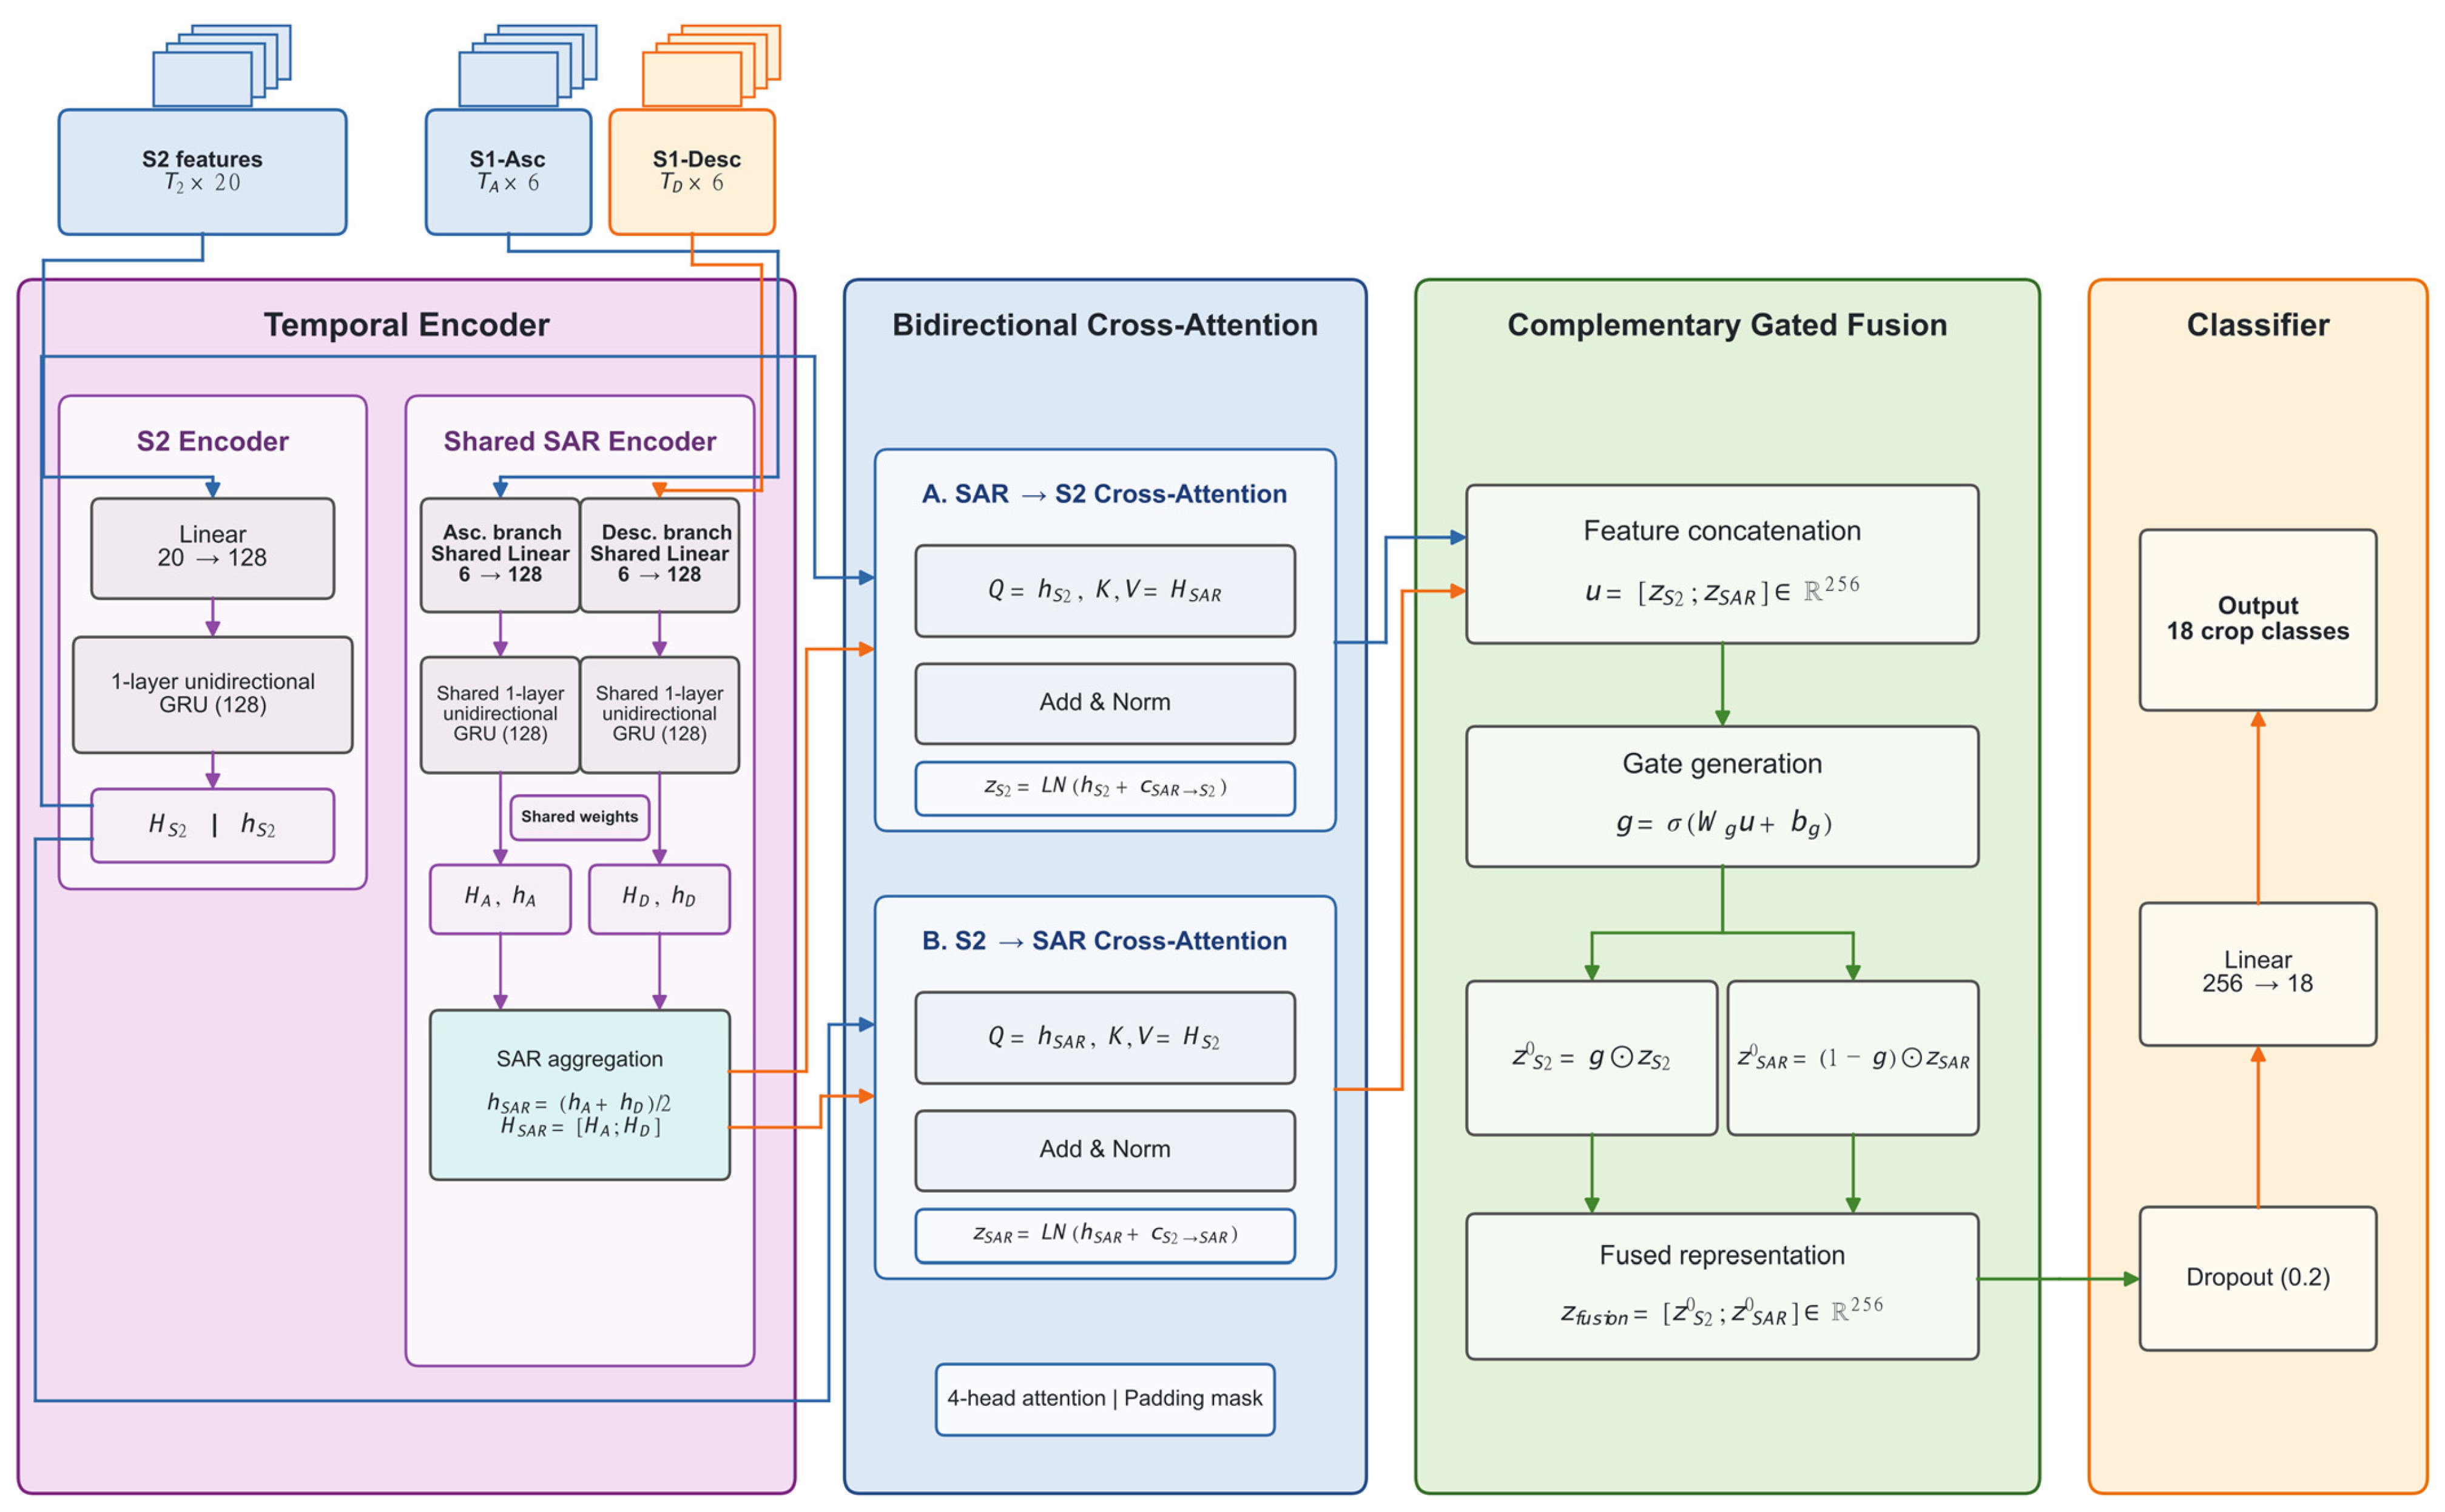
GCAT encodes Sentinel-2 and Sentinel-1 observations separately before fusion (Figure 3). Sentinel-2 features are projected to 128 dimensions and encoded by a single-layer unidirectional GRU. Sentinel-1 ascending and descending sequences use a shared SAR projection and GRU; their final hidden states are averaged for a global SAR representation, while their time-wise hidden states are concatenated for cross-attention:
where and denote the final hidden states of the Sentinel-1 ascending and descending sequences, respectively; and denote their time-wise hidden-state sequences; and [·;·]time denotes temporal concatenation. Bidirectional cross-attention then allows the optical global representation to retrieve information from the combined SAR sequence and the SAR global representation to retrieve information from the optical sequence. Residual connections and normalization produce enhanced optical and SAR representations.
Figure 3.
Architecture of the gated cross-attention temporal classification network.
A complementary gate adaptively weights the two enhanced representations before concatenation:
where and are the enhanced optical and SAR representations, respectively; and are learnable gating parameters; σ(·) denotes the sigmoid function; ⊙ denotes element-wise multiplication; and is the fused representation. For PASTIS-R, the resulting 256-dimensional fused representation is passed to an 18-class classifier; the Brandenburg experiment uses the corresponding nine-class output head described in Section 2.1.2.
Baseline Models and Fusion Comparisons
Six models were compared under the same fold partitions and training protocol. S1-GRU and S2-GRU are unimodal temporal baselines; Feature Fusion concatenates optical and orbit-averaged SAR representations; Decision Fusion averages the probabilities of frozen S1-GRU and S2-GRU models; cross-attention replaces direct concatenation with bidirectional cross-modal attention; and GCAT adds only the complementary gate to the otherwise matched cross-attention backbone.
The comparison separates gains from additional SAR information, cross-modal interaction, and gating. Feature Fusion versus cross-attention evaluates the implemented fusion module, whereas cross-attention versus GCAT is the strict gate ablation. The separate RP/DOY/quality experiments examine progressive training and temporal/quality inputs rather than fusion architecture.
A matched Fold-2 comparison evaluated original asynchronous GCAT against nearest-date matching, a causal 15-day grid, and 30-day compositing. Matching paired each available S2 acquisition with the closest accessible SAR dates; the grid used causal last-observation carry-forward, and compositing averaged observations within fixed windows. All variants excluded post-checkpoint information and used identical data roles, with model selection and calibration performed on their respective development subsets. We also evaluated L-TAE-RP [15] and ELECTS-S2 [34] under the Fold-2 protocol. Both are parcel-statistics adaptations rather than native implementations; ELECTS-S2 uses only optical data.
2.5. Progressive Training and Probability Calibration
Random-prefix training simulates progressive observation availability: at each iteration, a seasonal cutoff is sampled, and each sensor sequence is independently truncated to acquisitions available by that date. Real day-of-year (DOY) encoding retains acquisition timing in the temporal input representations. The same classifier is thereby trained across different seasonal observation lengths.
The classifier is supervised only by crop class; acceptance time is not part of the training objective. For each fold and checkpoint, temperature scaling is fitted separately for S2 and GCAT using Validation data and multiclass negative log-likelihood [39,40]:
where denotes the logits at checkpoint t, > 0 is the fitted temperature, and is the calibrated class-probability vector. Temperature scaling changes confidence but not class ranking. The maximum calibrated probability is used as the score for subsequent ACCEPT/DEFER decisions.
Probability quality was evaluated using expected calibration error (ECE), negative log-likelihood (NLL), and the multiclass Brier score. ECE measures the discrepancy between predicted confidence and empirical accuracy, whereas NLL and the Brier score assess the quality of predicted class probabilities. Lower values indicate better performance for all three metrics.
2.6. Sequential Selective Risk Control and Earliness Evaluation
At the six in-season checkpoints, a parcel that has not yet been accepted is evaluated using its maximum calibrated class probability:
where is the calibrated probability of class c for parcel at checkpoint , and is the corresponding maximum-confidence score. If the score exceeds the selected threshold, the current class and first acceptance date are recorded and locked; otherwise, the parcel remains in DEFER. Full-season predictions are used only as a classification reference.
Selective risk is the classification-error proportion in the terminal cumulative accepted set after the April–September sequence:
where e and n denote the numbers of classification errors and accepted parcels, respectively, in the terminal cumulative accepted set. For PASTIS-R, the threshold is selected only on Calibration-B. The primary target risk is r* = 0.05. The primary Fold-2 policy uses four current-prefix S2 quality bins defined from Training data, each with 50 candidate confidence thresholds (0.50–0.99), yielding 504four-component sequential policies. A one-sided Clopper–Pearson upper bound uses overall α = 0.05 with Bonferroni correction over this complete family [41,42]. A candidate is valid when its upper bound does not exceed r*; among valid candidates, the policy with the largest terminal accepted set is selected, with the smaller upper bound used to break ties. The selected four-component threshold vector is fixed across the six checkpoints; each parcel’s current quality bin selects its applicable component.
The calibration criterion is defined for the terminal cumulative accepted set of the complete sequence, rather than to individual monthly checkpoints. Accordingly, monthly coverage and empirical risk are reported as descriptive operating characteristics of the same frozen policy. The binomial interpretation of this bound relies on the assumed exchangeability and independence of calibration observations. Although complete image patches were kept in separate dataset partitions, parcels within the same calibration patch may still exhibit correlated classification errors. The Bonferroni correction accounts for multiple candidate thresholds under valid individual confidence bounds, but it does not eliminate within-patch dependence or restore the nominal binomial coverage property. Accordingly, the Clopper–Pearson criterion is interpreted as a risk-targeted threshold-selection rule under its stated sampling assumptions. To assess sensitivity to residual spatial dependence, we additionally constructed percentile-bootstrap intervals by resampling complete PASTIS-R test patches and predefined 2 km spatial blocks in Brandenburg, retaining all parcels within each resampled unit.
Two decision protocols are reported. The primary Fold-2 analysis uses the four-quality-bin policy above. The secondary, post hoc Global Sequential Selective Risk Control (Global SRC) analysis independently selects one of 50 shared scalar thresholds per fold (0.50–0.99), applied across the six checkpoints, with Bonferroni correction over those 50 policies. It is used only for directional cross-fold comparison over Folds 2–5; its Fold-2 values remain distinct from the primary fixed-protocol Fold-2 results.
Brandenburg 2019 is evaluated as a fully frozen replay using the 2018-trained model, normalization, checkpoint-specific temperatures, and acceptance threshold. No 2019 recalibration or threshold selection is performed, so only empirical selective risk is reported for the external year.
Earliness is summarized by cumulative accepted coverage and decision time. The cumulative accepted proportion at checkpoint t is
where is the cumulative accepted set by checkpoint and is the number of test parcels. Mean cumulative accepted coverage (MCAC), defined as the arithmetic mean of cumulative accepted coverage over the six in-season checkpoints, is then
This metric summarizes acceptance capacity over the in-season monitoring sequence.
For parcels accepted in-season by both S2 and GCAT, Lead-Time Gain is defined as
where and are the first acceptance dates under GCAT and S2, respectively. Positive values indicate earlier GCAT acceptance. Parcels accepted by GCAT but still deferred by S2 on 30 September are termed SAR-rescued; their proportion is calculated over all test parcels and does not imply correct classification.
2.7. Controlled Observation Degradation Evaluation
To evaluate sensitivity to observation degradation, we reused the frozen PASTIS-R Fold 2 GCAT and S2-GRU checkpoints on 17,559 test parcels. We applied random S2 acquisition removal at 20% and 40%, per-parcel continuous S2 outage windows of 30 and 60 days, zero-mean Gaussian perturbations (σ = 0.10 and 0.30 standardized feature units) to the six parcel features in each of the S1-Asc and S1-Desc streams, and deterministic S2 thinning with minimum retained-spacing targets of 20 and 40 days. Random deletion, outage, and noise conditions used five seeds; temporal thinning was deterministic. Across six April–September checkpoints, training normalization, temperatures, quality boundaries, and acceptance thresholds remained frozen. The full season was used only as a classification reference. We report Macro-F1, MCAC, and terminal empirical selective risk. The SAR perturbation is a feature-space sensitivity test, not physical speckle.
3. Results
3.1. Progressive Classification Performance and Multimodal Contribution
3.1.1. Comparison with Unimodal and Multimodal Baselines
To evaluate the contributions of SAR information and different multimodal fusion strategies, six classification models were compared across the five official spatial folds of PASTIS-R. Table 3 presents their full-season classification performance in terms of overall accuracy (OA), Macro-F1, and Kappa, reported as the mean ± sample standard deviation across the five folds.
Table 3.
Five-fold full-season classification performance of unimodal and multimodal fusion models on PASTIS-R.
S2-GRU outperformed S1-GRU in mean Macro-F1. Feature Fusion and Decision Fusion improved over S2-GRU to 78.35% and 78.90%, respectively, showing that SAR already added value with simple fusion.
Cross-attention further reached 79.49%, and GCAT achieved 80.57%, exceeding the non-gated baseline by 1.08 percentage points with a positive difference in every fold. Thus, the observed gain reflects both complementary SAR information and fusion design; it does not imply that gating alone explains the full improvement.
3.1.2. Progressive Classification Performance of S2 and GCAT
In Fold 2, Macro-F1 increased from April to September for both models, while GCAT remained higher at every checkpoint. GCAT improved from 56.90% to 79.54%, compared with 48.28% to 73.08% for S2-GRU.
The largest GCAT–S2 Macro-F1 gain occurred in May (+11.31 percentage points), with positive gains maintained through the full season, indicating the greatest benefit during early and middle operational checkpoints.
GCAT-RP-T denotes GCAT with random-prefix (RP) training and real day-of-year temporal encoding (T); GCAT-RP-TQ additionally embeds per-observation Sentinel-2 cloud quality (Q); and Q-GCAT further conditions the complementary fusion gate on prefix quality and observation counts. Fold-1 ablations showed that real DOY encoding generally improved seasonal Macro-F1. GCAT-RP-T reached 79.13% at full season, compared with 78.28% for GCAT-RP-TQ and 78.62% for Q-GCAT; however, GCAT-RP-TQ was 0.69 percentage points higher than GCAT-RP-T in May. We therefore retained GCAT-RP-T and interpret the quality-assisted variants as inconclusive rather than uniformly ineffective.
3.1.3. Timing-Alignment and Advanced-Baseline Verification
On Fold 2, GCAT achieved the highest full-season Macro-F1 (79.56%) among the four temporal processing strategies. It also ranked second in both the mean cumulative accepted coverage (MCAC = 0.448) and the September accepted coverage (59.72%), following nearest-date matching (0.470 and 61.94%, respectively). These results indicate that GCAT achieved the best classification performance while maintaining competitive decision coverage (Table 4).
Table 4.
Comparison of asynchronous and temporally aligned methods on PASTIS-R Fold 2.
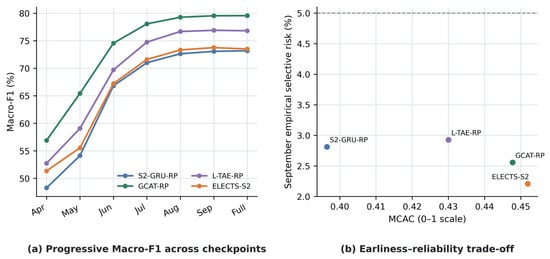
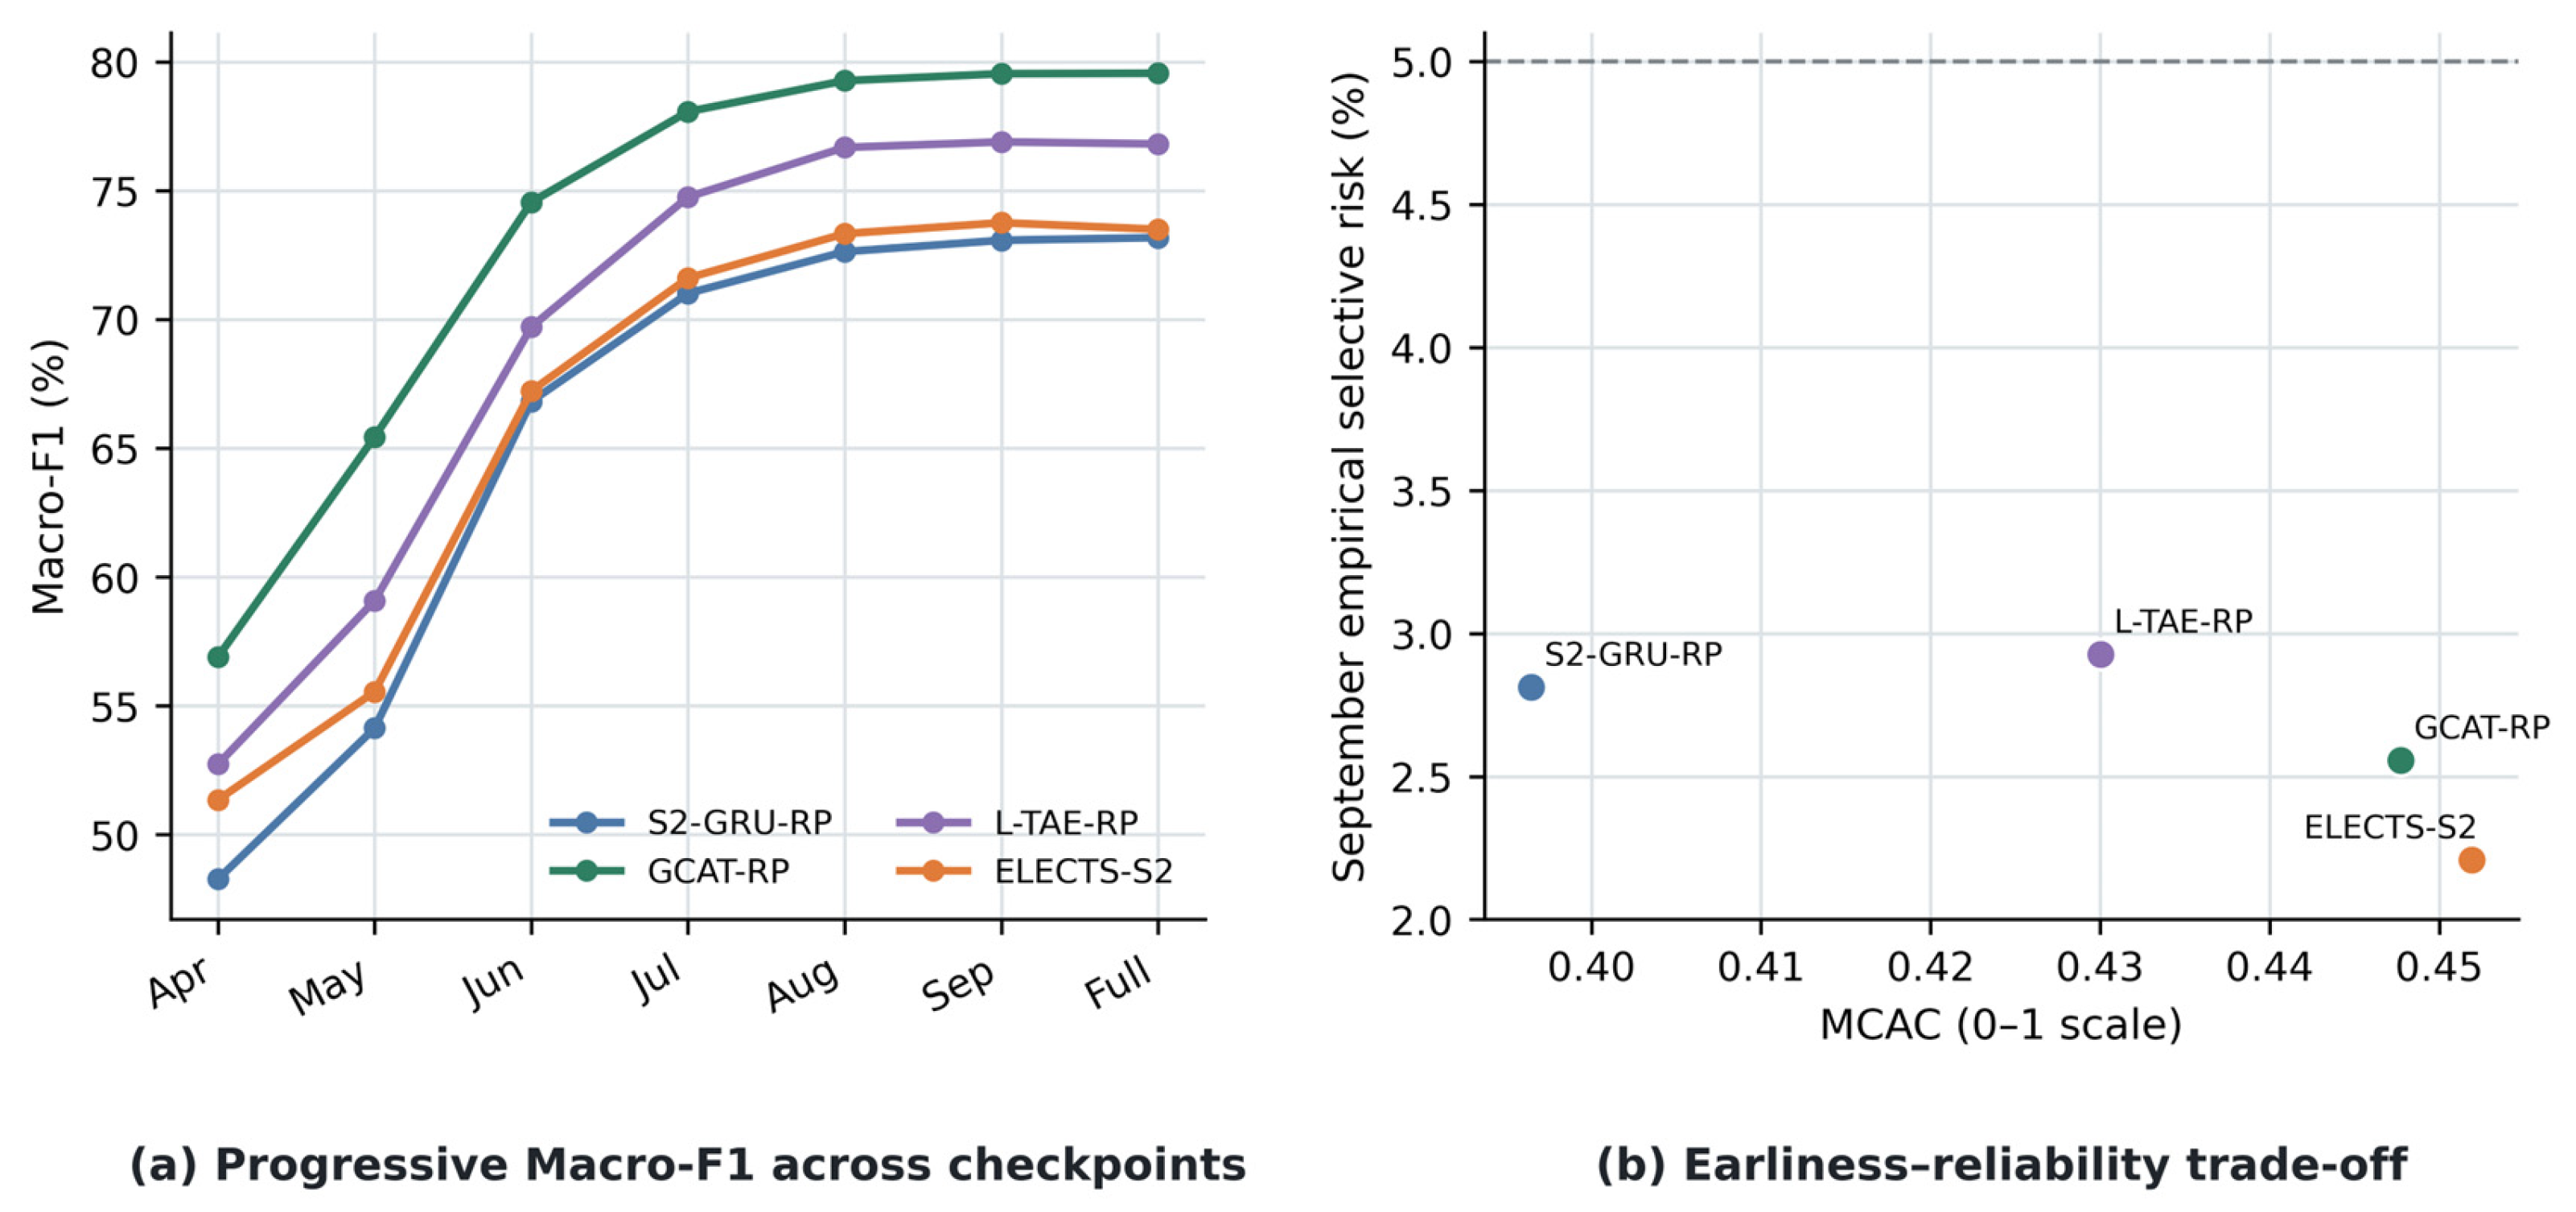
To further assess GCAT, we compared it with parcel-statistics adaptations of L-TAE and ELECTS, alongside the S2-GRU baseline, under the same Fold-2 protocol (Table 5 and Figure 4). GCAT achieved the highest full-season OA, Macro-F1, and Kappa, outperforming L-TAE-RP and ELECTS-S2 in Macro-F1 by 2.74 and 6.06 percentage points, respectively. GCAT also maintained the highest Macro-F1 across all seasonal checkpoints (Figure 4a). In terms of decision performance, GCAT achieved the second-highest MCAC, close to ELECTS-S2, although ELECTS-S2 showed a lower September empirical selective risk (Figure 4b). These results demonstrate GCAT’s classification advantage among the evaluated parcel-statistics implementations.
Table 5.
Comparison with representative temporal classification methods on PASTIS-R Fold 2.
Figure 4.
Progressive classification and earliness–reliability trade-offs among representative temporal classification methods on PASTIS-R Fold 2. (a) Checkpoint-wise Macro-F1; (b) MCAC versus September empirical selective risk. L-TAE-RP and ELECTS-S2 are parcel-statistics adaptations.
3.1.4. Robustness to Missing and Degraded Observations
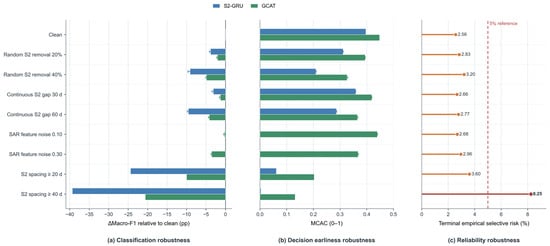
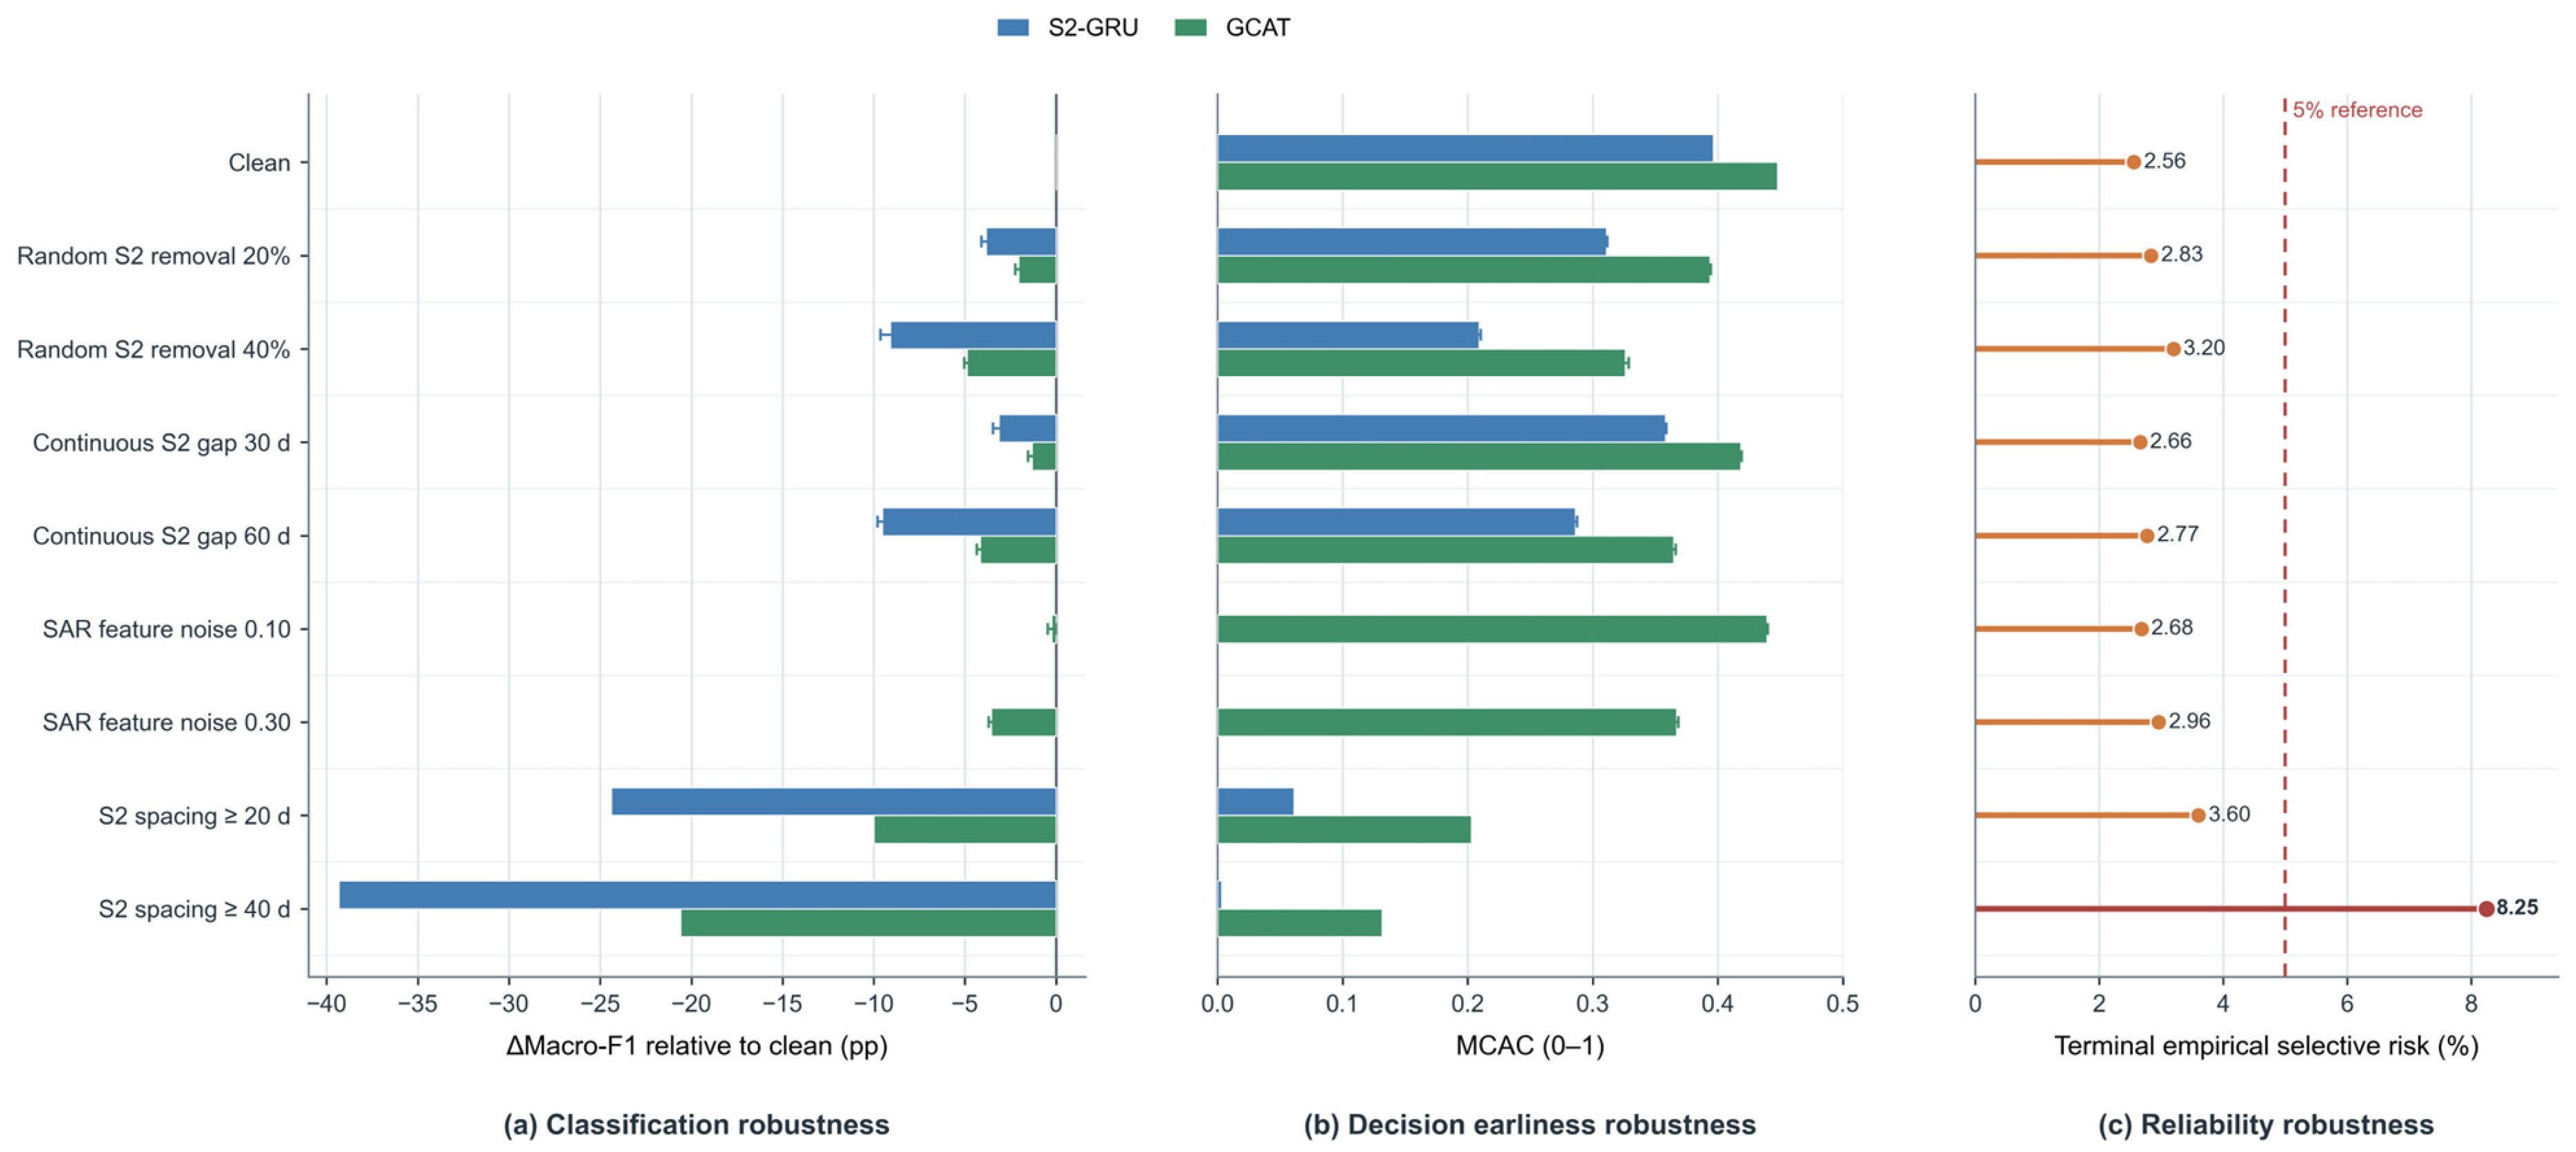
Under 40% random S2 removal, full-season Macro-F1 declined by 4.90 percentage points for GCAT versus 9.08 for S2-GRU; a 60-day optical gap caused losses of 4.16 and 9.54 points, respectively (Figure 5a). GCAT nevertheless lost decision coverage, with MCAC falling from 0.448 (clean) to 0.326 and 0.365 in these two conditions (Figure 5b). Standardized SAR-feature noise (σ = 0.30) reduced GCAT Macro-F1 by 3.56 points and MCAC to 0.367. The strongest S2 thinning condition (target spacing ≥40 days; 79.70% of S2 observations removed; realized median gap 45 days) reduced GCAT Macro-F1 by 20.61 points and MCAC to 0.132, while terminal empirical selective risk rose from 2.56% to 8.25% (Figure 5c). Thus, GCAT retained classification performance better than S2-GRU in the tested optical-missingness conditions, but severe temporal sparsity degraded accuracy, earliness, and reliability. The risk values describe the frozen policy under perturbed inputs.
Figure 5.
Robustness of classification and selective decisions under controlled observation degradation on PASTIS-R Fold 2. (a) Full-season Macro-F1 change relative to each model’s clean result; (b) MCAC under the frozen policy; and (c) GCAT terminal empirical selective risk under each observation condition. Error bars show ±1 SD across five perturbation seeds and are omitted for clean and deterministic conditions. The dashed line in (c) indicates the original development risk target.
3.2. In-Season Decision Earliness and Reliability
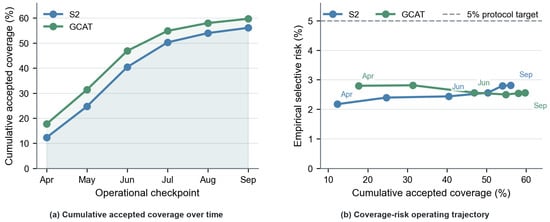
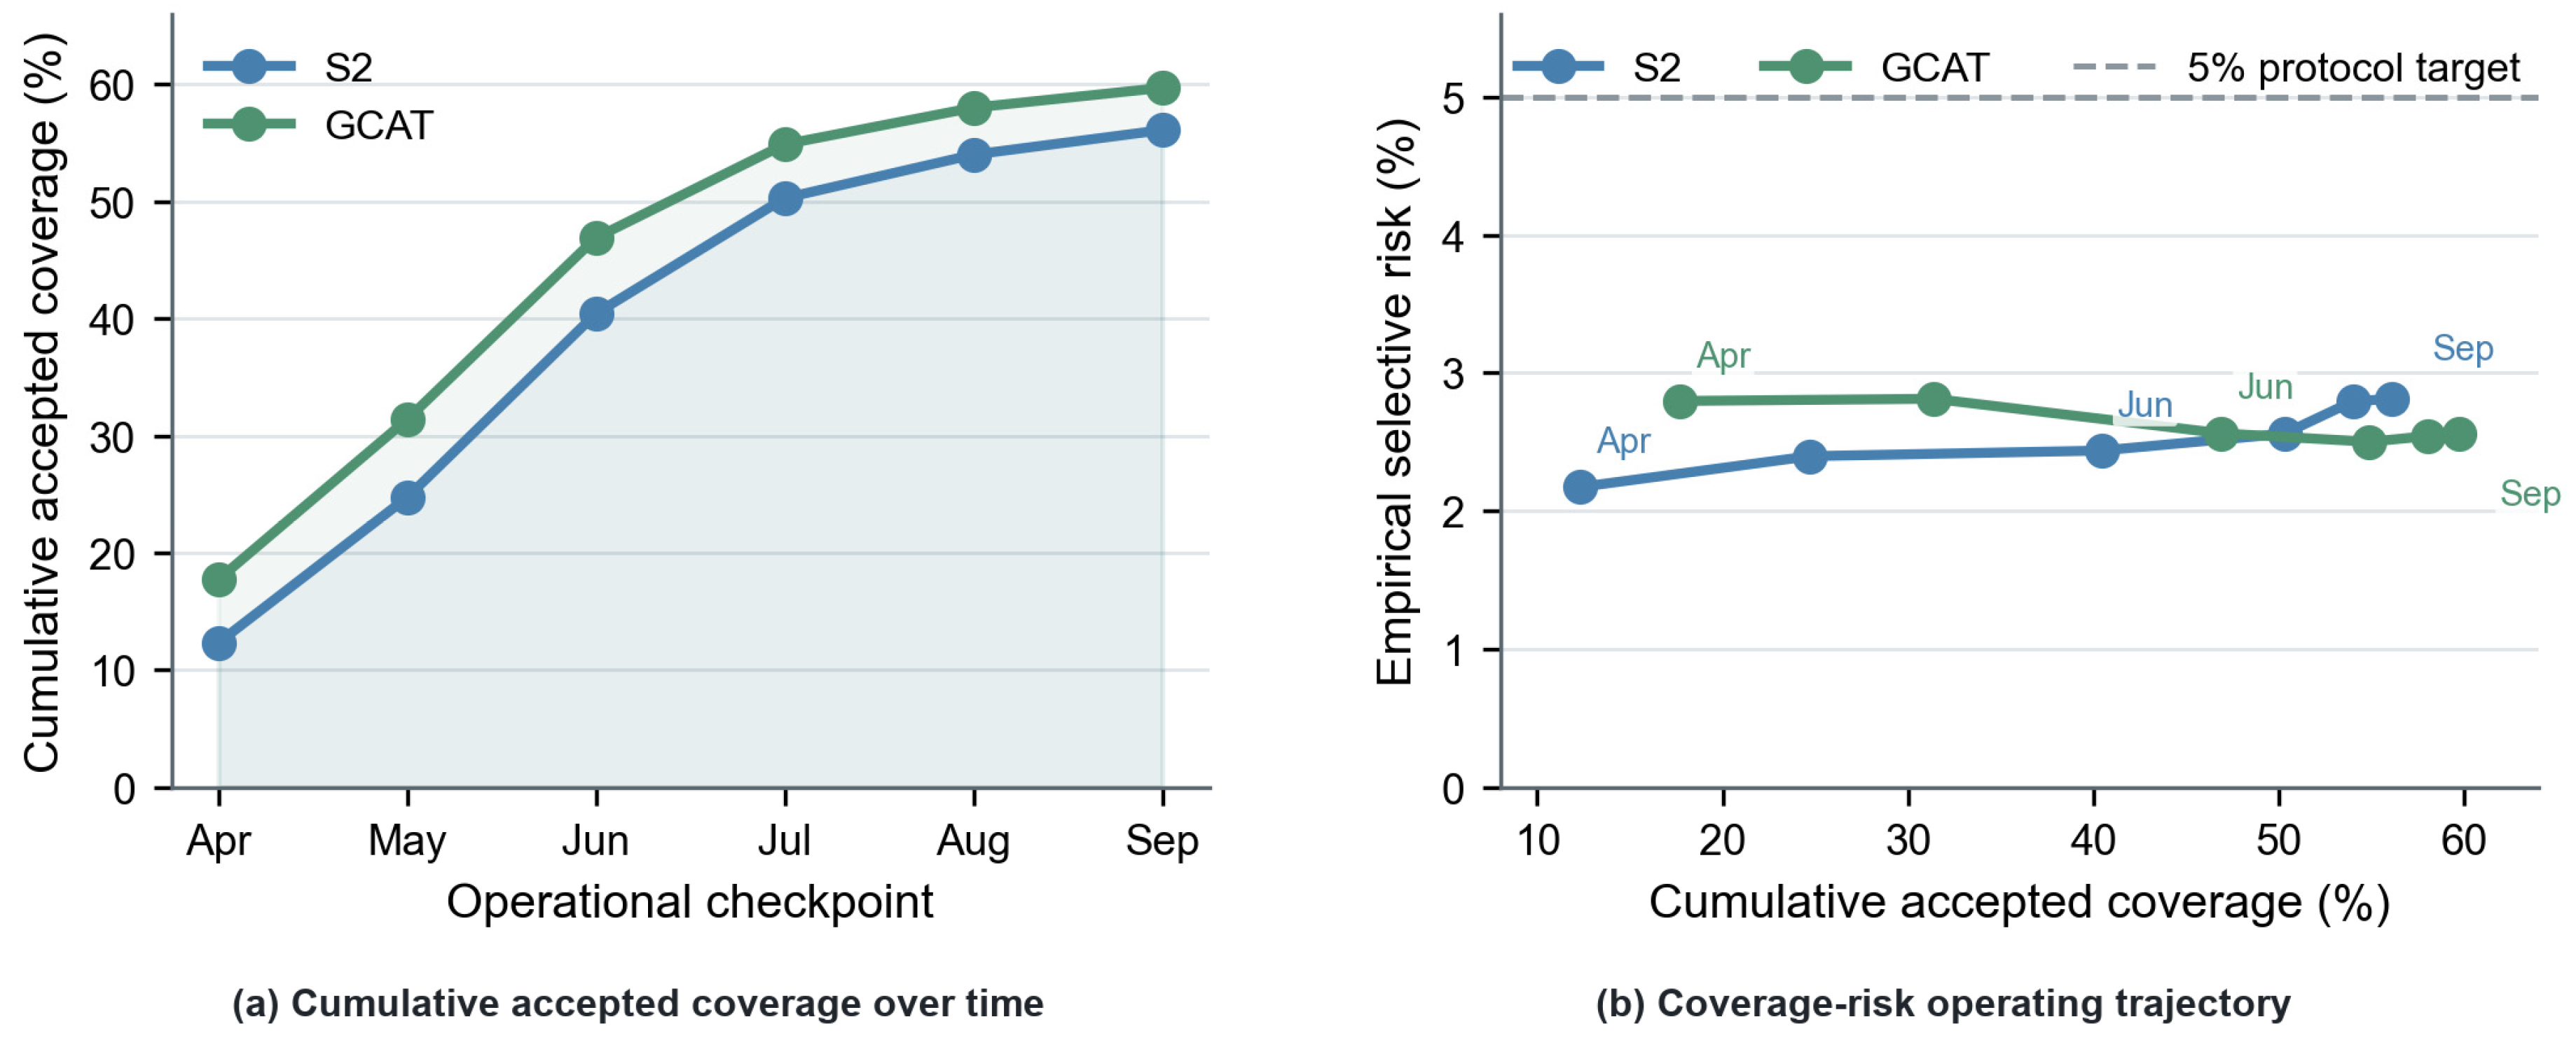
Under the fixed Fold-2 policy, cumulative accepted coverage increased from 12.32% to 56.11% for S2 and from 17.72% to 59.72% for GCAT, with GCAT increasing MCAC by 0.05.
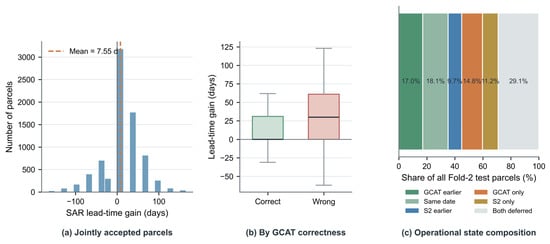
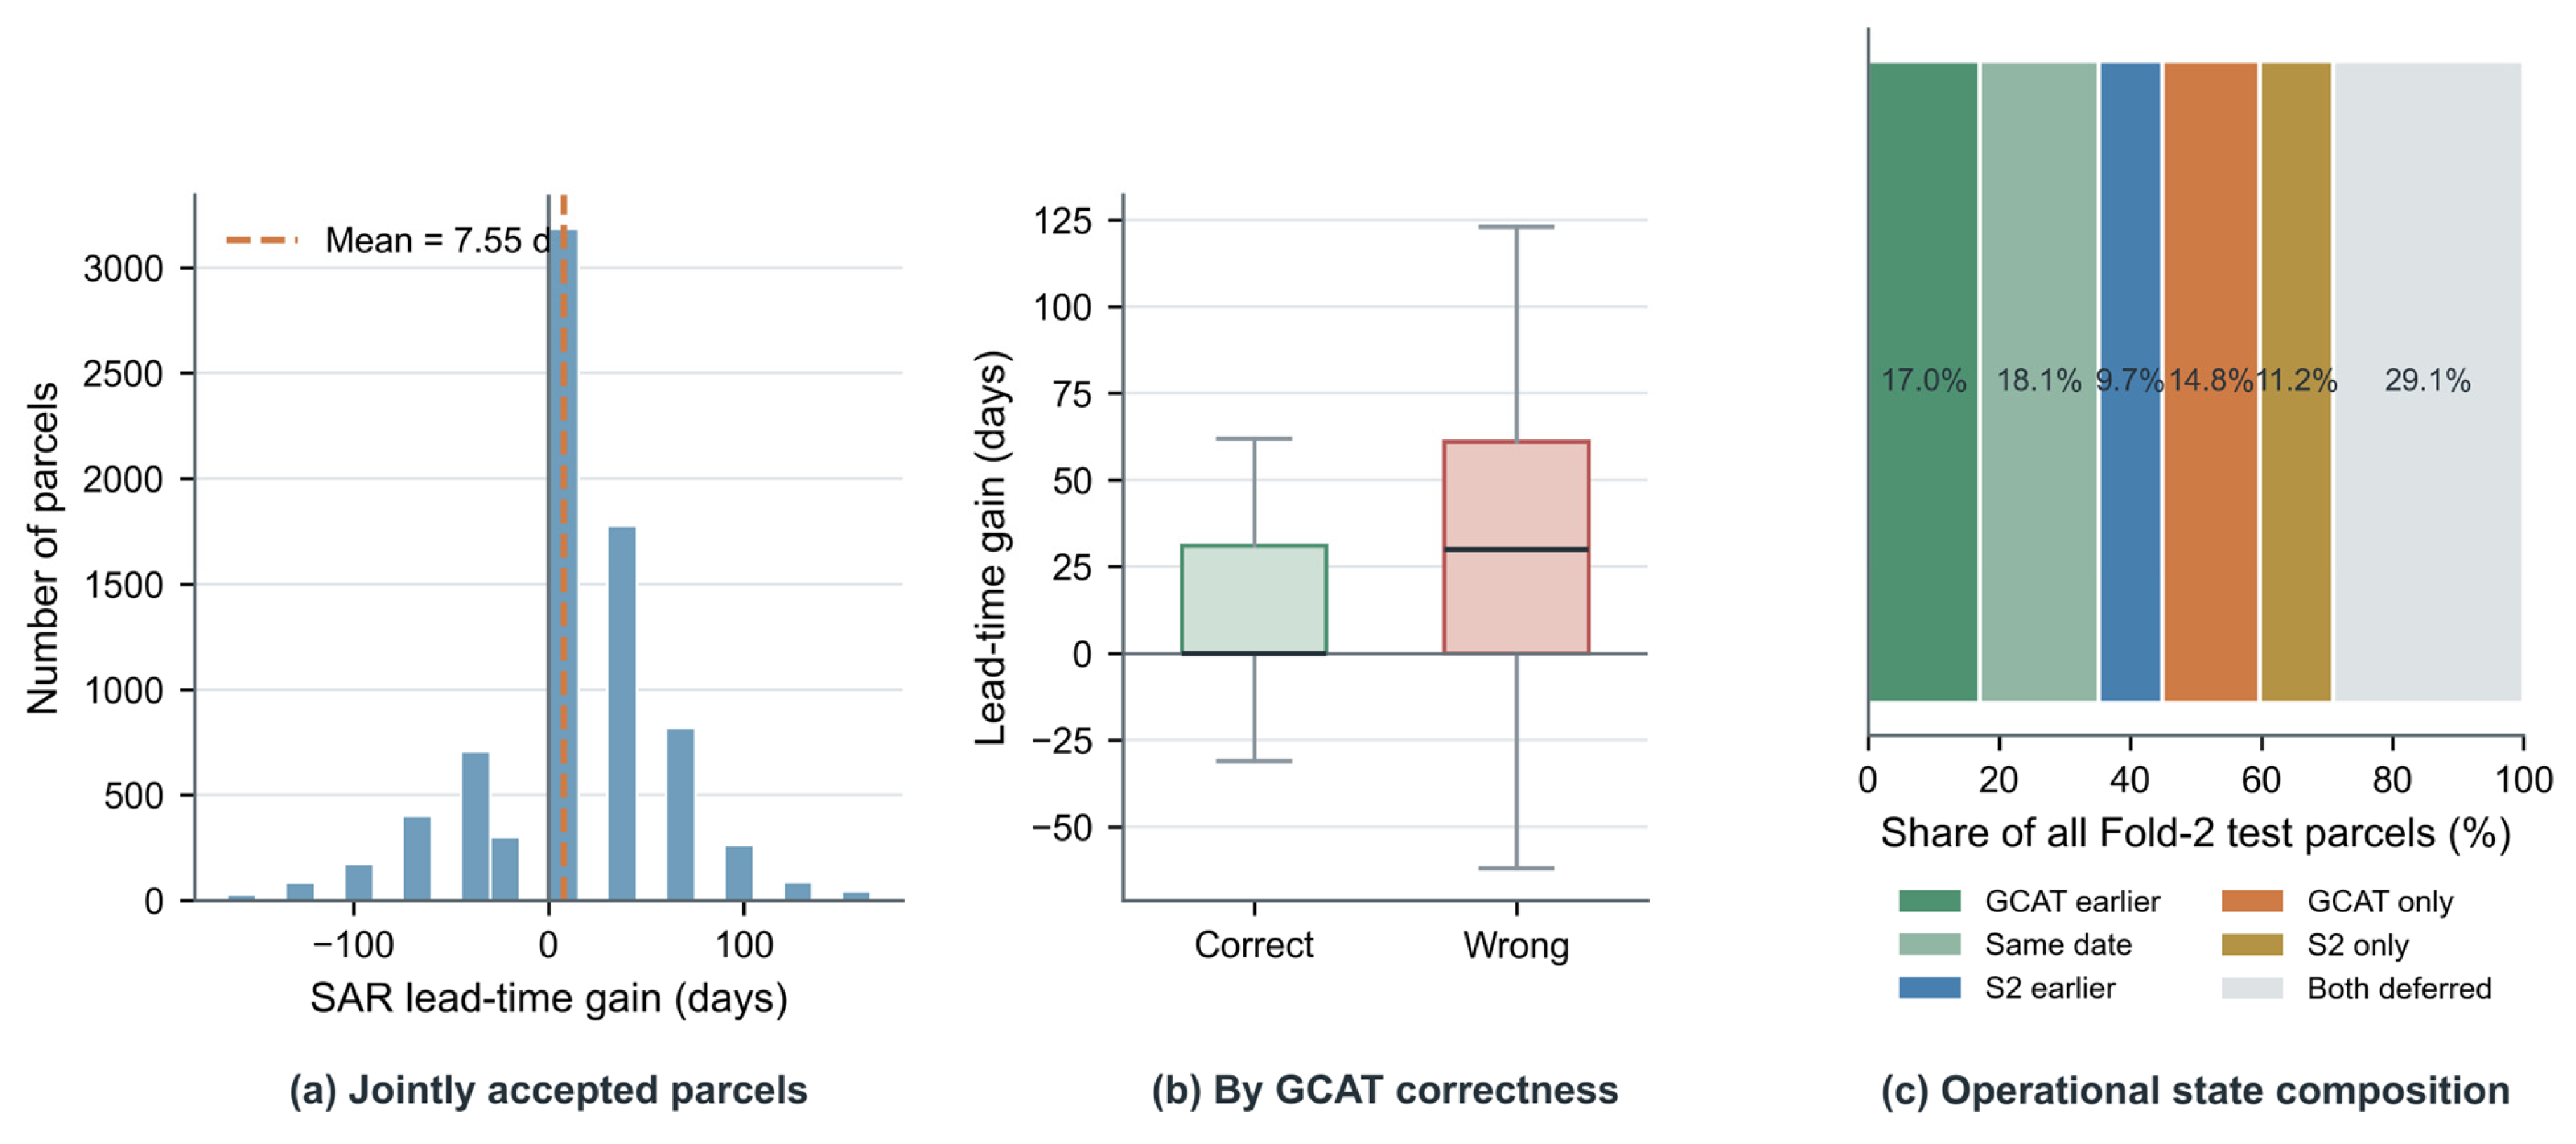
Among parcels accepted by both strategies, GCAT met the acceptance criterion 7.55 d earlier on average (95% CI: [5.47, 9.53] d); 37.96% were earlier, 40.42% unchanged, and 21.63% later. By 30 September, GCAT-only accepted parcels accounted for 14.82% of the test set (Figure 6; Table 6).
Figure 6.
Fold-2 SAR Lead-Time Gain distribution, correctness-stratified gain, and operational-state composition.
Table 6.
Progressive decision and earliness results on Fold 2.
Earlier acceptance was not equivalent to greater reliability. Among 7883 jointly accepted parcels, mean Lead-Time Gain was 7.35 d for correct first GCAT predictions and 24.33 d for incorrect ones (Figure 6b).
Figure 7 shows that GCAT generally achieved higher coverage at similar empirical risk. Both models remained below the 5% reference line at the six checkpoints, but these monthly values describe the frozen policy trajectory rather than independent risk guarantees.
Figure 7.
Fold-2 cumulative accepted coverage and coverage–risk operating trajectories.
3.3. Cross-Fold Spatial Robustness
For cross-fold comparability, the Global SRC procedure defined in Section 2.6 was applied independently to Folds 2–5. GCAT achieved higher MCAC and positive mean Lead-Time Gain in every fold (Table 7). The Fold-2 values differ from Section 3.2 because the harmonized cross-fold policy is not the primary Fold-2 policy.
Table 7.
Progressive earliness results across Folds 2–5.
Across Folds 2–5, mean MCAC was 0.30 ± 0.07 for S2 and 0.51 ± 0.04 for GCAT; mean Lead-Time Gain was 23.89 ± 9.94 d and mean SAR-rescued coverage was 25.32% ± 7.26%, with substantial variation in effect size across folds.
3.4. Cross-Year Transferability Evaluation
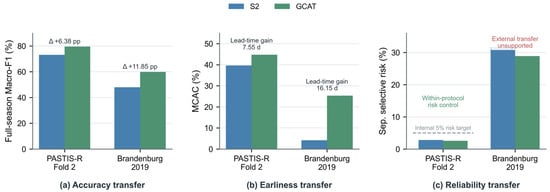
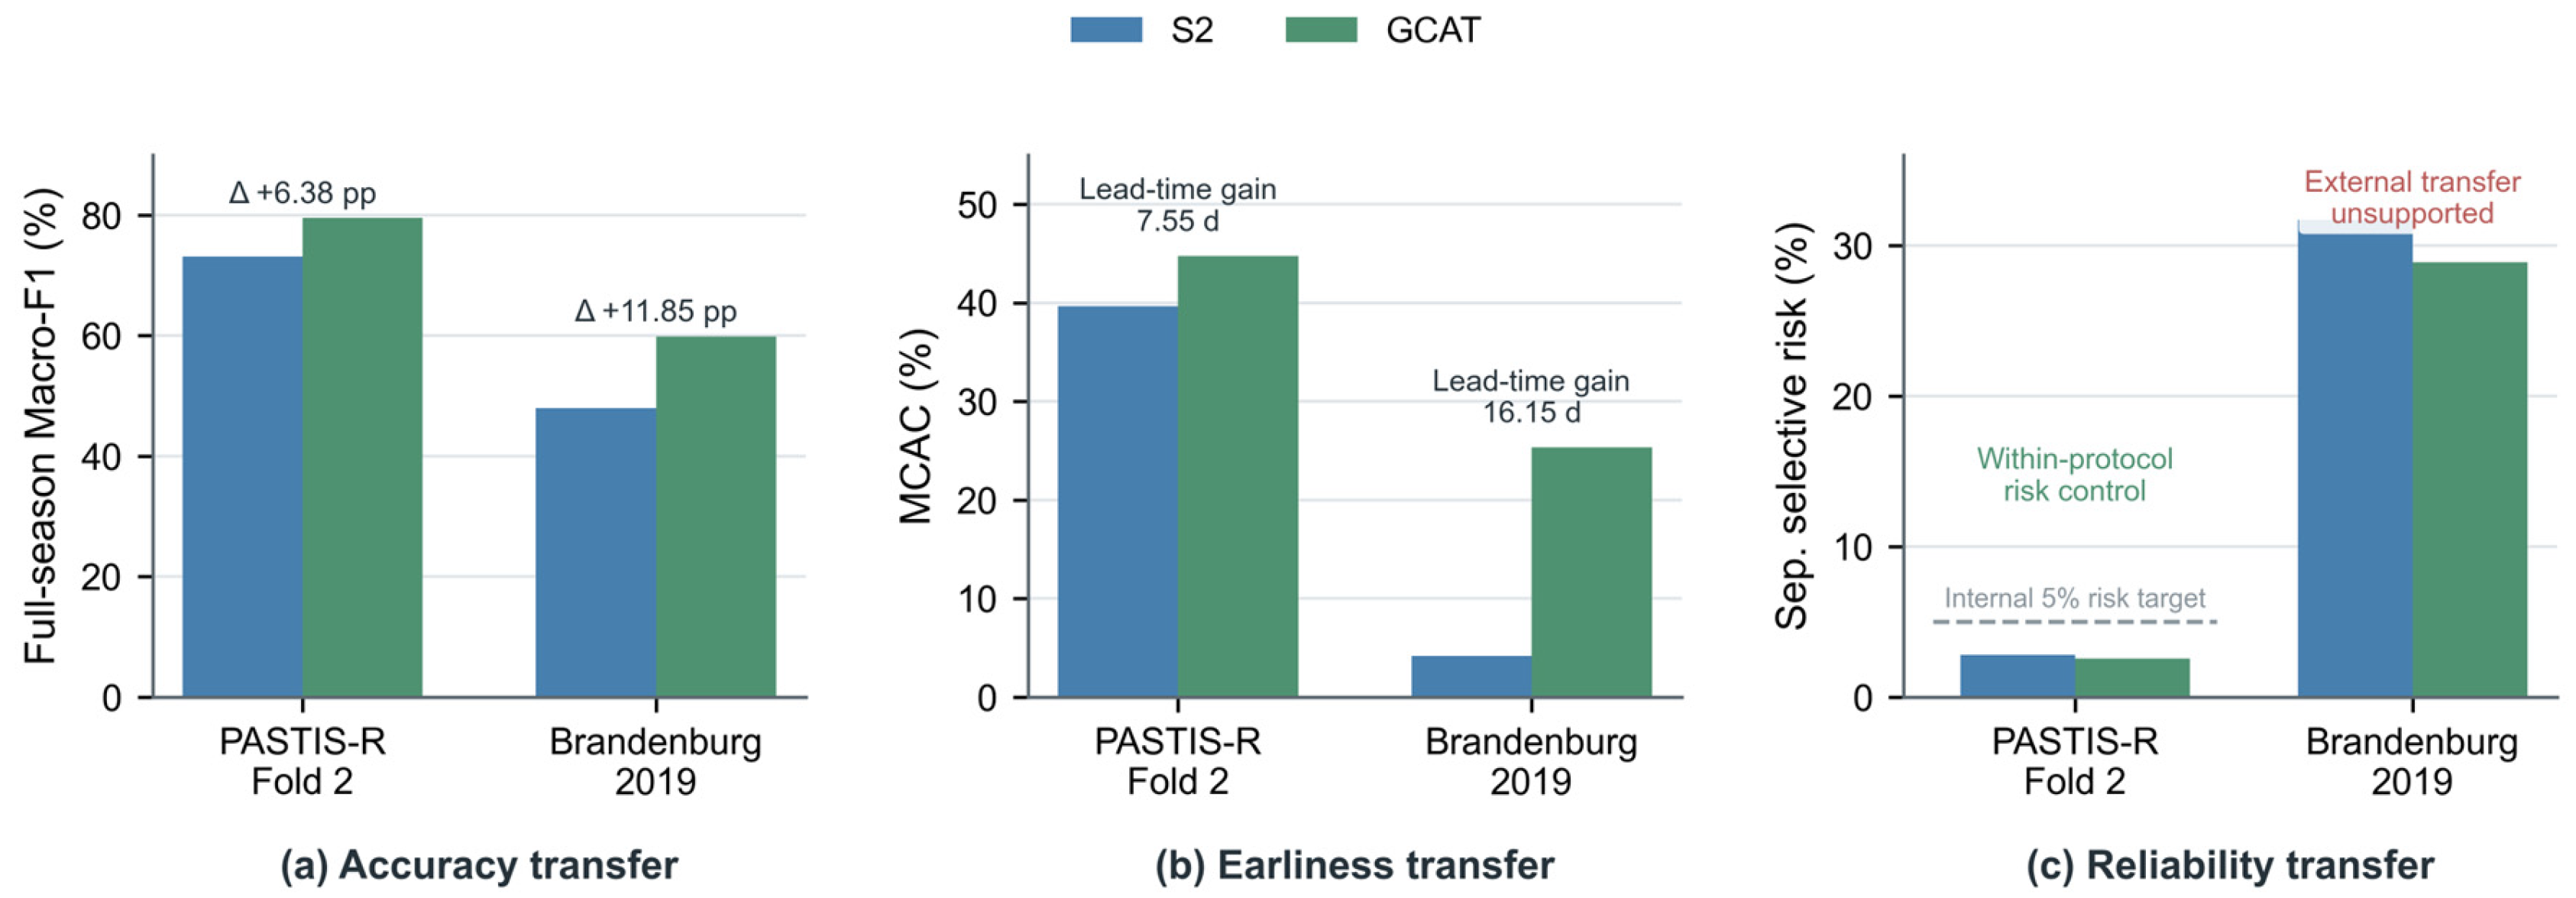
In the frozen Brandenburg 2019 test, GCAT was slightly below S2 in April but higher from May onward. Full-season Macro-F1 increased from 48.02% to 59.87% and OA increased from 60.51% to 68.80% (Table 8).
Table 8.
External classification performance on Brandenburg 2019 (%).
Under the same frozen policy, MCAC increased from 0.04 to 0.25 (difference 0.21; 95% block-bootstrap CI [0.18, 0.24]), and jointly accepted parcels were accepted 16.15 d earlier on average (95% CI: [9.67, 23.10] d).
Reliability did not transfer with classification and earliness. September empirical selective error reached 31.71% for S2 and 28.89% for GCAT, well above the internal 5% reference (Figure 8). Because 2019 was neither recalibrated nor used for threshold selection, these values diagnose degradation of the development-year confidence–risk relationship.
Figure 8.
Accuracy, earliness, and reliability evidence in PASTIS-R Fold 2 and the frozen Brandenburg 2019 replay.
3.5. External Reliability Degradation and Spatial Analysis
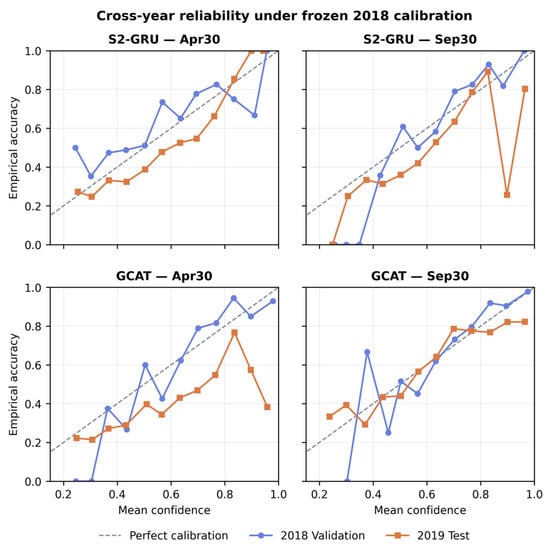
Under the frozen 2018 calibration, probability quality deteriorated on the Brandenburg 2019 test set. At the September checkpoint, GCAT’s ECE increased from 0.036 to 0.062, NLL from 0.626 to 0.876, and Brier score from 0.317 to 0.447 (Figure 9). These results indicate that the confidence–accuracy relationship established in 2018 was not fully preserved across years.
Figure 9.
Reliability diagrams for S2-GRU and GCAT under frozen 2018 calibration, comparing 2018 validation and 2019 external test predictions at the April and September checkpoints.
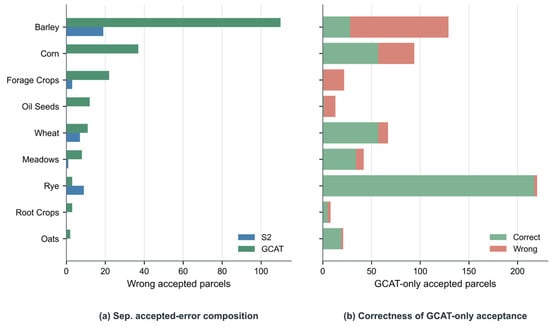
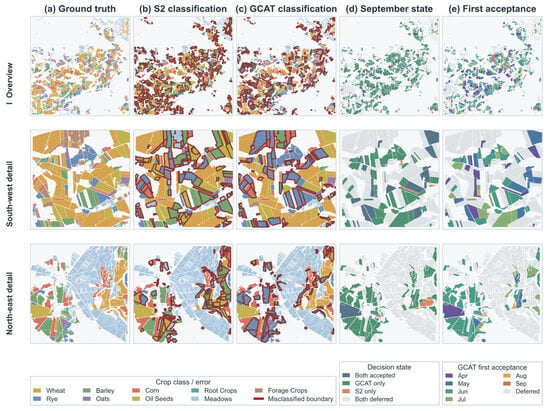
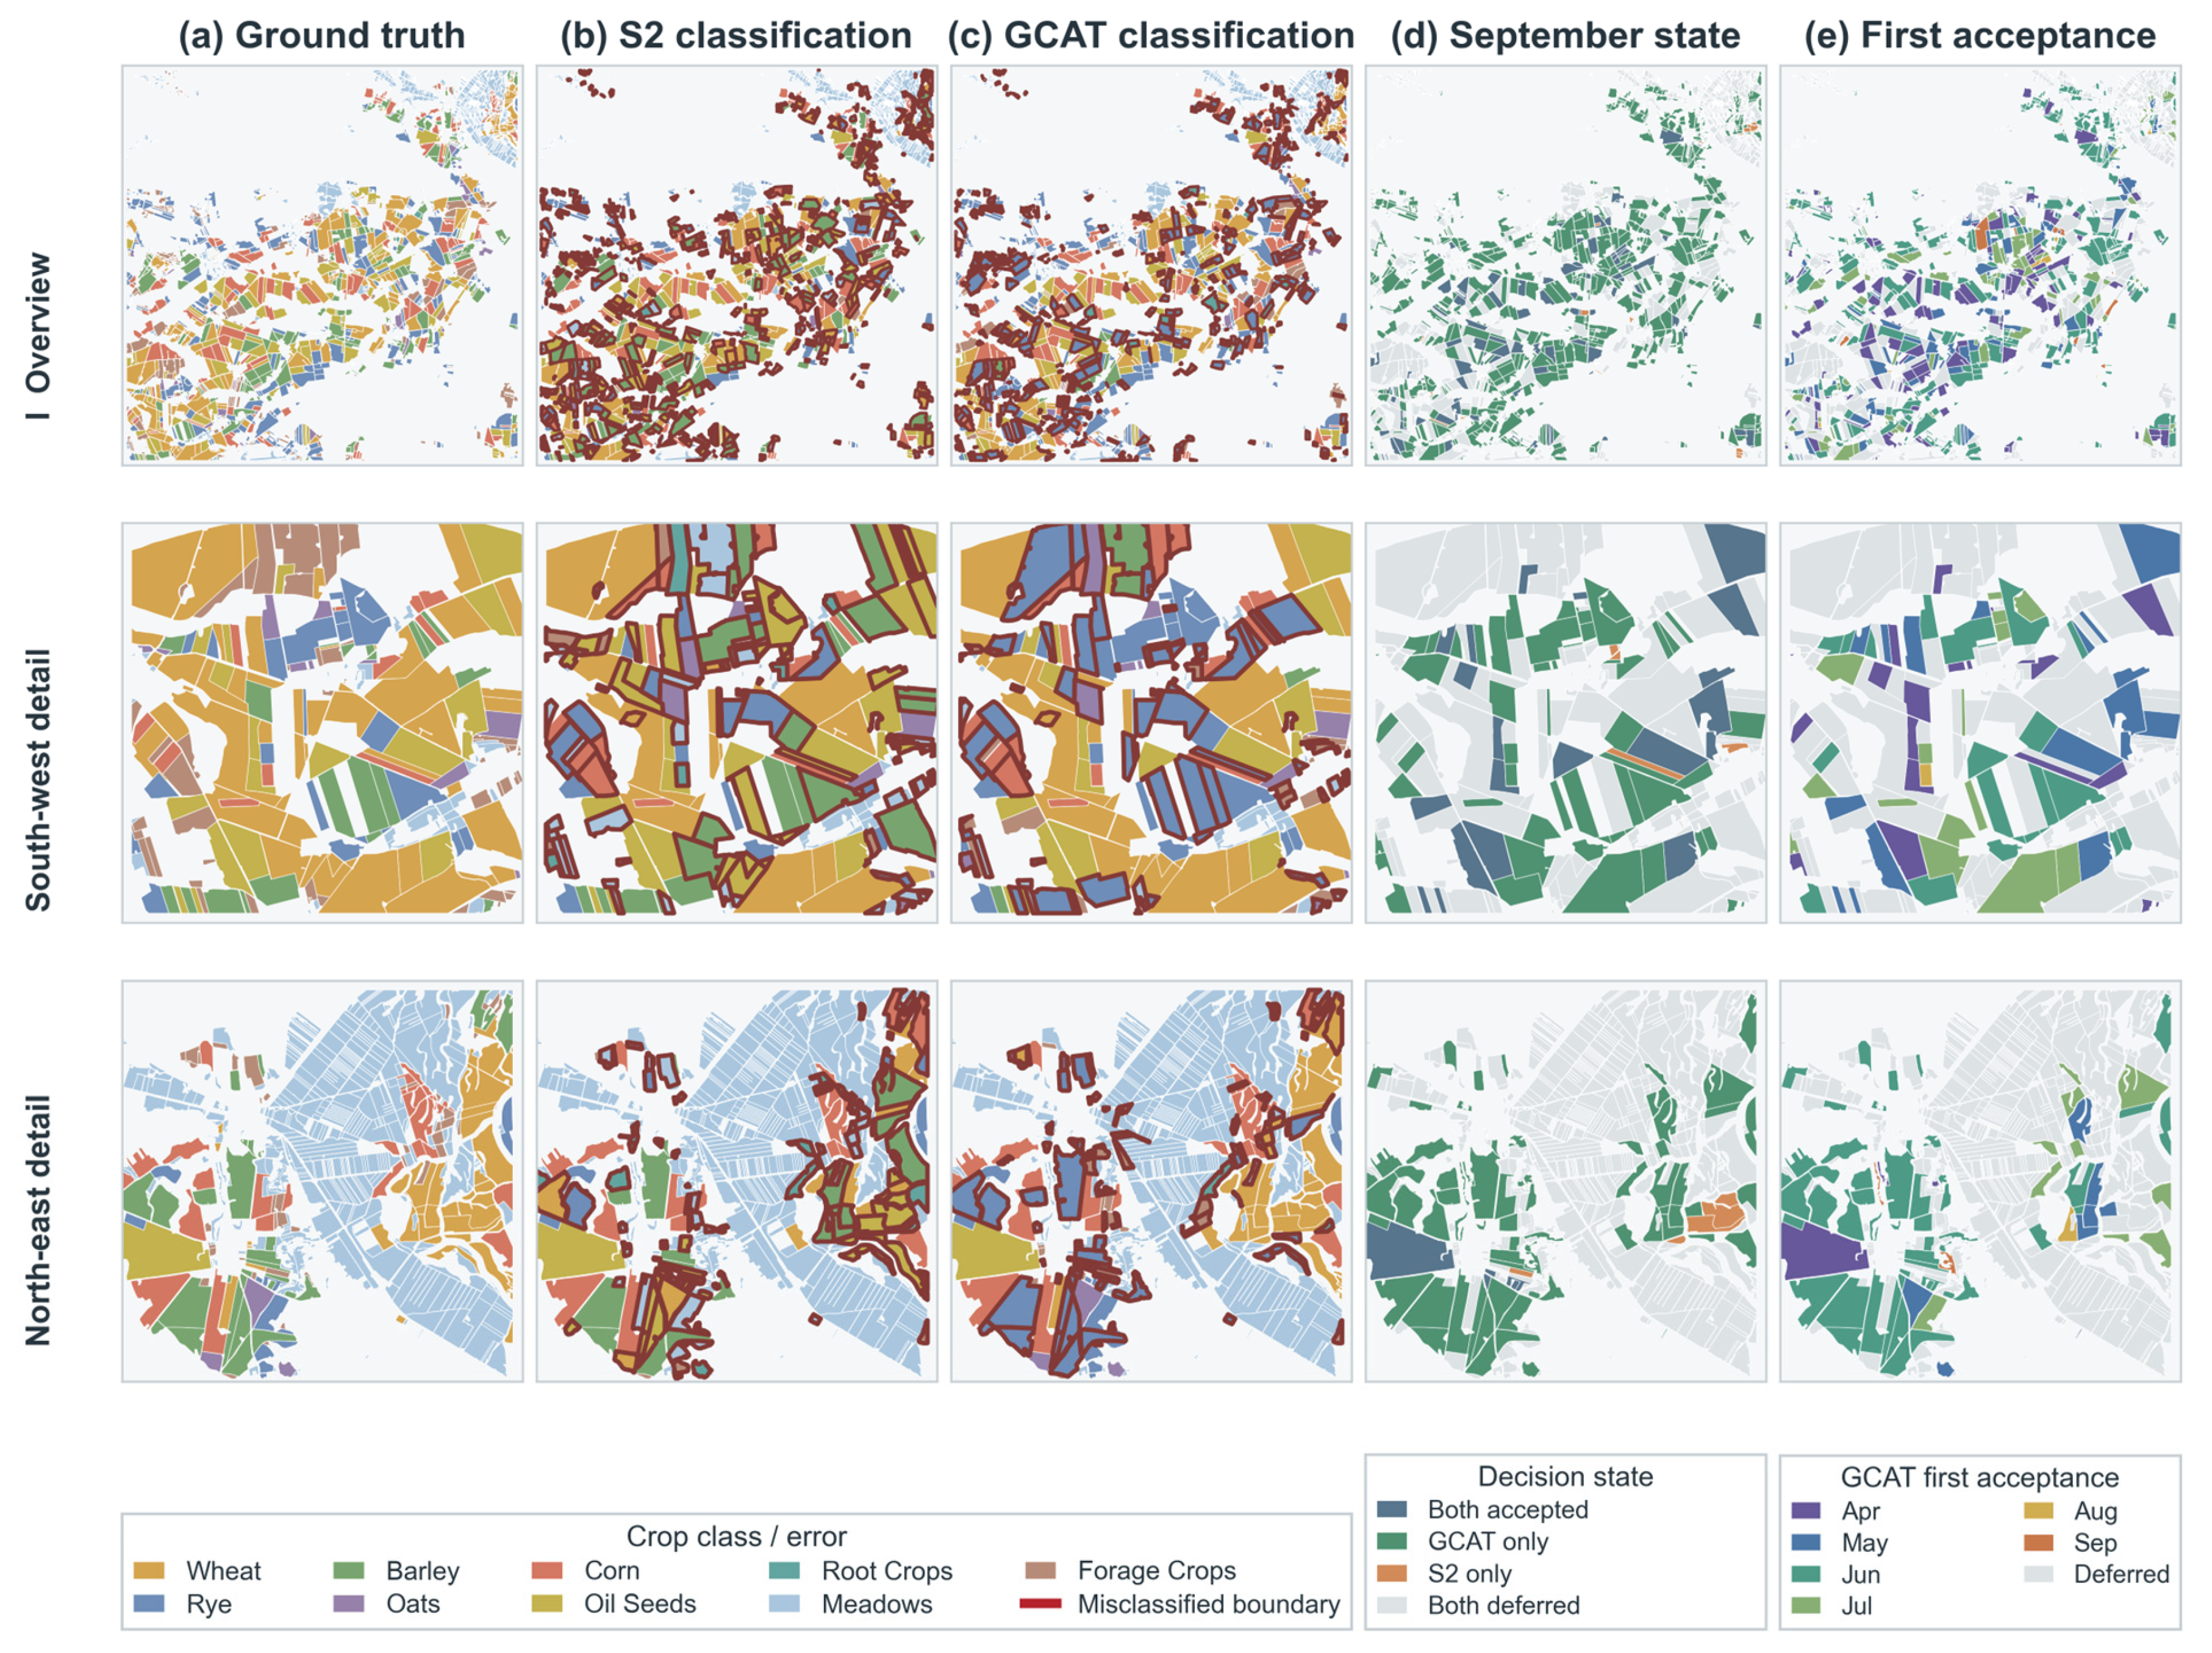
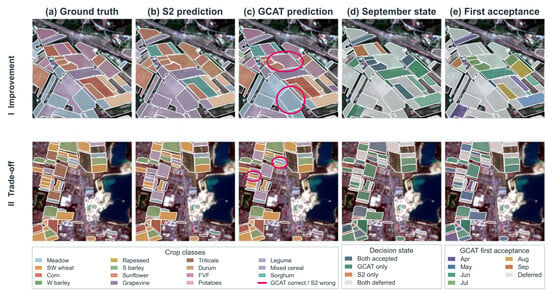
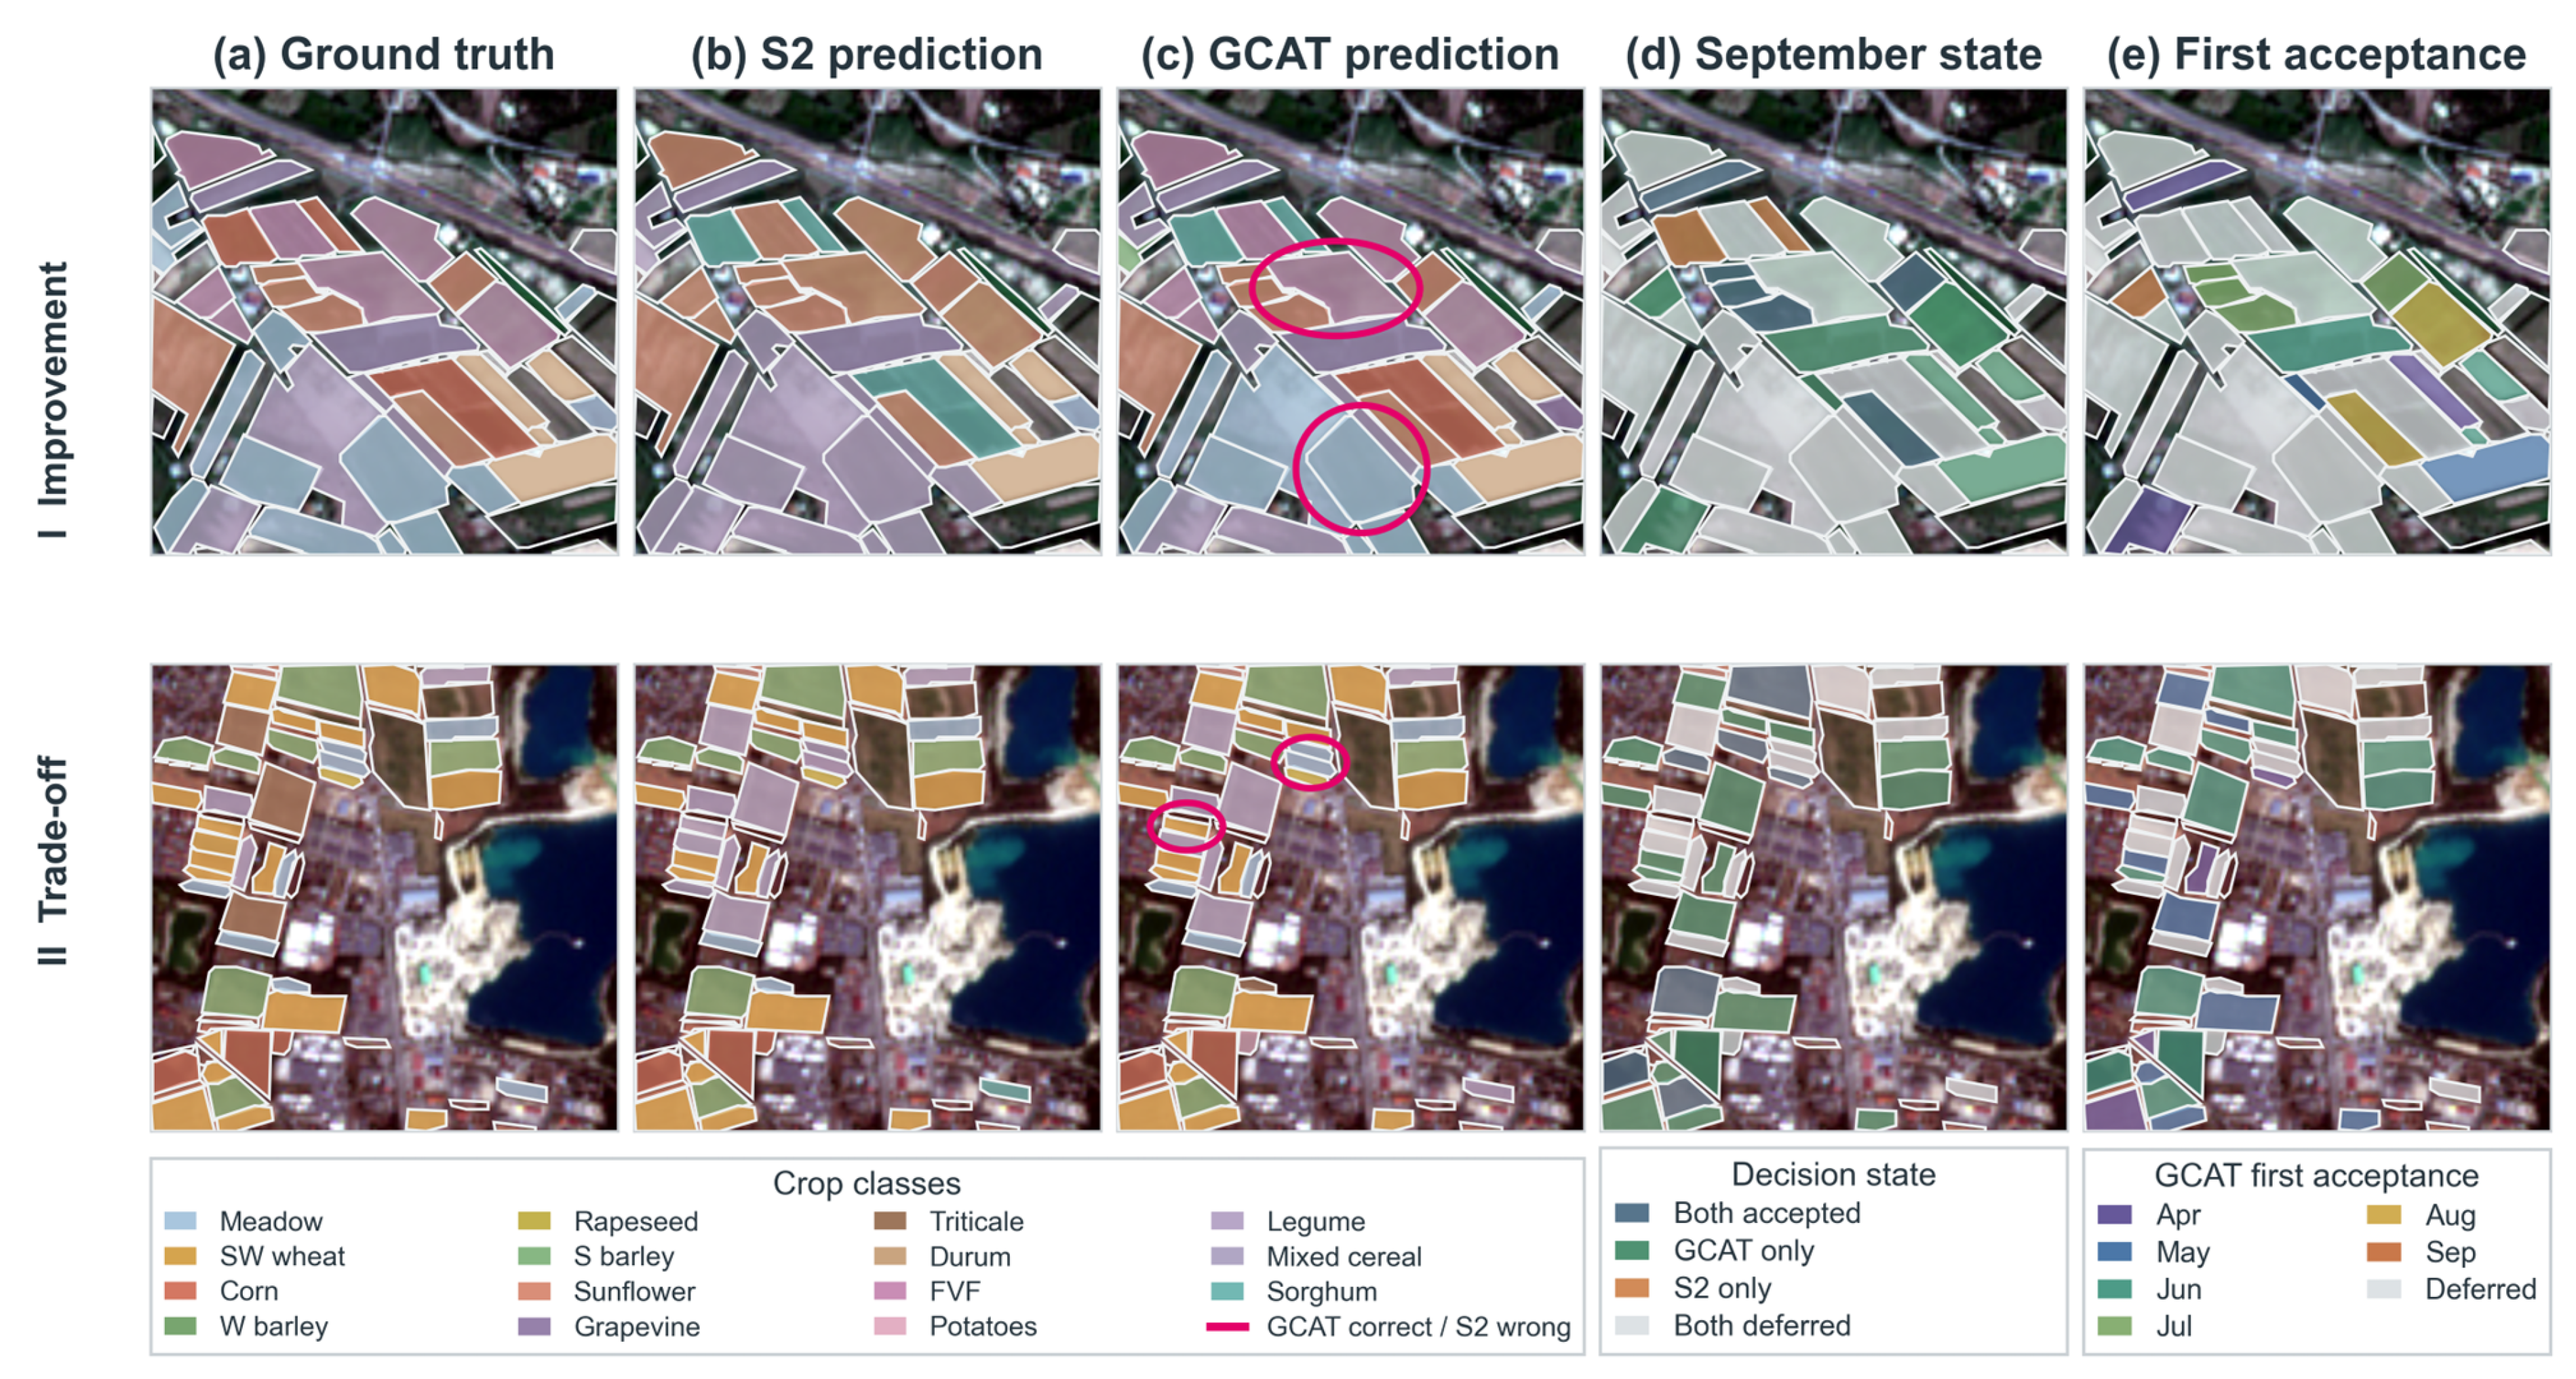
Figure 10 summarizes the accepted-error composition and GCAT-only class-wise correctness. Figure 11 maps Brandenburg 2019 ground truth, full-season predictions, September decision states, and GCAT first-acceptance timing. Figure 12 provides corresponding local-scale examples for representative PASTIS-R Fold-2 patches. The formal records exactly reproduce 616 GCAT-only accepted parcels: 418 correct and 198 incorrect, corresponding to 67.86% accuracy (95% exact binomial CI: 64.01–71.54%). The interval relies on a Bernoulli/exchangeability approximation; resampling 106 complete 2 km spatial blocks gave a descriptive 95% bootstrap sensitivity interval of 63.67–71.91%. Errors were concentrated in Barley (101 of 129 GCAT-only Barley acceptances were wrong) and in the earliest releases: only 36 of 121 April GCAT-only acceptances were correct, whereas 44 of 50 May and 86 of 90 July acceptances were correct. Mean confidence was 0.95 for incorrect and 0.93 for correct GCAT-only acceptances, showing why greater accepted coverage cannot be equated with greater reliability.
Figure 10.
Brandenburg 2019 accepted-error composition and class-wise correctness of GCAT-only acceptance.
Figure 11.
Brandenburg 2019 region-wide classification, September decision state, and GCAT first acceptance date. Row I presents the full study tile; Rows II–III enlarge two spatial-density-selected subregions (southwest and northeast) using the same frozen predictions.
Figure 12.
Parcel-level progressive decision patterns in two deterministically selected PASTIS-R Fold-2 patches. Row I shows an accuracy-improvement patch, while Row II shows a coverage–error trade-off patch.
Among the 720 Brandenburg 2019 parcels accepted by GCAT under the frozen 2018 policy, 512 were correctly classified and 208 were incorrectly classified at their first ACCEPT checkpoint. Observation availability was evaluated using only acquisitions dated on or before each parcel’s locked first acceptance date. The correct and incorrect groups had the same median number of valid Sentinel-2 acquisitions (71) and the same median absolute gap between the available Sentinel-1 acquisition across both orbits and the Sentinel-2 acquisition (2 d). All 720 accepted parcels fell in the prespecified 0–2 d gap stratum. Median calibrated confidence at first acceptance was 0.936 for correct releases and 0.953 for incorrect releases. These frozen-test comparisons are descriptive: they do not establish that observation density or SAR–optical timing caused the errors, and they were not used to refit calibration or select a new acceptance threshold.
4. Discussion
SAR and optical observations offer complementary information on canopy scattering, spectral properties, and seasonal development [22,23,24,25]. In the primary PASTIS-R Fold-2 evaluation, GCAT exceeded S2-GRU in Macro-F1 at every operational checkpoint, with the largest gain of 11.31 percentage points in May. SAR observations therefore improved discrimination before the full seasonal record was available. However, checkpoints are calendar dates, not shared phenological stages: winter cereals may be advanced in April while summer crops are emerging. The temporal gains should therefore be interpreted as improvements in calendar-based monitoring, not as evidence of specific crop-level phenological mechanisms.
The observed improvement reflects both sensor complementarity and fusion design. Across five PASTIS-R folds, GCAT achieved a mean full-season Macro-F1 of 80.57%, compared with 79.49% for the otherwise matched non-gated cross-attention model. Positive fold-wise differences support an incremental benefit from gating, while simpler baselines show that SAR itself also contributes. Adaptive gating is already established in multimodal learning [51]; the contribution here lies in its integration with bidirectional cross-attention over asynchronous Sentinel-1 ascending, descending, and Sentinel-2 sequences. These comparisons do not establish superiority over all adaptive-fusion architectures.
Temporal-alignment comparisons isolate the effect of preserving acquisition timing. On Fold 2, asynchronous GCAT achieved 79.56% full-season Macro-F1, compared with 78.42% for nearest-date matching, 76.88% for causal 15-day gridding, and 75.71% for 30-day compositing. Preserving asynchronous acquisitions therefore favored classification in this protocol. However, nearest-date matching attained higher mean cumulative accepted coverage (MCAC: 0.470 versus 0.448), showing that higher classification accuracy need not imply greater acceptance coverage. The comparisons with L-TAE-RP and ELECTS-S2 were conducted under a shared parcel-statistics representation to assess temporal modeling within a controlled input setting. However, these adaptations do not preserve the full capabilities of their native implementations, particularly when richer spatial representations are available. Therefore, the results should not be interpreted as demonstrating superiority over the original spatiotemporal architectures. Instead, the architectural contribution of GCAT is more directly supported by the matched comparison with the non-gated cross-attention model. Moreover, ELECTS-S2 achieved a lower September empirical selective risk than GCAT, despite GCAT obtaining a higher full-season Macro-F1. These findings indicate that classification accuracy, acceptance coverage, and selective risk represent distinct aspects of model performance, and no single method was consistently superior across all three dimensions.
Controlled degradation experiments further define the conditions under which multimodal fusion is useful. With 40% of optical acquisitions randomly removed, GCAT lost 4.90 Macro-F1 points, compared with 9.08 for S2-GRU; under a 60-day optical outage, the corresponding losses were 4.16 and 9.54 points. SAR information therefore provided partial compensation for missing optical observations. Nevertheless, severe optical thinning reduced GCAT’s MCAC to 0.132 and raised terminal empirical selective risk from 2.56% to 8.25%. Perturbing SAR features also impaired performance. These findings establish relative robustness only under the tested conditions; feature-space SAR noise is not physical speckle. In this study, robustness primarily refers to the stability of classification performance across the evaluated spatial folds and its relative resistance to missing optical observations, rather than guaranteed selective decision reliability under cross-year distribution shifts. The complementary SAR information allows GCAT to maintain smaller classification-performance losses than the optical-only baseline under the tested observation-degradation conditions. However, this classification robustness does not necessarily extend to probability calibration or confidence-based acceptance decisions, which must be evaluated separately.
The Fold-1 quality ablations clarify why introducing additional quality descriptors is not automatically beneficial. GCAT-RP-T achieved 79.13% full-season Macro-F1, compared with 78.28% for GCAT-RP-TQ and 78.62% for Q-GCAT, although GCAT-RP-TQ performed slightly better in May. These variants added cloud-quality features to temporal representations or gate inputs but did not explicitly connect quality estimates to predictive uncertainty. Acquisition timing and observation counts may already encode part of the availability signal, but this remains a hypothesis rather than an established explanation. Future work could examine quality-conditioned attention and uncertainty-aware modality weighting.
Decision earliness must be interpreted alongside error risk. Under the primary Fold-2 policy, GCAT reached its first acceptance an average of 7.55 days earlier among parcels accepted by both models, and 14.82% of all test parcels were accepted by GCAT but still deferred by S2-GRU at the final checkpoint. Yet incorrect GCAT decisions exhibited larger average Lead-Time Gains than correct decisions. Faster release therefore does not imply greater reliability. Accepted coverage, timing, and empirical selective risk describe complementary operating characteristics of the same frozen ACCEPT/DEFER policy [38,43], as illustrated in Figure 12.
The Brandenburg 2019 evaluation further illustrates the distinction between expanded decision coverage and reliable acceptance. Although GCAT retained a full-season Macro-F1 advantage over S2-GRU (59.87% versus 48.02%) and improved decision coverage, its September empirical selective risk reached 28.89%, substantially exceeding the 5% development-stage target. Among the 616 parcels accepted by GCAT but not by S2-GRU, 418 were correctly classified and 198 were misclassified, corresponding to an accuracy of 67.86% for this incremental accepted subset. These additional predictions may be useful for preliminary crop mapping, prioritizing parcels for field inspection, and supporting agricultural monitoring workflows with human review. However, the observed error rate does not justify treating these predictions as sufficiently reliable for fully automated applications requiring high accuracy. Potential improvements include more conservative acceptance thresholds selected using independent calibration data, class-conditional or shift-aware recalibration, and quality-aware or uncertainty-aware modality weighting. These approaches require further validation and should not be tuned using the frozen Brandenburg 2019 test labels. Changes in crop composition, phenology, and observation distributions may contribute to the observed reliability degradation, but the current descriptive results do not establish a unique causal mechanism [39,40,41,48].
Several methodological limitations remain. First, the evaluation is limited to PASTIS-R spatial folds and the Brandenburg 2018–2019 transfer, restricting generalization across climates and crop classes. Second, the Clopper–Pearson bound assumes independent calibration observations, which spatial clustering may violate. Patch-level bootstrap analysis for PASTIS-R Fold 2 and 2 km spatial-block bootstrap analysis for Brandenburg 2019 yielded descriptive 95% selective-risk intervals of [2.20%, 2.95%] and [25.31%, 33.06%], respectively. These findings support the observed risk differences but do not establish the validity of the binomial bound under spatial dependence. Thus, the 5% risk target remains a development-stage threshold-selection criterion rather than a guarantee under spatial dependence or cross-year shifts. Third, severe class imbalance remains unresolved despite inverse-frequency weighting. Logit adjustment and Balanced Softmax improved minority-class recall but reduced Macro-F1, while prototype learning and evidence-based selection showed insufficient development-stage improvements to warrant further testing. Moreover, the Barley-related errors in Brandenburg cannot be directly attributed to PASTIS-R class imbalance. Future work should explore more discriminative minority-class representations and class-conditional calibration under distribution shifts.
Finally, the use of lightweight parcel-level statistical features represents a deliberate methodological choice rather than an assumption that spatial information is unimportant. By summarizing each acquisition using band-wise means and standard deviations, the framework retains compact spectral and backscatter information, including a limited description of within-parcel variability, while avoiding high-dimensional pixel-level inputs. This design allows the study to isolate the contribution of asynchronous temporal fusion and sequential decision-making from additional spatial representation learning. Under this controlled setting, the matched GCAT and non-gated cross-attention comparison provides evidence that complementary gating improves temporal classification independently of changes in the input representation. Nevertheless, the statistical aggregation discards spatial arrangement, texture, and local neighborhood relationships, which may be particularly important for distinguishing crops with similar temporal signatures. Therefore, the present results demonstrate the effectiveness of lightweight parcel-statistics-based temporal fusion, but do not establish superiority over native spatiotemporal models or imply that spatial features are unnecessary. Future work should investigate the integration of lightweight texture descriptors or mask-aware spatial encoders and evaluate the associated trade-offs in classification accuracy, decision earliness, selective reliability, and computational cost.
5. Conclusions
The principal findings are as follows:
- (1)
- Across five PASTIS-R folds, SAR information and fusion design jointly improved classification; GCAT consistently outperformed the matched non-gated cross-attention baseline, although alternative timing and classification methods led on selected decision metrics.
- (2)
- Under the evaluated progressive policies, GCAT increased accepted coverage and shortened waiting time for some parcels. Controlled perturbations showed smaller losses than S2-GRU under tested optical outages, but severe temporal sparsity reduced accuracy and coverage and increased empirical risk.
- (3)
- In the frozen Brandenburg 2019 test, relative classification and decision-earliness benefits were partially retained, whereas development-year probability calibration and selective reliability deteriorated.
Together, these results motivate joint evaluation of classification accuracy, decision earliness, and decision reliability in operational crop monitoring.
Author Contributions
Conceptualization, Q.H.; methodology, Q.H., L.W. and C.H.; software, Q.H.; validation, Q.H.; formal analysis, Q.H.; investigation, Q.H.; data curation, Q.H.; visualization, Q.H.; writing—original draft preparation, Q.H.; writing—review and editing, C.H.; supervision, L.W., C.H., S.C. and J.Y. All authors have read and agreed to the published version of the manuscript.
Funding
This work was financially supported by the National Natural Science Foundation of China (Grant Nos. 4240415 and 52474194).
Data Availability Statement
The PASTIS-R dataset was obtained from https://doi.org/10.5281/zenodo.5735646, and the Fusion Competition Brandenburg dataset was obtained from https://doi.org/10.34911/rdnt.z9y7vu. The core implementation of the proposed GCAT framework, including asynchronous SAR–optical temporal fusion, progressive training, probability calibration, and sequential ACCEPT/DEFER decision-making, is available on GitHub at https://github.com/yylx-1234/GCAT (accessed on 25 October 2026). The repository provides source code and instructions for implementing the main methodology; the original datasets are accessible through their respective repositories.
Acknowledgments
The authors used OpenAI’s ChatGPT and Codex (GPT-5.6 sol) for language editing and assistance with figure design and formatting. All AI-assisted outputs were reviewed and revised by the authors, who take full responsibility for the final manuscript.
Conflicts of Interest
The authors declare no conflicts of interest.
References
- Zhao, L.; Li, F.; Chang, Q. Review of crop remote sensing identification and yield estimation. Trans. Chin. Soc. Agric. Mach. 2023, 54, 1–19. [Google Scholar]
- Wu, J.; Lv, Y.; Li, C.; Li, Q. County-level crop classification based on multi-temporal Sentinel-2A. Trans. Chin. Soc. Agric. Mach. 2019, 50, 194–200. [Google Scholar] [CrossRef]
- Blickensdörfer, L.; Schwieder, M.; Pflugmacher, D.; Nendel, C.; Erasmi, S.; Hostert, P. Mapping of crop types and crop sequences with combined time series of Sentinel-1, Sentinel-2 and Landsat 8 data for Germany. Remote Sens. Environ. 2022, 269, 112831. [Google Scholar] [CrossRef] [Scilit]
- Hamidi, M.; Homayouni, S.; Safari, A.; Hasani, H. Deep learning based crop-type mapping using SAR and optical data fusion. Int. J. Appl. Earth Obs. Geoinf. 2024, 129, 103860. [Google Scholar] [CrossRef] [Scilit]
- Eisfelder, C.; Boemke, B.; Gessner, U.; Sogno, P.; Alemu, G.; Hailu, R.; Mesmer, C.; Huth, J. Cropland and crop type classification with Sentinel-1 and Sentinel-2 time series using Google Earth Engine for agricultural monitoring in Ethiopia. Remote Sens. 2024, 16, 866. [Google Scholar] [CrossRef] [Scilit]
- Tang, K.; Chen, X.; Liu, T.; Li, A.; Tang, Y.; Yang, P.; Chen, J. AnytimeFormer: Fusing irregular and asynchronous SAR–optical time series to reconstruct reflectance at any given time. Remote Sens. Environ. 2026, 333, 115120. [Google Scholar] [CrossRef] [Scilit]
- Ndikumana, E.; Ho Tong Minh, D.; Baghdadi, N.; Courault, D.; Hossard, L. Deep Recurrent Neural Network for Agricultural Classification Using Multitemporal SAR Sentinel-1 for Camargue, France. Remote Sens. 2018, 10, 1217. [Google Scholar] [CrossRef] [Scilit]
- Rußwurm, M.; Körner, M. Multi-Temporal Land Cover Classification with Sequential Recurrent Encoders. ISPRS Int. J. Geo-Inf. 2018, 7, 129. [Google Scholar] [CrossRef] [Scilit]
- Cho, K.; van Merriënboer, B.; Gulcehre, C.; Bahdanau, D.; Bougares, F.; Schwenk, H.; Bengio, Y. Learning Phrase Representations Using RNN Encoder–Decoder for Statistical Machine Translation. In Proceedings of the 2014 Conference on Empirical Methods in Natural Language Processing (EMNLP), Doha, Qatar, 25–29 October 2014; pp. 1724–1734. [Google Scholar] [CrossRef] [Scilit]
- Hochreiter, S.; Schmidhuber, J. Long Short-Term Memory. Neural Comput. 1997, 9, 1735–1780. [Google Scholar] [CrossRef] [Scilit]
- Pelletier, C.; Webb, G.I.; Petitjean, F. Temporal Convolutional Neural Network for the Classification of Satellite Image Time Series. Remote Sens. 2019, 11, 523. [Google Scholar] [CrossRef] [Scilit]
- Ji, S.; Zhang, C.; Xu, A.; Shi, Y.; Duan, Y. 3D Convolutional Neural Networks for Crop Classification with Multi-Temporal Remote Sensing Images. Remote Sens. 2018, 10, 75. [Google Scholar] [CrossRef] [Scilit]
- Sainte Fare Garnot, V.; Landrieu, L.; Giordano, S.; Chehata, N. Satellite Image Time Series Classification with Pixel-Set Encoders and Temporal Self-Attention. In Proceedings of the 2020 IEEE/CVF Conference on Computer Vision and Pattern Recognition (CVPR), Seattle, WA, USA, 13–19 June 2020; pp. 12322–12331. [Google Scholar] [CrossRef] [Scilit]
- Sainte Fare Garnot, V.; Landrieu, L. Lightweight Temporal Self-Attention for Classifying Satellite Images Time Series. In Advanced Analytics and Learning on Temporal Data; Springer: Cham, Switzerland, 2020; pp. 171–181. [Google Scholar] [CrossRef] [Scilit]
- Rußwurm, M.; Körner, M. Self-Attention for Raw Optical Satellite Time Series Classification. ISPRS J. Photogramm. Remote Sens. 2020, 169, 421–435. [Google Scholar] [CrossRef] [Scilit]
- Vaswani, A.; Shazeer, N.; Parmar, N.; Uszkoreit, J.; Jones, L.; Gomez, A.N.; Kaiser, Ł.; Polosukhin, I. Attention Is All You Need. In Advances in Neural Information Processing Systems 30; Curran Associates: Red Hook, NY, USA, 2017; pp. 5998–6008. [Google Scholar]
- Zhang, W.; Tang, P.; Zhang, Z. Satellite image time-series classification based on a temporal self-attention mechanism. Natl. Remote Sens. Bull. 2023, 27, 1914–1924. [Google Scholar]
- Tarasiou, M.; Chavez, E.; Zafeiriou, S. ViTs for SITS: Vision Transformers for Satellite Image Time Series. In Proceedings of the 2023 IEEE/CVF Conference on Computer Vision and Pattern Recognition (CVPR), Vancouver, BC, Canada, 17–24 June 2023; pp. 10418–10428. [Google Scholar] [CrossRef] [Scilit]
- Zhang, W.; Tang, P.; Meng, Y.; Zhao, L.; Zhao, Z.; Zhang, Z. Crop classification from remote-sensing image time series using a multiscale spatiotemporal global-attention model. Natl. Remote Sens. Bull. 2024, 28, 2865–2877. [Google Scholar]
- Tang, P.; Chanussot, J.; Guo, S.; Zhang, W.; Qie, L.; Zhang, P.; Fang, H.; Du, P. Deep Learning with Multi-Scale Temporal Hybrid Structure for Robust Crop Mapping. ISPRS J. Photogramm. Remote Sens. 2024, 209, 117–132. [Google Scholar] [CrossRef] [Scilit]
- Zhang, X.; Cai, Z.; Hu, Q.; Yang, J.; Wei, H.; You, L.; Xu, B. Improving Crop Type Mapping by Integrating LSTM with Temporal Random Masking and Pixel-Set Spatial Information. ISPRS J. Photogramm. Remote Sens. 2024, 218, 87–101. [Google Scholar] [CrossRef] [Scilit]
- Sainte Fare Garnot, V.; Landrieu, L.; Chehata, N. Multi-Modal Temporal Attention Models for Crop Mapping from Satellite Time Series. ISPRS J. Photogramm. Remote Sens. 2022, 187, 294–305. [Google Scholar] [CrossRef] [Scilit]
- Adrian, J.; Sagan, V.; Maimaitijiang, M. Sentinel SAR–Optical Fusion for Crop Type Mapping Using Deep Learning and Google Earth Engine. ISPRS J. Photogramm. Remote Sens. 2021, 175, 215–235. [Google Scholar] [CrossRef] [Scilit]
- Ofori-Ampofo, S.; Pelletier, C.; Lang, S. Crop Type Mapping from Optical and Radar Time Series Using Attention-Based Deep Learning. Remote Sens. 2021, 13, 4668. [Google Scholar] [CrossRef] [Scilit]
- Weilandt, F.; Behling, R.; Goncalves, R.; Madadi, A.; Richter, L.; Sanona, T.; Spengler, D.; Welsch, J. Early Crop Classification via Multi-Modal Satellite Data Fusion and Temporal Attention. Remote Sens. 2023, 15, 799. [Google Scholar] [CrossRef] [Scilit]
- Yuan, Y.; Lin, L.; Zhou, Z.-G.; Jiang, H.; Liu, Q. Bridging Optical and SAR Satellite Image Time Series via Contrastive Feature Extraction for Crop Classification. ISPRS J. Photogramm. Remote Sens. 2023, 195, 222–232. [Google Scholar] [CrossRef] [Scilit]
- Han, Z.; Zhang, C.; Gao, L.; Zeng, Z.; Zhang, B.; Atkinson, P.M. Spatio-Temporal Multi-Level Attention Crop Mapping Method Using Time-Series SAR Imagery. ISPRS J. Photogramm. Remote Sens. 2023, 206, 293–310. [Google Scholar] [CrossRef] [Scilit]
- Follath, T.; Mickisch, D.; Hemmerling, J.; Erasmi, S.; Schwieder, M.; Demir, B. Multi-Modal Vision Transformers for Crop Mapping from Satellite Image Time Series. In Proceedings of the IGARSS 2024-2024 IEEE International Geoscience and Remote Sensing Symposium, Athens, Greece, 7–12 July 2024; pp. 1937–1941. [Google Scholar] [CrossRef] [Scilit]
- Anandakrishnan, J.; Meenkaski Sundaram, V.; Paneer, P. STA-AgriNet: A Spatio-Temporal Attention Framework for Crop Type Mapping from Fused Multi-Sensor Multi-Temporal SITS. IEEE J. Sel. Top. Appl. Earth Obs. Remote Sens. 2025, 18, 1817–1826. [Google Scholar] [CrossRef] [Scilit]
- Xie, Y.; Jia, Z.; Zhang, X. Forest classification based on cross-attention fusion of multispectral and SAR data. Natl. Remote Sens. Bull. 2025, 29, 2989–3005. [Google Scholar]
- Yan, J.; Gu, X.; Chen, Y. CropSTS: A Remote Sensing Foundation Model for Cropland Classification with Decoupled Spatiotemporal Attention. Remote Sens. 2025, 17, 2481. [Google Scholar] [CrossRef] [Scilit]
- Raab, C.; Nguyen, V.D.; Barrett, B.; Zakirova, A.; Zuberi, M.; Alff, H.; Spies, M. Crop Type Classification in Smallholder Agriculture of Central and South Asia Using Sentinel-1/2 Data Fusion. Remote Sens. Appl. Soc. Environ. 2026, 42, 102007. [Google Scholar] [CrossRef] [Scilit]
- Li, K.; Zhao, W.; Peng, R.; Ye, T. Multi-Branch Self-Learning Vision Transformer (MSViT) for Crop Type Mapping with Optical–SAR Time-Series. Comput. Electron. Agric. 2022, 203, 107497. [Google Scholar] [CrossRef] [Scilit]
- Rußwurm, M.; Courty, N.; Emonet, R.; Lefèvre, S.; Tuia, D.; Tavenard, R. End-to-End Learned Early Classification of Time Series for In-Season Crop Type Mapping. ISPRS J. Photogramm. Remote Sens. 2023, 196, 445–456. [Google Scholar] [CrossRef] [Scilit]
- Wang, C.; Zhang, X.; Wang, W.; Wei, H.; Wang, J.; Li, Z.; Li, X.; Wu, H.; Hu, Q. Understanding the potentials of early-season crop type mapping by using Landsat-8, Sentinel-1/2, and GF-1/6 data. Comput. Electron. Agric. 2024, 224, 109239. [Google Scholar] [CrossRef] [Scilit]
- Fei, C.; Li, Y.; McNairn, H.; Lampropoulos, G. Early-season crop classification utilizing time series based deep learning with multi-sensor remote sensing data. In Proceedings of the IGARSS 2024-2024 IEEE International Geoscience and Remote Sensing Symposium, Athens, Greece, 7–12 July 2024; pp. 4132–4135. [Google Scholar] [CrossRef] [Scilit]
- Yang, Z.; Diao, C.; Gao, F.; Li, B. EMET: An emergence-based thermal phenological framework for near real-time crop type mapping. ISPRS J. Photogramm. Remote Sens. 2024, 215, 271–291. [Google Scholar] [CrossRef] [Scilit]
- Geifman, Y.; El-Yaniv, R. Selective classification for deep neural networks. In Advances in Neural Information Processing Systems 30; Curran Associates: Red Hook, NY, USA, 2017; pp. 4878–4887. [Google Scholar]
- Guo, C.; Pleiss, G.; Sun, Y.; Weinberger, K.Q. On Calibration of Modern Neural Networks. In Proceedings of the 34th International Conference on Machine Learning, Sydney, Australia, 6–11 August 2017; Volume 70, pp. 1321–1330. [Google Scholar]
- Minderer, M.; Djolonga, J.; Romijnders, R.; Hubis, F.; Zhai, X.; Houlsby, N.; Tran, D.; Lucic, M. Revisiting the calibration of modern neural networks. In Advances in Neural Information Processing Systems 34; Curran Associates: Red Hook, NY, USA, 2021; pp. 15682–15694. [Google Scholar]
- Clopper, C.J.; Pearson, E.S. The Use of Confidence or Fiducial Limits Illustrated in the Case of the Binomial. Biometrika 1934, 26, 404–413. [Google Scholar] [CrossRef]
- Angelopoulos, A.N.; Bates, S.; Candès, E.J.; Jordan, M.I.; Lei, L. Learn then test: Calibrating predictive algorithms to achieve risk control. Ann. Appl. Stat. 2025, 19, 1641–1662. [Google Scholar] [CrossRef] [Scilit]
- Ringel, L.; Cohen, R.; Freedman, D.; Elad, M.; Romano, Y. Early Time Classification with Accumulated Accuracy Gap Control. In Proceedings of the 41st International Conference on Machine Learning (ICML 2024), Vienna, Austria, 21–27 July 2024; Proceedings of Machine Learning Research. Volume 235, pp. 42584–42600. [Google Scholar]
- Zhang, H.K.; Shen, Y.; Zhang, X.; Li, J.; Yang, Z.; Xu, Y.; Zhang, C.; Di, L.; Roy, D.P. Robust and Timely Within-Season Conterminous United States Crop Type Mapping Using Landsat Sentinel-2 Time Series and the Transformer Architecture. Remote Sens. Environ. 2025, 329, 114950. [Google Scholar] [CrossRef] [Scilit]
- Wang, Y.; Feng, L.; Zhang, Z.; Tian, F. An unsupervised domain adaptation deep learning method for spatial and temporal transferable crop type mapping using Sentinel-2 imagery. ISPRS J. Photogramm. Remote Sens. 2023, 199, 102–117. [Google Scholar] [CrossRef] [Scilit]
- Pham, V.-D.; Tetteh, G.; Thiel, F.; Erasmi, S.; Schwieder, M.; Frantz, D.; van der Linden, S. Temporally transferable crop mapping with temporal encoding and deep learning augmentations. Int. J. Appl. Earth Obs. Geoinf. 2024, 129, 103867. [Google Scholar] [CrossRef] [Scilit]
- Lin, C.; Zhong, L.; Song, X.-P.; Dong, J.; Lobell, D.B.; Jin, Z. Early- and in-season crop type mapping without current-year ground truth: Generating labels from historical information via a topology-based approach. Remote Sens. Environ. 2022, 274, 112994. [Google Scholar] [CrossRef] [Scilit]
- Ovadia, Y.; Fertig, E.; Ren, J.; Nado, Z.; Sculley, D.; Nowozin, S.; Dillon, J.; Lakshminarayanan, B.; Snoek, J. Can you trust your model’s uncertainty? Evaluating predictive uncertainty under dataset shift. In Advances in Neural Information Processing Systems 32; Curran Associates: Red Hook, NY, USA, 2019; pp. 13991–14002. [Google Scholar]
- Sainte Fare Garnot, V.; Landrieu, L. Panoptic Segmentation of Satellite Image Time Series with Convolutional Temporal Attention Networks. In Proceedings of the 2021 IEEE/CVF International Conference on Computer Vision (ICCV), Montreal, QC, Canada, 10–17 October 2021; pp. 4852–4861. [Google Scholar] [CrossRef] [Scilit]
- European Space Agency. Fusion Competition. Source Cooperative, 2023. Available online: https://source.coop/esa/fusion-competition/ (accessed on 16 September 2026).
- Pan, J.; Liu, Z.; Li, X.; Luo, X.; Huang, F.; He, M.; Qin, W.; Cai, Y.; Xiao, J.; Li, Y.; et al. An end-to-end dual backbone framework for UAV fish disease detection using optimized GateHCO feature fusion mechanism. Neural Netw. 2026, 203, 109140. [Google Scholar] [CrossRef] [Scilit]

Disclaimer/Publisher’s Note: The statements, opinions and data contained in all publications are solely those of the individual author(s) and contributor(s) and not of MDPI and/or the editor(s). MDPI and/or the editor(s) disclaim responsibility for any injury to people or property resulting from any ideas, methods, instructions or products referred to in the content. |
© 2026 by the authors. Licensee MDPI, Basel, Switzerland. This article is an open access article distributed under the terms and conditions of the Creative Commons Attribution (CC BY) license.