


Highlights
What are the main findings?
- The leaf-scale qL-PAR model can be coupled with SIF for simulating GPP of plantations.
- MLR model captures species-specific light-energy allocation strategies but has different performance in GPP simulation of plantations.
What are the implications of the main findings?
- Poplar plantations with a high photosynthetic rate can simulate canopy GPP using the simplified MLR-qL-PAR model.
- SIF-based GPP simulation needs to consider species-specific light-energy dissipation strategies.
Abstract
Solar-induced chlorophyll fluorescence (SIF) is a powerful proxy for photosynthesis, yet its quantitative relationship with gross primary productivity (GPP) varies considerably among ecosystems. The underlying mechanisms for this variability, particularly in structurally complex forests, remain poorly understood. Using tower-based SIF and eddy-covariance measurements from two contrasting plantation forests—a drought-tolerant Quercus variabilis and a fast-growing poplar—we investigated how species-specific light-energy allocation strategies influence SIF-GPP relationships and the performance of mechanistic light-reaction models. The key findings are as follows: (1) The photochemical mechanistic model substantially reduced the underestimation of GPP under high-light conditions. A simplified qL-PAR model, derived from leaf-level active fluorescence measurements, produced comparable performance to that of the full photochemical model, i.e., the MLR-NPQ method—a mechanistic light-response model with canopy SIF. (2) The MLR model captured seasonal light-energy partitioning dynamics across two plantations and revealed contrasting light-energy allocation patterns between the two plantation systems. Poplar prioritized photochemical efficiency (ΦP, averaging 0.41) to maximize carbon gain, whereas Q. variabilis invested more energy in NPQ and SIF for a photoprotective “safety-first” strategy. (3) However, MLR models exhibited inconsistent performance. For the poplar plantation, the model achieved higher accuracy (R2 = 0.83 at the daily scale and R2 = 0.65 at the half-hourly scale) than for the Q. variabilis plantation (R2 = 0.65 at the daily scale and R2 = 0.45 at the half-hourly scale). (4) The contrasting ΦP–ΦF relationships provide a physiological explanation for the species-specific performance of the SIF-based GPP models. For poplar, ΦP–ΦF maintained a tight linear relationship across a wide range of moderate-to-high PAR levels. In contrast, for Q. variabilis under high PAR (ΦP = 0.249), NPQ became saturated while SIF continued to rise, leading to a decoupling of the ΦP–ΦF relationship. Our results suggest that the contrasting light-energy allocation patterns observed at the two sites may contribute to the performance discrepancies in canopy-scale SIF-based GPP simulations. Our results collectively validate that a photochemical mechanistic framework advances the process-oriented simulation of photosynthetic energy partitioning in plantation canopies. These findings highlight the potential need to integrate species-specific ΦP–ΦF relationships to better constrain the competitive balance between carbon gain and photoprotective safety—a key uncertainty that must be reconciled for robust GPP retrievals over managed forests but requires further validation. These findings contribute to a mechanistic understanding of SIF–GPP relationships in tall forests and provide a reference for improving vegetation parameterization in regional-scale modeling applications where such ecosystems are represented.
1. Introduction
Plant photosynthesis is a fundamental driver of the terrestrial response to global climate change and rising atmospheric CO2 concentrations and constitutes a core component of nature-based climate mitigation strategies. During photosynthesis, the light energy absorbed by the photosystem reaction centers is partitioned into three competing pathways: photochemical energy conversion, non-photochemical quenching (NPQ), and emission as solar-induced chlorophyll fluorescence (SIF). Because SIF is emitted directly from the photosynthetic light reactions, it provides a direct and physiologically meaningful indicator of photosynthetic activity in plants.
The rationale for using SIF to simultaneously constrain carbon and water fluxes stems from the mechanistic coupling of photosynthesis and stomatal conductance. Through photosynthesis, vegetation assimilates atmospheric carbon dioxide, while stomatal regulation simultaneously controls the exchange of water vapor between leaves and the atmosphere. Owing to the close mechanistic linkage between SIF and photosynthetic processes [1], as well as the strong coupling between carbon assimilation and transpiration mediated by stomatal conductance [2,3], SIF can be used to infer key components of ecosystem carbon and water fluxes from a process-based perspective. Consequently, SIF offers a powerful observational constraint for the quantitative estimation of ecosystem productivity, terrestrial carbon sinks, and water cycling from regional to global scales [4,5,6].
Current approaches for estimating gross primary productivity (GPP) can be broadly classified into process-based models, light-use efficiency (LUE) models [7] and mechanistic models [8]. Among these, process-based models mainly include radiative transfer models, such as SCOPE, mSCOPE [9,10,11] and the BEPS model [12,13]. These models explicitly consider energy balance, radiative transfer and photosynthetic processes, making them powerful tools for investigating vegetation–atmosphere interactions under controlled conditions. However, accurate simulations require parameterization of species-specific physiological traits, biochemical properties, and canopy structural characteristics [9]. Consequently, extensive parameter calibration is often necessary, which limits model scalability and introduces substantial uncertainty in regional to global applications. LUE models have been widely adopted and have demonstrated strong performance in estimating ecosystem productivity from regional to global scales [14]. However, conventional LUE models depend on accurate specification of the maximum light-use efficiency (LUEmax) and environmental stress scalars [15]. On the other hand, the strong linear relationship between SIF and GPP at regional to global scales [16], as derived from remote sensing data, has been extensively documented. Nevertheless, such studies are often constrained by satellite resolution and revisit cycles [17], which further limit fine-scale GPP estimation and a nuanced understanding of the SIF–GPP relationship. While this linear correlation essentially reflects the principles underlying LUE models, at finer spatiotemporal scales—particularly at half-hourly to hourly resolutions over heterogeneous land surfaces—the SIF–GPP relationship often exhibits more complex nonlinear dynamics [18,19]. Due to their structural assumptions and inherent formulation, LUE-based models are generally unable to adequately capture or explain these complex nonlinear responses [20].
In contrast, mechanistic models explicitly represent photosynthetic and regulatory processes. These include the FvCB biochemical model and SIF-based mechanistic light-response (MLR model) frameworks [8]. The FvCB model provides a foundational description of photosynthetic carbon assimilation and forms the basis for leaf-to-ecosystem simulations of GPP and stomatal conductance [21,22]. More recently, SIF-based mechanistic models have emerged as promising approaches for linking radiative energy partitioning with photosynthetic regulation, offering new opportunities to bridge process understanding and large-scale carbon flux estimation.
Mechanistic light-response models explicitly couple the light and dark reactions of photosynthesis and induce SIF as a model constraint, thereby simplifying model structure and improving the stability and mechanistic interpretability of GPP estimates [8]. Recent studies have derived biophysically grounded nonlinear quantitative SIF and GPP within these frameworks. However, the practical application of such models is limited by the difficulty of obtaining physiological parameters—including the openness of photosystem II reaction centers (qL), NPQ and the ratio of PSII fluorescence to the total canopy SIF (fPSII), particularly when scaling from leaves to complex canopies [23]. Furthermore, existing evaluations of mechanistic light-response models have been conducted predominantly in agricultural ecosystems, with relatively few assessments in structurally and functionally complex forest systems. This imbalance constrains our ability to evaluate the general applicability of these models across tree species and limits mechanistic understanding of model performance differences among ecosystems.
China hosts the largest plantation area globally, and plantations play a crucial role in forestry management and ecosystem carbon sequestration [24]. As such, plantation carbon sinks serve as an important nature-based solution for achieving China’s carbon neutrality targets. Recent studies indicate that carbon sequestration in Chinese plantations increased significantly from 2005 to 2019, exhibiting pronounced spatiotemporal heterogeneity [25]. Consequently, accurately quantifying GPP in plantation ecosystems remains a major challenge. To date, continuous SIF observations for tall-stature plantations remain scarce, limiting robust evaluation of model performance and the attribution of differences among modeling approaches under varying biophysical processes, assumptions, and complex canopy structures. China’s vast plantation forests, representing contrasting functional types, provide an ideal platform to address this gap. Plantations such as the drought-tolerant Quercus variabilis and the fast-growing, high-productivity poplar embody opposite ends of the plant economic spectrum—a “safety” strategy versus an “efficiency” strategy. Understanding how these contrasting strategies modulate the SIF-GPP relationship is essential for accurate carbon accounting and sustainable forest management under climate change.
Consequently, we use multi-year eddy-covariance measurements and tower-based SIF observations from two representative plantation ecosystems. Integrating multi-scale observations with a canopy-scale mechanistic SIF model, we reveal that the species-specific ΦP–ΦF relationship fundamentally governs the performance discrepancies in GPP simulations—a finding critical for constraining model uncertainties across contrasting forest ecosystems. Specifically, the objectives of this study are to:
- (1)
- Evaluate SIF–GPP model performance at half-hourly and daily scales, and link performance discrepancies to seasonal canopy energy partitioning across two plantations; and further quantify key parameter sensitivities to radiation and temperature, clarifying how environmental variability shapes model applicability.
- (2)
- Test whether species-specific light-use strategies—particularly the trade-off between carbon assimilation and photoprotective dissipation (ΦP–ΦF relationship and NPQ)—underlie the inter-specific variability in SIF-derived GPP.
Collectively, these analyses establish an eco-physiological basis for satellite-based regional carbon accounting of plantations and offer actionable insights for adaptive silviculture to enhance long-term carbon sequestration.
2. Materials and Methods
2.1. Site Information
This study was conducted at two long-term field observation sites located in plantation ecosystems: a Quercus variabilis plantation (SPL) and a poplar plantation (YS) (Figure 1). The SPL site is located in the southern part of Jiyuan City, Henan Province (35°01′45″N, 112°28′08″E; 410 m), while the YS site is situated in Shangqiu City, Henan Province (34°4′33″N, 115°0′42″E; 100 m). Both sites are characterized by a semi-arid monsoon climate with warm temperatures and concentrated precipitation during the growing season. Compared with the SPL site, the YS site receives higher annual precipitation.
Figure 1.
Location of the Quercus variabilis and poplar plantation flux sites and schematic diagrams of the growing-season field plots. (a,b) Locations of the two plantation sites in China and the Yellow River Basin, respectively, where green dots denote the poplar plantation and the red triangle denotes the Q. variabilis site; (c,d) schematic diagrams of the growing-season plot at the poplar plantation and Q. variabilis plantation, respectively.
Soil conditions differ remarkably between the two sites. The SPL site is located in a rocky mountainous area with shallow soil layers, low fertility, and limited water-holding capacity. In contrast, the YS site has sandy loam soil with greater depth and higher water retention capacity. In addition, the groundwater table at the YS site is significantly higher than at the SPL site. Detailed climate and soil characteristics for these sites can be found in the study by Y. Zhou et al., 2022 [26]. During the study period, the stand ages of the Q. variabilis and poplar plantations were approximately 50 and 20 years, respectively. The mean heights were 12 m at the SPL site and 23 m at the YS sites. The average leaf area index (LAI) during the growing season was 2.4 for the Q. variabilis plantation and 4.5 for the poplar plantation.
2.2. Measurements and Data Processing
2.2.1. Eddy-Covariance and Auxiliary Measurements
Eddy-covariance (EC) systems were deployed at both Q. variabilis (SPL) and poplar (YS) plantation sites. Each system consisted of an open-path infrared gas analyzer (Li-7500) and a three-dimensional sonic anemometer (CSAT3). The EC systems were installed at heights of 36 m and 30 m for the SPL and YS sites, respectively. Meteorological variables including air temperature, humidity, photosynthetically active radiation (PAR), wind speed, soil moisture, and soil temperature were measured concurrently using standard sensors. Net radiometers and tipping bucket rain gauges were installed at 36 m (SPL) and 30 m (YS). All meteorological sensors were connected to CR1000 data loggers and recorded at 10-minute intervals. At the YS site, the instrumentation configuration was similar, with minor differences in installation height. The EC system was mounted at 30 m. Precipitation was measured simultaneously at 2 m and 30 m, while PAR and total radiation were measured at 17 m and 23 m, respectively. Detailed parameter specifications are provided in Cheng et al. (2022) [18].
2.2.2. SIF Measurements
SIF observations at the Quercus variabilis plantation were conducted from 1 January 2020 to 31 December 2023, while observations at the poplar plantation lasted from 1 April 2021 to 31 December 2022. Measurements were performed daily from 6:30 to 18:30 local time at 30-minute intervals, simultaneously recording canopy spectral data, eddy-covariance flux data, and gradient meteorological data. The spectral data, including incoming solar radiation spectra and canopy-reflected spectra, were acquired using an automated Sun-Induced Chlorophyll Fluorescence observation system (AutoSIF-1, Bergsun Inc., Beijing, China). The system was installed on an observation tower platform at 20 m above ground (approximately 10 m above the canopy), with an observation radius of about 2.2 m. Its core component is a high-precision spectrometer (QE65, Ocean Optics Inc., Dunedin, FL, USA; later upgraded to QE-Pro, Ocean Optics, with a signal-to-noise ratio of 1000, spectral range 650–840 nm, spectral resolution ~0.17 nm, and sampling interval ~0.07 nm). An electronic switch alternately connected two optical fibers to the spectrometer: one fiber terminated with a cosine corrector (CC3-3-UV-S, Ocean Optics) to measure downward solar radiation; the other fiber (bare, field of view 25°) measured upward-reflected radiation from the canopy. The system operated in a “sandwich” measurement mode—recording solar radiation, then rapidly switching to canopy radiation, and back to solar radiation—to minimize errors from rapid changes in illumination. The integration time was dynamically adjusted according to ambient light intensity to optimize the signal-to-noise ratio. Canopy SIF in the red (around 687 nm) and far-red (around 760 nm) bands was retrieved using the Spectral Fitting Method (SFM) [27]. The system also provided continuous canopy reflectance spectra from 650 to 800 nm.
2.2.3. Data Processing and Quality Control
Flux Data
Raw high-frequency (10 Hz) eddy-covariance (EC) data were processed at 30 min intervals using EddyPro software (Version 7.0.4). Standard processing steps included: (1) spike removal (threshold > 3.5 standard deviations from the local mean); (2) double coordinate rotation to align the coordinate system with local streamlines; (3) Webb–Pearman–Leuning (WPL) correction for density fluctuations; and 4) spectral corrections for low- and high-frequency losses following Aubinet et al. (2012) [28]. Subsequent flux post-processing followed the quality assurance and control protocols of the Integrated Carbon Observation System (ICOS).
To ensure data quality, several filtering criteria were applied. First, flux data measured during precipitation events were excluded to avoid sensor wetting artifacts. Second, for nighttime data (incoming shortwave radiation < 10 W m−2), only periods with friction velocity (u*) above a site-specific threshold of 0.35 m s−1 were retained, thereby minimizing biases due to insufficient turbulent mixing [29]. Third, only half-hourly fluxes with a quality flag of 0 (high-quality) or 1 (medium-quality, but usable for most applications)—as assigned by EddyPro’s internal quality assessment (based on steady-state and integral turbulence characteristics tests [30]—were retained for further analysis.
Gap-filling and flux partitioning were performed using the REddyProc package [31] (https://github.com/bgctw/REddyProc, accessed on 18 January 2018). Specifically, the sEddyProc_sMDSGapFillAfterUstar function was applied, which applied a u*-filtering step using the threshold determined above, and then filled remaining gaps in net ecosystem exchange (NEE), gross primary production (GPP), and ecosystem respiration (RECO) using the Marginal Distribution Sampling (MDS) algorithm [32]. The quality of gap-filled data is indicated by the NEE_uStar_fqc flag: 0 = good original data, 1 = gap-filled data, and values >1 = poor-quality data. Only records with NEE_uStar_fqc ≤ 1 were used in subsequent analyses. Flux partitioning into GPP and RECO was performed using the daytime light-response partitioning-based method described by Lasslop et al. (2010) [33].
where NEE denotes net ecosystem exchange, and RE denotes ecosystem respiration.
SIF Data
For quality control of SIF data, we did the following: raw spectra were processed by dark-current subtraction and radiometric calibration. Only SIF retrievals with spectral fitting residuals < 0.02 W m−2 sr−1 nm−1 were retained. To exclude periods with unstable illumination, which can bias SIF estimates, half-hourly intervals with a coefficient of variation (CV) of PAR (measured at 1 Hz) exceeding 0.15 were flagged as low-quality and removed from further analysis [18]. Furthermore, the spectrometer was calibrated biweekly against a spectral reference panel under clear-sky conditions to correct for sensor degradation, and the optical fibers and cosine corrector were cleaned weekly to prevent dust and moisture contamination. The instrument’s internal temperature was continuously logged; data acquired when the internal temperature fell outside the range of 15–35 °C were excluded.
During the observation period, leaf area index (LAI) was measured destructively or using plant canopy analyzers (e.g., LAI-2200C, LI-COR, Lincoln, NE, USA) at approximately monthly intervals, and the normalized difference vegetation index (NDVI) was calculated from the observed canopy reflectance spectra (using the 650 nm and 800 nm bands) as an auxiliary structural proxy. No additional quality filtering was applied to LAI and NDVI beyond the removal of physically unrealistic values (LAI < 0 or LAI > 8; NDVI < –0.1 or NDVI > 1.0). NDVI is a robust indicator of vegetation growth conditions and canopy structure, particularly reflecting changes in fractional vegetation cover. It can also be used to track alterations in canopy structure induced by prolonged environmental stress. Numerous studies have demonstrated a strong linear relationship between NDVI and both chlorophyll content and vegetation productivity. The NDVI is calculated as follows:
where ρNIR is the reflectance in the near-infrared band, and ρRED is the reflectance in the red band. The tower-based spectral measurements above the canopy provided continuous reflectance information across the wavelength range of 650–850 nm. In this study, ρNIR and ρRED were defined as the mean reflectance over the 770–790 nm interval and the 650–680 nm interval, respectively.
2.2.4. Mechanistic Light-Reaction Model
The light-response mechanistic model based on SIF provides a process-based approach for estimating GPP while maintaining mechanistic interpretability (Figure 2). The SIF mechanistic model has been comparatively studied in numerous agricultural ecosystems and a limited number of forest ecosystems, demonstrating relatively superior model performance. This indicates the feasibility of estimating GPP based on SIF mechanistic processes. The model was initially proposed by Gu et al. (2019) [8] and later structurally improved at the canopy scale by Liu et al. (2022) [23]. The fundamental relationship between GPP and SIF at the canopy scale can be expressed as:
where Cc represents the partial pressure of CO2 at the chloroplast carboxylation point, and Γ* is the CO2 compensation point in the absence of mitochondrial respiration. ΦPSIImax denotes the maximum quantum efficiency of photosystem II, which is 0.83 under non-stress conditions with sufficient water supply. KDF is the ratio of the first-order rate constant for thermal dissipation (KD) to that for fluorescence emission (KF). While Gu et al. (2019) [8] used KDF = 19, our study adopts the newest estimate of KDF = 9 [23]. SIFtot-PSII refers to the total canopy-observed SIF from photosystem II, after completing the necessary scaling and spectral conversion processes. Here, fPSII denotes the parameter representing the relative contribution of PSII fluorescence to the total canopy SIF at 760 nm, while ε is a parameter that governs the relative contributions of PSI and PSII fluorescence. According to Bacour et al. (2019) [34], the parameters of m1 and m2 at 760 nm are 0.00561 and 0.00917, respectively. qL represents the openness of photosystem II reaction centers within the chloroplasts, which is modeled based on extensive fluorescence light-response curves coupled with leaf-level gas-exchange data of each tree species. The light-response mechanistic model coupled with PAR is expressed as:
Figure 2.
Schematic diagram of the overall framework for simulating gross primary production (GPP) in the two studied plantation forest ecosystems. The framework couples both a mechanistic light-reaction model of solar-induced chlorophyll fluorescence (SIF) and a light-use efficiency (LUE) model with the Farquhar–von Caemmerer–Berry (FvCB) biochemical model. Here, SIF_TOC_760 denotes the directly observed vegetation SIF at 760 nm above the canopy. The yellow-shaded components illustrate two alternative parameterization schemes (qL-based and NPQ-based) within the SIF light-reaction model for quantifying the linear electron transport rate during the light-reaction phase. The purple-shaded region corresponds to the LUE-model simulation of GPP, which is further constrained by coupling with the FvCB model to regulate ΦP.
Since qL cannot be directly observed at the canopy scale, we adopted the modeling framework proposed by Liu et al. (2022) [23]. By utilizing the ratio of KP to KF, the original mechanistic model formulation was transformed into an equation that does not require qL:
Here, NPQ was simulated using the C3 plant’s default parameterization from the model study by Bacour et al. (2019) [34]. Non-photochemical quenching (NPQ) was modeled as a function of air temperature, photosynthetically active radiation (PAR), and χ, with the empirical parameters a = 16.042, b = 5.74, c = 2.167, d = −0.014, e = −0.00437 and f = 0.00576, respectively. The variable χ is defined as 1 minus the ratio of ΦPSII to Φpmax, where Φpmax was fixed at 0.8. ΦPSII represents the actual photochemical efficiency corresponding to the electron transport rate, which is derived from calculations based on the FvCB model [35]. This parameter reflects the limitation state of plant photosynthesis—whether it is regulated by RuBP regeneration or Rubisco enzyme activity [36]. It is noteworthy that, within the FvCB model framework, the maximum carboxylation rate (Vcmax) is derived from the base value at 25 °C (Vcmax25) as a function of air temperature. The Vcmax25 values were prescribed as 37 and 70 μmol m−2 s−1 for Quercus variabilis and Populus, respectively. The maximum electron transport rate (Jmax) was then calculated using the linear relationship between Vcmax and Jmax. Specifically, for C3 plants, the Jmax25/Vcmax25 ratio exhibits a linear correlation with air temperature, with a slope of 0.035 and an intercept of 2.59 from Bacour et al. (2019) [34]. Notably, the actual photochemical efficiency is also integrated into the light-use efficiency (LUE) model coupled with light utilization:
Among these, PAR represents photosynthetically active radiation above the canopy, and fPAR denotes the fraction of absorbed photosynthetically active radiation by the green parts of the canopy. The value 0.5 corresponds to the empirical allocation ratio of absorbed light energy between photosystem I (PSI) and photosystem II (PSII). The parameter Cc is derived with reference to the iterative calculation process described in the FvCB model [37], obtained after coupling with stomatal conductance constraints. The CO2 compensation point (Γ*) is formulated as a function of air temperature [38], calculated as follows:
2.2.5. Leaf-Scale Active Fluorescence and Gas-Exchange Measurements
Leaf-scale active fluorescence parameters—including qL, ΦPSIImax, and fPSII—were measured using a LI-6400XT portable photosynthesis system equipped with a LI-6400-40 fluorescence leaf chamber. For each species, five to seven fully expanded, sun-exposed mature leaves were selected from the upper canopy, as canopy SIF is predominantly contributed by these uppermost leaves. During all measurements, the CO2 concentration inside the leaf chamber was maintained at ambient levels (approximately 400 ppm), consistent with the prevailing atmospheric conditions, while chamber temperature and humidity were synchronized with the external environment. For both species, we measured the fluorescence light-response curves under varying photosynthetically active radiation (PPFD) and the diurnal courses of leaf fluorescence.
Throughout the experimental period, all target leaves were thoroughly dark-adapted prior to dawn. A multiphase saturating flash (PAR = 9000 μmol m−2 s−1) was applied to each leaf individually to determine the maximum (Fm) and minimum (F0) dark-adapted fluorescence. This procedure was consistently repeated for every measurement point across both the light-response and diurnal protocols. For the light-response curves, a PPFD gradient of 2000, 1800, 1600, 1400, 1200, 1000, 800, 600, 400, 200, 100, and 0 μmol m−2 s−1 was applied. After fluorescence and gas-exchange signals had reached steady state under each light level, the steady-state fluorescence yield (Fs) was recorded, followed by the application of an identical multiphase saturating flash to obtain the light-adapted maximum fluorescence (Fm’). The minimum fluorescence yield in the light-adapted state (F0′) was subsequently determined after applying a far-red light pulse to excite photosystem I (PSI), thereby facilitating electron transfer from PSII to PSI and ensuring full oxidation of PSII reaction centers. Concurrent measurements included net photosynthetic rate (An), transpiration rate, leaf temperature (Tleaf), and sample cell CO2 concentration (Cs). From these, stomatal conductance (gsw), intercellular CO2 concentration (Ci), and leaf-to-air vapor pressure deficit (VPDleaf) were subsequently calculated.
It is important to note that while these fluorescence yields are primarily attributed to PSII emission, a fraction of the steady-state signal (approximately 24%) can originate from PSI fluorescence at the leaf level [39], with this contribution reaching up to 45% in the near-infrared O2-A band region [40]. Accordingly, the parameters qL, ΦPSIImax, and fPSII were calculated following the protocols of Kramer et al. (2004) [41] and Jia et al. (2023) [42].
In total, 387 valid observations were collected during the rain-free period from July 5 to 12 September 2025, and incorporated into the final analysis. We used the mgcv package in R 4.1.3 to fit the response curve of ΦP to ΦF. Using the local second-order derivative features, the fitting function curve is retrieved from both ends of ΦP to obtain the breakpoints of ΦP. The leaf-level fluorescence and gas-exchange measurements were conducted in 2025 to characterize the general qL-PAR response function of the two species. They were not intended to represent the year-specific physiological state during the tower observation period. Because leaf-level qL measurements were available only for 2025, the qL-PAR relationship should be considered a first-order approximation. Interannual variation in water availability, temperature, leaf age, and physiological acclimation may alter absolute qL values. Future studies should establish multi-year leaf-level observations to quantify this uncertainty.
3. Results
3.1. Seasonal Dynamics of SIF, GPP, NDVI and Meteorological Factors
Figure 3 presents the seasonal dynamics of meteorological variables and canopy structure for the Q. variabilis and poplar plantations. At the Q. variabilis plantation site, air temperature exhibited similar seasonal patterns across different years, with the maximum temperature (Ta) occurring in July (35 °C) and the minimum in January (−7 °C). Incident radiation showed pronounced seasonal variability during 2020 to 2023. During the peak growing season (May–July), radiation was higher in 2022–2023 than in 2020–2021 and exhibited a seasonal lag relative to air temperature.
Figure 3.
Seasonal dynamics of key environmental variables and NDVI in Quercus variabilis (left column: panels (a,c,e,g)) and poplar (right column: panels (b,d,f,h)) plantations. Panels (a,b): air temperature (black solid line), total radiation (DR, blue solid line); panels (c,d): vapor pressure deficit (VPD, black dashed line); panels (e,f): rain (gray bars). Panels (e,f): volumetric soil water content (black solid line); panels (g,h): NDVI (gray solid circles).
Annual precipitation from 2020 to 2023 was 495.78 mm (2020), 1193 mm (2021), 534 mm (2022), and 708 mm (2023), respectively. Rainfall was concentrated in the growing season (June–September), accounting for 60%, 83%, 68%, and 44% of the annual totals. Soil moisture responded rapidly to precipitation events, with mean maximum and minimum values of 18%, 25.6%, and 11.6%, respectively. The mean NDVI of the Q. variabilis plantation was 0.86 during the growing season (April–October) and 0.34 during the non-growing season (November–March), with a maximum value of 0.93. Consistent with previous findings, the Q. variabilis plantation exhibited high sensitivity to drought stress during spring and autumn [26].
At the poplar plantation site, air temperature also displayed similar interannual seasonal variability. Maximum temperatures were recorded in July and June, reaching 37 °C in 2021 and 33 °C in 2022, while the minimum temperatures occurred in December and January, at −22 °C (2021) and −8 °C (2022), respectively. Incident radiation exhibited distinct seasonal variation (unimodal curve) between 2021 and 2022 and lagged behind air temperature at the seasonal scale. Annual precipitation in 2021 and 2022 was 792 mm and 486 mm, respectively, with the majority of rainfall concentrated in June–September, accounting for 83% and 76% of the annual totals. Soil moisture responded quickly to precipitation. Over the two years, the average, maximum, and minimum soil moisture contents were 8.4%, 27%, and 4.5%, respectively. The mean NDVI during the growing and non-growing seasons was 0.71 and 0.20, respectively, with a maximum NDVI of 0.86.
Figure 4 showed the seasonal and diurnal variation in GPP and total canopy SIF in Q. variabilis and poplar plantations. Both GPP and SIF at the two plantation sites showed consistent seasonal trends, increasing with rising NDVI and air temperature until canopy structure stabilized, then gradually declining in the late growing season. At the Q. variabilis site, notably interannual differences were observed in the SIF–GPP relationship, particularly during peak growing season. An apparent decoupling between SIF and GPP occurred in June–July 2020 and May–September 2022. In contrast, both SIF and GPP in the poplar plantation peaked in May 2021 and exhibited nearly identical temporal patterns, indicating that SIF closely tracked photosynthetic dynamics in this ecosystem.
Figure 4.
Seasonal (a,b) and diurnal (c,d) variation in canopy SIF (blue dotted line) and GPP (red dotted line) in Quercus variabilis ((a,c): 2020–2023) and poplar ((b,d): 2021–2022) plantations. Diurnal panels show half-hourly means across all available days.
Figure 5C,D show the diurnal patterns of GPP and total canopy SIF. At the Q. variabilis site, both variables followed a bell-shaped diurnal curve from 2020 to 2023, with peak GPP values of 13.21 μmol m−2 s−1 and corresponding SIF peaks of 2.16 mW m−2 nm−1 sr−1. The GPP–SIF relationship showed distinct interannual differences in hysteresis behavior.
Figure 5.
Analysis of simulated GPP performance of different models in a Quercus variabilis plantation at the half-hour scale (A,C,E) and the daily scale (B,D,F). The half-hour scale PAR data is used for color mapping. The black solid line is the 1:1 line, and the red solid line is the regression fit. GPP_LUE represents the total primary productivity calculated based on the framework of light-energy utilization. GPP_EC is the total primary productivity after the flux component is separated. GPP_SIF_MLR represents the total primary productivity obtained through the simulation of SIF and the light-reaction mechanism process. GPP_qL_PAR represents the total primary productivity simulated by the PAR and photoreaction mechanism processes.
Similarly, diurnal variations in GPP and SIF in the poplar plantation exhibited a unimodal pattern. Peak GPP occurred at approximately12:00 in both years, with values of 15.12 μmol m−2 s−1 in 2021 and 11.71 μmol m−2 s−1 in 2022. Peak SIF occurred slightly earlier or later at 11:30 in 2021 and 12:30 in 2022, with magnitudes of 1.03 mW m−2 nm−1 sr−1, respectively. A pronounced hysteresis effect in the GPP–SIF relationship was evident in 2021, with a stronger lag than that observed in the Q. variabilis site.
3.2. Performance Evaluation and Comparison of SIF-Based Photosynthetic Models
Figure 5 and Figure 6 showed the performance of three GPP simulation approaches—based on the MLR_SIF, MLR_PAR, and FvCB and LUE frameworks at half-hourly and daily temporal scales. At the Q. variabilis site, half-hourly simulations explained 45%, 46%, and 63% of the variance (R2) in EC-derived GPP, with RMSE values of 5.33, 5.03, and 1.91, respectively. At the daily scale, the explained variance increased to 60%, 63%, and 67% of the variation in GPP, with corresponding RMSE values of 2.08, 2.15, and 1.24, and the regression slope (0.75, 0.65, 0.41), indicating substantial differences in model bias, reflecting varying degrees of GPP underestimation and overestimation.
Figure 6.
Performance analysis of different models for simulating GPP in poplar planted forests at the half-hour scale (A,C,E) and the daily scale (B,D,F). The half-hour scale PAR data is used for color mapping. The black solid line is the 1:1 line, and the red solid line is the regression fit.
Similarly, at the poplar plantation, the three models explained 83%, 82%, and 81% of the daily GPP variation, respectively. However, model performance declined at the half-hourly scales, with R2 values of 0.65, 0.80, and 0.79 at the half-hourly scale. Under high PAR conditions, the GPPEC-LUE model showed saturation effects and significant underestimation in both plantation ecosystems. In contrast, the mechanism-based SIF model maintained a strong linear relationship even under high-light conditions, suggesting that the SIF-based modeling framework can improve the understanding of GPP–SIF relationships under complex environmental conditions.
NDVI was used as a proxy for canopy structural dynamics, allowing the growing season to be divided into two stages: (1) a stable, closed-canopy stage corresponding to peak growth, and (2) a rapid structural change stage during early and late growth. An NDVI threshold of 0.8 was identified for both plantations.
To further assess environmental controls on model performance, air temperature (Ta) and photosynthetically active radiation (PAR) (excluding PAR < 20 µmol m−2 s−1) were classified into four regimes: high PAR (≥800 µmol m−2 s−1 for Q. variabilis and ≥1000 µmol m−2 s−1 for poplar); low PAR (<800 µmol m−2 s−1 for Q. variabilis and <1000 µmol m−2 s−1 for poplar); high temperature (Ta ≥ 25 °C); and moderate temperature (Ta < 25 °C) (Table 1). At the half-hour scale, all models performed better under lower temperature conditions and low PAR, showing higher R2 values, slopes closer to one, and lower root mean square errors (RMSE). It is worth noting that the performance differences among models were more pronounced at the Q. variabilis site than at the poplar site in GPP simulations. Moreover, under all conditions, the LUE-based models consistently produced lower slopes than the mechanistic models, indicating a systematic underestimation of GPP. Although mechanistic models effectively corrected the GPP saturation effect under high-light conditions, this improvement was accompanied by increased RMSE (Table 1).
Table 1.
The simulation performance of the half-hour scale LUE model, MLR model and qL_MLR model for the planted forest ecosystems of Quercus variabilis and poplar under different Ta(air temperature) and PAR(photosynthetically active radiation) conditions. Including detailed information such as R2, RMSE and slope. The threshold value of PAR for poplar and Quercus variabilis was 1000 and 800, respectively.
Additionally, GPP simulations based on estimating the quantum yield of photosystem II (qL) using PAR and then applying a light-response mechanistic modeling framework showed performance largely consistent with simulations that did not incorporate qL, exhibiting slightly higher slopes and comparable R2 values across different Ta and PAR environmental groupings.
3.3. Responses of Canopy-Scale fPSII to PAR and Temperature
The mechanistic light-response modeling framework involves numerous parameters, with fPSII being the key parameter influencing scale conversion. During the growing season, the fPSII values for Q. variabilis and poplar plantations were 0.51 (±0.06) and 0.54 (±0.08) (Figure 7), respectively. From April to October, fPSII increased with rising air temperature and radiation before reaching a relatively stable plateau. Overall, across a broad air temperature range (–10 to 26 °C), fPSII exhibited a positive relationship with temperature in both species. However, the temperature inflection point for fPSII occurred at a lower threshold in poplar compared with Q. variabilis. Furthermore, the response of fPSII to photosynthetically active radiation (PAR) showed a strong negative correlation within the range of 100–500 µmol·m−2·s−1. Notably, when PAR exceeded 600 µmol·m−2·s−1, fPSII of Q. variabilis generally stabilized, whereas for poplar, the fPSII inflection point began to level off around 1000 µmol·m−2·s−1. For PAR < 600 µmol·m−2·s−1, the decline in fPSII was much greater in Q. variabilis than in poplar plantations, with fPSII rapidly entering a plateau phase and stabilizing between 0.4 and 0.5.
Figure 7.
The responses of fPSII to air temperature and PAR in Quercus variabilis and poplar plantations. Among them, (a,b) were poplar plantations; (c,d) were plantations of Quercus variabilis.
3.4. Seasonal Variability of Key Parameters in the MLR Model
Within the mechanistic model framework, a KDF value of nine was adopted, corresponding to fixed Kd and Kf values of 0.9 and 0.1, respectively. Under the prior condition that the sum of the four quantum yields equals one, this directly leads to dynamic regulation of ΦP and ΦN during the growing season (Figure 8). Both ΦP and ΦN exhibited opposite seasonal variation patterns in the two plantation ecosystems, with ΦP significantly higher in poplar than in Q. variabilis, reaching magnitudes of 0.41 (poplar: ±0.16) and 0.29 (Q. variabilis: ±0.13), respectively. We observed that during the growing season from April to October (2021), ΦF and ΦD accounted for relatively small proportions in Q. variabilis and poplar plantations, with values of 0.013, 0.016 and 0.12, 0.15, respectively. Additionally, the ratios of ΦP to ΦN were 0.14 and 0.45, which align with the photosynthetic and carboxylation capacities as well as the survival strategies of the two species. Moreover, the diurnal variation characteristics of NPQ and ΦP generally showed a competitive trade-off relationship: NPQ was higher under conditions of high PAR and temperature, while ΦP was relatively lower. This phenomenon largely indicates that the capacity allocation or competitive relationships within the mechanistic model framework are consistent with fundamental principles.
Figure 8.
Seasonal variations in the simulated four quantum yields (Φ) for the light-energy partitioning of Q. variabilis (a) and poplar (b) plantations: fluorescence (ΦF, red), nonradiative decay (ΦD, gray), nonphotochemical quenching (ΦN, blue), and photosynthesis (ΦP, green). Here we used data from 2021 for both sites based on the MLR model.
3.5. Leaf-Scale Mechanisms Governing Excitation Energy Allocation Within Light Reactions
Figure 9 showed the relationship between ΦP and ΦF at the leaf scale of Q. variabilis and poplar, and the corresponding critical thresholds. Under identical light conditions, the critical ΦP thresholds for Q. variabilis and poplar converged at 0.672 and 0.679, respectively, despite species-specific differences in water–carbon trade-off strategies. These values are broadly consistent with those reported by Maguire et al. 2020 [43] (0.757 and 0.744) for two coniferous species, but diverge markedly from the convergence point of ΦP ≈ 0.60 proposed by van der Tol et al. (2014) [44], Porcar-Castell et al. (2014) [45], and Magney et al. (2020) [46]. However, under high-light intensities (low ΦP range), the ΦP–ΦF relationship differed substantially between the two species. Poplar exhibited no clear turning point; instead, it remained in the second stage of the NPQ phase across a broad range of moderate-to-high light, displaying a consistent positive ΦP–ΦF correlation with increasing PAR. In contrast, Q. variabilis transitioned into the third NPQ stage under high-light conditions, where ΦF increased with light intensity, and exhibited a distinct ΦP breakpoint at 0.249 within the moderate-to-high-light range. Overall, the light-response and energy allocation dynamics of SIF in Q. variabilis are more complex than those in poplar, with evidence of NPQ saturation in the former but not in the latter. Our results further demonstrate that light conditions primarily drive the dynamic changes in quantum efficiency during the light reactions, while the coordinated ΦP–ΦF responses vary significantly among tree species.
Figure 9.
The relationship between the leaf-scale ΦF-ΦP quantum yield of two tree species, Q. variabilis and poplar. The blue curve represents the fitted curve of the GAM model, the gray shaded area indicates the 95% confidence interval band, and the red part shows the extreme points of the curve’s turning.
4. Discussion
4.1. Decoupling of SIF-GPP and Species-Specific Light-Energy Allocation Strategy
The relationship between SIF and GPP in the Q. variabilis and poplar plantation ecosystems exhibited generally consistent covariation patterns during the study period, indicating that SIF can be used to characterize the dynamics of GPP. However, a decoupling between SIF and GPP trends was observed in the Q. variabilis plantation from June to July 2020, and a similar opposing trend occurred in the poplar plantation in June 2021. Notably, during these decoupling periods, vapor pressure deficit (VPD) and air temperature (Ta) remained consistently high, suggesting that atmospheric aridity was the potential driver of the SIF–GPP decoupling.
The decoupling phenomenon was more pronounced in spring for the Q. variabilis plantation. We attribute the difference in the degree of SIF–GPP decoupling between Q. variabilis and poplar to differences in their photosynthetic responses to meteorological factors and to the drought characteristics of the two sites. Although poplar is more sensitive to drought, Q. variabilis leaves possess morphological adaptations such as a thick cuticle and well-developed palisade tissue, as well as small, isolated vessel elements that help resist embolism under drought stress, contributing to the plant’s high drought tolerance [47]. On the one hand, Q. variabilis plantations are more prone to spring and autumn droughts, whereas poplar plantations generally have access to more adequate groundwater. Furthermore, previous studies have shown that SIF in both vegetation types exhibits a linear relationship with photosynthetically active radiation (PAR), while GPP in Q. variabilis saturates under high PAR, leading to a nonlinear SIF–GPP relationship [18].
Differences exist between poplar and Q. variabilis plantations in the responses of fPSII, ΦP, and NPQ to light intensity, with the most significant differences occurring in the moderate PAR range of 100–600 µmol m−2 s−1. This range represents the most common light conditions in many natural habitats, such as forest gaps and under the canopy; therefore, these differences are central to understanding the two species’ light adaptation and carbon sequestration strategies. Q. variabilis and poplar represent opposite ends of the spectrum in terms of plant light adaptation and resource allocation, employing distinct carbon fixation strategies.
In the Q. variabilis plantation, before light intensity reaches damaging thresholds, a significant portion of excitation energy is diverted away from PSII, likely toward PSI or enhanced thermal dissipation (NPQ), to cope with excessive light. Maintaining relatively stable ΦP and NPQ under high PAR may represent an optimal balance between safety and efficiency for its photosynthetic apparatus (Figure 9). This implies that it retains considerable photochemical capacity for carbon fixation while keeping excess risk at a low level. This explains the narrow regulation range of ΦPSII under high-light conditions: its system enters a “fixed-configuration” defensive mode even at moderate light intensities, leaving limited room for further adjustment.
In contrast, poplar adopts a carbon sequestration strategy that maximizes photosynthetic production efficiency. From initial to intermediate increases in light intensity, poplar tends to maintain higher ΦP to maximize light harvesting and electron transport efficiency, supporting a higher potential photosynthetic rate. Significant adjustments in ΦP and NPQ occur only as light approaches the saturation point. This indicates that its system possesses a higher tolerance threshold and more sophisticated real-time regulatory capacity, allowing it to withstand greater light pressure without immediately initiating strong energy redistribution. This is consistent with the plant’s higher light saturation point.
4.2. The ΦP–ΦF Relationship Governs the Performance Differences in Mechanistic Models Between Two Plantations—From Phenomenon to Physiological Mechanism
Based on long-term SIF and eddy-covariance observations from two plantation ecosystems and the application of a mechanistic framework, significant differences were identified in the simulation of GPP between poplar and Q. variabilis plantations. The model exhibits lower interpretability in the Q. variabilis plantation. However, this does not imply that the mechanistic model is invalid. A plausible explanation for this phenomenon is that the current light-reaction-based framework does not fully capture the GPP dynamics and underlying physiological limiting processes in drought- and semi-drought-prone plantation ecosystems.
The classic light-use efficiency (LUE) model coupled with the Farquhar–von Caemmerer–Berry (FvCB) biochemical model has been widely adopted in numerous land surface process models to simulate photosynthetic mechanisms centered on dark reactions [48,49]. However, under high PAR conditions, vegetation photosynthetic chemical efficiency remains consistently low, leading to pronounced saturation effects and underestimation of photosynthesis when applying the LUE model—a limitation well acknowledged in the literature [50].
SIF, originating directly from the photosynthetic process, serves as an effective tool for quantifying GPP and can significantly simplify the input requirements of complex mechanistic models. Building on the research frameworks of Gu (2019) [8] and Liu (2022) [23], our results further confirm that an SIF-based light-reaction mechanistic model can mitigate GPP underestimation and saturation effects under high light. Our study demonstrates that a simplified parameterization of the photochemical opening coefficient (qL), integrated with leaf-level fluorescence and gas-exchange measurements within the mechanistic model framework, achieves performance comparable to that of the non-qL parameterized mechanistic light-response (MLR) model. This indicates that leaf-level qL response patterns can be effectively scaled to simulate canopy-level plantation GPP, a finding validated across multiple temporal scales in both plantation ecosystems.
The MLR model incorporates a more comprehensive dynamic photochemical and photoprotective regulatory mechanism. However, it still lacks explicit representation of combined high-light and water-stress interactions. Consequently, although the MLR model corrects for saturation-related underestimation, it still risks overestimating GPP under co-occurring high-light and drought stress. The performance of the model under the optimal temperature is superior to that under high-temperature stress, which may be related to the responses of the photoreaction enzyme activity and the dark-reaction carboxylation caused by high temperature. The mechanistic model framework should be improved in the future.
For SIF-based light-reaction models, potential mechanisms leading to GPP overestimation may include: (1) From an energy allocation perspective: under prolonged high-temperature and high-radiation conditions, decreased photosynthetic efficiency, saturated NPQ, and a linear increase in SIF with radiation can decouple the SIF–GPP relationship [51]. (2) From a drought-stress perspective: differences in plant hydraulic traits—with poplar tending toward isohydric behavior and Q. variabilis exhibiting typical an-isohydric behavior—lead to divergent responses. Under drought, partial stomatal closure in Q. variabilis reduces intercellular CO2 concentration, thereby limiting dark-reaction activity. Vegetation-specific photosynthetic capacity (e.g., high-photosynthesis poplar vs. low-photosynthesis Q. variabilis) also significantly influences the degree of photosynthetic inhibition. The mechanistic model comparisons in this study support these insights. Across all temporal scales, GPP simulation performance was consistently better for the high-photosynthesis poplar plantation than for the low-photosynthesis Q. variabilis plantation. The contrasting ΦP–ΦF relationships provide a physiological explanation for the species-specific performance of the SIF-based GPP models. In Q. variabilis, the breakpoint in ΦP at approximately 0.249 and the subsequent increase in fluorescence under high light suggest that a larger fraction of absorbed excitation energy is redirected towards photoprotection and/or non-photochemical dissipation. Under these conditions, SIF can remain high despite the saturation or inhibition of carbon assimilation, resulting in a decoupling between SIF and GPP. In contrast, poplar maintained a more continuous positive relationship between ΦP and ΦF across moderate-to-high-light conditions, indicating a closer coordination between photochemical activity and fluorescence. This may explain the more stable SIF-GPP relationship and the better performance of the SIF-based models in poplar. Nevertheless, this interpretation should be considered as a mechanistic hypothesis, because the two species were studied at different sites and the effects of species, climate and site conditions cannot be completely separated. SIF-based GPP models perform differently because species regulate excitation energy and carbon assimilation differently under environmental stress; therefore, the SIF–GPP relationship is not universally transferable across plantation ecosystems.
We also note that the canopy-scale mechanistic light-response (MLR) models operate under the assumption that the light reactions and the dark reactions (carboxylation processes) maintain a dynamic balance in accordance with ecological optimality theory, thereby enabling direct estimation of GPP from SIF or the photochemical quenching parameter (qL). However, in ecosystems frequently subjected to drought, this assumption can be substantially disrupted by factors such as stomatal limitation, mesophyll conductance, and biochemical down-regulation (e.g., reduced carboxylation efficiency) [52,53]. Under such conditions, merely increasing the complexity of light-reaction-related mechanisms may not improve GPP simulations. It has been confirmed that the leaf-scale photoreaction mechanism model under various soil moisture-limited conditions for multiple plants performs poorly [54]. Consequently, the MLR mechanistic model shows similar performance across different temporal scales regardless of whether qL is included. This suggests that the current framework likely lacks representation of drought-related processes rather than indicating the invalidity of the SIF-based light-reaction mechanism. It is noteworthy that under stress conditions, the relationship between SIF and GPP becomes nonlinear, as excess energy is predominantly dissipated via NPQ rather than through chlorophyll fluorescence or photosynthetic carbon fixation.
4.3. Limitations and Prospects
Regarding the issue of why the MLR model was not much better than the LUE model under stress conditions, it is because the MLR framework is built on photosynthetic light reactions. However, during drought or high VPD, plants experience stomatal closure that can limit the dark reactions. The current model lacks a robust stomatal or hydraulic constraint; the MLR model overestimates GPP during dry periods. Traditional LUE models use empirical water and VPD stress scalars to drop GPP under stress, which is why the MLR model did not consistently outperform them in the drought-prone Quercus variabilis site. Furthermore, the key parameters Kdf and Vcmax exert significant influences within the mechanistic model. The former directly participates in quantifying the Kd/Kf ratio, while the latter critically determines whether limitations arise from carboxylation or ribulose-1,5-bisphosphate (RuBP) regeneration limitations during GPP estimation. Regarding the seasonal dynamics, the constant value for Vcmax25 and a fixed KDF = 9 would introduce some uncertainty. In reality, photosynthetic enzyme capacity and energy dissipation traits change significantly across seasons (e.g., green-up vs. senescence). For model input, we selected the recently proposed value of Kdf = 9. This choice aligns with prior studies, though the applicable range of Kdf across different scenarios is reported to change from 9 to 19 [8,23] (Gu et al., 2019; Z. Liu et al., 2022). Research on crops indicates that progressively increasing the Kdf value within the mechanistic simulation framework can lead to overestimation of GPP [23,55]. However, the specific impact of Vcmax parameterization on GPP simulation within this mechanistic framework remains less understood. A primary constraint is the lack of measured data throughout the growing season, which limits a deeper mechanistic understanding of photosynthetic limitations across both light and dark reactions. Currently, the model employs a constant Vcmax25 value as input. Although the dynamic calculation of Vcmax incorporates air temperature influences, this approach inherently neglects its seasonal variability. Obtaining seasonally dynamic Vcmax characteristics for vegetation in ecosystems such as forests remains methodologically challenging [56,57]. Therefore, future efforts should focus on strengthening the continuous observation of key process variables underpinning the mechanistic model. This includes a quantitative assessment of the mechanistic explanations for the performance differences between the light-reaction-based model and the classic light-use efficiency (LUE) model. Advancing in these areas is essential for refining model accuracy and enhancing the physiological realism of GPP simulations.
5. Conclusions
SIF provides valuable information for constraining ecosystem photosynthetic activity and GPP. Using long-term, tower-based synchronous observations of fluxes and SIF, this study evaluated different light-response mechanistic models and the classical FvCB and LUE models for simulating GPP in poplar and Quercus variabilis plantations across multiple temporal scales. We further examined the effects of key meteorological factors on model parameters and performance. The results support the feasibility of an SIF-based light-response mechanistic framework for constraining GPP in the two tall-statured plantation ecosystems examined here. The main findings are as follows:
- Contrasting light-energy allocation patterns were observed between the two plantation systems. At the two study sites, Q. variabilis maintained relatively high NPQ even under low-light conditions, whereas poplar maintained higher photochemical efficiency. These contrasting patterns are consistent with differences in light-energy allocation observed between the two plantation systems. Within the present study, the SIF-based light-response mechanistic model helped reproduce and interpret the trade-off between photoprotection and photochemistry in plant light-energy utilization. Because species and site effects are confounded in this study, these patterns should be interpreted as site-specific, species-associated responses rather than definitive species-level effects.
- The mechanistic framework improved GPP simulation under high-light conditions relative to the LUE model. The SIF-based light-response mechanistic model mitigated the high-light saturation and associated GPP underestimation observed in the LUE model, thereby improving the representation of the SIF–GPP relationship in the two plantation systems. The qL-based parameterization, derived from canopy- and leaf-scale observations, achieved simulation performance comparable to that of the full MLR model, indicating that a simplified parameterization may provide a practical approach for constraining GPP in these two systems. Nevertheless, the performance of the SIF-based mechanistic model varied between the two plantations, highlighting the importance of obtaining stable and representative SIF signals and of further testing the model across contrasting sites and species.
- Differences in leaf-scale ΦP–ΦF relationships may help explain the contrasting performance of the MLR-based mechanistic model. The MLR model performed better for poplar than for Q. variabilis, and the contrasting ΦP–ΦF relationships observed at the leaf scale may provide a mechanistic explanation for this difference. The relatively lower simulation accuracy observed under drought-prone conditions also suggests that stomatal limitation is an important process that is not fully represented in the current light-response framework. Future studies should therefore consider incorporating stomatal limitation into the mechanistic model, particularly when extending the framework to water-limited environments.
Overall, the results demonstrate that tower-based SIF can help constrain GPP and that an SIF-based light-reaction mechanistic framework can alleviate some limitations of the LUE approach under high-light conditions in the two plantation ecosystems examined here. These conclusions are restricted to the study systems and conditions investigated in this work. Because species and site effects cannot be separated in the present experimental design, and because the leaf-level parameterization was not measured concurrently with the tower observations, multi-site, multi-species, and multi-year validation is required before these findings can be generalized to broader plantation ecosystems or regional scales.
Author Contributions
Conceptualization, X.W., Z.L., M.C.-T. and J.Z.; methodology, X.W.; software, X.W.; validation, X.W. and Z.L.; formal analysis, X.W.; investigation, X.W. and Z.L.; data curation, M.H. and Q.P.; writing—original draft preparation, X.W.; writing—review and editing, X.W., Z.L., M.C.-T. and J.Z.; visualization, X.W.; project administration, J.Z.; funding acquisition, Z.L. and J.Z. All authors have read and agreed to the published version of the manuscript.
Funding
This research was funded by Zhipeng Li of the Research Institute of Forestry, Chinese Academy of Forestry, grant number CAFYBB2023MA001 and Jinsong Zhang of the Research Institute of Forestry, Chinese Academy of Forestry, grant number 2023YFD2200400. The APC was funded by CAFYBB2023MA001.
Data Availability Statement
Data is unavailable due to privacy.
Acknowledgments
The authors would like to thank the anonymous reviewers for their valuable comments and suggestions. The research was supported by the Fundamental Scientific Research Operation of Central-level Public Welfare Scientific Research Institutes (No. CAFYBB2023MA001) and the National Key Research and Development Program of China (2023YFD2200400). We thank Zhipeng Li (Research Institute of Forestry, Chinese Academy of Forestry, Beijing, China) for their technical support in ecosystem-level eddy-covariance data and SIF data collection. The authors gratefully thank Jinsong Zhang and Manuel Campos-Taberner for helping with English editing and proofreading.
Conflicts of Interest
The authors declare no conflicts of interest.
References
- Li, X.; Xiao, J.; He, B.; Arain, M.A.; Beringer, J.; Desai, A.R.; Emmel, C.; Hollinger, D.Y.; Krasnova, A.; Mammarella, I.; et al. Solar-Induced Chlorophyll Fluorescence Is Strongly Correlated with Terrestrial Photosynthesis for a Wide Variety of Biomes: First Global Analysis Based on Oco-2 and Flux Tower Observations. Glob. Change Biol. 2018, 24, 3990–4008. [Google Scholar] [CrossRef] [Scilit]
- Beer, C.; Ciais, P.; Reichstein, M.; Baldocchi, D.; Law, B.E.; Papale, D.; Soussana, J.-F.; Ammann, C.; Buchmann, N.; Frank, D.; et al. Temporal and among-Site Variability of Inherent Water Use Efficiency at the Ecosystem Level. Glob. Biogeochem. Cycles 2009, 23, GB2018. [Google Scholar] [CrossRef] [Scilit]
- Zhou, S.; Yu, B.; Huang, Y.; Wang, G. The Effect of Vapor Pressure Deficit on Water Use Efficiency at the Subdaily Time Scale. Geophys. Res. Lett. 2014, 41, 5005–5013. [Google Scholar] [CrossRef] [Scilit]
- Reyes-Muñoz, P.; Kovács, D.D.; Berger, K.; Pipia, L.; Belda, S.; Rivera-Caicedo, J.P.; Verrelst, J. Inferring Global Terrestrial Carbon Fluxes from the Synergy of Sentinel 3 & 5p with Gaussian Process Hybrid Models. Remote Sens. Environ. 2024, 305, 114072. [Google Scholar] [CrossRef] [Scilit]
- Wang, S.; Zhang, Y.; Ju, W.; Wu, M.; Liu, L.; He, W.; Peñuelas, J. Temporally Corrected Long-Term Satellite Solar-Induced Fluorescence Leads to Improved Estimation of Global Trends in Vegetation Photosynthesis During 1995–2018. ISPRS J. Photogramm. Remote Sens. 2022, 194, 222–234. [Google Scholar] [CrossRef] [Scilit]
- Wang, T.; Zhang, Y.; Yue, C.; Wang, Y.; Wang, X.; Lyu, G.; Wei, J.; Yang, H.; Piao, S. Progress and Challenges in Remotely Sensed Terrestrial Carbon Fluxes. Geo-Spat. Inf. Sci. 2025, 28, 1–21. [Google Scholar] [CrossRef] [Scilit]
- Monteith, J.L. Solar Radiation and Productivity in Tropical Ecosystems. J. Appl. Ecol. 1972, 9, 747–766. [Google Scholar] [CrossRef] [Scilit]
- Gu, L.; Han, J.; Wood, J.D.; Chang, C.Y.Y.; Sun, Y. Sun-Induced Chl Fluorescence and Its Importance for Biophysical Modeling of Photosynthesis Based on Light Reactions. New Phytol. 2019, 223, 1179–1191. [Google Scholar] [CrossRef] [Scilit]
- Prikaziuk, E.; Migliavacca, M.; Su, Z.; van der Tol, C. Simulation of Ecosystem Fluxes with the Scope Model: Sensitivity to Parametrization and Evaluation with Flux Tower Observations. Remote Sens. Environ. 2023, 284, 113324. [Google Scholar] [CrossRef] [Scilit]
- van der Tol, C.; Verhoef, W.; Timmermans, J.; Verhoef, A.; Su, Z. An Integrated Model of Soil-Canopy Spectral Radiances, Photosynthesis, Fluorescence, Temperature and Energy Balance. Biogeosciences 2009, 6, 3109–3129. [Google Scholar] [CrossRef] [Scilit]
- Yang, P.; Verhoef, W.; van der Tol, C. The Mscope Model: A Simple Adaptation to the Scope Model to Describe Reflectance, Fluorescence and Photosynthesis of Vertically Heterogeneous canopies. Remote Sens. Environ. 2017, 201, 1–11. [Google Scholar] [CrossRef] [Scilit]
- Cao, J.; Wang, R.; Chen, J.M.; Yang, M.; Cheng, Z.; Miao, G. Quantifying Topographic Effects on Carbon and Water Fluxes over Mountainous Areas. J. Geophys. Res. Biogeosci. 2025, 130, e2025JG008878. [Google Scholar] [CrossRef] [Scilit]
- Liu, J.; Chen, J.M.; Cihlar, J.; Park, W.M. A Process-Based Boreal Ecosystem Productivity Simulator Using Remote Sensing Inputs. Remote Sens. Environ. 1997, 62, 158–175. [Google Scholar] [CrossRef] [Scilit]
- Yuan, W.; Cai, W.; Xia, J.; Chen, J.; Liu, S.; Dong, W.; Merbold, L.; Law, B.; Arain, A.; Beringer, J.; et al. Global Comparison of Light Use Efficiency Models for Simulating Terrestrial Vegetation Gross Primary Production Based on the Lathuile Database. Agric. For. Meteorol. 2014, 192–193, 108–120. [Google Scholar] [CrossRef] [Scilit]
- Gong, E.; Zhang, J.; Wang, Z.; Hu, Q.; Bai, H.; Wang, J. Global Comparison of Temperature and Water Stress Representations in Light Use Efficiency Models for Gross Primary Productivity Estimation. ISPRS J. Photogramm. Remote Sens. 2025, 230, 275–288. [Google Scholar] [CrossRef] [Scilit]
- Sun, Y.; Frankenberg, C.; Jung, M.; Joiner, J.; Guanter, L.; Köhler, P.; Magney, T. Overview of Solar-Induced Chlorophyll Fluorescence (Sif) from the Orbiting Carbon Observatory-2: Retrieval, Cross-Mission Comparison, and Global Monitoring for Gpp. Remote Sens. Environ. 2018, 209, 808–823. [Google Scholar] [CrossRef] [Scilit]
- Qiu, R.; Han, G.; Li, X.; Xiao, J.; Liu, J.; Wang, S.; Li, S.; Gong, W. Contrasting Responses of Relationship between Solar-Induced Fluorescence and Gross Primary Production to Drought across Aridity Gradients. Remote Sens. Environ. 2024, 302, 113984. [Google Scholar] [CrossRef] [Scilit]
- Cheng, X.; Hu, M.; Zhou, Y.; Wang, F.; Liu, L.; Wang, Y.; Huang, H.; Zhang, J. The Divergence of Micrometeorology Sensitivity Leads to Changes in Gpp/Sif between Cork Oak and Poplar. Agric. For. Meteorol. 2022, 326, 109189. [Google Scholar] [CrossRef] [Scilit]
- Wang, Y.; Sun, Y.; Chen, Y.; Wu, C.; Huang, C.; Li, C.; Tang, X. Non-Linear Correlations Exist between Solar-Induced Chlorophyll Fluorescence and Canopy Photosynthesis in a Subtropical Evergreen Forest in Southwest China. Ecol. Indic. 2023, 157, 111311. [Google Scholar] [CrossRef] [Scilit]
- Pei, Y.; Dong, J.; Zhang, Y.; Yuan, W.; Doughty, R.; Yang, J.; Zhou, D.; Zhang, L.; Xiao, X. Evolution of Light Use Efficiency Models: Improvement, Uncertainties, and Implications. Agric. For. Meteorol. 2022, 317, 108905. [Google Scholar] [CrossRef] [Scilit]
- Li, S.; Fleisher, D.H.; Wang, Z.; Barnaby, J.; Timlin, D.; Reddy, V.R. Application of a Coupled Model of Photosynthesis, Stomatal Conductance and Transpiration for Rice Leaves and Canopy. Comput. Electron. Agric. 2021, 182, 106047. [Google Scholar] [CrossRef] [Scilit]
- Sun, T.; Zhang, X.; Lv, S.; Lin, X.; Ma, J.; Liu, J.; Fang, Q.; Tang, L.; Liu, L.; Cao, W.; et al. Improving the Predictions of Leaf Photosynthesis During and after Short-Term Heat Stress with Current Rice Models. Plant Cell Environ. 2023, 46, 3353–3370. [Google Scholar] [CrossRef] [Scilit]
- Liu, Z.; Zhao, F.; Liu, X.; Yu, Q.; Wang, Y.; Peng, X.; Cai, H.; Lu, X. Direct Estimation of Photosynthetic CO2 Assimilation from Solar-Induced Chlorophyll Fluorescence (Sif). Remote Sens. Environ. 2022, 271, 112893. [Google Scholar] [CrossRef] [Scilit]
- Yao, L.; Liu, T.; Qin, J.; Jiang, H.; Yang, L.; Smith, P.; Chen, X.; Zhou, C.; Piao, S. Carbon Sequestration Potential of Tree Planting in China. Nat. Commun. 2024, 15, 8398. [Google Scholar] [CrossRef] [Scilit]
- Li, S.-Y.; Wei, X.-P.; Meng, Y.; Yang, Y.-T.; Zheng, Z.-Y.; Zhou, J.-X.; Yuan, W.-B.; Ni, H.-G. Spatiotemporal Patterns of Artificial Forest Expansion and Their Driving Mechanisms for Carbon Sink Enhancement in China (2005–2019). Land Use Policy 2026, 161, 107857. [Google Scholar] [CrossRef] [Scilit]
- Zhou, Y.; Zhang, J.; Yin, C.; Huang, H.; Sun, S.; Meng, P. Empirical Analysis of the Influences of Meteorological Factors on the Interannual Variations in Carbon Fluxes of a Quercus variabilis Plantation. Agric. For. Meteorol. 2022, 326, 109190. [Google Scholar] [CrossRef] [Scilit]
- Meroni, M.; Rossini, M.; Guanter, L.; Alonso, L.; Rascher, U.; Colombo, R.; Moreno, J. Remote Sensing of Solar-Induced Chlorophyll Fluorescence: Review of Methods and Applications. Remote Sens. Environ. 2009, 113, 2037–2051. [Google Scholar] [CrossRef] [Scilit]
- Aubinet, M.; Vesala, T.; Papale, D. Eddy Covariance: A Practical Guide to Measurement and Data Analysis; Springer Science & Business Media: Dordrecht, Germany, 2012. [Google Scholar]
- Papale, D.; Reichstein, M.; Aubinet, M.; Canfora, E.; Bernhofer, C.; Kutsch, W.; Longdoz, B.; Rambal, S.; Valentini, R.; Vesala, T.; et al. Towards a Standardized Processing of Net Ecosystem Exchange Measured with Eddy Covariance Technique: Algorithms and Uncertainty Estimation. Biogeosciences 2006, 3, 571–583. [Google Scholar] [CrossRef] [Scilit]
- Vickers, D.; Mahrt, L. Quality Control and Flux Sampling Problems for Tower and Aircraft Data. J. Atmos. Ocean. Technol. 1997, 14, 512–526. [Google Scholar] [CrossRef] [Scilit]
- Wutzler, T.; Reichstein, M.; Moffat, A.M.; Migliavacca, M. Reddyproc: Post Processing of (Half-) Hourly Eddy-Covariance Measurements. In R Package Version 1; The R Foundation: Vienna, Austria, 2018. [Google Scholar]
- Reichstein, M.; Falge, E.; Baldocchi, D.; Papale, D.; Aubinet, M.; Berbigier, P.; Bernhofer, C.; Buchmann, N.; Gilmanov, T.; Granier, A.; et al. On the Separation of Net Ecosystem Exchange into Assimilation and Ecosystem Respiration: Review and Improved Algorithm. Glob. Change Biol. 2005, 11, 1424–1439. [Google Scholar] [CrossRef] [Scilit]
- Lasslop, G.; Reichstein, M.; Papale, D.; Richardson, A.D.; Arneth, A.; Barr, A.; Stoy, P.; Wohlfahrt, G. Separation of Net Ecosystem Exchange into Assimilation and Respiration Using a Light Response Curve Approach: Critical Issues and Global Evaluation. Glob. Change Biol. 2010, 16, 187–208. [Google Scholar] [CrossRef] [Scilit]
- Bacour, C.; Maignan, F.; MacBean, N.; Porcar-Castell, A.; Flexas, J.; Frankenberg, C.; Peylin, P.; Chevallier, F.; Vuichard, N.; Bastrikov, V. Improving Estimates of Gross Primary Productivity by Assimilating Solar-Induced Fluorescence Satellite Retrievals in a Terrestrial Biosphere Model Using a Process-Based Sif Model. J. Geophys. Res. Biogeosci. 2019, 124, 3281–3306. [Google Scholar] [CrossRef] [Scilit]
- Farquhar, G.D.; von Caemmerer, S.; Berry, J.A. A Biochemical Model of Photosynthetic Co2 Assimilation in Leaves of C3 Species. Planta 1980, 149, 78–90. [Google Scholar] [CrossRef] [Scilit]
- Yin, X.; Struik, P.C. C3 and C4 Photosynthesis Models: An Overview from the Perspective of Crop Modelling. NJAS Wagening. J. Life Sci. 2009, 57, 27–38. [Google Scholar] [CrossRef] [Scilit]
- Wu, A.; Hammer, G.L.; Doherty, A.; von Caemmerer, S.; Farquhar, G.D. Quantifying Impacts of Enhancing Photosynthesis on Crop Yield. Nat. Plants 2019, 5, 380–388. [Google Scholar] [CrossRef] [Scilit]
- Katul, G.; Manzoni, S.; Palmroth, S.; Oren, R. A Stomatal Optimization Theory to Describe the Effects of Atmospheric Co2 on Leaf Photosynthesis and Transpiration. Ann. Bot. 2010, 105, 431–442. [Google Scholar] [CrossRef] [Scilit]
- Pfündel, E.E.; Klughammer, C.; Meister, A.; Cerovic, Z.G. Deriving Fluorometer-Specific Values of Relative Psi Fluorescence Intensity from Quenching of F0 Fluorescence in Leaves of Arabidopsis thaliana and Zea mays. Photosynth. Res. 2013, 114, 189–206. [Google Scholar] [CrossRef] [Scilit]
- Pfündel, E.E. Simultaneously Measuring Pulse-Amplitude-Modulated (Pam) Chlorophyll Fluorescence of Leaves at Wavelengths Shorter and Longer Than 700 nm. Photosynth. Res. 2021, 147, 345–358. [Google Scholar] [CrossRef] [Scilit]
- Kramer, D.M.; Johnson, G.; Kiirats, O.; Edwards, G.E. New Fluorescence Parameters for the Determination of Qa Redox State and Excitation Energy Fluxes. Photosynth. Res. 2004, 79, 209–218. [Google Scholar] [CrossRef] [Scilit]
- Jia, Q.; Liu, Z.; Guo, C.; Wang, Y.; Yang, J.; Yu, Q.; Wang, J.; Zheng, F.; Lu, X. Relationship between Photosynthetic Co2 Assimilation and Chlorophyll Fluorescence for Winter Wheat under Water Stress. Plants 2023, 12, 3365. [Google Scholar] [CrossRef] [Scilit]
- Maguire, A.J.; Eitel, J.U.H.; Griffin, K.L.; Magney, T.S.; Long, R.A.; Vierling, L.A.; Schmiege, S.C.; Jennewein, J.S.; Weygint, W.A.; Boelman, N.T.; et al. On the Functional Relationship between Fluorescence and Photochemical Yields in Complex Evergreen Needleleaf Canopies. Geophys. Res. Lett. 2020, 47, e2020GL087858. [Google Scholar] [CrossRef] [Scilit]
- van der Tol, C.; Berry, J.A.; Campbell, P.K.E.; Rascher, U. Models of Fluorescence and Photosynthesis for Interpreting Measurements of Solar-Induced Chlorophyll Fluorescence. J. Geophys. Res. Biogeosci. 2014, 119, 2312–2327. [Google Scholar] [CrossRef] [Scilit]
- Porcar-Castell, A.; Tyystjärvi, E.; Atherton, J.; van der Tol, C.; Flexas, J.; Pfündel, E.E.; Moreno, J.; Frankenberg, C.; Berry, J.A. Linking Chlorophyll a Fluorescence to Photosynthesis for Remote Sensing Applications: Mechanisms and Challenges. J. Exp. Bot. 2014, 65, 4065–4095. [Google Scholar] [CrossRef] [Scilit]
- Magney, T.S.; Barnes, M.L.; Yang, X. On the Covariation of Chlorophyll Fluorescence and Photosynthesis across Scales. Geophys. Res. Lett. 2020, 47, e2020GL091098. [Google Scholar] [CrossRef] [Scilit]
- Zhu, Y.; Zheng, J.; Kang, H.; Hui, N.; Yin, S.; Chen, Z.; Du, B.; Liu, C. Spatial Variations in Leaf Trichomes and Their Coordination with Stomata in Quercus variabilis across Eastern Asia. J. Plant Ecol. 2024, 17, rtae023. [Google Scholar] [CrossRef] [Scilit]
- Krinner, G.; Viovy, N.; de Noblet-Ducoudré, N.; Ogée, J.; Polcher, J.; Friedlingstein, P.; Ciais, P.; Sitch, S.; Prentice, I.C. A Dynamic Global Vegetation Model for Studies of the Coupled Atmosphere-Biosphere System. Glob. Biogeochem. Cycles 2005, 19. [Google Scholar] [CrossRef] [Scilit]
- Lawrence, D.M.; Fisher, R.A.; Koven, C.D.; Oleson, K.W.; Swenson, S.C.; Bonan, G.; Collier, N.; Ghimire, B.; van Kampenhout, L.; Kennedy, D.; et al. The Community Land Model Version 5: Description of New Features, Benchmarking, and Impact of Forcing Uncertainty. J. Adv. Model. Earth Syst. 2019, 11, 4245–4287. [Google Scholar] [CrossRef] [Scilit]
- Yamamoto, Y.; Ichii, K.; Yang, W.; Shikakura, Y.; Ryu, Y.; Kang, M.; Murayama, S.; Kim, S.-J.; Takao, Y.; Ueyama, M.; et al. Modeling Diurnal Gross Primary Production in East Asia Using Himawari-8/9 Geostationary Satellite Data. Remote Sens. Environ. 2025, 328, 114866. [Google Scholar] [CrossRef] [Scilit]
- Martini, D.; Sakowska, K.; Wohlfahrt, G.; Pacheco-Labrador, J.; van der Tol, C.; Porcar-Castell, A.; Magney, T.S.; Carrara, A.; Colombo, R.; El-Madany, T.S.; et al. Heatwave Breaks Down the Linearity between Sun-Induced Fluorescence and Gross Primary Production. New Phytol. 2022, 233, 2415–2428. [Google Scholar] [CrossRef] [Scilit]
- Jin, C.; Zha, T.; Bourque, C.P.A.; Jia, X.; Tian, Y.; Liu, P.; Li, X.; Xu, M.; Guo, Z.; Hu, Z. Ecosystem-Scale Carbon Dynamics in Desert Shrublands: Unraveling the Complex Interplay among Leaf Functional and Physiological Traits and Environment. Agric. For. Meteorol. 2024, 355, 110133. [Google Scholar] [CrossRef] [Scilit]
- Wang, Z.; Slot, M.; Wang, C. Decoupling of Stomatal Conductance, Transpiration and Photosynthesis in Terrestrial Plants under Elevated Temperature: A Meta-Analysis. Nat. Commun. 2026, 17, 1528. [Google Scholar] [CrossRef] [Scilit]
- Shi, S.; Cong, W.; Lu, S.; Zhao, T.; Wang, F.; Lu, Q. Can Sif and Npq Be Used in the Photosynthesis Rate Simulation of Plants Subjected to Drought? Environ. Exp. Bot. 2022, 203, 105067. [Google Scholar] [CrossRef] [Scilit]
- Ding, H.; Wang, Z.; Zhang, Y.; Li, J.; Jia, L.; Chen, Q.; Ding, Y.; Wang, S. A Mechanistic Model for Estimating Rice Photosynthetic Capacity and Stomatal Conductance from Sun-Induced Chlorophyll Fluorescence. Plant Phenomics 2023, 5, 0047. [Google Scholar] [CrossRef] [Scilit]
- Liu, Y.; Chen, J.M.; He, L.; Wang, R.; Smith, N.G.; Keenan, T.F.; Rogers, C.; Li, W.; Leng, J. Global Photosynthetic Capacity of C3 Biomes Retrieved from Solar-Induced Chlorophyll Fluorescence and Leaf Chlorophyll Content. Remote Sens. Environ. 2023, 287, 113457. [Google Scholar] [CrossRef] [Scilit]
- Liu, Y.; Chen, J.M.; He, L.; Zhang, Z.; Wang, R.; Rogers, C.; Fan, W.; de Oliveira, G.; Xie, X. Non-Linearity between Gross Primary Productivity and Far-Red Solar-Induced Chlorophyll Fluorescence Emitted from Canopies of Major Biomes. Remote Sens. Environ. 2022, 271, 112896. [Google Scholar] [CrossRef] [Scilit]
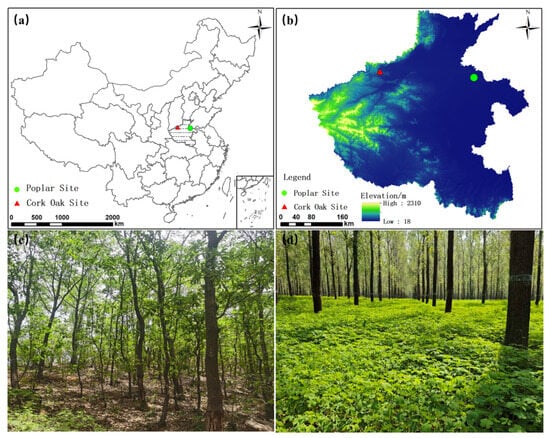
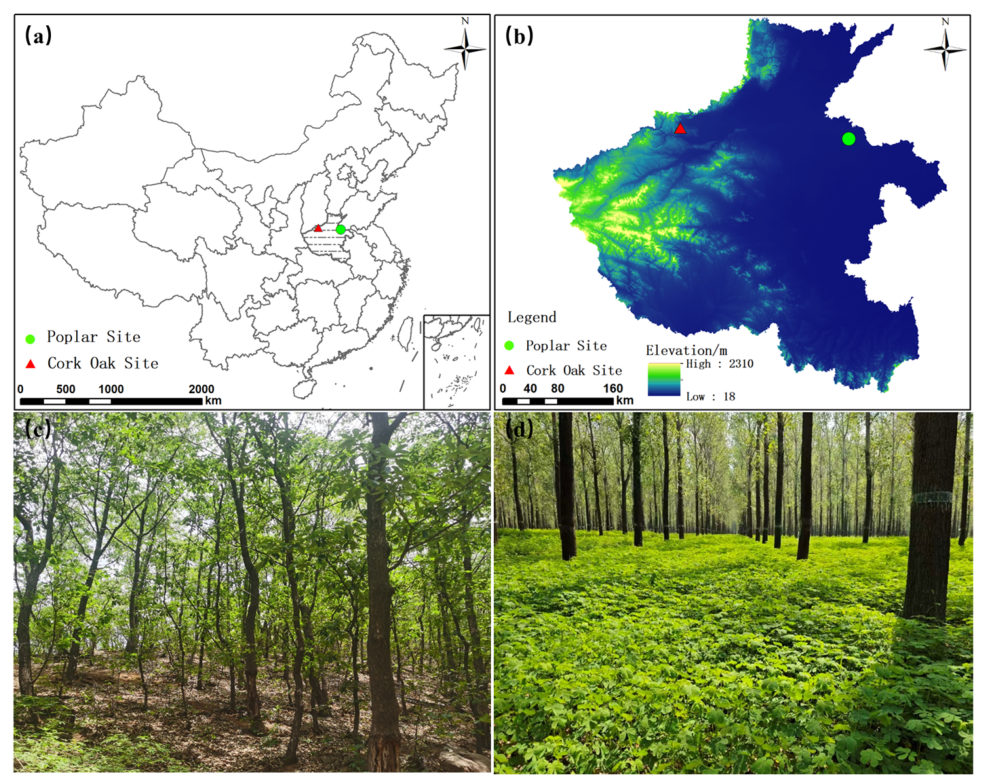
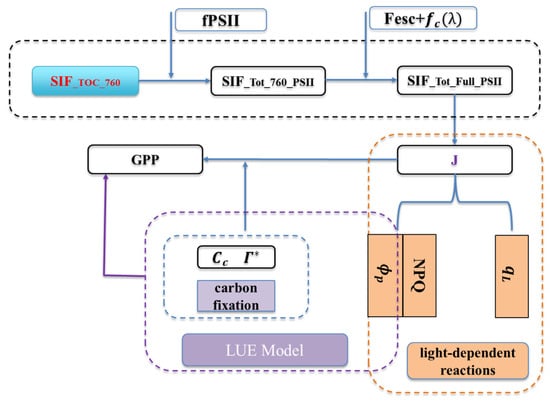
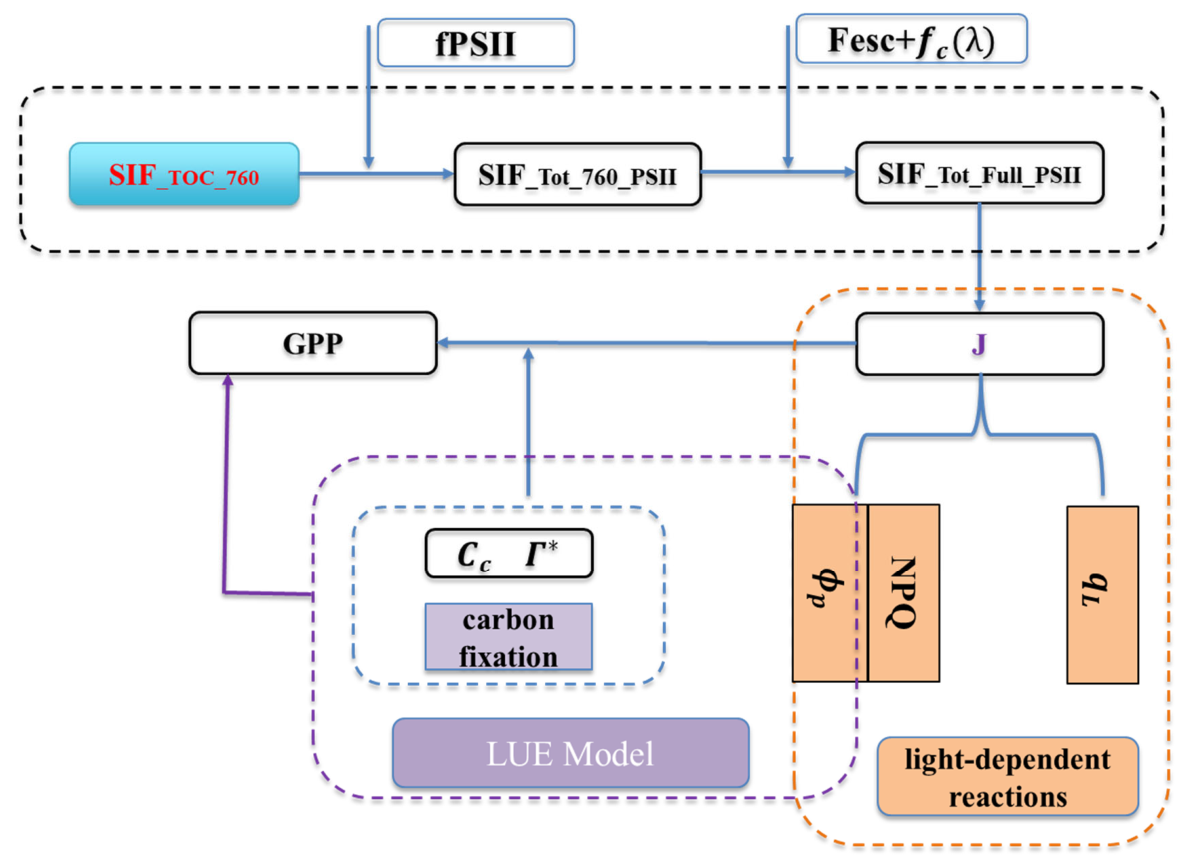
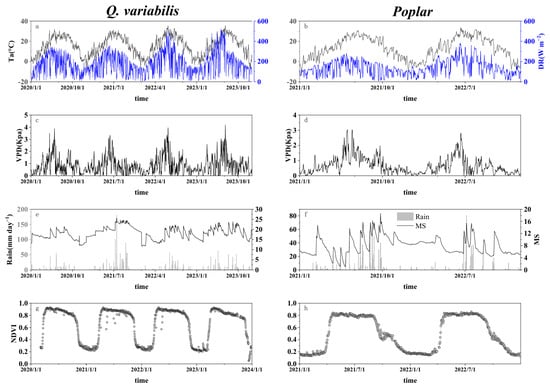
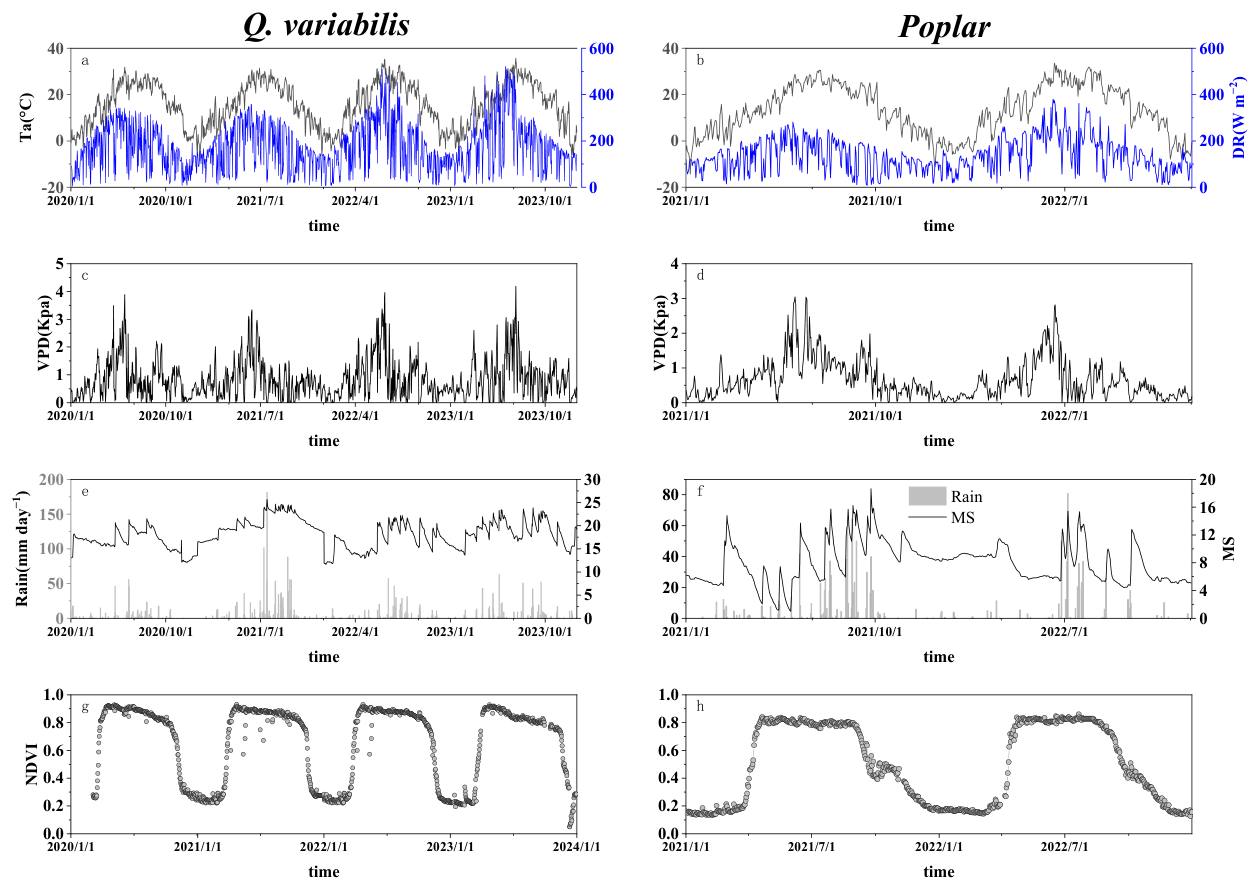
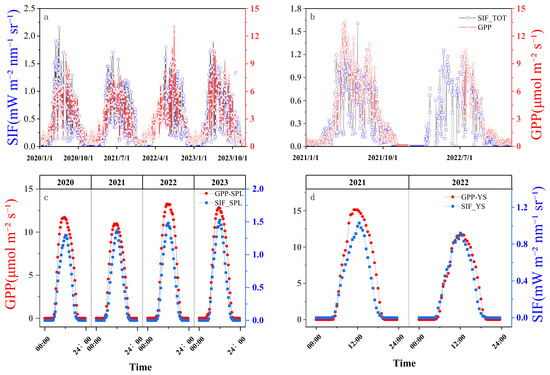
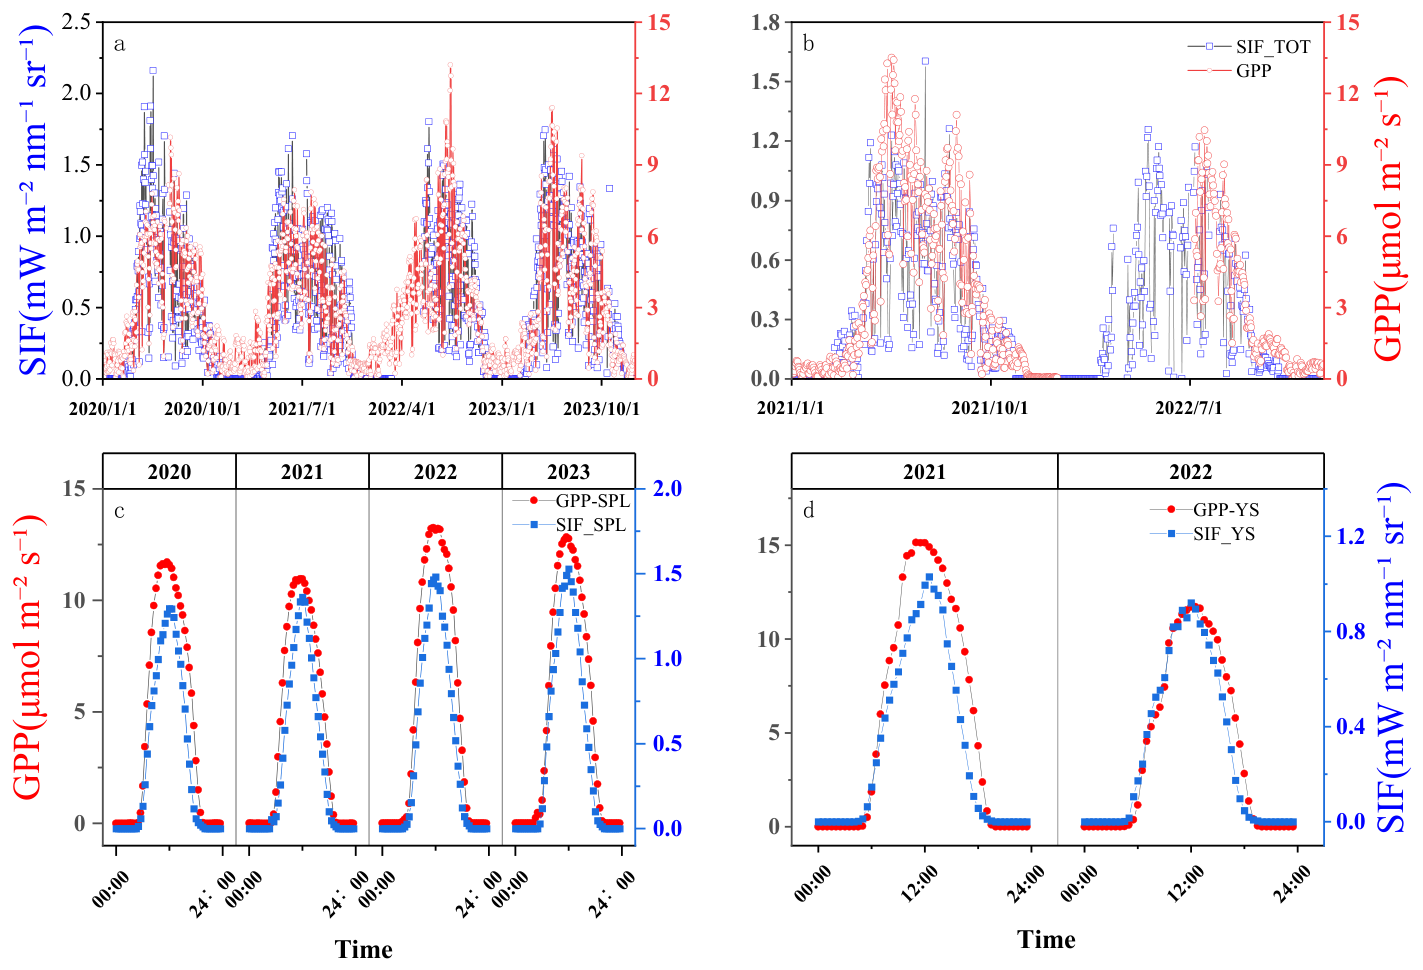
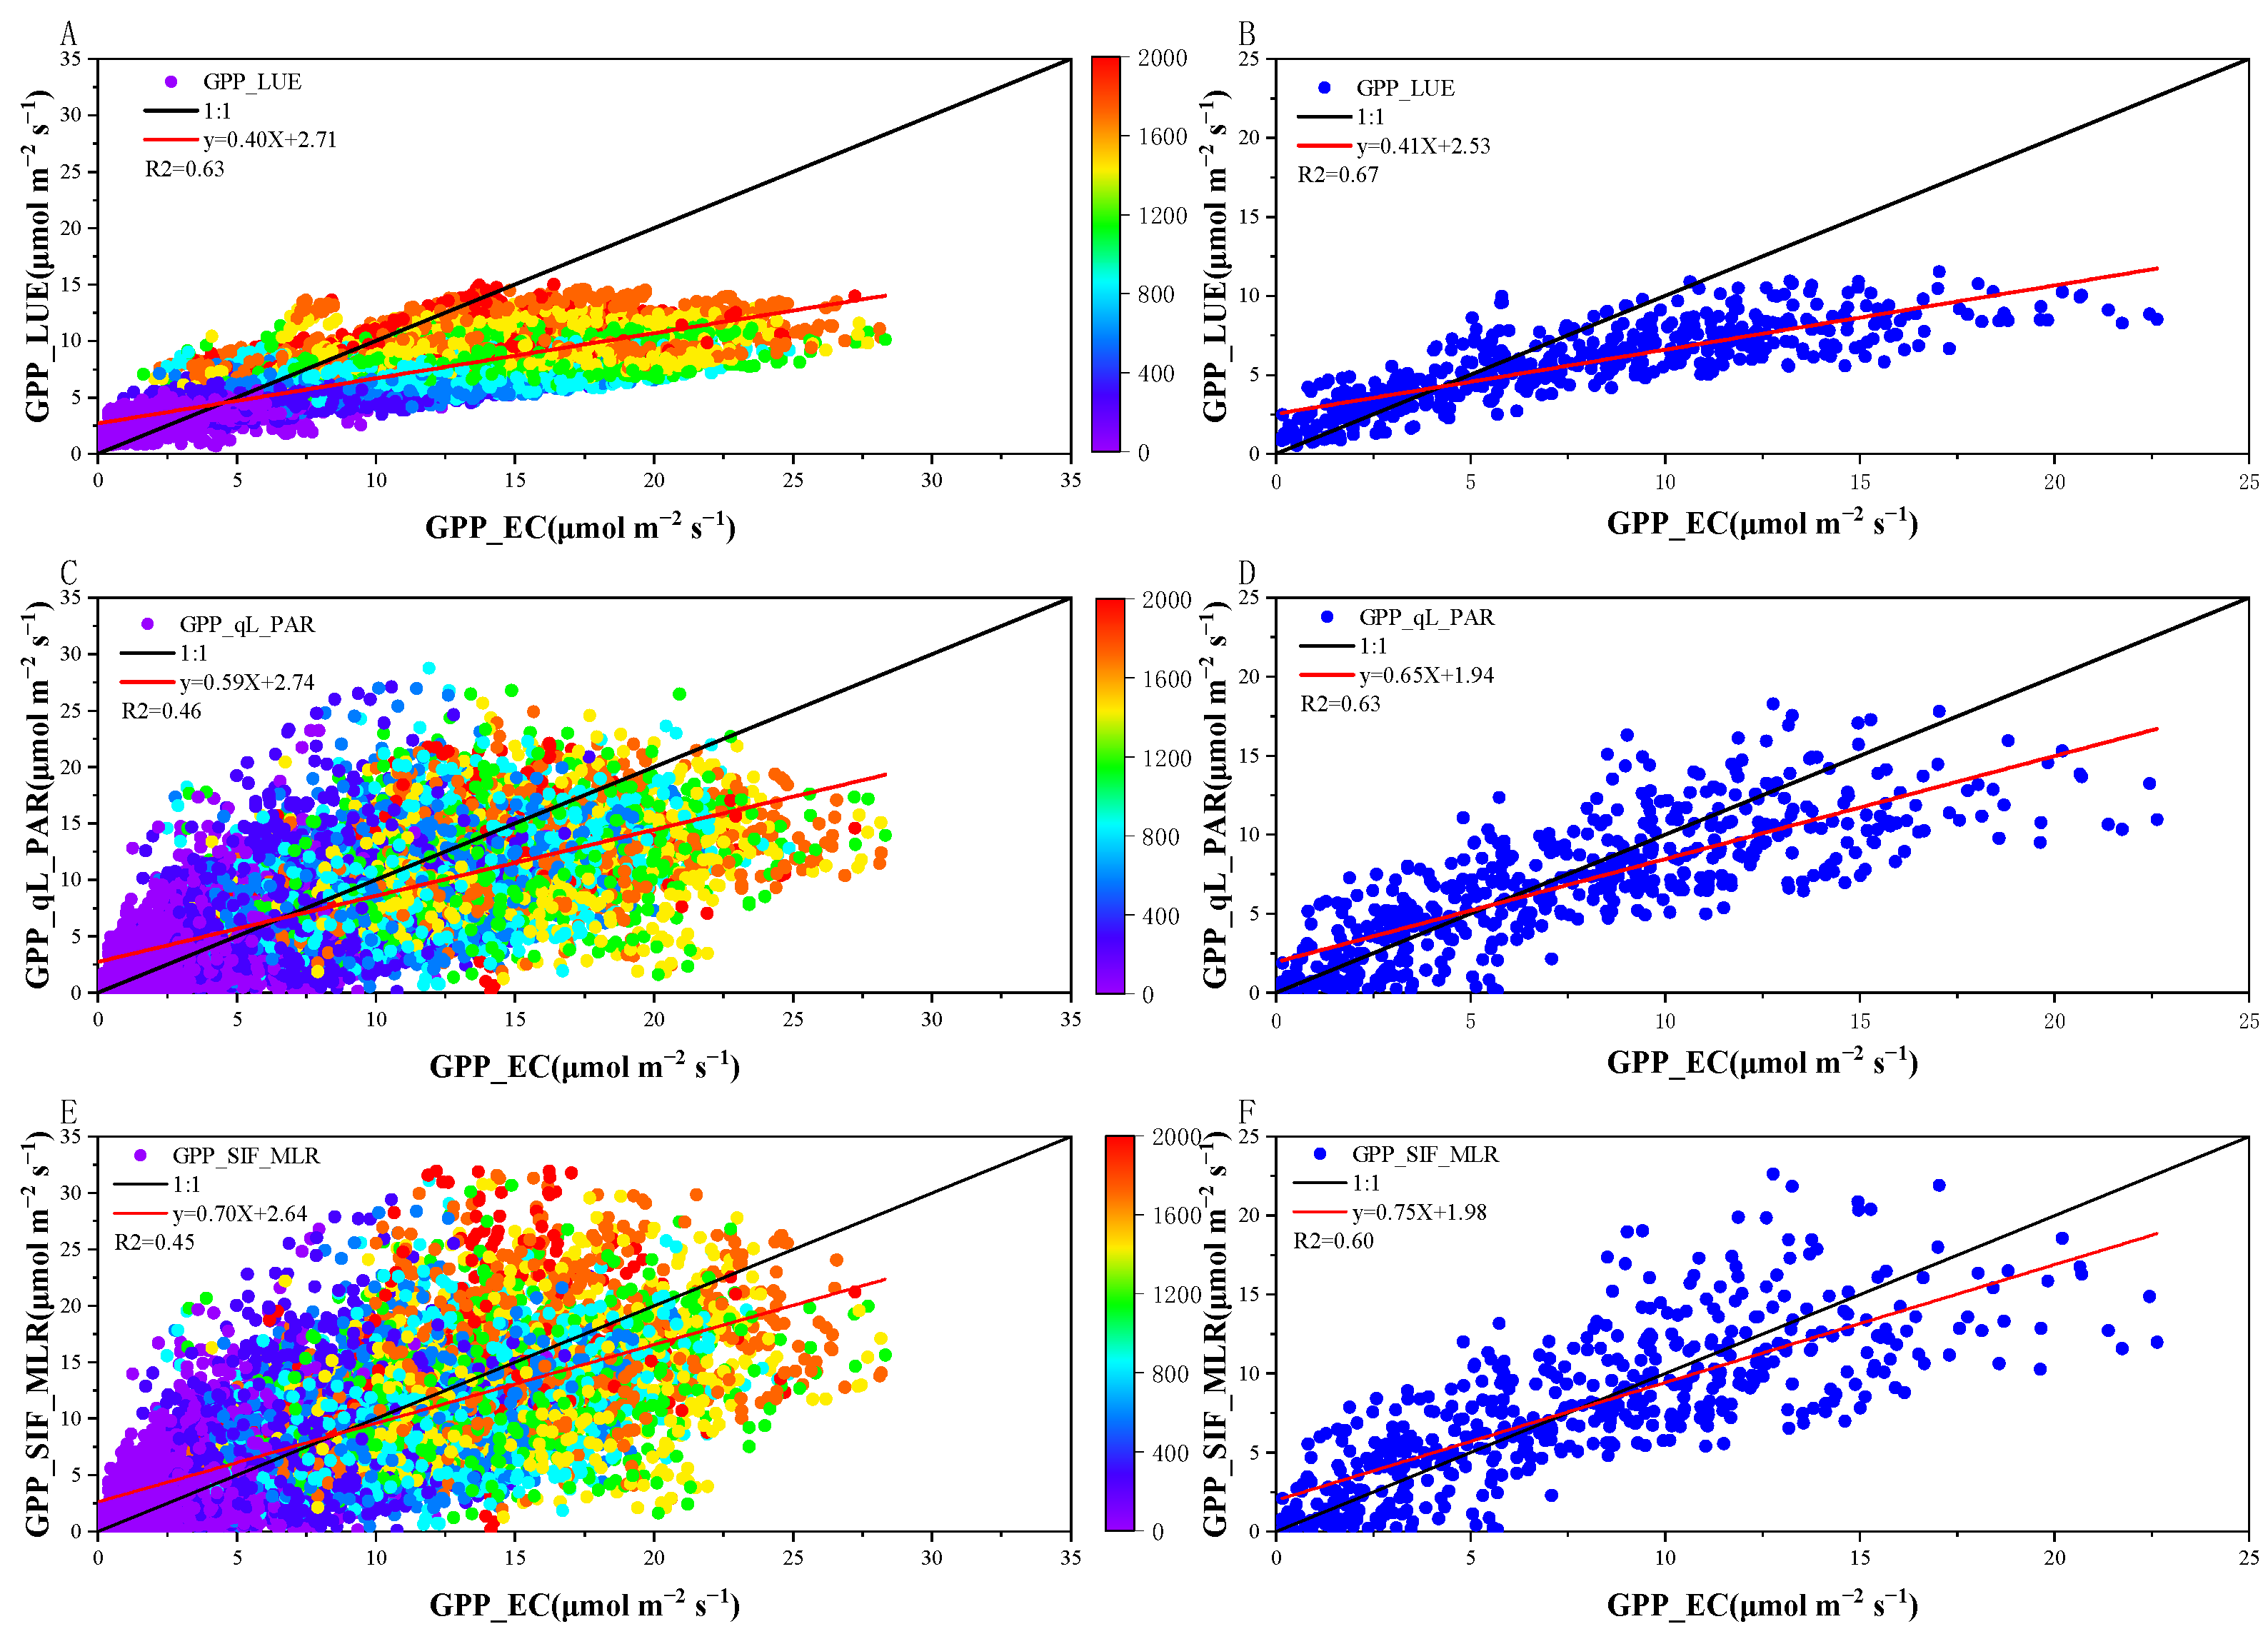
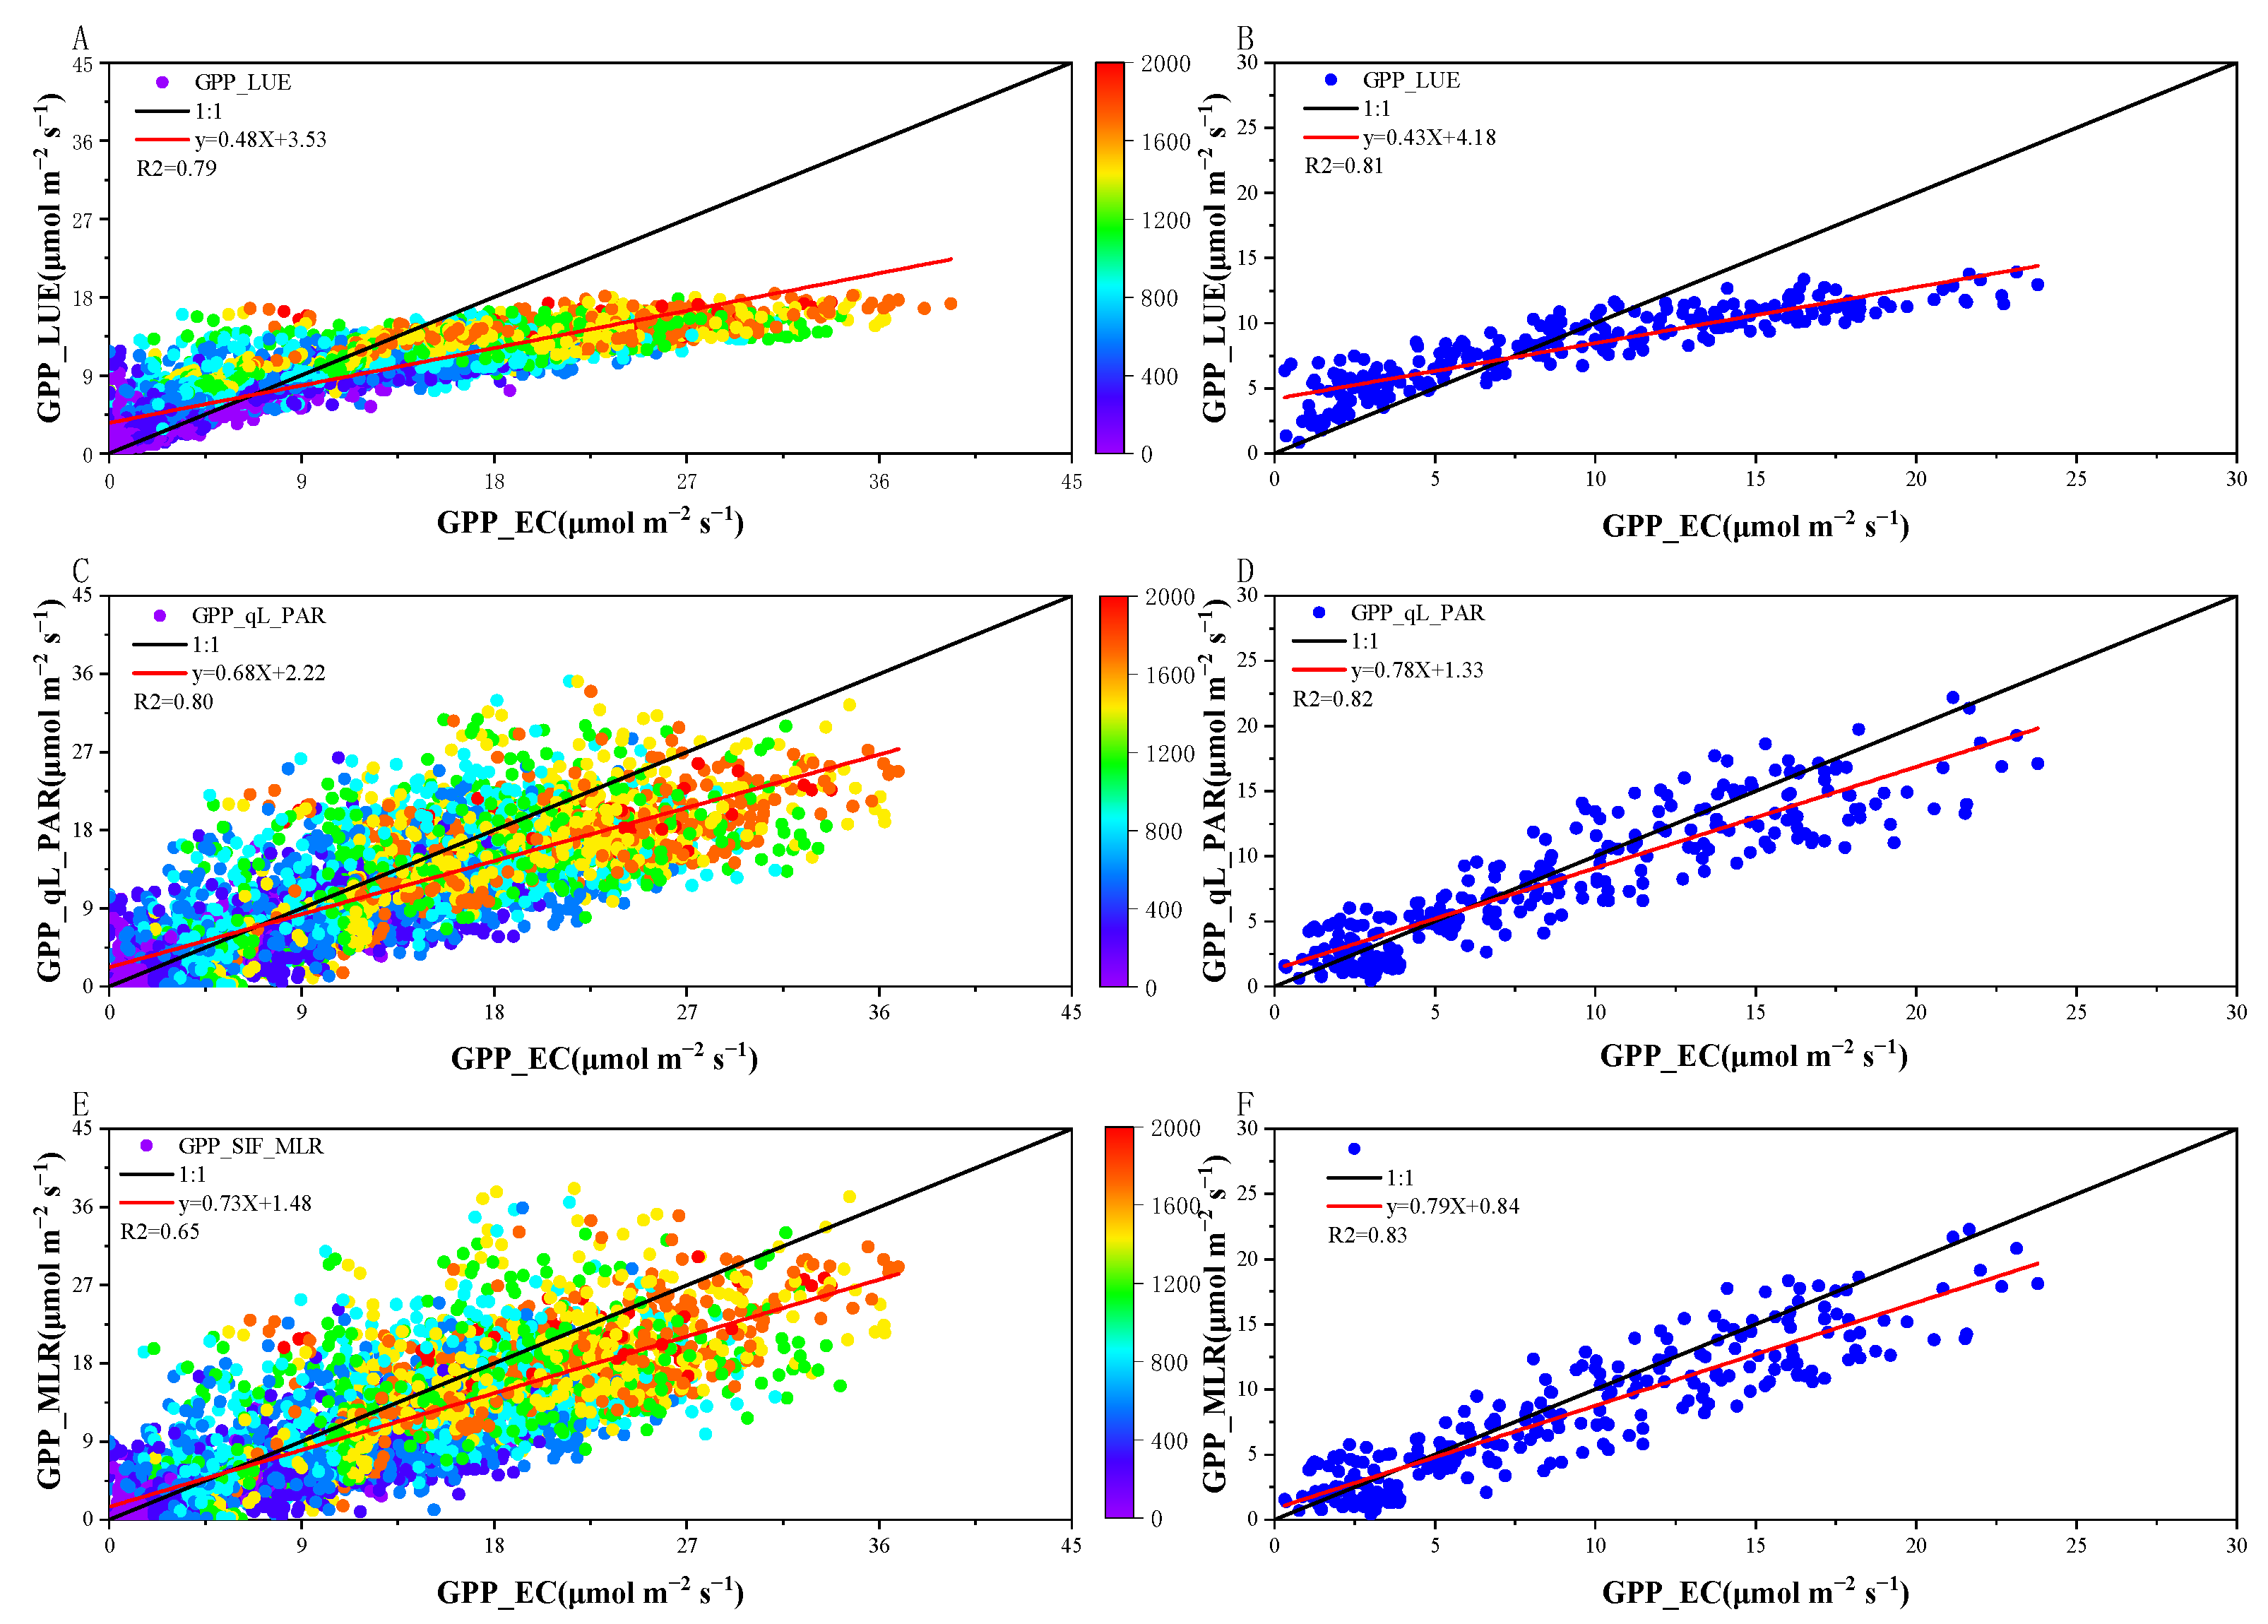
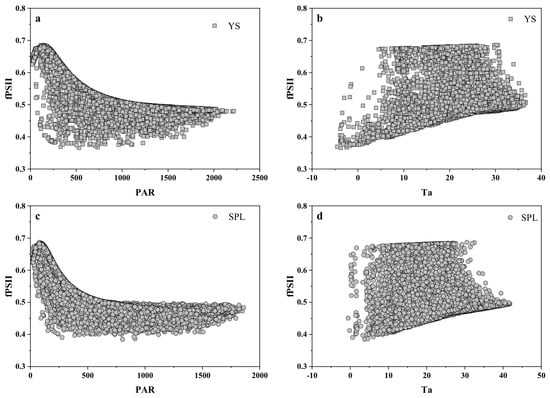
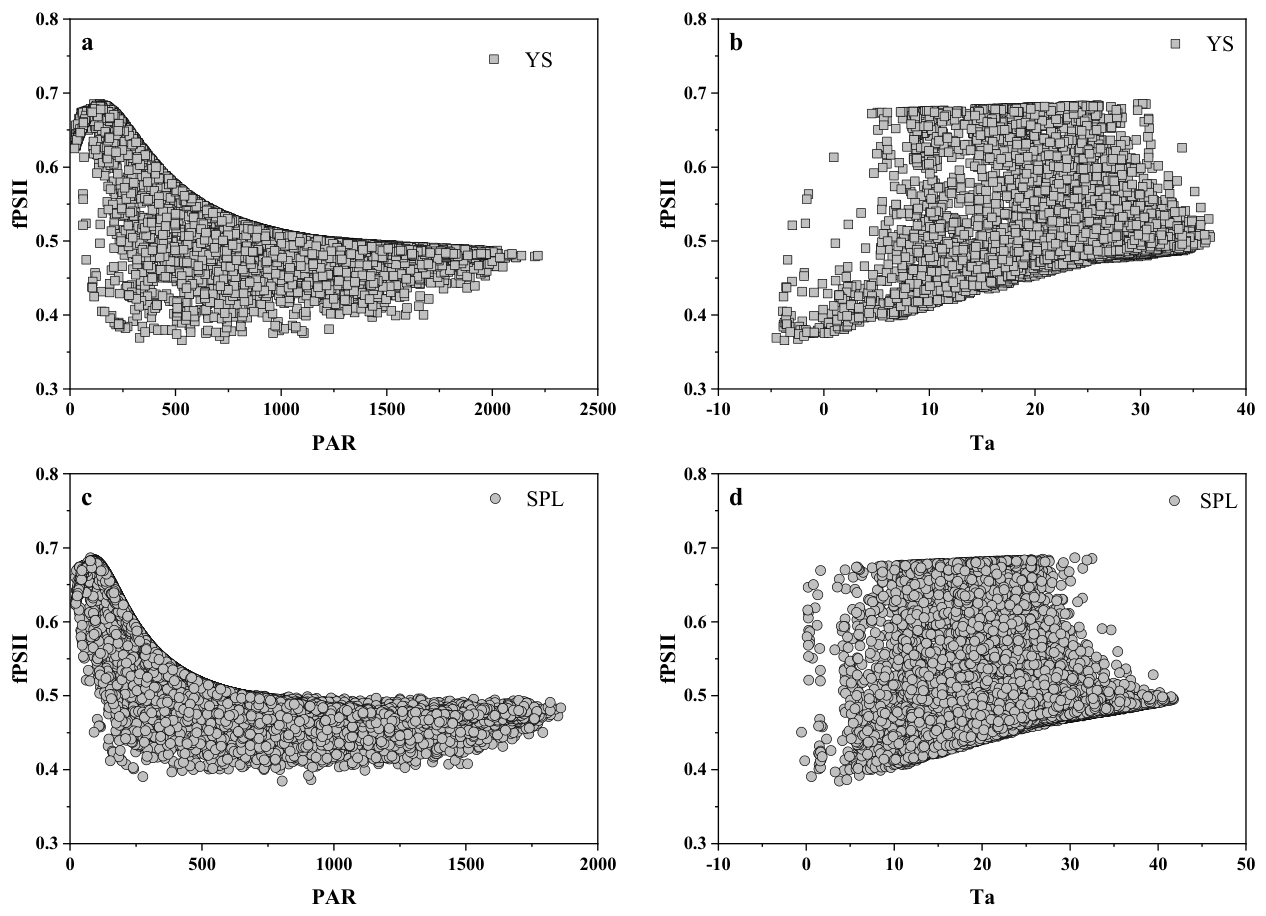
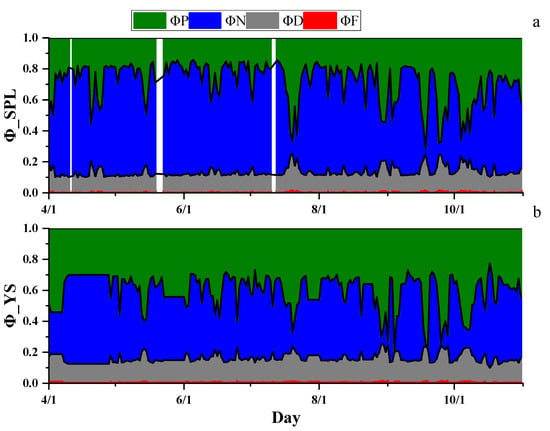
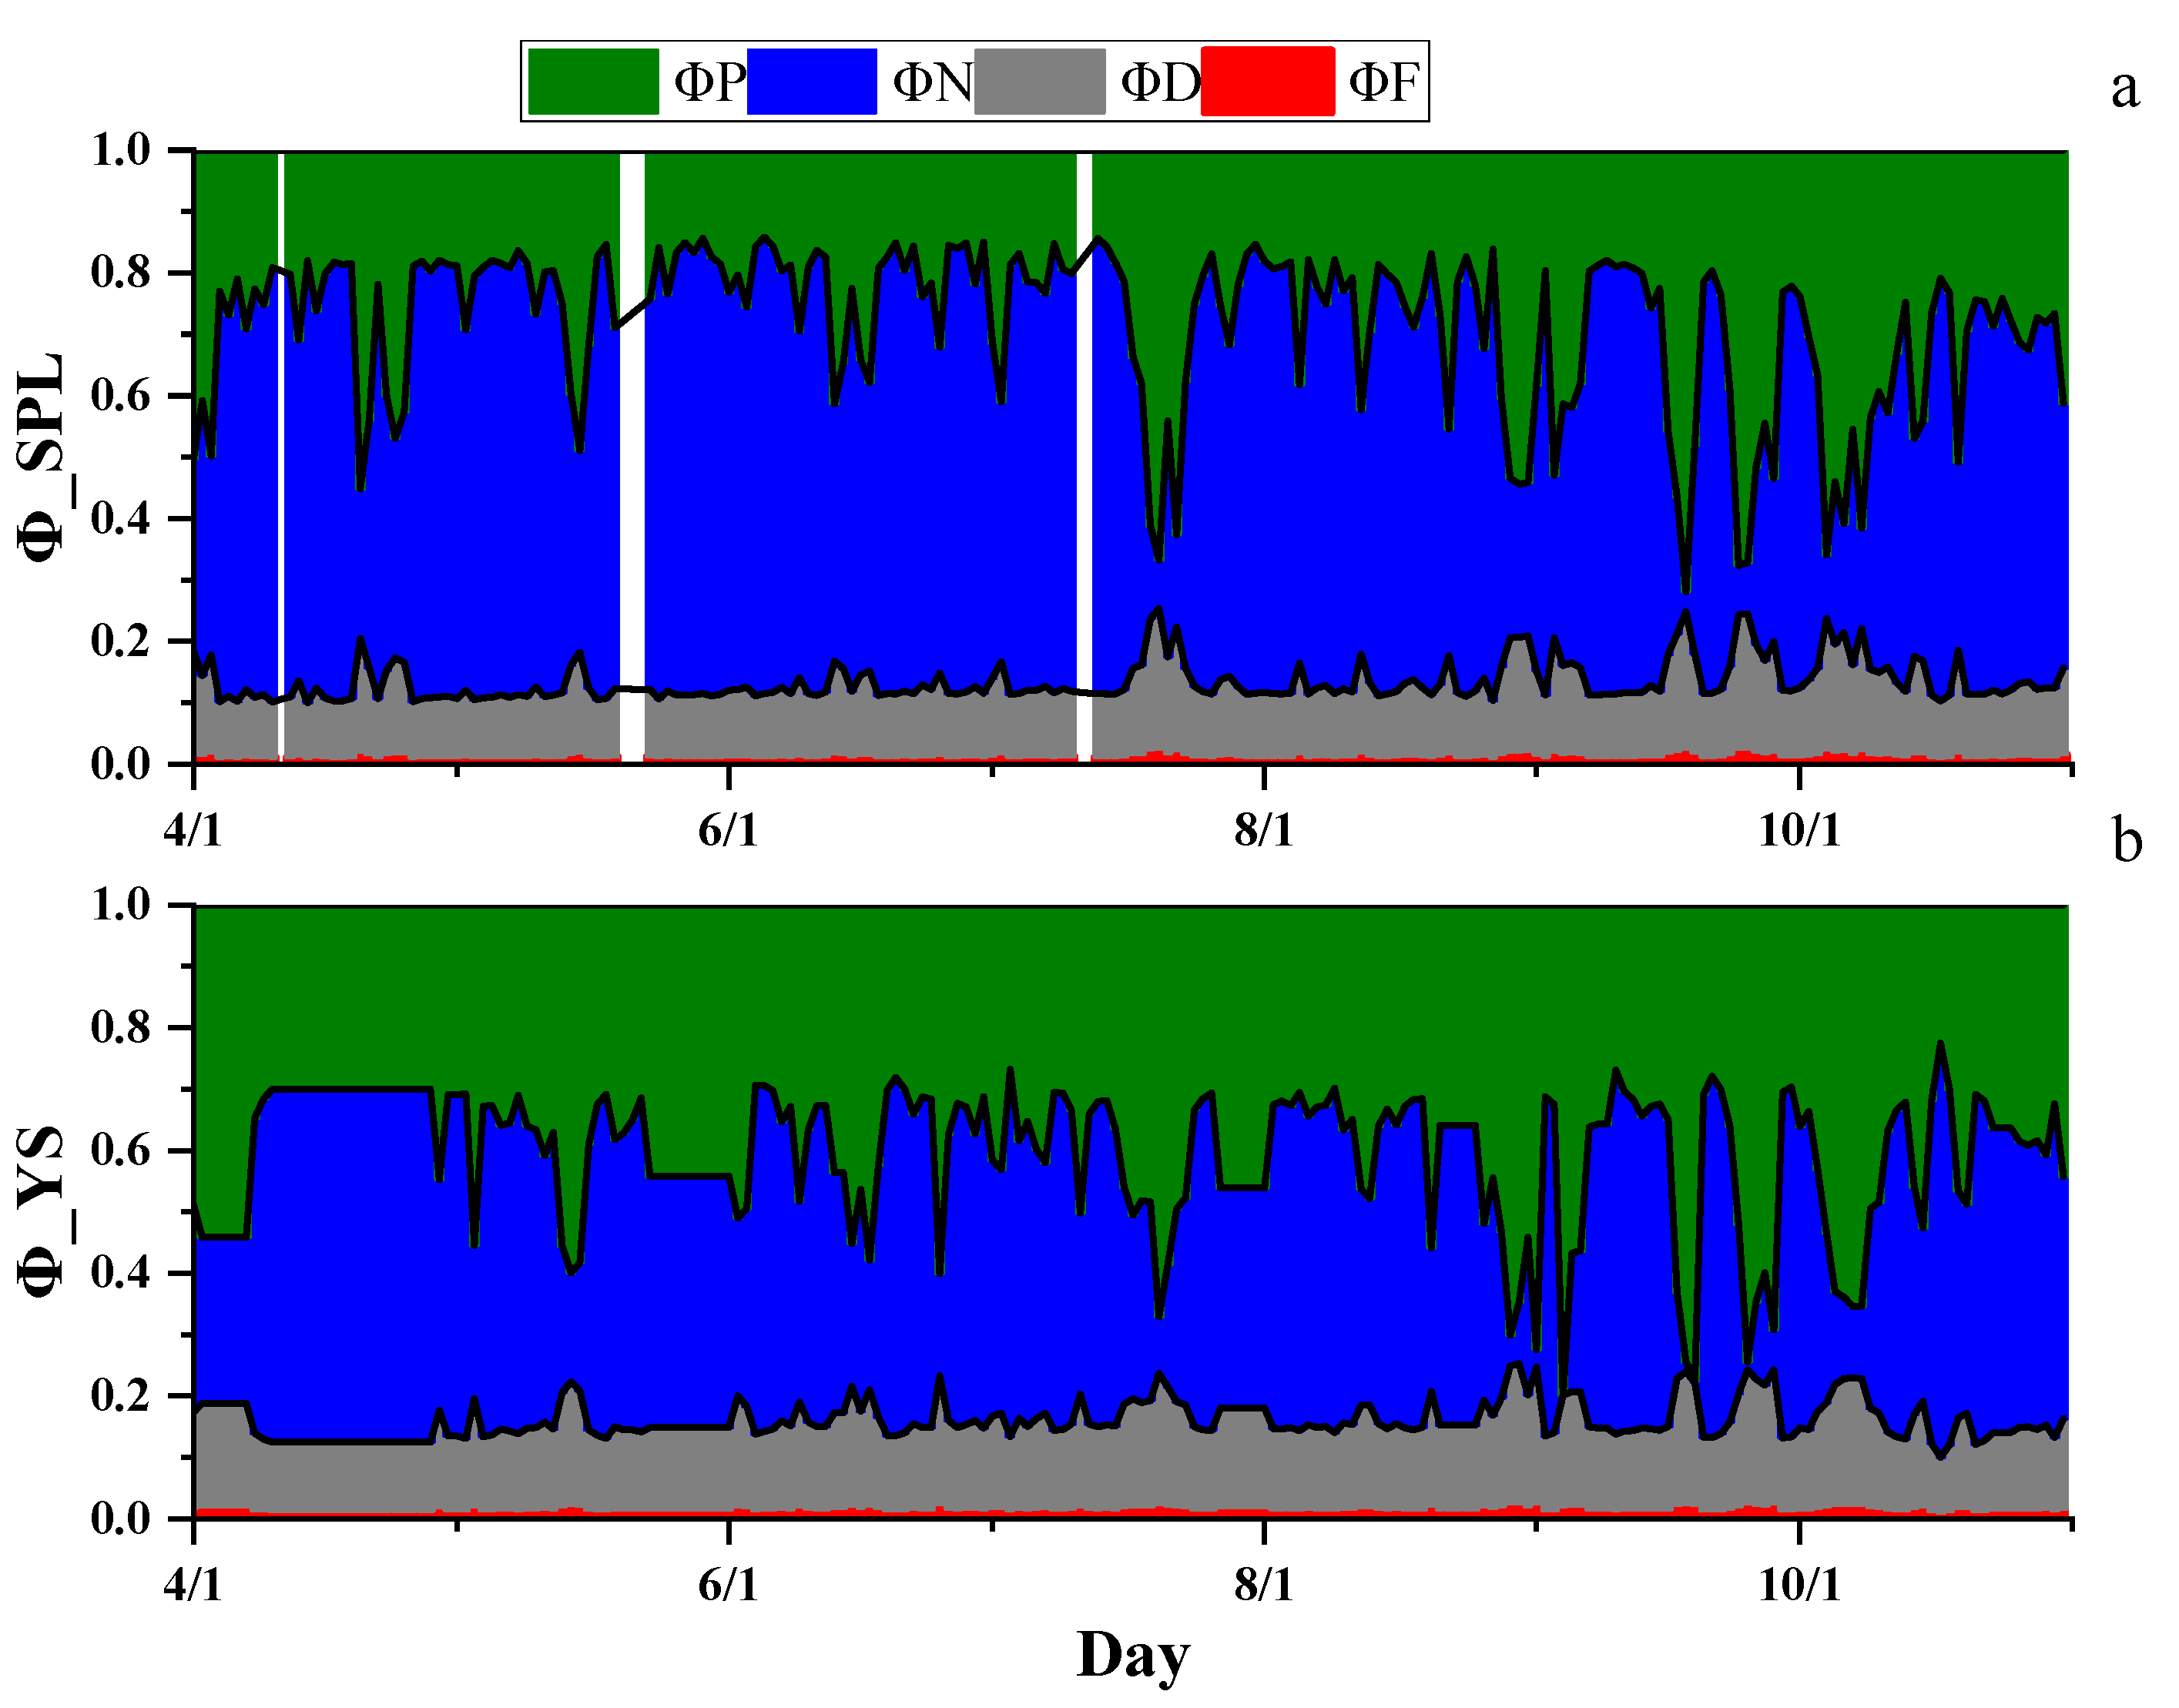
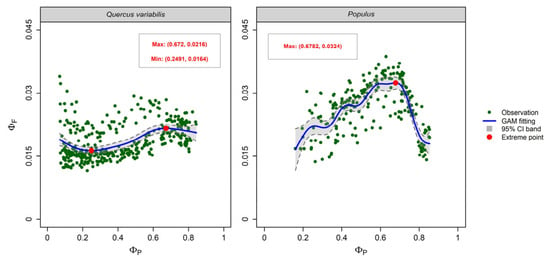
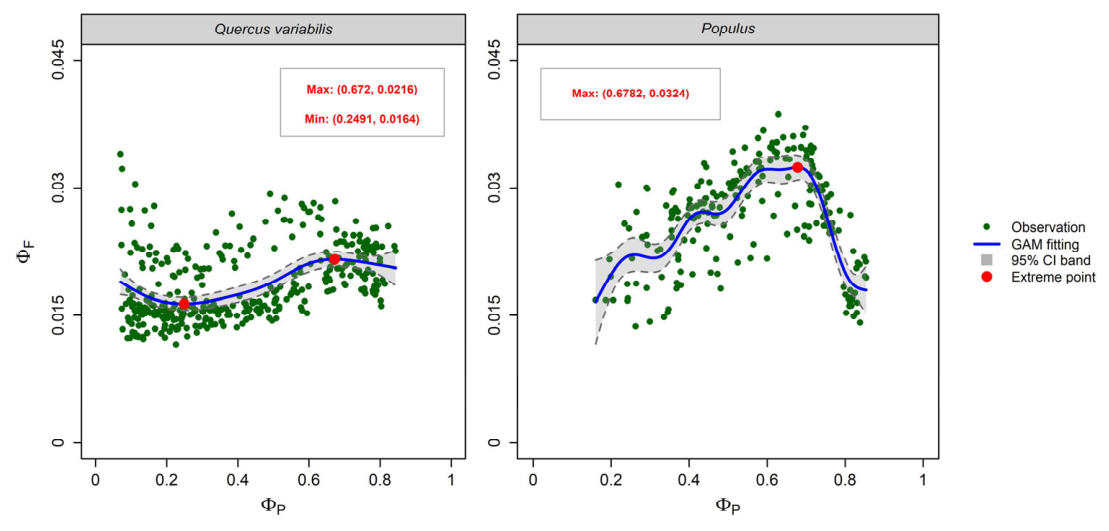

Disclaimer/Publisher’s Note: The statements, opinions and data contained in all publications are solely those of the individual author(s) and contributor(s) and not of MDPI and/or the editor(s). MDPI and/or the editor(s) disclaim responsibility for any injury to people or property resulting from any ideas, methods, instructions or products referred to in the content. |
© 2026 by the authors. Licensee MDPI, Basel, Switzerland. This article is an open access article distributed under the terms and conditions of the Creative Commons Attribution (CC BY) license.