


Highlights
What are the main findings?
- The UCRG converts calibration-derived global and class-wise source reliability into class-wise integration weights, stabilizes sparsely supported classes through reliability shrinkage, and conditionally applies soft fusion or hard source selection according to the reliability gap.
- Across FOR-instance, EvoMLS, and Lin3D, the shared UCRG parameterization achieves 70.68% mIoU. Across the six evaluated episodes, it records two negative-transfer cases compared with six for fixed-weight fusion. In the PTv3-augmented Lin3D candidate pool, the calibration-tuned UCRG reaches 59.20% mIoU.
What are the implications of the main findings?
- The aligned probability interface enables frozen predictors from different feature configurations, random seeds, and network architectures to be integrated without modifying or retraining their segmentation backbones.
- Calibration-guided integration provides a practical way to reuse available forest point cloud predictors across UAV, mobile-scanning, and cross-dataset transfer conditions without accessing query labels, while targeted confusion-pair refinement addresses recurrent local semantic ambiguities.
Abstract
Unmanned aerial vehicle (UAV) scanning and mobile laser scanning provide detailed three-dimensional observations for forest inventory and structural monitoring for which point-wise separation of ground, understory, woody components, and foliage is fundamental. Modern segmentation pipelines can produce multiple predictions from different feature configurations, training objectives, random seeds, or network architectures. However, equal and fixed-weight fusion implicitly assume stable source quality, although the relative reliability of these predictions can vary across semantic classes and sensing conditions, leading to error propagation and negative transfer. We therefore formulate multi-source prediction integration as a calibration-supported class-wise reliability decision problem and propose the unified class-wise reliability gate (UCRG). The UCRG measures global and class-wise source reliability from labeled calibration data, uses shrinkage to stabilize class-specific estimates when labels are scarce, and conditionally performs soft fusion or hard source selection according to the reliability gap. An optional calibration-guided confusion-pair refiner further targets residual ambiguity between semantically similar classes. All the reliability estimation and parameter selection processes are performed without query labels. Experiments on FOR-instance, EvoMLS, and Lin3D cover UAV and mobile laser scanning together with cross-dataset transfer. Using one shared parameterization across the three primary protocols, the UCRG obtains 70.68% mIoU and records two negative-transfer episodes across the six evaluated episodes compared with six for fixed-weight fusion. When the gate parameters are selected solely from the available calibration support in each deployment, the UCRG reaches 59.20% mean mIoU in the PTv3-augmented Lin3D candidate pool. These results show that reliability-guided decisions can exploit class-dependent complementarity across heterogeneous frozen predictors and sensing conditions.
1. Introduction
Forest point cloud semantic segmentation converts irregular laser-scanning measurements into point-level thematic information by distinguishing components such as ground, understory, woody material, and foliage. The resulting semantic representation provides an important basis for forest inventory, biomass estimation, structural characterization, and long-term ecosystem monitoring [1,2]. UAV-borne, mobile, and terrestrial laser scanning observe forest structure from complementary viewpoints and spatial scales, jointly improving the representation of canopy, stem, and below-canopy components [3,4]. Accurate semantic interpretation of these heterogeneous three-dimensional observations is therefore an essential link between forest remote sensing acquisition and quantitative forest information products.
Deep networks have advanced point cloud segmentation through direct point processing, hierarchical neighborhood learning, local geometric aggregation, and attention-based context modeling [5,6,7,8,9]. Forest-oriented methods further introduce structural priors, semantic-detail enhancement, label-efficient learning, and cross-modal guidance to separate geometrically entangled components in complex stands [10,11,12,13,14]. Despite this progress, most studies remain centered on optimizing an individual predictor under a predefined training and evaluation protocol. Practical pipelines may instead retain multiple viable predictions from complementary feature configurations, differently weighted or seeded checkpoints, and independently trained architectures. The existing model-centric approaches do not determine how these heterogeneous outputs should be integrated into a reliable and reusable decision.
The central challenge is that candidate-source reliability varies jointly across semantic classes and deployment conditions. Here, a deployment condition refers to a dataset-level protocol or transfer episode characterized by its acquisition configuration, scene composition, and class distribution. A labeled calibration set collected within that protocol provides empirical evidence of source behavior before query inference. Reliability is therefore estimated for the deployment condition represented by the calibration data rather than treated as an invariant property of a predictor. A source that performs well for foliage may be less reliable for ground or woody components, while its relative advantage may change across deployment protocols [12,15]. This setting arises concretely in our experiments through a height-based candidate and a Sen-net candidate incorporating adaptive guidance flow (AGF) and the semantic-driven detail enrichment module (SDEM) [12], differently weighted and seeded EvoMLS checkpoints, and independently trained network architectures. Equal averaging and fixed-weight fusion cannot respond to these reliability changes and may propagate errors from weaker sources [16]. Moreover, predictive confidence does not directly measure observed class-wise performance, while class imbalance can leave rare forest components with insufficient calibration labels for stable reliability estimation [13,17,18]. Together, these limitations indicate that prediction integration should be driven by observed source behavior under the current deployment condition, distinguish overall source performance from class-specific strengths, and account for the amount of available class evidence before deciding whether predictions should be combined or selected.
To operationalize this principle, we propose the unified class-wise reliability gate (UCRG), a black-box post hoc decision layer for aligned outputs from independently trained and frozen predictors. The UCRG converts labeled calibration evidence into deployment-conditioned class-wise source contributions: it estimates the observed segmentation reliability of each source for each semantic class, stabilizes sparse-class estimates through partial pooling, and controls the transition between soft fusion and source selection according to the reliability gap. This enables predictors with different feature configurations, training objectives, random seeds, or network architectures to be integrated through the same point and class interface without retraining the candidate models or accessing their internal features, logits, or architectures.
Reliability fitting, parameter selection, and query evaluation are assigned separate data roles, with query labels reserved exclusively for final evaluation. We consider two query-label-free deployment modes. The shared UCRG selects one gate parameter triple from the fixed FOR-instance and EvoMLS calibration protocols. The selected triple is then reused for the query portions of those protocols and the held-out Lin3D transfer episodes, while source reliabilities and class-wise weights are recomputed from the calibration support of each current condition. The calibration-tuned UCRG instead selects the gate parameters separately from the available calibration support for each dataset or transfer fold.
The main contributions of this work are summarized as follows:
- We propose the UCRG and formulate multi-source forest point cloud prediction integration as a black-box post hoc decision problem under condition- and class-dependent source reliability. Its aligned probability interface enables frozen predictors from different feature configurations, training objectives, random seeds, and network architectures to be handled by the same framework.
- We develop a condition-indexed reliability estimator with global and class-wise resolutions. Shrinking sparsely supported class-wise evidence toward the corresponding source’s global reliability within the same deployment condition stabilizes rare-class estimates while retaining class-specific source strengths.
- We develop a reliability-gap-controlled class-wise gate that switches between complementary soft fusion and decisive hard source selection. We further introduce a calibration-guided confusion-pair refiner as a confidence-controlled point-level extension for persistent semantic ambiguities. Reliability fitting, parameter selection, and query evaluation remain separated, and neither the shared UCRG nor the calibration-tuned UCRG requires query-label access or candidate-model retraining.
- Experiments on FOR-instance, EvoMLS, and Lin3D yield a cross-protocol average mIoU of 70.68% for the shared UCRG. In the PTv3-augmented three-source Lin3D pool, the calibration-tuned UCRG achieves 59.20% fold-averaged query mIoU compared with 55.83% for the fold-averaged best single source (query oracle) and 52.28% for equal averaging.
2. Related Work
2.1. Forest Point Cloud Semantic Segmentation
Forest point cloud semantic segmentation has progressed from geometric feature engineering to learned point representations. The early approaches combined local geometry, multiscale structural attributes, and conventional classifiers to distinguish foliage and woody components [19,20], while mode-point evolution exploited the spatial continuity of woody structures [21]. Deep networks subsequently enabled direct representation learning from irregular point sets. PointNet and PointNet++ introduced symmetric point processing and hierarchical neighborhood learning [5,6]; DGCNN, PointConv, and KPConv modeled local geometric relations [7,22,23]; and RandLA-Net, Point Transformer, PTv3, and SPVCNN advanced scalable aggregation, attention-based context modeling, and point–voxel representation [8,9,24,25]. These methods provide increasingly effective segmentation backbones, but their predictions are generally treated as the final output of an individual model.
Forest-oriented models further incorporate structural priors and task-specific guidance for geometrically entangled forest components. LWSNet performs point-based leaf–wood separation, SPTNet combines sparse convolution with transformer modeling, and PineSegNet targets fine-grained wood–leaf segmentation of Masson pine point clouds [10,26,27]. ForAINet jointly addresses semantic and individual-tree instance segmentation, while Sen-net introduces semantic-detail enrichment and adaptive guidance for forest-scene understanding [11,12]. Recent studies also explore unsupervised multispectral learning, cross-modal semantic transfer, and transferable wood–foliar semantics for 3D fuel characterization across global forest ecosystems [13,14,28]. Although these developments improve feature learning and forest-specific prediction, they remain primarily concerned with constructing or optimizing an individual model for a particular task, dataset, or sensing configuration. They do not directly address how several already available predictions should be integrated when their empirical reliability differs across semantic classes and deployment protocols. The UCRG addresses this output-level problem by applying a common black-box post hoc decision layer to aligned predictions from frozen candidate sources, thereby separating candidate-model development from reliability-guided prediction integration.
2.2. Reliability Estimation and Conditional Prediction Integration
The research related to reliability-guided prediction integration addresses two closely connected questions: how prediction reliability should be characterized and how the resulting evidence should control multiple candidate sources. For reliability characterization, deep ensembles use independently trained models to capture predictive variation [29], temperature scaling calibrates neural network probabilities post hoc [17], and evidential deep learning explicitly represents predictive evidence and uncertainty [30]. Such estimates describe properties of the predictive distribution, but they do not necessarily correspond to the observed segmentation performance of a source, particularly under dataset shift [18]. For prediction control, mixture-of-experts models learn gates over specialized predictors [31], dynamic ensemble selection estimates local classifier competence [32,33], and trusted multi-view classification weights complementary views using evidential information [34]. Transferability measures such as H-score, LEEP, and LogME provide another form of source assessment by estimating the global suitability of pretrained representations for a target task [35,36,37]. These approaches provide confidence-, competence-, view-, or model-level evidence, whereas the UCRG provides a deployment-conditioned class-wise output-level decision mechanism for frozen predictors. Mixture-of-experts methods generally learn a gating model jointly with predictors or their features [31], while dynamic ensemble selection typically estimates local or sample-wise classifier competence [32,33]. The UCRG instead uses labeled calibration outputs to recompute source contributions for each semantic class and to control soft fusion or source selection without retraining the candidate models. This distinction is important in forest point clouds, where class imbalance and occlusion can leave ground, understory, or woody components sparsely represented in labeled calibration data. Changes in sensing platform or acquisition condition further amplify this problem by altering both overall source quality and class-specific prediction strengths. The cross-condition point cloud research has primarily addressed such performance variation by adapting the predictor to the target domain.
Domain-adaptation methods modify model representations or parameters to reduce discrepancies between source and target data. MDAN and M3SDA use adversarial alignment and moment matching across multiple domains [38,39]; PointDAN aligns local and global point cloud representations, xMUDA exploits cross-modal consistency, and CoSMix combines semantic mixing with pseudo-label learning [40,41,42]. In forest environments, cross-modal semantic transfer has also been achieved through registration and probabilistic correspondence between UAV imagery and LiDAR points [14]. These methods improve target-domain prediction by adapting the underlying representation, generally through additional optimization and access to model internals; their cross-domain performance can also remain sensitive to model-selection and evaluation protocols [43]. The output-integration setting considered in this work begins after candidate-model training: multiple predictors are already available and remain frozen, while their aligned probability outputs must be combined according to their empirical reliability. The UCRG addresses this downstream decision problem by estimating condition-indexed global and class-wise reliability from labeled calibration data, stabilizing sparsely supported class estimates, and using the resulting evidence to control class-wise fusion or source selection without query-label access.
2.3. Boundary-Aware Learning and Prediction Refinement
Boundary-aware segmentation methods broadly follow three strategies: structured output regularization, explicit boundary supervision, and coarse-to-fine refinement. SEGCloud applies a fully connected conditional random field to improve spatial and semantic consistency in point cloud segmentation [44], while CRFNet learns conditional random field potentials for remote sensing image segmentation [45]. Explicit boundary learning instead introduces additional supervision or representation constraints. JSENet jointly predicts point-wise semantic labels and three-dimensional edges [46], and contrastive boundary learning separates adjacent point classes through boundary-oriented contrastive constraints [47]. In remote sensing imagery, boundary-aware multitask learning uses boundary detection and regularization to preserve local structures [48], while BMNet combines multiscale attention with boundary guidance to recover detailed object contours [49].
Recent work further integrates boundary reasoning with feature fusion and progressive refinement. BaAFN combines cross-level attention fusion with a semantic-aware contrastive boundary loss for remote sensing semantic segmentation [50], and BARNet employs multiscale boundary attention and boundary-aware decoupling to refine weakly supervised change-detection predictions [51]. In forest point clouds, Sen-net enriches semantic details where woody and foliage structures overlap [12]. These studies demonstrate the value of structured constraints, boundary supervision, and refinement, but most recent approaches incorporate boundary processing into network training or apply regularization across the full prediction. The calibration-guided confusion-pair refiner in the UCRG operates after reliability-gated integration: it identifies the dominant ambiguous class pair from calibration errors and applies confidence-controlled point-level correction within the corresponding candidate regions. This design links class-wise source integration with targeted refinement of residual semantic ambiguity.
3. Methodology
3.1. Problem Formulation and Framework Overview
For a deployment condition d, the proposed framework receives a labeled calibration set and a query point cloud , where is the number of query points and F is the input feature dimension. The deployment condition is fixed throughout one calibration–query protocol; its superscript is omitted below when no ambiguity arises.
The framework separates candidate-model development from prediction integration. Let denote the set of independently trained and frozen candidate prediction sources, and let . Each source is a predictor obtained from a particular feature configuration, training objective, random seed, or network architecture. The frozen sources are applied to both calibration and query cases. After deterministic point and class alignment, source provides the following K-class probability vector for query point i:
For a query case containing points, the aligned outputs of source s are stacked into
The common interface requires all the sources to assign predictions to the same points in the same point order and to follow the same semantic-class order. When a predictor operates on a subsampled point set, its outputs are projected back and reordered according to the common point set. When a source uses a different class organization, its probability channels are mapped to the canonical semantic-class order. The same alignment procedure is applied to calibration and query outputs, ensuring that source reliability and query-time integration are computed in a consistent point and class space.
The reliability-gated integration stage consumes the aligned calibration probabilities, calibration labels, and aligned query probabilities. The calibration outputs and labels provide empirical evidence for estimating global and class-wise source reliability, while a disjoint internal calibration subset is used to select the gate parameters. Once calibration is complete, the gate parameters and class-wise source weights are fixed for query inference. This output-level formulation leaves the candidate predictors unchanged and requires no access to their internal representations.
As illustrated in Figure 1, the frozen predictors first produce aligned query probability matrices . The UCRG combines these outputs according to calibration-derived source reliability and produces the fused class-score matrix
Point-wise maximization of gives the base UCRG prediction . A subsequent calibration-guided confusion-pair refiner performs confidence-controlled point-level correction within the calibration-identified ambiguous class pair, yielding the final semantic labels . Query labels are reserved exclusively for final performance evaluation.
Figure 1.
Overall processing pipeline of the proposed framework from independent candidate-model training and output alignment to reliability-gated integration and confusion-pair refinement.
3.2. Calibration-Supported Source Reliability Estimation
The labeled calibration data are divided at the point level within each calibration scene or plot into a reliability-fitting subset and a disjoint parameter-selection subset . The split is class-stratified and uses a 50:50 fit–selection ratio when each class has sufficient support. If a class contains fewer than two available points, its available points are retained in the fitting subset. No point is used in both subsets.
The reliability-fitting subset is used to estimate global and class-wise source reliability, including shrinkage quantities. The parameter-selection subset is used to select from the predefined grid. After selection, reliability is recomputed from the complete calibration support before frozen query evaluation. Query labels are not used in reliability estimation, parameter selection, or gate construction.
Because the split is performed among points within the same scene or plot, the two subsets are disjoint at the point level but are not assumed to be spatially independent. Neighboring LiDAR points may remain spatially correlated. The repeated-seed audit below therefore evaluates sensitivity to the point-level partition rather than claiming independence between the two subsets.
3.2.1. Global and Class-Wise Source Reliability
After concatenating the points from the reliability-fitting cases, let denote the corresponding point-index set. For source , the aligned probability output for point i is , and denotes its canonical ground truth class. The discrete calibration prediction of source s is obtained by selecting the class with the largest predicted probability:
Let denote the number of reliability-fitting points whose ground truth class is c:
The set of classes represented in the reliability-fitting subset is
For source s, the calibration confusion matrix is defined by
Here, a denotes the ground truth class and b denotes the predicted class. The diagonal entries represent correct predictions, whereas the off-diagonal entries represent class confusions.
For class c, the corresponding true-positive, false-positive, and false-negative counts are
We use class-wise IoU as the gating reliability because it directly measures the quality of the hard segmentation outcome for the class being weighted. Unlike class accuracy, IoU accounts for both false positives and false negatives and is less dominated by the frequency of prevalent classes. Its macro-average is also consistent with the primary mIoU evaluation criterion. Confidence, ECE, Brier score, and NLL characterize the quality of probability estimates but do not directly measure class-specific segmentation overlap or the confusion between semantic classes. They are therefore complementary calibration diagnostics rather than replacements for the task-level reliability used by the UCRG.
Accordingly, the class-wise source reliability is defined as the class-specific intersection over union:
The global reliability of source s is the macro-average of its class-wise reliability over the classes represented in the reliability-fitting subset:
Thus, summarizes the overall source performance within the current calibration condition, whereas records the source reliability for a particular semantic class. Both quantities are computed from calibration predictions and labels before gate construction.
For candidate sources, the measured class-wise reliabilities over the observed calibration classes form
The global source reliabilities form the vector
When all the canonical classes are represented, , is equivalent to the standard K-class mIoU of source s on the reliability-fitting subset. Thus, summarizes source-wide performance within the current deployment condition, whereas captures the reliability of that source for semantic class c.
The calculation of , , and is deterministic and introduces no additional trainable parameters. These quantities provide the reliability evidence used by the subsequent gate, as summarized in Figure 2.
Figure 2.
Detailed mechanism of the UCRG reliability-gated decision process from calibration-based reliability estimation to query-time prediction integration and confusion-pair refinement. The gap-triggered hard-selection branch is enabled only when ; setting bypasses this branch and retains soft source weights for all the classes.
3.2.2. Reliability Shrinkage Under Sparse Calibration Labels
Class-wise source reliability can be unstable when only a small number of labeled calibration points are available for a semantic class. Directly using such estimates may cause the gate to overreact to sampling variation, particularly for rare or partially occluded forest components. The UCRG therefore uses a deterministic shrinkage rule that combines class-wise reliability with the corresponding global source reliability within the same calibration condition.
Let denote the shrinkage strength. For an observed class , define the class-support coefficient as
The stabilized class-wise reliability of source s is then
The coefficient increases with the number of labeled calibration points. Thus, classes with sufficient calibration support retain more of their measured class-wise reliability, whereas classes with limited support borrow more information from the corresponding global source reliability. This partial-pooling rule reduces the influence of sampling variation while preserving class-specific source strengths when sufficient evidence is available.
If a canonical class is absent from the reliability-fitting subset (), its direct class-wise reliability is unavailable. The shrinkage rule then has , and its stabilized reliability is defined by the corresponding global source reliability:
The shrinkage strength is fixed a priori at and remains unchanged across datasets, calibration-label budgets, and evaluation folds. It is not selected using or query labels. The stabilized reliabilities , together with the global reliabilities , are passed to the global–class reliability mixing stage described in the next subsection.
3.3. Unified Class-Wise Reliability Gate
After source reliability has been estimated and stabilized through shrinkage, the UCRG converts the resulting evidence into class-wise source weights. Let denote the number of candidate sources. The gate combines global and class-wise reliability and then uses the reliability gap to determine whether source probabilities should be softly fused or whether the most reliable source should be selected. Its three parameters are the global–class mixing coefficient , the softmax temperature , and the reliability-gap threshold . These parameters are selected using the internal calibration procedure described in Section 3.4. The UCRG itself introduces no trainable network or backpropagation loss. The confusion-pair refiner described in Section 3.6 is trained separately on calibration data.
3.3.1. Global–Class Reliability Mixing
Let denote the global reliability of source s, and let denote its shrinkage-stabilized reliability for semantic class c. The UCRG combines these two types of evidence as
where is the mixed reliability score of source s for class c. Setting uses only the stabilized class-wise reliability, whereas uses only the global reliability. The mixed scores form
3.3.2. Temperature-Controlled Soft Fusion
For each semantic class c, the mixed scores are converted into source weights by applying softmax along the source dimension:
The resulting soft-weight matrix is
A smaller concentrates the weight on the more reliable sources, whereas a larger produces smoother source contributions. Since the softmax is applied independently for each class, the weights are class-wise rather than point-wise: after calibration, remains fixed across query points but may differ across semantic classes.
3.3.3. Reliability-Gap-Based Hard Selection
Soft fusion is retained when candidate sources have comparable reliability. When one source is clearly stronger for a class, contributions from weaker sources may instead cause negative transfer. Let and denote the largest and second-largest mixed reliability scores for class c, respectively. The reliability gap is
The most reliable source for class c is
The final class-wise source-weight vector is
Thus, the UCRG retains temperature-controlled soft fusion when the reliability gap is below the threshold and selects the strongest source when the gap is decisive. Setting disables the hard-selection branch and retains soft fusion for all the classes. When , hard selection is activated only if . For a single-source candidate pool, the softmax weight is one and the UCRG reduces to the identity decision.
3.3.4. Query-Time Gated Integration
Let denote the aligned probability assigned by source s to class c for query point i. The final class-wise weights are applied to the query predictions as
For a query set containing points, the fused class scores form
Because different classes may use different source-weight vectors, is a fused class-score matrix rather than a normalized class-probability matrix. The base UCRG prediction is obtained by point-wise decoding:
3.4. Query-Label-Free Parameter Selection and Shared Deployment
The shrinkage strength is fixed a priori at . The remaining gate parameters are collected into
where controls the concentration of the soft source weights, controls the balance between global and class-wise reliability, and determines when soft fusion is replaced by hard source selection. The predefined search space is denoted by
Only the decision-layer parameters in are selected; the candidate predictors remain frozen throughout this process.
Let index an evaluation dataset or deployment protocol, and let denote its associated calibration folds. For dataset d and fold , global and class-wise source reliabilities are estimated exclusively from . The resulting UCRG is then evaluated on the disjoint parameter-selection subset . The internal calibration score of a parameter setting is defined as
where denotes the UCRG prediction obtained with parameters and source reliability estimated from . The calibration-tuned UCRG selects the best setting for each fold as
For a dataset with a single calibration–query split, contains one fold. For datasets with multiple transfer folds, the fold-specific settings are selected independently from their corresponding calibration data. In all cases, the query labels are reserved for final performance evaluation and are not used in reliability estimation or parameter selection.
For leakage-controlled shared deployment, we distinguish the evaluation set from the shared-parameter selection set . In this study,
Both protocols have fixed and disjoint calibration and query sets. Lin3D is excluded from shared-parameter selection because its annotated plots rotate between calibration and query roles across leave-one-plot episodes.
For each , the dataset-level internal calibration score is obtained by averaging over its calibration folds:
This gives each fold equal influence within its dataset. Let
denote the best dataset-level internal calibration score. We define the relative calibration regret of on dataset d as
where prevents numerical instability when is close to zero.
The shared UCRG selects one parameterization by minimizing the mean relative regret across the calibration datasets:
Each selection dataset contributes one normalized calibration objective irrespective of its number of calibration folds. After selection, is frozen and transferred unchanged to every protocol in , including all the Lin3D leave-one-plot episodes.
During deployment, source reliabilities and class-wise weights are recomputed from the calibration support of the current dataset or fold. Within each Lin3D episode, only the designated support-plot labels are used for this computation; the remaining three plots are reserved for final query evaluation. Consequently, no Lin3D label contributes to the selection of .
To assess sensitivity to the calibration partition, we repeated the point-level class-stratified fit–selection procedure over ten seeds . For each seed, the gate parameters were selected using only the parameter-selection subset, and the selected shared parameterization was then evaluated on the frozen query outputs. The shared parameterization was in all ten repetitions. Supplementary Table S18 reports the shared parameters and corresponding query results. Dataset-specific selections from this audit are recorded separately in the accompanying audit JSON.
3.5. Candidate Prediction Pools and Class Alignment
The candidate prediction pool provides the inputs to the UCRG decision layer. A candidate source may correspond to a feature branch, training objective, random-seed realization, or network architecture. Let denote the candidate-source set and its size. The UCRG does not require a fixed number of sources; each source only needs to provide point-wise class probabilities that can be mapped to the common point and class interface.
For the primary experiments, each candidate pool was fixed before query evaluation. A predictor was included only if it had been trained and frozen before the comparison, produced complete point-aligned probabilities for both calibration and query cases, and could be mapped to the protocol-specific canonical class order. Candidate inclusion was determined by the prespecified feature configuration, training objective, random-seed realization, or architecture associated with the protocol. Query labels, query mIoU, and retrospective query ranking were not used for candidate inclusion.
The primary pools contain height and AGF/SDEM for FOR-instance and Lin3D, and raw, ground-weighted, raw seed 2027, and ground-weighted seed 2027 for EvoMLS. Additional trained predictors were evaluated separately: PointNet in the EvoMLS cross-architecture experiment, PointNet, KPFCNN, RandLA-Net, and Sen-net in the four-architecture Lin3D experiment, and PTv3 in the augmented Lin3D experiment. These experiments examine different candidate-pool compositions and are reported separately from the primary comparison. Stacker and refiner checkpoints are integration or refinement components rather than independent candidate predictors.
Before reliability estimation and prediction integration, the outputs of all candidate sources are harmonized. Point correspondence ensures that corresponding rows refer to the same points in the same order. When a source operates on a subsampled point set, its outputs are projected back to the common point set and reordered accordingly. Class alignment maps probability channels and reference labels to the canonical semantic-class order of the corresponding protocol. These transformations are deterministic and applied identically to calibration and query outputs.
When candidate sources or evaluation protocols use different class organizations, their probability channels are mapped to the canonical class set before reliability estimation. In the four-class forest protocol, the stem and woody-branch probabilities are combined into the wood class:
The corresponding reference labels are mapped to the same canonical class space. Since the merged channels form a disjoint partition of the original probability vector, the mapped output remains a valid class-probability vector.
The resulting aligned outputs use the matrix notation introduced in Section 3.1, where for a query case. The same interface is used by the reliability estimator and the subsequent class-wise gate. Fixed fusion, CSO, MSO, and target-plot branch selection are used as reference decision strategies in the experimental comparison.
3.6. Calibration-Guided Confusion-Pair Refinement
The reliability gate determines how candidate prediction sources contribute to the base prediction, while residual errors may remain concentrated between semantically similar classes. A calibration-guided confusion-pair refinement stage can therefore be applied after the base UCRG prediction. It uses calibration errors to identify the dominant ambiguous class pair and applies confidence-controlled corrections to the associated query points.
Let denote the confusion matrix of the base UCRG prediction computed on labeled calibration data, where counts points with true class a and base UCRG prediction b. For each unordered class pair , we define the symmetric confusion rate as
The selected pair is determined entirely from calibration predictions and labels, providing a reproducible refinement target for the current deployment condition. Manually specified and randomly selected pairs are considered only in the ablation analysis.
The query candidate set passed to the refiner is
For each , the refinement feature vector combines the aligned candidate probabilities with the base UCRG output. It includes the source-wise probabilities, their mean and standard deviation, normalized fused UCRG scores, the score margin, predictive entropy, source agreement, and normalized height. These features describe both the cross-source prediction pattern and the semantic ambiguity of the point.
Let denote the subset of whose ground truth and base UCRG labels both belong to . A lightweight PairMLP is first trained on this subset. Given a standardized refinement feature vector , the network produces a scalar logit
and the probability
of class . With the binary target
the network parameters are optimized using the unweighted binary cross-entropy loss
The implementation evaluates this objective in its numerically stable logit form. At inference,
A pair-specific confidence threshold is selected on . After threshold selection, the PairMLP is retrained with the same objective using the complete calibration set while the selected threshold remains fixed. Neither model training nor threshold selection uses query labels.
The final prediction applies a correction only when the point belongs to the selected candidate set, the predicted pair label differs from the base UCRG label, and the correction confidence reaches the selected threshold:
The resulting framework first produces the base UCRG prediction and may then apply calibration-guided correction to the selected confusion pair. This refinement stage is optional; unless explicitly stated otherwise, the reported UCRG results refer to the base gate output .
4. Experimental Results and Analysis
4.1. Experimental Setup
4.1.1. Datasets and Evaluation Protocols
We evaluate the UCRG on three public forest point cloud datasets: FOR-instance, EvoMLS, and Lin3D [12,52,53]. They represent UAV and mobile laser scanning and differ in point density, acquisition geometry, forest structure, and semantic-class organization. Unless otherwise stated, the shared UCRG and the calibration-tuned UCRG denote the base reliability-gated outputs before refinement. The results obtained after applying the confusion-pair refiner are explicitly denoted UCRG+Refiner.
For the primary evaluation, all the candidate outputs are mapped to a common four-class semantic interface before reliability estimation and prediction integration. The dataset-specific candidate pools and evaluation protocols are summarized in Table 1.
Table 1.
Datasets, candidate prediction pools, and evaluation protocols.
FOR-instance follows its official split. EvoMLS uses the strict four-class full-scene protocol, while its wood/foliage-only comparison with published results is reported as supplementary protocol context. Lin3D is evaluated under FOR-instance-to-Lin3D transfer: one labeled plot is used for calibration in each leave-one-plot episode, and the remaining three plots are used for query evaluation. The PTv3-augmented Lin3D candidate pool is evaluated separately in Section 4.4.3.
4.1.2. Evaluation Metrics
We report overall accuracy (OA), mean intersection over union (mIoU), and class-wise IoU when detailed error analysis is required. Let d index the evaluation protocol and denote its canonical class set. For class ,
The reported macro-averaged mIoU is
The overall accuracy is defined as
where N is the number of evaluated points. Because forest point cloud datasets are class-imbalanced, mIoU is used as the primary metric because it gives equal influence to the evaluated classes. OA and class-wise IoU provide complementary information on point-level and class-specific performance.
For leave-one-plot evaluations, metrics are computed separately for each query episode and then averaged across episodes when a fold-level summary is reported. The architecture-comparison results are computed by pooling the confusion counts over the evaluated query plots, as specified in the corresponding table notes.
4.1.3. Leakage Control and Implementation Details
All the candidate predictors are trained independently and frozen before the UCRG decision stage. The UCRG uses only their saved, point- and class-aligned probability outputs and does not access model parameters, intermediate features, training losses, or optimization histories.
For each calibration protocol, labeled calibration points are divided into disjoint, class-stratified reliability-fitting and parameter-selection subsets within each calibration scene or plot, as specified in Section 3.2. The ten-seed audit confirms that the selected shared UCRG parameterization is unchanged across these point-level partitions. The first subset is used to estimate global and class-wise source reliability, including shrinkage quantities, whereas the second is used to select gate parameters in the predefined search space. The fixed shrinkage strength and parameter-selection procedure follow Section 3.4.
Query labels are reserved exclusively for final evaluation. Shared-parameter selection uses only the fixed FOR-instance and EvoMLS calibration sets, and Lin3D is held out from this selection. The resulting is fixed before Lin3D evaluation.
Within each Lin3D episode, one labeled plot supplies fold-specific reliability evidence, while the remaining three plots are used only for query evaluation. Candidate-training details, parameter grids, fold-level results, and artifact provenance are provided in the Supplementary Materials. Because the Lin3D query sets overlap across episodes, their standard deviation describes episode-wise variation rather than uncertainty across independent trials.
4.2. Primary Cross-Dataset Evaluation
4.2.1. Standalone Candidate Performance
Table 2 reports every frozen source in the primary pools defined in Section 3.5. These query results were not used to construct the pools.
Table 2.
Standalone query performance of the frozen candidate sources used in the primary experiments. Lin3D values are averaged over the four leave-one-plot query episodes.
4.2.2. Overall Comparison of Decision Protocols
Table 3 compares reliability-agnostic fusion, calibration-based hard selection, calibration-optimized class-wise fusion, KNORA-E, the calibration-tuned UCRG, and the shared UCRG. The calibration-tuned UCRG selects gate parameters separately for each calibration protocol, whereas the shared UCRG transfers one parameterization across all three datasets. The additional baselines use the same aligned frozen candidate probabilities and calibration/query cases. Calibration-optimized class-wise fusion minimizes normalized fused-probability NLL on the complete calibration support, with non-negative source weights summing to one for each class. KNORA-E estimates local competence in the space of concatenated source probabilities using labeled calibration points. Query labels are used only for final evaluation. The implementation details are provided in Supplementary Section S8.2.
Table 3.
Cross-dataset mIoU (%) under the strict evaluation protocols. The “average” column is the unweighted mean of FOR-instance, EvoMLS, and fold-averaged Lin3D. The table includes reliability-agnostic fusion, calibration-based selection, calibration-optimized class-wise fusion, KNORA-E dynamic ensemble selection, and UCRG variants. Negative transfer counts the episodes in which a method performs below the strongest individual candidate. The counts are reported over the six evaluated episodes, whose four Lin3D query sets overlap.
The shared UCRG achieves a mean mIoU of 70.6805% compared with 70.6202% for calibration-based hard selection and 70.7027% for the calibration-tuned UCRG. Across the six evaluated episodes, the shared UCRG records two negative-transfer episodes compared with six for fixed-weight fusion and zero for calibration-based hard selection. Because the Lin3D query sets overlap, these counts are interpreted as observations under the evaluated protocol rather than independent-trial estimates.
4.2.3. Fold-Level Comparison with Calibration-Based Hard Selection
Table S23 reports the paired episode-level comparison between the shared UCRG and calibration-based hard selection. Both methods use the same frozen query outputs. The -point difference in Table 3 is computed from the three protocol-level means, whereas the unweighted mean of the six episode-level paired differences is points. This difference reflects the distinct aggregation levels.
Across the six episode-level paired differences, the descriptive mean is percentage points with a 95% t-based interval of points. An exact paired sign-flip test gives based on the three nonzero paired differences. Because the four Lin3D query sets overlap and the number of episodes is small, these intervals and the permutation result are descriptive rather than evidence from independent trials. The shared UCRG is therefore interpreted as competitive with calibration-based hard selection under the evaluated protocols rather than statistically superior.
4.2.4. Class-Wise Query Performance
To examine the effect of class-dependent integration, Table 4 reports query class-wise IoU for fixed-weight fusion, calibration-optimized class-wise fusion, KNORA-E dynamic ensemble selection, calibration-based hard selection, the calibration-tuned UCRG, and the shared UCRG. The class order is ground, low vegetation, wood, and crown for FOR-instance; ground, understory, wood, and foliage for EvoMLS; and ground, lower objects, wood, and foliage for Lin3D. The Lin3D values are averaged over the four leave-one-plot episodes; fold-level values and query class counts are provided in Supplementary Table S20.
Table 4.
Query class-wise IoU (%) for the main integration protocols. Lin3D values are arithmetic means over the four leave-one-plot episodes.
The class-wise results show that the effect of the UCRG is selective rather than uniform across classes. Relative to fixed-weight fusion, the shared UCRG improves ground and low vegetation on FOR-instance, ground, understory, and wood on EvoMLS, and all four classes in the Lin3D episodes. In particular, the rare lower-object class improves over fixed fusion in all four Lin3D episodes, although its IoU remains low. Compared with calibration-based hard selection, however, the shared UCRG is not uniformly better: hard selection remains stronger on FOR-instance and is equal to or slightly better than the shared UCRG on Lin3D. These results indicate class-dependent source reallocation rather than a uniform improvement of every semantic class.
The query class-support vectors are for FOR-instance and for EvoMLS. For Lin3D, the lower-object class contains only 9002–13,499 query points per episode compared with approximately 0.96–1.00 million foliage points. The complete fold-level counts are reported in Supplementary Table S20.
4.2.5. Source Calibration and Temperature Sensitivity
We evaluated source calibration using ECE, the multiclass Brier score, and NLL on the calibration selection subset. Per-source probability-space temperatures were fitted by minimizing NLL on the disjoint calibration fit subset. Because the stored predictions were probabilities rather than logits, we applied the transformation . Source-level calibration metrics were lower after recalibration for most source–fold combinations (Supplementary Table S19). On the frozen query sets, the resulting UCRG mIoU changed by percentage points for FOR-instance and points for EvoMLS. For Lin3D, three folds were unchanged and one increased by 0.5679 points, corresponding to a four-fold mean increase of 0.1420 points. Thus, this per-source recalibration generally improved calibration metrics but did not consistently improve segmentation performance.
4.2.6. Comparison with Published Results and Architecture Baselines
Table 5 places the shared UCRG in the context of representative published results and architecture baselines. The FOR-instance and EvoMLS baselines are taken from the cited studies under their corresponding strict protocols. The Lin3D architectures were trained on FOR-instance and evaluated as frozen predictors on the four annotated Lin3D plots; their results are pooled across plots, while the shared UCRG follows the four-episode protocol of the primary evaluation.
Table 5.
Comparison with published results and architecture baselines under the indicated evaluation protocols.
The shared UCRG reaches 78.83% mIoU on FOR-instance, exceeding Sen-net by 0.63 percentage points, and obtains 77.98% on EvoMLS, exceeding GMFE-Net while remaining below LSSegNet and RandLA-Net. On Lin3D, PTv3 provides the strongest pooled single-architecture result at 53.23%, while the shared UCRG reaches 55.23% under the primary height–AGF/SDEM integration protocol. The PTv3-augmented candidate pool is examined in Section 4.4.3, and the four-architecture extension reaching 57.44% is reported in the Supplementary Materials.
4.3. Analysis of Reliability-Gated Integration
4.3.1. Shared Versus Calibration-Tuned Deployment
Table 6 examines whether one externally selected gate parameterization can be reused across heterogeneous deployment conditions. The calibration-tuned UCRG selects separately from the calibration support of each protocol, whereas the shared UCRG fixes , selected using only FOR-instance and EvoMLS calibration data, and transfers it unchanged to Lin3D. In both modes, source reliabilities and class-wise weights are recomputed from the corresponding deployment calibration data.
Table 6.
Selected gate parameters and query mIoU (%) under calibration-tuned and shared UCRGs. Difference is computed as shared UCRG minus calibration-tuned UCRG.
Although the calibration protocols favor different gate settings, the shared UCRG remains within 0.0222 percentage points of the calibration-tuned UCRG when averaged over the three evaluated protocols. It slightly improves the FOR-instance result, matches the EvoMLS result, and decreases the Lin3D result by 0.2422 points. These results support reuse of the selected parameterization within the evaluated protocols and in the held-out Lin3D transfer setting. They do not by themselves establish general transferability to unseen datasets or arbitrary candidate pools. Lin3D is excluded from shared gate parameter selection, while its designated support plot remains available for fold-specific reliability estimation.
4.3.2. Gate Parameter and Component Analysis
Table 7 examines the three gate parameters through one-factor sensitivity analysis. The candidate predictions and reliability estimates remain fixed, while one parameter is varied around the shared UCRG setting . Because this setting is selected from calibration data, the query-side sweep is used only to characterize gate behavior.
Table 7.
One-factor sensitivity analysis of UCRG. Panel (a) reports dataset-wise mIoU (%) as varies. Panel (b) reports the cross-dataset average mIoU (%) and negative-transfer count as or varies. The remaining gate parameters are fixed at the shared UCRG setting. Bold mIoU values indicate column bests; ties are retained.
Figure 3 and Supplementary Table S24 report the joint parameter sweep. The highest protocol-level mean mIoU is 70.7494% at , 0.0689 percentage points above the calibration-selected shared setting. The effect of on negative transfer depends on and , with reducing the observed count for many combinations.
Figure 3.
Joint sensitivity of the UCRG to , , and under the primary frozen-output protocols. The upper panel reports the protocol-level mean query mIoU (%); the lower panel reports the observed negative-transfer count over the six evaluation episodes. Each panel contains one heatmap for a fixed , with on the horizontal axis and on the vertical axis. The query-side sweep is used for sensitivity analysis only; it is not used to select the reported shared parameterization.
Supplementary Figures S2 and S3 examine limited-label effects on lower-object IoU and overall mIoU, respectively.
Table 8 further isolates the effects of reliability resolution, sparse-support shrinkage, and reliability-gap selection. All the variants use the externally selected temperature , and denotes soft-only integration.
Table 8.
Component ablation under the leakage-controlled shared parameterization. All the variants use . Mean mIoU is the arithmetic mean over FOR-instance, EvoMLS, and fold-averaged Lin3D. The shared parameterization is selected using only FOR-instance and EvoMLS calibration data.
Shrinkage provides its clearest benefit under cross-dataset transfer. For class-wise soft fusion, it increases Lin3D mIoU from 54.7067% to 55.2321%; under the complete shared gate, it similarly increases Lin3D from 54.7083% to 55.2329% and raises the cross-dataset mean by 0.1749 points. In the evaluated episodes, conditional hard selection is associated with a lower negative-transfer count than shrunk class-wise soft fusion with two versus four episodes, respectively. Global-reliability soft fusion is more conservative, with one negative-transfer episode, but its lower mean shows that source-wide reliability alone does not fully exploit class-dependent complementarity.
4.3.3. Calibration-Label Budget
Table 9 evaluates the shared UCRG under six calibration fractions in Lin3D. For fractions below 100%, ten class-stratified samples were drawn within each leave-one-plot episode. Repeat-level results were aggregated within each episode before summarizing across the four episodes. The absolute total and per-class label counts are reported in Supplementary Table S9. The repeat-level source-weight and hard-selection audit is summarized in Supplementary Table S21.
Table 9.
Performance of shared UCRG under different calibration-label budgets in Lin3D. mIoU and SD are computed across four leave-one-plot episodes.
The query mIoU and hard-selection decisions are unchanged across the ten repeats for every tested fraction from 1% to 50%. In all four Lin3D episodes, the four semantic classes select AGF/SDEM under the final gate. The underlying soft weights nevertheless vary with the calibration fraction, particularly for the lower-object class, although these differences are suppressed when the hard-selection branch is activated. At 1%, each support plot contains 3436–4033 labeled points, including only 12–57 lower-object points. With the full support plot, the hard selection mask changes for the lower-object class in one episode, while AGF/SDEM remains the higher-reliability source; the mean mIoU is 0.2422 points lower. These results characterize the tested budgets and should not be interpreted as evidence that arbitrarily small calibration sets are sufficient.
4.3.4. Calibration-to-Query Reliability Diagnostics
Table 10 examines whether source reliability estimated from calibration data transfers to query evaluation and how this evidence affects gate behavior. Regret is the episode-averaged non-negative mIoU shortfall relative to the strongest individual query candidate. Source-selection accuracy measures the proportion of episodes in which the highest-ranked calibration source matches the strongest query candidate, while hard-selection rate is computed over class-level gate decisions.
Table 10.
Calibration-to-query reliability diagnostics for shared UCRG. Negative episodes are reported as the observed count over the number of evaluation episodes.
Calibration- and query-based source rankings are strongly aligned, and the globally strongest source is identified correctly in every evaluation episode. Gate behavior nevertheless varies across candidate pools: hard selection is used for 25% of the class-level decisions on FOR-instance and EvoMLS compared with 93.75% on Lin3D. Although calibration correctly identifies the globally strongest source, the nonzero regret on FOR-instance and Lin3D shows that global source ranking alone does not guarantee the best query performance. Different sources may remain stronger for different semantic classes, making class-wise weighting important for the final integration decision.
4.4. Additional Validation
4.4.1. Calibration-Guided Confusion-Pair Discovery and Refinement
Table 11 evaluates whether calibration confusion statistics can identify class pairs that benefit from targeted refinement. The query-best pair and rank correlation are included as retrospective diagnostics of the calibration-based selection.
Table 11.
Calibration-guided confusion-pair refinement. Base shared UCRG denotes the reliability-gated output before refinement. UCRG+Refiner results and gains are reported as mean ± standard deviation over three PairMLP training seeds. Spearman compares the calibration-confusion ranking with the retrospective query-gain ranking.
For FOR-instance, calibration selects wood/crown, which is also the retrospective query-best pair, and UCRG+Refiner increases mIoU from 78.8306% to 79.3320%. For EvoMLS, the selected ground/understory pair increases mIoU from 77.9780% to 78.0839%, whereas understory/foliage is the retrospective query-best pair. The lower rank correlation on EvoMLS indicates weaker alignment between calibration confusion and query-side refinement utility. Manual and seeded-random pair references are reported in the Supplementary Materials.
The refiner was evaluated on FOR-instance and EvoMLS. The Lin3D integration records used here do not contain the aligned point-height input that is required by this PairMLP implementation; refiner performance on Lin3D remains unevaluated. The Lin3D results therefore refer to the base UCRG.
4.4.2. Heterogeneous Architecture Candidate Pool
To evaluate cross-architecture prediction integration, we construct an EvoMLS candidate pool from independently trained and frozen KPConv and PointNet predictors [5,7]. Both sources are converted to the same point and class interface without modifying the reliability estimator or decision gate. The experiment compares the fixed shared UCRG setting with gate parameters selected for this heterogeneous candidate pool. The cross-architecture prediction integration results are summarized in Table 12.
Table 12.
Cross-architecture prediction integration on EvoMLS.
KPConv exceeds PointNet by 14.6984 percentage points, while unconditional fusion provides almost no improvement over the stronger predictor. The shared UCRG preserves the KPConv result under its fixed cross-dataset parameterization, whereas the calibration-tuned UCRG reaches 76.6867% mIoU, improving upon KPConv by 1.1818 points. The result demonstrates that the common probability interface supports heterogeneous architectures and candidate-pool-specific calibration can recover class-wise complementarity that is not captured by unconditional fusion.
4.4.3. PTv3-Augmented Lin3D Candidate Pool
We further add a frozen PTv3 predictor to the height–AGF/SDEM pool, creating a three-source pool that combines KPConv-based candidates with PTv3. PTv3 is trained on FOR-instance and transferred to Lin3D without target-domain fine-tuning. For retrospective comparison, the best single source (query oracle) evaluates all the candidate sources against the query labels and retains the highest-mIoU source in each episode. The shared UCRG uses , whereas the calibration-tuned UCRG selects its parameters from the corresponding calibration plot. Because the oracle selects one complete source rather than integrating class-wise predictions, the UCRG may exceed its result. The results for the PTv3-augmented three-source pool are summarized in Table 13.
Table 13.
PTv3-augmented three-source integration on Lin3D. mIoU is averaged over four leave-one-plot episodes.
The calibration-tuned UCRG achieves 59.1964% mIoU, exceeding the best single source (query oracle) by 3.3645 percentage points and equal/fixed-weight fusion by 6.9191 points. This result shows that the three-source pool contains class-dependent complementary information that cannot be recovered by selecting a single predictor. The shared UCRG reaches 55.2515%, outperforming unconditional fusion and calibration-based hard selection, while protocol-specific parameter selection makes fuller use of the added PTv3 source.
4.5. Qualitative Analysis
Figure 4 illustrates the complementary errors of the height and AGF/SDEM sources on a FOR-instance NIBIO scene. In the enlarged wood/crown transition region, the shared UCRG better preserves the local semantic structure by integrating the two source predictions according to their calibration-derived reliability.
Figure 4.
Qualitative comparison on a FOR-instance NIBIO scene. Columns show: (a) raw point cloud; (b) ground truth; (c) height; (d) AGF/SDEM; and (e) shared UCRG; the lower row enlarges the region marked in red.
Figure 5 shows that EvoMLS errors are concentrated near ground/understory transitions, consistent with the dominant confusion pair identified from the calibration data.
Figure 5.
Shared UCRG predictions on EvoMLS from the XY, XZ, and YZ views. Columns show: (a) ground truth; (b) ours; and (c) error map; correct points are gray and errors are shown in their corresponding class colors.
Figure 6 illustrates the distinct local errors of the four EvoMLS candidate sources and their integration by the shared UCRG. The candidate panels display point-wise labels, whereas the shared UCRG operates on their complete aligned probability outputs.
Figure 6.
Candidate-source and shared UCRG predictions on EvoMLS from the YZ view: (a) ground truth; (b) base KPFCNN; (c) ground-weighted KPFCNN; (d) base KPFCNN, seed 2027; (e) ground-weighted KPFCNN, seed 2027; and (f) shared UCRG. Red boxes mark the same local region across panels.
Figure 7 compares four frozen architectures under FOR-instance-to-Lin3D transfer. PointNet overpredicts wood, RandLA-Net largely collapses toward lower objects, and KPFCNN exhibits substantial class mixing, whereas Sen-net preserves more of the target-scene structure. By limiting unreliable class-wise contributions, the shared UCRG produces predictions that more closely follow the ground truth in both the full scene and the enlarged region.
Figure 7.
Qualitative FOR-instance-to-Lin3D transfer results for the four-architecture candidate pool. Columns show: (a) raw point cloud; (b) ground truth; (c) PointNet; (d) KPFCNN; (e) RandLA-Net; (f) Sen-net; and (g) shared UCRG. The red boxes mark the regions enlarged in the corresponding panels in the lower row.
5. Discussion and Conclusions
5.1. Discussion
The UCRG formulates multi-source prediction integration as a separate decision problem from candidate-model training. Unlike end-to-end routing or sample-wise ensemble selection, it estimates empirical source reliability from labeled calibration data and applies class-wise decisions to aligned outputs from frozen predictors. The experimental results show that this design can exploit class-dependent complementarity while limiting the interference of weaker sources. Under the evaluated protocols, the shared UCRG remains close to the calibration-tuned UCRG despite reusing one gate parameterization selected from FOR-instance and EvoMLS calibration data. The heterogeneous candidate-pool and PTv3-augmented experiments further demonstrate that the common probability interface extends beyond variants of a single model, while the confusion-pair refiner provides targeted correction for residual semantic ambiguity. In Lin3D, gate decisions remain unchanged from 1% to 50% calibration support, whereas full support changes one class-level decision. The 1% setting still contains thousands of labels per support plot; performance therefore depends on both calibration quantity and its representativeness of the deployment condition. Future work should therefore investigate local reliability estimation, uncertainty-aware gating, broader architecture pools, and calibration strategies covering greater sensor and scene variation.
5.2. Conclusions
We presented the UCRG, a post hoc framework that integrates aligned probability outputs from frozen forest point cloud predictors using global and class-wise calibration reliability, sparse-label shrinkage, and reliability-gap-controlled soft fusion or source selection. Across FOR-instance, EvoMLS, and Lin3D, the shared UCRG achieves 70.6805% mIoU and remains within 0.0222 percentage points of the calibration-tuned UCRG. Across the six evaluated episodes, it records two negative-transfer episodes compared with six for fixed-weight fusion. In the PTv3-augmented Lin3D pool, the calibration-tuned UCRG reaches 59.1964% mIoU and exceeds the best single-source query oracle by 3.3645 points. These results support the UCRG as a calibration-supported decision layer for integrating heterogeneous forest point cloud predictions under the evaluated sensing and transfer conditions.
Supplementary Materials
The following supporting information can be downloaded at: https://www.mdpi.com/article/10.3390/rs18213689/s1, Table S1: Leakage-controlled shared-parameter selection audit; Table S2: Dataset-specific reference pipelines and shared UCRG; Tables S3–S7: Candidate configurations, reference fusion, refiners, and confusion-pair audits; Tables S8–S13: Lin3D support/query protocols and transfer extensions; Tables S14–S16: Architecture and PTv3 extension results; Table S17: Machine-readable provenance records included in the reproducibility archive; Table S18: Ten-seed UCRG parameter audit; Table S19: Source calibration metrics before and after probability-space temperature recalibration; Table S20: Fold-level query class-wise IoU and class-support counts; Table S21: Repeat-level calibration-budget gate audit; the associated machine-readable repeat-level records are provided as test/reviewer2_lin3d_budget_audit/repeat_level_gate_audit.csv; Table S22: Shared UCRG query confusion matrices; Table S23: Fold-level paired comparison between shared UCRG and calibration-based hard selection; Table S24: Full-support joint UCRG parameter sensitivity summary; Figure S1: Class-wise calibration IoU of the EvoMLS candidate prediction sources; Figure S2: Lin3D lower-object IoU across limited-label parameter combinations; Figure S3: Lin3D mIoU across limited-label parameter combinations.
Author Contributions
Conceptualization, L.L., H.Z. and X.Z.; methodology, L.L. and Y.L.; software, L.L. and Y.L.; validation, L.L., Y.L., Q.Z., X.C. and B.X.; formal analysis, L.L., Y.L. and Q.Z.; investigation, L.L., Y.L., X.C. and B.X.; resources, Q.Z., H.Z., X.Z., X.C. and B.X.; data curation, L.L. and Y.L.; writing—original draft preparation, L.L.; writing—review and editing, L.L., Y.L., Q.Z., H.Z., X.Z., X.C. and B.X.; visualization, L.L., Y.L. and Q.Z.; supervision, H.Z. and X.Z.; project administration, L.L., H.Z., X.Z. and X.C.; funding acquisition, Y.L., X.Z. and B.X. All authors have read and agreed to the published version of the manuscript.
Funding
This research was funded by the China University Industry–Academia–Research Innovation Fund, grant number 2025XJS023; the Central Guidance for Local Science and Technology Development Fund, grant number ZYYD2025QY19; and State Grid Shaanxi Electric Power Co., Ltd. through the Research and Application Project, grant number B626JY25Z011. Y.L. was also supported by the China Scholarship Council (CSC) under the State Scholarship Fund (File No. 202508420254).
Institutional Review Board Statement
Not applicable.
Informed Consent Statement
Not applicable.
Data Availability Statement
The FOR-instance, EvoMLS, and Lin3D point cloud datasets analyzed in this study are third-party datasets that are available from the sources cited in the manuscript. The authors do not own or redistribute the original datasets; access is provided by the respective data providers under their applicable terms. The Supplementary Materials submitted with this article contain the additional figures, tables, detailed experimental configurations, and fold-level results supporting the reported analyses. The submitted reproducibility archive contains machine-readable provenance records, evaluation results, and audit files. The source code and code-based reproducibility materials will be released in a public repository following acceptance. Additional derived prediction outputs and artifact files are available from the corresponding author upon reasonable request for editorial verification.
Acknowledgments
During the preparation of this manuscript, the authors used GPT-5 for language editing, consistency checking, and assistance with the preparation of reproducibility scripts. The authors have reviewed and edited the output and take full responsibility for the content of this publication.
Conflicts of Interest
X.C. and B.X. are employees of the Economic and Technical Research Institute, State Grid Shaanxi Electric Power Co., Ltd., which funded this research under grant B626JY25Z011. Their roles are disclosed in the Author Contributions statement. The remaining authors declare no conflicts of interest.
References
- White, J.C.; Coops, N.C.; Wulder, M.A.; Vastaranta, M.; Hilker, T.; Tompalski, P. Remote sensing technologies for enhancing forest inventories: A review. Can. J. Remote Sens. 2016, 42, 619–641. [Google Scholar] [CrossRef] [Scilit]
- Calders, K.; Newnham, G.; Burt, A.; Murphy, S.; Raumonen, P.; Herold, M.; Culvenor, D.; Avitabile, V.; Disney, M.; Armston, J.; et al. Nondestructive estimates of above-ground biomass using terrestrial laser scanning. Methods Ecol. Evol. 2015, 6, 198–208. [Google Scholar] [CrossRef] [Scilit]
- Brede, B.; Lau, A.; Bartholomeus, H.M.; Kooistra, L. Towards Operational 3D Mapping of Forests with UAV Laser Scanning. Remote Sens. Environ. 2017, 188, 456–465. [Google Scholar] [CrossRef] [Scilit]
- Calders, K.; Adams, J.; Armston, J.; Bartholomeus, H.; Bauwens, S.; Bentley, L.P.; Chave, J.; Danson, F.M.; Demol, M.; Disney, M.; et al. Terrestrial laser scanning in forest ecology: Expanding the horizon. Remote Sens. Environ. 2020, 251, 112102. [Google Scholar] [CrossRef] [Scilit]
- Qi, C.R.; Su, H.; Mo, K.; Guibas, L.J. PointNet: Deep Learning on Point Sets for 3D Classification and Segmentation. In Proceedings of the IEEE Conference on Computer Vision and Pattern Recognition (CVPR), Honolulu, HI, USA, 21–26 July 2017; pp. 652–660. [Google Scholar]
- Qi, C.R.; Yi, L.; Su, H.; Guibas, L.J. Pointnet++: Deep hierarchical feature learning on point sets in a metric space. In Proceedings of the Advances in Neural Information Processing Systems 30 (NeurIPS 2017), Long Beach, CA, USA, 4–9 December 2017; Curran Associates Inc.: Red Hook, NY, USA, 2017; Volume 30. [Google Scholar]
- Thomas, H.; Qi, C.R.; Deschaud, J.E.; Marcotegui, B.; Goulette, F.; Guibas, L. Kpconv: Flexible and deformable convolution for point clouds. In Proceedings of the 2019 IEEE/CVF International Conference on Computer Vision (ICCV); IEEE: Piscataway, NJ, USA, 2019; pp. 6410–6419. [Google Scholar]
- Hu, Q.; Yang, B.; Xie, L.; Rosa, S.; Guo, Y.; Wang, Z.; Trigoni, N.; Markham, A. Randla-net: Efficient semantic segmentation of large-scale point clouds. In Proceedings of the 2020 IEEE/CVF Conference on Computer Vision and Pattern Recognition (CVPR); IEEE: Piscataway, NJ, USA, 2020; pp. 11105–11114. [Google Scholar]
- Zhao, H.; Jiang, L.; Jia, J.; Torr, P.; Koltun, V. Point transformer. In Proceedings of the 2021 IEEE/CVF International Conference on Computer Vision (ICCV); IEEE: Piscataway, NJ, USA, 2021; pp. 16239–16248. [Google Scholar]
- Jiang, T.; Zhang, Q.; Liu, S.; Liang, C.; Dai, L.; Zhang, Z.; Sun, J.; Wang, Y. LWSNet: A point-based segmentation network for leaf-wood separation of individual trees. Forests 2023, 14, 1303. [Google Scholar] [CrossRef] [Scilit]
- Xiang, B.; Wielgosz, M.; Kontogianni, T.; Peters, T.; Puliti, S.; Astrup, R.; Schindler, K. Automated forest inventory: Analysis of high-density airborne LiDAR point clouds with 3D deep learning. Remote Sens. Environ. 2024, 305, 114078. [Google Scholar] [CrossRef] [Scilit]
- Lu, H.; Li, B.; Yang, G.; Fan, G.; Wang, H.; Pang, Y.; Wang, Z.; Lian, Y.; Xu, H.; Huang, H. Towards a point cloud understanding framework for forest scene semantic segmentation across forest types and sensor platforms. Remote Sens. Environ. 2025, 318, 114591. [Google Scholar] [CrossRef] [Scilit]
- Ruoppa, L.; Oinonen, O.; Taher, J.; Lehtomäki, M.; Takhtkeshha, N.; Kukko, A.; Kaartinen, H.; Hyyppä, J. Unsupervised deep learning for semantic segmentation of multispectral LiDAR forest point clouds. ISPRS J. Photogramm. Remote Sens. 2025, 228, 694–722. [Google Scholar] [CrossRef] [Scilit]
- Zhou, F.; He, H.; Chen, T.; Zhang, T.; Yang, M.; Yuan, Y.; Liu, J. Semantic-Aware Cross-Modal Transfer for UAV-LiDAR Individual Tree Segmentation. Remote Sens. 2025, 17, 2805. [Google Scholar] [CrossRef] [Scilit]
- Takhtkeshha, N.; Bocaux, L.; Ruoppa, L.; Remondino, F.; Mandlburger, G.; Kukko, A.; Hyyppä, J. 3D forest semantic segmentation using multispectral LiDAR and 3D deep learning. PFG–J. Photogramm. Remote Sens. Geoinf. Sci. 2025, 94, 377–397. [Google Scholar] [CrossRef] [Scilit]
- Wang, Z.; Dai, Z.; Póczos, B.; Carbonell, J. Characterizing and avoiding negative transfer. In Proceedings of the 2019 IEEE/CVF Conference on Computer Vision and Pattern Recognition (CVPR); IEEE: Piscataway, NJ, USA, 2019; pp. 11285–11294. [Google Scholar]
- Guo, C.; Pleiss, G.; Sun, Y.; Weinberger, K.Q. On calibration of modern neural networks. In Proceedings of the International Conference on Machine Learning; PMLR: Cambridge, MA, USA, 2017; pp. 1321–1330. [Google Scholar]
- Ovadia, Y.; Fertig, E.; Ren, J.; Nado, Z.; Sculley, D.; Nowozin, S.; Dillon, J.; Lakshminarayanan, B.; Snoek, J. Can you trust your model’s uncertainty? Evaluating predictive uncertainty under dataset shift. In Proceedings of the Advances in Neural Information Processing Systems 32 (NeurIPS 2019), Vancouver, BC, Canada, 8–14 December 2019; Curran Associates Inc.: Red Hook, NY, USA, 2019; Volume 32. [Google Scholar]
- Vicari, M.B.; Disney, M.; Wilkes, P.; Burt, A.; Calders, K.; Woodgate, W. Leaf and wood classification framework for terrestrial LiDAR point clouds. Methods Ecol. Evol. 2019, 10, 680–694. [Google Scholar] [CrossRef] [Scilit]
- Wang, D.; Momo Takoudjou, S.; Casella, E. LeWoS: A universal leaf-wood classification method to facilitate the 3D modelling of large tropical trees using terrestrial LiDAR. Methods Ecol. Evol. 2020, 11, 376–389. [Google Scholar] [CrossRef] [Scilit]
- Hui, Z.; Jin, S.; Xia, Y.; Wang, L.; Ziggah, Y.Y.; Cheng, P. Wood and leaf separation from terrestrial LiDAR point clouds based on mode points evolution. ISPRS J. Photogramm. Remote Sens. 2021, 178, 219–239. [Google Scholar] [CrossRef] [Scilit]
- Wang, Y.; Sun, Y.; Liu, Z.; Sarma, S.E.; Bronstein, M.M.; Solomon, J.M. Dynamic graph cnn for learning on point clouds. ACM Trans. Graph. (TOG) 2019, 38, 146. [Google Scholar] [CrossRef] [Scilit]
- Wu, W.; Qi, Z.; Li, F. PointConv: Deep Convolutional Networks on 3D Point Clouds. In Proceedings of the 2019 IEEE/CVF Conference on Computer Vision and Pattern Recognition (CVPR); IEEE: Piscataway, NJ, USA, 2019; pp. 9613–9622. [Google Scholar]
- Wu, X.; Jiang, L.; Wang, P.S.; Liu, Z.; Liu, X.; Qiao, Y.; Ouyang, W.; He, T.; Zhao, H. Point Transformer V3: Simpler, Faster, Stronger. In Proceedings of the IEEE/CVF Conference on Computer Vision and Pattern Recognition, Seattle, WA, USA, 16–22 June 2024; pp. 4840–4851. [Google Scholar]
- Tang, H.; Liu, Z.; Zhao, S.; Lin, Y.; Lin, J.; Wang, H.; Han, S. Searching efficient 3d architectures with sparse point-voxel convolution. In Proceedings of the European Conference on Computer Vision; Springer: Berlin/Heidelberg, Germany, 2020; pp. 685–702. [Google Scholar]
- Zhang, S.; Chen, Y.; Wang, B.; Pan, D.; Zhang, W.; Li, A. SPTNet: Sparse convolution and transformer network for woody and foliage components separation from point clouds. IEEE Trans. Geosci. Remote Sens. 2024, 62, 5702718. [Google Scholar] [CrossRef] [Scilit]
- Liu, Y.; Li, L.; Zhang, X.; Liu, S.; Sun, H. PineSegNet: A Deep Learning Method for Fine-Grained Wood-Leaf Segmentation of Masson Pine Point Clouds. Remote Sens. 2026, 18, 2697. [Google Scholar] [CrossRef] [Scilit]
- Fareed, N.; Silva, C.A.; Gaskins, A.J.; Prichard, S.J.; Hudak, A.T.; Xia, J.; Alvites Diaz, C.I. From Wood–Foliar Semantics to 3D Fuel Characterization: Transferable Deep Learning for Terrestrial LiDAR Across Global Forest Ecosystems. Remote Sens. 2026, 18, 3158. [Google Scholar] [CrossRef] [Scilit]
- Lakshminarayanan, B.; Pritzel, A.; Blundell, C. Simple and scalable predictive uncertainty estimation using deep ensembles. In Proceedings of the Advances in Neural Information Processing Systems 30 (NIPS 2017), Long Beach, CA, USA, 4–9 December 2017; Curran Associates Inc.: Red Hook, NY, USA, 2017; Volume 30. [Google Scholar]
- Sensoy, M.; Kaplan, L.; Kandemir, M. Evidential deep learning to quantify classification uncertainty. In Proceedings of the Advances in Neural Information Processing Systems 31 (NeurIPS 2018), Montréal, QC, Canada, 3–8 December 2018; Curran Associates Inc.: Red Hook, NY, USA, 2018; Volume 31. [Google Scholar]
- Jacobs, R.A.; Jordan, M.I.; Nowlan, S.J.; Hinton, G.E. Adaptive mixtures of local experts. Neural Comput. 1991, 3, 79–87. [Google Scholar] [CrossRef] [Scilit] [PubMed]
- Cruz, R.M.; Sabourin, R.; Cavalcanti, G.D.; Ren, T.I. META-DES: A dynamic ensemble selection framework using meta-learning. Pattern Recognit. 2015, 48, 1925–1935. [Google Scholar] [CrossRef] [Scilit]
- Cruz, R.M.; Sabourin, R.; Cavalcanti, G.D. Dynamic classifier selection: Recent advances and perspectives. Inf. Fusion 2018, 41, 195–216. [Google Scholar] [CrossRef] [Scilit]
- Han, Z.; Zhang, C.; Fu, H.; Zhou, J.T. Trusted multi-view classification with dynamic evidential fusion. IEEE Trans. Pattern Anal. Mach. Intell. 2022, 45, 2551–2566. [Google Scholar] [CrossRef] [Scilit] [PubMed]
- Bao, Y.; Li, Y.; Huang, S.L.; Zhang, L.; Zheng, L.; Zamir, A.; Guibas, L. An information-theoretic approach to transferability in task transfer learning. In Proceedings of the 2019 IEEE International Conference on Image Processing (ICIP); IEEE: Piscataway, NJ, USA, 2019; pp. 2309–2313. [Google Scholar]
- Nguyen, C.; Hassner, T.; Seeger, M.; Archambeau, C. Leep: A new measure to evaluate transferability of learned representations. In Proceedings of the International Conference on Machine Learning; PMLR: Cambridge, MA, USA, 2020; pp. 7294–7305. [Google Scholar]
- You, K.; Liu, Y.; Wang, J.; Long, M. Logme: Practical assessment of pre-trained models for transfer learning. In Proceedings of the International Conference on Machine Learning; PMLR: Cambridge, MA, USA, 2021; pp. 12133–12143. [Google Scholar]
- Zhao, H.; Zhang, S.; Wu, G.; Moura, J.M.; Costeira, J.P.; Gordon, G.J. Adversarial multiple source domain adaptation. In Proceedings of the Advances in Neural Information Processing Systems 31 (NeurIPS 2018), Montréal, QC, Canada, 3–8 December 2018; Curran Associates Inc.: Red Hook, NY, USA, 2018; Volume 31. [Google Scholar]
- Peng, X.; Bai, Q.; Xia, X.; Huang, Z.; Saenko, K.; Wang, B. Moment matching for multi-source domain adaptation. In Proceedings of the 2019 IEEE/CVF International Conference on Computer Vision (ICCV); IEEE: Piscataway, NJ, USA, 2019; pp. 1406–1415. [Google Scholar]
- Qin, C.; You, H.; Wang, L.; Kuo, C.C.J.; Fu, Y. Pointdan: A multi-scale 3d domain adaption network for point cloud representation. In Proceedings of the Advances in Neural Information Processing Systems 32 (NeurIPS 2019), Vancouver, BC, Canada, 8–14 December 2019; Curran Associates Inc.: Red Hook, NY, USA, 2019; Volume 32. [Google Scholar]
- Jaritz, M.; Vu, T.H.; De Charette, R.; Wirbel, E.; Pérez, P. xmuda: Cross-modal unsupervised domain adaptation for 3d semantic segmentation. In Proceedings of the 2020 IEEE/CVF Conference on Computer Vision and Pattern Recognition (CVPR); IEEE: Piscataway, NJ, USA, 2020; pp. 12602–12611. [Google Scholar]
- Saltori, C.; Galasso, F.; Fiameni, G.; Sebe, N.; Ricci, E.; Poiesi, F. Cosmix: Compositional semantic mix for domain adaptation in 3d lidar segmentation. In Proceedings of the European Conference on Computer Vision; Springer: Berlin/Heidelberg, Germany, 2022; pp. 586–602. [Google Scholar]
- Gulrajani, I.; Lopez-Paz, D. In search of lost domain generalization. arXiv 2020, arXiv:2007.01434. [Google Scholar]
- Tchapmi, L.; Choy, C.; Armeni, I.; Gwak, J.; Savarese, S. Segcloud: Semantic segmentation of 3d point clouds. In Proceedings of the 2017 International Conference on 3D Vision (3DV); IEEE: Piscataway, NJ, USA, 2017; pp. 537–547. [Google Scholar]
- Pastorino, M.; Moser, G.; Serpico, S.B.; Zerubia, J. CRFNet: A deep convolutional network to learn the potentials of a CRF for the semantic segmentation of remote sensing images. IEEE Trans. Geosci. Remote Sens. 2024, 62, 4707619. [Google Scholar] [CrossRef] [Scilit]
- Hu, Z.; Zhen, M.; Bai, X.; Fu, H.; Tai, C.L. JSENet: Joint Semantic Segmentation and Edge Detection Network for 3D Point Clouds. In Proceedings of the European Conference on Computer Vision; Springer: Berlin/Heidelberg, Germany, 2020; pp. 222–239. [Google Scholar]
- Tang, L.; Zhan, Y.; Chen, Z.; Yu, B.; Tao, D. Contrastive boundary learning for point cloud segmentation. In Proceedings of the 2022 IEEE/CVF Conference on Computer Vision and Pattern Recognition (CVPR); IEEE: Piscataway, NJ, USA, 2022; pp. 8479–8489. [Google Scholar]
- Wang, Y.; Ding, W.; Zhang, R.; Li, H. Boundary-aware multitask learning for remote sensing imagery. IEEE J. Sel. Top. Appl. Earth Obs. Remote Sens. 2020, 14, 951–963. [Google Scholar] [CrossRef] [Scilit]
- You, C.; Jiao, L.; Liu, X.; Li, L.; Liu, F.; Ma, W.; Yang, S. Boundary-aware multiscale learning perception for remote sensing image segmentation. IEEE Trans. Geosci. Remote Sens. 2023, 61, 4407115. [Google Scholar] [CrossRef] [Scilit]
- Chen, J.; Xu, S.; Zheng, Y. BaAFN: A boundary-aware attention fusion network for remote sensing semantic segmentation. IEEE J. Sel. Top. Appl. Earth Obs. Remote Sens. 2025, 18, 20914–20928. [Google Scholar] [CrossRef] [Scilit]
- Jiang, F.; Zhong, Z.; Zhang, M.; Gong, M.; Zhou, Y.; Zhao, W.; Guan, Z. BARNet: Boundary-aware refinement network for weakly supervised change detection. IEEE Trans. Geosci. Remote Sens. 2025, 63, 5647115. [Google Scholar] [CrossRef] [Scilit]
- Puliti, S.; Pearse, G.; Surovỳ, P.; Wallace, L.; Hollaus, M.; Wielgosz, M.; Astrup, R. FOR-instance: A UAV laser scanning benchmark dataset for semantic and instance segmentation of individual trees. arXiv 2023, arXiv:2309.01279. [Google Scholar]
- Kaijaluoto, R.; Kukko, A.; El Issaoui, A.; Hyyppä, J.; Kaartinen, H. Semantic segmentation of point cloud data using raw laser scanner measurements and deep neural networks. ISPRS Open J. Photogramm. Remote Sens. 2022, 3, 100011. [Google Scholar] [CrossRef] [Scilit]
- Li, T.; Cheng, P.; Lyu, X.; Hui, Z.; Nie, Y. GMFE-Net: Point cloud semantic segmentation with general multi-feature fusion and extraction. Int. J. Remote Sens. 2026, 47, 1242–1269. [Google Scholar] [CrossRef] [Scilit]
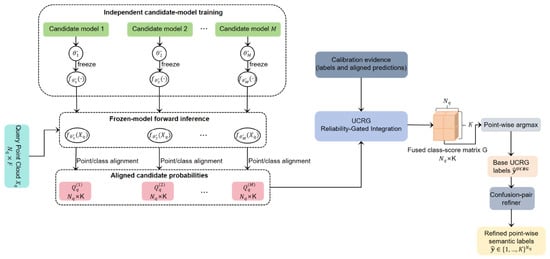
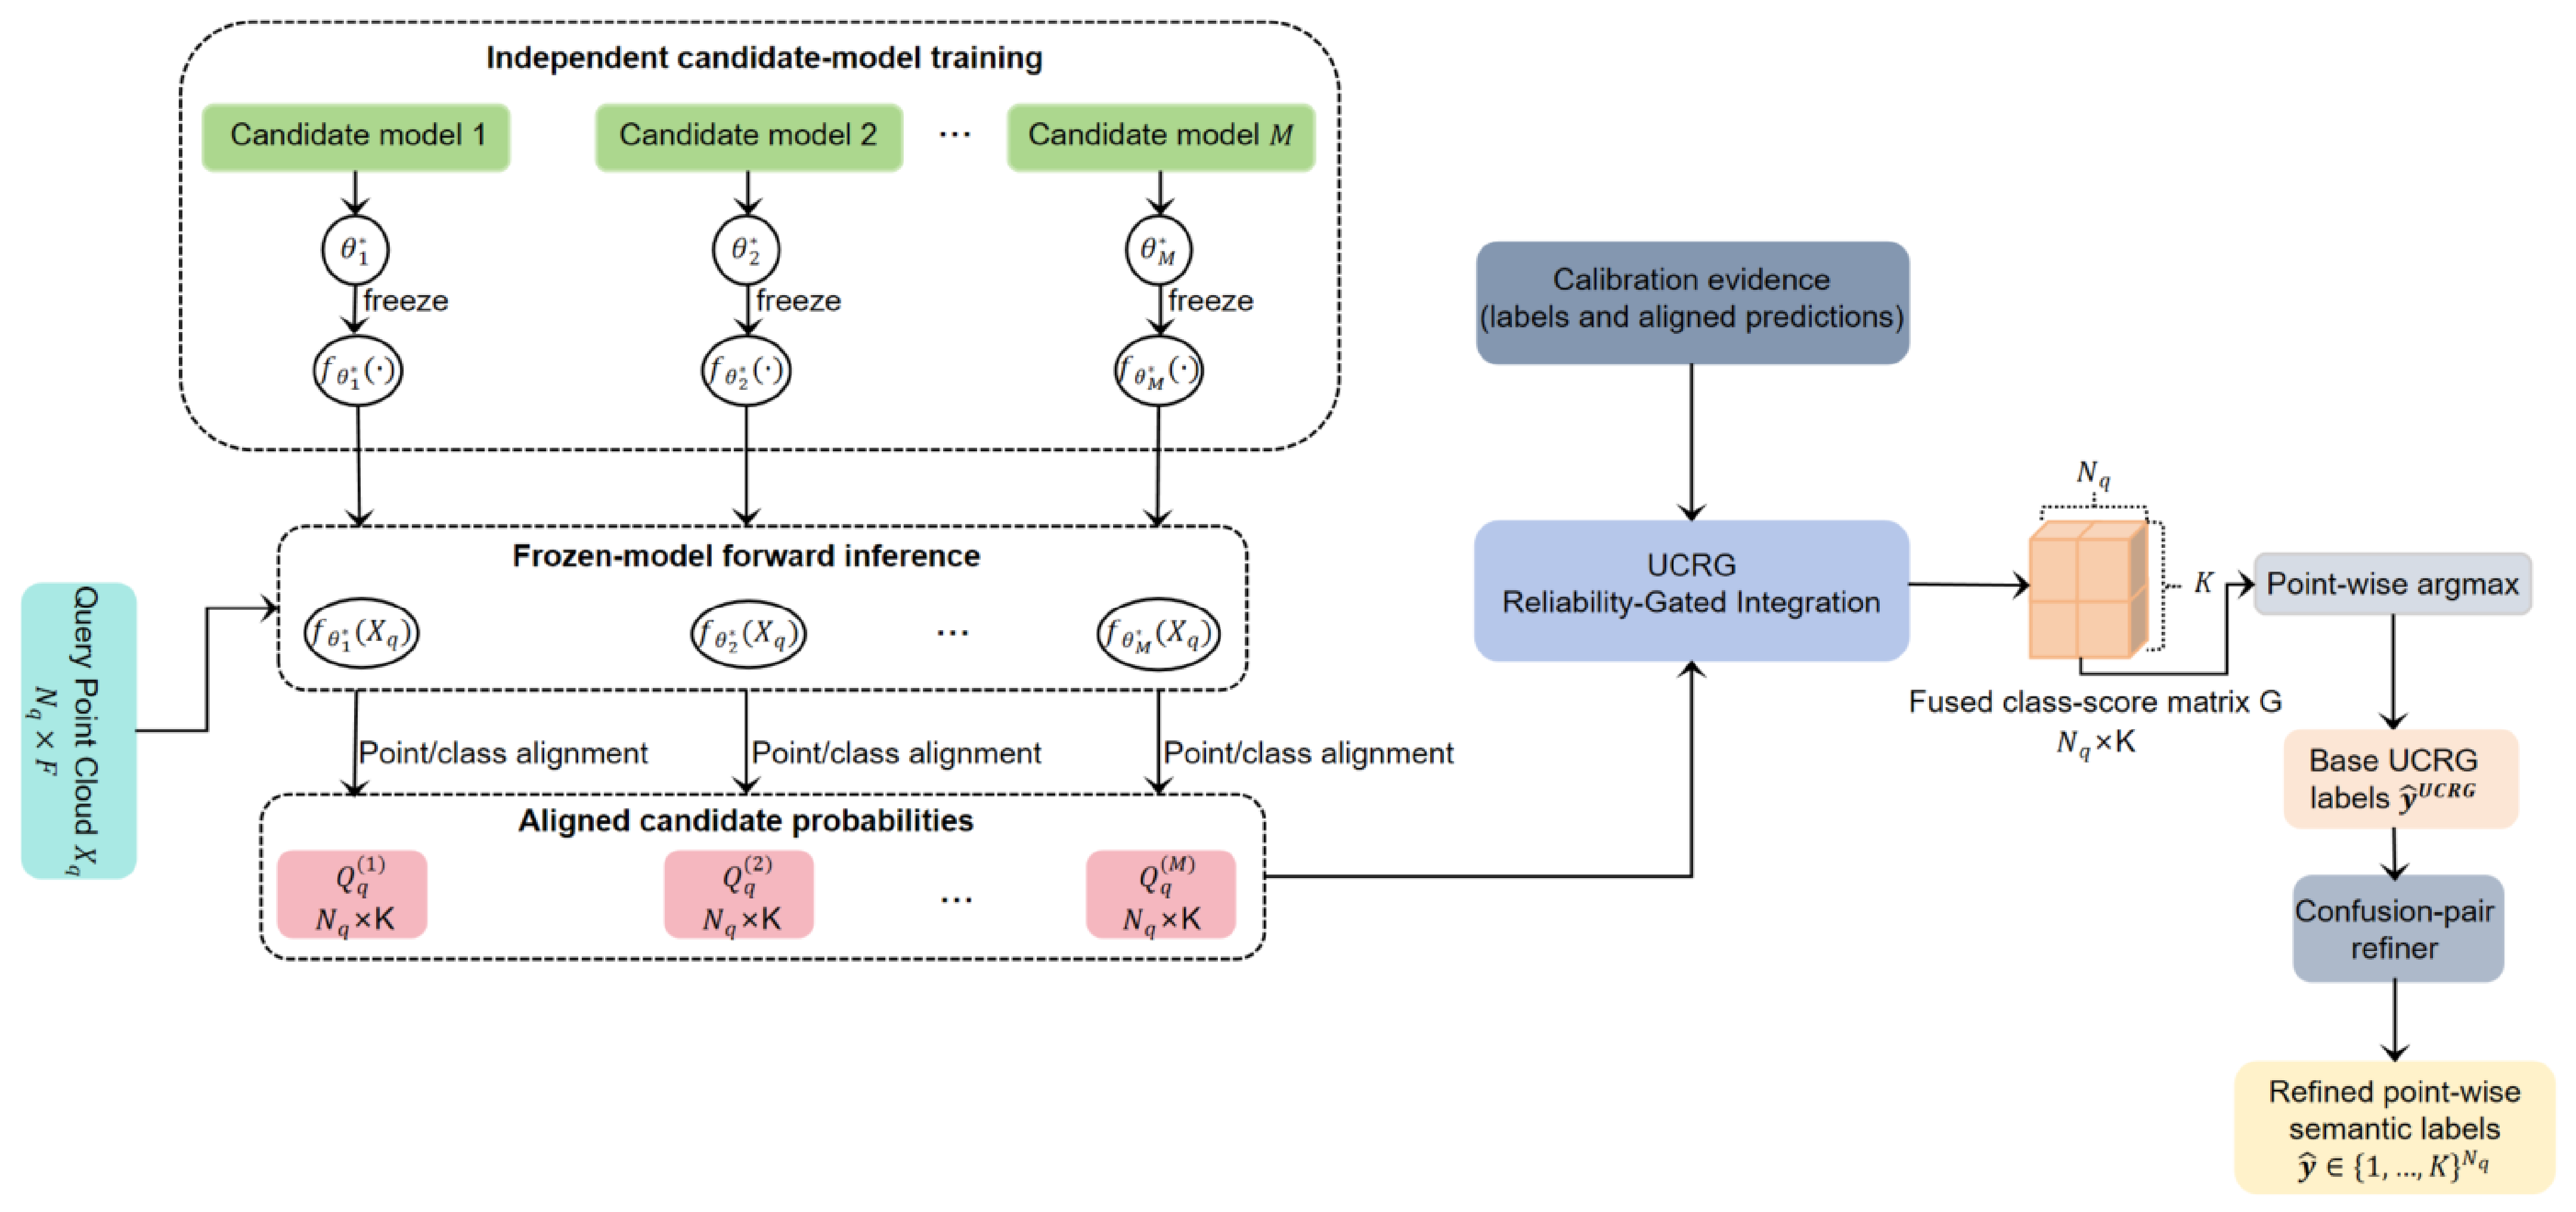
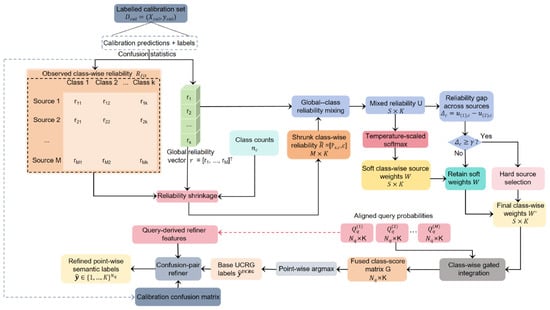
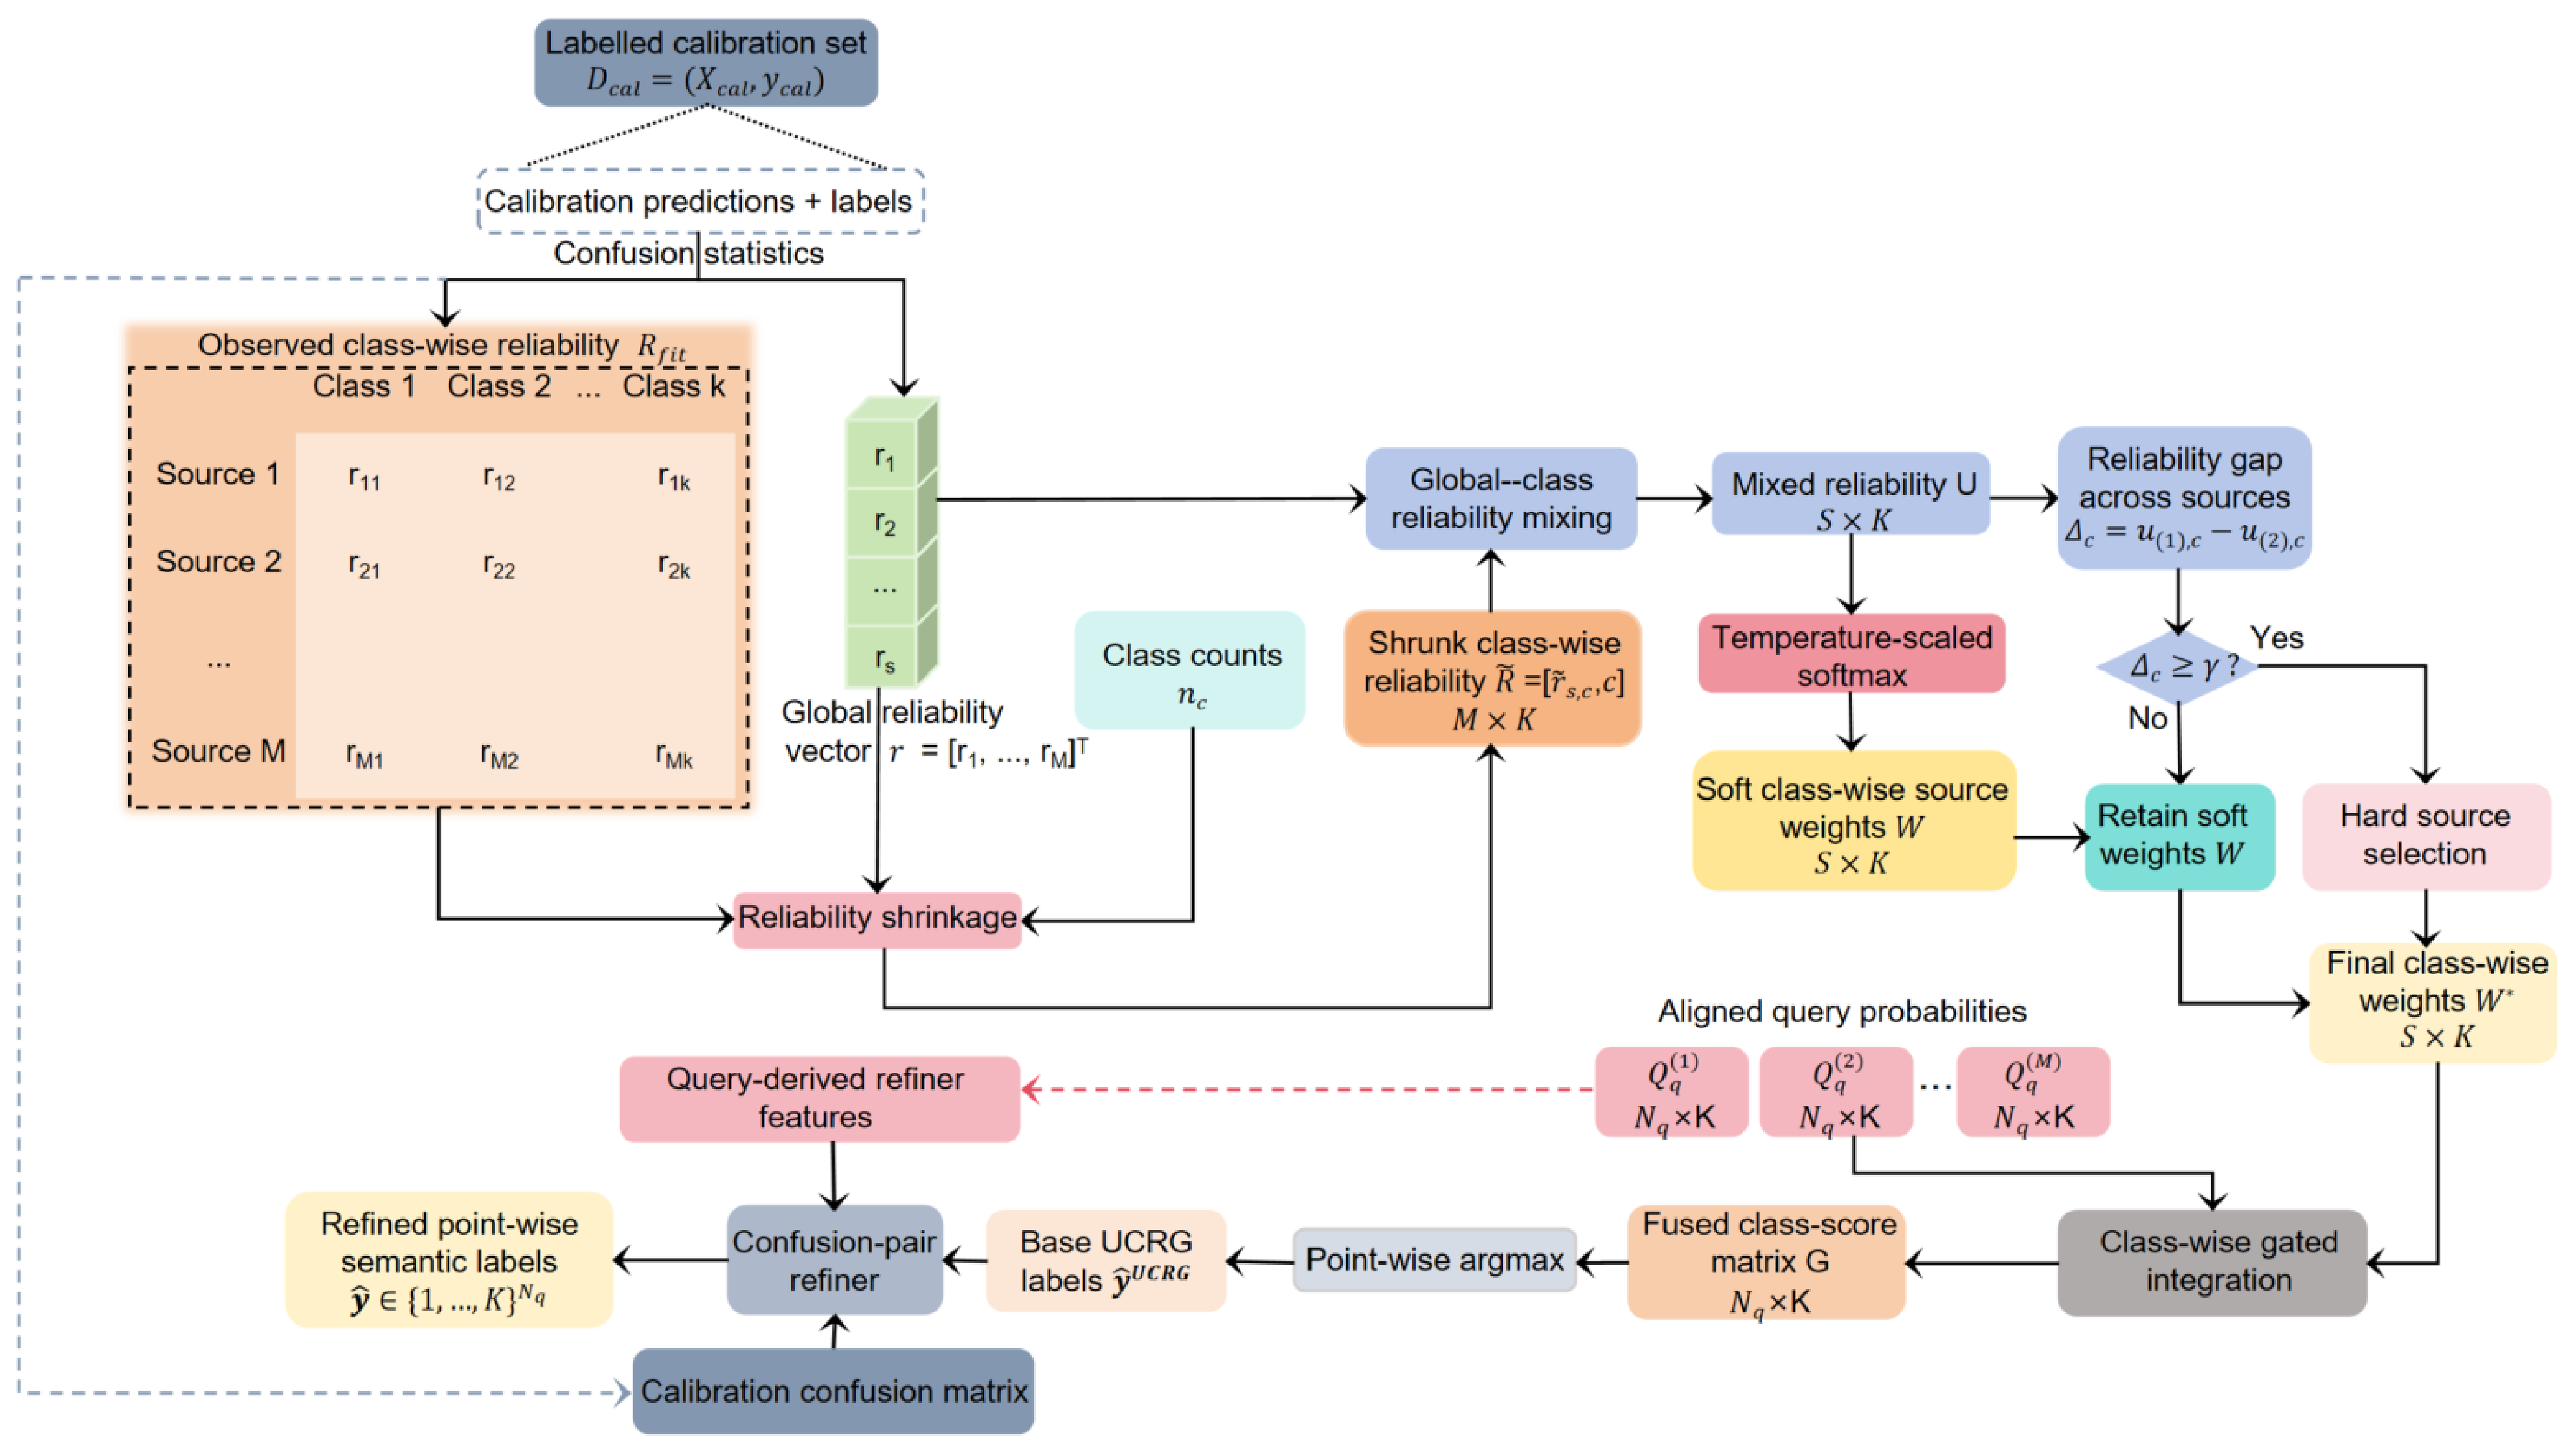
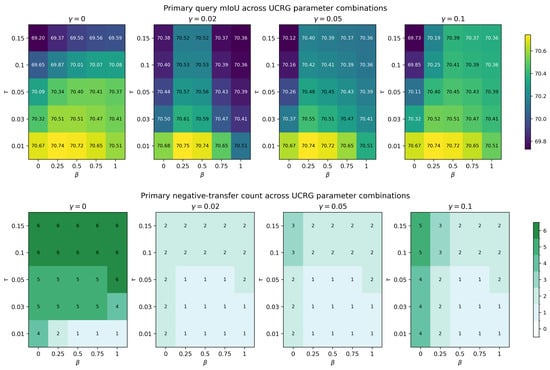
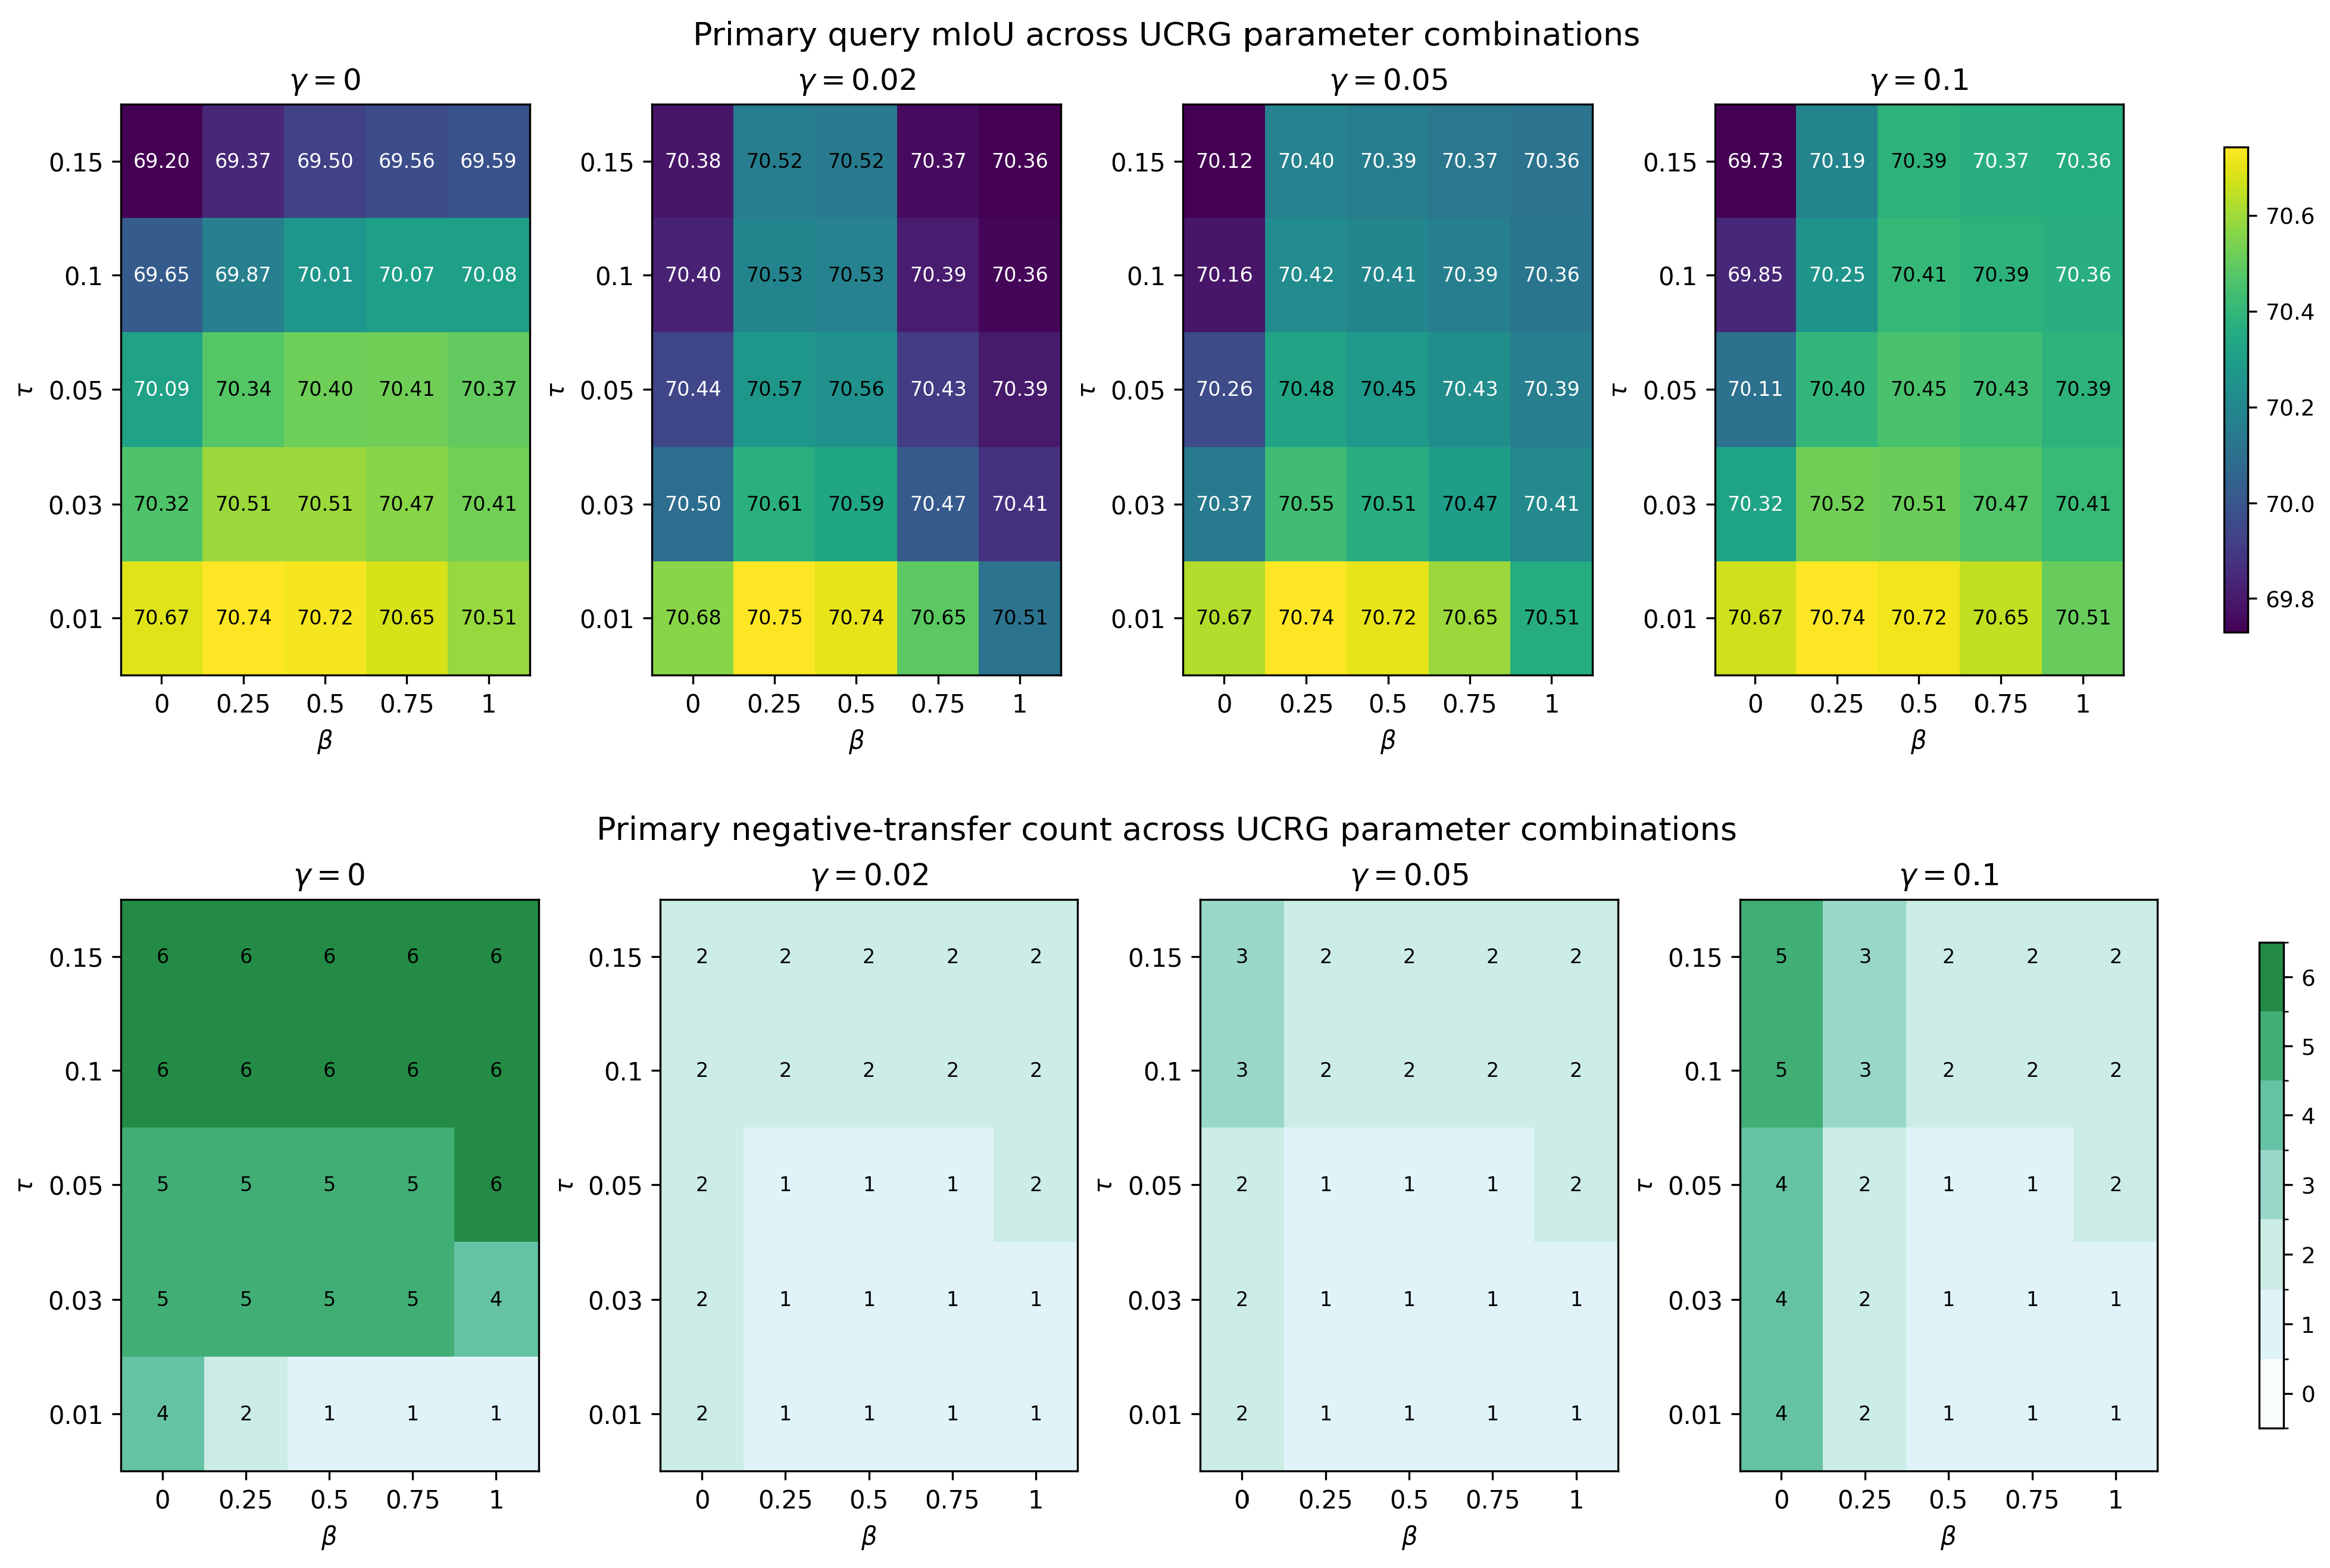
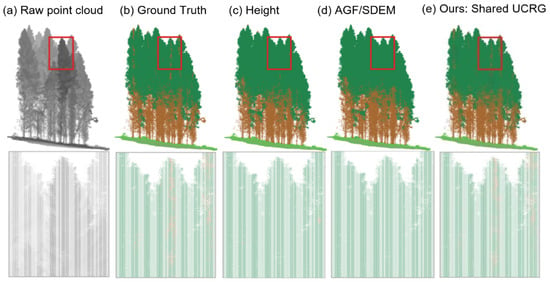
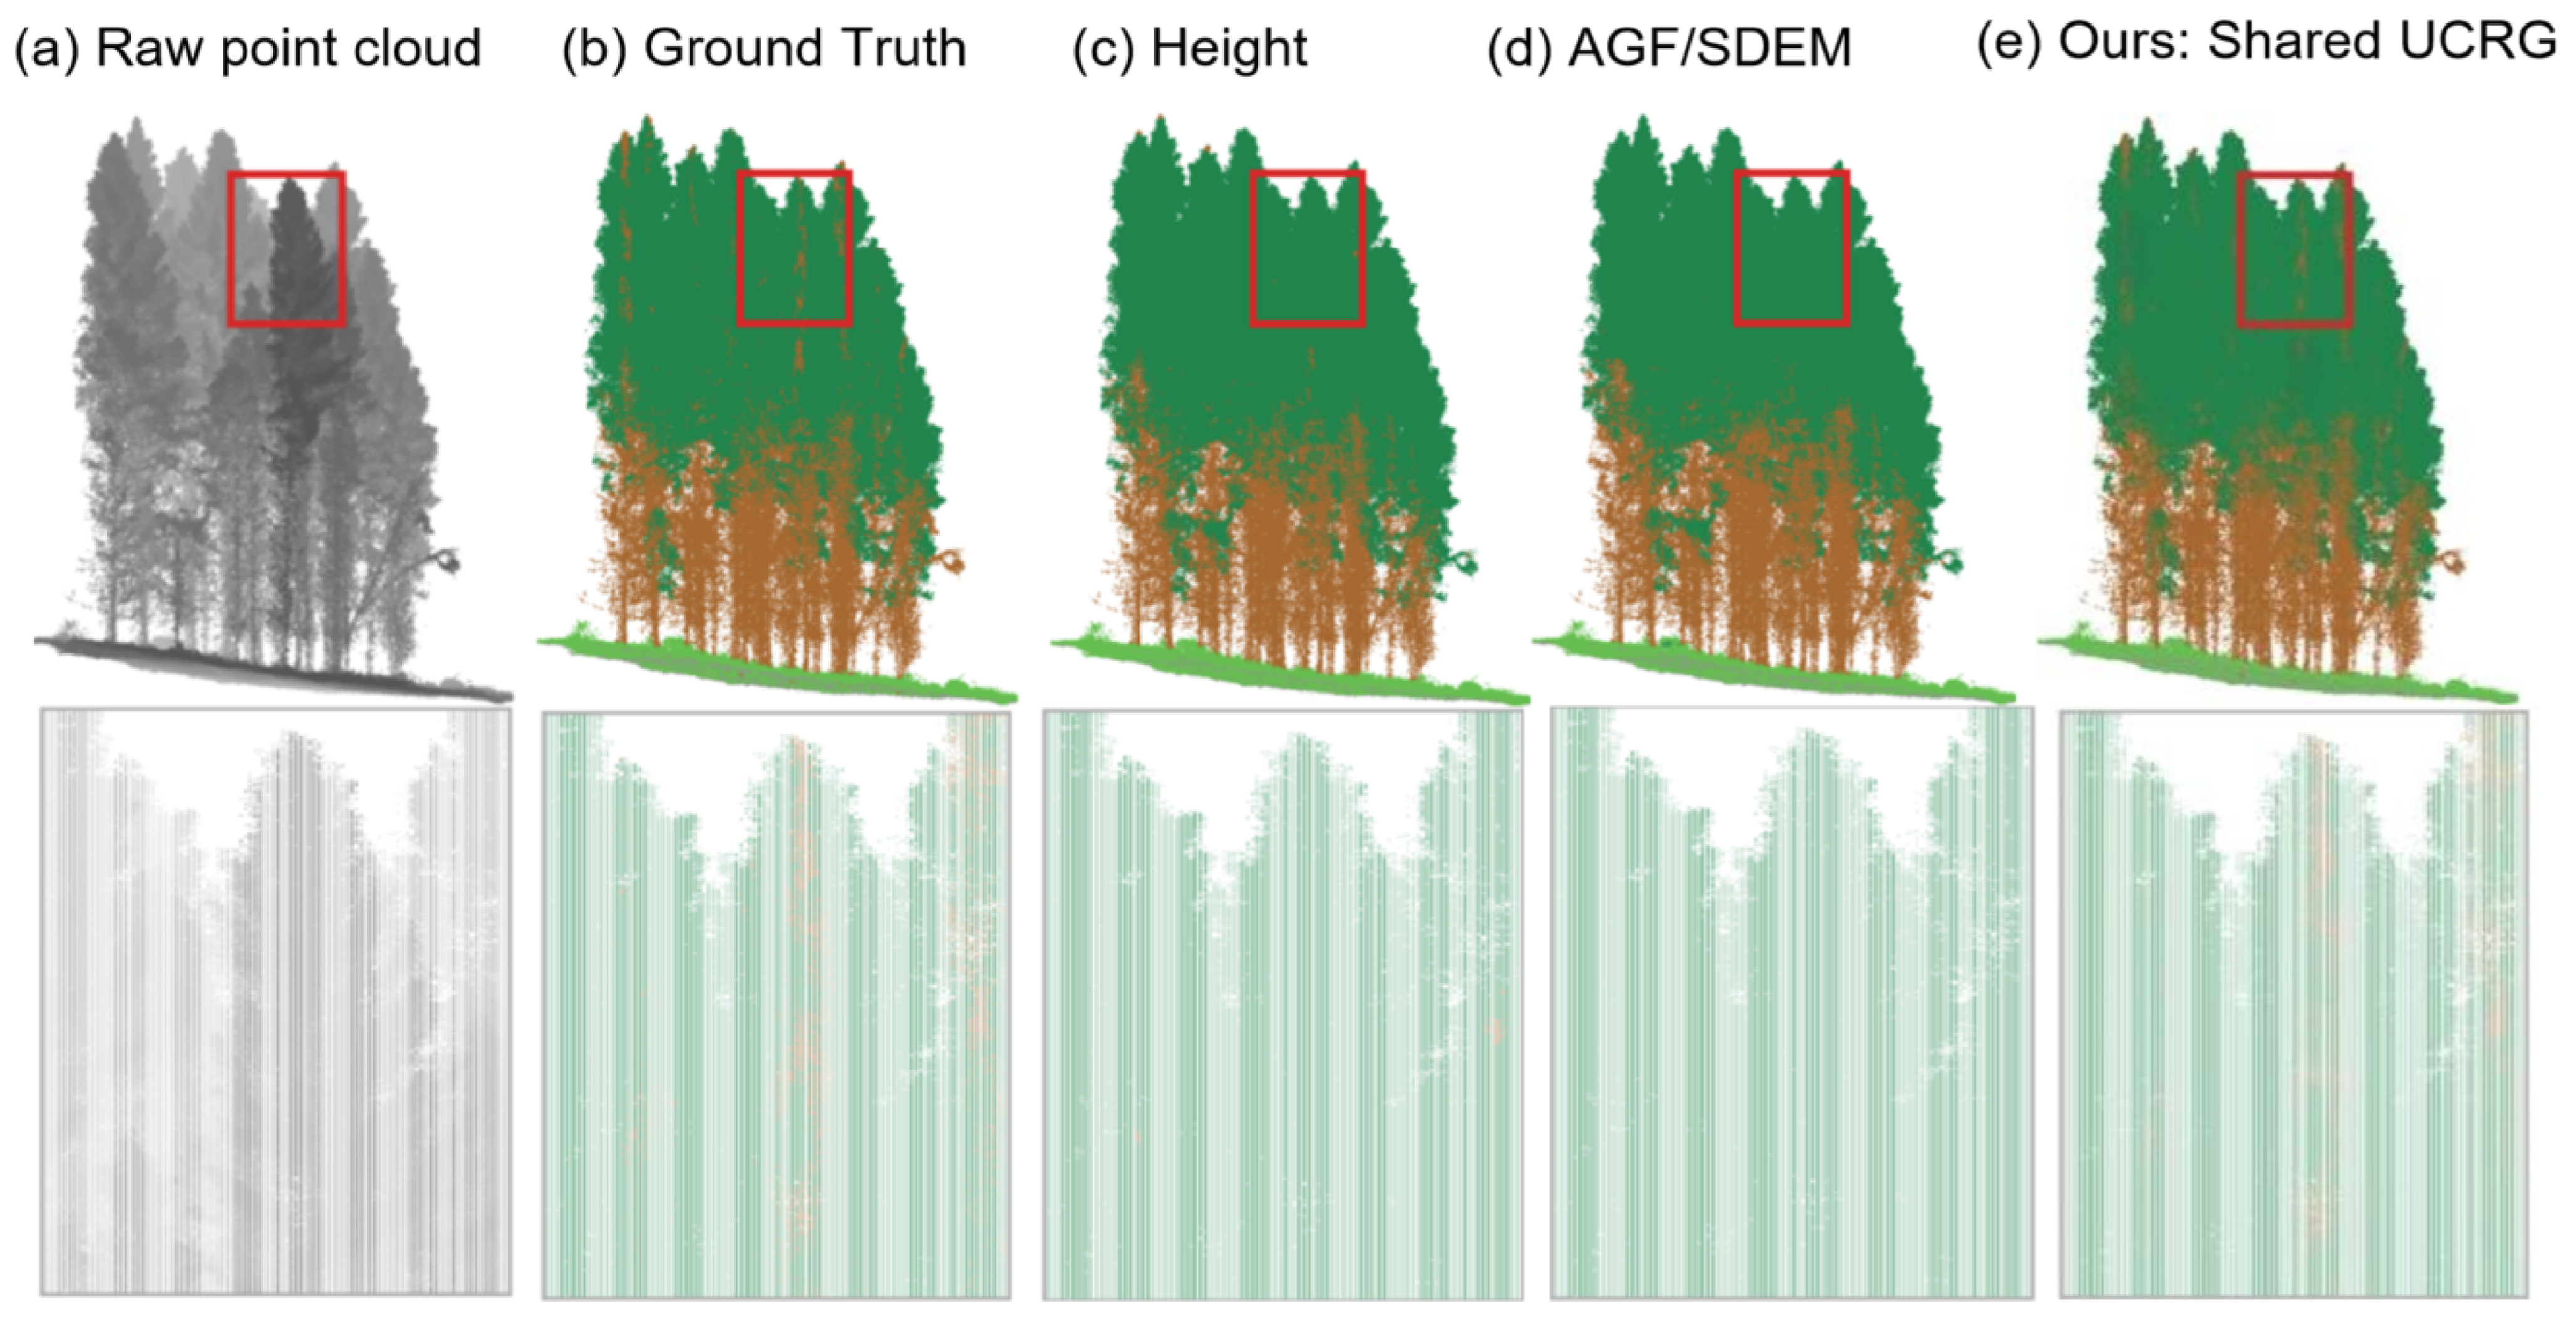
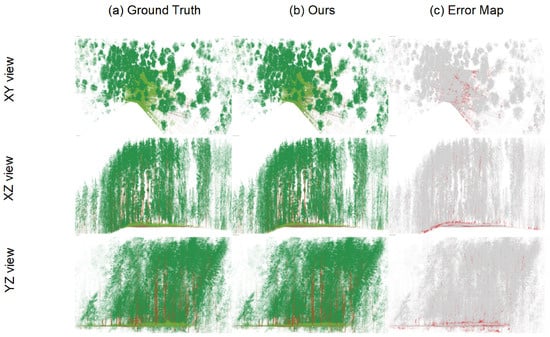
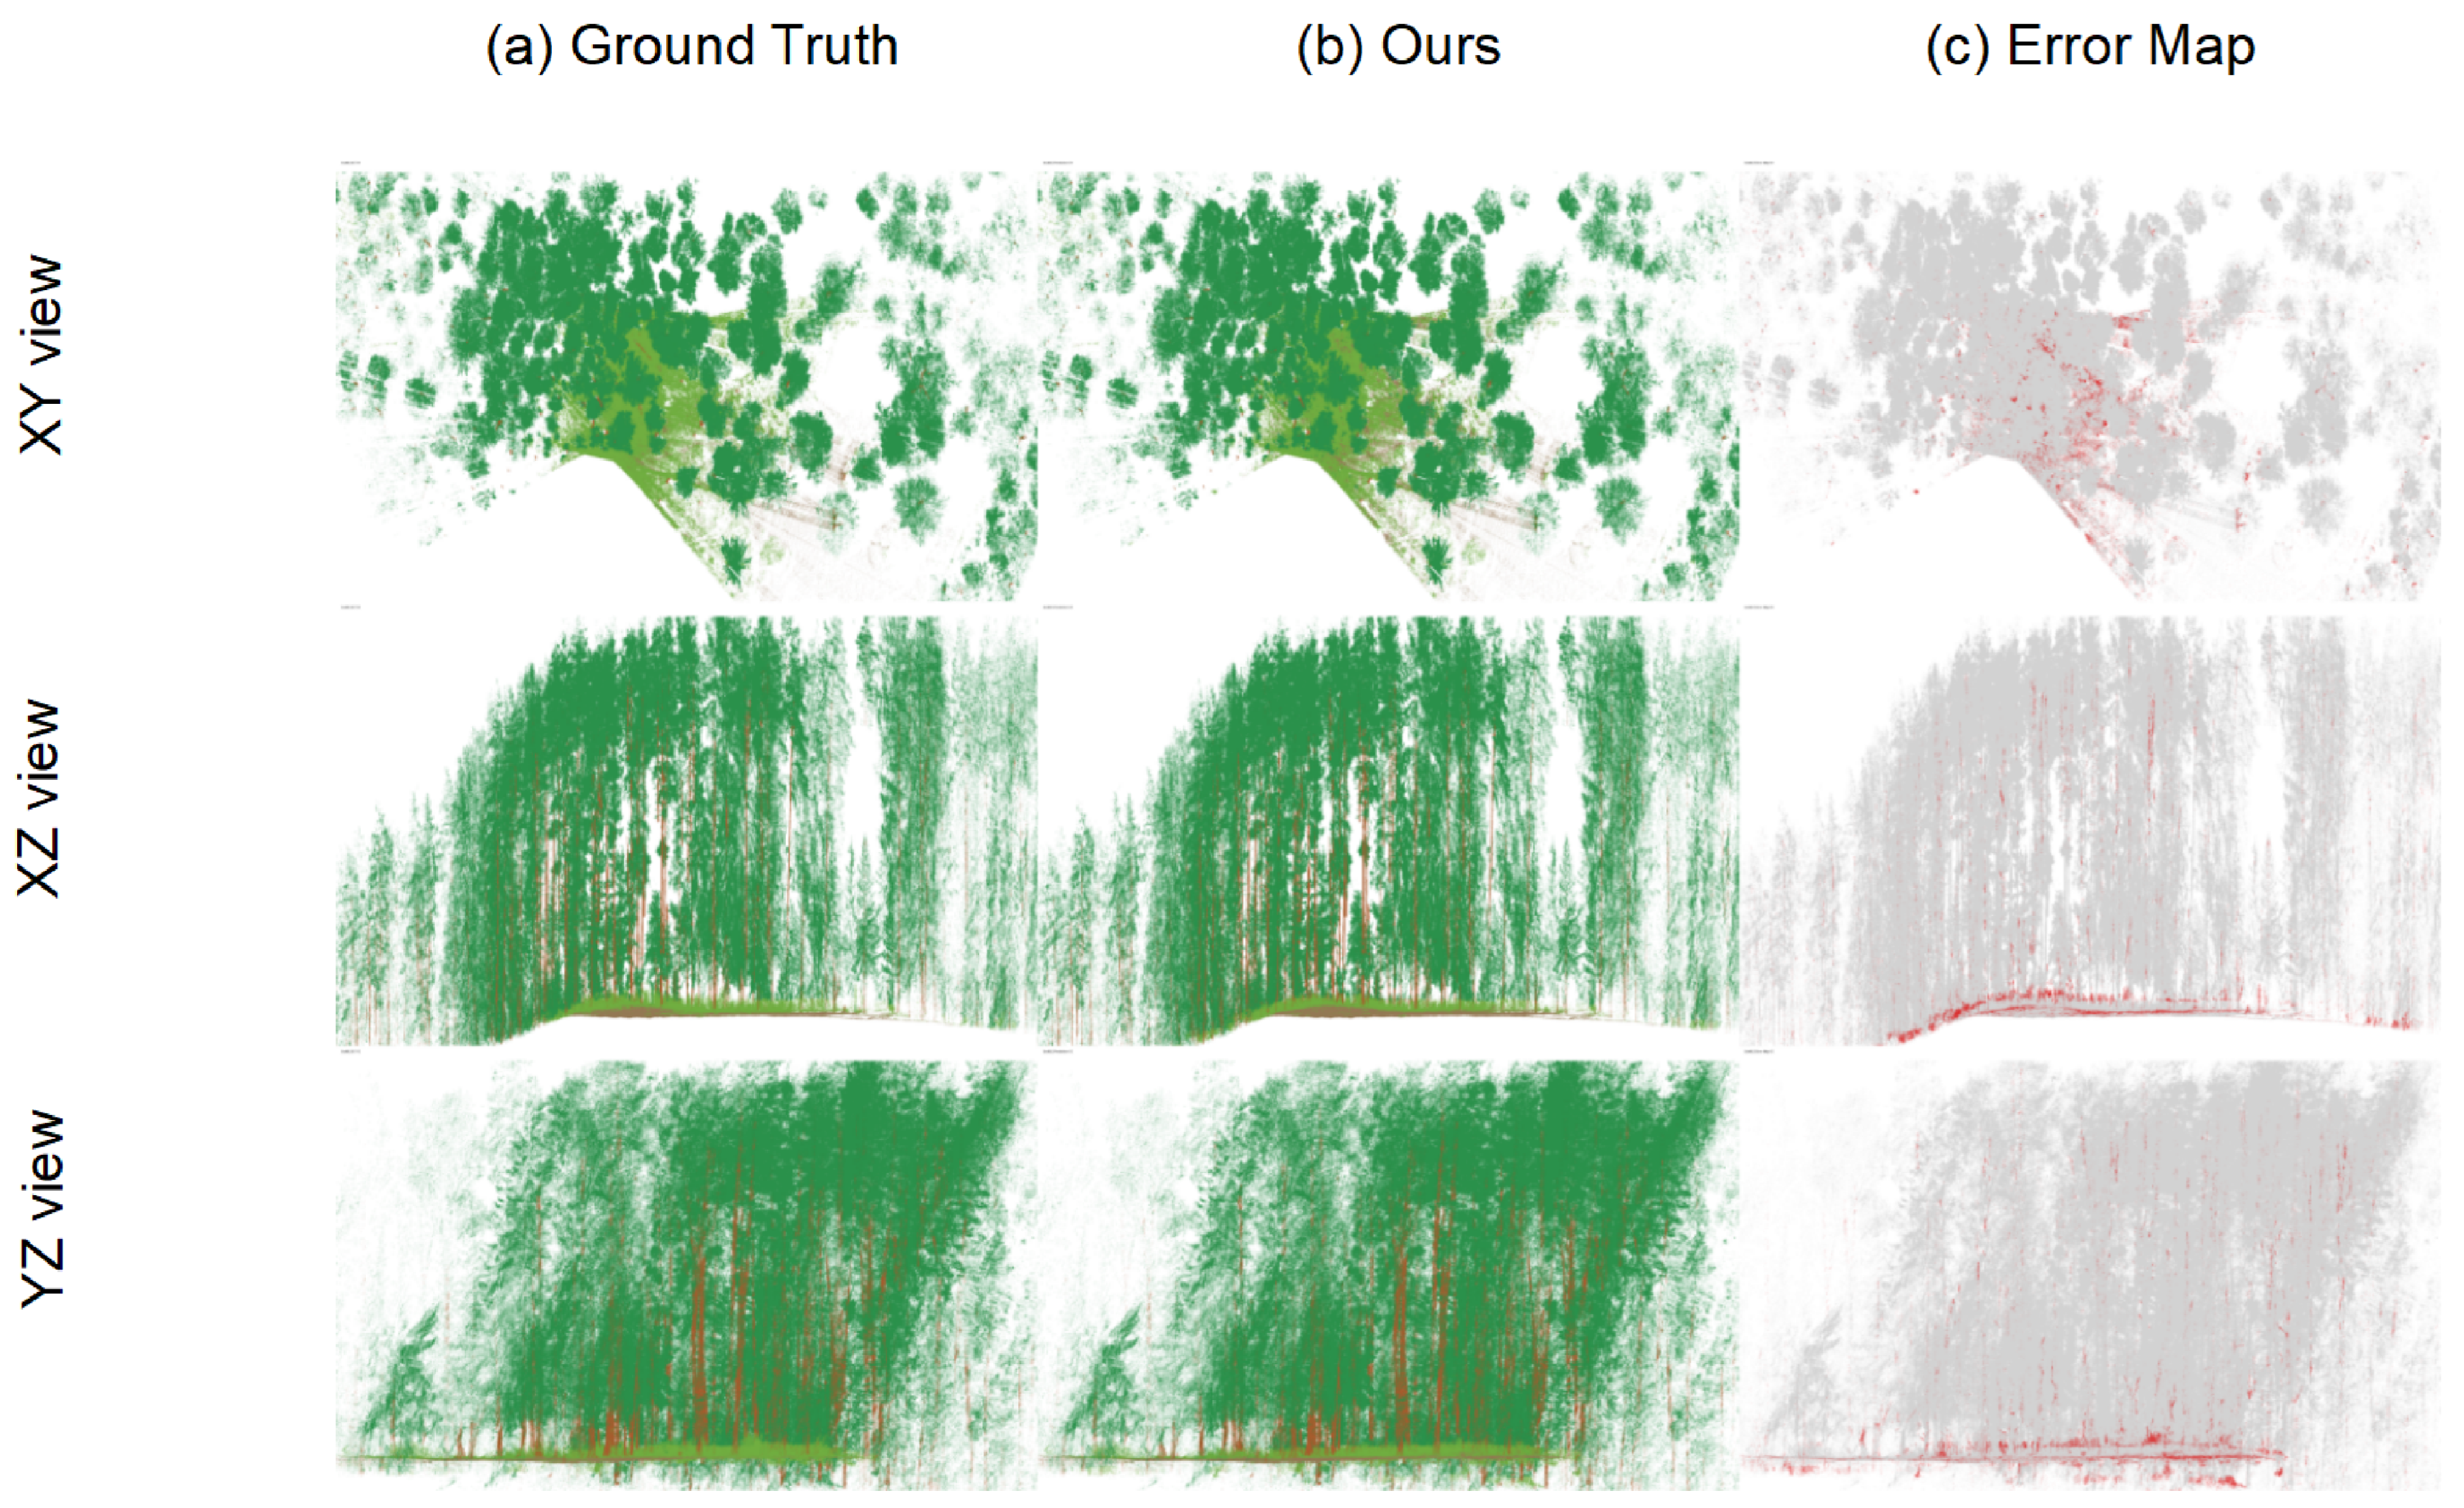
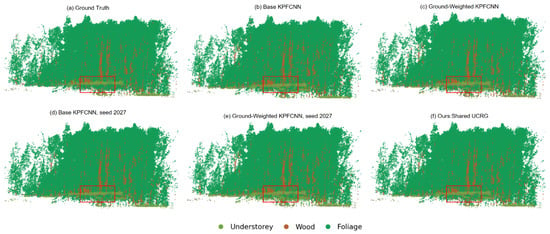
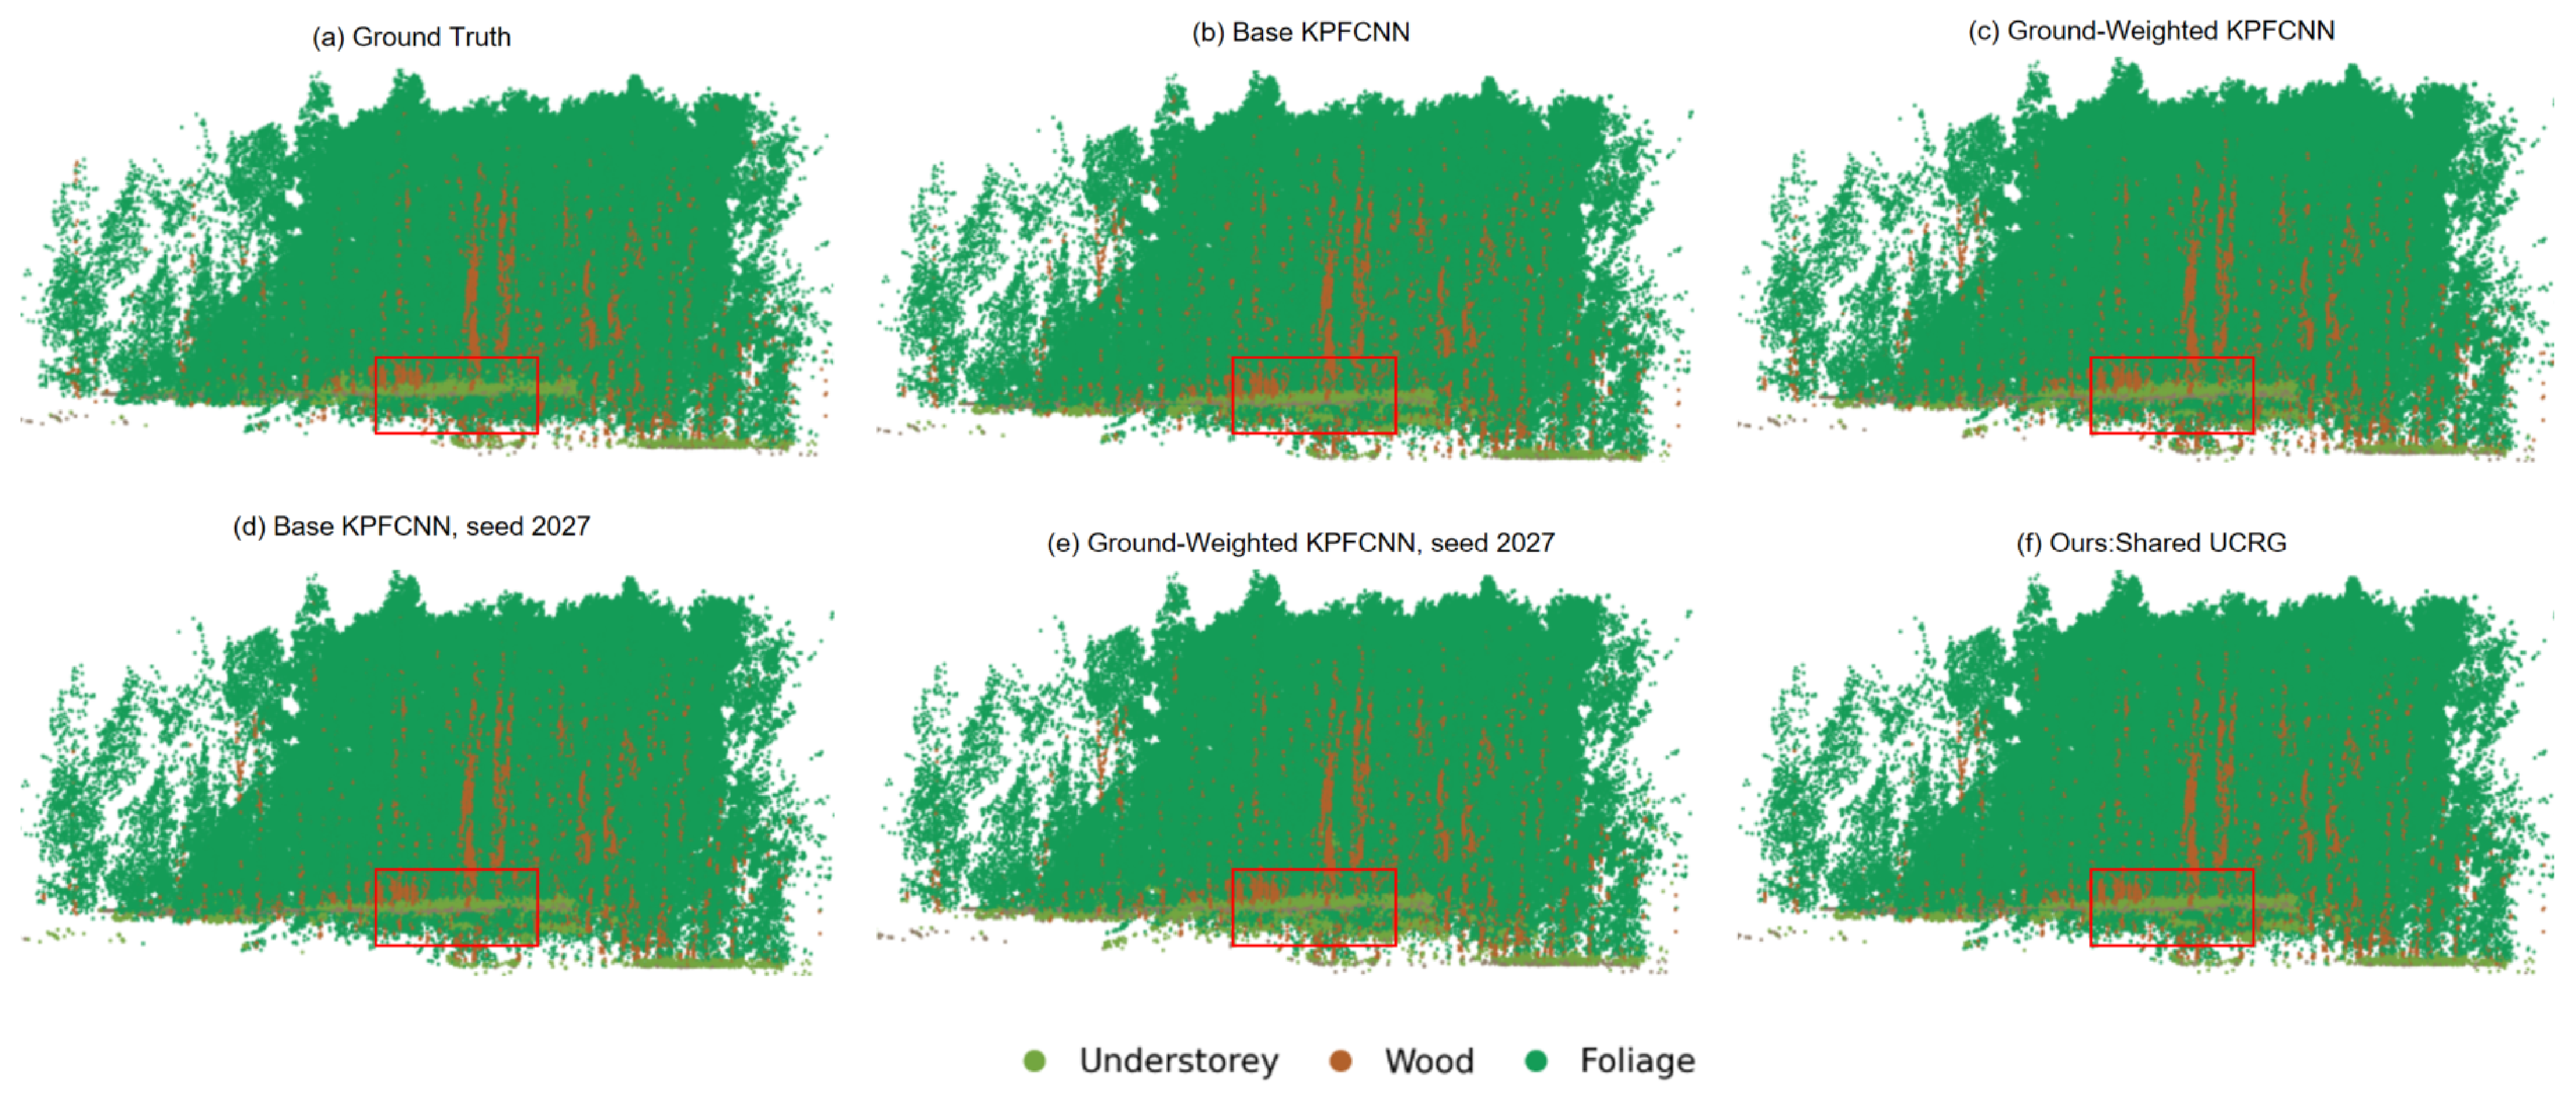
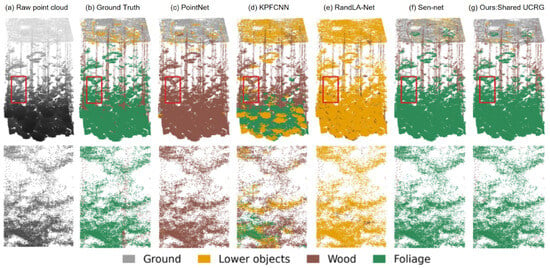
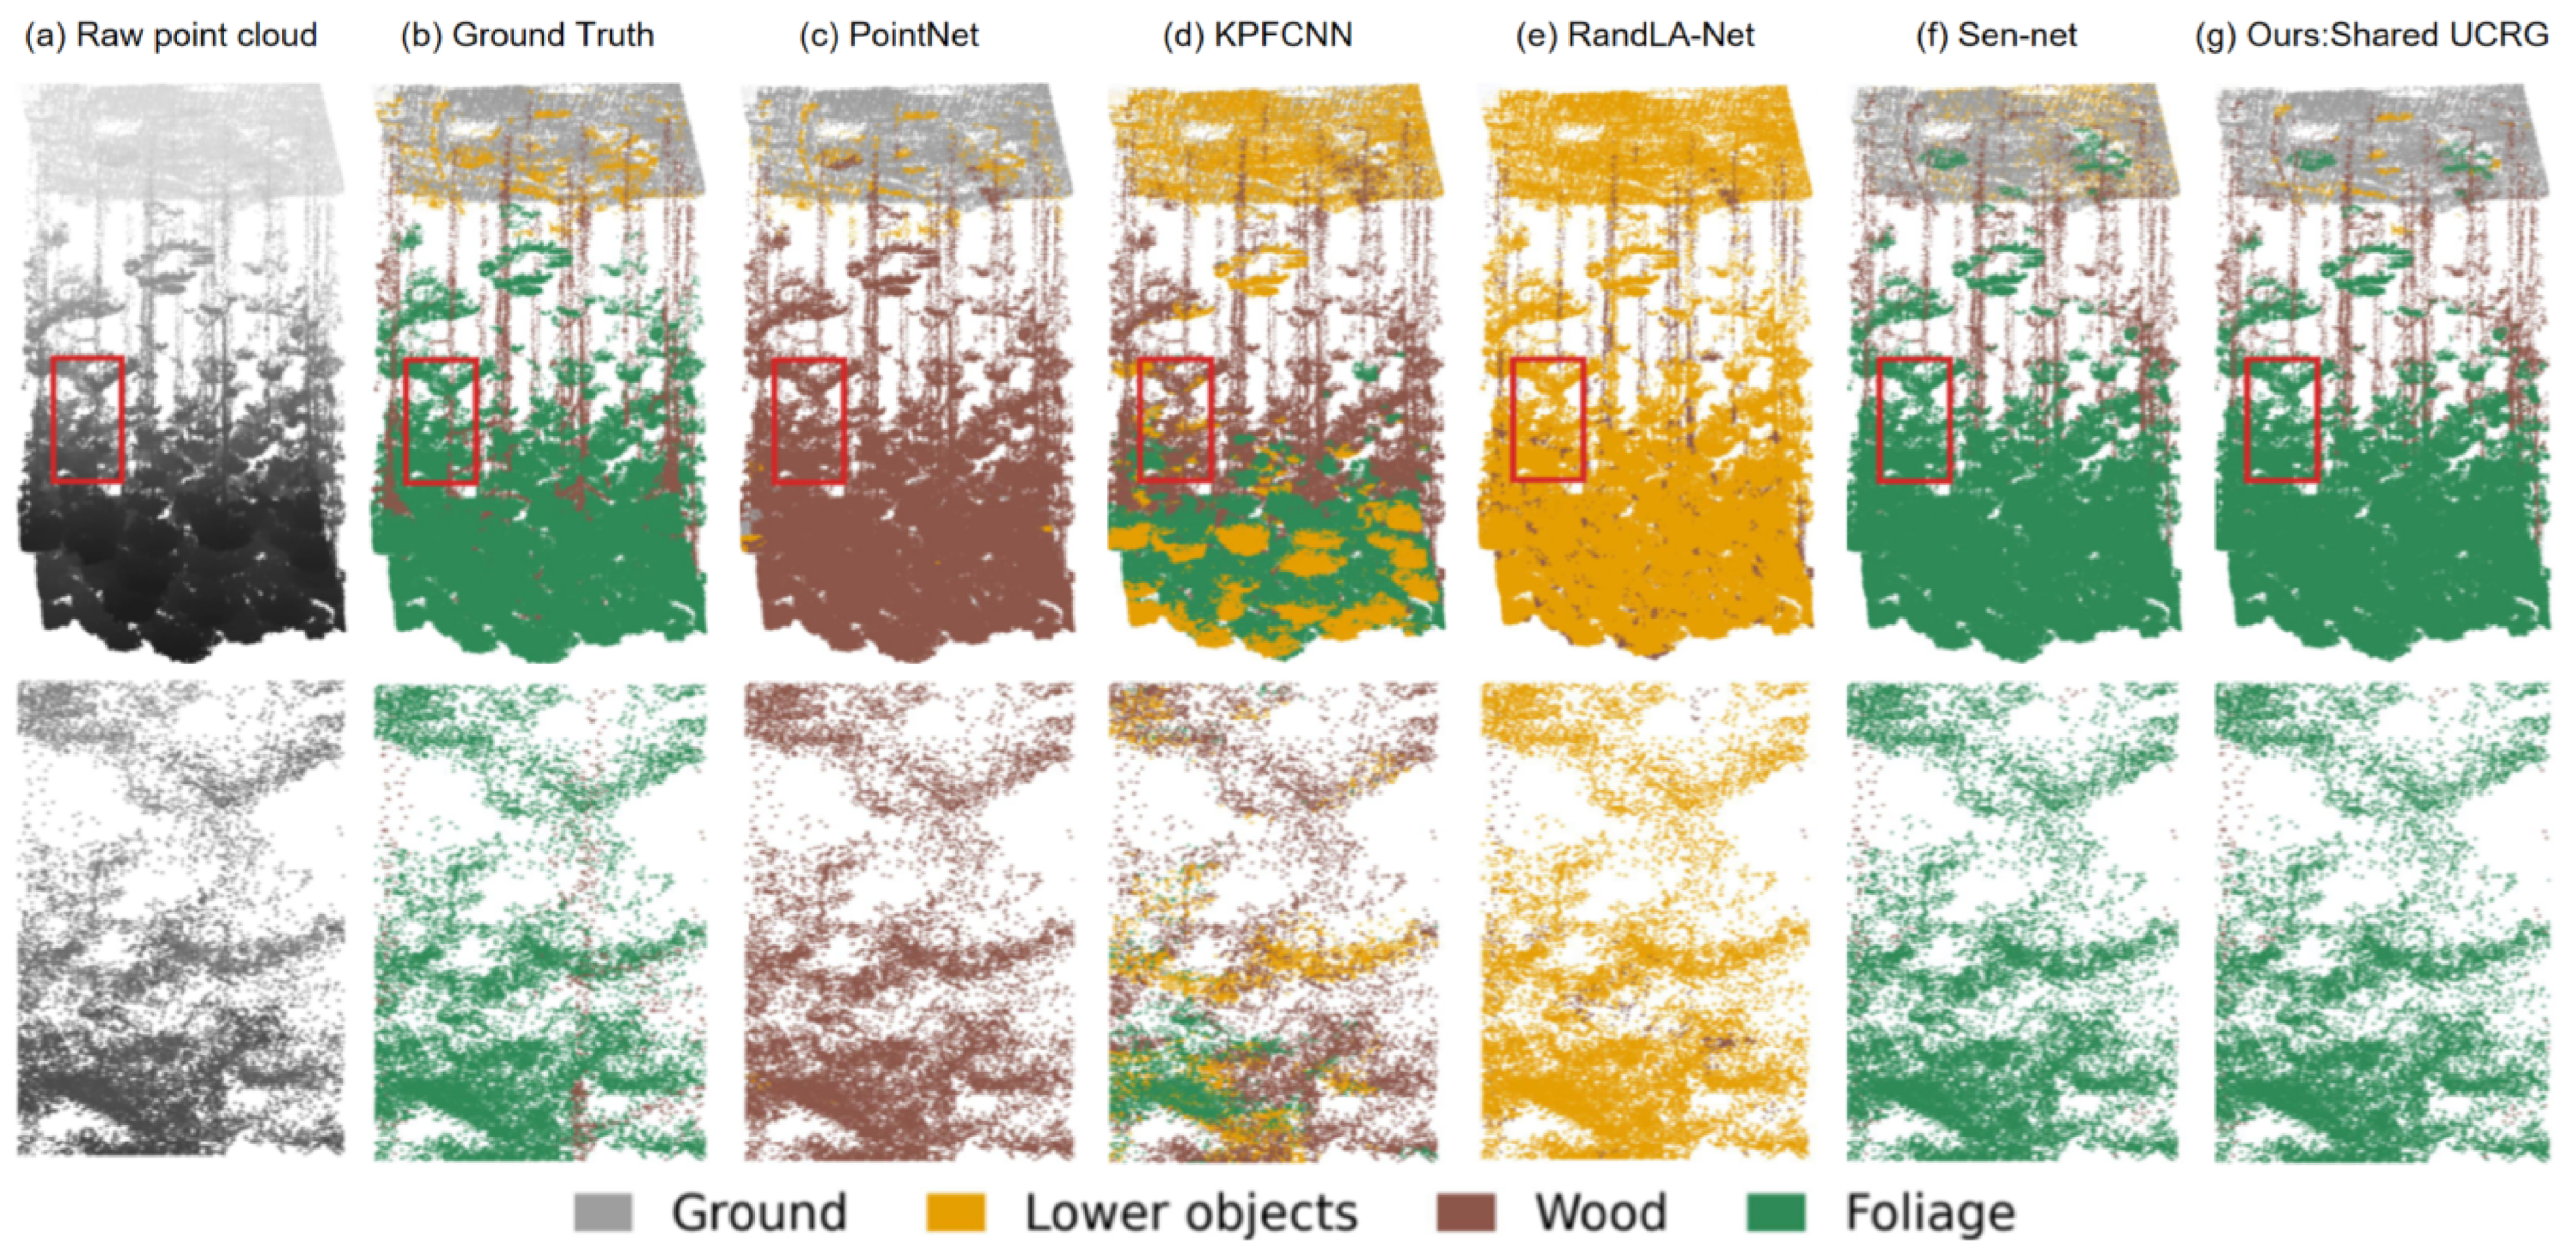

Disclaimer/Publisher’s Note: The statements, opinions and data contained in all publications are solely those of the individual author(s) and contributor(s) and not of MDPI and/or the editor(s). MDPI and/or the editor(s) disclaim responsibility for any injury to people or property resulting from any ideas, methods, instructions or products referred to in the content. |
© 2026 by the authors. Licensee MDPI, Basel, Switzerland. This article is an open access article distributed under the terms and conditions of the Creative Commons Attribution (CC BY) license.