


Highlights
What are the main findings?
- The synergy between EarthCARE CPR and Meteosat Rapid Scan observations provides a comprehensive framework for characterizing the vertical structure and temporal evolution of Mediterranean deep convection.
- The combination of low cloud-top temperatures, rapid cloud-top cooling, lightning activity and hail probability effectively identifies the most intense convective cells, while Doppler-velocity variability emerges as a robust proxy for convective intensity.
What are the implications of the main findings?
- Multisensor synergy can substantially enhance the detection and characterization of deep convection, demonstrating the value of combining complementary observations to overcome the sampling limitations of individual sensors.
- Geostationary observations provide essential temporal and morphological context for interpreting instantaneous spaceborne Doppler-radar measurements, enabling the evolution and intensity of convective systems to be placed in a broader dynamical framework.
- While convective areas can be reliably identified, quantitative retrievals of vertical air motions remain challenging, highlighting a key limitation of current spaceborne observations of convection.
Abstract
Convection plays a key role in the Earth’s energy balance and is responsible for severe weather phenomena such as hailstorms, which cause significant damage to infrastructure and agriculture. This study investigates convective events over the Mediterranean Basin between September 2024 and September 2025 using a synergistic combination of active and passive satellite observations from geostationary (GEO) and low Earth orbit (LEO) platforms. Convective evolution is analyzed using EUMETSAT Satellite Application Facility on Support to Nowcasting and Very Short Range Forecasting products derived from Meteosat Rapid Scan Service imagery and the Multi-sensor Approach for Satellite Hail Advection (MASHA), which combines passive microwave hail probability retrievals from the Global Precipitation Measurement constellation with high-temporal-resolution Meteosat infrared observations to monitor hail-producing storms in near real time. The analysis is further enhanced with EarthCARE Cloud Profiling Radar reflectivity and Doppler velocity measurements, whose spatial variability provides a proxy for identifying convective cores and storm intensity. For selected events, observations from the Meteosat Third Generation Lightning Imager are also examined, highlighting the close relationship between intense lightning activity and strong convective updrafts. The results demonstrate the potential of combining complementary satellite observations to improve the detection and characterization of severe convection and hail-producing storms and identify the key roadblocks and pathways towards the effective integration of LEO and GEO observations.
1. Introduction
Atmospheric convection is a fundamental process governing weather patterns, sustaining the hydrological cycle and regulating the Earth’s energy balance [1,2]. At the same time, convective systems are among the most important sources of high-impact weather, producing heavy precipitation, damaging winds and hail, with potentially severe socio-economic consequences. Through the vertical transport of heat, moisture and momentum from the boundary layer into the free atmosphere, convection plays a key role in coupling different layers of the atmosphere, while condensation and precipitation associated with convective updrafts redistribute water and latent heat throughout the atmospheric column [3]. The vertical structure and intensity of convection are therefore critical for understanding its development, evolution and interactions with the surrounding environment, as well as for assessing its potential impacts on weather and climate.
Several observing systems are available for investigating convection, yet each provides only a partial view of this complex and rapidly evolving phenomenon. Ground-based radars offer high spatial resolution and Doppler measurements of storm dynamics, making them particularly valuable for resolving convective cores and their internal structure. However, their coverage is largely confined to land, primarily in developed regions, and measurement quality can degrade with increasing distance from the radar. Even where extensive radar networks are available, observations remain geographically and temporally limited, constraining their utility for deriving global statistics. Moreover, conventional operational volume scans may not provide sufficient temporal resolution to adequately capture rapidly evolving convective events. The Multisensor Agile Adaptive Sampling (MAAS) framework [4], for example, addresses some of these limitations through a multisensor approach that combines complementary observations to track storms in real time, with sensing strategies guided by scientific objectives rather than predefined scanning patterns.
Spaceborne radars extend observations to much larger areas, although their measurements remain discontinuous for individual events because of satellite orbits and swath limitations. Different radar frequencies provide complementary information: lower-frequency (Ku band) radars are generally less affected by attenuation and are better suited to observing larger hydrometeors, whereas higher-frequency (Ka and W-bands) radars are more sensitive to small particles and ice hydrometeors but are more strongly attenuated in precipitation. Global characterization of tropical and extratropical rainfall, deep-convection structure and cloud distribution has been achieved through several studies based on TRMM, GPM, RainCube and CloudSat [5].
A key limitation of spaceborne observations has been the difficulty of directly measuring convective vertical air motions, a crucial parameter for assessing convective intensity. The launch of the ESA–JAXA EarthCARE (EC) mission in May 2024 [6] marks an important advance in this direction. Its Doppler cloud-profiling radar (CPR), the first atmospheric Doppler radar in space [7,8], provides vertically resolved measurements of Doppler velocity, offering new opportunities to investigate cloud and precipitation dynamics from space [9,10]. The Doppler capability enables the investigation of vertical air motions and their variability within convective systems, complementing the microphysical and structural information provided by radar reflectivity. This represents a major step toward studying convective processes globally and investigating the coupling between microphysics, dynamics and radiative effects that governs the life cycle of deep convection [11,12,13]. Since becoming operational, the EarthCARE CPR has provided insights into low marine clouds [14], sedimentation velocity in the Arctic region [9] and vertical velocities [15,16].
Despite these premises, measuring Doppler velocities from space presents several challenges [5,11]. The primary limitation is the narrow Nyquist velocity () range, resulting from the 3 mm wavelength and the Pulse Repetition Frequency (PRF) trade-off between minimizing second-trip echoes and maximizing the measurable Doppler velocity range. During commissioning, the PRF was increased to 7.5 kHz at high latitudes, but the resulting Nyquist velocity of only 5.5 m/s still causes frequent aliasing and noisy Doppler estimates, particularly in intense convection and regions with large Doppler spectral widths (e.g., associated to strong turbulence and/or wind shears) [10,17]. The narrow Nyquist range also hampers de-aliasing, as cloud-top velocities provide no unambiguous reference for distinguishing updrafts from downdrafts after low signal-to-noise ratio (SNR) filtering [17].
Even if Doppler velocities are properly de-aliased, they are not a direct measurement of vertical air motions but represent the motions of the radar-scattering hydrometeors and are therefore influenced by both air motions and hydrometeor fall velocities, which cannot be simply estimated and then subtracted in regions of deep convection. Furthermore, regions affected by strong multiple scattering or large spectral widths can appear as white noise in the Doppler signal, biasing the measured velocities toward 0 m/s. Passive microwave observations provide an additional complementary information on the integrated and vertically distributed hydrometeors and, via sounding channels, thermodynamic structure of convective systems. Their sensitivity to liquid and frozen hydrometeors varies with frequency; in particular, high-frequency channels are sensitive to the scattering signature of ice particles and can therefore provide valuable information on deep convective systems [18,19]. Their relatively coarse spatial resolution and the limited temporal sampling of low-Earth-orbit platforms can be combined to build temporal information on the development and organization of convective systems.
Geostationary (GEO) satellites allow for continuous monitoring of cloud evolution over large areas, with observations typically available every 5–15 min. This temporal continuity is particularly valuable for detecting convective initiation and tracking rapid cloud-top changes using decreases in infrared brightness temperatures (IR BTs) [20,21,22]. However, their relatively coarse spatial resolution limits the representation of small-scale convective cores, especially when embedded within larger cloud systems. In addition, GEO infrared sensors primarily observe cloud tops rather than internal vertical structures, thus they are not able to identify convective cores within the clouds.
The complementary nature of all these observing systems is therefore essential: their synergistic use can combine the spatial and temporal continuity of geostationary observations with the detailed vertical and microphysical information provided by active and passive sensors, improving the detection and characterization of convection across a range of spatial and temporal scales.
The scope of this work is to characterize convection through the synergistic use of EarthCARE, geostationary and LEO passive microwave observations, combining vertically resolved microphysical and dynamical information from EarthCARE with GEO monitoring of cloud evolution and PMW signatures of hail. The area focus of the study is over the Mediterranean basin where the Meteosat Second Generation Rapid Scan Service (MSG RSS) data are available. The Mediterranean Basin is a region of complex and highly variable convective activity, shaped by the interaction of land–sea contrasts, surrounding mountainous terrain and synoptic-scale atmospheric disturbances. Convective activity exhibits a pronounced seasonal evolution, occurring predominantly over land during summer and progressively shifting toward the sea during autumn, when enhanced convection is observed over several sub-basins, including the Adriatic, Ionian and western Mediterranean. Such spatial and temporal variability, together with the limited availability of observations over the sea, makes the Mediterranean an important region for investigating the structure and dynamics of convective systems [23,24].
2. Materials and Methods
The life cycle of Mediterranean convection can be investigated through the complementary information provided by GEO (IR and lighning sensors) and LEO satellites, combining the continuous monitoring of cloud evolution with observations of hail and electrical activity. These observables are closely linked to convective intensity and development, with particularly strong relationships reported between lightning activity, deep convective development and hail occurrence (e.g., [25,26,27,28,29]).
2.1. EC
Reflectivity data from the Level 1b C-NOM (500 m resolution) and Level 2a C-PRO (1 km resolution) products, corrected for gaseous attenuation and second-trip echoes, are utilized [17]. Doppler velocity data are taken from the Level 2a products and consist of 1 km resolution velocities corrected for antenna mispointing [30]. To characterize convective updrafts at the finest spatial resolution (1 km), two additional diagnostic parameters were calculated: (i) the Number of Doppler Velocity Foldings (NDVF), where a folding event was identified by examining successive vertical range gates (100 m resolution) whenever the absolute velocity difference between adjacent gates was smaller after adjusting the velocity of the subsequent gate by than when using the recorded velocity; and (ii) the number of pixels with vertical velocities outside the typical stratiform cloud velocity range of −2 to 3 m/s referred to as the Number of Non-Stratiform Pixels (NNSP). Given the challenges associated with W-band observations of the rain layer in convective clouds, including attenuation, multiple scattering and hydrometeor sedimentation, the calculation of Doppler-velocity-based qualitative proxies is restricted to the region above the freezing level. These two parameters serve as qualitative proxies for the intensity of vertical motions [12].
2.2. EUMETSAT NWC SAF Convection Product
The convective scenarios were characterized using the Rapidly Developing Thunderstorm (RDT) product from the EUMETSAT Satellite Application Facility on support to Nowcasting and Very Short Range Forecasting (NWC SAF, https://www.nwcsaf.org/) [31,32]. The RDT product was generated with the GEO software package v2021.3 applied to MSG RSS data to guarantee the highest available temporal resolution (i.e., 5 min) over the Mediterranean, which is essential for tracking the evolution of convective systems. ERA5 hourly data at 0.25° spatial resolution [33] supplied the synoptic conditions required by the algorithm. The RDT was used to characterize CPR-detected convective cells, including their spatial extension, development phase (i.e., triggering, growing, mature and decaying), cooling rate (i.e., by tracking the minimum of the cloud top temperature during the convective system life cycle) and presence of overshooting tops. Cloud cells are identified as connected IR pixels below an adaptive, cell-specific BT threshold, determined by scanning 198–278 K in 1 K increments. The cell bottom is defined by the highest temperature threshold that distinguishes the cell from the warmer cloud background, while the top corresponds to the lowest temperature level differing by at least 6 K from the cell minimum BT. These two BT levels determine the contour lines delimiting the cloud cell. Parallax correction is applied to improve the spatial consistency between GEO and CPR observations.
GEO cloud-top temperature observations can provide a qualitative estimate of cloud-top ascent, based on the assumption that rising cloud tops penetrate colder atmospheric layers, causing IR BT to decrease over time. Spatially continuous cloud-top vertical velocity fields were derived from consecutive MSG RSS 10.8 μm BT observations 5 min apart. The retrieval uses BT differences between successive slots and is applied only to pixels within the convective cell bottom contours identified by the RDT product. Following [22], the cloud-top cooling rate is converted to vertical velocity by dividing it by a constant moist adiabatic lapse rate of 6.5 K/km [34]. This retrieval is subject to several limitations: the 5 min temporal resolution may not capture rapid convective evolution; horizontal cloud advection may contribute to the observed BT changes, as no cloud-element tracking is performed; the assumed lapse rate is constant despite its dependence on the thermodynamic environment; and the coarser MSG RSS spatial resolution (approximately 4–5 km at mid-latitudes) prevents direct pixel-to-pixel comparison with EarthCARE CPR observations. Therefore, the derived fields should be interpreted as qualitative proxies for the location and relative intensity of cloud-top ascent and convective growth, rather than quantitative estimates of in-cloud vertical air motion, providing useful context for the EarthCARE observations.
2.3. MASHA Algorithm for Hail Retrieval
Due to the strong connection between hail and convection [35,36], the Multi-sensor Approach for Satellite Hail Advection (MASHA) algorithm was applied to detect hail and track hail-bearing convective systems at the MSG RSS spatio-temporal resolution. The algorithm is based on a blended GEO-IR and low-Earth-orbit (LEO)-passive microwave (PWM) technique at the rapid update originally conceived for precipitation retrieval [37]. It combines GEO-IR and LEO PMW observations from the Global Precipitation Measurement satellite constellation (GPM-C) through a histogram-matching approach, linking hail probabilities derived from the MicroWave Cloud Classification for Hail (MWCC-H) algorithm to MSG 10.8 μm BTs. MWCC-H estimates hail probability from 150–170 GHz BTs using logistic regression, exploiting the enhanced microwave scattering associated with increasing hail size and distinguishing three hail categories as shown in Table 1 [27,28].
Table 1.
Categorization of the different hail types as classified by the MWCC-H algorithm.
A key aspect of the MASHA method is the identification of spatio-temporally collocated GPM-C and MSG observations. This task is performed using a spatial tolerance of 10 km and a temporal tolerance of 15 min. These criteria are used to generate the coincidence dataset, which is subsequently employed to apply the MWCC-H algorithm to GPM-C data. Coincident observations are aggregated within 0.5° spatial grid cells, starting from the oldest observations (up to 24 h before the acquisition time of the GEO slot being processed) and progressing to the most recent. The aggregation continues until either the spatial coverage of the 0.5° cell exceeds 75% or the number of coincident observations reaches 80. These thresholds ensure that a sufficient number of samples is available to derive, through histogram matching, the relationship between IR BTs and the corresponding MWCC-H hail probabilities. Each relationship is updated whenever new coincident observations become available within its 0.5° cell. The most recent relationship is then used to assign a hail probability to every GEO pixel located within that cell, provided that it is no older than 24 h relative to the acquisition time of the processed GEO slot. Despite its high temporal resolution, MASHA may underestimate or miss hail events when suitable PMW overpasses are unavailable or when rapidly intensifying convective systems evolve faster than the IR BTs–PMW relationships can be updated. MASHA provides an innovative satellite-based approach for tracking hailstorms across Central Europe, the Mediterranean Basin and North Africa. It has been successfully applied to hail-prone convective systems, particularly rapidly intensifying severe storms [38], and is also suitable for long-lasting synoptic systems such as Medicanes, whose hail production remains largely unexplored.
2.4. Geostationary Lightning Observations
The Meteosat Third Generation (MTG) geostationary satellite carries the Lightning Imager (LI), which provides continuous observations of lightning activity over our study area. The instrument detects transient increases in cloud-top radiance produced by lightning discharges and therefore observes total lightning activity without distinguishing between intra-cloud, cloud-to-cloud and cloud-to-ground lightning. Because a single lightning discharge can produce simultaneous detections in several neighboring pixels, individual pixel-level detections, called events, are clustered in space and time into lightning groups and flashes [39]. In this study, for selected events, we examined LI Level 2 lightning groups that were collocated with EarthCARE observations [40].
3. Census of Case Studies over the Mediterranean Region
A series of 20 case studies were analyzed between September 2024 and September 2025, covering distinct convective events in the region. The date, UTC time and features description of each event are listed in Table 2 to facilitate spatial and temporal interpretation. A selection of five case studies are discussed in the following representing convection events at different temporal stages (i.e., growing, mature and decaying), with different duration and presence of lighting activity.
Table 2.
List of convection case studies over the Mediterranean basin from September 2024 to September 2025. The main features of the convective systems are listed. SU: Strong Updraft; OT: Overshooting Top; SLS: Short-Lived System; LCS: Life Cycle Stage; LA: Lightning Activity (MTG-LI); HP: Hail Probability; S: Surface. For SU and OT, “yes” and “no” indicate the occurrence or absence of the feature, respectively. For LA, “yes” indicates the presence of lightning activity. A ✓ indicates that the system is classified as a SLS, while a “no” indicates that it is not. The LCS is specified where it can be determined, while × indicates that the life-cycle stage is ambiguous or cannot be verified. HP and S indicate the corresponding hail probability and surface characteristics, respectively. “no data” means that no sufficient data were available for the analysis.
The selected cases provide representative examples of Mediterranean convection observed by EarthCARE CPR, including both developing and mature systems. They are not intended as statistically representative climatology but rather illustrate the complementary capabilities of the different observing systems used in this study. The cases encompass different convective environments and stages of development. The criteria of Takahashi and Luo [41] were used as a general reference for deep convection, while developing systems below the 10 km cloud-top threshold were also retained.
In principle, geostationary imagery can aid in this situation, as it provides extensive views of cloud tops. However, depending on event location, the spatial resolution of geostationary data can be coarse—for instance, MSG RSS infrared imagery has a nadir resolution of about 3 km, which decreases moving away from the sub-satellite point.
3.1. Case Study I: Mature Deep Convection with Overshooting Top
This section presents a case study of a convective cell occurred on 4 September 2024 over the Tyrrhenian sea and overpassed by EC at 13:30 UTC. This case is useful to illustrate the main challenges associated with interpreting CPR Doppler velocity measurements and highlight the limitations of GEO observations in this context.
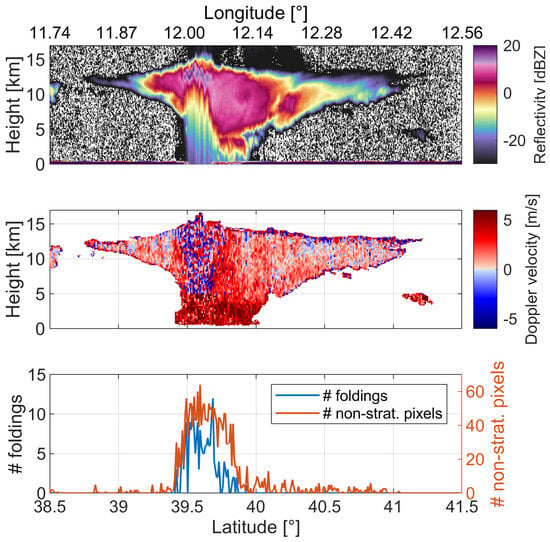
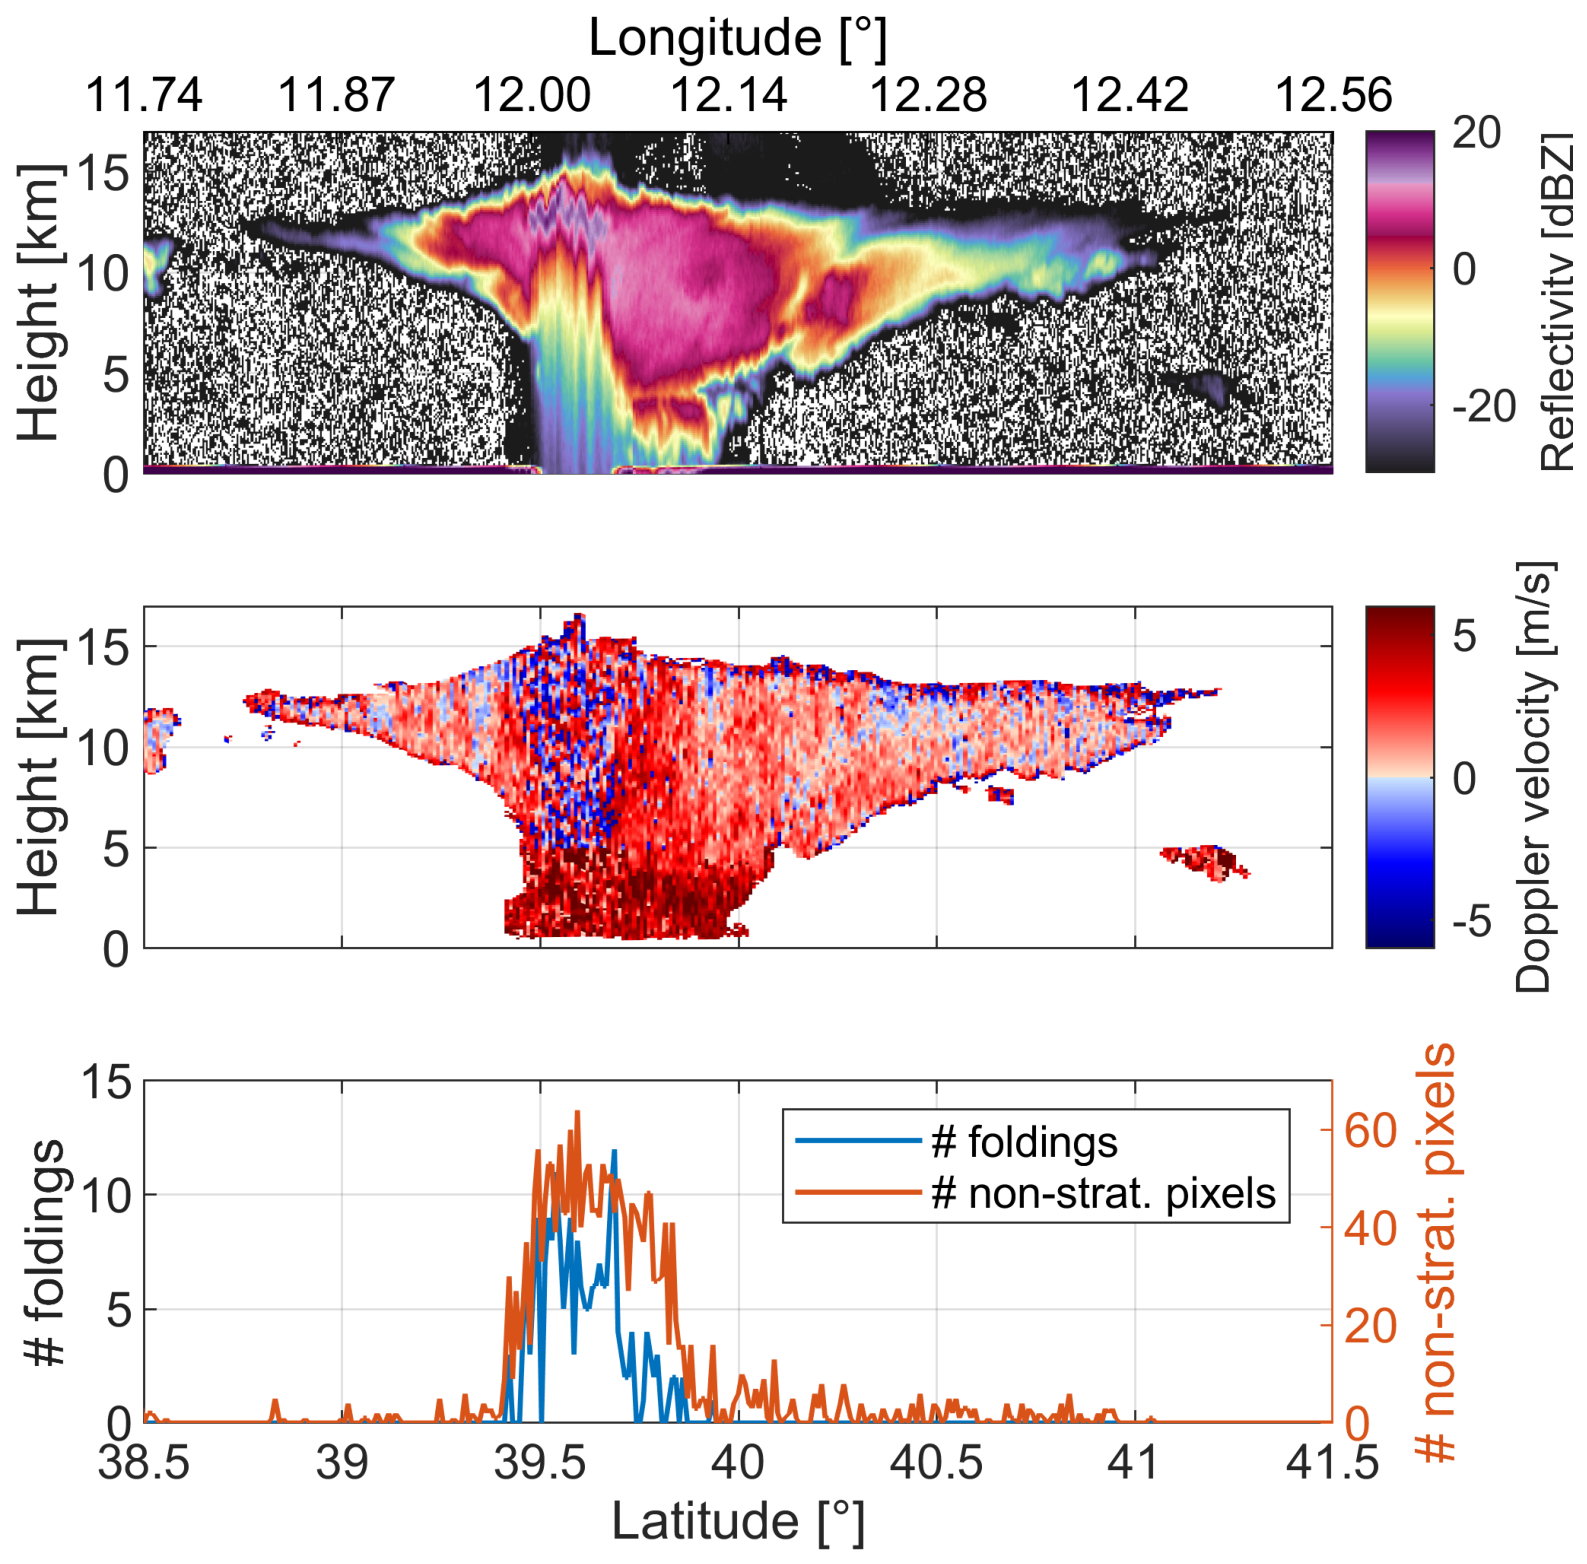
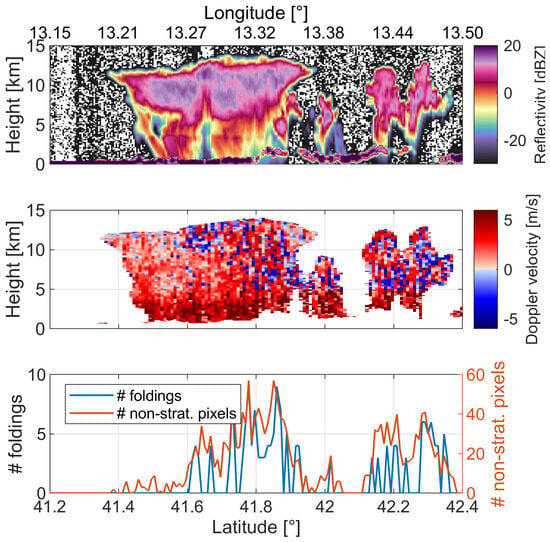
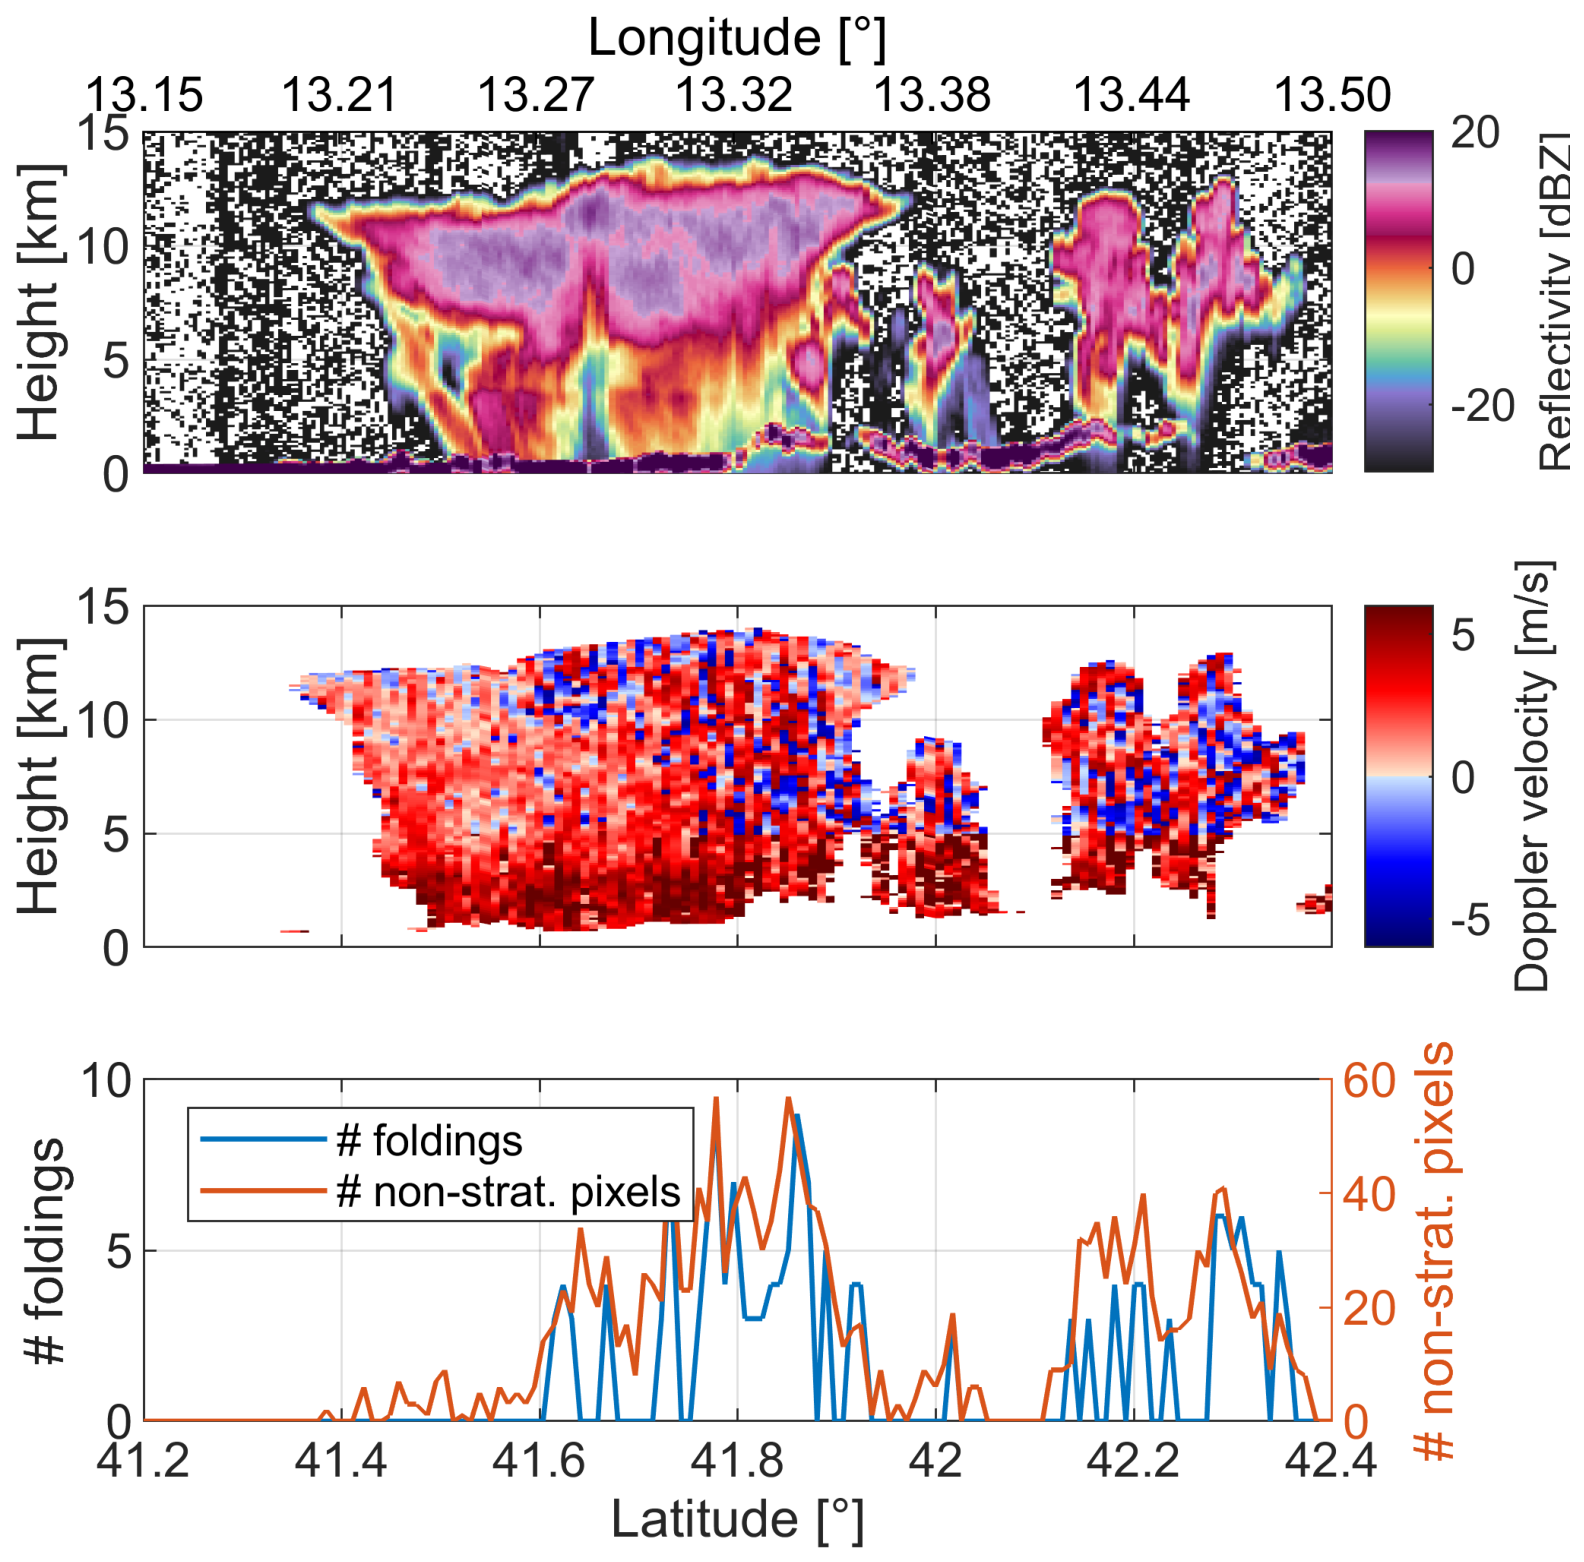
At 39.6°N latitude, the convective core exhibits an overshooting top, as indicated by the high-reflectivity protrusion extending above 15 km. Note that this is not an artifact introduced by the second trip echoes [42] that are clearly present when looking at the Level 1b C-NOM reflectivity (Figure 1, top panel) but are characterized by reflectivity values much lower than those occurring in the overshooting. The figure highlights the kilometer scale of the convective features, which cannot be captured by the coarser resolution GEO products.
Figure 1.
Top panel: reflectivity from Level 1b C-NOM product, 500 m along-track resolution, frame 1534D, recorded on 4 September 2024, over the Tyrrhenian Sea. Central panel: Doppler velocity at 1 km along-track resolution of the CPR scene. Bottom panel: the number of Doppler velocity pixels that fold and that exceed the stratiform region [−2, 3] m/s in the frozen part of the cloud.
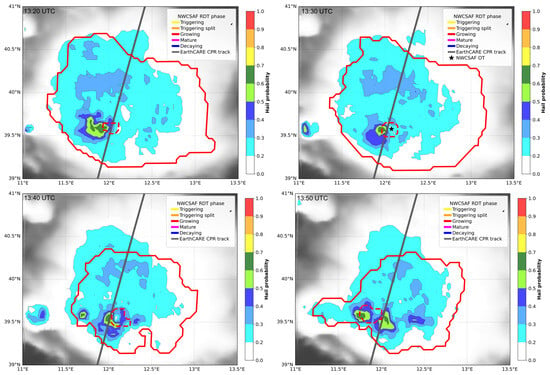
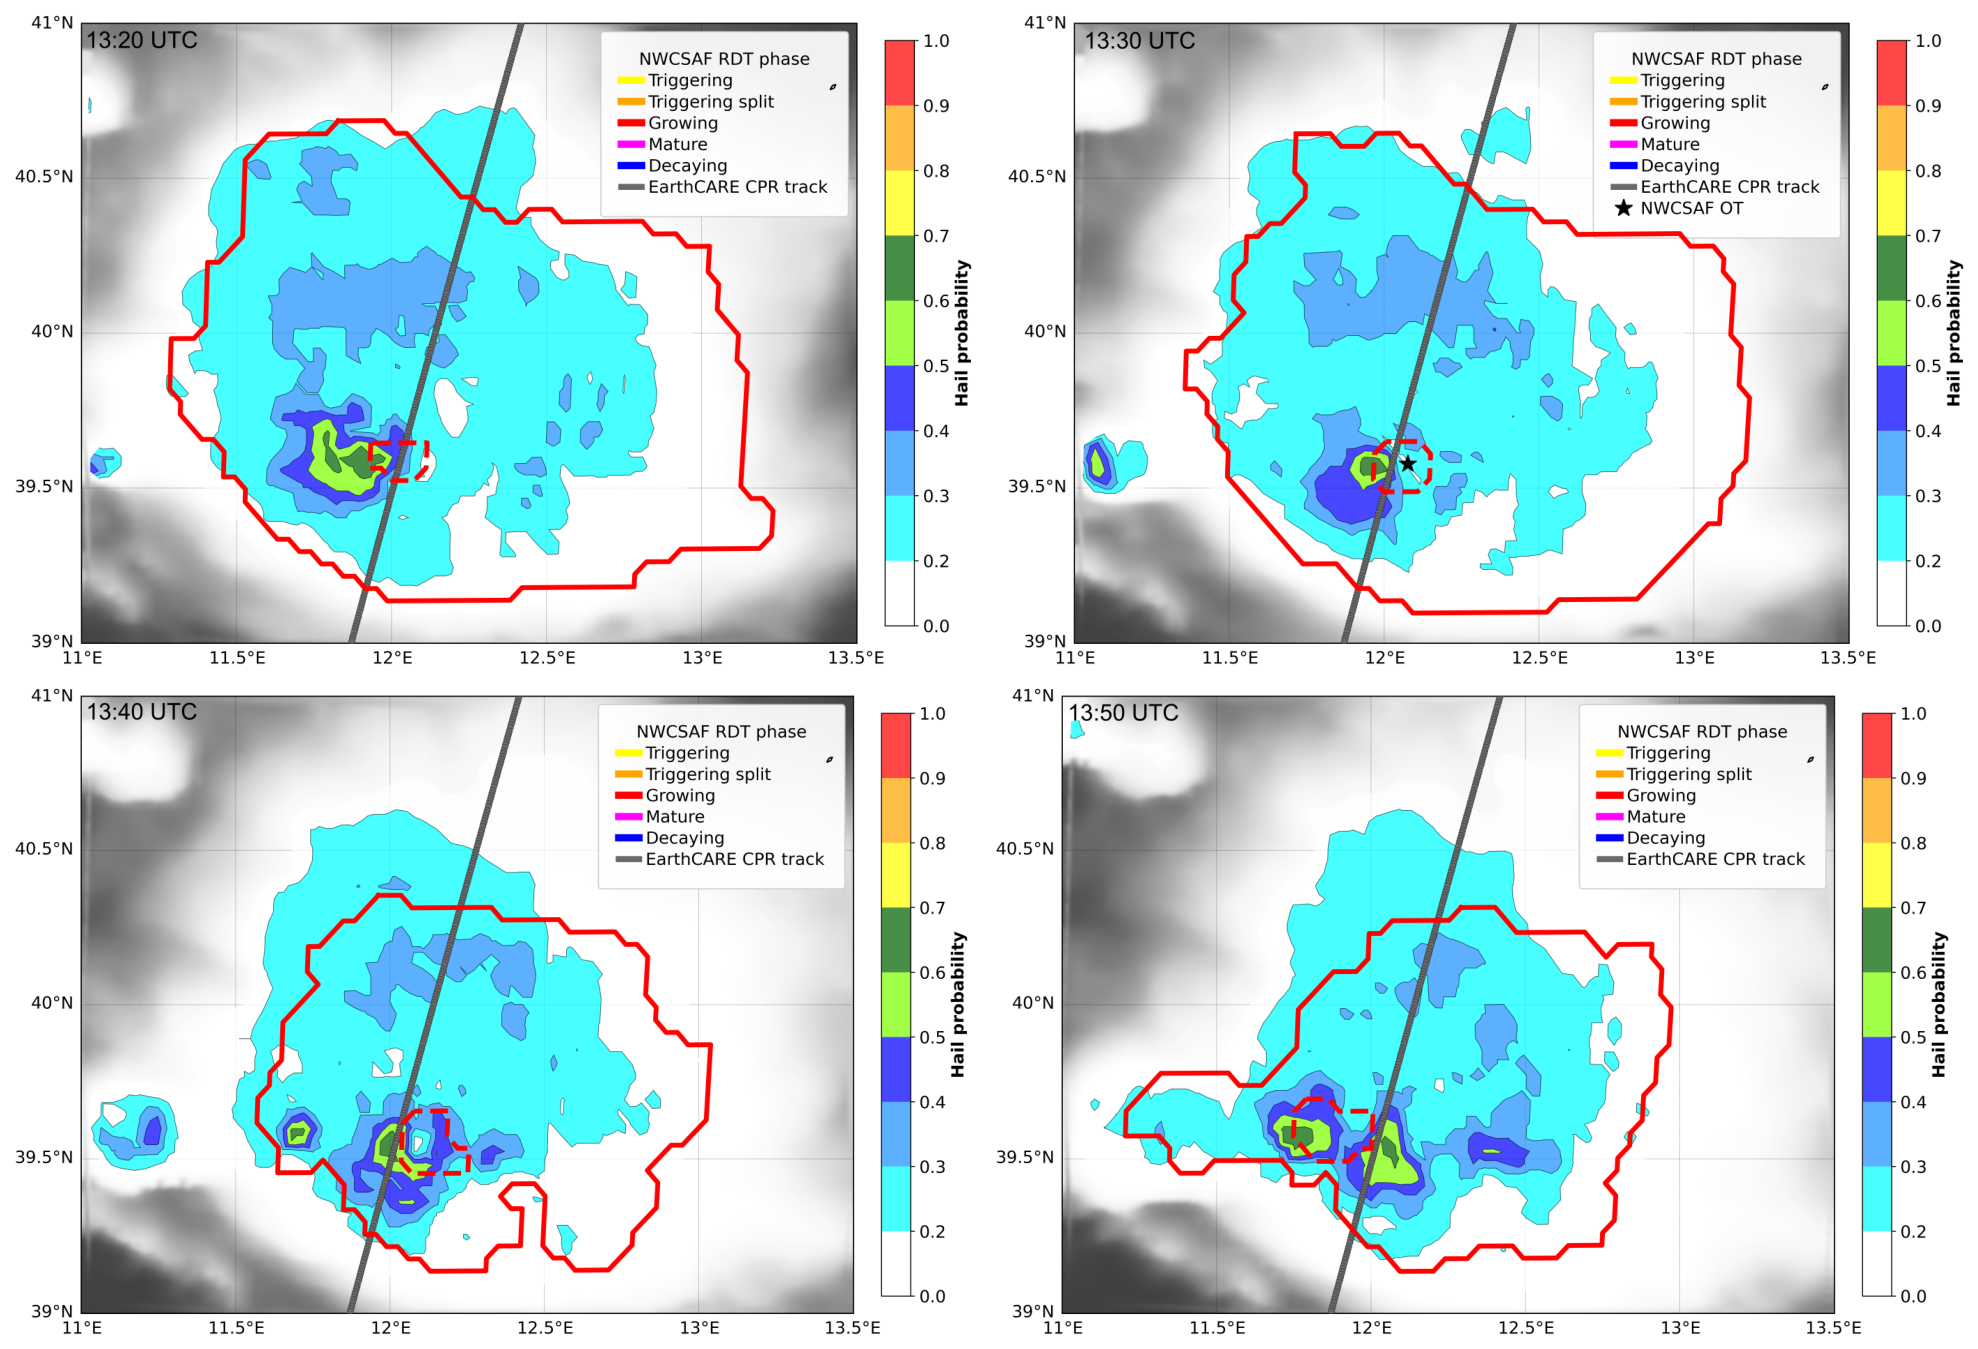
The NWC SAF software (v2021) detects and tracks the convective cores and the overshooting top presence over time (Figure 2 red contour lines). When it is overpassed by the EarthCARE CPR, the cell is in its growing stage. This convective system was tracked by the RDT product from 08:30 UTC, persisting for over 9 h. The anvil, characterized by very low cloud-top temperatures, has reached its maximum horizontal extent, while a strong convective updraft remains active beneath it, producing overshooting tops that penetrate the tropopause. These features are highly localized and transient, making them particularly challenging to detect with nadir-viewing radars aboard LEO satellites and to resolve in GEO satellite imagery with coarse spatial resolution. Since in this case the convection is vigorous and the overshooting top is extended, it is visible in the MSG imagery as a cold spot that overshoots the tropopause, characterized by IR BTs of around 205 K.
Figure 2.
Series of four RDT product images overlapped to MASHA hail probabilities separated by 10 min around the EarthCARE overpass time of Figure 1 at 13:30 UTC. Contour lines define the extension of the convective cell (cell bottom with solid lines and cell top with dashed lines, see Section 2.2) using colors related to the system phase of life as indicated in the legend. Star symbol indicates the position of the overshooting top. The black line represents the EC trajectory.
Where the strong updrafts occur, levels where reflectivities exceed 10 dBZ are located very close to cloud top [13], and the Doppler velocity shows very high variability both along track and along range. As presented in Figure 1 (bottom panel), the number of foldings and non-stratiform pixels per profile has been counted: as expected, these numbers sharply increase in correspondence with the convective core, while they drop where only the anvil is present. This confirms how useful these metrics can be as qualitative proxies for strong convection detection.
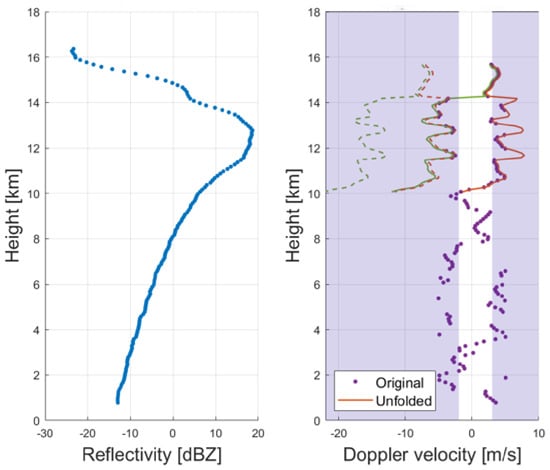
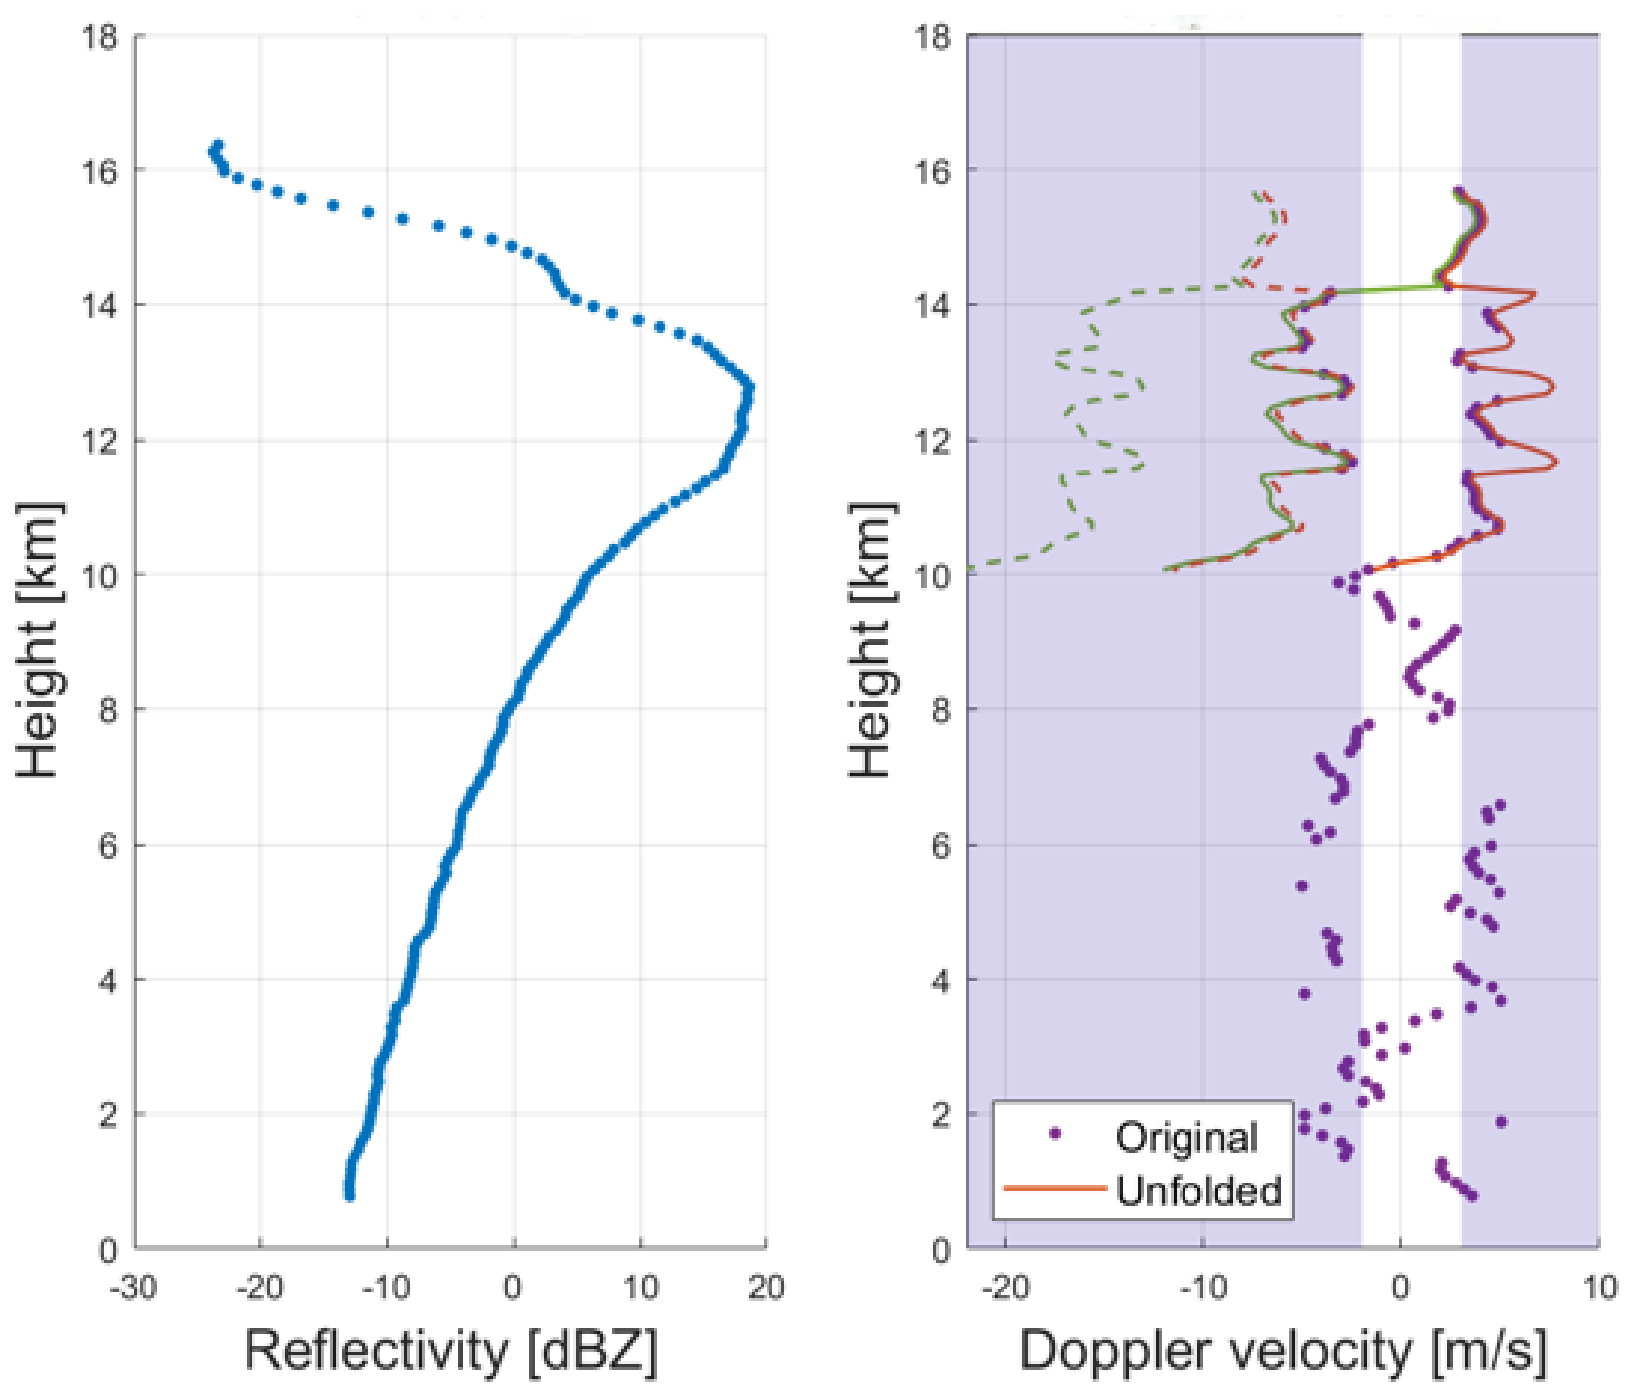
To support the above discussion, the reflectivity and Doppler velocity profiles within the strong convective core corresponding to the overshooting top are shown in Figure 3. Reflectivity reaches its maximum around 13 km height and then starts decreasing due to strong attenuation. The presence of multiple scattering is confirmed by the characteristic long tail with the absence of any surface peak, as can be observed in Figure 1, top panel [43]. Doppler velocity is considered a reliable measure only when reflectivity is above −21 dBZ, ensuring positive SNR and when it is not affected by strong multiple scattering. For this reason, in the Doppler profile (right panel in Figure 3), the section below 10 km is discarded. By convention, negative velocity indicates updrafts, while positive velocity indicates downward motion. The interpretation of Doppler velocity in convection is very challenging. The narrow Nyquist range (±5.5 m/s) and the noisiness of the measurements create ambiguities in the reconstruction of the Doppler velocity profiles. The two profiles plotted with solid lines represent the most plausible solutions corresponding to the CPR measurements (purple dots in Figure 3). The two profiles plotted with dashed lines are the same as the solid ones but shifted by twice the Nyquist velocity, making them indistinguishable to the CPR. The final downselection among the four profiles is challenging; it could be guided by boundary conditions (e.g., updraft or downdraft at cloud top). In this case, the MSG RSS can provide support for the interpretation of the CPR Doppler velocity, reflecting the sensitivity of visible and infrared channels to cloud-top structure. The presence of an overshooting area that is spatially and temporally collocated with the CPR overpass provides clear evidence of the existence of an updraft. Nevertheless, this information lacks the spatial resolution required to constrain the selection of the Doppler vertical velocity profile by providing an indication of the cloud-top vertical velocity. Therefore, both positive and negative cloud-top velocities (see Figure 3) remain equally plausible in the CPR retrieval. Moreover, to effectively constrain the CPR retrieval, the GEO cloud-top vertical velocity would be needed at the pixel level, taking into account the advection of the convective system, which can be substantial and result in displacements comparable to or even larger than the MSG pixel size. For example, in this case study, the convective cell has a horizontal velocity of approximately 15 m/s at 13:30 UTC (data from RDT output), corresponding to a displacement of about 4.5 km over 5 min. In these conditions, the computation of the cloud-top vertical velocity as described in Section 2.2 is not applicable due to the strong contribution from cloud advection.
Figure 3.
EarthCARE CPR Reflectivity and Doppler velocity profiles in correspondence to the overshooting top marked with a dashed line in Figure 1.
To further confirm the convective strength of this episode, the hail probability has been computed by MASHA (Figure 2). Large hail reaching the ground associated with probability greater than 50% is identified in the area near the overshooting top.
The 4th September case study highlights the effectiveness of the proposed observation strategy. All utilized tools contribute to characterizing the convective system, including the identification of the overshooting top, its vertical velocity profile and the associated increase in hail probability reaching the Super Hail category.
3.2. Case Study II: Growing and Decaying Convection
Another convective case occurred on 15 June 2025, over the Lazio region in Central Italy (Figure 4). The presence of convection is confirmed by the spatial structure of the reflectivity and the Doppler velocity measurements with strong attenuation and large Doppler variability in correspondence to the convective cores. In addition, it is confirmed by peak values of the number of velocity foldings and the number of pixels exhibiting vertical velocities exceeding the typical stratiform cloud velocity range [−2, 3] m/s.
Figure 4.
Top panel: reflectivity from Level 1b C-NOM product, 500 m along-track resolution, frame 5953D, recorded on 15 June 2025, over Central Italy. Mid panel: Doppler velocity at 1 km along-track resolution of the CPR scene. Bottom panel: the number of pixels that fold (blue line) and that exceed the stratiform range [−2, 3] m/s (red line) in the frozen part of the cloud.
EarthCARE is overpassing two convective systems at 13:28 UTC, indicated with A and B in Figure 4 (central panel). RTD-based analysis reveals that the cloud system A is triggered at 12:25 UTC and remains active until 14:00 UTC, but, at the CPR overpass time, it is already in the decaying phase (i.e., IR BTs are stable around 214 K and the convective area is not expanding, see Figure 4). The first identification of cloud system B is at 13:05 UTC in the growing phase characterized by negative cooling rates from 13:05 to 13:40 UTC. No overshooting tops are identified for both cells.
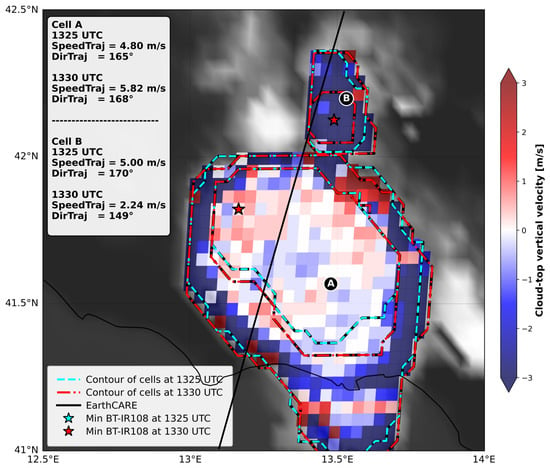
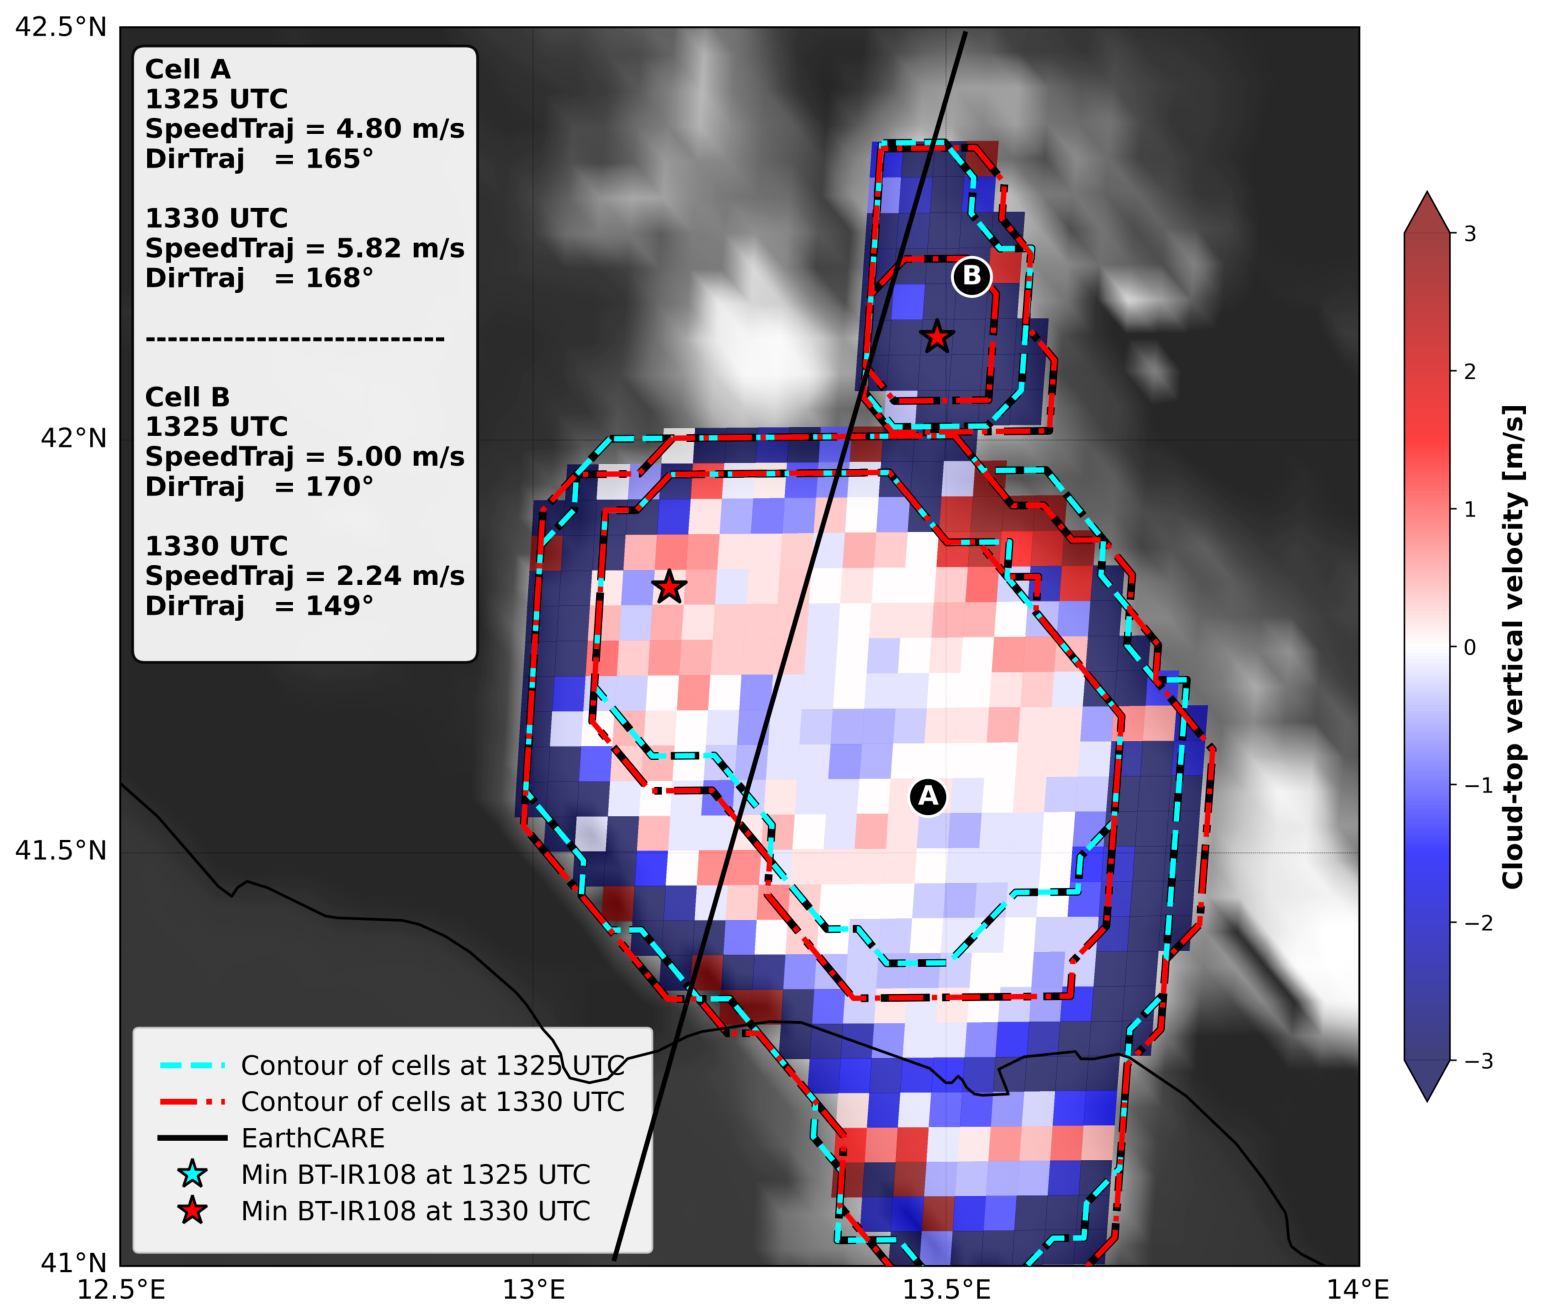
The map of cloud-top vertical velocity derived from MSG RSS data near the EarthCARE overpass time confirms that the two convective cells are at different stages of development (Figure 5). In this case, both cells exhibit horizontal displacement velocities substantially lower than those in the previous case study, ranging from 2 to 5 m/s, resulting in horizontal displacements over the 5 min interval between consecutive MSG images that are smaller than the spatial resolution of MSG at midlatitudes, particularly for cell B. This is further supported by the nearly stationary cell contours shown in Figure 5 and by the close correspondence of the minimum BT locations. Under these conditions, it is reasonable to use the MSG-derived cloud-top vertical velocity without accounting for the advection contribution as described in Section 2.2. For system A, the cloud-top vertical velocities are close to zero at the time of the EarthCARE overpass, consistent with the cell being in its decaying phase. Moreover, the area where an updraft core may still be active, as shown in the bottom panel of Figure 5, is only barely discernible. The large positive and negative velocities observed along the boundaries of the convective system are instead attributable to residual advection effects. In contrast, cell B is characterized by large negative cloud-top vertical velocities, providing strong evidence for the presence of an active updraft extending to the cloud top.
Figure 5.
MSG RSS-derived cloud top velocity within the cells overpassed by EarthCARE, shown in Figure 4. Cyan and red lines represent the cell contours at 13:25 and 13:30 UTC, respectively. BT minimum values are indicated with star symbols; values at 13:25 UTC are not visible because they overlap with the collocated values at 13:30 UTC. The horizontal velocities (SpeedTraj) and direction of the advection (DirTraj, degrees to North) are reported for the two cloud cells at 13:25 and 13:30 UTC.
The MASHA algorithm does not detect hail in the two convective cells because no recent calibration of the GEO infrared BTs with LEO passive microwave observations is available. However, a hail report was issued by the European Severe Storms Laboratory at 12:45 UTC in system A (41.8°N, 13.22°E), and an intense lighting activity was recorded by the lighting network LAMPINET. At that time, cell A was in the mature stage according to RDT product.
3.3. Case Study III: Short-Lived Convective Cells
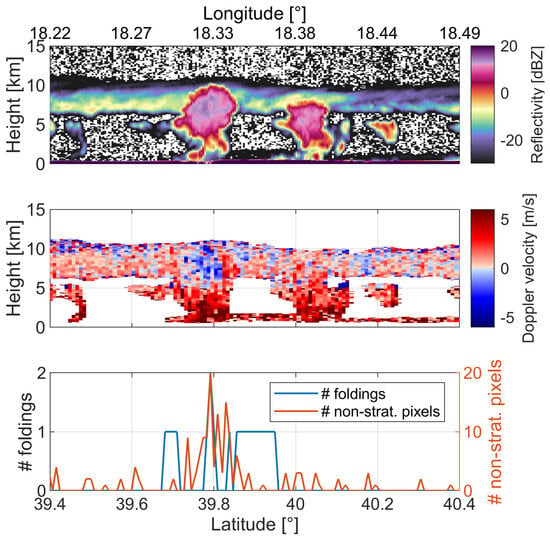
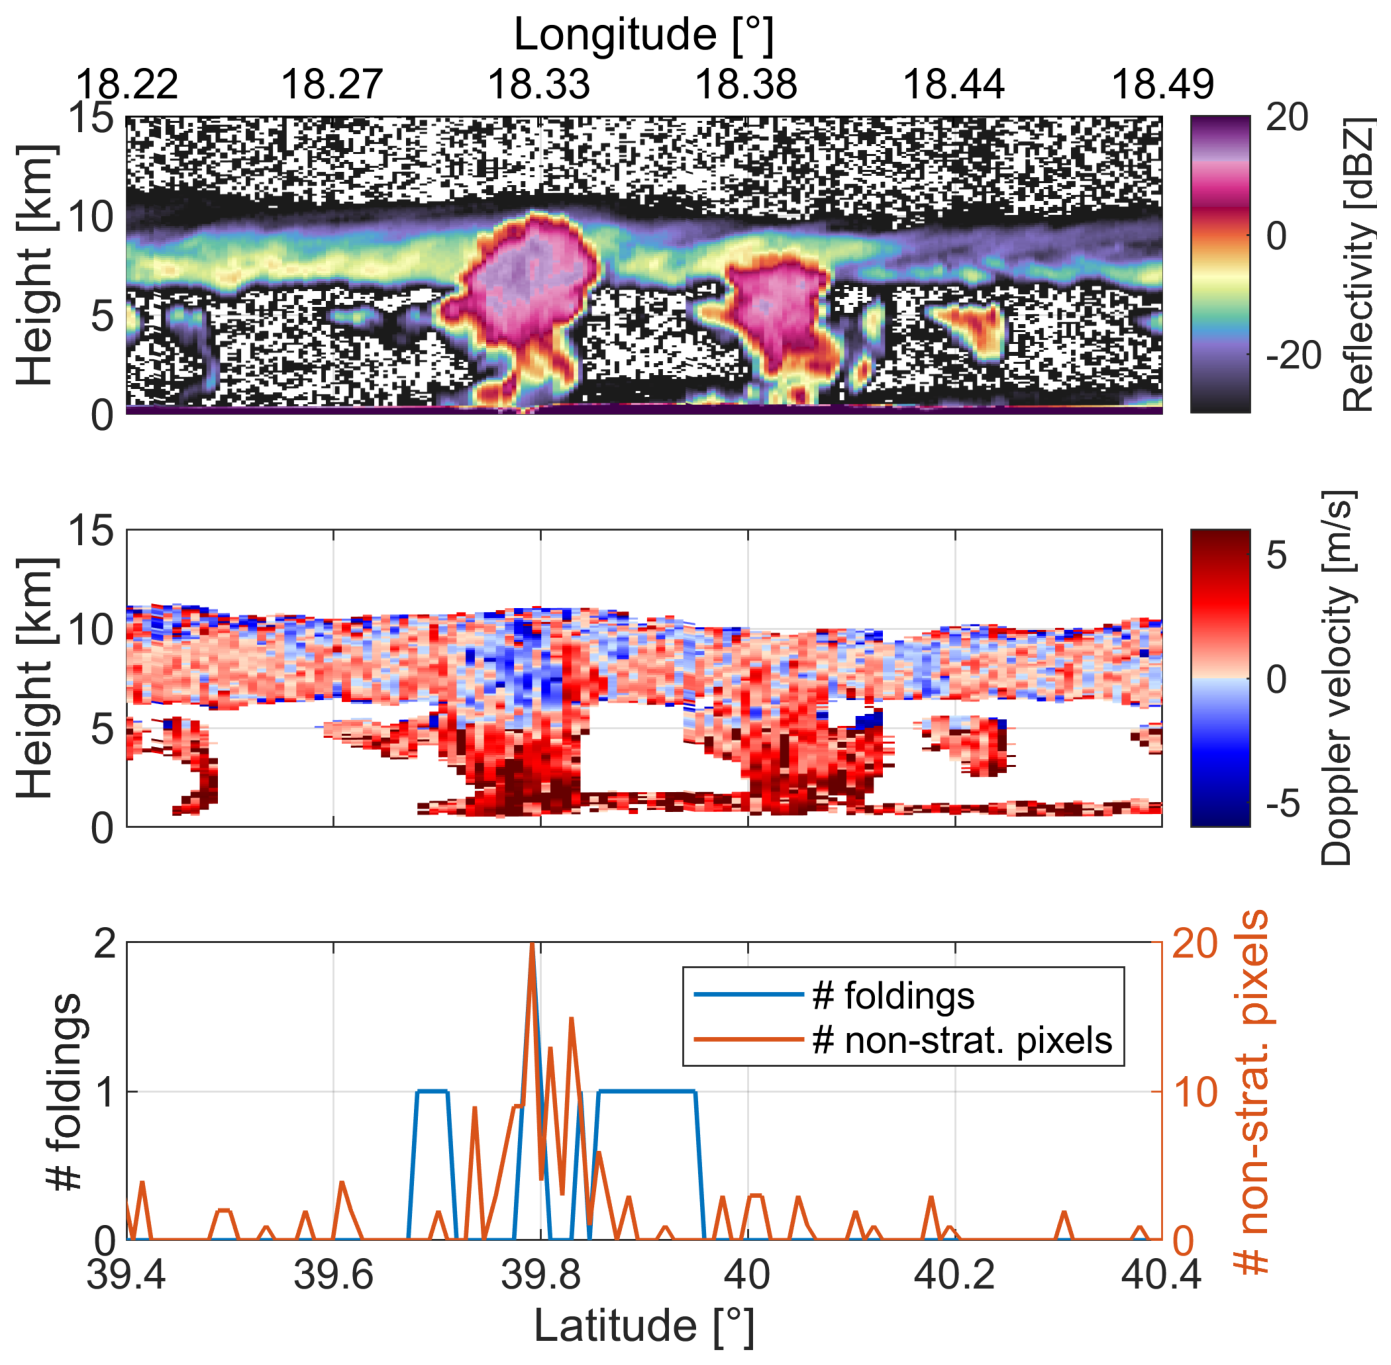
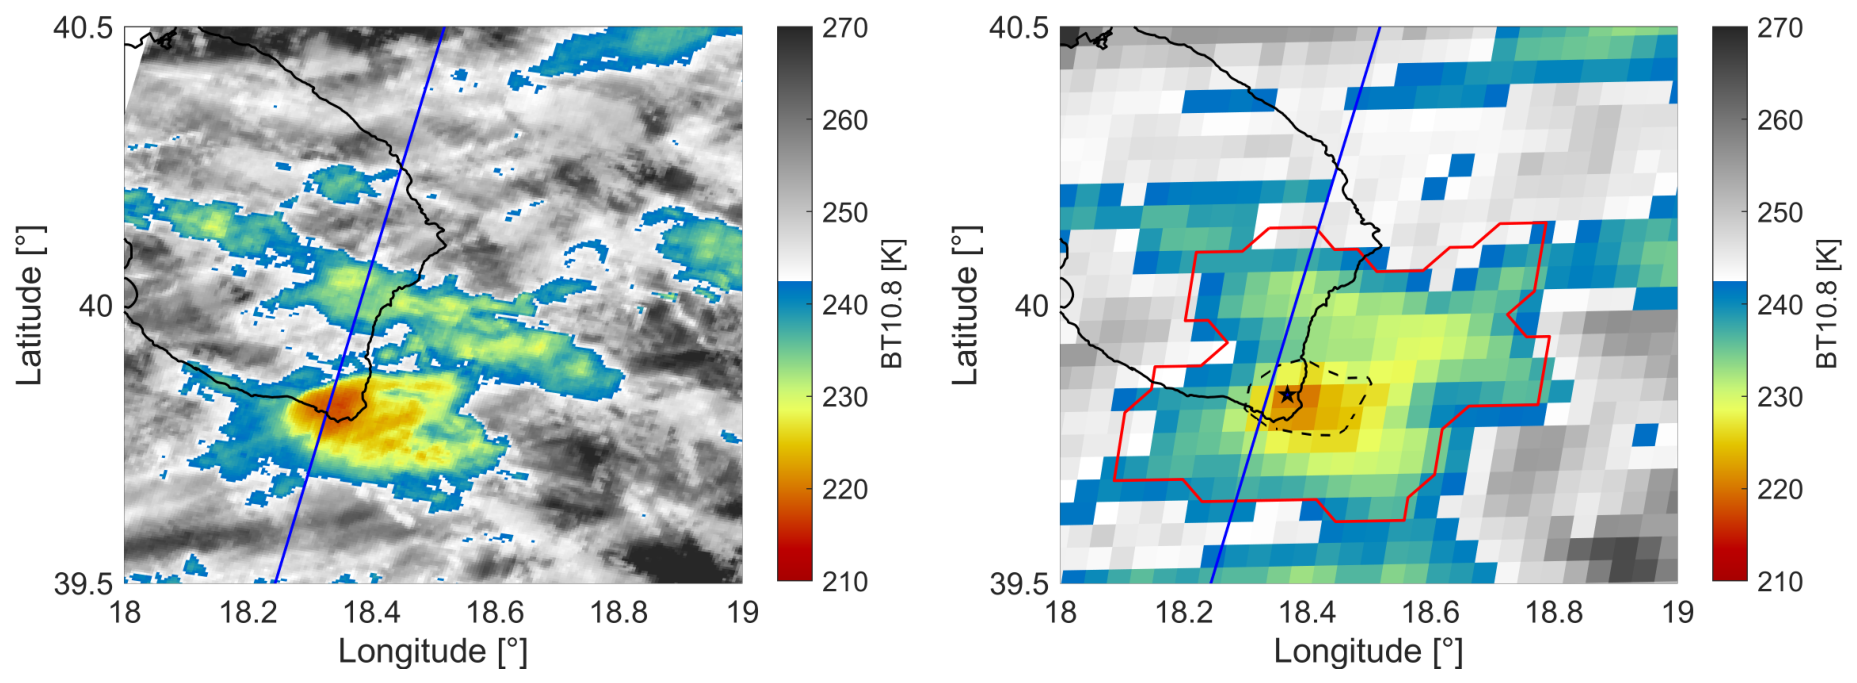
Figure 6 presents a convective scene over the Mediterranean basin with two distinct convective cores: one near 39.8°N and another around 40.05°N, but only the first one produces an increase in the number of foldings and the number of non-stratiform pixels (Figure 6 bottom). Both develop beneath a cirrus layer, likely the anvil remnant of a preceding convective event. Although the towers are not particularly deep, their horizontal scale is on the order of 10 km, compatible with the GEO spatial resolution.
Figure 6.
Top panel: reflectivity from Level 1b C-NOM product, 500 m along-track resolution, frame 4459D, recorded on 11 March 2025, over the south of Italy. Central panel: Doppler velocity at 1 km along-track resolution of the CPR scene. Bottom panel: The number of pixels that fold and that exceed the stratiform region [−2, 3] m/s in the frozen part of the cloud.
Using the SAF software (v2021), a convective cell was detected over the Apulia region beginning around 12:00 UTC (EarthCARE CPR overpass at 13:08 UTC) and persisting for roughly one hour. Although short-lived, the system was still relatively intense.
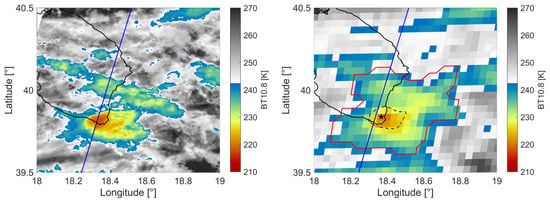
The core at 39.8°N is located within the coldest region of the convective system, where BTs are below 225 K (Figure 7), and is characterized by a negative cooling rate of −0.005 K/s. In contrast, the other core, at 40.05°N, is shallower than the former, with BTs exceeding 230 K. The finer spatial resolution of the MSI (left panel of Figure 7) reveals the shallower convective core. However, this core is embedded within the extensive anvil generated by preceding convective activity, which obscures the underlying updraft structure and prevents its identification from the GEO perspective. Also note the advantage of the finer MSI resolution in capturing kilometer-scale features (compare right and left panels). No hail presence is detected according to the MASHA algorithm.
Figure 7.
Left panel: IR BT map from MSI. Right panel: IR BT map from MSG RSS, 11 March 2025 13:05 UTC. The red (black dashed) contour line represents the convective cloud bottom (cloud top). The BT minimum value location on the cloud top is indicated by a star symbol. The blue lines correspond to the CPR groundtrack.
3.4. Case Study IV: Embedded Convection
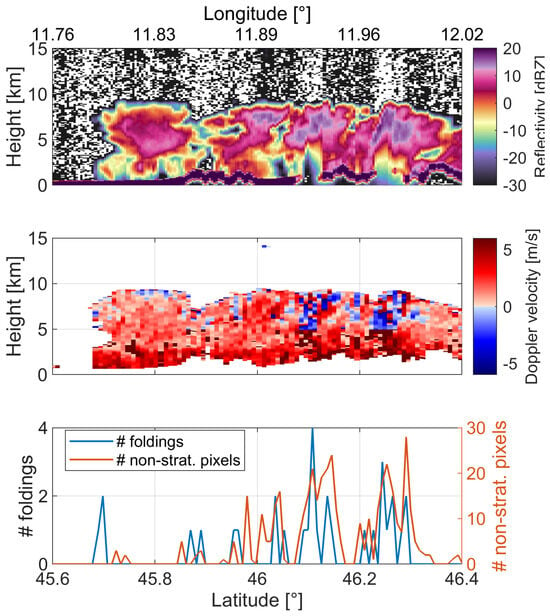
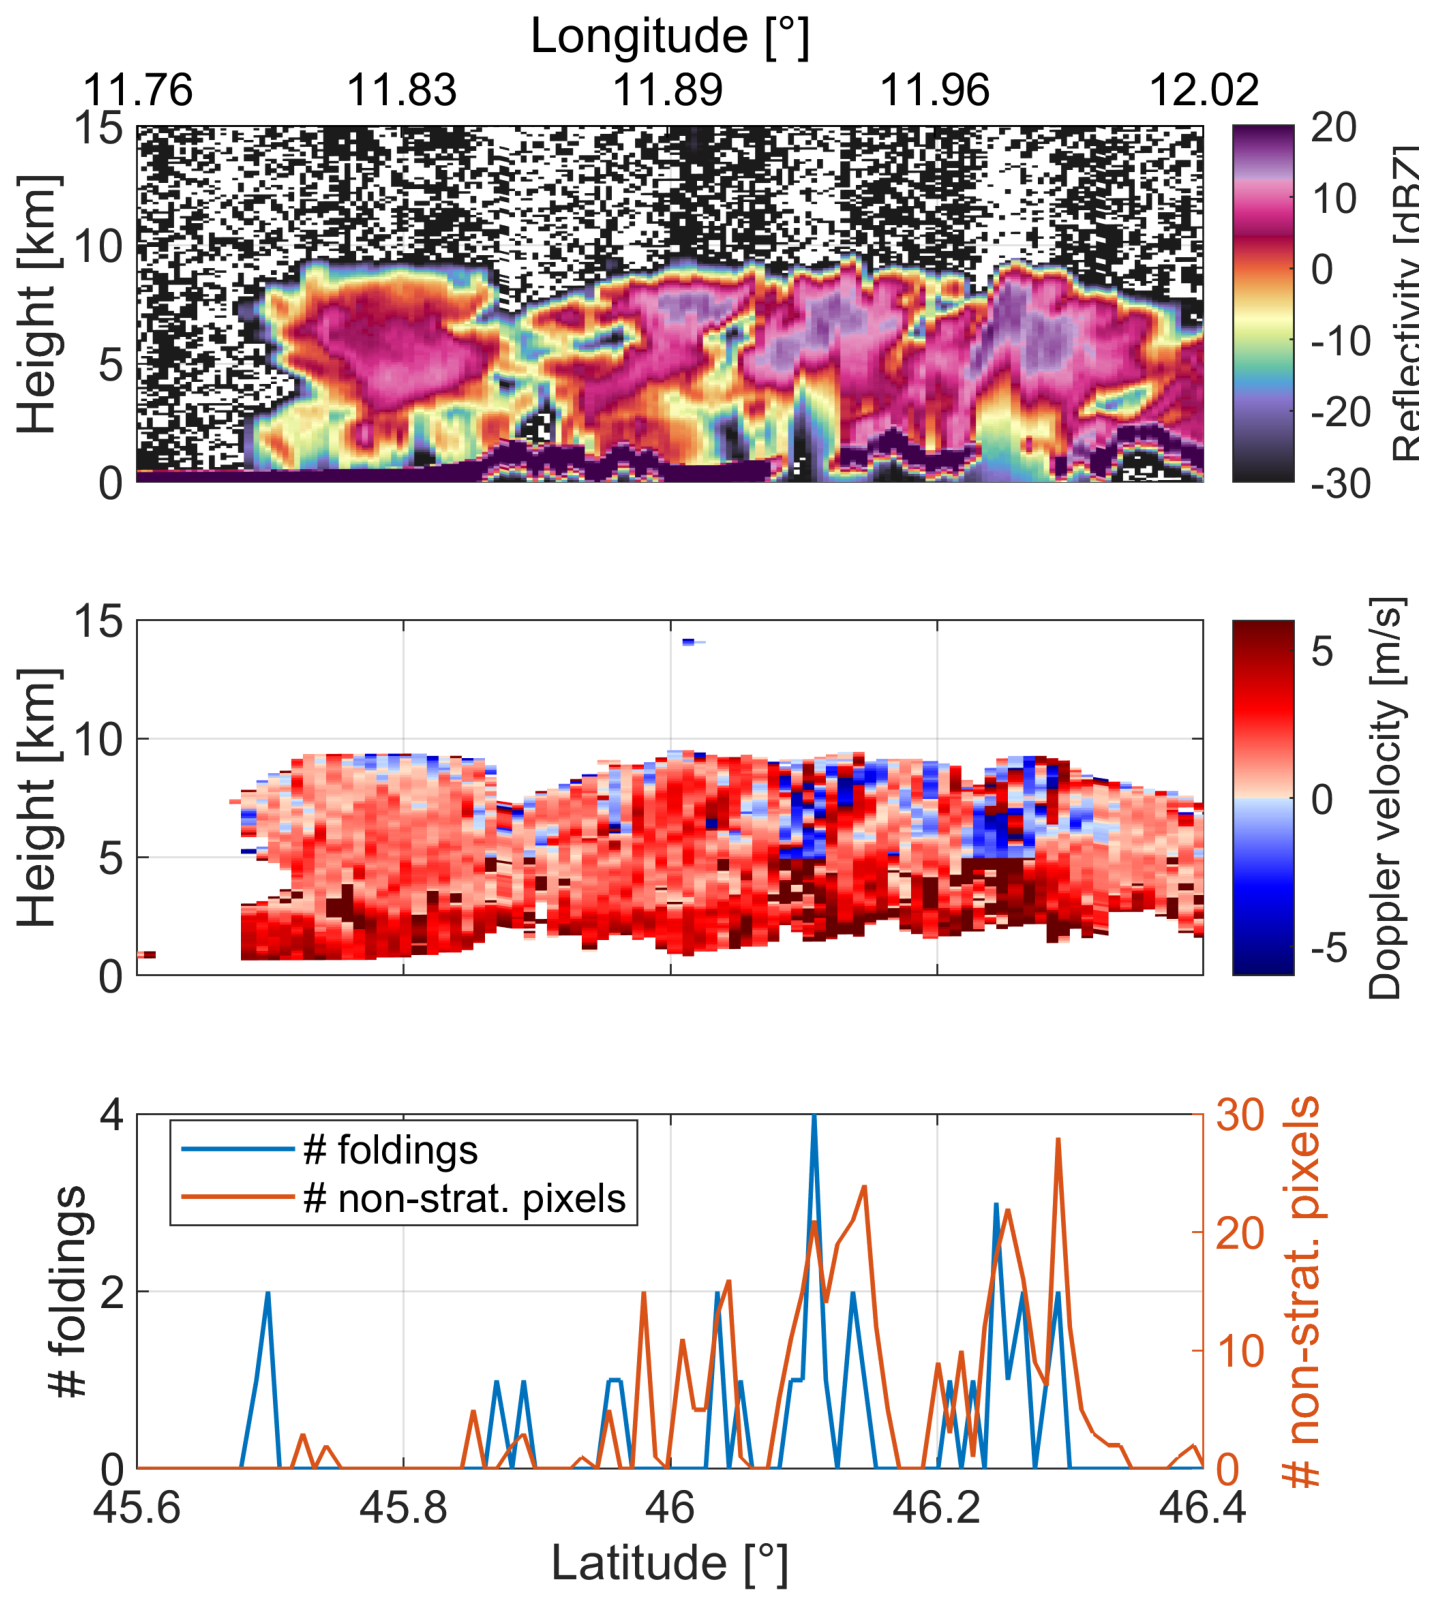
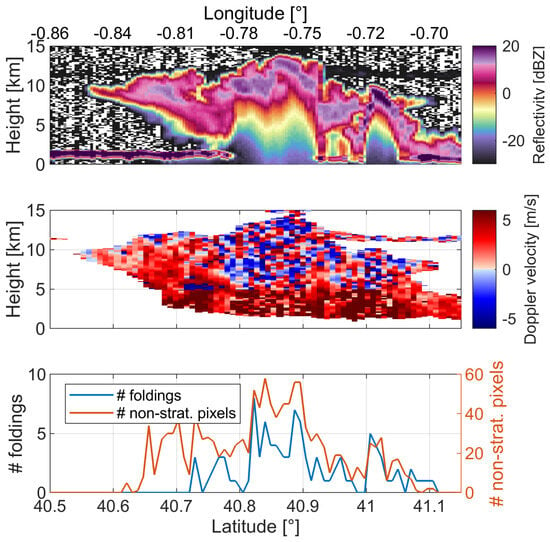
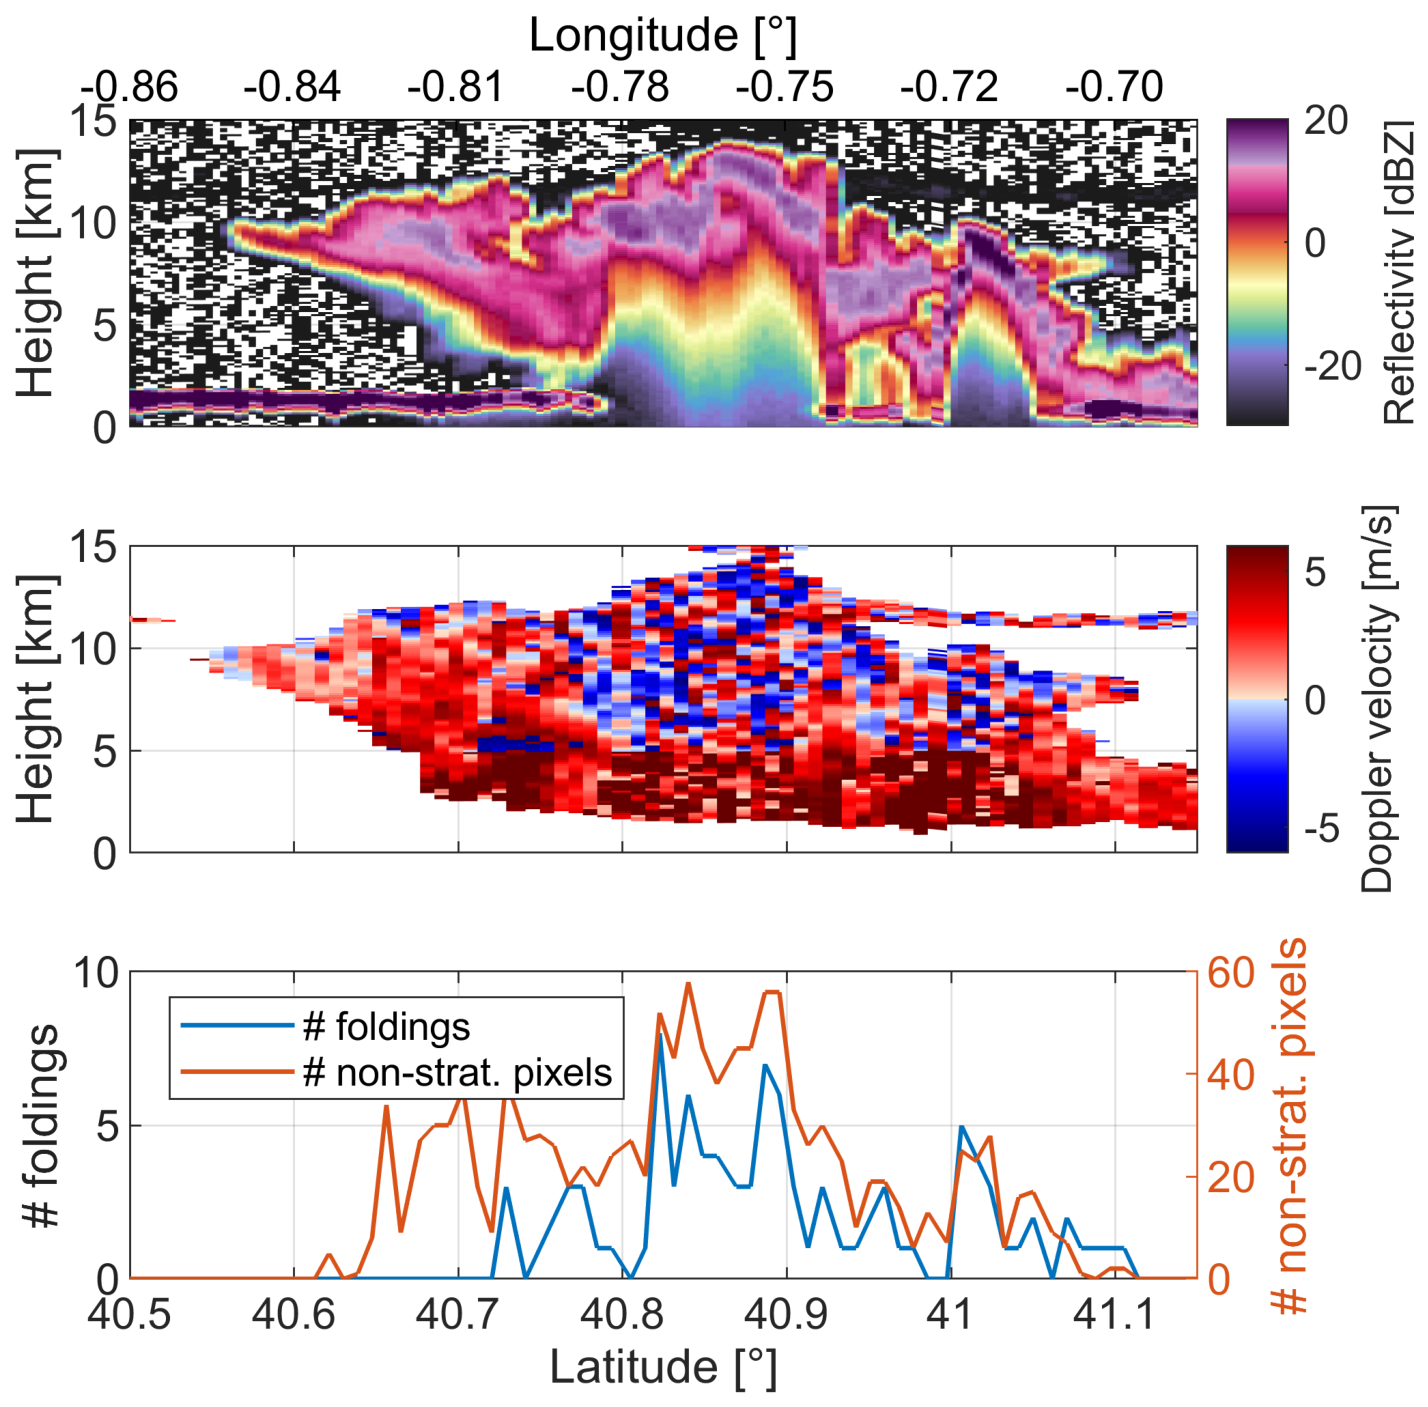
In Figure 8, the case study occurred on 8 July 2025 characterized by deep convective cores embedded in a big system is presented. Where the stronger updrafts occur, the number of foldings and non-stratiform pixels increases dramatically (bottom panel in Figure 8).
Figure 8.
Top panel: reflectivity from Level 1b C-NOM product, 500 m along-track resolution, frame 6311D, recorded on 8 July 2025, over the northern Italy. Central panel: Doppler velocity at 1 km along-track resolution of the CPR scene. Bottom panel: The number of pixels that fold and that exceed the stratiform region [−2, 3] m/s in the frozen part of the cloud.
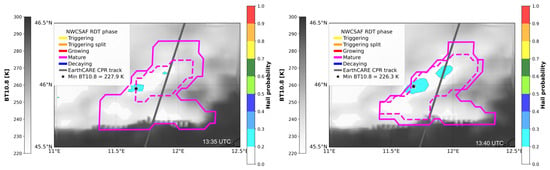
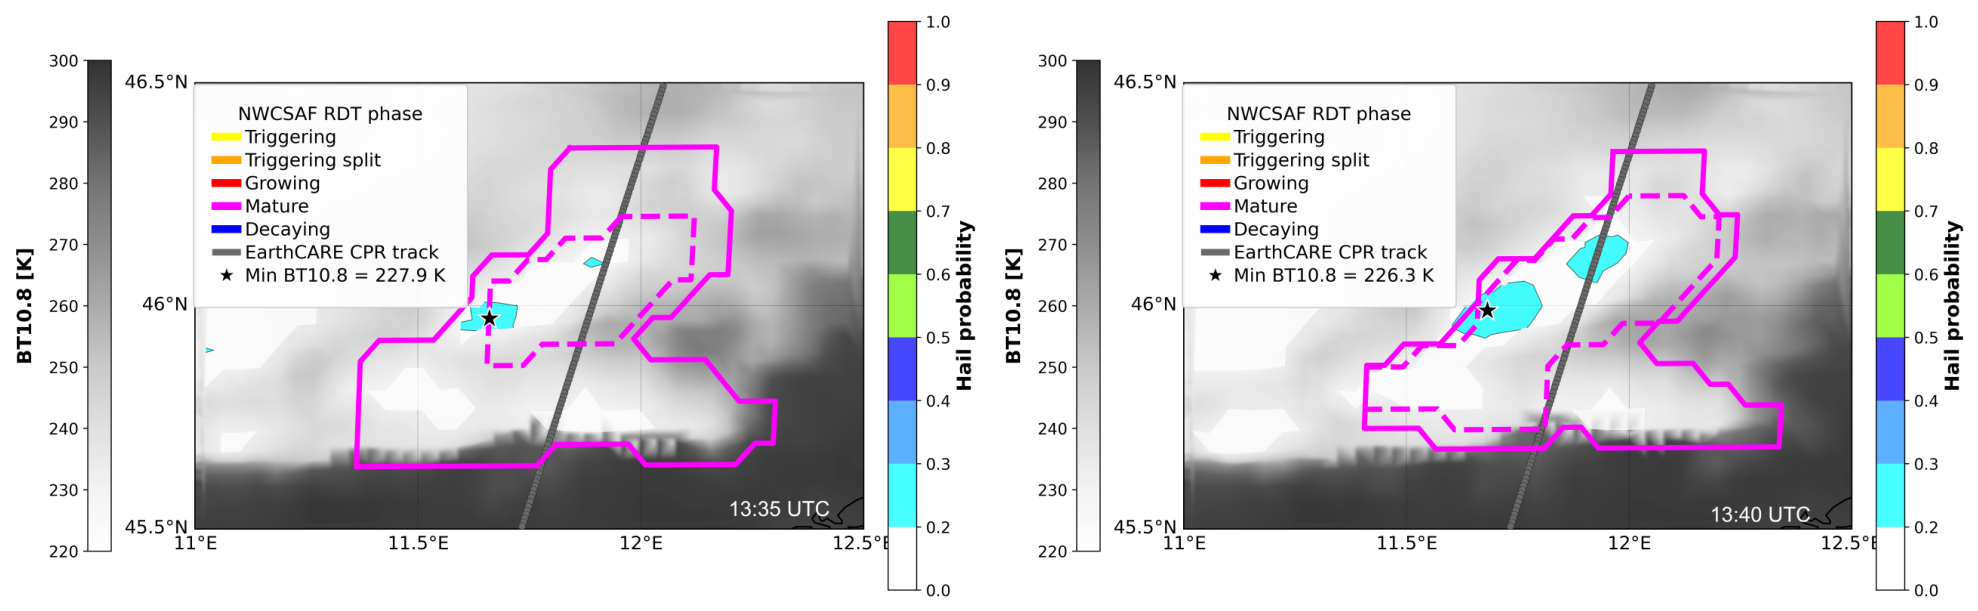
The two convective cores are embedded within a cell that transitioned from the growing to the mature stage (minimum IR BT below 233 K) between the MSG slots at 13:30 and 13:35 UTC. At 13:35 UTC, a previously identified convective cell located north of 46° latitude is included in this cell, resulting in the configuration shown in Figure 9. The area north of 46° latitude is characterized by the MASHA hail probability lower than 0.3, which only indicates the presence of ice in the cloud system (Figure 9). Due to the high advection velocity values (i.e., 15–16 m/s), it is not possible to isolate the region characterized by updraft through the analysis of MSG-derived cloud top vertical velocity.
Figure 9.
MASHA hail probability at 13:35 (left) and 13:40 UTC (right) within the cell hit by EarthCARE (CPR overpass at 13:38 UTC), shown in Figure 8. Solid lines represent the convective cell bottom contour; dashed lines delimit the top. Star symbols identify the IR BT minimum values.
3.5. Case Study V: Lightning
Figure 10 depicts a strong convective storm intercepted by EarthCARE CPR on 19 August 2025, over southern Spain. In this case, the cloud top reaches significantly low BTs (<220 K) with cloud tops exceeding 13 km, indicating a deep and intense convective system.
Figure 10.
Top panel: reflectivity from Level 1b C-NOM product, 500 m along-track resolution, frame 6965D, recorded on 19 August 2025, over the south of Spain. Central panel: Doppler velocity at 1 km along-track resolution of the CPR scene. Bottom panel: The number of pixels that fold and that exceed the stratiform region [−2, 3] m/s in the frozen part of the cloud.
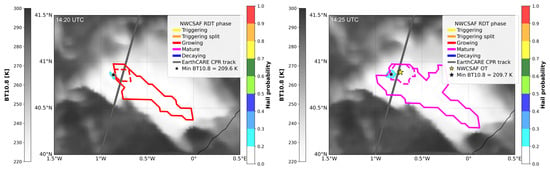
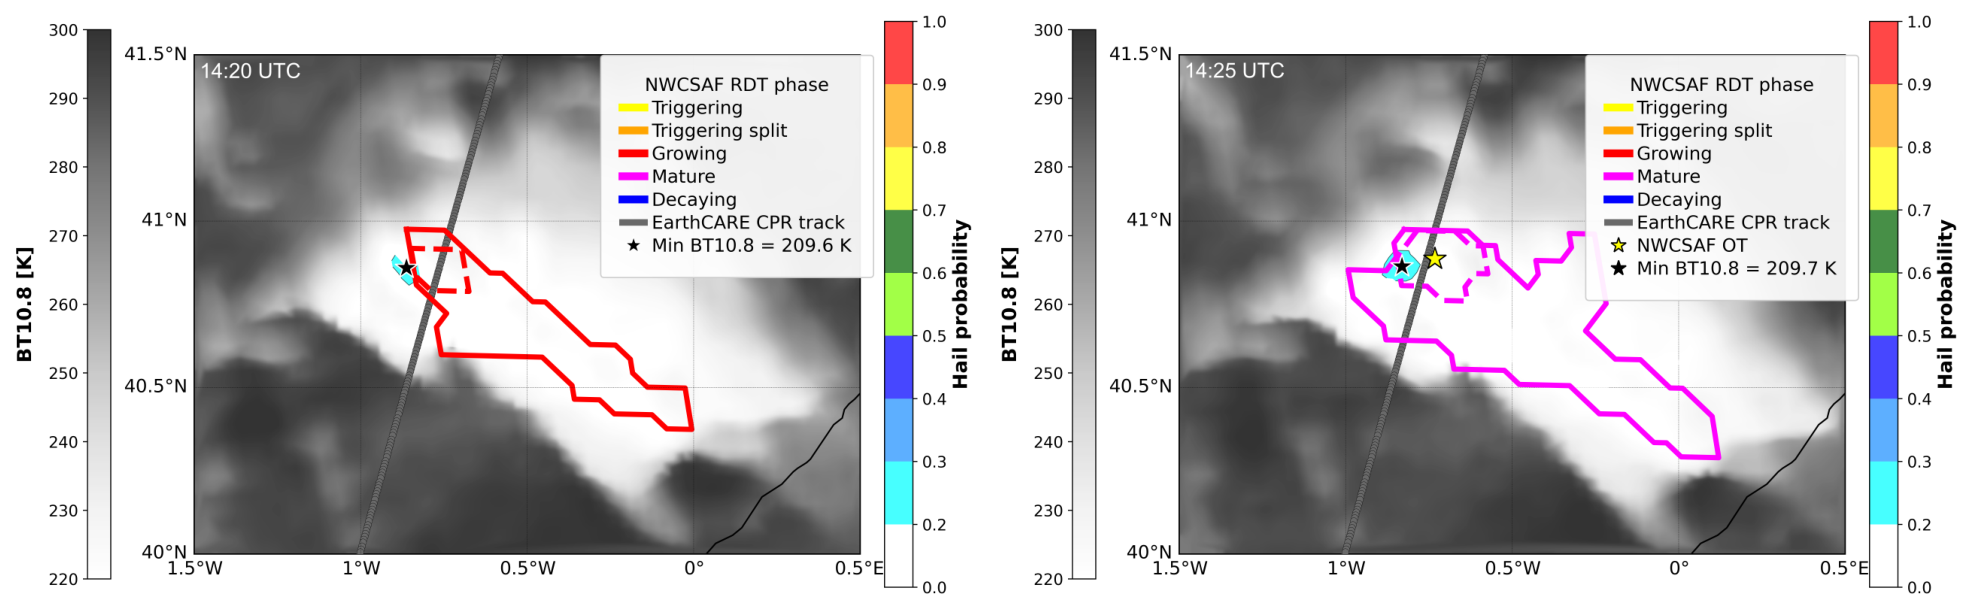
The RDT product tracking of this system begins at 12:45 UTC and continues until 16:50 UTC. The system is still in the growth phase at the EC passage (MSG slot 14:20 UTC), reaching the mature stage in the successive slot (14:25 UTC) with the formation of an overshooting top (Figure 11) corresponding to the area where the number of foldings and the number of non-stratiform pixels reach their maximum values (Figure 10) and the expansion of the cell. MASHA detects the hail potential category but without hail on the ground.
Figure 11.
Convective cell contour from RDT product and MASHA hail probability on 19 August 2025, at 14:20 (left) and 14:25 (right) UTC. Solid lines represent the bottom contour of convective cell; dashed lines delimit the top. The overshooting top at 14:25 UTC is indicated with a star symbol in yellow. Symbols in black indicate the locations of the IR BT minimum values.
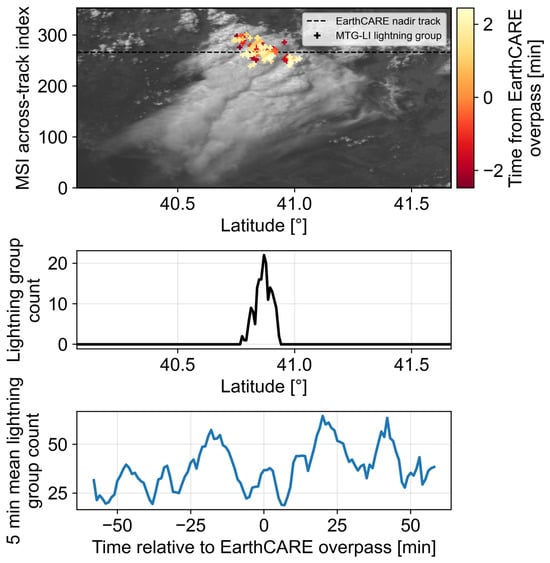
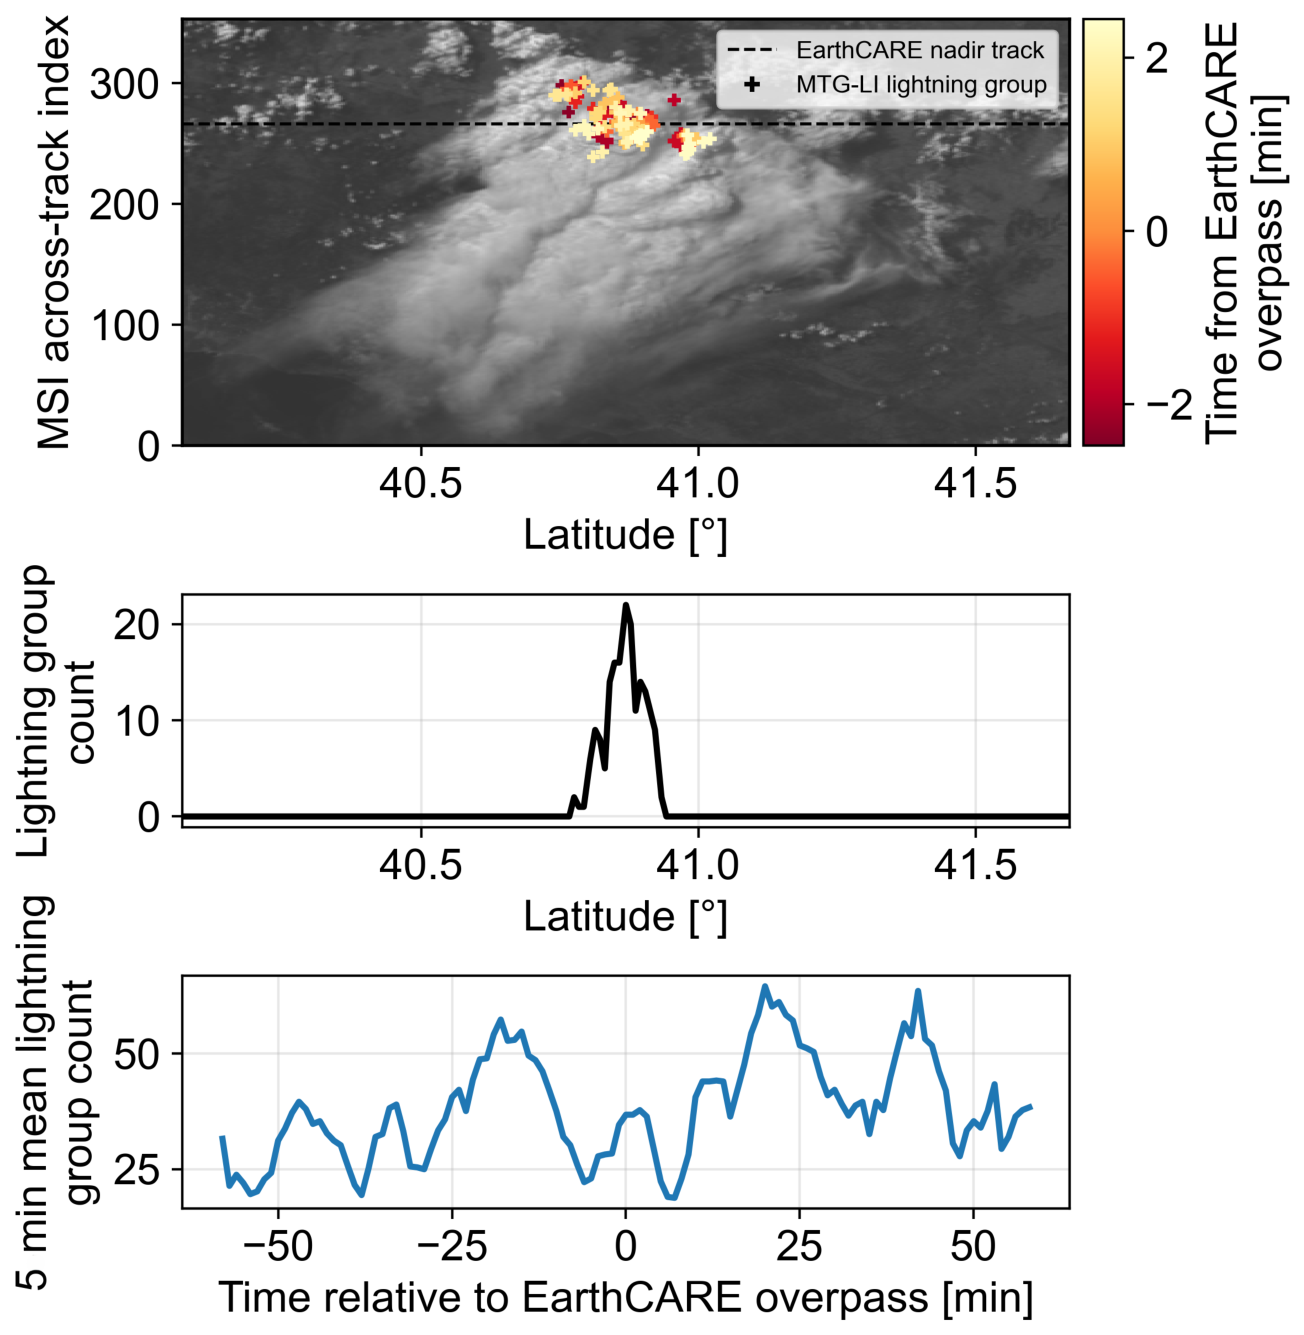
A peak of intense lightning activity as detected from the MTG-LI is associated with this event (Figure 12). The lightning maximum coincides with the coldest cloud-top temperatures and with peaks in both Doppler velocity foldings and the number of non-stratiform pixels. The bottom panel of Figure 12 shows the evolution of lightning activity in the convective system up to 60 min before and after the EarthCARE overpass, highlighting the mature stage of the system and its persistence over time.
Figure 12.
Lightning activity observed by MTG-LI over a convective cell on 19 August 2025, EarthCARE frame 6965D. Top panel: MSI visible image with MTG-LI lightning groups occurring within ±2.5 min of the EarthCARE overpass. Central panel: along-track lightning group counts within ±2.5 min and ±2.5 km of the EarthCARE overpass. Bottom panel: temporal evolution of lightning activity in the convective system within ±1 h of the overpass.
4. Discussion
Statistics of Convection Across the Mediterranean Basin
The results from the case studies analyzed in the previous subsections are summarized in Table 3. Overall, the selected cases show that low cloud-top brightness temperatures, enhanced radar-derived dynamical signatures and high lightning activity provide complementary qualitative indicators of convective intensity with valuable contextual information but not a direct quantitative measure of convective activity. In contrast, the NDVF and the NNSP derived from the radar observations provide quantitative measures that can be systematically applied across a larger sample of convective systems. Although the additional cases listed in Table 2 were not discussed individually above, they provide further evidence supporting the interpretation of these dynamical signatures in convective systems. Based on these results, we therefore introduce a dynamics-based methodology for the quantitative identification of convection using NDVF and NNSP.
Table 3.
Summary of the analyzed case studies using the multi-sensor approach. The main features of the convective systems identified through the analysis are reported. EC-MSG: time interval between EC overpass and the closest in time available MSG RSS observation (in minutes); LGC: Lightning Group Counts; HP: Hail Probability; NDVF: Number of Doppler Velocity Foldings; NNSP: Number of Non-Stratiform Pixels; MBT: Minimum IR 10.8 μm Brightness Temperature. HP indicates the corresponding hail probability from MASHA. NDVF and NNSP indicate the total number of foldings and non-stratiform pixels, respectively, identified within the analyzed core.
The spatial correspondence between enhanced Doppler velocity signatures, lightning activity, cold cloud tops and hail probability is also physically consistent with the occurrence of vigorous convective updrafts. In particular, regions characterized by strong hydrometeor motions may favor the conditions for charge separation and hail growth, which can be reflected by enhanced lightning activity and hail probability. These observations therefore provide complementary signatures of the same active convective regions, although their correspondence should not be interpreted as evidence of a direct causal relationship.
Because EarthCARE samples only a narrow swath, the satellite may observe convective systems at different stages of their life cycle or intersect only part of an active convective core. Convection is consequently classified on a profile-by-profile basis. Only profiles containing a continuous cloud layer extending at least 5 km above the surface are considered. Pixels with reflectivity below −21 dBZ are excluded because Doppler velocity estimates are considered unreliable at such low signal levels. A profile is classified as convective when it contains at least two Doppler velocity foldings and at least ten non-stratiform pixels within the frozen portion of the cloud, where large Doppler velocity magnitudes are observed. Note that the thresholds used here should not be interpreted as universal values but rather as a physically motivated first step toward exploiting Doppler observations for the identification and characterization of convective cores. A more comprehensive analysis, including intercomparison with climatologies based on morphological criteria, such as that of [44], will be presented in a forthcoming manuscript.
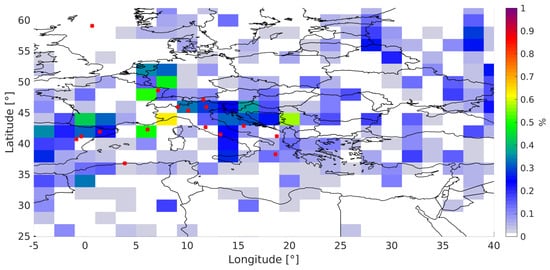
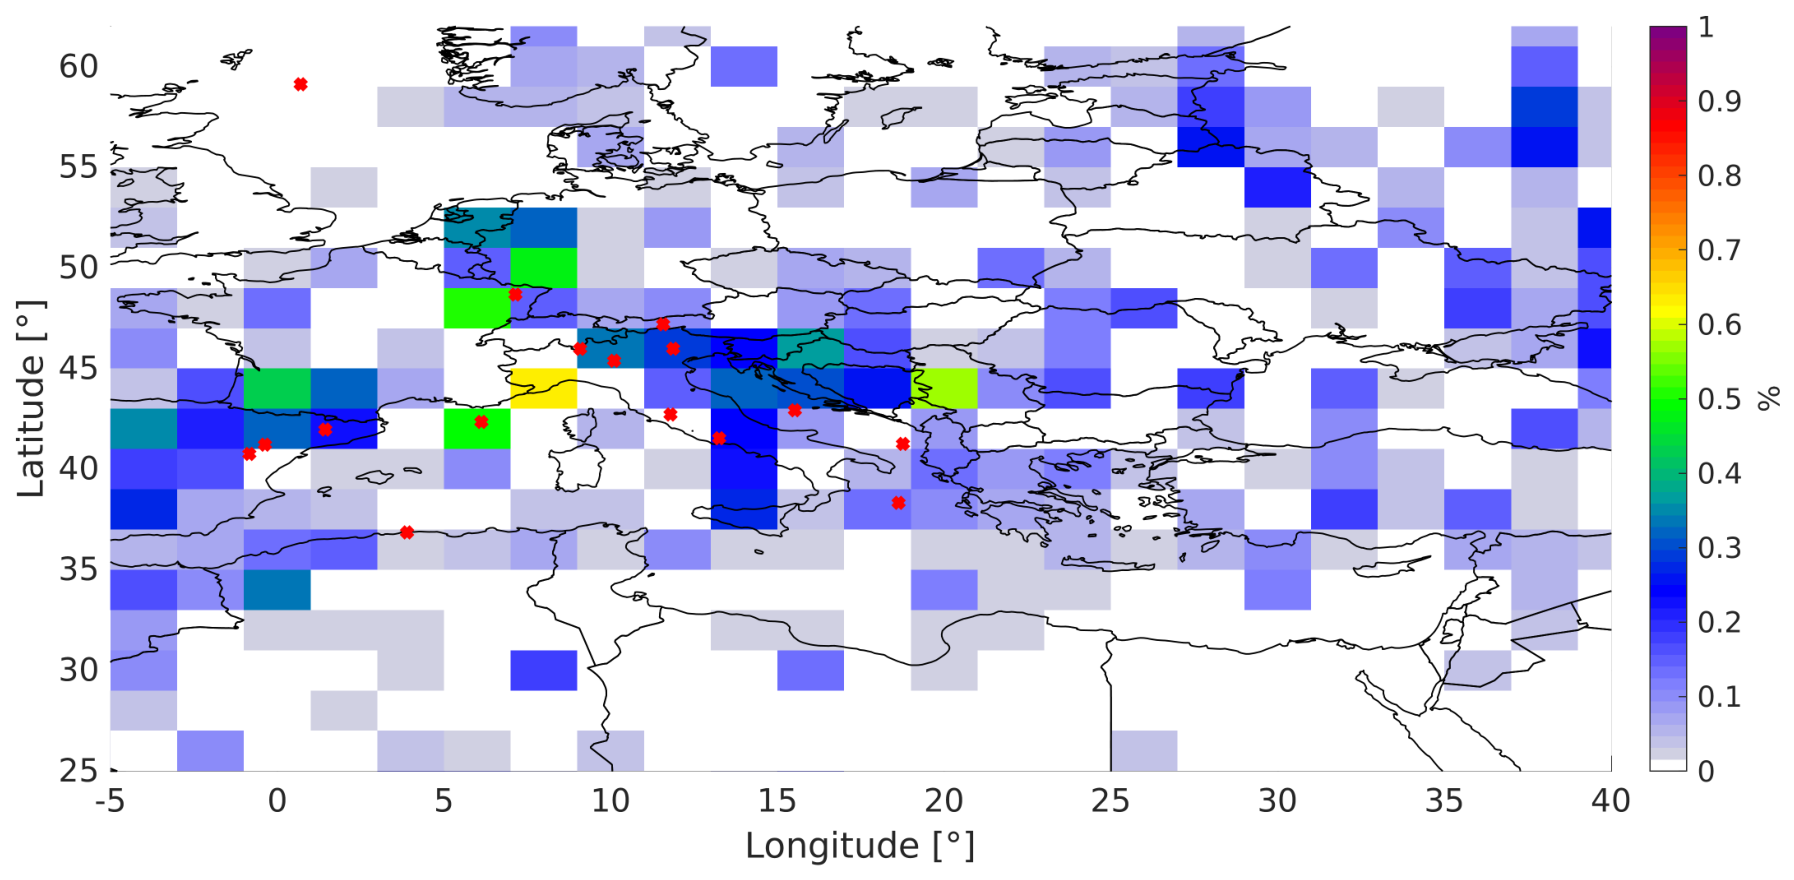
Figure 13 shows the percentage of convective profiles relative to the total number of EarthCARE profiles within each 2° × 2° grid cell. The analysis is restricted to the Mediterranean region, and the red crosses indicate the centers of the deep convective cases listed in Table 2. The resulting statistics remain noisy because of the limited spatial sampling associated with EarthCARE’s nadir-viewing geometry. This limitation is expected to diminish as additional years of observations become available, improving the statistical robustness of the analysis. Future work will also investigate a convection-classification framework based on coherent convective cells rather than individual radar profiles, using clustering algorithms to identify contiguous convective structures and provide a more physically consistent representation of convective systems.
Figure 13.
Percentage of convective profiles relative to the total number of radar profiles within each 2° × 2° grid cell, derived from one year of EarthCARE observations (January–December 2025). Convective profiles are identified using the EarthCARE dynamical methodology based on Doppler velocity measurements. Red crosses indicate the centers of the deep convective case studies listed in Table 2.
5. Conclusions
The recently launched EarthCARE Mission, equipped with a Doppler-capable Cloud Profiling Radar, represents a major advance in satellite-based observations of atmospheric convection. Despite this progress, significant scientific challenges remain, particularly in the interpretation of Doppler velocity signals. The present study exploits the synergy between complementary satellite observations from GEO and LEO platform to improve the detection and characterization of convective cores. The analysis is focused on the Mediterranean Basin, where a selected set of case studies from September 2024 to September 2025 is examined.
The main conclusions drawn from this work are summarized below.
- Multi-sensor observations provide complementary information for the detection and characterization of deep convection. The case studies demonstrate that the combination of EarthCARE Doppler-radar observations with GEO, passive-microwave and lightning observations provides a more comprehensive characterization of convective systems than any individual observation alone. Cold cloud-top brightness temperatures, lightning activity, hail probability and Doppler-velocity variability provide complementary indicators of convective activity and intensity. In particular, the continuous temporal sampling and morphological information provided by GEO observations place the instantaneous EarthCARE measurements within the broader evolution of the convective system, helping to interpret the observed Doppler signatures in their appropriate storm-scale context.
- The combined observations provide useful constraints on convective evolution, but their different sampling characteristics limit quantitative interpretation. GEO observations have substantially coarser spatial resolution than the active EarthCARE measurements, resulting in significant non-uniform beam filling effects. Moreover, differences in the scanning modes and sampling times of the instruments make the matching of the observed cloud extent and lifecycle stage challenging. Consequently, even Rapid Scan observations may not fully resolve rapidly evolving and spatially localized features such as overshooting tops throughout their lifecycle. These limitations need to be considered when relating GEO-derived indicators of convective evolution to instantaneous EarthCARE Doppler observations.
- Quantitative retrievals of vertical air motions remain challenging. The present analysis does not demonstrate reliable quantitative retrievals of vertical air velocity. Estimates of cloud-top vertical motion from GEO infrared observations provide potentially useful dynamical information but are inherently limited to the vicinity of the cloud top and can be affected by horizontal advection, complicating their interpretation as direct measures of vertical air motion. On the other hand, Doppler-velocity ambiguities and uncertainties in sedimentation velocities seriously hamper the retrieval of vertical motions from EarthCARE. The limited spatial and temporal resolution of independent observations further restricts the availability of robust and spatially representative boundary conditions for Doppler-velocity de-aliasing. Thus, while EarthCARE Doppler-velocity variability provides a useful indicator of convective activity, further developments are required before spaceborne Doppler observations can provide quantitative estimates of convective vertical motions.
Future investigations should focus on the following aspects.
- Quantifying the relationships between lightning, hail and convective intensity. Lightning observations are particularly valuable because their continuous GEO sampling enables the evolution of convection to be monitored throughout the storm lifecycle. Hail-probability products provide an additional indicator of intense convection, although their validation remains challenging because of the sparse temporal sampling of current passive-microwave observations. A larger statistical analysis, extending the methodology to full-disk observations and multiple years, is therefore needed to robustly quantify the relationships among lightning activity, hail occurrence, cloud-top evolution and convective intensity as characterized by the proposed proxies.
- Improving GEO–LEO synergy and Doppler-velocity interpretation. The new generation of Meteosat observations (MTG), including the Rapid Scan Service with 2.5 min temporal sampling and spatial resolution down to about 1 km in the 10.5 μm infrared channel, offers new opportunities for improved spatial and temporal matching with EarthCARE and for characterizing rapidly evolving convective systems. Further work is also needed to improve Doppler-velocity unfolding and assess whether higher-resolution GEO observations can provide stronger constraints on the interpretation of EarthCARE Doppler measurements.
- Validation through dedicated field campaigns. Independent observations are needed to validate the proposed Doppler-based convective diagnostics and other quantitative indicators. Such validation remains challenging because of the limited spatial and temporal coincidence between the narrow-swath EarthCARE CPR and ground-based or airborne observations, particularly for rapidly evolving and localized convective systems. Dedicated field campaigns will therefore be important for assessing the performance and limitations of these diagnostics, as well as for supporting the development of future convection-focused missions, including NASA INCUS and FALCON, JAXA-PMM and ESA-WIVERN.
Author Contributions
A.G. performed the analysis and provided the draft of the manuscript, A.B. supervised the study and reviewed the paper, E.C. reviewed the paper and provided the NWC SAF analysis, G.M. and F.V. provided the MASHA analysis, B.P.G. provided the lightning analysis and P.K. reviewed the paper. All authors have read and agreed to the published version of the manuscript.
Funding
The work was funded by the PRIN project number 2022JHEM2M “Convection characterization via synergistic geo and leo satellite observations” and by the Space It Up project funded by the Italian Space Agency (contract 848 2024-5-E.0—CUP No. I53D24000060005).
Data Availability Statement
The original contributions presented in the study are included in the article. Further inquiries can be directed to the corresponding author.
Conflicts of Interest
The authors declare no conflicts of interest.
References
- Lin, J.; Qian, T.; Bechtold, P.; Grell, G.; Zhang, G.; Zhu, P.; Freitas, S.; Vagasky, H.; Han, J. Atmospheric Convection. Atmos.-Ocean 2022, 60, 1–55. [Google Scholar] [CrossRef] [Scilit]
- Cheng, K.Y.; Harris, L.; Bretherton, C.; Merlis, T.M.; Bolot, M.; Zhou, L.; Kaltenbaugh, A.; Clark, S.; Fueglistaler, S. Impact of Warmer Sea Surface Temperature on the Global Pattern of Intense Convection: Insights From a Global Storm Resolving Model. Geophys. Res. Lett. 2022, 49, e2022GL099796. [Google Scholar] [CrossRef] [Scilit]
- Hartmann, D.L.; Gasparini, B.; Berry, S.E.; Blossey, P.N. The Life Cycle and Net Radiative Effect of Tropical Anvil Clouds. J. Adv. Model. Earth Syst. 2018, 10, 3012–3029. [Google Scholar] [CrossRef] [Scilit]
- Kollias, P.; Luke, E.; Lamer, K.; Hamann, H.; Treserras, B.P.; Allwayin, N.; Oue, M. Connected Radar: A New Paradigm for Atmospheric Observation and Experimentation. Bull. Am. Meteorol. Soc. 2026, 107, E1931–E1938. [Google Scholar] [CrossRef] [Scilit]
- Battaglia, A.; Kollias, P.; Dhillon, R.; Roy, R.; Tanelli, S.; Lamer, K.; Grecu, M.; Lebsock, M.; Watters, D.; Mroz, K.; et al. Spaceborne Cloud and Precipitation Radars: Status, Challenges, and Ways Forward. Rev. Geophys. 2020, 58, e2019RG000686. [Google Scholar] [CrossRef] [Scilit] [PubMed]
- Illingworth, A.J.; Barker, H.W.; Beljaars, A.; Ceccaldi, M.; Chepfer, H.; Clerbaux, N.; Cole, J.; Delanoë, J.; Domenech, C.; Donovan, D.P.; et al. The EarthCARE Satellite: The Next Step Forward in Global Measurements of Clouds, Aerosols, Precipitation, and Radiation. Bull. Am. Meteorol. Soc. 2015, 96, 1311–1332. [Google Scholar] [CrossRef] [Scilit]
- Wehr, T.; Kubota, T.; Tzeremes, G.; Wallace, K.; Nakatsuka, H.; Ohno, Y.; Koopman, R.; Rusli, S.; Kikuchi, M.; Eisinger, M.; et al. The EarthCARE mission—Science and system overview. Atmos. Meas. Tech. 2023, 16, 3581–3608. [Google Scholar] [CrossRef] [Scilit]
- Eisinger, M.; Marnas, F.; Wallace, K.; Kubota, T.; Tomiyama, N.; Ohno, Y.; Tanaka, T.; Tomita, E.; Wehr, T.; Bernaerts, D. The EarthCARE mission: Science data processing chain overview. Atmos. Meas. Tech. 2024, 17, 839–862. [Google Scholar] [CrossRef] [Scilit]
- Kim, J.; Kollias, P.; Treserras, B.P.; Battaglia, A.; Tan, I. Evaluation of the EarthCARE Cloud Profiling Radar (CPR) Doppler velocity measurements using surface-based observations. EGUsphere 2025, 25, 15389–15402. [Google Scholar] [CrossRef] [Scilit]
- Imura, Y.; Aoki, S.; Kubota, T.; Nakatsuka, H.; Ohno, Y.; Okamoto, H. Observation modes of EarthCARE/CPR with different Doppler measurement accuracy: Evaluation of their applicability. EGUsphere 2026, 19, 5617–5631. [Google Scholar] [CrossRef] [Scilit]
- Kollias, P.; Battaglia, A.; Lamer, K.; Treserras, B.P.; Braun, S.A. Mind the Gap—Part 3: Doppler Velocity Measurements from Space. Front. Remote Sens. 2022, 3, 860284. [Google Scholar] [CrossRef] [Scilit]
- Galfione, A.; Battaglia, A.; Puigdomènech Treserras, B.; Kollias, P. First insights into deep convection by the Doppler velocity measurements of the EarthCARE’s Cloud Profiling Radar. EGUsphere 2025, 18, 6747–6763. [Google Scholar] [CrossRef] [Scilit]
- Hotta, H.; Suzuki, K.; Kikuchi, M.; Aoki, S.; Kubota, T. Characteristics of tropical clouds with strong updrafts revealed by Doppler velocity measurements from EarthCARE/CPR. EGUsphere 2026, 26, 11605–11626. [Google Scholar] [CrossRef] [Scilit]
- Xu, Z.; Kollias, P.; Sasikumar, S.; Battaglia, A.; Puigdomènech Treserras, B.; McLinden, M.L.W. EarthCARE Cloud Profiling Radar observations of the vertical structure of marine stratocumulus clouds. Atmos. Chem. Phys. 2026, 26, 4619–4632. [Google Scholar] [CrossRef] [Scilit]
- Aoki, S.; Kubota, T.; Turk, F.J. Exploring vertical motions in convective and stratiform precipitation using spaceborne radar observations: Insights from EarthCARE and GPM coincidence dataset. Atmos. Meas. Tech. 2026, 19, 79–100. [Google Scholar] [CrossRef] [Scilit]
- Roh, W.; Satoh, M.; Matsugishi, S.; Aoki, S.; Kubota, T.; Okamoto, H. Vertical motions in clouds from EarthCare satellite and a global storm-resolving modeling. Sci. Rep. 2025, 16, 2622. [Google Scholar] [CrossRef] [Scilit] [PubMed]
- Kollias, P.; Puidgomènech Treserras, B.; Battaglia, A.; Borque, P.; Tatarevic, A. Processing reflectivity and Doppler velocity from EarthCARE’s cloud profiling radar: The C-FMR, C-CD and C-APC products. EGUsphere 2022, 16, 1901–1914. [Google Scholar] [CrossRef] [Scilit]
- Bang, S.D.; Cecil, D.J. Constructing a Multifrequency Passive Microwave Hail Retrieval and Climatology in the GPM Domain. J. Appl. Meteorol. Climatol. 2019, 58, 1889–1904. [Google Scholar] [CrossRef] [Scilit]
- Battaglia, A.; Mroz, K.; Cecil, D. Chapter 9—Satellite hail detection. In Precipitation Science; Michaelides, S., Ed.; Elsevier: Amsterdam, The Netherlands, 2022; pp. 257–286. [Google Scholar] [CrossRef] [Scilit]
- Lee, Y.; Kummerow, C.D.; Zupanski, M. A simplified method for the detection of convection using high-resolution imagery from GOES-16. Atmos. Meas. Tech. 2021, 14, 3755–3771. [Google Scholar] [CrossRef] [Scilit]
- Mecikalski, J.R.; Bedka, K.M. Forecasting Convective Initiation by Monitoring the Evolution of Moving Cumulus in Daytime GOES Imagery. Mon. Weather Rev. 2006, 134, 49–78. [Google Scholar] [CrossRef] [Scilit]
- Hamada, A.; Takayabu, Y.N. Convective cloud top vertical velocity estimated from geostationary satellite rapid-scan measurements. Geophys. Res. Lett. 2016, 43, 5435–5441. [Google Scholar] [CrossRef] [Scilit]
- Alhammoud, B.; Claud, C.; Funatsu, B.M.; Béranger, K.; Chaboureau, J.P. Patterns of Precipitation and Convection Occurrence over the Mediterranean Basin Derived from a Decade of Microwave Satellite Observations. Atmosphere 2014, 5, 370–398. [Google Scholar] [CrossRef] [Scilit]
- Galanaki, E.; Lagouvardos, K.; Kotroni, V.; Flaounas, E.; Argiriou, A. Thunderstorm climatology in the Mediterranean using cloud-to-ground lightning observations. Atmos. Res. 2018, 207, 136–144. [Google Scholar] [CrossRef] [Scilit]
- Marra, A.; Porcù, F.; Baldini, L.; Petracca, M.; Casella, D.; Dietrich, S.; Mugnai, A.; Sanò, P.; Vulpiani, G.; Panegrossi, G. Observational analysis of an exceptionally intense hailstorm over the Mediterranean area: Role of the GPM Core Observatory. Atmos. Res. 2017, 192, 72–90. [Google Scholar] [CrossRef] [Scilit]
- Dafis, S.; Rysman, J.F.; Claud, C.; Flaounas, E. Remote sensing of deep convection within a tropical-like cyclone over the Mediterranean Sea. Atmos. Sci. Lett. 2018, 19, e823. [Google Scholar] [CrossRef] [Scilit]
- Laviola, S.; Monte, G.; Levizzani, V.; Ferraro, R.R.; Beauchamp, J. A New Method for Hail Detection from the GPM Constellation: A Prospect for a Global Hailstorm Climatology. Remote Sens. 2020, 12, 3553. [Google Scholar] [CrossRef] [Scilit]
- Laviola, S.; Levizzani, V.; Ferraro, R.R.; Beauchamp, J. Hail Detection from Satellite Microwave Radiometers. Remote Sens. 2020, 12, 621. [Google Scholar] [CrossRef] [Scilit]
- Vermi, F.; Capozzi, V.; Monte, G.; Budillon, S.; Laviola, S. Lightning jump as precursor of very large hail occurrence: First evidence in the Italian territory. Bull. Atmos. Sci. Technol. 2025, 6, 21. [Google Scholar] [CrossRef] [Scilit]
- Puigdomènech Treserras, B.; Kollias, P.; Battaglia, A.; Tanelli, S.; Nakatsuka, H. EarthCARE’s Cloud Profiling Radar Antenna Pointing Correction using Surface Doppler Measurements. EGUsphere 2025, 18, 5607–5618. [Google Scholar] [CrossRef] [Scilit]
- EUMETSAT NWC SAF. User Manual for the Convection Product Processors of the NWC/GEO; NWC/CDOP3/GEO/MF-PI/SCI/UM/Convection; EUMETSAT: Darmstadt, Germany, 2024. [Google Scholar]
- EUMETSAT NWC SAF. Algorithm Theoretical Basis Document for the Convection Product Processors of the NWC/GEO; NWC/CDOP3/GEO/MF-PI/SCI/ATBD/Convection; EUMETSAT: Darmstadt, Germany, 2024. [Google Scholar]
- Hersbach, H.; Bell, B.; Berrisford, P.; Biavati, G.; Horányi, A.; Muñoz Sabater, J.; Nicolas, J.; Peubey, C.; Radu, R.; Rozum, I.; et al. ERA5 Hourly Data on Pressure Levels from 1940 to Present; Copernicus Climate Change Service (C3S) Climate Data Store (CDS): Reading, UK, 2023. [Google Scholar] [CrossRef]
- Mecikalski, J.R. Convective Updraft Detection Algorithm Theoretical Basis Document; EUM/CO/22/4600002721/SMJ; EUMETSAT: Darmstadt, Germany, 2024. [Google Scholar]
- Mikuš Jurković, P.; Mahović, N.S.; Počakal, D. Lightning, overshooting top and hail characteristics for strong convective storms in Central Europe. Atmos. Res. 2015, 161–162, 153–168. [Google Scholar] [CrossRef] [Scilit]
- Melcón, P.; Merino, A.; Sánchez, J.L.; López, L.; Hermida, L. Satellite remote sensing of hailstorms in France. Atmos. Res. 2016, 182, 221–231. [Google Scholar] [CrossRef] [Scilit]
- Torricella, F.; Levizzani, V.; Turk, F.J. Application of a Blended MW-IR Rainfall Algorithm to the Mediterranean. In Measuring Precipitation from Space; Advances in Global Change Research; Springer: Dordrecht, The Netherlands, 2007; Volume 28. [Google Scholar] [CrossRef] [Scilit]
- Laviola, S.; Vermi, F.; Monte, G.; Cattani, E. Multi-sensor Approach for Satellite Rain Advection (MASHA): A new technique to support the nowcasting of hailstorms. In Proceedings of the European Geosciences Union General Assembly (EGU2025), Vienna, Austria, 27 April–2 May 2025. [Google Scholar]
- Kokou, P.; Willemsen, P.; Lekouara, M.; Arioua, M.; Mora, A.; Van den Braembussche, P.; Neri, E.; Aminou, D.M. Algorithmic Chain for Lightning Detection and False Event Filtering Based on the MTG Lightning Imager. IEEE Trans. Geosci. Remote Sens. 2018, 56, 5115–5124. [Google Scholar] [CrossRef] [Scilit]
- Piskala Gvoždíková, B.; Mayer, J.; Brose, S.M.; Malina, E.; Gasbarra, D.; Doležalová, A.; Samardzhiev, K. Lightning2EarthCARE: Collocated geostationary lightning and EarthCARE observations of electrically active storms. Earth Syst. Sci. Data Discuss. 2026. in review. [Google Scholar] [CrossRef] [Scilit]
- Takahashi, H.; Luo, Z.J. Characterizing tropical overshooting deep convection from joint analysis of CloudSat and geostationary satellite observations. J. Geophys. Res. Atmos. 2014, 119, 112–121. [Google Scholar] [CrossRef] [Scilit]
- Battaglia, A. Impact of second-Trip echoes for space-borne high-pulse-repetition-frequency nadir-looking W-band cloud radars. Atmos. Meas. Tech. 2021, 14, 7809–7820. [Google Scholar] [CrossRef] [Scilit]
- Battaglia, A.; Simmer, C. How Does Multiple Scattering Affect the Spaceborne W-Band Radar Measurements at Ranges Close to and Crossing the Sea-Surface Range? IEEE Trans. Geosci. Remote Sens. 2008, 46, 1644–1651. [Google Scholar] [CrossRef]
- Luo, Z.; Liu, G.Y.; Stephens, G.L. CloudSat adding new insight into tropical penetrating convection. Geophys. Res. Lett. 2008, 35, L19189. [Google Scholar] [CrossRef] [Scilit]

Disclaimer/Publisher’s Note: The statements, opinions and data contained in all publications are solely those of the individual author(s) and contributor(s) and not of MDPI and/or the editor(s). MDPI and/or the editor(s) disclaim responsibility for any injury to people or property resulting from any ideas, methods, instructions or products referred to in the content. |
© 2026 by the authors. Licensee MDPI, Basel, Switzerland. This article is an open access article distributed under the terms and conditions of the Creative Commons Attribution (CC BY) license.