


Highlights
What are the main findings?
- Multi-source ensemble data (2000–2024) reveal co-increasing precipitation (1.79 mm yr−1, p = 0.014) and GPP (0.28 g C m−2 yr−1, p = 0.726) across Central Asia, accompanied by widespread increases in precipitation frequency (75.10% R1mm, 82.46% CWD) and intensity (64.16% SDII, 81.67% Extreme).
- Precipitation frequency rapidly reduced VPD and maintained shallow SM during t to t + 1, producing GPP anomaly gains ~0.5 g C m−2 8 d−1; meanwhile, precipitation intensity replenished deep SM, sustaining GPP anomaly gains of 0.5–1.5 g C m−2 8 d−1 from t + 1 onward.
- CB-SEM identified VPD as the dominant direct driver of GPP (−0.482), followed by SM (0.290); precipitation frequency reduced VPD (−0.016), whereas precipitation intensity increased SM (0.057).
What are the implications of the main findings?
- This study provides a novel ecohydrological framework that differentiates multi-dimensional precipitation characteristics, uncovering process-level mechanisms that enhance dryland ecosystem productivity under climate warming.
- The distinct atmospheric-relief and hydrological-buffering pathways highlight the necessity of explicitly incorporating rainfall frequency, intensity, and lagged VPD–soil-moisture dynamics into DGVMs and satellite monitoring.
Abstract
Global-warming-induced shifts in precipitation regimes profoundly affect terrestrial vegetation productivity; however, the pathways through which precipitation characteristics regulate gross primary productivity (GPP) remain insufficiently understood. Using meteorological records, satellite remote-sensing products, and reanalysis data from 2000 to 2024, we quantified GPP responses to changing precipitation regimes in Central Asian drylands through superposed epoch analysis, random forest and TreeSHAP analyses, and cross-lagged structural equation modeling (CB-SEM). Against a background of increasing annual precipitation (1.79 mm yr−1, p = 0.014), synchronous increases in precipitation frequency and intensity enhanced dryland productivity, with increasing GPP (0.28 g C m−2 yr−1, p = 0.726). The two precipitation-frequency metrics increased across 75.10–82.46% of the study area, whereas the intensity metrics increased across 64.16–81.67%. Frequent precipitation rapidly reduced vapor pressure deficit (VPD) and maintained shallow soil moisture, producing GPP anomaly gains ~0.5 g C m−2 8 d−1 across extensive Central Asian plains. In contrast, high-intensity precipitation replenished deep soil moisture and sustained GPP anomaly gains of 0.5–1.5 g C m−2 8 d−1 in the semi-arid steppe of northern Kazakhstan. CB-SEM identified VPD as the strongest direct climatic driver of GPP (−0.482), followed by soil moisture (0.290) and temperature (0.283). Precipitation frequency directly reduced VPD (−0.016), whereas precipitation intensity positively affected soil moisture (0.057). The frequency-mediated atmospheric pathway was strongest during the initial t (0–8-day) response period, while the intensity-mediated soil-moisture pathway became increasingly important after 8 days. These findings reveal complementary atmospheric-regulation and soil-moisture-buffering mechanisms and provide a process-based framework for improving the representation of dryland carbon–water coupling under changing precipitation regimes.
1. Introduction
Global warming intensifies the hydrologic cycle, driving significant shifts in precipitation regimes [1,2]. Accumulating evidence demonstrates that climate change alters not only regional and seasonal precipitation totals but also profoundly reshapes precipitation frequency, intensity, and structural patterns, while exacerbating the frequency and severity of extreme weather events [3,4,5]. These precipitation shifts, by altering atmospheric and soil moisture dynamics, exert profound impacts on terrestrial vegetation [6,7,8]. Because water is the primary limiting factor for terrestrial vegetation growth, variations in precipitation frequency and intensity directly govern micro-level eco-physiological processes—such as photosynthesis and water-use efficiency—while simultaneously shifting vegetation phenology, altering community composition and spatial distribution, and ultimately dictating ecosystem primary productivity and stability [9,10,11,12,13].
Consequently, numerous studies have investigated the impacts of climate-driven precipitation shifts on vegetation productivity. Previous work confirms that precipitation enhances gross primary productivity (GPP) by replenishing soil moisture (SM) while concurrently suppressing the atmospheric vapor pressure deficit (VPD) [6,14,15,16]. At the organismal scale, improved water availability prevents atmospheric drought-induced stomatal closure, thereby maintaining elevated stomatal conductance and photosynthetic rates to promote plant performance and productivity [13]. Across regional communities, grasslands, shrublands, and forests exhibit highly divergent responses to precipitation variations due to their distinct water-use strategies [17]. Relatively shallow-rooted grasslands are exceptionally sensitive to increased precipitation frequency and the resulting moisture pulses; they can rapidly trigger growth mechanisms, leading to sharp productivity surges. Driven by increased moisture, shrubs grow more vigorously and demonstrate widespread canopy expansion. In contrast, deep-rooted trees display greater spatial heterogeneity than herbaceous plants; in water-limited regions, increased precipitation relieves moisture stress and directly amplifies leaf-level photosynthetic potential [18,19,20,21]. Globally, changing precipitation regimes drive the migration of vegetation biomes—such as the shifting of dryland boundaries and the upward advancement of alpine tree lines—profoundly reshaping the spatial distribution and long-term stability of global vegetation productivity [22,23,24]. Collectively, these findings underscore that precipitation variations reshape terrestrial vegetation through a cascade of mechanisms spanning from micro-physiological processes to macro-ecosystem scales.
Although previous studies have advanced our understanding of how climate-driven shifts in precipitation amounts influence vegetation productivity across multiple scales, a consensus is still lacking on how alterations in precipitation regimes drive productivity and through what specific mechanisms. Many studies highlight the critical role of precipitation intensity, arguing that low-intensity rainfall is rapidly dissipated by surface evapotranspiration and canopy interception in arid regions; only high-intensity events can overcome these barriers to infiltrate the soil column, replenish SM, and sustain deep-rooted vegetation survival and productivity [11,25,26,27,28]. Conversely, other research suggests that higher precipitation frequency more effectively maintains low VPD levels, delaying leaf senescence and relieving ecosystem drought stress, which provides a stable microclimate that allows shallow-rooted dryland vegetation to keep stomata open [13,29,30,31,32]. In fact, the ecological impacts of both precipitation intensity and frequency are highly complex. Excessive intensity can easily exceed dryland soil infiltration rates, causing surface runoff, topsoil erosion, and soil organic carbon loss [33,34]. Conversely, a higher precipitation frequency without sufficient intensity fails to replenish deeper SM and is largely lost to ineffective evaporation [20]. Systematically unraveling how precipitation regimes—particularly the interplay between intensity and frequency—cascade through atmospheric and soil processes to ultimately govern vegetation productivity is crucial. This understanding is vital for deepening our insights into dryland eco-climatology and carbon–water coupling, thereby providing scientific underpinnings to accurately evaluate dryland carbon neutrality potential and support regional Sustainable Development Goals (SDGs).
Here, we focus on the temporal dynamics and causal coupling between precipitation regimes and natural vegetation productivity across Central Asia. Leveraging an integrated, high-frequency spatiotemporal dataset at an 8-day (weekly) resolution, we systematically quantified the coupling patterns of GPP with precipitation totals, intensity, frequency, and drought events from 2000 to 2024. We identified the evolving trends of the Central Asian precipitation regime and characterized the corresponding vegetation responses and lag effects. Utilizing a multi-model approach, we identified the non-linear response thresholds of GPP across different aridity zones under multidimensional precipitation variations and drought disturbances. By coupling Random Forest with SHAP (SHapley Additive exPlanations), we ranked the relative importance of different precipitation characteristics across various vegetation types. Finally, using structural equation modeling (SEM), we dissected the cascading causal pathways through which precipitation characteristics indirectly govern vegetation productivity dynamics by regulating SM and the VPD. These findings provide critical scientific underpinnings for parameterizing dryland climate-vegetation dynamics and benchmarking ecosystem carbon sink simulations.
2. Materials and Methods
2.1. Study Area
Central Asia (CA)—encompassing five nations (Kazakhstan, Uzbekistan, Kyrgyzstan, Turkmenistan, and Tajikistan) alongside the Xinjiang Uygur Autonomous Region of China—is a classic continental arid-to-semi-arid domain spanning approximately deep within the Eurasian hinterland (). The region is characterized by stark topographic relief abruptly ascending from (Turpan Depression) to (Tianshan and Pamir Mountains), a gradient that drives pronounced spatial heterogeneity in land cover (Figure 1b). Barren land (BAR) and grasslands (GRA) overwhelmingly dominate the landscape, sequestered within the hyper-arid southern basins and the northern semi-arid steppe belt, respectively. Conversely, transitional shrublands (CSH, OSH, WSA) remain sparse and localized within southern Turkmenistan and Uzbekistan, while forests (ENF, DBF, MF) are exceptionally rare, clustered almost exclusively within the well-watered southeastern montane zones.
Figure 1.
Study area and meteorological station distribution. (a) Digital elevation model (DEM, m) integrated with the distribution of meteorological stations and regional location map. (b) Spatial pattern of land use and land cover (LULC) types across the domain. Legend abbreviations represent standard MODIS land cover classes.
2.2. Datasets
Given the pronounced spatiotemporal uncertainty of arid precipitation, we integrated 11 long-term, high-resolution datasets to robustly evaluate its impacts on vegetation productivity. Based on their underlying algorithms, these products were classified into four major categories (Table 1): station-interpolated data (NOAA GHCN, CMA surface dataset, CPC, and GPCC); reanalysis products characterizing continuous land–atmosphere coupling (ECMWF ERA5, NCEP CFSR/CFSv2, and NASA MERRA-2); satellite estimates proficient in capturing high-frequency extreme events (IMERG, GSMaP, and CMORPH); and blended datasets leveraging optimal multi-source weighting schemes (MSMEP) [35,36,37,38,39,40,41,42,43].
Table 1.
Precipitation datasets.
To comprehensively capture vegetation photosynthetic responses to moisture forcing, we utilized two complementary GPP products: the LUE-model-based MODIS MOD17A2H (500 m, 8-day) and the SIF-derived GOSIF GPP (0.05°, 8-day). MODIS GPP offers robust long-term stability optimized for tracking macro-scale phenology and decadal growth trends. Conversely, GOSIF GPP—retrieved via the joint inversion of satellite solar-induced chlorophyll fluorescence and meteorological inputs—provides a direct physiological proxy with exceptional instantaneous sensitivity to moisture-deficit induced stomatal closure and photosynthetic downregulation [44,45].
To delineate representative natural vegetation communities, the annual 500 m MODIS Land Cover product (MCD12Q1 Version 6) was spatially reclassified from 17 IGBP classes into three consolidated categories: (1) Tree Cover, aggregating forests and woody savannas (IGBP 1–5, 8, 9); (2) Shrublands, encompassing closed/open shrublands and cropland/natural vegetation mosaics (IGBP 6, 7, 14); and (3) Grasslands (IGBP 10). To eliminate anthropogenic and non-vegetated confounding factors, croplands (IGBP 12) along with urban areas, snow/ice, barren land, and water bodies were strictly masked out, ensuring the high-fidelity assessment of undisturbed natural ecosystems [46,47].
To resolve land–atmosphere coupling dynamics, hourly 0.1° × 0.1° variables were extracted from the ECMWF ERA5-Land dataset and partitioned into two functional categories: meteorological controls, including 2 m TEMP (°C) and surface solar radiation downwards (RAD) (W·m−2), integrated to filter out confounding interannual radiative and thermal fluctuations on GPP; and atmospheric and hydrological constraints, comprising VPD (kPa; derived from 2 m air and dewpoint temperatures to capture atmospheric aridity) and volumetric SM content (m3/m3). Native SM across four discrete layers (0–7, 7–28, 28–100, and 100–289 cm) was vertically aggregated into distinct shallow (0–28 cm) and deep (28–289 cm) SM zones [48,49].
2.3. Theoretical Basis and Hypotheses
Arid ecosystem responses to moisture forcing are governed by intricate temporal lags and physiological buffering mechanisms [50]. Under the classic “pulse–reserve” framework [51], a discrete precipitation event (pulse input) triggers rapid soil recharge; after the rainfall ceases, this moisture undergoes exponential decay driven by atmospheric demand and deep percolation, acting as a sustained-release reserve that cushions plants during subsequent dry spells (Figure 2a) [52]. Concurrently, vegetation photosynthesis exhibits a pronounced response lag moisture peaks because cascading physiological and biochemical processes—such as root water uptake, stomatal opening, and carbon assimilation—require time for signal transduction (Figure 2b). Consequently, GPP can remain elevated long after SM has receded to baseline levels.
Figure 2.
Conceptual framework linking precipitation regimes, pulse–reserve dynamics, and lagged vegetation productivity responses in Central Asian drylands. (a) A precipitation pulse initiates rapid soil-water recharge, followed by soil-moisture retention and a lagged GPP response. (b) A time lag exists between the soil moisture peak and the GPP anomaly, generating a delayed vegetation legacy effect. (c) High-intensity precipitation is hypothesized to replenish deep soil moisture and sustain delayed productivity gains through hydrological buffering. (d) High-frequency precipitation is hypothesized to repeatedly alleviate VPD and maintain shallow soil moisture, thereby promoting rapid short-term GPP responses.
Building on this common pulse–reserve framework, we formulated two contrasting and testable hypotheses to distinguish the ecohydrological pathways through which precipitation regimes regulate vegetation productivity (Figure 2b,c). The intensity-driven hypothesis proposes that high-intensity precipitation produces strong infiltration pulses and replenishes deep soil moisture, thereby generating a delayed and sustained productivity response through hydrological buffering (Figure 2b). In contrast, the frequency-driven hypothesis proposes that recurrent rainfall events repeatedly alleviate atmospheric VPD and maintain shallow soil moisture, thereby promoting a rapid, short-term vegetation response (Figure 2c). These pathways are not mutually exclusive; rather, they represent distinct temporal mechanisms through which precipitation intensity and frequency may jointly regulate dryland GPP.
2.4. Data Fusion and Preprocessing
Spatial Standardization and Resampling: To align datasets across varying native resolutions (0.1° to 1.0°), continuous meteorological variables (ERA5-Land VPD, TEMP, RAD, SM) and distinct precipitation products were resampled onto a standardized 0.1° × 0.1° grid via bilinear interpolation with strict coordinate alignment. To properly process land cover and vegetation data without category distortion, the native 500 m MCD12Q1 product was first utilized at its original resolution to construct a vegetation mask, strictly excluding croplands (to eliminate irrigation confounding effects), urban areas, snow/ice, permanent water bodies, and other non-vegetated surfaces. This high-resolution mask was applied directly to the native 500 m GPP data prior to spatial aggregation. The masked 500 m GPP pixels were then aggregated to the 0.1° grid by calculating the spatial mean. Finally, 0.1° grid cells with a total vegetation fraction below 20% were excluded to minimize mixed-pixel effects.
Time-Zone Correction and Temporal Aggregation: Hourly datasets were adjusted from UTC to the local UTC + 6 time zone to ensure daily precipitation sequences aligned with real diurnal rhythms [53,54]. These daily sequences were subsequently aggregated into 8-day blocks matching satellite GPP products: arithmetic means were computed for TEMP, VPD, and SM; cumulative integration for RAD; and total cumulative volumes with extreme precipitation indices from daily precipitation.
Reference Dataset Construction and Prior Evaluation: To evaluate individual dataset accuracy before fusion, missing values in NOAA and CMA station observations were gap-filled using the high-accuracy CPC product to construct a continuous reference dataset. Pixel values from eight gridded datasets were extracted at station coordinates and validated using Correlation Coefficient (CC) for magnitude coherence and Probability of Detection (POD) for event capture [55].
Optimized Ensemble Averaging: Guided by prior evaluation, a pixel-wise ensemble mean of the multi-source precipitation products was computed to minimize systematic biases and random noise, particularly under extreme conditions [42,56].
Definition of Precipitation Indicators: Traditional ETCCDI climate indices are typically aggregated at monthly or annual scales. To achieve rigorous temporal alignment with the 8-day composite GPP remote sensing data, a window-based reconstruction was applied to daily precipitation. Mean and intensity metrics (PRCPTOT and SDII) were calculated independently within each 8-day window. For extreme precipitation (R90p), the maximum daily value exceeding the pixel-specific annual 90th percentile threshold within each 8-day window was extracted (Table 2). To account for ecological memory and non-resetting moisture stress, cumulative duration and frequency indices (R1mm, CWD, and CDD) were derived using a continuous state-transition model at the daily scale rather than being forcibly truncated within isolated 8-day windows. This model permits wet/dry states to carry over naturally across window, monthly, and annual boundaries. For each 8-day GPP period, the reported value of R1mm, CWD, or CDD reflects the maximum cumulative state achieved within or up to that specific 8-day window (Table 2), thereby capturing multi-week or multi-month moisture accumulation and deficit conditions.
Table 2.
Precipitation frequency and intensity metrics based on ETCCDI.
2.5. Trend Estimation and Significance Testing
Long-term trends in annual precipitation, precipitation-regime indices, and GPP during 2000–2024 were quantified for each valid grid cell using the Theil–Sen estimator. The resulting Sen’s slope represents the median annual rate of change and is reported in the corresponding physical units. Trend significance was assessed using a two-sided Mann–Kendall test, with the null hypothesis of no monotonic trend. Trends with p < 0.05 were considered statistically significant, and those with p < 0.01 were considered highly significant. In the spatial trend maps, stippling indicates grid cells with significant trends (p < 0.05), whereas unstippled cells denote non-significant trends. Positive and negative slopes indicate increasing and decreasing trends, respectively.
2.6. Superposed Epoch Analysis
To precisely resolve the dynamic response trajectories of vegetation productivity to diverse precipitation regimes and elucidate whether intensity or frequency exerts a more pronounced control on cumulative carbon assimilation, we introduced SEA. By aligning discrete precipitation events at a synchronized temporal node (t = 0), SEA filters out high-frequency stochastic background noise to isolate consistent ecosystem response trajectories [57,58,59,60]. Prior to this analysis, we established a rigorous preprocessing workflow to systematically strip confounding long-term climatic shifts and intra-annual seasonality from the 8-day time series dataset.
This process began with pixel-wise ordinary least squares linear detrending applied to the raw observations to eliminate secular warming trends, formulated as:
where and denote the raw and detrended values for pixel s at time t, respectively, while and represent the long-term intercept and slope. To subsequently filter out normal seasonal physiological and meteorological variations driven by annual solar cycles, we calculated the multi-year climatological mean for each specific calendar day:
where is the baseline climatology for the p-th 8-day temporal block (p ∈ [1, 46]) across an N-year sequence. Subtracting this seasonal baseline from the detrended time series ultimately yielded the absolute anomalies:
which provide clean, unconfounded signals () of sudden climate anomalies and abrupt ecosystem stress for downstream non-linear modeling.
To characterize ecosystem dynamics under varying forcing magnitudes, all precipitation metrics were stratified into four progressive stress levels (). Specifically, duration and frequency metrics (CWD, CDD, R1mm) were binned by absolute day thresholds, whereas intensity metrics (Extreme, SDII) were standardized using localized historical non-zero percentiles to reconcile the sharp baseline aridity gradients across Central Asia (Table 3).
Table 3.
Stratification for precipitation frequency and intensity metrics.
2.7. Random Forest and TreeSHAP
To capture non-linear biological responses and interactive mechanisms of GPP to climate anomalies, a machine learning attribution framework integrating a Random Forest (RF) regressor and TreeSHAP was constructed.
Pixel-wise anomalies for meteorological factors, precipitation indicators, and GPP were calculated against multi-year historical means for specific day-of-year periods to eliminate structural seasonality. A three-period rolling average window was applied to the feature cube to capture lag effects and cumulative ecological buffers. The processed datasets were stratified into three primary vegetation archetypes (Tree, Shrub, and Grass) using localized land cover fractional vectors, followed by balanced statistical sampling to form the training matrix. The RF regressor was configured with 100 decision trees and a maximum tree depth of 15 to ensure predictive generalization and avoid overfitting.
Following predictive convergence, post hoc interpretability was formulated utilizing TreeSHAP, isolating the exact marginal contributions of each variable across feature permutations at the pixel level. Derived local SHAP values were aggregated into physical mechanism blocks to evaluate absolute magnitudes and percentage variations relative to base GPP means. Non-linear dynamics were extracted from SHAP dependency distributions using a dual-layer calculus routine on quantile-binned trend coordinates. Linear interpolation was applied to solve for zero-crossing thresholds where meteorological variations shift between ecological facilitation and constraint, while discrete first-order forward differentiation pinpointed peak sensitivity domains and growth saturation inflection points.
2.8. Cross-Lagged Structural Equation Model
To quantify the cascading precipitation anomaly–environmental mediation–vegetation response network while resolving multicollinearity, a Covariance-Based Cross-Lagged Structural Equation Model (CB-SEM) was developed. This multivariate framework simultaneously evaluates direct, indirect, and lagged associative pathways across the growing season (April–October) while accounting for measurement error. Site-specific anomalies for all primary variables (GPP, VPD, TEMP, RAD, SM, and extreme climate indices) were calculated and globally standardized to isolate climate shocks and eliminate seasonal cycles.
The CB-SEM topology integrates a latent measurement model with a multi-stage cross-lagged structural network spanning 32 days across four 8-day intervals. Two key latent source variables were defined: an Intensity Factor indicated by concurrent SDII and Extreme, and a Frequency Factor indicated by R1mm (lagged t to t − 3) and CWD (lagged t to t − 1). An atmospheric feedback loop was configured where cumulative CDD (t to t − 3) directly drives concurrent RAD and TEMP anomalies to simulate clear-sky heating mechanisms. Temporally, the network transitions from an immediate atmospheric phase at t, to an intermediate hydrological phase at t + 1 where SM is modeled via lagging infiltration and first-order autoregressive memory, and ultimately to slow physiological phases at t + 2 and t + 3 where GPP is jointly constrained by lagged SM and atmospheric conditions. Following Maximum Likelihood estimation and fit index evaluation (CFI, TLI and RMSEA), the path coefficient product rule was applied using directed graph network analysis. Total impacts of precipitation intensity and frequency on delayed GPP were decomposed into hydrologically mediated pathways via SM and stomatally limited pathways via VPD.
3. Results
3.1. Multidimensional Evolution of Precipitation Regimes and Spatiotemporal Differentiation of Vegetation Productivity Responses
Over the past 25 years (2000–2024), the arid region of Central Asia has exhibited a complex pattern of coupled hydroclimatic and ecological dynamics [61,62]. Time-series analysis based on the ensemble mean of optimized multi-source gridded precipitation products indicates that annual total precipitation (PRCPTOT), despite pronounced interannual oscillations, displays a statistically significant increasing trend (). Concurrently, the ensemble mean GPP, integrated from two independent satellite-derived datasets, presents a subtle upward trajectory (), though statistically non-significant on a regional average scale (p = 0.726). Far from indicating a lack of ecological responsiveness, this regional-scale non-significance primary reflects the strong interannual volatility driven by episodic hydroclimatic extremes and substantial spatial heterogeneity across distinct vegetation zones. Crucially, extreme wet and dry years (such as the 2008 severe drought and the 2016 pluvial period) demonstrate striking macroscopic synchrony between PRCPTOT and GPP fluctuations (Figure 3). Sensitivity analysis further confirms that GOSIF exhibited stronger responses to precipitation indices than MOD17A2H during the t to t + 3 lag period, particularly around t and t + 3 (Figure S1), while both products consistently captured the dominant temporal response patterns. This strong interannual fluctuation synchrony, juxtaposed with a non-significant overall linear trend, demonstrates that dryland primary productivity is predominantly regulated by discrete, event-scale precipitation pulses and spatial microclimates rather than a monotonic long-term greening process. In summary, while both precipitation and GPP in Central Asia exhibited upward trajectories over the study period, the long-term increase in GPP remained statistically non-significant, highlighting the necessity of investigating sub-annual event characteristics and spatiotemporal differentiation.
Figure 3.
Spatiotemporal distribution of precipitation and vegetation productivity trends in Central Asia from 2000 to 2024. (a,b) Spatial trends of (a) annual precipitation (PRCPTOT, ) and (b) growing-season GPP, ). Stippling denotes p < 0.05. (c) Zonal profiles () of (blue) and (green). Light-green shading indicates the regional domain. (d,e) Interannual variability and trends of (d) precipitation across 8 individual products and (e) GPP. Bold solid lines represent Ensemble Means and dashed lines denote its trends (* denotes statistical significance at p < 0.05). Shading indicates uncertainty bounds: Upper Spread () and Lower Spread (). (f) Coupling between grid-cell and . The four background quadrant colors represent distinct response regimes: dual-increase (), dual-decrease (), precipitation-driven suppression (), and precipitation-driven stimulation ().
However, this modest regional average trend masks substantial internal heterogeneity. Spatial differentiation in precipitation trends reveals a pronounced west–dry and east–wet pattern [62,63]. The western and northern sectors of the study area—including the Greater Barsuki Desert in Kazakhstan, the Karakum Desert in Turkmenistan, and the Kyzylkum Desert in Uzbekistan—are undergoing significant long-term aridification (with annual precipitation dropping by −10 to −5 ). Conversely, the southeastern domain—encompassing most of Xinjiang, the majority of Tajikistan, and central and eastern Kazakhstan (specifically the Tianshan Mountains, southern Altai Mountains, and northern Kunlun Mountains)—exhibits substantial precipitation increases (locally exceeding ). Spatial patterns of precipitation gains and losses are fundamentally synchronized with vegetation dynamics (Figure 3c).
Notably, the temporal evolution of vegetation productivity does not strictly mirror annual total precipitation. Marked desynchronization occurs in specific years where precipitation increases or decreases, but GPP moves in the opposite direction relative to the prior year (as observed during 2003–2004, 2010–2011, and 2022–2023). Even under identical magnitudes of annual precipitation change, the amplitude of GPP fluctuations varies widely (Figure 3f). Although precipitation changes dictate the directional shifts in GPP across most regions (quadrants I and III of the scatter plot), a substantial proportion of spatial pixels exhibit clear ecological anomalies. In certain mid-to-high latitude zones experiencing precipitation declines, GPP remains stable or even displays a counter-trend greening; conversely, some areas with increased precipitation fail to translate the water bonus into effective productivity gains (Figure 3c). This spatiotemporal mismatch between annual total precipitation and vegetation growth implies that a singular annual total precipitation (PRCPTOT) metric is insufficient to explain the complex, heterogeneous ecological responses in arid regions under climate warming. Instead, the response of Central Asian vegetation to moisture availability is likely modulated by finer-scale shifts in the precipitation regime, such as alterations in precipitation frequency and intensity [28,64].
Based on the optimized ensemble field (Ens_Top6_Mean), we performed a multidimensional trend analysis of regional precipitation regimes spanning intensity (Simple Daily Intensity Index (SDII), Extreme Precipitation (Extreme)), frequency (Precipitation Frequency (R1mm), Consecutive Wet Days (CWD)), and Consecutive Dry Days (CDD) (Figure 4). Regarding precipitation frequency metrics, R1mm and CWD increased across 75.10% and 82.46% of the region, with significant trends observed in 41.98% and 47.61% of the area, respectively. For intensity metrics, SDII and Extreme exhibited increasing trends in 64.16% and 81.67% of the region, of which 33.60% and 53.64% were statistically significant. Additionally, CDD increased over 51.01% of the area, with 20.74% showing significant increases. The results confirm that the precipitation regimes in Central Asia are undergoing distinct structural transitions that are not fully synchronized with spatial variations in annual total precipitation. In the southeastern sector and high-altitude mountainous zones surrounding the Tianshan and Pamir Mountains, frequency and intensity escalated concurrently; frequency exhibited a highly consistent and significant upward trend (R1mm, 0.5–2 d yr−1; CWD, 0.1–0.5 d yr−1), while intensity grew synchronously and significantly (SDII, 0.03 mm d−1 yr−1; Extreme, 0.5–5 mm yr−1). This co-intensification pattern of frequency and intensity profoundly optimized the VPD and SM replenishment, directly explaining the significant surge in vegetation GPP (1–10 ) in this region. Conversely, in regions with divergent shifts in frequency and intensity—such as central Kazakhstan, where precipitation intensity decreased but frequency increased—the precipitation regime exhibited a downward trend in intensity metrics (SDII: ~−0.03 mm d−1 yr−1, Extreme: ~0.5 mm yr−1) alongside an increasing trend in frequency metrics (R1mm: ~0.5 d yr−1, CWD: ~0.05 d yr−1) despite a slight expansion in total precipitation (~1–5 mm yr−1). This structural shift ultimately led to a 0.1–5 growth in GPP across these areas. In contrast, for the southwestern sector experiencing enhanced intensity but diminished frequency, both SDII and Extreme precipitation generally showed upward trends (0.03 mm d−1 yr−1, 0.5 mm yr−1). However, these regions simultaneously suffered from a declining trend in precipitation frequency (R1mm: 0.5 day yr−1) and a localized elongation of consecutive dry day duration (CDD: 0.5 d yr−1), which ultimately manifested as a GPP degradation trend of −0.1 to −5 .
Figure 4.
Spatial variations in five precipitation indices in Central Asia. (a–e) Spatial distributions of the multi-year linear trends (2000–2024) of five precipitation indices based on the Ens_Top6_Mean; (a) SDII; (b) Extreme; (c) R1mm; (d) CWD and (e) CDD. Black stippled areas indicate trends that passed the significance test (p < 0.05). (f) Percentage statistics of the increasing and decreasing trends in the regional means of the five precipitation indices.
3.2. Cascading Effects and Lag Response Processes Driven by Shifting Precipitation Regimes
In this study, we employed superposed epoch analysis (SEA) to quantitatively characterize the cascading “moisture infiltration–carbon assimilation” responses triggered by different precipitation regimes, together with the event-driven ecological responses revealed by spatial mapping. The precipitation regimes were examined from three complementary dimensions: precipitation amount and drought persistence (PRCPTOT and CDD, Figure 5), precipitation frequency and wet-day persistence (R1mm and CWD, Figure 6) and precipitation intensity and extremity (SDII and Extreme, Figure 7). For each event type, the spatial GPP response was quantified as the difference between the mean GPP anomaly during the three post-event 8-day periods (t + 1 to t + 3) and the pre-event baseline.
Figure 5.
Cascading atmosphere–soil–vegetation responses and spatial distribution of vegetation responses to precipitation amount and drought persistence. (a,c) PRCPTOT; (b,d) CDD. Light-gray shading indicates the temporal window covered by the corresponding precipitation or drought event, with PRCPTOT representing precipitation accumulated over the current 8-day period (t) and CDD including events lasting > 45 days. Histograms show the area percentages of different ∆GPP response intervals. Black stippling indicates statistically significant responses (p < 0.05).
Figure 6.
Cascading atmosphere–soil–vegetation responses and spatial distribution of vegetation responses to precipitation frequency and wet-day persistence. (a,c) R1mm; (b,d) CWD. Light-gray shading indicates the temporal window affected by the corresponding event. Specifically, for extreme persistent precipitation events (e.g., R1mm days), the continuous wet conditions can extend across up to four consecutive 8-day composite windows (). Consequently, the corresponding curves begin to elevate from the preceding t − 4 period, with the light-gray shading spanning the full 32-day impact window to reflect the onset and cascading influence on GPP. Histograms show the area percentages of different response intervals. Black stippling indicates statistically significant responses (p < 0.05).
Figure 7.
Cascading atmosphere–soil–vegetation responses and spatial distribution of vegetation responses to precipitation intensity and extremes. (a,c) SDII; (b,d) Extreme. Light-gray shading indicates the temporal window covered by the corresponding event, with SDII and Extreme defined based on precipitation occurring during the current period (t). Histograms show the area percentages of different ∆GPP response intervals. Black stippling indicates statistically significant responses (p < 0.05).
The responses to PRCPTOT and CDD highlight the contrasting effects of water availability and drought persistence on vegetation productivity (Figure 5). During precipitation events (t = 0), shallow soil moisture (0–28 cm) increased rapidly, whereas deep soil moisture (28–289 cm) responded more slowly, generally reaching a maximum around t + 1 before gradually declining. This delayed propagation of water into deeper soil layers was followed by a pronounced increase in GPP from t + 1 to t + 3, indicating a clear lagged coupling between precipitation, soil moisture, and carbon assimilation. In contrast, prolonged CDD events generally suppressed GPP, although the magnitude of the response varied substantially with drought duration and background aridity. The strongest GPP reductions (~−0.3 ) were mainly observed across the temperate steppe regions of northern and central Kazakhstan, where herbaceous vegetation is highly sensitive to prolonged water deficits. An opposite response was observed in parts of the southern Altai and Tianshan Mountains, where CDD events were occasionally associated with increased GPP, whereas precipitation events produced weak or negative responses. This pattern may reflect the different climatic controls in relatively humid, high-elevation ecosystems, where water availability is supported by snow and glacier melt and increased dry days may coincide with greater solar radiation and warmer conditions.
Precipitation frequency and wet-day persistence represented by R1mm and CWD produced more rapid and sustained ecological responses (Figure 6). Frequent precipitation events and consecutive wet days maintained shallow soil moisture and alleviated atmospheric water stress, as reflected by reduced VPD. Although consecutive light rainfall pulses did not substantially increase deep soil moisture, their cumulative effect helped maintain near-surface wetness and favorable atmospheric conditions, facilitating stomatal reopening and enhancing GPP. Consequently, R1mm and CWD events generated a relatively rapid increase in GPP that persisted over several subsequent 8-day periods. Spatially, positive responses were particularly evident across the Central Asian plains, including large parts of Turkmenistan, Kyrgyzstan, and Tajikistan, where GPP gains exceeded approximately following high-frequency precipitation events.
In contrast, precipitation intensity and extreme events exhibited a different response pathway, primarily associated with soil-water storage (Figure 7). Compared with low-intensity rainfall, higher SDII events generated stronger infiltration pulses and more effectively replenished deep soil moisture, resulting in a delayed but relatively persistent increase in GPP. SDII events above the median intensity generally produced stronger positive ecological responses, suggesting that rainfall intensity influences the amount of water transferred into deeper soil layers and subsequently available to vegetation. Extreme precipitation events showed a similar but more spatially heterogeneous pattern. Strong Extreme events were associated with positive GPP responses in the semi-arid steppe regions of northern Kazakhstan, with response magnitudes of approximately 0.5–1.5 . However, weak or lower-intensity extreme-event classes occasionally showed negative responses, indicating that the ecological benefit of extreme precipitation does not increase monotonically with event intensity. Overall, these results indicate that precipitation intensity regulates vegetation productivity mainly through the magnitude and persistence of soil-water replenishment.
Noticeably, across multiple precipitation metrics in lower value or percentile intervals (e.g., Extreme metric below the 90th percentile or precipitation frequency within 1–4 days in Figure 6 and Figure 7), the responses of eco-climatic indicators (RAD, TEMP, VPD, SM, and GPP) remain highly muted or exhibit slight negative anomalies. Statistically, this is attributable to the strongly right-skewed probability distribution of daily rainfall, where these sub-threshold or short-duration intervals are dominated by high-frequency, low-magnitude precipitation pulses. Overall, the three precipitation dimensions reveal distinct ecological pathways: precipitation amount primarily regulates water availability, precipitation intensity controls soil-water storage, whereas precipitation frequency maintains shallow moisture and alleviates atmospheric drought stress.
3.3. Associative Pathways and Response Mechanisms of Central Asian Vegetation to Multidimensional Precipitation Characteristics
To isolate the associative pathways and interactive relationships through which distinct precipitation metrics are linked to GPP, we constructed a CB-SEM integrating precipitation frequency, precipitation intensity, and consecutive dry days (Figure 8b). The standardized path coefficients reveal that within the climatic control network regulating arid land vegetation productivity, VPD exerts the most dominant direct effect on GPP (path coefficient = −0.482), followed by SM (0.29) and TEMP (0.283), whereas RAD exhibits a weaker influence (0.125). This hierarchy explicitly highlights the predominance of atmospheric forcing over arid vegetation productivity, demonstrating that the moisture stress experienced by vegetation stems primarily from atmospheric transpirational demand rather than being solely constrained by the physical supply of SM.
Figure 8.
Response pathways and associations of Central Asian vegetation with precipitation frequency, intensity, and consecutive dry days scenarios. (a) Conceptual framework illustrating the vegetation responses to precipitation frequency, intensity, and consecutive dry days scenarios. (b) CB-SEM quantifying the networks through which precipitation frequency, intensity, and consecutive dry days are associated with vegetation GPP. Blue and red arrows represent statistically significant positive and negative path associations, respectively; arrow widths are proportional to the absolute values of the standardized path coefficients (*** denotes a significance level of p < 0.01). (c) Path effect decomposition and total effects of precipitation frequency, intensity, and consecutive dry days on GPP CFI = 0.908, TLI = 0.902, RMSEA = 0.081, SRMR = 0.045, and the effective sample size N = 81,817.
Furthermore, the associations between precipitation characteristics and GPP exhibit distinct mediator-specific and temporal patterns. As illustrated in Figure 8b, VPD showed a stronger standardized association with GPP (−0.482) than soil moisture (SM; 0.290), indicating that variations in atmospheric moisture demand were more strongly associated with GPP than variations in SM at the regional scale. However, the relative importance of the two precipitation characteristics cannot be inferred from these mediator-to-GPP coefficients alone, because Frequency and Intensity differed substantially in their associations with the respective mediators. Specifically, Frequency showed a stronger negative association with VPD (−0.016) than Intensity (−0.009), whereas Intensity showed a stronger positive association with SM (0.057) than Frequency (0.035) (Figure 8b). Thus, although VPD had a larger standardized association with GPP than SM, the strength of the precipitation-to-mediator pathways differed between Frequency and Intensity.
This distinction is further reflected in the cross-lagged indirect contributions shown in Figure 8c. In the pathway mediated by VPD, Frequency contributed more strongly to GPP during the early response stages, particularly at t and t + 1, consistent with its relatively stronger association with VPD. By contrast, in the pathway mediated by SM, Frequency showed a relatively higher contribution at t, but the contribution associated with Intensity became greater from t + 1 onward, consistent with the stronger Intensity–SM association. Importantly, the effects mediated through SM exhibited a more persistent lagged response than those mediated through VPD. The progressive persistence of soil-moisture responses across later lag periods therefore allowed the contribution of Intensity to accumulate over time. Consequently, although Frequency showed a stronger contribution during the initial lag through the VPD pathway, the cumulative total effect across the t to t + 3 lag periods was greater for Intensity than for Frequency (Figure 8c). These results indicate that the relative contribution of precipitation Frequency and Intensity to GPP depends not only on the strength of their associations with individual mediators, but also on the temporal persistence of those mediator pathways.
Overall, the cross-lagged analysis suggests a temporal differentiation in the precipitation–GPP associations: Frequency was more strongly associated with the early atmospheric pathway through VPD, whereas Intensity was more strongly associated with the later soil-moisture pathway and accumulated a greater total contribution across the lag period. These patterns should be interpreted as lagged associations within the observational cross-lagged model rather than as evidence of causal dominance. In the CDD scenario, the adverse association with GPP was concentrated primarily at t + 1 and weakened rapidly by t + 2.
4. Discussion
4.1. Cross-Validation and Robustness of Multi-Source Precipitation Datasets
Due to the complex topography and sparse rain gauges in Central Asia, substantial uncertainties exist in the spatiotemporal representation of the multidimensional evolution of precipitation [65]. Regarding precipitation frequency, satellite and reanalysis datasets typically overestimate the number of precipitation events, particularly in identifying light precipitation, where noise or non-precipitation signals are easily misclassified as effective precipitation; conversely, station-interpolated products tend to underestimate event frequency. In terms of precipitation intensity, satellite products exhibit strong capabilities in identifying heavy precipitation but lack stability in capturing consecutive wet days, while reanalysis products tend to smooth precipitation processes, thereby dampening the characteristics of extreme precipitation pulses [66,67]. Figure 9 compares and reveals the potential biases of individual precipitation products, demonstrating the scientific robustness of Ens_Top6_Mean.
Figure 9.
Accuracy evaluation and linear trend comparison of multi-source precipitation products for precipitation indices in Central Asia (CA). (a–f) Scatter plots of Probability of Detection (POD) against Correlation Coefficient (CC) for six precipitation indices: (a) PRCPTOT, (b) SDII, (c) Extreme, (d) R1mm, (e) CWD, and (f) CDD. The red circles highlight top-performing products, and error bars represent spatial variability across the study domain. (g) Regional mean linear trends of precipitation indices derived from individual precipitation products and ensemble means. Numbers above the bars report the relative trend (% yr−1) followed by the absolute trend in parentheses, with an asterisk (*) indicating statistical significance at p < 0.05.
Significant discrepancies exist among different baseline datasets in capturing the precipitation structure of arid regions. For grid-sensitive indices such as Extreme and R1mm, the CC and POD of reanalysis data (e.g., ERA5) and satellite products (e.g., GSMaP) exhibit substantial dispersion (Figure 9d). For instance, the annual growth rates of PRCPTOT estimated by CFSR and Merra2 exceed those of other products, whereas CMORPH displays a weak negative trend; regarding the trends of R1mm and CDD, different datasets even yield contrasting directions in trend deviations. This indicates that relying solely on a single precipitation product to derive land–atmosphere coupling causal chains introduces profound data biases. In contrast, the Ens_Top6_Mean constructed in this study demonstrates remarkable superiority, consistently occupying the optimal “high CC, high POD” quadrant in the upper-right corner across nearly all key precipitation indices (Figure 9a–f). Synthesizing the robust, consensus trends across multiple precipitation datasets, we demonstrate that Central Asia as a whole exhibits upward trends in annual total precipitation (PRCPTOT: 1.79 mm yr−1), daily precipitation intensity (SDII: 0.004 mm d−1 yr−1), extreme precipitation (Extreme: 0.067 mm yr−1), precipitation frequency (R1mm: 0.33 d yr−1), and consecutive wet days (CWD: 0.06 d yr−1), while consecutive dry days (CDD: 0.045 d yr−1) also register a slight increase. This provides robust evidence for the “wetting” of Central Asia, while further highlighting that the concurrent amplification of both intensity and frequency indicates that precipitation is becoming inherently more extreme (Figure 9g).
Although Ens_Top6_Mean reduces the uncertainties of precipitation datasets, certain data limitations remain in this study. Multi-source gridded products are still constrained by their baseline spatial resolution when capturing orographic rainfall pulses or addressing light precipitation omissions in high-altitude mountainous areas. Future research urgently needs to incorporate higher-resolution regional climate models, multi-scale radar networks, and in situ micrometeorological observation arrays to provide more benchmark precipitation values for accuracy evaluation and validation.
4.2. Divergent Responses and Sensitivities of Tree, Shrub, and Grass Functional Types
To quantify the relative contributions and driving forces of hydroclimatic variables, we applied the TreeSHAP algorithm to a Random Forest framework. The predictor diagnostics revealed distinct patterns of correlation between precipitation indices and environmental drivers (Figure S2). Among the environmental variables, TEMP and VPD showed the strongest pairwise correlation (r = 0.77), reflecting their strong physical coupling, while VPD and RAD also exhibited a moderate positive correlation (r = 0.62). Nevertheless, the VIF values for VPD, TEMP, RAD, and SM were all below 4, indicating that multivariate collinearity among the environmental drivers remained below commonly used thresholds for severe multicollinearity. In contrast, relatively high VIF values were observed for several precipitation-related indices, particularly Extreme and PRCPTOT, reflecting the inherent statistical dependence among precipitation amount, frequency, and intensity metrics. This collinearity introduces potential uncertainty into the TreeSHAP marginal attributions, requiring caution when disentangling individual driver contributions.
Across the study area, grasslands occupy an absolute dominant position, covering 58.8% of the area and contributing 73.5% of total GPP, whereas trees (0.2%) and shrubs (1.9%) are locally constrained (Figure 10k). Nonetheless, these plant functional types exhibit distinct sensitivities and behavioral modes under diverse precipitation and environmental forcing. For shrubs, although the absolute SHAP values for SM and VPD are moderate (0.675 and 0.674, respectively), their relative contributions are exceptionally high at 18.32% and 18.28%. Conversely, SM exerts the absolute highest driving force on trees (1.536), yet its relative contribution is limited to 4.27% due to their high baseline productivity. Notably, temperature (TEMP) outranks VPD in driving tree GPP; because trees primarily populate regions with sufficient deep-soil water resources, thermal availability rather than atmospheric aridity dominates their carbon assimilation. For grasslands, both the absolute value (0.982) and relative proportion (7.88%) of SM driving force remain prominently high, significantly outstripping TEMP and RAD. This underscores that grasslands heavily rely on shallow soil moisture, showing a direct and unconfounded vegetative response where precipitation-induced shallow SM replenishment and alleviated atmospheric aridity immediately dictate seasonal productivity.
Figure 10.
TreeSHAP-based importance assessment of climatic drivers of vegetation productivity. (a–j) SHAP dependence plots illustrating the relationships between individual climatic drivers and GPP anomalies. (k) Areal proportions and total GPP contribution rates across different vegetation types within the study area. (l) Mean absolute SHAP values (Mean SHAP) of each climatic driver for Tree, Shrub, and Grass categories.
Cross-comparisons of the SHAP dependence plots reveal pronounced, non-linear tipping points in vegetative responses to hydroclimatic anomalies (Figure 10a–j). The GPP response to SM exhibits a classic inverse S-shaped curve: within the SM anomaly range of [−0.03, 0.05], SHAP marginal benefits rise sharply and linearly with moisture accrual; when negative SM anomalies exceed −0.03, the curve plateaus into a negative saturation zone, indicating that severe soil desiccation triggers physiological drought and suppresses productivity to its baseline. Beyond a positive SM anomaly of 0.05, the curve flattens out (with SHAP values stabilizing between 2.5 and 5.0), suggesting that excess water ceases to yield additional photosynthetic gains and may coincide with radiation deficits from persistent cloud cover. Concurrently, VPD anomalies display a typical negative correlation with GPP; negative VPD anomalies (<−0.5) exert a strong positive pull on GPP due to low evaporative demand, whereas positive anomalies exceeding the critical threshold of 0 cause SHAP values to plunge into negative terrain, capturing the immediate constraints of drought-induced stomatal closure on carbon fixation. Among precipitation-derived metrics, PRCPTOT ranks fourth in absolute and relative importance (0.201, 1.20%) across all vegetation types, outperforming precipitation intensity and frequency (Figure 10l). The peaked response of trees to CDD stems from their distribution in humid microclimates where absolute CDD anomalies are low, allowing them to benefit from the enhanced radiation and thermal accumulation during short dry spells. This dynamic also elucidates the V-shaped response to CWD, highlighting that tree-dominated ecosystems react negatively to excessive rainfall frequency but respond positively to discrete precipitation intensity.
4.3. Uncertainties in Ecohydrological Modeling and Data Integration
Several uncertainties should be considered when interpreting the ecohydrological responses identified in this study. First, although precipitation-event metrics such as R1mm and CWD were derived from daily precipitation data, the GPP response was evaluated at an 8-day temporal resolution to match the available GPP products. This temporal mismatch may smooth short-lived physiological responses occurring within individual precipitation events and therefore limits our ability to resolve sub-8-day pulse–response dynamics. Future studies using daily or sub-daily vegetation productivity observations could further resolve these rapid responses.
Second, the deep soil moisture used in this study was derived from ERA5-Land and should therefore be interpreted as a modeled representation of subsurface water availability rather than direct field observations. In particular, uncertainties may arise from the representation of vertical water percolation, groundwater interactions, and lateral water redistribution in hyper-arid environments. The absence of extensive deep soil-moisture observations across Central Asia also limits direct validation of the proposed precipitation–deep soil moisture–GPP pathway.
Third, spatial aggregation to the common grid introduces uncertainties associated with sub-grid land-cover heterogeneity, particularly in complex mountainous regions such as the Tianshan Mountains. Although the native 500 m MCD12Q1 land-cover data were used to construct a high-resolution vegetation mask before GPP aggregation, and grid cells with a vegetation fraction below 20% were excluded, a 0.1°grid still represents an area of approximately 10 km and may contain substantial heterogeneity in vegetation cover, elevation, land-cover composition, and snow/ice or exposed barren surfaces. The vegetation-fraction screening reduces the potential dilution of GPP signals by predominantly non-vegetated surfaces, but cannot completely resolve fine-scale spatial contrasts within individual 0.1°cells. Consequently, the aggregated GPP anomalies should be interpreted as representative of the vegetation-dominated fraction of each valid grid cell rather than as spatially homogeneous ecosystem responses. This scale-related uncertainty may be particularly relevant when interpreting localized responses in high-elevation and topographically heterogeneous environments.
Fourth, uncertainties associated with GPP products require careful consideration in dryland ecosystems. MOD17A2H has known limitations in sparsely vegetated arid and semi-arid environments, where strong soil-background effects, FPAR retrieval errors, and light-use efficiency (LUE) parameterization constraints often lead to systematic underestimations of absolute GPP. To reduce dependence on a single retrieval framework, we used a weighted ensemble combining MOD17A2H and GOSIF GPP. Evaluating product-specific sensitivities via separate SEA over t − 4 to t + 5 (Figure S1) revealed that while both products exhibited consistent temporal response trajectories, GOSIF captured a stronger response magnitude, particularly around t and t+ for frequency-related precipitation indicators (Figure S1c,d). This pattern reflects the heightened sensitivity of SIF-derived proxies to rapid physiological adjustments compared to LUE-based formulations. Because these differences were primarily reflected in response magnitude rather than the direction or timing of the response, relying on deseasonalized and standardized ensemble GPP anomalies effectively minimizes sensitivity to persistent absolute biases while capturing robust relative productivity dynamics. Nevertheless, as short-term response magnitudes remain product-dependent and standardization cannot fully eliminate time-varying stress biases during extreme droughts, our findings should be interpreted in terms of relative ecosystem dynamics rather than absolute carbon fluxes, underscoring the need for future flux-tower validation and higher-frequency GPP evaluations.
Finally, the study region encompasses both mountainous ecosystems, where vegetation productivity is often sensitive to solar radiation, and extensive arid/semi-arid ecosystems, where atmospheric and soil-water availability exert primary controls. In our integrated model, the direct path coefficient from RAD to GPP was relatively low (0.125). This modest coefficient primarily arises because the regional-average CB-SEM aggregates spatially contrasting relationships across the study domain, potentially dampening the direct effect of RAD in radiation-limited sub-regions. Furthermore, because RAD is physiologically and physically coupled with TEMP, VPD, and SM, a substantial portion of the radiation influence is conveyed indirectly through these covarying drivers, while the linear formulation of CB-SEM may fail to capture non-linear physiological responses such as light saturation. Consequently, spatial heterogeneity, non-linear dynamics, and complex environmental interactions remain partially smoothed by a single domain-wide linear structure, highlighting the need for future research to leverage climate-zone-specific modeling, non-linear structural approaches, and process-based ecohydrological models to fully disentangle these localized mechanisms.
4.4. Ecohydrological Mechanisms Driving Central Asian Vegetation Productivity Under Future Warming
In summary, our findings demonstrate that high-frequency precipitation dominates the short-term rapid escalation of dryland vegetation productivity by providing immediate relief from atmospheric VPD. The core of this mechanism resides in the atmosphere–vegetation interface feedback, where an increased number of rainy days suppresses VPD and rapidly transitions plant stomata from closed to open states—serving as the primary catalyst for the episodic growth spurts typical of herbaceous-dominated arid ecosystems (Figure 6a). Conversely, high-intensity precipitation sustains the medium-to-long-term stable growth of vegetation productivity through the storage and slow-release dynamics of the soil reservoir. Heavy intensity pulses generate effective deep-layer soil water reserves that interact synergistically with recovering TEMP and solar radiation post-event, providing a continuous moisture supply to support prolonged photosynthetic activity and sustain elevated productivity.
Under global warming, the synchronous intensification of Central Asian precipitation frequency and intensity drives sustained growth of the regional GPP by coupling short-term atmospheric relief with long-term soil hydrological memory. Our findings demonstrate that this co-intensification yields a dual dividend, simultaneously mitigating VPD and replenishing SM, to unlock a leapfrog enhancement in ecosystem productivity. Consequently, we conclude that shifting precipitation regimes are profoundly reshaping dryland ecohydrological dynamics; increasing precipitation frequency and intensity co-drive substantial increases in Central Asian vegetative carbon assimilation via this coupled atmosphere–soil pathway. This mechanism not only provides a novel framework for understanding the non-linear responses of dryland carbon cycling to climate change, but also suggests that if this synergistic trend persists, it will overturn the conventional paradigm of drylands as regions of marginal productivity, transforming them into critical hotspots for global gross carbon uptake.
5. Conclusions
This study quantified the response pathways of dryland vegetation productivity to changing precipitation characteristics across Central Asia from 2000 to 2024 by integrating multi-source satellite remote sensing, reanalysis ensemble data, and dynamic modeling frameworks. The findings demonstrate that synchronous increases in precipitation frequency and intensity exert a significant synergistic control, triggering a dual ecohydrological dividend that drives substantial productivity enhancements in vulnerable dryland ecosystems. Increased precipitation frequency drives rapid short-term productivity pulses by promptly mitigating atmospheric vapor pressure deficit and plant moisture stress. Conversely, enhanced precipitation intensity sustains medium-to-long-term productivity stability by providing a persistent hydrological buffer through deep soil moisture recharge and gradual release. This temporal and spatial pathway bifurcation reveals how atmospheric relief and soil moisture memory jointly modulate dryland carbon assimilation under an accelerating hydrological cycle. These insights establish a refined process-level framework for dryland carbon–water coupling, emphasizing the need to incorporate multi-dimensional precipitation regimes into satellite monitoring and dynamic vegetation models to improve future climate resilience assessments.
Supplementary Materials
The following supporting information can be downloaded at https://www.mdpi.com/article/10.3390/rs18203449/s1, Figure S1. Comparison of GPP response trajectories and differences between GOSIF and MOD17A2H under SEA lag periods across various precipitation indices. Figure S2. Multicollinearity evaluation of predictor variables used in the Random Forest (RF) model, including precipitation-related indices (PRCPTOT, CDD, CWD, Extreme, R1mm, and SDII) and environmental drivers (SM, VPD, TEMP, and RAD).
Author Contributions
Conceptualization, H.Z. and C.Z.; methodology, H.Z.; software, H.Z.; validation, H.Z., Y.C. and C.Z.; formal analysis, H.Z.; investigation, H.Z.; resources, Y.L. (Yongchang Liu); data curation, Y.L. (Yupeng Li) and J.W.; writing—original draft preparation, H.Z.; writing—review and editing, Y.C. and C.Z.; visualization, Y.L. (Yupeng Li) and J.J.; supervision, Z.L.; project administration, G.F.; funding acquisition, Y.C. and C.Z. All authors have read and agreed to the published version of the manuscript.
Funding
The research is supported by the National Natural Science Foundation of China (W2412135) and the Tianshan Yingcai Program of Xinjiang Uygur Autonomous Region, China (2024TSYCCX0052).
Data Availability Statement
Data will be made available on request.
Acknowledgments
We are sincerely grateful to the reviewers and editors for their constructive comments for the improvement of the manuscript.
Conflicts of Interest
The authors declare no conflicts of interest.
References
- Wentz, F.J.; Ricciardulli, L.; Hilburn, K.; Mears, C. How Much More Rain Will Global Warming Bring? Science 2007, 317, 233–235. [Google Scholar] [CrossRef] [Scilit] [PubMed]
- Zhang, W.; Furtado, K.; Wu, P.; Zhou, T.; Chadwick, R.; Marzin, C.; Rostron, J.; Sexton, D. Increasing Precipitation Variability on Daily-to-Multiyear Time Scales in a Warmer World. Sci. Adv. 2021, 7, eabf8021. [Google Scholar] [CrossRef] [Scilit] [PubMed]
- Allan, R.P.; Soden, B.J. Atmospheric Warming and the Amplification of Precipitation Extremes. Science 2008, 321, 1481–1484. [Google Scholar] [CrossRef] [Scilit] [PubMed]
- Lenderink, G.; van Meijgaard, E. Increase in Hourly Precipitation Extremes beyond Expectations from Temperature Changes. Nat. Geosci. 2008, 1, 511–514. [Google Scholar] [CrossRef] [Scilit]
- Guerreiro, S.B.; Fowler, H.J.; Barbero, R.; Westra, S.; Lenderink, G.; Blenkinsop, S.; Lewis, E.; Li, X.-F. Detection of Continental-Scale Intensification of Hourly Rainfall Extremes. Nat. Clim. Change 2018, 8, 803–807. [Google Scholar] [CrossRef] [Scilit]
- Yuan, W.; Zheng, Y.; Piao, S.; Ciais, P.; Lombardozzi, D.; Wang, Y.; Ryu, Y.; Chen, G.; Dong, W.; Hu, Z.; et al. Increased Atmospheric Vapor Pressure Deficit Reduces Global Vegetation Growth. Sci. Adv. 2019, 5, eaax1396. [Google Scholar] [CrossRef] [Scilit] [PubMed]
- Liu, Y.; Zhang, Y.; Peñuelas, J.; Kannenberg, S.A.; Gong, H.; Yuan, W.; Wu, C.; Zhou, S.; Piao, S. Drought Legacies Delay Spring Green-up in Northern Ecosystems. Nat. Clim. Change 2025, 15, 444–451. [Google Scholar] [CrossRef] [Scilit]
- Sun, W.; Zhou, S.; Yu, B.; Zhang, Y.; Keenan, T.; Fu, B. Soil Moisture-Atmosphere Interactions Drive Terrestrial Carbon-Water Trade-Offs. Commun. Earth Environ. 2025, 6, 169. [Google Scholar] [CrossRef] [Scilit]
- Ritter, F.; Berkelhammer, M.; Garcia, C. Distinct Response of Gross Primary Productivity in Five Terrestrial Biomes to Precipitation Variability. Commun. Earth Environ. 2020, 1, 34, Correction in Commun. Earth Environ. 2023, 4, 322. https://doi.org/10.1038/s43247-023-00962-8. [Google Scholar] [CrossRef] [Scilit]
- Feldman, A.F. The Pulse of Global Vegetation: Do Individual Rainfall Events Create a Lasting Imprint on Photosynthesis? New Phytol. 2025, 249, 736–743. [Google Scholar] [CrossRef] [Scilit] [PubMed]
- Gherardi, L.A.; Sala, O.E. Effect of Interannual Precipitation Variability on Dryland Productivity: A Global Synthesis. Glob. Change Biol. 2019, 25, 269–276. [Google Scholar] [CrossRef] [Scilit] [PubMed]
- Thomey, M.L.; Collins, S.L.; Vargas, R.; Johnson, J.E.; Brown, R.F.; Natvig, D.O.; Friggens, M.T. Effect of Precipitation Variability on Net Primary Production and Soil Respiration in a Chihuahuan Desert Grassland. Glob. Change Biol. 2011, 17, 1505–1515. [Google Scholar] [CrossRef] [Scilit]
- Zhang, X.; Wang, X.; Zohner, C.M.; Peñuelas, J.; Li, Y.; Wu, X.; Zhang, Y.; Liu, H.; Shen, P.; Jia, X.; et al. Declining Precipitation Frequency May Drive Earlier Leaf Senescence by Intensifying Drought Stress and Enhancing Drought Acclimation. Nat. Commun. 2025, 16, 910. [Google Scholar] [CrossRef] [Scilit] [PubMed]
- Novick, K.A.; Ficklin, D.L.; Stoy, P.C.; Williams, C.A.; Bohrer, G.; Oishi, A.C.; Papuga, S.A.; Blanken, P.D.; Noormets, A.; Sulman, B.N.; et al. The Increasing Importance of Atmospheric Demand for Ecosystem Water and Carbon Fluxes. Nat. Clim. Change 2016, 6, 1023–1027. [Google Scholar] [CrossRef] [Scilit]
- Liu, L.; Gudmundsson, L.; Hauser, M.; Qin, D.; Li, S.; Seneviratne, S.I. Soil Moisture Dominates Dryness Stress on Ecosystem Production Globally. Nat. Commun. 2020, 11, 4892. [Google Scholar] [CrossRef] [Scilit] [PubMed]
- Humphrey, V.; Berg, A.; Ciais, P.; Gentine, P.; Jung, M.; Reichstein, M.; Seneviratne, S.I.; Frankenberg, C. Soil Moisture–Atmosphere Feedback Dominates Land Carbon Uptake Variability. Nature 2021, 592, 65–69. [Google Scholar] [CrossRef] [Scilit] [PubMed]
- Huxman, T.E.; Smith, M.D.; Fay, P.A.; Knapp, A.K.; Shaw, M.R.; Loik, M.E.; Smith, S.D.; Tissue, D.T.; Zak, J.C.; Weltzin, J.F.; et al. Convergence across Biomes to a Common Rain-Use Efficiency. Nature 2004, 429, 651–654. [Google Scholar] [CrossRef] [Scilit] [PubMed]
- Dong, P.; Jing, C.; Wang, G.; Shao, Y. Rapid Expansion of Global Shrub Encroachment across Aridity Gradients and Its Effects on Vegetation Dynamics. Remote Sens. 2026, 18, 1749. [Google Scholar] [CrossRef] [Scilit]
- Wu, D.; Ciais, P.; Viovy, N.; Knapp, A.K.; Wilcox, K.; Bahn, M.; Smith, M.D.; Vicca, S.; Fatichi, S.; Zscheischler, J.; et al. Asymmetric Responses of Primary Productivity to Altered Precipitation Simulated by Ecosystem Models across Three Long-Term Grassland Sites. Biogeosciences 2018, 15, 3421–3437. [Google Scholar] [CrossRef] [Scilit]
- Kulmatiski, A.; Holdrege, M.C.; Chirvasă, C.; Beard, K.H. Root Distributions Predict Shrub–Steppe Responses to Precipitation Intensity. Biogeosciences 2024, 21, 131–143. [Google Scholar] [CrossRef] [Scilit]
- Pu, J.; Chang, Y.; Winkler, A.J.; Zuo, Z.; Chen, C.; Knyazikhin, Y.; Myneni, R.B. Large Gains in Leaf Scale Photosynthetic Rates of Sparsely Vegetated Arid and Semi-Arid Lands. Commun. Earth Environ. 2025, 7, 97. [Google Scholar] [CrossRef] [Scilit]
- Zhu, Z.; Piao, S.; Myneni, R.B.; Huang, M.; Zeng, Z.; Canadell, J.G.; Ciais, P.; Sitch, S.; Friedlingstein, P.; Arneth, A.; et al. Greening of the Earth and Its Drivers. Nat. Clim. Change 2016, 6, 791–795. [Google Scholar] [CrossRef] [Scilit]
- Li, X.; Wu, T.; Xia, K.; Tang, H.; Wang, X.; Wang, S. Increased Precipitation Has Not Synchronously Enhanced Vegetation Carbon Sequestration Rate along the Aridity Gradient. GISci. Remote Sens. 2026, 63, 2665916. [Google Scholar] [CrossRef] [Scilit]
- Zhong, Y.; Shi, X.; Yang, H.; Wilson, D.J.; Hein, J.R.; Kaboth-Bahr, S.; Lu, Z.; Clift, P.D.; Yan, Q.; Lohmann, G.; et al. Humidification of Central Asia and Equatorward Shifts of Westerly Winds since the Late Pliocene. Commun. Earth Environ. 2022, 3, 274. [Google Scholar] [CrossRef] [Scilit]
- Knapp, A.K.; Fay, P.A.; Blair, J.M.; Collins, S.L.; Smith, M.D.; Carlisle, J.D.; Harper, C.W.; Danner, B.T.; Lett, M.S.; McCarron, J.K. Rainfall Variability, Carbon Cycling, and Plant Species Diversity in a Mesic Grassland. Science 2002, 298, 2202–2205. [Google Scholar] [CrossRef] [Scilit] [PubMed]
- Knapp, A.K.; Beier, C.; Briske, D.D.; Classen, A.T.; Luo, Y.; Reichstein, M.; Smith, M.D.; Smith, S.D.; Bell, J.E.; Fay, P.A.; et al. Consequences of More Extreme Precipitation Regimes for Terrestrial Ecosystems. Bioscience 2008, 58, 811–821. [Google Scholar] [CrossRef] [Scilit]
- Zeppel, M.J.B.; Wilks, J.V.; Lewis, J.D. Impacts of Extreme Precipitation and Seasonal Changes in Precipitation on Plants. Biogeosciences 2014, 11, 3083–3093. [Google Scholar] [CrossRef] [Scilit]
- Feldman, A.F.; Feng, X.; Felton, A.J.; Konings, A.G.; Knapp, A.K.; Biederman, J.A.; Poulter, B. Plant Responses to Changing Rainfall Frequency and Intensity. Nat. Rev. Earth Environ. 2024, 5, 276–294. [Google Scholar] [CrossRef] [Scilit]
- Sala, O.E.; Lauenroth, W.K. Small Rainfall Events: An Ecological Role in Semiarid Regions. Oecologia 1982, 53, 301–304. [Google Scholar] [CrossRef] [Scilit] [PubMed]
- Peng, S.; Piao, S.; Shen, Z.; Ciais, P.; Sun, Z.; Chen, S.; Bacour, C.; Peylin, P.; Chen, A. Precipitation Amount, Seasonality and Frequency Regulate Carbon Cycling of a Semi-Arid Grassland Ecosystem in Inner Mongolia, China: A Modeling Analysis. Agric. For. Meteorol. 2013, 178–179, 46–55. [Google Scholar] [CrossRef] [Scilit]
- Didiano, T.J.; Johnson, M.T.J.; Duval, T.P. Disentangling the Effects of Precipitation Amount and Frequency on the Performance of 14 Grassland Species. PLoS ONE 2016, 11, e0162310. [Google Scholar] [CrossRef] [Scilit] [PubMed]
- Gong, Y.-H.; Zhao, D.-M.; Ke, W.-B.; Fang, C.; Pei, J.-Y.; Sun, G.-J.; Ye, J.-S. Legacy effects of precipitation amount and frequency on the aboveground plant biomass of a semi-arid grassland. Sci. Total Environ. 2020, 705, 135899. [Google Scholar] [CrossRef] [Scilit] [PubMed]
- Frank, D.; Reichstein, M.; Bahn, M.; Thonicke, K.; Frank, D.; Mahecha, M.D.; Smith, P.; van der Velde, M.; Vicca, S.; Babst, F.; et al. Effects of Climate Extremes on the Terrestrial Carbon Cycle: Concepts, Processes and Potential Future Impacts. Glob. Change Biol. 2015, 21, 2861–2880. [Google Scholar] [CrossRef] [Scilit] [PubMed]
- Dannenberg, M.P.; Wise, E.K.; Smith, W.K. Reduced Tree Growth in the Semiarid United States Due to Asymmetric Responses to Intensifying Precipitation Extremes. Sci. Adv. 2019, 5, eaaw0667. [Google Scholar] [CrossRef] [Scilit] [PubMed]
- Menne, M.J.; Durre, I.; Vose, R.S.; Gleason, B.E.; Houston, T.G. An Overview of the Global Historical Climatology Network-Daily Database. J. Atmos. Ocean. Technol. 2012, 29, 897–910. [Google Scholar] [CrossRef] [Scilit]
- Hersbach, H.; Bell, B.; Berrisford, P.; Hirahara, S.; Horányi, A.; Muñoz-Sabater, J.; Nicolas, J.; Peubey, C.; Radu, R.; Schepers, D.; et al. The ERA5 Global Reanalysis. Q. J. R. Meteorol. Soc. 2020, 146, 1999–2049. [Google Scholar] [CrossRef] [Scilit]
- Saha, S.; Moorthi, S.; Pan, H.-L.; Wu, X.; Wang, J.; Nadiga, S.; Tripp, P.; Kistler, R.; Woollen, J.; Behringer, D.; et al. The NCEP Climate Forecast System Reanalysis. Bull. Am. Meteorol. Soc. 2010, 91, 1015–1058. [Google Scholar] [CrossRef] [Scilit]
- Gelaro, R.; McCarty, W.; Suárez, M.J.; Todling, R.; Molod, A.; Takacs, L.; Randles, C.A.; Darmenov, A.; Bosilovich, M.G.; Reichle, R.; et al. The Modern-Era Retrospective Analysis for Research and Applications, Version 2 (MERRA-2). J. Clim. 2017, 30, 5419–5454. [Google Scholar] [CrossRef] [Scilit] [PubMed]
- Skofronick-Jackson, G.; Petersen, W.A.; Berg, W.; Kidd, C.; Stocker, E.F.; Kirschbaum, D.B.; Kakar, R.; Braun, S.A.; Huffman, G.J.; Iguchi, T.; et al. The Global Precipitation Measurement (GPM) Mission for Science and Society. Bull. Am. Meteorol. Soc. 2017, 98, 1679–1695. [Google Scholar] [CrossRef] [Scilit] [PubMed]
- Kubota, T.; Aonashi, K.; Ushio, T.; Shige, S.; Takayabu, Y.N.; Kachi, M.; Arai, Y.; Tashima, T.; Masaki, T.; Kawamoto, N.; et al. Global Satellite Mapping of Precipitation (GSMaP) Products in the GPM Era. In Satellite Precipitation Measurement: Volume 1; Levizzani, V., Kidd, C., Kirschbaum, D.B., Kummerow, C.D., Nakamura, K., Turk, F.J., Eds.; Springer International Publishing: Cham, Switzerland, 2020; pp. 355–373. [Google Scholar]
- Joyce, R.J.; Janowiak, J.E.; Arkin, P.A.; Xie, P. CMORPH: A Method That Produces Global Precipitation Estimates from Passive Microwave and Infrared Data at High Spatial and Temporal Resolution. J. Hydrometeorol. 2004, 5, 487–503. [Google Scholar] [CrossRef] [Scilit]
- Beck, H.E.; Wood, E.F.; Pan, M.; Fisher, C.K.; Miralles, D.G.; van Dijk, A.I.J.M.; McVicar, T.R.; Adler, R.F. MSWEP V2 Global 3-Hourly 0.1° Precipitation: Methodology and Quantitative Assessment. Bull. Am. Meteorol. Soc. 2019, 100, 473–500. [Google Scholar] [CrossRef] [Scilit]
- Schneider, U.; Becker, A.; Finger, P.; Meyer-Christoffer, A.; Ziese, M.; Rudolf, B. GPCC’s New Land Surface Precipitation Climatology Based on Quality-Controlled in Situ Data and Its Role in Quantifying the Global Water Cycle. Theor. Appl. Climatol. 2014, 115, 15–40. [Google Scholar] [CrossRef] [Scilit]
- Running, S.W.; Nemani, R.R.; Heinsch, F.A.; Zhao, M.; Reeves, M.; Hashimoto, H. A Continuous Satellite-Derived Measure of Global Terrestrial Primary Production. Bioscience 2004, 54, 547–560. [Google Scholar] [CrossRef] [Scilit]
- Li, X.; Xiao, J. Mapping Photosynthesis Solely from Solar-Induced Chlorophyll Fluorescence: A Global, Fine-Resolution Dataset of Gross Primary Production Derived from OCO-2. Remote Sens. 2019, 11, 2563. [Google Scholar] [CrossRef] [Scilit]
- Sulla-Menashe, D.; Gray, J.M.; Abercrombie, S.P.; Friedl, M.A. Hierarchical Mapping of Annual Global Land Cover 2001 to Present: The MODIS Collection 6 Land Cover Product. Remote Sens. Environ. 2019, 222, 183–194. [Google Scholar] [CrossRef] [Scilit]
- Loveland, T.R.; Reed, B.C.; Brown, J.F.; Ohlen, D.O.; Zhu, Z.; Yang, L.; Merchant, J.W. Development of a Global Land Cover Characteristics Database and IGBP DISCover from 1 Km AVHRR Data. Int. J. Remote Sens. 2000, 21, 1303–1330. [Google Scholar] [CrossRef] [Scilit]
- Muñoz-Sabater, J.; Dutra, E.; Agustí-Panareda, A.; Albergel, C.; Arduini, G.; Balsamo, G.; Boussetta, S.; Choulga, M.; Harrigan, S.; Hersbach, H.; et al. ERA5-Land: A State-of-the-Art Global Reanalysis Dataset for Land Applications. Earth Syst. Sci. Data 2021, 13, 4349–4383. [Google Scholar] [CrossRef] [Scilit]
- Weirich-Benet, E.; Pyrina, M.; Jiménez-Esteve, B.; Fraenkel, E.; Cohen, J.; Domeisen, D.I.V. Subseasonal Prediction of Central European Summer Heatwaves with Linear and Random Forest Machine Learning Models. Artif. Intell. Earth Syst. 2023, 2, e220038. [Google Scholar] [CrossRef] [Scilit]
- Feldman, A.F.; Short Gianotti, D.J.; Konings, A.G.; Gentine, P.; Entekhabi, D. Patterns of Plant Rehydration and Growth Following Pulses of Soil Moisture Availability. Biogeosciences 2021, 18, 831–847. [Google Scholar] [CrossRef] [Scilit]
- Noy-Meir, I. Desert Ecosystems: Environment and Producers. Annu. Rev. Ecol. Syst. 1973, 4, 25–51. [Google Scholar] [CrossRef] [Scilit]
- Bai, Y.; Zhang, F.; Ciais, P.; Wigneron, J.-P.; Feldman, A.F.; Gentine, P.; Smith, W.K.; Biederman, J.A.; Scott, R.L.; Stoy, P.C.; et al. Widespread Enhancement of Ecosystem Carbon Fluxes during Post Moisture Pulse. Commun. Earth Environ. 2026, 7, 171. [Google Scholar] [CrossRef] [Scilit]
- Trenberth, K.E.; Zhang, Y.; Gehne, M. Intermittency in Precipitation: Duration, Frequency, Intensity, and Amounts Using Hourly Data. J. Hydrometeorol. 2017, 18, 1393–1412. [Google Scholar] [CrossRef] [Scilit]
- Bodesheim, P.; Jung, M.; Gans, F.; Mahecha, M.D.; Reichstein, M. Upscaled Diurnal Cycles of Land–Atmosphere Fluxes: A New Global Half-Hourly Data Product. Earth Syst. Sci. Data 2018, 10, 1327–1365. [Google Scholar] [CrossRef] [Scilit]
- Levine, R.A.; Wilks, D.S. Statistical Methods in the Atmospheric Sciences. J. Am. Stat. Assoc. 2000, 95, 344. [Google Scholar] [CrossRef] [Scilit]
- Maggioni, V.; Meyers, P.C.; Robinson, M.D. A Review of Merged High-Resolution Satellite Precipitation Product Accuracy during the Tropical Rainfall Measuring Mission (TRMM) Era. J. Hydrometeorol. 2016, 17, 1101–1117. [Google Scholar] [CrossRef] [Scilit]
- Mass, C.F.; Portman, D.A. Major Volcanic Eruptions and Climate: A Critical Evaluation. J. Clim. 1989, 2, 566–593. [Google Scholar] [CrossRef] [Scilit]
- Haurwitz, M.W.; Brier, G.W. A Critique of the Superposed Epoch Analysis Method: Its Application to Solar–Weather Relations. Mon. Weather Rev. 1981, 109, 2074–2079. [Google Scholar] [CrossRef] [Scilit]
- Swetnam, T.W. Fire History and Climate Change in Giant Sequoia Groves. Science 1993, 262, 885–889. [Google Scholar] [CrossRef] [Scilit] [PubMed]
- Anderegg, W.R.L.; Schwalm, C.; Biondi, F.; Camarero, J.J.; Koch, G.; Litvak, M.; Ogle, K.; Shaw, J.D.; Shevliakova, E.; Williams, A.P.; et al. Pervasive Drought Legacies in Forest Ecosystems and Their Implications for Carbon Cycle Models. Science 2015, 349, 528–532. [Google Scholar] [CrossRef] [Scilit] [PubMed]
- Piao, S.; Wang, X.; Park, T.; Chen, C.; Lian, X.; He, Y.; Bjerke, J.W.; Chen, A.; Ciais, P.; Tømmervik, H.; et al. Characteristics, Drivers and Feedbacks of Global Greening. Nat. Rev. Earth Environ. 2020, 1, 14–27. [Google Scholar] [CrossRef] [Scilit]
- Wei, W.; Zou, S.; Duan, W.; Chen, Y.; Li, S.; Zhou, Y. Spatiotemporal Variability in Extreme Precipitation and Associated Large-Scale Climate Mechanisms in Central Asia from 1950 to 2019. J. Hydrol. 2023, 620, 129417. [Google Scholar] [CrossRef] [Scilit]
- Jiang, L.; Jiapaer, G.; Bao, A.; Guo, H.; Ndayisaba, F. Vegetation Dynamics and Responses to Climate Change and Human Activities in Central Asia. Sci. Total Environ. 2017, 599–600, 967–980. [Google Scholar] [CrossRef] [Scilit] [PubMed]
- Feldman, A.F.; Konings, A.G.; Gentine, P.; Cattry, M.; Wang, L.; Smith, W.K.; Biederman, J.A.; Chatterjee, A.; Joiner, J.; Poulter, B. Large Global-Scale Vegetation Sensitivity to Daily Rainfall Variability. Nature 2024, 636, 380–384. [Google Scholar] [CrossRef] [Scilit] [PubMed]
- Zhang, C.; Chen, X.; Shao, H.; Chen, S.; Liu, T.; Chen, C.; Ding, Q.; Du, H. Evaluation and Intercomparison of High-Resolution Satellite Precipitation Estimates—GPM, TRMM, and CMORPH in the Tianshan Mountain Area. Remote Sens. 2018, 10, 1543. [Google Scholar] [CrossRef] [Scilit]
- Hu, Z.; Hu, Q.; Zhang, C.; Chen, X.; Li, Q. Evaluation of Reanalysis, Spatially Interpolated and Satellite Remotely Sensed Precipitation Data Sets in Central Asia. J. Geophys. Res. Atmos. 2016, 121, 5648–5663. [Google Scholar] [CrossRef] [Scilit]
- Adler, R.F.; Gu, G.; Sapiano, M.; Wang, J.-J.; Huffman, G.J. Global Precipitation: Means, Variations and Trends during the Satellite Era (1979–2014). Surv. Geophys. 2017, 38, 679–699. [Google Scholar] [CrossRef] [Scilit]
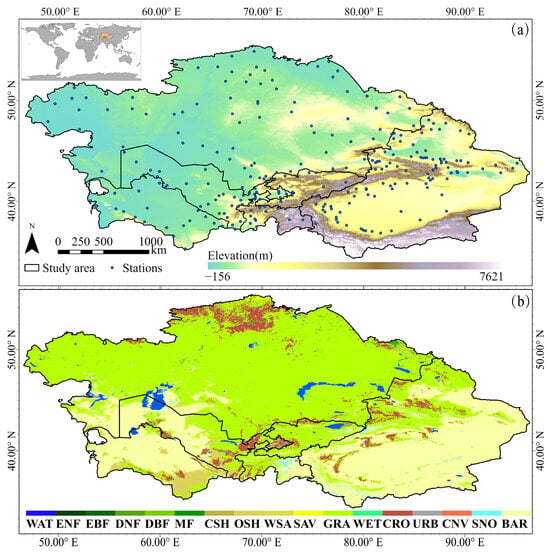
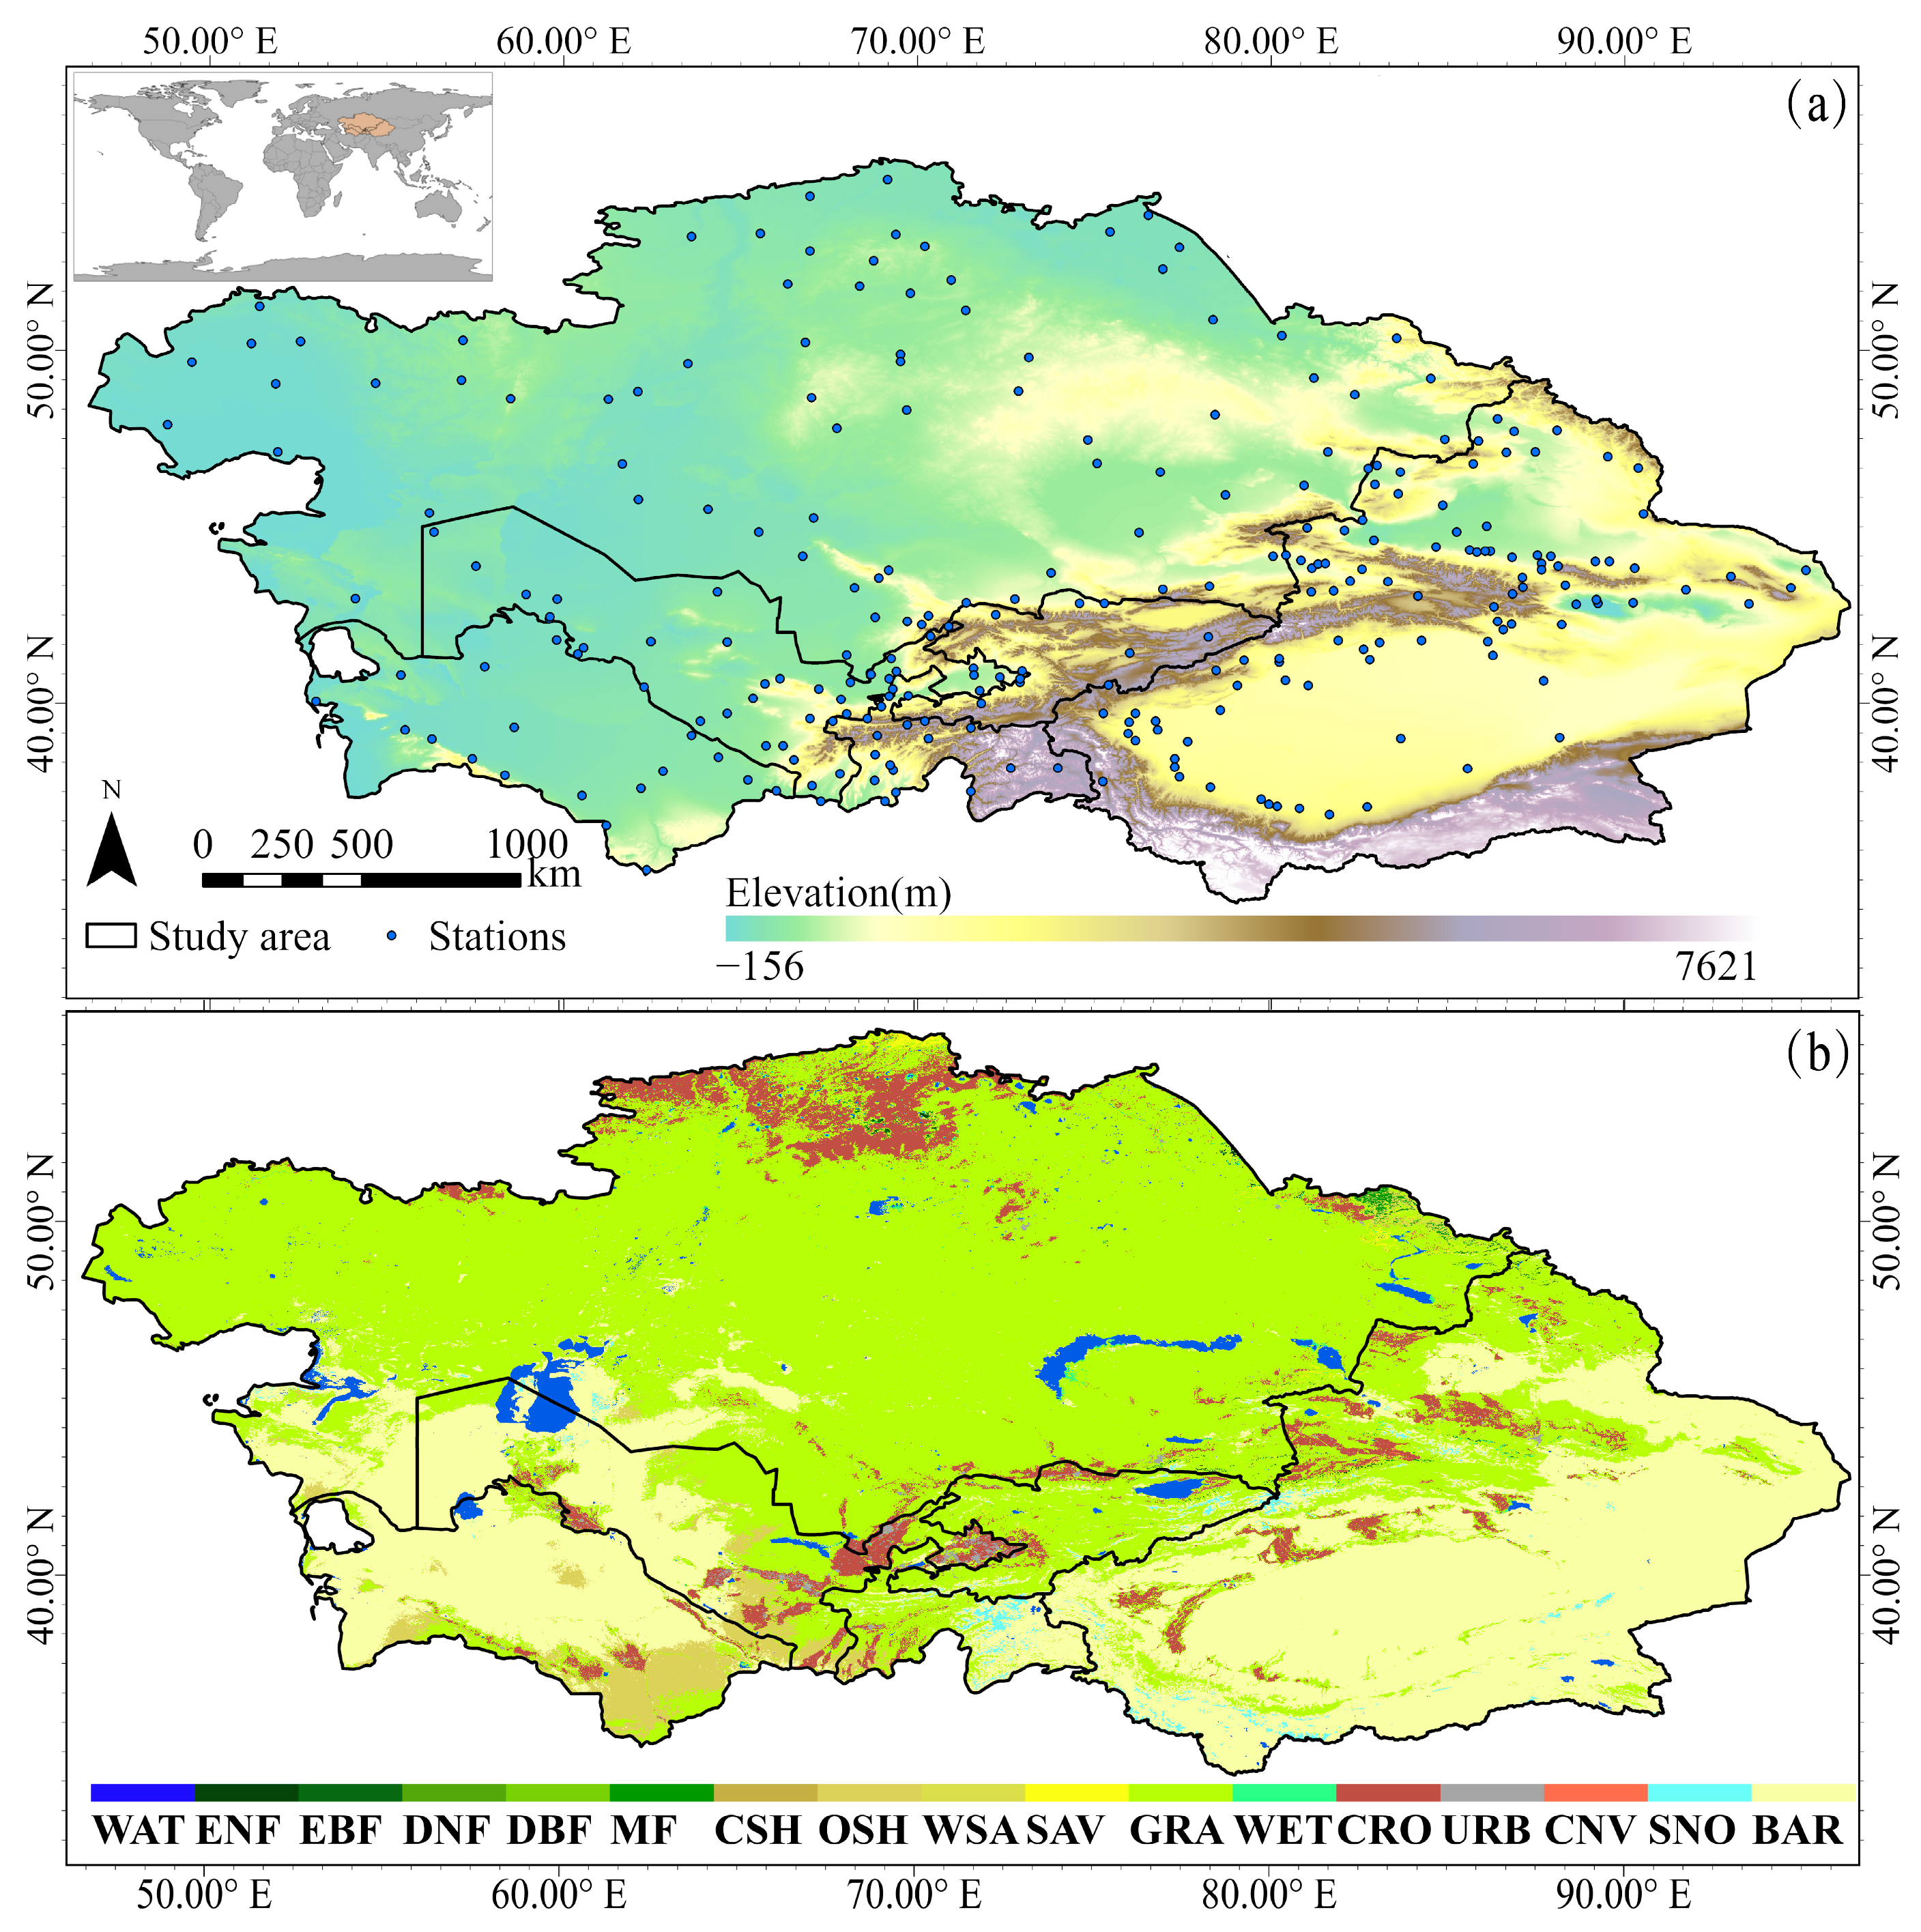
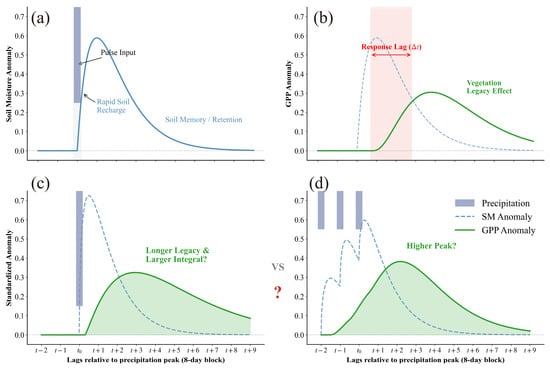
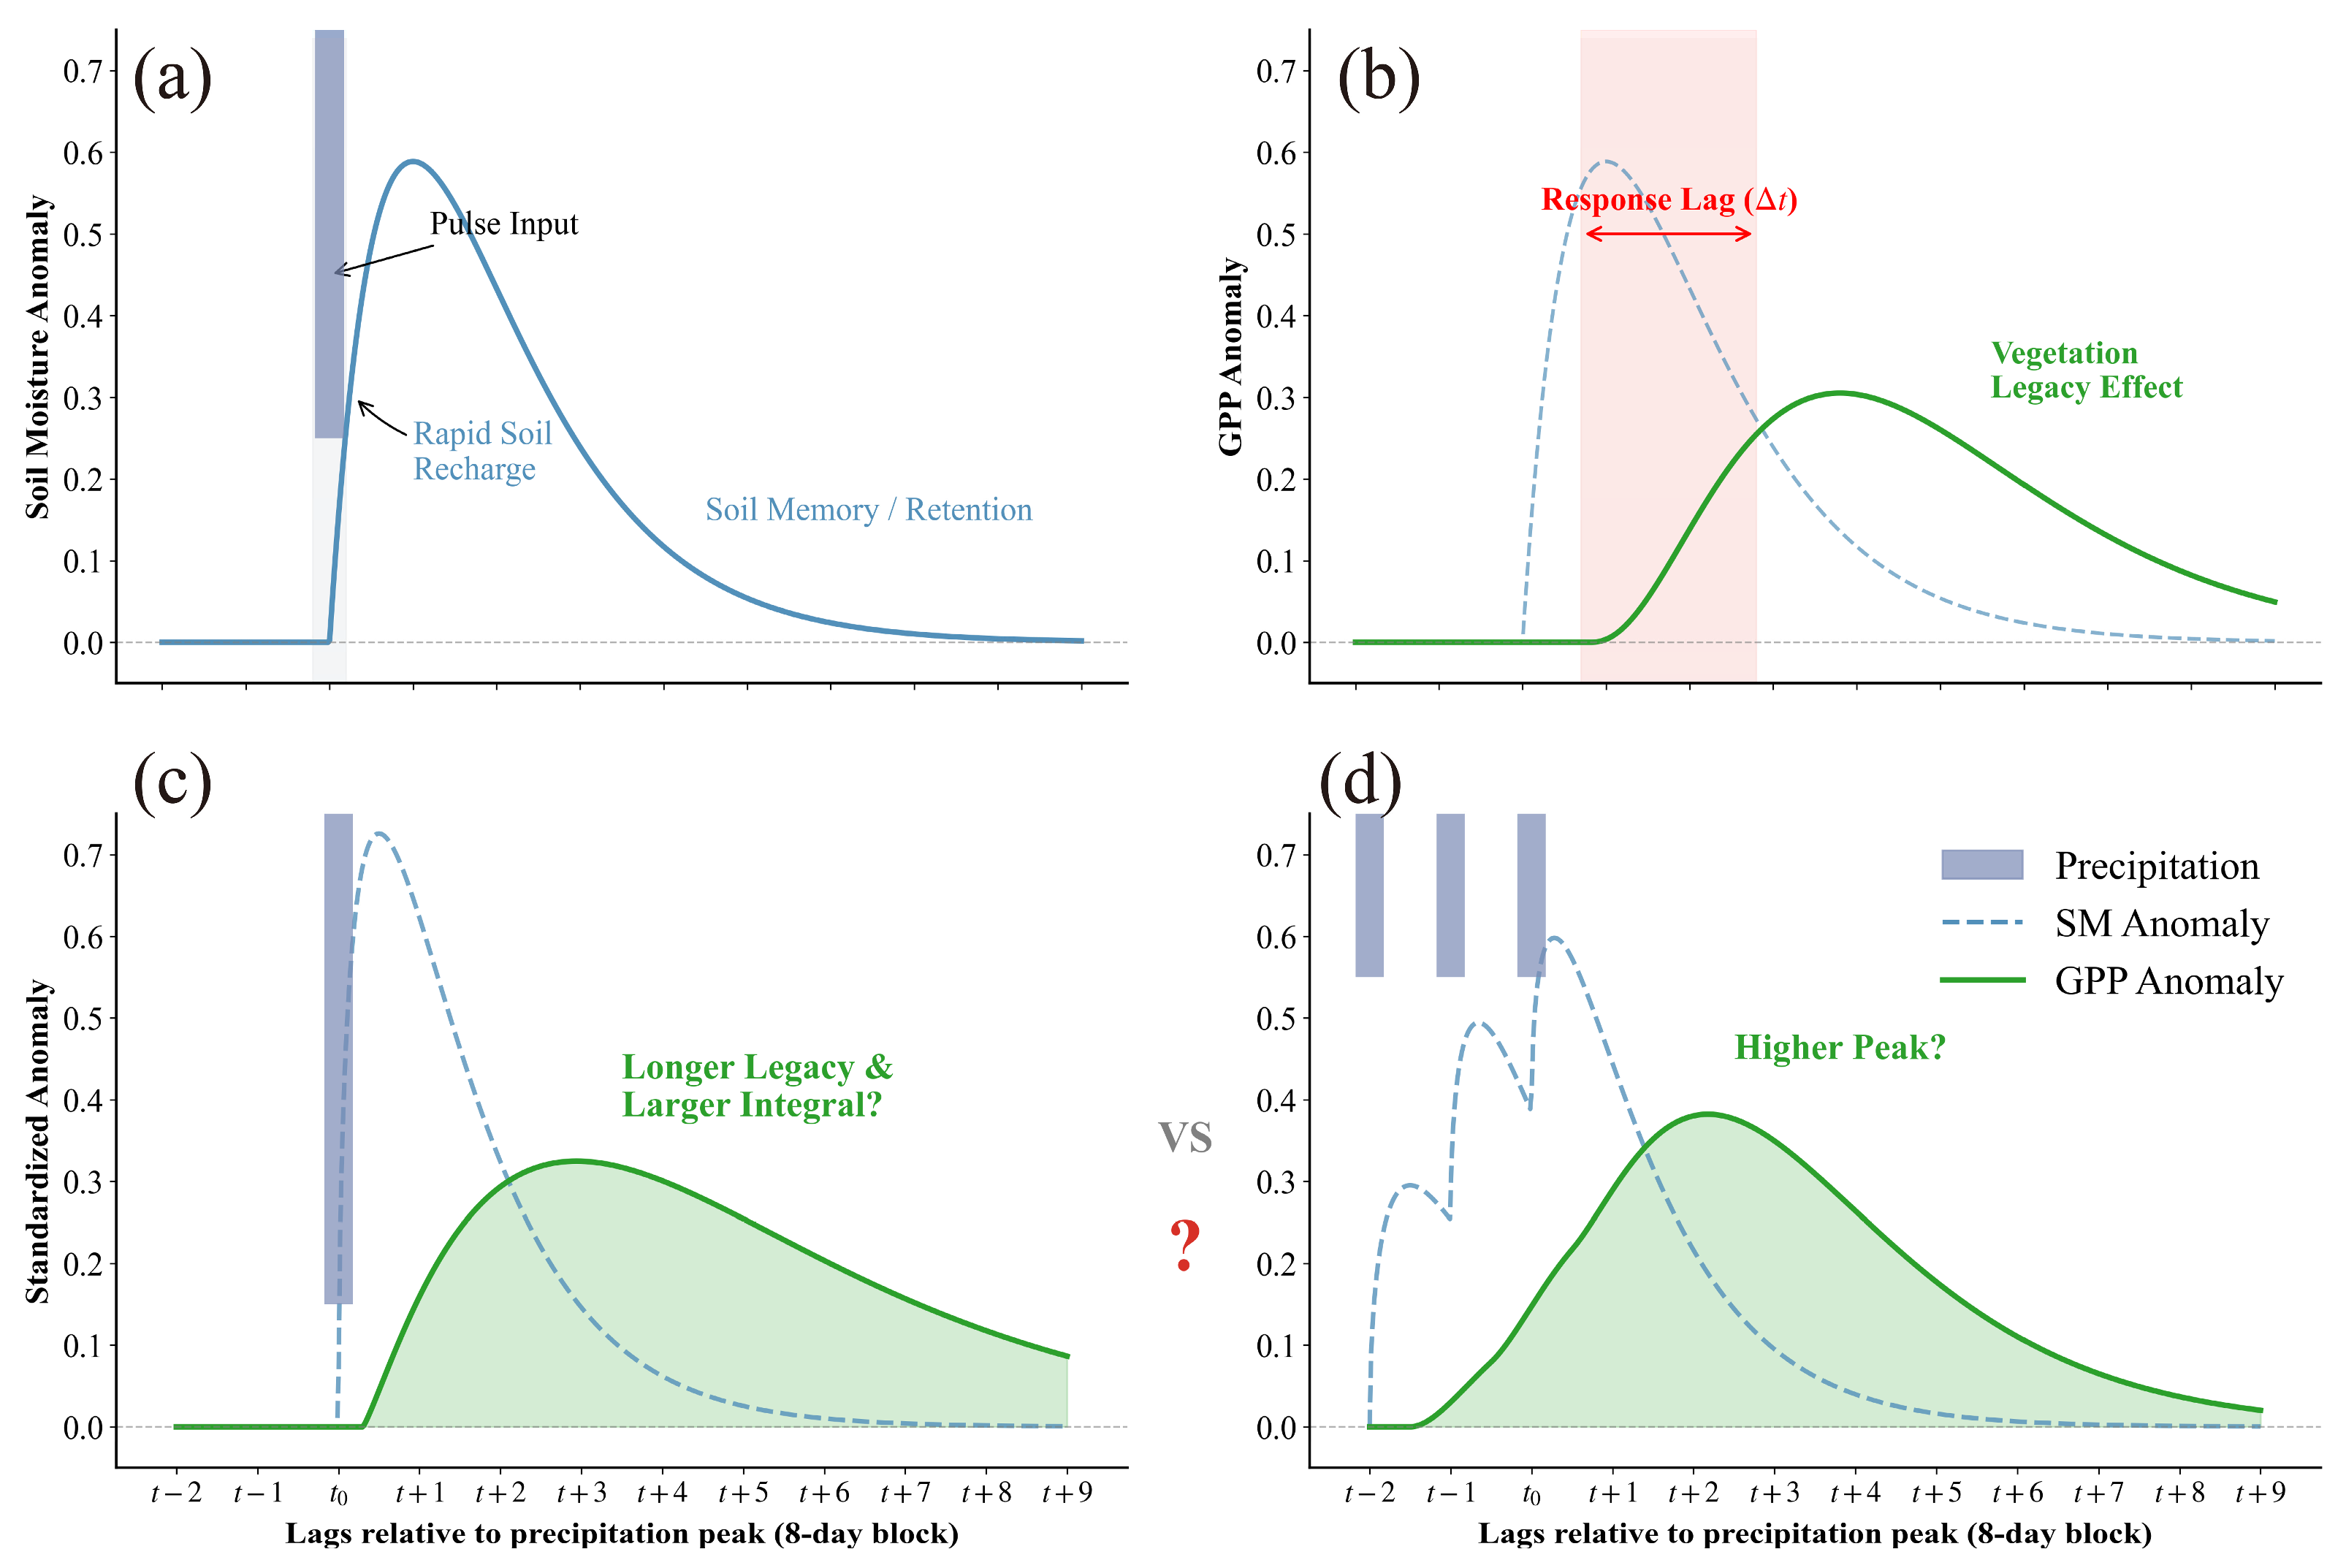
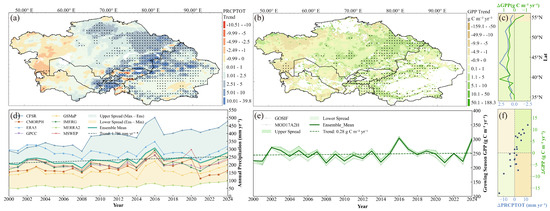
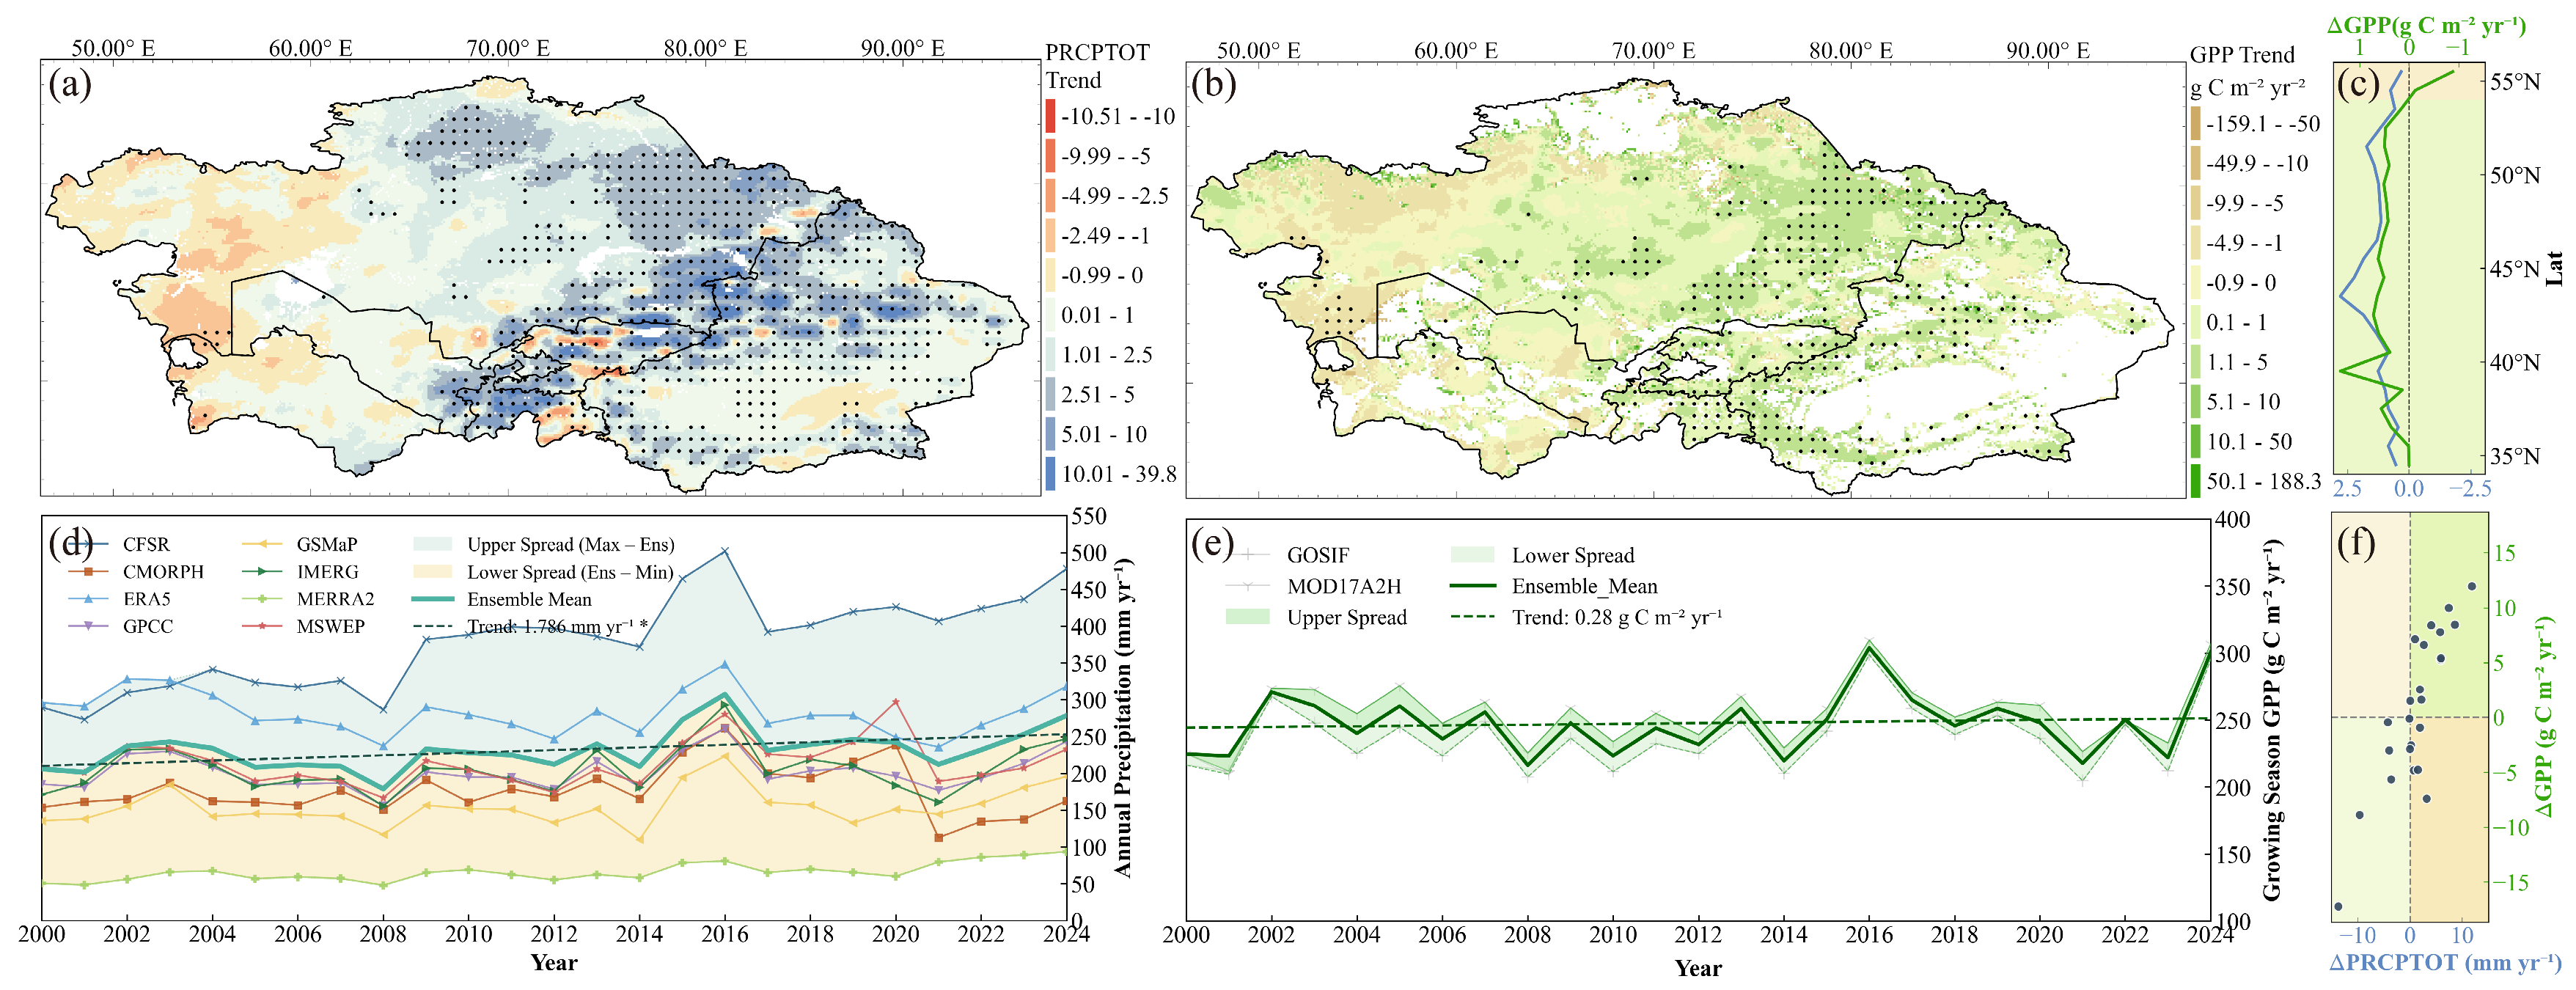
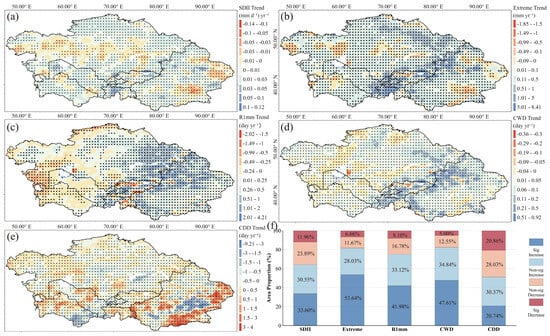
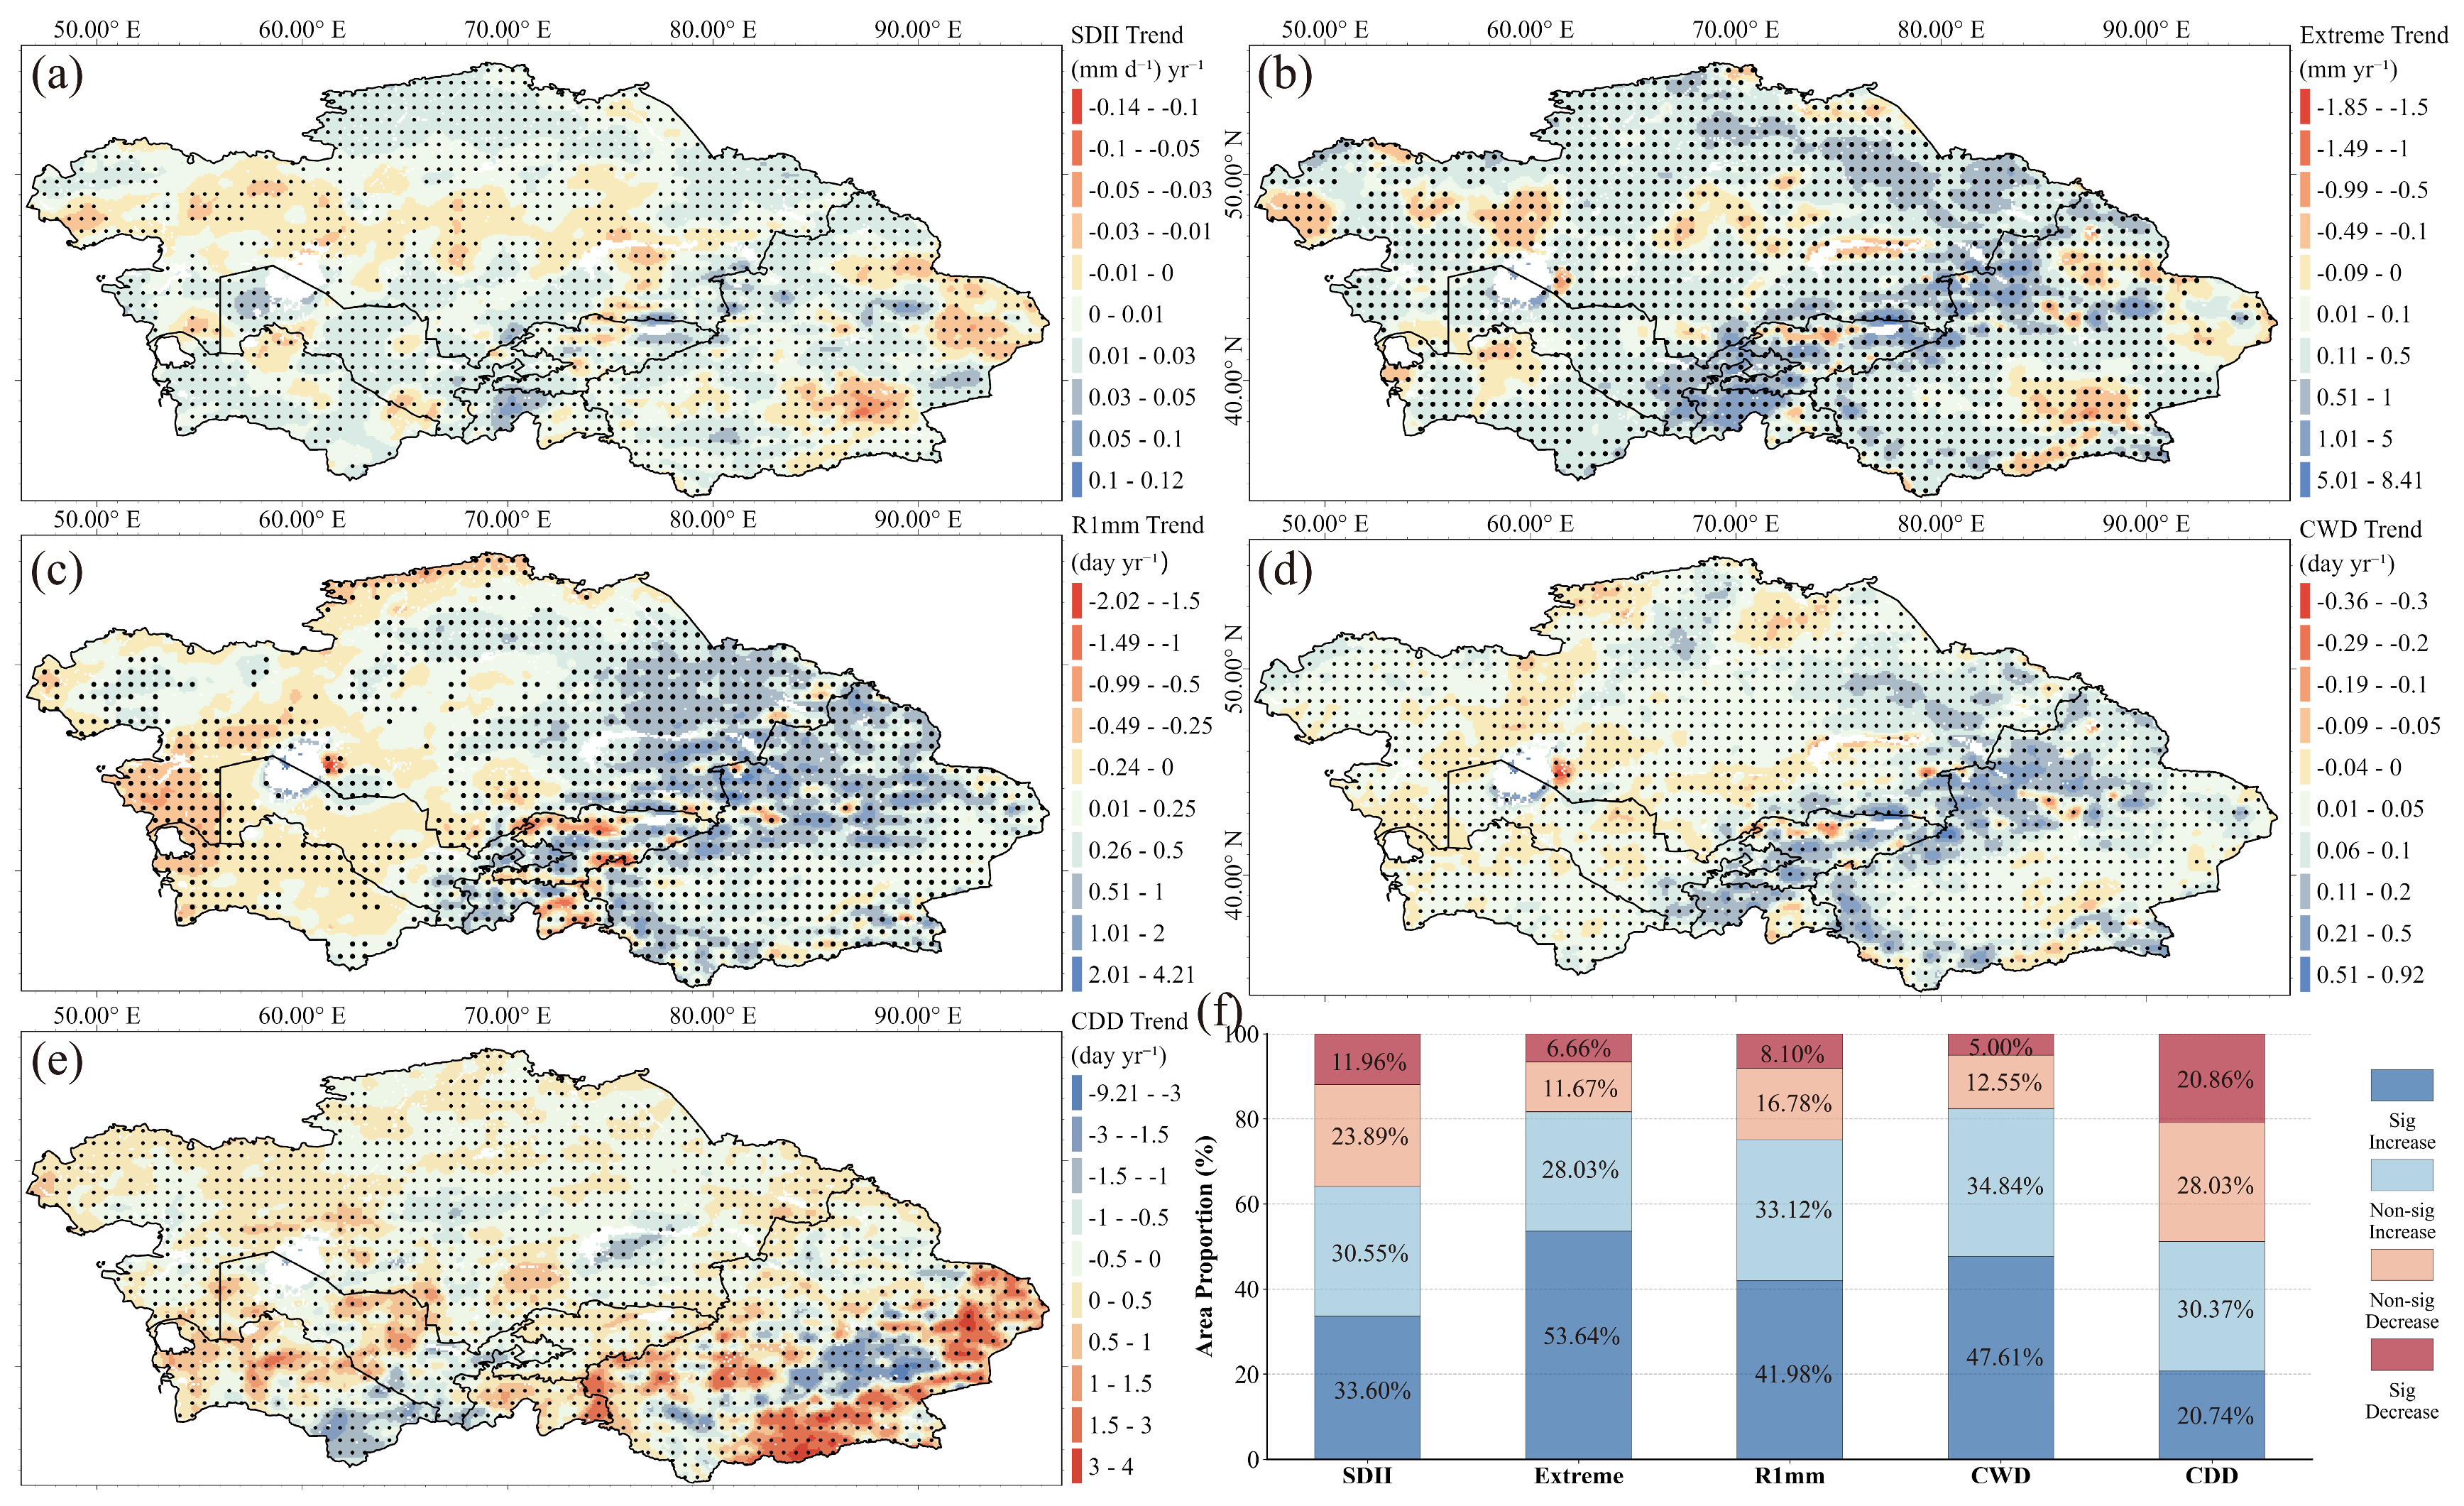
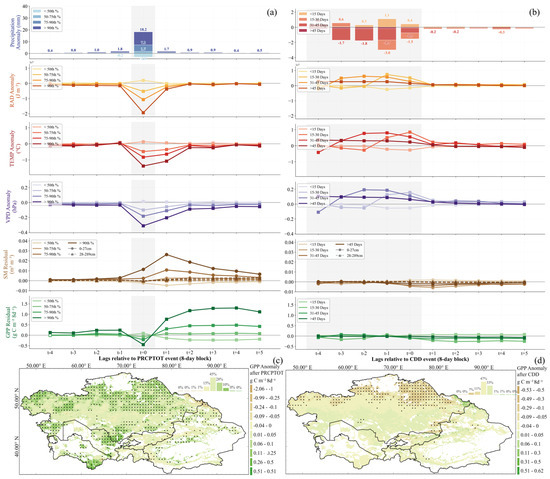
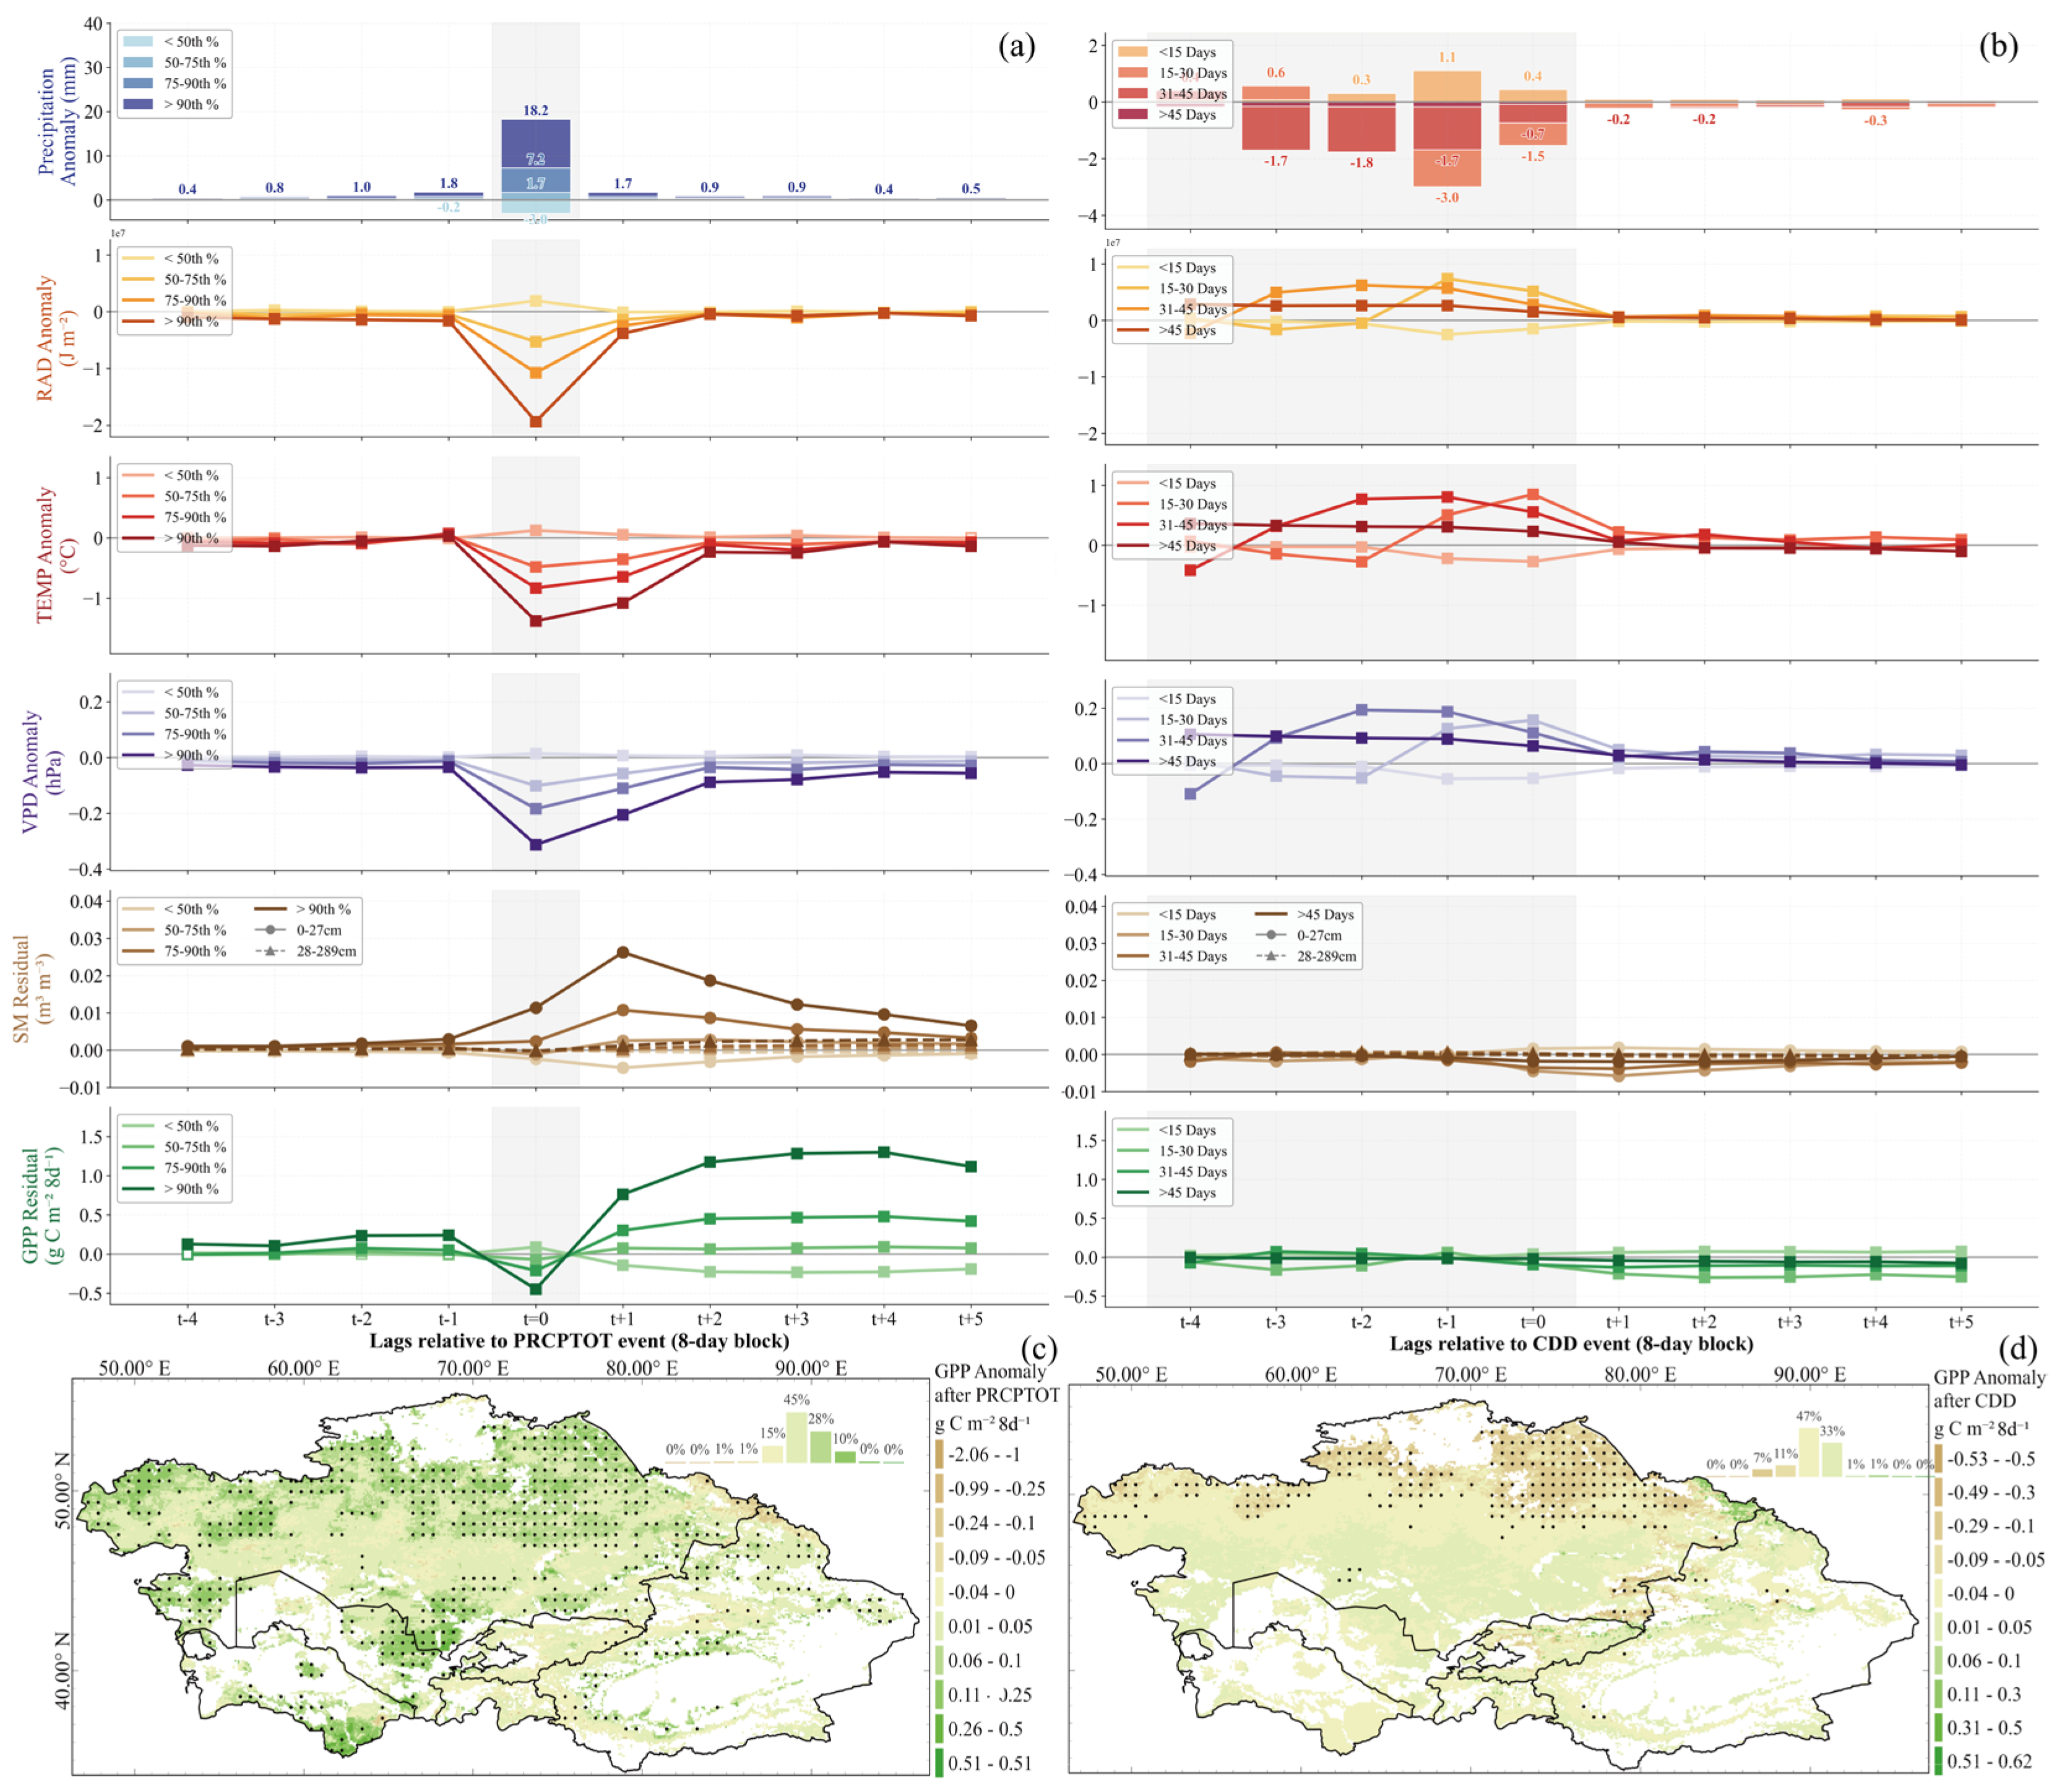
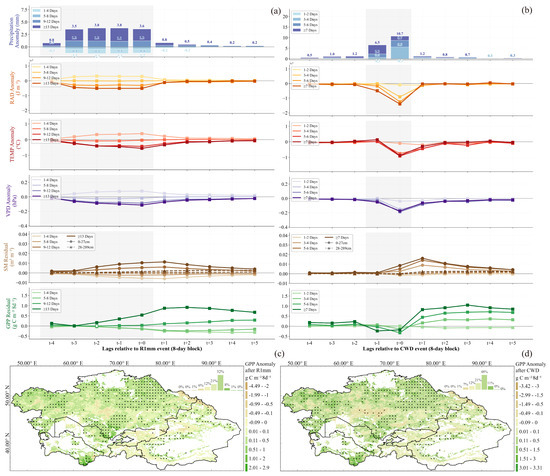
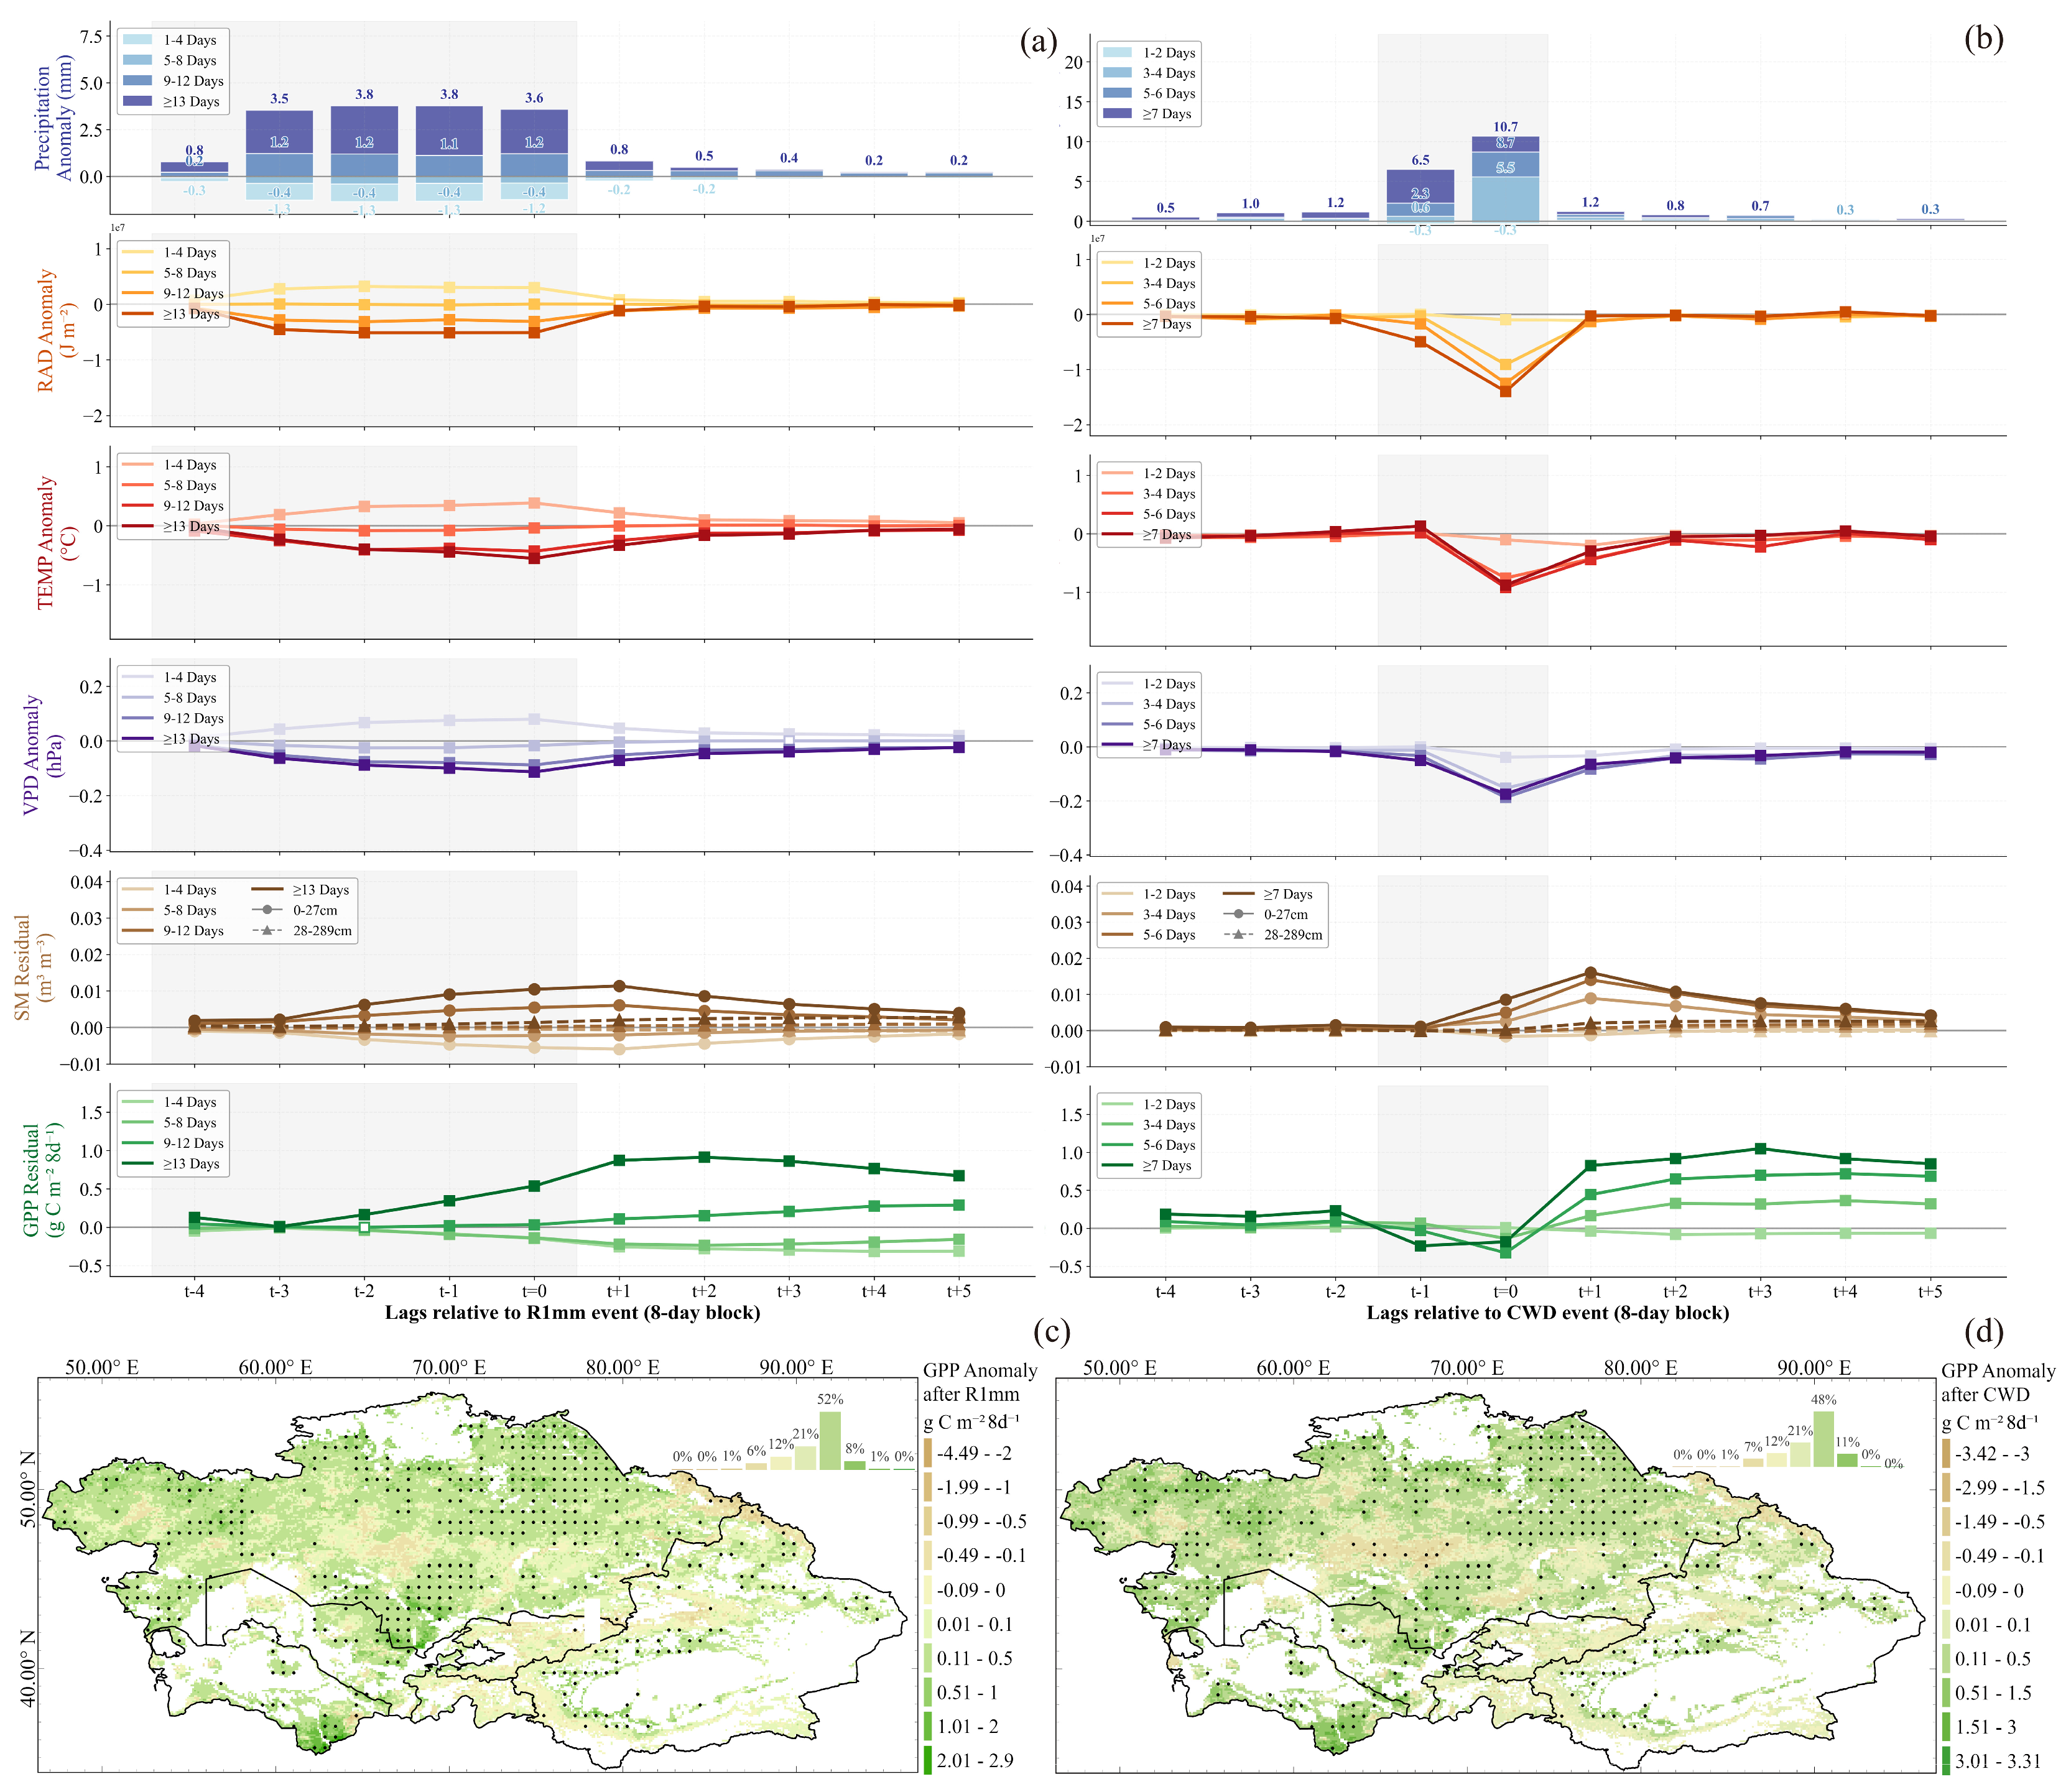
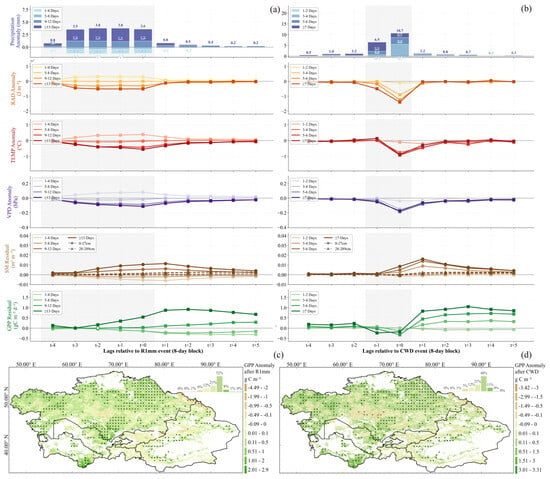
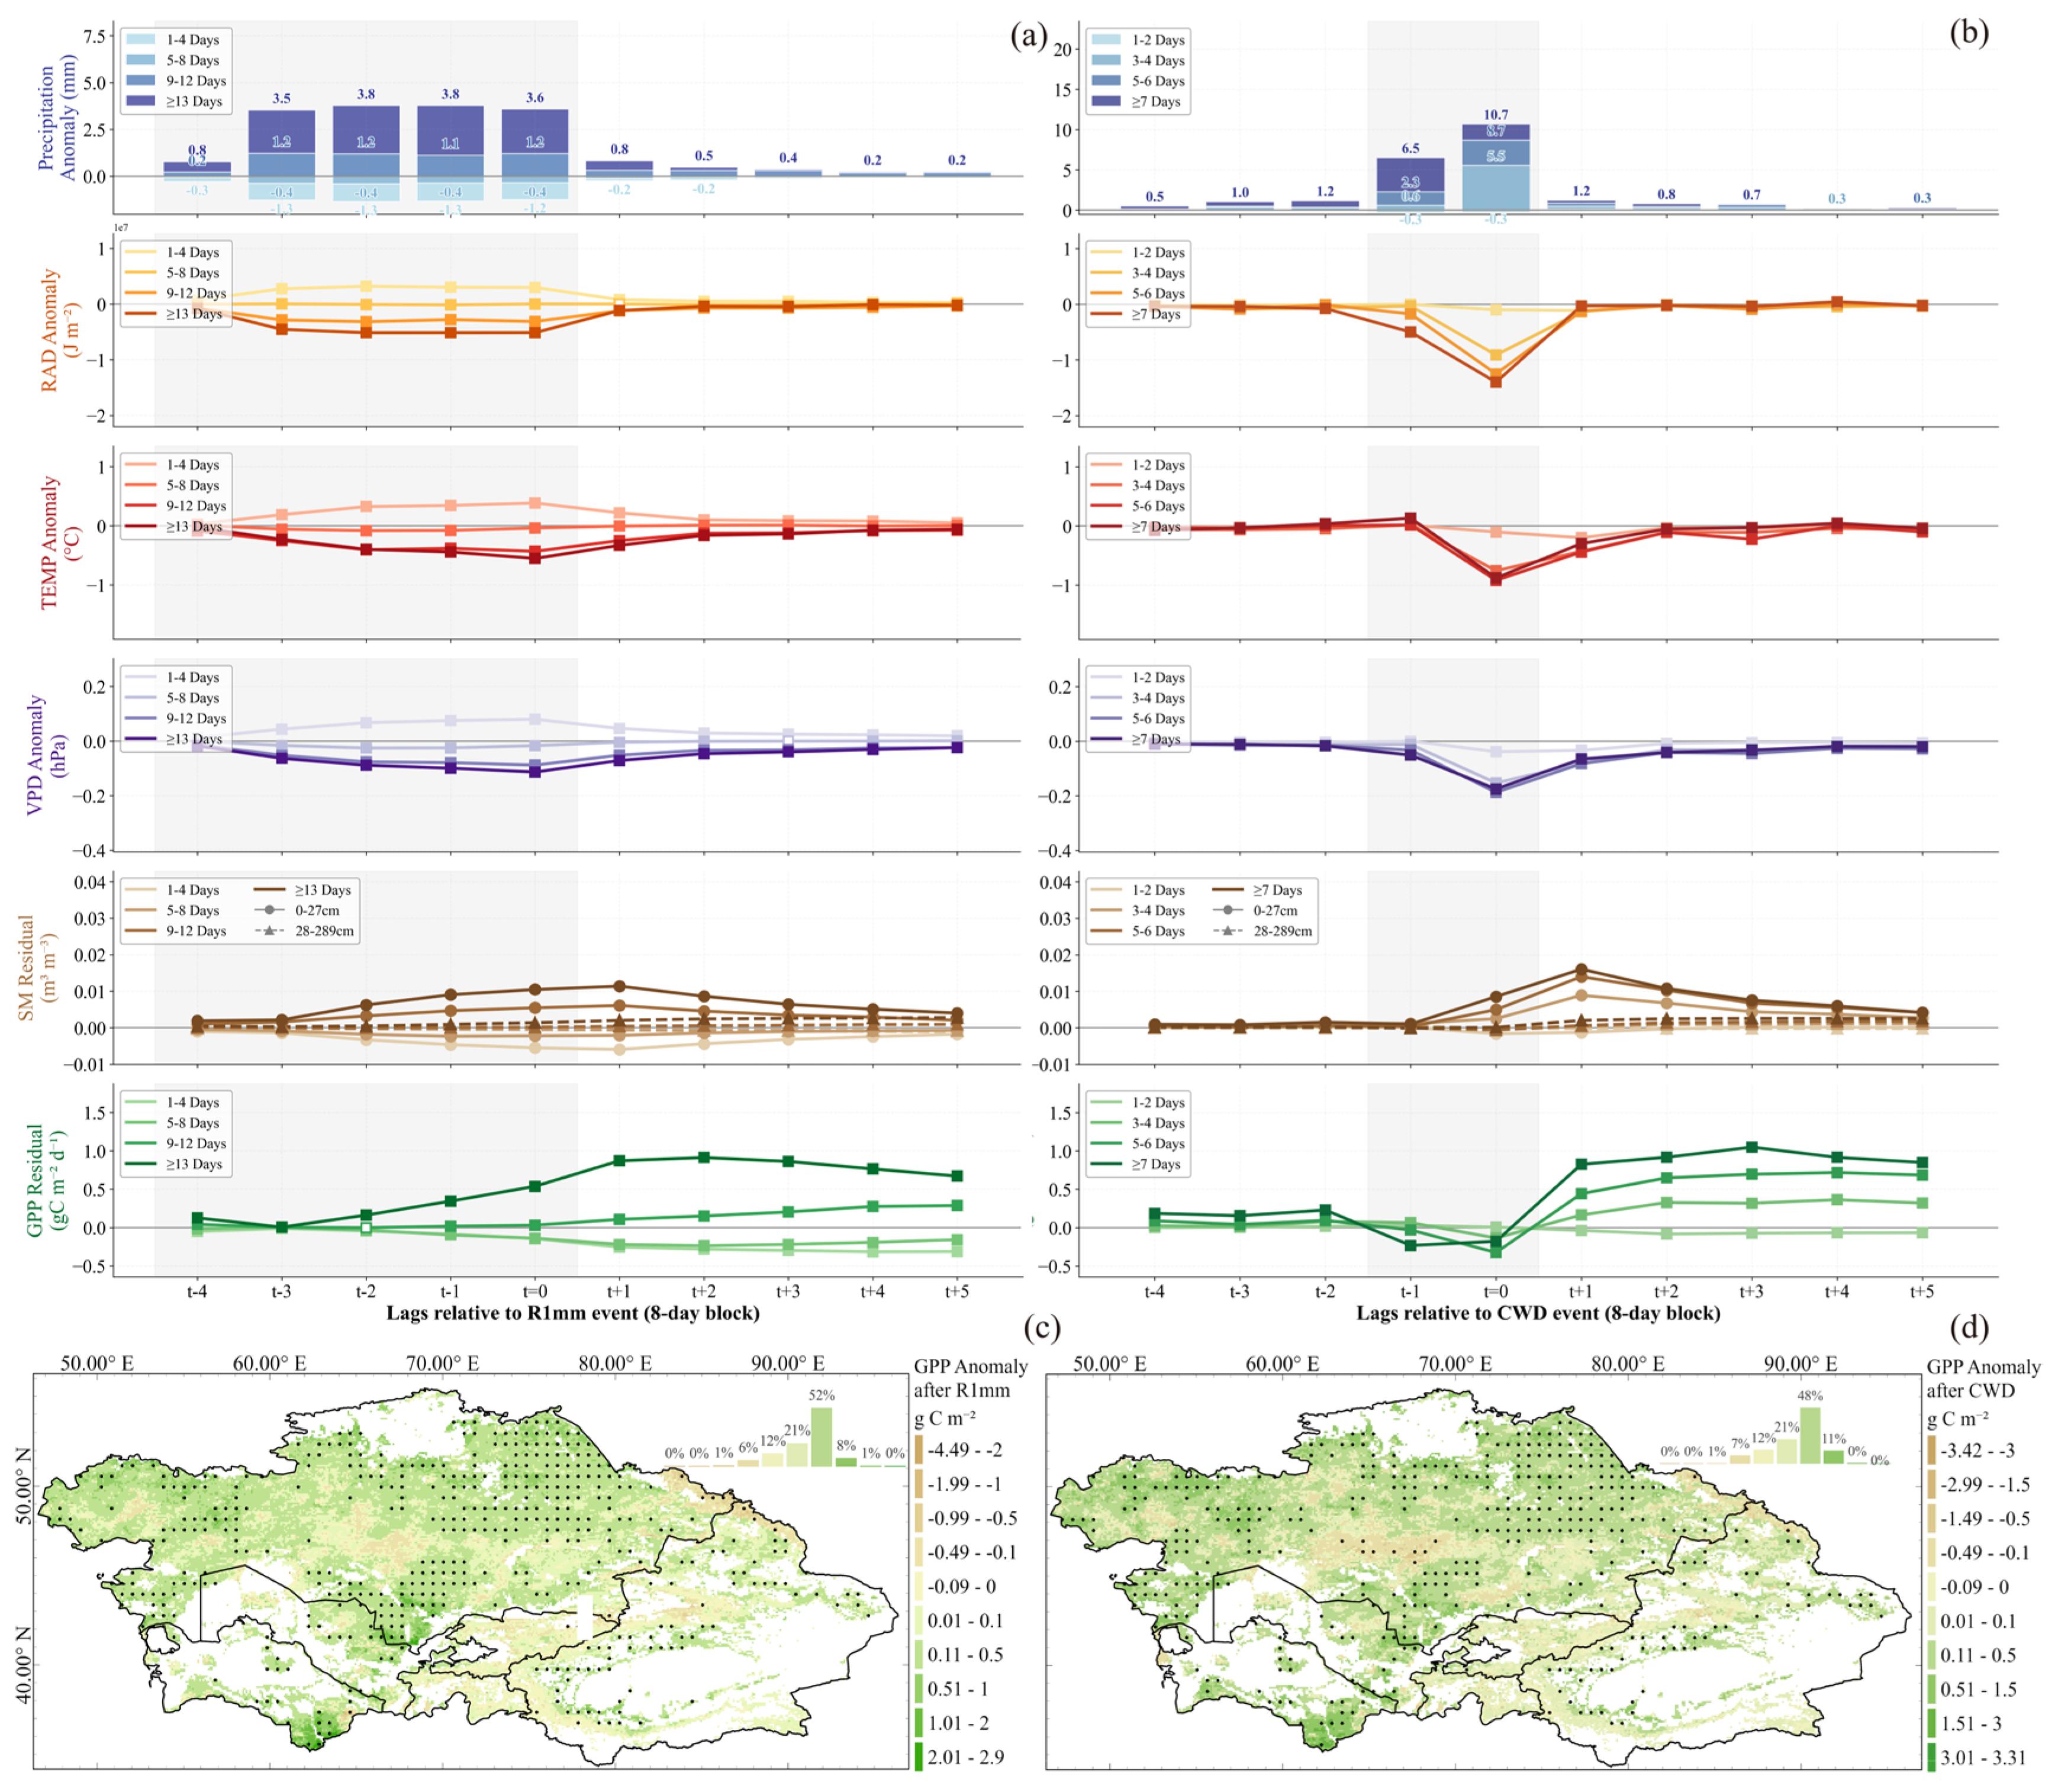
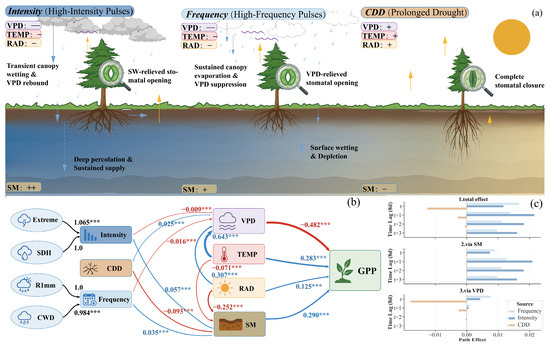
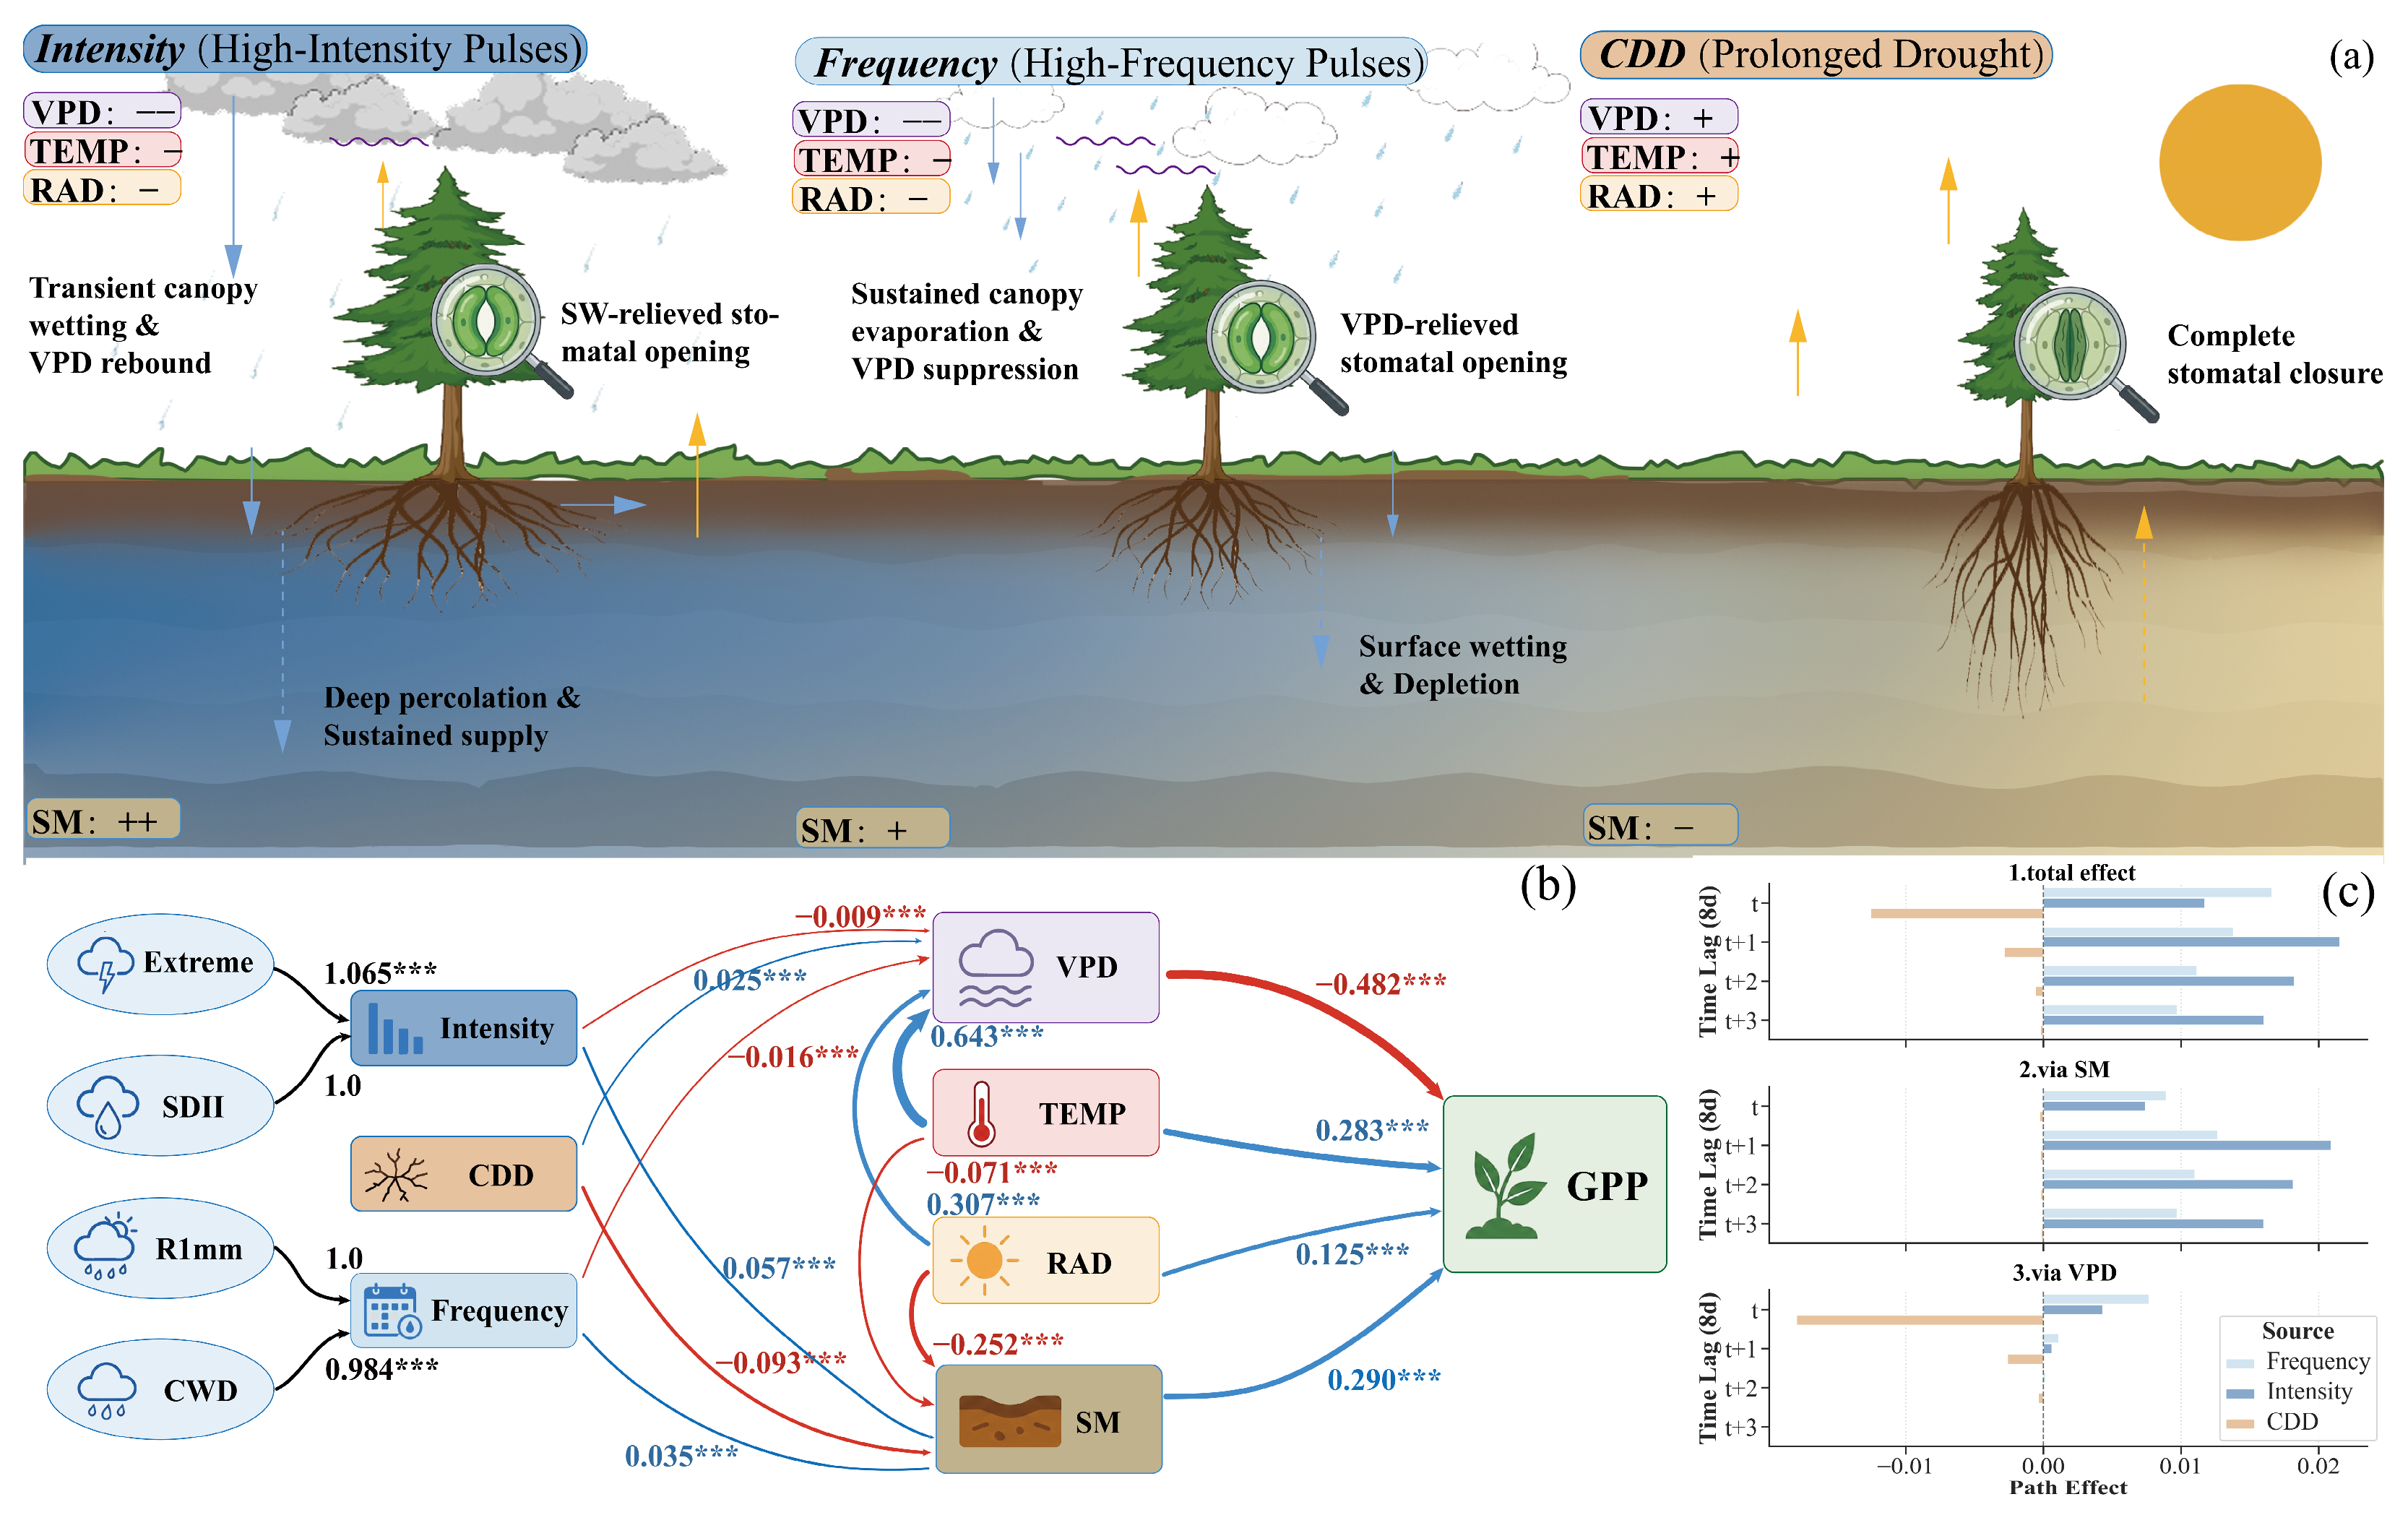
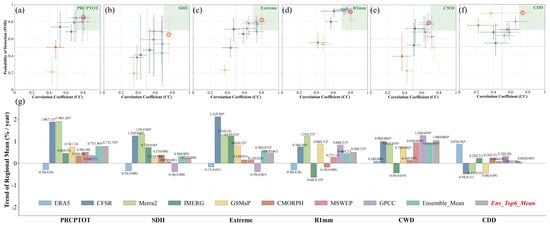
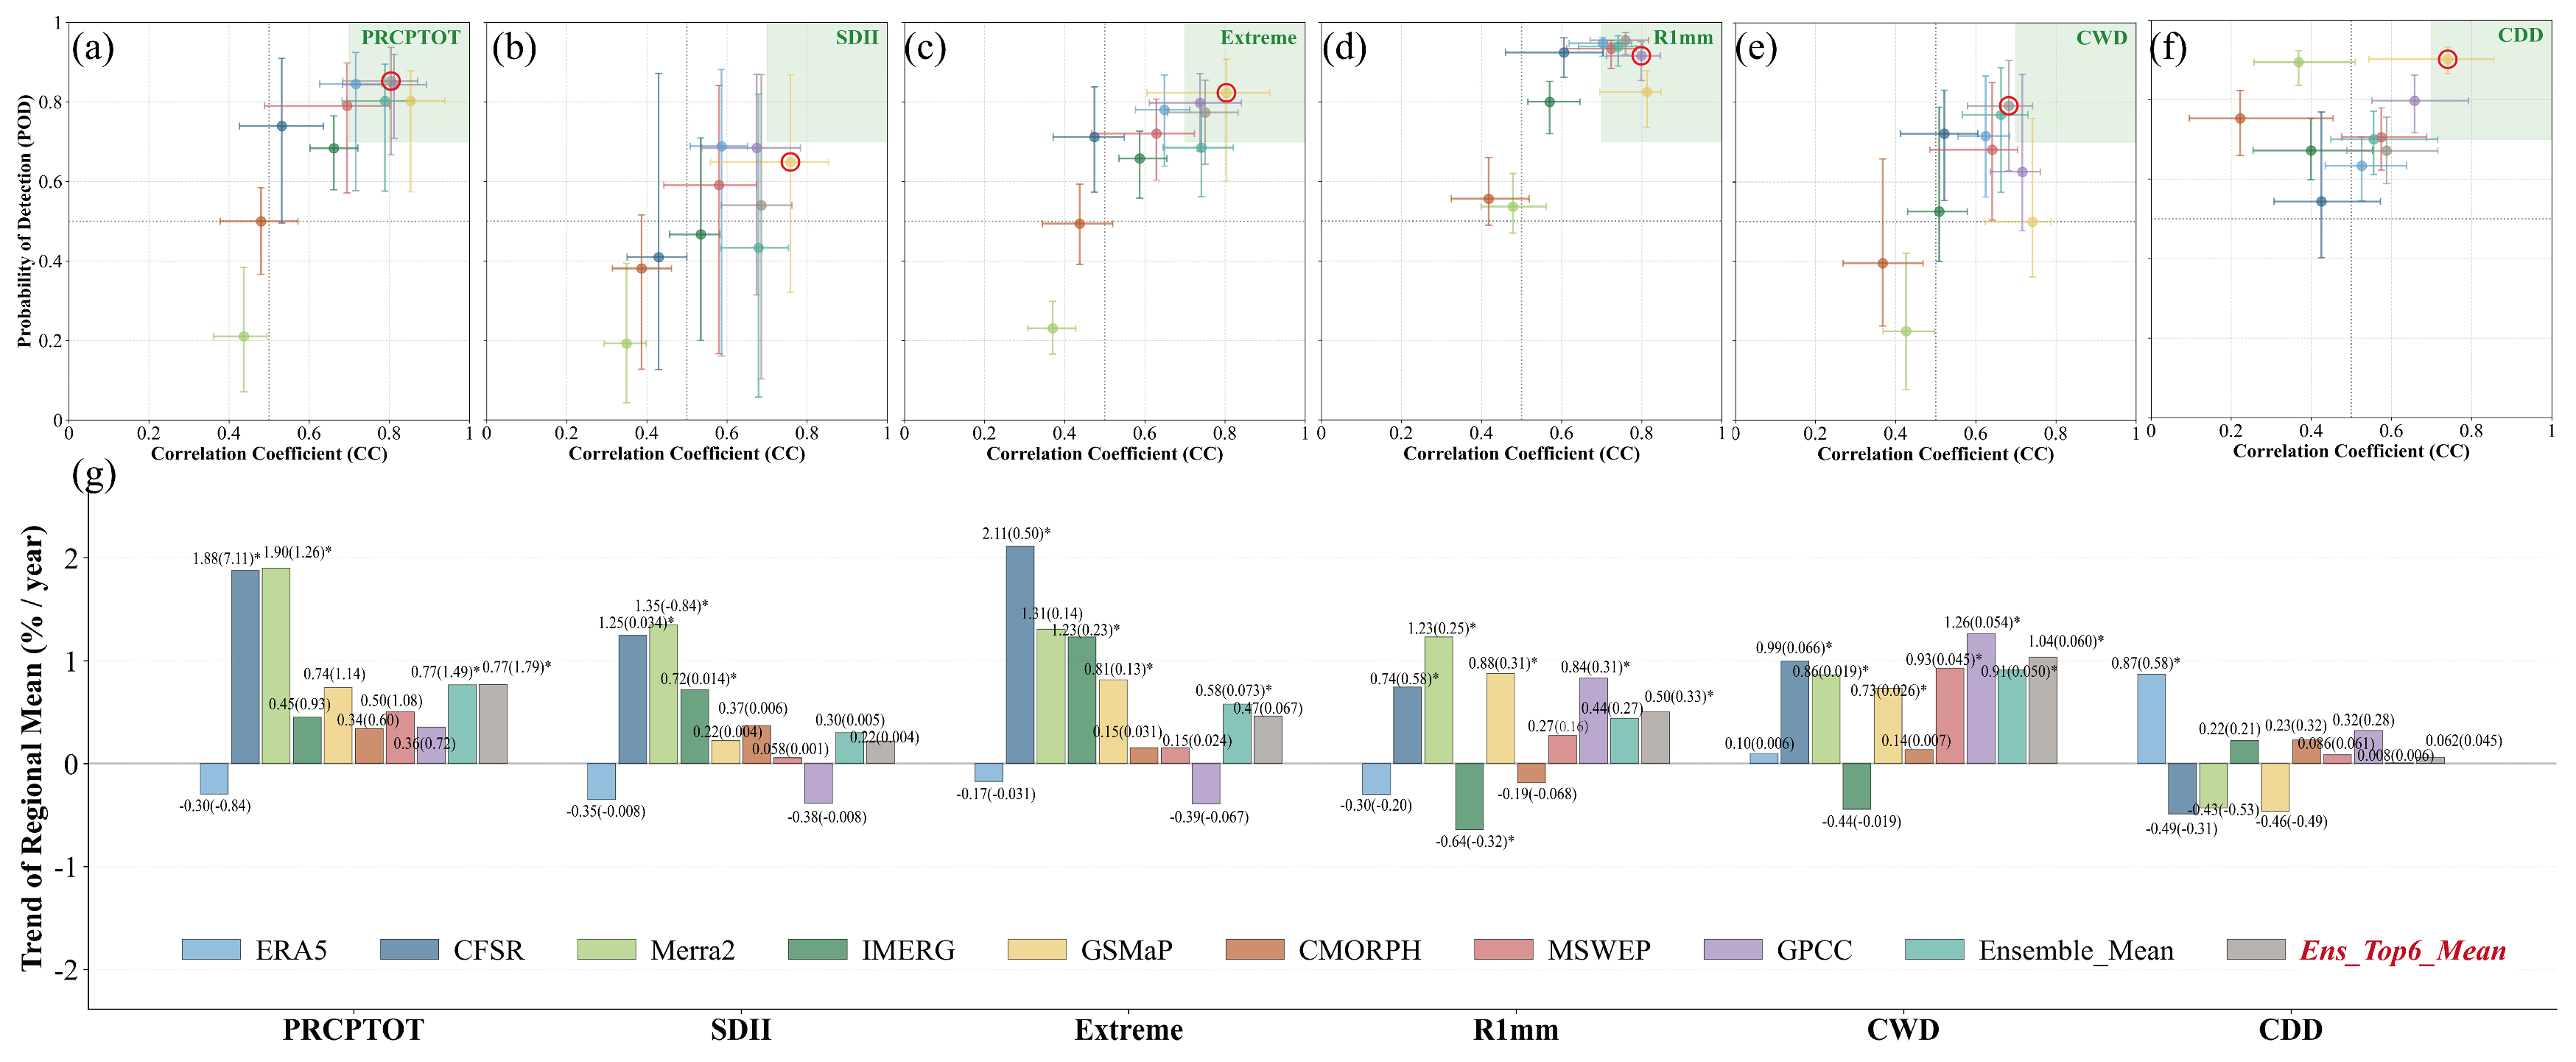
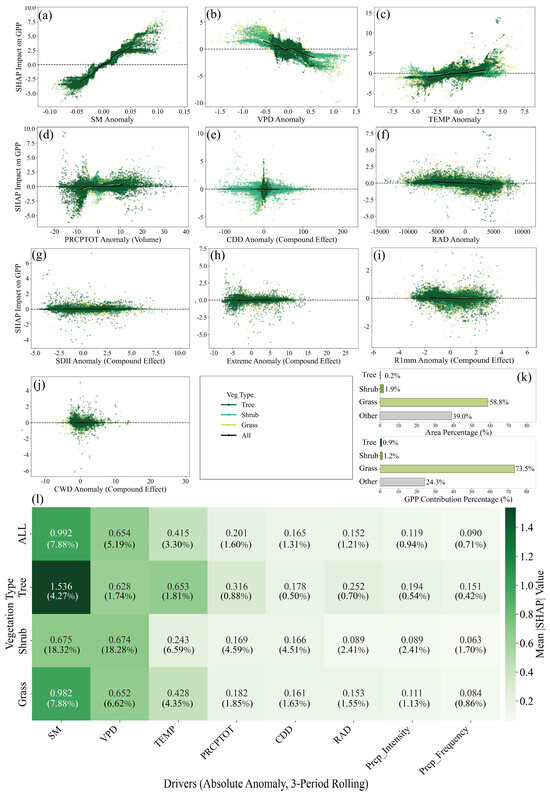
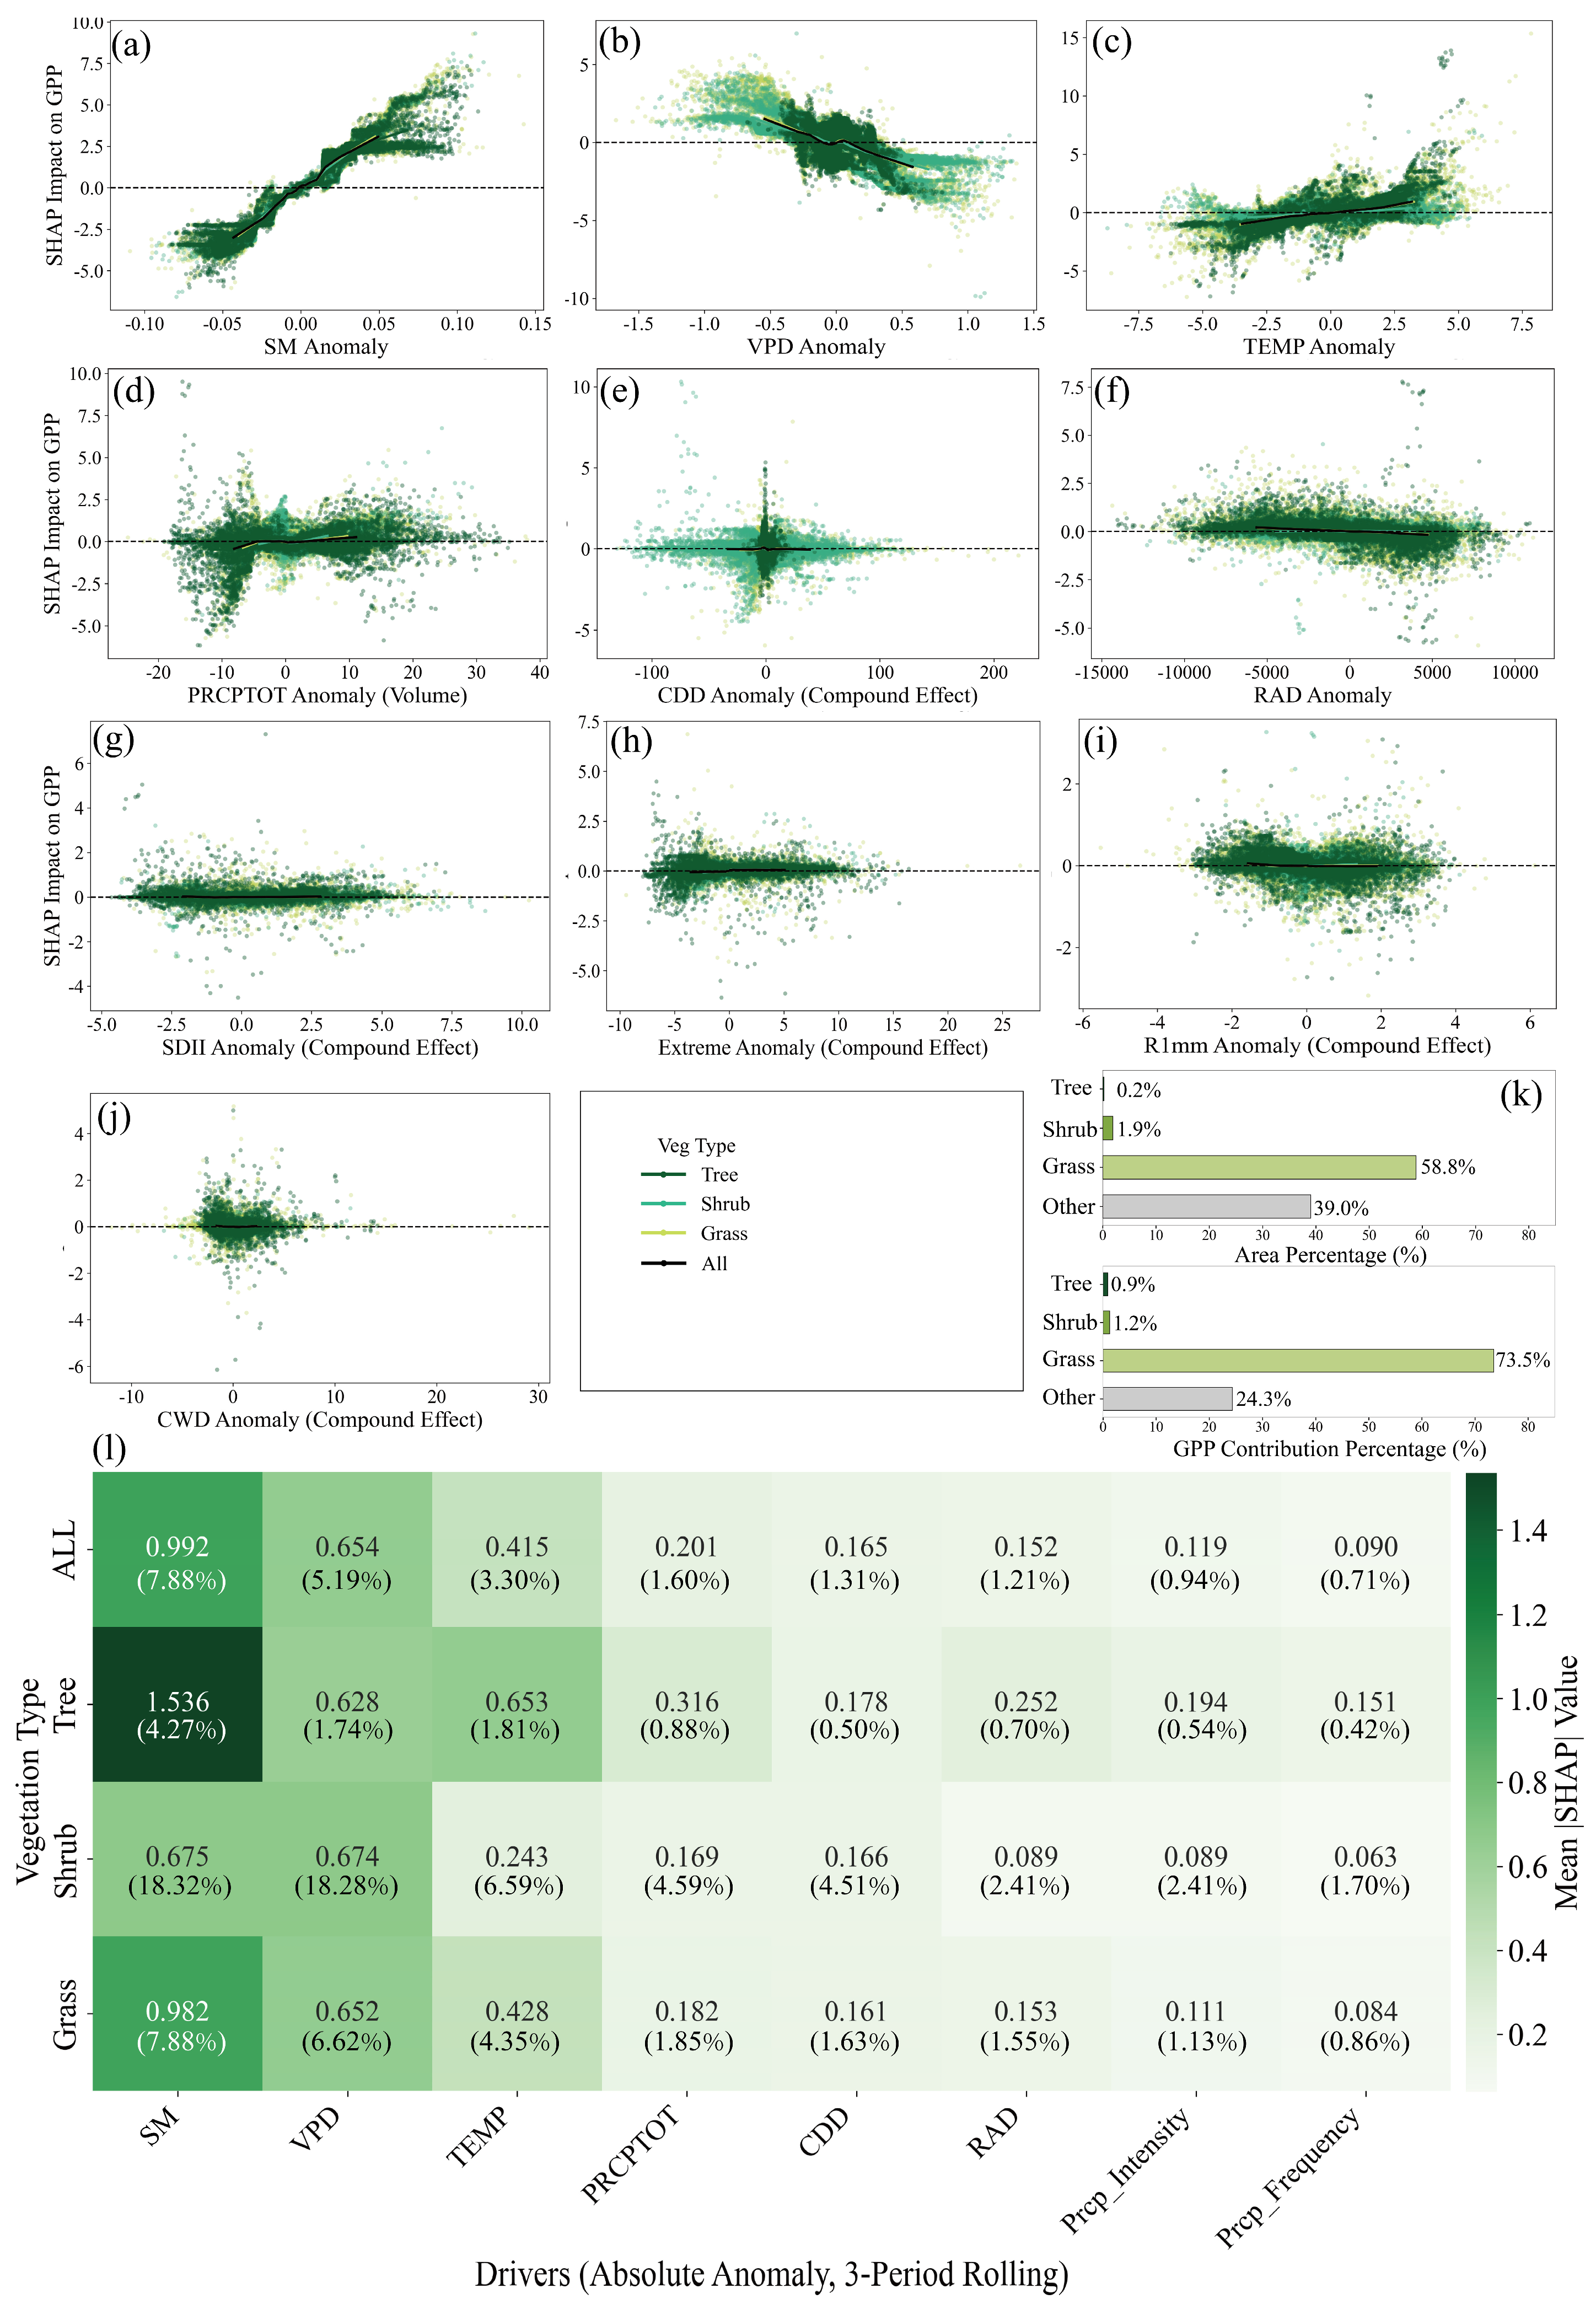

Disclaimer/Publisher’s Note: The statements, opinions and data contained in all publications are solely those of the individual author(s) and contributor(s) and not of MDPI and/or the editor(s). MDPI and/or the editor(s) disclaim responsibility for any injury to people or property resulting from any ideas, methods, instructions or products referred to in the content. |
© 2026 by the authors. Licensee MDPI, Basel, Switzerland. This article is an open access article distributed under the terms and conditions of the Creative Commons Attribution (CC BY) license.