


Highlights
What are the main findings?
- Identified 21 potentially hazardous lakes (10 outburst-prone and 11 inundation-prone) through a survey of 1352 expanding lakes on the Tibetan Plateau (TP).
- Revealed divergent drivers: inundation hazards (mainly medium-to-large lakes) are moisture-dominated (precipitation), whereas outburst hazards (typically small lakes) are energy-dominated (radiation-induced meltwater).
What are the implications of the main findings?
- Provides a validated risk inventory to support infrastructure protection, such as the expressway threatened by Xiao Qaidam Lake.
- Suggests that disaster mitigation must shift from broad basin-scale climate generalizations to specific catchment-scale analyses.
Abstract
Climate-induced lake expansion on the Tibetan Plateau (TP) has led to two distinct hazard types: outburst floods and passive inundation. However, the divergent driving mechanisms behind these hazards remain insufficiently understood. This study analyzes the spatiotemporal trends of 1352 non-glacial lakes (>1 km2) on the TP from 2014 to 2023 using high-resolution Gaofen-1 (GF-1) and Gaofen-2 (GF-2) imagery. By integrating geomorphic analysis with hazard mechanisms, we screened and categorized lakes prone to outburst floods and inundation using a classification and assessment framework proposed in this study. The results indicate that the net area of these lakes expanded by 2839.53 km2 (6.07%), with the Inner TP Basin contributing the largest absolute area gain (1960.60 km2). We identified 21 potentially hazardous lakes (10 outburst-prone and 11 inundation-prone) and systematically categorized them by risk level. Field investigations of high-risk candidates, such as Rulei Co and Xiao Qaidam Lake, validated the accuracy of the hazard classification and risk assessment methodology. Preliminary attribution analysis further suggests that the two hazard types may be associated with distinct climatic factors. Overall, this study provides a scientific basis for disaster mitigation and lake management on the TP.
1. Introduction
The TP, widely acclaimed as the “Roof of the World” and “Third Pole” [1,2,3], is rich in water resources, possessing ice reservoirs second only to those in the polar regions [4,5,6]. It boasts an extraordinary concentration of lakes, representing the world’s most densely distributed alpine lake cluster [7,8]. These widely distributed lakes constitute a vast water surface area that is vital to the terrestrial hydrosphere and crucial in regulating the regional climate and ecosystem. As a result, the TP is also called the “Asian Water Tower” [9,10,11,12,13,14,15,16]. However, the ecological environment of these lakes is being profoundly impacted by global warming [17]. According to the IPCC Sixth Assessment Report, human-induced warming has been unprecedented over the past 2000 years [18,19]. Against this background, the TP has experienced accelerated glacier retreats and intensified permafrost thaw [20,21,22]. Consequently, lake areas have generally increased, with particularly pronounced growth in major lakes such as Siling Co, Nam Co, and Zhari Namco [23,24]. Siling Co, for instance, expanded by approximately 650 km2 (nearly 40%) from 1988 to 2020, surpassing Nam Co to become the largest saltwater lake in Tibet [25]. This rapid expansion has led to the emergence of lake-related hazards that significantly impact regional ecosystems and economic development [26].
Currently, lake-related hazards in the TP region are shifting from being dominated primarily by small glacial lake outbursts to a trend where glacial lake outbursts coexist with non-glacial lake outbursts and inundations. Due to rapid expansion, these non-glacial hazards are becoming increasingly frequent. In September 2011, the outburst of Zonag Lake in the Hoh Xil region caused a chain reaction, flowing into Yanhu Lake and severely threatening the Qinghai–Tibet Highway [27,28]. In September 2023, Siling Co experienced a rapid water level rise that reactivated an ancient channel, temporarily connecting it with Bangkog Co. This caused Bangkog Co’s level to rise by approximately 2.3 m, destroying the S208 provincial road and inundating the surrounding pastureland [26,29]. More recently, in February 2024, a dike collapse at Lake Dongge Cuona in Qinghai Province severely affected downstream activities. These frequent medium-to-large-scale events have drawn urgent attention to emerging lake-related hazards that differ from traditional glacial lake outbursts.
Despite the urgency, past studies on lake-related hazards in the TP region have primarily focused on glacial lake outbursts [30,31,32,33]. Significant progress has been made in understanding the mechanisms of moraine outbursts and developing risk assessment methods for glacial lakes [34,35,36,37]. In contrast, although recent studies have begun to investigate hazards associated with non-glacial lakes, such research remains comparatively limited relative to the extensive body of work on lake change trends and their climatic drivers; comprehensive and systematic assessments of the potential hazards triggered by these changes are still insufficient [38,39,40,41,42,43,44,45,46,47]. Moreover, there is a lack of in-depth studies on identifying potentially hazardous lakes and establishing early warning systems for them. Additionally, while field validation is essential, the high altitude, complex terrain, and inaccessibility of the TP region significantly increase the challenges of conducting such research [48]. Therefore, it is essential to integrate remote sensing monitoring with field validation to develop a comprehensive system for screening and warning of potentially hazardous lakes.
This study proposes a technical methodology system for non-glacial lake-related hazards, leveraging remote sensing methods and field validation to monitor and assess potentially hazardous lakes. High-resolution optical remote sensing imagery of lakes larger than 1 km2 in area in 2014 and 2023 was used as baseline data to analyze the number, distribution, and changes in lakes. Based on the characteristics of previous lake-related hazards, potentially hazardous lakes were identified and categorized into Outburst-prone Lakes (OPLs) and Inundation-prone Lakes (IPLs), resulting in the first comprehensive list of non-glacial lake-related hazards. A risk assessment system was developed, and field investigations were conducted to verify high-risk lakes. In addition, this study aims to provide scientific support for evaluating emerging lake-related hazards, address the research gap regarding alpine lakes, and offer valuable references for future research on lake evolution and lake disaster management on the TP.
2. Geographic Region
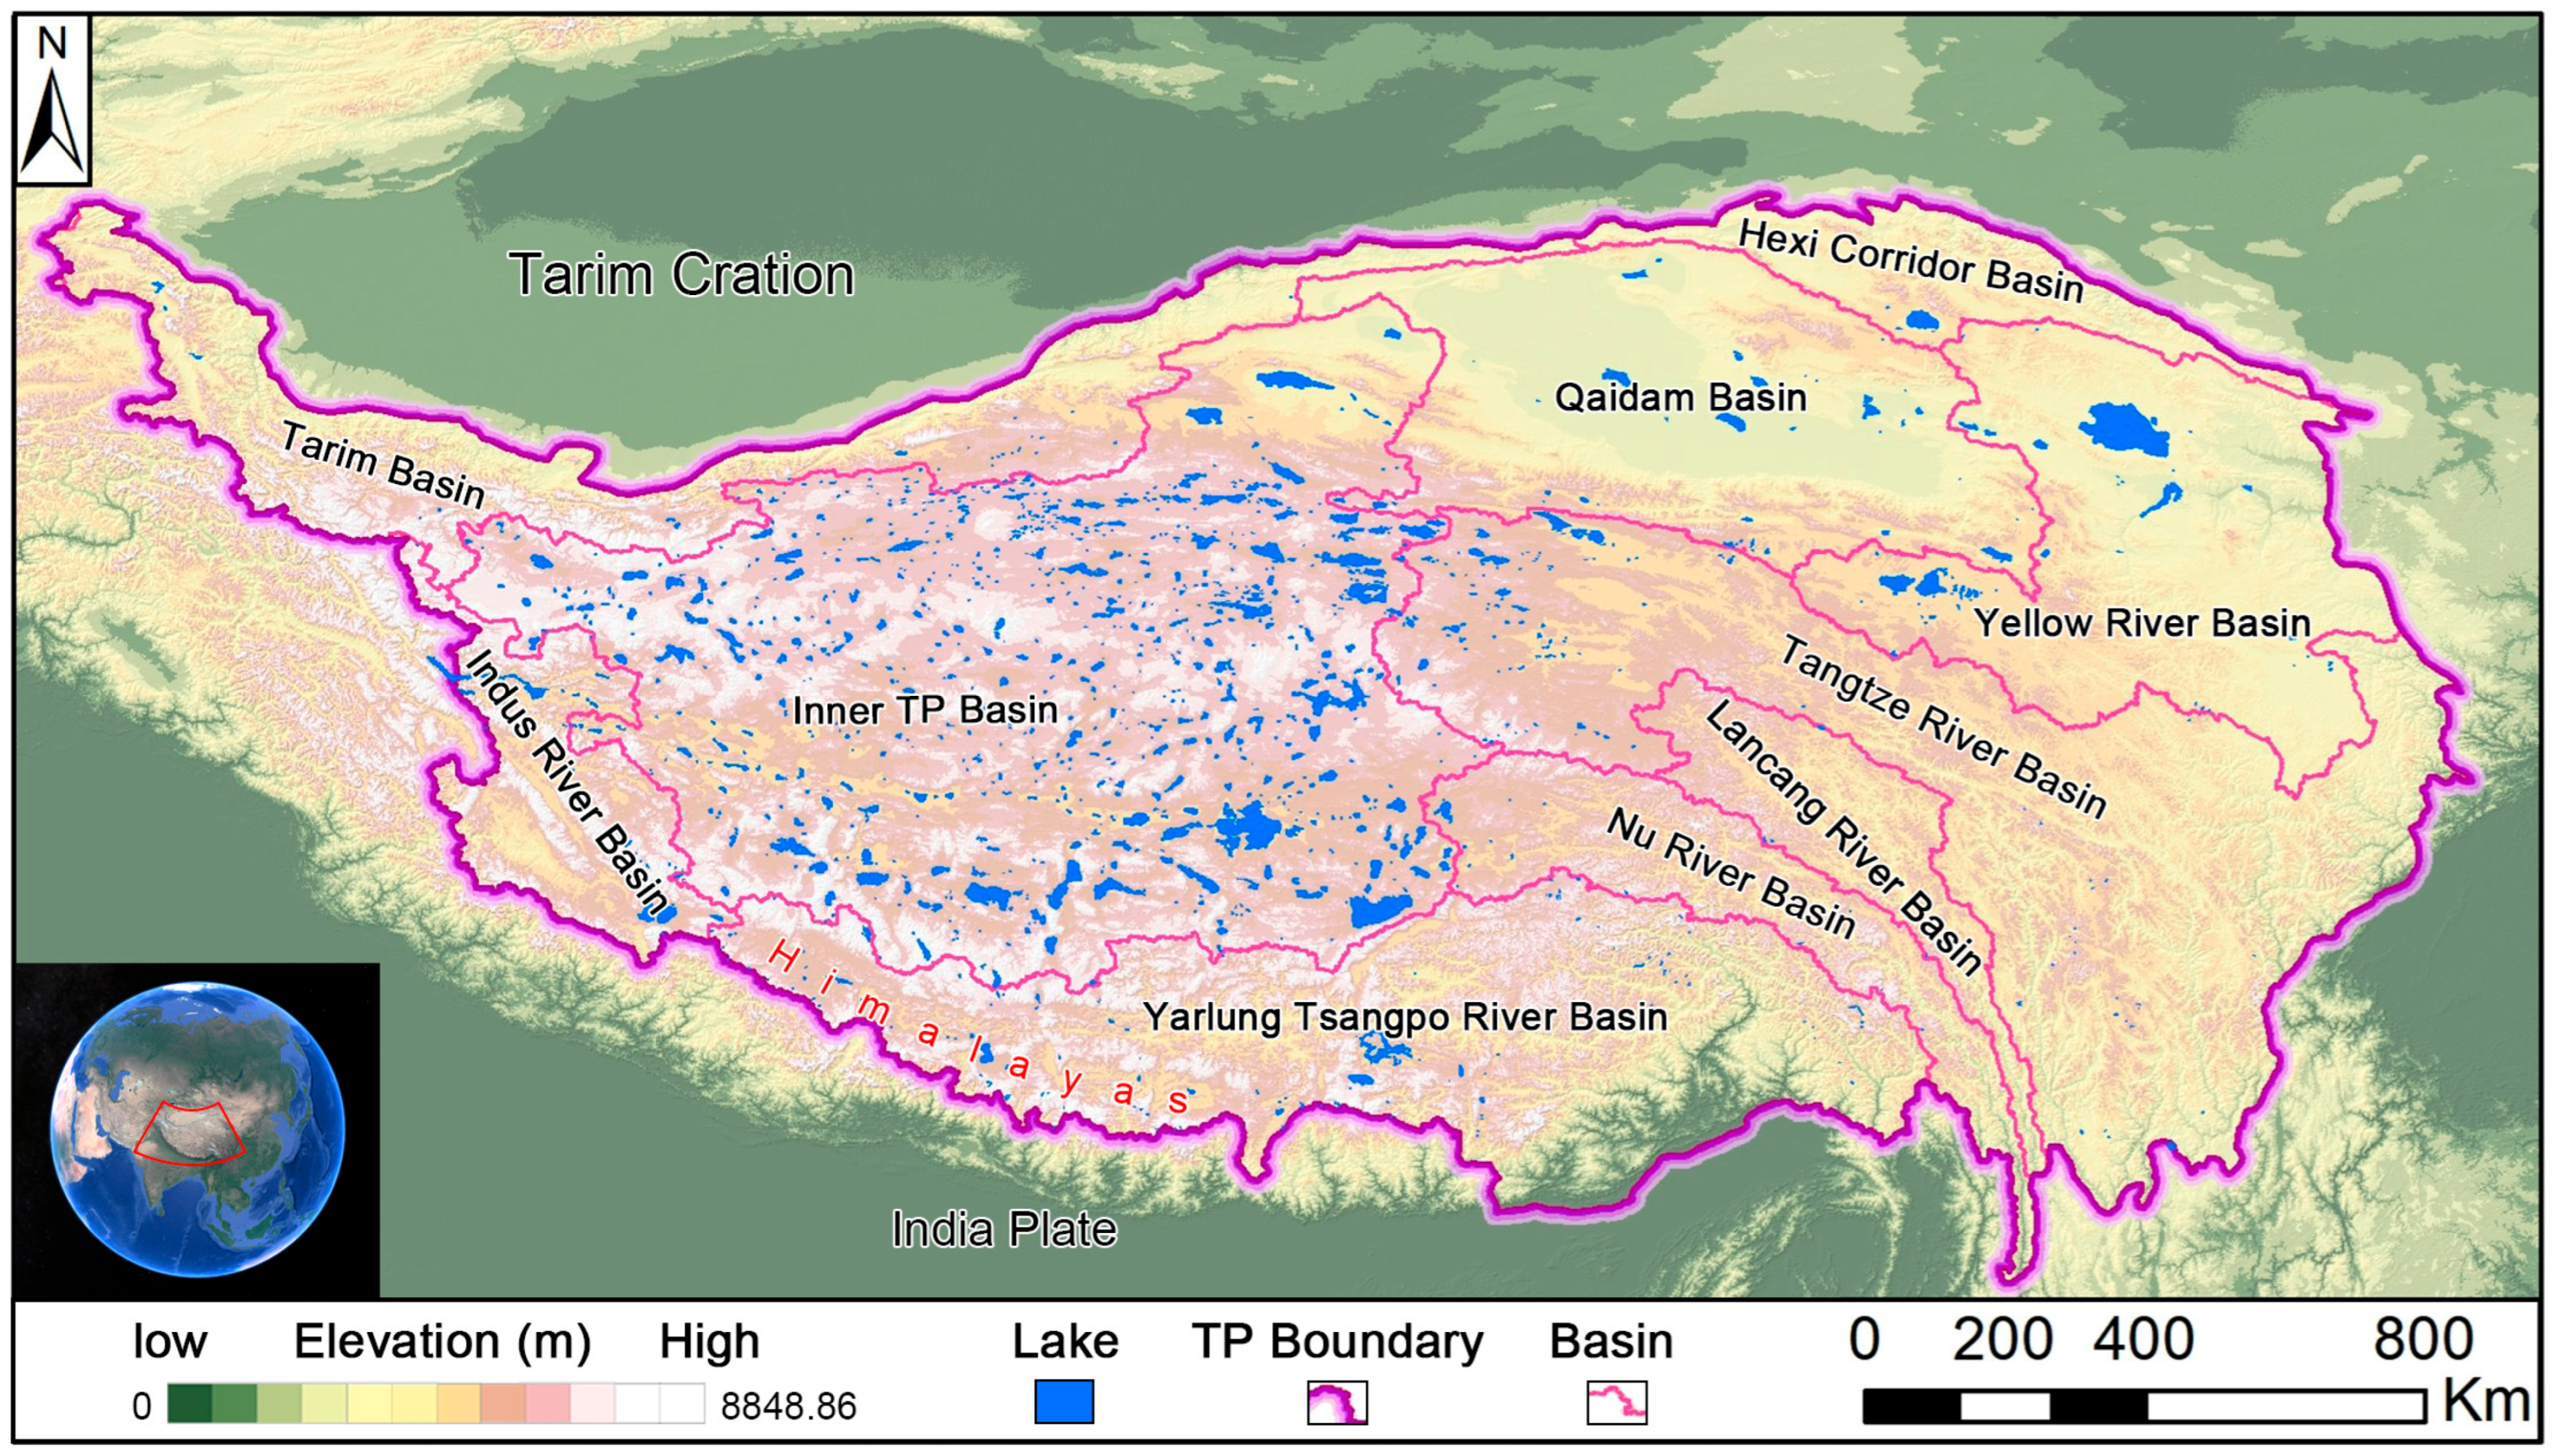
The TP, characterized by high-altitude and west-to-east sloping topography, serves as the source for many of Asia’s major rivers. The precise boundaries of the plateau are subject to varying interpretations among researchers. In this study, the boundary is adapted from the TPBoundary_HF dataset of the Administrative Boundaries Data at 1:1,000,000 Scale Over the TP (2017), published by the Institute of TP Research, Chinese Academy of Sciences, to define the TP’s extent within China (Figure 1) [49]. This study focuses on lakes larger than 1 km2 within a standardized definition of the region. The plateau is divided into several major river basins, including those of the Nu River (the upper reaches of the Salween), Yarlung Tsangpo (the upper reaches of the Brahmaputra), Lancang (the upper reaches of the Mekong), Yangtze, and Yellow Rivers, which are exogenous systems flowing to the ocean. Additionally, it contains significant endorheic basins such as the Inner TP Basin, the Qaidam Basin, the Hexi Corridor Basin, the Indus River Basin and the Tarim Basin. The distribution of mountain ranges, such as the Himalayas, Kunlun, and Qilian Mountains, dictates the layout of these basins and influences the location of the plateau’s numerous lakes, which constitute the densest concentration of lakes in China [50]. The distribution of these lakes exhibits distinct regional characteristics; the majority are endorheic lakes situated within the expansive Inner TP Basin. These lakes are predominantly remnants of larger Quaternary period lakes that have since shrunk [51,52,53]. Their formation is closely linked to the tectonic evolution and glacial processes of the plateau, with most being tectonic lakes formed in fault-induced depressions or down-warped basins. Many originated from depressions carved by glacial erosion, while a smaller number are barrier lakes created by landslides or glacial moraines. The majority of these lakes exist as saline or saltwater bodies due to high evaporation rates in the enclosed basins, although freshwater lakes are also present [54].
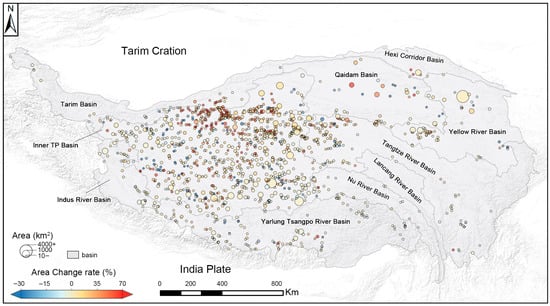
Figure 1.
Distribution of non-glacial lakes and major river basins on the TP; TP boundary data come from Institute of TP Research, Chinese Academy of Sciences.
3. Data and Methods
3.1. Data
3.1.1. High-Resolution Optical Remote Sensing Imagery
The Gaofen-1 (GF-1) and Gaofen-2 (GF-2) satellites are part of China’s High-Resolution Earth Observation System National Major Project (Gaofen Project) and are designed to capture high-resolution optical imagery of the Earth’s surface. Table 1 presents the main parameters of the two satellites. GF-1 was successfully launched on 26 April 2013, carrying two multispectral sensors. Among them, the Wide Field of View (WFV) sensor consists of four cameras, which capture 16 m resolution multispectral images, while the Panchromatic Multi-spectral (PMS) sensor is equipped with two cameras capable of acquiring 2 m resolution panchromatic images and 8 m resolution multispectral images. GF-2 was successfully launched on 19 August 2014, carrying a PMS sensor and doubling the resolution to the sub-meter level compared with GF-1. GF-1 and GF-2 imagery enhance the precision of lake vector extraction and enable a more accurate assessment of risk elements surrounding lakes in lake hazard investigations compared to the previously used Landsat series images [41,55,56,57,58,59]. In this study, PMS sensor images from the TP region are utilized as the background dataset.
Table 1.
Main parameters of the GF-1 and GF-2.
3.1.2. Copernicus DEM (CopDEM)
The CopDEM is published by the European Space Agency (ESA) to capture terrain and infrastructure on Earth [60]. It provides highly accurate Digital Elevation Models (DEMs) essential for various applications, including the orthorectification of satellite imagery and other geospatial analyses [61]. CopDEM is available in three distinct resolutions: EEA-10 (10 m), GLO-30 (30 m), and GLO-90 (90 m). While EEA-10 is limited to 39 European countries, both GLO-30 and GLO-90 provide global coverage [62]. The datasets utilize World Geodetic System 1984 (WGS84) as the geographic coordinate reference and Earth Gravitational Model 2008 (EGM2008) as the vertical datum. Compared to other publicly available DEM products, such as NASADEM and AW3D30, CopDEM is more accurate for gentle slopes (<10°), while NASADEM and AW3D30 perform comparably better for slopes above 10°, with neither maintaining a consistent advantage across all gradients [63]. However, CopDEM demonstrates greater accuracy on bare ground and sparse vegetation surfaces. Given that the TP region is characterized by extensive bare surfaces and sparse vegetation cover, this study employs CopDEM GLO-30 as the primary topographic dataset to extract topographic information surrounding the lakes.
3.1.3. Cryosat-2
The CryoSat-2 satellite, launched by the ESA on 8 April 2010, is equipped with the Synthetic Aperture Interferometric Radar Altimeter (SIRAL). SIRAL operates in three spatial sampling modes, notably the Synthetic Aperture Radar Interferometry (SARIn) mode, which offers reduced systematic bias [64,65]. Research has indicated that CryoSat-2 is effective for monitoring smaller lakes on the TP, thereby complementing the coverage provided by other altimetry missions [66]. Therefore, the CryoSat-2 L2 GDR Baseline E product was utilized to retrieve water levels for IPLs for the years 2014 and 2023, using primarily SARIn data supplemented by Low Resolution Mode (LRM) data.
3.2. Method
In this study, non-glacial lakes are defined as lakes whose formation is not directly attributable to glacial processes. This definition specifically excludes: (1) cirque lakes formed by glacial erosion, (2) moraine-dammed lakes impounded by glacial deposits, and (3) ice-dammed lakes blocked by glacier ice itself. Critically, this classification is based on lake genesis rather than hydrological connectivity. Non-glacial lakes, as defined herein, may still receive glacial meltwater as a component of their water supply, provided that their origin is not the direct result of glacial activity. This distinction is essential because the hazard mechanisms of non-glacial lakes differ fundamentally from those of glacial lakes, which are typically triggered by dynamic glacial processes such as ice or rock avalanches entering the lake.
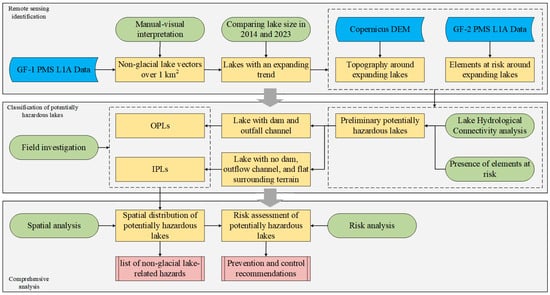
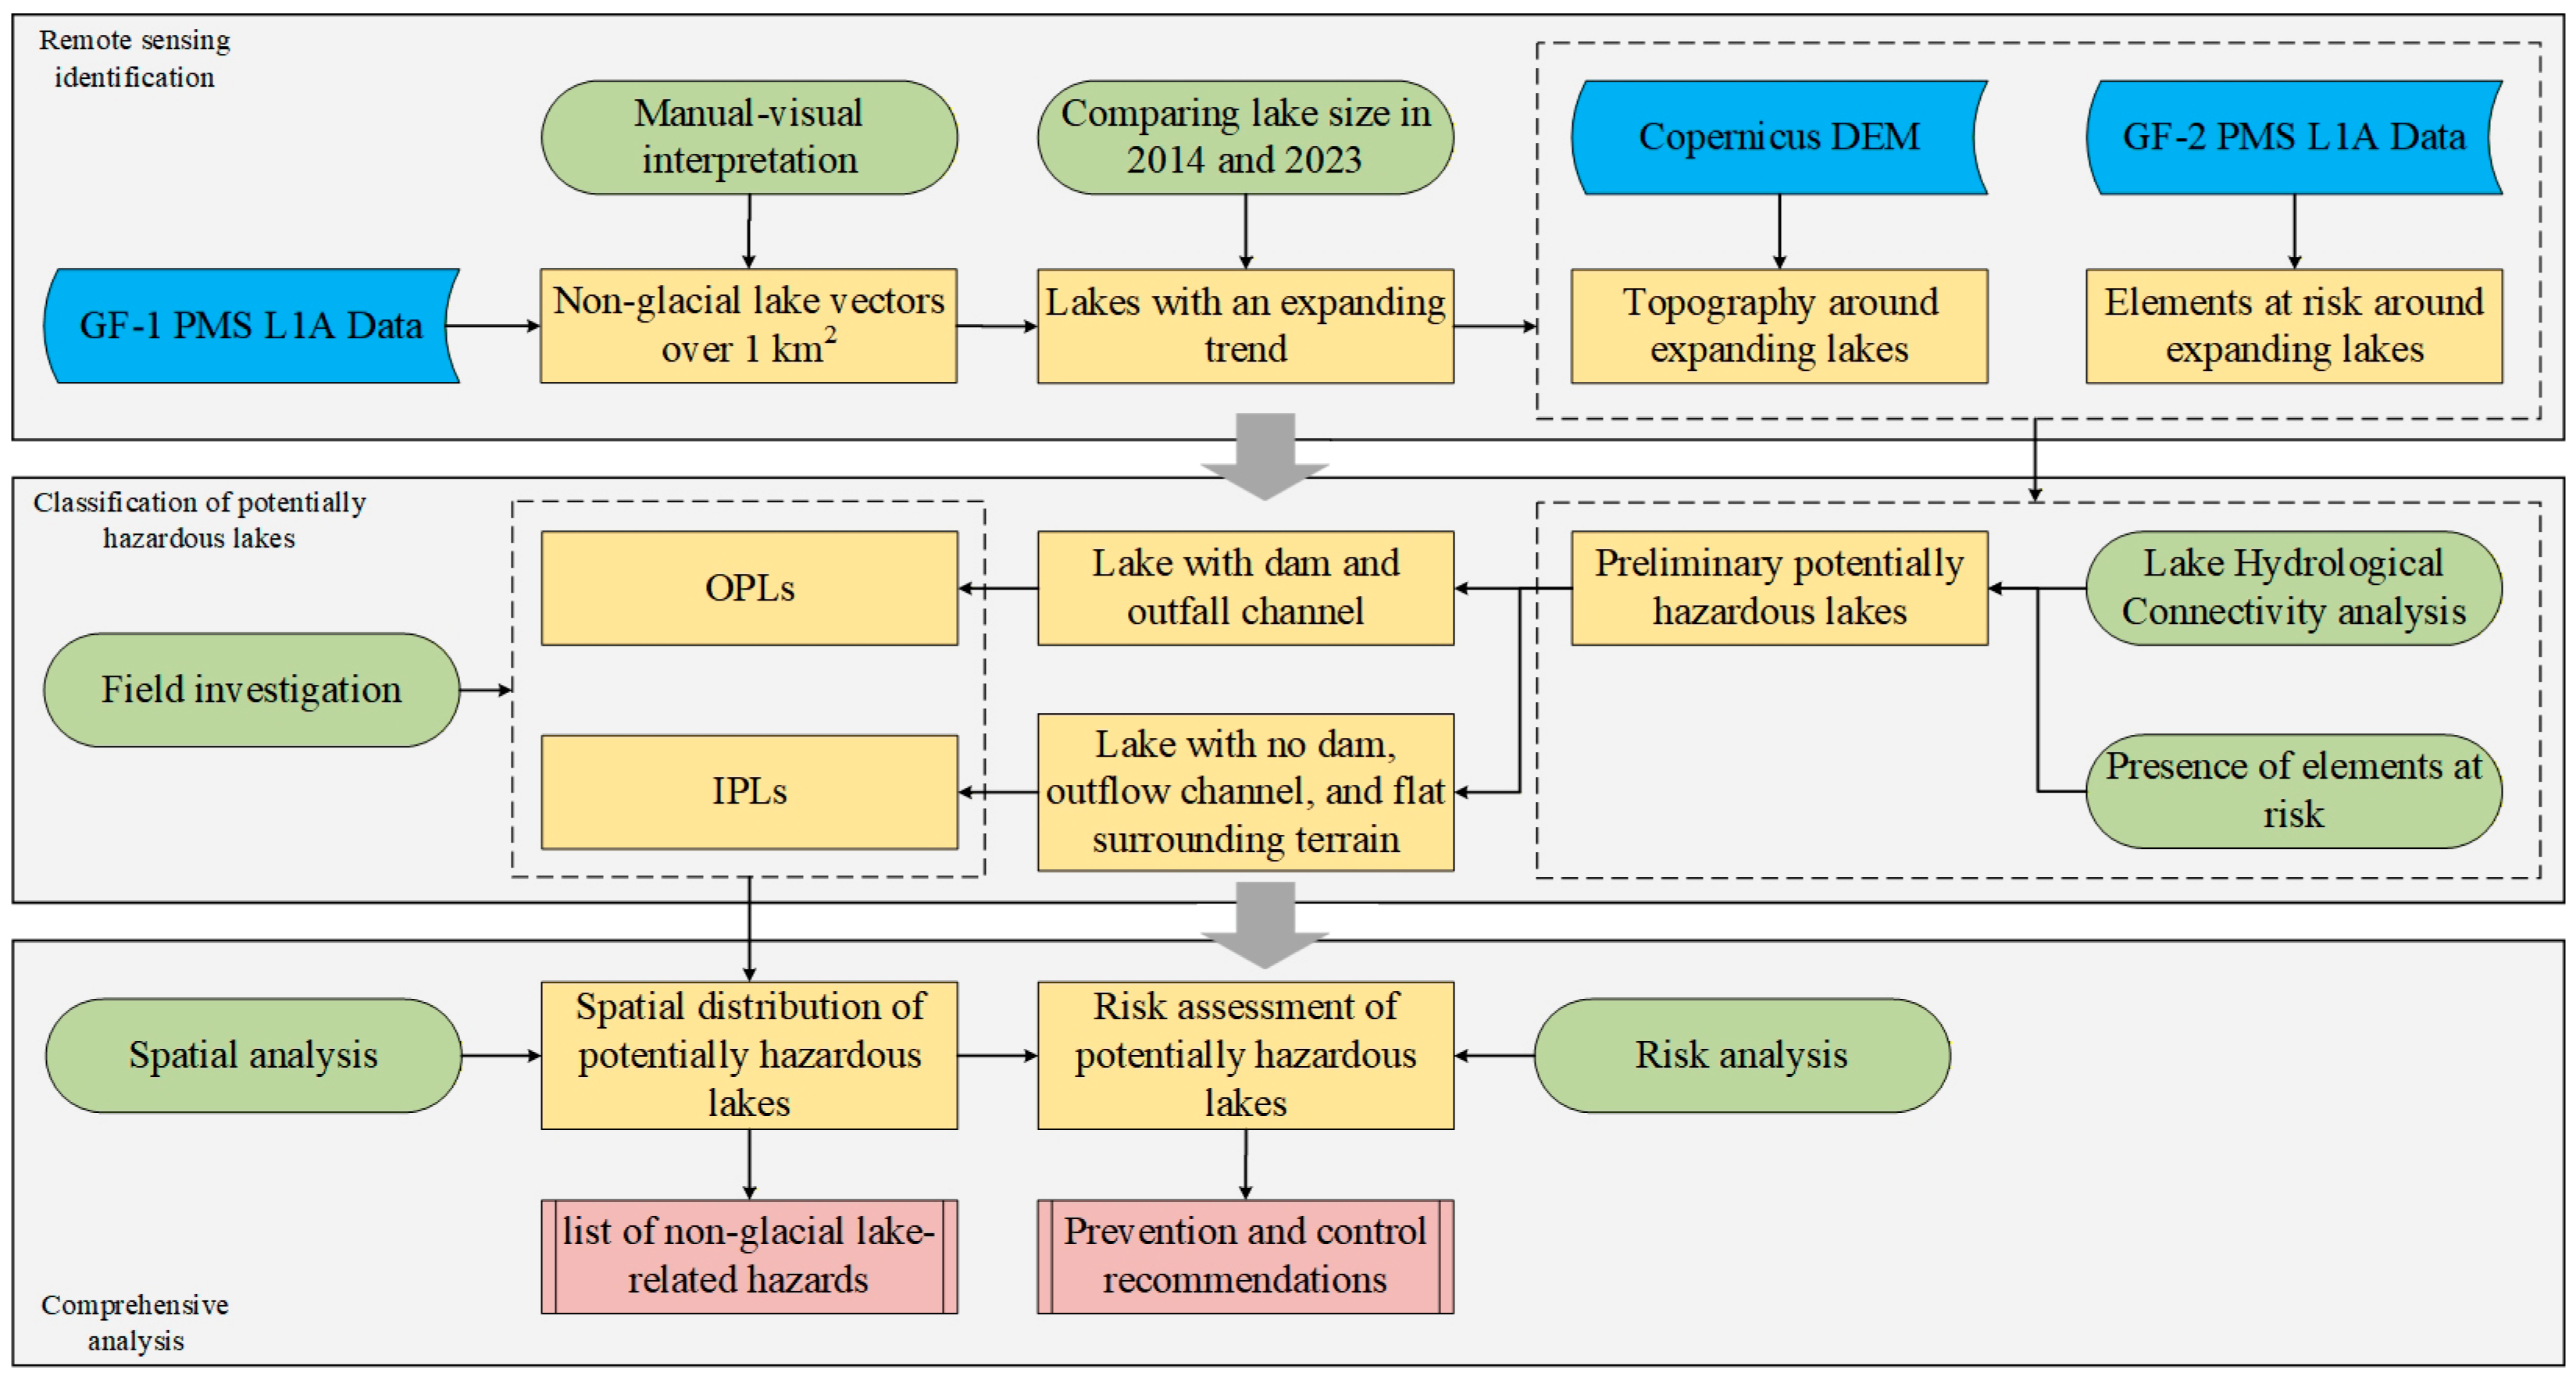
To investigate non-glacial lake-related hazards, this study proposes a scientific research framework (Figure 2) for identifying potential risks, categorizing existing non-glacial lake hazards, and conducting risk assessments.
Figure 2.
Flowchart for extraction and analysis of non-glacial lake-related hazards.
Initially, manual visual interpretation of the processed GF-1 PMS L1A data for the TP region was conducted to extract vector data of non-glacial lakes larger than 1 km2 in 2014 and 2023. Through a comparative analysis of lake area changes, expanding lakes were identified. Next, to precisely identify potential hazards, CopDEM and GF-2 PMS L1A data were integrated to perform a hydrological connectivity analysis, revealing the drainage patterns and basin characteristics of the expanding lakes. By overlaying these findings with elements at risk (e.g., infrastructure and settlements), lakes presenting a threat were identified as preliminary potentially hazardous lakes. Subsequently, we categorized these potentially hazardous lakes into OPLs and IPLs based on the results of the hydrological analysis and topographic assessment. Field investigations were then conducted to validate the classification results. Finally, a spatial analysis was performed to examine the distribution patterns of these lakes, leading to the compilation of an inventory of non-glacial lake hazards on the TP. Based on the risk assessment, recommendations for future risk prevention and mitigation were proposed.
3.2.1. Non-Glacial Lake Mapping
One of the major challenges in mapping lakes on the TP is distinguishing non-glacial lakes from glacial lakes. While many studies have employed automated water body identification techniques, these methods often struggle to achieve high accuracy on the TP due to its complex terrain and diverse lake types [67,68,69,70]. To address this challenge, this study utilized high-resolution GF-1 PMS sensor data in conjunction with the global glacial lake inventory for cross-referencing [71,72]. Using manual visual interpretation, non-glacial lakes across the TP were accurately identified.
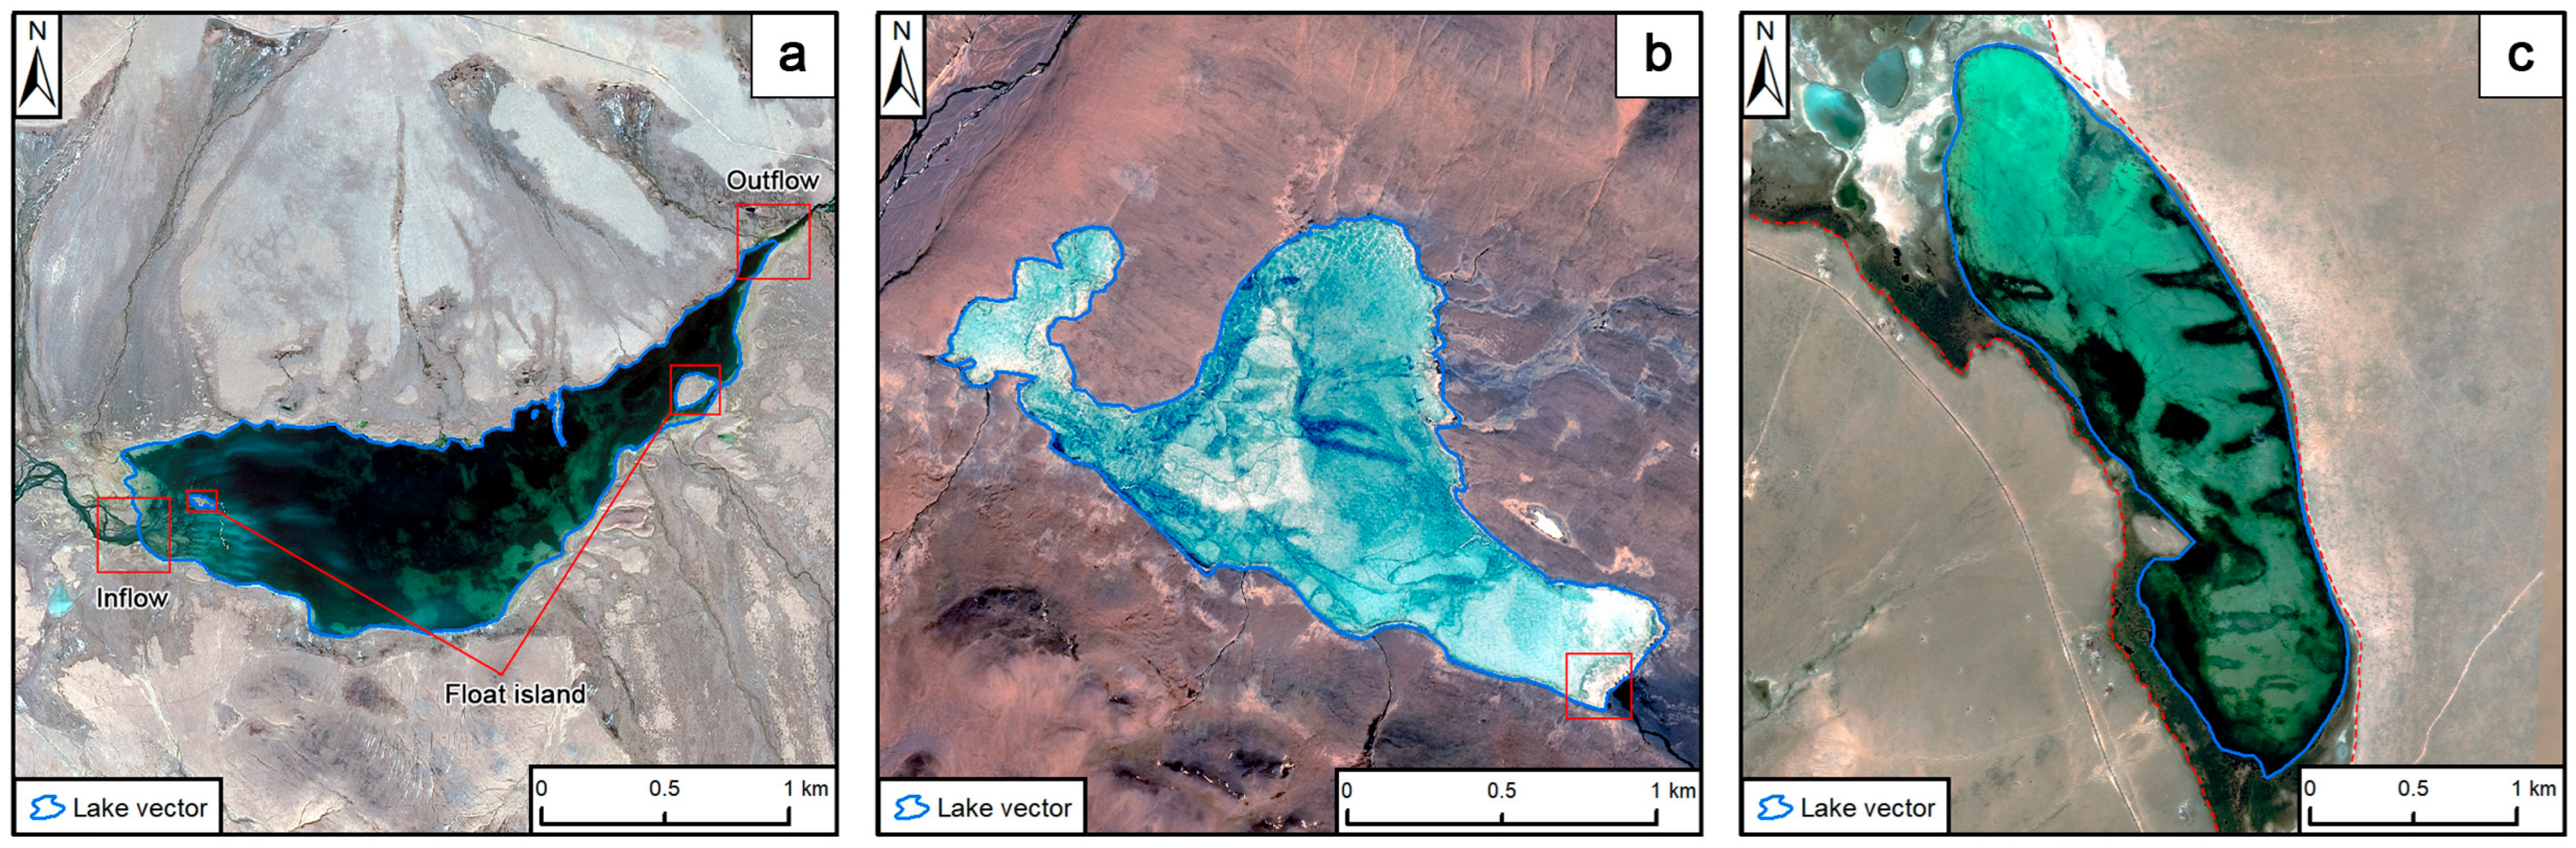
To ensure the accuracy of the interpretation, this study selected high-quality GF-1 PMS L1A images with minimal cloud coverage from September to December in 2014 and 2023 across the TP region, supplemented by WFV sensor data to fill any gaps in coverage. This specific period was chosen because it corresponds to the post-flood season, when lake levels are relatively stable, and before the onset of freezing, which is critical for the accurate shoreline identification. Currently, no rigid quantitative standards exist for lake boundary extraction, and the criteria for shoreline delineation in manual visual interpretation can vary among different interpreters. This process is particularly complex on the TP due to specific challenges, such as the intricate shoreline morphologies of lakes in tectonically active regions. Furthermore, distinguishing between ice-covered water bodies and shorelines during the freezing period is difficult. For drainage lakes, the precise interpretation of inflows and outflows can also significantly influence the resulting delineation. To address these issues and ensure dataset reliability, this study establishes a clear set of interpretation standards. As illustrated in Figure 3a, while complex shorelines were meticulously delineated, inflows and outflows were consistently handled by applying a smooth connecting line across their mouths; concurrently, any islands were excluded from the main lake polygon. For frozen lakes, the white ice margin near the shore was consistently included as part of the lake area (Figure 3b). For lakes showing signs of shrinkage with a visible former bank, particularly where there are significant surrounding wetlands exist, the current, receded shoreline was used as the definitive boundary (Figure 3c).
Figure 3.
Examples illustrating the delineation criteria for different lake types: (a) a drainage lake, showing the standardized treatment of inflows, outflows, and islands; (b) a frozen lake in a high-altitude region; and (c) a shrinking lake, delineated by its current shoreline. The red dotted line indicates the relict shoreline.
Due to potential inaccuracies arising from mixed-pixel effects in multi-resolution imagery and the influence of short-term, intense precipitation on lake area, establishing a quantitative threshold to define significant lake change is essential. This study employed a percentage change method based on the statistical characteristics of the compiled lake dataset. The rate of change for each lake between the two periods was calculated using the formula:
where represents the lake area in 2023 and is the area in 2014. Based on this calculation, a threshold of 1% was used to classify the lakes’ dynamic status. A lake was categorized as expanding if its change rate exceeded 1%, shrinking if the rate was below −1%, and stable if the change fell within the range of ±1%.
3.2.2. Non-Glacial Lake-Related Hazard Classification
Following the identification of lake boundaries, a systematic classification of potential lake-related hazards was conducted. The initial step involved a comparative analysis of the lake extents between the two periods to identify all lakes that had undergone expansion. Subsequently, each of these expanding lakes was meticulously assessed using high-resolution GF-2 PMS L1A optical imagery in conjunction with CopDEM topographic data to categorize them into one of two distinct hazard types: “OPLs” or “IPLs”.
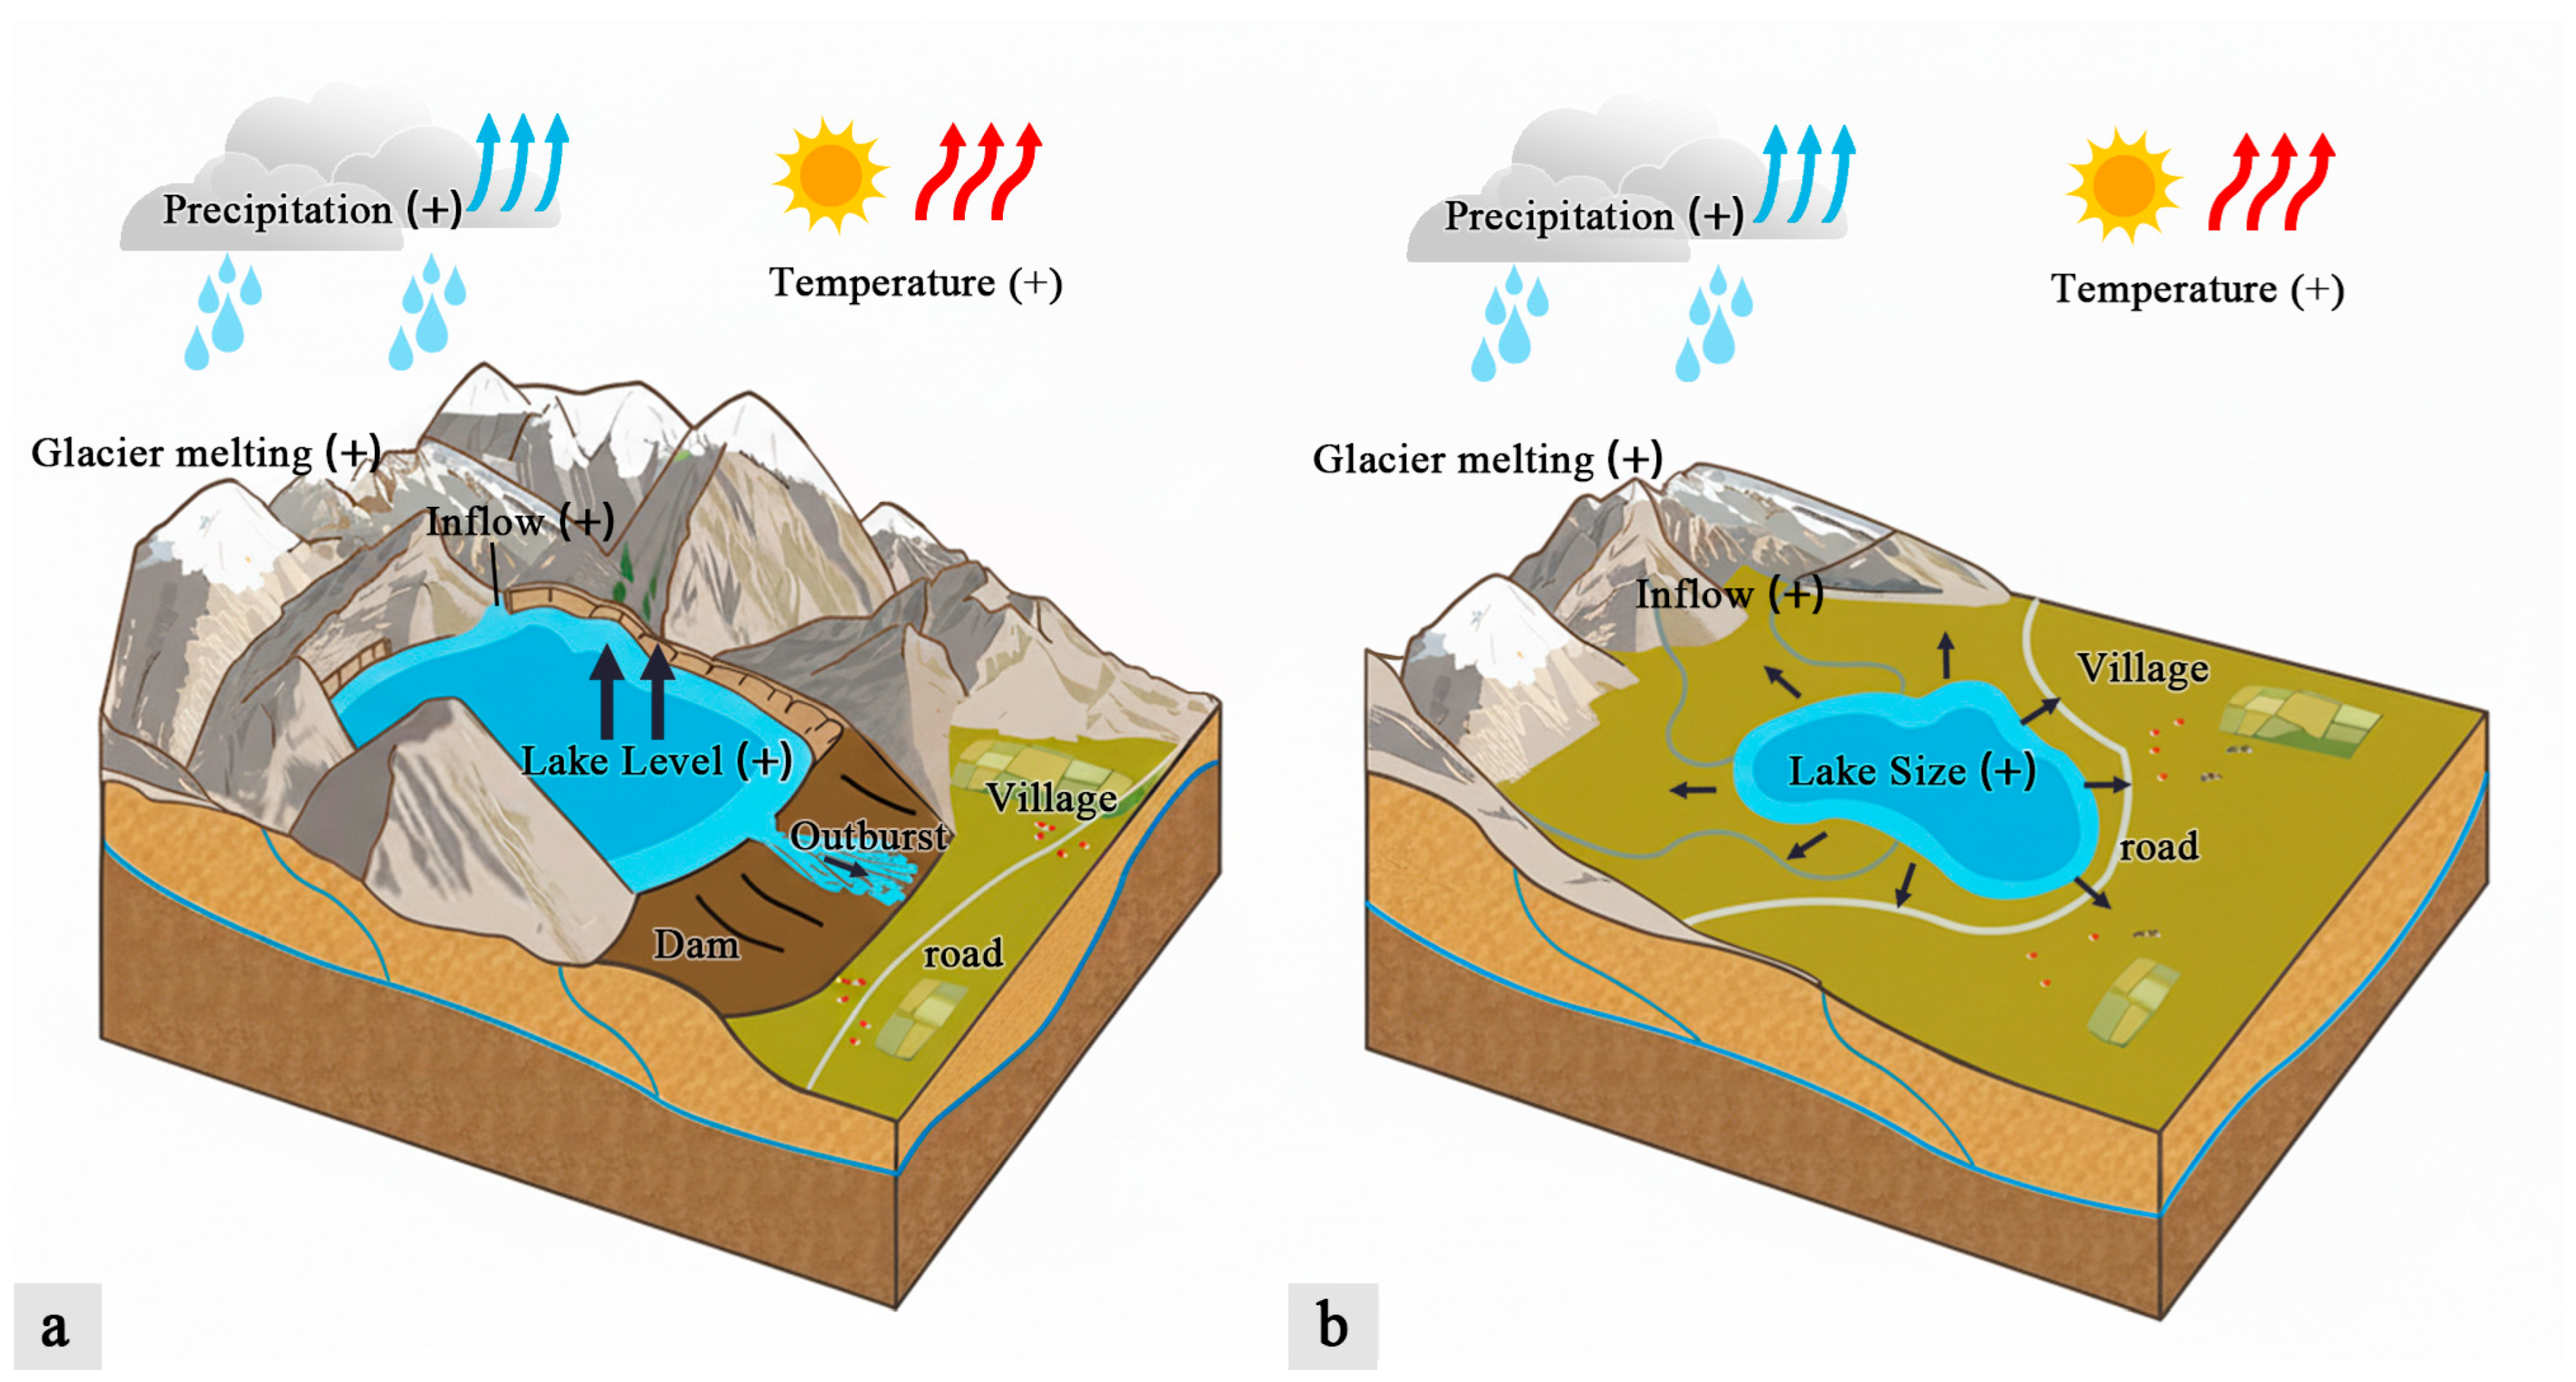
The first category, OPLs (Figure 4a), is characterized by a specific failure mechanism involving the hydrological overtopping and subsequent erosion of a natural dam. This classification applies to lakes that are impounded by a dam-like landform, are fed by surface runoff, and possess a potential overflow channel. The hazardous process is initiated when the lake’s water level rises beyond its maximum storage capacity, causing water to spill over the dam’s crest. This sustained outflow erodes the outlet and, through headward erosion, progressively degrades the structural integrity of the natural dam. This process can culminate in a rapid and catastrophic breach, releasing a large volume of water as a downstream flood. Variations in formation conditions result in differences in the surrounding topography and geomorphology. Generally, Glacial Lake Outburst Floods (GLOFs) are more typically triggered by external dynamic forces (e.g., ice avalanches), whereas non-glacial lake outbursts are predominantly driven by hydrological overflow.
Figure 4.
Conceptual diagram of non-glacial lake-related hazards: (a) the mechanism of an OPL, characterized by the breach of a natural dam due to overtopping and erosion; (b) the mechanism of an IPL, characterized by gradual expansion and submergence of surrounding areas in a basin without a distinct dam or outlet.
The second category, IPLs (Figure 4b), is defined by a combination of specific topographic and proximity-based criteria. The hazard mechanism here is not a sudden dam failure, but the gradual submergence of surrounding areas. A lake is classified as an inundation-prone hazard if it meets the following conditions: it is situated within a topographic depression that functions as the terminal point of its watershed catchment, it lacks a distinct confining dam or a natural outflow channel that would regulate its maximum level, and there are critical assets (elements at risk), such as roads, buildings, or pastureland, located along its immediate shoreline. The hazard manifests as the lake expands due to a positive water balance, with its rising water level and expanding surface area slowly encroaching upon and submerging the adjacent infrastructure and land.
3.2.3. Lake Risk Assessment
The variability of lake water bodies is governed by a complex interplay of meteorological factors, including precipitation, glacier meltwater, evaporation, surface runoff, and groundwater exchange [73]. However, conducting robust risk assessments for lakes on the TP is fraught with difficulties. A primary challenge is the scarcity of in situ meteorological data across this vast and remote region, which limits the accurate quantification of these climatic drivers [74]. Consequently, parameterizing multi-factor models that aim to simulate and predict lake dynamics is a significant challenge. Given these challenges, this study adopts a targeted lake risk assessment methodology that differentiates its analytical approach according to the hazard type: for OPLs, it prioritizes intense, short-term precipitation as the key triggering factor, whereas for IPLs, it assesses risk through the analysis of shoreline evolution across defined buffer zones to capture more progressive changes.
For OPLs, the risk assessment relies on a quantitative framework to project volume changes and precipitation thresholds. The evaluation is governed by the following equations:
In the proposed framework, represents the average annual increase in lake volume under normal conditions, derived from the total volume change () over the observation interval (, 2014–2023). The lake’s remaining storage capacity () is defined as the volume between the current lake surface (as of 2023) and the base elevation of the primary outflow spillway; in this calculation, denotes the lake dam crest elevation, represents the terrain elevation between the dam crest datum and the lake surface, and is the pixel area of the terrain data. Regarding the threshold calculations, denotes the maximum rainfall required to fill the remaining capacity , where is the catchment area, is the runoff coefficient, and is the current lake surface area (as of 2023). Additionally, estimates the projected flood-season precipitation based on the region’s average annual precipitation () and flood-season coefficient ().
Based on these parameters, the outburst risk is evaluated from three distinct perspectives:
- Normal Climatic Conditions: The projected is compared with to estimate the time frame until the lake might overtop under persistent, average climatic conditions.
- Historical Extreme Conditions: The calculated is compared against historical maximum daily precipitation records () for the region. This assesses the likelihood of an outburst triggered by the recurrence of known extreme weather events.
- Future Extreme Conditions: The potential impact of climate intensification is assessed by comparing the projected with the calculated . This evaluates the risk level under plausible future extreme scenarios.
For IPLs, the risk assessment methodology addresses the gradual nature of the hazard, allowing for the potential relocation of affected populations and assets. The primary risk is determined not only by the proximity of administrative units and infrastructure to the expanding shoreline but also by the volumetric growth of the lake, which drives the inundation process. To provide a comprehensive assessment, this study employs a dual-approach combining horizontal shoreline analysis with vertical altimetry and volumetric estimation.
To quantify the rate of planar expansion, the Digital Shoreline Analysis System (DSAS) [75] was utilized. Specifically, the End Point Rate (EPR) was calculated to determine the shoreline change rate based on the distance between shoreline positions at two points in time (2014 and 2023), disregarding intermediate variations. The EPR is computed according to the formula:
where is the end point rate of shoreline change for transect between times and ; and are the distances from a baseline to the shoreline intersection points on transect at times and , respectively; and is the time interval between the two dates.
Solely analyzing horizontal expansion provides an incomplete assessment of the hazard intensity. Therefore, monitoring changes in water level and water storage is critical for understanding the hydrological driving forces behind the inundation. To retrieve water levels, this study utilized CryoSat-2 L2 GDR Baseline E data. The orthometric height of the lake surface () is calculated as follows:
where is the satellite altitude; is the range distance from the satellite to the lake surface; and refers to the geoid undulation (EGM2008) relative to the WGS84 ellipsoid. represents the sum of geophysical corrections applied to ensure accuracy, including corrections for wet and dry troposphere, ionosphere, solid Earth tide, ocean loading tide, and pole tide, as specified in the CryoSat-2 handbook [76].
Based on the derived water levels and the lake surface areas extracted for 2014 and 2023, the change in lake water storage () was estimated using the truncated pyramid formula [77]:
where and represent the water levels, and and represent the lake areas for the years 2014 and 2023, respectively.
Integrating the directional shoreline expansion rates with the established hydraulic trends, the inundation risk was analyzed by establishing three distinct buffer zones. This approach provides a spatially explicit basis for evaluating potential impacts:
- A 50 m buffer zone is analyzed to represent the maximum potential inundation extent under normal climatic variability.
- A 250 m buffer zone is used to assess the maximum potential inundation extent within a year under extreme climatic conditions.
- A 1000 m buffer zone is delineated to evaluate the potential long-term inundation range, identifying areas at risk from sustained lake expansion over multiple years.
4. Result
4.1. Temporal and Spatial Variations in Non-Glacial Lakes
As of 2023, a total of 1352 non-glacial lakes larger than 1 km2 were identified on the TP, covering a total area of approximately 49,628.43 km2 (Table 2). This constitutes about 2% of the plateau’s total landmass of approximately 2.5 million km2. The spatial distribution of these lakes is highly concentrated within the Inner TP Basin, which hosts 909 of the lakes. The total lake area in this endorheic basin is approximately 35,055.87 km2, accounting for 70.64% of the total lake area across the entire TP. The Yellow River Basin contains the second-largest lake area, with a total of approximately 6827.79 km2, which represents 13.76% of the plateau’s total. The remaining basins hold comparatively smaller total lake areas.
Table 2.
Statistical table of lake changes by basin.
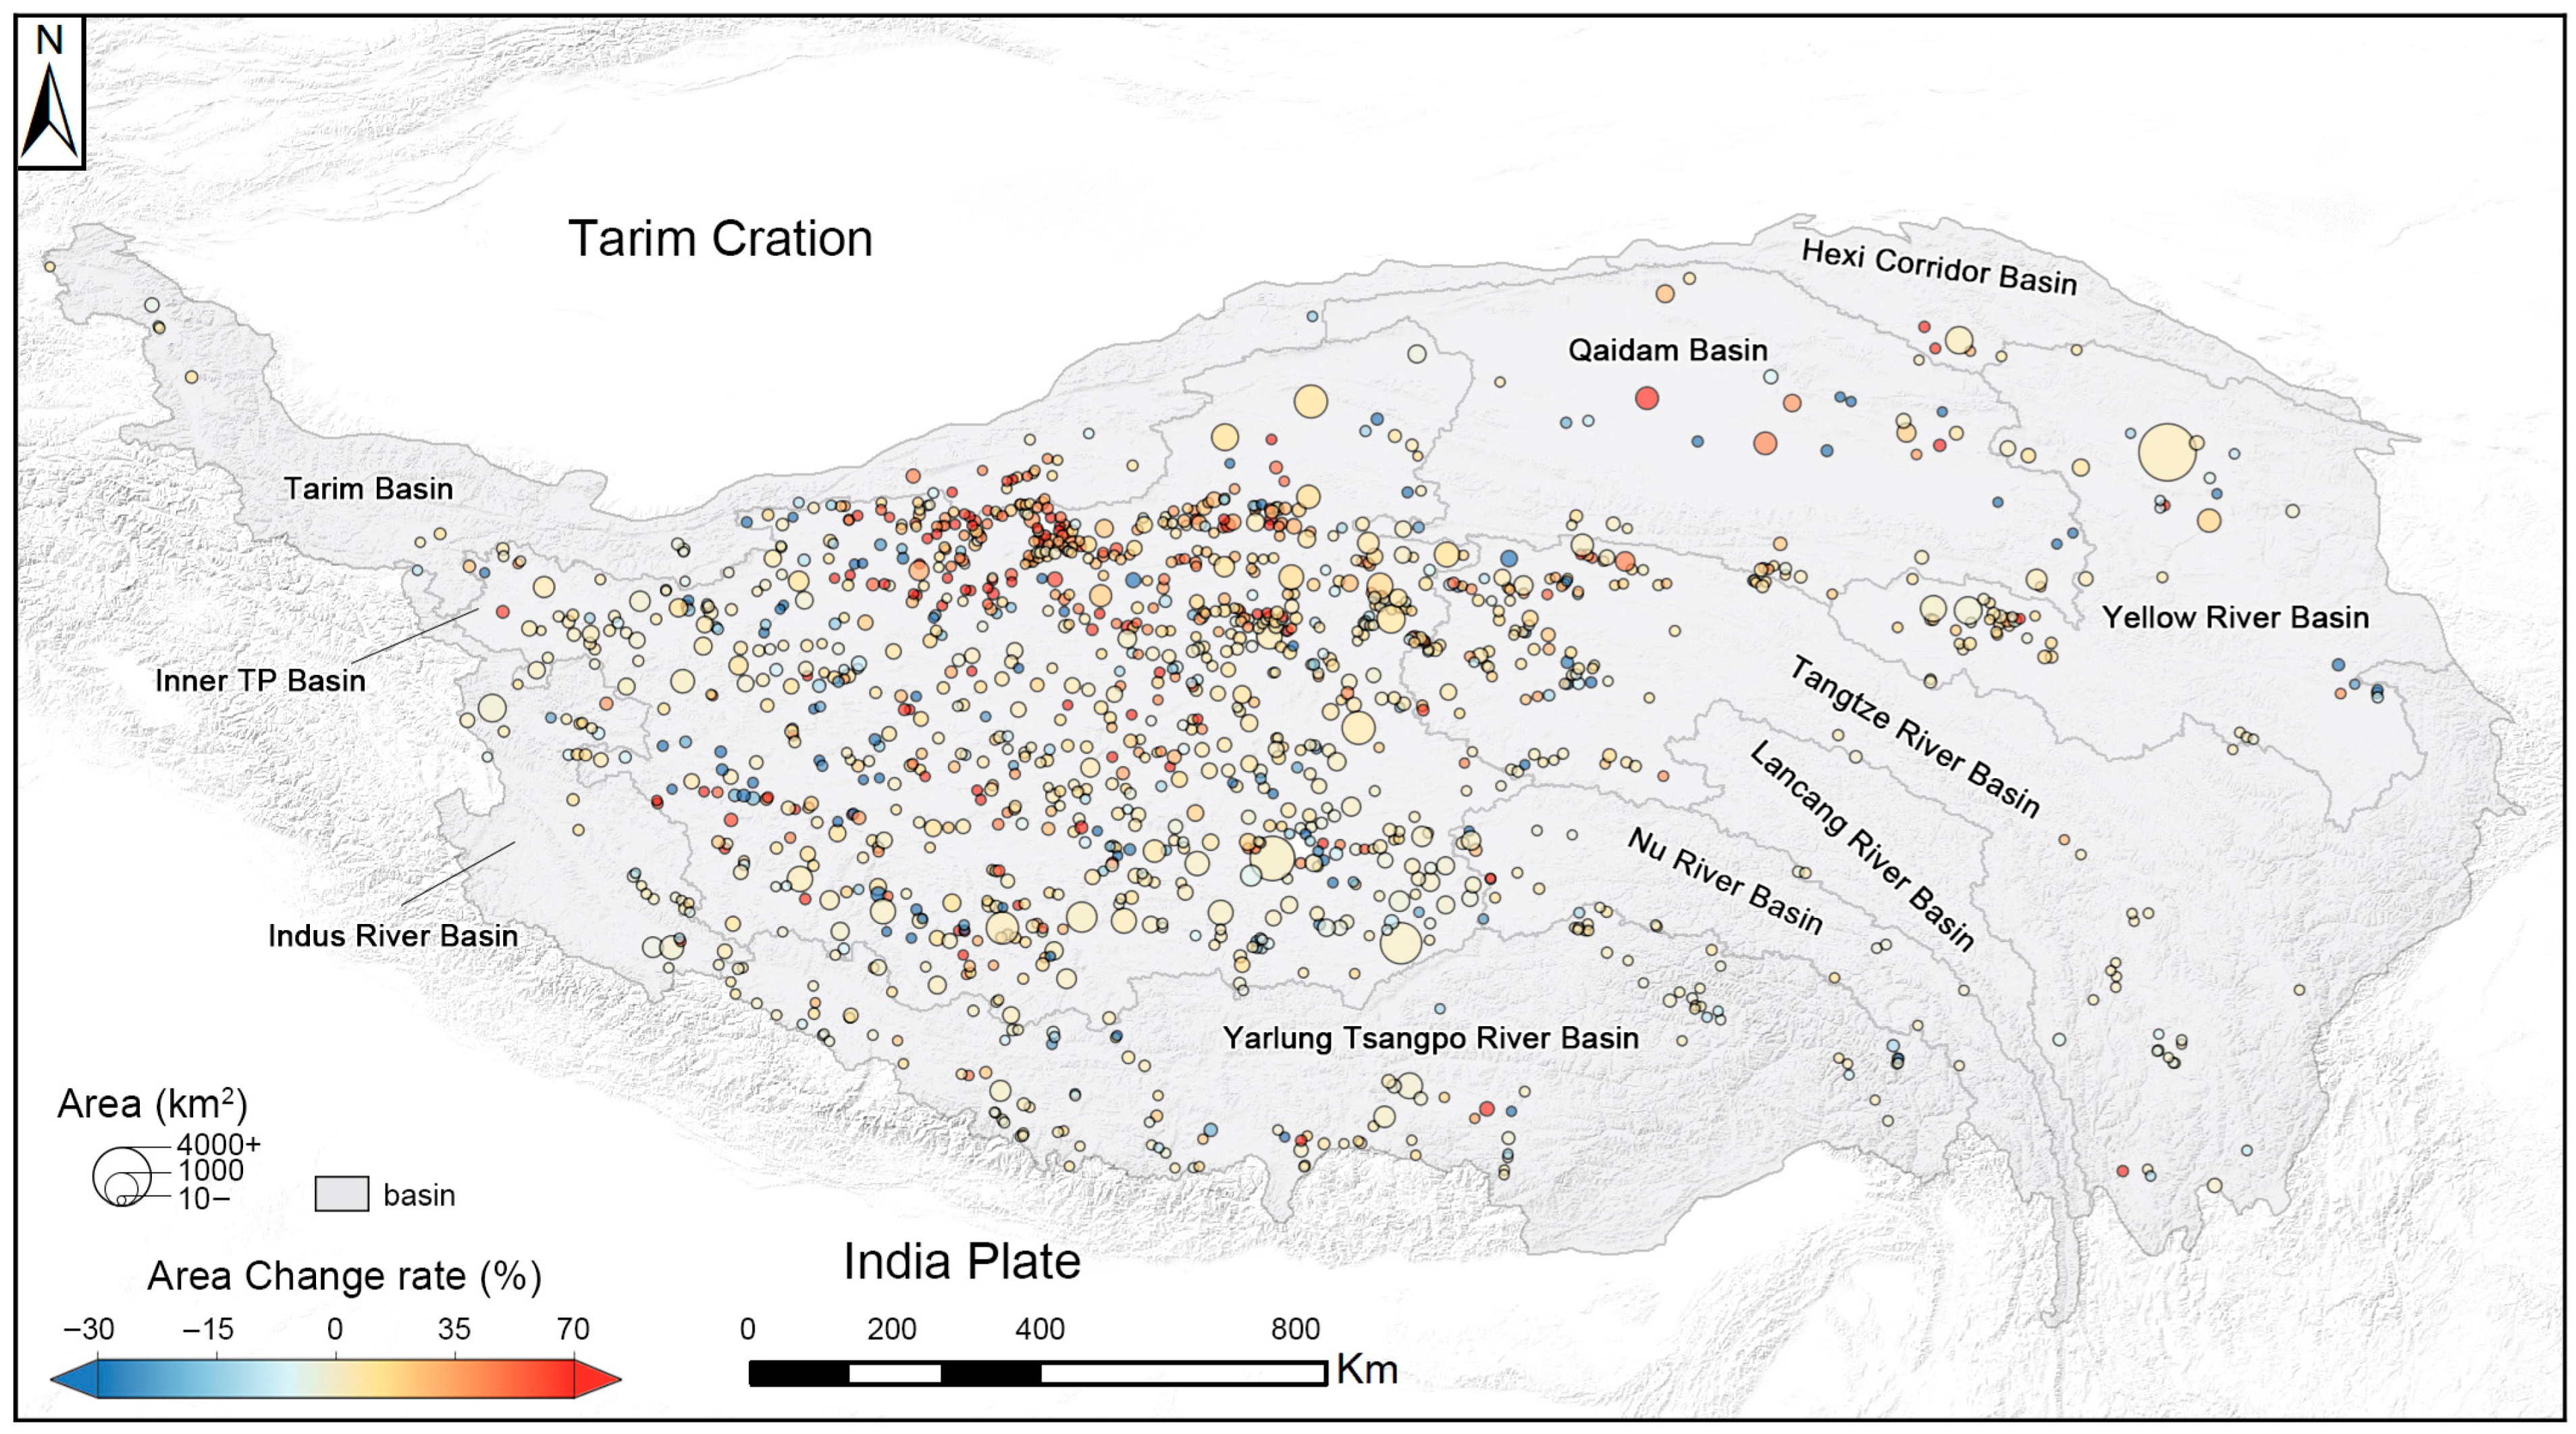
From 2014 to 2023, the lakes across the TP exhibited a distinct overall trend of expansion. As illustrated in Figure 5, lakes with the highest expansion rates show a clear geographical clustering. They are primarily concentrated in the northern Inner TP Basin, particularly in the region bordering the Tarim Basin, and are predominantly small-sized lakes. In contrast, the expansion rates for most medium- and large-sized lakes across the plateau are comparatively more moderate. In the southeastern part of the TP, where lake distribution is sparser, the vast majority of lakes show minimal change or slow rates of expansion.
Figure 5.
Spatio-temporal overview of non-glacial lakes (>1 km2) on the TP. The size of each circle corresponds to the lake’s area, and the fill color indicates the rate of area change.
Quantitatively, the total area of non-glacial lakes on the TP increased from 46,788.90 km2 in 2014 to 49,628.43 km2 in 2023, a net increase of 2839.53 km2. This corresponds to an overall area change rate of 6.07% for the period. An analysis of the 1352 lakes reveals that 940 (69.53%) expanded, 314 (23.22%) shrank, and only 98 (7.25%) remained relatively stable. The magnitude of this overall expansion is substantial, exceeding the surface area of Siling Co, the second-largest lake on the TP.
At the basin scale, the most significant relative change occurred in the Qaidam Basin, which saw a remarkable 16.36% increase in lake area, largely driven by the expansion of its medium-sized lakes. The Tarim Basin followed with the second-highest rate of change at 10.56%, where the most rapidly expanding lakes were concentrated along its southern boundary with the northern Inner TP Basin. In terms of absolute area increase, the Inner TP Basin was dominant. While its overall change rate was a more modest 5.92%, its lakes expanded by a total of 1960.60 km2, an amount that is an order of magnitude greater than any other basin. This observation is consistent with research by Zhang et al., which suggests the interior of the TP is becoming increasingly wet [16]. In stark contrast, the Indus River Basin was the only basin to show a net negative change in lake area. Remarkably, even within this arid region where evaporation significantly exceeds precipitation [78], the number of expanding lakes was nearly equal to the number of stable and shrinking lakes, further illustrating the profound effect of global climate change on the TP.
4.2. Lake Hazard Assessment
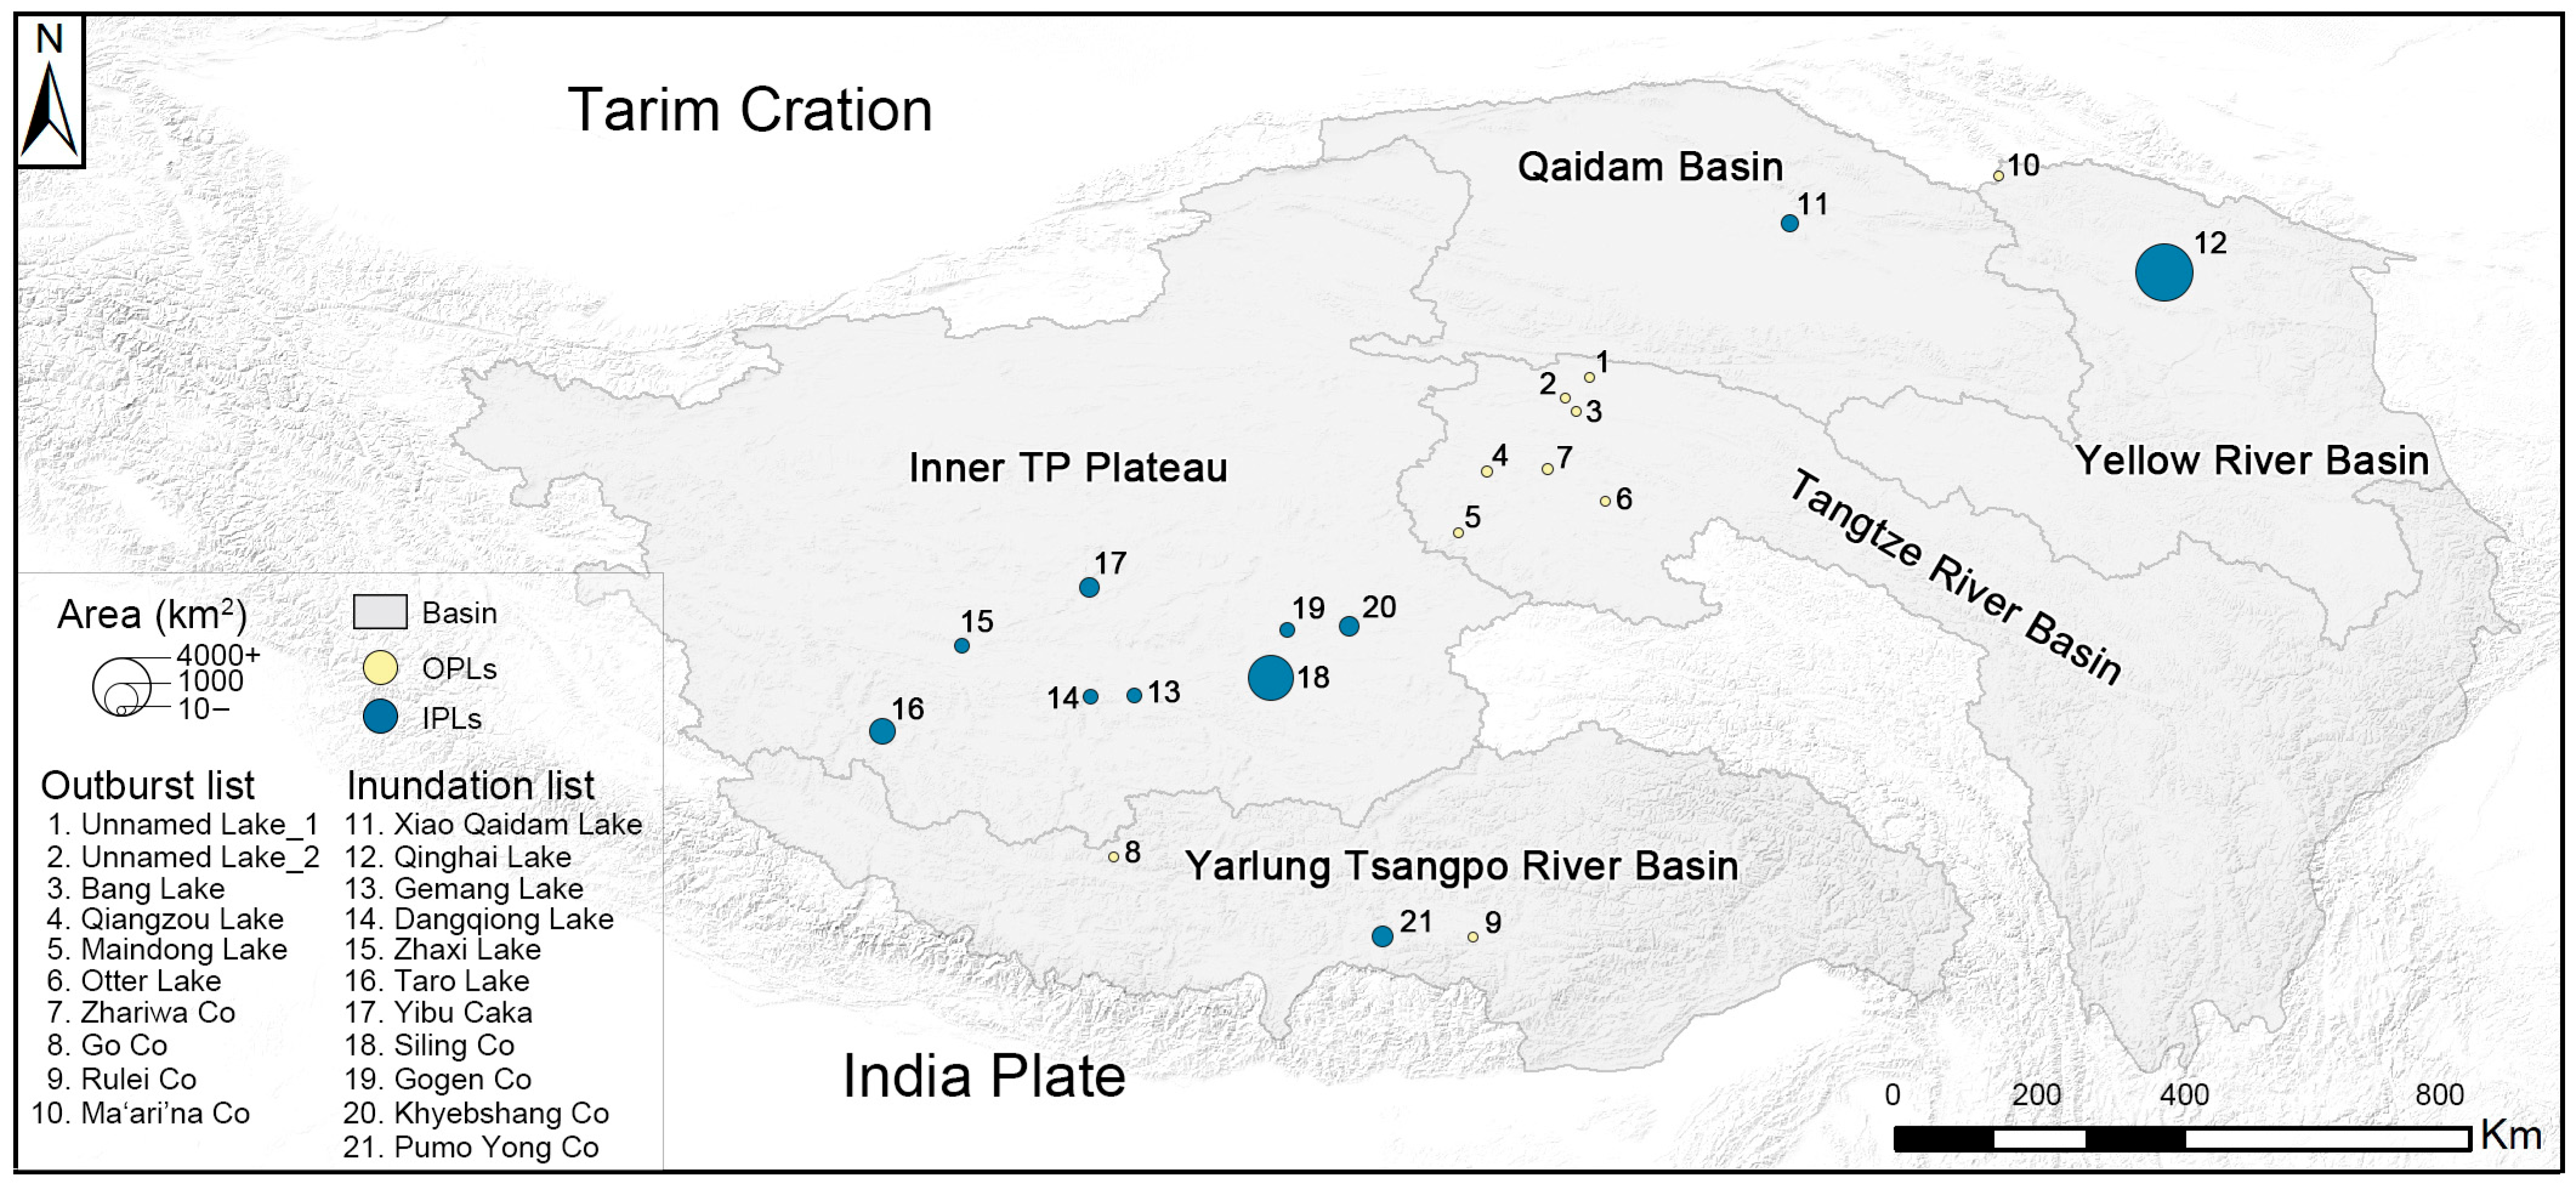
Based on established criteria, this study identified 10 non-glacial lakes in the TP region as OPLs and 11 as IPLs. The spatial distribution of these lakes is distinct: IPLs are concentrated in the southeastern Inner TP Basin, while OPLs are clustered in the western Yangtze River basin, with only a few scattered occurrences in the Qaidam, Yellow River, and Yarlung Tsangpo River basins. The two hazard types also exhibit clear morphological differences. IPLs are predominantly medium-to-large, exceeding 100 km2, with the largest being Qinghai Lake at 4531.80 km2. In contrast, OPLs are primarily small, with most measuring less than 10 km2. Figure 6 illustrates the detailed spatial distribution of the identified hazardous lakes across the TP.
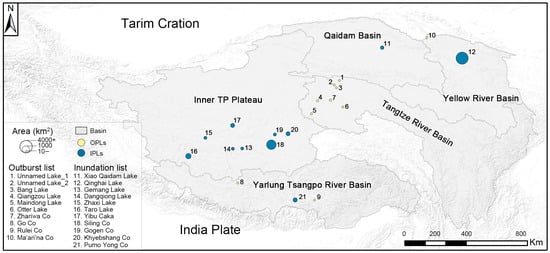
Figure 6.
Schematic diagram of potential non-glacial hazard lakes on the TP.
4.2.1. OPLs Risk Assessment
To quantify the magnitude of precipitation events required to trigger an outburst, key rainfall parameters were derived from the ERA5-Land reanalysis dataset [79], with results presented in Table 3. The risk assessment compares each lake’s remaining storage capacity () against potential water inputs. Using a runoff coefficient () and a flood-season precipitation coefficient ()—based on the 2018 rapid rise in Salt Lake—we calculated both the outburst-triggering threshold () and projected extreme flood-season precipitation ().
Table 3.
Detailed characteristics of the 10 identified potential outburst lakes, including their location, precipitation data, catchment area, lake area, average annual volume change, and remaining storage capacity. The abbreviated lake names used in the table (Lake.1–Lake.10) correspond to Unnamed Lake_1, Unnamed Lake_2, Bang Lake, Qiangzou Lake, Maindong Lake, Otter Lake, Zhariwa Co, Go Co, Rulei Co, and Ma’ari’na Co, respectively.
Under normal climatic conditions, the immediate risk is minimal, as the average annual volume increase () remains substantially lower than the available storage () for all ten lakes. Even in the most critical case, Rulei Co, the annual increase accounts for only one-quarter of its remaining capacity. Regarding single-day extreme events, the calculated is an order of magnitude higher than the historical maximum daily precipitation () across all lakes, suggesting a low probability of a sudden breach caused by isolated storms.
However, under the future extreme flood-season scenario (defined by 1.65 times the average rainfall), the risk increases significantly. In this scenario, seven lakes (Unnamed Lake_1, Unnamed Lake_2, Maindong Lake, Otter Lake, Go Co, Rulei Co, and Ma’ari’na Co) are identified as potential outburst candidates. Spatially, these lakes are concentrated in the eastern Yangtze and Yellow River basins and the southern Yarlung Tsangpo River Basin. The remaining three lakes (Bang Lake, Qiangzou Lake, and Zhariwa Co) maintain a lower risk profile, as their exceptionally large storage capacities () provide a buffer that exceeds even these extreme seasonal projections.
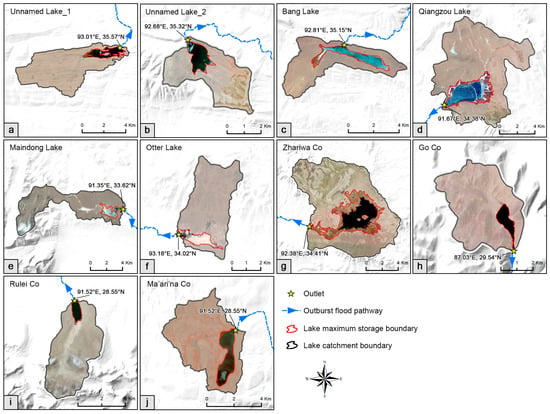
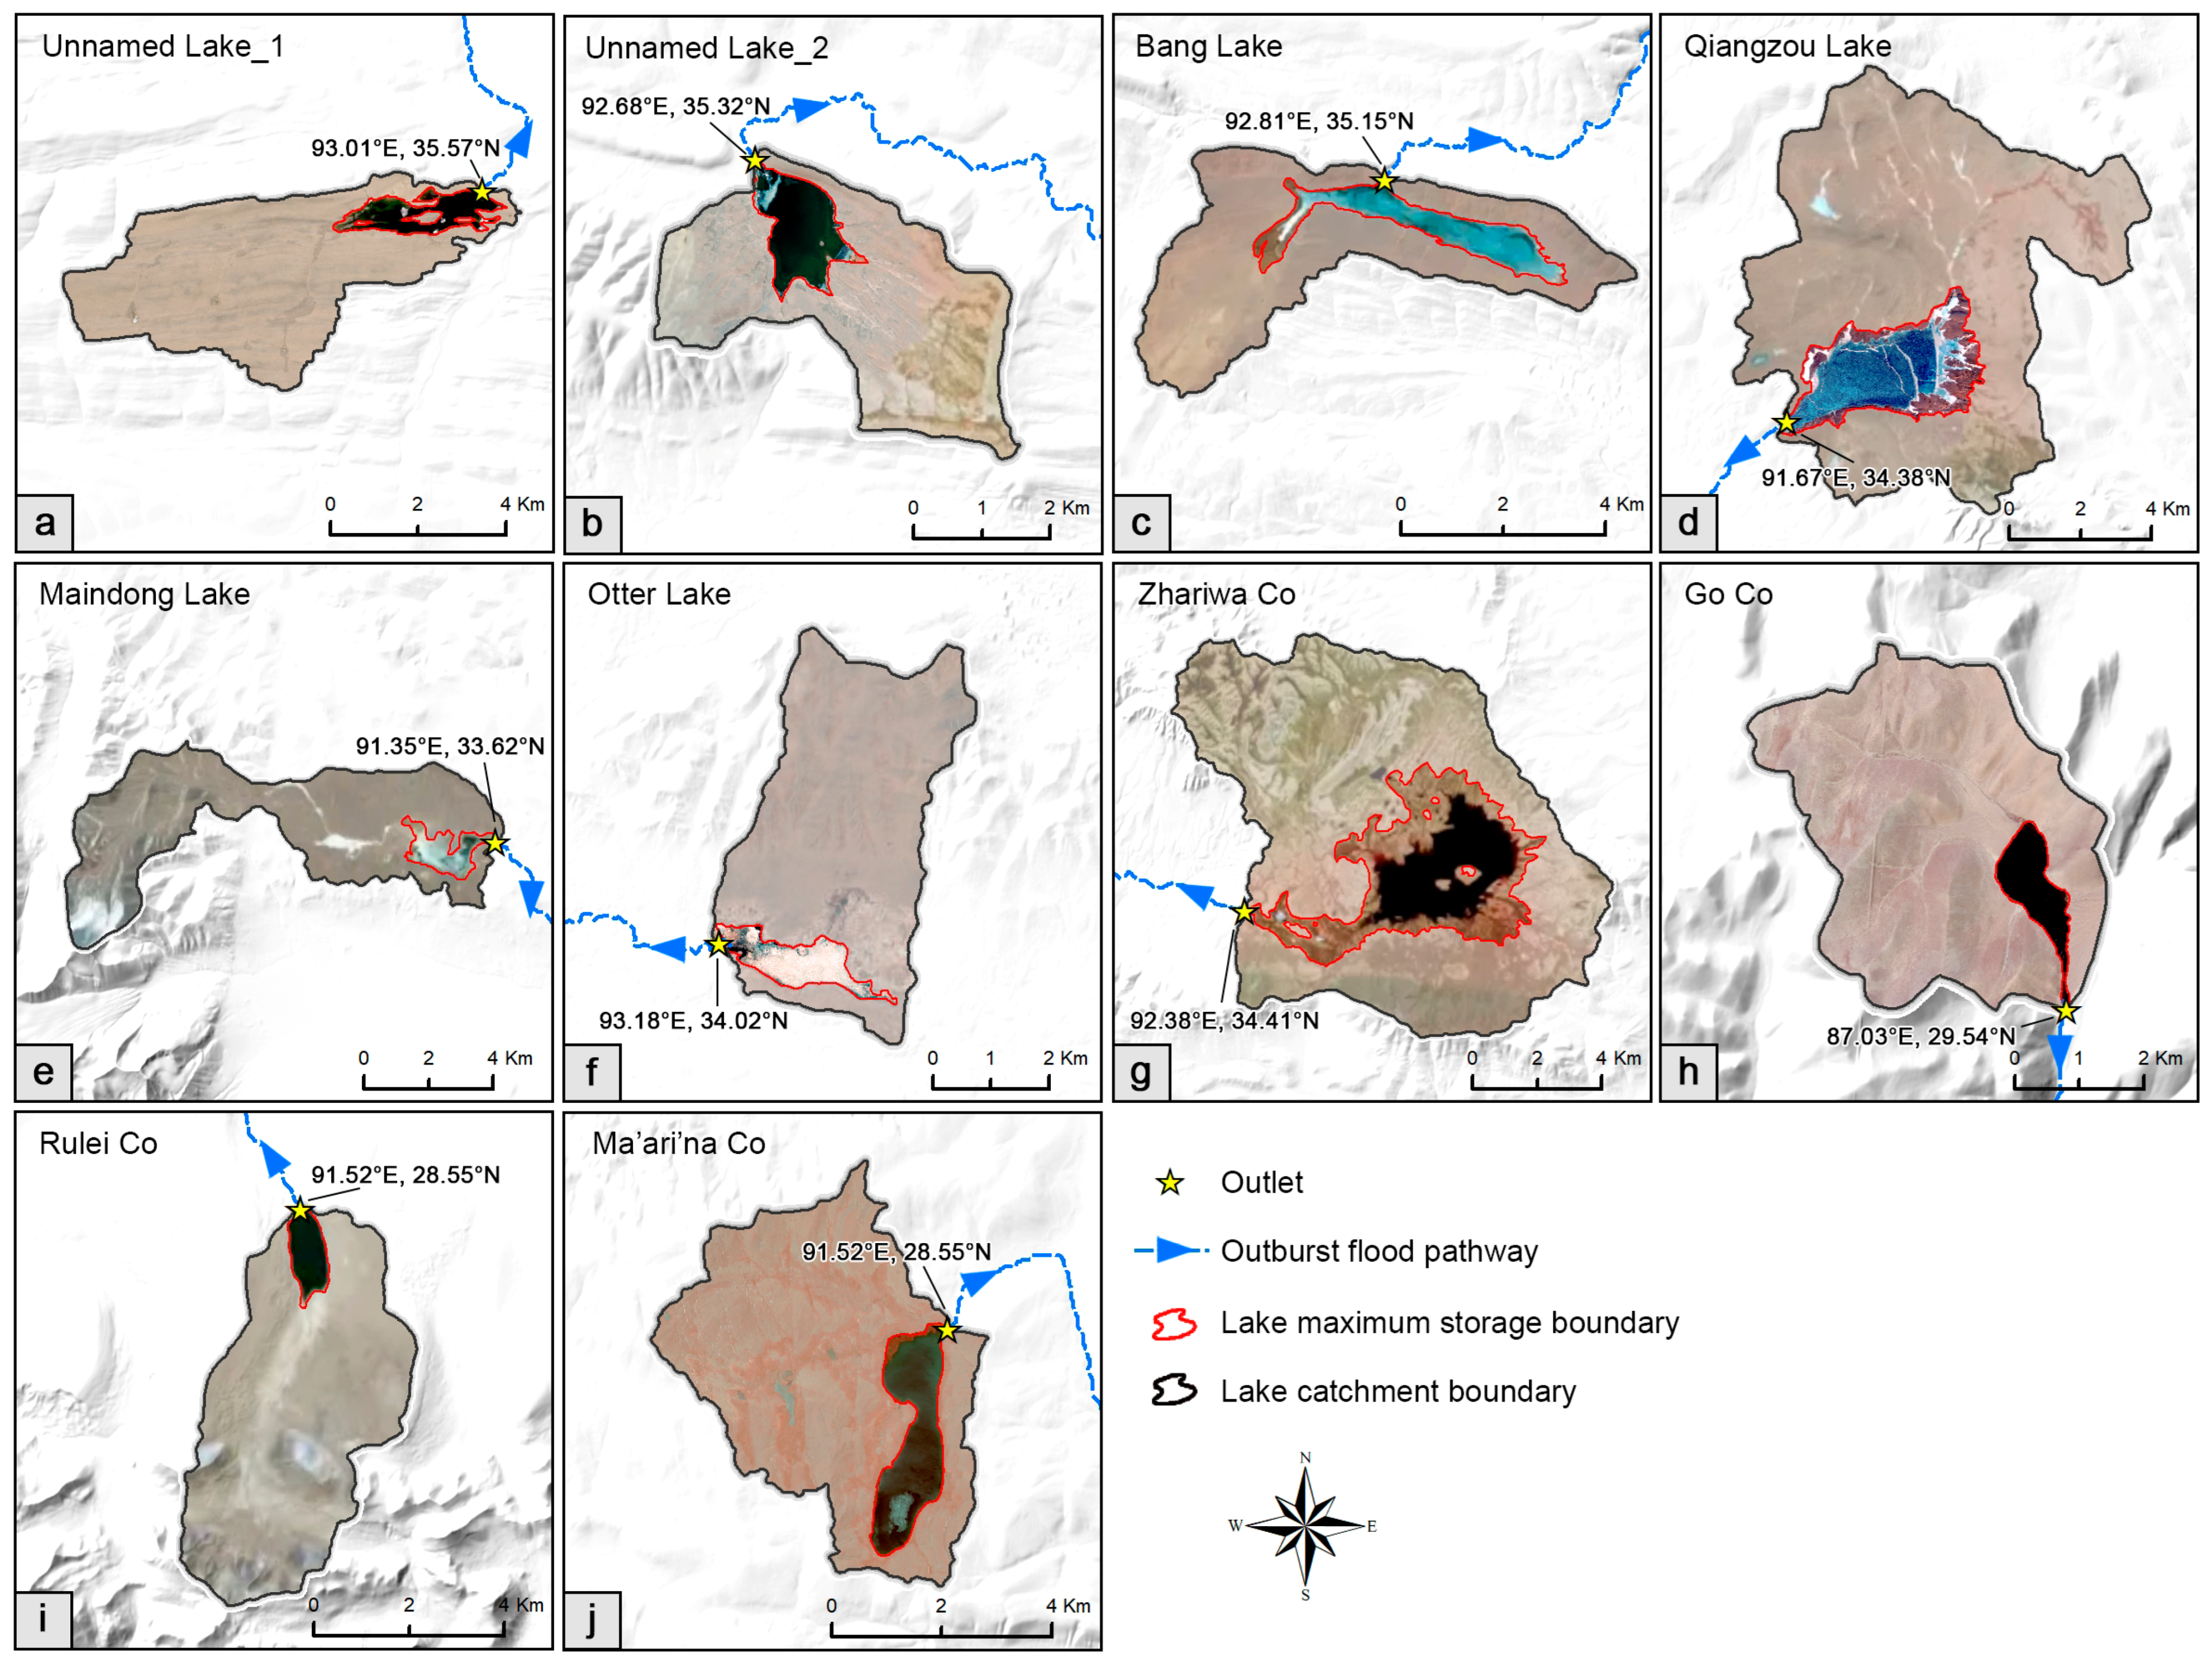
Of the seven lakes with outburst potential under an extreme flood-season scenario, three are classified as high-risk due to their proximity to downstream assets and specific hydraulic characteristics. Rulei Co (Figure 7i) is identified as the most critical, with a remaining storage capacity () of only 7.93 × 10⁵ m3 and a low outburst-triggering precipitation threshold () of 184.90 mm. Its current water level is approaching the maximum storage boundary, suggesting a high probability of an outburst within the year. The steep gradient of its potential flood path (34.89‰) indicates that an outburst would likely be a high-energy, rapid event, posing a substantial threat to the National Highway G560 and numerous pastoralist dwellings. Go Co (Figure 7h) also poses a high risk; although its remaining capacity is larger at 1.60 × 10⁶ m3, its outlet is located merely 50 m from pastoralist dwellings and the Provincial Highway S205. The channel’s steep gradient (15.21‰) would likely contribute to a destructive flood. Similarly, Otter Lake (Figure 7f) is also categorized as high-risk. Its projected extreme flood-season precipitation () of 869.70 mm is nearly double its triggering threshold of 478.08 mm. A potential outburst would threaten pastoralist dwellings and a branch of the Provincial Highway S313 located only 2.5 km downstream. Notably, its flood path has an exceptionally low gradient (0.68‰), suggesting that a breach would result in slow-moving but widespread inundation rather than a high-velocity flow.
Figure 7.
Detailed maps of the 10 OPLs (a–j), illustrating the outlet location (yellow star), the potential outburst flood pathway (blue dashed arrow), the maximum lake storage boundary (red polygon), and the lake catchment boundary (black polygon).
The outburst threat posed by the other four lakes is classified as either moderate or low, depending on downstream conditions and potential impact. Unnamed Lake_1 (Figure 7a) is classified as moderate risk. While its initial flood path has a relatively low gradient (2.37‰), the primary concern is its potential to trigger a cascading event. An outburst from this lake would flow into the downstream Salt Lake, which has already expanded substantially following the 2011 Zonag Lake outburst and now threatens the key National Highway G109 and the Qinghai–Tibet Railway. Although flood diversion channels have been constructed, the potential for a cascading disaster warrants a moderate-risk classification. The remaining three lakes, Unnamed Lake_2 (Figure 7b), Ma’ari’na Co (Figure 7j), and Maindong Lake (Figure 7e), are assessed as having a low immediate risk. For Unnamed Lake_2 and Ma’ari’na Co, the primary assets at risk (national highways and railways) are located over 27 km and 50 km downstream, respectively. These long flood paths would significantly mitigate the potential impact. In the case of Maindong Lake, its flood path only contains abandoned roads, presenting a negligible risk to current infrastructure.
The final three lakes assessed as having a low probability of outburst (Bang Lake, Qiangzou Lake, and Zhariwa Co) are characterized by large remaining storage capacities that are unlikely to be exceeded even under extreme precipitation scenarios. Based on this low probability and the absence of significant downstream assets, Bang Lake and Qiangzou Lake are assessed as having negligible risk. Zhariwa Co (Figure 7g), however, presents a unique case and is classified as moderate risk. Despite its low outburst probability, it is a large lake situated directly upstream from Tanggula Town, a major residential center and railway hub. A failure of this lake, however improbable, would release a volume of water orders of magnitude greater than that of the other lakes, posing a significant threat to the infrastructure and population of Tanggula Town. Therefore, its classification is elevated to moderate risk to reflect the high potential impact, underscoring the need for prioritized monitoring. A summary of the risk assessment for each lake is provided in Table 4.
Table 4.
Risk assessment for potential outburst lakes. Gradient refers to that of the lake outburst channel. The risk levels are defined as follows: H (High), M (Moderate), L (Low), and N (negligible). The abbreviated lake names used in the table (Lake.1–Lake.10) correspond to Unnamed Lake_1, Unnamed Lake_2, Bang Lake, Qiangzou Lake, Maindong Lake, Otter Lake, Zhariwa Co, Go Co, Rulei Co, and Ma’ari’na Co, respectively. Other abbreviations: NH (National Highway, e.g., NH-G109); PH (Provincial Highway, e.g., PH-S313); PD (Pastoralist dwellings).
4.2.2. IPLs Risk Assessment
We assessed the risk for the 11 identified IPLs using a dual-index system that integrates DSAS-derived horizontal shoreline change rates with CryoSat-2-derived vertical hydrological variations. Elements at risk were inventoried within 50 m, 250 m, and 1000 m buffer zones. The potential hazard intensity was evaluated by combining the local End Point Rate () at the nearest asset location with the magnitude of water storage change (). The hydrological monitoring results for the 2014–2023 period are presented in Table 5. Details and risk summary tables are shown in Figure 8 and Table 6.
Table 5.
Level and area changes for potential Inundation lakes. The abbreviated lake names used in the table (Lake.11–Lake.21) correspond to Xiao Qaidam Lake, Qinghai Lake, Gemang Lake, Dangqiong Lake, Zhaxi Lake, Taro Lake, Yibu Caka, Siling Co, Gogen Co, and Khyebsang Co, Pumo Yong Co, respectively.
Figure 8.
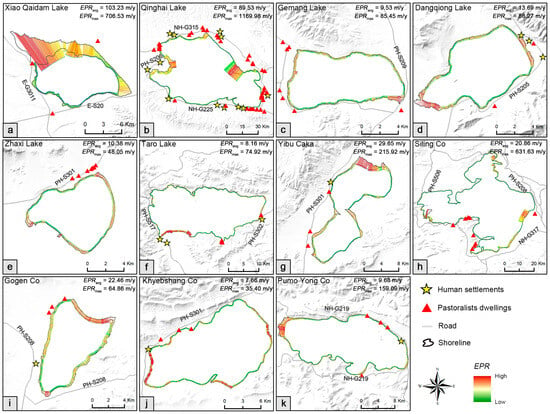
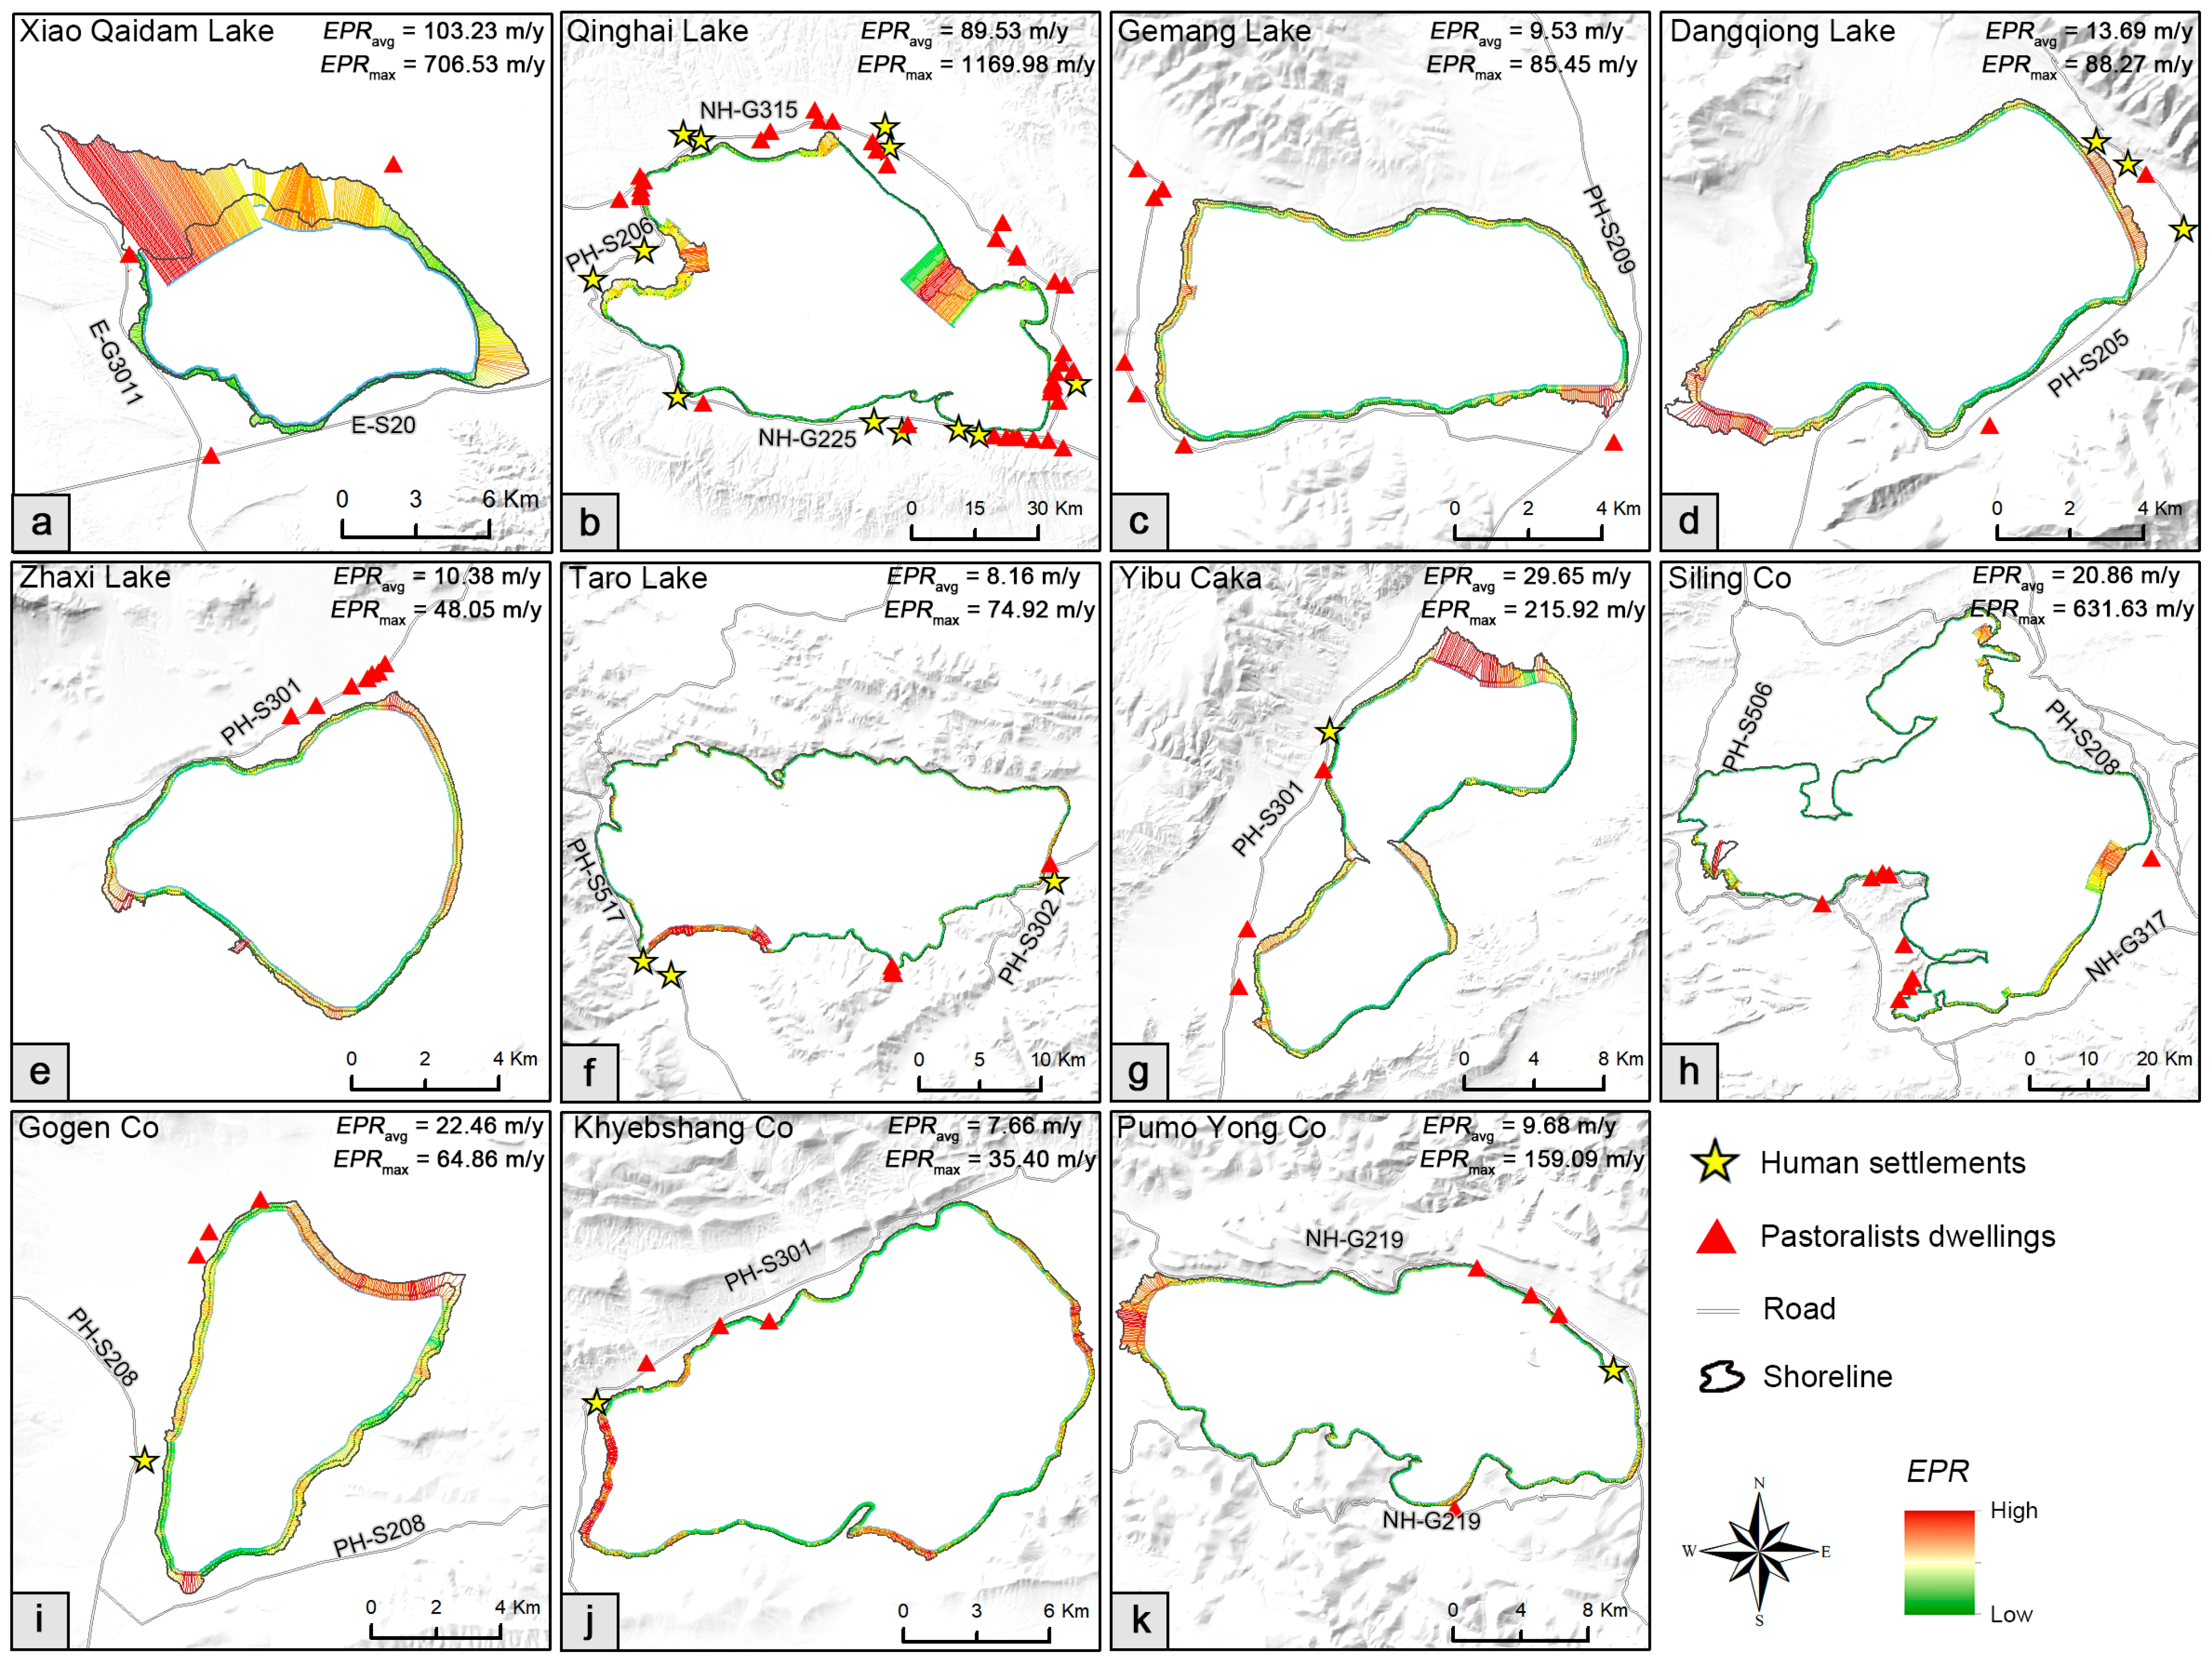
Overview of the 11 identified IPLs (a–k) illustrating shoreline dynamics and elements at risk. The colored transects represent shoreline change rates derived from the DSAS. Socio-economic assets are denoted by yellow stars (human settlements), red triangles (pastoralist dwellings), and gray lines (road networks). The black outlines indicate the shoreline positions in 2014 and 2023. Other abbreviations: NH (National Highway, e.g., NH-G109); PH (Provincial Highway, e.g., PH-S313); E (Expressway, e.g., E-G3011).
Table 6.
Risk assessment for potential Inundation lakes. represents the End Point Rate of the transect corresponding to the location of the nearest element at risk. The risk levels are defined as follows: H (High), M (Moderate), L (Low), and N (negligible). The abbreviated lake names used in the table (Lake.11–Lake.21) correspond to Xiao Qaidam Lake, Qinghai Lake, Gemang Lake, Dangqiong Lake, Zhaxi Lake, Taro Lake, Yibu Caka, Siling Co, Gogen Co, and Khyebsang Co, Pumo Yong Co, respectively. Other abbreviations: NH (National Highway, e.g., NH-G109); PH (Provincial Highway, e.g., PH-S313); E (Expressway, e.g., E-G3011); PD (Pastoralist dwellings); HS (Human settlement).
Xiao Qaidam Lake was identified as the sole high-risk lake among those studied. The lake exhibits a rapid overall expansion trend, driven by a substantial water storage increase of 4.01 × 10⁸ m3, resulting in an of 103.23 m/yr and a maximum rate reaching 706.53 m/yr along the eastern and northern shores. The critical factor determining its high-risk status is the presence of major transportation infrastructure, specifically Expressway S20 and G3011, located within the 50 m buffer zone on the western and southern banks. The analysis indicates an of 52.44 m/yr at the nearest infrastructure point. Given this high rate of shoreline advancement, the probability of these road networks being inundated under normal climatic variability is substantial, warranting immediate attention.
Qinghai Lake, Siling Co, and Gemang Lake were classified as at moderate risk. Qinghai Lake and Siling Co are characterized by massive water storage accumulations ( of 9.60 × 10⁹ m3 and 3.76 × 10⁹ m3, respectively), representing the two largest volumetric increases among all studied IPLs. Despite relatively moderate local shoreline change rates at the nearest elements at risk ( of 8.63 m/yr for Qinghai Lake and 10.12 m/yr for Siling Co), the sheer magnitude of accumulated water storage poses a sustained inundation threat to surrounding infrastructure. For Qinghai Lake, pastoralist dwellings and Provincial Highway S206 are situated within the 250 m buffer zone, while human settlements and National Highway G315 lie within the 1000 m buffer (Figure 8b). Notably, the Qinghai–Tibet Railway traverses the northern margin of Qinghai Lake, with the nearest point approximately 100 m from the current shoreline. Although the probability of inundation in the near term remains low, given the current , continued expansion at the present rate would pose a potential threat to the safe operation of this critical transportation corridor over the medium to long term. For Siling Co, National Highway G317 is located within the 50 m buffer, with pastoralist dwellings, Provincial Highway S208, and Provincial Highway S506 distributed within the 250 m and 1000 m buffers (Figure 8h). Gemang Lake exhibits a relatively low average expansion rate ( of 9.53 m/yr); however, the shoreline advancement is spatially non-uniform. The southeast shore represents the dominant corridor of expansion, where Provincial Highway S209 is situated within the 50 m buffer. The local expansion rate at this location () reaches 22.27 m/yr, significantly exceeding the lake-wide average. Consequently, while the immediate threat is lower than that of Xiao Qaidam Lake, the road infrastructure faces a potential inundation risk within a near-term horizon, particularly if current expansion trends persist.
The remaining seven lakes, including Dangqiong Lake, Zhaxi Lake, Taro Lake, Yibu Caka, Gogen Co, Khyebshang Co, and Pumo Yong Co, were categorized as low risk. Pumo Yong Co exhibits a high maximum expansion rate ( of 159.09 m/yr) on its western shore; however, the pastoralist dwellings and National Highway G219 are located on the eastern shore, where the expansion is minimal ( of 2.17 m/yr). This spatial misalignment between zones of rapid shoreline advance and the location of socio-economic assets effectively mitigates the associated risk. Other lakes, such as Dangqiong Lake, Zhaxi Lake, Taro Lake, Yibu Caka, Gogen Co, and Khyebshang Co, were also deemed low risk due to a combination of low expansion velocities and sufficient buffer distances. In cases such as Zhaxi Lake and Taro Lake, although infrastructure exists within the 50 m buffer, the local shoreline change rates () are negligible, ranging between 3.09 m/yr and 4.97 m/yr. For lakes like Yibu Caka and Gogen Co, despite higher average expansion rates, the primary elements at risk are located within the 250 m or 1000 m buffers, providing a sufficient temporal margin for adaptation or relocation. The results demonstrate that the inundation risk is driven not only by the magnitude of lake expansion but critically by the spatial alignment between the corridors of rapid shoreline advance and the location of socio-economic assets.
5. Discussion
5.1. The Discrepancy Between Regional Climate and Local Lake Response
The TP, functioning as the “Asian Water Tower,” exhibits high sensitivity to global warming, yet the climatic response mechanisms driving lake dynamics remain characterized by profound spatiotemporal complexity [16]. Although the region is generally undergoing a “warming and wetting” trend, interactions among climate variables create significant uncertainties [80]. For instance, the “evaporation paradox”—where decreased potential evapotranspiration (attributed to declining wind speed and sunshine duration) coexists with rising temperatures—complicates the attribution of lake water balance. Furthermore, the scarcity of high-elevation meteorological observations limits the accuracy of regional climate models in predicting local hazard trajectories. Consequently, relying solely on macro-scale “warm-wet” patterns risks masking the specific drivers of local lake hazards. It is therefore critical to bridge the gap between uncertain regional climatic drivers and practical disaster prevention by focusing on catchment-scale climate forcing and the specific hydrological morphology of the lakes.
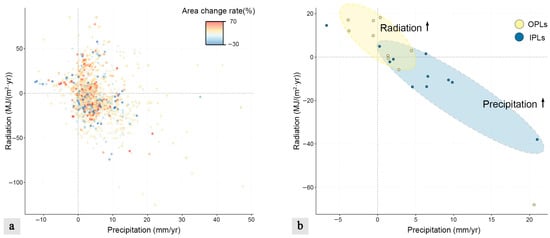
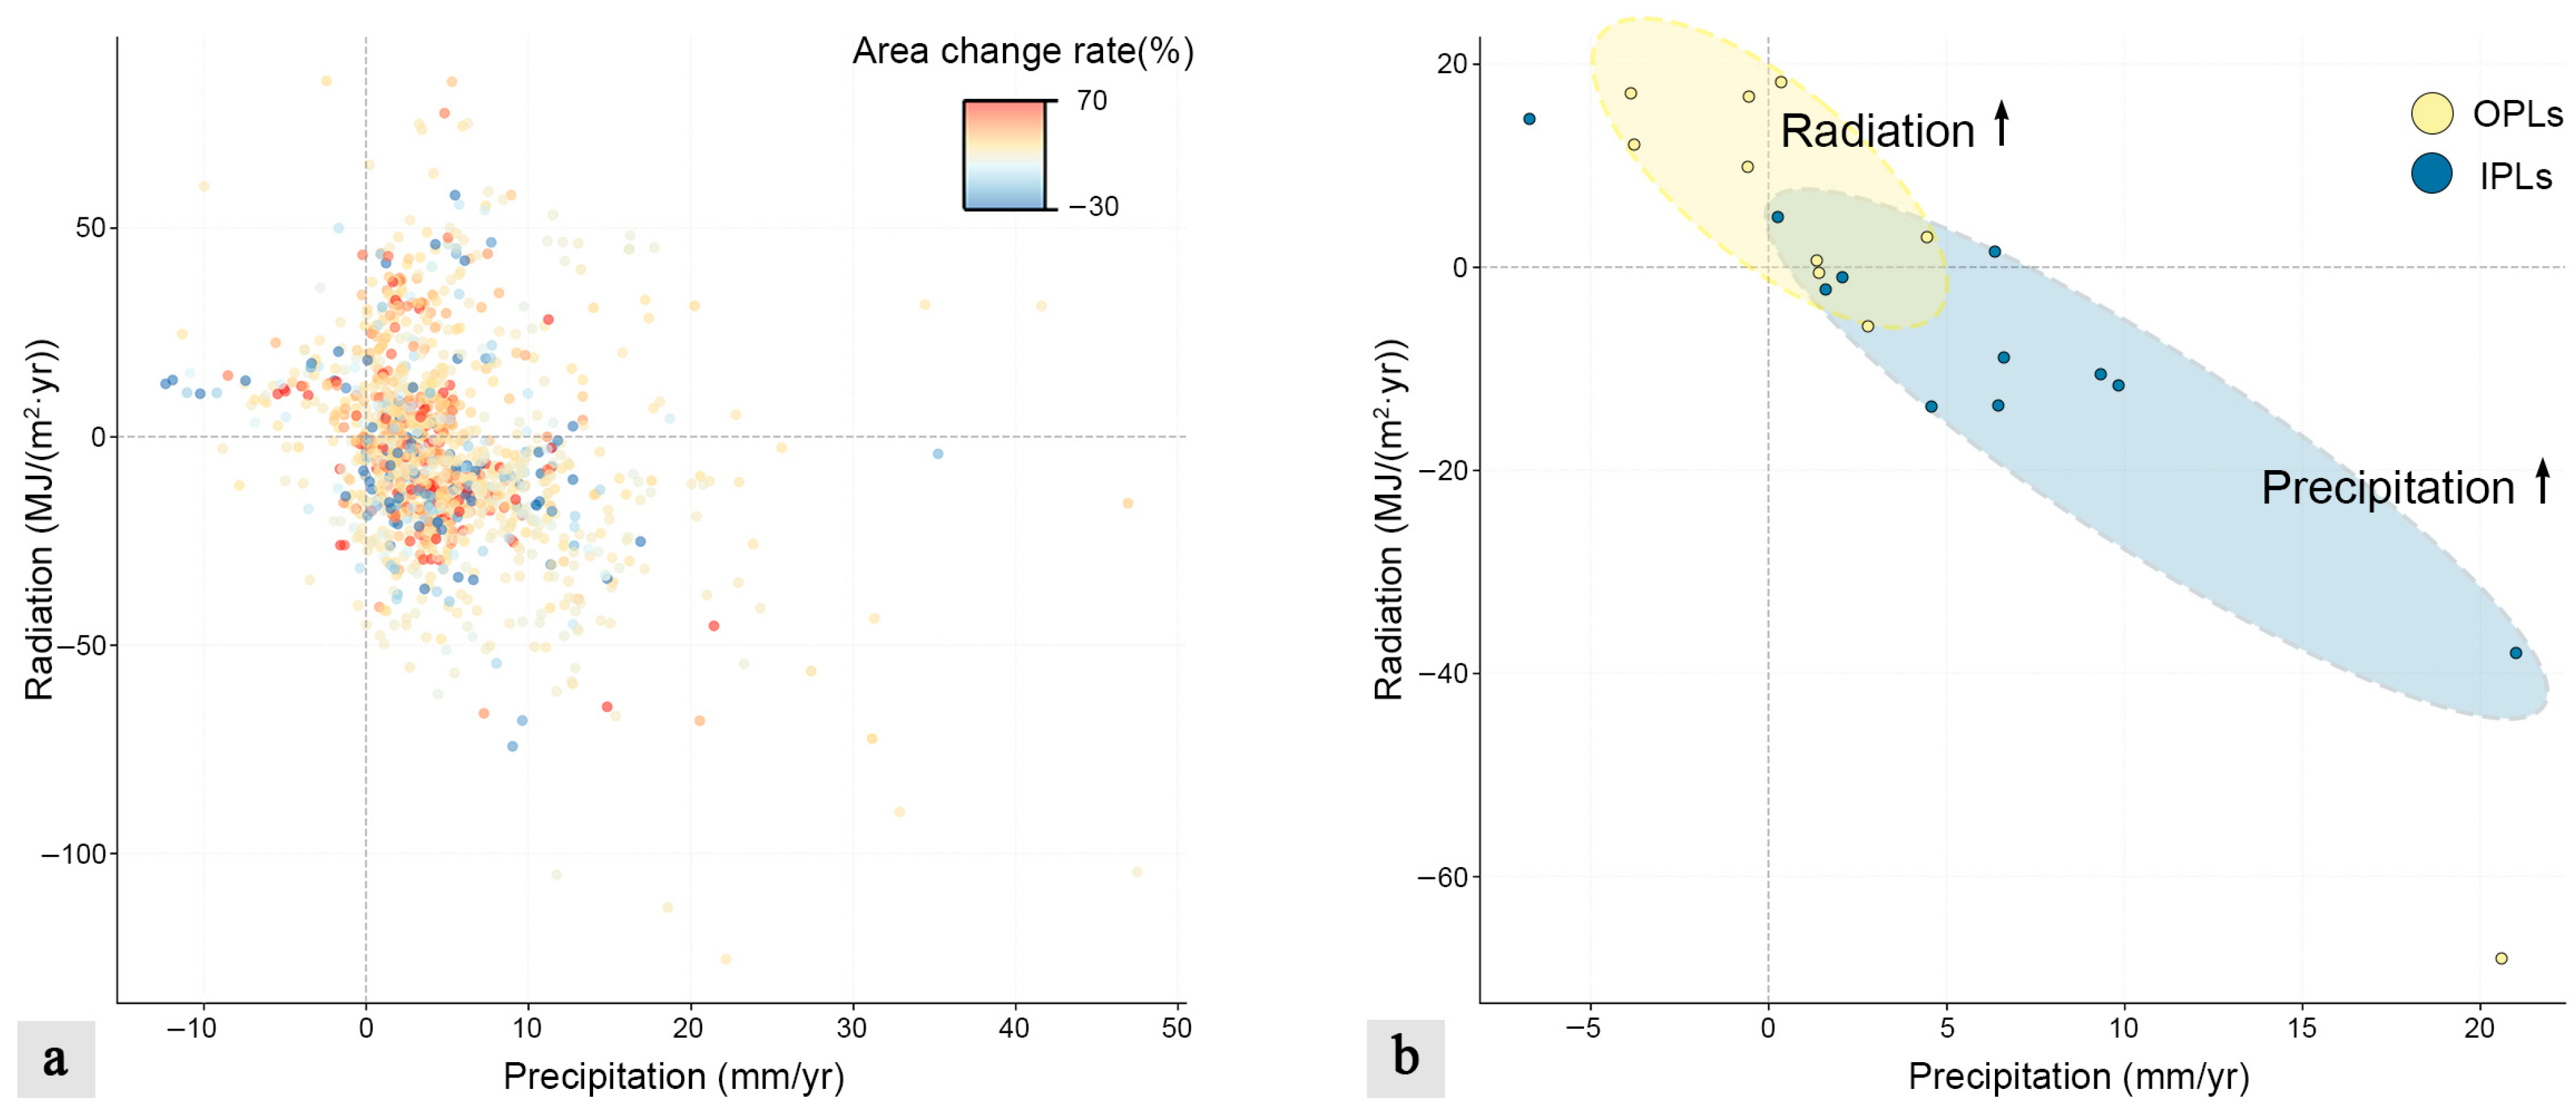
As illustrated in Figure 9a and Table 7, the distribution of the studied lakes within the Precipitation–Net Surface Shortwave Radiation (P-NSSR) phase space reveals that approximately 60.13% cluster in Quadrant IV, a regime characterized by increased precipitation and decreased radiation. This quadrant contains 543 expanding lakes, accounting for 57.77% of the total expanding lakes in the study area. This distribution aligns with the findings of Li et al., who investigated water storage variations on the TP. Their studies indicated that in the Inner TP Basin, a significant increase in precipitation, coupled with a reduction in NSSR—which suppresses evaporation—has driven substantial lake expansion, particularly in the region bordering the northern Inner TP and the Tarim Basin [81]. These results suggest that, at the macro-basin scale, the general characteristic of lake expansion on the TP is positively correlated with higher precipitation levels and lower net surface shortwave radiation.
Figure 9.
Attribution of lake area changes to catchment-scale climatic forcing over the TP: (a) Scatter plot of all 1352 lakes, showing a dominant concentration of expanding lakes in the increased precipitation and decreased radiation sector (Quadrant IV). (b) Distributional heterogeneity of Lake-related hazard. IPLs (Blue) are primarily clustered in the precipitation-dominated region, while OPLs (Yellow) are mostly located in the radiation-enhanced region.
Table 7.
Classification of lake area variations and associated climatic drivers across the four quadrants of the P-NSSR phase space. Quadrants represent different combinations of climatic trends over the study period: Quadrant I (Increased Precipitation and Radiation); Quadrant II (Decreased Precipitation and Increased Radiation); Quadrant III (Decreased Precipitation and Radiation); Quadrant IV (Increased Precipitation and Decreased Radiation). The table summarizes the number of expanding/shrinking lakes and their average area change rates within each climatic combination.
However, an analysis of lakes presenting potential hazards reveals a distinct heterogeneity in the responses of OPLs versus IPLs to these climatic factors. As shown in Figure 9b, IPLs (blue) appear largely controlled by the synergistic effects of precipitation and NSSR. The majority of these lakes are situated in the quadrant defined by increased precipitation and reduced radiation. For these predominantly medium-to-large lakes, increased rainfall provides a direct mass input, while localized radiation attenuation effectively inhibits surface evaporation. This cumulative “double positive forcing” contributes to sustained water level rises and subsequent land inundation in lakes with longer response times. Conversely, OPLs (yellow) exhibit a markedly different trend. Among the ten identified OPLs, seven demonstrate a significant trend of increasing radiation. Notably, some of these lakes continue to expand even against a background of decreasing annual precipitation. This anomaly suggests that for smaller-scale OPLs, locally enhanced NSSR may dominate the catchment energy balance. It is hypothesized that the resulting acceleration in glacial meltwater supply offsets the precipitation deficit. Such an “energy-dominated” mechanism could be overlooked if assessed solely within the macro-scale “warm-wet” (moisture-dominated) framework, thereby underscoring the necessity for refined, catchment-scale research to accurately characterize diverse lake-related hazards.
5.2. Field Assessments of Typical Risk Lakes
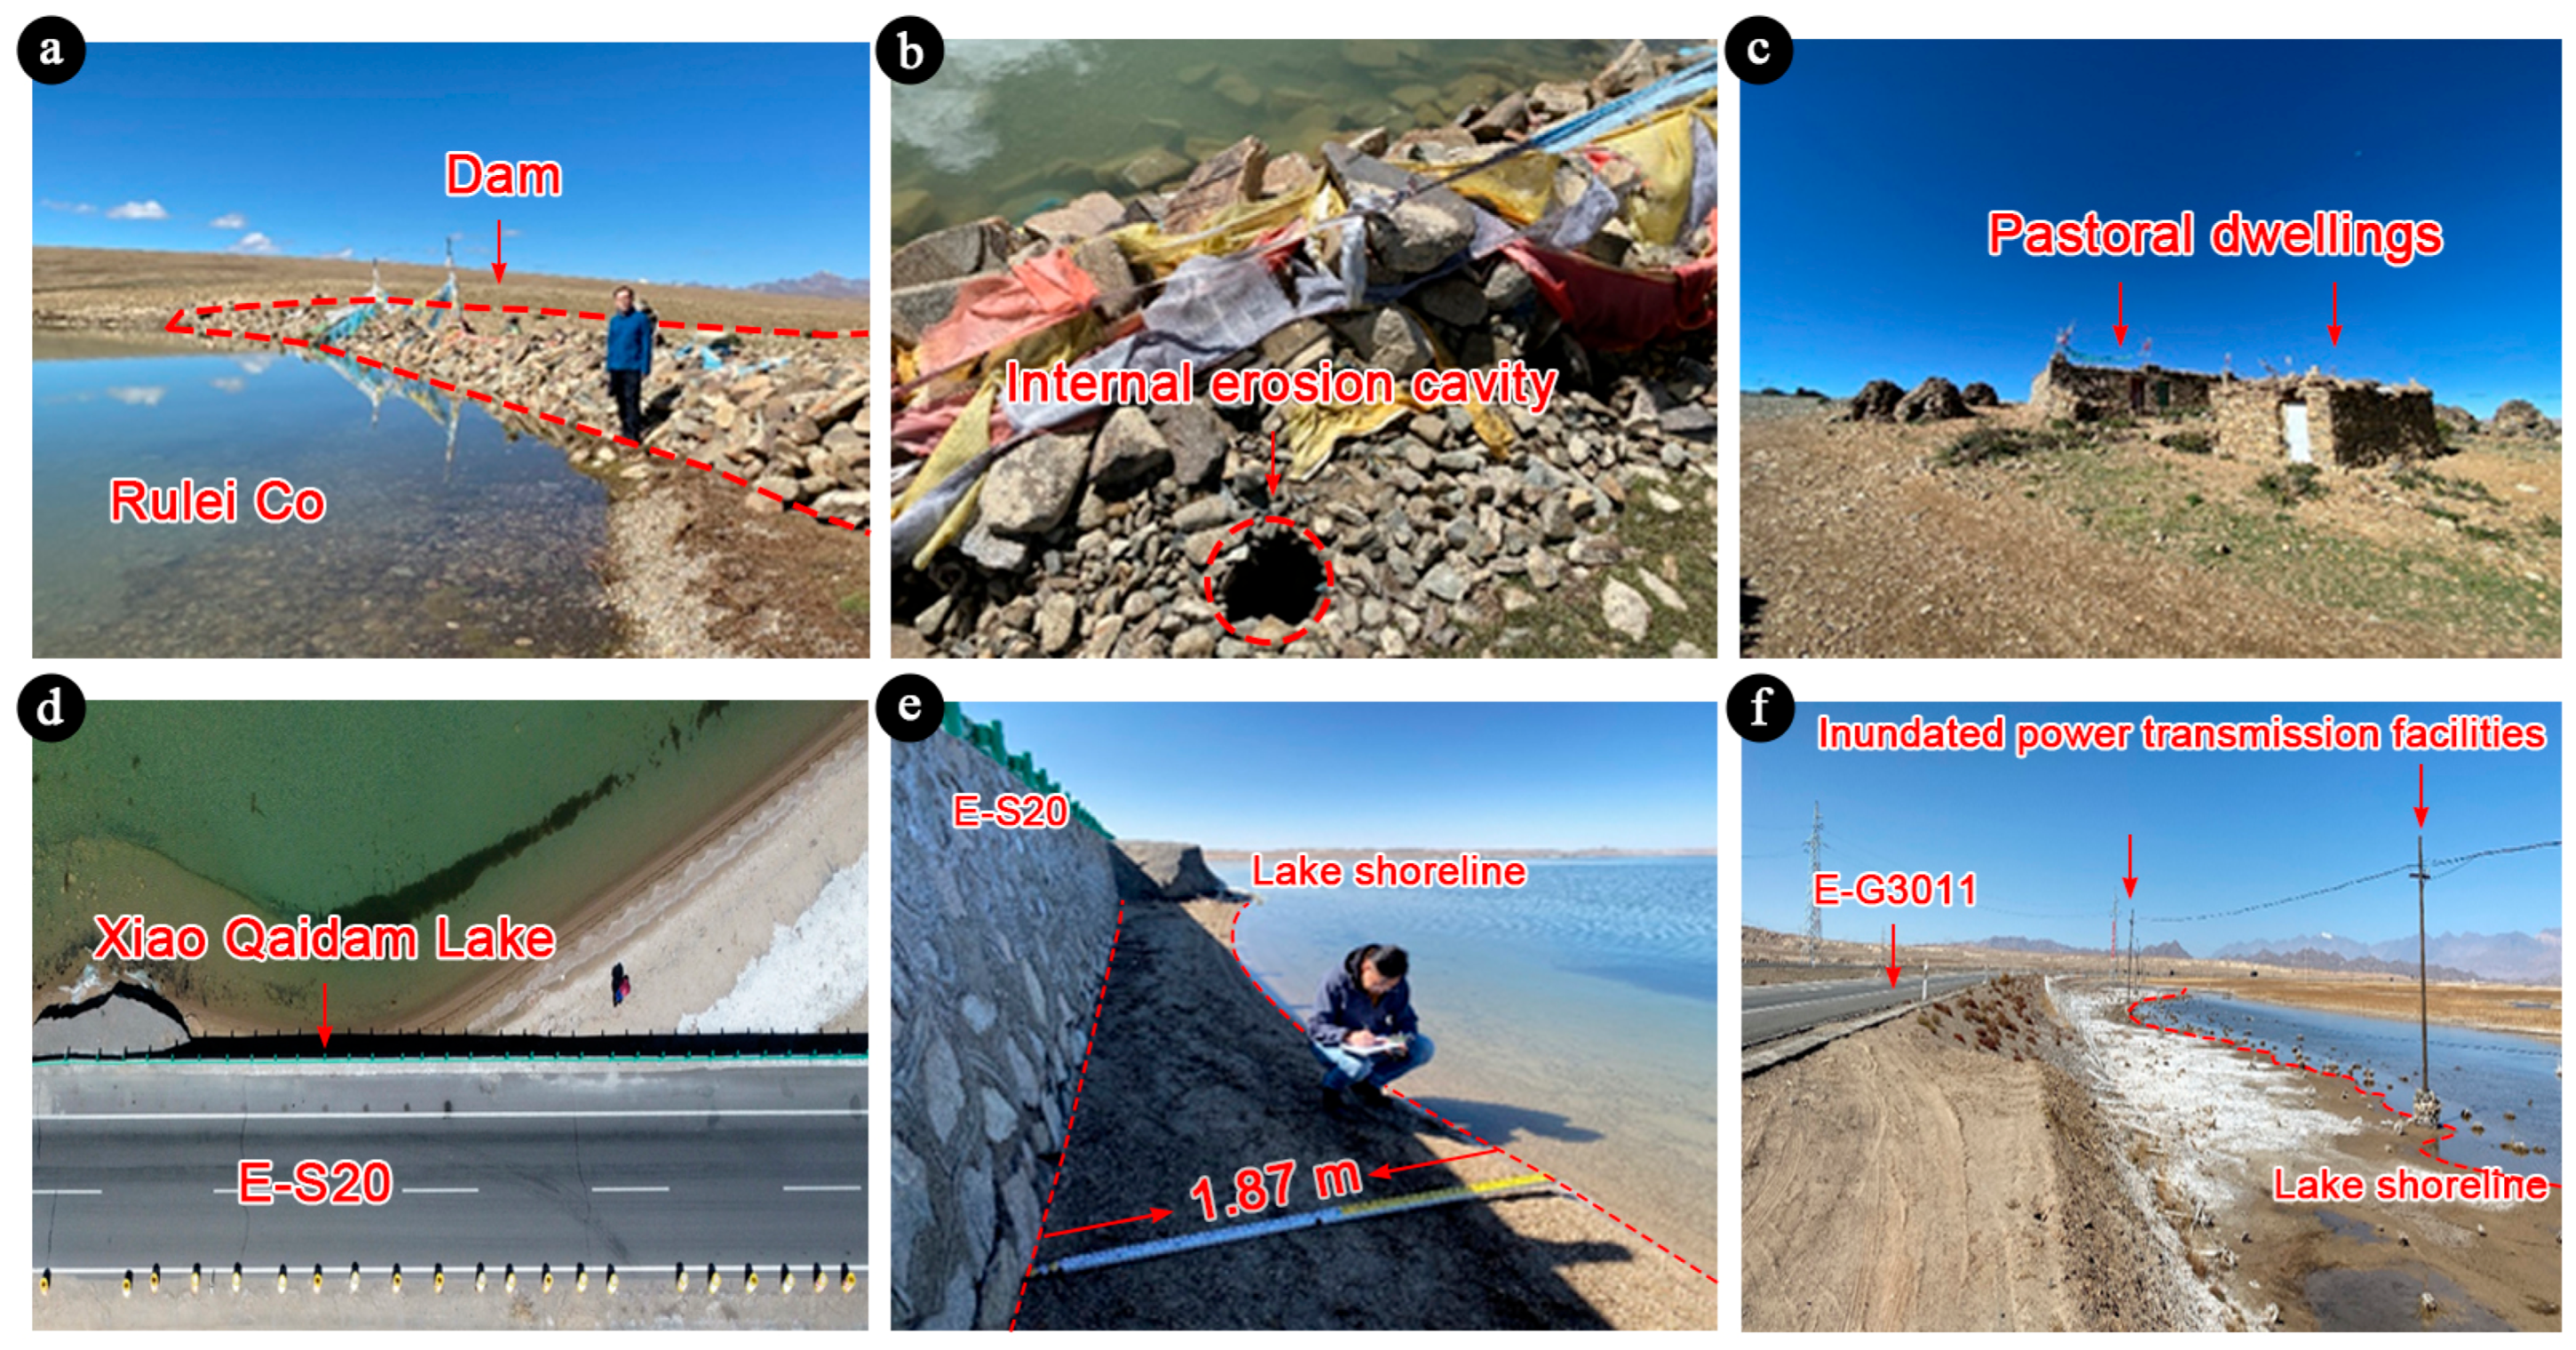
Field investigations constitute a critical component of the hazard assessment workflow. However, restricted by the geographical constraints and limited transportation facilities of the TP, some remote lakes were difficult to access. In this study, we conducted on-site investigations of 5 key risk lakes, including 2 OPLs (Rulei Co and Zhariwa Co) and 3 IPLs (Xiao Qaidam Lake, Qinghai Lake, and Siling Co). The results of these on-site investigations are presented in Figure 10, with a focus on potentially high-risk lakes, including the outburst-prone Rulei Co and the inundation-prone Xiao Qaidam Lake.
Figure 10.
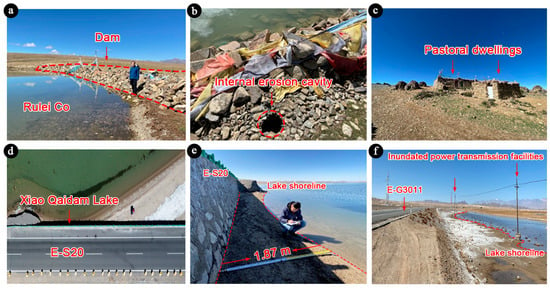
Field evidence of distinct lake hazard characteristics in the study area. (a–c) Geomorphic features and embankment instability at the outburst-prone Rulei Co, showing (a) the lake dam, (b) signs of internal erosion cavity, and (c) threatened pastoral dwellings. (d–f) Infrastructure encroachment by the inundation-prone Xiao Qaidam Lake, highlighting (d) the proximity of the Expressway S20 to the lake surface, (e) field measurement of the water-to-road distance, and (f) inundated power transmission facilities.
Rulei Co is located in Comai County, Shannan City, Tibet Autonomous Region, approximately 14 km north of the Comai County seat. As illustrated in Figure 10a,b, a rudimentary artificial earth-rock dam has been constructed at the potential overflow outlet on the northwest shore of Rulei Co. Measuring approximately 80 m in length and 20 m in width, the dam is composed primarily of sandstone and granite. The structure exhibits loose packing and suboptimal stability, with visible erosion-induced cavities near the lake-facing side. Due to rising water levels, Rulei Co has transitioned from a closed lake to an open system. Although continuous outflow is currently observed, the discharge volume remains relatively low, establishing a state of quasi-dynamic equilibrium; however, the possibility of a rapid surge in water volume during extreme flood seasons cannot be ruled out. The outflow travels downstream through the overflow channel toward National Highway G560, forming a small stream. At the intersection with the highway, a culvert (approx. 16 m wide and 8 m high) facilitates a slow-moving flow. Additionally, abandoned pastoral dwellings and livestock fencing were identified approximately 574 m from the culvert, though they currently face no immediate disaster threat (Figure 10c).
Xiao Qaidam Lake is located in Dachaidan Town, Haixi Mongol and Tibetan Autonomous Prefecture, Qinghai Province. Regarding this Lake, the southern shoreline is critically close to the S20 Expressway, with a minimum distance of only 1.87 m. Signs of submersion and erosion are evident in the Quaternary lacustrine deposits between the roadbed and the current shoreline, suggesting that the water level may reach the base of the roadbed during high-water periods. Continued expansion and infiltration of lake water could soften the roadbed, reducing its bearing capacity and potentially leading to instability, which poses significant risks to traffic safety and infrastructure integrity (Figure 10d,e). Furthermore, on the western shore, the minimum distance to the G3011 Expressway is approximately 16.25 m. The terrain in this area is flat, and some power transmission facilities are already inundated. Although a culvert exists to divert rising waters to low-lying areas west of the road, indicating that the shoreline is unlikely to reach the roadbed in the short term, long-term expansion or extreme precipitation events could still compromise highway operations (Figure 10f).
6. Conclusions
This study investigated the decadal evolution (2014–2023) of 1352 non-glacial lakes (>1 km2) on the TP using high-resolution GF-1/2 imagery, establishing a systematic inventory of emerging lake-related hazards. The results reveal a profound morphological shift in the region’s hydro-landscape, characterized by a total lake area expansion of 2839.53 km2 (6.07%). This expansion exhibits clear spatial heterogeneity, with the Qaidam Basin recording the most significant relative growth (16.36%) and the Inner TP Basin contributing the largest absolute area gain (1960.60 km2).
Based on geomorphic constraints and hazard mechanisms, 21 potentially hazardous lakes (10 OPLs and 11 IPLs) were identified using the classification and assessment methods first proposed and evaluated in this study. OPLs are characterized by unstable natural dams and overflow channels, while IPLs are defined as expanding terminal lakes lacking outlets. Risk assessments tailored to these typologies identified critical threats. Specifically, hydraulic analysis pinpointed Rulei Co, Go Co, and Otter Lake as high-risk outburst sources due to imminent overtopping potentials. Meanwhile, shoreline change analysis highlighted Xiao Qaidam Lake as a critical inundation risk, where rapid transgression (>50 m/yr) threatens the adjacent national expressway. Field investigations corroborated these findings, verifying the structural instability of the Rulei Co dam and the critical encroachment of Xiao Qaidam Lake upon transport infrastructure.
Attribution analysis of climatic drivers reveals a complex heterogeneity in lake responses. At the macro-scale, approximately 60% of the studied lakes cluster within a climatic phase space characterized by increased precipitation and decreased NSSR. This suggests that general lake expansion is largely driven by a “moisture-dominated” mechanism, where higher rainfall inputs and radiation-suppressed evaporation act synergistically. IPLs align closely with this regime, benefiting from this “double positive forcing.” Conversely, OPLs exhibit a divergent, “energy-dominated” response. The majority of these lakes show a significant trend of increasing radiation, with some expanding even amidst precipitation deficits. This anomaly implies that for these specific, often smaller catchments, enhanced NSSR dominates the energy balance, likely accelerating glacial meltwater supply to offset rainfall shortages. This distinction underscores the necessity of moving beyond broad “warm-wet” generalizations to capture catchment-scale complexities.
It is important to acknowledge the limitations of the hazard classification framework employed in this study. While we categorized lakes into OPLs and IPLs based on their primary hazard mechanisms, the distinction is not always absolute. Specifically, even lakes with dams and outflow channels may experience inundation if the rate of water level rise exceeds the discharge capacity. For instance, Taro Co and Pumo Yum Co, classified here as IPLs, actually possess outflow features, suggesting a “hybrid” hazard mechanism where inundation risks coexist with potential outflow regulation. This highlights the existence of “hybrid” lake types that warrant further investigation. Future research should aim to refine these classification systems to better capture the complexities of such hybrid systems and their dynamic hydrological behaviors.
In summary, this research provides the first integrated risk ranking of non-glacial lake hazards on the TP. By combining remote sensing, topographic modeling, and field validation, the study offers a practical framework for hazard identification and early warning. Future efforts should focus on refining high-frequency hydrological monitoring and developing adaptive strategies to mitigate the socio-economic impacts of these evolving alpine hazards.
Author Contributions
Conceptualization, H.W., P.H., Z.G., G.W., J.T. and S.Y.; Methodology, H.W. and P.H.; Software, H.W.; Validation, H.W., P.H., J.T. and S.Y.; Formal analysis, H.W.; Investigation, H.W., P.H., Z.G., J.T. and S.Y.; Data curation, P.H., Z.G., J.T. and S.Y.; Writing—original draft, H.W.; Writing—review and editing, P.H., Z.G. and G.W.; Visualization, H.W.; Supervision, P.H., Z.G. and G.W. All authors have read and agreed to the published version of the manuscript.
Funding
This research was funded by the Geological Survey Project of China Geological Survey (Grant nos. DD20251300205, DD20230083 and DD20230448). This work was also supported by the Guangdong Provincial Geological Hazard Early Identification Project (YL202403044 and 1210-2541YDZB8719).
Data Availability Statement
The original contributions presented in this study are included in the article. Further inquiries can be directed to the corresponding author.
Conflicts of Interest
The authors declare no conflicts of interest.
References
- Royden, L.H.; Burchfiel, B.C.; van der Hilst, R.D. The Geological Evolution of the Tibetan Plateau. Science 2008, 321, 1054–1058. [Google Scholar] [CrossRef] [Scilit] [PubMed]
- Kang, S.; Xu, Y.; You, Q.; Flügel, W.-A.; Pepin, N.; Yao, T. Review of Climate and Cryospheric Change in the Tibetan Plateau. Environ. Res. Lett. 2010, 5, 015101. [Google Scholar] [CrossRef] [Scilit]
- Wang, C.; Zhao, X.; Liu, Z.; Lippert, P.C.; Graham, S.A.; Coe, R.S.; Yi, H.; Zhu, L.; Liu, S.; Li, Y. Constraints on the Early Uplift History of the Tibetan Plateau. Proc. Natl. Acad. Sci. USA 2008, 105, 4987–4992. [Google Scholar] [CrossRef] [Scilit]
- Yao, T.; Thompson, L.; Yang, W.; Yu, W.; Gao, Y.; Guo, X.; Yang, X.; Duan, K.; Zhao, H.; Xu, B.; et al. Different Glacier Status with Atmospheric Circulations in Tibetan Plateau and Surroundings. Nat. Clim. Change 2012, 2, 663–667. [Google Scholar] [CrossRef] [Scilit]
- Li, C.; Bosch, C.; Kang, S.; Andersson, A.; Chen, P.; Zhang, Q.; Cong, Z.; Chen, B.; Qin, D.; Gustafsson, Ö. Sources of Black Carbon to the Himalayan–Tibetan Plateau Glaciers. Nat. Commun. 2016, 7, 12574. [Google Scholar] [CrossRef] [Scilit]
- Zhang, Y.; Gao, T.; Kang, S.; Shangguan, D.; Luo, X. Albedo Reduction as an Important Driver for Glacier Melting in Tibetan Plateau and Its Surrounding Areas. Earth-Sci. Rev. 2021, 220, 103735. [Google Scholar] [CrossRef] [Scilit]
- Song, C.; Huang, B.; Ke, L.; Richards, K.S. Remote Sensing of Alpine Lake Water Environment Changes on the Tibetan Plateau and Surroundings: A Review. ISPRS J. Photogramm. Remote Sens. 2014, 92, 26–37. [Google Scholar] [CrossRef] [Scilit]
- Wu, Y.; Huang, A.; Yang, B.; Dong, G.; Wen, L.; Lazhu; Zhang, Z.; Fu, Z.; Zhu, X.; Zhang, X.; et al. Numerical Study on the Climatic Effect of the Lake Clusters over Tibetan Plateau in Summer. Clim. Dyn. 2019, 53, 5215–5236. [Google Scholar] [CrossRef] [Scilit]
- Zhu, M.; Yao, T.; Yang, W.; Xu, B.; Wu, G.; Wang, X. Differences in Mass Balance Behavior for Three Glaciers from Different Climatic Regions on the Tibetan Plateau. Clim. Dyn. 2018, 50, 3457–3484. [Google Scholar] [CrossRef] [Scilit]
- Zhang, G.; Yao, T.; Xie, H.; Kang, S.; Lei, Y. Increased Mass over the Tibetan Plateau: From Lakes or Glaciers? Geophys. Res. Lett. 2013, 40, 2125–2130. [Google Scholar] [CrossRef] [Scilit]
- Ye, Q.; Kang, S.; Chen, F.; Wang, J. Monitoring Glacier Variations on Geladandong Mountain, Central Tibetan Plateau, from 1969 to 2002 Using Remote-Sensing and GIS Technologies. J. Glaciol. 2006, 52, 537–545. [Google Scholar] [CrossRef] [Scilit]
- Xu, X.; Zhao, T.; Lu, C.; Guo, Y.; Chen, B.; Liu, R.; Li, Y.; Shi, X. An Important Mechanism Sustaining the Atmospheric “Water Tower” over the Tibetan Plateau. Atmos. Chem. Phys. 2014, 14, 11287–11295. [Google Scholar] [CrossRef] [Scilit]
- Sun, J.; Zhou, T.; Liu, M.; Chen, Y.; Shang, H.; Zhu, L.; Shedayi, A.A.; Yu, H.; Cheng, G.; Liu, G.; et al. Linkages of the Dynamics of Glaciers and Lakes with the Climate Elements over the Tibetan Plateau. Earth-Sci. Rev. 2018, 185, 308–324. [Google Scholar] [CrossRef] [Scilit]
- Li, Z.; Sun, W.; Zeng, Q. Measurements of Glacier Variation in the Tibetan Plateau Using Landsat Data. Remote Sens. Environ. 1998, 63, 258–264. [Google Scholar] [CrossRef] [Scilit]
- Zhang, G.; Yao, T.; Chen, W.; Zheng, G.; Shum, C.K.; Yang, K.; Piao, S.; Sheng, Y.; Yi, S.; Li, J.; et al. Regional Differences of Lake Evolution across China during 1960s–2015 and Its Natural and Anthropogenic Causes. Remote Sens. Environ. 2019, 221, 386–404. [Google Scholar] [CrossRef] [Scilit]
- Zhang, G.; Yao, T.; Xie, H.; Yang, K.; Zhu, L.; Shum, C.K.; Bolch, T.; Yi, S.; Allen, S.; Jiang, L.; et al. Response of Tibetan Plateau Lakes to Climate Change: Trends, Patterns, and Mechanisms. Earth-Sci. Rev. 2020, 208, 103269. [Google Scholar] [CrossRef] [Scilit]
- Dietz, T.; Shwom, R.L.; Whitley, C.T. Climate Change and Society. Annu. Rev. Sociol. 2020, 46, 135–158. [Google Scholar] [CrossRef] [Scilit]
- Intergovernmental Panel On Climate Change (IPCC). Climate Change 2021–The Physical Science Basis: Working Group I Contribution to the Sixth Assessment Report of the Intergovernmental Panel on Climate Change, 1st ed.; Cambridge University Press: Cambridge, UK, 2023. [Google Scholar]
- IPCC. Climate Change 2023: Synthesis Report. Contribution of Working Groups I, II and III to the Sixth Assessment Report of the Intergovernmental Panel on Climate Change; Core Writing Team, Lee, H., Romero, J., Eds.; IPCC: Geneva, Switzerland, 2023. [Google Scholar]
- Fang, Y.; Cheng, W.; Zhang, Y.; Wang, N.; Zhao, S.; Zhou, C.; Chen, X.; Bao, A. Changes in Inland Lakes on the Tibetan Plateau over the Past 40 Years. J. Geogr. Sci. 2016, 26, 415–438. [Google Scholar] [CrossRef] [Scilit]
- Li, Y.; Liao, J.; Guo, H.; Liu, Z.; Shen, G. Patterns and Potential Drivers of Dramatic Changes in Tibetan Lakes, 1972–2010. PLoS ONE 2014, 9, e111890. [Google Scholar] [CrossRef] [Scilit] [PubMed]
- Zhang, J.; Hu, Q.; Li, Y.; Li, H.; Li, J. Area, Lake-Level and Volume Variations of Typical Lakes on the Tibetan Plateau and Their Response to Climate Change, 1972–2019. Geo-Spat. Inf. Sci. 2021, 24, 458–473. [Google Scholar] [CrossRef] [Scilit]
- Liu, W.; Liu, H.; Xie, C.; Zhao, J.; Liu, G.; Wang, W.; Zhang, Q.; Zhao, Q. Dynamic Changes in Lakes and Potential Drivers within the Selin Co Basin, Tibetan Plateau. Environ. Earth Sci. 2022, 81, 84. [Google Scholar] [CrossRef] [Scilit]
- Zhang, G.; Xie, H.; Kang, S.; Yi, D.; Ackley, S.F. Monitoring Lake Level Changes on the Tibetan Plateau Using ICESat Altimetry Data (2003–2009). Remote Sens. Environ. 2011, 115, 1733–1742. [Google Scholar] [CrossRef] [Scilit]
- Zhou, J.; Wang, L.; Zhang, Y.; Guo, Y.; Li, X.; Liu, W. Exploring the Water Storage Changes in the Largest Lake (Selin Co) over the Tibetan Plateau during 2003–2012 from a Basin-Wide Hydrological Modeling. Water Resour. Res. 2015, 51, 8060–8086. [Google Scholar] [CrossRef] [Scilit]
- Xu, F.; Zhang, G.; Woolway, R.I.; Yang, K.; Wada, Y.; Wang, J.; Crétaux, J.-F. Widespread Societal and Ecological Impacts from Projected Tibetan Plateau Lake Expansion. Nat. Geosci. 2024, 17, 516–523. [Google Scholar] [CrossRef] [Scilit]
- Liu, W.; Xie, C.; Zhao, L.; Wu, T.; Wang, W.; Zhang, Y.; Yang, G.; Zhu, X.; Yue, G. Dynamic Changes in Lakes in the Hoh Xil Region before and after the 2011 Outburst of Zonag Lake. J. Mt. Sci. 2019, 16, 1098–1110. [Google Scholar] [CrossRef] [Scilit]
- Ding, Z.; Niu, F.; Li, G.; Mu, Y.; Chai, M.; He, P. The Outburst of a Lake and Its Impacts on Redistribution of Surface Water Bodies in High-Altitude Permafrost Region. Remote Sens. 2022, 14, 2918. [Google Scholar] [CrossRef] [Scilit]
- Lei, Y.; Zhou, J.; Yao, T.; Bird, B.W.; Yu, Y.; Wang, S.; Yang, K.; Zhang, Y.; Zhai, J.; Dai, Y. Overflow of Siling Co on the Central Tibetan Plateau and Its Environmental Impacts. Sci. Bull. 2024, 69, 2829–2832. [Google Scholar] [CrossRef] [Scilit] [PubMed]
- Zhang, D.; Zhou, G.; Li, W.; Han, L.; Zhang, S.; Yao, X.; Duan, H. A Robust Glacial Lake Outburst Susceptibility Assessment Approach Validated by GLOF Event in 2020 in the Nidu Zangbo Basin, Tibetan Plateau. CATENA 2023, 220, 106734. [Google Scholar] [CrossRef] [Scilit]
- Wang, S.; Che, Y.; Xinggang, M. Integrated Risk Assessment of Glacier Lake Outburst Flood (GLOF) Disaster over the Qinghai–Tibetan Plateau (QTP). Landslides 2020, 17, 2849–2863. [Google Scholar] [CrossRef] [Scilit]
- Allen, S.K.; Zhang, G.; Wang, W.; Yao, T.; Bolch, T. Potentially Dangerous Glacial Lakes across the Tibetan Plateau Revealed Using a Large-Scale Automated Assessment Approach. Sci. Bull. 2019, 64, 435–445. [Google Scholar] [CrossRef] [Scilit]
- Wang, W.; Xiang, Y.; Gao, Y.; Lu, A.; Yao, T. Rapid Expansion of Glacial Lakes Caused by Climate and Glacier Retreat in the Central Himalayas. Hydrol. Process. 2015, 29, 859–874. [Google Scholar] [CrossRef] [Scilit]
- Westoby, M.J.; Glasser, N.F.; Brasington, J.; Hambrey, M.J.; Quincey, D.J.; Reynolds, J.M. Modelling Outburst Floods from Moraine-Dammed Glacial Lakes. Earth-Sci. Rev. 2014, 134, 137–159. [Google Scholar] [CrossRef] [Scilit]
- Neupane, R.; Chen, H.; Cao, C. Review of Moraine Dam Failure Mechanism. Geomat. Nat. Hazards Risk 2019, 10, 1948–1966. [Google Scholar] [CrossRef] [Scilit]
- Kougkoulos, I.; Cook, S.J.; Jomelli, V.; Clarke, L.; Symeonakis, E.; Dortch, J.M.; Edwards, L.A.; Merad, M. Use of Multi-Criteria Decision Analysis to Identify Potentially Dangerous Glacial Lakes. Sci. Total Environ. 2018, 621, 1453–1466. [Google Scholar] [CrossRef] [Scilit] [PubMed]
- Zhang, T.; Wang, W.; Gao, T.; An, B.; Yao, T. An Integrative Method for Identifying Potentially Dangerous Glacial Lakes in the Himalayas. Sci. Total Environ. 2022, 806, 150442. [Google Scholar] [CrossRef] [Scilit]
- Tang, Y.; Huo, J.; Zhu, D.; Yuan, Z. Simulation of the Water Storage Capacity of Siling Co Lake on the Tibetan Plateau and Its Hydrological Response to Climate Change. Water 2022, 14, 3175. [Google Scholar] [CrossRef] [Scilit]
- Song, C.; Huang, B.; Richards, K.; Ke, L.; Hien Phan, V. Accelerated Lake Expansion on the Tibetan Plateau in the 2000s: Induced by Glacial Melting or Other Processes? Water Resour. Res. 2014, 50, 3170–3186. [Google Scholar] [CrossRef] [Scilit]
- Yi, G.; Zhang, T. Delayed Response of Lake Area Change to Climate Change in Siling Co Lake, Tibetan Plateau, from 2003 to 2013. Int. J. Environ. Res. Public Health 2015, 12, 13886–13900. [Google Scholar] [CrossRef] [Scilit]
- Zhang, G.; Chen, W.; Xie, H. Tibetan Plateau’s Lake Level and Volume Changes From NASA’s ICESat/ICESat-2 and Landsat Missions. Geophys. Res. Lett. 2019, 46, 13107–13118. [Google Scholar] [CrossRef] [Scilit]
- He, H.; Li, W.; Qian, M.; Hu, S. Time Series Clustering and Influencing Factors Analysis on Qinghai-Tibet Plateau Lake Area Change. Environ. Model. Assess. 2024, 29, 503–516. [Google Scholar] [CrossRef] [Scilit]
- Zhang, G.; Bolch, T.; Chen, W.; Crétaux, J.-F. Comprehensive Estimation of Lake Volume Changes on the Tibetan Plateau during 1976–2019 and Basin-Wide Glacier Contribution. Sci. Total Environ. 2021, 772, 145463. [Google Scholar] [CrossRef] [Scilit]
- Cheng, J.; Song, C.; Liu, K.; Fan, C.; Ke, L.; Chen, T.; Zhan, P.; Yao, J. Satellite and UAV-Based Remote Sensing for Assessing the Flooding Risk from Tibetan Lake Expansion and Optimizing the Village Relocation Site. Sci. Total Environ. 2022, 802, 149928. [Google Scholar] [CrossRef] [Scilit]
- Cheng, J.; Song, C.; Liu, K.; Ke, L.; Chen, T.; Fan, C. Regional Assessment of the Potential Risks of Rapid Lake Expansion Impacting on the Tibetan Human Living Environment. Environ. Earth Sci. 2021, 80, 166. [Google Scholar] [CrossRef] [Scilit]
- Lei, Y.; Yao, T.; Sheng, Y.; Yang, K.; Yang, W.; Li, S.; Zhou, J.; Jiang, Y.; Yu, Y. Unprecedented Lake Expansion in 2017–2018 on the Tibetan Plateau: Processes and Environmental Impacts. J. Hydrol. 2023, 619, 129333. [Google Scholar] [CrossRef] [Scilit]
- Sha, T.; Yao, X.; Wang, Y.; Tian, Z. A Quick Detection of Lake Area Changes and Hazard Assessment in the Qinghai–Tibet Plateau Based on GEE: A Case Study of Tuosu Lake. Front. Earth Sci. 2022, 10, 934033. [Google Scholar] [CrossRef] [Scilit]
- Veh, G.; Korup, O.; Walz, A. Hazard from Himalayan Glacier Lake Outburst Floods. Proc. Natl. Acad. Sci. USA 2020, 117, 907–912. [Google Scholar] [CrossRef] [Scilit]
- Zhang, Y. Integration Dataset of Tibet Plateau Boundary; National Tibetan Plateau/Third Pole Environment Data Center: Beijing, China, 2019. [Google Scholar] [CrossRef]
- Wu, Y.; Cui, Z.; Liu, G.; Ge, D.; Yin, J.; Xu, Q.; Pang, Q. Quaternary Geomorphological Evolution of the Kunlun Pass Area and Uplift of the Qinghai-Xizang (Tibet) Plateau. Geomorphology 2001, 36, 203–216. [Google Scholar] [CrossRef] [Scilit]
- Chen, F.; Yu, Z.; Yang, M.; Ito, E.; Wang, S.; Madsen, D.B.; Huang, X.; Zhao, Y.; Sato, T.; John, B.; et al. Holocene Moisture Evolution in Arid Central Asia and Its Out-of-Phase Relationship with Asian Monsoon History. Quat. Sci. Rev. 2008, 27, 351–364. [Google Scholar] [CrossRef] [Scilit]
- Shi, X.; Kirby, E.; Furlong, K.P.; Meng, K.; Robinson, R.; Lu, H.; Wang, E. Rapid and Punctuated Late Holocene Recession of Siling Co, Central Tibet. Quat. Sci. Rev. 2017, 172, 15–31. [Google Scholar] [CrossRef] [Scilit]
- Alivernini, M.; Lai, Z.; Frenzel, P.; Fürstenberg, S.; Wang, J.; Guo, Y.; Peng, P.; Haberzettl, T.; Börner, N.; Mischke, S. Late Quaternary Lake Level Changes of Taro Co and Neighbouring Lakes, Southwestern Tibetan Plateau, Based on OSL Dating and Ostracod Analysis. Glob. Planet. Change 2018, 166, 1–18. [Google Scholar] [CrossRef] [Scilit]
- Zhang, G.; Han, X.; Xu, F.; Zhou, T.; Woolway, R.I. Why Are There so Many Lakes on the Tibetan Plateau? Innov. Geosci. 2025, 3, 100135. [Google Scholar] [CrossRef] [Scilit]
- Liu, Y.; Zhao, L.; Bao, A.; Li, J.; Yan, X. Chinese High Resolution Satellite Data and GIS-Based Assessment of Landslide Susceptibility along Highway G30 in Guozigou Valley Using Logistic Regression and MaxEnt Model. Remote Sens. 2022, 14, 3620. [Google Scholar] [CrossRef] [Scilit]
- Sun, W.; Tian, Y.; Mu, X.; Zhai, J.; Gao, P.; Zhao, G. Loess Landslide Inventory Map Based on GF-1 Satellite Imagery. Remote Sens. 2017, 9, 314. [Google Scholar] [CrossRef] [Scilit]
- Zou, Y.; Qi, S.; Guo, S.; Zheng, B.; Zhan, Z.; He, N.; Huang, X.; Hou, X.; Liu, H. Factors Controlling the Spatial Distribution of Coseismic Landslides Triggered by the Mw 6.1 Ludian Earthquake in China. Eng. Geol. 2022, 296, 106477. [Google Scholar] [CrossRef] [Scilit]
- Ma, R.; Duan, H.; Hu, C.; Feng, X.; Li, A.; Ju, W.; Jiang, J.; Yang, G. A Half-Century of Changes in China’s Lakes: Global Warming or Human Influence? Geophys. Res. Lett. 2010, 37, L24106. [Google Scholar] [CrossRef] [Scilit]
- Zhang, G.; Zheng, G.; Gao, Y.; Xiang, Y.; Lei, Y.; Li, J. Automated Water Classification in the Tibetan Plateau Using Chinese GF-1 WFV Data. Photogramm. Eng. Remote Sens. 2017, 83, 509–519. [Google Scholar] [CrossRef] [Scilit]
- European Space Agency (ESA). Copernicus DEM—Global and European Digital Elevation Model. Available online: https://dataspace.copernicus.eu/explore-data/data-collections/copernicus-contributing-missions/collections-description/COP-DEM (accessed on 31 July 2025).
- Franks, S.; Rengarajan, R. Evaluation of Copernicus DEM and Comparison to the DEM Used for Landsat Collection-2 Processing. Remote Sens. 2023, 15, 2509. [Google Scholar] [CrossRef] [Scilit]
- Ghannadi, M.A.; Alebooye, S.; Izadi, M.; Ghanadi, A. Vertical accuracy assessment of copernicus dem (case study: Tehran and jam cities). ISPRS Ann. Photogramm. Remote Sens. Spat. Inf. Sci. 2023, X-4-W1-2022, 209–214. [Google Scholar] [CrossRef] [Scilit]
- Li, H.; Zhao, J.; Yan, B.; Yue, L.; Wang, L. Global DEMs Vary from One to Another: An Evaluation of Newly Released Copernicus, NASA and AW3D30 DEM on Selected Terrains of China Using ICESat-2 Altimetry Data. Int. J. Digit. Earth 2022, 15, 1149–1168. [Google Scholar] [CrossRef] [Scilit]
- Feng, Y.; Yang, L.; Zhan, P.; Luo, S.; Chen, T.; Liu, K.; Song, C. Synthesis of the ICESat/ICESat-2 and CryoSat-2 observations to reconstruct time series of lake level. Int. J. Digit. Earth 2023, 16, 183–209. [Google Scholar] [CrossRef] [Scilit]
- Nielsen, K.; Stenseng, L.; Andersen, O.B.; Villadsen, H.; Knudsen, P. Validation of CryoSat-2 SAR Mode Based Lake Levels. Remote Sens. Environ. 2015, 171, 162–170. [Google Scholar] [CrossRef] [Scilit]
- Deng, X.; Wang, R.-B.; Peng, F.; Yang, Y.; Mo, N.-M. Retracking Cryosat-2 Data in SARIn and LRM Modes for Plateau Lakes: A Case Study for Tibetan and Dianchi Lakes. Remote Sens. 2021, 13, 1078. [Google Scholar] [CrossRef] [Scilit]
- Lyons, E.A.; Sheng, Y.; Smith, L.C.; Li, J.; Hinkel, K.M.; Lenters, J.D.; Wang, J. Quantifying Sources of Error in Multitemporal Multisensor Lake Mapping. Int. J. Remote Sens. 2013, 34, 7887–7905. [Google Scholar] [CrossRef] [Scilit]
- Zhang, G.; Li, J.; Zheng, G. Lake-Area Mapping in the Tibetan Plateau: An Evaluation of Data and Methods. Int. J. Remote Sens. 2017, 38, 742–772. [Google Scholar] [CrossRef] [Scilit]
- Zhang, M.; Chen, F.; Tian, B. An Automated Method for Glacial Lake Mapping in High Mountain Asia Using Landsat 8 Imagery. J. Mt. Sci. 2018, 15, 13–24. [Google Scholar] [CrossRef] [Scilit]
- Li, J.; Sheng, Y. An Automated Scheme for Glacial Lake Dynamics Mapping Using Landsat Imagery and Digital Elevation Models: A Case Study in the Himalayas. Int. J. Remote Sens. 2012, 33, 5194–5213. [Google Scholar] [CrossRef] [Scilit]
- Zhang, T.; Wang, W.; An, B. Heterogeneous Changes in Global Glacial Lakes under Coupled Climate Warming and Glacier Thinning. Commun. Earth Environ. 2024, 5, 374. [Google Scholar] [CrossRef] [Scilit]
- Zhang, T.; Wang, W. Global Glacial Lake Dataset; National Tibetan Plateau/Third Pole Environment Data Center: Beijing, China, 2024. [Google Scholar] [CrossRef]
- Liu, W.; Liu, H.; Li, Q.; Xie, C.; Zhang, Z.; Zhou, G.; Zhang, Q.; Zhao, Q. Extensive Responses of Lake Dynamics to Climate Change on Northeastern Tibetan Plateau. Front. Earth Sci. 2023, 10, 1007384. [Google Scholar] [CrossRef] [Scilit]
- Sun, F.; Ma, R.; He, B.; Zhao, X.; Zeng, Y.; Zhang, S.; Tang, S. Changing Patterns of Lakes on The Southern Tibetan Plateau Based on Multi-Source Satellite Data. Remote Sens. 2020, 12, 3450. [Google Scholar] [CrossRef] [Scilit]
- Himmelstoss, E.A.; Henderson, R.E.; Kratzmann, M.G.; Farris, A.S. Digital Shoreline Analysis System Version 6.0; U.S. Geological Survey: Reston, VA, USA, 2024. [CrossRef]
- Bouzinac, C. CryoSat-2 Product Handbook; European Space Agency: Paris, France, 2015; Available online: https://earth.esa.int/documents/10174/125272/CryoSat_Product_Handbook (accessed on 11 January 2026).
- Taube, C.M.; Schneider, J.C. Three methods for computing the volume of a lake. In Manual of Fisheries Survey Methods II: With Periodic Updates; Michigan Department of Natural Resources: Ann Arbor, MI, USA, 2000; pp. 175–179. [Google Scholar]
- Li, Q.; Kang, X.; Xu, M.; Li, K.; Zhu, K. Hydrogeochemical Processes of As Enrichment and Migration in the Surface’s Critical Zone of the Shiquan River Basin in the Western Qinghai–Tibet Plateau. J. Hydrol. 2025, 646, 132305. [Google Scholar] [CrossRef] [Scilit]
- Muñoz-Sabater, J. ERA5-Land Hourly Data from 1950 to Present; Copernicus Climate Change Service (C3S) Climate Data Store (CDS): Reading, UK, 2019. [Google Scholar] [CrossRef]
- Kuang, X.; Jiao, J.J. Review on Climate Change on the Tibetan Plateau during the Last Half Century. J. Geophys. Res. Atmos. 2016, 121, 3979–4007. [Google Scholar] [CrossRef] [Scilit]
- Li, X.; Long, D.; Scanlon, B.R.; Mann, M.E.; Li, X.; Tian, F.; Sun, Z.; Wang, G. Climate Change Threatens Terrestrial Water Storage over the Tibetan Plateau. Nat. Clim. Change 2022, 12, 801–807. [Google Scholar] [CrossRef] [Scilit]

Disclaimer/Publisher’s Note: The statements, opinions and data contained in all publications are solely those of the individual author(s) and contributor(s) and not of MDPI and/or the editor(s). MDPI and/or the editor(s) disclaim responsibility for any injury to people or property resulting from any ideas, methods, instructions or products referred to in the content. |
© 2026 by the authors. Licensee MDPI, Basel, Switzerland. This article is an open access article distributed under the terms and conditions of the Creative Commons Attribution (CC BY) license.