


Highlights
What are the main findings?
- Drone-based observations captured strong event-to-event variability in marine aerosol size and number concentrations.
- Air-mass origin and boundary-layer structure were the primary factors shaping observed aerosol characteristics.
What are the implications of the main findings?
- Upwind transport and boundary-layer dynamics are critical for interpreting reef-scale aerosol measurements.
- Drone-based sampling provides an effective approach for monitoring marine aerosols in remote and otherwise inaccessible regions.
Abstract
Marine aerosol particles influence the climate, and interactions between ocean waves and coral reefs may impact aerosol size distributions in remote locations, such as the Great Barrier Reef. However, quantifying these processes has proven to be challenging. We tested whether marine aerosol size distributions and concentrations differ across four zones: background air outside the lagoon, above the reef crest, within the lagoon, and near the beach of Heron Island, approximately 85 km offshore. Using a modified DJI Matrice 600 hexacopter equipped with a miniaturised optical particle counter and custom inline gas dryer, we measured aerosols from 165 to 3000 nm across 64 drone flights during 16 sampling events in November 2024. Aerosol concentrations showed substantial day-to-day temporal variability, while spatial differences among reef zones were generally minor; on certain days, the maximum difference between background and near-island measurements reached approximately 25%. K-means clustering identified four dominant air mass transport patterns, and Hybrid Single-Particle Lagrangian Integrated Trajectory model analysis indicated that upwind conditions had a strong influence on aerosol loading. Vertical profiles revealed limited variability within the lowest 100 m. Mixing layer height, air parcel travel speed, and water depth along the final 12 h of trajectories were key drivers of aerosol variability. These results demonstrate the potential of drone-based measurements for characterising marine aerosols and provide a foundation for improving climate model representations of natural aerosol processes.
1. Introduction
Energy, momentum, moisture, gases, and aerosols move continuously between the Earth’s surface and the lower atmosphere within the planetary boundary layer [1]. Around 70% of this exchange occurs over the ocean [2,3]. Marine aerosols can contribute to negative radiative forcing and play an important role in shaping our climate [4]. The influence of marine aerosols occurs directly through interactions with sunlight [5,6] and indirectly when particles alter cloud properties and lifespan [7]. These processes are critical to Earth’s energy balance, yet their precise effect remains one of the largest uncertainties in quantifying global radiative forcing and predicting future climate change [8] due to the complex physical and chemical behaviour of aerosol particles and their spatio-temporal variation across regions [9]. Increased sampling of regional marine aerosol characteristics is important for advancing our understanding of natural aerosol sources and their influence on the climate [3,10,11].
Marine aerosols include both natural and anthropogenic components. Natural sources primarily consist of sea spray aerosols (SSA) and secondary marine aerosols (SMA). At the same time, anthropogenic contributions can be present from the long-range transport of continental aerosols (e.g., dust, sand) and emissions from fossil fuel combustion, including ship exhaust [12]. In remote regions like the Great Barrier Reef, the air is cleaner than in most parts of the world, and natural fluxes of SSA and SMA often dominate the aerosol budget, with minimal influence from anthropogenic emissions [13]. The relative absence of pollution provides an ideal environment for investigating natural aerosol processes, making such regions crucial for understanding baseline atmospheric conditions and the role of marine aerosols in climate regulation [3,12,14].
The formation of SSA is influenced by factors such as wind speed and sea-surface temperature [15,16]. Beyond SSA as a direct aerosol source, the ocean also emits volatile gases, including dimethyl sulphide (DMS) and other organic compounds, which undergo atmospheric oxidation to form SMA. These gases are linked to the biological activity of marine phytoplankton, algae, and endosymbiont zooxanthellae in reef-building corals [17,18]. DMS remains the dominant natural source of atmospheric sulphur [10,19]. Spikes in DMS emissions have been recorded over the Great Barrier Reef, typically occurring during daylight with low relative humidity and low wind speeds, which create favourable conditions for the local gas-phase nucleation of DMS oxidation products [20,21].
Particle size plays a crucial role in aerosol behaviour [22], influencing the atmospheric residence time of SSA, which ranges from seconds to days, depending on their size. Larger SSA (~5000–10,000 nm) settle rapidly due to the influence of gravity, while smaller aerosols, particularly those in the accumulation-mode size range (~100–1000 nm), persist longer in the atmosphere and are primarily removed by cloud interactions and precipitation. As aerosol size decreases, diffusivity increases, making the smallest particles more susceptible to removal via coagulation and dry deposition [14,23,24]. In contrast, the atmospheric residence time of DMS is approximately 24 h [25]. After oxidation, the formation of SMA through nucleation or condensation can take additional time, typically ranging from several hours to a day. The scattering of light by aerosols depends on their size, composition, and the wavelength of light. As mid-visible solar radiation is centred ~550 nm, particles between 200–1000 nm are most effective at scattering light [26,27].
Marine aerosols < 1000 nm are generally considered non-sea-salt sulphate, while larger ones are classified as sea-salt aerosols. However, research suggests that nearly all aerosols > 130 nm are likely to contain some degree of sea salt [18,26,28]. The concentration and size of giant sea-salt aerosol particles with a dry diameter > 1000 nm are influenced by high wind stress (>7 m/s) on the ocean surface and cloud processing [24,28,29,30]. In clean marine environments, these aerosols likely play a major role in aerosol-cloud interactions, influencing cloud properties and potentially transforming non-precipitating clouds into precipitating ones. However, marine aerosols remain sparse even at high wind speeds [30,31,32]. Traditional surface-based instruments deployed on islands [33], research vessels [34], and aircraft [35] have been used to investigate marine aerosol emissions and their vertical entrainment over coral reefs. However, a critical measurement gap remains within the lowest 100 m of the atmosphere [36]. To address this, we used a custom-designed multirotor drone equipped for aerosol sampling. These new observations improve our understanding of the processes shaping aerosol concentrations over remote oceanic regions and establish a baseline for assessing the influence of anthropogenic particle emissions in more industrialised environments [2,22]. We further sought to identify potential reef-zone effects on aerosol properties arising from the formation or modification of particles through DMS emissions from the Heron Reef lagoon [10], emissions from Heron Island [37], and sea spray generation at the reef crest [38]. The overarching aim of the present study was to apply drone-based methods to establish source–receptor relationships for variability in natural marine aerosol size distributions and number concentrations over a coral reef lagoon in the Great Barrier Reef. We tested the hypotheses that marine aerosol size distributions (i) differ among background air outside the coral lagoon, above the reef crest at the coral lagoon edge, within the lagoon, and near the beach of a remote sand island, and (ii) differ between low- and high-tide. We also assessed the role that environmental factors play in contributing to the dynamics of marine aerosol particles in the first 100 m above a coral reef.
2. Materials and Methods
2.1. Sampling Methods and Safety Strategy
A Matrice 600 (M600) hexacopter drone (DJI, Shenzhen, China) was used to characterise vertical aerosol size distributions near Heron Island, a coral cay located ~80 km off the east coast of Australia (23.439°S, 151.908°E) within a protected research zone of the Great Barrier Reef Marine Park (Figure 1). Between the 3rd and 16th of November 2024, 64 flights were conducted with complete datasets to characterise vertical aerosol size distributions (Table 1).
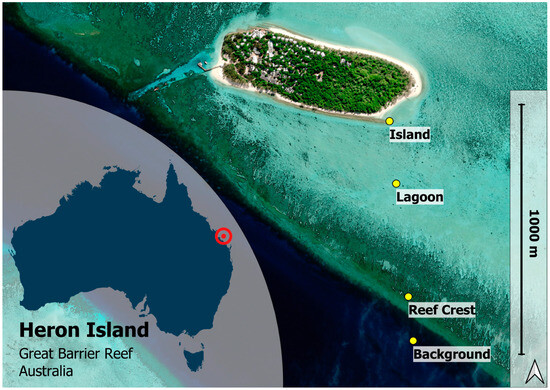
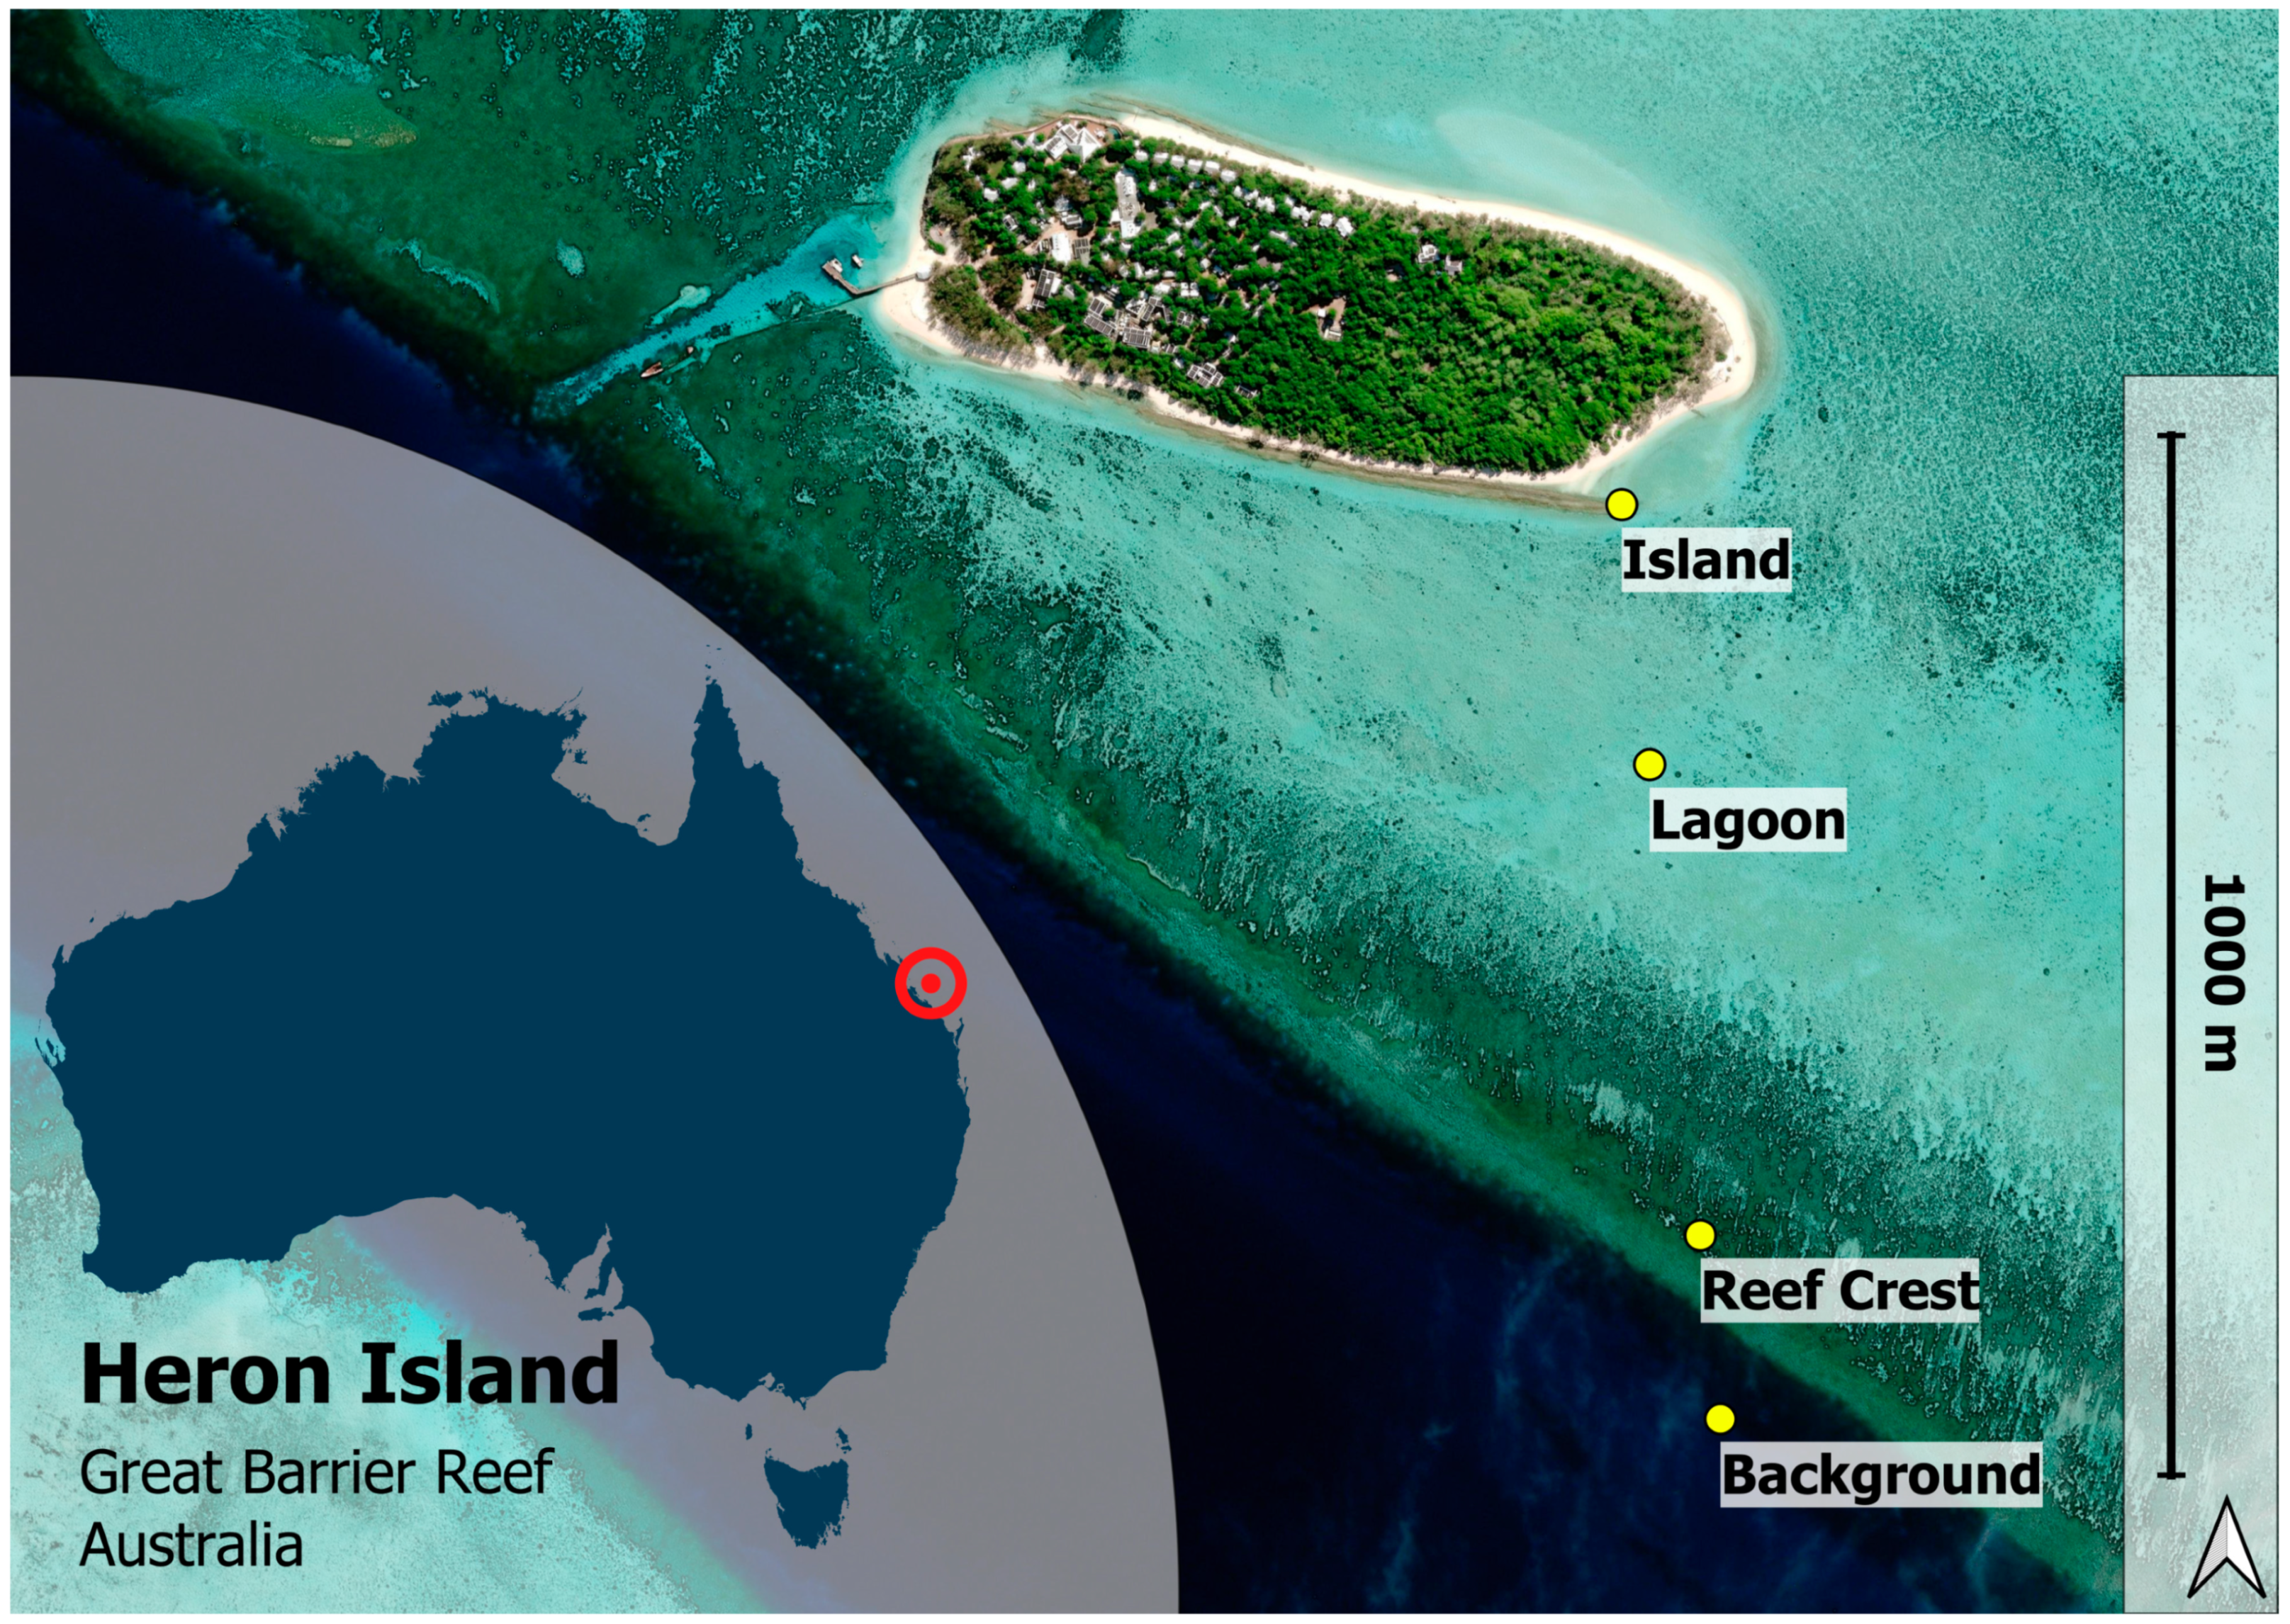
Figure 1.
Heron Island (indicated by the red circle) is a coral cay in the Capricorn Group within the southern Great Barrier Reef, Australia (−23.439°S, 151.908°E). Sampling flights were carried out across four areas: near the island, within the lagoon, over the reef crest, and outside the reef lagoon. Flights were scheduled to align with either high or low tide to ensure representative environmental conditions (Source: Esri).
Table 1.
Summary of drone flights during the campaign. Each event included four vertical profiles, one per sampling location (Background, Reef Crest, Lagoon, and Island), recorded at 5 m intervals from approximately 5 to 105 m above water. Tidal state refers to plus or minus two hours around the predicted high or low tide.
A complete data set consisted of vertical sampling flights at four different environmental locations: background outside the reef lagoon, over the reef crest, inside the reef lagoon, and near Heron Island (Figure 1). The flight missions were pre-programmed to ensure consistent and repetitive aerosol measurements throughout the campaign. Each automated flight began with a 15-s hover at 5 m above water level at each sampling location. The drone then ascended in 5-m increments, hovering for 15 s at each altitude level until reaching a maximum height of ~105 m. Due to regular helicopter operations servicing Heron Island Resort, strict drone safety protocols were implemented under Australian aviation safety regulations [39,40]. All flight missions were scheduled within ±2 h of predicted high or low tide to capture aerosol variability across tidal cycles and provide temporal variability compared with fixed sampling times. The replicate sampling events were considered independent, as there was at least 4.5 h between each event. Flight times were adjusted or postponed during periods of high bird or helicopter activity. All equipment was transported daily to and from the launch site on the island’s eastern tip to minimise disturbance to nesting turtles at night.
2.2. Sampling Hardware
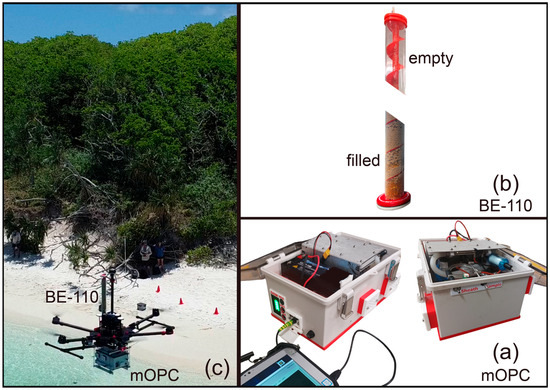
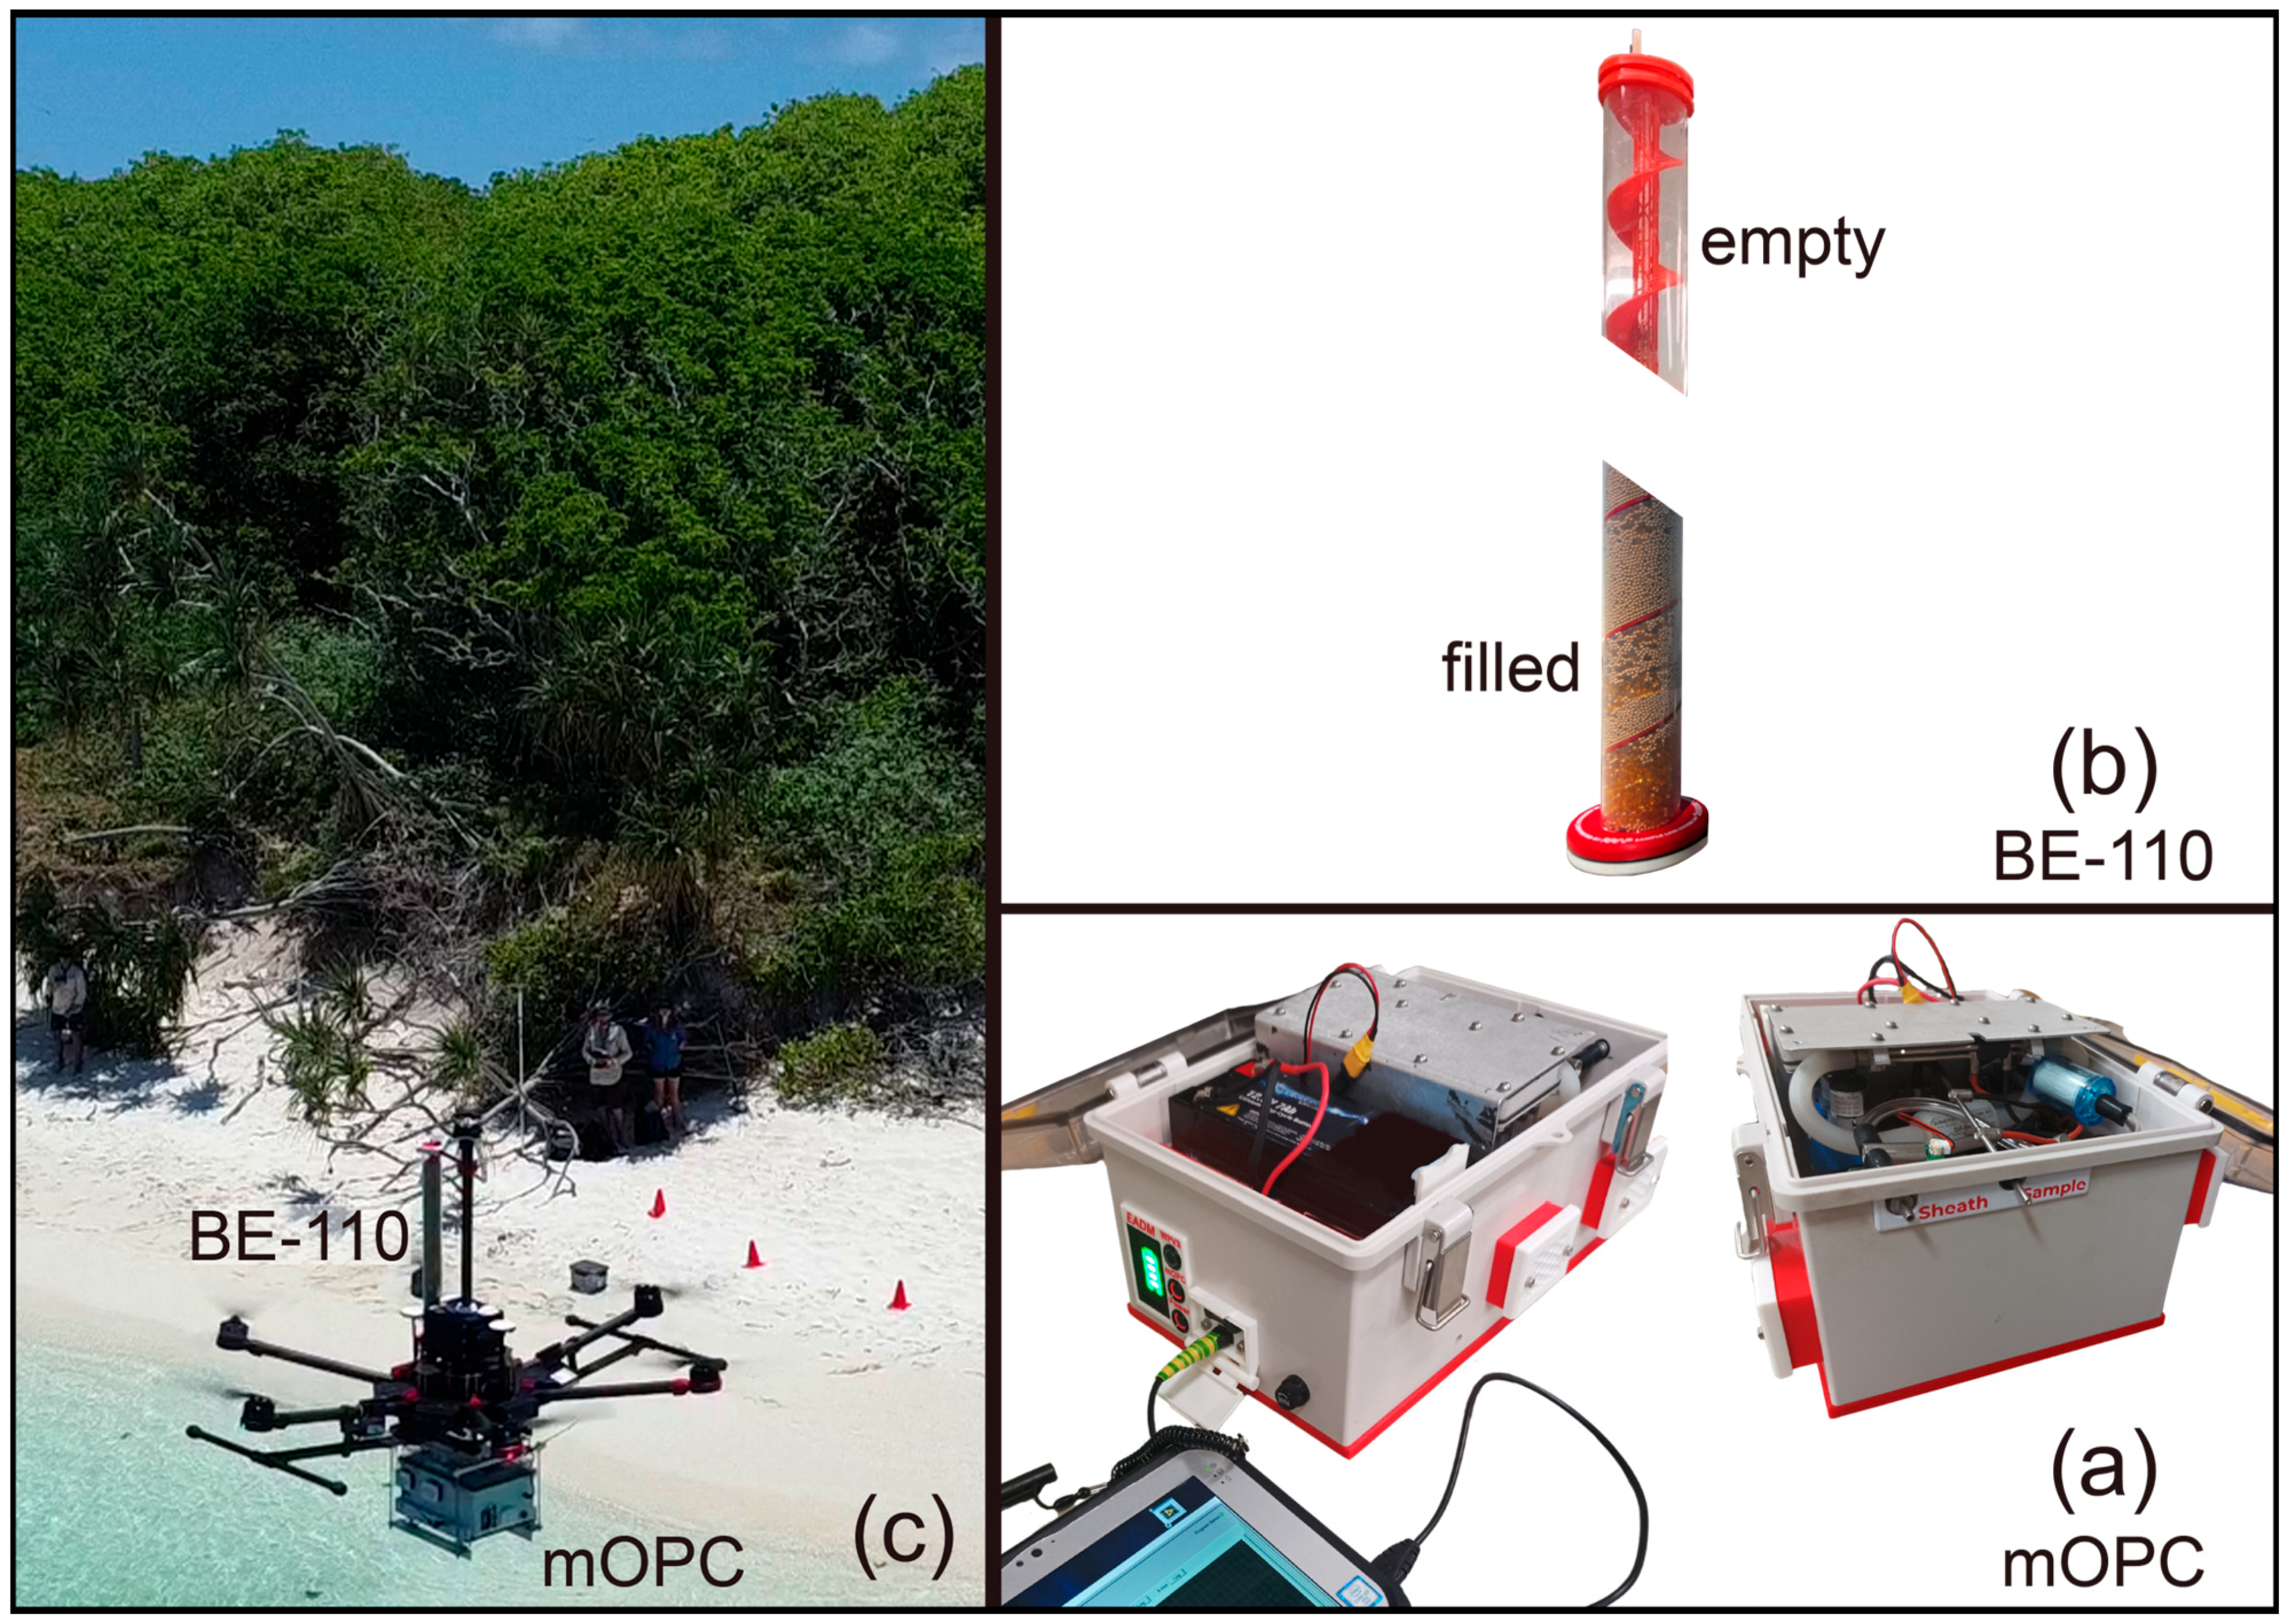
The 4.6 kg instrumentation payload included a model 9405 miniaturised optical particle counter (mOPC) (Brechtel, Hayward, CA, USA) (Figure 2a,c) and a custom-made inline gas dryer unit using a Nafion™, BE-110-18 moisture exchanger (BE-110) (Perma Pure, Lakewood, CO, USA), filled with molecular sieve desiccant (Figure 2b,c). The mOPC, designed for drones and small aircraft, measures particle number size distributions with a manufacturer-claimed 100% counting efficiency for diameters between 165 nm and 3000 nm. It classifies particles into 72-size bins and operates within a 0–50,000 [#/cm3] concentration range, with an error margin below 10% [41]. The unit, measuring 9.4 × 11.9 × 15.2 cm, was housed in an IP66-rated enclosure with 3D-printed components securing the mOPC and a separate 12.8 V, 7.0 Ah lithium-ion battery, which powered the device independently of the drone (Figure 2a). An external SD card and USB port allowed tablet connectivity for monitoring sampling parameters and retrieving data without opening the enclosure, protecting the instrument from dust, sand, and humid air (Figure 2a). To operate the mOPC over extended periods in Heron Island’s tropical marine environment, we integrated four 12 V, 30 mm ventilation fans with exchangeable filters to cool the instrumentation housing. The sample and sheath flow inlets were positioned at the back of the enclosure, and the mOPC’s sample inlet was rotated 90° to shorten and straighten the inlet line, reducing transport losses of larger particles (Figure 2a).
Figure 2.
The 4.6 kg payload consisted of two main components: a mini optical particle counter (mOPC) (Brechtel, Hayward, CA, USA) (a) and a custom-built inline gas dryer (BE-110) (b), using a BE-110-18 moisture exchanger (Perma Pure, Lakewood, CO, USA). The mOPC was mounted beneath the drone’s main body to keep the weight centred around the drone’s centre of gravity. At the same time, the BE-110 gas dryer was positioned on top to minimise interference from the rotor wash (c).
The BE-110 was mounted on a carbon fibre plate on top of the drone body, with the aerosol sampling inlet positioned around 0.5 m above the spinning propeller blades. This placement ensured a negligible rotor-wash impact on the sampling air stream during hovering [36,42]. The dryer unit consisted of two 3D-printed components with a screwable central connection; both were enclosed in a 40 mm acrylic tube. The central axis of the tube provided space for the BE-110-18 moisture exchanger. A helical path around the central sample line allowed the molecular sieve to be filled from the top and emptied without removing the device from the drone. The desiccant mixture included 10% silica beads, which contained a colour indicator to visually signal when saturation occurred, and replacement was necessary (Figure 2b).
Before entering the instrument enclosure, the airline was split by a Model 1105 aerosol sample centreline splitter (Brechtel, Hayward, CA, USA) [43] into a sheath and sample flow. An additional microfibre filter capsule was installed in line with the sheath flow inside the enclosure to prevent particles from entering the mOPC pumps. A compact inline humidity sensor (Brechtel, Hayward, CA, USA) was installed just inside the enclosure on the sheath flow line to measure the moisture content of the air before it entered the mOPC. Although the sensor has limited accuracy and sensitivity to rapid humidity changes, its small size allows for direct installation in the mOPC line without adding significant weight, providing a general indication of moisture content.
Laboratory tests were conducted to assess the performance of the integrated mOPC and BE-110 (Appendix A, Figure A1). The performance of the custom-made BE-110 inline gas dryer is evaluated by comparing ambient relative humidity with measurements taken after the airflow passed through the BE-110, using the mOPC inline sensor, and the Vaisala HMP60 humidity probe (Vaisala, Vantaa, Finland) (Figure A2). The Vaisala measurements were consistent with the expected performance of the Perma Pure BE-110-18 moisture exchanger, and a positive bias adjustment of 5.8% was applied to the mOPC sensor. Overall, the dryer reduced ambient RH from ~67% to below 35% for at least one hour, ensuring sufficient drying for the sampling missions.
The performance of the mOPC was evaluated using aerosols generated by a Brechtel Aerosol Generation System 9200 (Brechtel, Hayward, CA, USA) from ammonium sulphate solution.The generated aerosols were passed through a Perma Pure Nafion dryer (Perma Pure, Lakewood, CO, USA) before being split and measured by the mOPC, a model 2100 scanning electromobility spectrometer (SEMS),() (Brechtel, Hayward, CA, USA), an aerodynamic particle sizer (APS) (TSI, Shoreview, MN, USA) and a model DMS500 differential mobility spectrometer (DMS) (Cambustion, Cambridge, UK). The aerodynamic particle size from the APS was converted to electrodynamic size by assuming spherical particles; the measured sizes of the other instruments were left as measured (Figure A3). The size calibration of the mOPC was further confirmed for the range 200–1000 nm by connecting the inlet to the mono-disperse output of the SEMS. The measured particle distributions on the mOPC were within the manufacturer’s specifications, as shown in an example of the mOPC response when the SEMS output was set to 600 nm (Figure A4).
2.3. Modelling Data and Analysis
Aerosol number concentrations [#/cm3] and dN/dlogDp were calculated from raw aerosol counts. The mOPC scanned at 1 Hz as the drone hovered at each of the 21 altitude levels for 15 s. Measurements were averaged into a single value per altitude level to reduce data noise. Further generalisations of parameterised size distributions were based on averages of the fitted lognormal parameters from the initial parameterisation at each altitude level. The sampling locations were aligned in a straight line in a southeasterly direction. The distance between the closest location to the island and the background measurement site outside the lagoon was approximately 960 m (Figure 1).
To assess spatial variation in aerosol number concentrations, we calculated differences at each altitude and expressed them as percentage variations. Following a short period of rain, one sampling event was excluded due to significantly different aerosol number concentrations between locations compared to dry conditions. We observed a bimodal pattern in the size distributions, indicating two primary sources of natural aerosols in the smaller range (<500 nm). A third mode, centred around ~330 nm, was observed in only a few events with small number concentrations. Therefore, a bimodal lognormal fit was consistently applied to enable a robust comparison of overall trends across all samples. The smaller mode is referred to as mode 180, and the larger mode is referred to as mode 240. Nonlinear least squares fitting using the R package minpack.lm (v1.2-4) was applied to optimise and parameterise aerosol size distributions [44].
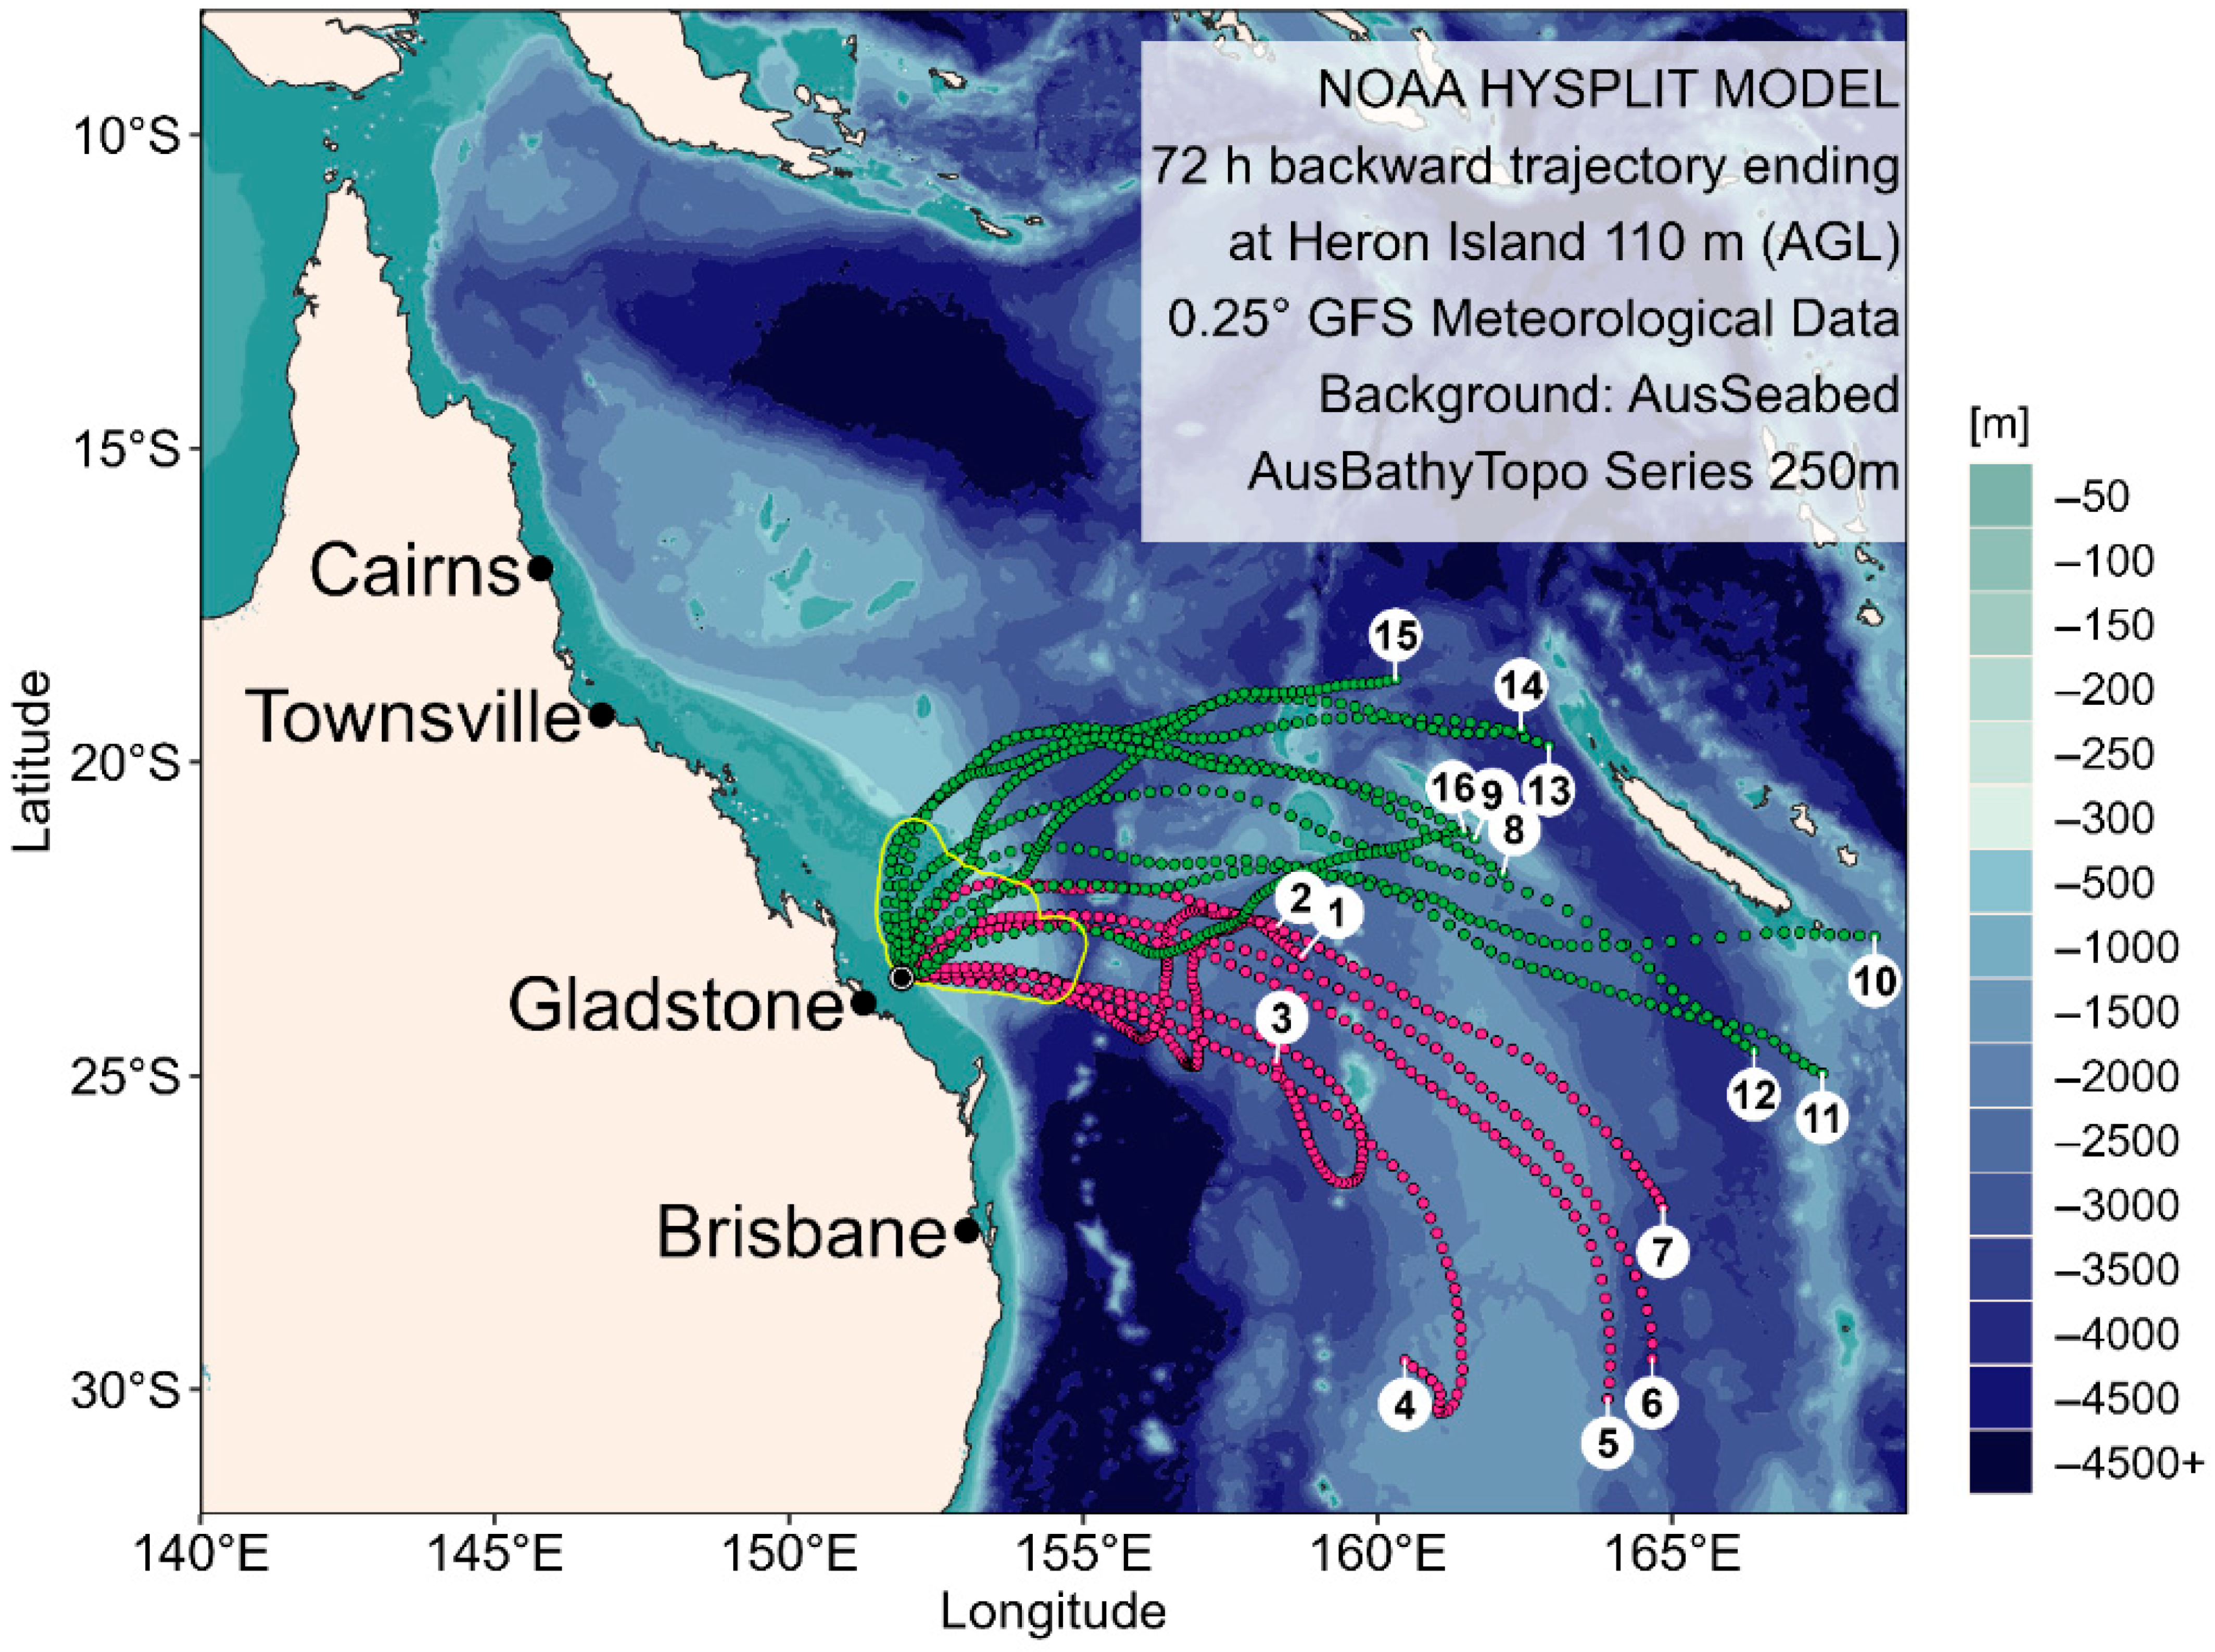
To analyse the geospatial trends of air parcel pathways arriving at Heron Island, a dataset of 5968 individual 72 h air parcel backward trajectories was calculated using the American National Oceanic and Atmospheric Administration Hybrid Single-Particle Lagrangian Integrated Trajectory model (HYSPLIT) [45]. The retrieval process was automated using the openair R package [46]. The trajectories were computed over four years from January 2021 to January 2025, with arrival heights of 150 m above Heron Island and arrival times at six-hour intervals. Cluster analysis was used to group air masses with similar geographic origins. The trajCluster function from the openair package was set to use an angle-based distance matrix, which clusters trajectories according to their angular similarity from the origin and is suited to analyses where transport direction is the primary focus [47]. Density plots of the clustered trajectories were then created to define the spatial boundaries of each cluster for subsequent analysis.
For all 16 sampling events conducted during the field campaign, 72 h HYSPLIT backward trajectories were calculated using 0.25° Global Forecast System (GFS) meteorological data. Spatial analysis was performed to assign each trajectory to the dominant air mass cluster identified through k-means analyses. To assess long-term factors influencing the variability of natural aerosols at Heron Island, we integrated bathymetry data and extended GFS meteorological parameters, including mixed layer height (MLH), relative humidity, and air parcel travel speed over the 0 to 12 h period along the air parcel pathway. Air parcel travel speed was calculated from consecutive HYSPLIT trajectory points using the haversine formula (geosphere package in R) to determine great-circle distances, divided by the time interval between points. Based on the atmospheric lifetimes of SSA [14] and SMA [48,49], we assumed the last 12 h of an air parcel’s trajectory are most critical for determining aerosol size distributions above Heron Island. While longer time spans (e.g., 0–24 h) could also be considered, averaging over these intervals tends to smooth out short-term variations in mixing depth, water depth, and travel speed, thereby reducing the ability to resolve source–receptor relationships. The 0–12 h group showed the highest variability in mixing depth, while the 13–24 h group exhibited the greatest variability in water depth and elevated air parcel speeds. Later age groups were less variable. Linking these data to previously identified clusters, and considering water depth, suggests that the final passage over the reef or open water is likely the most influential segment for aerosol properties at the sampling site. Focusing on 12 h increments captures short-term source contributions without diluting signals, in line with the limited lifetime of SSA and SMA.
Bathymetry along air parcel pathways was extracted from the AusBathyTopo 250 m 2024 Grid, a national bathymetric dataset encompassing the marine territory of Australia [50], to assess how the underlying marine environment influences air parcels and their aerosol composition. Air parcels travelling from the north spend extended periods over the shallower waters of the Great Barrier Reef, where increased biological productivity may enhance the composition and abundance of SSA and SMA [48,51]. As the SSA flux generally increases with wind speed [3,30], we calculated air parcel travel speed along backward trajectories to better understand the influence of atmospheric transport dynamics on aerosol composition at the endpoint. Additionally, the hygroscopicity of marine aerosols, particularly those composed of ionic solutions, affects their growth factor, vertical entrainment, and potential cloud processing [52,53]. These processes are strongly influenced by ambient relative humidity, and incorporating this parameter provides further insight into its impact on aerosol size distributions at Heron Island. The MLH also plays a key role in lower atmospheric dynamics. MLH estimates from GFS-based calculations align with ground-based measurements, particularly in capturing temporal variations [54]. Including this data also allowed a better assessment of how the diurnal cycle influences aerosol composition. Information about local wind speed was obtained from the Australian Institute of Marine Science (AIMS) Northern Australia Automated Marine Weather and Oceanographic Stations sensor deployed on Heron Reef.
We used permutational multivariate analysis of variance (PERMANOVA) [55] to test the hypothesis that aerosol size distributions differ significantly among sampling locations around Heron Reef. Location was treated as a fixed factor with four levels: background (outside the reef lagoon), reef crest, inside the reef lagoon, and near Heron Island (just off the beach), and sampling event was a random factor. Each peak concentration value from the bimodal lognormal fitted modes (mode 180 and mode 240) and the total aerosol number concentration was treated as a replicate in the PERMANOVA analyses. Analyses were conducted using Euclidean distance with 9999 permutations. When a significant main effect was detected, pairwise post-hoc tests were used to identify differences among factor levels. To explore source-receptor relationships, we analysed variables, including k-means cluster assignments for each HYSPLIT trajectory, water depth, MLH, air parcel travel speed, and tidal conditions. This analysis was performed using a distance-based linear model (DistLM). The model selection was based on the corrected Akaike Information Criterion (AICc), and a best-fit procedure was selected for these analyses. All PERMANOVA, post-hoc, and DistLM analyses were carried out in PRIMER 7 (version 7.0.24) with the PERMANOVA+ add-on (PRIMER-e, Auckland, New Zealand).
3. Results
Across 11 sampling days, one or two measurement runs were conducted each day, resulting in 16 sampling events and ~20,000 aerosol scans recorded at 1 Hz across 72 particle size bins (165–3000 nm). After correcting for the positive bias of the Brechtel inline humidity sensor, the average relative humidity downstream of the BE-110 was 31.3% (Figure A2). As such, aerosol sizes that fell below the efflorescence point for NaCl in sea salt-containing aerosol are reported [56]. Consistently low wind speeds (<5 m/s) during all sampling events resulted in few, if any, detections of larger aerosol particles. As a result, the measured aerosol number concentrations predominantly reflect natural aerosol loadings not driven by local wind. Contrary to our initial hypothesis, aerosol size distributions did not differ significantly between sampling locations, while strong variability was observed between sampling events.
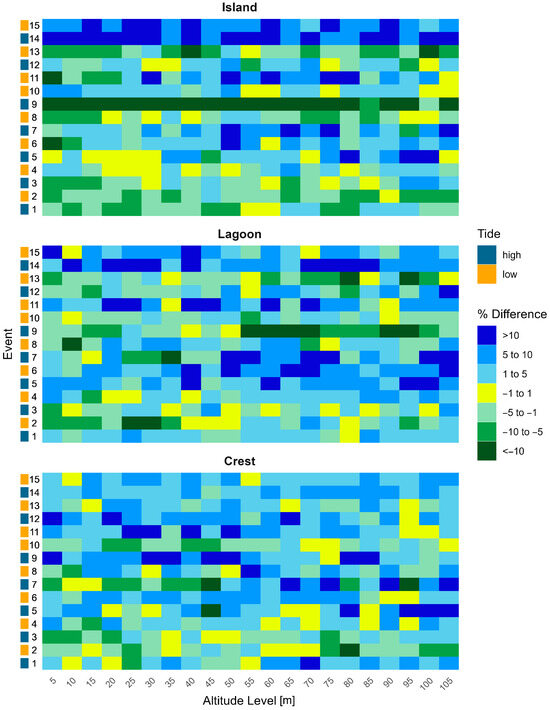
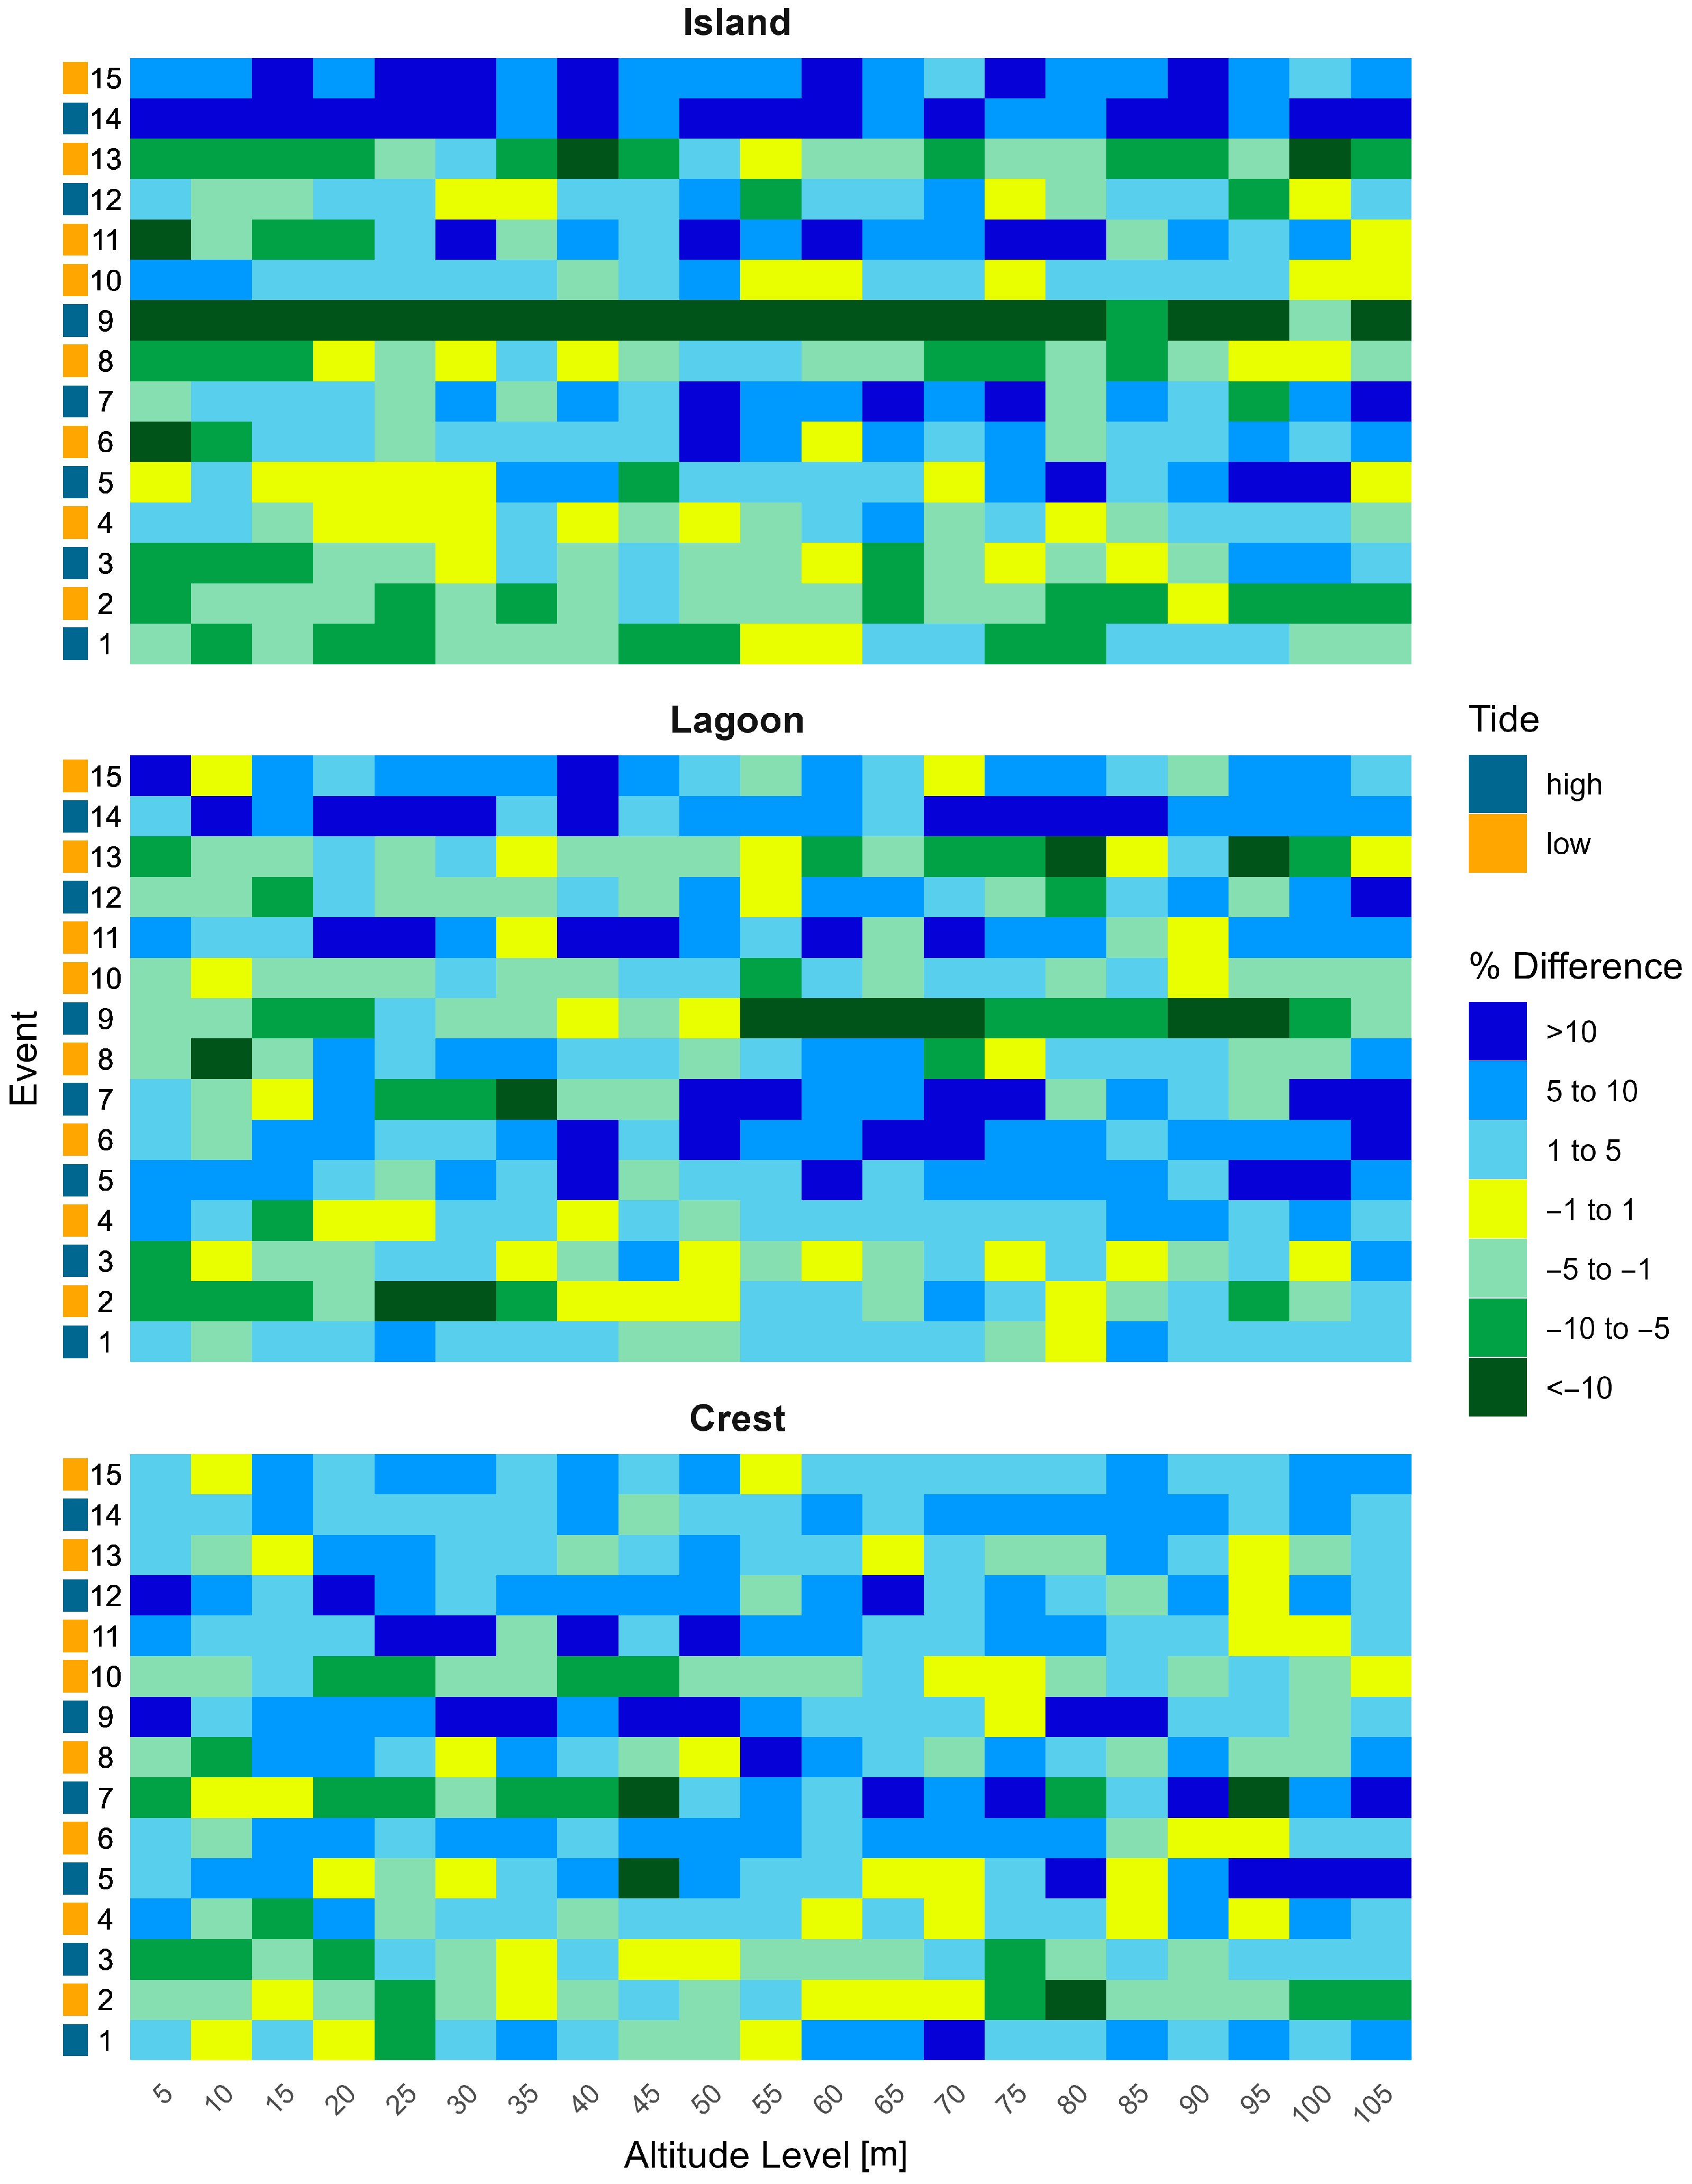
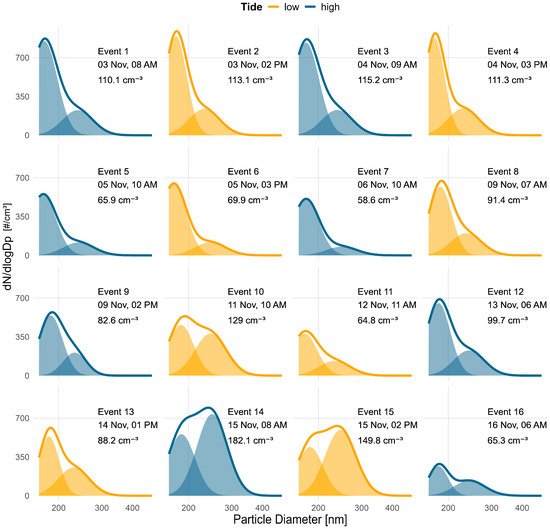
Measured aerosol concentrations [#/cm3] varied by up to +19% to −25% between the background site outside the reef lagoon and the three other sampling locations (Figure 3). Sampling events 1, 2, 3, 4, 8, 10, and 13 exhibited mean percentage differences of less than ±5%. The greatest spatial variation was observed during event 9, with an absolute mean difference exceeding 10.2% across all locations relative to the background concentration (Figure 3). On average, aerosol number concentrations differed least from the background at the crest location, with a mean difference of 4.6%. In contrast, the largest average difference was recorded near the island site, with a mean difference of 5.8% (Figure 3). Total marine aerosol number concentrations varied across the 16 sampling events, with a mean of 98.6 [#/cm3] (±33.9 [#/cm3]), ranging from 58.6 to 182.1 [#/cm3] (Figure 4). Following rain immediately prior to sampling event 16, aerosol number concentrations were up to 46% lower at the island, 39% lower at the lagoon, and 31% lower at the crest relative to the background site (Figure 4).
Figure 3.
Percentage differences in aerosol number concentrations among the background measurements taken outside the reef lagoon and all other sampling locations. Overall, we see differences ranging from +19% to −25%. During events 1, 2, 3, 4, 8, 10, and 13, aerosol concentrations were relatively consistent with height around Heron Island, with measurements at the island, lagoon, and reef crest varying on average by less than ±5%. Overall, the least variation in concentrations was recorded above the reef crest (4.6%), while the most variation was near the island (5.8%), reflecting the spatial distances from the background location. Event 16, which followed a rain event, showed substantial reductions in aerosol concentrations (−46% at the island, −39% at the lagoon, and −31% at the crest) and was excluded from the analysis.
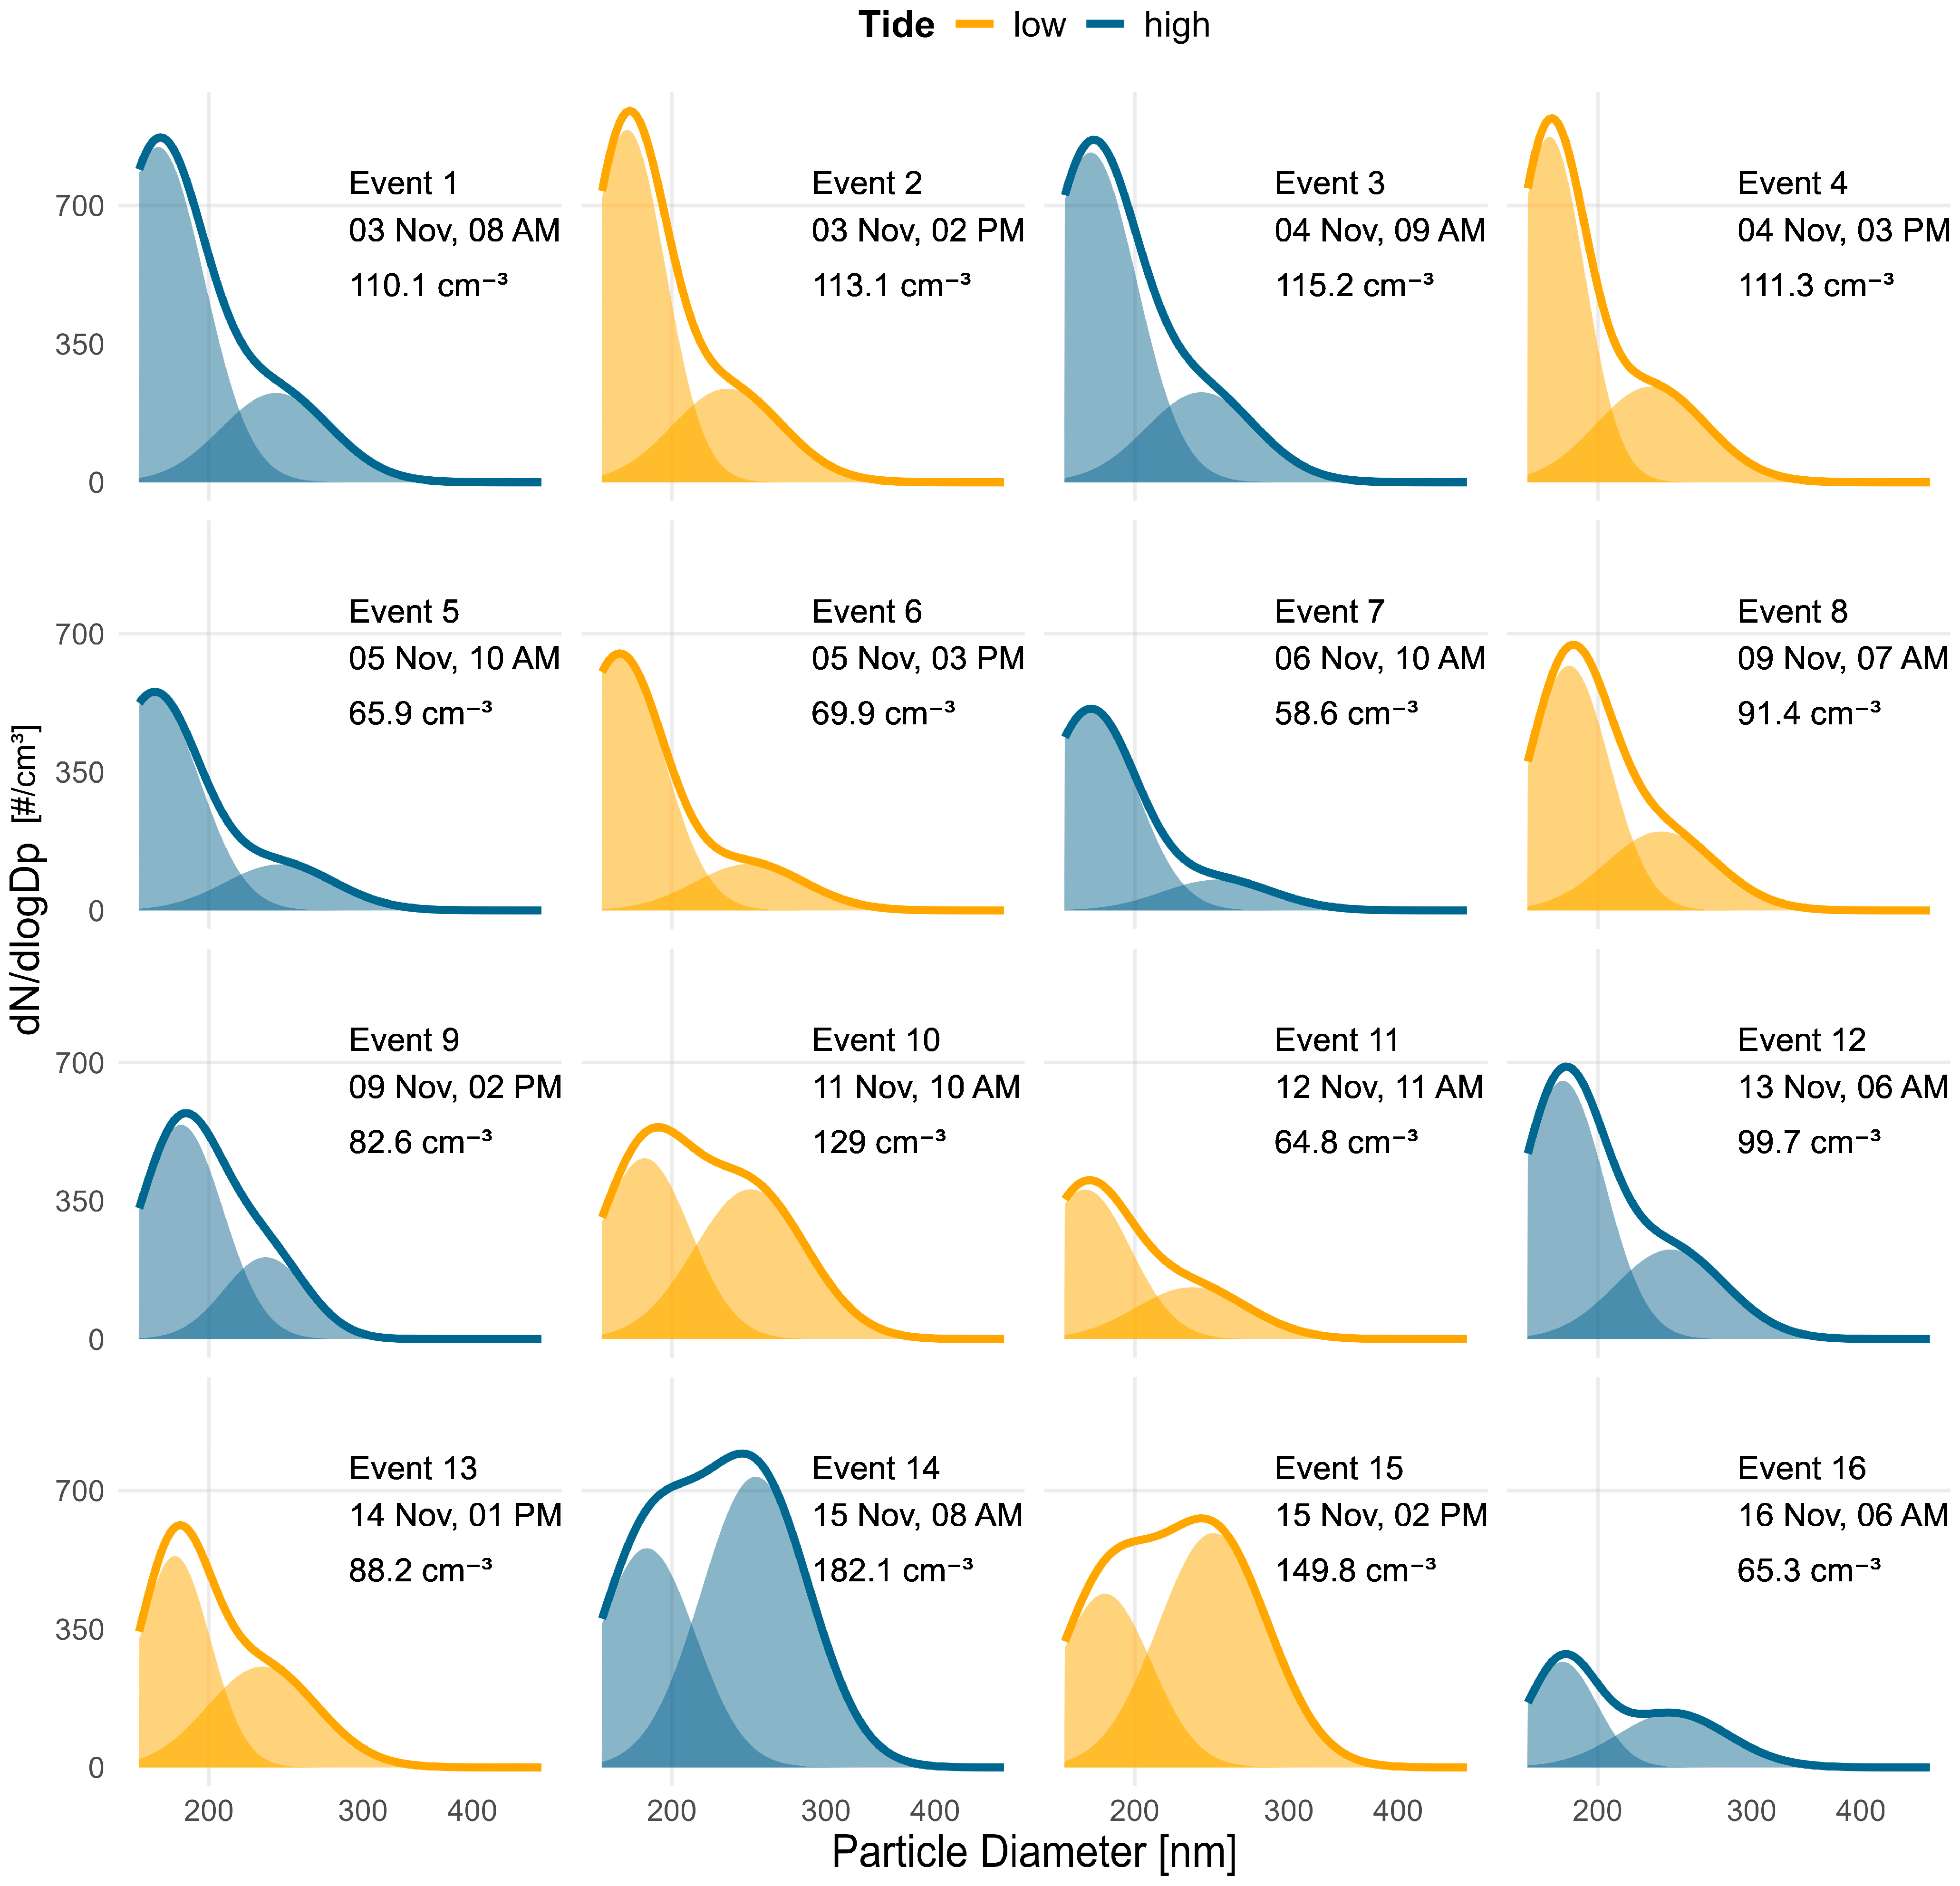
Figure 4.
Bimodal lognormal fitted curves for each measurement event, with event numbers and local Queensland (Australia) time shown alongside corresponding aerosol number concentrations. Aerosol conditions were sampled during both low and high tides on five days (3, 4, 5, 9, and 15 November). Early in the field campaign, smaller aerosols dominated the size distribution, and a shift from high to low tide was generally associated with increased dominance of mode 180. In contrast, during events 14 and 15, when mode 240 was dominant, higher aerosol concentrations were observed during high tide, when more water was present over Heron Reef. Event 16 size distribution illustrates the notable drop in aerosol concentration following a rain event.
We identified five groups of sampling events that captured both high and low tide conditions on the same day: event groups 1–2, 3–4, 5–6, 8–9, and 14–15 (Figure 4). For further analysis, we focused on aerosol concentrations in the smallest size bins (165–176 nm), which are most likely to capture organic emissions from coral reefs [27]. Tidal conditions significantly influenced mean aerosol number concentrations across all five event groups. In four comparisons (event groups 1–2, 3–4, 5–6, and 8–9), high tide was associated with a statistically significant decrease in mean particle number concentration (size range 165–176 nm, with the strongest effect observed in events 8–9 (estimate = −0.78, p < 0.001, R2 = 0.18). In contrast, event group 14–15 showed a significant increase in mean particle number concentration at high tide (estimate = +0.31, p < 0.001). The percentage changes in mean particle number concentration between high and low tide conditions for each event group were also calculated (Table 2). Event groups 1–2, 3–4, and 5–6 exhibited very similar size distributions, each with a dominant mode at 180 nm and moderate increases in aerosol concentrations of 7.5%, 11.6%, and 13.7%, respectively. Event group 8–9 also showed a dominant mode at 180 nm; however, the increase in aerosol concentrations was substantially higher, rising by 30.8% (Table 2, Figure 4). In contrast, event group 14–15, characterised by a dominant mode at 240 nm, displayed an 8% reduction in aerosol concentrations. Despite this overall trend, a location-specific comparison at the island site during events 14–15 revealed a 2.1% increase in aerosol number concentrations between high and low tide (Table 2, Figure 4).
Table 2.
Mean percentage change in aerosol number concentration (165.0–176.3 nm) between low and high tide, with standard deviation and standard error, grouped by sampling location. Environmental variables include local wind speed (AIMS weather sensor), k-means cluster assignment, mixing layer height, air parcel travel speed, and ocean water depth integrated over the final 12 h of the Hybrid Single-Particle Lagrangian Integrated Trajectory model backward trajectory.
Event groups 1–2, 3–4, and 5–6 showed similar aerosol size distributions and comparable environmental conditions along the HYSPLIT trajectories, so they were grouped. Across these grouped events, aerosol concentrations in the 165.0–173.4 nm size range increased by 10.9%. For event group 8–9, concentrations in this size range increased by 30.8% from high to low tide across all locations. In contrast, event group 14–15, dominated by a mode 240 event, showed an 8.9% decrease from high to low tide.
Water depths along the air parcel trajectories during the final 12 h before arriving at Heron Island were also recorded. In the grouped events (1–2, 3–4, 5–6), average water depth ranged from −674 m to −110 m, with a mean of −371 m. Event group 8–9 travelled over much shallower water, averaging −72 m at high tide and −58 m at low tide. In event groups 5–6, the water depth during low tide was −110 m, compared to −561 m in event group 1–2. Data were grouped into two altitude ranges (low: 5–20 m; high: 90–105 m) to investigate the vertical dispersion of measured aerosols. At the background location, aerosol concentrations decreased slightly, with an average reduction of 0.29% and fluctuations ranging from a 13.5% decrease to a 7.42% increase during ascent from 5 to 105 m above ground level. At the crest location, which can be subject to wave action, concentrations showed a greater average reduction of 2.74%, with variations between a 10.9% decrease and a 13.1% increase over the same height range. The island location experienced an average decrease of 3.19%, with changes ranging from a 15.9% decline to a 13.5% increase. The lagoon showed the most consistent trend, with an average decrease of 3.93%, although fluctuations ranged from a 4.46% drop to a 14.9% increase. Vertical profiles from 5 to 105 m above sea level showed only minor variations in aerosol number concentration and no consistent pattern (Figure 3).
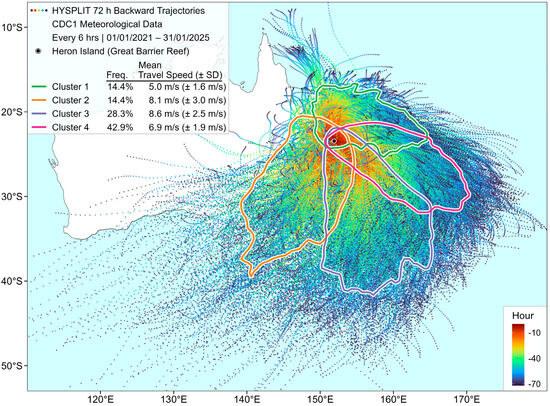
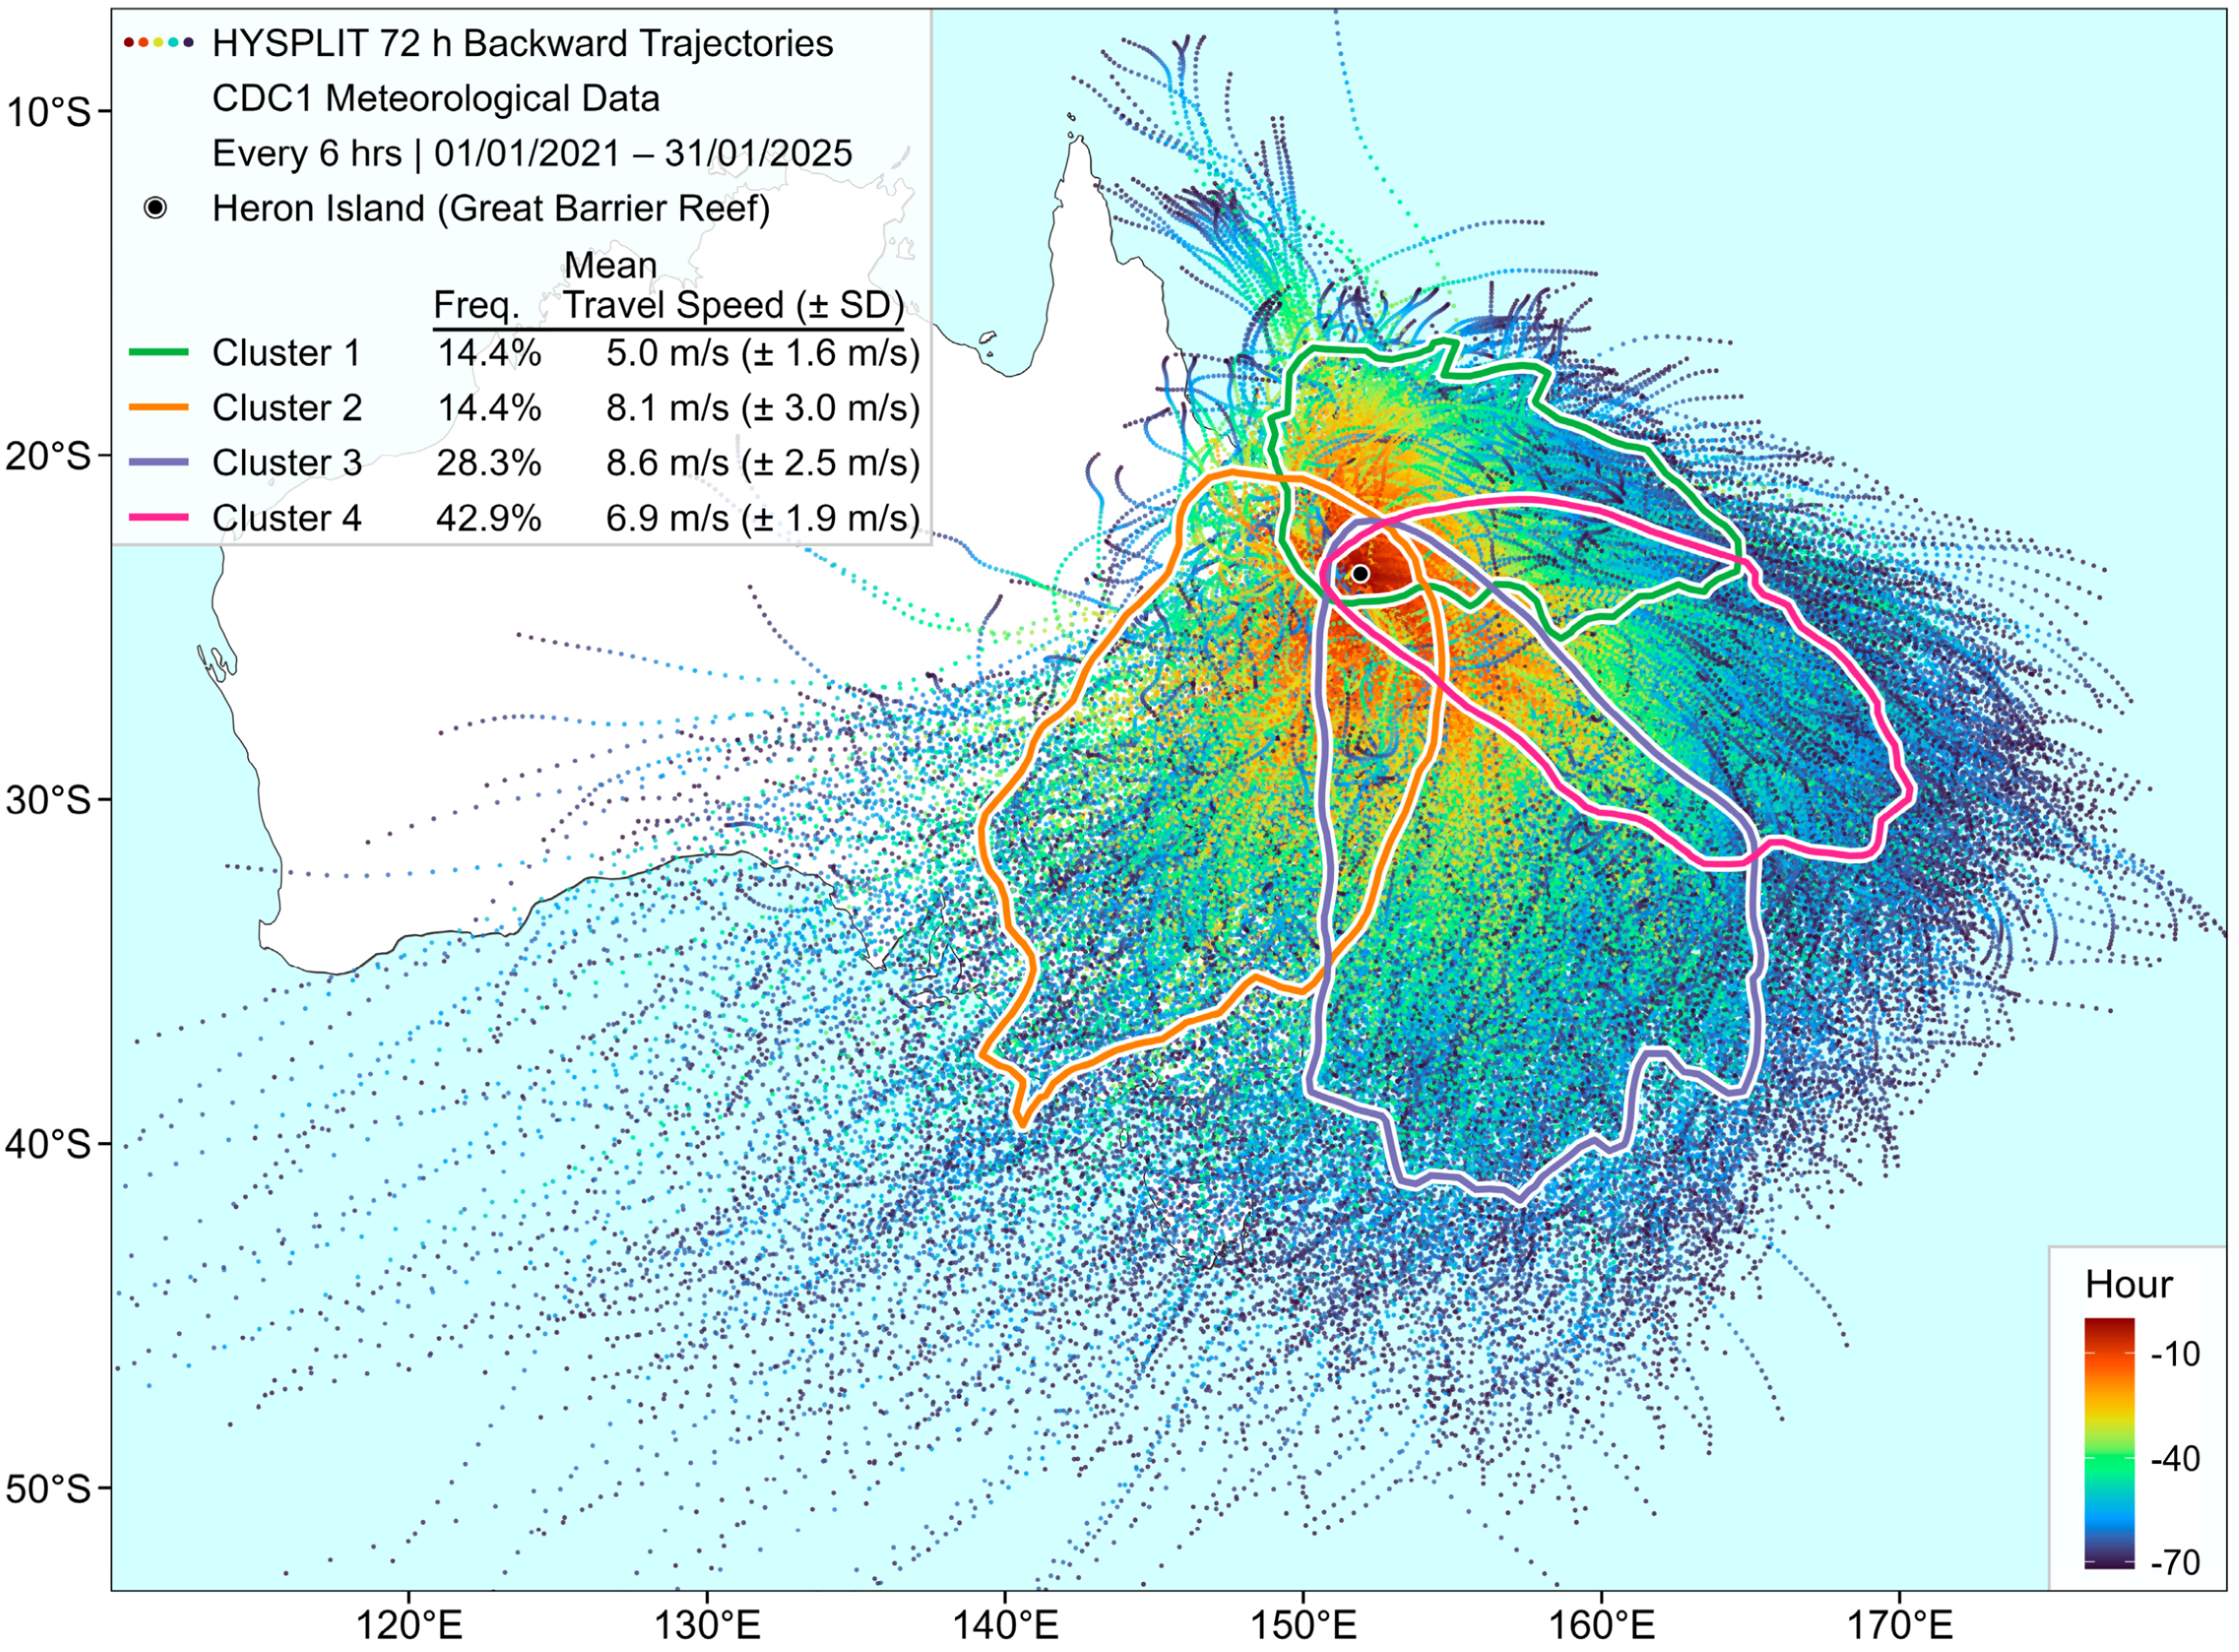
Long-term back-trajectory cluster analysis for Heron Island identified four distinct air mass transport pathways throughout the year. The decision to set the k-means cluster analysis to four clusters was based on an elbow analysis. Cluster 4, the most frequent (42.9%), has an average travel speed of 6.9 m/s (±1.9 m/s) and originates from the east, primarily bringing marine-influenced air from the Pacific Ocean (Figure 5). Over 72 h, the trajectories in cluster 1 cover a distance of approximately 1294 km. The second most frequent, cluster 3 (28.3%), has the highest average speed at 8.6 m/s (±2.5 m/s) (Figure 5). These trajectories originate from the southeast, passing over a mix of marine and continental air masses along the east coast of Australia. They cover an average distance of 2220 km over 72 h before reaching Heron Island (Figure 5). Clusters 1 and 2 each account for 14.4% of the total trajectories. Cluster 1 has an average speed of 5.0 m/s (±1.6 m/s), with air coming from the north-northeast, primarily travelling through the Coral Sea. The trajectories in cluster 2 cover an average distance of 2100 km over 72 h, mainly originating from the Australian continent and bringing environmental conditions from land to the air around Heron Island (Figure 5).
Figure 5.
K-means clustering of 5968 Hybrid Single-Particle Lagrangian Integrated Trajectory model (HYSPLIT) back-trajectories, sampled every 6 h between January 2021 and January 2025, identified four distinct air mass transport pathways arriving at Heron Island at 150 m altitude. Travel speed, derived from the hourly distance travelled, was used as a proxy for ambient wind speed. The dominant Cluster 4 originates from the east–southeast, transporting predominantly clean marine air from the Pacific. Cluster 3 arrives from the south–southeast, covering an average distance of 2220 km in 72 h, carrying a mix of marine and continental air. Clusters 1 and 2 each account for 14.4% of the trajectories. Cluster 1 comes from the north-northeast over the Coral Sea, while Cluster 2 predominantly originates from the Australian continent, likely transporting both natural and anthropogenic aerosols. The spatial polygons for trajectory assignment overlapped an area of 58,736 km2 around Heron Island, with a mean back-trajectory age of about 7 h. Seasonal and monthly analyses reveal that November’s trajectory patterns align with the annual trends, supporting the use of these clusters in future studies (Figure A5).
The spatial polygons used to assign clusters to individual air parcel back trajectories overlap in a small area around Heron Island, which is the endpoint of all trajectories. This region corresponds to a mean back-trajectory age of approximately 7 h, with variation based on the speed of the air parcels before reaching Heron Island. The backward trajectories follow a similar spatial path within this area (Figure 5). Running the k-means cluster analysis on seasonal and monthly data reveals some variation, which should be carefully assessed for specific periods of interest (Figure A5). In November, the cluster results generally align with the overall yearly clustering, allowing the use of annual clusters in our analysis (Figure A5). We incorporated key environmental and atmospheric factors into our analysis to better understand the source–receptor relationships influencing marine aerosol variability above Heron Reef (Figure 6). Relative humidity was excluded from further analysis due to its strong negative correlation with mixing layer height (r = −0.81, p < 0.0001).
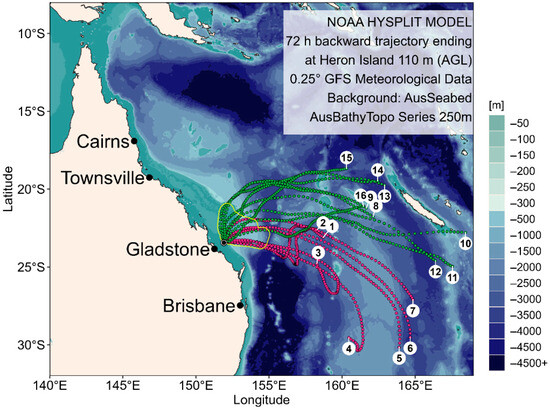
Figure 6.
The 72 h HYSPLIT backward trajectories for 16 sampling events at Heron Island, calculated using 0.25° Global Forecast System meteorological data. Trajectories were grouped into dominant air mass clusters (green: Cluster 1; pink: Cluster 4). Mixed layer height, travel speed, and water depth (from the AusBathyTopo250 m grid) were integrated over the final 12 h of each trajectory (yellow polygon) to refine the air parcel transport history. Tidal state, local time, and date for each sampling event (circled numbers) are provided in Table 1.
The PERMANOVA analysis confirmed significant variation in aerosol size distributions across sampling events for both the 180 nm and 240 nm modes (p < 0.01), while location had no significant effect (p > 0.05) (Table A1). Pairwise tests identified that most events were significantly different from each other in mode 180 and mode 240 (p < 0.05). For mode 180, sampling events 2 and 4, as well as 9 and 13, did not differ significantly (p > 0.05). For mode 240, there was non-significant grouping across encompassing sampling events 1, 2, 3 and 4 (p > 0.05).
The DistLM analysis identified key environmental factors influencing variability in aerosol size distributions for mode 180 and mode 240 (Table A1). For mode 180, cluster membership was the strongest predictor of variability, explaining 35.1% of the variation (p ≤ 0.001), followed by depth (20.2%, p ≤ 0.001). Mixing layer height (MLH) also contributed (3.3%, p = 0.14), while travel speed (2.5%, P = 0.21) and tide (0.3%, p = 0.68) had weaker associations. The best overall model, incorporating cluster, depth, MLH, and tide, explained 58.96% of the variation (AICc = 607.52). For mode 240, MLH was the dominant factor, explaining 26.6% of the variation (p = 0.0001), followed by cluster membership (18.1%, p ≤ 0.001). Travel speed, depth, and tide had lower contributions, each explaining less than 2.1% of the variance. The best model for mode 240, included cluster, depth, MLH, and travel speed, accounted for 41.07% of the variability (AICc = 635.93) (Table A1).
4. Discussion
We employed a drone-based measurement approach to characterise marine aerosol size distributions at Heron Reef under low-wind conditions. The variation in marine aerosol size distribution was primarily influenced by upwind atmospheric sources rather than local reef processes. Across 64 sampling flights, aerosol number concentrations (<500 nm) varied between +19% and −25% relative to background levels. Tidal influence on aerosols in the 165.0–176.3 nm range was observed, with variations of up to 37.1% and −16.7% between high and low tides, respectively. The k-means cluster for mode 180 and the MLH for mode 240 were identified as the primary factors driving variability along individual HYSPLIT air parcel backward trajectories for each sampling event. Integrating in situ drone-based measurements with analyses of upwind environmental conditions can provide valuable insights into natural aerosol variability, which may inform future modelling efforts and the interpretation of satellite-derived aerosol observations [3,57]. Here, drones provided a unique, flexible, and cost-effective solution for sampling aerosols in the marine atmospheric boundary layer, helping to advance research into aerosol dynamics and their influence on climate [10,58,59].
The observed bimodal aerosol size distribution, with mean mode diameters of approximately 180 nm and 240 nm, exhibited significant variations in aerosol number concentrations between sampling events. Previous studies have reported accumulation mode aerosol diameters ~150 nm at 30% relative humidity over the Great Barrier Reef under the influence of transported continental sources [13]. Given that most aerosol counts during this campaign were near the lower detection limit of the mOPC at 165 nm, with a parameterised mean mode diameter around 180 nm, extending the measurement range below 165 nm would likely shift this peak closer to 150 nm. The second peak at ~240 nm, along with an occasional third peak at ~330 nm, is expected to be attributed to variations in wind speed and environmental conditions that influence wave-breaking events over coral reefs, resulting in multiple sources of SSA production [30,60,61].
Observed aerosol number concentrations around Heron Island were largely uniform within the first 105 m above the water surface, with only a slight decrease from lower to higher altitudes. This pattern is consistent with conditions commonly found over marine environments, where a convective boundary layer capped by an inversion often persists during daytime hours [1,62]. The inversion marks the boundary between a turbulent, well-mixed layer below and a stably stratified, non-turbulent free atmosphere above. The region between the top of the surface layer and the base of the inversion is typically fully mixed; it is characterised by nearly constant potential temperature, water vapour mixing ratio, and aerosol size distribution [1,62]. The presence of a convective boundary layer also agrees with recent observations in the region [63,64]. Future drone-based measurements should extend vertical sampling to ~1000 m to better capture variations in particle number concentration and aerosol entrainment from the reef surface to the cloud base. Such measurements would, however, require careful management of battery capacity for longer flights and regulatory approval for operations above 120 m (400 ft).
The k-means analysis of nearly 6000 individual HYSPLIT air mass trajectories over four years identified four main pathways delivering air masses to Heron Island throughout the year. K-means clustering of HYSPLIT backward trajectories has proven to be a reliable and effective method for grouping air mass pathways [65,66]. By analysing air parcel travel speeds along these trajectories, we gain valuable insight into the prevailing wind conditions influencing transport to Heron Island. Previous studies have demonstrated an inverse relationship between wind speed and the organic mass fraction in SSA based on wind velocity measurements at the same location as the aerosol sampling [67]. Our findings suggest that air parcel speeds, particularly in the 0 to 12 h before arrival at the sampling site, may help evaluate variations in aerosol loading.
Additionally, distinct travel speed patterns observed in some trajectory clusters indicate broader atmospheric transport trends. While this study does not include aerosol chemistry, the presented insights into source-receptor relationships provide a valuable foundation for identifying key parameters to integrate into future research on the organic mass fraction of marine aerosol size distributions. Incorporating bathymetric data provides additional insight into changing environmental conditions along the spatial pathways of HYSPLIT backward trajectories, which may not be fully captured by visually inspecting trajectory plots, particularly for trajectories originating and travelling entirely over the ocean.
The DistLM analysis identified the main factors driving variability in aerosol size distributions and concentrations. For mode 180 aerosols, cluster membership was the strongest predictor, explaining 35.1% of the variation (p ≤ 0.001) (Table A1). For mode 240, MLH was dominant, accounting for 26.6% of the variation (p = 0.0001) (Table A1). The MLH, derived from extended meteorological parameters along HYSPLIT trajectories, represents the depth of the turbulent layer within the atmospheric boundary, driven by wind shear or buoyant forces, which disperses surface aerosols [54,68]. During event group 14–15, we measured a shallow MLH of about 550 m and low wind speeds of around 2.5 m/s (Table 2), which coincided with higher aerosol concentrations (Figure 4). This is consistent with previous studies showing that under light wind conditions, increases in MLH can dilute near-surface marine aerosols by dispersing them through a larger air volume [69]. Event group 14–15 also belongs to Cluster 1, where air-mass trajectories from the north-northeast pass over the shallow Coral Sea and remain longer over the biologically active regions of the Great Barrier Reef. These extended air-mass exposures likely contributed to the higher aerosol loadings observed [57,59,70]. The formation of SSA and SMA, along with entrainment processes in the lowest 100 m of the boundary layer, is highly complex [14,71]. Longer field campaigns are needed to confirm and quantify these patterns over Heron Reef and other locations of the Great Barrier Reef.
No clear positive correlation was observed between local wind speed and increased SSA concentrations in our measurements [24,72,73]. During low wind periods (~2–3 m/s), aerosol number concentrations around Heron Island were primarily influenced by upwind conditions, with any local wind effect depending on ambient wind strength and existing aerosol loading. This is supported by the low variability observed across reef locations.
Although we initially hypothesised that aerosol concentrations would differ among reef zones and tide states due to local processes including DMS-driven secondary aerosol formation, this effect was non-significant. Weak winds limited mechanical sea spray, freshly nucleated DMS-derived particles likely fell below the ~165 nm detection limit, and the convective boundary layer diluted near-surface emissions. Consequently, upwind sources and boundary layer dynamics dominated the observed variability, consistent with studies showing that detectable DMS enhancements typically require stronger biological forcing, higher precursor concentrations, or longer particle growth times [48,59,74].
Only an active surf zone with breaking waves has a substantial impact on aerosol concentrations [14,75]. Consequently, the observed low wind speeds were insufficient to generate enough mechanical motion in the water to produce detectable differences in aerosol concentrations from sea spray. The elevated concentrations measured closer to Heron Island during events 14 and 15 (Figure 3) occurred under very calm wind conditions (Table 2), suggesting a growing influence of reef emissions on aerosol concentrations as wind decreases. Extended and longer-term measurement campaigns would be required to further quantify this effect. Additionally, rainfall prior to sampling event 16 clearly suppressed concentrations, highlighting the role of precipitation-driven removal processes.
HYSPLIT backward trajectory analysis provides insights into the properties of air masses arriving at Heron Island, highlighting MLH, water depth, and air parcel travel speed along the trajectory as key drivers of local marine aerosol loading. These findings are consistent with previous studies that identified both local and remote aerosol sources around Heron Island [76]. Our findings also show that upwind conditions play an important role in source–receptor relationships. We see value in using water depth as a way to represent the type of environment the air mass travels over before reaching Heron Island, together with broader meteorological information along HYSPLIT trajectories. Shallower water depths along the air parcel paths, particularly for event group 8–9, suggest extended travel over coral reef systems rather than deeper open waters. This likely enhanced organic emissions from the reef, which were then transported to Heron Island, contributing to the 30.8% increase in smaller-sized aerosols from high to low tide. A similar, though less pronounced, pattern is observed in event groups 5–6, where shallower water during low tide corresponded with higher aerosol concentrations in the 165.0–173.4 nm range. Event group 14–15 followed a different trajectory. During low tide, the air parcel travelled over deeper waters, whereas during high tide it passed over shallower waters from a more northerly direction. Despite low local wind speeds (2.2 and 2.7 m/s), elevated concentrations of mode 240 aerosols were observed, indicating that regional transport and boundary-layer structure can outweigh local tidal effects for this aerosol mode. We recommend further long-term in situ aerosol characterisation measurements to better understand natural marine aerosol emissions and improve source–receptor models.
Our observations support the contention that aerosol concentrations are strongly influenced by environmental conditions encountered by the air mass at least 12 h before arriving at Heron Island, particularly when the trajectory crosses biologically active areas of the Great Barrier Reef. These findings could support previous studies suggesting that DMS emissions and the resulting SMA production around Heron Island are influenced by physiological stress from high sea surface temperatures, solar irradiance, and salinity changes, resulting in a substantial increase in aerosol concentrations during calm, sunny conditions at low tide [10,48,59,74]. These results highlight the importance of incorporating source–receptor relationships, boundary-layer dynamics, and upwind biological activity into model representations of marine aerosol emissions. Expanding the presented drone-based measurements setup in future with an advanced mixing condensation particle counter and a miniaturised scanning electrical mobility sizer [58] would enable size-resolved measurements from 5–3,000 nm, providing valuable insights into reef emissions and the role of DMS oxidation products in cloud condensation nuclei formation.
5. Conclusions
This research demonstrated the effectiveness of using a multi-rotor drone with advanced aerosol sizing and counting instruments to measure marine aerosols in challenging environments. Across 16 sampling events conducted around Heron Island in the Great Barrier Reef, aerosol concentrations varied considerably among sampling events while showing minimal spatial differences across the various reef locations. Within the scope of this short field campaign, a source–receptor analysis of aerosol size distributions, based on HYSPLIT air parcel back trajectories, indicated that these variations were mainly influenced by changing upwind atmospheric conditions. The data also suggest that local reef-based emissions contributed to elevated aerosol levels when air parcels spent extended periods travelling over the reef. Aerosol concentrations remained relatively constant within the lowest 105 m above sea level, suggesting limited vertical stratification during the observed conditions, consistent with a convective boundary layer. K-means cluster analysis identified four main air mass travel pathways influencing aerosol transport to Heron Reef during the November sampling period. Key environmental factors, including mixing layer depth, travel speed, water depth, and tidal conditions, were integrated for each 12 h trajectory age group to capture short-term source contributions. Significant variation across sampling events was confirmed by a PERMANOVA analysis, with the k-means cluster being the most important factor for aerosols around 180 nm and MLH for aerosols around 240 nm, as revealed by DistLM analysis. While our dataset represents a first targeted effort rather than a comprehensive regional assessment, the results provide important groundwork for improving the representation of marine aerosol processes in climate models. The findings highlight mechanisms relevant to estimating biogenic aerosol emissions from coral reefs and understanding their potential influence on radiative balance and coral bleaching risk. By improving the understanding of natural background aerosol variability in reef environments, this study provides a foundation for refining regional and global climate projections. Future work should extend this approach to longer-term and multi-site drone-based observations to better capture seasonal and spatial variability.
Author Contributions
Conceptualisation, C.E. and B.P.K.; methodology, C.E., B.P.K. and D.P.H.; software, C.E. and A.D.; validation, C.E. and C.M.; formal analysis, C.E.; investigation, C.E., K.I.M. and B.P.K.; resources, C.E. and A.D.; data curation, C.E.; writing—original draft preparation, C.E.; writing—review and editing, B.P.K., D.P.H., K.I.M. and C.M.; visualisation, C.E.; supervision, B.P.K. and D.P.H.; funding acquisition, D.P.H. and B.P.K. All authors have read and agreed to the published version of the manuscript.
Funding
This work was undertaken for the Reef Restoration and Adaptation Program (Cooling and Shading sub-program), funded by the partnership between the Australian Government’s Reef Trust and the Great Barrier Reef Foundation. Equipment was also used from ARC LIEF LE200100083 to B.P.K.
Data Availability Statement
The raw data supporting the conclusions of this article will be made available by the authors on request.
Acknowledgments
We respect and recognise the Gooreng Gooreng, Gurang, Bailai, and Taribelang Bunda peoples as the traditional custodians of the area around Heron Island. We also thank Magdalena Okuljar and Juha Sulo from the Queensland University of Technology for their support in preparing for and during our field trip to Heron Island. Additionally, we acknowledge Fred Brechtel and his team for their customer support.
Conflicts of Interest
The authors declare no conflicts of interest.
Appendix A
Performance Test of the Inline Gas Dryer Unit BE-110
The drying performance of the BE-110 was tested in a laboratory setup at Heron Island Research Station. The dryer’s inlet was connected to the laboratory’s air supply for over one hour (Figure A1b). A GMX501 weather station (Gill Instruments Limited, Lymington, UK) was installed on the laboratory roof next to the aerosol inlet to measure ambient humidity (Figure A1b, top right, red circles). After passing through the centreline splitter of the dryer, the air sample’s moisture content was measured in the sheath flow using an HMP60 humidity probe. The sheath flow then entered the mOPC enclosure, where the Brechtel inline humidity sensor measured the moisture content as part of the mOPC setup. The ambient humidity averaged 66.6%, ranging from 64% to 69% (Figure A2). After passing through the BE-110 unit, the mOPC sensor recorded an average humidity of 37.7% (37–38%), while the Vaisala sensor measured an average of 31.9% (30–32.5%) (Figure A2). The Vaisala readings were consistent with the expected performance of the BE-110-18 moisture exchanger [77]. The mOPC sensor exhibited a systematic positive bias of approximately 5.8% relative to the Vaisala sensor, which was accounted for throughout the measurement campaign.
Figure A1.
Laboratory test configuration used to test the mOPC (device at right) before field deployment (a). The inlet of the BE-110 sample line dryer was connected to the aerosol inlet at Heron Island Research Station. Ambient conditions were measured using the GMX501 weather station (Gill Instruments Limited, Lymington, UK), which was mounted next to the aerosol inlet ((b), top-right). Humidity levels after the dryer were measured using a Vaisala HMP60 (Vaisala, Vantaa, Finland) and a Brechtel inline humidity sensor (Brechtel, Hayward, CA, USA) before the air sample entered the mOPC.
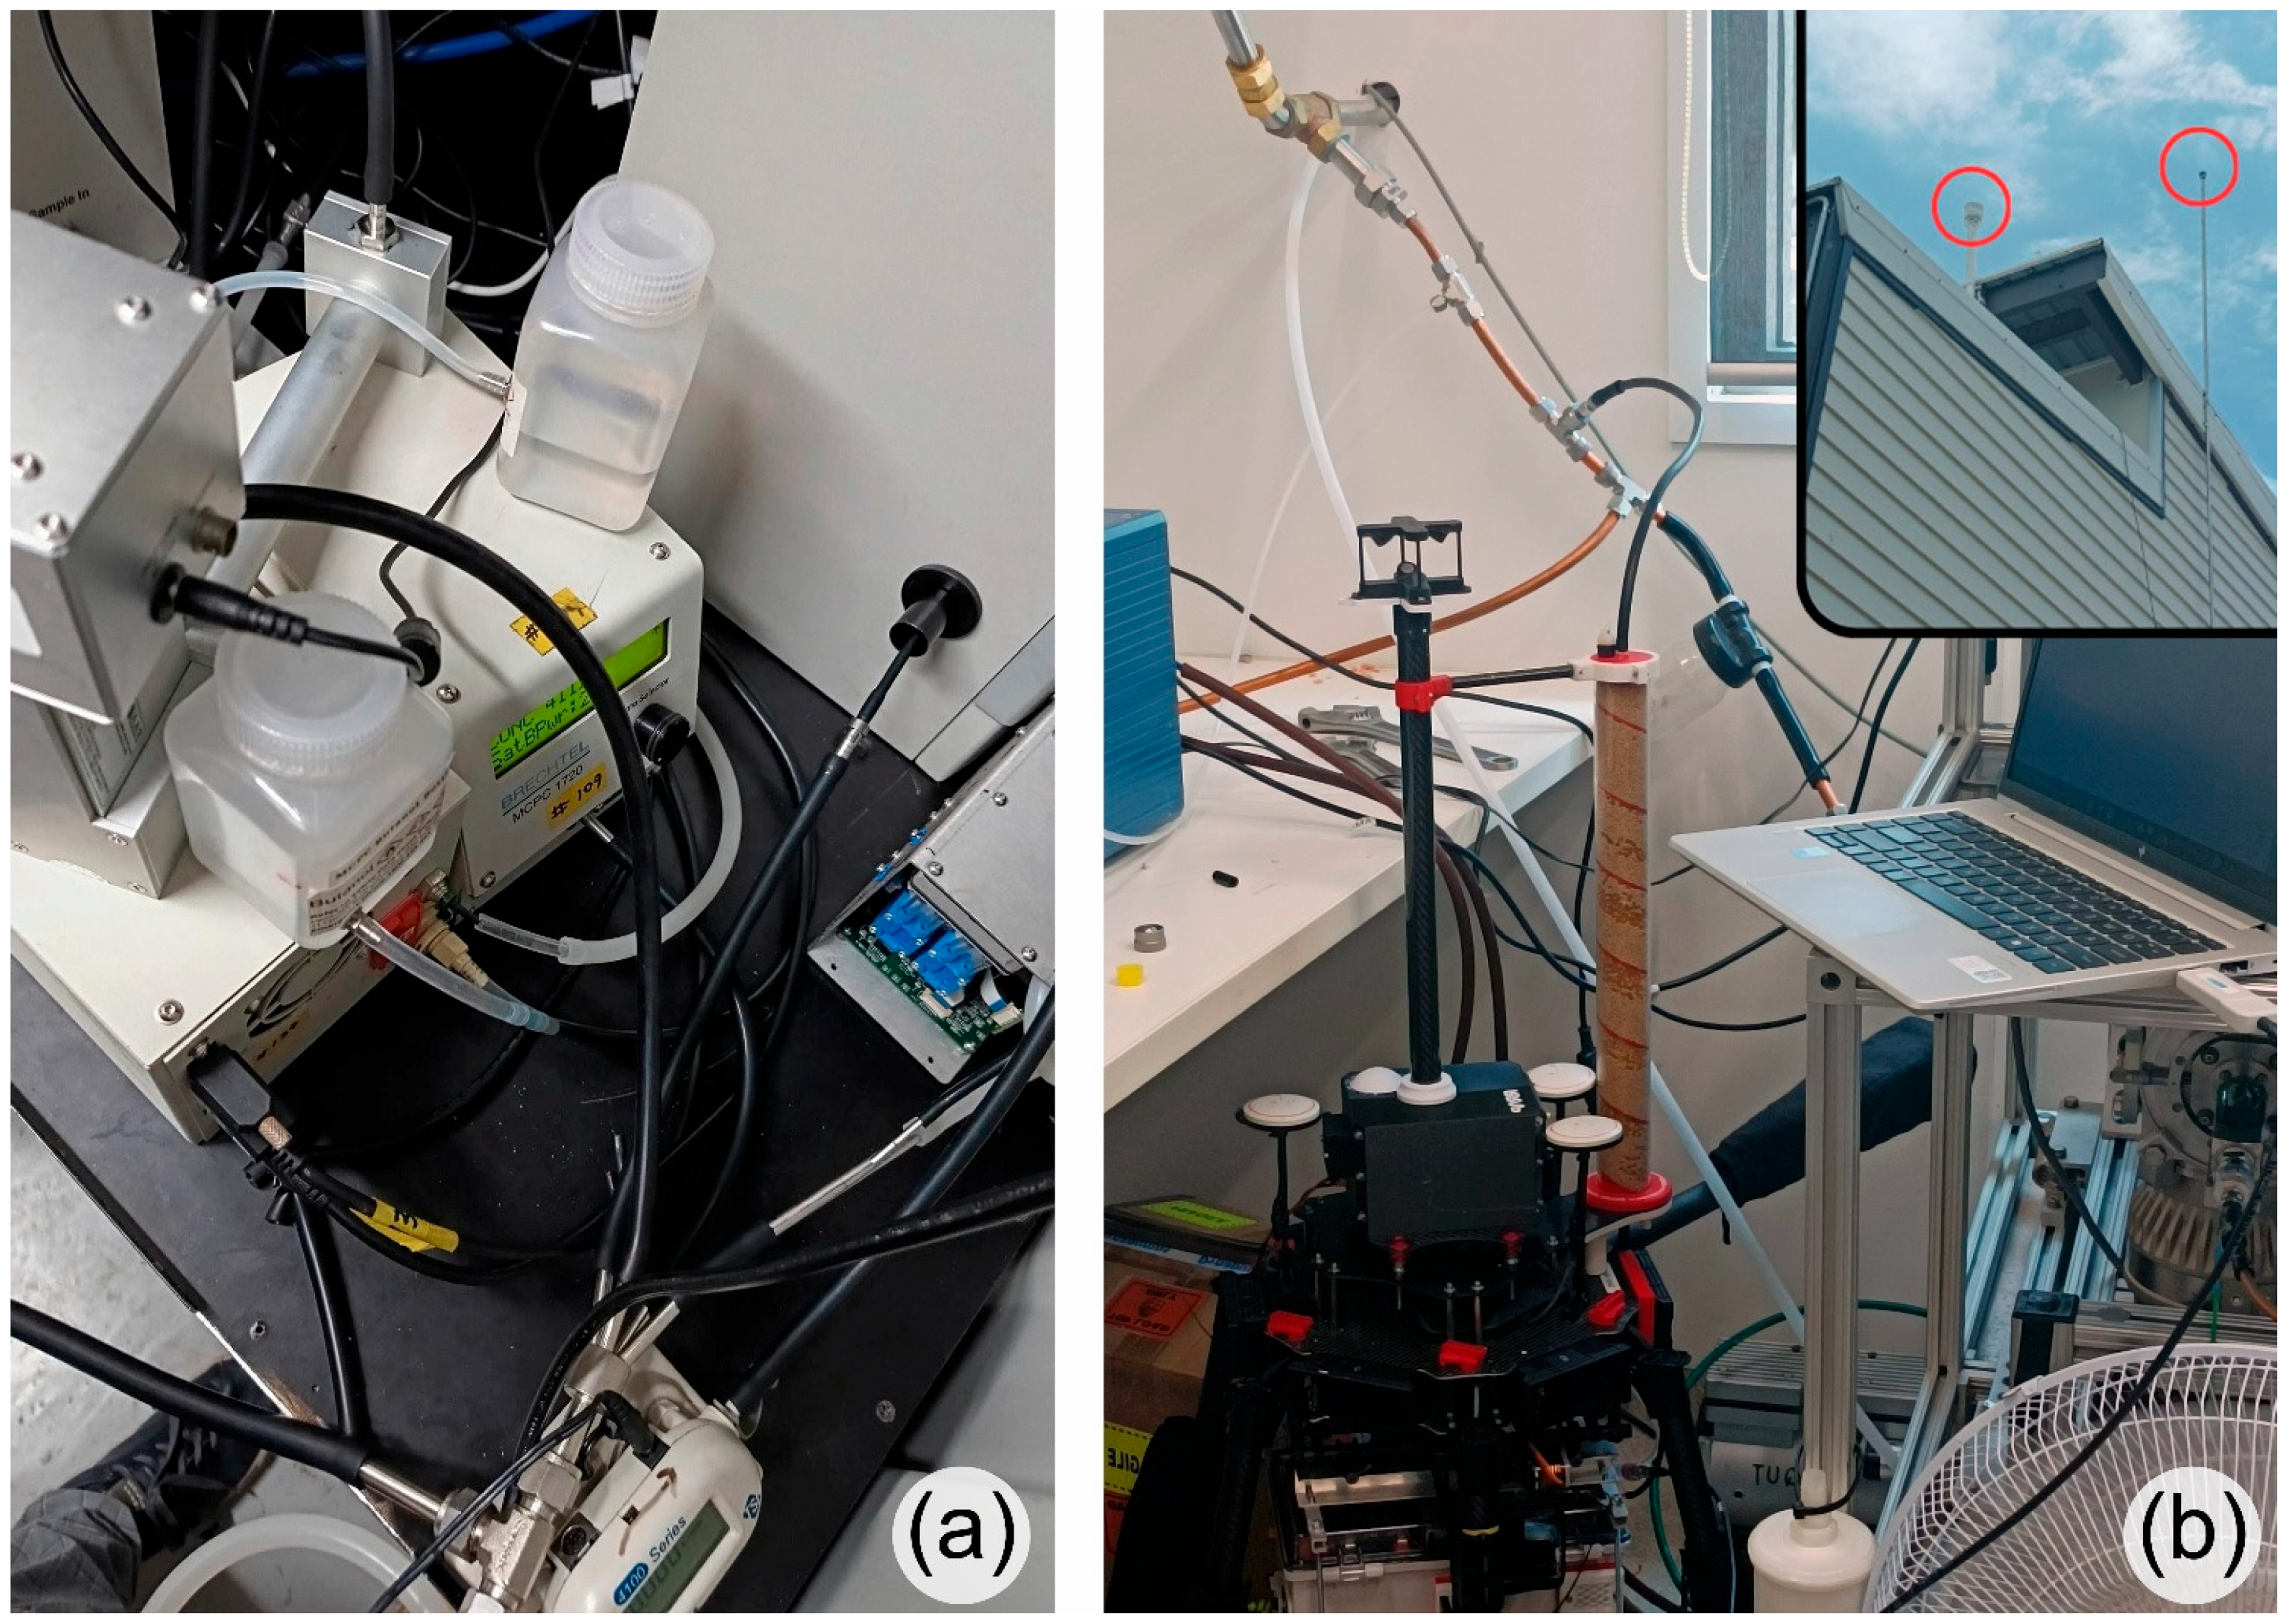
Figure A2.
The performance of the custom-made BE-110 inline gas dryer is evaluated by comparing ambient relative humidity (blue) with measurements taken after the airflow passed through the BE-110, using the mOPC inline sensor (orange) and the Vaisala HMP60 humidity probe (green). The Vaisala measurements were consistent with the expected performance of the Perma Pure BE-110-18 moisture exchanger. Consequently, a positive bias adjustment was applied to the humidity sensor integrated into the mOPC sheath flow line. Overall, the inline gas dryer effectively reduces the average ambient RH of 67% to a stable level well below 35% for at least one hour, ensuring sufficient drying time for an entire sampling mission.
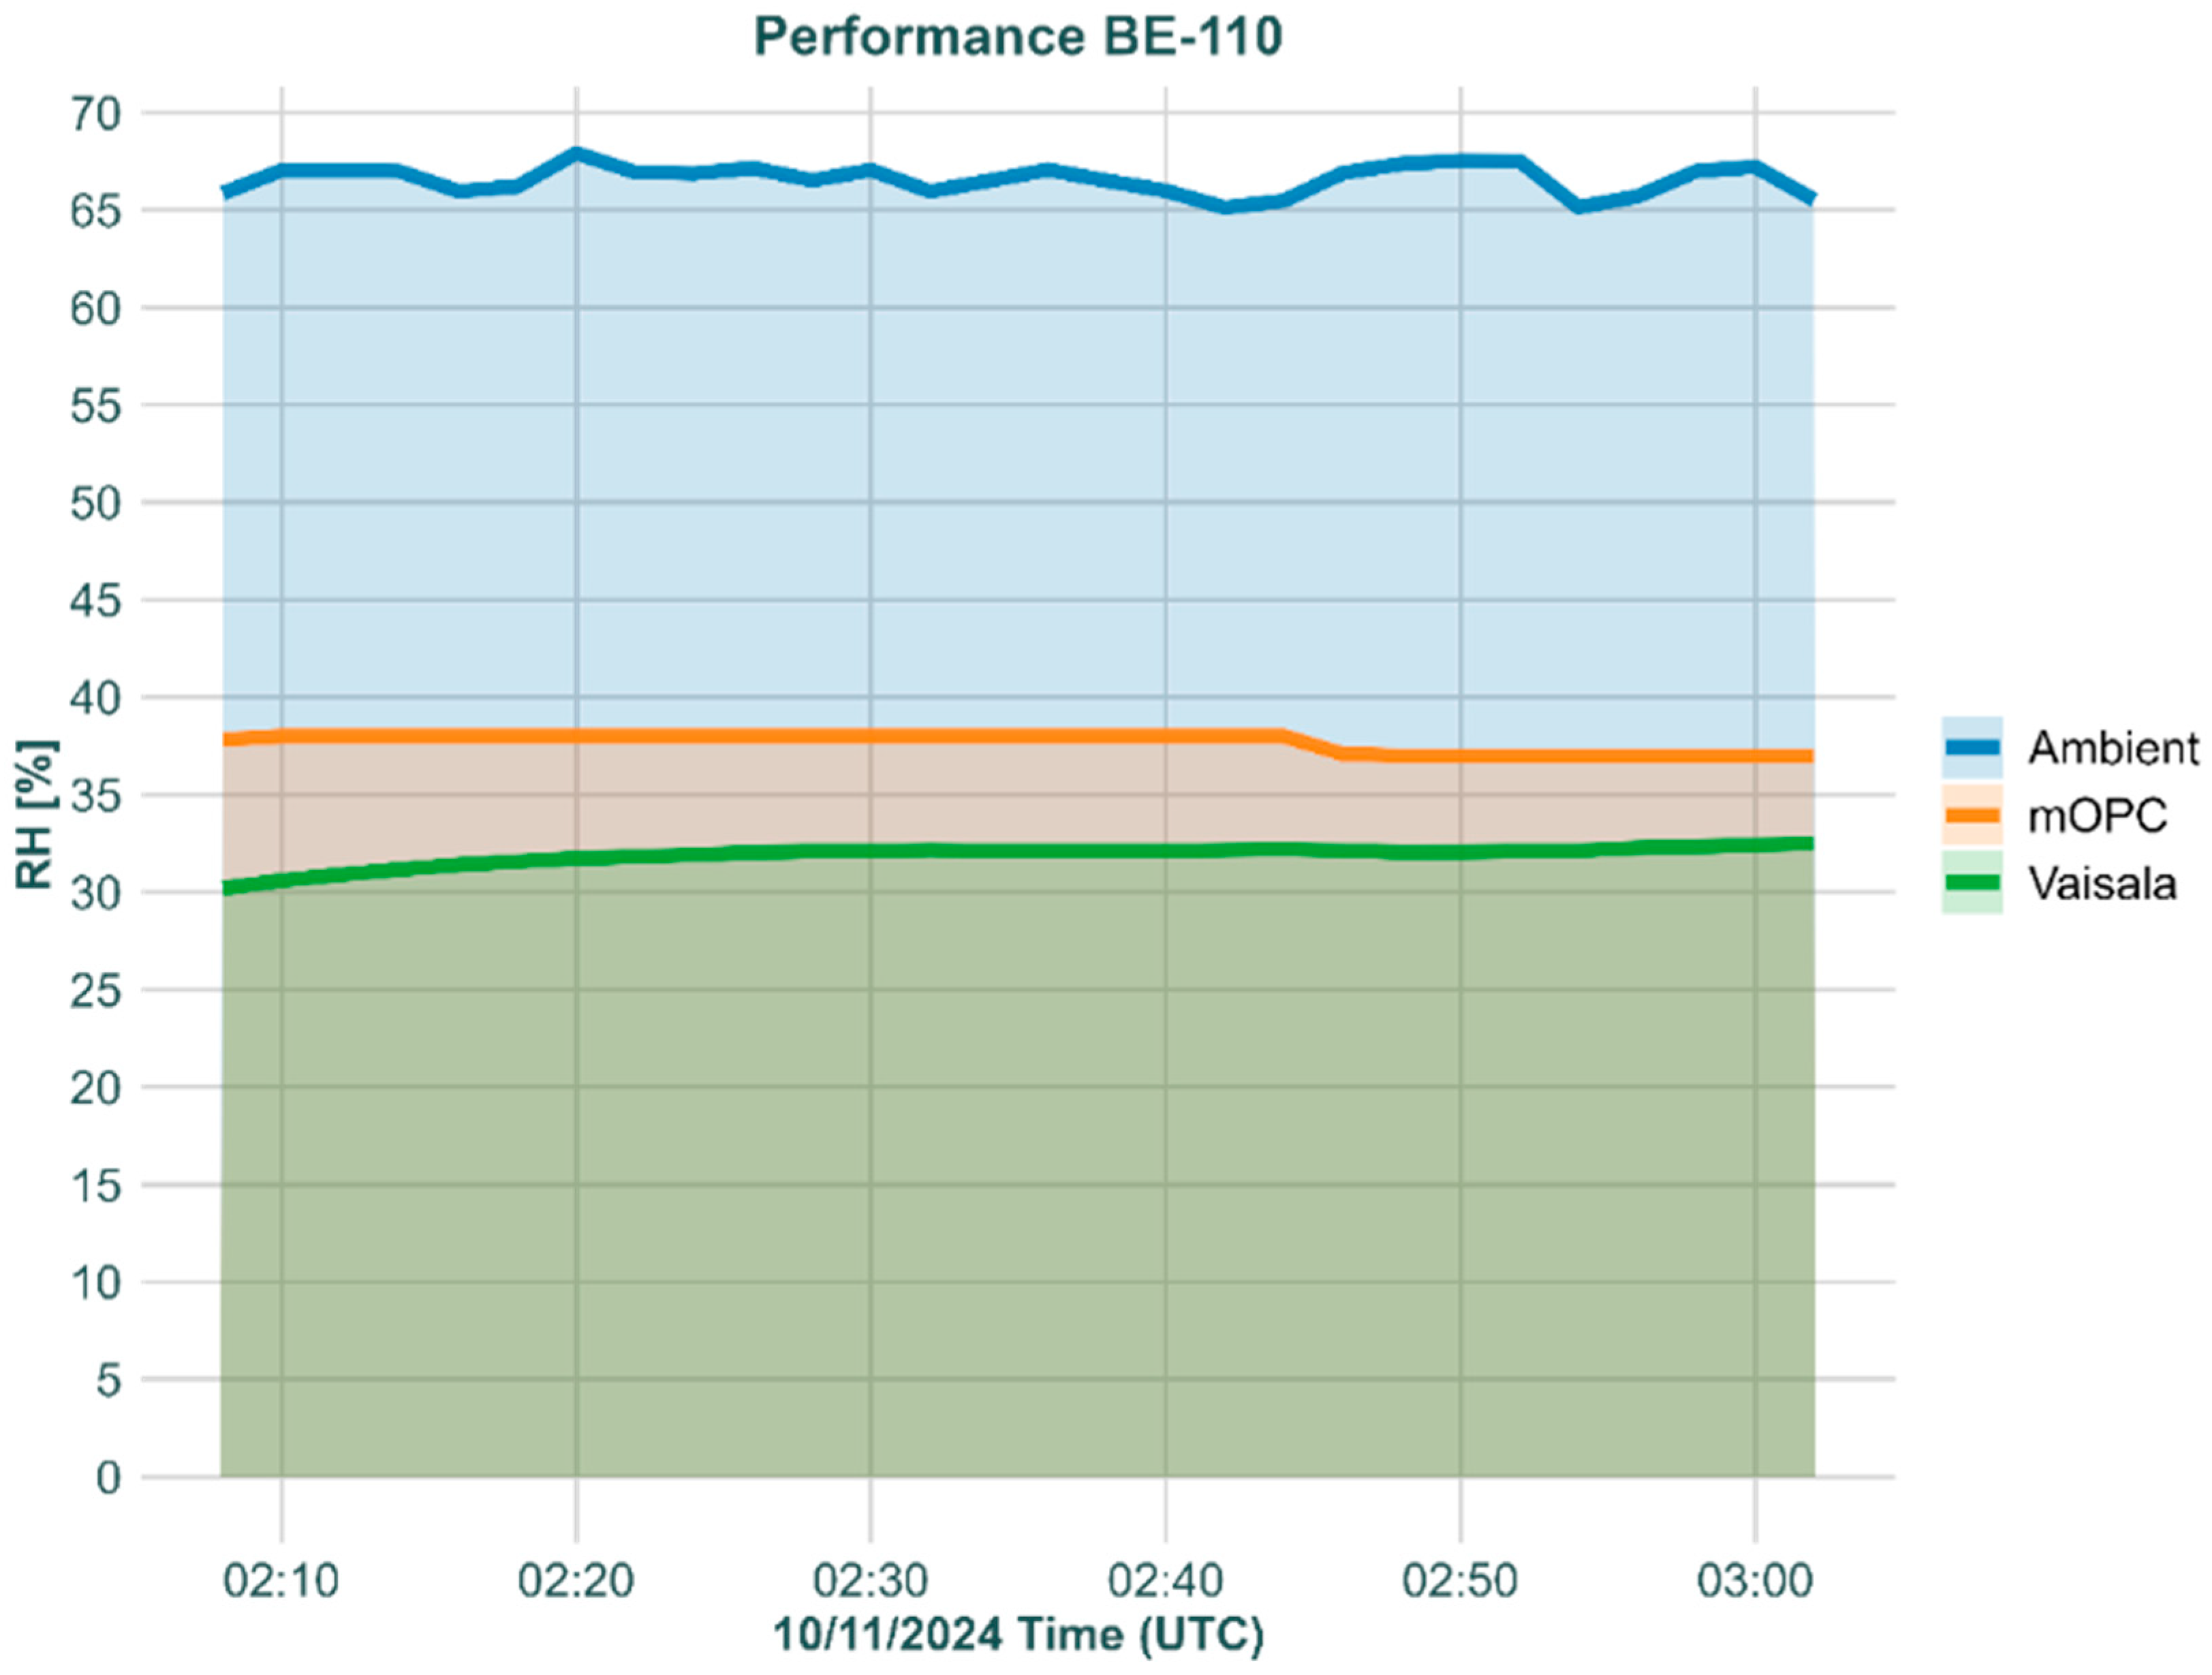
Figure A3.
Comparison of dry particle diameters produced from an ammonium sulphate solution using a Brechtel nebuliser (Brechtel Manufacturing Inc., Hayward, CA, USA). Particle size distributions were measured using an aerodynamic particle sizer (APS) (TSI Inc., Shoreview, MN, USA) for diameters of 600–10,000 nm (red), a DMS500 differential mobility spectrometer (Cambustion, Cambridge, UK) covering 4.5–1000 nm (green), a mOPC spanning 150–3000 nm (blue), and a model 2100 scanning electromobility spectrometer (SEMS),; (Brechtel Manufacturing Inc., Hayward, CA, USA) covering 30–1000 nm (purple).
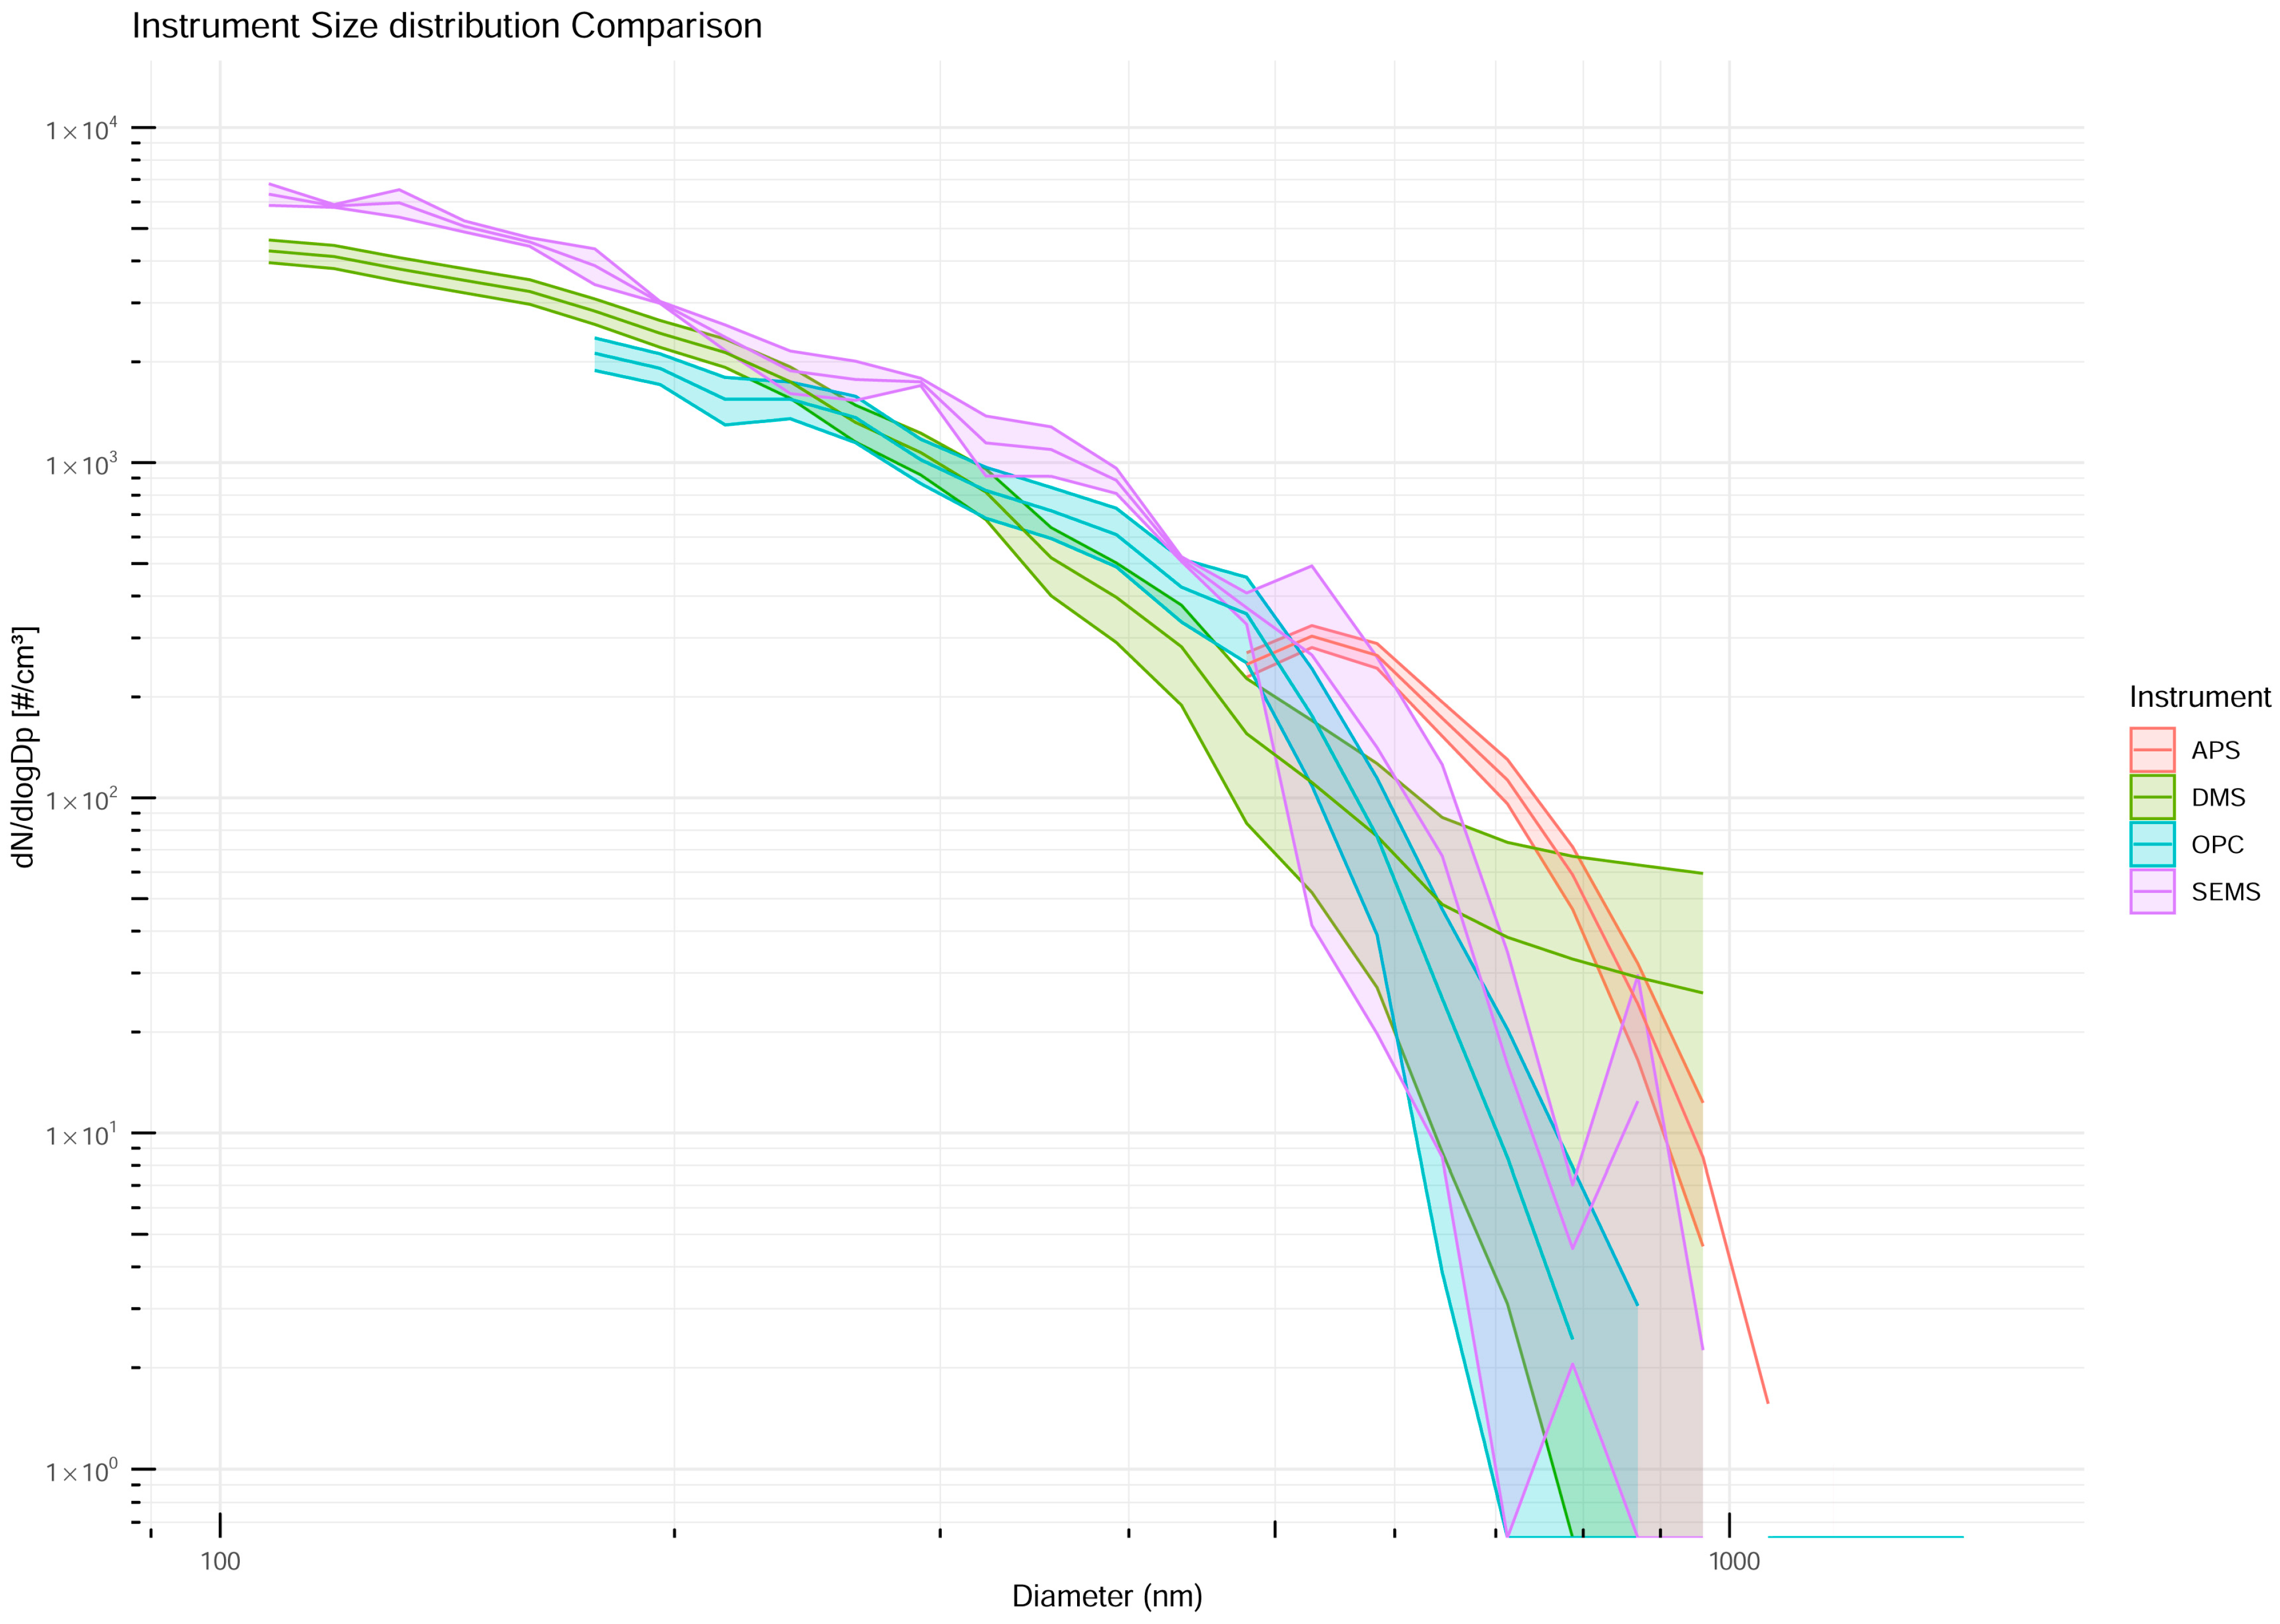
Figure A4.
Dry particle size measured by the mOPC attached to the monomodal output of the SEMS, with the classifier voltage set to select particles of 600 nm mobility diameter (indicated by the reddashed line).
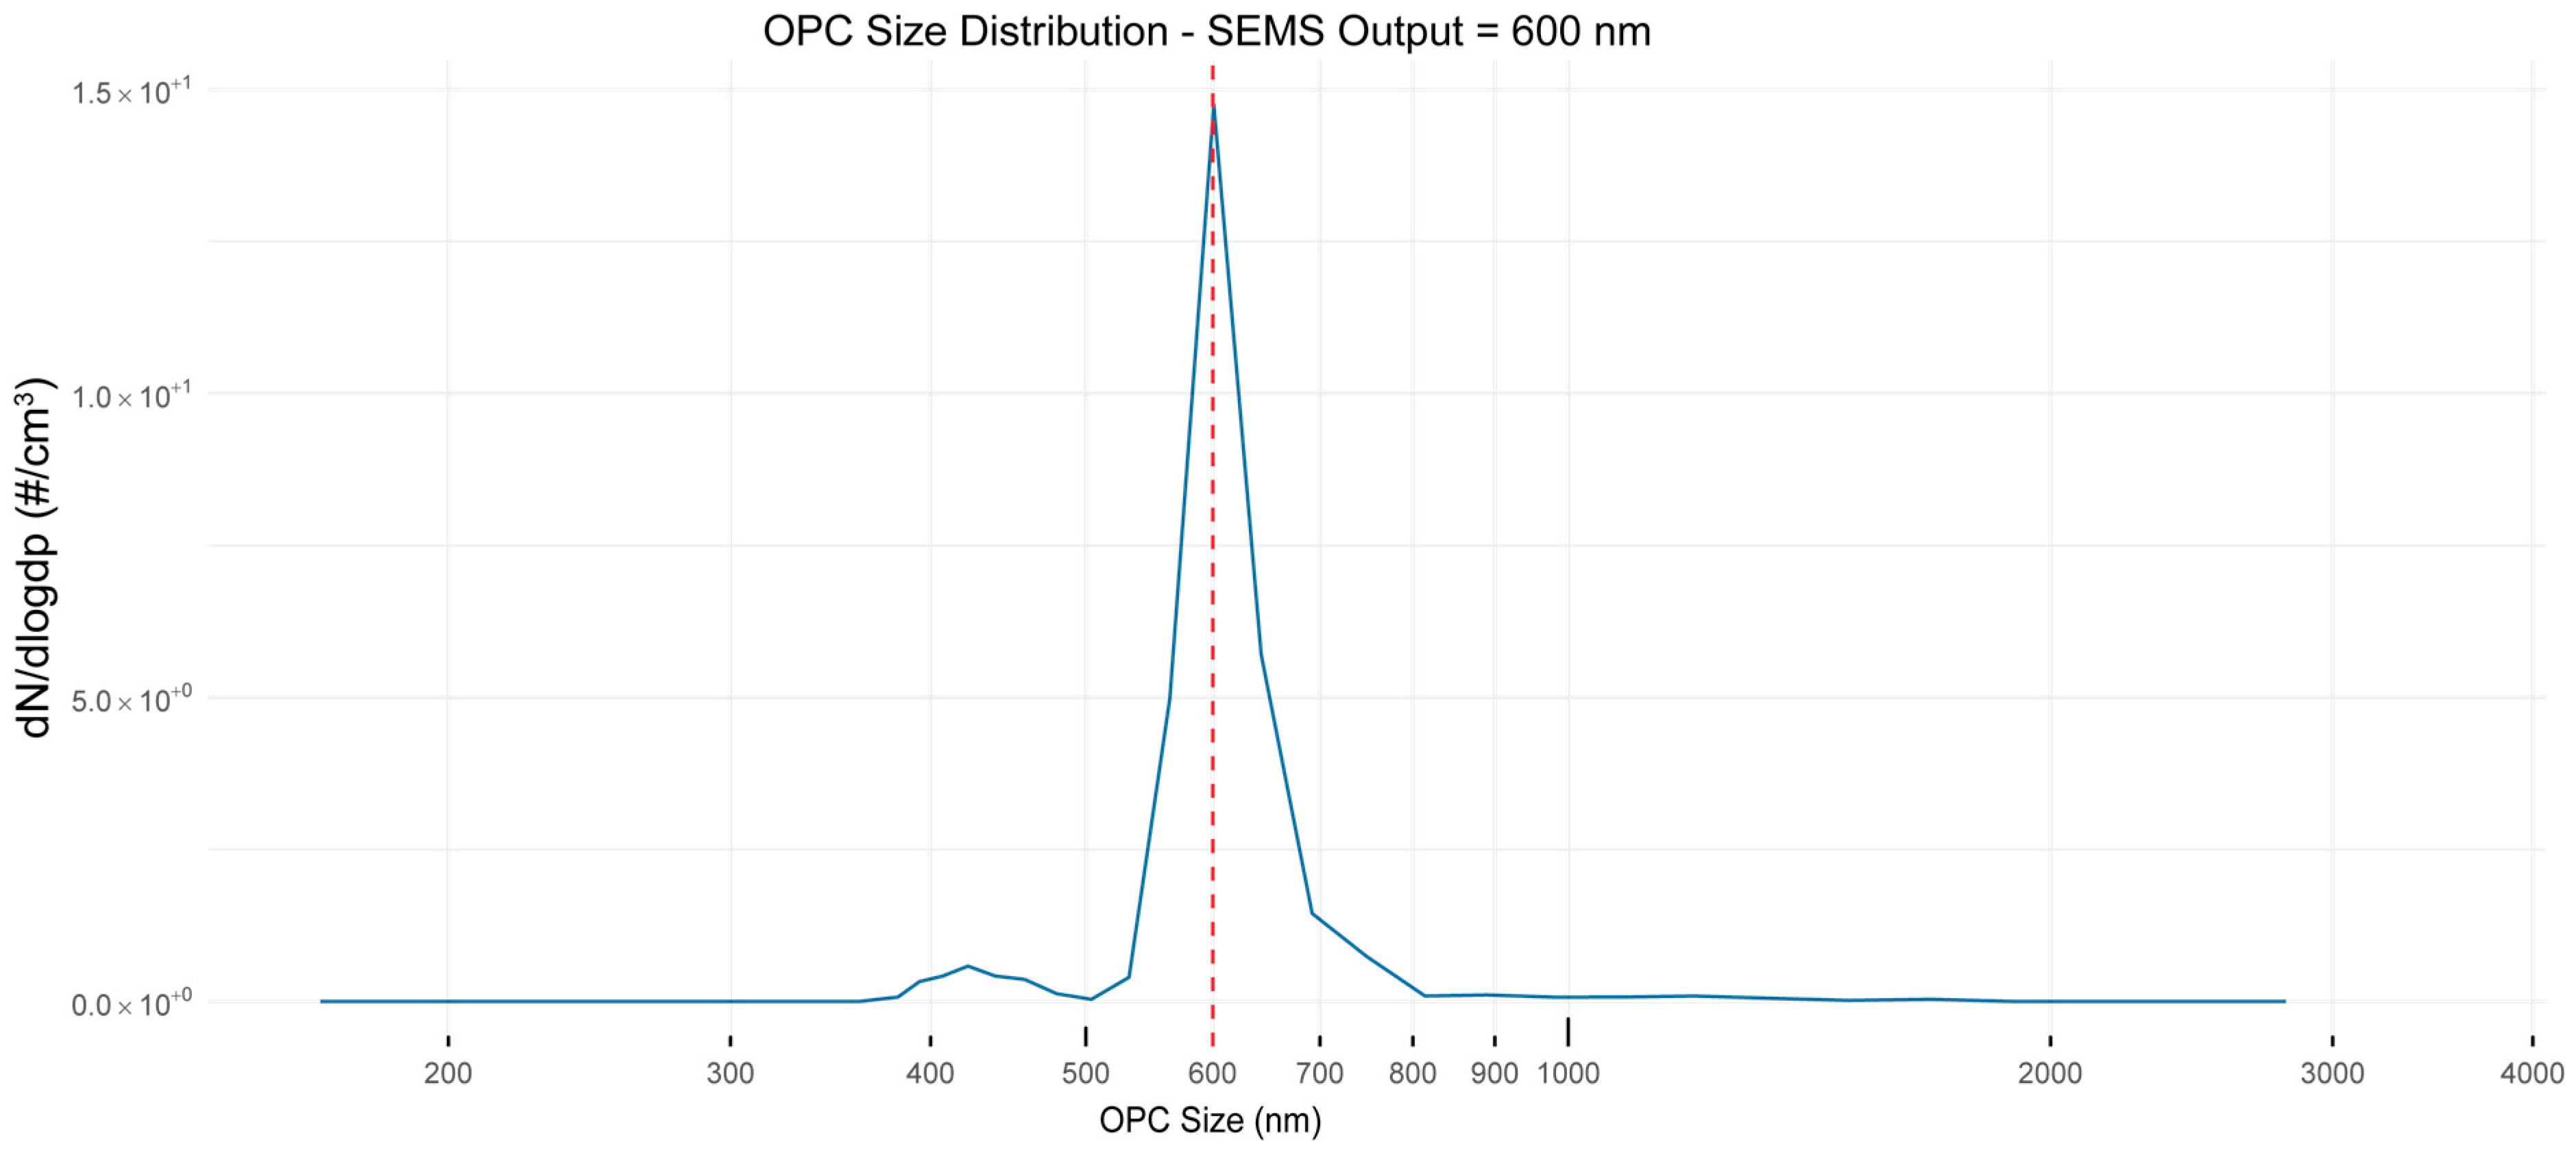
Figure A5.
The seasonal and monthly 72 h backward trajectories of air parcels arriving at Heron Island are based on 5968 individual trajectories. Each colour represents a different transport pathway, with the percentages showing the relative frequency of each path. The left panel displays the monthly distributions, while the right panel shows seasonal aggregations for Australia, with the included months indicated in brackets.
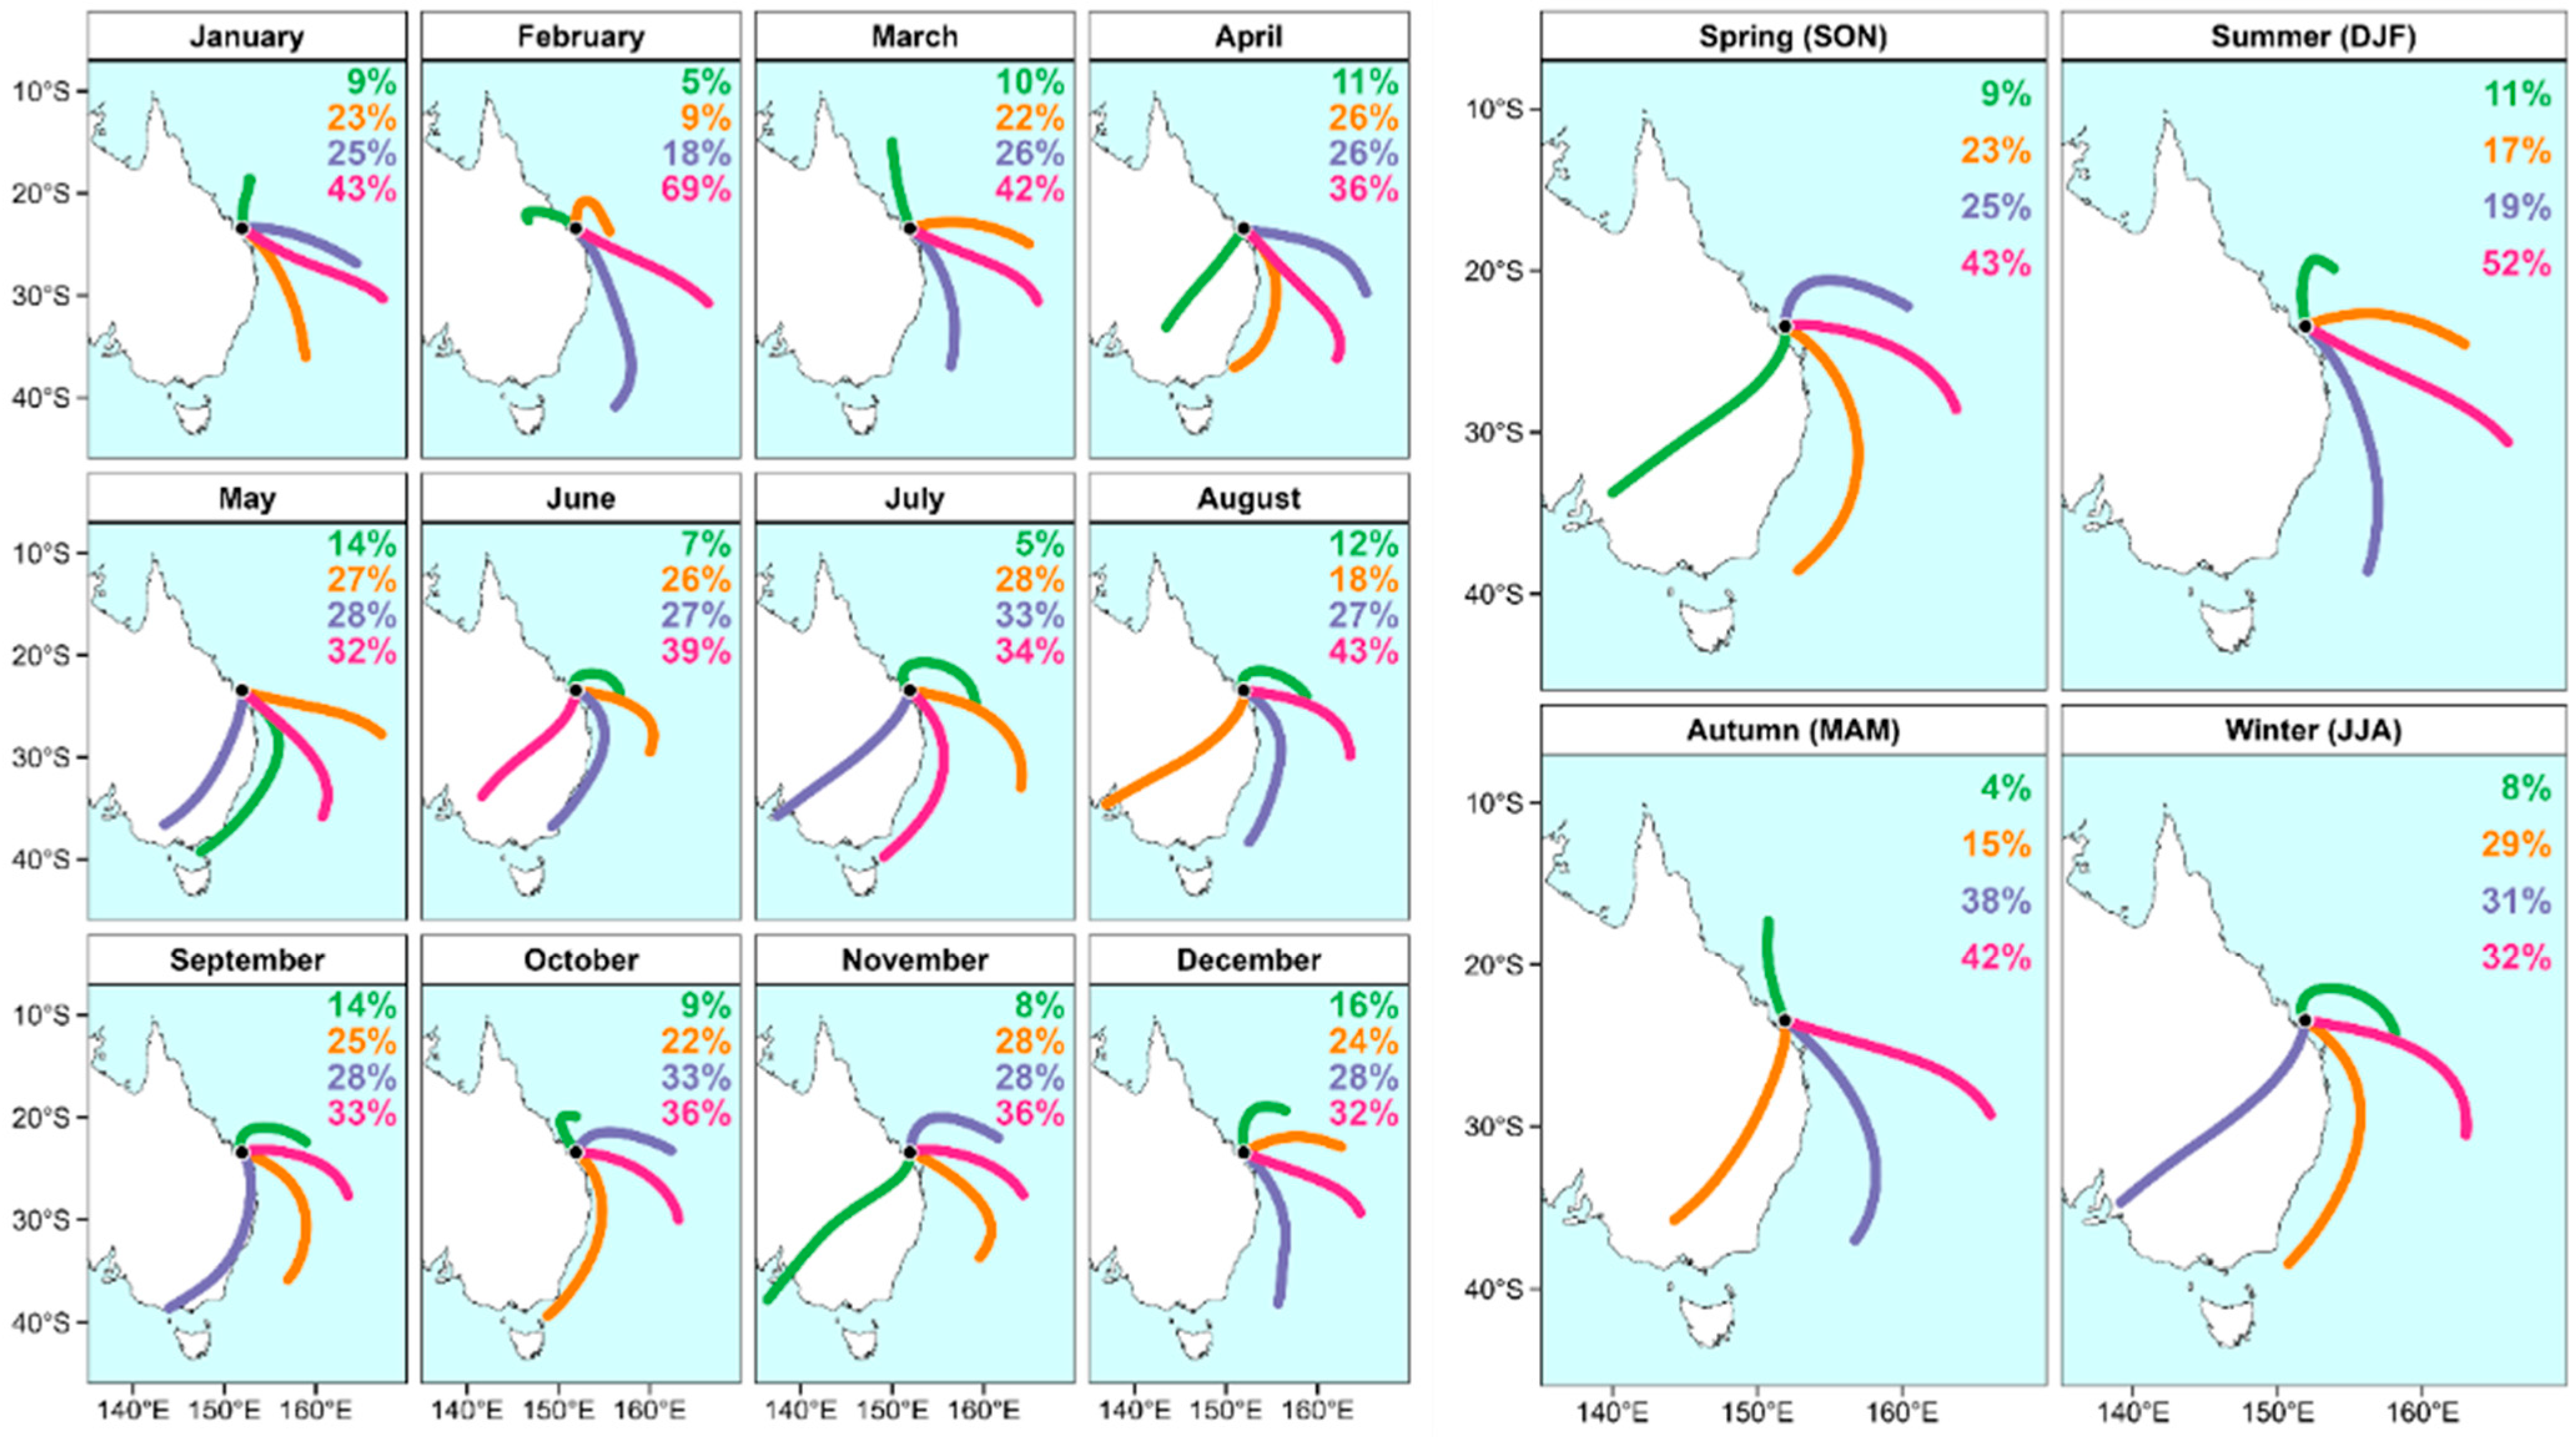
Table A1.
Summary of the permutational multivariate analysis of variance (PERMANOVA) and distance-based linear model analyses across modes 180 and 240.
References
- Stull, R.B. An Introduction to Boundary Layer Meteorology; Springer: Dordrecht, The Netherland, 1988; Volume 1. [Google Scholar]
- Katoshevski, D.; Nenes, A.; Seinfeld, J.H. A study of processes that govern the maintenance of aerosols in the marine boundary layer. J. Aerosol Sci. 1999, 30, 503–532. [Google Scholar] [CrossRef] [Scilit]
- Russell, L.M.; Moore, R.H.; Burrows, S.M.; Quinn, P.K. Ocean flux of salt, sulfate, and organic components to atmospheric aerosol. Earth-Sci. Rev. 2023, 239, 104364. [Google Scholar] [CrossRef] [Scilit]
- Andreae, M.O.; Jones, C.D.; Cox, P.M. Strong present-day aerosol cooling implies a hot future. Nature 2005, 435, 1187–1190. [Google Scholar] [CrossRef] [Scilit] [PubMed]
- Jacobson, M.Z. Global direct radiative forcing due to multicomponent anthropogenic and natural aerosols. J. Geophys. Res. Atmos. 2001, 106, 1551–1568. [Google Scholar] [CrossRef] [Scilit]
- Carslaw, K.; Lee, L.; Reddington, C.; Pringle, K.; Rap, A.; Forster, P.; Mann, G.; Spracklen, D.; Woodhouse, M.; Regayre, L. Large contribution of natural aerosols to uncertainty in indirect forcing. Nature 2013, 503, 67–71. [Google Scholar] [CrossRef] [Scilit] [PubMed]
- Fan, J.; Wang, Y.; Rosenfeld, D.; Liu, X. Review of Aerosol–Cloud Interactions: Mechanisms, Significance, and Challenges. J. Atmos. Sci. 2016, 73, 4221–4252. [Google Scholar] [CrossRef] [Scilit]
- IPCC. Climate Change 2021—The Physical Science Basis: Working Group I Contribution to the Sixth Assessment Report of the Intergovernmental Panel on Climate Change; IPCC: Geneva, Switzerland, 2023. [Google Scholar]
- Kleefeld, C.; O’Dowd, C.D.; O’Reilly, S.; Jennings, S.G.; Aalto, P.; Becker, E.; Kunz, G.; de Leeuw, G. The relative contribution of submicron and supermicron particles to aerosol light scattering in the marine boundary layer (MBL). J. Geophys. Res. Atmos. 2002, 107, PAR 8-1–PAR 8-13. [Google Scholar] [CrossRef] [Scilit]
- Jackson, R.L.; Woodhouse, M.T.; Gabric, A.J.; Cropp, R.A.; Swan, H.B.; Deschaseaux, E.S.; Trounce, H. Modelling the influence of coral-reef-derived dimethylsulfide on the atmosphere of the Great Barrier Reef, Australia. Front. Mar. Sci. 2022, 9, 910423. [Google Scholar] [CrossRef] [Scilit]
- McGowan, H.; Sturman, A.; Saunders, M.; Theobald, A.; Wiebe, A. Insights from a decade of research on coral reef—Atmosphere energetics. J. Geophys. Res. Atmos. 2019, 124, 4269–4282. [Google Scholar] [CrossRef] [Scilit]
- Flores, J.M.; Bourdin, G.; Kostinski, A.B.; Altaratz, O.; Dagan, G.; Lombard, F.; Haëntjens, N.; Boss, E.; Sullivan, M.B.; Gorsky, G. Diel cycle of sea spray aerosol concentration. Nat. Commun. 2021, 12, 5476. [Google Scholar] [CrossRef] [Scilit]
- Chen, Z.; Schofield, R.; Rayner, P.; Zhang, T.; Liu, C.; Vincent, C.; Fiddes, S.; Ryan, R.G.; Alroe, J.; Ristovski, Z.D.; et al. Characterization of aerosols over the Great Barrier Reef: The influence of transported continental sources. Sci. Total Environ. 2019, 690, 426–437. [Google Scholar] [CrossRef] [Scilit]
- De Leeuw, G.; Andreas, E.L.; Anguelova, M.D.; Fairall, C.; Lewis, E.R.; O’Dowd, C.; Schulz, M.; Schwartz, S.E. Production flux of sea spray aerosol. Rev. Geophys. 2011, 49, RG2001. [Google Scholar] [CrossRef] [Scilit]
- Croft, B.; Martin, R.V.; Moore, R.H.; Ziemba, L.D.; Crosbie, E.C.; Liu, H.; Russell, L.M.; Saliba, G.; Wisthaler, A.; Müller, M.; et al. Factors controlling marine aerosol size distributions and their climate effects over the northwest Atlantic Ocean region. Atmos. Chem. Phys. 2021, 21, 1889–1916. [Google Scholar] [CrossRef] [Scilit]
- Saliba, G.; Chen, C.-L.; Lewis, S.; Russell, L.M.; Rivellini, L.-H.; Lee, A.K.Y.; Quinn, P.K.; Bates, T.S.; Haëntjens, N.; Boss, E.S.; et al. Factors driving the seasonal and hourly variability of sea-spray aerosol number in the North Atlantic. Proc. Natl. Acad. Sci. USA 2019, 116, 20309–20314. [Google Scholar] [CrossRef] [Scilit] [PubMed]
- Andreae, M.O.; Ferek, R.J.; Bermond, F.; Byrd, K.P.; Engstrom, R.T.; Hardin, S.; Houmere, P.D.; LeMarrec, F.; Raemdonck, H.; Chatfield, R.B. Dimethyl sulfide in the marine atmosphere. J. Geophys. Res. D Atmos. 1985, 90, 12891–12900. [Google Scholar] [CrossRef] [Scilit]
- O’Dowd, C.D.; De Leeuw, G. Marine aerosol production: A review of the current knowledge. Philos. Trans. R. Soc. Ser. A Math. Phys. Eng. Sci. 2007, 365, 1753–1774. [Google Scholar] [CrossRef] [Scilit]
- Jones, G.; Nevitt, G.; Simó, R. Editorial: The role of dimethylsulfide and other sulfur substances on the climate and ecology of coral reefs. Front. Mar. Sci. 2023, 10, 1119817. [Google Scholar] [CrossRef] [Scilit]
- Swan, H.B.; Jones, G.B.; Deschaseaux, E.S.; Eyre, B.D. Coral reef origins of atmospheric dimethylsulfide at Heron Island, southern Great Barrier Reef, Australia. Biogeosciences 2017, 14, 229–239. [Google Scholar] [CrossRef] [Scilit]
- Swan, H.B.; Crough, R.W.; Vaattovaara, P.; Jones, G.B.; Deschaseaux, E.S.; Eyre, B.D.; Miljevic, B.; Ristovski, Z.D. Dimethyl sulfide and other biogenic volatile organic compound emissions from branching coral and reef seawater: Potential sources of secondary aerosol over the Great Barrier Reef. J. Atmos. Chem. 2016, 73, 303–328. [Google Scholar] [CrossRef] [Scilit]
- Hinds, W.C.; Zhu, Y. Aerosol Technology: Properties, Behavior, and Measurement of Airborne Particles; John Wiley & Sons: New York, NY, USA, 2022. [Google Scholar]
- Grythe, H.; Ström, J.; Krejci, R.; Quinn, P.; Stohl, A. A review of sea-spray aerosol source functions using a large global set of sea salt aerosol concentration measurements. Atmos. Chem. Phys. 2014, 14, 1277–1297. [Google Scholar] [CrossRef] [Scilit]
- Song, A.; Li, J.; Tsona, N.T.; Du, L. Parameterizations for sea spray aerosol production flux. Appl. Geochem. 2023, 157, 105776. [Google Scholar] [CrossRef] [Scilit]
- Khan, M.; Gillespie, S.; Razis, B.; Xiao, P.; Davies-Coleman, M.; Percival, C.; Derwent, R.; Dyke, J.; Ghosh, M.; Lee, E. A modelling study of the atmospheric chemistry of DMS using the global model, STOCHEM-CRI. Atmos. Environ. 2016, 127, 69–79. [Google Scholar] [CrossRef] [Scilit]
- Murphy, D.M.; Anderson, J.R.; Quinn, P.K.; McInnes, L.M.; Brechtel, F.J.; Kreidenweis, S.M.; Middlebrook, A.M.; Pósfai, M.; Thomson, D.S.; Buseck, P.R. Influence of sea-salt on aerosol radiative properties in the Southern Ocean marine boundary layer. Nature 1998, 392, 62–65. [Google Scholar] [CrossRef] [Scilit]
- Quinn, P.K.; Collins, D.B.; Grassian, V.H.; Prather, K.A.; Bates, T.S. Chemistry and Related Properties of Freshly Emitted Sea Spray Aerosol. Chem. Rev. 2015, 115, 4383–4399. [Google Scholar] [CrossRef] [Scilit] [PubMed]
- O’Dowd, C.D.; Smith, M.H.; Consterdine, I.E.; Lowe, J.A. Marine aerosol, sea-salt, and the marine sulphur cycle: A short review. Atmos. Environ. 1997, 31, 73–80. [Google Scholar] [CrossRef] [Scilit]
- McGowan, H.; Lensky, N.G.; Abir, S.; Saunders, M. Coral Reef Coupling to the Atmospheric Boundary Layer Through Exchanges of Heat, Moisture, and Momentum: Case Studies from Tropical and Desert Fringing Coral Reefs. Front. Mar. Sci. 2022, 9, 900679. [Google Scholar] [CrossRef] [Scilit]
- Lewis, E.R.; Schwartz, S.E. Sea Salt Aerosol Production: Mechanisms, Methods, Measurements, and Models; American Geophysical Union: Washington, DC, USA, 2004; Volume 152. [Google Scholar]
- Dror, T.; Flores, J.M.; Altaratz, O.; Dagan, G.; Levin, Z.; Vardi, A.; Koren, I. Sensitivity of warm clouds to large particles in measured marine aerosol size distributions—A theoretical study. Atmos. Chem. Phys. 2020, 20, 15297–15306. [Google Scholar] [CrossRef] [Scilit]
- Jensen, J.B.; Nugent, A.D. Condensational Growth of Drops Formed on Giant Sea-Salt Aerosol Particles. J. Atmos. Sci. 2017, 74, 679–697. [Google Scholar] [CrossRef] [Scilit]
- Sorribas, M.; Martín, J.G.; Hay, T.; Mahajan, A.S.; Cuevas, C.A.; Reyes, M.A.; Mora, F.P.; Gil-Ojeda, M.; Saiz-Lopez, A. On the concentration and size distribution of sub-micron aerosol in the Galápagos Islands. Atmos. Environ. 2015, 123, 39–48. [Google Scholar] [CrossRef] [Scilit]
- Horchler, E.J.; Alroe, J.; Harrison, L.; Cravigan, L.; Harrison, D.P.; Ristovski, Z.D. Measurement report: Aerosol and cloud nuclei properties along the Central and Northern Great Barrier Reef–impact of continental emissions. Atmos. Chem. Phys. 2025, 25, 10075–10087. [Google Scholar] [CrossRef] [Scilit]
- Hernandez-Jaramillo, D.C.; Medcraft, C.; Braga, R.C.; Butcherine, P.; Doss, A.; Kelaher, B.; Rosenfeld, D.; Harrison, D.P. New airborne research facility observes sensitivity of cumulus cloud microphysical properties to aerosol regime over the great barrier reef. Environ. Sci. Atmos. 2024, 4, 861–871. [Google Scholar] [CrossRef] [Scilit]
- Burgués, J.; Marco, S. Environmental chemical sensing using small drones: A review. Sci. Total Environ. 2020, 748, 141172. [Google Scholar] [CrossRef] [Scilit]
- Wu, L.; Horchler, E.J.; Ristovski, Z.; Liu, J.; Yu, F.; Han, S.; Zhao, W.; Richards, L.; Harrison, D.; Zheng, J. Ammonia emissions from an avian-rich island in the Great Barrier Reef: Environmental drivers and observational insights. Atmos. Environ. 2025, 361, 121525. [Google Scholar] [CrossRef] [Scilit]
- Zhou, S.; Salter, M.; Bertram, T.; Brito Azevedo, E.; Reis, F.; Wang, J. Shoreline wave breaking strongly enhances the coastal sea spray aerosol population: Climate and air quality implications. Sci. Adv. 2025, 11, eadw0343. [Google Scholar] [CrossRef] [Scilit] [PubMed]
- Australian Government. Civil Aviation Safety Regulations 1998, Statutory Rules No. 237, 1998, Part 101—Unmanned Aircraft and Rockets; Australian Government: Canberra, Australian, 2024.
- Australian Government Civil Aviation Safety Authority. Rules for Recreational Drone Operators. Available online: https://www.casa.gov.au/knowyourdrone/drone-rules (accessed on 15 May 2025).
- Brechtel Manufacturing Inc. Instrument Manual Ver. 2.0 Mini-OPC 9405. Available online: https://www.brechtel.com/wp-content/uploads/2023/08/bmi_model_9405_mOPC_manual_ver_2.0.pdf (accessed on 17 June 2024).
- Alvarado, M.; Gonzalez, F.; Erskine, P.; Cliff, D.; Heuff, D. A Methodology to Monitor Airborne PM10 Dust Particles Using a Small Unmanned Aerial Vehicle. Sensors 2017, 17, 343. [Google Scholar] [CrossRef] [Scilit] [PubMed]
- Brechtel Manufacturing Inc. Flow Splitters Two-Way, Four-Way and Centerline Models 1100 to 1105. Available online: https://www.brechtel.com/wp-content/uploads/2014/10/Brechtel_Model_1100_Series_FlowSplitters_Brochure.pdf (accessed on 20 January 2025).
- Elzhov, T.V.; Mullen, K.M.; Spiess, A.-N.; Bolker, B. minpack.lm: R Interface to the Levenberg-Marquardt Nonlinear Least-Squares Algorithm Found in MINPACK, Plus Support for Bounds; The Comprehensive R Archive Network (CRAN): Vienna, Austria, 2016. [Google Scholar] [CrossRef] [Scilit]
- Stein, A.F.; Draxler, R.R.; Rolph, G.D.; Stunder, B.J.B.; Cohen, M.D.; Ngan, F. NOAA’s HYSPLIT Atmospheric Transport and Dispersion Modeling System. Bull. Am. Meteorol. Soc. 2015, 96, 2059–2077. [Google Scholar] [CrossRef] [Scilit]
- Carslaw, D.C.; Ropkins, K. Openair—An R package for air quality data analysis. Environ. Model. Softw. 2012, 27, 52–61. [Google Scholar] [CrossRef] [Scilit]
- Sirois, A.; Bottenheim, J.W. Use of backward trajectories to interpret the 5-year record of PAN and O3 ambient air concentrations at Kejimkujik National Park, Nova Scotia. J. Geophys. Res. Atmos. 1995, 100, 2867–2881. [Google Scholar] [CrossRef] [Scilit]
- Jackson, R.; Gabric, A.; Woodhouse, M.; Swan, H.; Jones, G.; Cropp, R.; Deschaseaux, E. Coral Reef Emissions of Atmospheric Dimethylsulfide and the Influence on Marine Aerosols in the Southern Great Barrier Reef, Australia. J. Geophys. Res. Atmos. 2020, 125, e2019JD031837. [Google Scholar] [CrossRef] [Scilit]
- Fung, K.M.; Heald, C.L.; Kroll, J.H.; Wang, S.; Jo, D.S.; Gettelman, A.; Lu, Z.; Liu, X.; Zaveri, R.A.; Apel, E.C.; et al. Exploring dimethyl sulfide (DMS) oxidation and implications for global aerosol radiative forcing. Atmos. Chem. Phys. 2022, 22, 1549–1573. [Google Scholar] [CrossRef] [Scilit]
- Townsend, N.; Baldry, K.; Crossman, D.; Cullen, R.; Doubell, M.; Ingleton, T.; Mackay, K.; McNeil, M.; Nichol, S.; Parnum, I.; et al. Ausseabed: A National Program of Collaboration to Maximise Australia’s Seabed Mapping Efforts. Coast. Eng. Proc. 2023, 37, management.174. [Google Scholar] [CrossRef] [Scilit]
- Jones, G.; Curran, M.; Broadbent, A.; King, S.; Fischer, E.; Jones, R. Factors affecting the cycling of dimethylsulfide and dimethylsulfoniopropionate in coral reef waters of the Great Barrier Reef. Environ. Chem. 2007, 4, 310–322. [Google Scholar] [CrossRef] [Scilit]
- Braga, R.C.; Rosenfeld, D.; Hernandez, D.; Medcraft, C.; Efraim, A.; Moser, M.; Lucke, J.; Doss, A.; Harrison, D. Cloud processing dominates the vertical profiles of aerosols in marine air masses over the Great Barrier Reef. Atmos. Res. 2025, 315, 107928. [Google Scholar] [CrossRef] [Scilit]
- Saltzman, E.S. Marine aerosols. Geophys. Monogr. Ser. 2009, 187, 17–35. [Google Scholar] [CrossRef] [Scilit]
- Julaha, K.; Ždímal, V.; Šmejkalová, A.H.; Komínková, K.; Zíková, N. Boundary layer and mixing layer height: Models vs. Ground-based measurements intercomparison. Atmos. Res. 2025, 315, 107897. [Google Scholar] [CrossRef] [Scilit]
- Anderson, M.J. Permutational multivariate analysis of variance (PERMANOVA). In Wiley Statsref: Statistics Reference Online; John Wiley & Sons, Ltd.: Hoboken, NJ, USA, 2014; pp. 1–15. [Google Scholar] [CrossRef] [Scilit]
- Gupta, D.; Kim, H.; Park, G.; Li, X.; Eom, H.J.; Ro, C.U. Hygroscopic properties of NaCl and NaNO3 mixture particles as reacted inorganic sea-salt aerosol surrogates. Atmos. Chem. Phys. 2015, 15, 3379–3393. [Google Scholar] [CrossRef] [Scilit]
- Fiddes, S.L.; Woodhouse, M.T.; Utembe, S.; Schofield, R.; Alexander, S.P.; Alroe, J.; Chambers, S.D.; Chen, Z.; Cravigan, L.; Dunne, E.; et al. The contribution of coral-reef-derived dimethyl sulfide to aerosol burden over the Great Barrier Reef: A modelling study. Atmos. Chem. Phys. 2022, 22, 2419–2445. [Google Scholar] [CrossRef] [Scilit]
- Eckert, C.; Hernandez-Jaramillo, D.C.; Medcraft, C.; Harrison, D.P.; Kelaher, B.P. Drone-Based Measurement of the Size Distribution and Concentration of Marine Aerosols above the Great Barrier Reef. Drones 2024, 8, 292. [Google Scholar] [CrossRef] [Scilit]
- Jackson, R.; Gabric, A.; Cropp, R. Coral reefs as a source of climate-active aerosols. PeerJ 2020, 8, e10023. [Google Scholar] [CrossRef] [Scilit]
- Alroe, J.; Cravigan, L.T.; Miljevic, B.; Johnson, G.R.; Selleck, P.; Humphries, R.S.; Keywood, M.D.; Chambers, S.D.; Williams, A.G.; Ristovski, Z.D. Marine productivity and synoptic meteorology drive summer-time variability in Southern Ocean aerosols. Atmos. Chem. Phys. 2020, 20, 8047–8062. [Google Scholar] [CrossRef] [Scilit]
- Quinn, P.K.; Coffman, D.J.; Johnson, J.E.; Upchurch, L.M.; Bates, T.S. Small fraction of marine cloud condensation nuclei made up of sea spray aerosol. Nat. Geosci. 2017, 10, 674–679. [Google Scholar] [CrossRef] [Scilit]
- Fitzgerald, J.W. Model of the aerosol extinction profile in a well-mixed marine boundary layer. Appl. Opt. 1989, 28, 3534–3538. [Google Scholar] [CrossRef] [Scilit] [PubMed]
- Ryan, R.G.; Eckert, C.; Kelaher, B.P.; Harrison, D.P.; Schofield, R. Boundary layer height above the Great Barrier Reef studied using drone and Mini-Micropulse LiDAR measurements. J. South. Hemisph. Earth Syst. Sci. 2024, 74, ES24008. [Google Scholar] [CrossRef] [Scilit]
- Eckert, C.; Monteforte, K.I.; Harrison, D.P.; Kelaher, B.P. Exploring Meteorological Conditions and Microscale Temperature Inversions above the Great Barrier Reef through Drone-Based Measurements. Drones 2023, 7, 695. [Google Scholar] [CrossRef] [Scilit]
- Abdalmogith, S.S.; Harrison, R.M. The use of trajectory cluster analysis to examine the long-range transport of secondary inorganic aerosol in the UK. Atmos. Environ. 2005, 39, 6686–6695. [Google Scholar] [CrossRef] [Scilit]
- Cui, L.; Song, X.; Zhong, G. Comparative Analysis of Three Methods for HYSPLIT Atmospheric Trajectories Clustering. Atmosphere 2021, 12, 698. [Google Scholar] [CrossRef] [Scilit]
- Gantt, B.; Meskhidze, N.; Facchini, M.C.; Rinaldi, M.; Ceburnis, D.; O’Dowd, C.D. Wind speed dependent size-resolved parameterization for the organic mass fraction of sea spray aerosol. Atmos. Chem. Phys. 2011, 11, 8777–8790. [Google Scholar] [CrossRef] [Scilit]
- Seibert, P.; Beyrich, F.; Gryning, S.-E.; Joffre, S.; Rasmussen, A.; Tercier, P. Review and intercomparison of operational methods for the determination of the mixing height. Atmos. Environ. 2000, 34, 1001–1027. [Google Scholar] [CrossRef] [Scilit]
- Luo, T.; Yuan, R.; Wang, Z. On factors controlling marine boundary layer aerosol optical depth. J. Geophys. Res. Atmos. 2014, 119, 3321–3334. [Google Scholar] [CrossRef] [Scilit]
- Cropp, R.; Gabric, A.; van Tran, D.; Jones, G.; Swan, H.; Butler, H. Coral reef aerosol emissions in response to irradiance stress in the Great Barrier Reef, Australia. Ambio 2018, 47, 671–681. [Google Scholar] [CrossRef] [Scilit]
- Christiansen, S.; Salter, M.E.; Gorokhova, E.; Nguyen, Q.T.; Bilde, M. Sea spray aerosol formation: Laboratory results on the role of air entrainment, water temperature, and phytoplankton biomass. Environ. Sci. Technol. 2019, 53, 13107–13116. [Google Scholar] [CrossRef] [Scilit]
- Tomasi, C.; Lupi, A. Primary and secondary sources of atmospheric aerosol. In Atmospheric Aerosols: Life Cycles and Effects on Air Quality and Climate; John Wiley & Sons, Ltd.: Hoboken, NJ, USA, 2017; pp. 1–86. [Google Scholar] [CrossRef] [Scilit]
- Wang, Y.-C.; Wang, S.-H.; Lewis, J.R.; Chang, S.-C.; Griffith, S.M. Determining planetary boundary layer height by micro-pulse lidar with validation by UAV measurements. Aerosol Air Qual. Res. 2021, 21, 200336. [Google Scholar] [CrossRef] [Scilit]
- Deschaseaux, E.S.; Jones, G.B.; Deseo, M.A.; Shepherd, K.M.; Kiene, R.; Swan, H.; Harrison, P.L.; Eyre, B.D. Effects of environmental factors on dimethylated sulfur compounds and their potential role in the antioxidant system of the coral holobiont. Limnol. Oceanogr. 2014, 59, 758–768. [Google Scholar] [CrossRef] [Scilit]
- Van Eijk, A.; Kusmierczyk-Michulec, J.; Francius, M.; Tedeschi, G.; Piazzola, J.; Merritt, D.; Fontana, J. Sea-spray aerosol particles generated in the surf zone. J. Geophys. Res. Atmos. 2011, 116, D19210. [Google Scholar] [CrossRef] [Scilit]
- Jackson, R.; Gabric, A.; Matrai, P.; Woodhouse, M.; Cropp, R.; Jones, G.; Deschaseaux, E.; Omori, Y.; McParland, E.; Swan, H. Parameterizing the Impact of Seawater Temperature and Irradiance on Dimethylsulfide (DMS) in the Great Barrier Reef and the Contribution of Coral Reefs to the Global Sulfur Cycle. J. Geophys. Res. Ocean. 2021, 126, e2020JC016783. [Google Scholar] [CrossRef] [Scilit]
- Perma Pure. BE Series Moisture Exchangers. Available online: https://www.permapure.com/wp-content/uploads/2021/10/BE-Gas-Detection.pdf (accessed on 20 February 2025).

Disclaimer/Publisher’s Note: The statements, opinions and data contained in all publications are solely those of the individual author(s) and contributor(s) and not of MDPI and/or the editor(s). MDPI and/or the editor(s) disclaim responsibility for any injury to people or property resulting from any ideas, methods, instructions or products referred to in the content. |
© 2026 by the authors. Licensee MDPI, Basel, Switzerland. This article is an open access article distributed under the terms and conditions of the Creative Commons Attribution (CC BY) license.