


Highlights
What are the main findings?
- A Progressive Deep Learning Crop Mapping framework enables accurate 10 m rice mapping over more than one million square kilometers using only sparse initial samples, achieving consistently high accuracy from 2022 to 2024 with strong spatial and temporal generalization.
- Model transferability exhibits a clear distance decay pattern and is jointly influenced by multiple factors, including spatial distance from training areas, climatic and phenological gradients, terrain and soil heterogeneity, and regional differences in multi-temporal image availability and quality.
What are the implications of the main findings?
- The proposed framework provides a scalable and transferable paradigm for operational crop mapping, reducing dependence on extensive labeled datasets and lowering the barrier for national or continental scale applications.
- The publicly available multi-year 10 m rice maps offer reliable spatial information to support food security assessment, agricultural management, and sustainability-related policy making, with clear relevance to SDG 2 monitoring.
Abstract
Accurate mapping of rice cultivation is vital for ensuring food security, reducing greenhouse gas emissions, and achieving sustainable development goals. However, large-scale deep learning–based crop mapping remains limited due to the demand for vast, uniformly distributed, high-quality samples. To address this challenge, we propose a Progressive Deep Learning Crop Mapping (PDLCM) framework for national-scale, high-resolution rice mapping. Beginning with a small set of localized rice and non-rice samples, PDLCM progressively refines model performance through iterative enhancement of positive and negative samples, effectively mitigating sample scarcity and spatial heterogeneity. By combining time-series Sentinel-2 optical data with Sentinel-1 synthetic aperture radar imagery, the framework captures distinctive phenological characteristics of rice while resolving spatiotemporal inconsistencies in large datasets. Applying PDLCM, we produced 10 m rice maps from 2022 to 2024 across the middle and lower Yangtze River Basin, covering more than one million square kilometers. The results achieved an overall accuracy of 96.8% and an F1 score of 0.88, demonstrating strong spatial and temporal generalization. All datasets and source codes are publicly accessible, supporting SDG 2 and providing a transferable paradigm for operational large-scale crop mapping.
1. Introduction
Rice cultivation plays a central role in ensuring food security, reducing greenhouse gas emissions, and maintaining ecological balance [1,2,3]. In East and Southeast Asia, rapid urbanization, climate variability, and socioeconomic change have caused continuous adjustments in rice cultivation areas [4,5,6]. For example, in Zhejiang Province, the rice planting area has decreased by nearly 70% since the late 1990s, while population and food demand have continued to rise. Such changes make accurate and dynamic monitoring of rice distribution essential for sustainable agricultural development.
With the continuous improvement of satellite remote sensing technology, Earth observation data have become the primary source for large-scale crop mapping [7,8,9,10,11]. Rice exhibits distinctive seasonal dynamics that can be recognized through both optical and synthetic aperture radar (SAR) observations. Flooding before transplanting, canopy closure during growth, and drying before harvest create identifiable temporal patterns in reflectance and backscatter. These multi-temporal signatures form the basis of many remote-sensing-based rice mapping approaches [12,13,14,15].
A number of algorithms have been developed to exploit these temporal features [16,17,18]. Boschetti et al. (2017) proposed the PhenoRice approach, which extracts phenological metrics from MODIS time-series imagery for regional rice mapping [19]. Shen et al. (2025) established the CCD-Rice dataset by applying machine-learning techniques to long-term optical images, producing a 30 m national-scale rice distribution map for China [20]. Zhan et al. (2021) developed an automated method (ARM-SARFS) that detects the characteristic “V-shaped” temporal pattern of Sentinel-1A VH backscatter associated with paddy field flooding, achieving over 86% accuracy without the need for training samples [3]. These studies substantially advanced rice mapping research, but most existing products remain limited in either spatial resolution or coverage and still face challenges in generalizing to regions with complex cropping systems and environmental heterogeneity.
Deep learning has recently provided new opportunities for crop mapping by learning spatial and temporal features directly from large volumes of remote sensing data [14,21]. Recent advances in explainable deep learning combined with multi-temporal SAR imagery have shown promising potential for large-scale rice mapping under strong spatiotemporal heterogeneity, offering improved robustness, interpretability, and scalability for global applications [22]. However, its application to national or continental-scale rice mapping remains limited. Several technical and practical challenges hinder broader implementation: (1) inconsistency in optical observations due to cloud cover and the asynchronous revisit cycles of multi-sensor data [23,24]; (2) substantial environmental heterogeneity across agro-ecological zones that weakens model transferability [25,26,27]; (3) dependence on large, spatially balanced training datasets that are costly to obtain [28,29]; and (4) heavy computational demands associated with large-scale data processing and model training [30,31]. These issues often limit the efficiency and scalability of deep learning methods for operational crop mapping.
The middle and lower reaches of the Yangtze River Basin offer an ideal test region for addressing these challenges. As one of the world’s most important rice-growing areas, it spans diverse climatic zones, terrain conditions, and rice-cropping systems, including both single- and double-season rice [16,32,33]. However, existing rice mapping studies in this region still rely heavily on rule-based or conventional machine learning methods, which are sensitive to regional thresholds and data gaps. Few studies have explored how to apply deep learning models effectively across such a wide area while maintaining stable accuracy under complex agro-ecological and climatic conditions.
In this context, this study aims to develop a scalable and data-efficient deep learning framework tailored for large-scale rice mapping in the Yangtze River Basin. The framework seeks to reduce dependence on extensive labeled samples, improve the consistency of multi-source image use, and enhance model generalization across regions and years. By integrating time-series Sentinel-1 radar and Sentinel-2 optical data, the proposed approach attempts to capture the full phenological cycle of rice and to resolve the challenges of data heterogeneity and sample imbalance that typically constrain high-resolution large-area mapping.
The work presented here contributes to ongoing efforts in large-scale agricultural remote sensing by exploring how progressive learning and sample enhancement strategies can support operational crop mapping. The goal is not only to generate multi-year 10 m rice distribution products for the middle and lower Yangtze River Basin but also to provide a transferable methodological framework that can be extended to other crops and regions. To support reproducibility and further research, all rice mapping results generated in this study have been made publicly available at https://doi.org/10.6084/m9.figshare.29336981, enabling open access to the 10 m rice distribution maps across one of the most important rice-growing regions in the world.
2. Materials
2.1. Study Area
The middle and lower reaches of the Yangtze River are located in a warm and humid subtropical monsoon climate, with average annual temperatures of about 16 to 18 °C and precipitation ranging from 1000 mm to 1600 mm. The region includes six provinces and one municipality: Anhui, Jiangsu, Zhejiang, Jiangxi, Hubei, Hunan, and Shanghai. It covers roughly 1,000,000 km2 and supports a population of more than 400 million people. As one of the most important rice-producing regions in the world and a historical center of rice cultivation, it accounted for more than half of China’s total rice area in 2022.
Rainfall is concentrated in the summer months and sometimes causes flooding, which poses challenges for rice farming. The terrain varies from plains to hills and river networks, leading to uneven distribution of arable land. Plains are suitable for intensive rice production, while hilly areas face limitations in irrigation and water retention. The regional climate also exhibits a pronounced north–south gradient, which results in distinct rice cropping systems: single-season rice in the northern part of the study area and double-season rice in the southern part. In this context, single-season rice refers to fields where rice is cultivated once per year, although other crops may be grown outside the rice-growing period. Double-season rice refers to fields where two rice crops are cultivated within a single year. Within the double-season system, early rice and late rice correspond to the first and second rice-growing seasons, respectively. These diverse and region-specific cropping practices increase the spatiotemporal complexity of rice phenology and substantially complicate large-scale rice mapping, thereby requiring flexible and adaptable mapping methods.
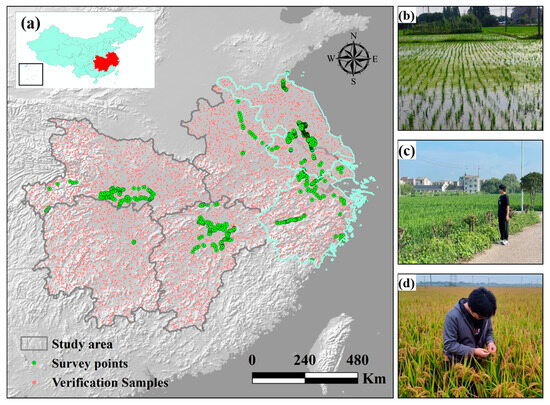
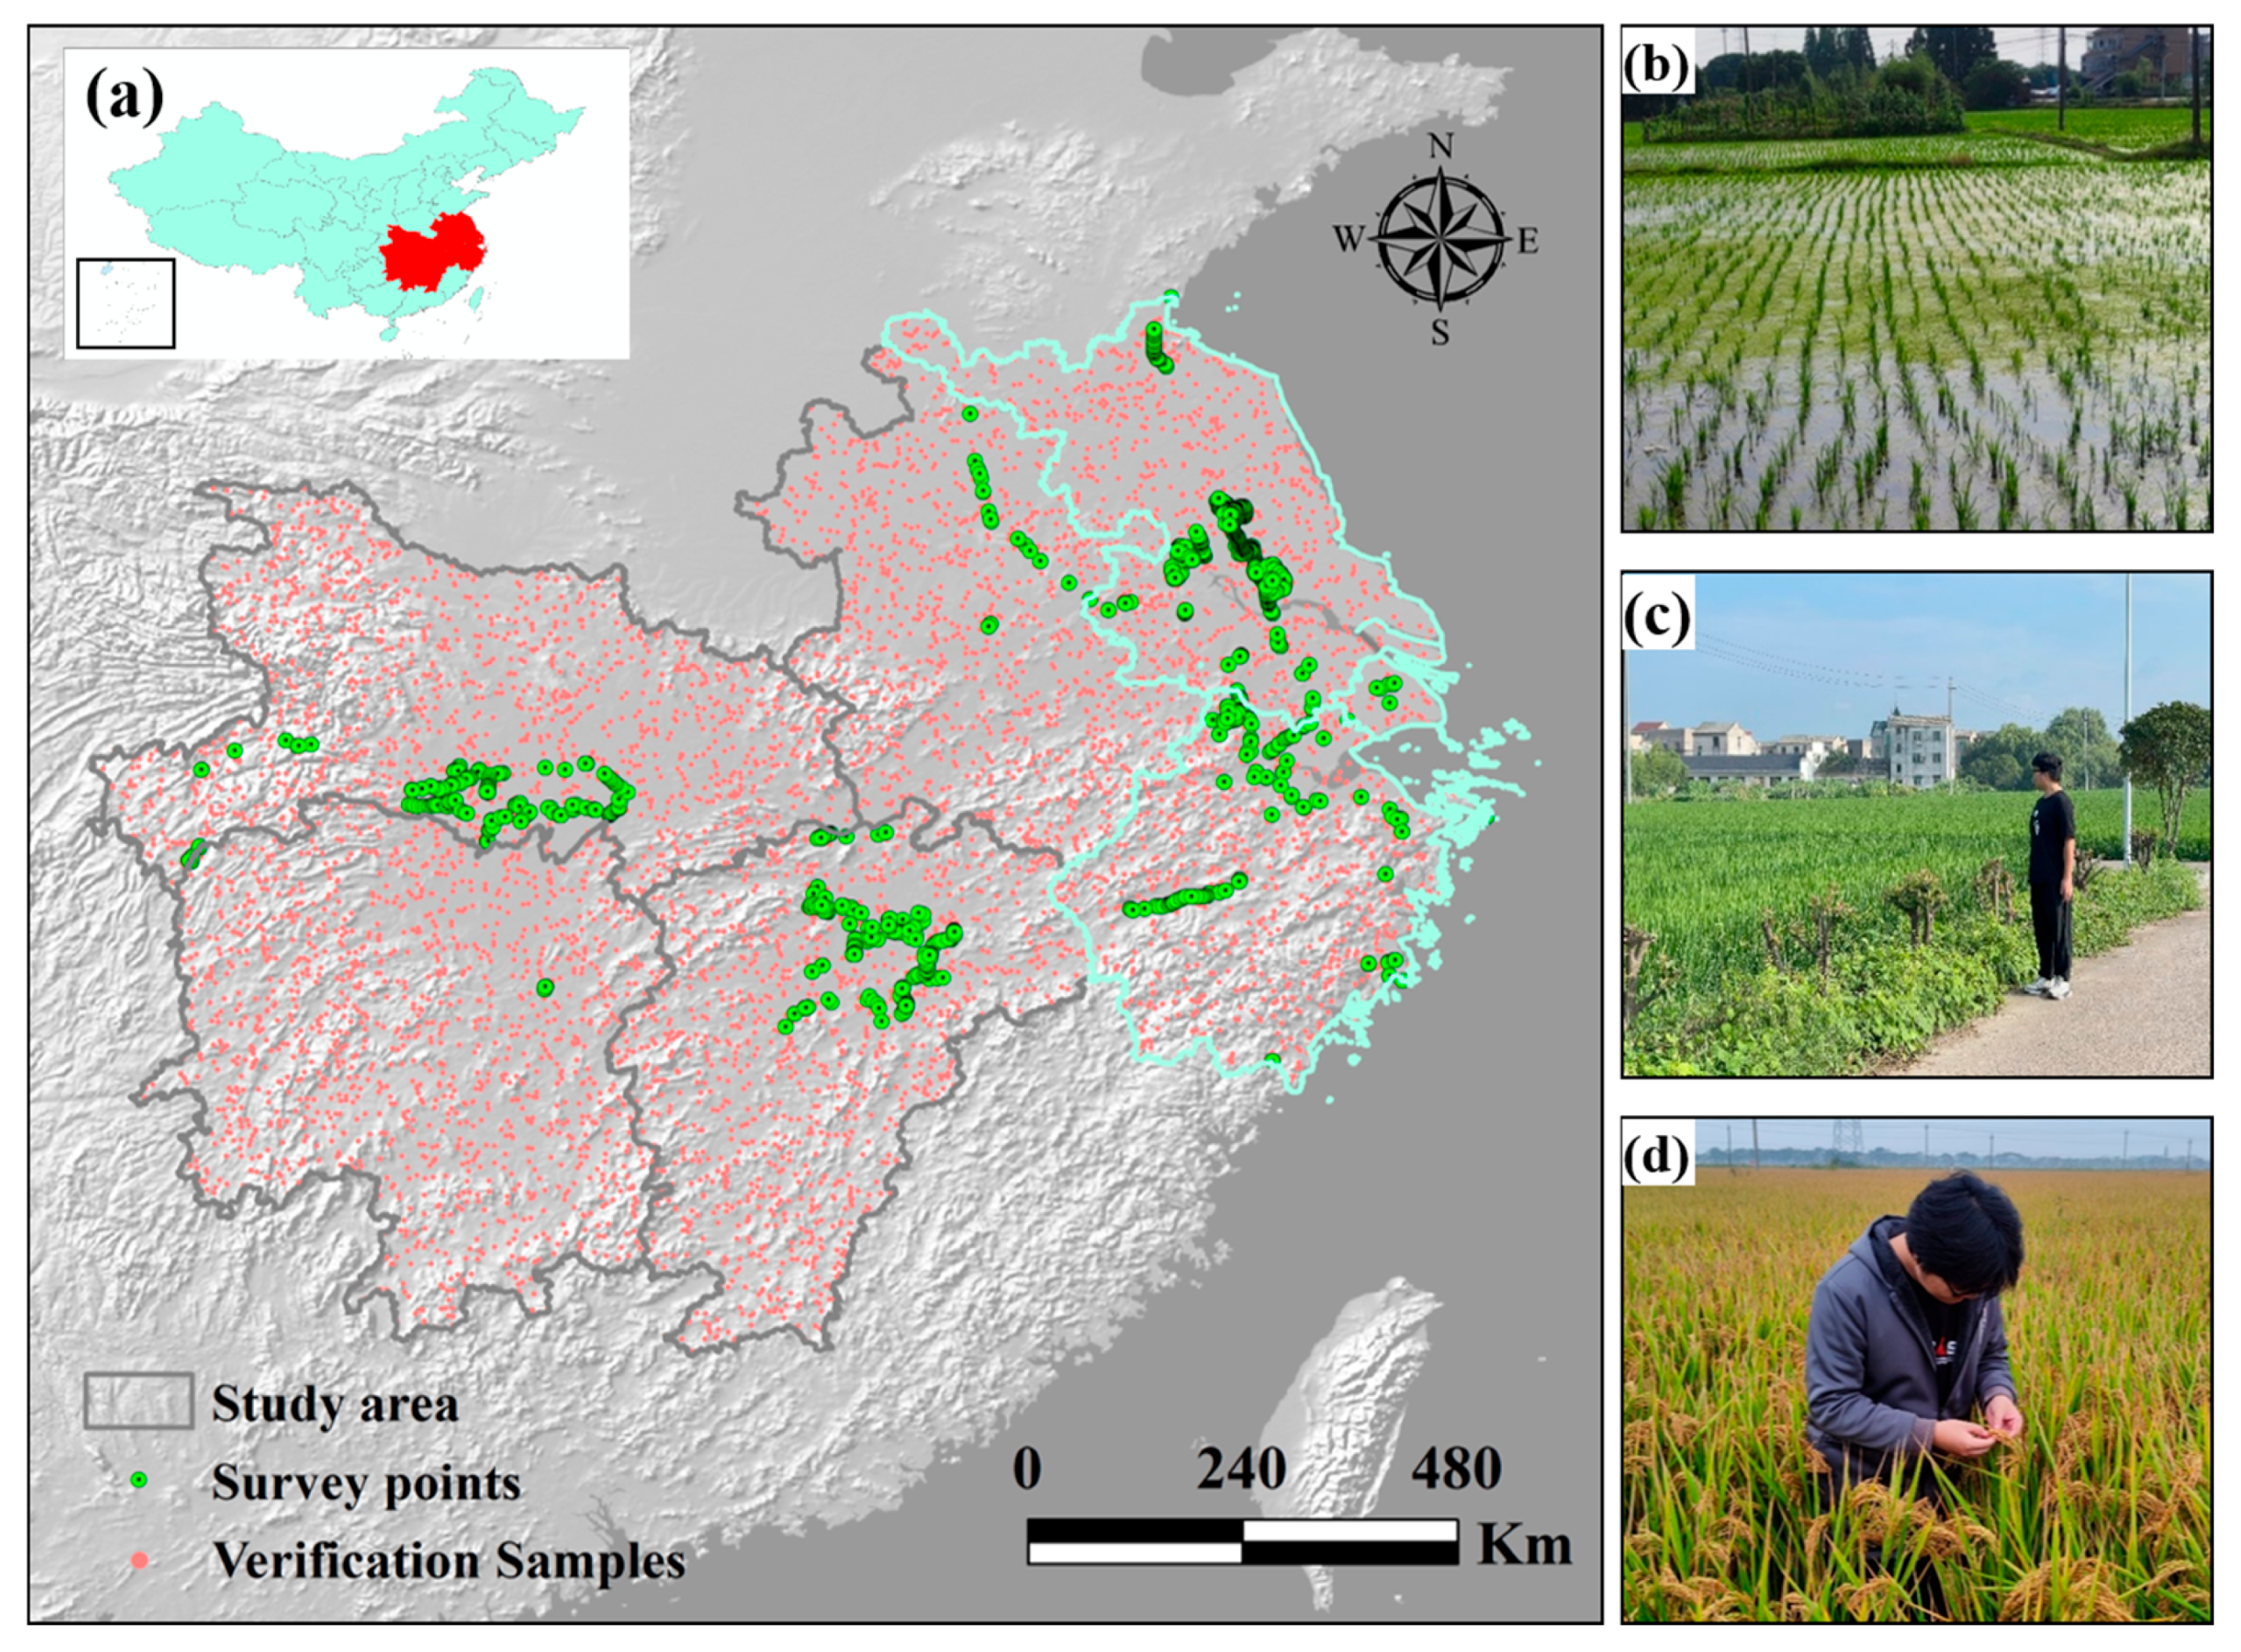
To demonstrate the proposed approach, the provinces of Jiangsu and Zhejiang together with the municipality of Shanghai (referred to as JZS in Figure 1) were selected as representative areas. The goal of this study is to produce accurate 10 m rice distribution maps for the entire basin for the years 2022 to 2024 using a deep learning-based framework.
Figure 1.
Geographical Location: (a) the distribution of study areas in China and field survey locations; (b–d) images of rice at different growth stages: flooding-transplant stage, growing stage, and harvest stage.
2.2. Satellite Data
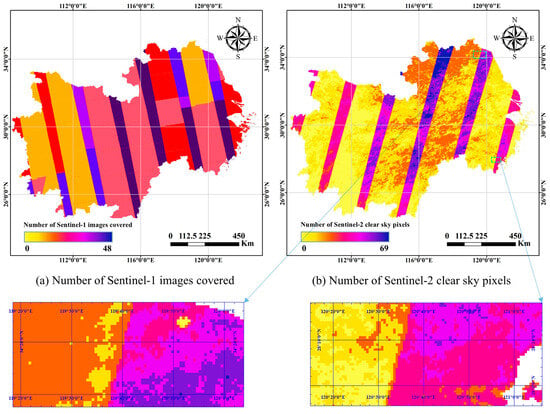
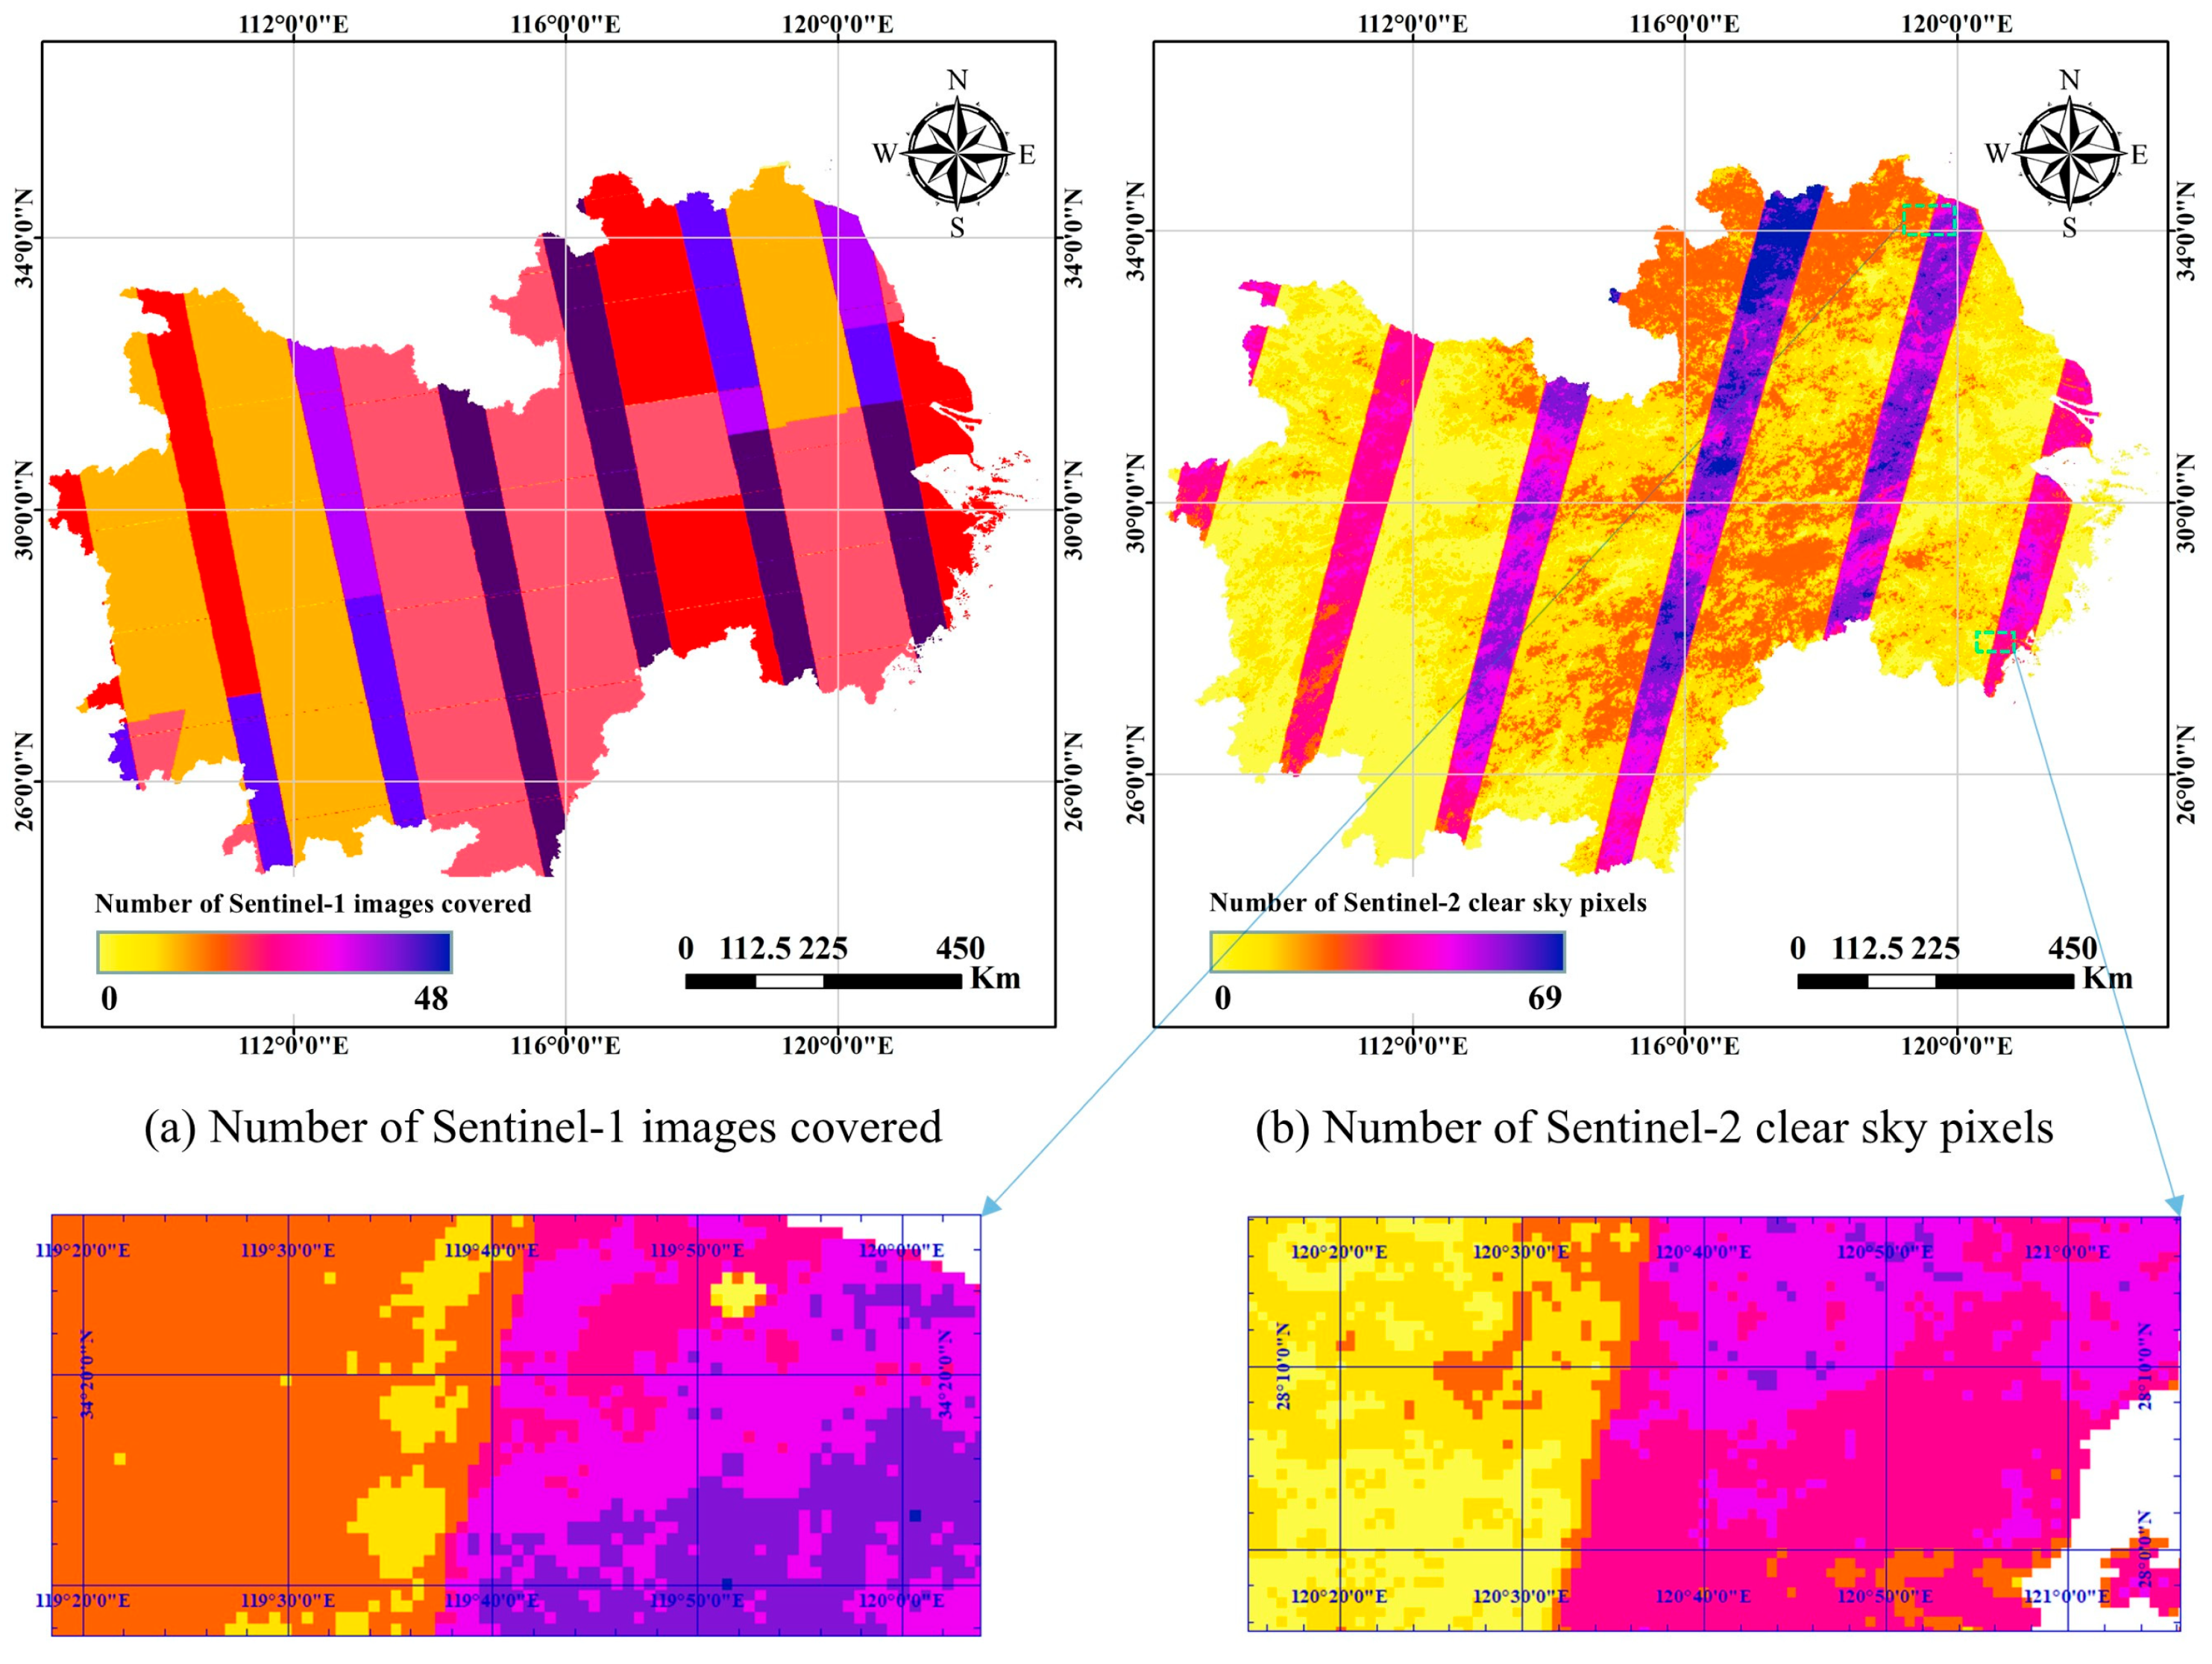
The large geographic extent of the study area and the multi-year monitoring scope led to the acquisition and management of massive volumes of remote sensing data (Figure 2). Specifically, for each year, approximately 556 GB of Sentinel-2 data and 1428 GB of Sentinel-1 data were processed, totaling nearly 2 TB annually and over 6 TB across the three study years (2022–2024). To efficiently handle this data volume, we employed the Google Earth Engine (GEE) platform for image filtering, cloud masking, temporal compositing, and batch downloading. GEE provides convenient access to multi-source satellite archives and powerful cloud-based preprocessing capabilities, which are particularly valuable when managing large-scale and long-term datasets.
Figure 2.
Analysis of sentinel satellite image coverage in the research area from 1 April to 3 November 2022: (a) Number of Sentinel-1 images covered; (b) Number of Sentinel-2 clear sky pixels. The magnified views aim to illustrate the more complex regional variations in Sentinel-2 clear sky pixels.
Since Google Earth Engine (GEE) does not yet support deep learning model training and inference, all model development and rice classification were carried out locally. This hybrid workflow used GEE for large-scale image access and preprocessing, while local processing handled model training and prediction, combining the efficiency of cloud data management with the flexibility of local computing.
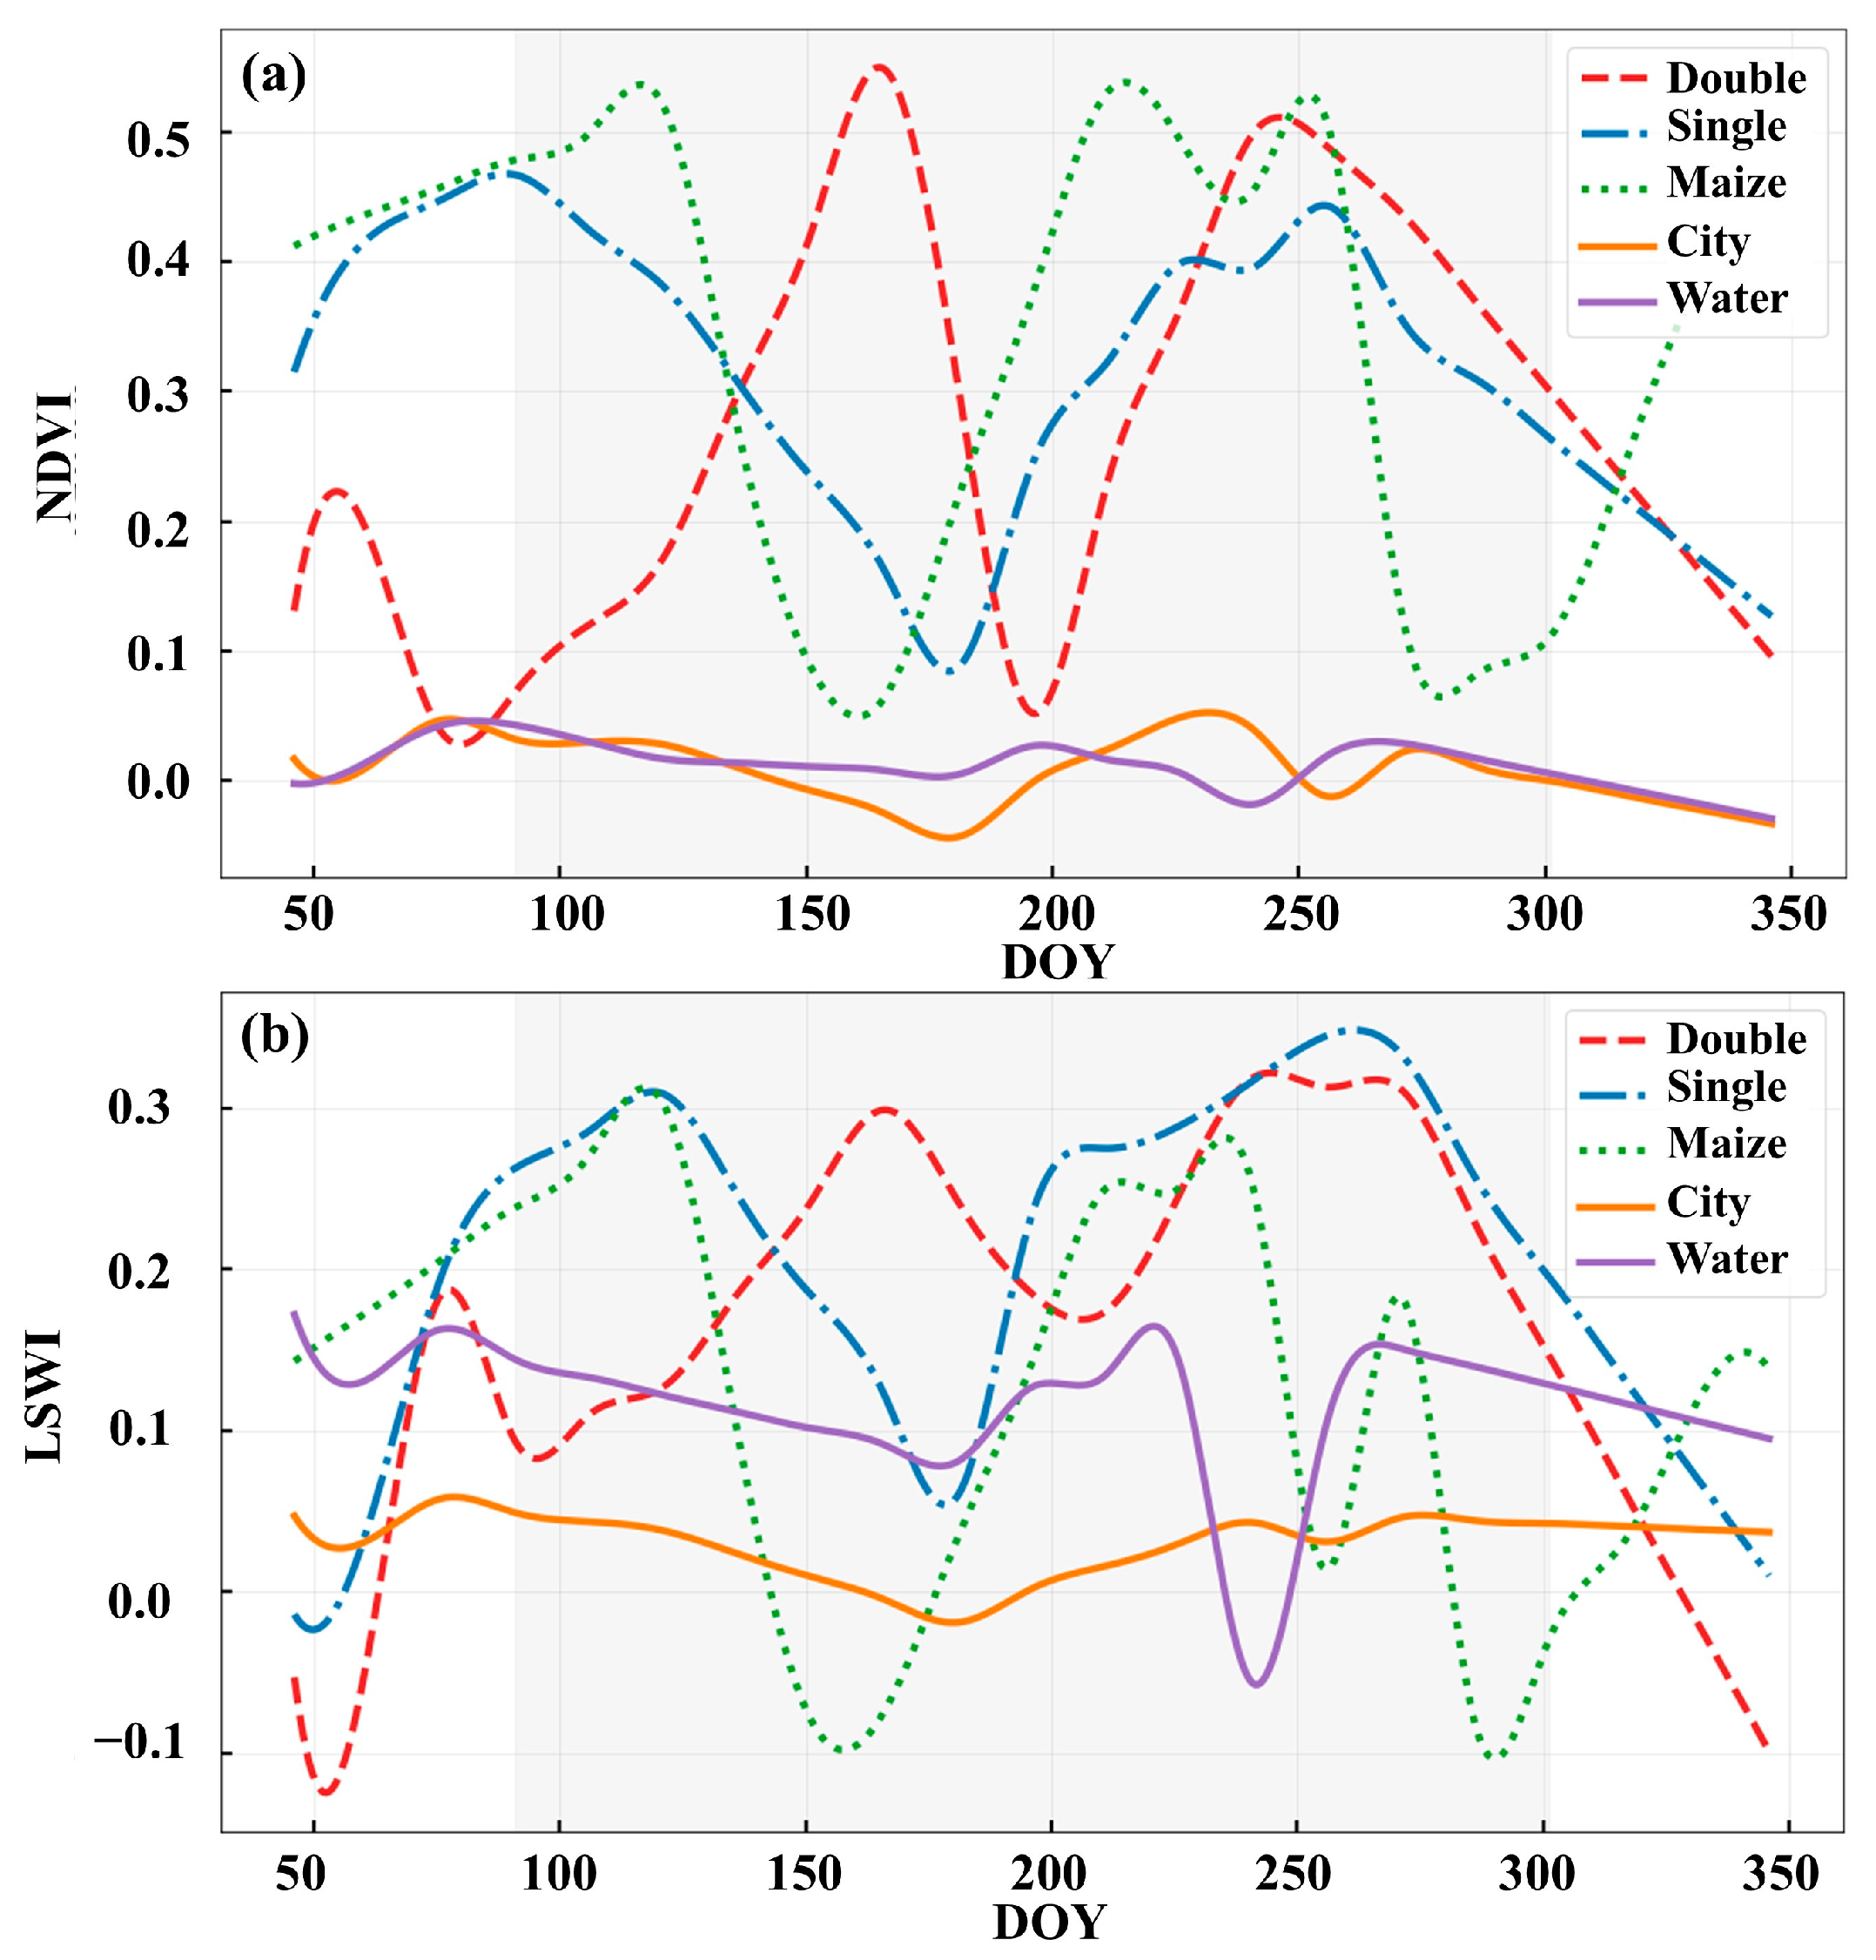
Sentinel-2 provides visible, near-infrared, and shortwave infrared bands that describe vegetation and soil conditions. From these bands, indices such as the Normalized Difference Vegetation Index (NDVI) and Land Surface Water Index (LSWI) were calculated to characterize the phenological stages of rice [34]. Because the study area covers about one million square kilometers, cloud-free observations vary across regions and months. To obtain consistent inputs, all available cloud-free Sentinel-2 images from April to October were composited by averaging ten spectral bands (B2 to B8A, B11, and B12) into a single seasonal image.
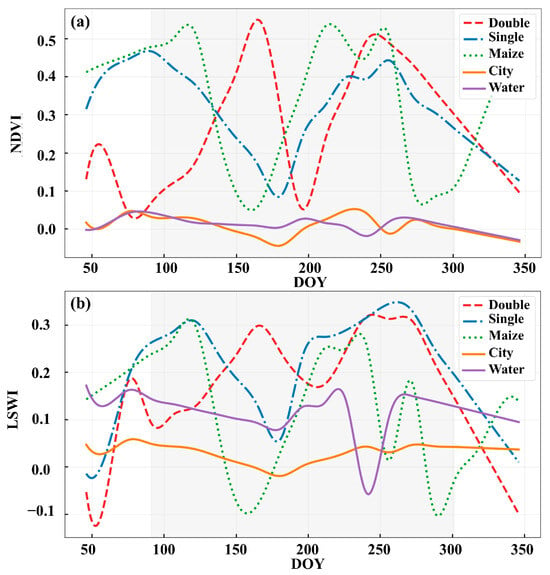
Four additional bands were generated by computing the temporal maximum and minimum values of NDVI and LSWI for each pixel over the rice-growing season, forming a 14-band composite that represents the full growth cycle of rice. The NDVI and LSWI time-series patterns of rice, maize, urban land, and water bodies (Figure 3) demonstrate the strong ability of these indices to distinguish rice fields from other land covers.
Figure 3.
Time Series Curves of NDVI (a) and LSWI (b) for Different Land Cover Types. For single-season rice, a bimodal NDVI pattern may occur due to residual signals from winter crops cultivated between rice-growing periods in the study region.
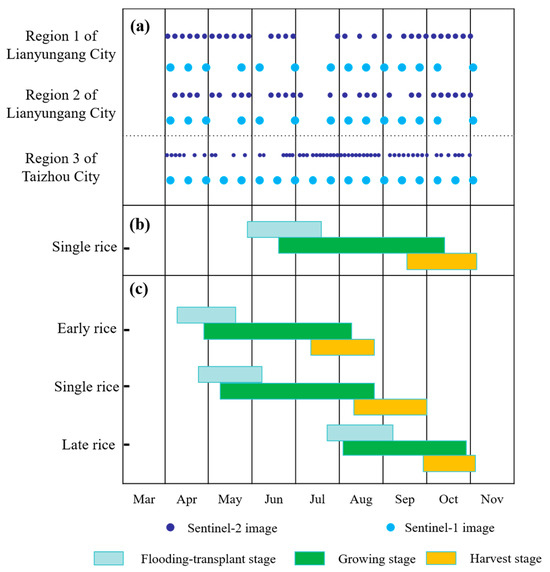
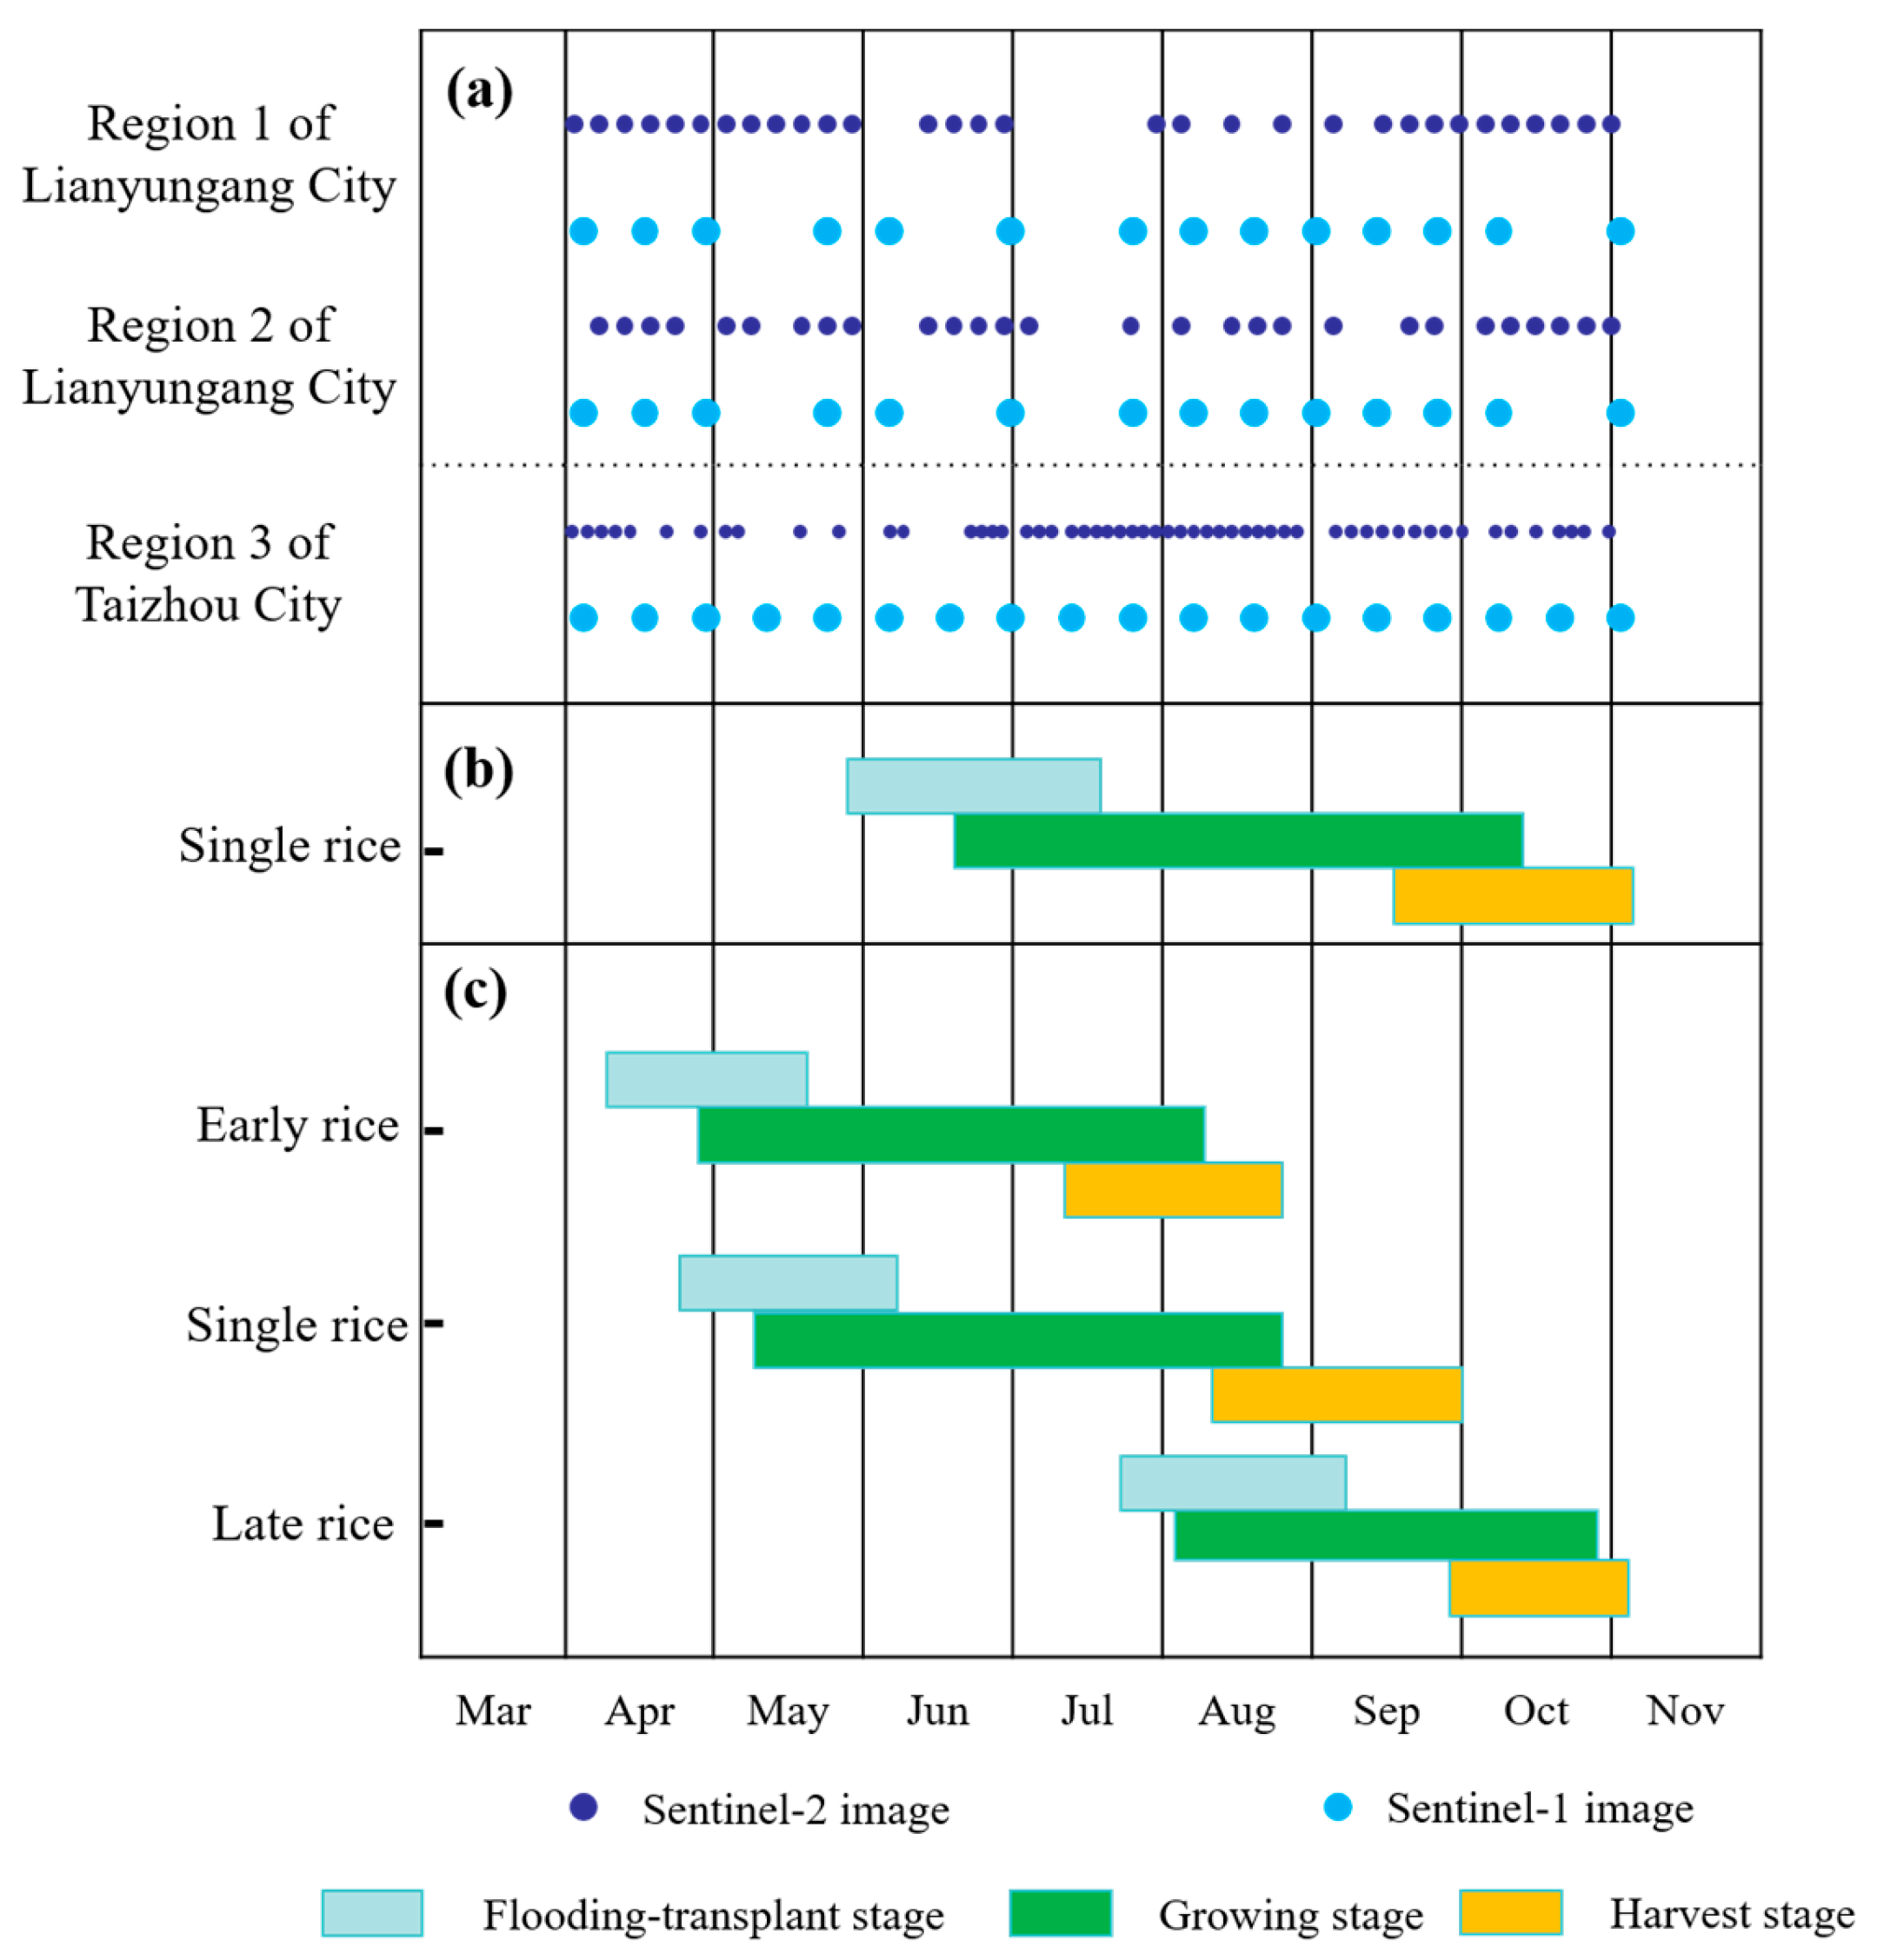
Sentinel-1 radar data complemented the optical information. The time series covered the same period, from April to early November, with 12-day intervals and dual polarizations (VV and VH). A total of 36 radar composites were produced and merged with the optical data to create the final multi-source image set used for rice classification (Figure 4).
Figure 4.
Image dates in different regions (a) and rice cropping calendar at Jiangsu Province (b), Shanghai City and Zhejiang Province (c).
2.3. Ground Survey and Sample Data
To ensure the reliability and interpretability of rice mapping results, this study incorporated a comprehensive set of ground-truth data, including field surveys, high-resolution image interpretation, and statistical reports at multiple administrative levels.
Field surveys were conducted across all six provinces within the study area, covering diverse rice-growing environments. During these surveys, crop growth stages were recorded through geo-tagged photographs, and cultivation practices were documented via in-person interviews with local farmers. These data served as a foundational source of prior knowledge for subsequent sample labeling and interpretation validation.
For accuracy assessment, approximately 18,000 validation sample points were randomly generated throughout the entire region (around 6000 for each year from 2022 to 2024), as shown in Figure 2a. The random sampling strategy ensured spatial representativeness and statistical rigor. Each sample point was individually labeled through comprehensive visual interpretation using multiple sources: Google Earth, Esri World Imagery, multi-temporal and multi-spectral satellite imagery, as well as the aforementioned field survey data. This multi-source cross-referencing approach greatly improved the reliability and consistency of land cover identification.
In addition, rice cultivation statistics were collected from provincial and municipal statistical yearbooks, as well as government bulletins and public reports, to validate the remote sensing–derived rice areas at both regional and sub-regional scales. These authoritative sources provided critical references for assessing the consistency and credibility of the mapped results.
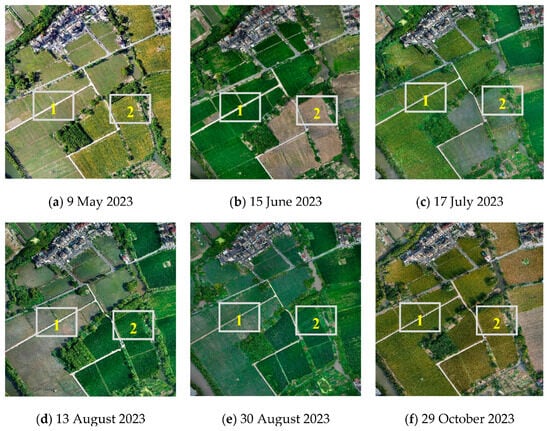
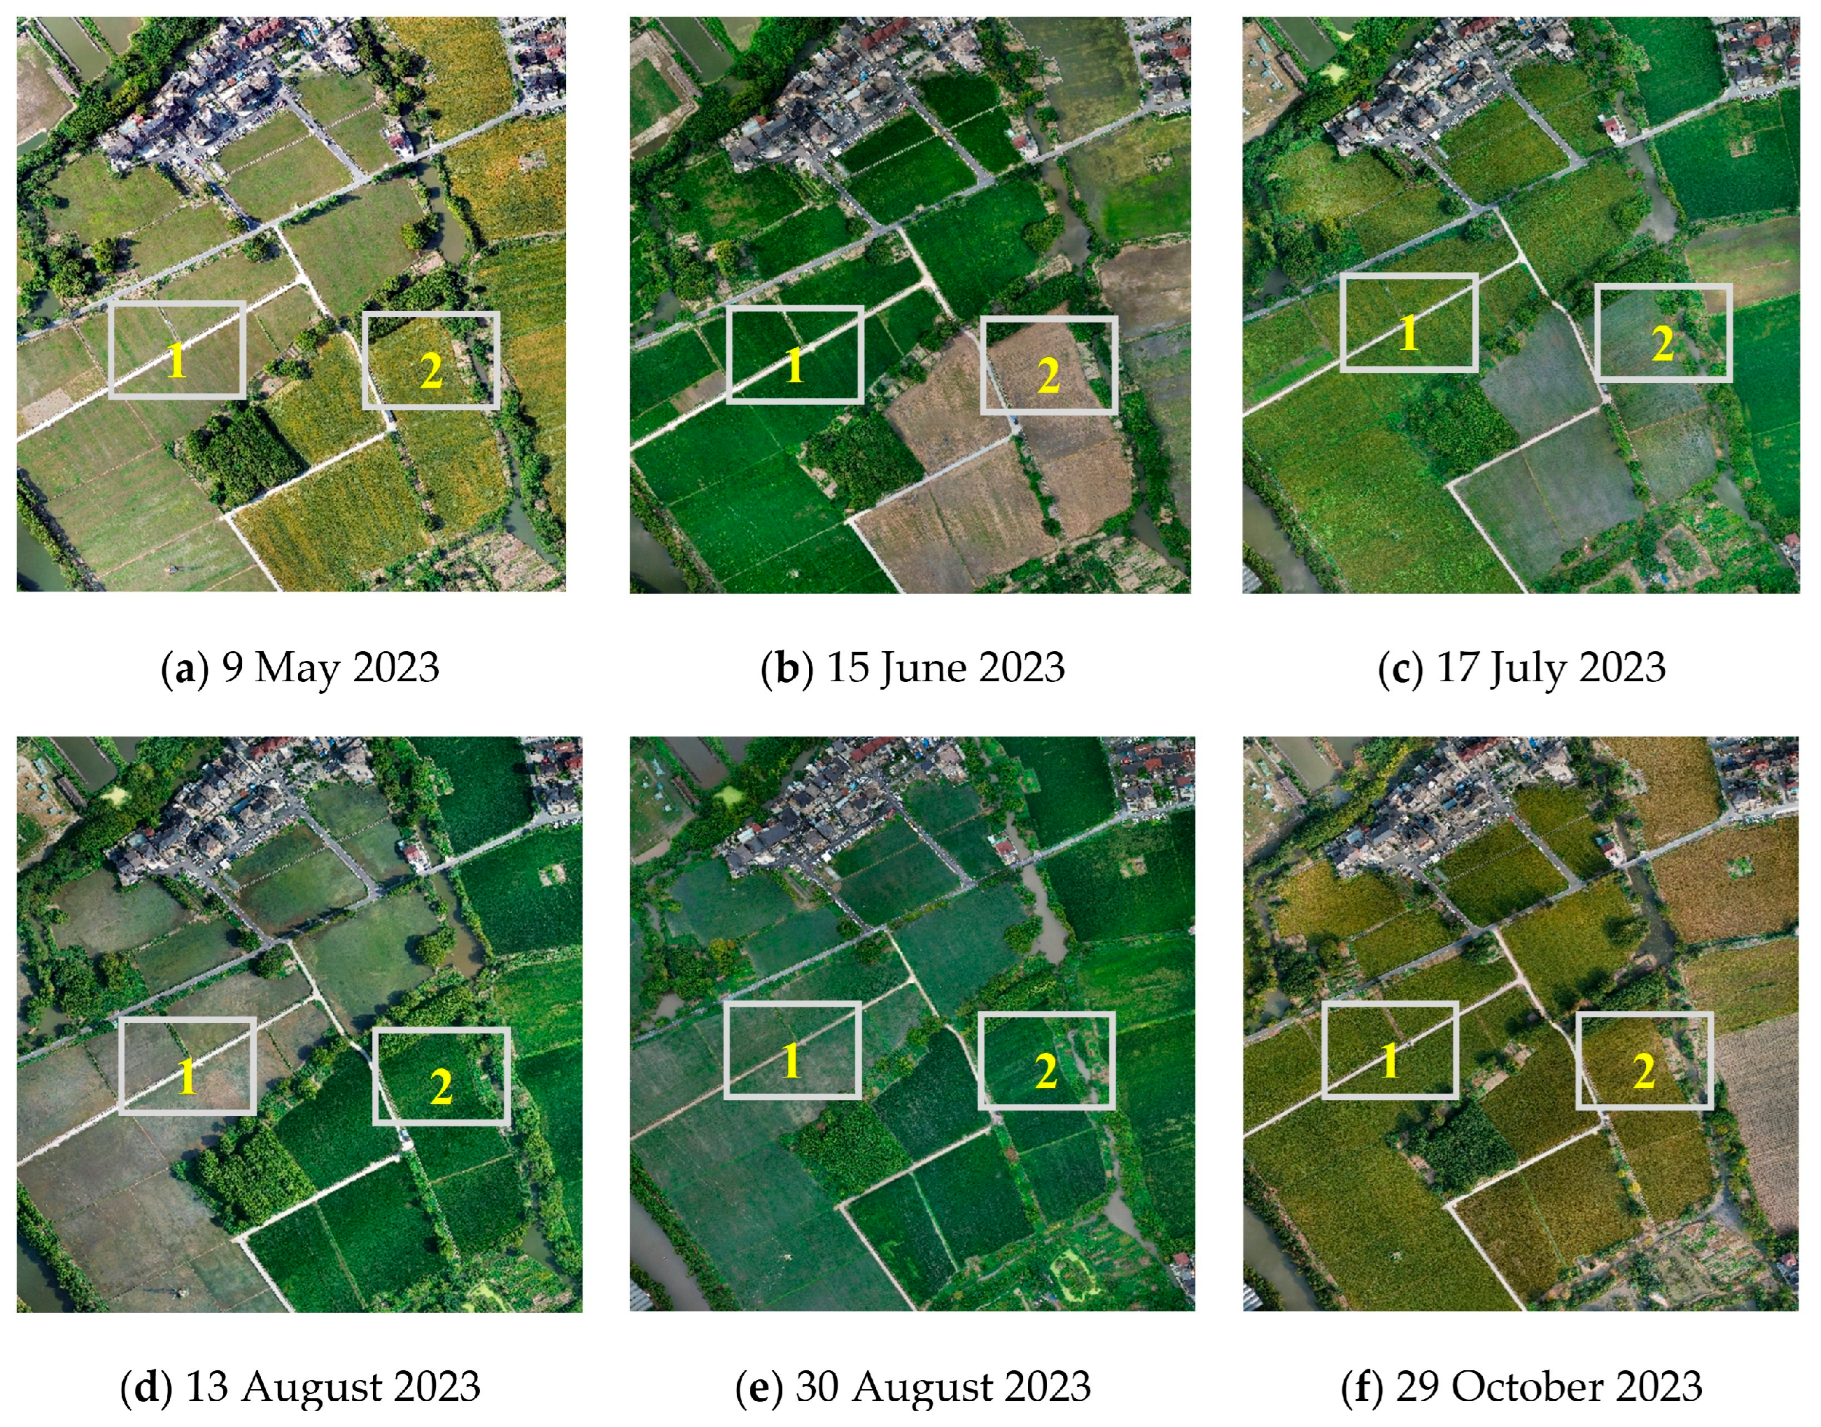
Furthermore, representative rice fields were selected for detailed phenological observations and continuous UAV (Unmanned Aerial Vehicle) monitoring. These multi-temporal UAV campaigns helped distinguish between single- and double-season rice and provided high-frequency visual evidence to support label accuracy and phenological interpretation. As shown in Figure 5, the field 1 is planted with double-cropping rice, while field 2 is planted with single-cropping rice. These expert-guided observations ensured label reliability in spatially heterogeneous landscapes.
Figure 5.
Representative multi-temporal UAV imagery from a sample area in Hangzhou, Zhejiang, illustrating typical phenological differences between double-cropping rice (Field 1: transplanted on 9 May and 13 August) and single-cropping rice (Field 2: transplanted on 17 July).
3. Methods
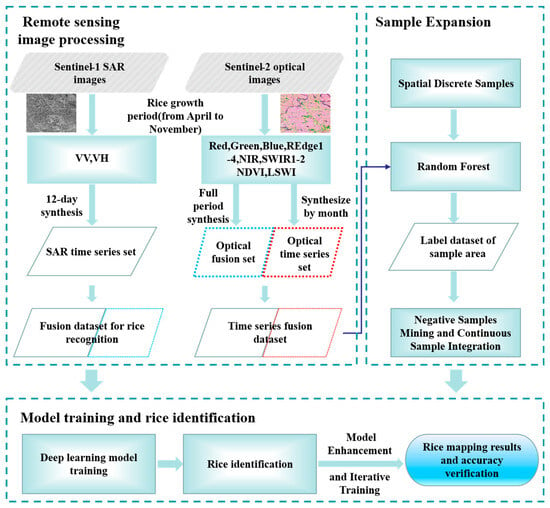
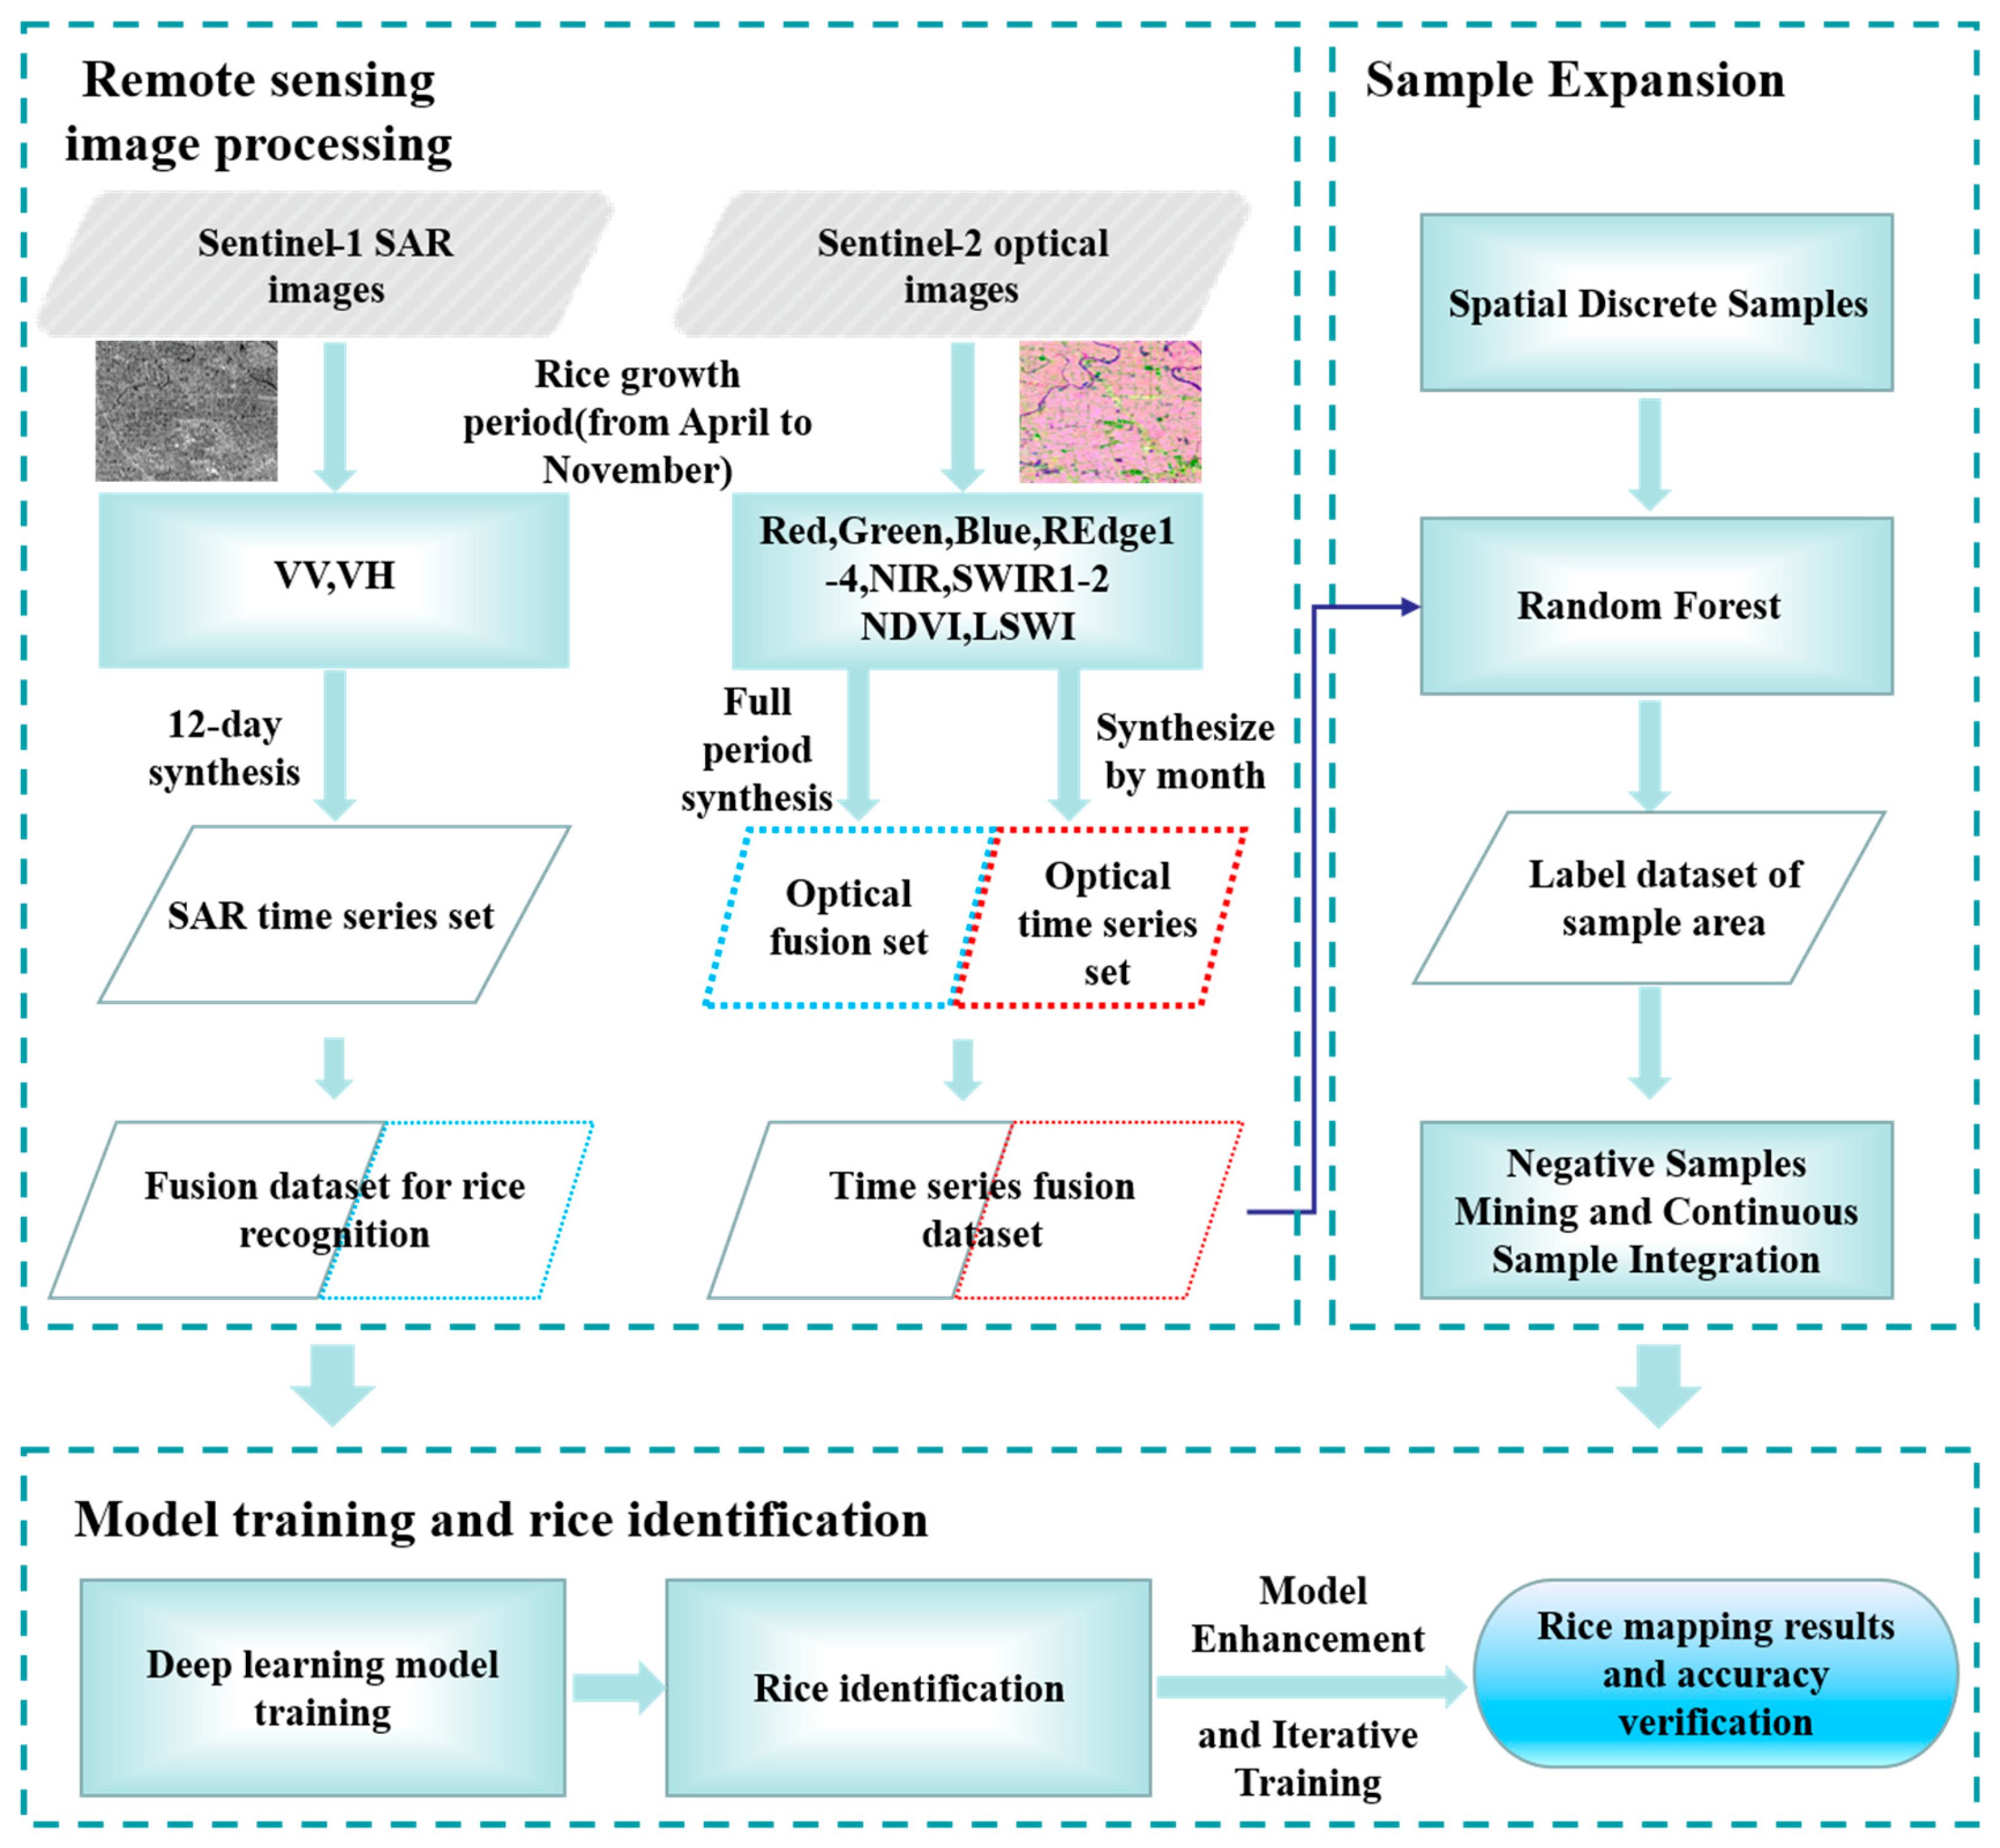
This study utilized Sentinel-1 and Sentinel-2 image data and applied a deep learning framework to map rice planting areas across the middle and lower Yangtze River Basin. Jiangsu, Zhejiang, and Shanghai were selected as representative regions to demonstrate the technical workflow (see Figure 6).
Figure 6.
Large-scale rice remote sensing mapping flow chart. The parallelograms represent datasets, with the two gray-filled ones being external datasets; rectangles represent processes, and rounded rectangles represent final output results.
3.1. Progressive Deep Learning for Large-Scale Crop Mapping
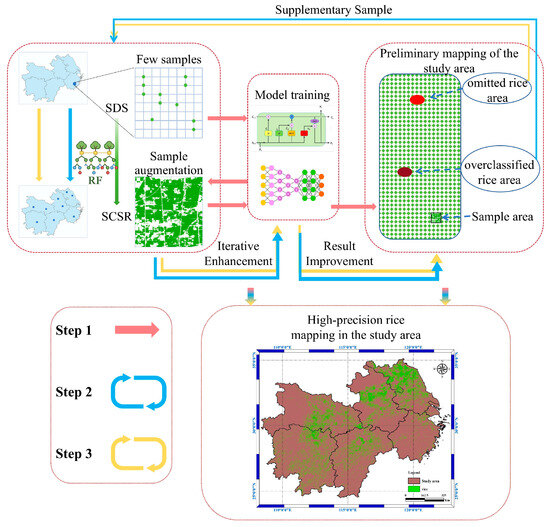
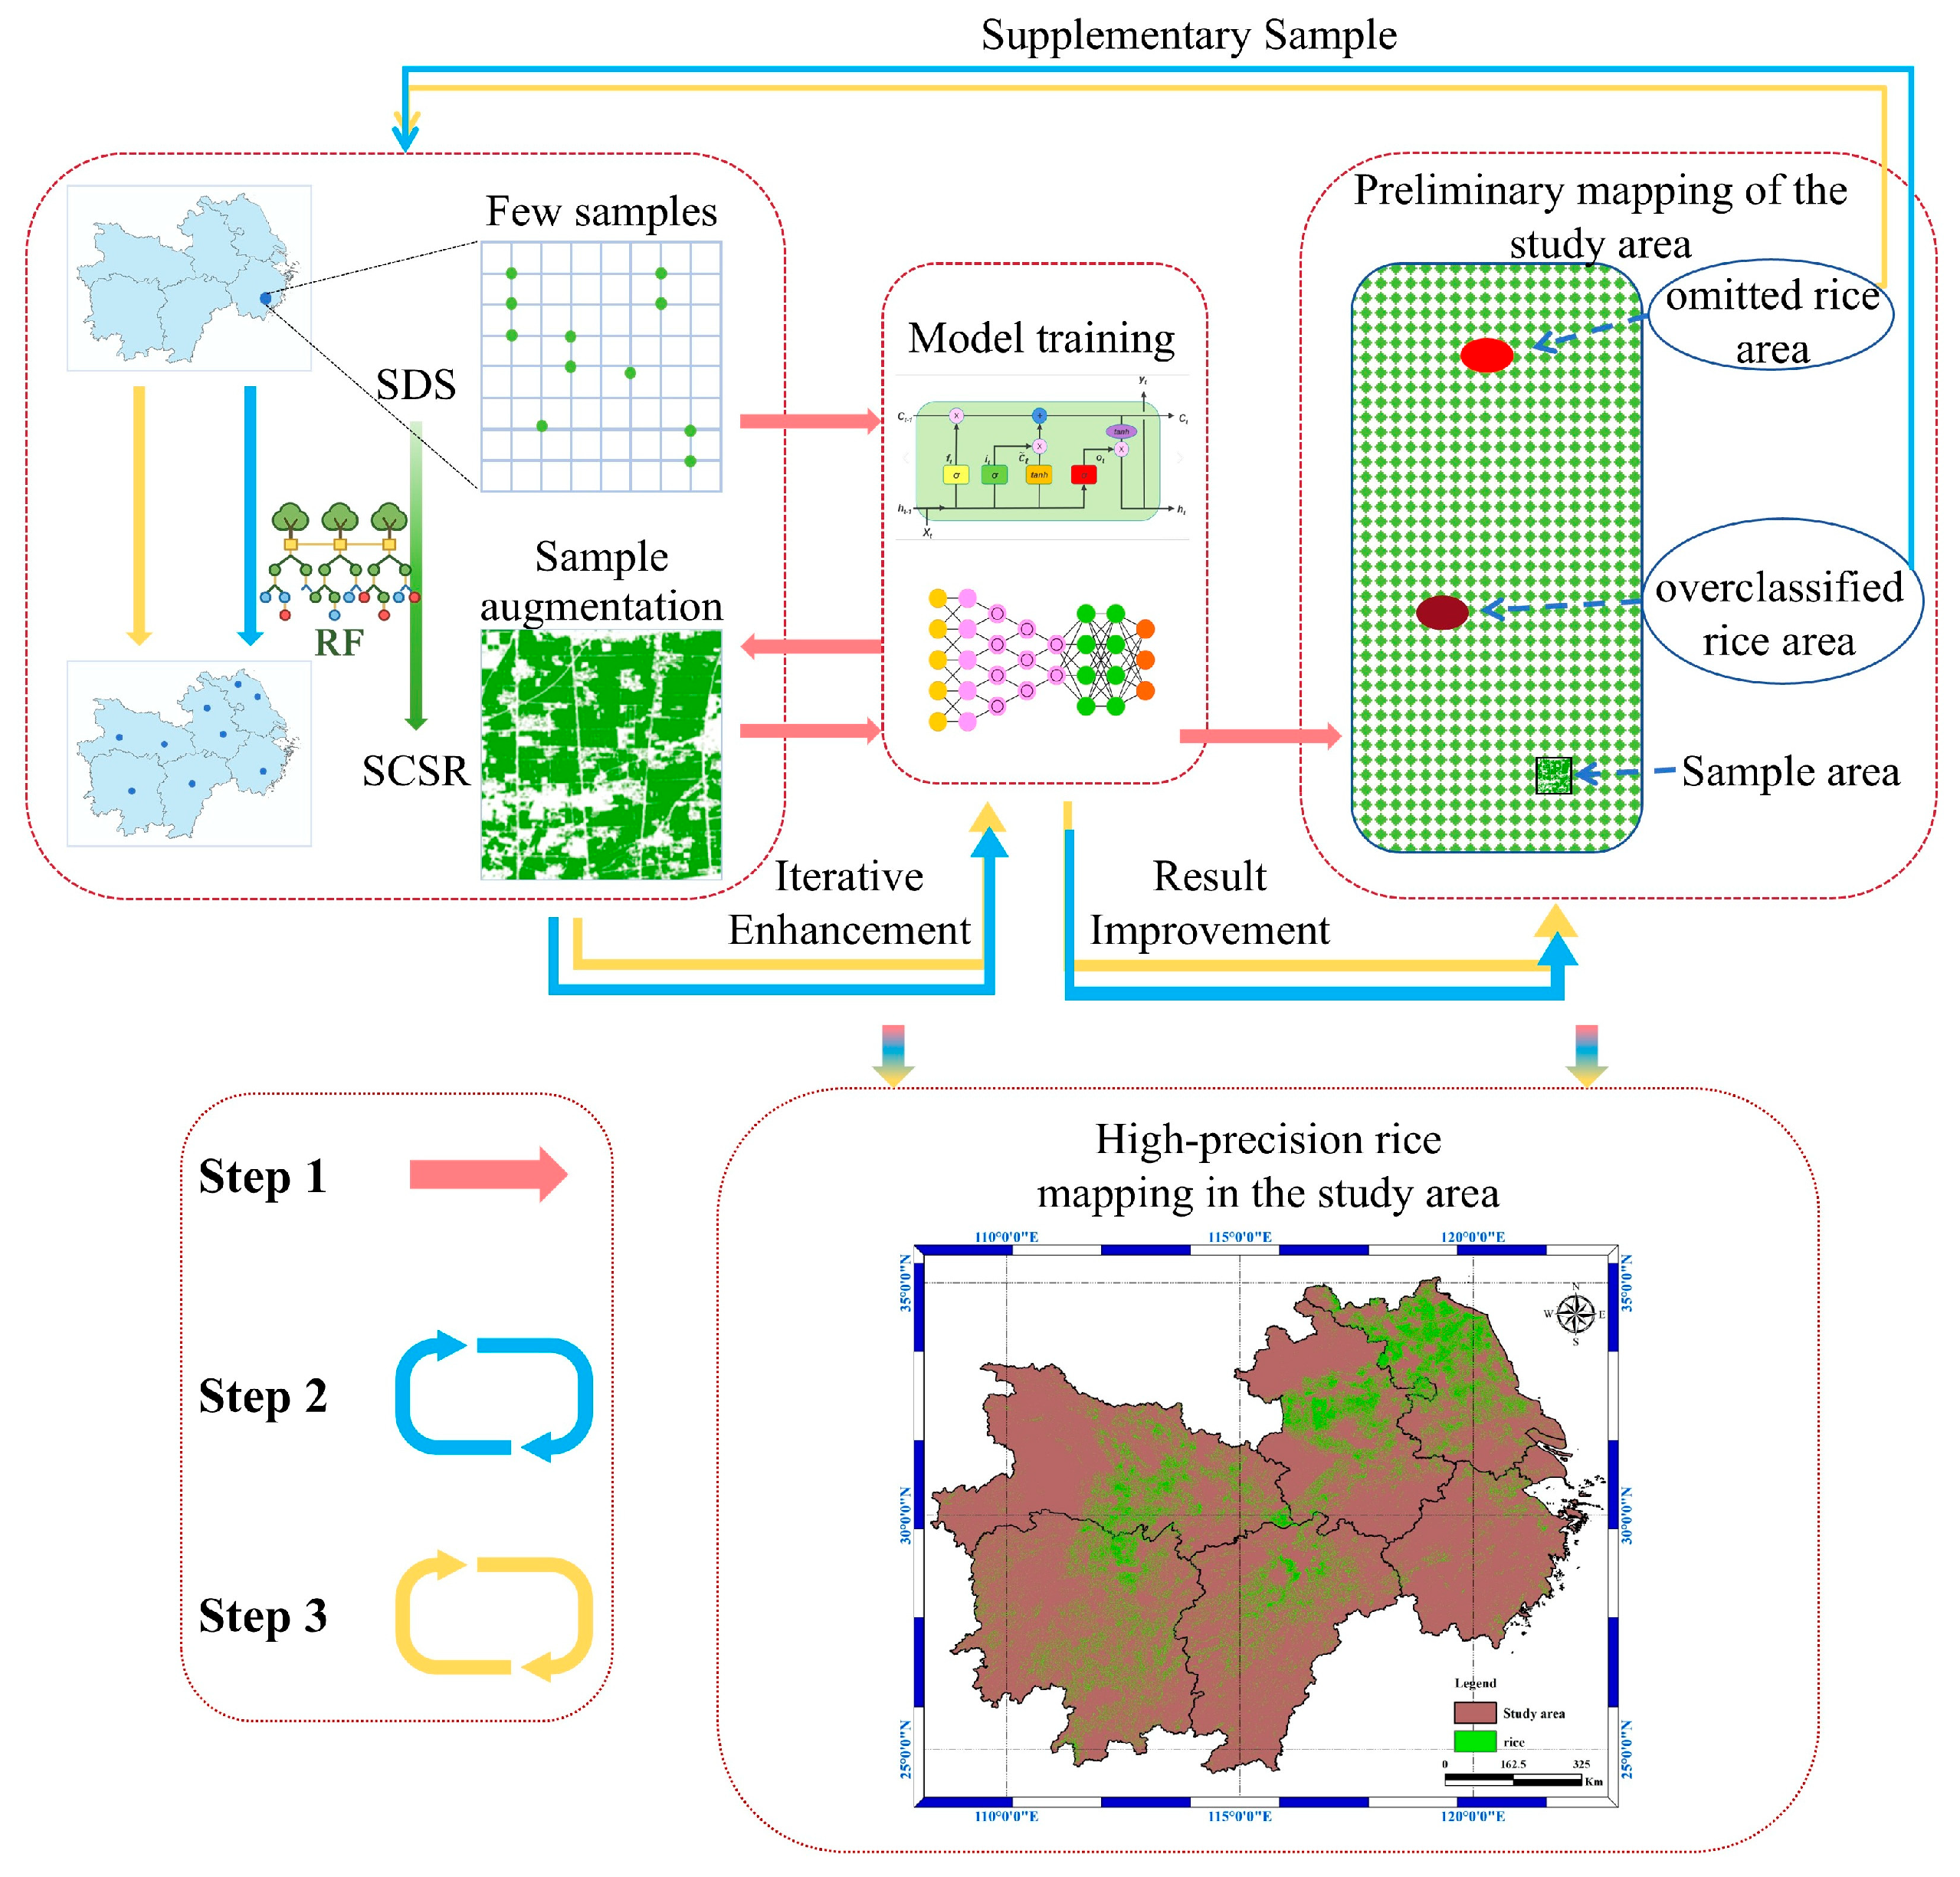
Progressive Deep Learning for Large-Scale Crop Mapping (PDLCM) is an iterative learning framework designed to improve large-scale crop classification under limited and heterogeneous training data conditions. Conventional large-scale crop mapping methods typically rely on a large number of uniformly distributed, high-quality samples, which are often redundant, difficult to collect, and costly to maintain, especially across large regions and multiple years. To address these limitations, PDLCM adopts a progressive learning strategy that starts from a small set of high-precision reference samples and gradually expands the training data through iterative refinement.
In PDLCM, an initial model is first trained using a limited number of representative samples. The model is then progressively enhanced by identifying misclassified or hard samples from large-scale predictions and incorporating them into subsequent training cycles. Through this iterative process, the model incrementally improves its discriminative capability while reducing dependence on extensive manually labeled samples, leading to more efficient and accurate large-scale crop mapping. The overall PDLCM workflow is illustrated in Figure 7.
Figure 7.
The process diagram of the PDLCM method (SDS: Spatial Discrete Samples; SCSR: Spatial Continuous Sample Regions).
- Step 1: Spatial Discrete Samples Expansion (SDSE) and Initial Model Training
A representative sub-region with sufficient reference information was first selected as the initial training area (as described in Section 4.1). Within this area, spatial discrete samples (SDS) were manually collected based on expert knowledge and visual interpretation. These samples were labeled into two primary categories: rice and non-rice. Rice samples included both single-season rice and double-season rice, while non-rice samples covered a wide range of land-cover types such as built-up areas, water bodies, forests, hillslopes with different aspects, and other crops. To ensure representativeness, samples were evenly distributed across the study area, with particular emphasis on the diversity of non-rice samples.
To transform spatial discrete samples into spatial continuous sample regions (SCSR), a Random Forest classifier was employed as an intermediate sample expansion module. The Random Forest model was trained using the discrete samples and then applied to optical imagery to generate pixel-wise predictions over the training area, thereby producing an initial continuous reference map of rice and non-rice regions. The input features included both a multi-band composite integrating 14 spectral bands over the full rice-growing cycle and a multi-temporal dataset constructed from monthly mean composites of cloud-free Sentinel-2 images. These spatially continuous sample regions were subsequently used to train an initial semantic segmentation model, which was applied to generate the first large-scale classification map (Figure 7, Step 1).
- Step 2: Negative Samples Mining and Model Enhancement
Based on the initial classification results, regions exhibiting clear misclassification were identified. This identification process is semi-automated: areas with low-confidence predictions and spatial anomalies are first filtered automatically, after which expert verification is conducted using available high-resolution imagery. The corresponding samples from these regions were labeled as negative samples and incorporated into the training dataset. The segmentation model was then retrained using the augmented sample set to improve its classification performance (Figure 7, Step 2).
- Step 3: Continuous Sample Integration and Iterative Training
In addition to negative sample mining, regions showing significant misclassification or omission were further isolated from the classification outputs. Using the SDSE strategy introduced in Step 1, spatial discrete samples within these regions were again expanded into continuous sample regions via Random Forest–based prediction. The expanded samples were integrated into the training dataset, and the segmentation model was retrained accordingly to achieve further refinement (Figure 7, Step 3).
Steps 2 and 3 were iteratively repeated, with sample coverage gradually expanding from the initial training region to multiple distinct regions across the study area. The iterative process was terminated when the F1-score on the validation set stabilized at approximately 90% or when further sample augmentation resulted in negligible improvements in classification accuracy. Through this progressive learning process, a semantic segmentation model with strong generalization capability was ultimately obtained, enabling accurate and high-precision crop mapping over the entire large-scale region.
The SCSR-derived labels and the corresponding multi-source imagery were jointly tiled into fixed-size patches (128 × 128 pixels) to form the final training samples for the deep learning model.
3.2. Introduction of the SFDLM-MSD
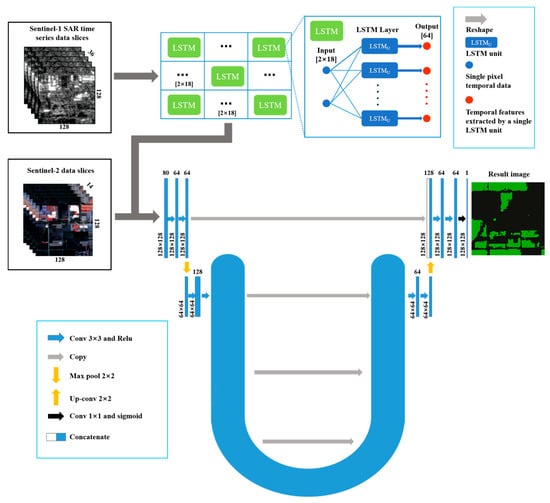
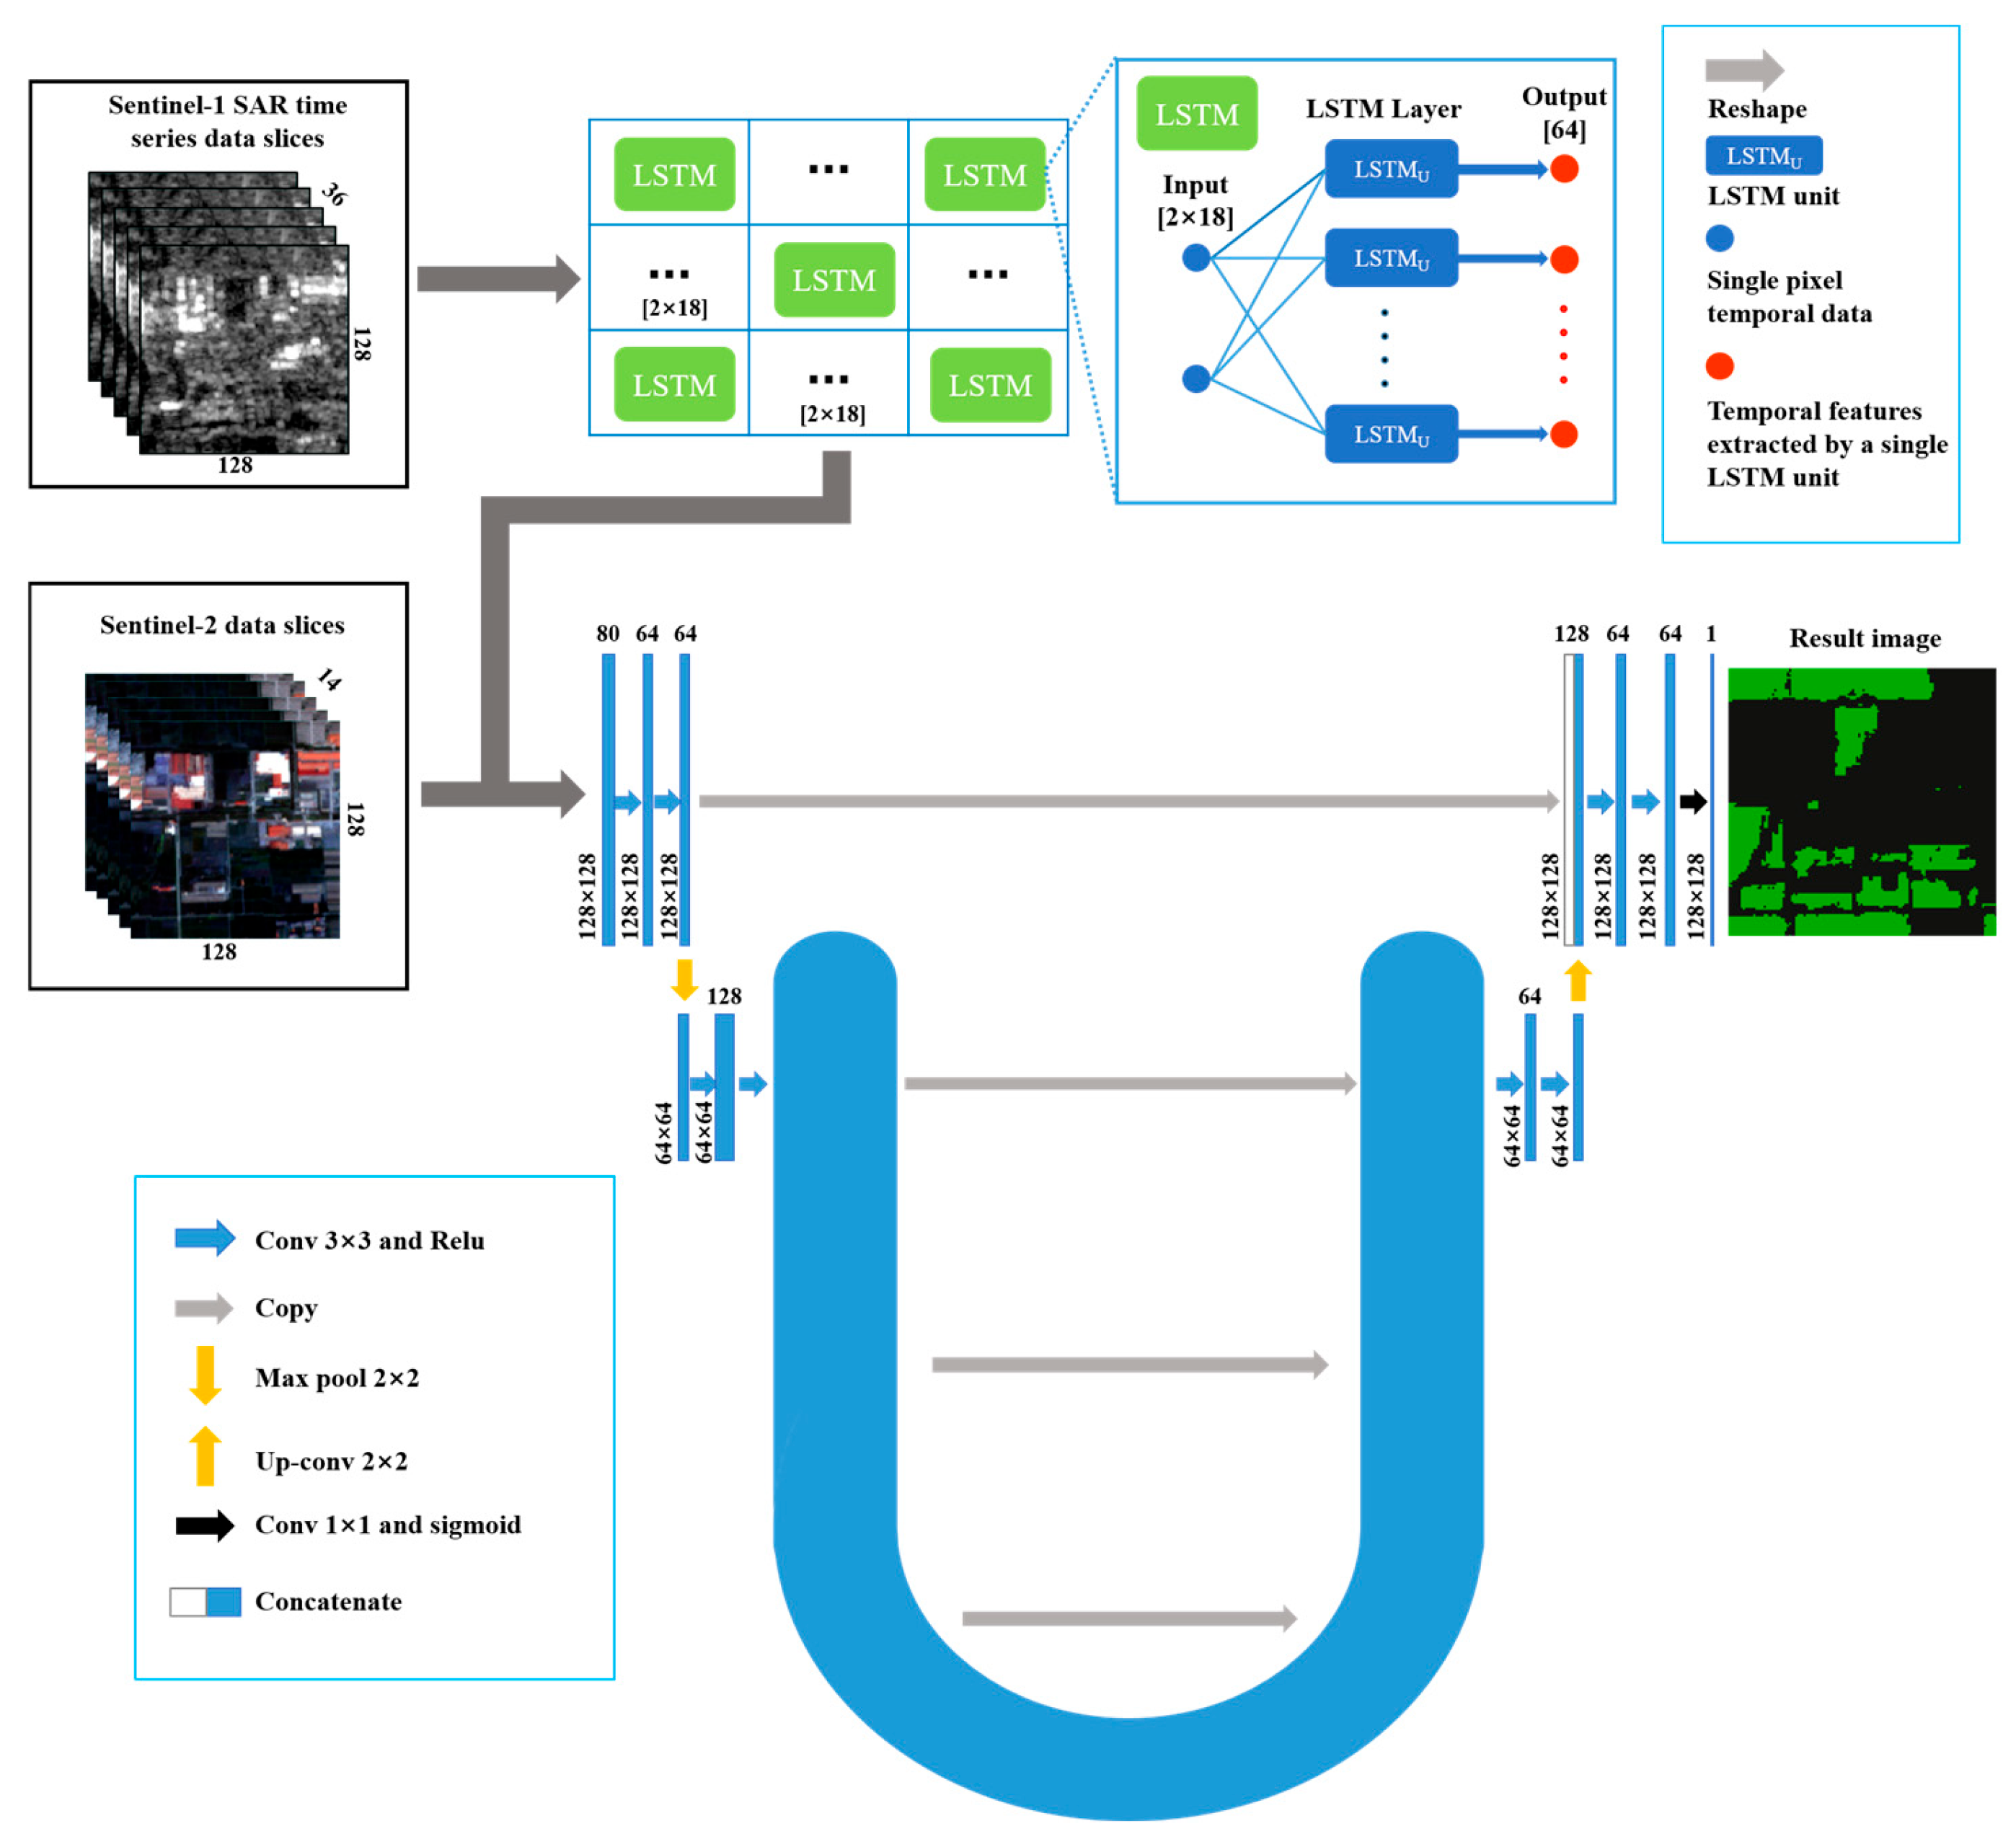
In research on rice area extraction based on deep learning methods, satellite imagery is commonly used as input data. While LSTM (Long Short-Term Memory) models can extract rich temporal features from time-series remote sensing images, they cannot handle the spatial characteristics of rice field distribution within the images. This study established the spatio-temporal Fusion Deep Learning Model Based on Multi-Source Data (SFDLM-MSD), which combined LSTM modules for extracting temporal features from SAR time-series imagery and U-Net modules for processing spatial information within the images, thus achieving rice area recognition and extraction. The specific structure of the model is as follows (Figure 8):
Figure 8.
Model structure diagram.
- (1)
- Input Layer
The study utilized Sentinel-1 and Sentinel-2 imagery as multi-source data. The input data for the model consisted of image tiles segmented from the SCSR-derived labels and corresponding multi-source composite images. These tiles had dimensions of [50 × 128 × 128], representing the number of bands, rows and columns of the tiles, respectively. Initially, the Sentinel-1 SAR time-series data n were processed using an LSTM module. Therefore, the image tiles were divided into optical and SAR parts, with the SAR time-series image tiles processed by the LSTM module.
- (2)
- Temporal Feature Extraction Layer
The LSTM layer consisted of a 128 × 128 LSTM model matrix and a reshape layer. Each LSTM model in the model matrix extracted temporal features (dimension: [2 × 18]) corresponding to the pixels at the input tile positions. All LSTM models in the matrix shared a uniform structure and parameters (weights and biases). Each LSTM model contained 64 LSTM units, generating 64 temporal features per model. Using the reshape layer, the 64 temporal features were combined into a temporal feature image with dimensions of [64 × 128 × 128], which was used for subsequent semantic segmentation.
- (3)
- Semantic Segmentation Layer
This section employed a complete U-Net architecture, consisting of both the Downsampling and Upsampling parts. On the left side was the Downsampling process, which gradually reduced the size and number of channels of the feature maps through multiple convolution and pooling operations. This helped in extracting high-level semantic information from the images, increasing the receptive field, and enabling the network to learn more global and abstract features. On the right side was the Upsampling process, which utilized skip connections and concatenation operations to gradually integrate deep spatial semantic information with precise spatial positions and boundary information, ultimately obtaining feature maps that fused different scale spatial positions and semantic information.
The input data for this module were the temporal feature images extracted by the LSTM module and the optical image tiles. Through the Upsampling and Downsampling processes, along with skip connections, the module output feature maps with dimensions of [64 × 128 × 128].
- (4)
- Output Layer
The output layer consisted of a 1 × 1 convolutional layer, which was used to reduce the number of channels in the model’s feature maps to 1. In other words, the final output of the model had a single channel, which corresponded to the model’s prediction result.
3.3. Accuracy Evaluation Index
This study used recall, precision, F1 score and Cohen’s kappa coefficient, as four precision indicators to evaluate the model performance (refer to Section 2.3 for a description of the validation samples). Calculated as follows:
Among these, is the total number of pixels in category i that are correctly classified; is the total number of pixels in category i in the classified image, is the total number of pixels in category i in the reference true value, and is the probability of correct prediction, is the probability that the prediction is correct by chance. The calculation formulas of and are as follows (N is the total number of pixels):
In addition, we compared with statistical yearbooks and used the kernel density function and Moran’s Index to analyze the distribution of rice cultivation in the study area.
3.4. Model Transferability Analysis
To analyze the model’s transferability, this study conducted both spatial and temporal transferability validation. In the spatial transfer test, the model was first trained on a specific region (e.g., the Taizhou sample area) and then on different geographical regions (e.g., Jiangsu, Zhejiang) for testing, analyzing the model’s performance across different regions. In the temporal transfer test, the model was used for rice classification across different years (e.g., 2019–2021) to examine its stability and accuracy across years. Based on these tests, we also analyzed the factors influencing the model’s transferability.
4. Results
Given the large spatial extent of the study area, this section first introduces the methodology, sample preparation, and analysis results using the Jiangsu, Zhejiang, and Shanghai (JZS) region as a representative example. As a north–south transect, the JZS area reflects major variations in terrain, climate, and cropping systems. The subsequent sections present large-scale rice mapping results for all six provinces and one municipality from 2022 to 2024.
4.1. Implementation and Results of PDLCM
The Progressive Deep Learning Crop Mapping (PDLCM) framework was used to produce large-scale rice maps across the study area. The JZS region was selected to illustrate the key procedures of sample construction and model training, which are essential for achieving high-precision mapping over broad and diverse landscapes.
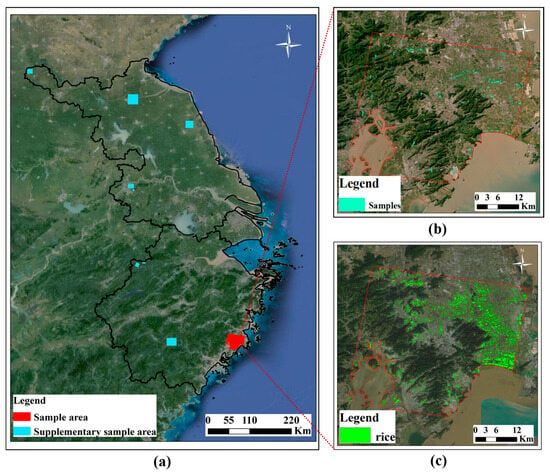
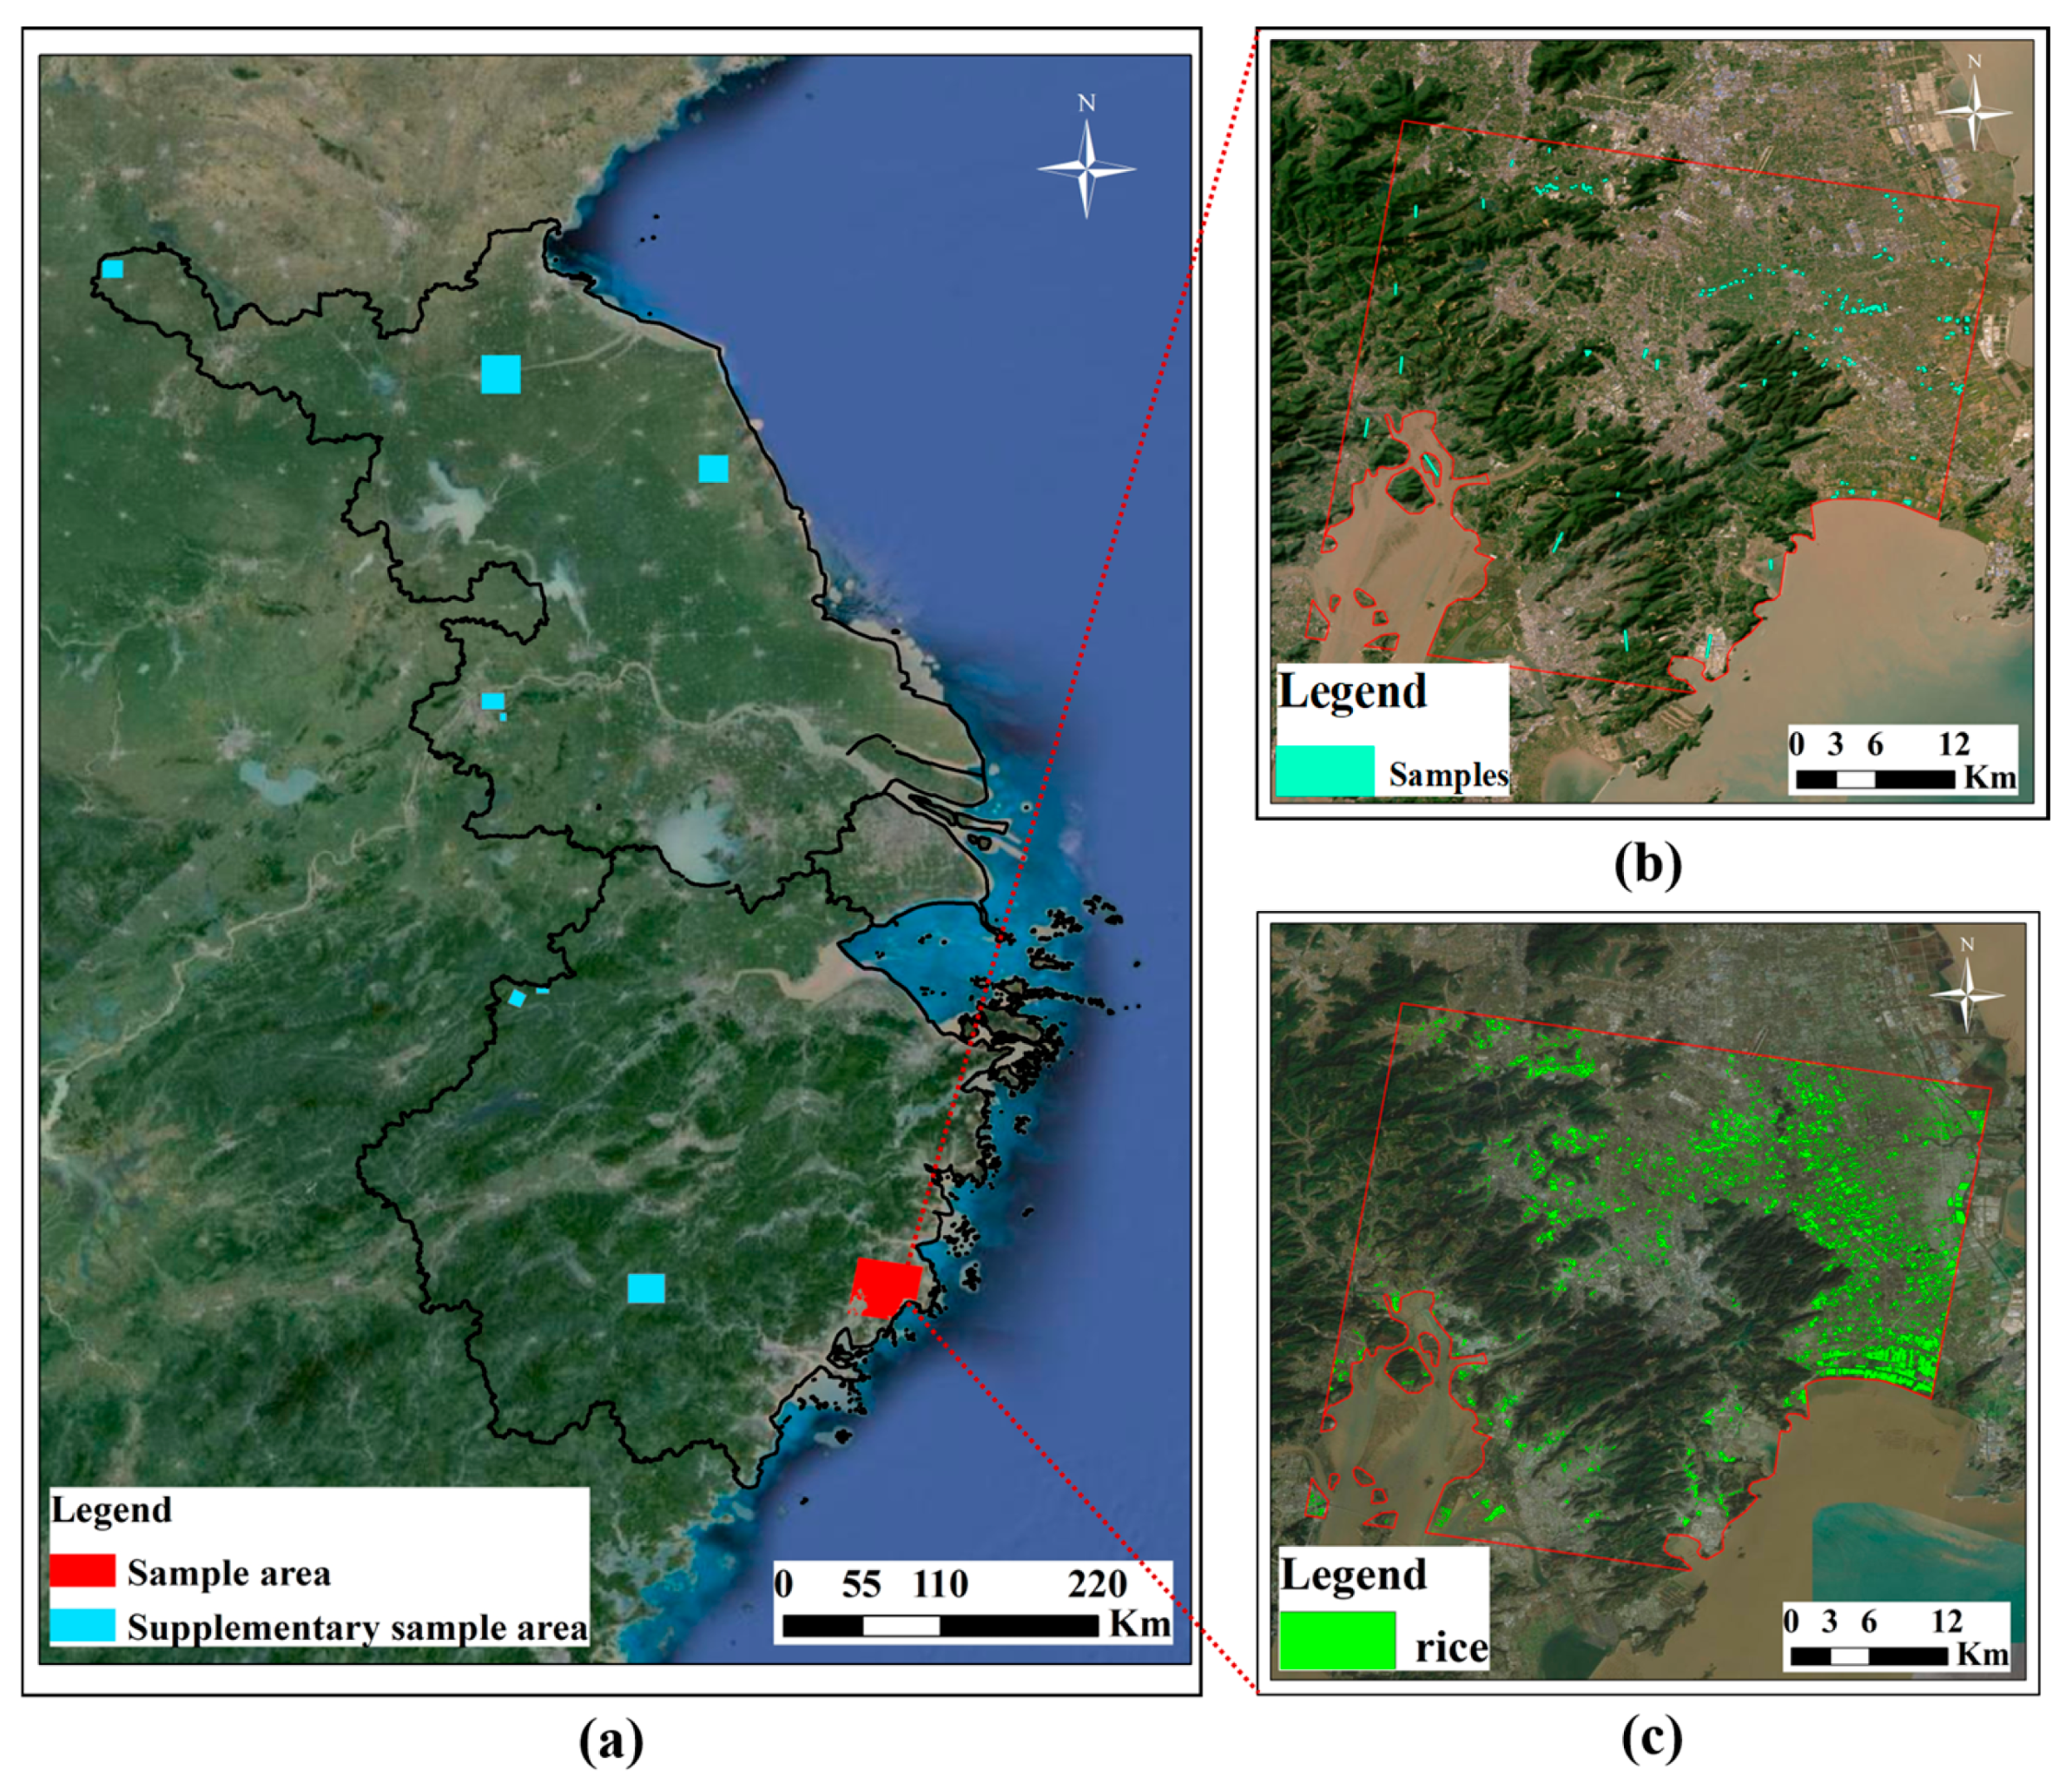
The initial training area was located in the southern part of Taizhou City (Figure 9) and covered about 40 km on each side. This plain region has a subtropical monsoon climate influenced by the nearby ocean, with warm, humid conditions and abundant rainfall. Both single- and double-season rice are cultivated, together with other crops. The diversity of cropping patterns and land use in this area provided sufficient rice and non-rice samples, enabling the model to learn representative spectral and temporal characteristics and to achieve reliable initial classification performance.
Figure 9.
Sample Augmentation Process: (a) Geographical Locations of All Sample Areas; (b) Sample Selection; (c) Random Forest Expansion Results in Initial Sample Areas.
After defining the initial sample area, visual interpretation and field surveys were used to collect representative training samples. These included rice samples from both single- and double-season fields, as well as non-rice samples such as buildings, water bodies, forests, and other crops. A balanced selection ensured that the dataset captured the spectral diversity of major land cover types. The discrete samples, together with preprocessed multi-source images, were used to train a random forest classifier for sample expansion, producing a continuous high-resolution reference map of rice distribution. This map provided the foundation for deep learning model training and iterative optimization.
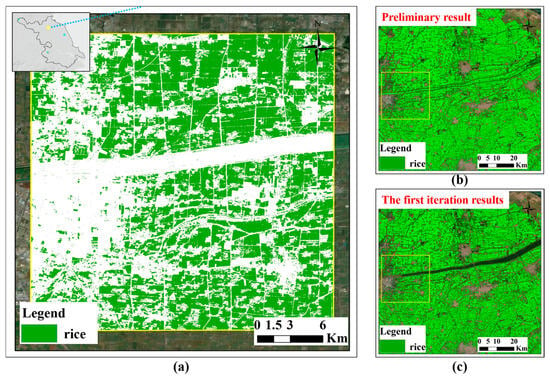
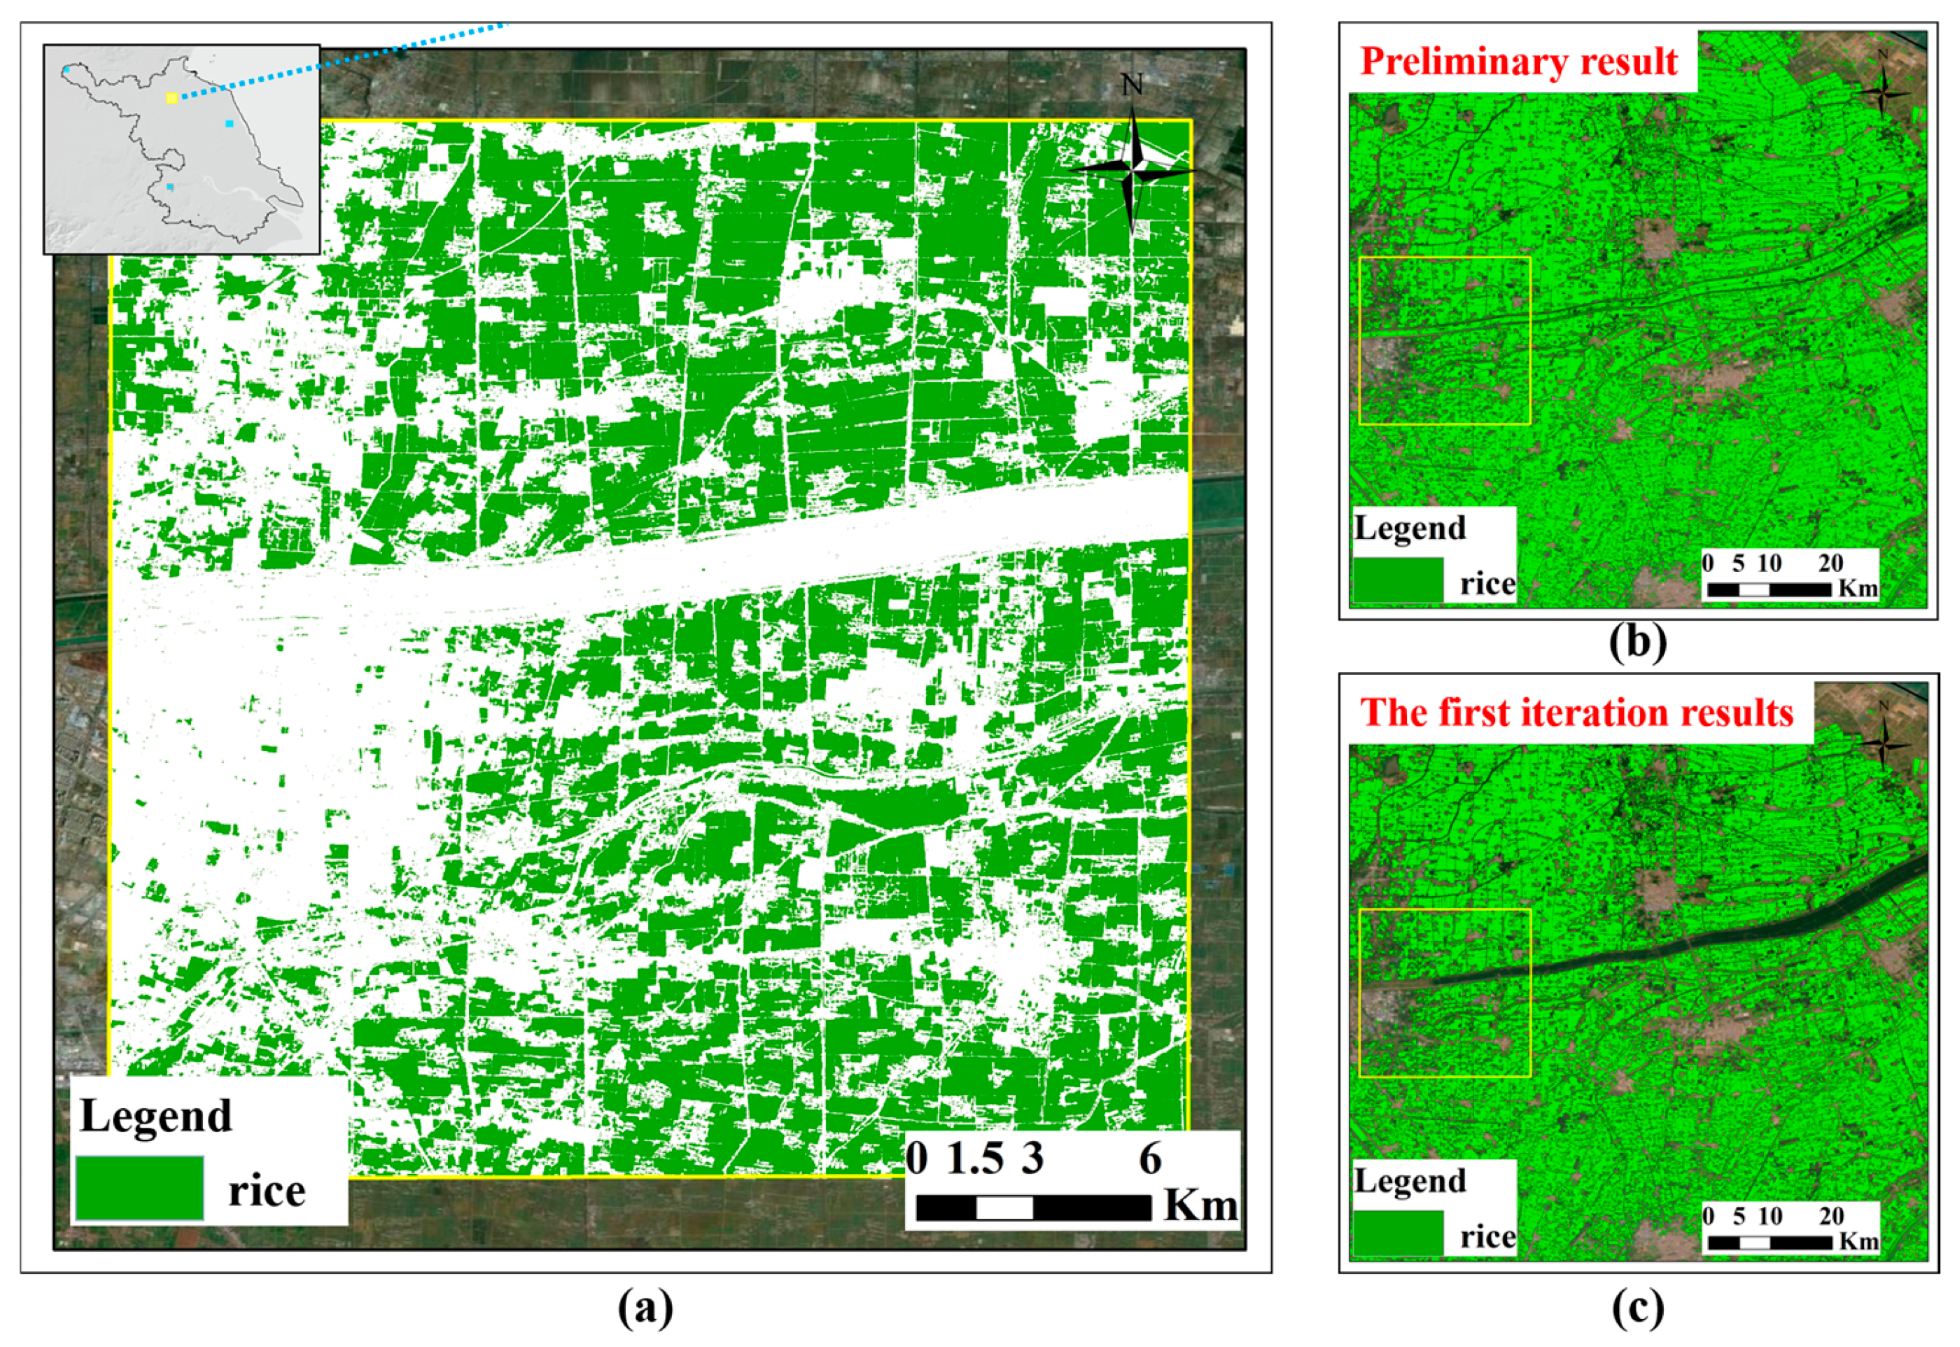
Using the high-quality label dataset and time-series imagery, a deep learning model was trained to generate preliminary rice classification for the JZS region. Because the initial samples represented only part of the regional variability, areas with significant misclassification were identified and used to create supplementary sample sets. These additional samples were incorporated into the training process to improve model performance and reduce regional errors. Figure 10 illustrates the first iteration, where the model successfully corrected major misclassifications in the Xinyi River area, confirming the effectiveness of the sample enhancement strategy.
Figure 10.
The geographical location and label results of the first supplementary sample area (a), along with the comparison of results (b) before and after the first iteration (c).
Subsequent iterations followed the same approach, adding new supplementary samples from uncorrected regions to further refine the model. Through progressive enhancement and retraining, the model gradually achieved stable generalization and produced a high-resolution, high-accuracy rice distribution map across the entire JZS region.
4.2. Rice Planting Distribution Results of JZS Region
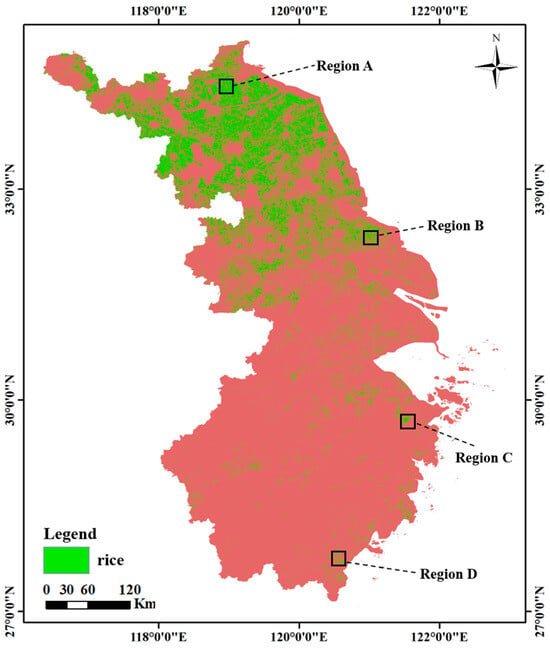
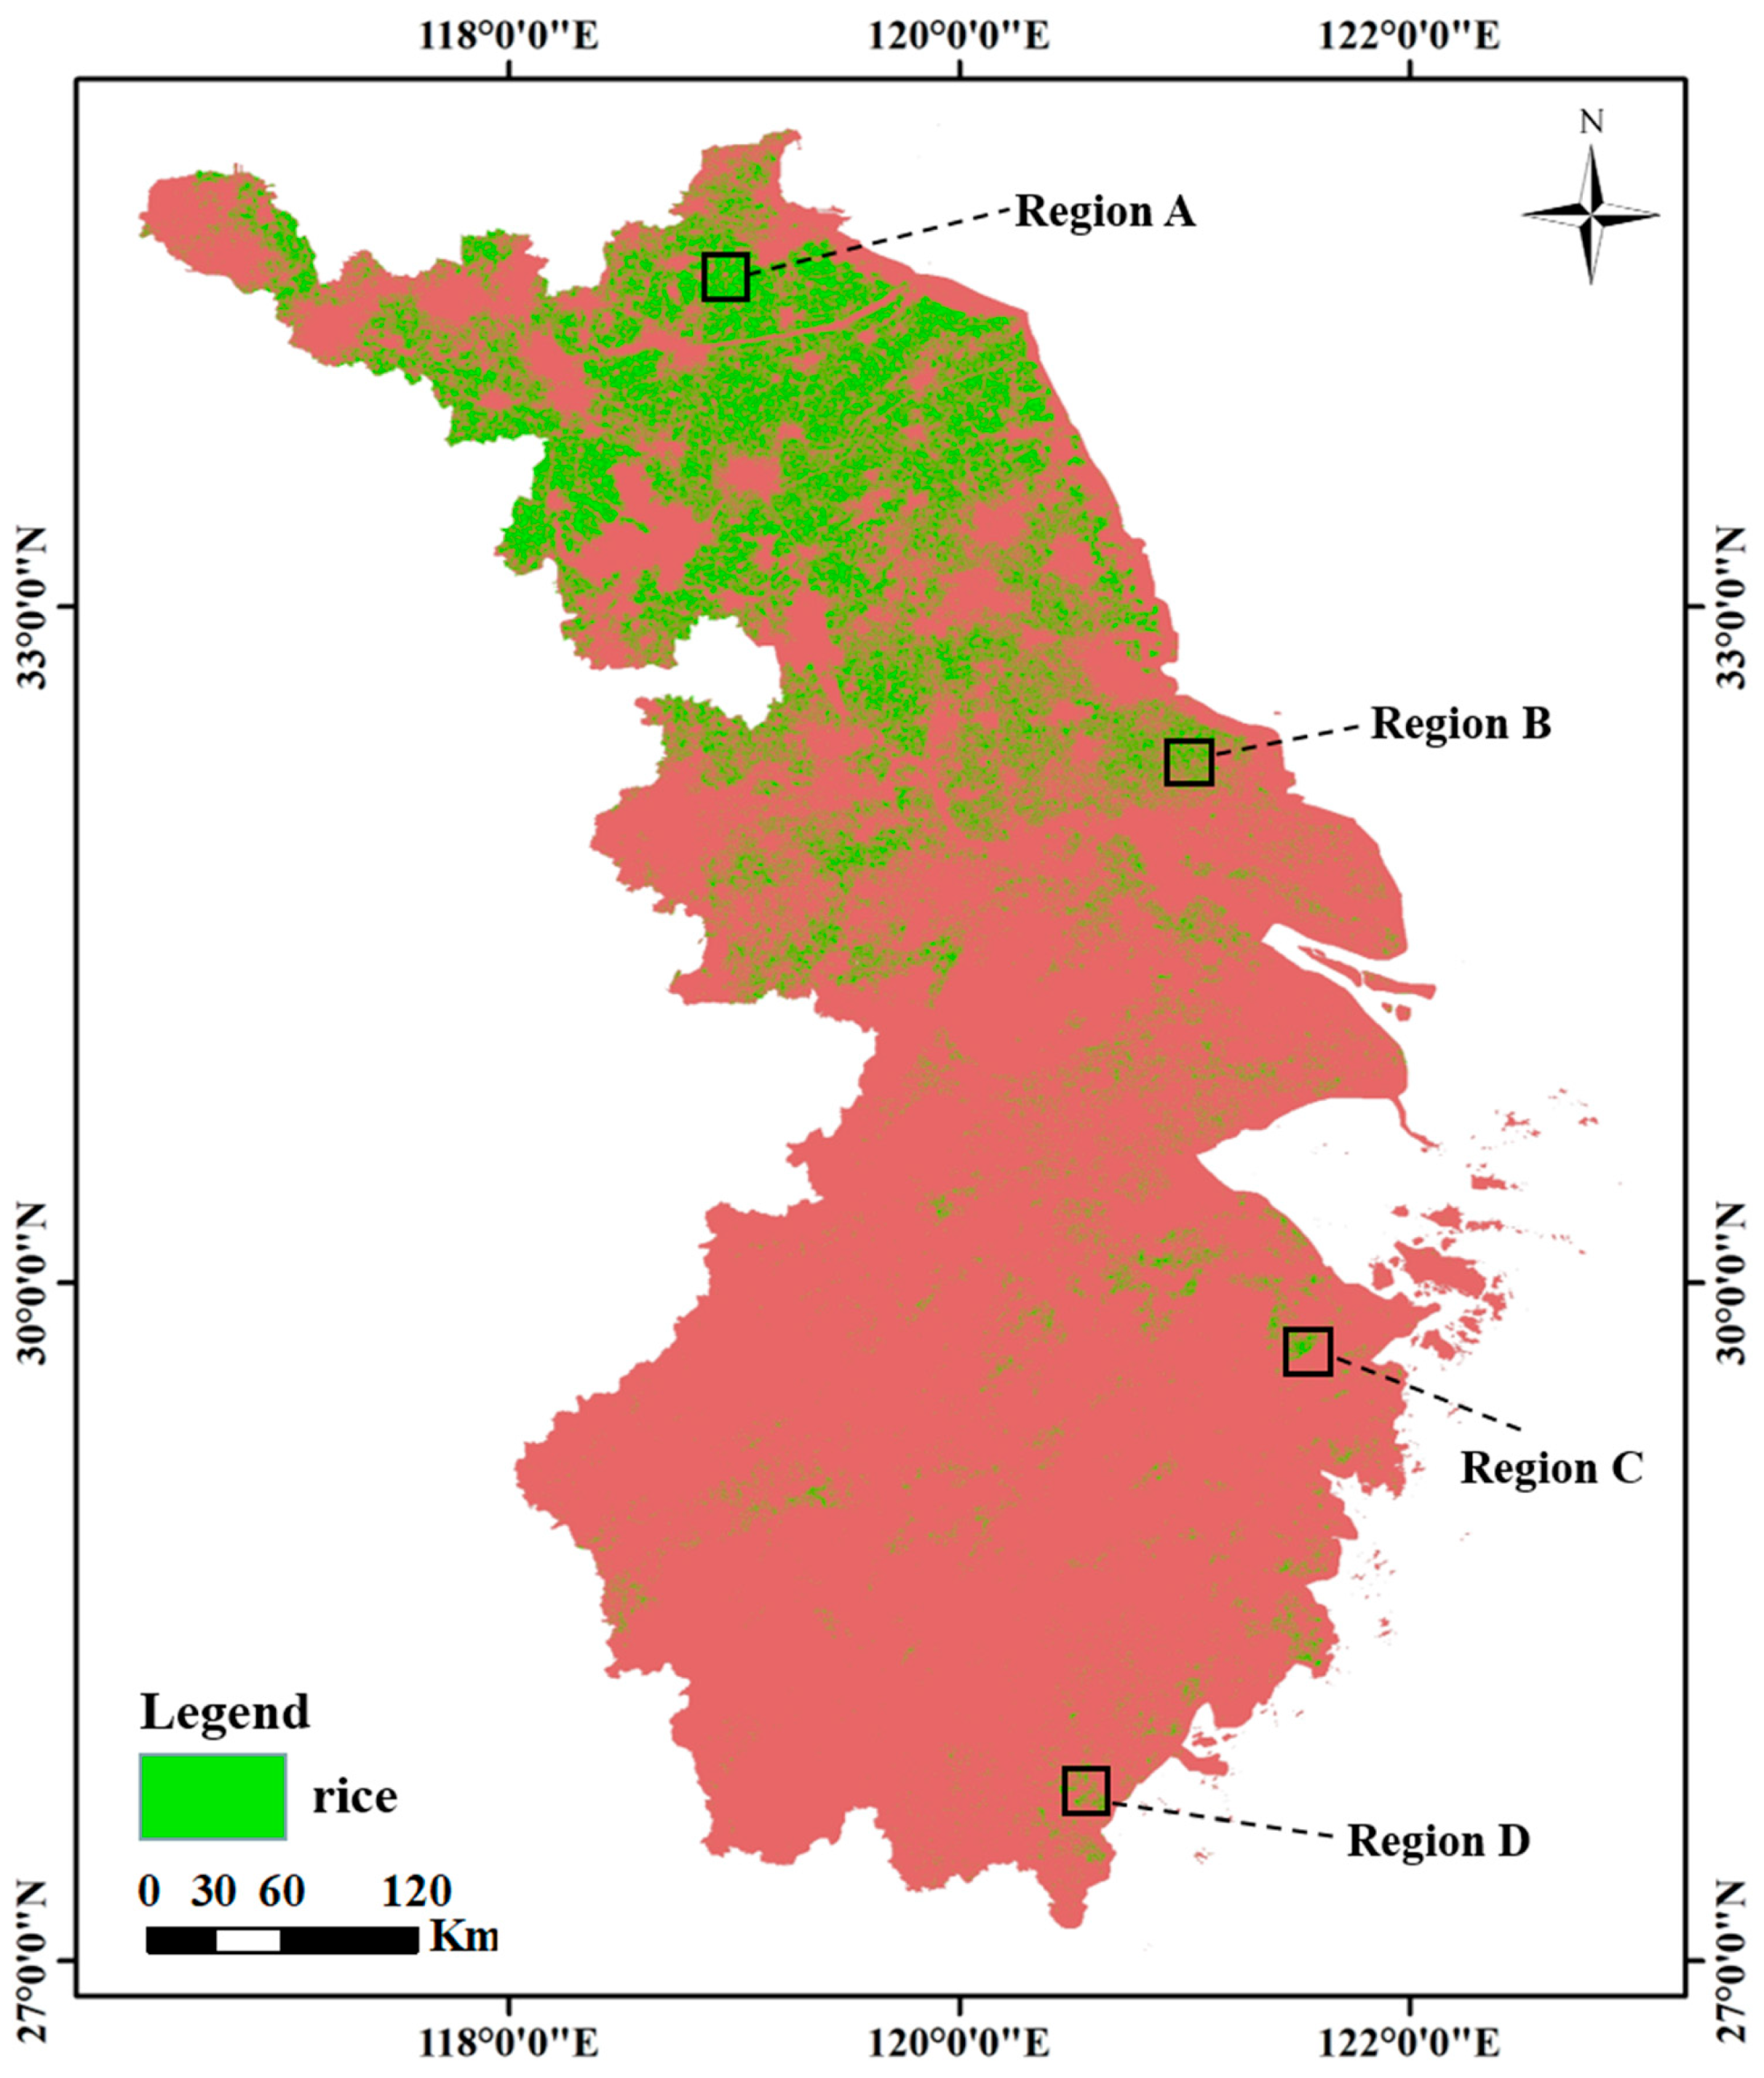
Using the 2022 image dataset and the trained deep learning model, rice cultivation in the Jiangsu, Zhejiang, and Shanghai (JZS) region was mapped at 10 m resolution (Figure 11). To evaluate the model’s performance, four representative subregions with distinct environments were analyzed. Region A, in the northern Huai River Basin (Lianyungang, Jiangsu), is dominated by single-season rice under a temperate monsoon climate. Region B, located in the Jianghai Plain (Nantong, Jiangsu), features dense river networks and extensive single-season paddies. Region C, the Ningbo–Shaoxing Plain in northern Zhejiang, supports both single- and double-season rice, while Region D, in southern Zhejiang (Wenzhou), has more complex terrain and scattered fields. These subregions capture the main climatic and topographic diversity of the JZS area.
Figure 11.
Rice Mapping Results for the JZS region in 2022.
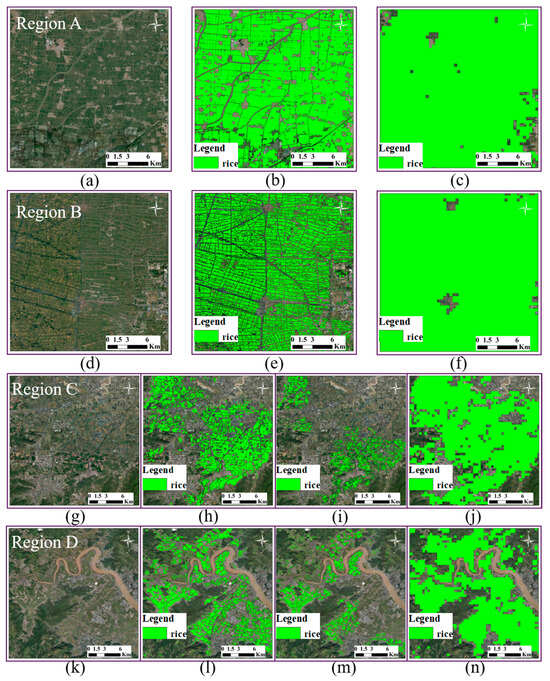
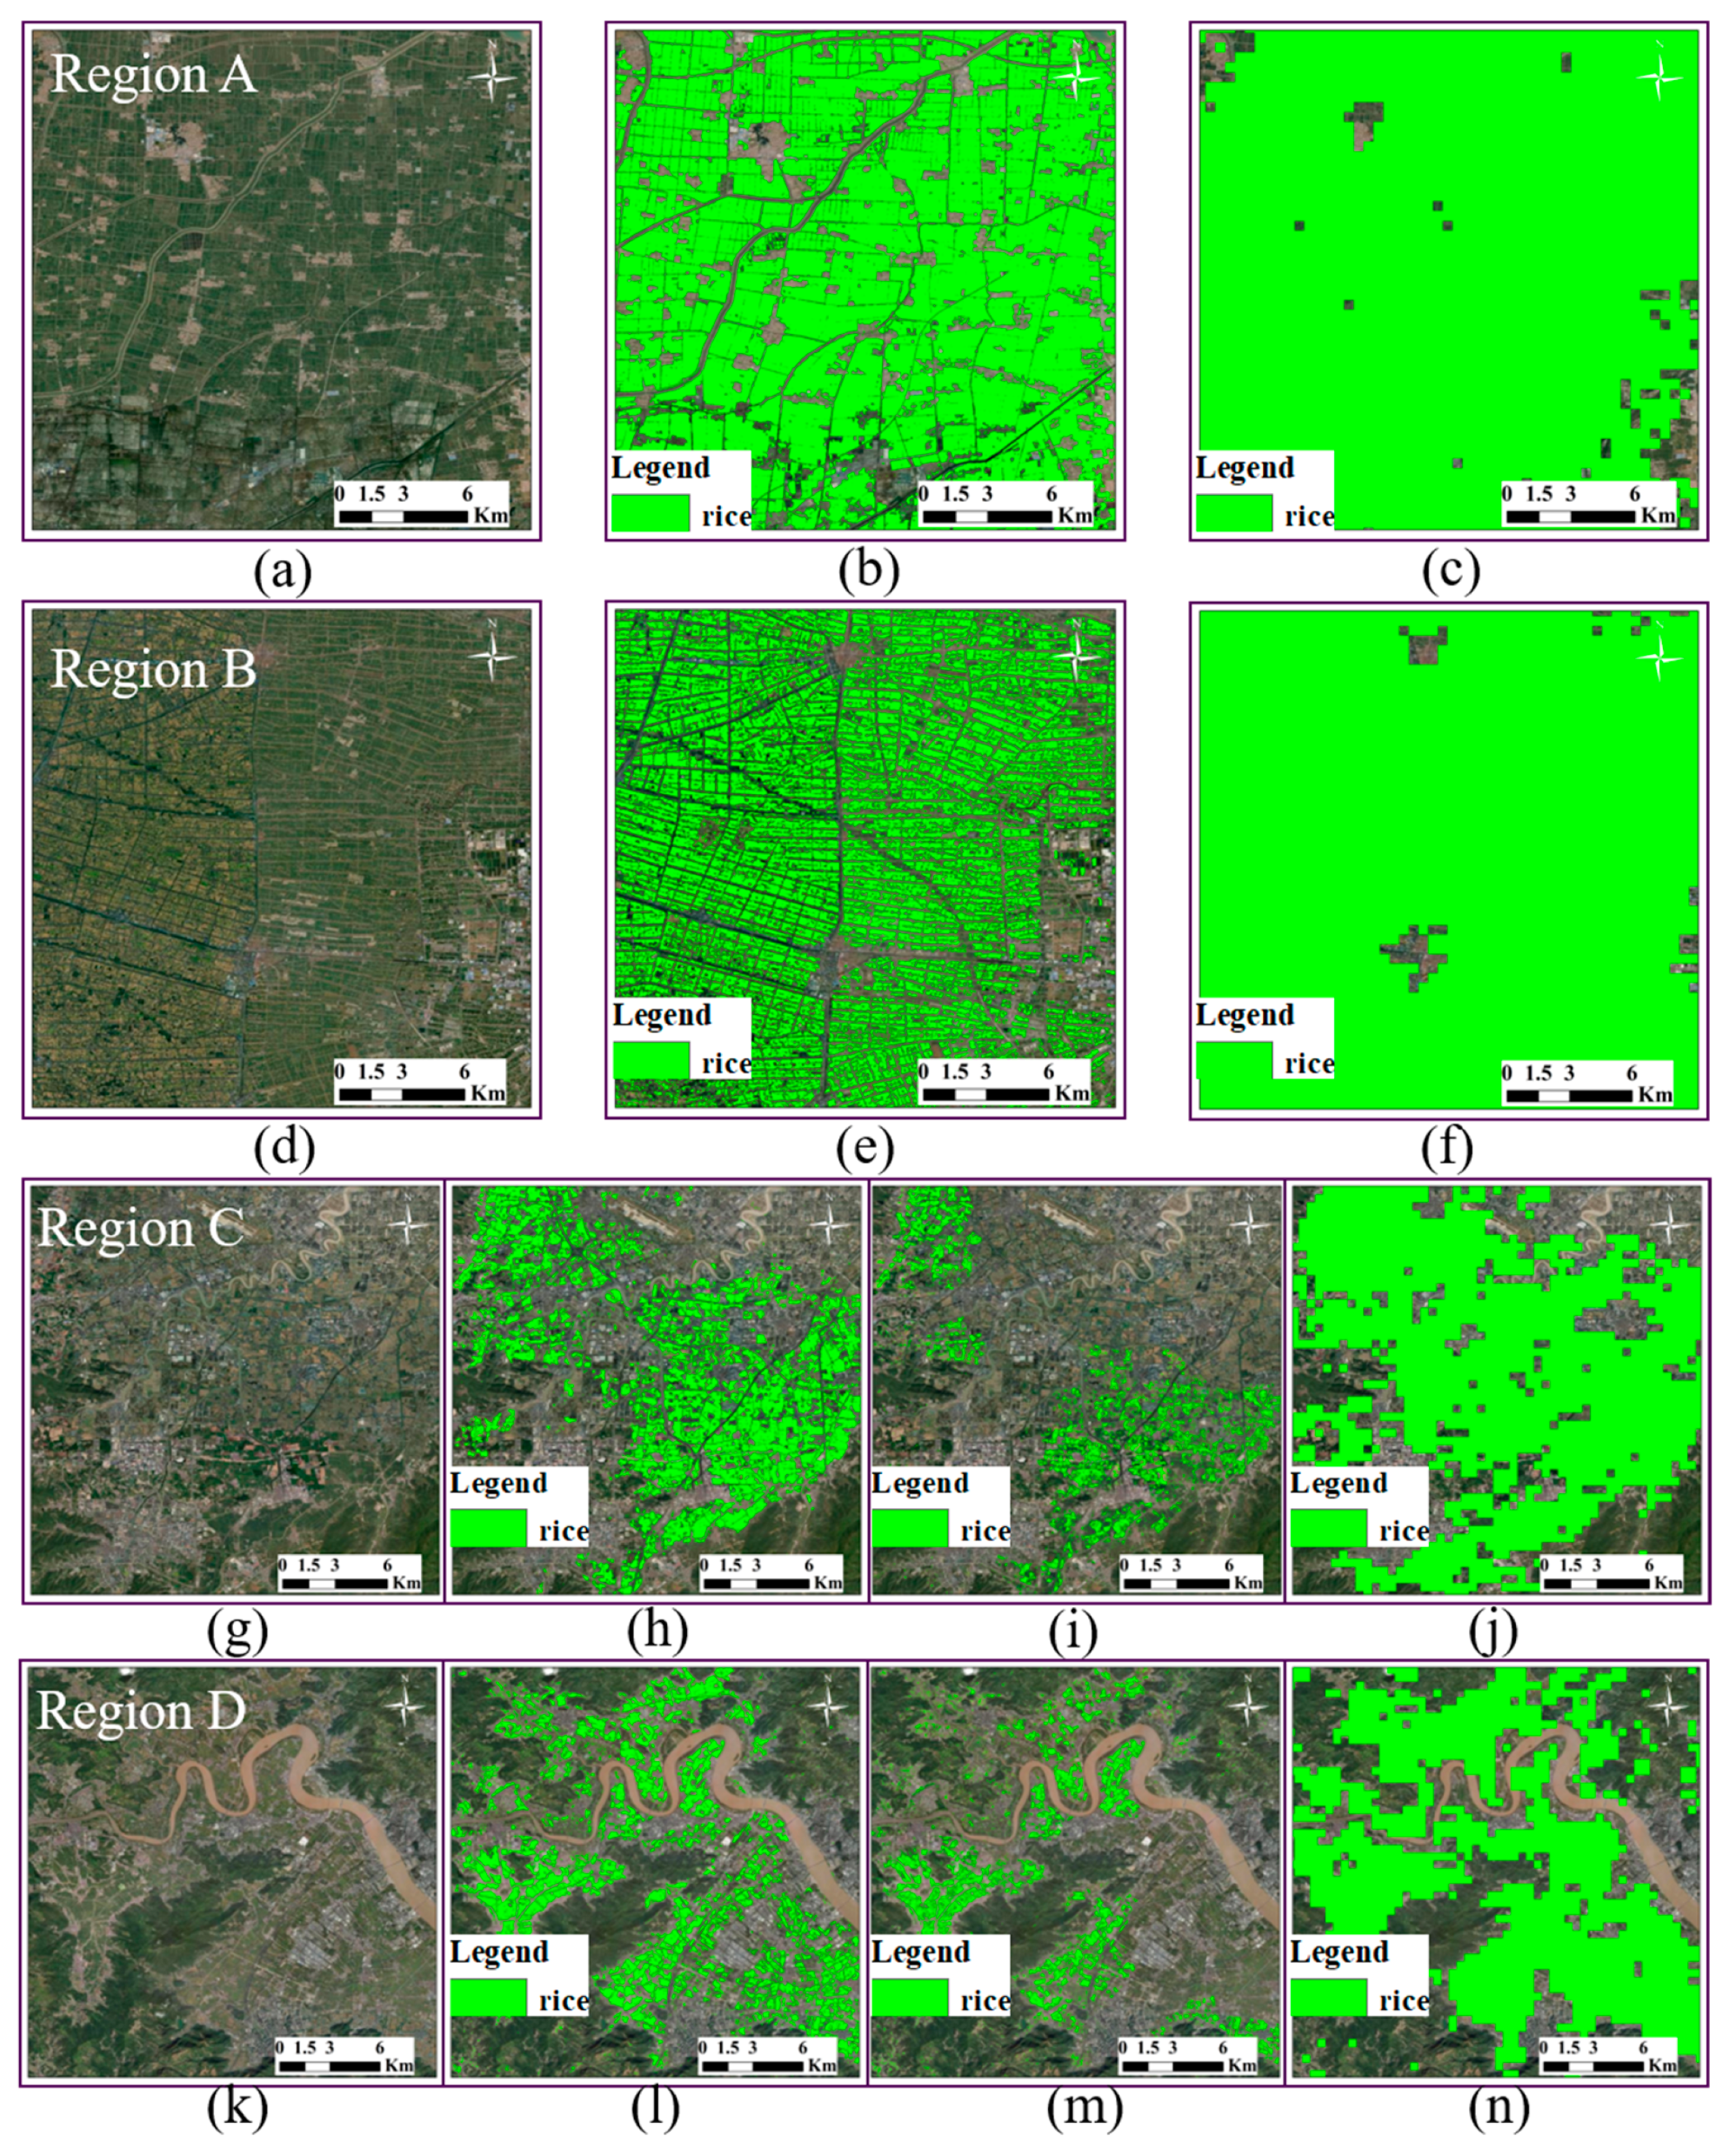
Comparison with existing rice products (Figure 12) shows that the proposed model effectively delineated most rice fields and maintained strong spatial consistency with multi-scale reference maps, such as Nelson and Gumma (2024) [35] and Pan et al. (2021) [33]. The higher spatial detail of this study’s results improved the recognition of fragmented and smallholder rice fields, especially in complex landscapes.
Figure 12.
Comparison of Rice Mapping Results in Regions A, B, C, and D. The first two rows show the (a,d) map images, (b,e) mapping results from this study, and (c,f) 500 m rice mapping results [35] for regions A and B, respectively. The last two rows display the (g,k) map images, (h,l) mapping results from this study, (i,m) 10 m double-cropping rice distribution results [33], and (j,n) 500 m rice mapping results [35] for regions C and D.
Accuracy validation based on random sampling was conducted for the overall region and for individual provinces (Table 1). The results show that the overall accuracy for the entire JZS region reached 97.54%, with an F1-score of 92.22%, a Kappa coefficient of 90.76%, a precision of 96.31%, and a recall of 88.46%. The overall accuracy for Jiangsu and for Zhejiang–Shanghai exceeded 96%, with F1-scores above 94%. These results confirm that the model achieved stable and reliable classification performance across areas with varied climatic and cropping conditions, though minor omission errors remain in regions with fragmented double-cropping patterns.
Table 1.
Accuracy Validation Confusion Matrix for Rice Mapping in the JZS region.
4.3. Spatial Transferability Performance of the Model
To evaluate the spatial generalization ability of the model, the study applied the SFDLM-MSD architecture within the PDLCM framework using a model trained only on samples from the Taizhou area. This preliminary model was then used to predict rice distribution across the entire JZS region.
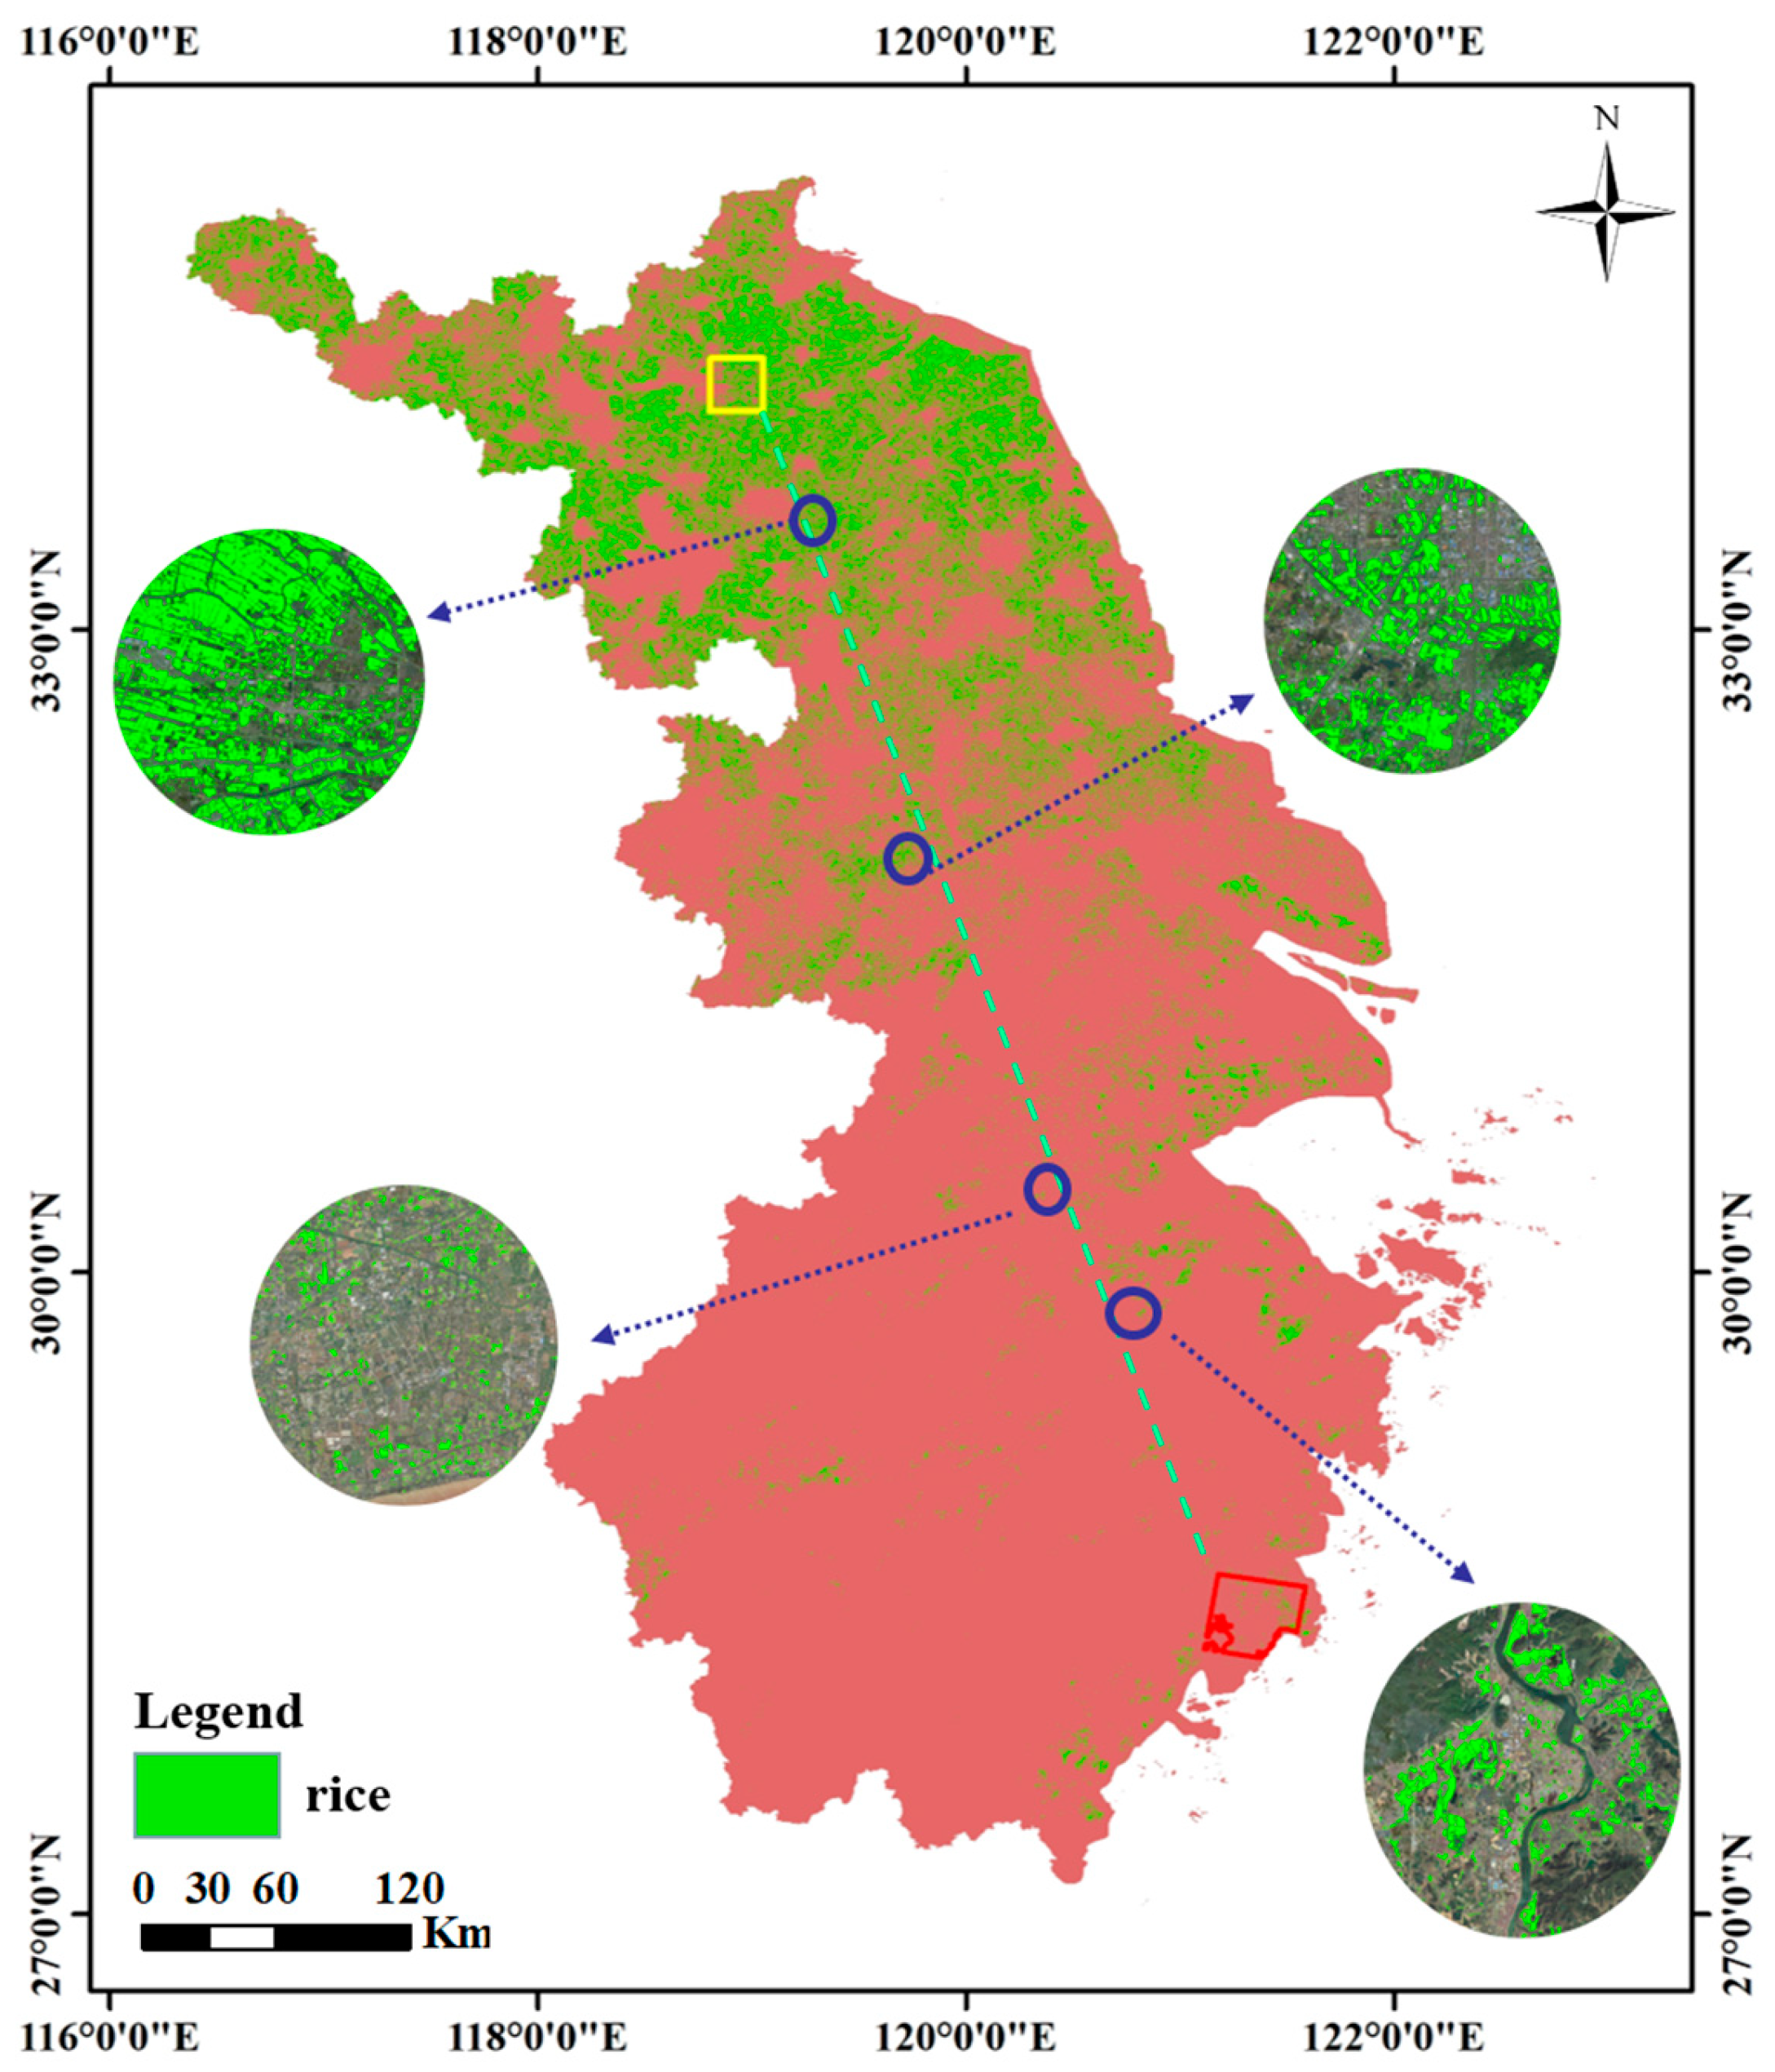
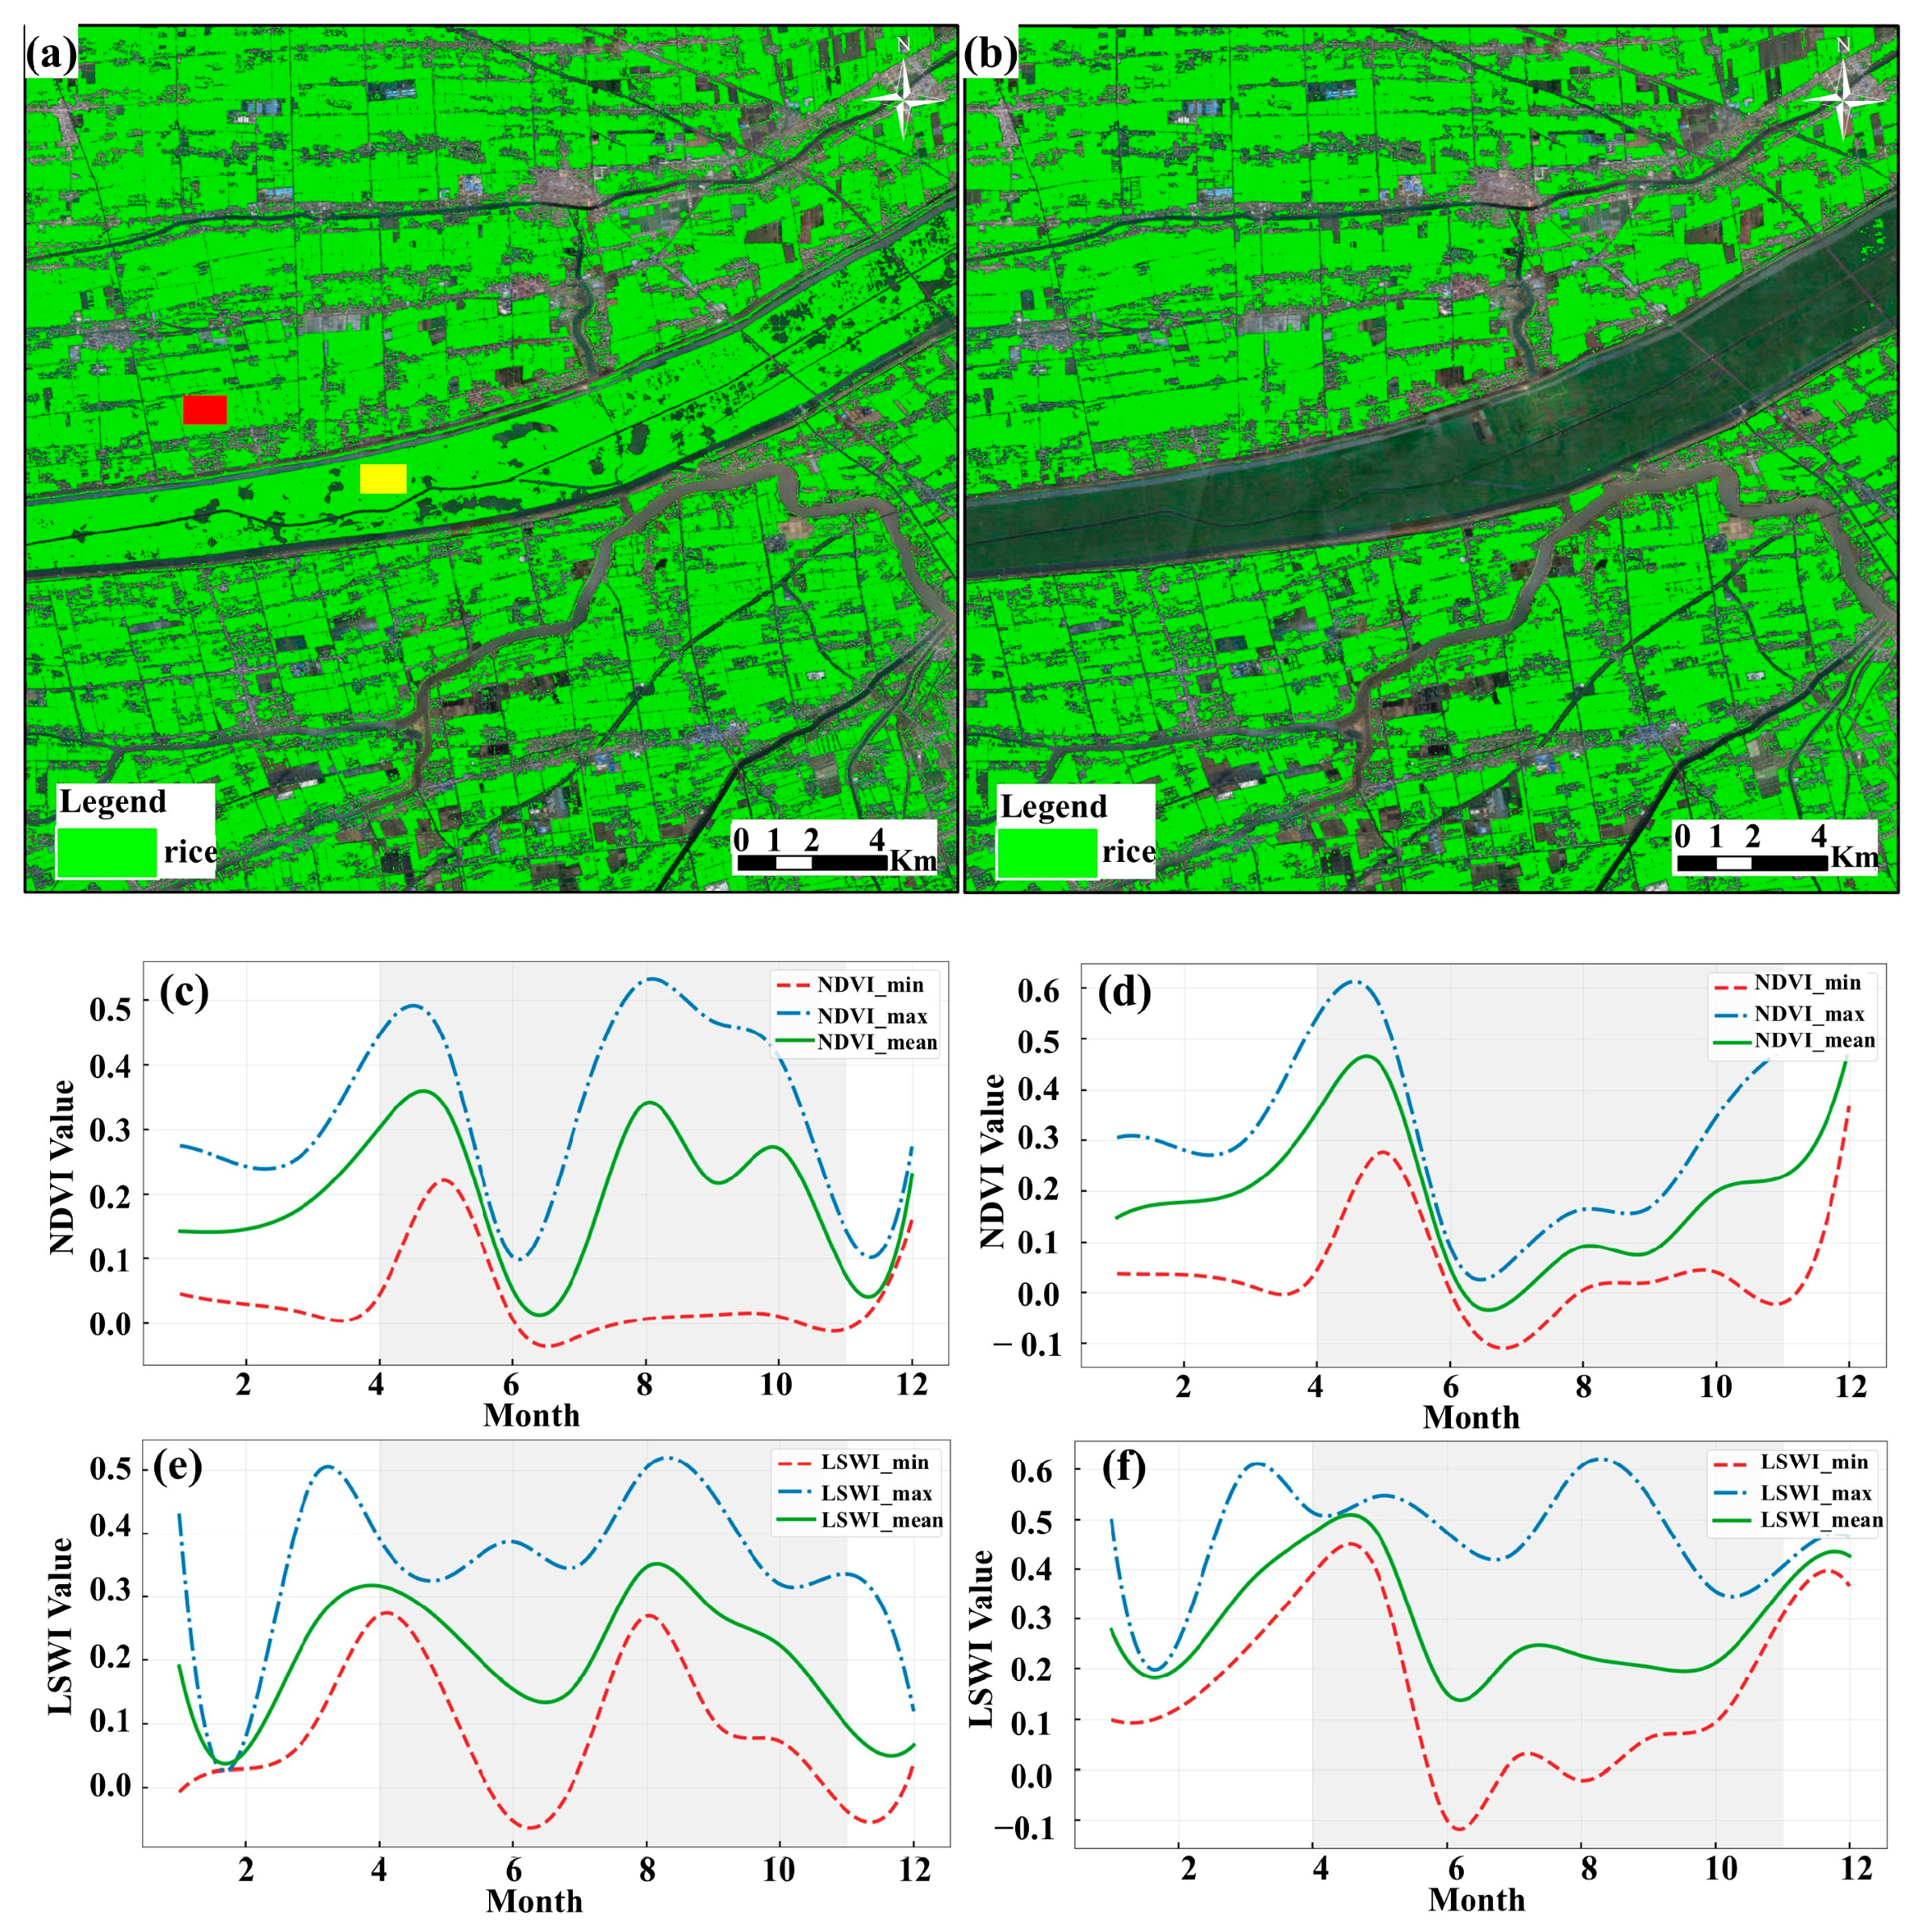
As shown in Figure 13, the model successfully detected most rice cultivation areas, performing well both near and far from the initial training region. However, some misclassifications occurred, especially along the Xinyi River in northern Jiangsu (Figure 14a). This area is prone to seasonal flooding and is largely unsuitable for crop cultivation, which explains the presence of false rice predictions.
Figure 13.
Preliminary Rice Classification Results. The red area indicates the location of sample areas, the yellow area corresponds to the region shown in Figure 14a, and the blue area represents the region used for accuracy assessment analysis.
Figure 14.
Locations of Misclassified Regions and Analysis of Causes. (a) depicts the control group’s rice identification results, with RED areas representing rice samples and YELLOW areas denoting problematic samples. (b) shows the rice distribution results obtained in this study. (c,e) display the temporal change curves of NDVI and LSWI indices for rice sample, while (d,f) depict the temporal change curves of NDVI and LSWI indices for problematic sample.
To understand the cause, the NDVI and LSWI time-series curves of misclassified and correctly identified samples were analyzed (Figure 14). The results showed that problematic pixels had consistently low NDVI values and limited variation in LSWI during the growing season, lacking the typical temporal patterns of rice. This confirmed that the area was non-rice. The small differences between maximum and minimum NDVI and LSWI values also contributed to weak separability in the input features, which reduced the model’s performance locally.
Overall, the analysis demonstrated that the preliminary model had good spatial transferability but still faced limitations in areas with atypical hydrological or surface conditions. These insights guided the selection of supplementary samples for subsequent iterations of model enhancement.
To evaluate the spatial generalization capability of models, most studies have adopted a partition-based validation approach. For instance, Wei et al. (2021) established three sites within the study area, selecting one site as the training site and designating the other two as transfer sites for testing, thereby assessing the model’s spatial generalization [36]. Similarly, Yang et al. (2023) trained the model using the Mississippi Alluvial Plain dataset and then tested the model’s spatial transferability for rice mapping in Shuangcheng, northeastern China [31]. They further refined the model using the Shuangcheng dataset and validated its spatial generalization capability across three rice-growing areas in northeastern China: the Songnen Plain, the Liaohe Plain, and the Sanjiang Plain.
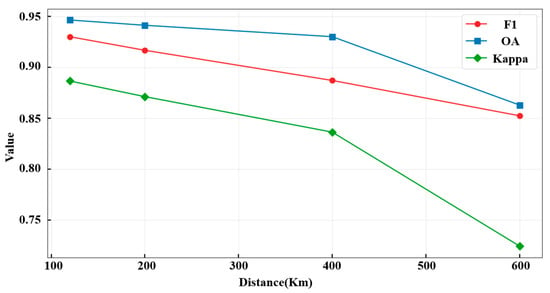
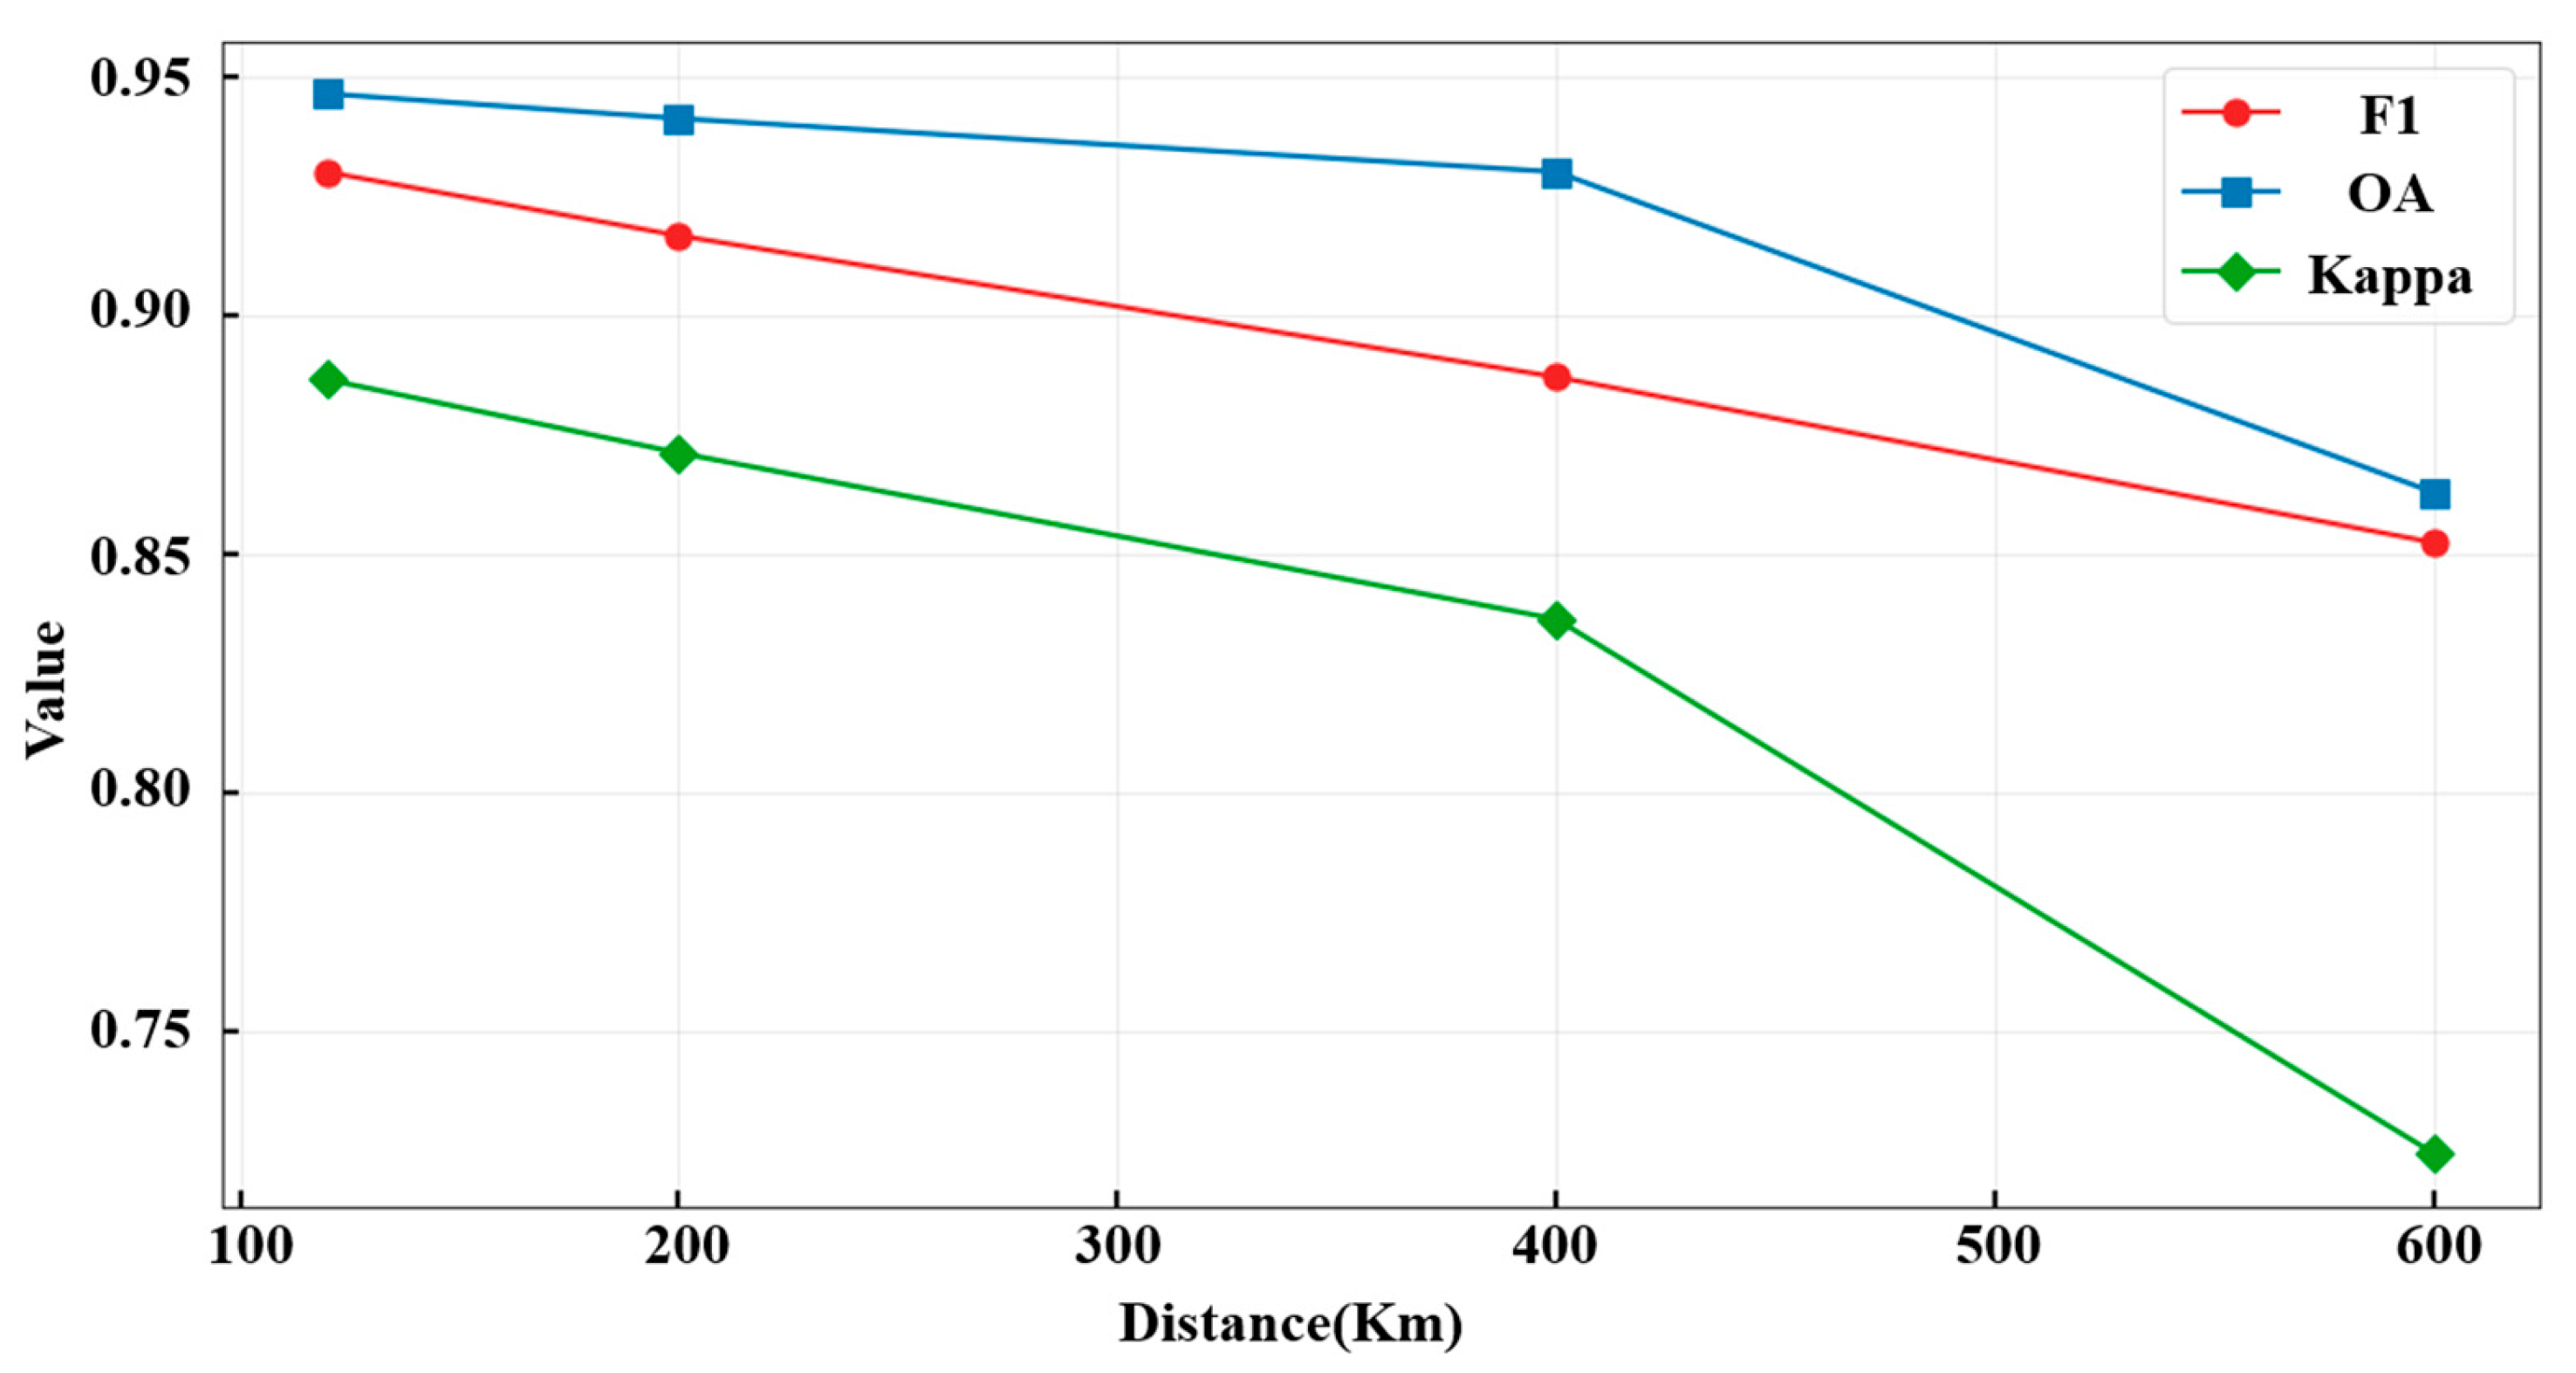
To evaluate the spatial generalization of the initial model, the Taizhou sample area and the Xinyi River area were selected as two endpoints along a transect, and multiple regions at increasing distances were sampled for accuracy assessment (Figure 13). The results (Table 2, Figure 15) showed that at 120 km from the training area, the F1-score reached 92.9%, the Kappa coefficient was 88.65%, and the overall accuracy was 94.63%. At 200 km, these values slightly decreased to 91.67%, 87.12%, and 94.12%, respectively. At 400 km, accuracy dropped more noticeably, with an F1-score of 84.80%, a Kappa of 78.85%, and an overall accuracy of 91.33%. At 600 km, the F1-score recovered slightly to 87.61%, but the Kappa fell to 71.59% and the overall accuracy to 86%. The model achieved 98.46% accuracy within the sample area, while accuracy in the Xinyi River area was near zero.
Table 2.
Rice mapping accuracy at different spatial distances.
Figure 15.
Accuracy Evaluation of Rice Classification Model at Varying Distances from Sample Area.
These results indicate that the model performed well close to the training site but gradually lost accuracy with increasing distance. Beyond 400 km, the decline became significant, suggesting that additional samples should be introduced to maintain model reliability. In summary, when trained only on a single sample area, the model was able to identify most rice fields and maintain good accuracy within a moderate range, but its performance declined in distant or atypical regions. Supplementing training data from new areas can effectively address this limitation and further enhance large-scale mapping robustness.
4.4. Temporal Transferability Performance of the Model
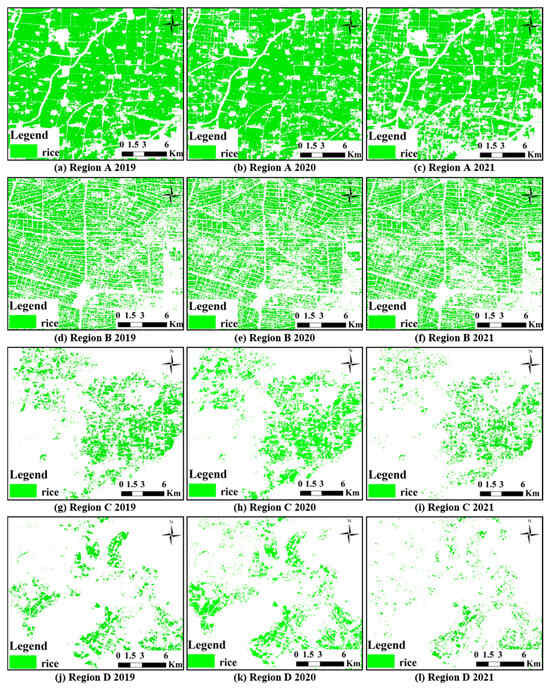
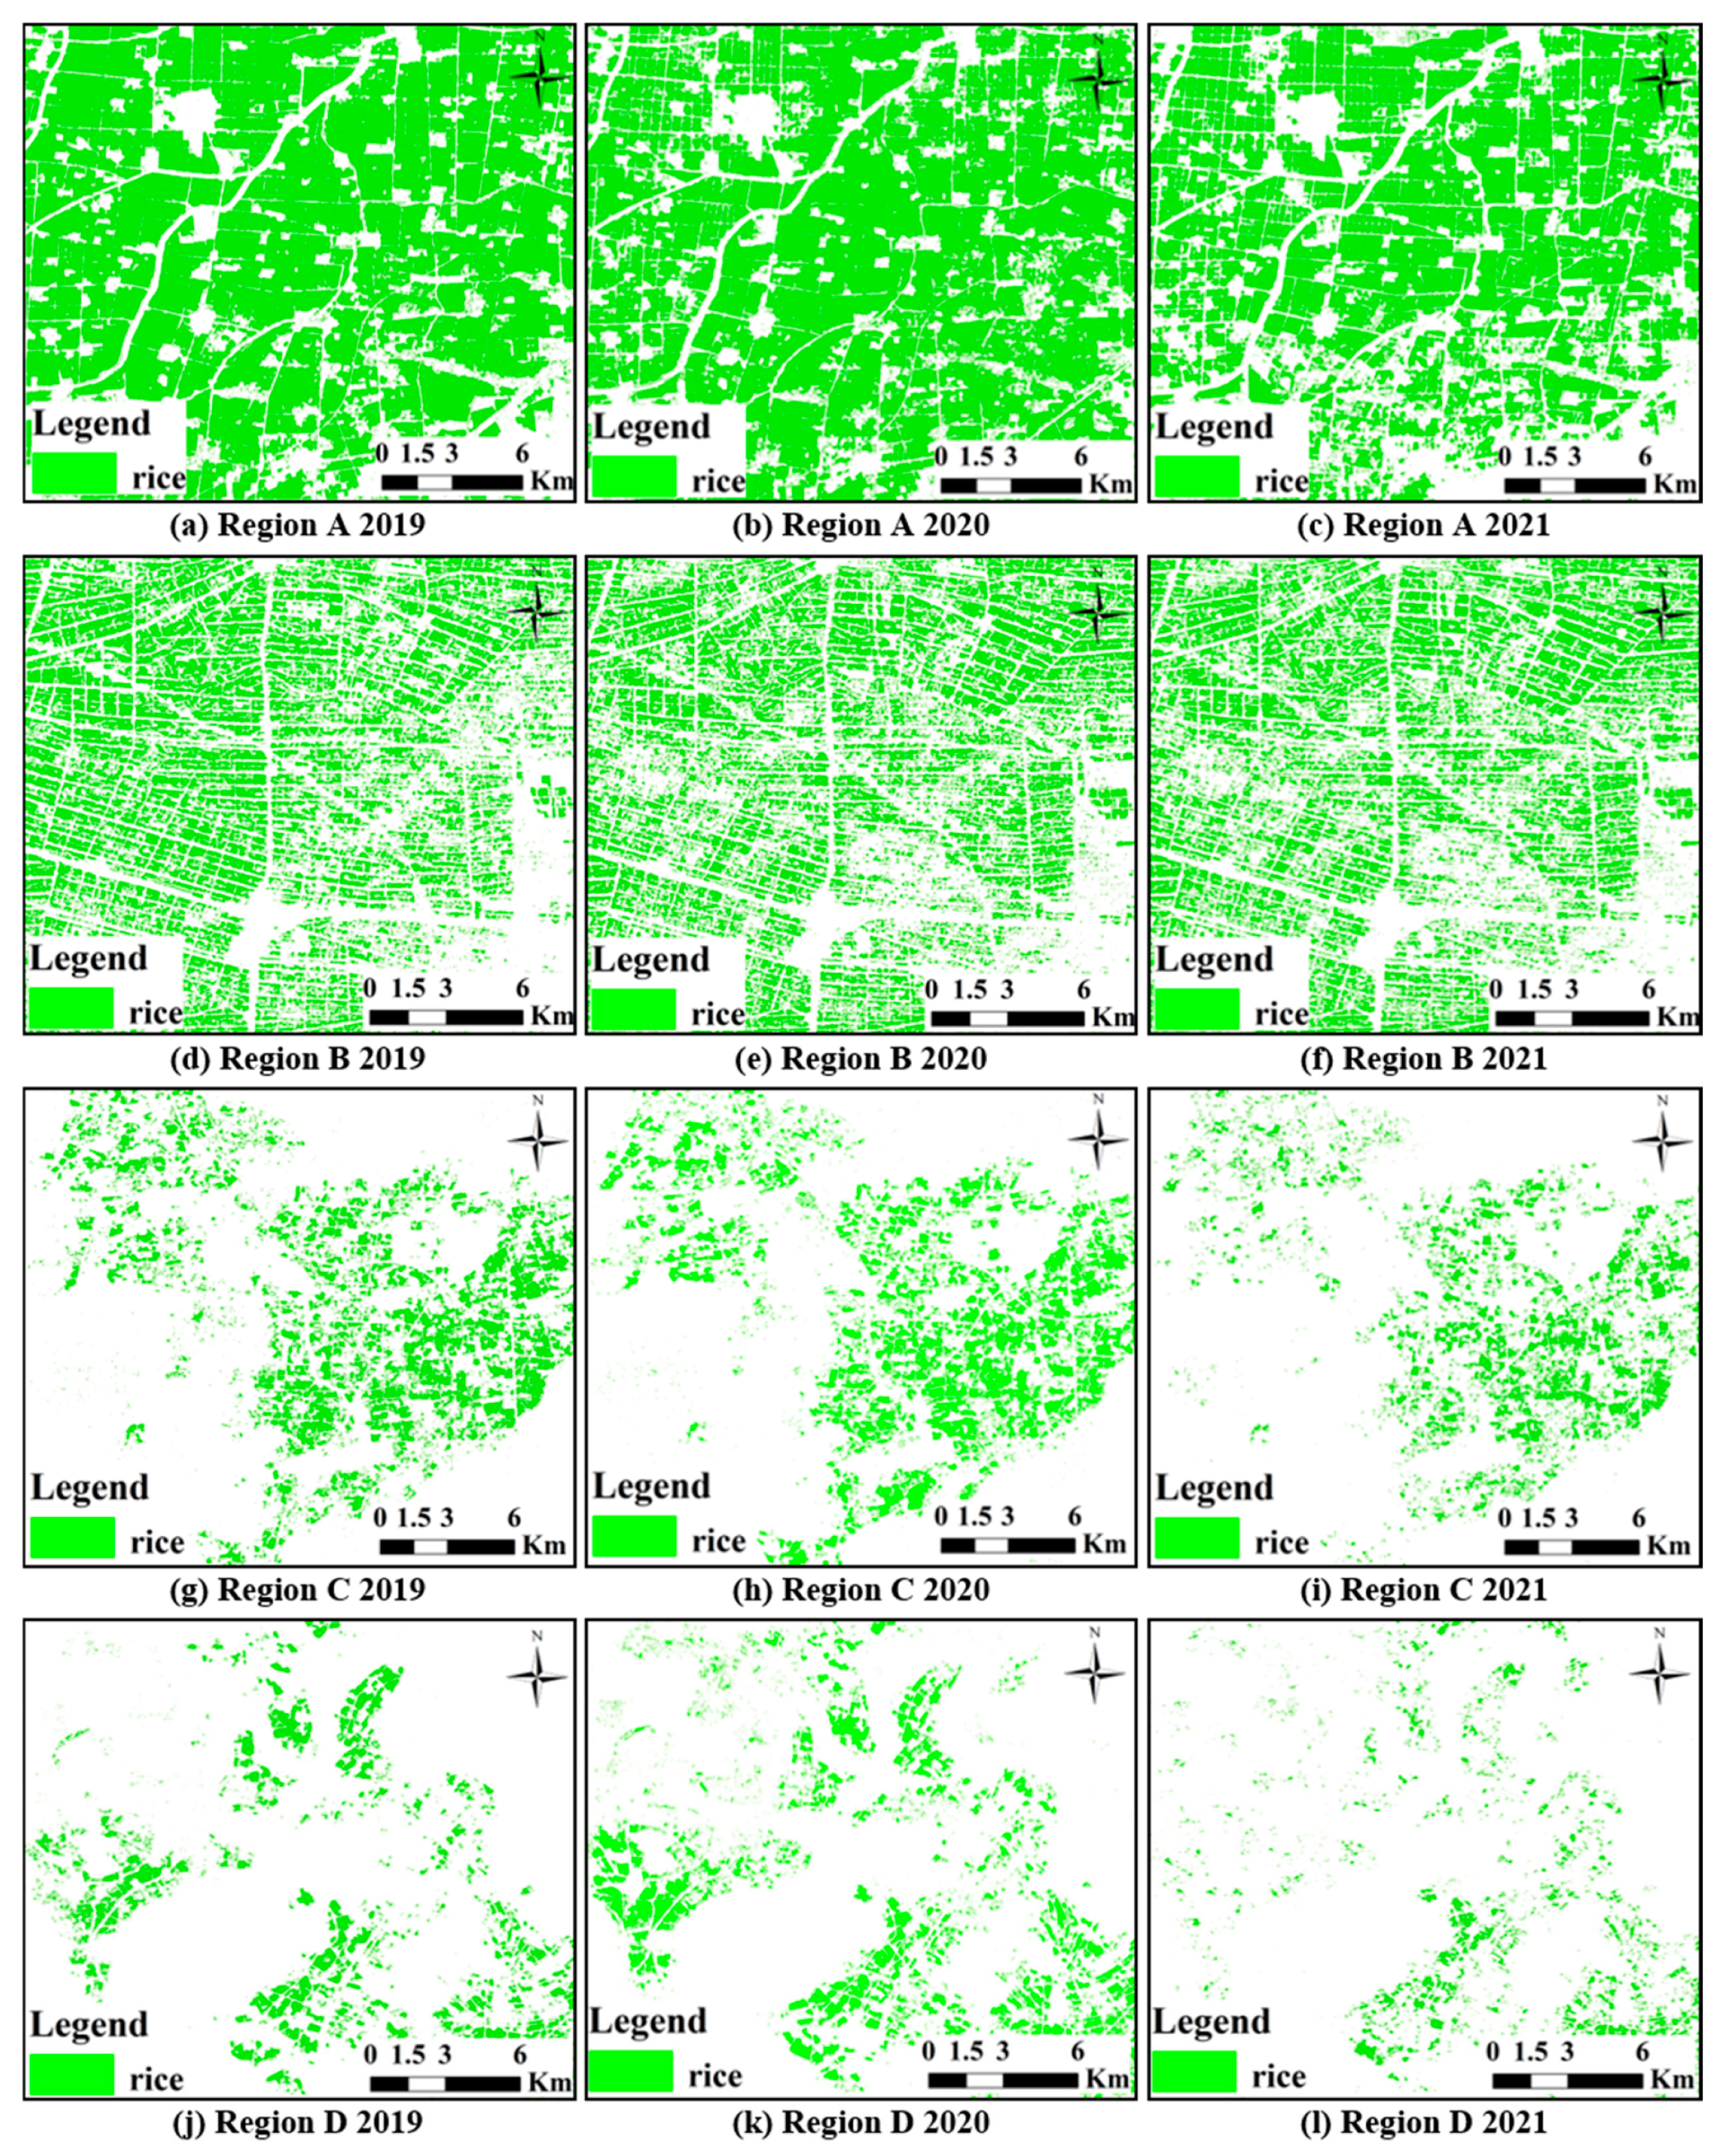
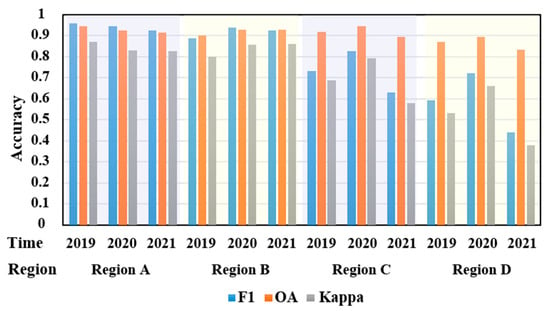
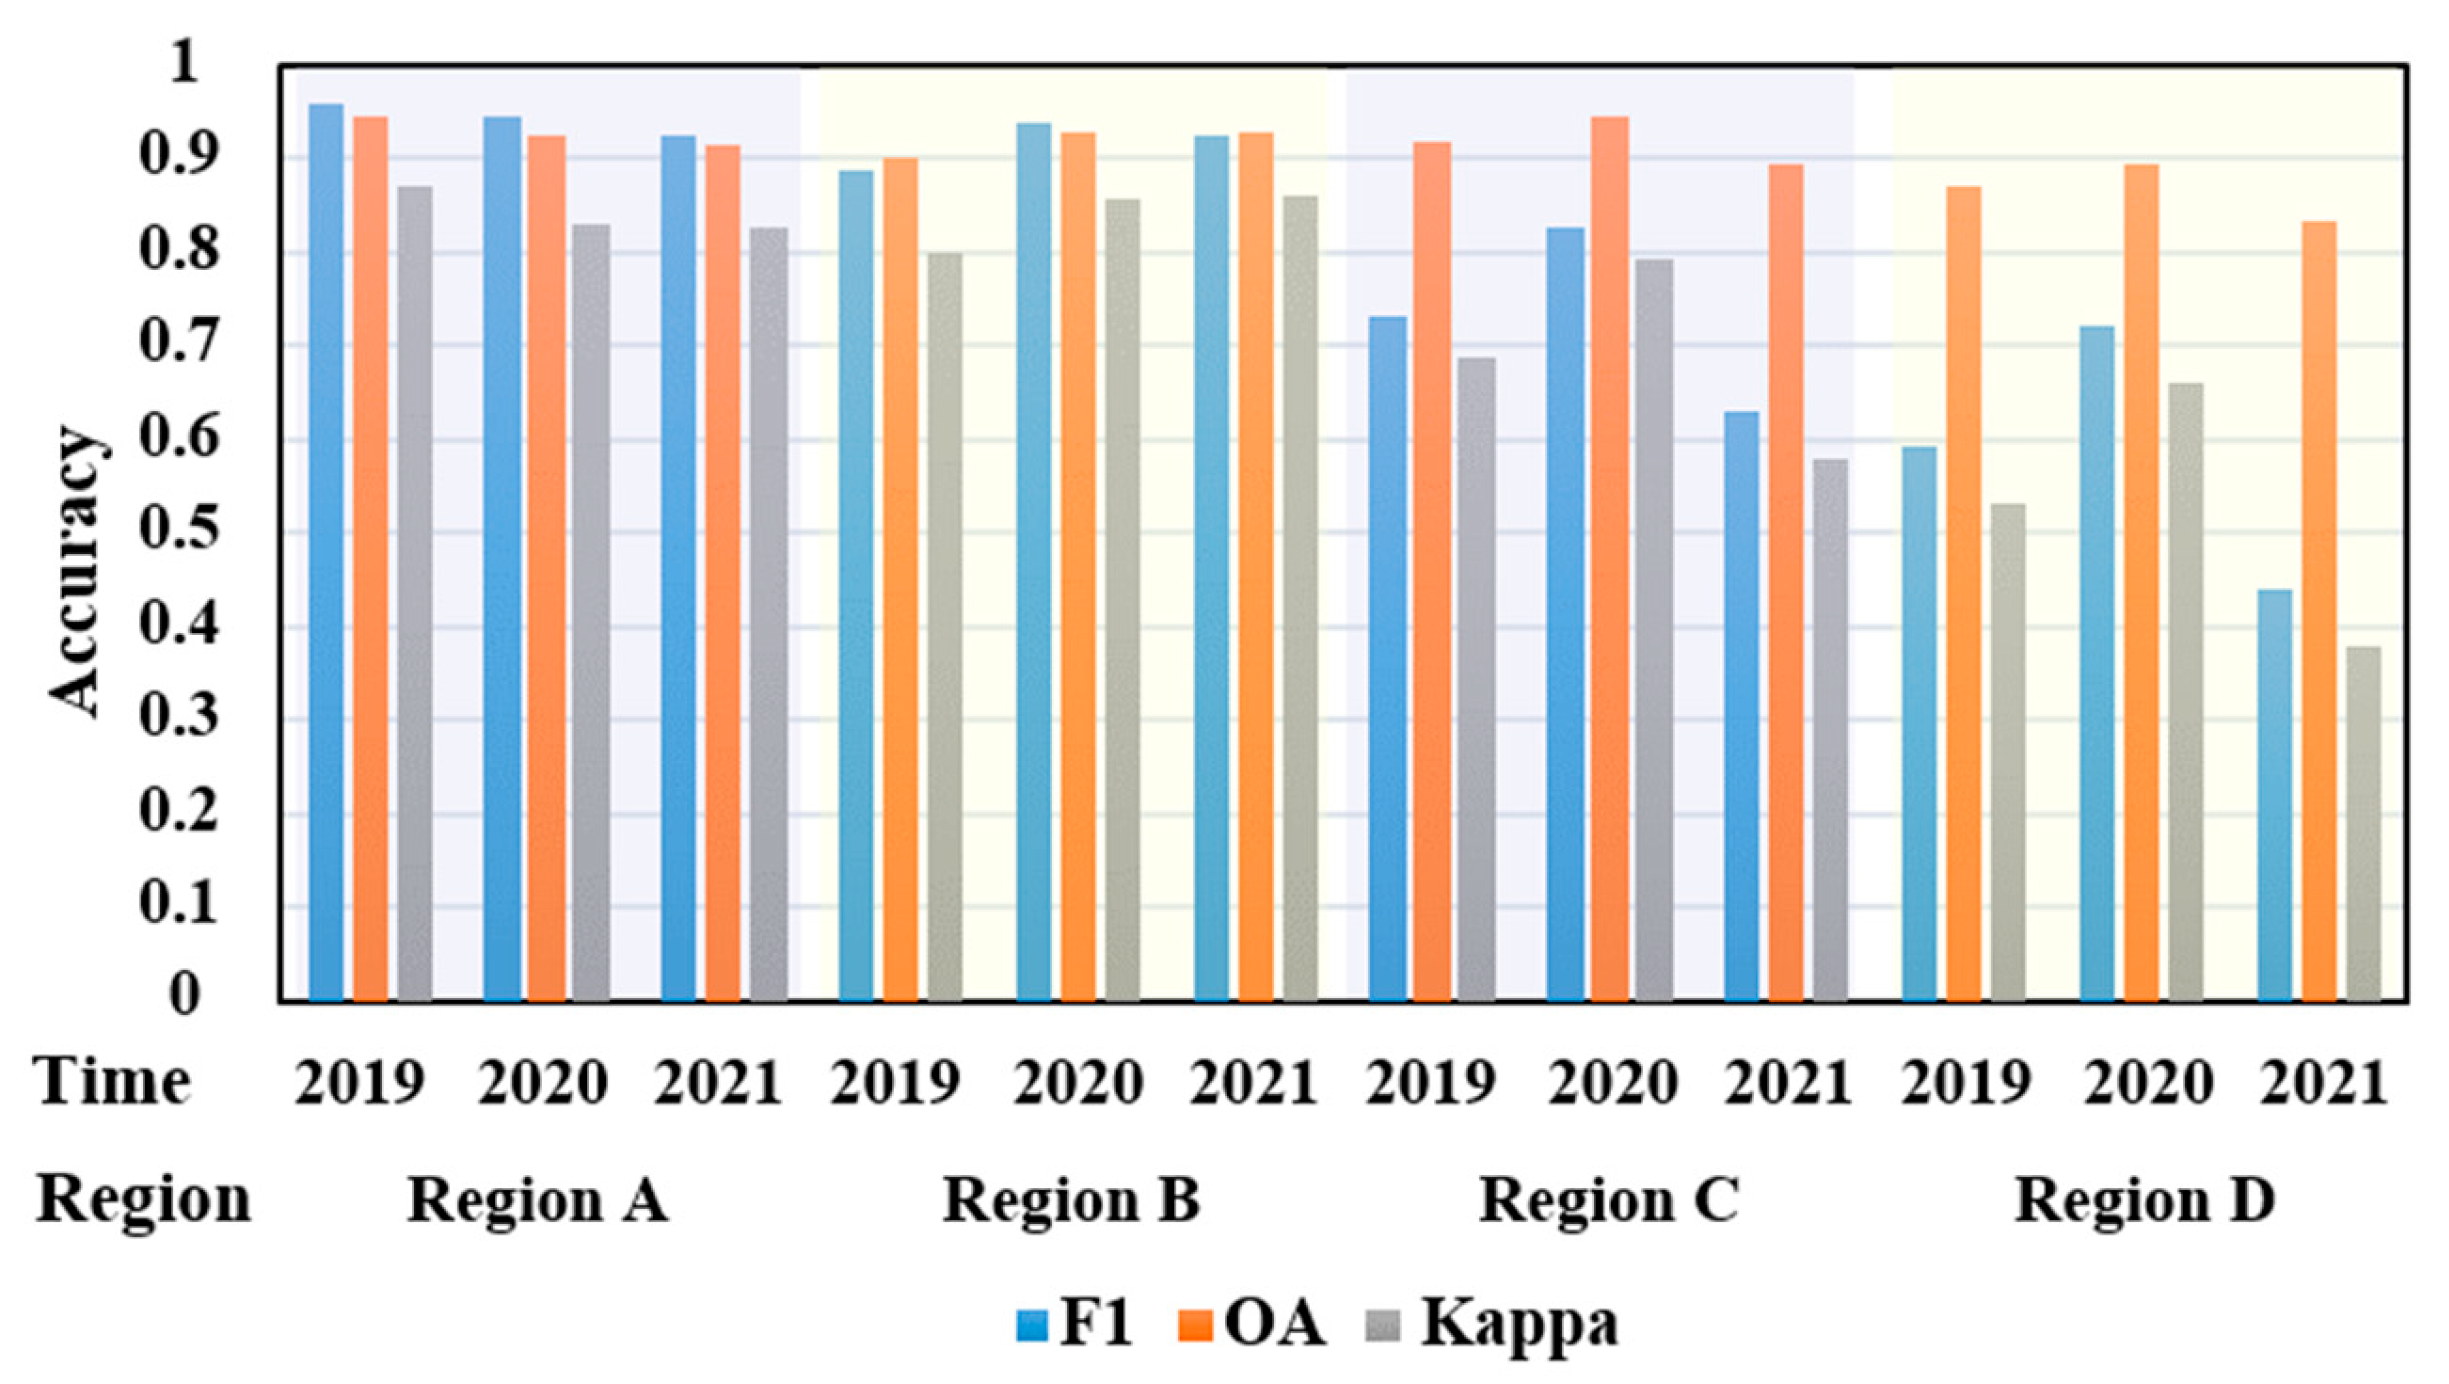
The temporal generalization of the model was evaluated through cross-year rice classification in four representative regions (A to D in Figure 11), with results shown in Figure 16. Even without using same-year training data, the model successfully identified most rice cultivation areas.
Figure 16.
Rice Recognition Results for Regions A, B, C, and D from 2019 to 2021.
Among the four regions, Region A achieved the best temporal performance, maintaining stable rice detection across years. Region B showed a slight decline but continued to identify most rice fields accurately. Regions C and D performed less consistently; Region C retained moderate accuracy, while Region D exhibited notable omission errors, especially in 2021, when extensive rice areas in the north and southwest were missed.
Accuracy metrics for each region and year (Figure 17) revealed consistent trends. In Regions A and B, F1-scores were above 0.88 and overall accuracy exceeded 0.90. Region C performed best in 2020 with slightly lower values, whereas Region D had the weakest results, with the F1-score dropping to 0.44 in 2021. These results indicate that the model achieved good temporal transferability overall but was sensitive to interannual variability and local agricultural practices.
Figure 17.
Accuracy Metrics of the Model for Rice Mapping Across Different Regions and Years.
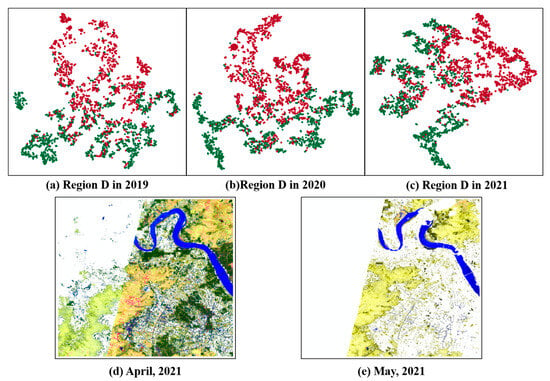
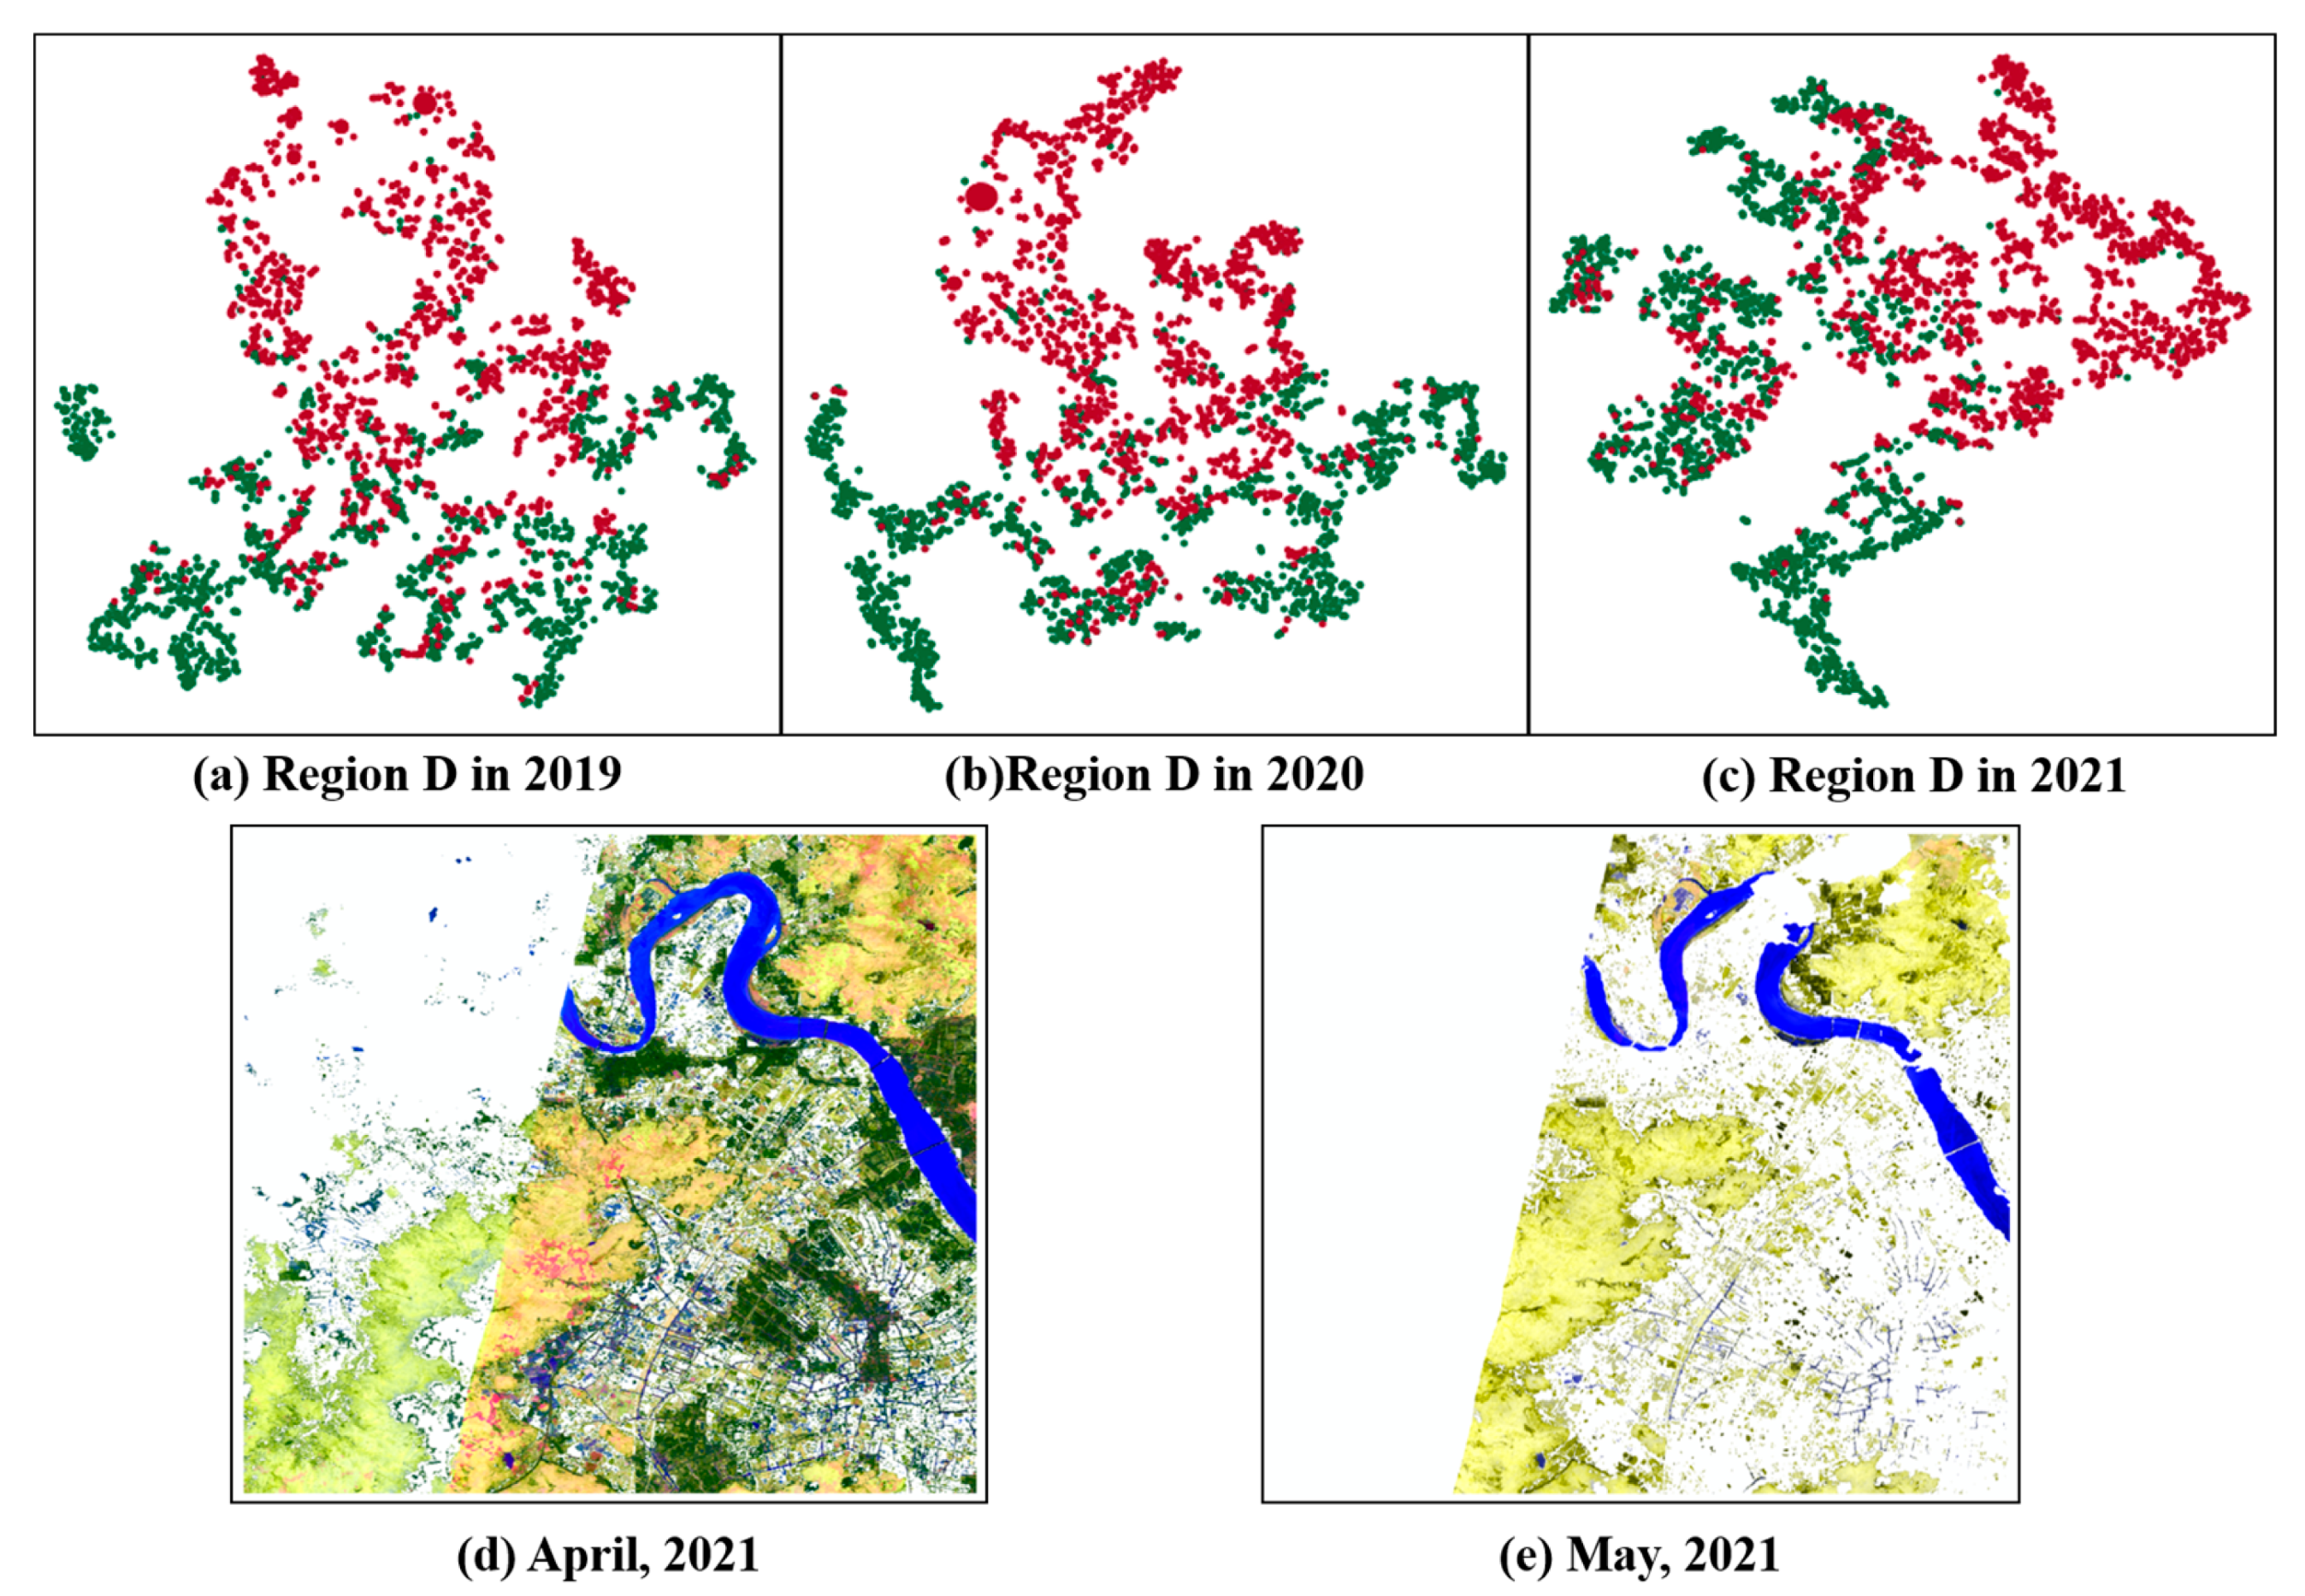
To further analyze the causes of reduced accuracy, the t-SNE (t-Distributed Stochastic Neighbor Embedding) method was used for feature visualization. This nonlinear dimensionality reduction technique projects high-dimensional features into a two-dimensional space while preserving local relationships among samples [37]. In this study, t-SNE was applied to qualitatively visualize model features. Figure 18a–c presents the results for Region D from 2019 to 2021 based on 2000 stratified random samples. The blurred cluster boundaries and high sample misclassification rates indicate that the model had difficulty distinguishing feature patterns. The accuracy decline in Region D’s cross-year classification was therefore related to its geographical complexity and the limited quantity and quality of available imagery.
Figure 18.
Analysis of the Reasons for Low Cross-Year Identification Accuracy in Region D. (a–c) depict the t-SNE dimensionality reduction results for Region D from 2019 to 2021 (the red points represent non-rice samples, while the green points represent rice samples), while (d,e) show the composite RGB images of Region D from Sentinel-2 imagery in April and May 2021.
Region D is located in Wenzhou, Zhejiang Province, where both single- and double-cropping rice are cultivated under complex terrain and variable climatic conditions. In 2021, Sentinel-2 imagery from April to May obtained via Google Earth Engine showed large data gaps (Figure 18d,e), which reduced composite image quality and weakened the model’s ability to recognize rice fields.
Overall, the model demonstrated moderate temporal transferability, but its performance varied by region. Several factors affected cross-year accuracy: (1) weather variations, where abnormal rainfall or temperature influenced crop growth; (2) data quality issues, as missing or low-quality imagery limited reliable feature extraction; and (3) social factors, such as changes in farming intensity during the pandemic.
Comparative results showed better temporal stability in Jiangsu Province, while Zhejiang’s complex landscapes and diverse cropping systems amplified data inconsistencies and reduced model accuracy. Understanding these influences is essential for improving model robustness and guiding future refinements in data preprocessing and temporal modeling strategies.
4.5. Analysis of Factors Affecting Model Spatial Scale Recognition
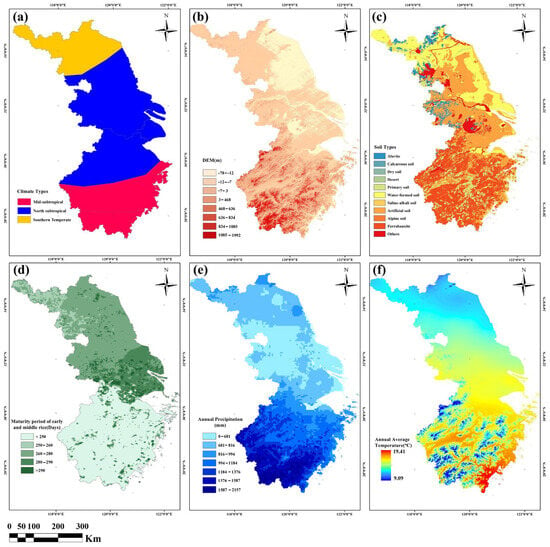
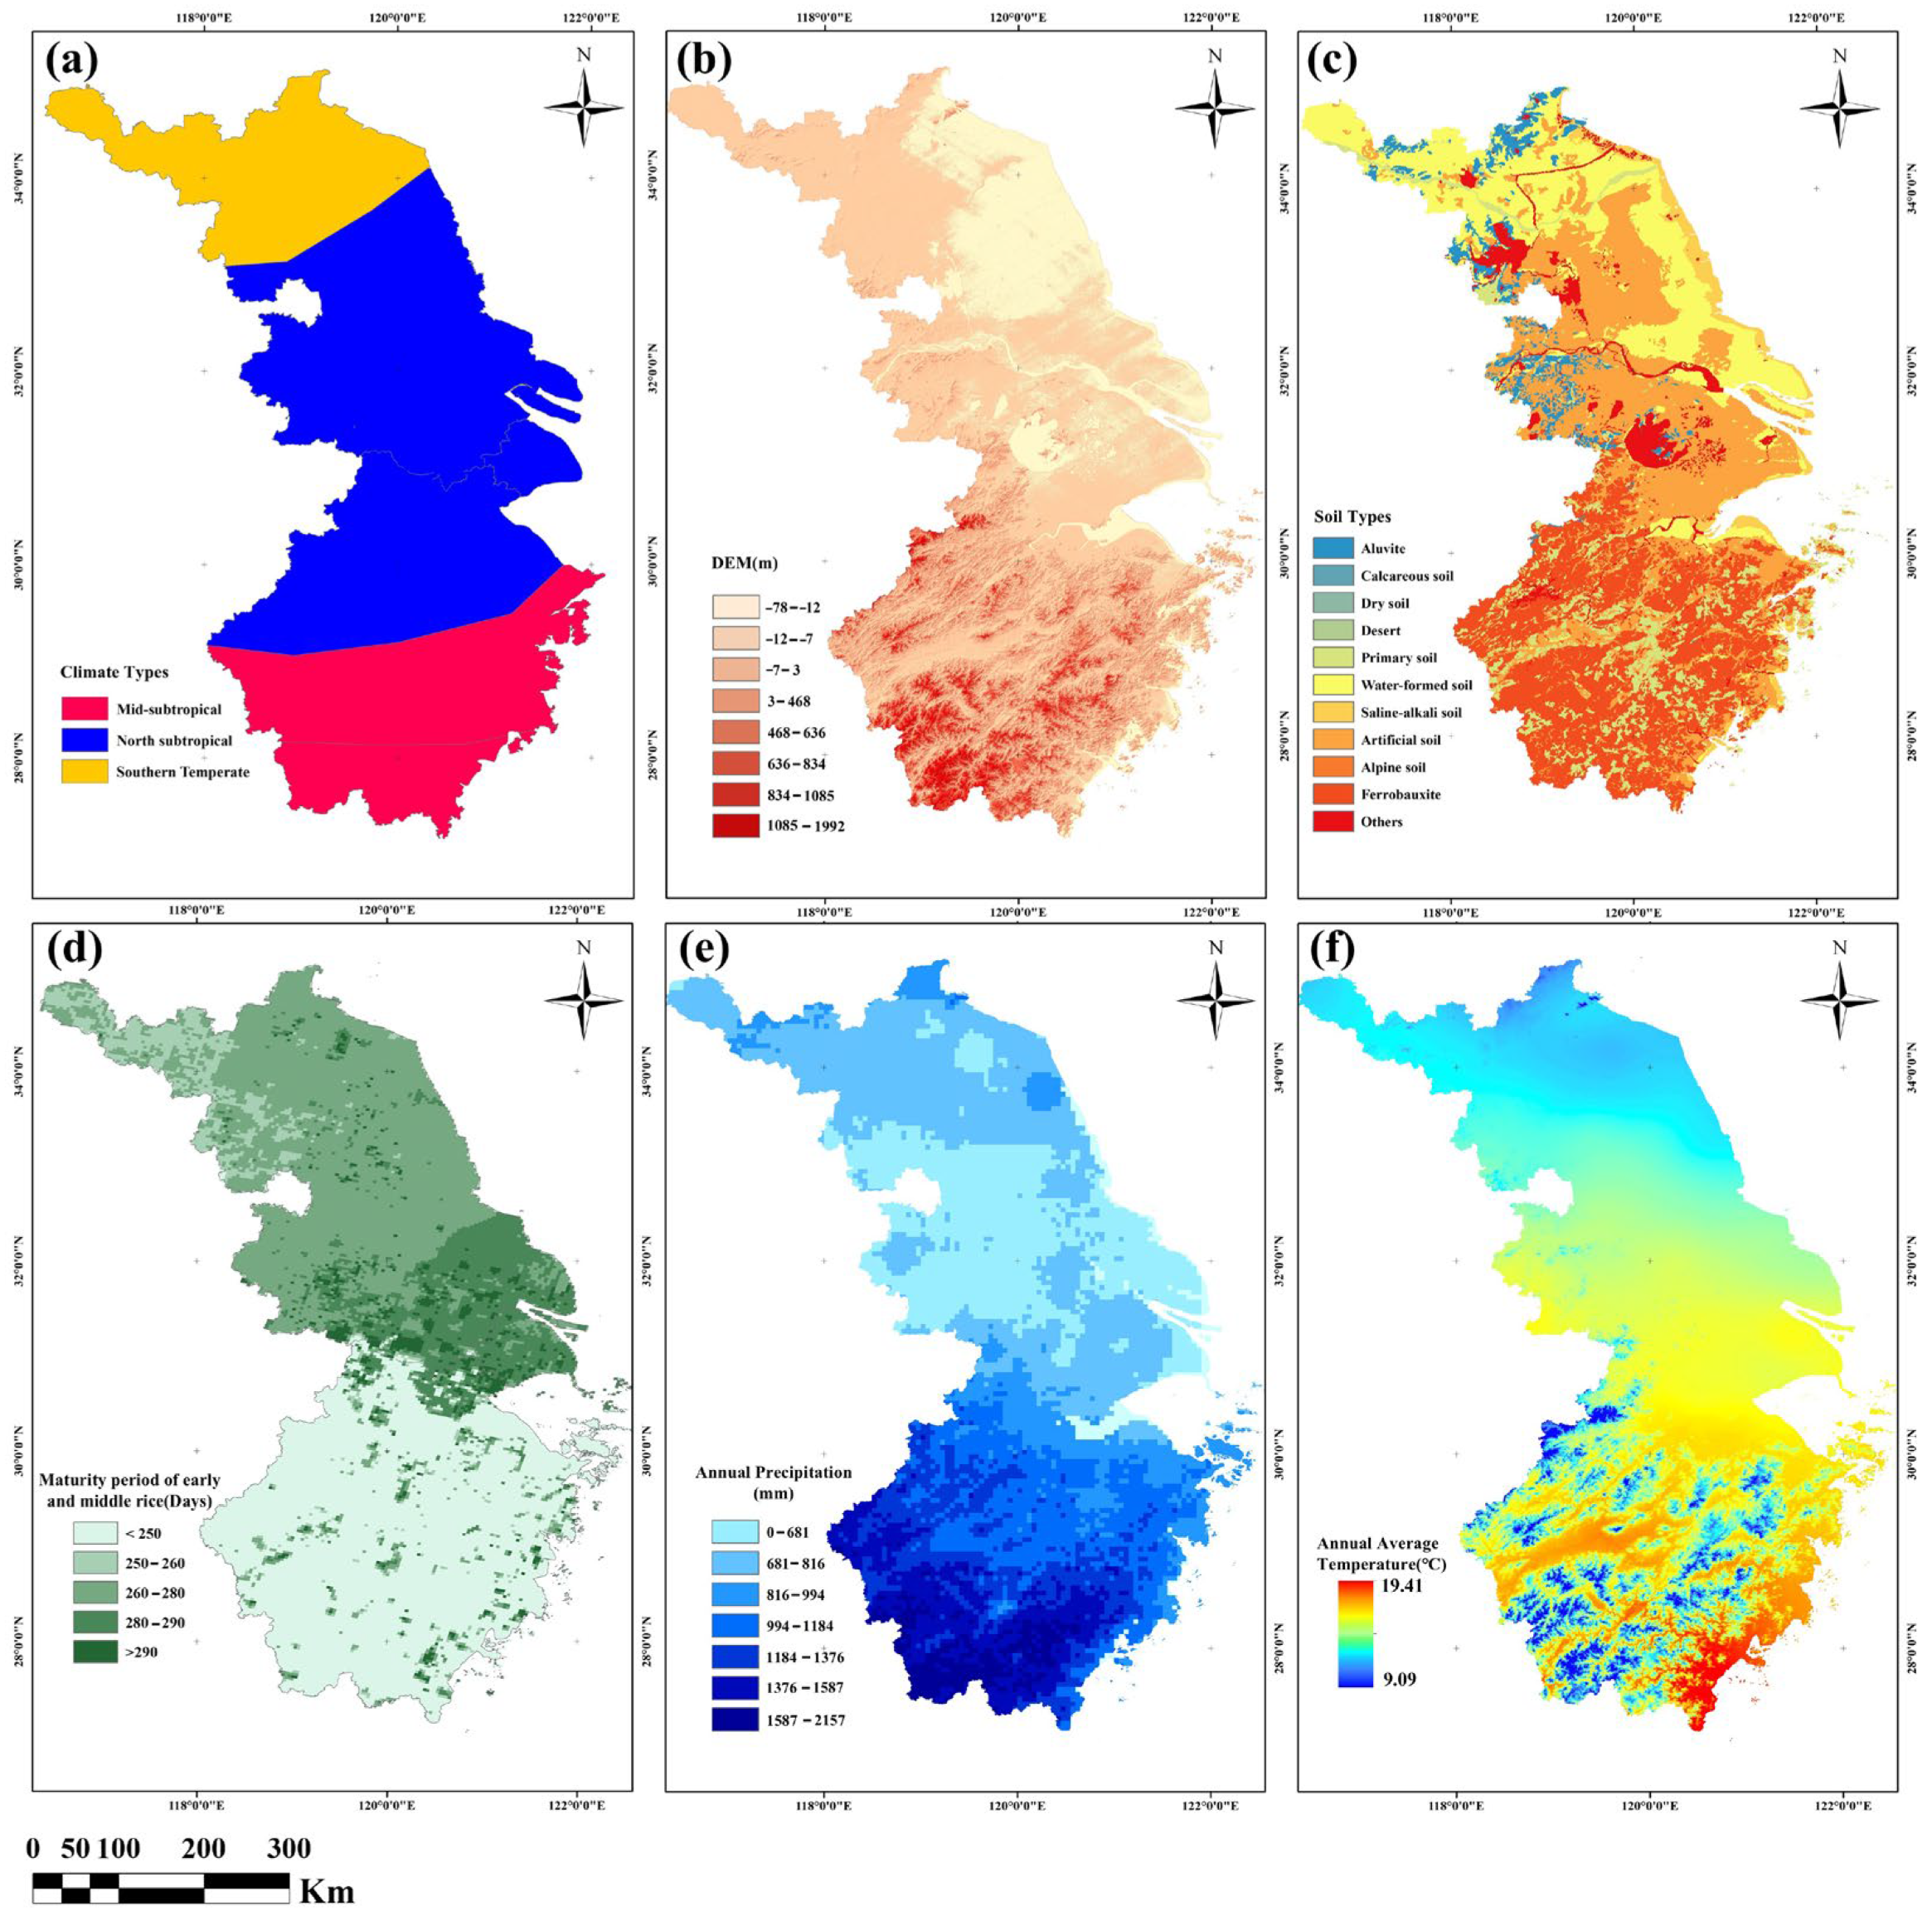
The spatial analysis showed that the model’s generalization ability declined with increasing distance from the training area. To explore the causes, auxiliary data including digital elevation model (DEM), annual precipitation, and average temperature were analyzed for the JZS region (Figure 19). The area spans three main climatic zones: southern temperate, northern subtropical, and central subtropical, each with distinct environmental characteristics (Figure 19a). The DEM map (Figure 19b) reveals more complex terrain in Zhejiang Province than in Jiangsu or Shanghai, while the southern soils are more heterogeneous than those in the north (Figure 19c). These variations in topography, climate, and soil composition collectively contribute to spatial inconsistencies in model recognition performance.
Figure 19.
Potential factors affecting the spatial generalization ability of the model. (a) Climate Types; (b) DEM Data; (c) Soil Types; (d) Maturity period of early and middle rice; (e) Annual Precipitation; (f) Annual Average Temperature.
Figure 19d illustrates that early and middle rice mature earlier in the north than in the south, showing a clear north–south gradient. Figure 19e presents annual precipitation, which decreases from south to north with a maximum difference of about 1700 mm. Figure 19f shows that average annual temperature also declines with latitude, with a difference of around 10 degrees Celsius.
Overall, the analysis indicates pronounced north–south differences in climate type, soil characteristics, phenology, precipitation, temperature, and terrain. In addition, the availability of high-quality imagery varied among regions. These environmental and data-related disparities jointly limited the model’s spatial generalization but also highlighted directions for improvement. Future studies should incorporate these factors to enhance the model’s adaptability and prediction accuracy across diverse conditions.
4.6. Rice Cultivation Distribution in the Middle and Lower Reaches of the Yangtze River
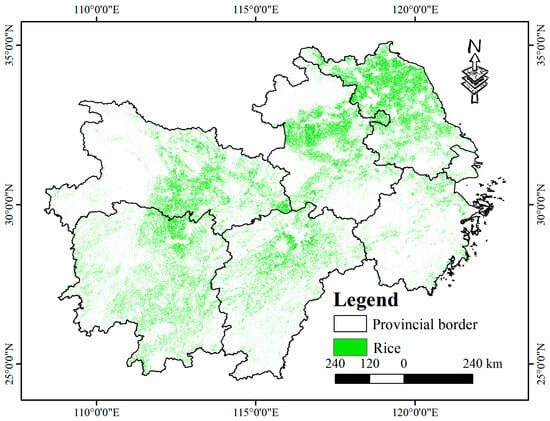
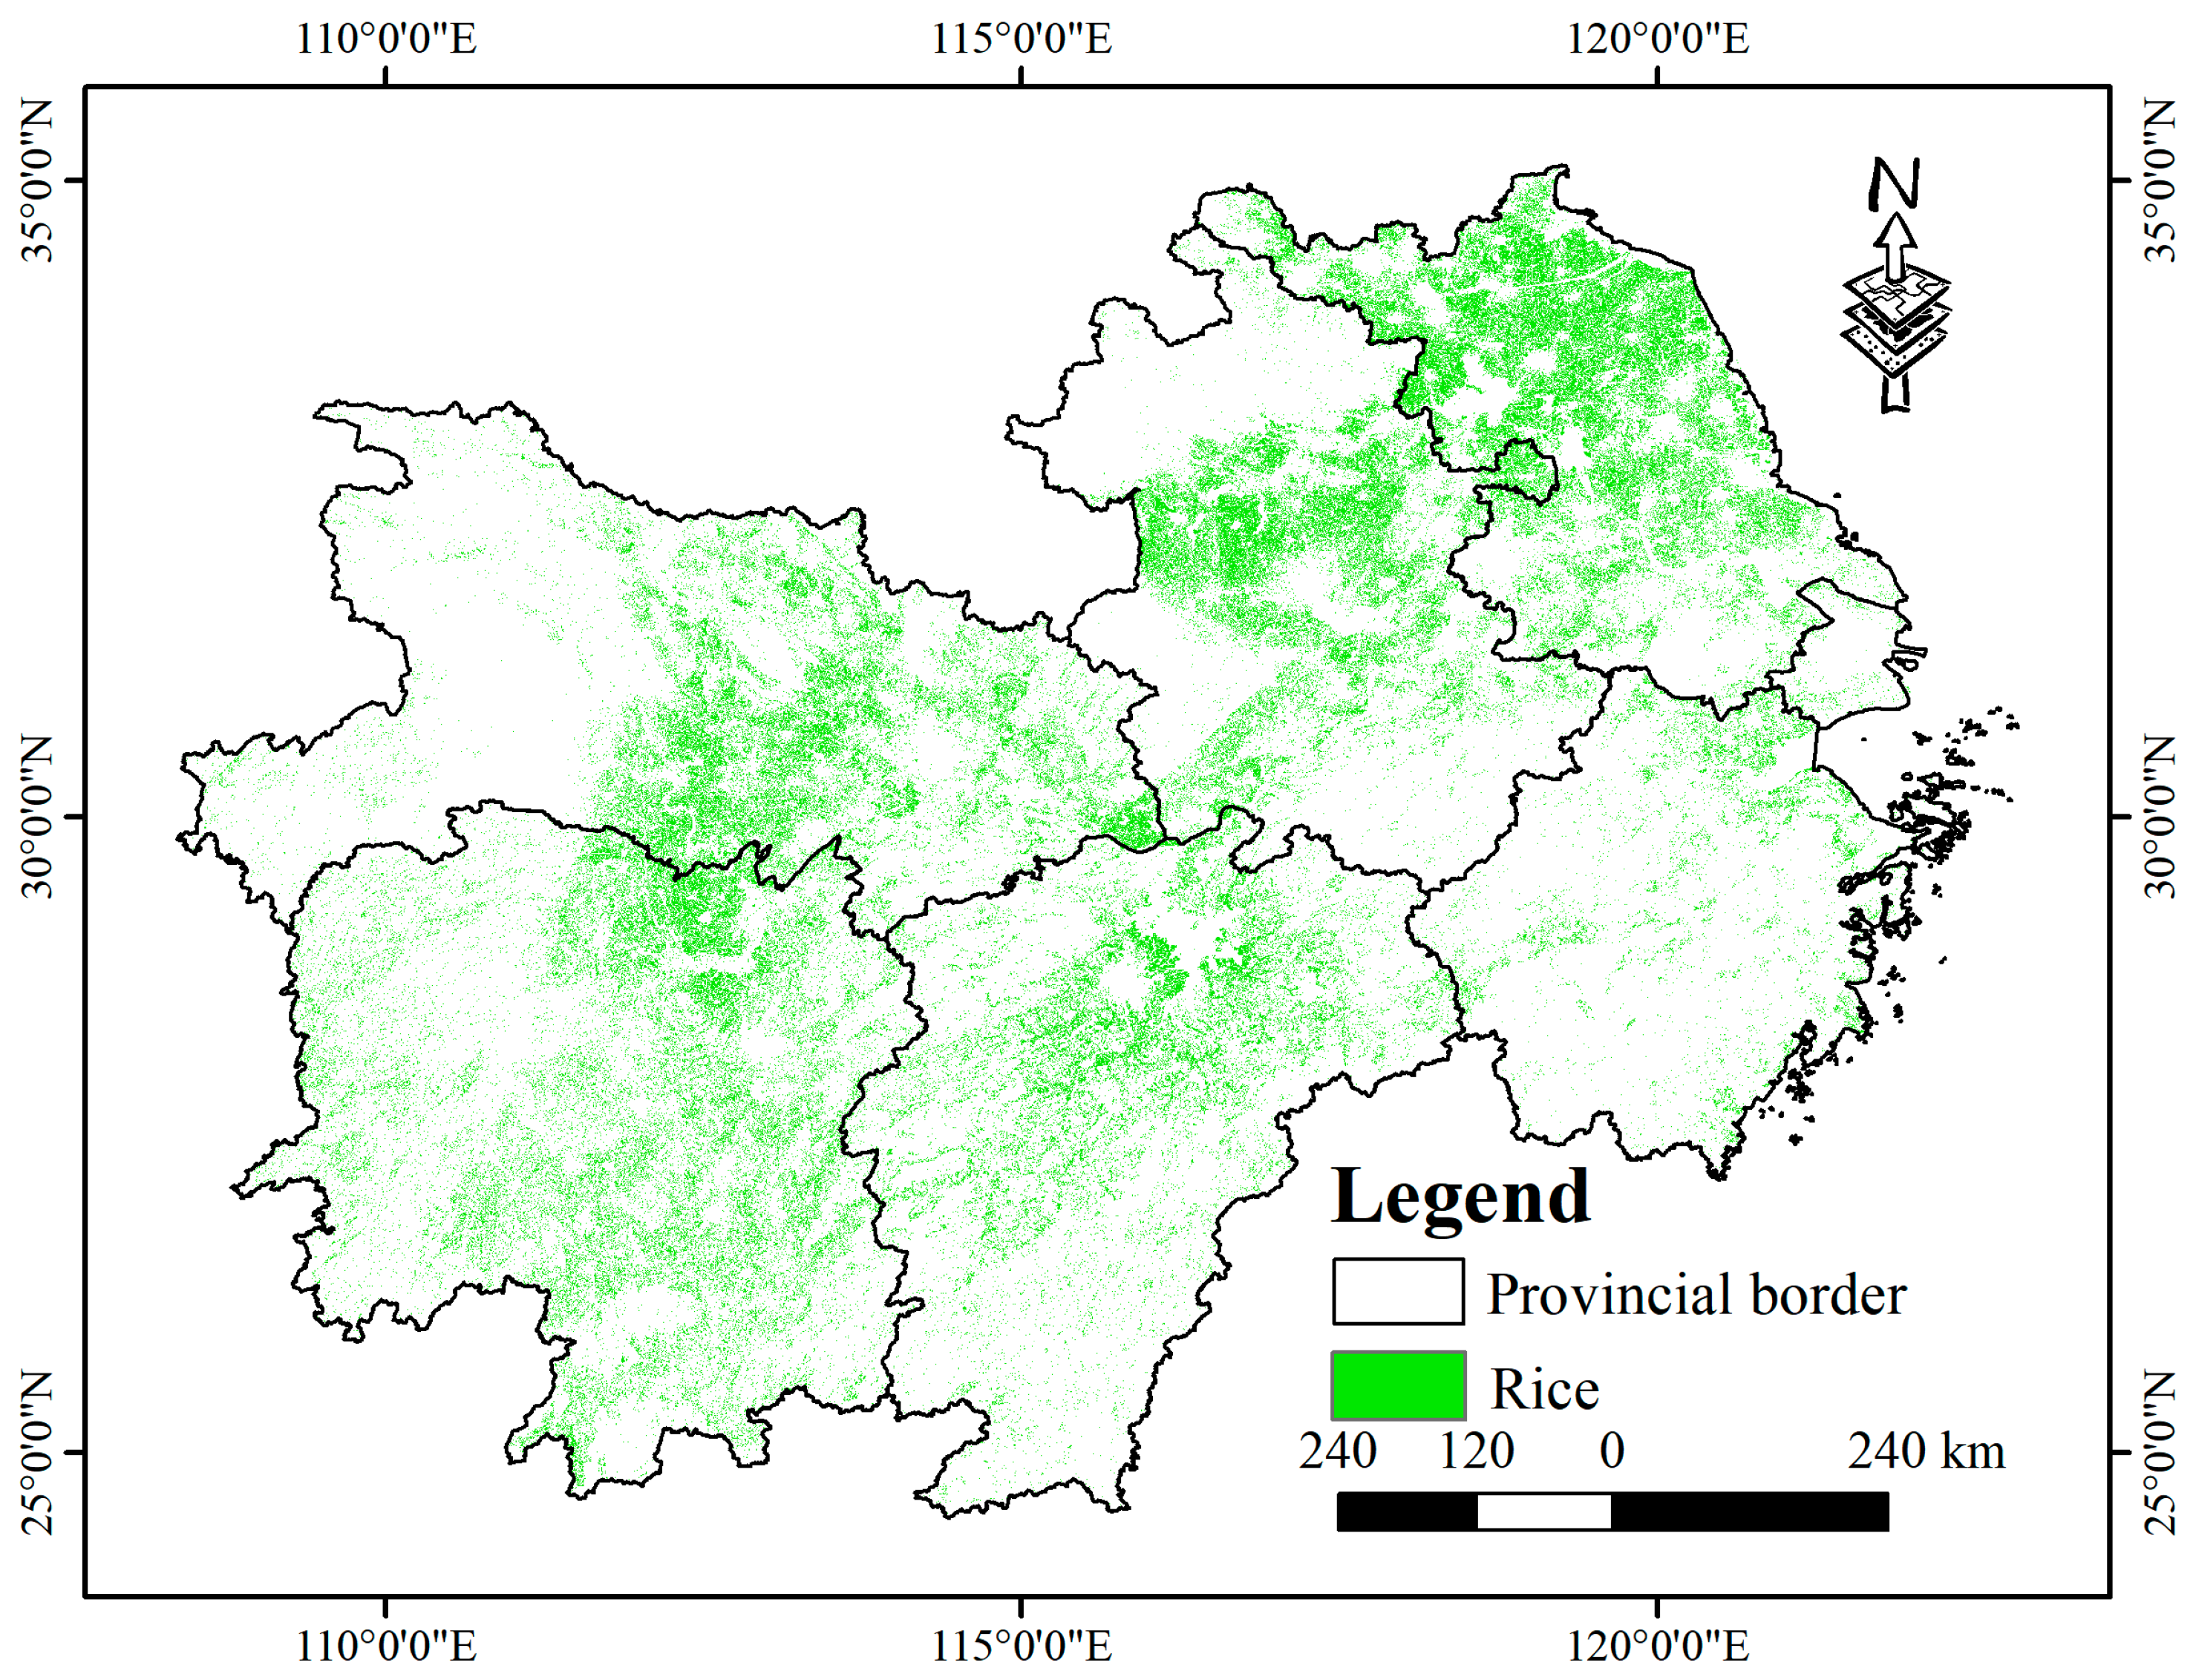
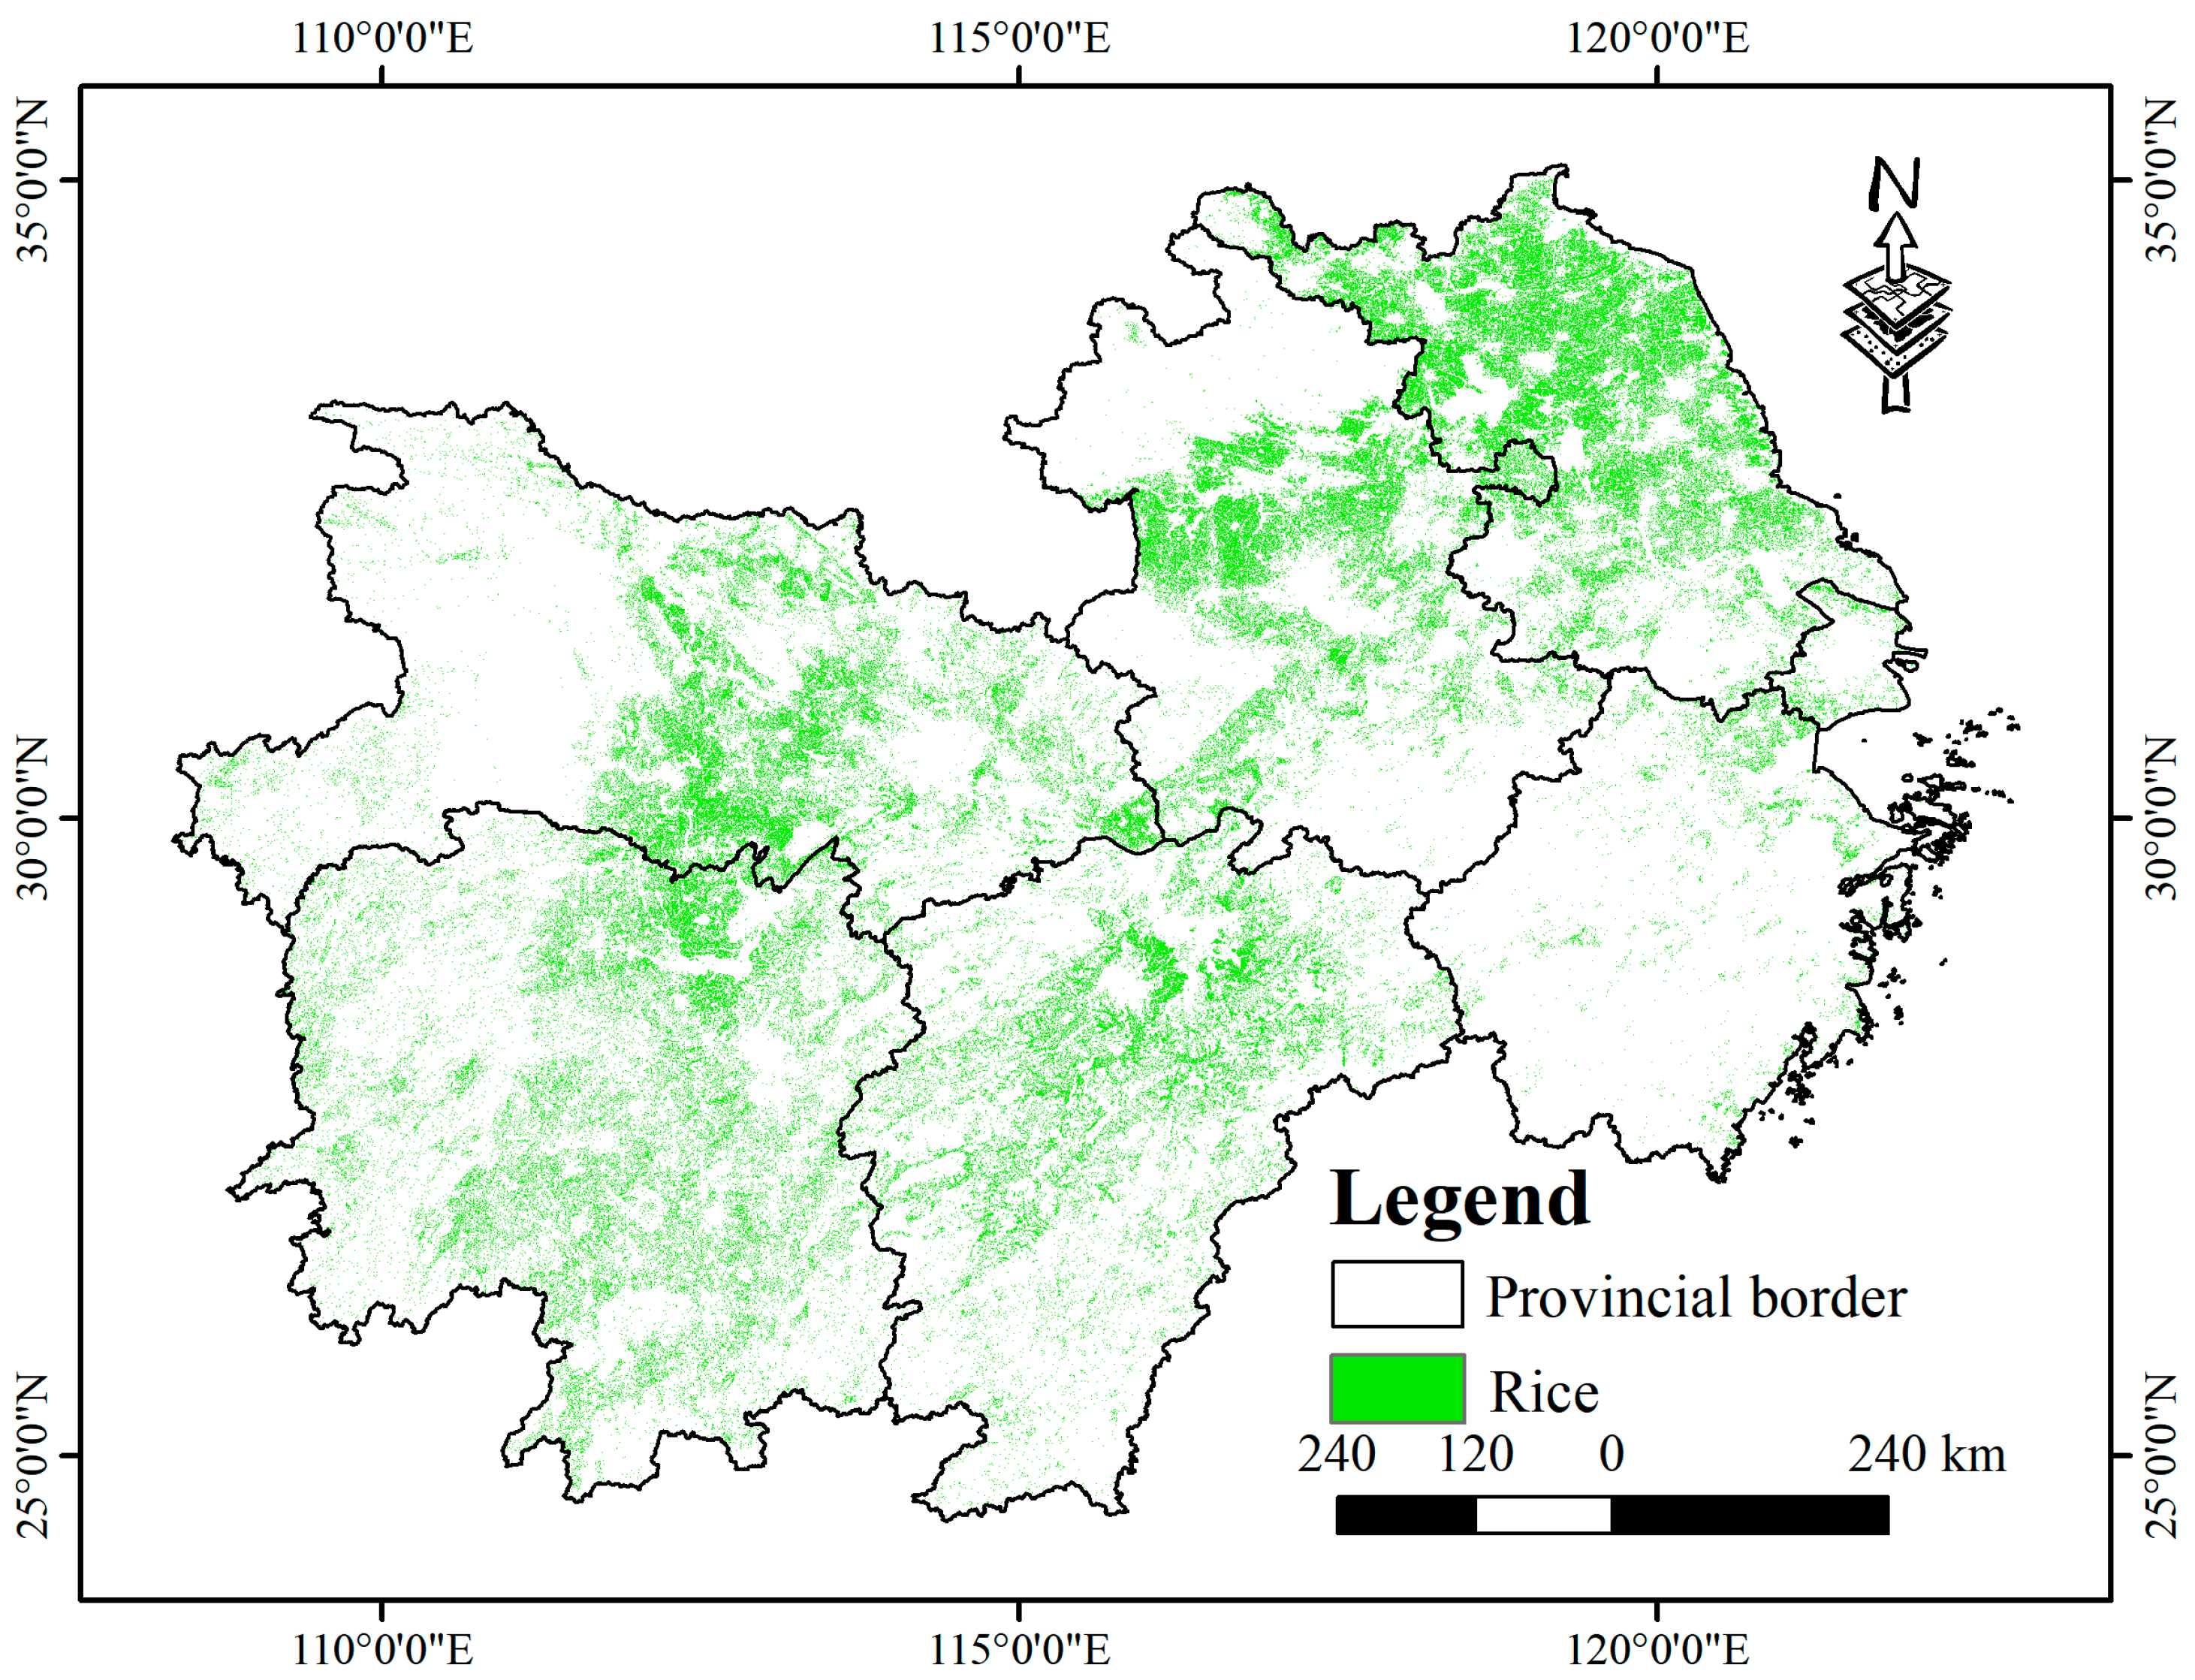
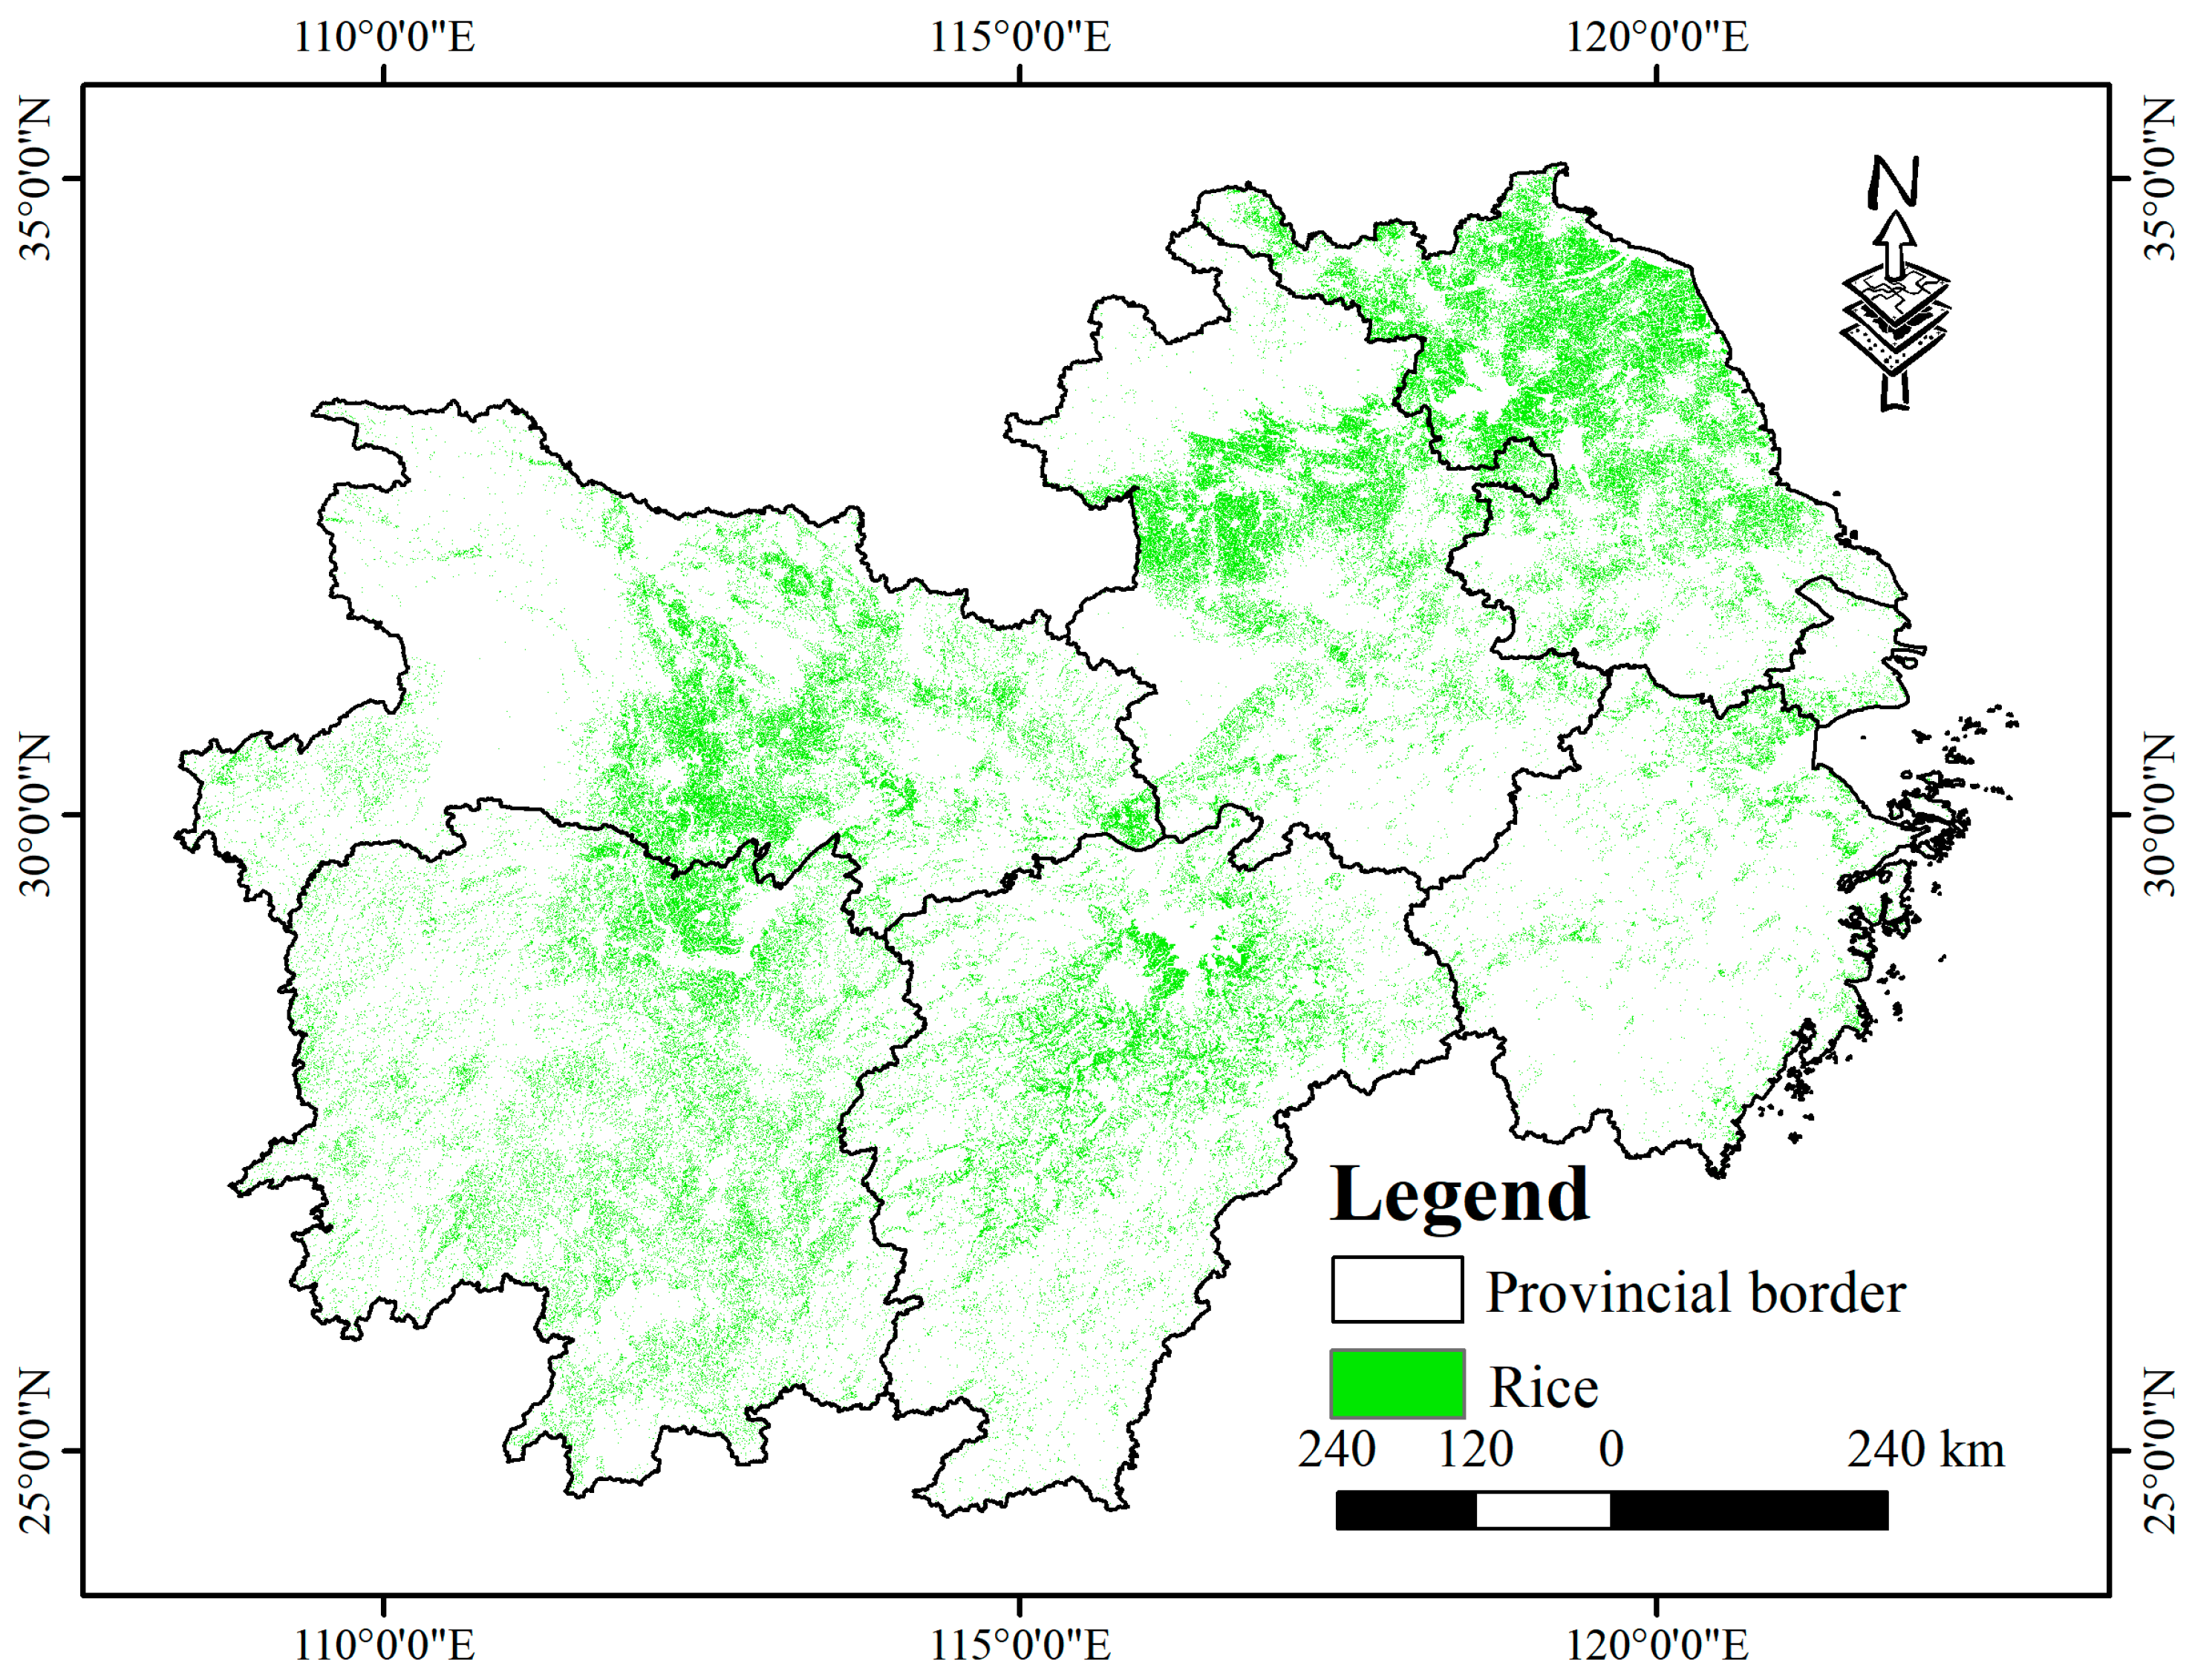
Using the proposed methods, rice cultivation was successfully mapped across six provinces and one municipality in the middle and lower reaches of the Yangtze River (Figure 20, Figure 21 and Figure 22). The results show that rice in Anhui and Hubei provinces is clearly clustered by region, while in Hunan, Jiangxi, and Jiangsu provinces, cultivation is widespread. Zhejiang Province, with its complex terrain and limited plains, shows fragmented and scattered rice fields, whereas Shanghai’s cultivation is concentrated in suburban zones. Overall, rice is mainly distributed in areas with flat terrain, fertile soils, abundant water, and favorable climatic conditions.
Figure 20.
2022 rice distribution map for the middle and lower Yangtze River region.
Figure 21.
2023 rice distribution map for the middle and lower Yangtze River region.
Figure 22.
2024 rice distribution map for the middle and lower Yangtze River region.
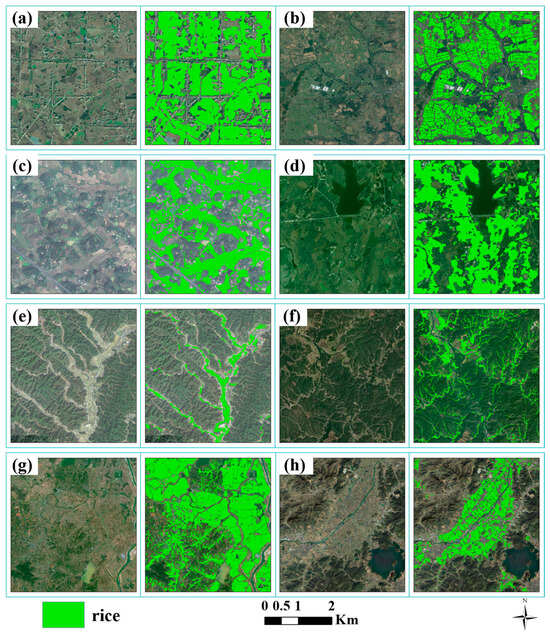
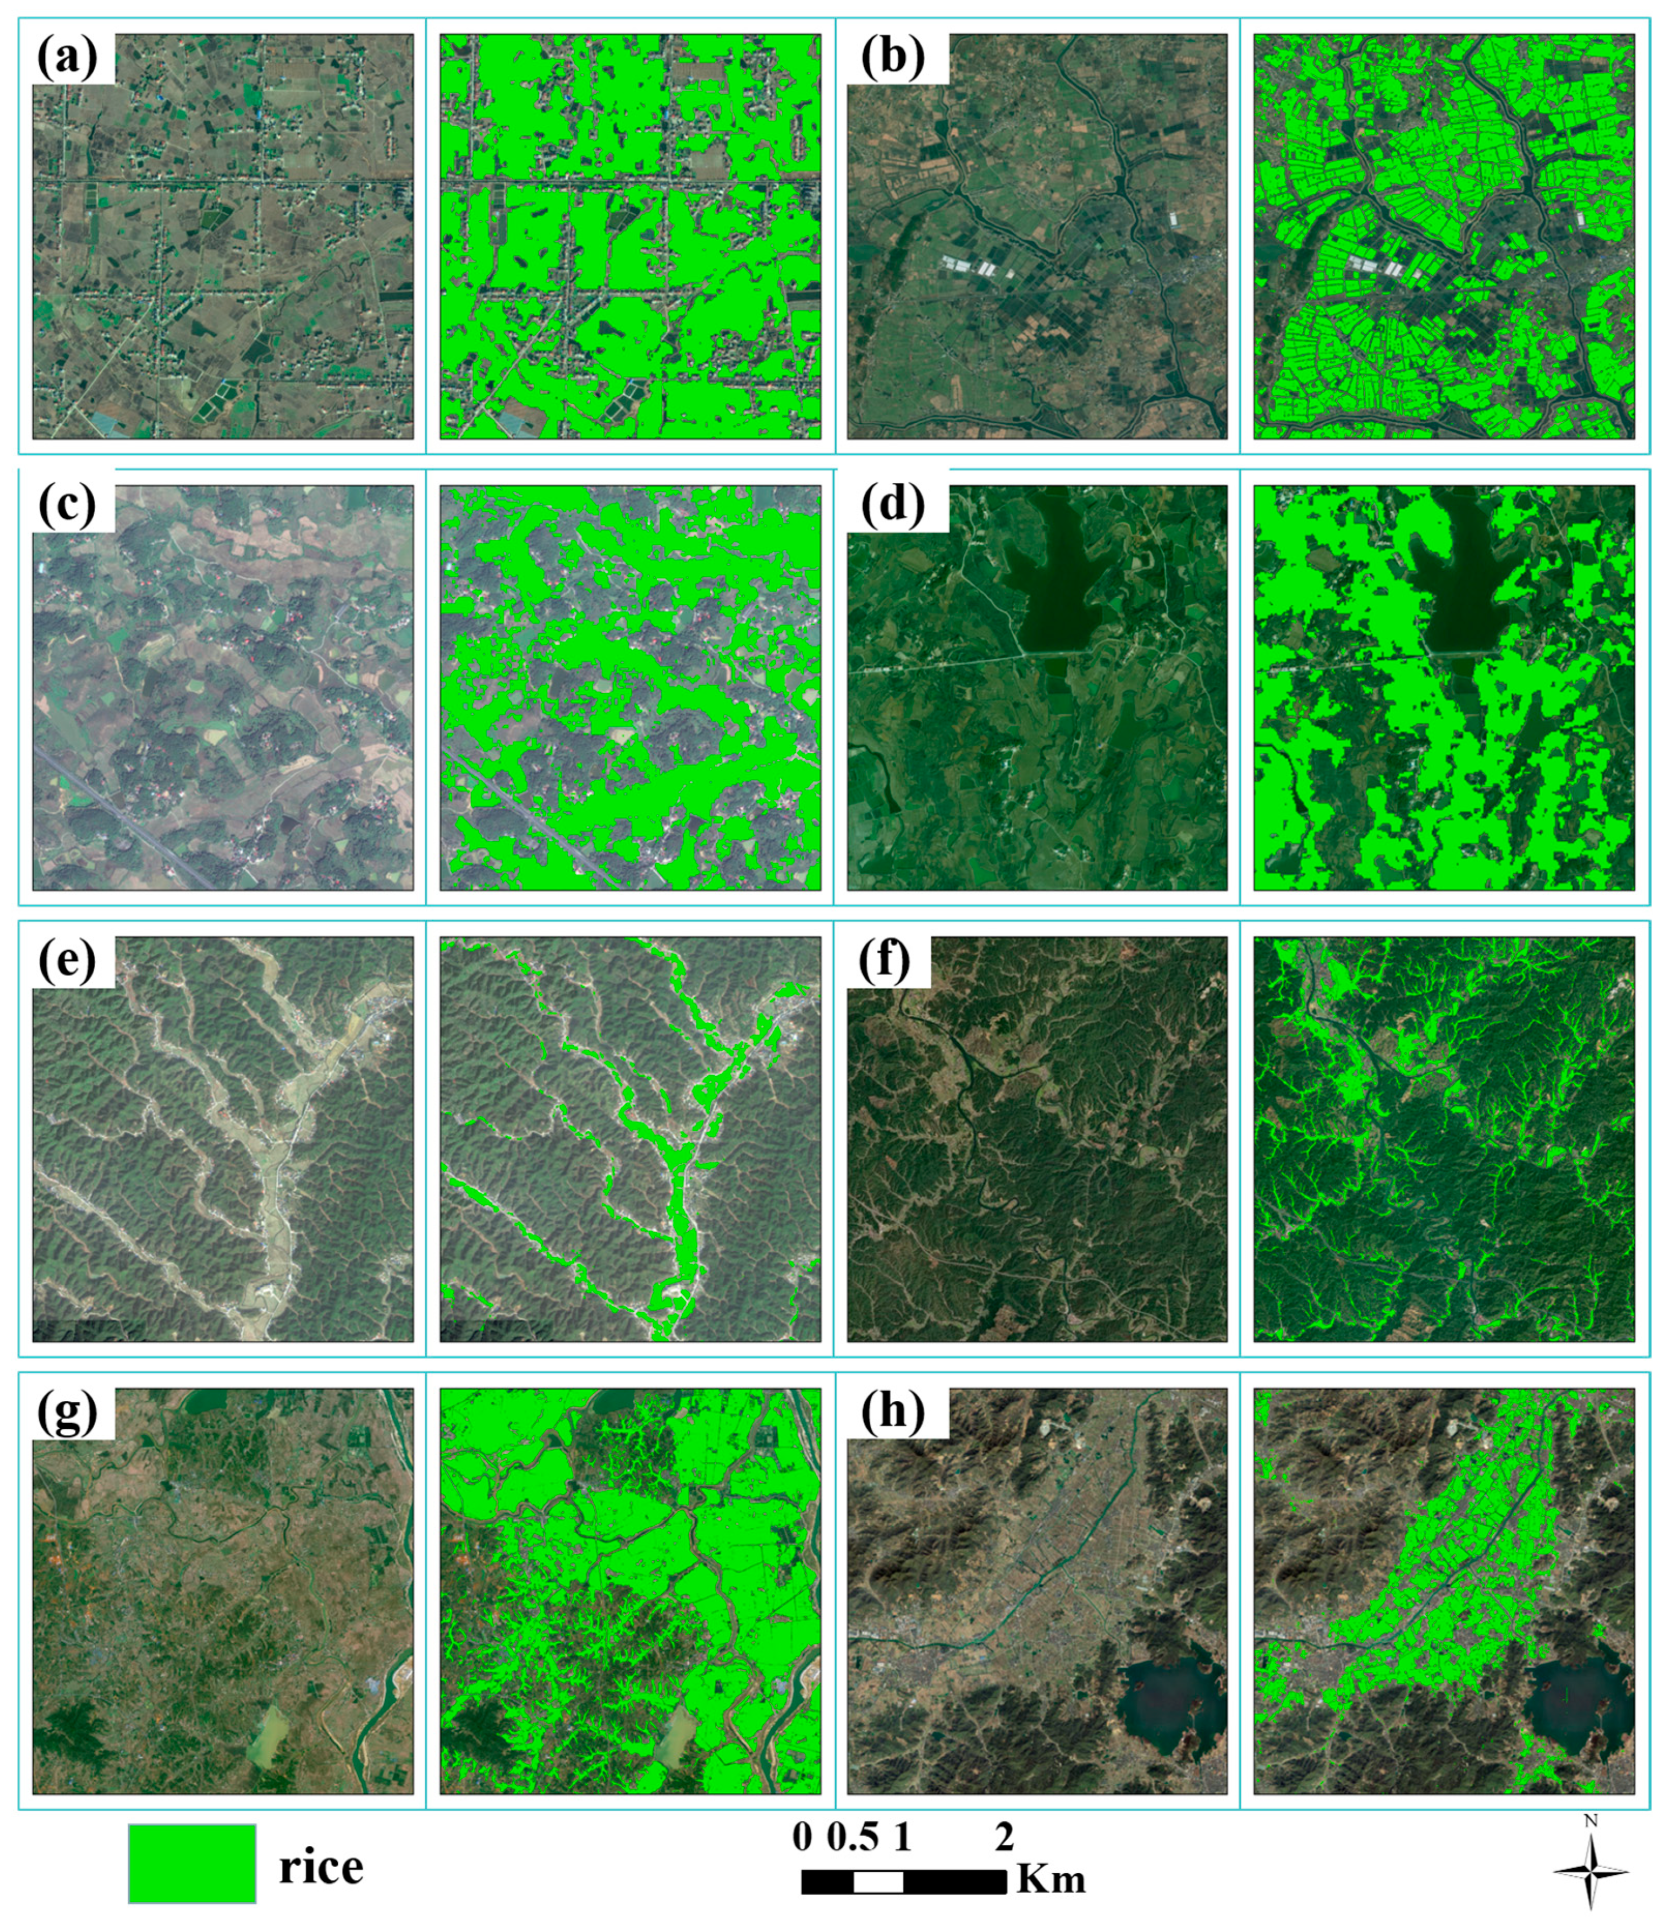
High-resolution comparisons (Figure 23) further illustrate the model’s robustness under different environments. Figure 23a,b show strong performance in plains such as Jiangsu and southern Anhui. Figure 23c,d reflect accurate recognition in mixed landscapes with ponds and terraces. Figure 23e,f depict rice fields in mountain valleys, while Figure 23g,h show effective mapping near major lakes and basins, including Poyang Lake and the Zhuji Basin. These results confirm that the model maintains reliable generalization and precision across diverse terrain and hydrological conditions within the study region.
Figure 23.
Comparison of Satellite map and Rice Mapping Results in Different Areas of the Study Region. (a,b) show classification results in plains. (c,d) reflect accurate recognition in mixed landscapes with ponds and terraces. (e,f) depict rice fields in mountain valleys. (g,h) show effective mapping near major lakes and basins.
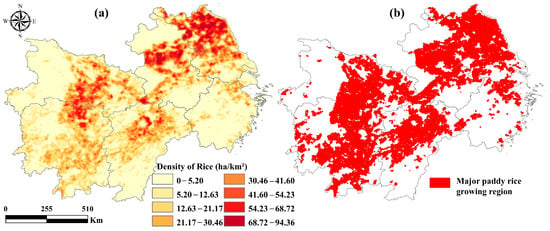
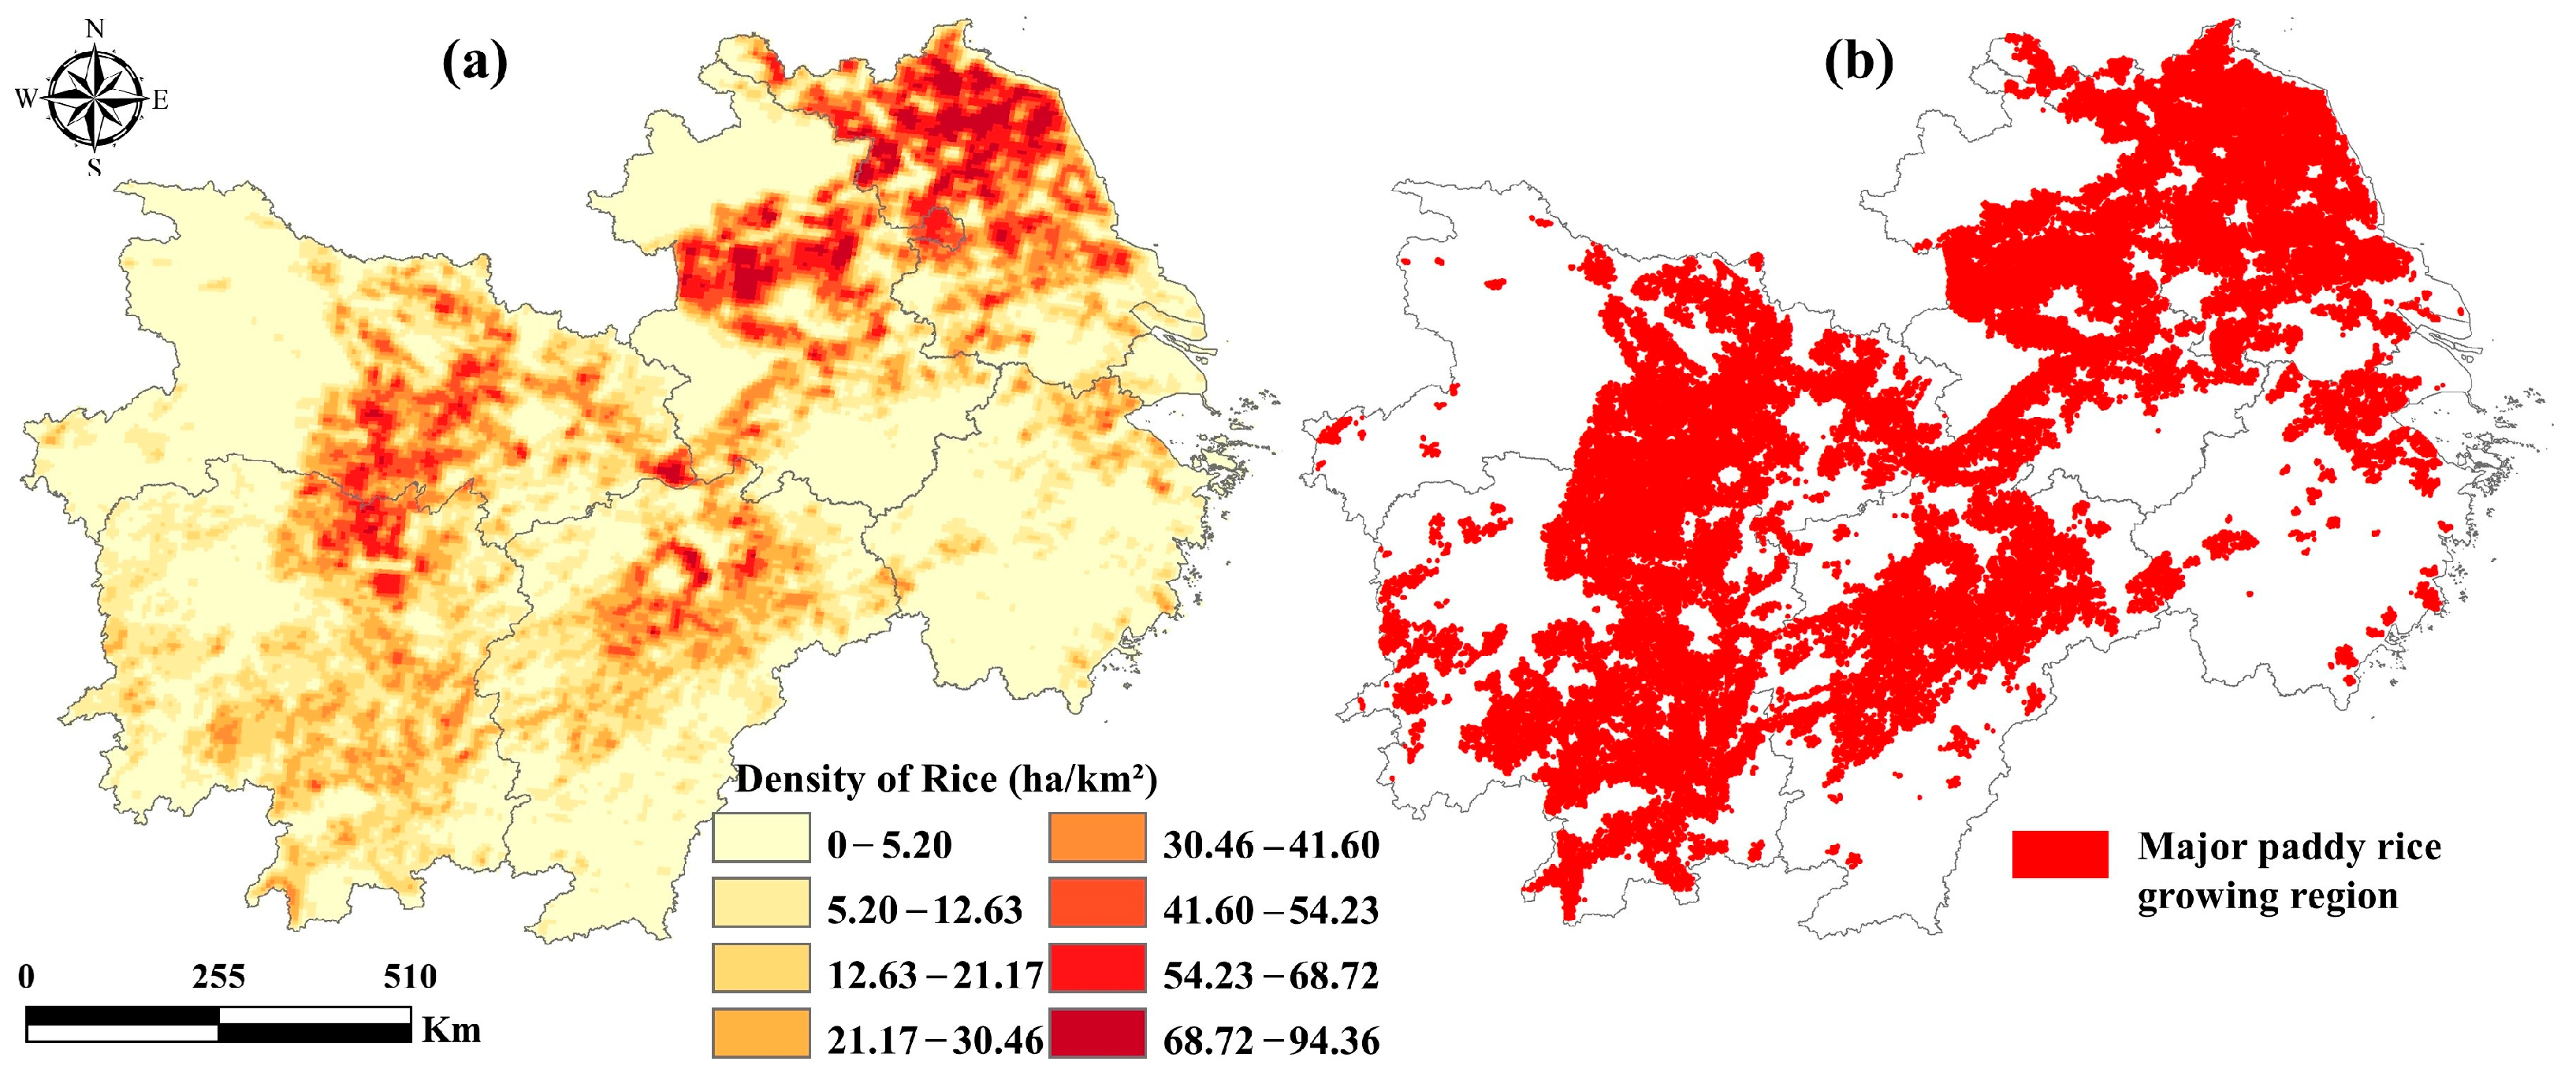
To analyze the spatial distribution of rice cultivation, kernel density estimation was applied to generate rice density maps, and spatial clustering was assessed using the local Moran’s I index (Figure 24). High-density rice zones were concentrated in central and northern Jiangsu, central Anhui, central Hubei, northern Hunan, and central Jiangxi, with mean densities above 41.6 ha/km2 and local peaks near 94 ha/km2. These statistically significant clusters reflect strong spatial aggregation of rice cultivation in major production areas.
Figure 24.
The planting densities (a) and major growing regions (b) of rice in study area.
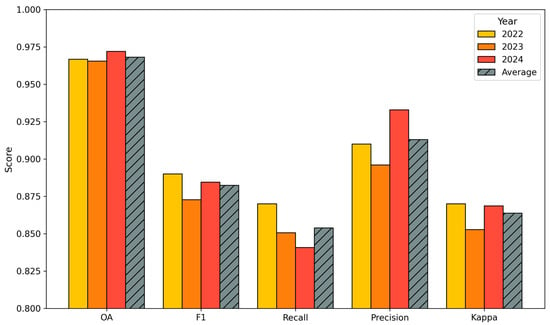
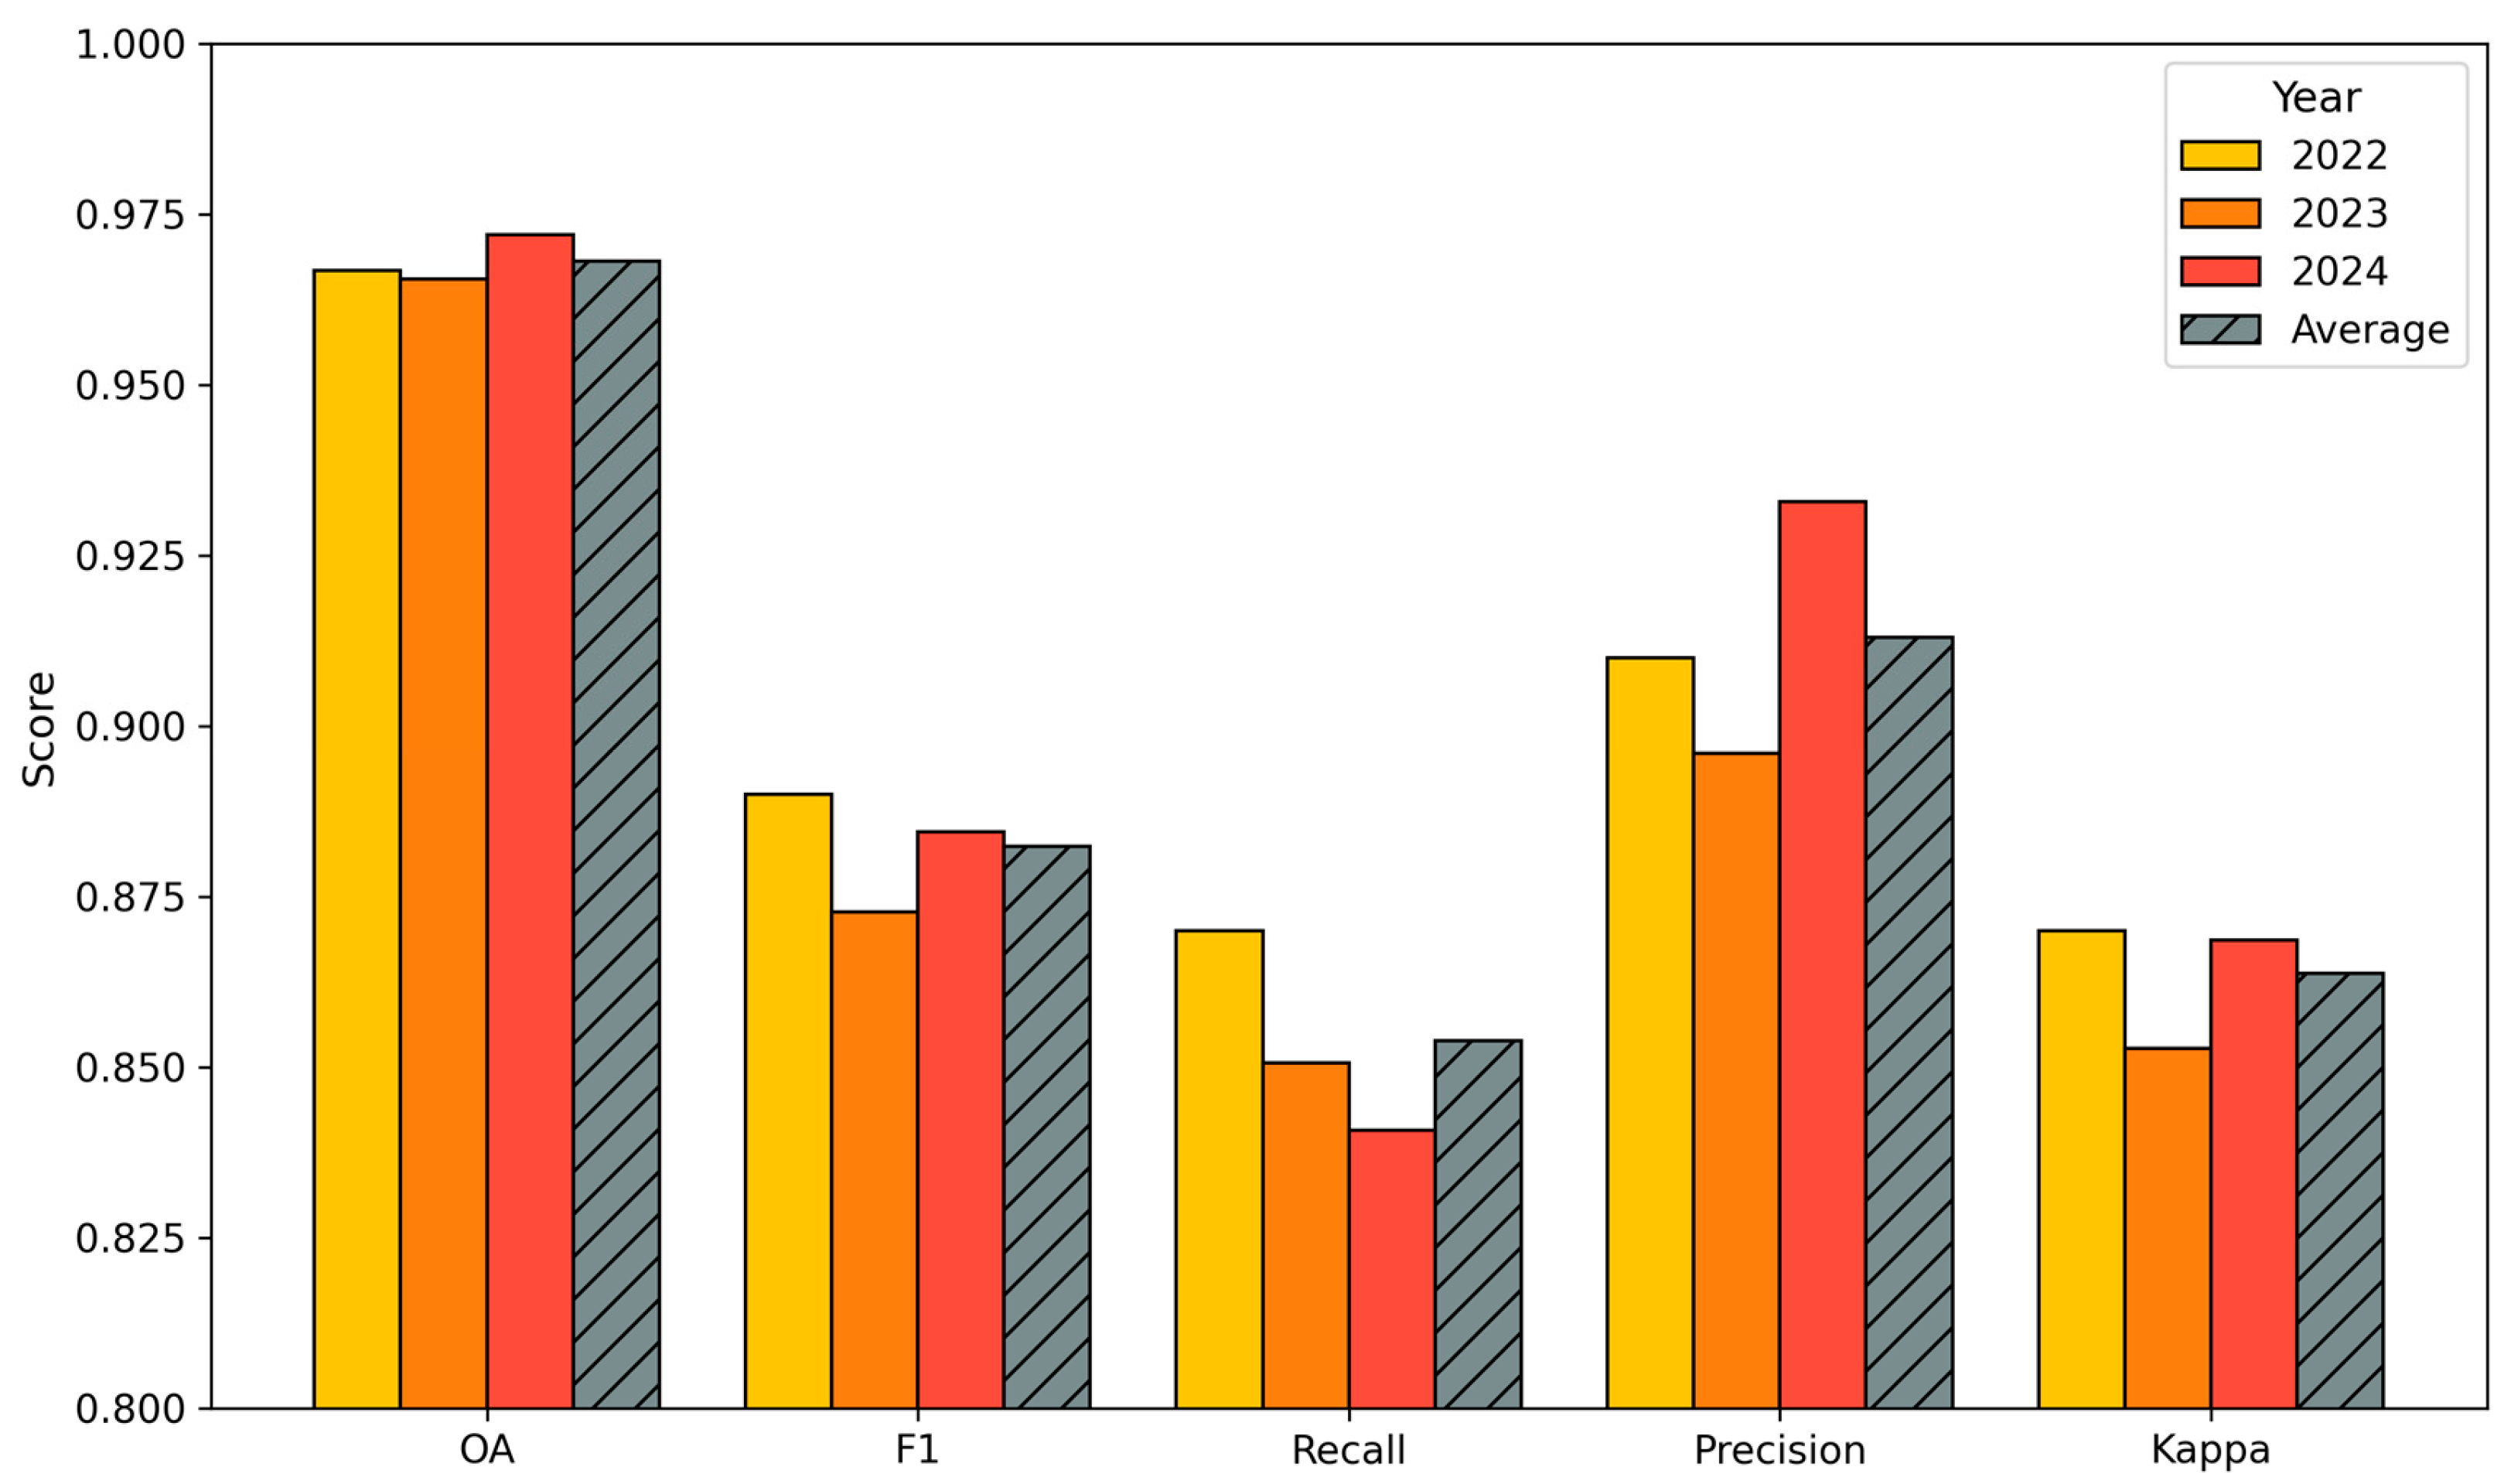
Model performance was further evaluated for 2022, 2023, and 2024 using independent validation samples (Figure 25). The results show stable and high accuracy across years, with overall accuracy ranging from 96.54% to 97.20%, F1 scores between 0.873 and 0.89, and Kappa coefficients from 0.853 to 0.87. Precision reached 0.933 in 2024, and recall remained between 0.841 and 0.87. On average, the model achieved an overall accuracy of 96.81%, an F1 score of 0.882, a recall of 0.854, a precision of 0.913, and a Kappa of 0.864, confirming robust and consistent temporal performance.
Figure 25.
Accuracy assessment of rice mapping results in the middle and lower Yangtze River Basin from 2022 to 2024. Bars represent five key metrics—overall accuracy (OA), F1 score, recall, precision, and Kappa coefficient across three years, with diagonally hatched bars indicating the multi-year average for each metric.
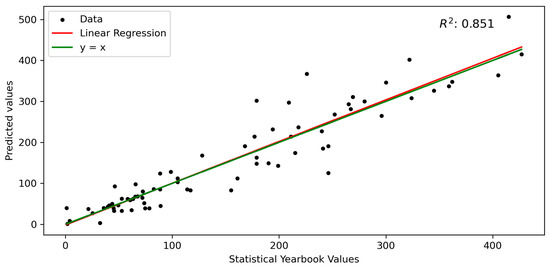
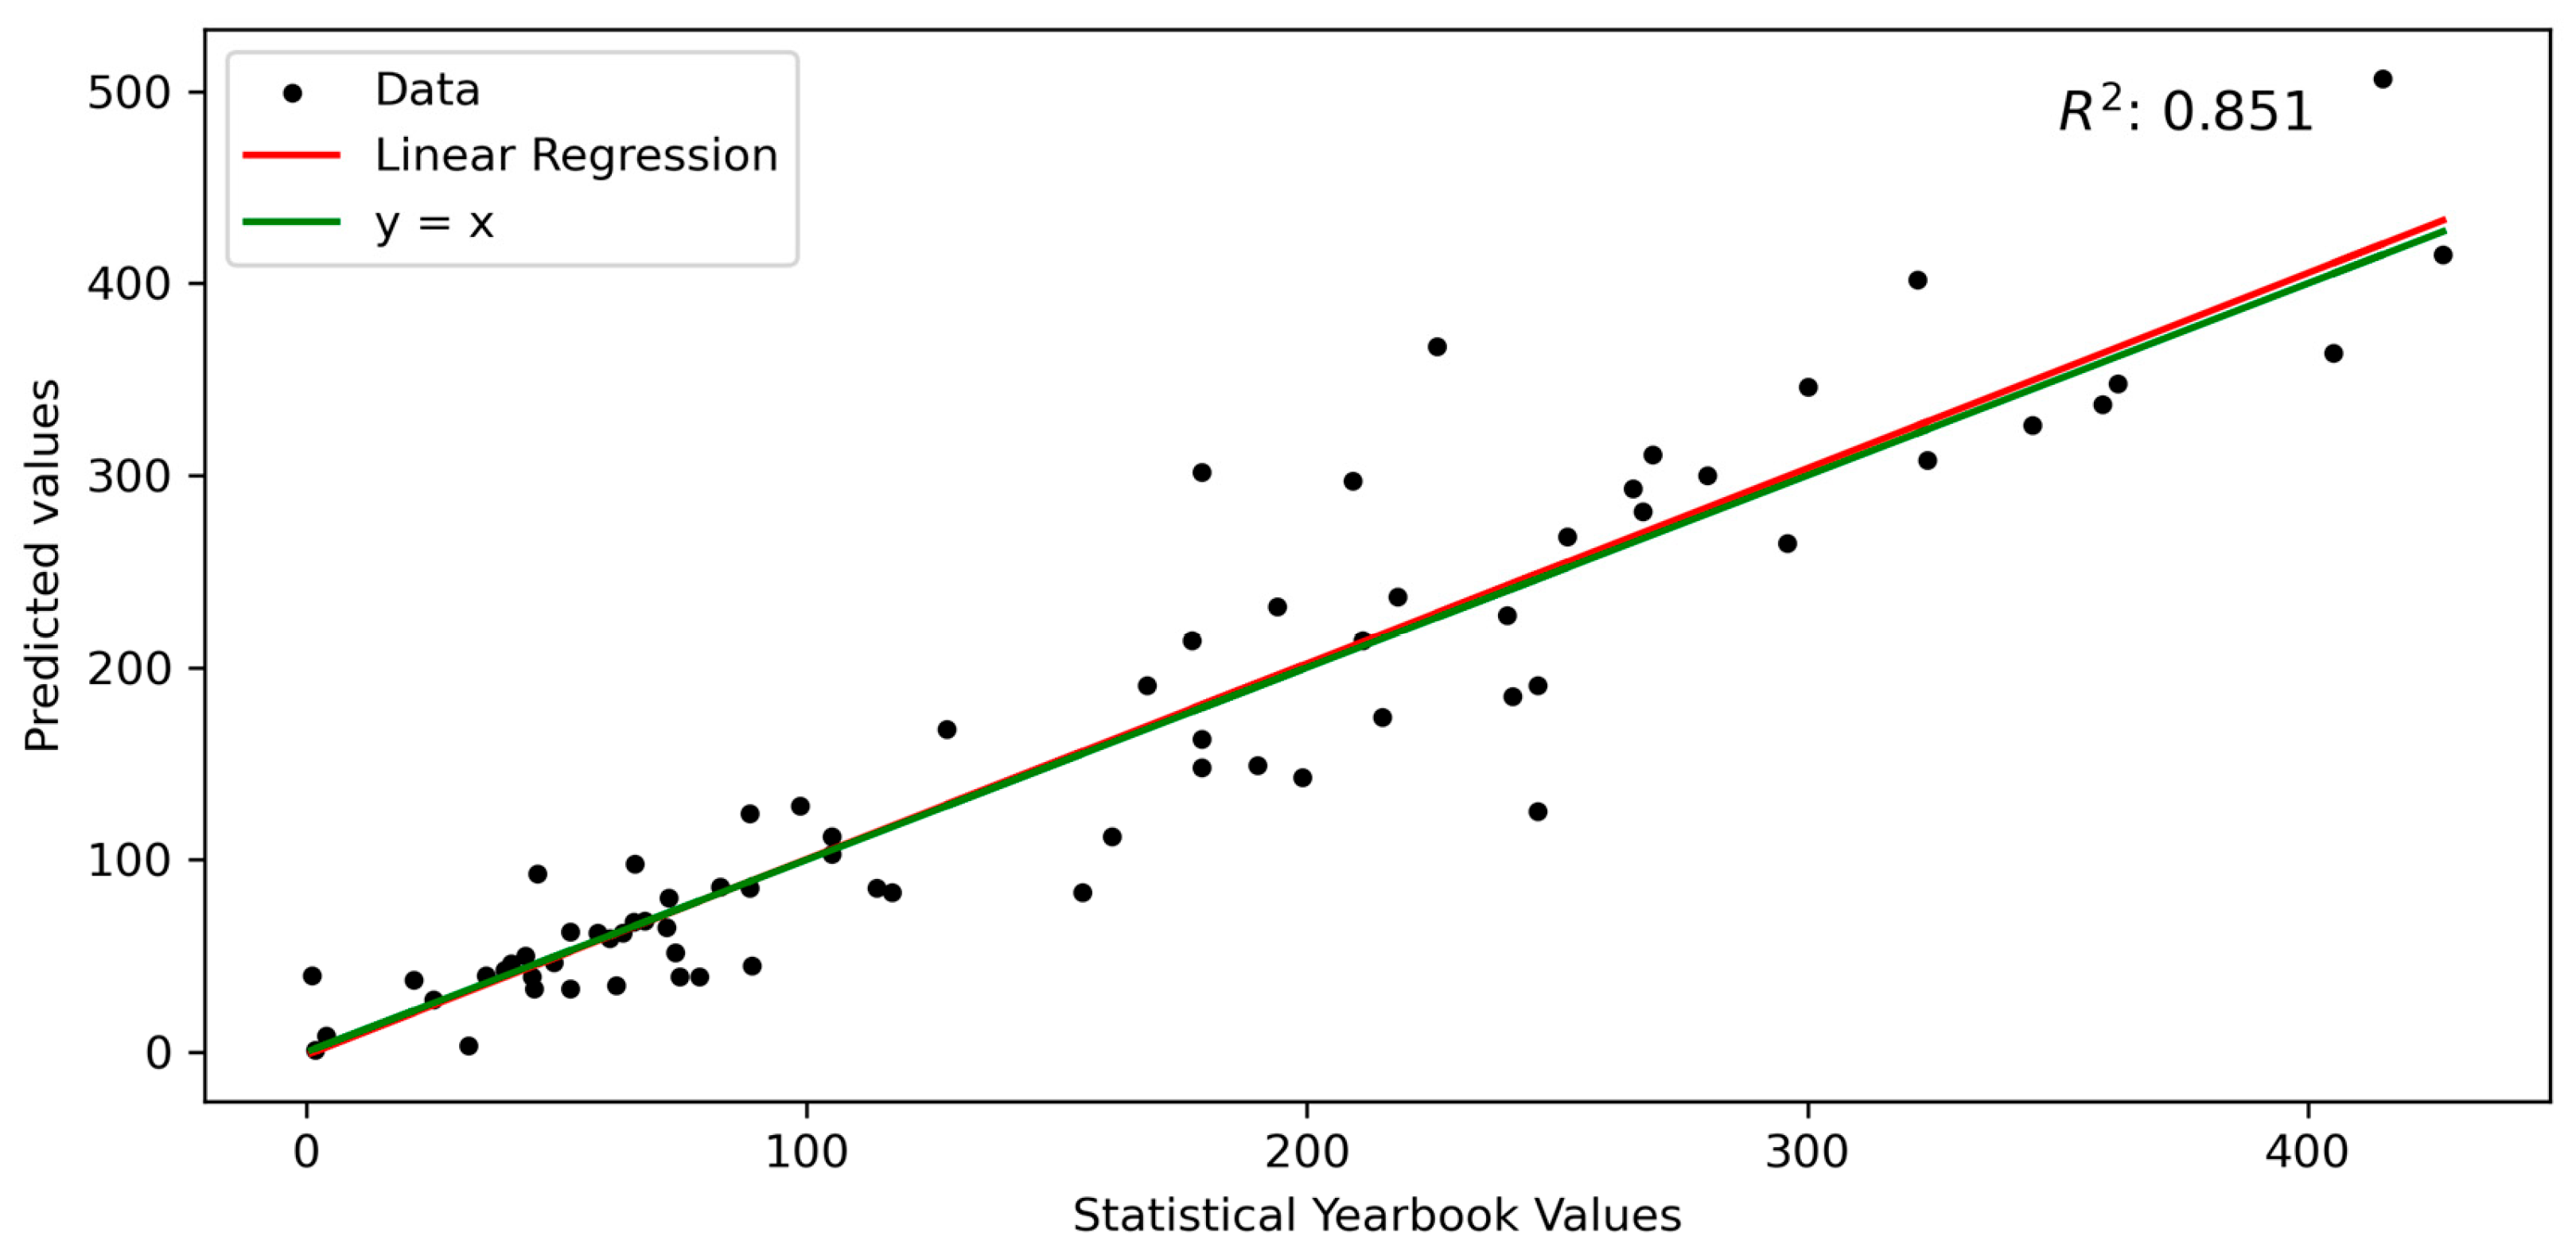
Comparison with official municipal statistics (Figure 26) showed a strong correlation between predicted and reported rice areas, with an R2 of 0.851. This agreement demonstrates that the proposed framework can produce reliable large-scale rice distribution data suitable for supporting agricultural monitoring and policy applications.
Figure 26.
Comparison between remote sensing-derived rice planting areas and statistical yearbook data. Black dots represent sample points, the red line indicates linear regression fitting, and the green line denotes the ideal reference line y = x. The high coefficient of determination confirms strong consistency between predicted and reported values.
5. Discussion
5.1. Model Performance, Generalization, and Practical Implications
This study develops a progressive deep learning crop mapping (PDLCM) framework for large-scale rice mapping in the middle and lower Yangtze River Basin, aiming to address sample scarcity, environmental heterogeneity, and multi-source data inconsistency. By integrating spatiotemporal feature fusion with iterative sample enhancement, the framework enables stable 10 m rice mapping over more than one million square kilometers using a limited set of initial samples. Spatial and temporal transfer analyses indicate that the model maintains reliable performance within several hundred kilometers of the training area and across most years, while accuracy degradation is mainly associated with climatic and phenological gradients, terrain complexity, and regional differences in image availability and quality. These results highlight both the effectiveness of the proposed framework for large-area applications and the key factors constraining its generalization, providing a basis for discussing model transferability to other regions and crops as well as computational feasibility for operational deployment.
From a transferability perspective, the PDLCM framework is not restricted to the Yangtze River Basin and can be extended to other rice-growing regions. In regions such as Northeast China, where rice cultivation is dominated by single-season systems with relatively homogeneous phenology and fewer cloud-related data gaps, the framework is expected to be more easily transferable. Based on the observed spatial generalization patterns and previous related studies [26], effective transfer can be achieved either by fine-tuning the trained model using a small number of local samples or by retraining the model when sufficient region-specific samples are available. For other crop types with distinct phenological characteristics, adaptations such as adjusting temporal feature representations and incorporating crop-specific growth indicators would be required, while the progressive learning and sample enhancement strategy remains applicable.
Computational efficiency is an important consideration for large-area operational applications. In this study, model training and inference were conducted on a workstation equipped with an Intel i9-13900 CPU, an NVIDIA RTX 4090 GPU (24 GB VRAM), and 64 GB RAM. Excluding data download, preprocessing, and code development, model training required approximately 4.3 h, and large-area inference over the entire study region required approximately 6.7 h. The main computational bottleneck lies in data acquisition and preprocessing, as the total volume of Sentinel-1 and Sentinel-2 data processed for the three study years reached approximately 6 TB. These results indicate that, while the deep learning model itself is computationally feasible for large-scale mapping, further efficiency gains could be achieved through cloud-based computing and distributed processing, which will be explored in future work.
5.2. Methodological Limitations and Outlook
In this study, Sentinel-1/2 time-series data were used to characterize the spatio-temporal dynamics of rice growth. To alleviate temporal misalignment across regions at large scales, Sentinel-1 images were synthesized at a 12-day interval, and Sentinel-2 images and indices were composited over the full growing season. Despite partially reducing temporal inconsistencies, gaps in Sentinel-1 time series remained uneven across regions, which required downscaling regions with denser temporal coverage to ensure consistency in the training data. This process likely reduced the effective information content and negatively affected model generalization. Recent remote sensing foundation datasets, such as Google Satellite Embedding [38], integrate multimodal information, including optical and radar observations, climate variables, textual descriptions, and vector layers, into low-dimensional embeddings, showing strong potential for large-scale crop mapping. However, their performance in multi-year mapping over large and heterogeneous regions has not yet been systematically validated, and limitations remain in terms of interpretability and data update frequency.
The proposed PDLCM method primarily addresses two major challenges in large-scale rice identification and mapping studies. First, it tackles the issue of the substantial data requirements and the difficulties in obtaining sample labels needed for large-scale crop mapping using deep learning. Second, it employs an iterative training approach to resolve discrepancies in sample regions across large areas and to recognize special sample regions. Experimental results demonstrated the effectiveness of this method in large-scale rice mapping, offering valuable insights for future crop mapping across broader regions. However, the method heavily relies on the expert knowledge, and the extended label datasets generated using the random forest tool still face accuracy issues. This highlights the need for further research to improve the precision of the label sets.
Moreover, while the model’s spatiotemporal generalization was preliminarily assessed, its behavior under varying environmental and sensor conditions warrants deeper investigation. Future studies should explore how differences in crop phenology, image acquisition timing, and sensor coverage affect model performance. Additional efforts are also needed to improve transferability across unseen regions and years by refining model structure and incorporating strategies for dynamic temporal alignment.
6. Conclusions
This study tackled the challenges of large-scale rice mapping in the middle and lower Yangtze River Basin by integrating time-series Sentinel-1/2 imagery, deep learning techniques, and a novel Progressive Deep Learning Crop Mapping (PDLCM) framework. Leveraging this approach, we successfully produced high-resolution (10 m) rice distribution maps for three consecutive years (2022–2024), covering over one million square kilometers across six provinces and one municipality. This marks one of the first deep learning–based efforts to achieve temporally continuous, large-area rice mapping at such resolution and scale.
The proposed method demonstrates several technical advantages. It combines spatiotemporal feature fusion with an iterative training strategy that progressively incorporates both positive and negative samples, effectively addressing challenges related to sample scarcity, class imbalance, and environmental heterogeneity. The resulting maps exhibit high classification accuracy (an OA exceeding 96%, an F1 score of 0.89, and R2 of 0.85), underscoring the robustness and applicability of the framework under diverse agroecological conditions.
These findings provide a scalable and transferable solution for high-resolution crop mapping and contribute valuable methodological insights to the field of agricultural remote sensing. Future research should further enhance model generalization across time and space by refining network architectures and mitigating data inconsistencies caused by sensor and acquisition variability. Ultimately, this work lays a strong foundation for operational, data-driven monitoring of rice production, food security assessment, and sustainable agricultural management at regional to national scales.
Author Contributions
Conceptualization, L.Y., C.X., Z.C., J.H. and J.Z.; methodology, L.Y., J.H., H.M., L.W. and J.Z.; software, J.D., Y.W. and H.M.; validation, L.Y., J.D., J.H. and Y.W.; formal analysis, L.Y., C.X., Y.W. and J.Z.; investigation, J.D., J.H. and Z.C.; resources, C.X., J.H., Y.W., Z.C. and J.Z.; data curation, L.Y. and Y.W.; writing—original draft preparation, L.Y., J.D., Z.C., J.H. and J.Z.; writing—review and editing, J.D., C.X., Y.W., H.M. and L.W.; visualization, J.D., J.H., Y.W. and L.W.; supervision, H.M., C.X. and L.W.; project administration, L.Y., J.H. and J.Z.; funding acquisition, L.Y., H.M. and J.Z. All authors have read and agreed to the published version of the manuscript.
Funding
This research was funded by the National Natural Science Foundation of China (42201412, 42401400) and the National Key R&D Program of China (2023YFB3906201-02, 2022YFD2000100).
Data Availability Statement
All rice mapping products (2022–2024) and source codes are publicly available (https://doi.org/10.6084/m9.figshare.29336981, accessed on 5 January 2026).
Acknowledgments
We express our deepest gratitude to the reviewers and editors for their suggestions.
Conflicts of Interest
The authors declare no conflicts of interest.
References
- Dong, J.; Xiao, X. Evolution of regional to global paddy rice mapping methods: A review. J. Photogramm. Remote Sens. 2016, 119, 214–227. [Google Scholar] [CrossRef] [Scilit]
- Funk, C.C.; Brown, M.E. Declining global per capita agricultural production and warming oceans threaten food security. Food Secur. 2009, 1, 271–289. [Google Scholar] [CrossRef] [Scilit]
- Zhan, P.; Zhu, W.; Li, N. An automated rice mapping method based on flooding signals in synthetic aperture radar time series. Remote Sens. Environ. 2021, 252, 112112. [Google Scholar] [CrossRef] [Scilit]
- Chandio, A.A.; Gokmenoglu, K.K.; Ahmad, M.; Jiang, Y. Towards sustainable rice production in Asia: The role of climatic factors. Earth Syst. Environ. 2022, 6, 1–14. [Google Scholar] [CrossRef] [Scilit]
- Chang, S.; Benjamin, E.O.; Sauer, J. Factors influencing the adoption of sustainable agricultural practices for rice cultivation in Southeast Asia: A review. Agron. Sustain. Dev. 2024, 44, 27. [Google Scholar] [CrossRef] [Scilit]
- Frazier, A.G.; Yen, B.T.; Stuecker, M.F.; Nelson, K.M.; Sander, B.O.; Kantar, M.B.; Wang, D.R. Impact of historical climate variability on rice production in Mainland Southeast Asia across multiple scales. Anthropocene 2022, 40, 100353. [Google Scholar] [CrossRef] [Scilit]
- Bargiel, D. A new method for crop classification combining time series of radar images and crop phenology information. Remote Sens. Environ. 2017, 198, 369–383. [Google Scholar] [CrossRef] [Scilit]
- Manjunath, K.R.; More, R.S.; Jain, N.K.; Panigrahy, S.; Parihar, J.S. Mapping of rice-cropping pattern and cultural type using remote-sensing and ancillary data: A case study for South and Southeast Asian countries. Int. J. Remote Sens. 2015, 36, 6008–6030. [Google Scholar] [CrossRef] [Scilit]
- Roy, D.P.; Wulder, M.A.; Loveland, T.R.; Woodcock, C.E.; Allen, R.G.; Anderson, M.C.; Helder, D.; Irons, J.R.; Johnson, D.M.; Kennedy, R.; et al. Landsat-8: Science and product vision for terrestrial global change research. Remote Sens. Environ. 2014, 145, 154–172. [Google Scholar] [CrossRef] [Scilit]
- Tran, K.H.; Zhang, H.; McMaine, J.T.; Zhang, X.Y.; Luo, D. 10 m crop type mapping using Sentinel-2 reflectance and 30 m cropland data layer product. Int. J. Appl. Earth Obs. Geoinf. 2022, 107, 102692. [Google Scholar] [CrossRef] [Scilit]
- Zhang, X.; Wu, B.F.; Ponce-Campos, G.E.; Zhang, M.; Chang, S.; Tian, F.Y. Mapping up-to-Date Paddy Rice Extent at 10 M Resolution in China through the Integration of Optical and Synthetic Aperture Radar Images. Remote Sens. 2018, 10, 1200. [Google Scholar] [CrossRef] [Scilit]
- Canisius, F.; Shang, J.L.; Liu, J.G.; Huang, X.D.; Ma, B.L.; Jiao, X.F.; Geng, X.Y.; Kovacs, J.M.; Walters, D. Tracking crop phenological development using multi-temporal polarimetric Radarsat-2 data. Remote Sens. Environ. 2018, 210, 508–518. [Google Scholar] [CrossRef] [Scilit]
- Xiao, X.; Boles, S.; Frolking, S.; Salas, W.; Moore, B., III; Li, C.; He, L.; Zhao, R. Observation of flooding and rice transplanting of paddy rice fields at the site to landscape scales in China using VEGETATION sensor data. Int. J. Remote Sens. 2002, 23, 3009–3022. [Google Scholar] [CrossRef] [Scilit]
- Yang, L.; Huang, R.; Huang, J.; Lin, T.; Wang, L.; Mijiti, R.; Wei, P.; Tang, C.; Shao, J.; Li, Q.; et al. Semantic Segmentation Based on Temporal Features: Learning of Temporal-Spatial Information From Time-Series SAR Images for Paddy Rice Mapping. IEEE Trans. Geosci. Remote Sens. 2022, 60, 1–16. [Google Scholar] [CrossRef] [Scilit]
- You, N.S.; Dong, J.W.; Huang, J.X.; Du, G.M.; Zhang, G.L.; He, Y.L.; Yang, T.; Di, Y.Y.; Xiao, X.M. The 10-m crop type maps in Northeast China during 2017–2019. Sci. Data 2021, 8, 41. [Google Scholar] [CrossRef] [Scilit]
- Huang, C.; You, S.; Liu, A.; Li, P.; Zhang, J.; Deng, J. High-resolution national-scale mapping of paddy rice based on sentinel-1/2 data. Remote Sens. 2023, 15, 4055. [Google Scholar] [CrossRef] [Scilit]
- Lin, S.; Qi, Z.; Li, X.; Zhang, H.; Lv, Q.; Huang, D. A phenological-knowledge-independent method for automatic paddy rice mapping with time series of polarimetric SAR images. ISPRS-J. Photogramm. Remote Sens. 2024, 218, 628–644. [Google Scholar] [CrossRef] [Scilit]
- Weng, W.; Huang, J.; Yue, C.; Lyu, Z.; Xiao, Y.; Li, S.; Huang, R.; Peng, D.; Huang, C.; Bigirimana, F. Widespread land surface cooling from paddy rice cultivation revealed by global satellite mapping. Nat. Commun. 2025. [Google Scholar] [CrossRef] [Scilit]
- Boschetti, M.; Busetto, L.; Manfron, G.; Laborte, A.; Asilo, S.; Pazhanivelan, S.; Nelson, A. PhenoRice: A method for automatic extraction of spatio-temporal information on rice crops using satellite data time series. Remote Sens. Environ. 2017, 194, 347–365. [Google Scholar] [CrossRef] [Scilit]
- Shen, R.Q.; Peng, Q.Y.; Li, X.Q.; Chen, X.Z.; Yuan, W.P. CCD-Rice: A long-term paddy rice distribution dataset in China at 30 m resolution. Earth Syst. Sci. Data 2025, 17, 2193–2216. [Google Scholar] [CrossRef] [Scilit]
- Zhang, Z.; Xia, L.; Zhao, F.; Gu, Y.; Yang, J.; Zha, Y.; Wu, S.; Yang, P. Long history paddy rice mapping across Northeast China with deep learning and annual result enhancement method. Earth Syst. Sci. Data Discuss. 2025, 2025, 6851–6869. [Google Scholar] [CrossRef] [Scilit]
- Ge, J.; Zhang, H.; Zuo, L.; Xu, L.; Jiang, J.; Song, M.; Ding, Y.; Xie, Y.; Wu, F.; Wang, C. Large-scale rice mapping under spatiotemporal heterogeneity using multi-temporal SAR images and explainable deep learning. ISPRS-J. Photogramm. Remote Sens. 2025, 220, 395–412. [Google Scholar] [CrossRef] [Scilit]
- Liu, N.; Zhao, Q.; Williams, R.; Duan, S.; Liu, X.; Barrett, B. Enhanced Crop Mapping Using Polarimetric SAR Features and Time Series Deep Learning: A Case Study in Bei’an, China. IEEE Trans. Geosci. Remote Sens. 2025, 63, 1–17. [Google Scholar] [CrossRef] [Scilit]
- Wei, P.; Chai, D.; Huang, R.; Peng, D.; Lin, T.; Sha, J.; Sun, W.; Huang, J. Rice mapping based on Sentinel-1 images using the coupling of prior knowledge and deep semantic segmentation network: A case study in Northeast China from 2019 to 2021. Int. J. Appl. Earth Obs. Geoinf. 2022, 112, 102948. [Google Scholar] [CrossRef] [Scilit]
- Gao, Y.; Wallach, D.; Liu, B.; Dingkuhn, M.; Boote, K.; Singh, U.; Asseng, S.; Kahveci, T.; He, J.; Zhang, R.; et al. Comparison of three calibration methods for modeling rice phenology. Agric. For. Meteorol. 2020, 280, 107785. [Google Scholar] [CrossRef] [Scilit]
- Shen, R.; Dong, J.; Yuan, W.; Han, W.; Ye, T.; Zhao, W. A 30 m Resolution Distribution Map of Maize for China Based on Landsat and Sentinel Images. J. Remote Sens. 2022, 2022, 9846712. [Google Scholar] [CrossRef] [Scilit]
- Zhang, D.; Pan, Y.; Zhang, J.; Hu, T.; Zhao, J.; Li, N.; Chen, Q. A generalized approach based on convolutional neural networks for large area cropland mapping at very high resolution. Remote Sens. Environ. 2020, 247, 111912. [Google Scholar] [CrossRef] [Scilit]
- Liu, Y.H.; Zhong, Y.F.; Ma, A.L.; Zhao, J.; Zhang, L.P. Cross-resolution national-scale land-cover mapping based on noisy label learning: A case study of China. Int. J. Appl. Earth Obs. Geoinf. 2023, 118, 103265. [Google Scholar] [CrossRef] [Scilit]
- Zhou, C.; Huang, J.F.; Xiao, Y.J.; Du, M.Q.; Li, S.C. A novel approach: Coupling prior knowledge and deep learning methods for large-scale plastic greenhouse extraction using Sentinel-1/2 data. Int. J. Appl. Earth Obs. Geoinf. 2024, 132, 104073. [Google Scholar] [CrossRef] [Scilit]
- Adrian, J.; Sagan, V.; Maimaitijiang, M. Sentinel SAR-optical fusion for crop type mapping using deep learning and Google Earth Engine. ISPRS-J. Photogramm. Remote Sens. 2021, 175, 215–235. [Google Scholar] [CrossRef] [Scilit]
- Yang, L.; Huang, R.; Zhang, J.; Huang, J.; Wang, L.; Dong, J.; Shao, J. Inter-Continental Transfer of Pre-Trained Deep Learning Rice Mapping Model and Its Generalization Ability. Remote Sens. 2023, 15, 2443. [Google Scholar] [CrossRef] [Scilit]
- He, Z.; Li, S.H.; Chang, M.H.; Liu, Y.T.; Liu, K.T.; Wan, L.H.; Wang, Y. Novel Harmonic-Based Scheme for Mapping Rice-Crop Intensity at a Large Scale Using Time-Series Sentinel-1 and ERA5-Land Datasets. IEEE Trans. Geosci. Remote Sens. 2024, 62, 4406523. [Google Scholar] [CrossRef] [Scilit]
- Pan, B.; Zheng, Y.; Shen, R.; Ye, T.; Zhao, W.; Dong, J.; Ma, H.; Yuan, W. High Resolution Distribution Dataset of Double-Season Paddy Rice in China. Remote Sens. 2021, 13, 4609. [Google Scholar] [CrossRef] [Scilit]
- Xin, F.; Xiao, X.; Zhao, B.; Miyata, A.; Baldocchi, D.; Knox, S.; Kang, M.; Shim, K.; Min, S.; Chen, B.; et al. Modeling gross primary production of paddy rice cropland through analyses of data from CO2 eddy flux tower sites and MODIS images. Remote Sens. Environ. 2017, 190, 42–55. [Google Scholar] [CrossRef] [Scilit]
- Nelson, A.; Gumma, M.K. A map of lowland rice extent in the major rice growing countries of Asia. Harvard Dataverse. 2024. Available online: https://dataverse.harvard.edu/dataset.xhtml?persistentId=doi:10.7910/DVN/EQBNII (accessed on 5 January 2026).
- Wei, P.L.; Chai, D.F.; Lin, T.; Tang, C.; Du, M.Q.; Huang, J.F. Large-scale rice mapping under different years based on time-series Sentinel-1 images using deep semantic segmentation model. ISPRS-J. Photogramm. Remote Sens. 2021, 174, 198–214. [Google Scholar] [CrossRef] [Scilit]
- Chan, D.M.; Rao, R.; Huang, F.; Canny, J.F. GPU accelerated t-distributed stochastic neighbor embedding. J. Parallel Distrib. Comput. 2019, 131, 1–13. [Google Scholar] [CrossRef] [Scilit]
- Brown, C.F.; Kazmierski, M.R.; Pasquarella, V.J.; Rucklidge, W.J.; Samsikova, M.; Zhang, C.; Shelhamer, E.; Lahera, E.; Wiles, O.; Ilyushchenko, S. Alphaearth foundations: An embedding field model for accurate and efficient global mapping from sparse label data. arXiv 2025, arXiv:2507.22291. [Google Scholar] [CrossRef] [Scilit]

Disclaimer/Publisher’s Note: The statements, opinions and data contained in all publications are solely those of the individual author(s) and contributor(s) and not of MDPI and/or the editor(s). MDPI and/or the editor(s) disclaim responsibility for any injury to people or property resulting from any ideas, methods, instructions or products referred to in the content. |
© 2026 by the authors. Licensee MDPI, Basel, Switzerland. This article is an open access article distributed under the terms and conditions of the Creative Commons Attribution (CC BY) license.