


Highlights
What are the main findings?
- Empirically validated texture density standard: Established 1.26 mm2/texel as optimal resolution for photorealistic archaeological digital replicas in immersive HMD and desktop contexts, with explicit mathematical formula ensuring reproducibility across large-scale excavations (4770 m2 documented).
- Temporal integration methodology: Successfully merged 3D snapshots acquired across three excavation campaigns (2016–2018) with iterative structure removal, maintaining geometric and chromatic consistency through semi-automated texture merging workflows achieving homogeneous visual quality (1.15–1.32 mm2/texel range).
What are the implications of the main findings?
- Reproducible pipeline for urban archaeology: The complete open-source workflow (3DSC, EMtools, and EMviq available via GitHub) addresses documentation challenges in active construction environments, where in situ preservation is not feasible, enabling digital autoptic analysis of stratigraphic units through photorealistic models.
- Transparent virtual reconstruction framework: An extended matrix semantic documentation with four-level reliability classification (preserved–restoration–anastylosis–hypothesis) provides inspectable research process rather than black-box outputs, supporting peer validation and long-term reproducibility in archaeological interpretation.
Abstract
This contribution presents an integrated methodological pipeline for digital documentation and virtual reconstruction of large-scale urban archaeological excavations, developed through the Amba Aradam case study (Metro C line, Rome). The excavation revealed a 2nd-century A.D. military complex extending over 4770 m2 at depths reaching 20 m, documented through multiple photogrammetric campaigns (2016–2018) as structures were progressively excavated and removed. We established an empirically validated texture density standard (1.26 mm2/texel) for photorealistic digital replicas suitable for immersive HMD and desktop exploration, with an explicit texture density calculation formula ensuring reproducibility. The temporal integration workflow merged 3D snapshots acquired across three excavation campaigns while maintaining geometric and chromatic consistency. Semantic documentation, through the extended matrix framework, recorded Virtual Stratigraphic Units linking archaeological evidence, comparative sources, and interpretative reasoning (paradata) for transparent virtual reconstruction. The complete pipeline, implemented through open-source 3DSC 1.4 and EMtools add-ons for Blender and Metashape v0.9 (available on GitHub), addresses specific challenges of documenting complex stratigraphic contexts within active construction environments where in situ preservation is not feasible. The spatial integration of the digital replica with previous archaeological data illuminated the urban evolution of Rome’s military topography during the 2nd–3rd centuries A.D., demonstrating the essential role of advanced digital documentation in contemporary urban archaeology.
1. Introduction
This contribution presents methods, tools, and technologies employed in the archaeological excavation (conducted under the scientific supervision of the Soprintendenza, initially by Rossella Rea and subsequently by Simona Morretta) of the Amba Aradam station of the underground line C in the city of Rome, in the years 2015–2018. The excavation of this significant context permits documenting the archaeological remains of several unknown ancient structures and, consequently, increase the comprehension of the urban topography of this area of the ancient Rome in relation to the urban fabric of the current city.
The goal of this research project is to use 3D technologies to collect, organize, analyze, and visualize relevant information connected to both discovered monumental complexes and their relationship with the present city. In particular, the wide extent of the excavation area, both in terms of area and depth with respect to the surface of the modern city, has required to rethink and adapt the standards of documentation and computer management of archaeological record. This methodological reflection involved the whole chain of activities carried out, from the archaeological excavation to the documentation and the reconstructive hypotheses and led to the development of ad hoc open-source software tools within the Extended Matrix [1,2,3,4,5,6] Framework (EMF) that can also be reused in other contexts: EMtools [7], 3DSC [8] and EMviq [9]. This software, under development by the Digital Heritage Innovation laboratory (DHILab) of the CNR-ISPC of Rome, is already available as open-source solutions on GitHub, with centralized access, documentation, and tutorials provided through the extended matrix project portal (https://extendedmatrix.org). This choice not only has allowed easily distribution of stable releases of these software to the scientific community but has also permitted developers to openly contribute to the development of these digital tools, ensuring long-term accessibility and reproducibility of the complete workflow.
This research activity was carried out within an institutional agreement between the National Research Council of Italy (CNR-ISPC) and the Soprintendenza Speciale Archeologia Belle Arti e Paesaggio di Roma for the study and public dissemination of the exceptional Amba Aradam archaeological context. This article should be understood as the first comprehensive publication documenting the complete methodological pipeline, focusing primarily on digital documentation procedures and technical workflows. A subsequent publication will address the virtual reconstruction in detail, presenting the archaeological and architectural analysis that here is only outlined from a procedural and methodological perspective, without entering the specificity of interpretative content and historical synthesis. Furthermore, the project focused on the estimation of geometric resolution and texture values (in relation to the unit of reference) necessary to develop different types of real time applications from mobile to desktop and from VR to immersive desktop through HMD. Finally, these tasks contributed to the creation of different dedicated tools of the add-on 3DSC, developed especially for the management of 3D survey data within Blender.
The complexity of the case study and the innovation proposed by some of the software solutions facilitated, during the project, the dialogue among specialists, such as those who collect or interpret the archaeological data, those who develop virtual reconstructive hypotheses (based on evidence and scientific sources), and those who work on exploitation and dissemination.
The contribution will treat a detailed presentation of the most innovative aspects applied to the digital documentation pipeline of the Amba Aradam excavation, keeping in consideration the state of the art in literature and trying to stimulate discussion regarding solutions and weaknesses concerning 3D visualization of complex multidimensional data related to historical urban fabric.
2. State of the Art
The term “virtual archaeology” has its origins in the late 1990s with the development of digital technologies in cultural heritage and was used by P. Reilly [10] to describe the use of computer-based simulations of archaeological excavations. Over the years, issues relating to the scientific simulated models of the past have been theoretically debated to ensure that computer-based visualisation methods of archaeological heritage are applied with academic rigour. In 2008, the so-called London Charter (http://www.londoncharter.org/introduction.html, accessed on 30 June 2025)—for which fundamentals had already been established in 2003 in the UNESCO Charter on the Preservation of the Digital Heritage (https://unesdoc.unesco.org/ark:/48223/pf0000229034, accessed on 30 June 2025)—was drafted and it currently regulates the principles of visualization in Cultural Heritage. In particular, it highlights the importance of collecting and structuring not only the sources used but also the interpretation made to achieve the simulation. In 2009, the Seville Principles (http://sevilleprinciples.com, accessed 30 June 2025) were arranged to apply the London Charter and to improve its implementation particularly in the field of archaeological heritage. Finally, in the last decades many scientific works (e.g., [2,3,11,12,13,14,15,16,17,18,19,20,21,22,23,24,25,26,27,28,29,30,31,32,33,34,35,36,37,38,39,40,41,42,43,44]) and consortium (e.g., (3DVisa, http://3dvisa.cch.kcl.ac.uk/index.html and V-Must.net, https://cordis.europa.eu/project/id/270404, accessed both on 30 June 2025) have contributed in defining thorough workflows, methods and tools to regulate the use of computer-based visualisation by scientific community and provide adequate mechanisms to declare the level of authenticity. This last aspect is fundamental since allows to distinguish what is objective data from what is result of speculation and interpretation.
The work of 3D reconstruction of the archaeological context of Metro C was based on a theoretical and methodological approach that refers to these principles to ensure intellectual transparency and avoid a “black box” effect [5,6]. The peculiarity of this case study is that both the 3D survey and the archaeological documentation have been rigorously collected and organized to be integrated into a virtual reconstruction project from the very beginning using a semantic approach based on the extended matrix formal language. Moreover, the modeling and visualization of the 3D data, carried out simultaneously with the excavation activities, allowed a better understanding of the relationships between the architectural volumes and spaces, which would otherwise be impossible inside the underground building site.
This article builds methodologically on previous work [45] that established the theoretical framework and technical implementation of Open World environments for cultural heritage documentation, particularly the Sarmizegetusa Ulpia Traiana case study. The Open World approach—enabling real-time exploration of large spatial extents through level-of-detail management—is applied extensively in the Amba Aradam project for scene construction and interactive visualization. For a comprehensive discussion of Open World principles, multi-resolution asset production, and related literature, readers are referred to that foundational work.
The Amba Aradam case study extends this framework by addressing three methodological aspects not fully explored in the literature: (1) Scale and temporal complexity: documentation of 4770 m2 at 20 m depth with iterative structure removal, requiring integration of 3D snapshots across three years while maintaining geometric and chromatic consistency. (2) Empirically validated quality standards: establishment of quantified texture density benchmarks (1.26 mm2/texel) through systematic testing on HMD and desktop platforms, with explicit texture density calculation formula for reproducibility (Equation (1)). (3) Integrated transparency framework: simultaneous development of digital replica, semantic documentation through extended matrix, and interactive interrogation tools from excavation inception, rather than retrospective application. While individual technical components draw on established photogrammetric and 3D modeling techniques, their systematic integration and quantification for large-scale urban archaeology conducted within active construction constraints address specific methodological gaps, particularly regarding temporal integration workflows and reproducible quality standards for immersive visualization.
3. The Excavation for the Amba Aradam Station of Rome’s Metro C: An Urban Archaeology Project
The archaeological investigations at the Amba Aradam station were carried out in an area of about 3000 square meters. The Metro C excavations represent a paradigm case of preventive archaeology in urban contexts [46], requiring innovative documentation strategies for large-scale infrastructure projects [47,48,49]. The discovery, from a depth of 9 m, of part of a military complex dating from the first half of the second century A.D., perhaps dating back to the emperor Hadrian, was exceptional. The complex consists of a long structure with a central corridor overlooked by 39 rooms, 16 square meters each, and two buildings perpendicular to the first, interpreted as the domus of the commander of the barracks and as the service wing. The barracks were abandoned, stripped of reusable materials, partly trimmed, and finally buried in the third century A.D. during the construction of the Aurelian Walls. The entire complex was built respecting the original orography along a waterway that ran parallel to the subsequent walls. The importance of the discovery is also due to its position (see Figure 1). Along the southern slopes of Mount Celio are the remains of various barracks: the Castra Nova Equitum Singularium, under the Basilica of San Giovanni in Laterano; the Castra Priora Equitum Singularium, at the entrance of the current Via Tasso; and the Castra Peregrina, near the church of Santo Stefano Rotondo. In summary, the southern slopes of the Celio, from the first half of the second century. A.D., constituted a large neighbourhood reserved for castra.
Figure 1.
Topography of the southern slopes of the Celio with location of the barracks (in red). In the southern part, the barracks of Viale Ipponio-Amba Aradam.
4. Materials and Methods
This section describes the complete methodological pipeline developed for the documentation, analysis, and virtual reconstruction of the Amba Aradam archaeological excavation. The workflow encompasses digital replica creation through photogrammetric survey; temporal integration of multiple acquisition campaigns; semantic data management through extended matrix; virtual reconstruction based on archaeological sources; and interactive visualization technologies.
4.1. Digital Replica: Concept and Operational Standards
One of the aims of the project was to obtain an Open World 3D environment (for a state of the art about the use of the open worlds in cultural heritage ([45], pp. 126–127) with a high level of visual quality. An Open World is a particular type of 3D model that can be explored in real time and is characterized by a large spatial extension, that includes 3D objects at different scales (such as a small artifact, a collection, a building, an architectural complex, a city, a territory, etc). This type of model has a particular data structure, organized according to increasing levels of detail. This approach, which combines reality-based models, high visual quality, and interactivity, within an Open World, is called Digital Replica (DR) and provides effective tools for study and dissemination [45].
Table 1 lists the seven contexts that compose the digital replica of the Amba Aradam excavation. These contexts were acquired from 2016 to 2018 as the excavation activity revealed new structures. Considering the extension of the digital replica and the large number of 3D surveys acquired during the excavation, it was necessary to define guidelines to keep the 3D data homogeneous. Each context has been segmented into tiles. The tile represents the minimum unit of digital replication and can correspond to an archaeological artifact, as in the case of barracks where each tile is equivalent to a single room. However, it can also include several or larger areas, as in the case of the gardens (context id 3). During the project, a standard was developed to define for each tile:
Table 1.
The Amba Aradam’s numbers: contexts point clouds, 3D models, and textures. The UV ratio column indicates the percentage of texture space effectively utilized by the 3D geometry through UV mapping coordinates—a critical parameter for assessing photogrammetric model quality and texture optimization. All contexts maintain a consistent UV ratio of 0.6, ensuring homogeneous texture density across the entire digital replica.
- Size
- Number of polygons
- (Relative) number of associated textures
The proposed standard has made it possible to create a digital replica of the archaeological context, characterized by a homogeneous resolution of color information. This resolution is best described in terms of texels rather than pixels. A texel (texture element) is the fundamental unit of a texture in 3D graphics, analogous to how a pixel is the fundamental unit of a 2D digital image.
In our digital replica, each texel represents between 1.5 and 1.32 mm2 of the actual archaeological surface.
The target texture density of approximately 1.26 mm2/texel was empirically determined through extensive testing on Head Mounted Display (HMD) devices and desktop screens. Through iterative evaluation with domain experts and end-users exploring the virtual environment at human scale, this density was identified as the optimal threshold to achieve photorealistic quality during immersive exploration, balancing perceptual realism with computational performance. At this resolution, approximately 0.67 to 0.76 texels represent each square millimeter of the real archaeological surface, ensuring that fine details such as mortar texture, surface weathering, and painted decorations remain clearly visible during close-range inspection.
The texture density calculation for each tile follows a precise formula implemented in the 3DSC add-on for Metashape [50]. The algorithm calculates how many texture atlases are needed for any given tile area to maintain the target resolution:
where
- = number of 40962 texture atlases required (minimum 1)
- = actual surface area of the tile in m2 (obtained from the python opearator chunk.model.area() in Metashape)
- = 10,000 mm (side length of a reference 100 m2 square: )
- = 1.26 mm2/texel (empirically determined target texture density)
- = 4096 pixels (texture atlas dimension)
- = 0.6 (UV space utilization efficiency)
- = standard mathematical rounding (0.5 rounds up).
The formula operates in two conceptual steps:
Step 1—Reference calculation: Calculate how many textures are needed for a standard 100 m2 tile:
Step 2—Area scaling: Scale this proportionally based on the actual tile area,
For example, a tile with m2 would require textures (rounded). A tile of 55 m2 would yield textures, while 60 m2 would give textures. The use of standard rounding (rather than ceiling) optimizes texture memory allocation. Tiles slightly above the threshold receive an additional texture atlas, while those slightly below maintain the lower count, balancing visual quality against memory constraints.
Implementation note: The reference to 100 m2 in Equation (1) reflects the workflow convention where this value represents the maximum standard tile size established in the segmentation strategy. While texture count could be calculated directly from without this intermediate reference, the scaled approach maintains conceptual consistency with the tile-based organization system and provides intuitive estimates for field personnel.
The parameters warrant specific explanation:
- 1.26 mm2/texel (target texture density): This value was empirically determined through iterative testing on HMD devices and desktop screens. At this texture density, fine archaeological details (mortar texture, surface weathering, painted decoration) remain clearly visible during immersive exploration at human scale, while maintaining acceptable rendering performance. This constitutes the reference standard for all texture density calculations across the digital replica.
- 4096 pixels: This texture size was selected for broad platform compatibility. While higher resolutions (81922) are feasible on high-end hardware, 40962 textures ensure deployment across web browsers, mobile devices, and entry-level HMD systems without exceeding memory constraints.
- 0.6 UV ratio: Automatic UV parameterization in Photoscan/Metashape inevitably leaves approximately 40% of texture space unused due to UV island spacing, seam allowances, and atlas packing inefficiencies. This value of 0.6 represents the median efficiency observed across our dataset and can be adjusted if different UV unwrapping strategies are employed.
The algorithm is applied automatically to each tile. Metashape calculates the actual surface area of the 3D mesh (chunk.model.area()), the formula determines the required number of texture atlases, and UV parameterization and texture baking proceed with the calculated atlas count (page_count parameter). This ensures homogeneous texel density across all tiles regardless of size variation, from small architectural details (<10 m2) to large courtyard surfaces (approaching 100 m2). The complete implementation is available as open-source code (Supplementary Code S1).
The Texture Density Calculation Formula (Fixed-Density Approach)
In our digital replica, each texel represents between 1.15 and 1.32 mm2 of the actual archaeological surface, with a target mean of 1.26 mm2/texel.
The target texture density of approximately 1.26 mm2/texel was empirically determined through extensive testing on Head Mounted Display (HMD) devices and desktop screens. Through iterative evaluation with domain experts and end-users exploring the virtual environment at human scale, this density was identified as an optimal threshold to achieve photorealistic quality during immersive exploration, balancing perceptual realism with computational performance. At this resolution, approximately 0.67 to 0.87 texels represent each square millimeter of the real archaeological surface, ensuring that fine details such as mortar texture, surface weathering, and painted decorations remain clearly visible during close-range inspection.
The consistency in texel density across the model is important for several reasons:
- Realistic rendering: A uniform texel density ensures that all parts of the model appear equally detailed, preventing jarring transitions between areas of high and low resolution.
- Efficient use of resources: By standardizing the texel density, we can optimize the use of computational resources, balancing detail with performance in real-time rendering scenarios.
- Accurate representation: The consistent texel density allows for a more faithful digital representation of the archaeological site, maintaining proportional detail across different artifacts and areas.
- Methodological reproducibility: The explicit texture density calculation formula and empirically validated density standard (1.26 mm2/texel) enable other researchers to replicate this approach for similar large-scale archaeological documentation projects.
Beyond visual quality and computational efficiency, the digital replica serves a fundamental role in enabling digital autoptic analysis of archaeological structures (within defined scenarios). The consistent texel density ensures that stratigraphic masonry units remain clearly identifiable and analyzable directly on the 3D model, effectively substituting direct visual inspection of the physical context in many analytical scenarios. This capacity for “reading” stratigraphy through the digital model represents a significant methodological advancement for contexts where in situ preservation is not feasible. However, the operational limits of digital autoptic analysis—particularly regarding diagnostic capabilities for material composition, weathering patterns, and micro-stratigraphic relationships—require further systematic research beyond the scope of this article and will be explored in future work.
Indeed, this homogeneity of information constitutes an important element for a realistic and aesthetically satisfying rendering of the immersive experience (see Figure 2).
Figure 2.
Digital replica of the buildings found in the Amba Aradam excavation. The green squares A and B show details of the model, providing visual samples (blue and red) of the high resolution of the model.
4.2. 3D Survey Acquisition in the Field
During the excavation activity, several 3D surveys (3D snapshots) were carried out with the use of digital photogrammetry techniques, minimizing interference with the timing of the work site. The team of Cooperativa Archeologia (Firenze, Italy; https://www.archeologia.it, accessed 30 June 2025) acquired the field data relative to the lower level of the archaeological complex (the so-called Commander’s House), performing extraction, filtering and subsequent post processing and creating geo-referenced 3D models with photorealistic textured mapped surfaces. For Cooperativa Archeologia, Alice Scortecci and Adriano Averini carried out the surveys and subsequent processing under the coordination of Anna Giulia Fabiani. The photographs taken during the acquisition as well as the topographic survey performed by the team of Cooperativa Archeologia were shared with the authors for the creation of the digital replica presented in this article. The acquisition process was implemented using a Canon 6D with three fixed lenses (14 mm, 24 mm, 35 mm), white and grey cards (during the photo shooting campaign, two cards—white and gray—for light color temperature adjustment (in post-processing) were included) and targets positioned on the structures (geo-referenced via total station). The light conditions of the acquisitions remained fairly homogeneous over the years, as the archaeological excavation took place inside reinforced concrete bulkheads prepared for the future metro station. Exposure and colour values were treated differently only when limited areas of the excavation were exposed to direct sunlight. A chromatic change, perceptible to the naked eye, was also noted in the acquisitions made during the warm seasons, compared to those made in autumn-winter. In this case, to correct this chromatic difference, textures have been chromatically balanced, using the color correction tool available within the 3DSC add-on.
The 3D survey of each context responded to different needs. For example, the context with the largest relative extension was that of the barracks (see Table 1), but, at the same time, it was the easiest to acquire since, at the end of the excavation campaign in 2016, it was entirely uncovered in a consistent manner. Other contexts, such as the so-called “domus of the commander” and its backside, presented a large number of different archaeological phases, discovered during the excavation (i.e., stairs covering a previous floor at Figure 3), and 3D surveys, hampered by the presence of modern artifacts related to the construction of the underground line, that had to be recorded.
Figure 3.
Two different 3D snapshots of the Amba Aradam excavation: remains of a stairs (post-severian epoch (left)) and remains of a room with underfloor heating (severian epoch, (right)).
4.3. Photogrammetric Processing and Quality Assessment
The processing workflow for the Amba Aradam excavation followed established photogrammetric and mesh optimization procedures, extensively described in our previous work [45]. Here, we provide specific implementation details for this case study.
For each of the seven contexts, image datasets were processed using Agisoft Photoscan (ver. 1.26, later Metashape for contexts acquired after 2017). The standard structure-from-motion pipeline included camera alignment with automatic tie-point detection; manual identification and measurement of ground control points (acquired via total station) for geo-referencing; camera calibration optimization to minimize photogrammetric errors; and dense point cloud generation at high quality settings (see Figure 4). Photogrammetric accuracy metrics for each context are reported in Table 2.
Figure 4.
Images (left) and their alignment within Agisoft Photoscan (right).
Table 2.
Photogrammetric processing data for Ipponio excavation sectors. GSD: Ground Sample Distance; Reproj. err: Reprojection error; GCP RMSE: Root Mean Square Error of Ground Control Points. Processing time includes alignment and dense cloud generation. Asterisk (*) indicates mean values.
Dense point clouds were exported with a coordinate shift (x: +16,000, y: +29,000, z: 0) to address numerical precision constraints in mesh processing software. The original coordinates of the Amba Aradam site are optimal for geographic positioning but problematic for intensive mesh operations due to floating-point precision limitations in 32-bit arithmetic. Large coordinate values accumulate rounding errors during iterative operations (normal computation, Poisson reconstruction, decimation). This transformation translates the dataset to near-origin coordinates while maintaining metric accuracy and relative positioning, ensuring numerical stability throughout mesh optimization. The inverse shift was applied during texture generation to restore geo-referencing. Point cloud cleaning and mesh generation were performed in CloudCompare 2.08 (http://www.cloudcompare.org/), applying manual cleaning of isolated points; density uniformization; statistical outlier removal; normal computation, and reorientation.
4.4. Mesh Optimization and Tiling Strategy
Meshes were generated using Poisson Surface Reconstruction [51], then optimized through edge-collapse decimation following established mesh optimization strategies for archaeological applications [32,36] that preserves geometric features and boundaries (see Figure 5).
Figure 5.
Optimization of meshes and textures.
Mesh segmentation evolved during the project (see Figure 6). The semi-automated segmentation approach addresses scalability challenges documented in large-scale archaeological 3D documentation projects [33,39]. The initial context (barracks, 2016) employed CloudCompare’s segment tool for rough separation of major architectural zones into tiles of maximum 100 m2 surface area (2 h total). Subsequent contexts benefited from the 3DSC “Cutter” tool developed specifically for rapid tile segmentation in Blender. This tool enables semi-automated cutting through planar section definition, automatically generating individual tile meshes with preserved edge topology along architectural boundaries. Using 3DSC, a typical context was segmented into 10–15 tiles in 30–40 min of operator time, with automatic edge preservation preparing tiles for subsequent level-of-detail generation. This approach provided precise control over cutting line placement to separate structures from terrain while dramatically reducing manual labor compared to polygon-by-polygon selection methods. CloudCompare’s role was thus limited to point cloud cleaning and mesh generation, not tile segmentation, balancing memory efficiency with visual quality for real-time deployment.
Figure 6.
Segmentation of the model into tiles (different colors indicate individual tiles only, with no additional semantic meaning).
Texture generation followed the density calculation formula described above (Equation (1)), with texture count per tile determined by surface area (Table 3). All tiles were textured following the PBR-metalness workflow for consistent material properties across real-time rendering platforms.
Table 3.
Number of 4096 textures related to tile area (sq m).
For comprehensive details on the theoretical framework and general methodology underlying this pipeline, readers are referred to [45].
4.5. Temporal Integration: 3D Snapshots Methodology
It is important to distinguish between two fundamental approaches to creating 3D models: the “3D snapshot” and the time-composite model.
4.5.1. 3D Snapshots
A 3D snapshot, as the name suggests, is a 3D “photograph” of an object or context at a specific moment in time. This approach captures the exact state of the archaeological site or artifact as it exists during a single, brief period of data collection. The key characteristics of a 3D snapshot include the following:
- Temporal Consistency: All data in a 3D snapshot represent the subject at a single point in time, ensuring a cohesive and accurate representation of that specific moment.
- Minimal Environmental Variation: Changes in lighting, weather conditions, or site access are minimized due to the short data collection period.
- Preservation of Transient Features: Temporary or fragile elements that might change or disappear over time are accurately captured.
4.5.2. Time-Composite Models
In contrast, time-composite models are created from data collected over an extended period, often spanning weeks, months, or even years. While these models can provide a more comprehensive view of a site, they also present unique challenges:
- Temporal Inconsistency: Different parts of the model may represent the site at different times, potentially leading to inconsistencies in the overall representation.
- Environmental Variations: Changes in lighting, weather, and seasonal conditions can affect the quality and consistency of the data.
- Site Evolution: Both minor and significant changes to the site over time (due to ongoing excavations, natural processes, or conservation efforts) can be inadvertently incorporated into the model.
4.6. Texture Generation and Visual Consistency
One of the most complex aspects of creating the digital replica of the Amba Aradam archaeological context has been the fusion of different datasets (3D snapshots) collected over three years.
This situation presented us with the task of integrating multiple 3D snapshots, each representing a distinct moment in the site’s recent history, into a cohesive digital replica. This process required careful consideration of several factors:
- Temporal Alignment: Ensuring that the integration of different snapshots did not create anachronistic representations of the site.
- Change Documentation: Using the variations between snapshots to document and analyze changes in the site over time.
- Data Consistency: Maintaining a consistent level of detail and accuracy across snapshots taken with potentially different equipment or under varying conditions.
- Interpretative Challenges: Deciding how to represent areas where significant changes occurred between snapshots, balancing the need for a coherent model with the desire to accurately represent the site’s evolution.
In this case, due to the iterative process of excavation, documentation, and accurate removal of the building structures—carried out both for safety and security reasons and in view of their future musealization—the 3D survey acquisition and post-processing phases required particular attention. On one hand, the first and most obvious difficulty encountered was the change of light conditions in some of the datasets, due to the moment of the day or the moment of the year in which images were acquired. On the other hand, the photogrammetric documentation of an excavation in progress, such as the Amba Aradam context, also encountered the concrete possibility to register in 3D the development of the excavation itself (such as the acquisition of an artifact or a structure during different phases of the excavation). These single 3D models, or “snapshots”, represented “photographs” of the state of the excavation, at a precise moment in time, and had to be integrated and assembled to complete some structures brought to light at different times (for example, a wall excavated during a year where the upper part was surveyed in month 1, removed in month 6, excavated to the foundations in month 11 and surveyed again in month 12).
To obtain a consistent model, different point clouds from different datasets have been combined to create a single coherent point cloud, to be employed as base to generate a comprehensive mesh of the context and produce different versions of a tile in the case of the representation of assets belonging to different epochs (see Figure 3).
At the same time, a temporary textured high-resolution 3D model was developed for every single snapshot. In Blender, using the “Texture mixer” clone tool of 3DSC [8,52] and applying texture blending techniques adapted from high-resolution photographic mapping methods [32,38], the color information of all snapshots was transferred to the corresponding tile of the final 3D models. This tool worked as a 3D brush with the function of a color clone and allowed to manage this important step of the 3D documentation.
In some areas, the archaeological excavation not only has reached almost 20 m of depth, but it was also subjected to local phenomena of subsidence of the ground, stagnation of water (unavoidable in case of rain) and thermal shock (between day and night, winter and summer). These phenomena, for example, have damaged some decorated surfaces, exposed during the excavation, before the dismantling and securing of these remains in a safe storage, making the timely creation of 3D snapshots significant.
The texture merging process using the 3DSC “Texture mixer” tool required approximately 2 h of operator time per tile (100 sqm) for color information transfer and visual consistency verification. In total, approximately five tiles across the seven contexts required this intensive manual texture integration workflow, representing contexts where multiple temporal snapshots needed to be merged into coherent final representations.
In certain circumstances, ad hoc photogrammetric campaigns were organized to acquire portions of the context that were hidden by obstacles. For instance, this is the case of some stands which were placed on the top of marble floors, in specific points of the area, to be used as a temporary coverage with the intent of protecting some decorated surfaces and, as a consequence, hampering the 3D survey. On this occasion, to accomplish this task another tool of the 3DSC add-on was used. The “photogrammetry paint” was developed to import in Blender the photogrammetric mesh and transfer the color information of specific images to the desired tile.
In the above-mentioned situations and also in the case of the opening of new excavation areas (with the consequent creation of new 3D models), different light conditions (such as cloudy sky, full sun, morning, afternoon, etc.) were managed during the 3D survey. In these cases, the “color correction”, the 3DSC tool was employed to modify in real time materials and textures of multiple tiles, finding the best solution before merging the results of the surveys. The tool includes curves RGB and saturation-hue-value parameters that allow control the color correction parameters, save the results, and visualize the modified texture within Blender.
4.7. Level of Detail Generation for Real-Time Experience
After the elaboration of a tiled and textured 3D model, levels of details (LODs) were created to realize a real-time experience to experiment within compatible graphics engines, such as Unreal, Unity or Godot. To face this specific step of the process, the “LOD generator” tool of 3DSC has been developed and used. This tool permits to set both a precise number of LODs and the magnitude value useful for reducing the number of polygons and the texture resolution. By means of the “LOD generator” tool, 3D models can also be exported in FBX format, with packed textures and LODs, to be directly imported into a real-time engine.
4.8. Data Management and Semantic Organization: Extended Matrix
The realization of a high-resolution digital replica represented the starting point for the study of the archaeological context with the aim of elaborating a potential 3D reconstructive hypothesis of both the complex and the surrounding environment at a given moment in the past. To this end, stratigraphic data, collected during the excavation, and the interpretation of the structures have been linked to the 3D model using the EM proxy visualization standard. Within the 3D space, each stratigraphic unit is represented as a simplified volume, superimposed on the textured photogrammetric model, that incorporates and highlights the individual information in the 3D environment. The metaphor, concerning the visualization of geometries and the representation of the minimum unit of information, follows what is already known in the environment of geographic information systems (GIS) for the elements “point”, “line”, and “polygon” in the case of proxies, objects with a volume in space are highlighted, i.e., the stratigraphic units (for example a wall or a column).
The archaeological and historical study of the walls, stratigraphies and artifacts allowed researchers to formulate reconstructive 3D hypotheses for the most important chronological phases of the complex. Analysis, synthesis and reconstruction were facilitated by 3D technologies and were performed following a data driven approach. In particular, the use of a knowledge graph was experimented (as a standard extended matrix [1,3] dataset), in which archaeological remains and sources (involved within the reconstructive process) were recorded semantically. Therefore, knowledge graph was employed not only to characterize objects but, above all, to declare the existing relationships, such as space-time and logical relations—within a process of virtual reconstruction. This semantic tool was then the basis for creating applications for visualization and interaction, useful both for the scientific study and dissemination (interactive 3D applications and documentary videos in CGI).
The enormous amount of geometric data and colour information, collected through the photogrammetric survey activities, were required the development of tools and methods to optimize 3D models and minimize loss of data.
The virtual reconstruction workflow presented in this article was developed using extended matrix versions 1.2 through 1.4. These versions enabled the creation of the Severian phase reconstructive model through the proxy-based approach and semantic documentation described in Section 4.9.
Currently, a comprehensive re-elaboration of the Amba Aradam virtual reconstruction is underway using extended matrix 1.5 (development version), which introduces significant methodological advances in multi-temporal management of 3D snapshots and enhanced semantic querying capabilities. This new version integrates temporal variability directly into the knowledge graph structure, enabling a more sophisticated representation of archaeological phasing and structural evolution. The complete reconstructive hypothesis based on extended matrix 1.5, including detailed archaeological and architectural analysis, interpretative synthesis, and comprehensive source documentation, will be presented in a forthcoming publication dedicated specifically to the virtual reconstruction outcomes and historical interpretation of the Amba Aradam complex.
For the current article, we focus on the methodological pipeline that enabled the creation of the digital replica and its integration with semantic documentation, using Room 44 as an exemplary case to illustrate the extended matrix workflow principles.
4.9. Virtual Reconstruction Methodology
The aim of the project was to create a 3D “representation model” for each historical period of the archaeological context. The first epoch that has been developed up to now is the second century A.D., the one concerning the construction of the entire complex (see Figure 7). The reconstructive representation model has been developed in alignment with established guidelines for asset production in real-time open-world environments, ensuring optimal level-of-detail (LOD) management and material reuse. Additionally, the model employs the Physically Based Rendering (PBR) approach [53], specifically utilizing the metalness workflow for shader development.
Figure 7.
Overall view from northwest of the reconstructed context of the excavation of Amba Aradam.
The reconstructive model was used as a basis for several outputs:
- Technical drawings (sections, blueprints) and reconstructive views.
- An interactive application (EMviq), desktop-based, that make it possible to inspect the knowledge graph.
- A computer graphics video that presents the various functions of the complex through a continuous fading of the camera between the 3D digital replica and the virtual reconstruction of the second century A.D.
4.9.1. Methodology and Sources Used
The creation of the reconstructive hypothesis focused on the Severian phase as the moment of maximum expansion of the monumental complex (barracks, commander’s domus, and garden areas).
To illustrate the extended matrix workflow, we present Room 44 of the barracks as an exemplary case (see Figure 8). This room demonstrates the complete methodological chain: digital replica as documentation base (top left), representation model as final output (top right), and semantic proxy-based documentation (bottom), enabling a transparent connection between archaeological evidence and reconstructive hypothesis.
Figure 8.
View of Room 44: digital replica (top left), model of representation (top right), and proxies (bottom).
The workflow proceeded through several stages:
1. Stratigraphic documentation: Archaeological stratigraphy was digitized through proxy modeling with red color-coding for in situ remains. Each proxy corresponds to a Stratigraphic Unit in the extended matrix graph, imported from GraphML format using the EMtools add-on for Blender [7].
2. Digital restoration: Fragmentary structures (e.g., wall sections truncated at specific heights, incomplete mosaic floors) were completed through blue-coded proxies representing direct restoration based on preserved material evidence. These Virtual Stratigraphic Units (USV) were simultaneously added to the extended matrix with links to comparative sources.
3. Hypothetical reconstruction: Elements without direct material evidence (e.g., upper-floor wall structures, roofing systems) were represented through green-coded proxies, with extended matrix documentation of the architectural treatises and comparative contexts supporting these interpretative choices.
4. Source documentation and paradata: All sources employed—ranging from excavation data and stratigraphic reading to comparative contexts (particularly regarding decorative schemes: House of the Hierodules at Ostia, houses of Ephesus) and general rules of Roman military architecture—were recorded in the extended matrix with explicit notation of interpretative reasoning (paradata).
The EMtools add-on enabled interactive visualization of this semantic structure within Blender’s 3D environment, displaying source citations and paradata during model inspection. The extended matrix formal language, based on stratigraphic principles, extended to include reconstructive elements [1,3], ensures that the reasoning path from archaeological evidence to virtual reconstruction remains transparent and interrogable.
Once the proxy model was completed and the extended matrix populated with comprehensive paradata, the final representation model (RM) was created as a geometrically detailed model with PBR materials and textures designed for maximum visual realism in real-time rendering. The proxy models serve dual functions: communicating reconstruction reliability through color-coding and enabling interactive query through tools like EMviq (Section 4.10.2), where users can select individual elements and access their complete source documentation.
This workflow exemplifies the extended matrix principle that virtual reconstruction should function as an inspectable research process rather than a finished product, aligning with transparency principles established in the London Charter and Seville Principles while providing concrete technical implementation through semantic 3D technologies.
4.9.2. Decoration: Painted Walls and Mosaics
The reconstruction of the decorative apparatus of the internal rooms was one of the most complex activities since the information regarding the upper part of the walls and ceilings is almost completely lacking. However, in the remaining parts, the original drawings and colours have been preserved in good condition. This has allowed them to be classified within precise historical periods and to hypothesize some stylistic comparisons. Based on the available data, comparisons were searched for the Severan and Adrian/Antonine ages. Given the large presence of simple decorative patterns characterized by geometric rigor (repetition of panels and frames, alternating arrangement of colours), the reconstruction of the entire apparatus was possible through the simple repetition of the preserved motives. As a significant example of the workflow adopted, it follows the reconstructive study of Room 24. Concerning the floor, the reconstruction has been fairly simple. The mosaic is in black and white tessellated tiles and shows an off-centre emblem with a decorative scheme consisting of a simple geometric pattern in circles and rhombuses. First, a liberation digital restoration [54] of additions (marble slabs of variable size) belonging to more recent periods has been performed (Figure 9(D1)). Then the original decorative scheme has been hypothesized and the gaps filled in by repeating the geometric elements (Figure 9(D2)). Finally, to re-establish the continuity of the figurative composition, the texture has been reconstructed using the existing tiles as reference (Figure 9(D3)). For the virtual restoration of the fresco, orthoimages derived from the acquired 3D model were used as the main reference (Figure 9(C1)). First, the displayed anomalies generated by the collapse of structures (e.g., inclined architectural elements, irregularity in the wall alignments) have been digitally corrected (Figure 9(C2)). Subsequently, the pictorial scheme was analyzed to find stylistic comparisons. The remains show that the decorative schema was composed by alternating red and yellow panels—with frames of the opposite colour—bordered by white lines. Traces of a plant with large leaves in a central position are still visible in the base. All the panels were divided by white columns painted in the foreground. This type of fresco-ed wall decoration is typical of the late Adrian/Antonine period. Direct comparisons can be found in the paintings of the Garden Houses in Ostia (insula of the Hierodules, rooms 4 and 6; insula III, IX) [55,56]. These references were used to complete the iconographic scheme of the missing parts and in particular the mentioned comparisons have been fundamental to formulate a reliable reconstruction of the upper part which were affected by greater uncertainty (Figure 9(C3)) Lastly, for what concerns the decoration of the ceiling, the virtual rconstruction has been based on the painted plasters of the collapsed vault found in the excavation. When archaeological evidence was not found, as in this case, the reconstruction was based only on comparisons. Some paintings of the 3rd century A.D. from the western substructure of the Canopus in the Villa Adriana were used as the main reference [57].
Figure 9.
Room 24. Schematic workflow adopted for reconstructing the decorative apparatus of the room. (A): top view of the Barracks and position of room 24 and ortophoto of the four walls of the room (a-b-c-d-a); (B): orthometric view of the room from the digital replica; (C): orthoimages of the frescoes (C1), virtual restoration of the collapsed walls and schematic reconstruction of the decorative pattern (C2), stylistic reconstruction of the frescoes (C3); (D): orthoimage of the mosaic in its current state of conservation (D1), “liberation” restoration of additions belonging to more recent periods and schematic reconstruction of the original decorative pattern (D2), stylistic reconstruction of the mosaic (D3).
4.10. Visualization Technologies
4.10.1. Real-Time Technologies for Video Production
The reconstructive model of the Severian epoch was imported into the Unreal Engine 4 (UE4) software, where interactive lighting simulations were made to better understand the effect that the light sources (windows, doors, oil lamps) had in the various environments. For example, the windows located high up inside the barracks’ rooms had to ensure a rather soft light (also considering their orientation to the north). Another interesting example was the corridor between the rooms, which had to be particularly dark, and made it necessary to place a suitable number of oil-lanterns (estimated as 7–8 lumens each) probably attached to the roof beams. The light-technical study on the rooms of the barracks is involving some quantitative aspects on the propagation of light and is still in progress. Inside the software, an animation video of about 10 min has been produced in 4K format that allows exploring all the interiors and exteriors of the monumental complex during the Severian era with visual transitions, by fading between the digital replica and the reconstructive model.
4.10.2. EMviq: Extended Matrix Visual Inspector and Querier
Within the real-time domain, one of the main requirements for functional inspection and interrogation of complex, 4D contexts, is a clear separation between the visible 3D scene-graph and semantic-graph (consisting of structured semantic shapes—or proxies). Such an approach offers great flexibility with different data granularity since it completely separates the 3D graphics requirements of the visible virtual scene (multi-resolution, etc.) from semantic segmentation requirements [3]. To inspect and query such data within a 3D interactive context, the very first step is to extract runtime structures from the knowledge graph, suitable for 3D interactive interrogation [4]. Specifically, we need to extract (1) a timeline; (2) a semantic 3D structure (query-able shape descriptors or proxies); and (3) source-graphs assigned to each proxy/shape (paradata). Such tasks require to be well-engineered since they are generally performed each time the knowledge graph is modified (edited), depending on the application scenario.
“EMviq” https://osiris.itabc.cnr.it/scenebaker/index.php/projects/emviq/—extended matrix Visual Inspector and Querier, accessed on 30 June 2025) is a complete, interactive 4D visualization and runtime interrogation tool for Extended Matrices. The tool focuses on automatic extraction from GraphML files (EMs) targeting 3D visualization (including immersive VR through HMDs) [4], ease-of-use and performance, to establish a fast and robust pipeline among a multi-disciplinary team. Within the considered context, the desktop tool was able to automatically parse, extract and generate the proxy-graph (see Figure 10 (left))—i.e., the runtime structures required for real-time inspection of the site. The multi-resolution 3D representation model is loaded separately by the tool and overlaid with the proxy-graph (see Figure 10 (right)). During the last few years, a fully web-based, online version of the tool “EMviq” was developed, on top of the open-source framework ATON [58]. The new tool offers the features already explored in previous work with the capabilities inherited from the framework—for instance, accessing and interacting with such data on every device, including immersive VR [59,60].
Figure 10.
Automatic generation of proxy-graph from EM (left). Interactive query at runtime using EMviq desktop application (right).
4.11. Use of Generative AI Tools
During the preparation of this manuscript, the authors used Claude (Anthropic, version 4.5 Sonnet) for the purposes of improving written English quality, refining technical phrasing clarity, and assisting with the structural organization of complex methodological descriptions. The tool was not used for data generation, analysis, interpretation, or creating study designs. All scientific content, methodologies, data analysis, results, and interpretations are original work by the authors. The authors have thoroughly reviewed and edited all AI-assisted content and take full responsibility for the accuracy, validity, and integrity of this publication.
5. Results
5.1. Digital Replica: Quantitative Assessment
The application of the digital replica methodology to the Amba Aradam excavation resulted in a comprehensive 3D documentation covering 4770 m2 of archaeological surfaces, organized into 115 tiles across seven distinct contexts. The complete dataset comprises approximately 507 million points in the dense clouds, decimated to 8.7 million triangles in the optimized meshes, and textured with 664 total texture atlases (480 at 20482 resolution and 184 at 40962 resolution).
Point cloud density varied according to the geometric complexity of each context, ranging from 40 points/mm2 (Intermediate context) to 160 points/mm2 (Gardens context), with a mean of 97 points/mm2 across all contexts (see Table 1). The resulting mesh density showed similar variation, from 955 triangles/m2 (Walls context) to 5403 triangles/m2 (domus context), with a mean of 2056 triangles/m2.
The consistent application of the texture density calculation formula (Equation (1)) ensured homogeneous visual quality across all contexts, with texture density values ranging from 1.15 to 1.32 mm2/texel (mean: 1.25 mm2/texel), closely matching the target value of 1.26 mm2/texel. The UV ratio remained constant at 0.6 across all tiles, confirming efficient texture space utilization throughout the digital replica.
5.2. Temporal Integration Outcomes
The temporal integration workflow successfully merged 3D snapshots acquired over three excavation campaigns (2016–2018), producing coherent representations of archaeological structures documented at different excavation stages. The texture merging process, utilizing the 3DSC “Texture mixer” tool, enabled the integration of color information from multiple temporal snapshots while maintaining visual consistency across tile boundaries.
Critical preservation documentation was achieved for several contexts subject to environmental degradation during the excavation period. For instance, decorated surfaces in the domus context (Context 6) were documented through multiple snapshots before structural removal, preserving high-resolution color information that would have been otherwise lost due to water stagnation and thermal stress at excavation depths reaching 20 m below modern ground level.
Visual color consistency across temporally separated acquisition campaigns was achieved through the 3DSC “Color correction” tool, which enabled real-time adjustment of RGB curves and HSV parameters during texture integration. While full photometric color calibration was not performed, the use of white, grey, and black reference cards during field acquisition provided baseline references for visual harmonization, ensuring uniform appearance across the final digital replica despite varying seasonal lighting and environmental conditions spanning three years.
5.3. Virtual Reconstruction Outputs
The virtual reconstruction focused on the Severian phase (2nd century A.D.) produced a comprehensive 3D representation model encompassing the complete military complex: 39-room barracks (Context 1), commander’s domus (Context 6), service wing (Context 5), and associated garden areas (Context 3). The reconstruction integrated multiple source typologies recorded in the extended matrix knowledge graph, including:
- Direct archaeological evidence: wall structures, floor remains, preserved decorative elements
- Comparative sources: stylistic parallels with contemporary contexts (Ostia, Ephesus, Villa Adriana)
- Architectural treatises: general rules of Roman military architecture for elements without direct evidence
The extended matrix knowledge graph (version 1.4) explicitly documented the evidential chain connecting archaeological data to reconstructive outputs: primary sources (excavation records, stratigraphic documentation, preserved architectural elements), comparative references (stylistic parallels from contemporary contexts), architectural treatises (general construction principles for elements lacking direct evidence), and interpretative reasoning (paradata) articulating the logical steps from evidence to hypothesis.
The proxy-based visualization system employed a four-level reliability classification through color coding:
- Red: Preserved archaeological remains documented through digital replica (highest reliability).
- Blue: Direct digital restoration of fragmentary structures where material evidence constrains reconstruction (high reliability).
- Yellow: Anastylosis-based reconstruction where displaced architectural elements can be repositioned based on structural logic and comparable contexts (medium reliability).
- Green: Hypothetical reconstruction of elements without direct physical traces, based on comparative sources and architectural principles (lower reliability, higher interpretative component).
This graduated reliability system makes epistemic distinctions immediately apparent in 3D visualization, enabling both specialist peer review and non-specialist comprehension of the evidential basis underlying different portions of the reconstructive hypothesis.
Room 44 exemplifies the complete workflow (Figure 8), integrating digital replica documentation, semantic proxy modeling, and final representation model production. Detailed decorative reconstruction of this space demonstrates the methodological approach: liberation restoration removing later additions from the mosaic floor, geometric pattern completion based on preserved tesserae, and stylistic reconstruction of wall frescoes following Adrian/Antonine parallels from Ostia’s Insula of the Hierodules [55,56] (Figure 9).
5.4. Interactive Visualization Tools
The visualization pipeline produced multiple outputs for different user needs:
Real-time engine implementation: The reconstructive model was successfully deployed in Unreal Engine 4, enabling interactive lighting studies. Quantitative analysis of illumination patterns in the barracks established ambient light levels of approximately 50–80 lux in individual rooms (considering north-facing window orientation) and 15–30 lux in the central corridor, necessitating supplementary lighting via oil lamps (estimated 7–8 lumens each) for functional circulation.
Video production: A 10-min 4K animation was produced, featuring continuous visual transitions between digital replica and virtual reconstruction through temporal fading effects, enabling direct comparison of preserved evidence and interpretative hypothesis.
EMviq desktop application: The extended matrix interrogation tool successfully parsed the complete GraphML dataset and generated interactive proxy-graphs, enabling real-time inspection of reconstructive sources and paradata. User testing confirmed functionality of the semantic query system, allowing domain experts to validate reconstructive hypotheses against cited sources within the 3D environment.
Web-based EMviq (ATON framework): The online version deployed the complete Amba Aradam dataset for cross-platform access, including immersive VR inspection through HMD devices, demonstrating the scalability of the extended matrix approach for public dissemination and remote expert collaboration.
6. Discussion
6.1. Methodological Challenges in Large Urban Excavations
The Amba Aradam case study highlights specific methodological challenges inherent to large-scale urban archaeology projects conducted within active construction environments. The constraint of documenting 4770 m2 of archaeological surfaces at depths reaching 20 m, while minimizing interference with metro construction timelines, necessitated the development of rapid acquisition protocols and post-processing workflows capable of managing temporal inconsistencies.
The “3D snapshot” approach proved essential for contexts subject to iterative excavation and structural removal. Unlike static archaeological sites where comprehensive single-campaign documentation is feasible, the Amba Aradam excavation required integrating surveys conducted across multiple excavation phases, with structures documented, removed, and underlying levels subsequently revealed. This temporal fragmentation introduced specific technical challenges: photogrammetric alignment across temporally distant datasets, chromatic harmonization despite varying environmental conditions, and geometric registration of structures partially removed between acquisition campaigns.
The tile-based organization strategy, while increasing initial processing complexity, provided essential flexibility for managing the evolving dataset. The ability to update individual tiles as new excavation areas were revealed, while maintaining geometric and chromatic consistency with previously processed contexts, proved critical for maintaining documentation currency throughout the three-year excavation period.
Environmental factors—particularly water stagnation, thermal stress, and direct sunlight exposure at excavation depth—accelerated deterioration of decorated surfaces, validating the decision to prioritize timely 3D snapshot creation even when optimal lighting conditions could not be achieved. Post-processing color correction tools successfully compensated for suboptimal acquisition conditions, demonstrating the viability of rapid documentation protocols in challenging urban excavation environments.
Methodological choice: photogrammetry over laser scanning. The selection of structure-from-motion photogrammetry rather than terrestrial laser scanning warrants explicit justification, as laser scanning offers higher geometric precision and faster field acquisition. Our choice was deliberate and based on project-specific requirements: (1) Chromatic fidelity: photogrammetry provides color texture directly from camera sensors, with visual color consistency achieved through reference cards (white, grey, black) rather than full photometric calibration, essential for documenting decorated surfaces, painted plasters, and mosaics where RGB overlay from laser scanners typically exhibits lower chromatic accuracy. (2) Accessibility and cost: multiple excavation teams could acquire data simultaneously using standard DSLR cameras without specialized equipment allocation or trained operators. (3) Minimal site interference: photogrammetric acquisition required minimal setup time in the active construction environment compared to laser scanner station positioning and occlusion management. (4) Flexibility for iterative documentation: rapid re-acquisition of modified contexts (following structural removal) was more practical with camera-based workflows. While laser scanning would have reduced post-processing time, the photogrammetric accuracy achieved (geometric precision documented in Table 2) was sufficient for archaeological interpretation and virtual reconstruction at the 4770 m2 scale, where sub-millimeter precision was unnecessary. The trade-off favored chromatic quality and operational flexibility over marginal gains in geometric precision.
Open-source workflow rationale. The selection of open-source tools (CloudCompare 2.0, Blender 2.79 to 4.4) alongside commercial photogrammetric software (Photoscan 1.26 and Metashape 1.x) warrants explicit justification. While integrated commercial solutions (Autodesk ReCap, Pix4D) offer streamlined processing, our pipeline intentionally separates photogrammetric reconstruction from mesh optimization to provide granular control at each stage. Point spacing normalization before mesh generation was critical for achieving uniform quality across contexts with varying original densities (40–160 points/mm2, Table 1). For our tile-based workflow (maximum 100 m2 per tile), CloudCompare’s Poisson implementation performed adequately (5–15 min per tile on standard workstations), and the tiled approach enabled distributed processing across multiple machines. Beyond technical performance, open-source commitment addresses long-term reproducibility. Proprietary software versions become non-executable as operating systems evolve, while open-source tools can be maintained, compiled, and adapted indefinitely. File formats employed (PLY, OBJ) remain openly documented regardless of software evolution. The approximately 15–20% time overhead introduced by the tile-based optimization workflow (compared to monolithic commercial pipelines) was an acceptable trade-off for real-time deployment capability, modular tile updating, and long-term methodological transparency. All tools developed by our team (3DSC, EMtools, EMviq) are available through https://extendedmatrix.org with complete documentation.
6.2. Transparency and Reproducibility in Virtual Reconstruction
The implementation of the extended matrix framework addresses intellectual transparency in archaeological virtual reconstruction by explicitly documenting the evidential basis and reasoning underlying reconstructive decisions. The color-coded proxy system provides immediate visual communication of reliability levels, while the EMviq interrogation tool enables interactive inspection of sources and interpretative reasoning for each element. This approach is the operational core of the extended matrix methodology [1,3], transforming virtual reconstructions from finished products into inspectable research processes that align with transparency principles established in the London Charter and Seville Principles.
6.3. Limitations and Future Developments
Several limitations of the current approach warrant discussion:
Hardware and software dependencies: The workflow relies on specific commercial (Agisoft Metashape) and open-source (CloudCompare, Blender) software tools. While the 3DSC and EMtools add-ons are open source, ensuring long-term reproducibility requires addressing software versioning and platform evolution. Migration strategies for datasets as software platforms evolve remain underspecified.
Validation framework and epistemic transparency: While photogrammetric accuracy can be quantified through objective metrics (RMSE values on ground control points, point cloud density, reprojection errors), validation of virtual reconstruction decisions operates within a fundamentally different epistemic framework. The extended matrix approach does not pursue quantitative validation scores for interpretative hypotheses—a methodological choice grounded in the recognition that numerical metrics applied to reconstructive reasoning risk creating false objectivity that masks underlying interpretative diversity.
Instead, the extended matrix follows an “identity card” paradigm: establishing an objective framework of existence levels (the four-color reliability classification: red–blue–yellow–green) based on immutable postulates regarding the relationship between archaeological evidence and reconstructive hypothesis. These existence levels remain consistent across different operators because they derive from epistemological categories (preserved remains, direct restoration, anastylosis, hypothesis) rather than subjective assessments. The framework’s value lies not in producing validation scores, but in rendering the interpretative process transparent, modifiable, and suitable as a foundation for subsequent research.
Quantitative validation of reconstructive choices remains theoretically conceivable—for instance, through inter-operator agreement metrics on source-to-hypothesis mappings, or probabilistic confidence intervals on dimensional parameters derived from fragmentary evidence. However, such quantification has not yet been achieved in practice, and it remains unclear whether it would prove operationally useful to reconstructors without introducing non-homogeneous estimation variability across different operators and archaeological contexts. The current extended matrix implementation prioritizes intellectual transparency and process documentation over numerical validation metrics, accepting that peer review by domain experts—informed by explicit paradata and source documentation—constitutes the appropriate validation mechanism for interpretative archaeological reasoning. Future research may explore formal validation protocols, but these must be designed to support rather than replace expert judgment in reconstructive hypothesis evaluation.
Scalability: The manual segmentation, texture merging, and proxy modeling processes, while providing high-quality results, involve significant manual labor. For projects exceeding the Amba Aradam scale, increased automation would be necessary, though potentially at the cost of quality control and interpretative nuance.
Performance metrics: The current study prioritized methodological documentation over systematic performance benchmarking across target platforms (desktop, mobile, HMD). Future work should establish quantitative rendering performance baselines for digital replicas at varying complexity levels, informing tile size and LOD parameter selection for specific deployment scenarios.
Chromatic standardization: The current workflow achieves visual color consistency through operator-guided adjustments using reference cards (white, grey, black) as baseline anchors. While this approach successfully homogenizes datasets acquired under varying lighting conditions, it relies on empirical visual assessment rather than quantitative colorimetric protocols. Future work should establish a reproducible chromatic correction pipeline based on spectrophotometric reference targets and standardized color space transformations (e.g., CIE LAB). Such a protocol would enable: (1) objective color consistency verification across 3D snapshots through quantitative metrics (E values); (2) separation of geometric accuracy assessment from chromatic fidelity evaluation; and (3) long-term color monitoring for deterioration analysis when archaeological contexts are re-surveyed after extended periods. The development of automated chromatic calibration tools integrated into the 3DSC workflow represents a priority for achieving fully reproducible digital replica production pipelines that meet both geometric and colorimetric scientific standards.
Documentation time investment and workflow optimization: The extended matrix approach requires systematic documentation of sources and interpretative reasoning for each reconstructive element, introducing additional time investment compared to conventional 3D modeling workflows that produce visual outputs without semantic annotation. However, this investment yields proportionally richer and more scientifically robust results: the explicit documentation of evidential chains enables peer validation, supports iterative refinement as new archaeological data emerges, and creates reusable knowledge structures for comparative research.
The time requirements are primarily operational rather than inherently methodological. Development of specialized tools has significantly reduced repetitive tasks: the EMtools “swimlane” visualization enables rapid association of Stratigraphic Units to chronological phases, while automated periodization functions in Blender generate phase-specific 3D views directly from the extended matrix graph without manual material assignment. What initially required hours of manual proxy organization now executes in minutes through batch processing.
The Amba Aradam project demonstrates that close collaboration between excavation archaeologists and digital specialists throughout the documentation process—rather than retrospective application—optimizes workflow efficiency. Real-time recording of interpretative decisions as excavation proceeds reduces subsequent reconstruction effort, as the semantic structure evolves in parallel with fieldwork rather than requiring post hoc reconstruction of reasoning paths. This integrated approach suggests that transparency frameworks achieve maximum efficiency when embedded from project inception, functioning as a documentation methodology rather than post-processing overhead.
The challenge of retrospectively applying an extended matrix to existing reconstructions remains considerable, requiring archaeological domain expertise to reverse-engineer interpretative decisions from finished 3D models. This limitation reinforces the principle that semantic documentation frameworks must be conceived as intrinsic components of the research process, not supplementary annotation layers.
7. Conclusions
This contribution presented an integrated methodological pipeline for digital documentation and virtual reconstruction of large-scale urban archaeological excavations, developed and validated through the Amba Aradam case study in Rome. The combination of rapid 3D snapshot acquisition, tile-based organization, temporal integration workflows, and extended matrix semantic documentation addressed the specific challenges of documenting complex stratigraphic contexts within active construction environments.
The empirically validated texture density standard (1.26 mm2/texel) and associated calculation algorithm provide reproducible quality benchmarks for photorealistic digital replicas suitable for immersive exploration at the human scale. The 3DSC and EMtools open-source toolsets, developed to address project-specific needs, are now available for application to similar large-scale documentation projects.
The extended matrix framework demonstrated viability for maintaining intellectual transparency in virtual reconstruction processes, explicitly documenting the evidential basis and interpretative reasoning underlying reconstructive elements. The EMviq interrogation tool enables interactive inspection of reconstructive hypotheses, supporting both scholarly validation and public engagement with archaeological interpretation processes.
The spatial integration of the Amba Aradam digital replica with broader urban archaeological investigations in this sector of Rome has illuminated previously obscure aspects of the city’s military topography during the 2nd–3rd centuries A.D., highlighting urban transformations that occurred over the centuries. The documentation of this significant military complex—ultimately demolished for metro construction—preserves high-resolution geometric and chromatic data for future research, demonstrating the essential role of advanced digital documentation in contemporary urban archeology where preservation in situ is not feasible.
Data integration has laid the foundations for new methodologies for data visualization and querying. Future work will focus on: completing photogrammetric accuracy documentation across all seven contexts; integrating extended matrix querying directly into real-time engines (Unreal, Unity); developing performance optimization guidelines and reference tables for polygon density and texture resolution tailored to specific visualization platforms; and expanding the web-based EMviq tool (based on the ATON framework) [58] to support collaborative annotation, multi-user inspection, and real-time queries of reconstructive hypotheses. The methodological framework and open-source tools developed through this project provide a foundation for transparent, reproducible virtual archaeology applicable to large-scale excavation contexts worldwide.
Supplementary Materials
The following supporting information is available: Code S1: Python 3.11 implementation of the target density calculation algorithm for the 3DSC Metashape add-on, available at Zenodo [61] and GitHub repository: https://github.com/zalmoxes-laran/3DSC_Metashape, accessed on 30 June 2025. Complete documentation, tutorials, and stable releases for all tools developed in this project (3DSC, EMtools, EMviq) are available through the extended matrix project portal: https://extendedmatrix.org.
Author Contributions
Conceptualization, E.D. (Emanuel Demetrescu) and E.D. (Enzo D’Annibale); methodology, E.D. (Emanuel Demetrescu) and E.D. (Enzo D’Annibale); software, B.F. and E.D. (Emanuel Demetrescu); validation, E.D. (Emanuel Demetrescu), S.B., D.F. and S.M.; formal analysis, E.D. (Emanuel Demetrescu) and D.F.; investigation, E.D. (Emanuel Demetrescu); resources, E.D. (Emanuel Demetrescu); data curation, E.D. (Emanuel Demetrescu); texture density calculation formula, E.D. (Emanuel Demetrescu) and E.D. (Enzo D’Annibale); writing—original draft preparation, E.D. (Emanuel Demetrescu), D.F., B.F., S.M. and E.D. (Enzo D’Annibale); writing—review and editing, E.D. (Emanuel Demetrescu), S.B., D.F. and B.F.; visualization, E.D. (Emanuel Demetrescu), D.F. and S.B.; supervision, E.D. (Emanuel Demetrescu), S.M. and R.R.; project administration, E.D. (Emanuel Demetrescu), S.M. and R.R. All authors have read and agreed to the published version of the manuscript.
Funding
This research received no external funding.
Data Availability Statement
The original contributions presented in this study are included in the article/Supplementary Materials. Further inquiries can be directed to the corresponding author.
Acknowledgments
We would like to thank Metro C S.p.A., in the persons of Mauro D’Angelo, Marco Cervone, and Eriberto Bucci, and Roma Metropolitane, in the persons of Andrea Sciotti and Stefano Salvini. Without their commitment this research would not have been possible. We are also grateful to Cooperativa Archeologia, in the persons of Anna Giulia Fabiani, Alice Scortecci, and Adriano Averini, for their constant support in the collection of archaeological data on the excavation and for sharing the photogrammetric 3D surveys of the lower part of the site; to Cooperativa Parsifal, in the person of Flavia Failli, for the scientific and archaeological aspects; to Stella Falzone for the careful study of the Roman paintings and for indicating stylistic comparisons useful for the virtual reconstruction; to Mirko Buono for his valuable modeling and texturing work; and to Claudia Gioia for the reconstructive drawing of the roof of the room 44. We thank the anonymous reviewers whose constructive comments significantly improved the clarity and scientific rigor of this manuscript, particularly regarding technical documentation and methodological transparency. During the preparation of this manuscript, the authors used Claude (Anthropic, version 4.5 Sonnet) for the purposes of improving written English quality, refining technical phrasing clarity, and assisting with structural organization of complex methodological descriptions. The authors have reviewed and edited the output and take full responsibility for the content of this publication. This publication is dedicated to the memory of Anna Giulia Fabiani, whose human warmth and professional dedication deeply contributed to the success of this work.
Conflicts of Interest
The authors declare no conflict of interest.
Abbreviations
The following abbreviations are used in this manuscript:
| EM | Extended Matrix |
| 3DSC | 3D Survey Collection |
| KG | Knowledge Graph |
| TDCF | Texture Density Calculation Formula |
References
- Demetrescu, E. Archaeological Stratigraphy as a Formal Language for Virtual Reconstruction. Theory and Practice. J. Archaeol. Sci. 2015, 57, 42–55. [Google Scholar] [CrossRef] [Scilit]
- Demetrescu, E.; Ferdani, D.; Dell’Unto, N.; Touati, A.-M.L.; Lindgren, S. Reconstructing the Original Splendour of the House of Caecilius Iucundus. SCIRES-IT 2016, 6, 51–66. [Google Scholar] [CrossRef] [Scilit]
- Demetrescu, E.; Fanini, B. A White-Box Framework to Oversee Archaeological Virtual Reconstructions in Space and Time. J. Archaeol. Sci. Rep. 2017, 14, 500–514. [Google Scholar] [CrossRef] [Scilit]
- Fanini, B.; Demetrescu, E. Carving Time and Space: A Mutual Stimulation of IT and Archaeology to Craft Multidimensional VR Data-Inspection. In International Conference on Digital Environments for Education, Arts and Heritage; Springer: Berlin/Heidelberg, Germany, 2018; pp. 553–565. [Google Scholar] [CrossRef] [Scilit]
- Demetrescu, E. Virtual Reconstruction as a Scientific Tool: The Extended Matrix and Source-Based Modelling Approach. In Digital Research and Education in Architectural Heritage; Springer: Berlin/Heidelberg, Germany, 2018; pp. 102–116. [Google Scholar] [CrossRef] [Scilit]
- Ferdani, D.; Demetrescu, E.; Cavalieri, M.; Pace, G.; Lenzi, S. 3D Modelling and Visualization in Field Archaeology: From Survey to Interpretation of the Past Using Digital Technologies. Groma 2020, 4. [Google Scholar] [CrossRef] [Scilit]
- Demetrescu, E. Extended Matrix Tools. EMtools GitHub Page. 2020. Available online: https://github.com/zalmoxes-laran/EM-blender-tools (accessed on 30 June 2025).
- Demetrescu, E. 3D Survey Collection. 3DSC. 2020. Available online: https://github.com/zalmoxes-laran/3D-survey-collection (accessed on 30 June 2025).
- Fanini, B. EMviq. GitHub Project. 2020. Available online: https://github.com/phoenixbf/emviq (accessed on 30 June 2025).
- Reilly, P. Towards a Virtual Archaeology. In Computer Applications in Archaeology; British Archaeological Reports: Oxford, UK, 1990; pp. 133–139. [Google Scholar]
- Ferdani, D.; Demetrescu, E.; d’Annibale, E.; Bottazzi, G.; Bigi, P. Le Fortificazioni del Titano: Un Progetto di Indagine Multidisciplinare per la Conoscenza e la Tutela dell’Edilizia Medievale Sammarinese. Archeol. Dell’Architettura 2019, 24, 195–215. [Google Scholar] [CrossRef]
- Russo, A.; Cosentino, R.; d’Annibale, E.; Demetrescu, E.; Ferdani, D. La Necropoli della Banditaccia di Cerveteri: Da Raniero Mengarelli agli UAV. Archeol. Aerea 2019, 11, 105–118. Available online: http://www.claudiogrenzieditore.it/scheda_libro.asp?id_libro=997 (accessed on 30 June 2025).
- Pietroni, E.; Ferdani, D.; Forlani, M.; Pagano, A.; Rufa, C. Bringing the Illusion of Reality Inside Museums—A Methodological Proposal for an Advanced Museology Using Holographic Showcases. Informatics 2019, 6, 2. [Google Scholar] [CrossRef] [Scilit]
- Barceló, J.A.; Forte, M.; Sanders, D.H. Virtual Reality in Archaeology; ArchaeoPress: Oxford, UK, 2000. [Google Scholar]
- Bentkowska-Kafel, A.; Denard, H.; Baker, D. Paradata and Transparency in Virtual Heritage; Ashgate Publishing: Farnham, UK, 2012. [Google Scholar]
- Clark, J.T. The Fallacy of Reconstruction. In Introduction to Cyber-Archaeology; Forte, M., Ed.; Archaeopress: Oxford, UK, 2010; pp. 63–74. [Google Scholar]
- Denard, H. Implementing Best Practice in Cultural Heritage Visualisation: The London Charter. In Good Practice in Archaeological Diagnostics; Springer: Berlin/Heidelberg, Germany, 2013; pp. 255–268. [Google Scholar]
- Dell’Unto, N.; Ferdani, D.; Leander, A.-M.; Dellepiane, M.; Callieri, M.; Lindgren, S. Digital Reconstruction and Visualization in Archaeology: Case-Study Drawn from the Work of the Swedish Pompeii Project. In Proceedings of the 2013 Digital Heritage International Congress, Marseille, France, 28 October–1 November 2013; IEEE: Piscataway, NJ, USA, 2013; Volume 1, pp. 621–628. [Google Scholar] [CrossRef] [Scilit]
- Forte, M. Cyber Archaeology: 3D Sensing and Digital Embodiment. In Digital Methods and Remote Sensing in Archaeology; Springer: Berlin/Heidelberg, Germany, 2016; pp. 271–289. [Google Scholar]
- Gabellone, F. The Reconstruction of Archaeological Contexts: A Dialectical Relationship between Historical-Aesthetic Values and Principles of Architecture. In Sensing the Past; Springer: Berlin/Heidelberg, Germany, 2017; pp. 395–417. [Google Scholar]
- Barceló, J.A.; Calvano, M.; Campana, I.; Piqué, R.; Palomo, A.; Bultó, J.O. Rebuilding the Past: 3D Reconstruction and BIM Analysis of a Neolithic House at La Draga (Girona, Spain). In Digital Cultural Heritage; Springer: Berlin/Heidelberg, Germany, 2020; pp. 157–168. [Google Scholar] [CrossRef] [Scilit]
- Ferdani, D.; Fanini, B.; Piccioli, M.C.; Carboni, F.; Vigliarolo, P. 3D Reconstruction and Validation of Historical Background for Immersive VR Applications and Games: The Case Study of the Forum of Augustus in Rome. J. Cult. Herit. 2020, 43, 129–143. [Google Scholar] [CrossRef] [Scilit]
- Apollonio, F.I.; Gaiani, M.; Sun, Z. 3D Reality-Based Artefact Models for the Management of Archaeological Sites Using 3D Gis: A Framework Starting from the Case Study of the Pompeii Archaeological Area. J. Archaeol. Sci. 2012, 39, 1271–1287. [Google Scholar] [CrossRef] [Scilit]
- Remondino, F.; El-Hakim, S. Image-Based 3D Modelling: A Review. Photogramm. Rec. 2006, 21, 269–291. [Google Scholar] [CrossRef] [Scilit]
- Champion, E. Critical Gaming: Interactive History and Virtual Heritage; Ashgate Publishing: Farnham, UK, 2011. [Google Scholar]
- Frischer, B.; Dakouri-Hild, A. Beyond Illustration: 2D and 3D Digital Technologies as Tools for Discovery in Archaeology; Archaeopress: Oxford, UK, 2008. [Google Scholar]
- Agugiaro, G.; Remondino, F.; Girardi, G.; Von Schwerin, J.; Richards-Rissetto, H.; De Amicis, R. A Web-Based Interactive Tool for Multi-Resolution 3D Models of a Maya Archaeological Site. ISPRS Arch. 2011, 38, 23–30. [Google Scholar] [CrossRef] [Scilit]
- Guidi, G.; Russo, M.; Angheleddu, D. 3D Survey and Virtual Reconstruction of Archaeological Sites. Digit. Appl. Archaeol. Cult. Herit. 2014, 1, 55–69. [Google Scholar] [CrossRef] [Scilit]
- Remondino, F.; Spera, M.G.; Nocerino, E.; Menna, F.; Nex, F. State of the Art in High Density Image Matching. Photogramm. Rec. 2014, 29, 144–166. [Google Scholar] [CrossRef] [Scilit]
- Kersten, T.P.; Lindstaedt, M. Image-Based Low-Cost Systems for Automatic 3D Recording and Modelling of Archaeological Finds and Objects. In Progress in Cultural Heritage Preservation; Ioannides, M., Fritsch, D., Leissner, J., Davies, R., Remondino, F., Caffo, R., Eds.; Springer: Berlin/Heidelberg, Germany, 2012; pp. 1–10. [Google Scholar] [CrossRef] [Scilit]
- Koutsoudis, A.; Vidmar, B.; Ioannakis, G.; Arnaoutoglou, F.; Pavlidis, G.; Chamzas, C. Multi-Image 3D Reconstruction Data Evaluation. J. Cult. Herit. 2014, 15, 73–79. [Google Scholar] [CrossRef] [Scilit]
- Callieri, M.; Cignoni, P.; Corsini, M.; Scopigno, R. Masked Photo Blending: Mapping Dense Photographic Data Set on High-Resolution Sampled 3D Models. Comput. Graph. 2008, 32, 464–473. [Google Scholar] [CrossRef] [Scilit]
- Dellepiane, M.; Dell’Unto, N.; Callieri, M.; Lindgren, S.; Scopigno, R. Archeological Excavation Monitoring Using Dense Stereo Matching Techniques. J. Cult. Herit. 2013, 14, 201–210. [Google Scholar] [CrossRef] [Scilit]
- Campana, S. Drones in Archaeology. State-of-the-Art and Future Perspectives. Archaeol. Prospect. 2017, 24, 275–296. [Google Scholar] [CrossRef] [Scilit]
- Jiménez Fernández-Palacios, B.; Rizzi, A.; Remondino, F.; Baier, W.; Haala, N. Crowdsourcing for 3D Surveys—What Works and What Does Not. Int. Arch. Photogramm. Remote Sens. Spat. Inf. Sci. 2013, 40, 363–368. [Google Scholar]
- Cignoni, P.; Callieri, M.; Corsini, M.; Dellepiane, M.; Ganovelli, F.; Ranzuglia, G. MeshLab: An Open-Source Mesh Processing Tool. In Proceedings of the Eurographics Italian Chapter Conference 2008, Salerno, Italy, 2–4 July 2008; Scarano, V., De Chiara, R., Erra, U., Eds.; Eurographics Association: Goslar, Germany, 2008; pp. 129–136. [Google Scholar]
- Girardeau-Montaut, D. CloudCompare (Version 2.8) [GPL Software]; EDF R&D, Telecom ParisTech: Paris, France, 2016; Available online: http://www.cloudcompare.org/ (accessed on 30 June 2025).
- Lévy, B.; Petitjean, S.; Ray, N.; Maillot, J. Least Squares Conformal Maps for Automatic Texture Atlas Generation. ACM Trans. Graph. 2002, 21, 362–371. [Google Scholar] [CrossRef] [Scilit]
- Dell’Unto, N.; Leander, A.M.; Dellepiane, M.; Callieri, M.; Ferdani, D.; Lindgren, S. Experiencing Ancient Buildings from a 3D GIS Perspective: A Case Drawn from the Swedish Pompeii Project. J. Archaeol. Method Theory 2016, 23, 73–94. [Google Scholar] [CrossRef] [Scilit]
- Opitz, R.S.; Cowley, D. Interpreting Archaeological Topography: 3D Data, Visualisation and Observation; Oxbow Books: Oxford, UK, 2013. [Google Scholar]
- Guarnieri, A.; Remondino, F.; Vettore, A. Digital Photogrammetry and TLS Data Fusion Applied to Cultural Heritage 3D Modeling. ISPRS Arch. 2004, 36, 1–6. [Google Scholar]
- Sanders, D.H. Virtual Heritage: Researching and Visualizing the Past in 3D. J. East. Mediterr. Archaeol. Herit. Stud. 2014, 2, 30–47. [Google Scholar] [CrossRef] [Scilit]
- Watterson, A. Beyond Digital Dwelling: Re-Thinking Interpretive Visualisation in Archaeology. Open Archaeol. 2015, 1, 119–130. [Google Scholar] [CrossRef] [Scilit]
- Bitelli, G.; Girelli, V.A.; Sammarini, G. 4-Dimensional Recording and Visualization of Urban Archaeological Excavations. Appl. Geomat. 2018, 10, 415–426. [Google Scholar] [CrossRef] [Scilit]
- Demetrescu, E.; d’Annibale, E.; Ferdani, D.; Fanini, B. Digital Replica of Cultural Landscapes: An Experimental Reality-Based Workflow to Create Realistic, Interactive Open World Experiences. J. Cult. Herit. 2020, 41, 125–141. [Google Scholar] [CrossRef] [Scilit]
- Serlorenzi, M.; Boi, V. Archeologia Preventiva, Predittiva, Potenziali Archeologici. Una Breve Introduzione al Panorama Italiano. In Proceedings of the VIII Ciclo di Lezioni sulla Ricerca Applicata in Archeologia, Certosa di Pontignano (SI), Italy, 8–12 March 2014; Campana, S., Remondino, F., Scopigno, R., Eds.; All’Insegna del Giglio: Firenze, Italy, 2016; pp. 115–130. [Google Scholar]
- Rea, R. Cantieristica Archeologica e Opere Pubbliche. In La Linea C della Metropolitana di Roma; Serlorenzi, M., Ed.; Mondadori Electa: Milano, Italy, 2011; pp. 13–18. [Google Scholar]
- Rea, R. Roma. Progettazione e Realizzazione della Linea “C” della Metropolitana. In Arqueología, Patrimonio y Desarrollo Urbano; Ajuntament de Girona: Girona, Spain, 2010; pp. 181–198. [Google Scholar]
- Martone, S. La Linea C della Metropolitana di Roma. Procedure e Nuove Prospettive. Boll. D’Arte 2010, 1, 1–26. [Google Scholar]
- Zamolxes-Laran. zalmoxes-Laran/3DSC_Metashape: V.0.9; Zenodo: Geneva, Switzerland, 2021. [Google Scholar] [CrossRef]
- Kazhdan, M.; Bolitho, M.; Hoppe, H. Poisson Surface Reconstruction. In Proceedings of the Fourth Eurographics Symposium on Geometry Processing, Cagliari, Sardinia, Italy, 26–28 June 2006; Eurographics Association: Goslar, Germany, 2006; pp. 61–70. [Google Scholar]
- Demetrescu, E. zalmoxes-Laran/3D-Survey-Collection: V1.6.10dev4; Zenodo: Geneva, Switzerland, 2024. [Google Scholar] [CrossRef]
- Pharr, M.; Jakob, W.; Humphreys, G. Physically Based Rendering: From Theory to Implementation, 3rd ed.; Morgan Kaufmann: San Francisco, CA, USA, 2016. [Google Scholar]
- Limoncelli, M. Virtual Hierapolis. Virtual Archaeology and Restoration Project (2007–2015); Ege Yayinlari: Istanbul, Turkey, 2019. [Google Scholar]
- Falzone, S.; Pellegrino, A. Scavi di Ostia: Insula delle Ierodule; Il Cigno GG Edizioni: Roma, Italy, 2014. [Google Scholar]
- Falzone, S. Ornata Aedificia: Pitture Parietali dalle Case Ostiensi; Istituto Poligrafico dello Stato: Roma, Italy, 2007. [Google Scholar]
- Molle, C. La Decorazione Pittorica delle Volte delle Sostruzioni Occidentali del Canopo di Villa Adriana. In Proceedings of the International Congress on Ancient Wall Painting: Materials, Techniques, Analysis and Conservation, Fribourg, Switzerland, 22–26 March 2004; Barbet, A., Ed.; Pytheas Publishing: Budapest, Hungary, 2004; pp. 385–388. [Google Scholar]
- Fanini, B.; Ferdani, D.; Demetrescu, E.; Berto, S.; d’Annibale, E. ATON: An Open-Source Framework for Creating Immersive, Collaborative and Liquid Web-Apps for Cultural Heritage. Appl. Sci. 2021, 11, 11062. [Google Scholar] [CrossRef] [Scilit]
- Fanini, B.; Demetrescu, E.; Bucciero, A.; Chirivi, A.; Giuri, F.; Ferrari, I.; Delbarba, N. Building Blocks for Multi-Dimensional WebXR Inspection Tools Targeting Cultural Heritage. In International Conference on Extended Reality; Springer: Berlin/Heidelberg, Germany, 2022; pp. 373–390. [Google Scholar] [CrossRef] [Scilit]
- Demetrescu, E.; Fanini, B.; Cocca, E. An Online Dissemination Workflow for the Scientific Process in CH through Semantic 3D: EMtools and EMviq Open Source Tools. Heritage 2023, 6, 1264–1276. [Google Scholar] [CrossRef] [Scilit]
- Demetrescu, E. Zalmoxes-Laran/3DSC_Metashape: V.1.0; Zenodo: Geneva, Switzerland, 2024. [Google Scholar] [CrossRef]
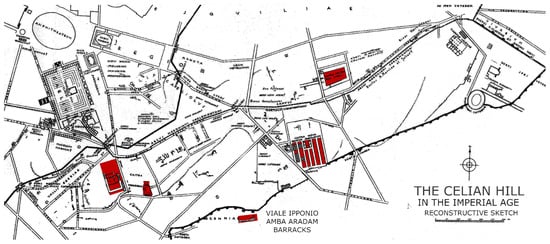
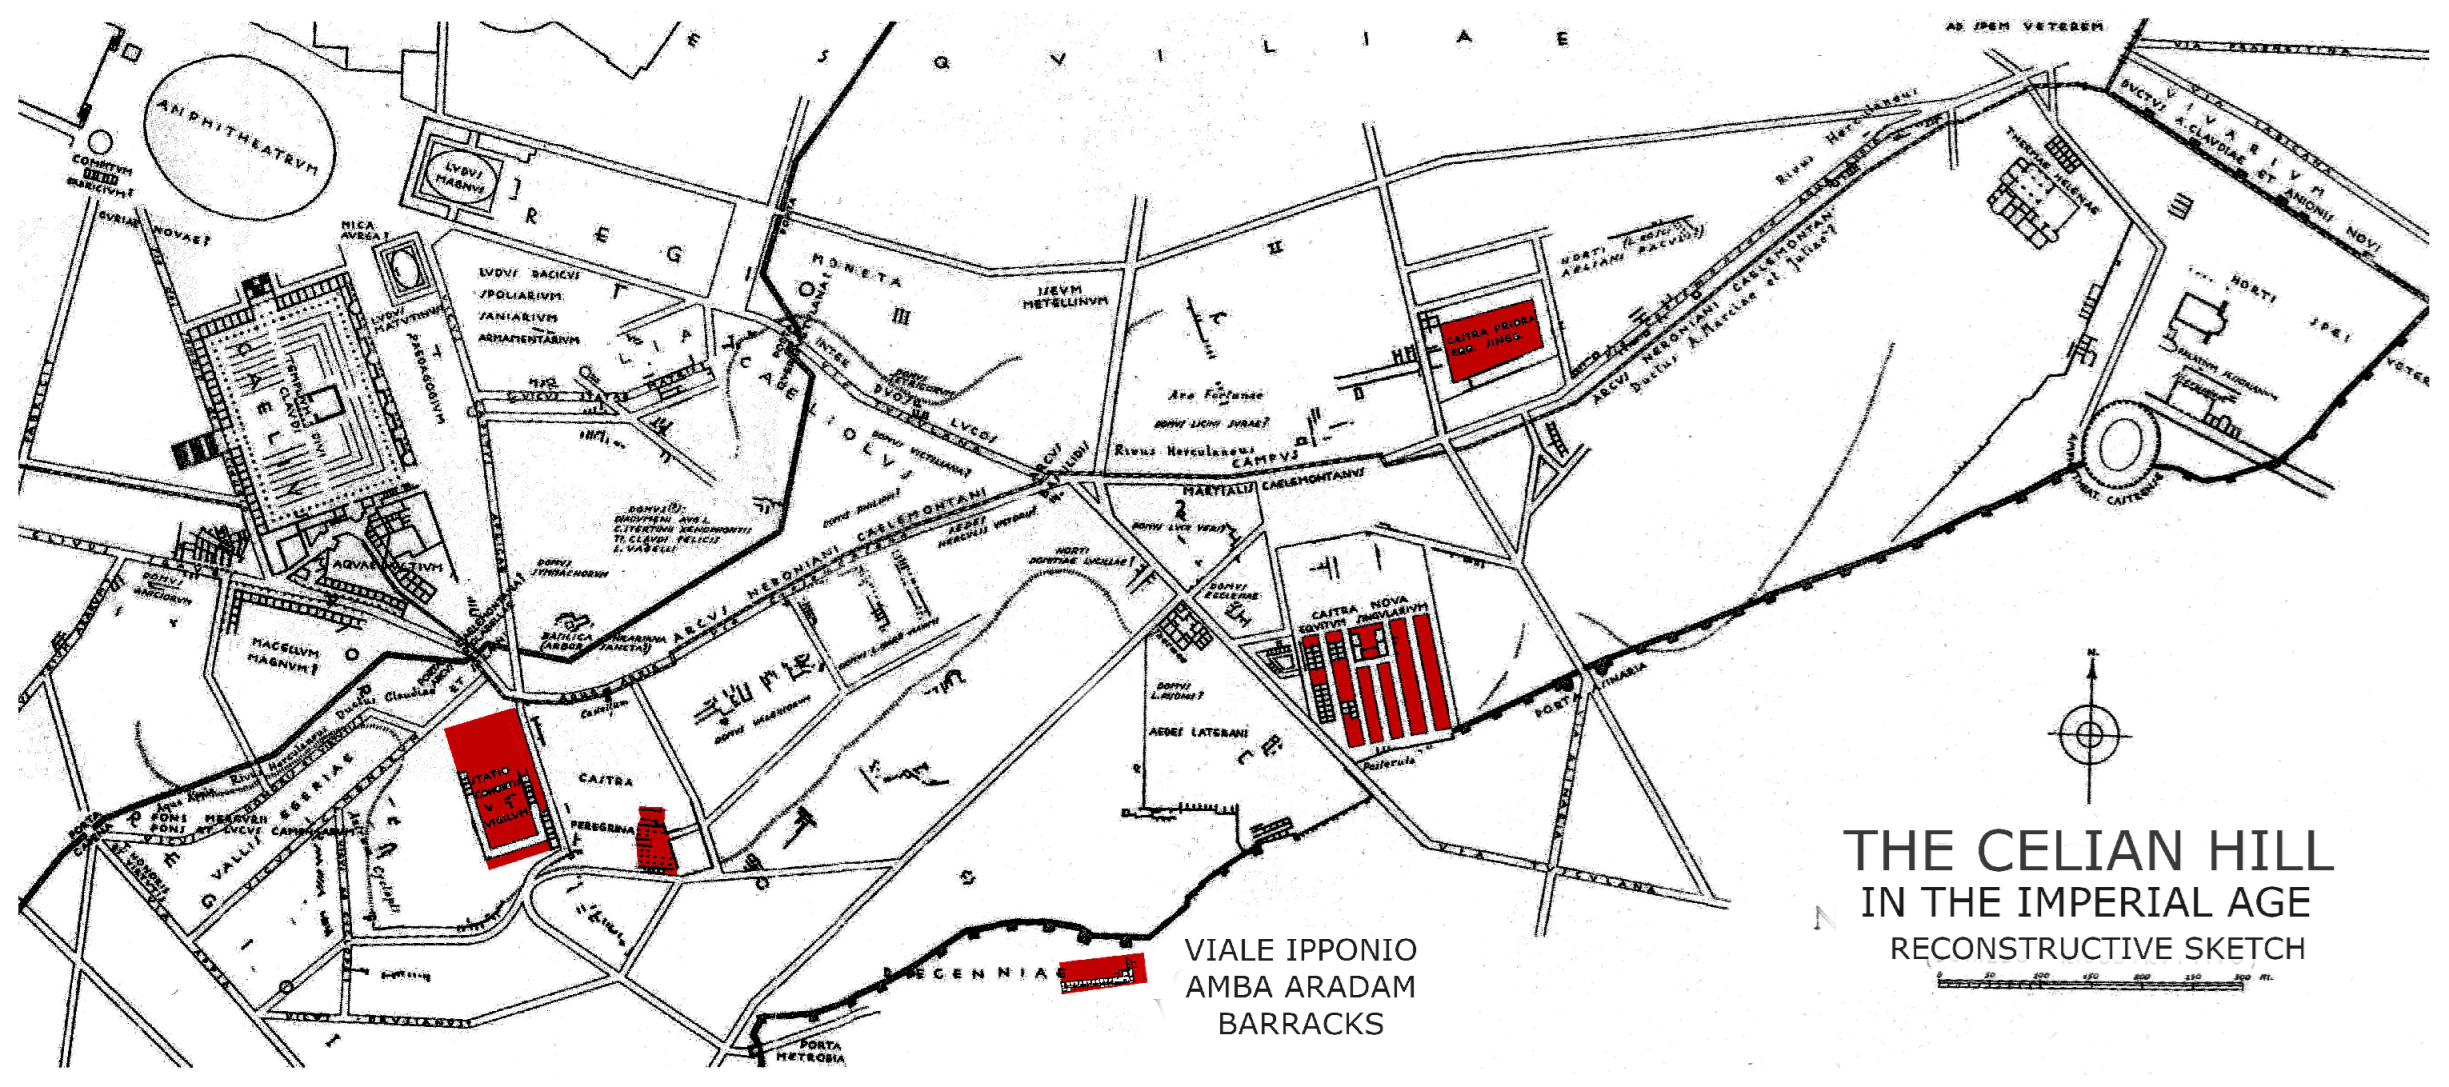
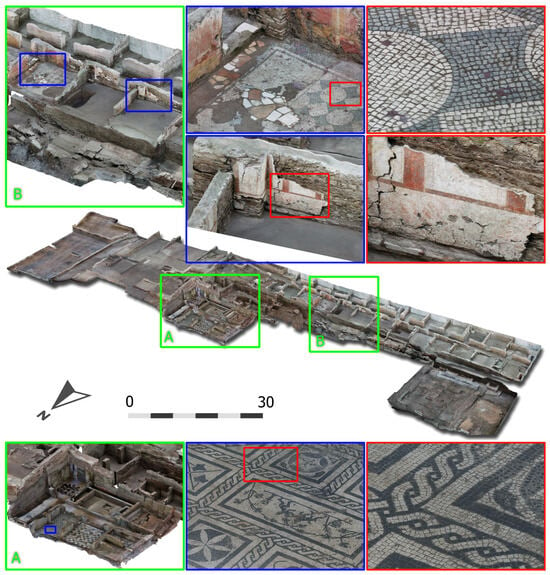
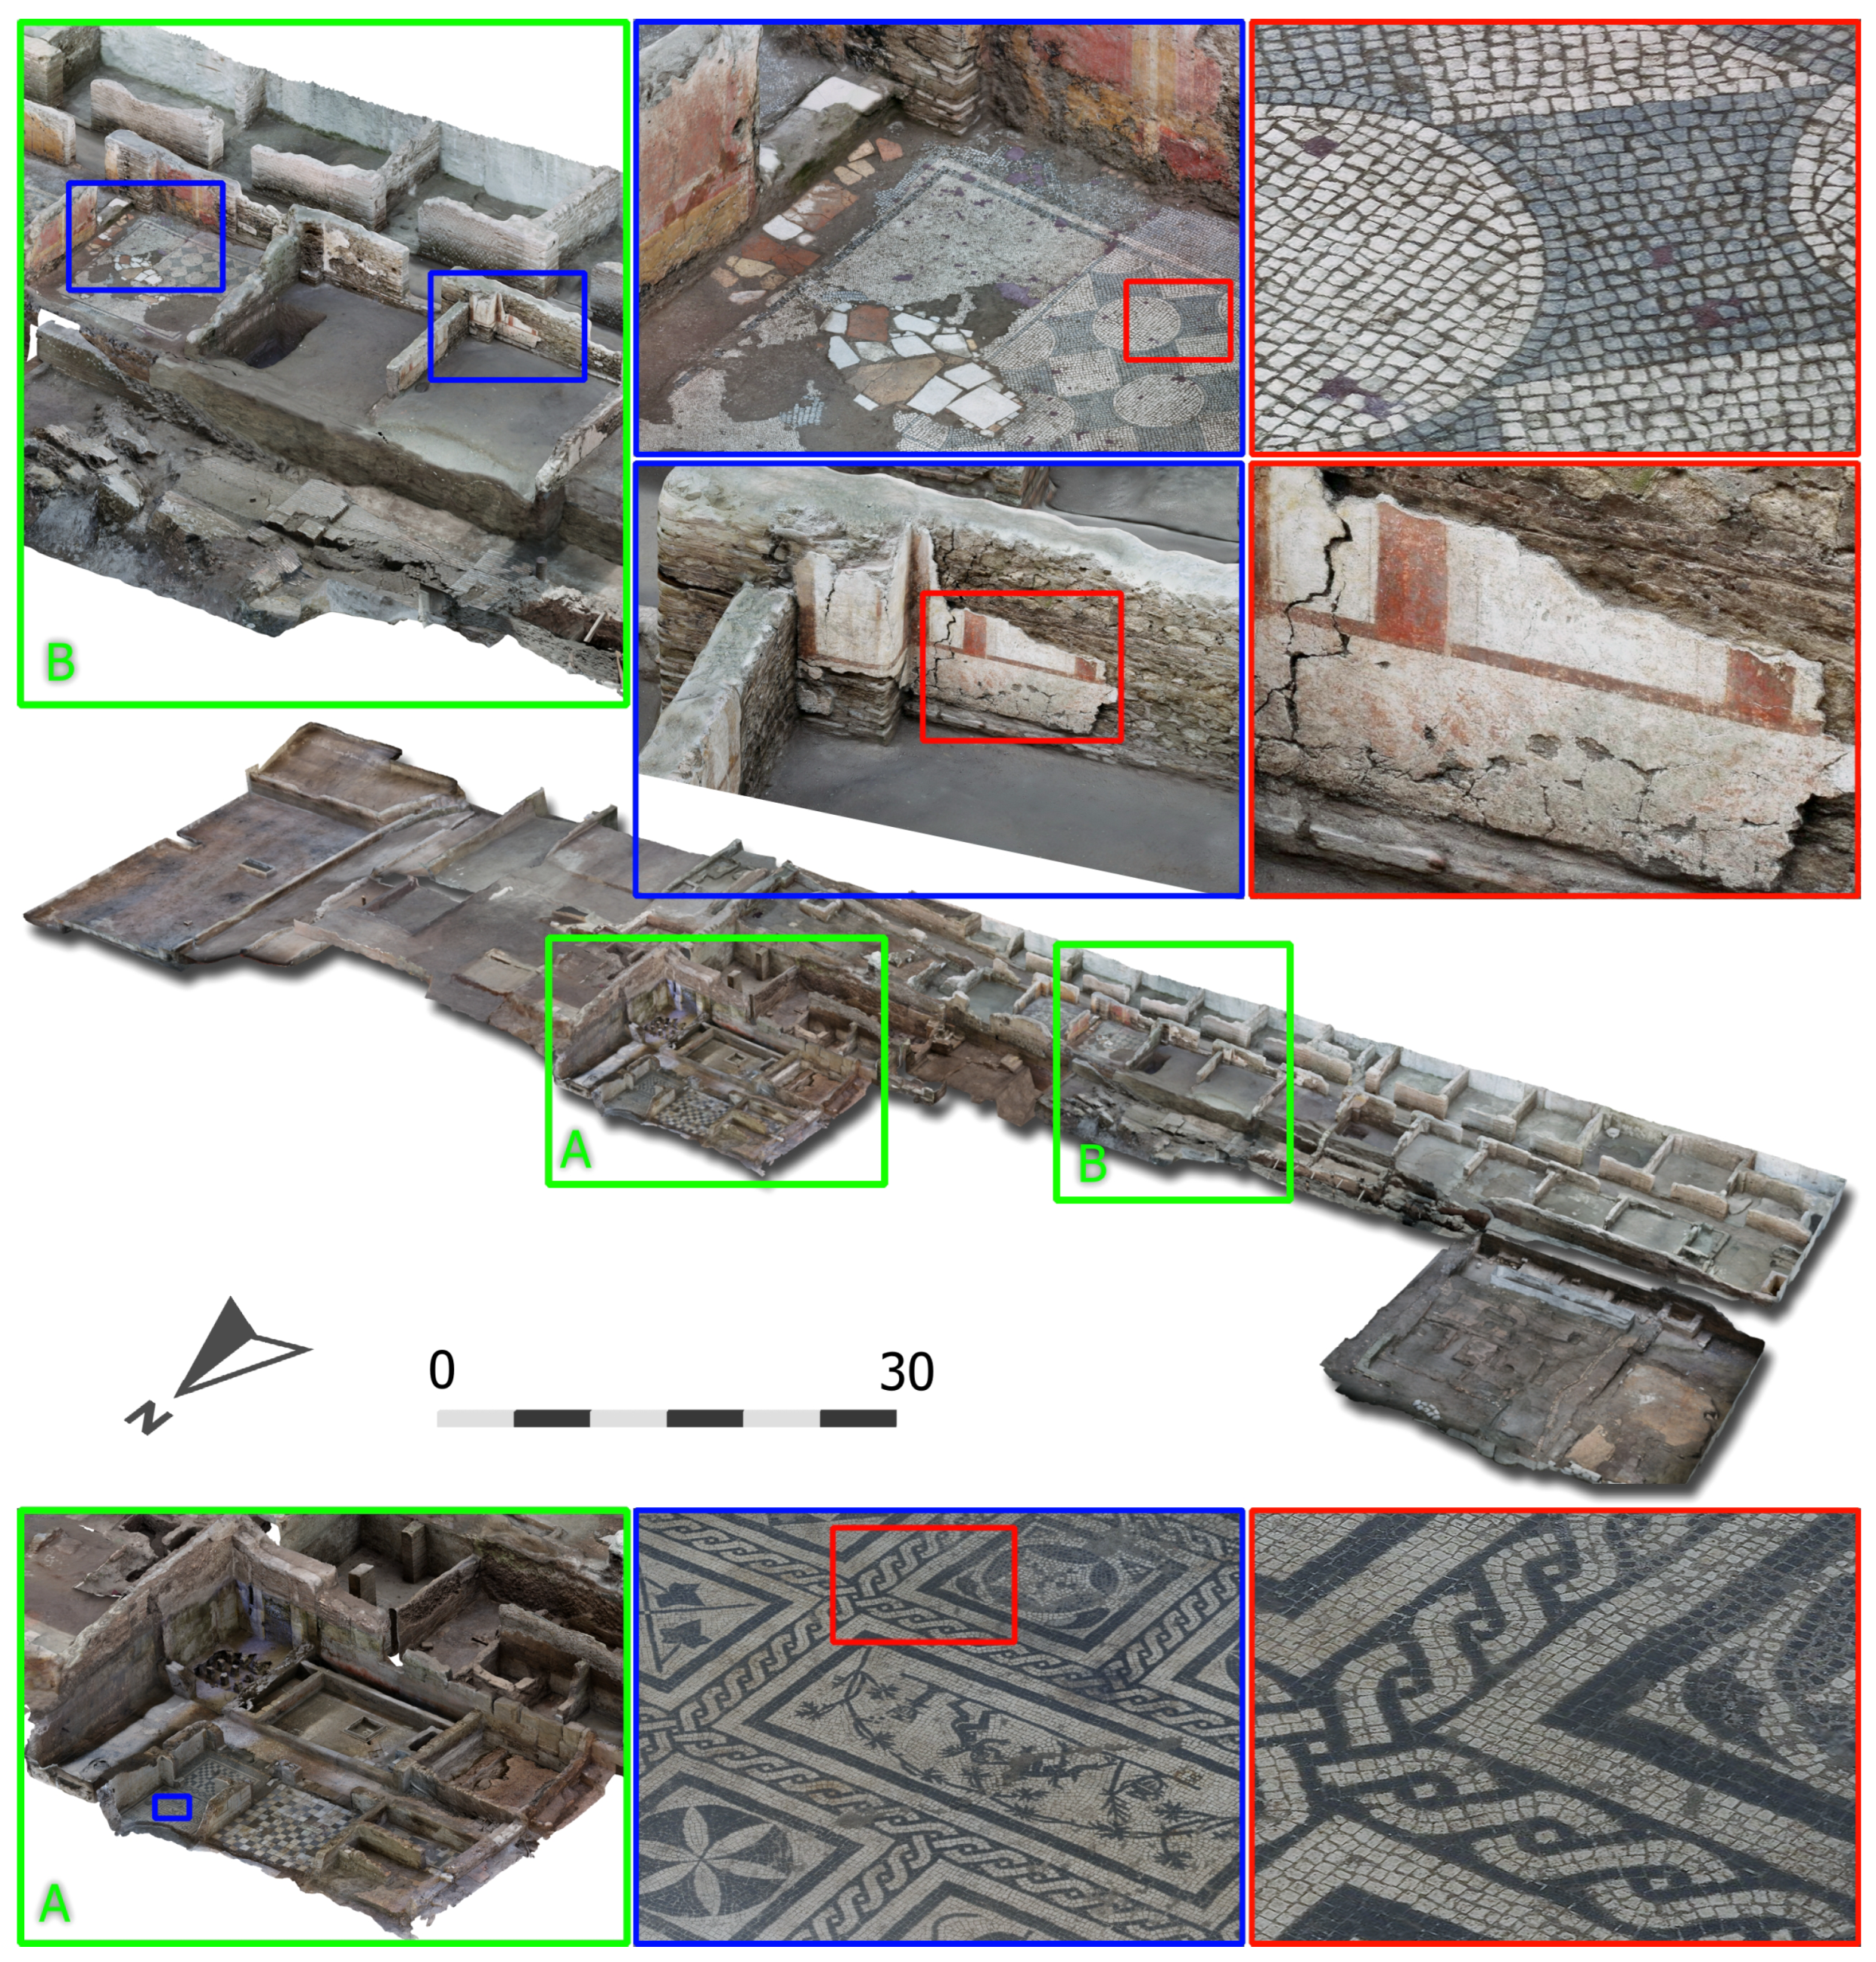
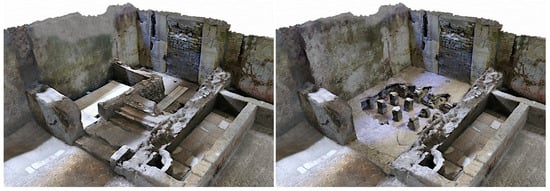
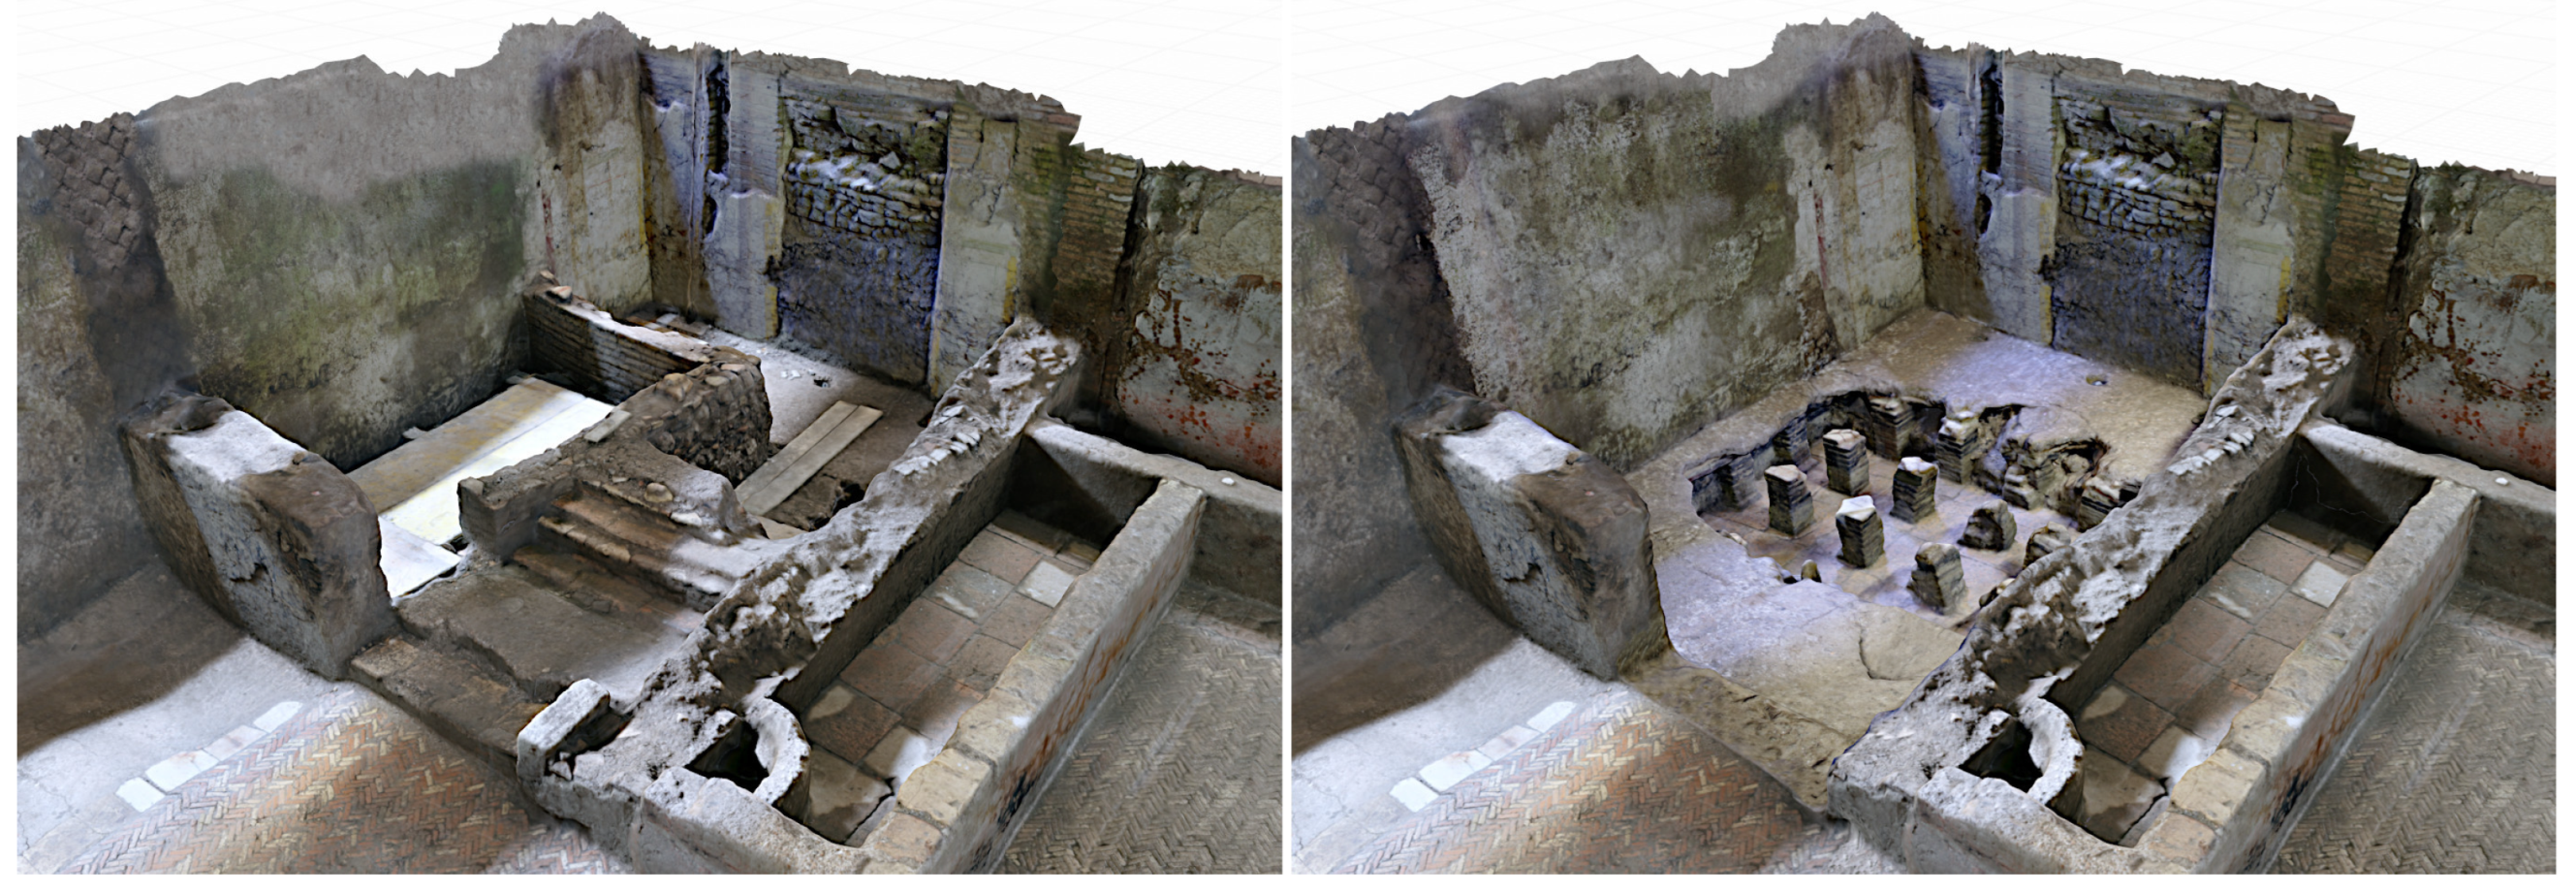
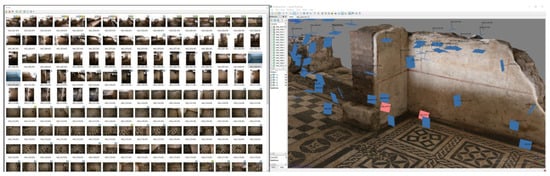
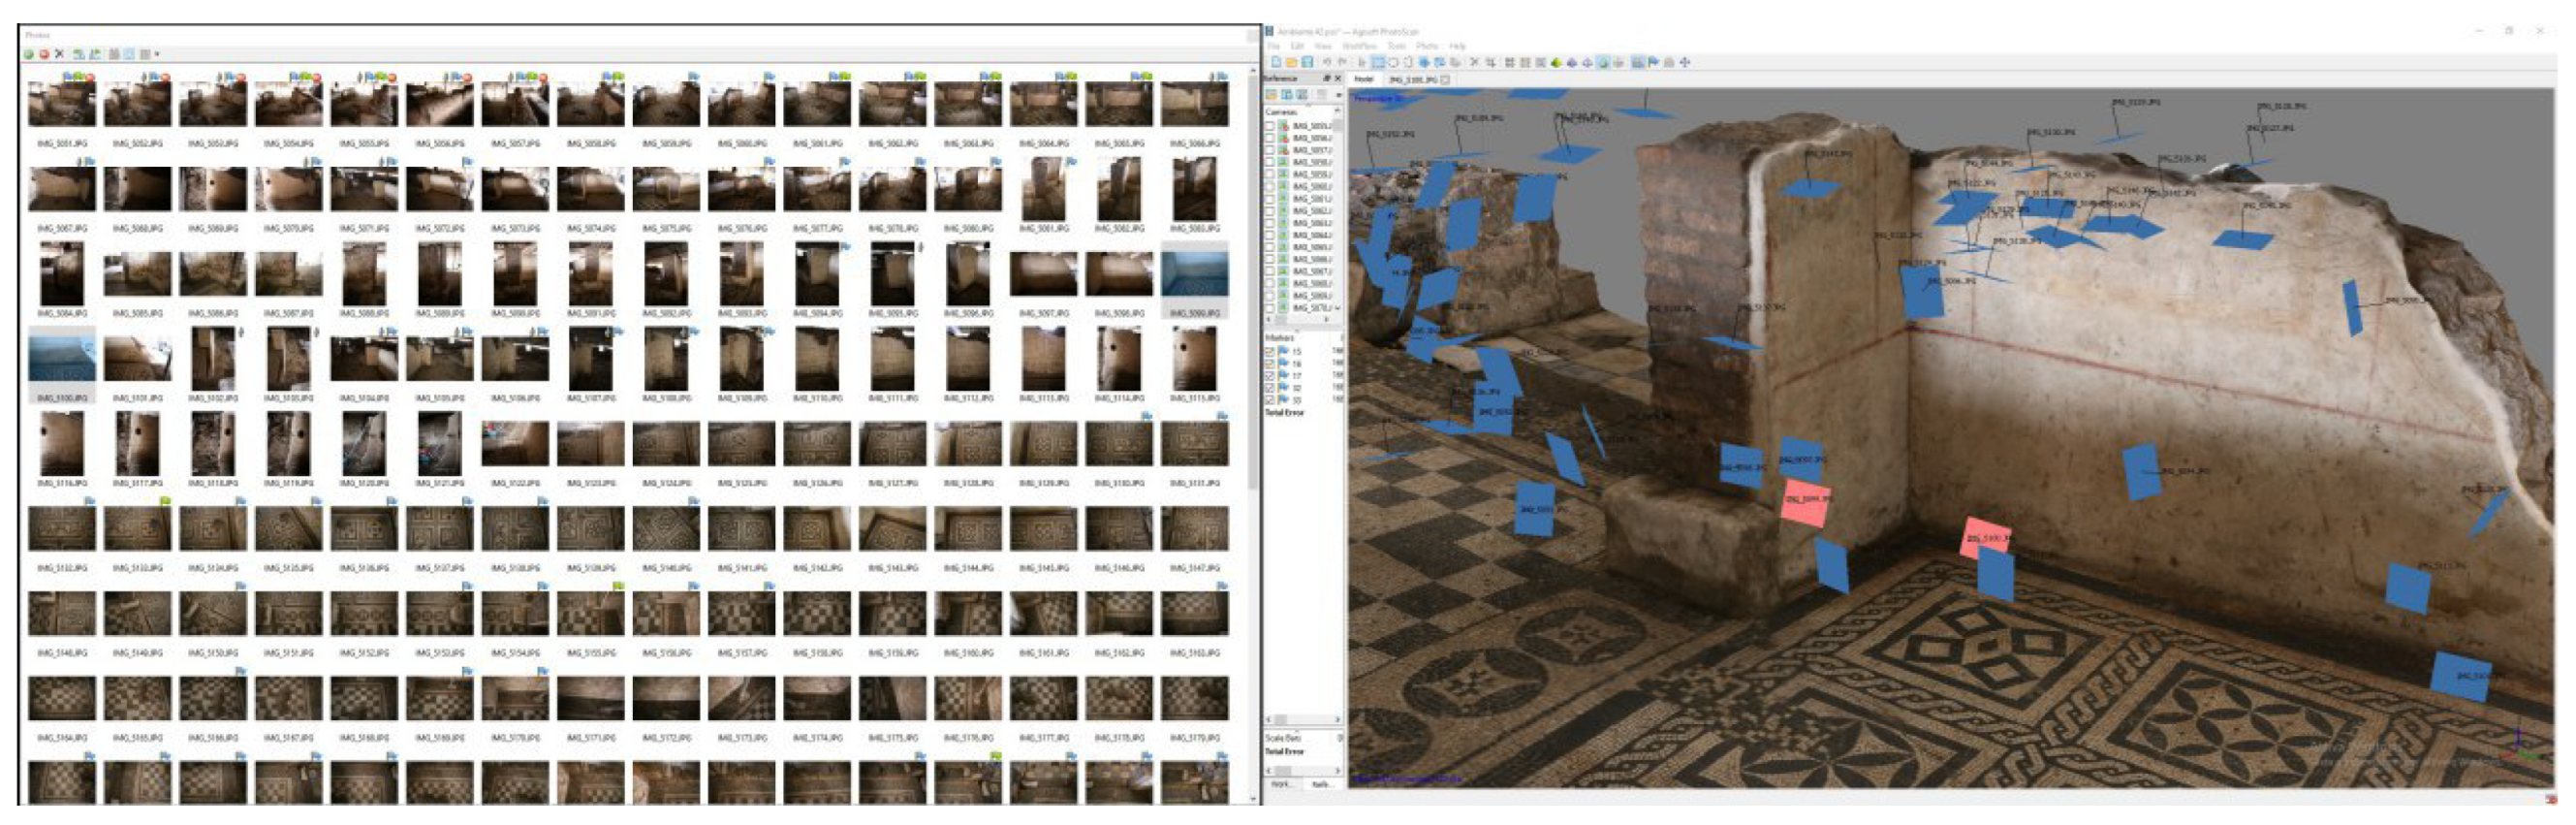
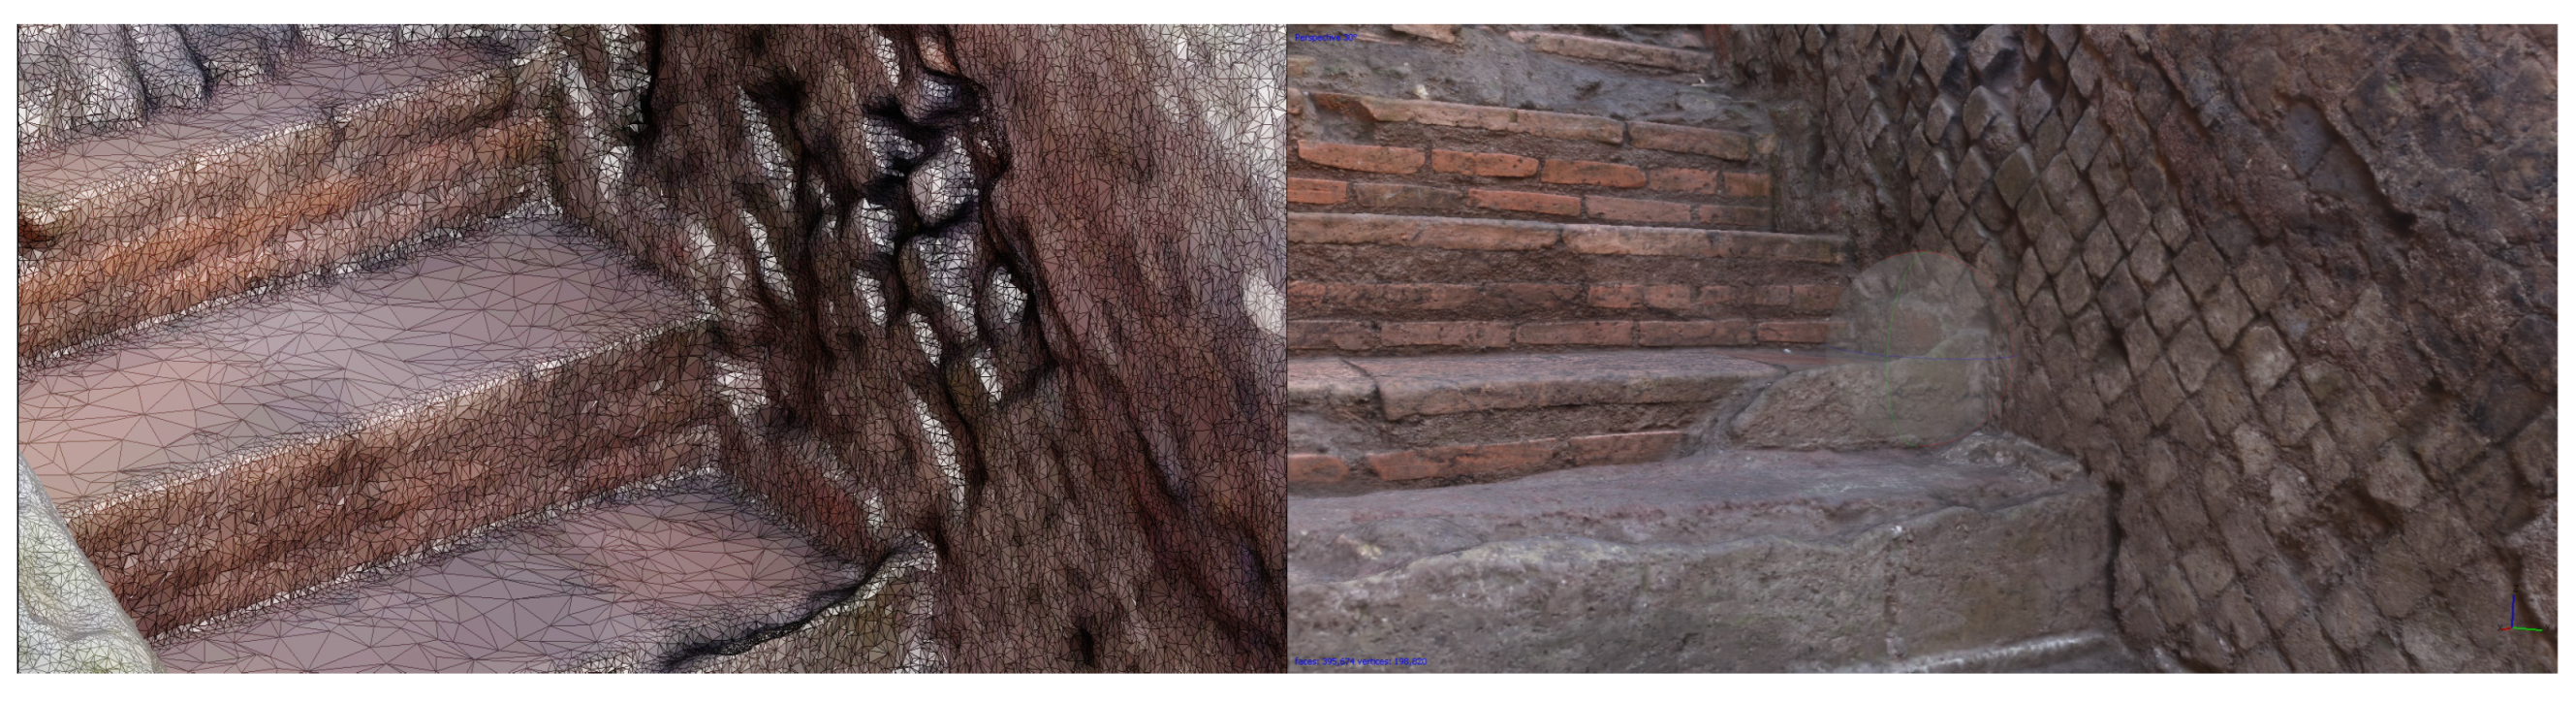
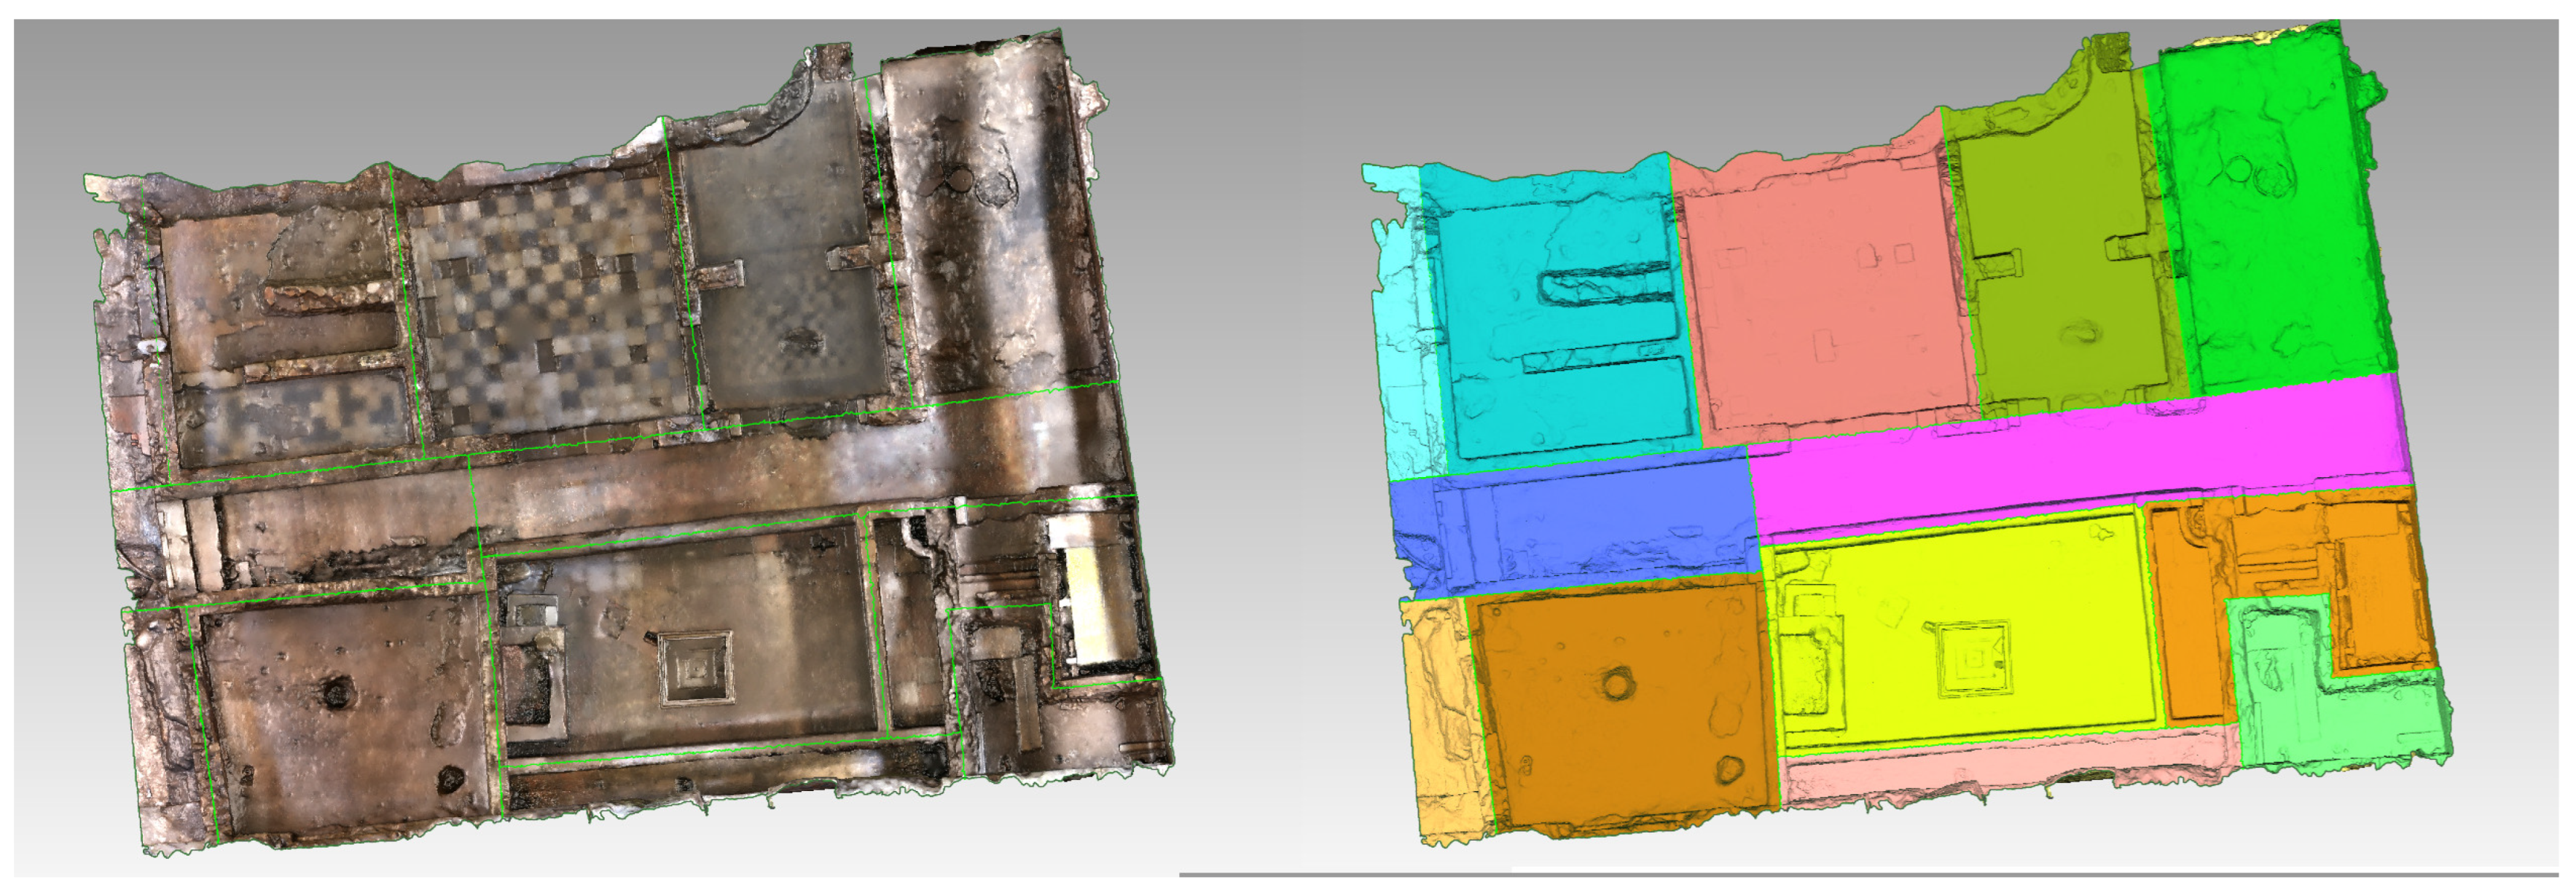
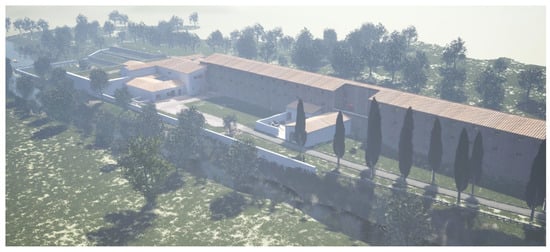
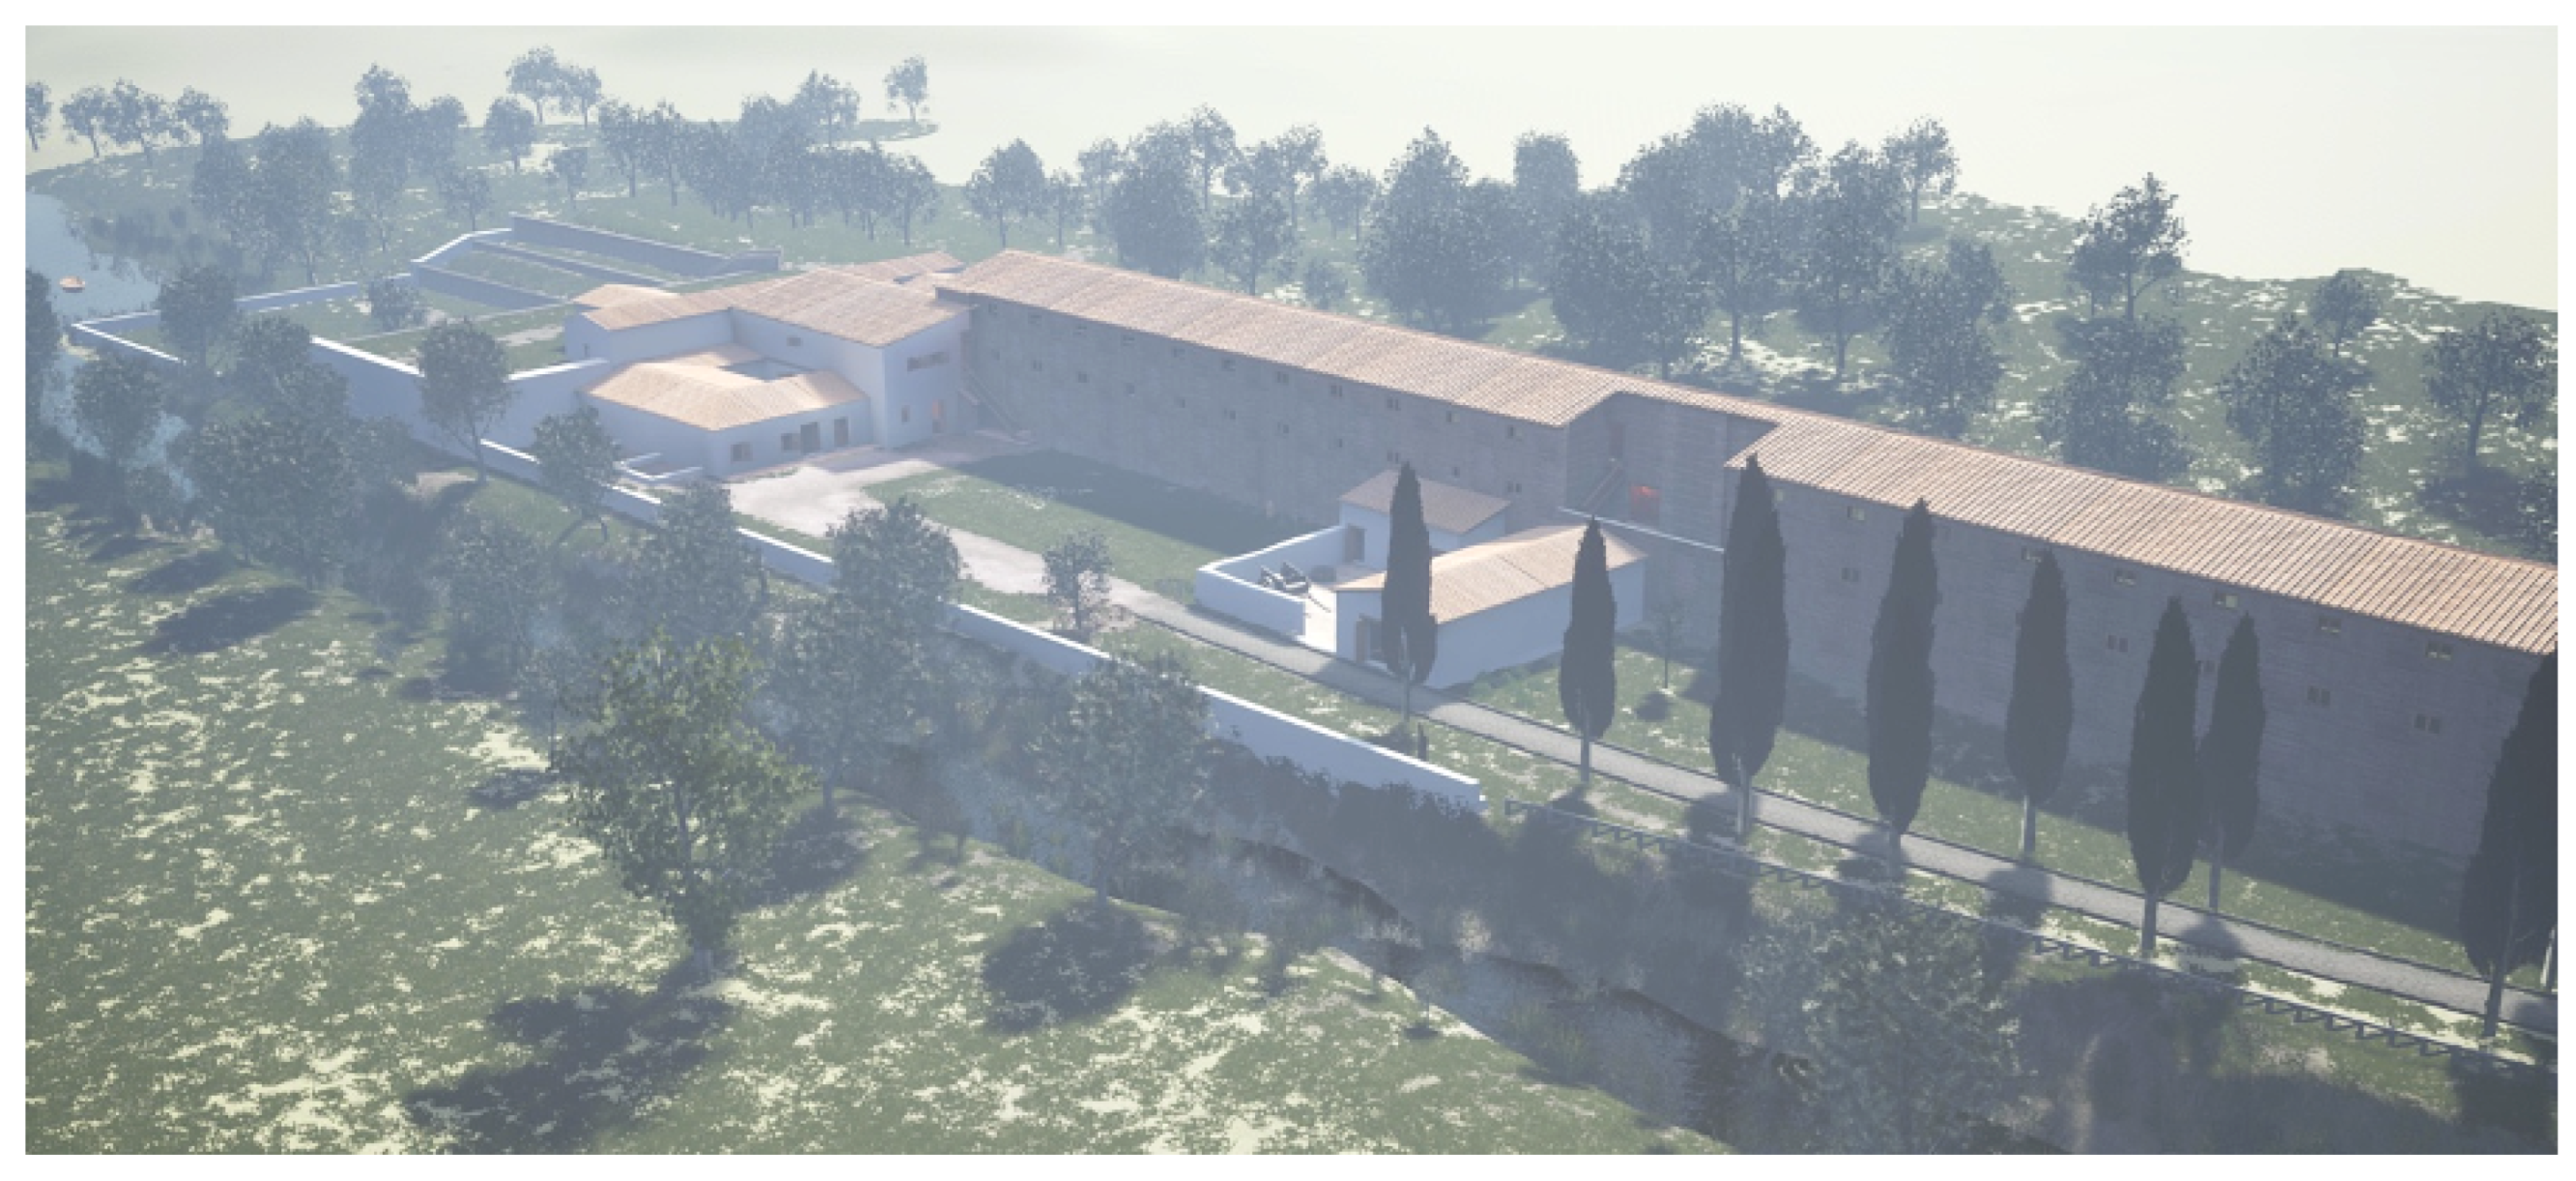
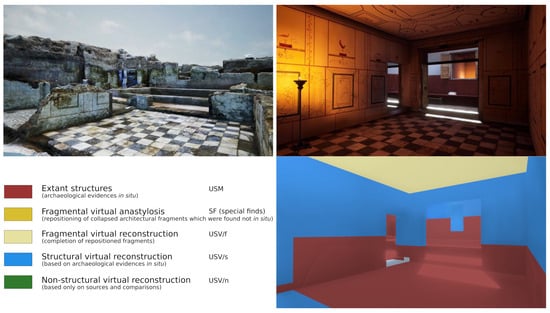
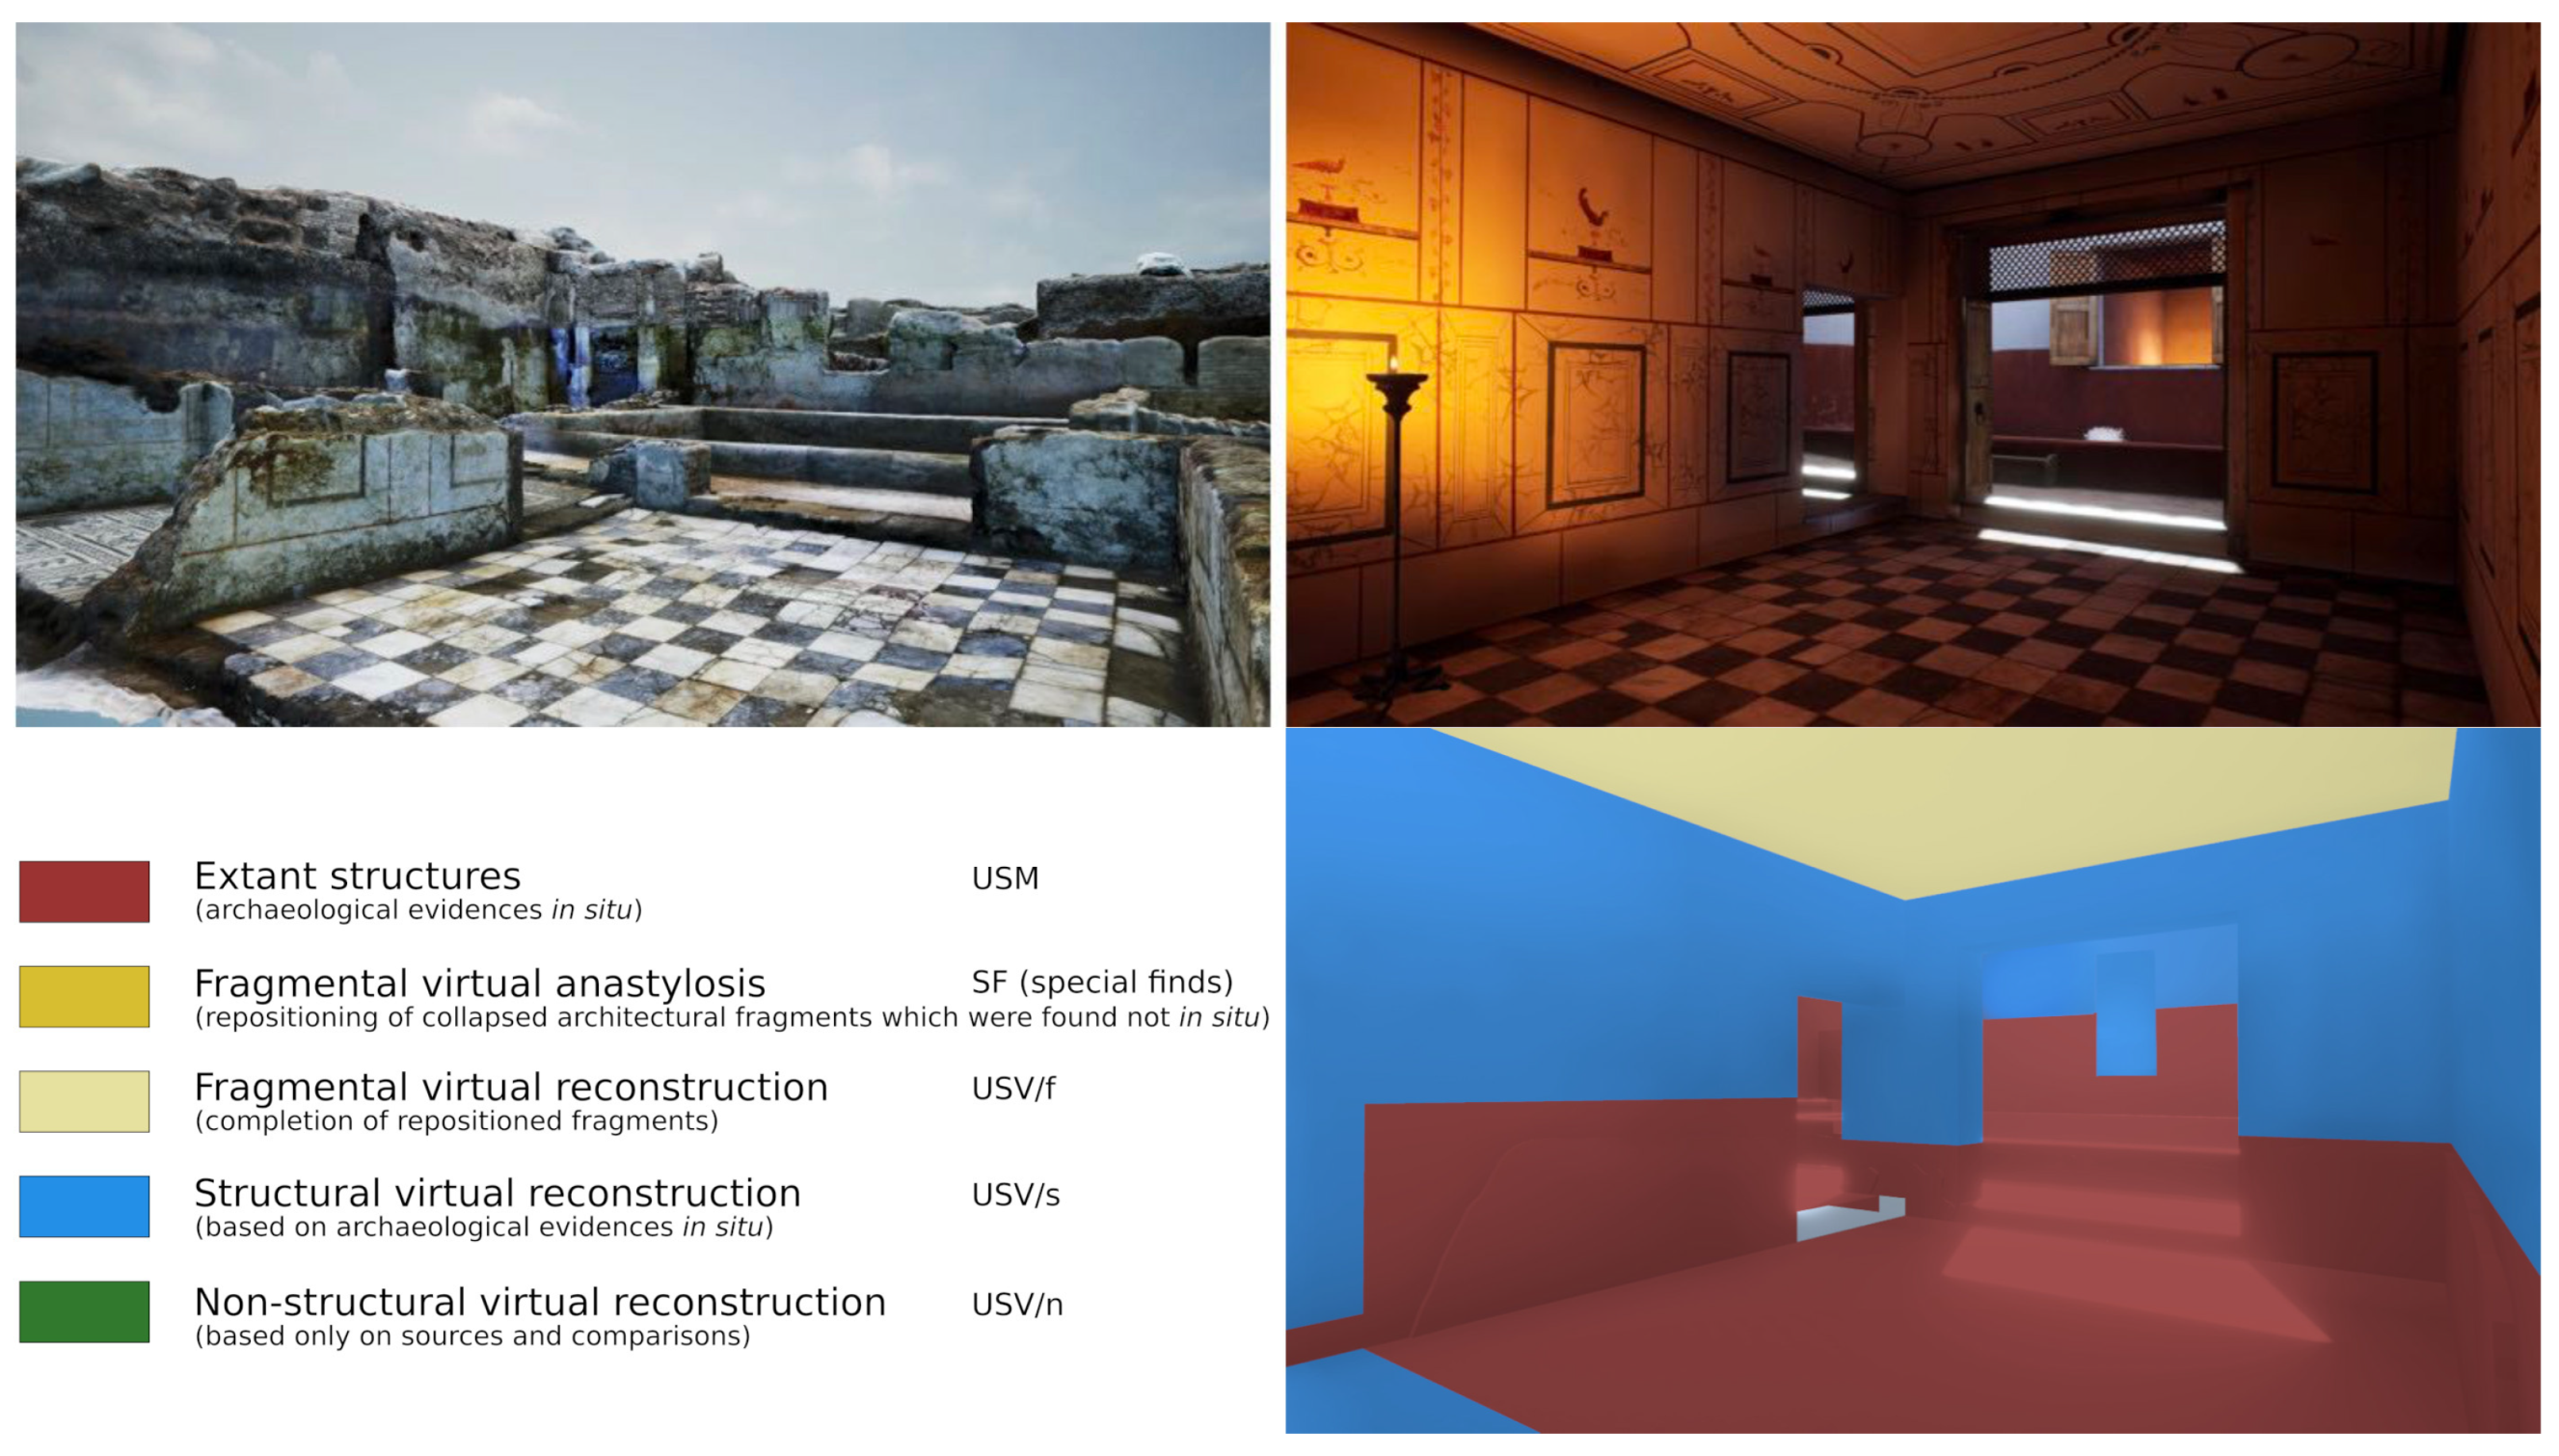
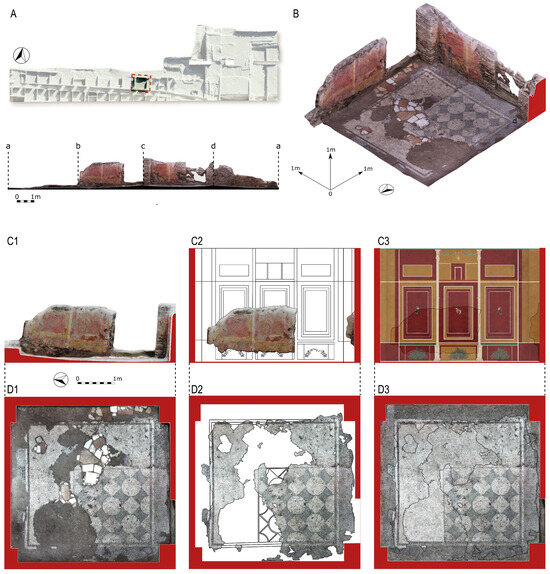
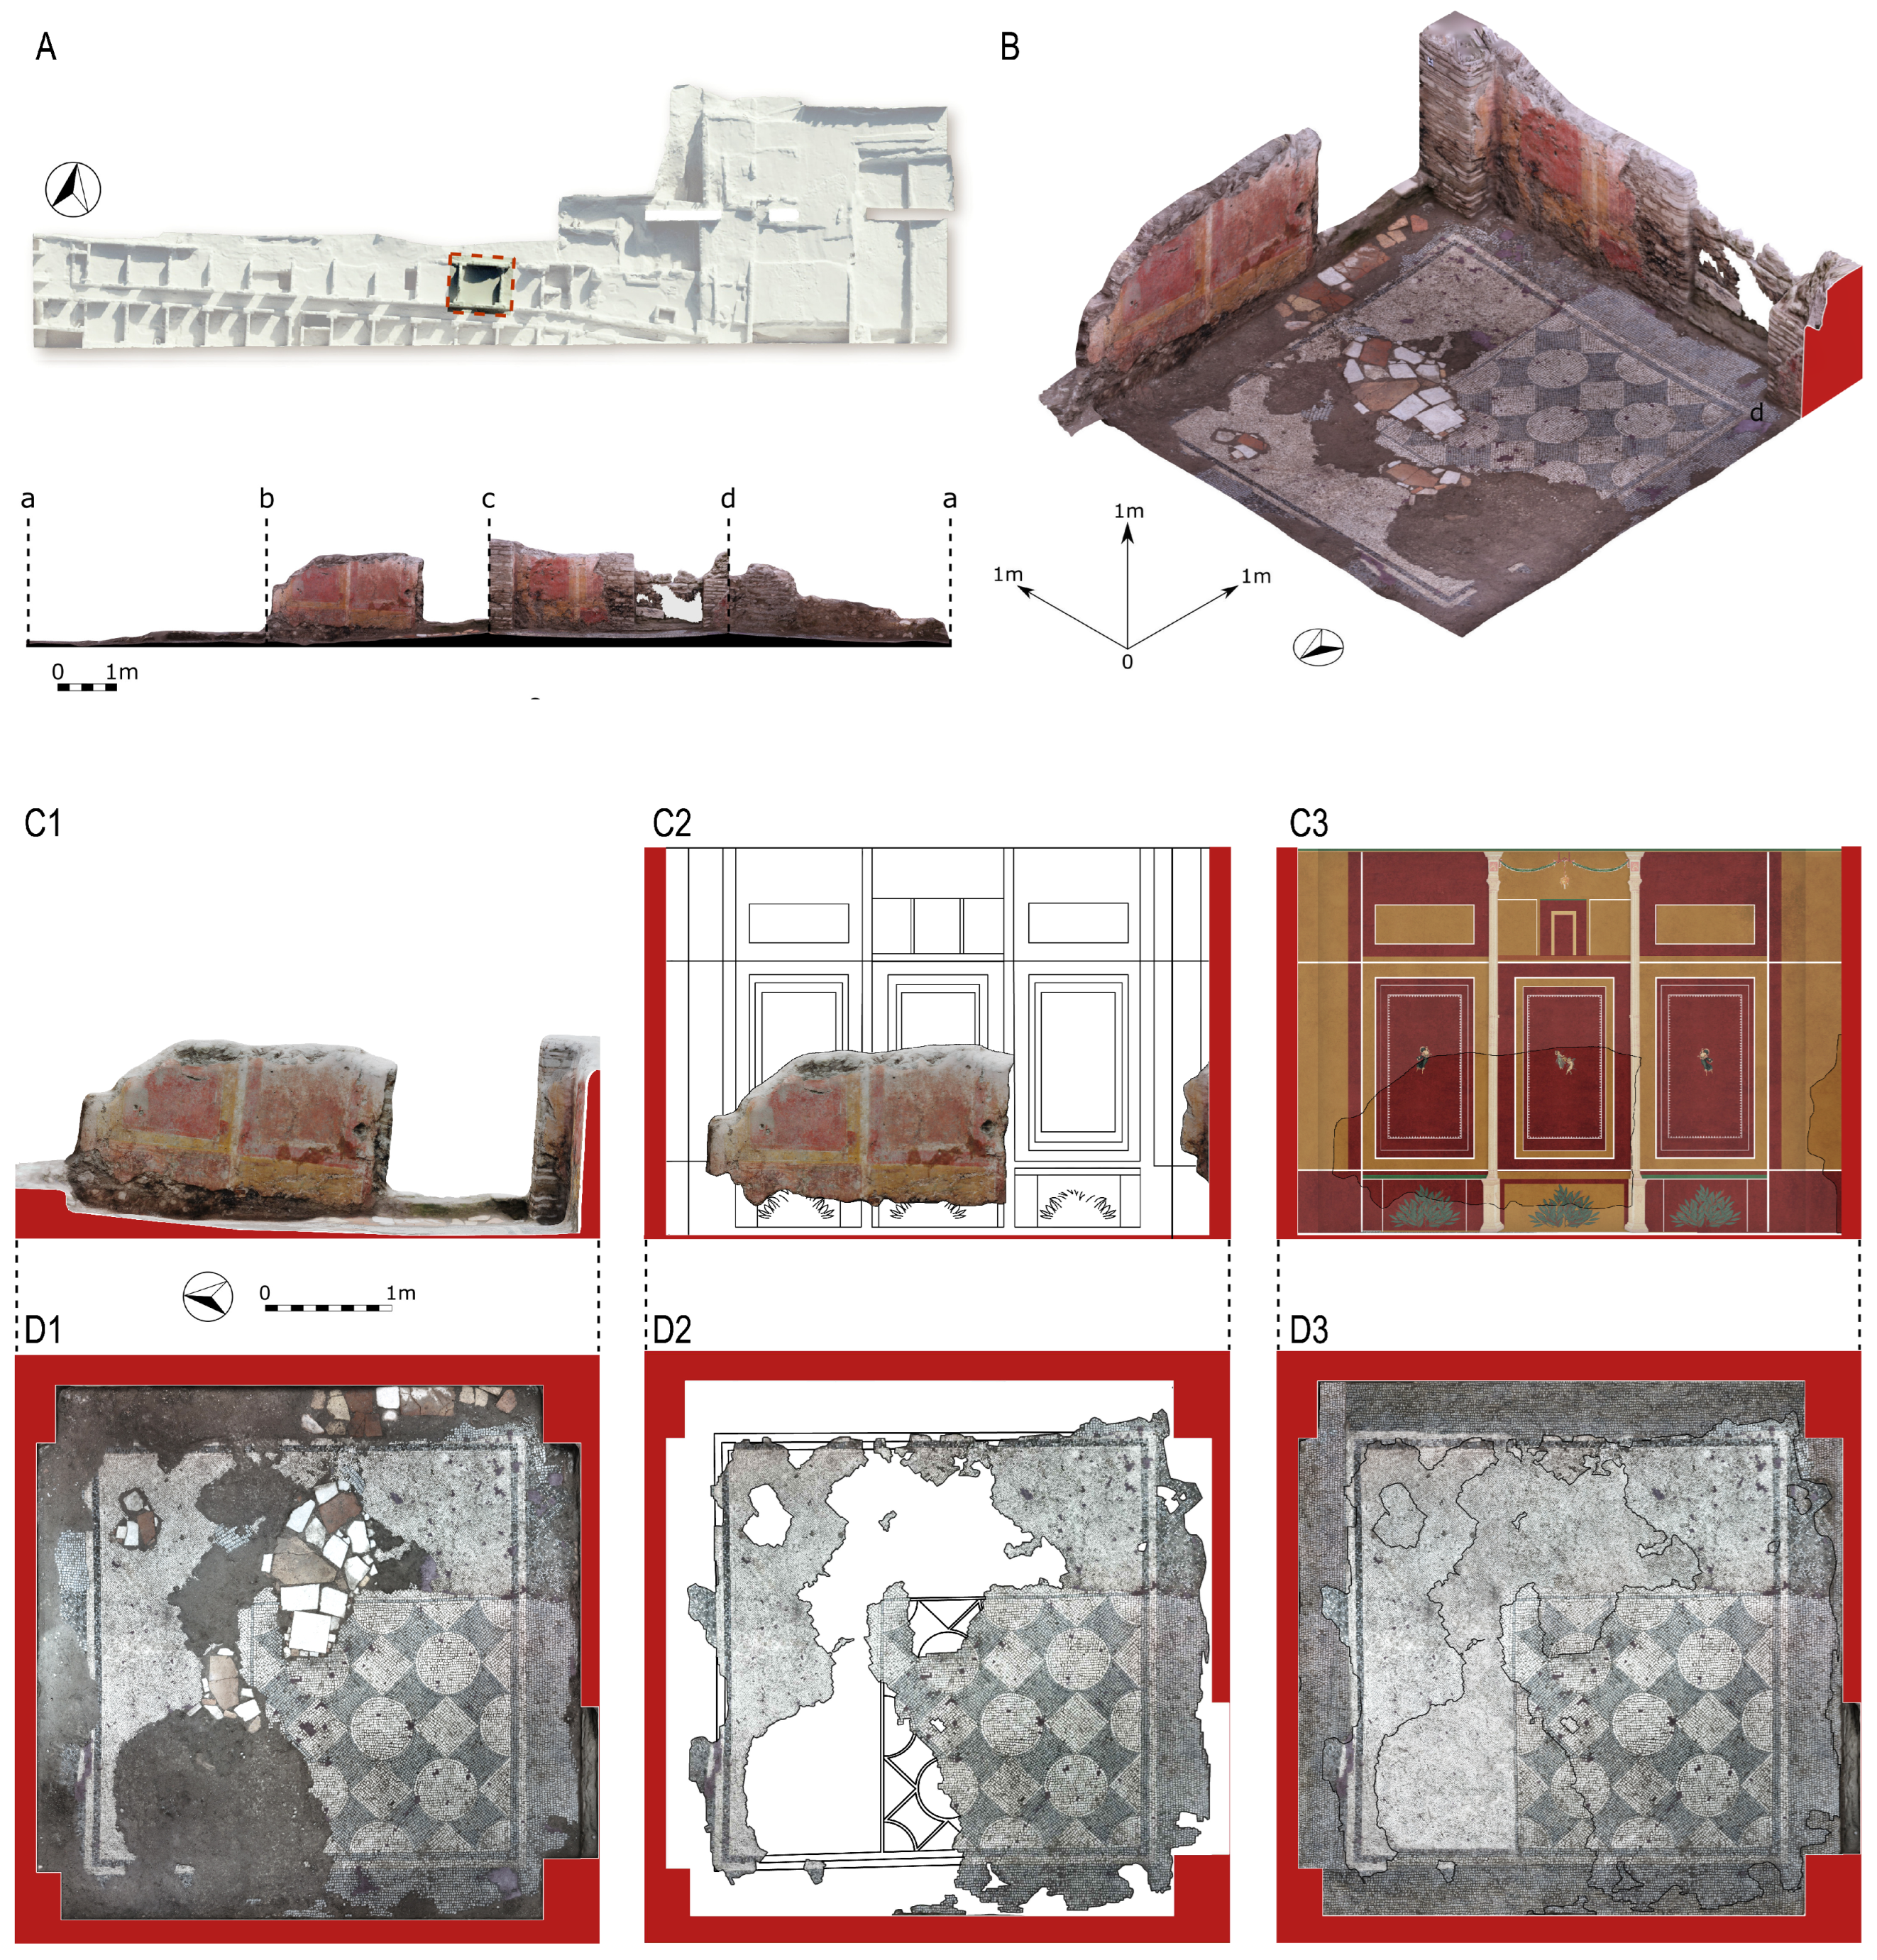
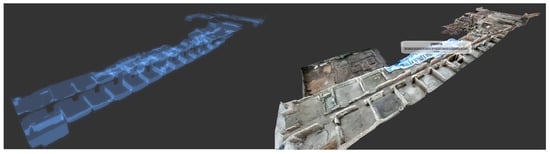
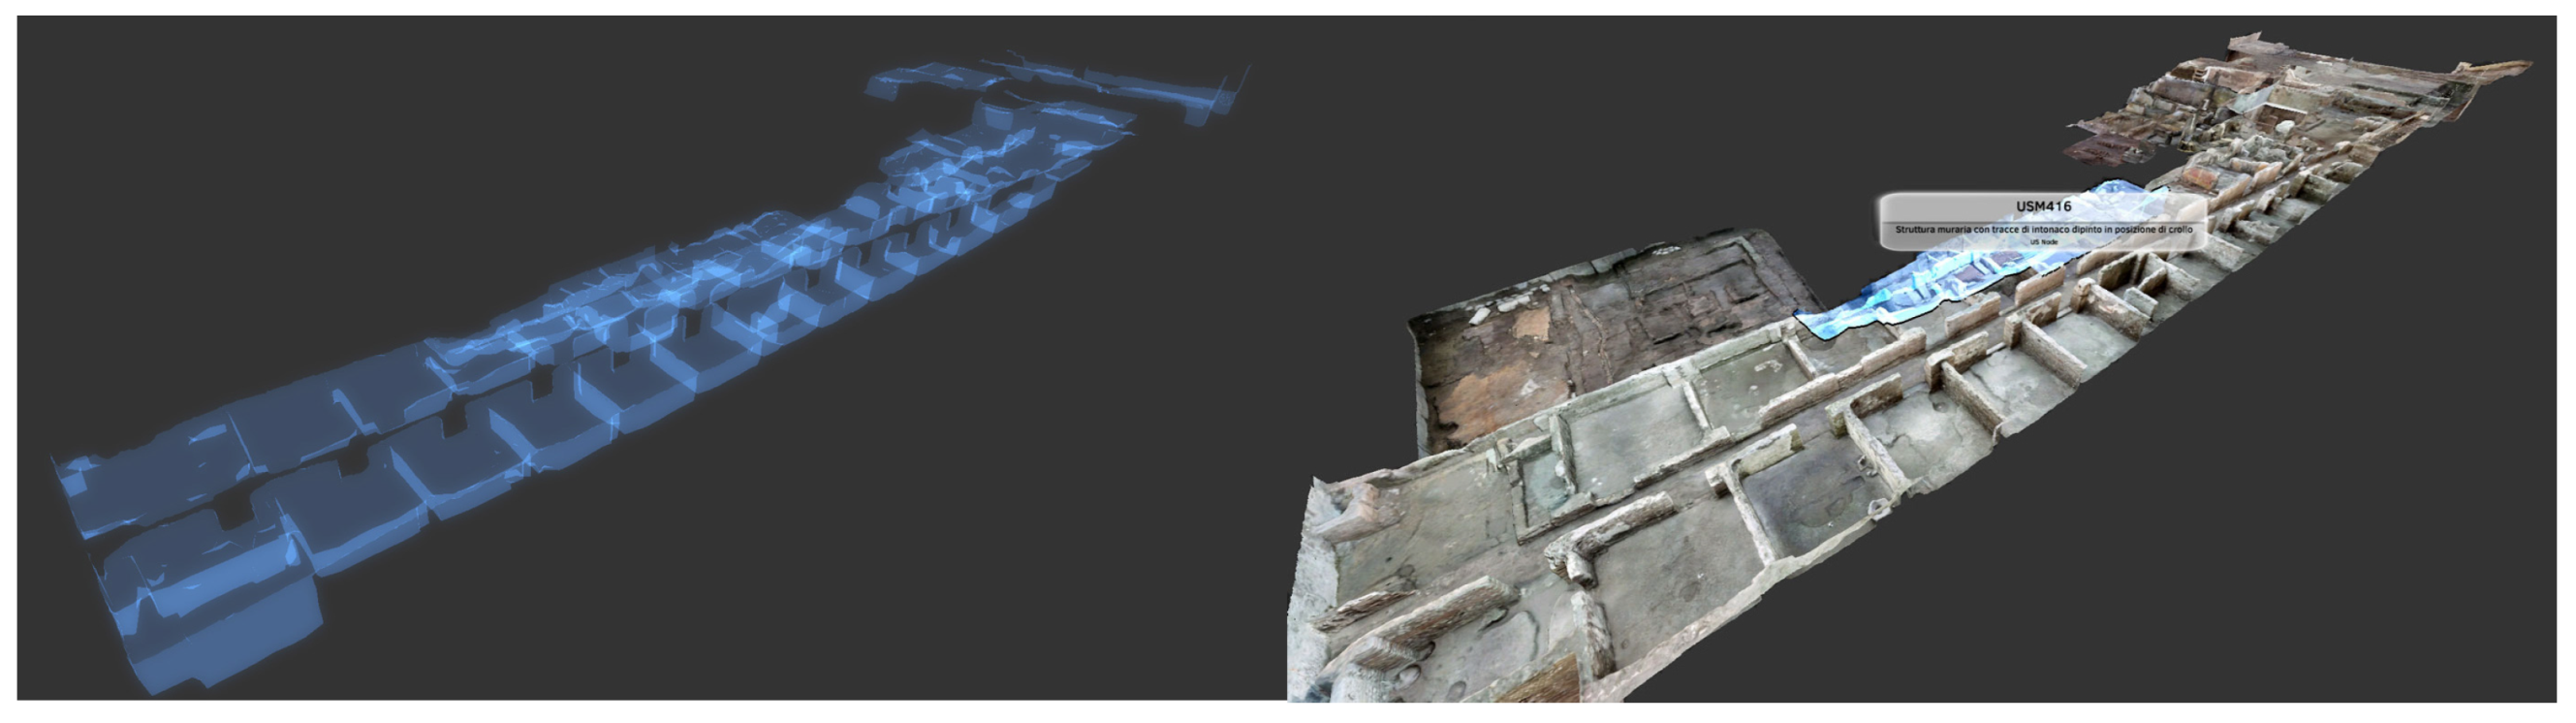

Disclaimer/Publisher’s Note: The statements, opinions and data contained in all publications are solely those of the individual author(s) and contributor(s) and not of MDPI and/or the editor(s). MDPI and/or the editor(s) disclaim responsibility for any injury to people or property resulting from any ideas, methods, instructions or products referred to in the content. |
© 2026 by the authors. Licensee MDPI, Basel, Switzerland. This article is an open access article distributed under the terms and conditions of the Creative Commons Attribution (CC BY) license.