Article

RSICDNet: A Novel Regional Scribble-Based Interactive Change Detection Network for Remote Sensing Images


School of Remote Sensing and Geomatics Engineering, Nanjing University of Information Science and Technology, Nanjing 210044, China
*
Author to whom correspondence should be addressed.
Remote Sens. 2026, 18(2), 204; https://doi.org/10.3390/rs18020204
Submission received: 1 December 2025 / Revised: 25 December 2025 / Accepted: 6 January 2026 / Published: 8 January 2026

Highlights

What are the main findings?
  • We propose RSICDNet, an interactive change detection model with regional scribble interaction. The model leverages regional scribble interactions, which provide rich spatial priors, and incorporates an Interaction Fusion and Refinement Module (IFRM) to effectively fuse these interactions with high-level semantic features for efficient change detection.
  • We develop a human–computer interactive change detection application based on RSICDNet, which significantly improves the efficiency of change label annotation.
What are the implications of the main findings?
  • Experimental results on three public datasets demonstrate that RSICDNet outperforms mainstream interactive models in interaction efficiency, validating its superiority.
  • A significant performance gain in interactive change detection is achieved by integrating the proposed regional scribble interaction as an efficient paradigm and the IFRM as an effective fusion module.

Abstract
To address the issues of inadequate performance and excessive interaction costs when handling large-scale and complex-shaped change areas with existing interaction forms, this paper proposes RSICDNet, an interactive change detection (ICD) model with regional scribble interaction. In this framework, regional scribble interaction is introduced for the first time to provide rich spatial prior information for accurate ICD. Specifically, RSICDNet first employs an interaction processing network to extract interactive features, and subsequently utilizes the High-Resolution Network (HRNet) backbone to extract features from bi-temporal remote sensing images concatenated along the channel dimension. To effectively integrate these two information streams, an Interaction Fusion and Refinement Module (IFRM) is proposed, which injects the spatial priors from the interactive features into the high-level semantic features. Finally, an Object Contextual Representation (OCR) module is applied to further refine feature representations, and a lightweight segmentation head is used to generate final change map. Furthermore, a human–computer ICD application has been developed based on RSICDNet, significantly enhancing its potential for practical deployment. To validate the effectiveness of the proposed RSICDNet, extensive experiments are conducted against mainstream interactive deep learning models on the WHU-CD, LEVIR-CD, and CLCD datasets. The quantitative results demonstrate that RSICDNet achieves optimal Number of Interactions (NoI) metrics across all three datasets. Specifically, its NoI80 values reach 1.15, 1.45, and 3.42 on the WHU-CD, LEVIR-CD, and CLCD datasets, respectively. The qualitative results confirm a clear advantage for RSICDNet, which consistently delivers visually superior outcomes using the same or often fewer interactions.

Graphical Abstract

1. Introduction

Remote sensing image change detection (CD) aims to identify and quantify land cover changes resulting from natural evolution and human activities by precisely comparing images of the same area captured at different times. It plays a crucial role in numerous applications, including urban and rural planning [1], agricultural and forestry surveys [2], environmental monitoring [3], and disaster assessment [4]. However, achieving high-precision and high-efficiency CD remains challenging due to the interference from varying imaging conditions, complex terrain, and seasonal variations. Traditional CD methods are primarily categorized by their analysis unit into pixel-based and object-based approaches. Pixel-based methods—such as algebra-based [5], image transformation [6], and post-classification comparison [7] techniques—operate by comparing spectral or textural features on a pixel-by-pixel basis. Nevertheless, due to the lack of contextual information, these methods are sensitive to background noise and are mainly suitable for medium- and low-resolution imagery. With the advancement of spatial image resolution, change detection methods have gradually shifted from pixel-based to object-based [8]. Object-based methods first obtain image objects through segmentation and then perform comparisons, including direct object comparison [9] and post-classification comparison [10]. However, these methods are susceptible to segmentation scale selection and exhibit limited capability in detecting complex changes. To overcome these limitations, classical machine learning algorithms, such as Support Vector Machines [11], Decision Trees [12], and Random Forests [13], have been extensively applied to CD. Nevertheless, these methods still suffer from heavy reliance on manual feature engineering and difficulties in automatically learning high-level discriminative features.
In recent years, due to their powerful hierarchical feature representation and non-linear modeling capabilities, deep learning techniques have been widely introduced into CD. Compared to traditional methods, deep learning-based change detection (DLCD) has demonstrated significant advantages in terms of accuracy and automation, and has become the mainstream approach in CD [14]. Based on the architecture of networks, existing DLCD methods can be primarily categorized into Convolutional Neural Network (CNN)-based, Transformer-based, and Mamba-based models. Particularly, CNN-based models capture local information through convolutional operations, effectively extracting hierarchical feature representations. For example, Peng et al. [15] proposed an end-to-end CD method by combining UNet++ network with a multi-output fusion strategy. Wang et al. [16] proposed a Siamese CD network that leverages a weight-shared High-Resolution Network (HRNet) backbone. They further incorporated an Object-Contextual Representation (OCR) module to refine high-level features, thereby enhancing the focus on change areas. Chen et al. [17] employed a Siamese convolutional network as the encoder and incorporated a spatial–temporal attention mechanism into the decoder to model spatial–temporal relationships. However, CNN models have a limited receptive field, making it difficult to capture long-range dependencies. In contrast, Transformer-based models perform global information modeling through self-attention mechanisms, effectively capturing long-range dependencies. For instance, Bandara et al. [18] employed a Siamese Transformer encoder to extract hierarchical features, where the difference features were computed and subsequently fed into a lightweight multilayer perceptron (MLP) to generate the final change map. Yan et al. [19] adopted the Swin Transformer as the backbone network and obtained difference features through a cross-attention mechanism. Zhu et al. [20] introduced a framework that employs a plain Vision Transformer (ViT) backbone. It is augmented with a detail-capture module for spatial feature extraction and a feature injector to integrate fine-grained details into high-level semantic learning. However, Transformer models suffer from high computational complexity, making it challenging to process large-scale inputs. Recently, Mamba-based models, which are based on state space models (SSM), have provided a new solution for efficiently capturing contextual information with linear complexity. In this context, Chen et al. [21] first introduced the Visual Mamba block for CD, achieving competitive performance. To overcome the insufficiency of local details, Zhang et al. [22] combined Mamba’s global modeling capability with CNNs’ capability for local detail enhancement, leading to considerable gains in both accuracy and efficiency. Wu et al. [23] integrated a locality adaptive enhancement strategy into SSM-based remote sensing CD, overcoming the limitation of regular Mamba in local perception. However, the aforementioned data-driven CD methods heavily rely on learning change mapping patterns from large amounts of labeled data while failing to incorporate useful prior knowledge. Consequently, such methods often achieve poor performance in real-world change scenarios due to the interference of background noise and domain variations. Notably, the recent rapid rise of vision foundation models has led to the progressive introduction of representative models such as Segment Anything Model (SAM) [24], CLIP [25], and DINO [26] into CD. For example, Tan et al. [27] employed SAM to generate candidate change areas and leveraged CLIP to semantically constrain and filter these areas, thereby minimizing the pseudo-change phenomenon. To achieve zero-shot CD, Qin et al. [28] reformulated CD as a bidirectional object tracking task by utilizing the temporal memory mechanism of SAM2 to establish instance-level correspondences between bi-temporal images for identifying changes. Particularly, through pre-training on large-scale datasets, vision foundation models have acquired powerful zero-shot generalization capabilities and extensive general visual knowledge, opening up new possibilities for CD. To integrate vision and language for detecting changes across any category, Li et al. [29] combined multiple foundation models to construct two training-free frameworks for open-vocabulary CD tasks.
Interactive models introduce a human-in-the-loop mechanism during inference, allowing them to incorporate external prior knowledge and thereby enhance model robustness. Furthermore, these models support an iterative prediction cycle, where user guidance enables outcomes to be progressively refined in a highly flexible, fault-tolerant, and interpretable manner. Particularly, existing interactive models mainly employ three interaction paradigms: clicking, bounding box selection, and scribbling. Among these, owing to its straightforward operation and low learning cost, click-based interaction has become the de facto standard among interaction paradigms. For example, Xu et al. [30] first proposed an interactive model for image segmentation by integrating click-based interaction with deep learning models. To improve the accuracy of interactive image segmentation, Sofiiuk et al. [31] optimized the interactive model using a Feature Backpropagation Refinement Scheme (f-BRS). In [32], considering the importance of the first-click interaction, a first-click attention mechanism is introduced to reduce misclassification errors. However, early interactive models were prone to unstable segmentation outputs during iterative prediction. To address this issue, Sofiiuk et al. [33] further proposed an iterative refinement mechanism that leverages the previous prediction to supply the model with additional prior information, thus avoiding a drop in segmentation accuracy after incorporating new user clicks. In [34], to enhance the automation level, a general framework capable of automatically simulating user interactions was designed, which effectively segments objects of interest through pseudo-clicks. To address constrained computational resources, Chen et al. [35] decomposed the time-consuming full-image inference into two rapid, localized predictions, enabling operation on low-power devices. Furthermore, to enhance the global contextual awareness of interactive models, Liu et al. [36] constructed a simple yet effective architecture using a ViT as the backbone network. Specifically, for the CD task, Jiang et al. [37] utilized a Siamese network for differential feature extraction, which were then fused with user clicks to facilitate interactive change detection (ICD). Nevertheless, in large-scale regions, the prior information provided by these clicks is highly limited. Wang et al. [38] introduced line scribbles into ICD models, effectively improving interaction efficiency. In summary, while the prevailing click-based interaction paradigm is simple and effective, it often exhibits limitations such as poor adaptability to complex scenes and insufficient guidance over large areas [38,39]. This makes it difficult to achieve efficient ICD in such scenarios. While box-based interaction can specify the target’s size and location, it necessitates that the user-provided bounding box tightly encloses the target [40]. This requirement places a high operational burden on the user and makes the approach poorly suited for iterative prediction. In contrast, scribble-based interaction offers greater flexibility. It provides substantial prior information while maintaining interaction efficiency, constituting a user-friendly paradigm. Despite the lack of widely accepted standards for simulating scribble inputs and for training and evaluating scribble-based interactive models [39], this interaction paradigm still demonstrates clear potential in ICD.
To address the aforementioned issues, we propose an ICD model with regional scribble interaction named RSICDNet, which effectively enhances the performance of ICD through an improved interaction mechanism. First, interactive features are constructed from regional scribbles within change targets. Then, an HRNet backbone is employed to extract multi-scale features from bi-temporal images. Simultaneously, an Interaction Fusion and Refinement Module (IFRM) is introduced to incorporate prior information from the interactive features into the bi-temporal image features, guiding the model to focus on change areas. Finally, an OCR module is used to enhance feature representations, and a lightweight segmentation head is adopted to generate final CD maps. The main contributions of this paper are as follows:
  • We propose a regional scribble-based interaction method that effectively captures spatial priors—such as the location, shape, and structure of changed areas—significantly enhancing the interaction efficiency of the model. Furthermore, an automated regional scribble generation approach is developed to simulate regional scribble interactions during model training and evaluation, thereby streamlining the workflow.
  • An Interaction Fusion and Refinement Module (IFRM) is proposed, which effectively enhances the feature representation of bi-temporal imagery by fusing interactive features with high-level semantic features, thus significantly improving the change area perception capability of RSICDNet.
  • By integrating RSICDNet with a graphical user interface (GUI), we develop an interactive application that simplifies and accelerates change annotation, thereby facilitating the assembly of CD datasets.

2. Materials and Methods

2.1. The RSICDNet Architecture

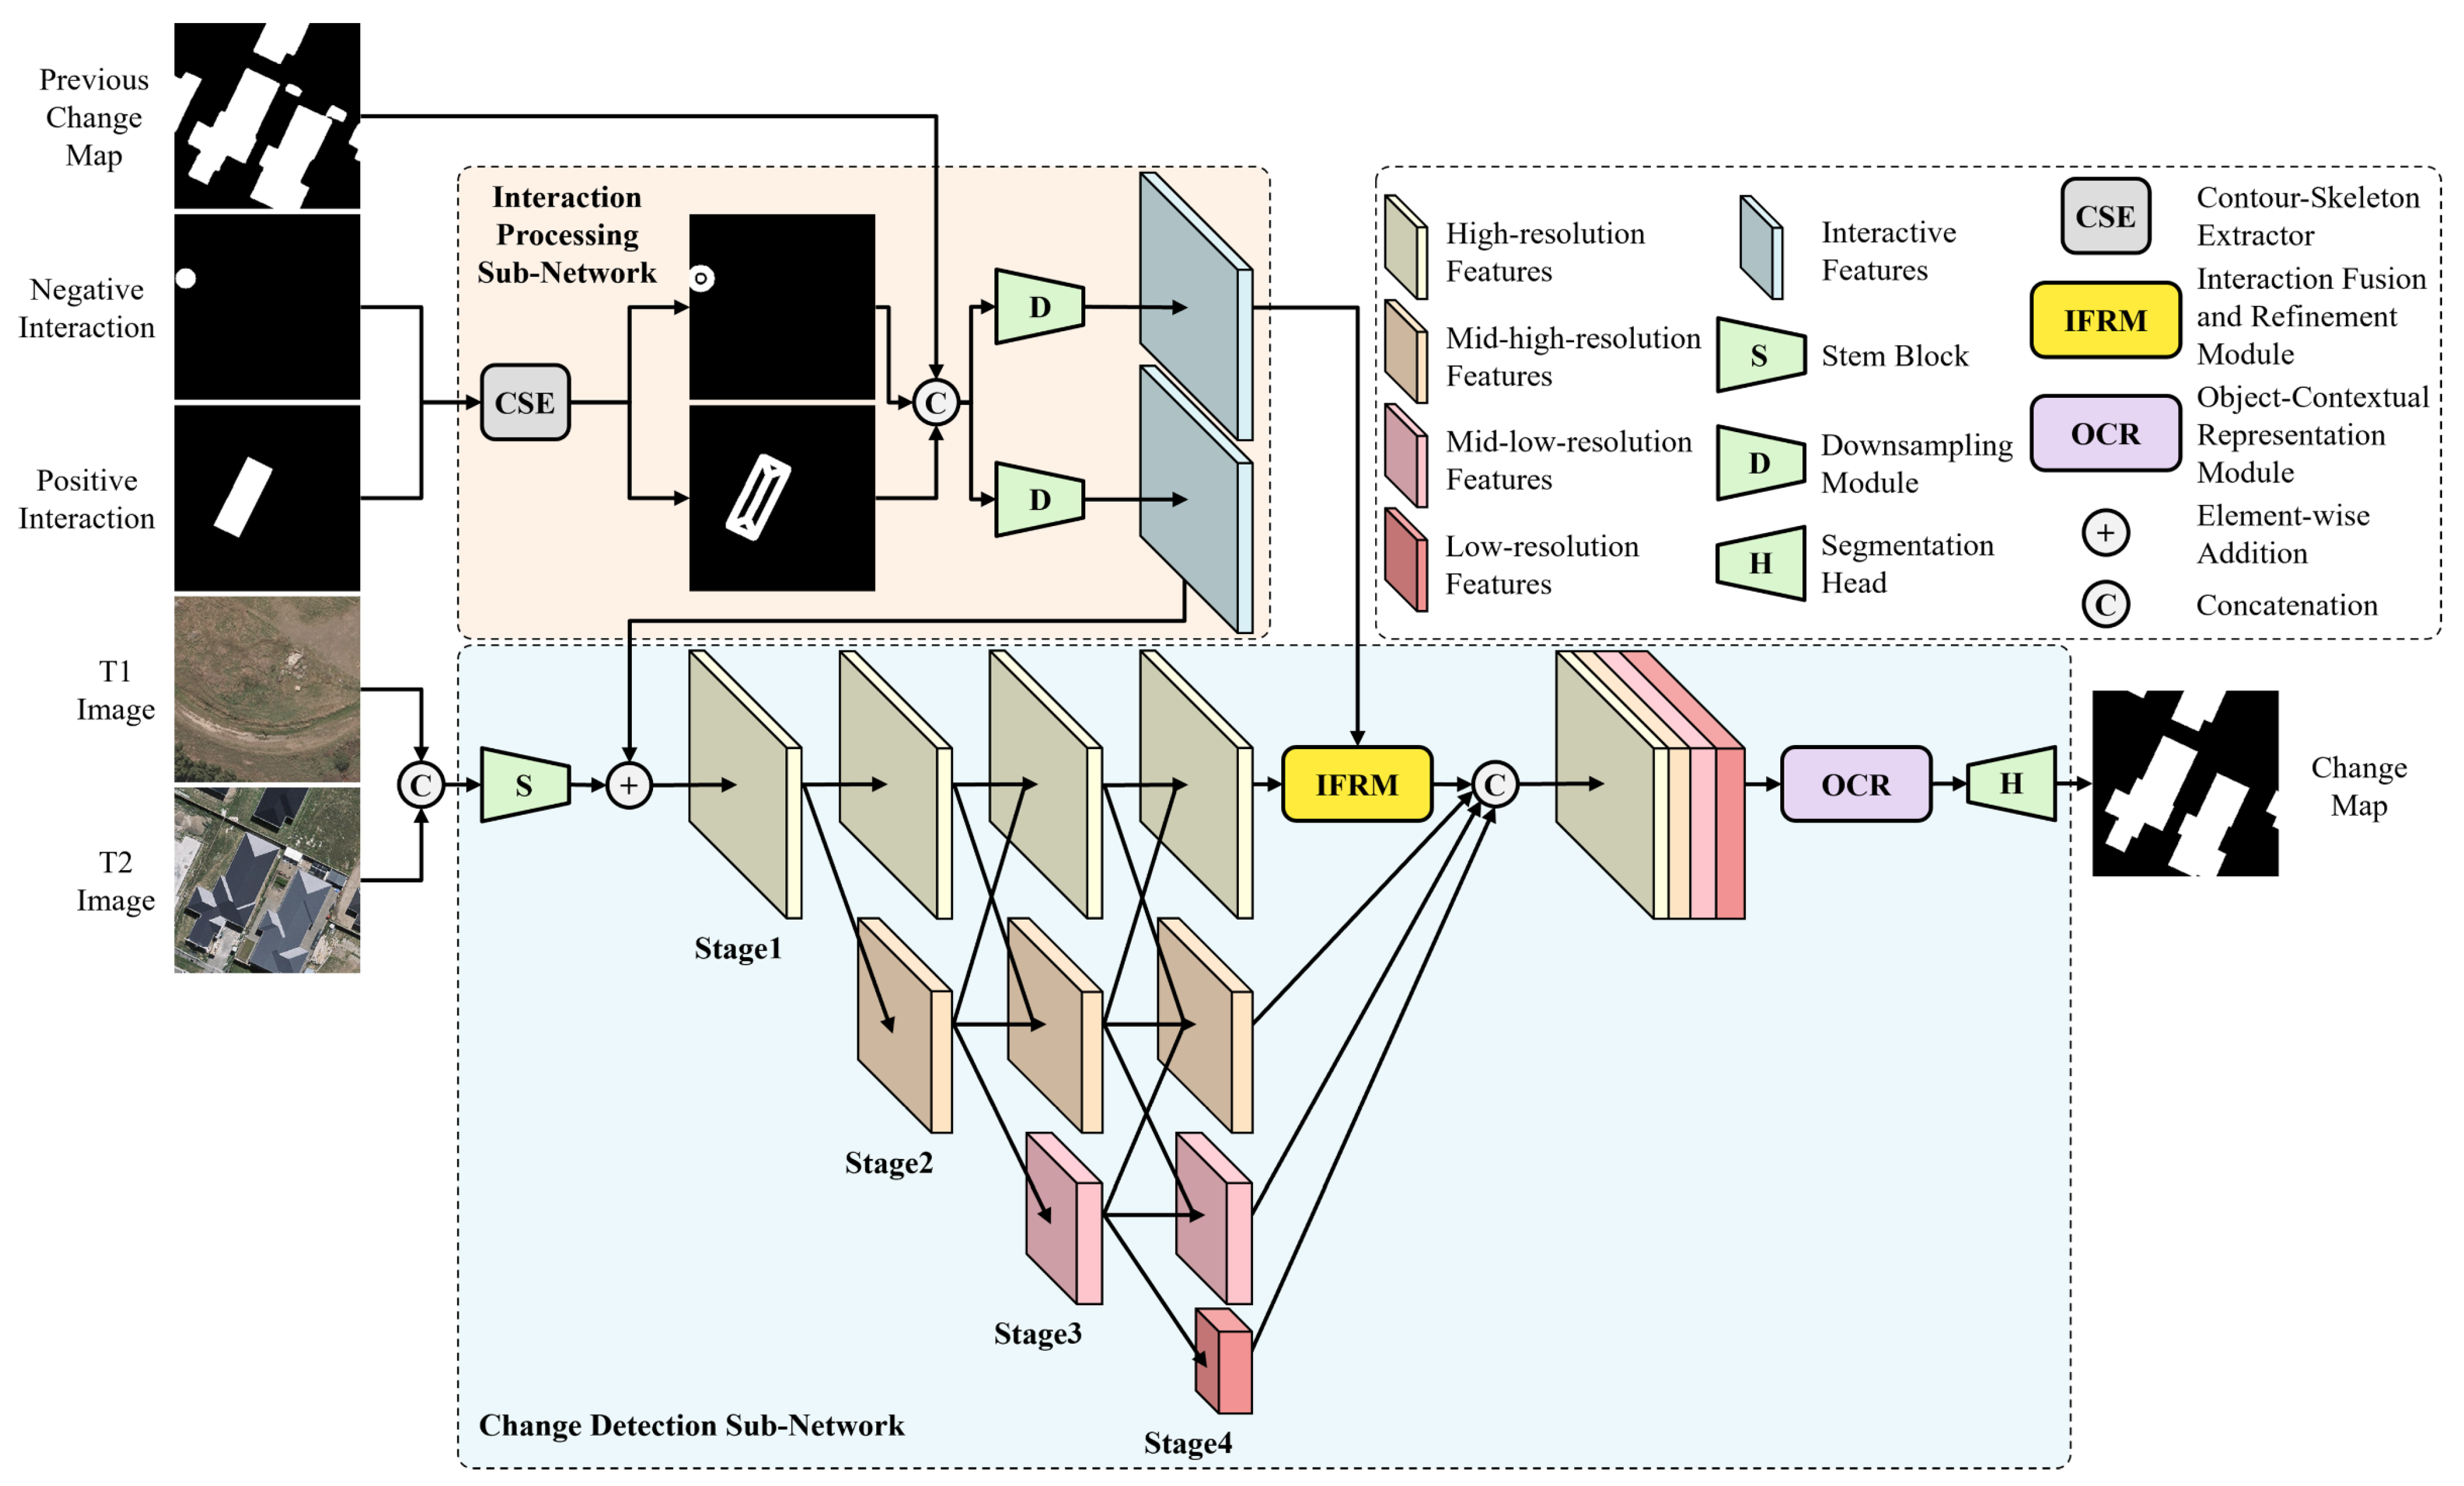
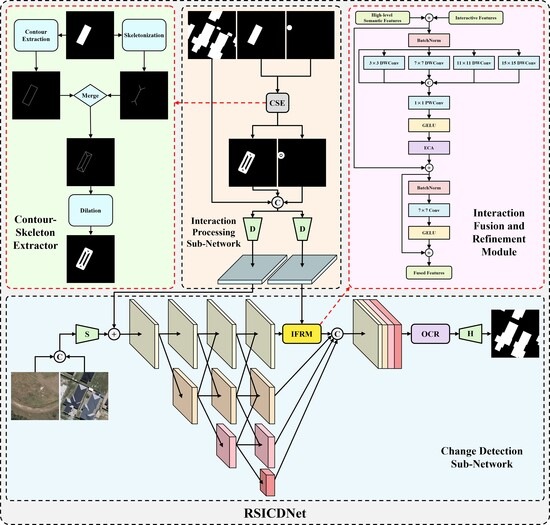
The overall architecture of the proposed RSICDNet is shown in Figure 1. Overall, we replace traditional point clicks with regional scribble interactions, allowing users to sketch over target areas and thereby providing substantial spatial priors. We also introduce an iterative refinement mechanism that stabilizes predictions by feeding the model both the current scribbles and the result from the previous iteration as additional prior information. In terms of model architecture, RSICDNet primarily consists of two components: an interaction processing sub-network (IPSNet) and a CD sub-network (CDSNet). To be specific, IPSNet is responsible for extracting interactive features. First, a Contour-Skeleton Extractor (CSE) is adopted to generate a comprehensive contour-skeleton representation map of the delineated regions. This map is then concatenated with the previous CD result along the channel dimension. Finally, two downsampling modules are used to perform feature extraction and spatial reduction, yielding interactive features that match the spatial dimensions of the backbone network’s features. Furthermore, CDSNet aims to extract change-related hierarchical feature representations and subsequently generate a pixel-wise change map. Specifically, HRNet [41] is adopted as the backbone to extract features from bi-temporal remote sensing images, which are concatenated along the channel dimension. During this process, the interactive features are fused with the low-level features via element-wise addition operations, guiding the model to focus on the key areas indicated by the interactions. Subsequently, an Interaction Fusion and Refinement Module (IFRM) is introduced at the end of the high-resolution main branch to achieve effective fusion of the interactive features and high-level semantic features. This integration refines the feature representation by injecting spatial prior information into the high-level semantic features. Finally, an OCR module [42] is employed to aggregate global contextual information for further feature enhancement, and a lightweight segmentation head is adopted to produce the final change map.

2.2. Regional Scribble Interaction and Its Automated Simulation

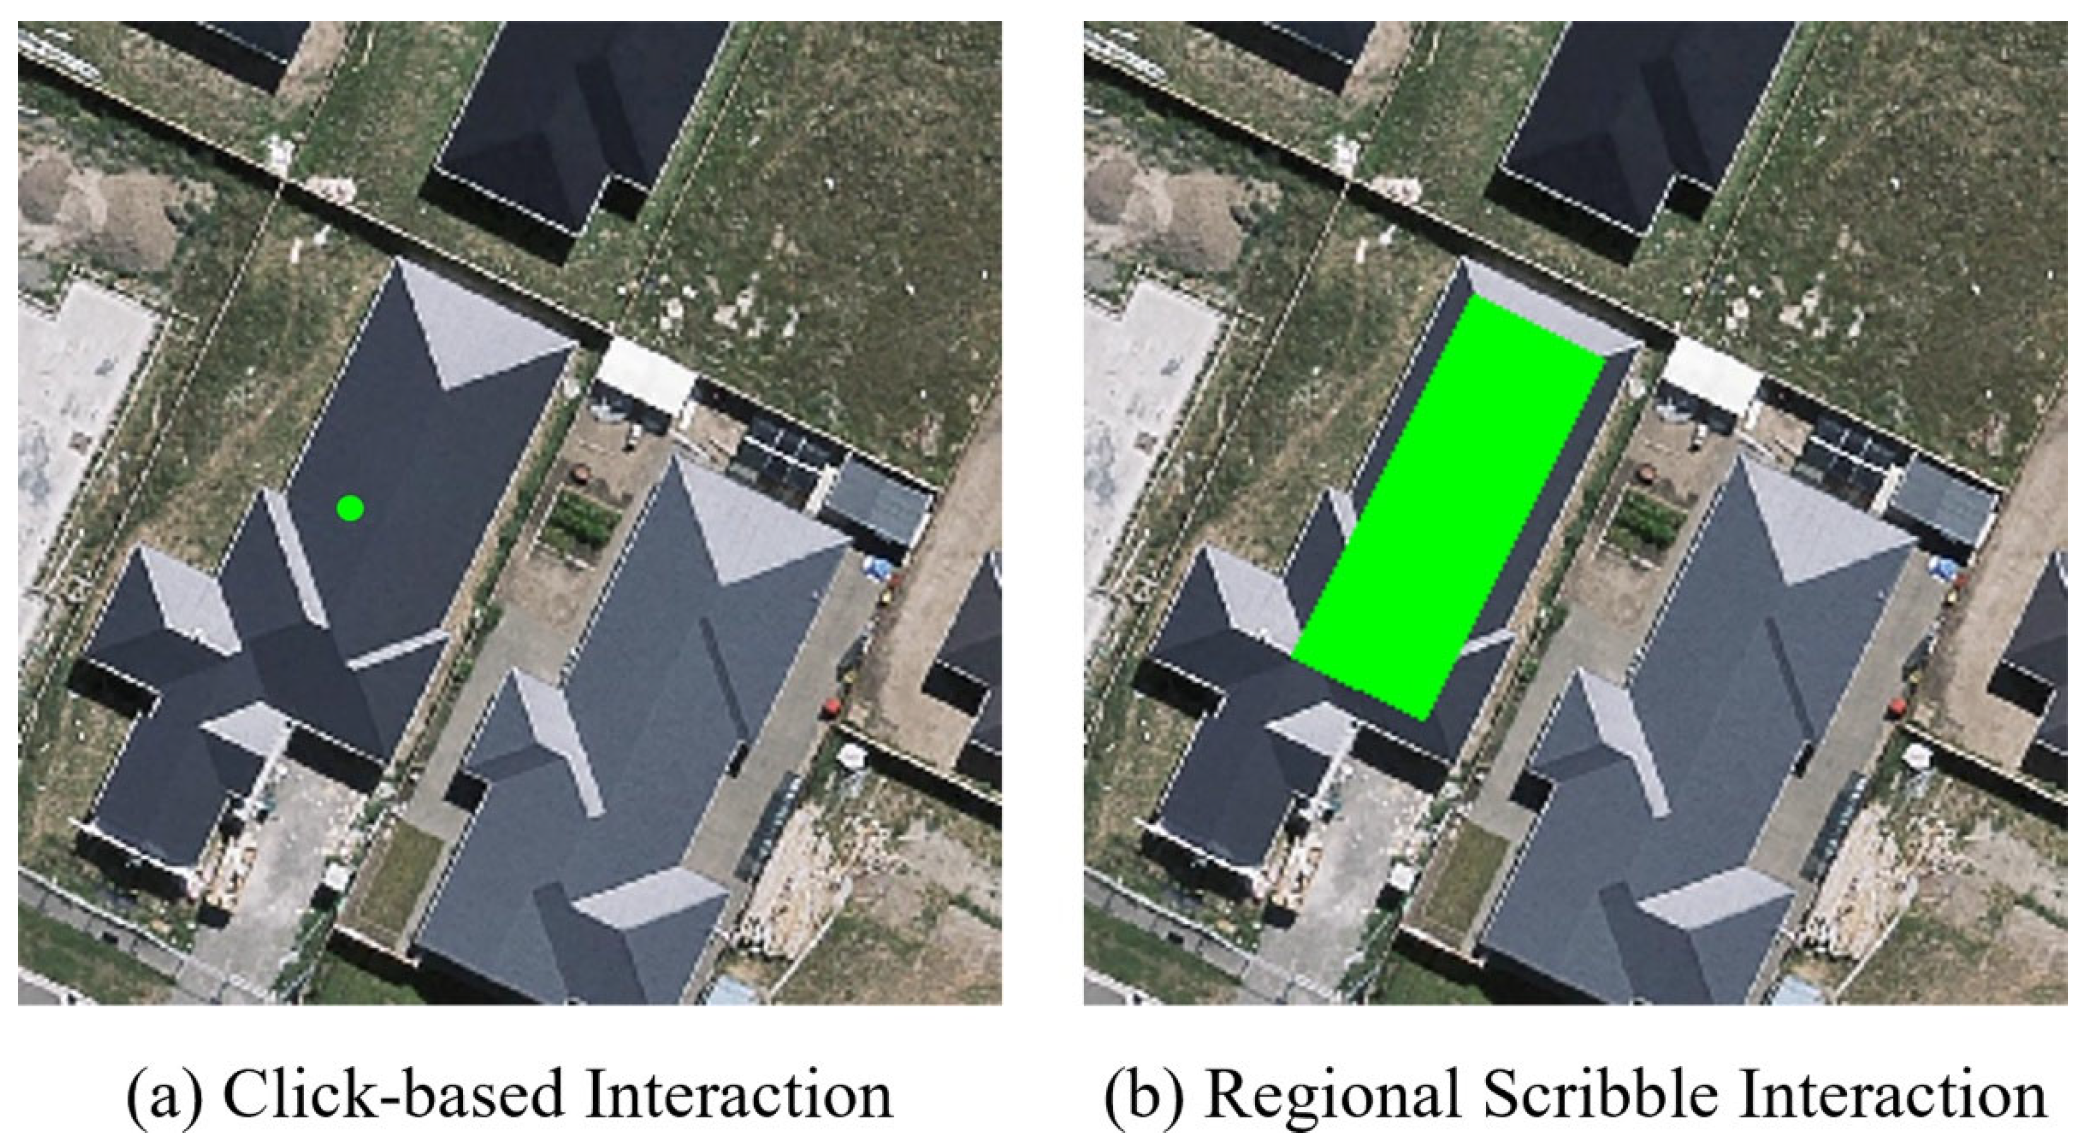
To enhance the interaction efficiency of RSICDNet, we introduce a regional scribble-based interaction paradigm, which involves drawing a closed two-dimensional solid shape inside target areas to provide rich spatial priors. Compared to the commonly used click-based interaction, this proposed form conveys more information per interaction, thereby providing the model with richer spatial priors. Examples of both interaction forms are illustrated in Figure 2. Similar to click-based interaction, the regional scribble paradigm includes both positive and negative types, where positive interactions guide the model to focus on specified change areas, while negative interactions are used to suppress the interference from false positive areas. To be specific, the proposed interaction process begins by drawing a positive scribble inside a change target. The binary mask of this scribble, along with the bi-temporal remote sensing images, are then fed into the model. Subsequently, the IPSNet and CDSNet are adopted to extract features from the scribble mask and the images, respectively. The interactive features are then fused with the bi-temporal image features to inject spatial priors, thereby guiding the model to detect the change target. Furthermore, RSICDNet supports iterative prediction through incremental interactions, allowing for the progressive refinement of the initial CD results. Particularly, during this iterative process, users can draw a positive scribble within missed detection areas or a negative scribble within false positive areas. The newly added scribble, along with any existing scribbles and the previous CD result, are collectively fed into the model to correct errors in the current result.
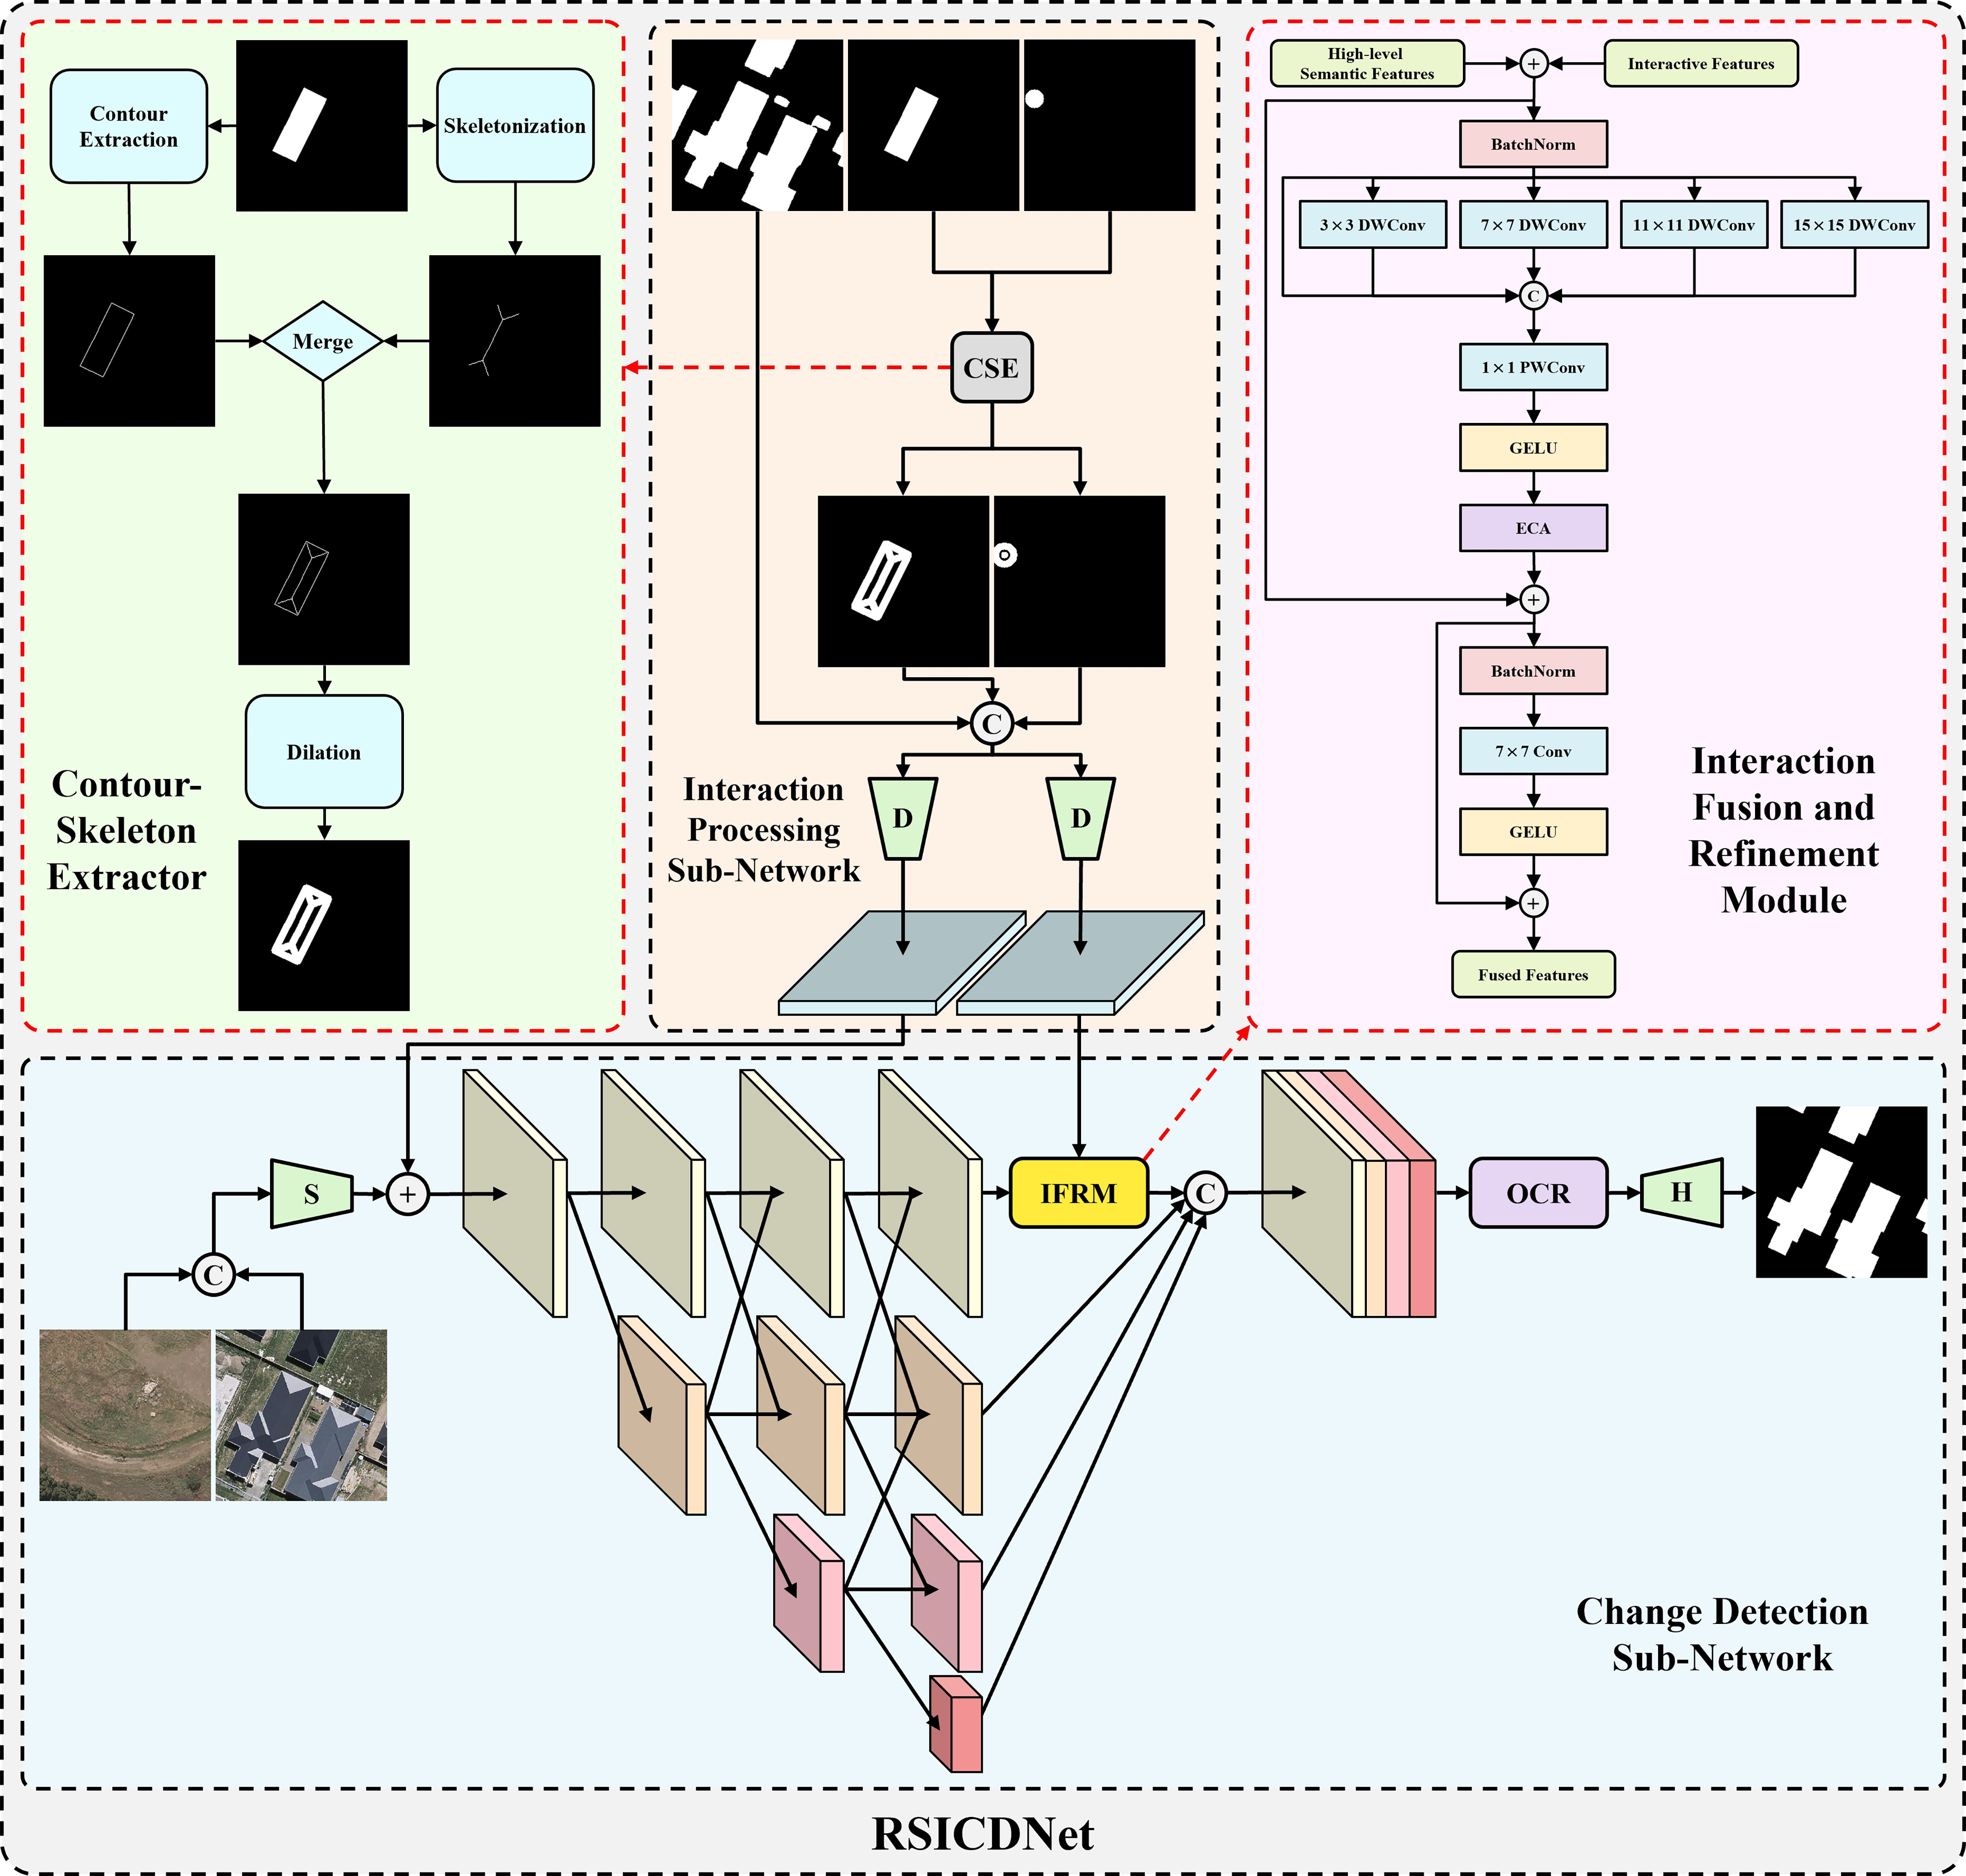
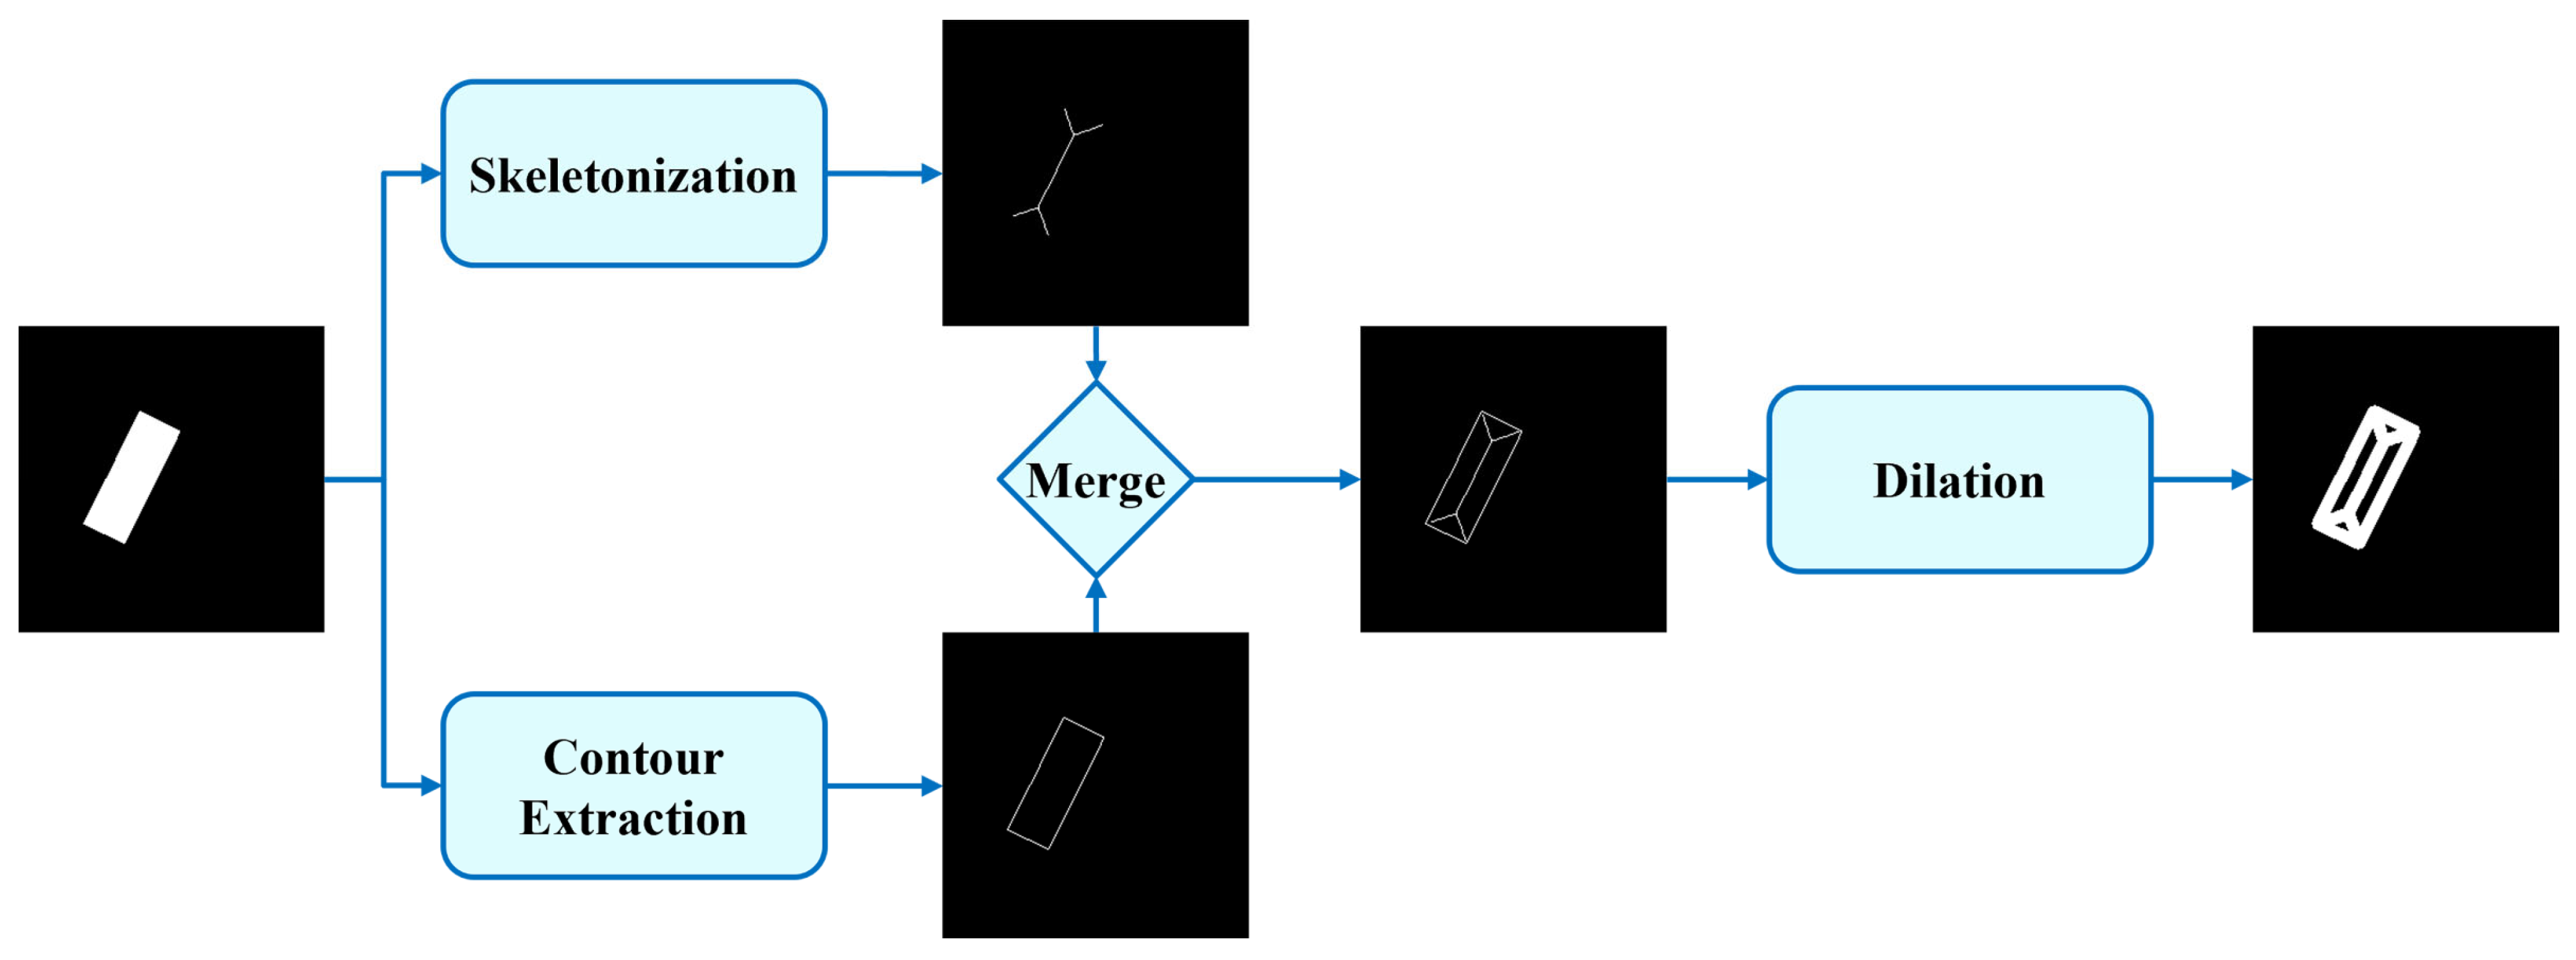
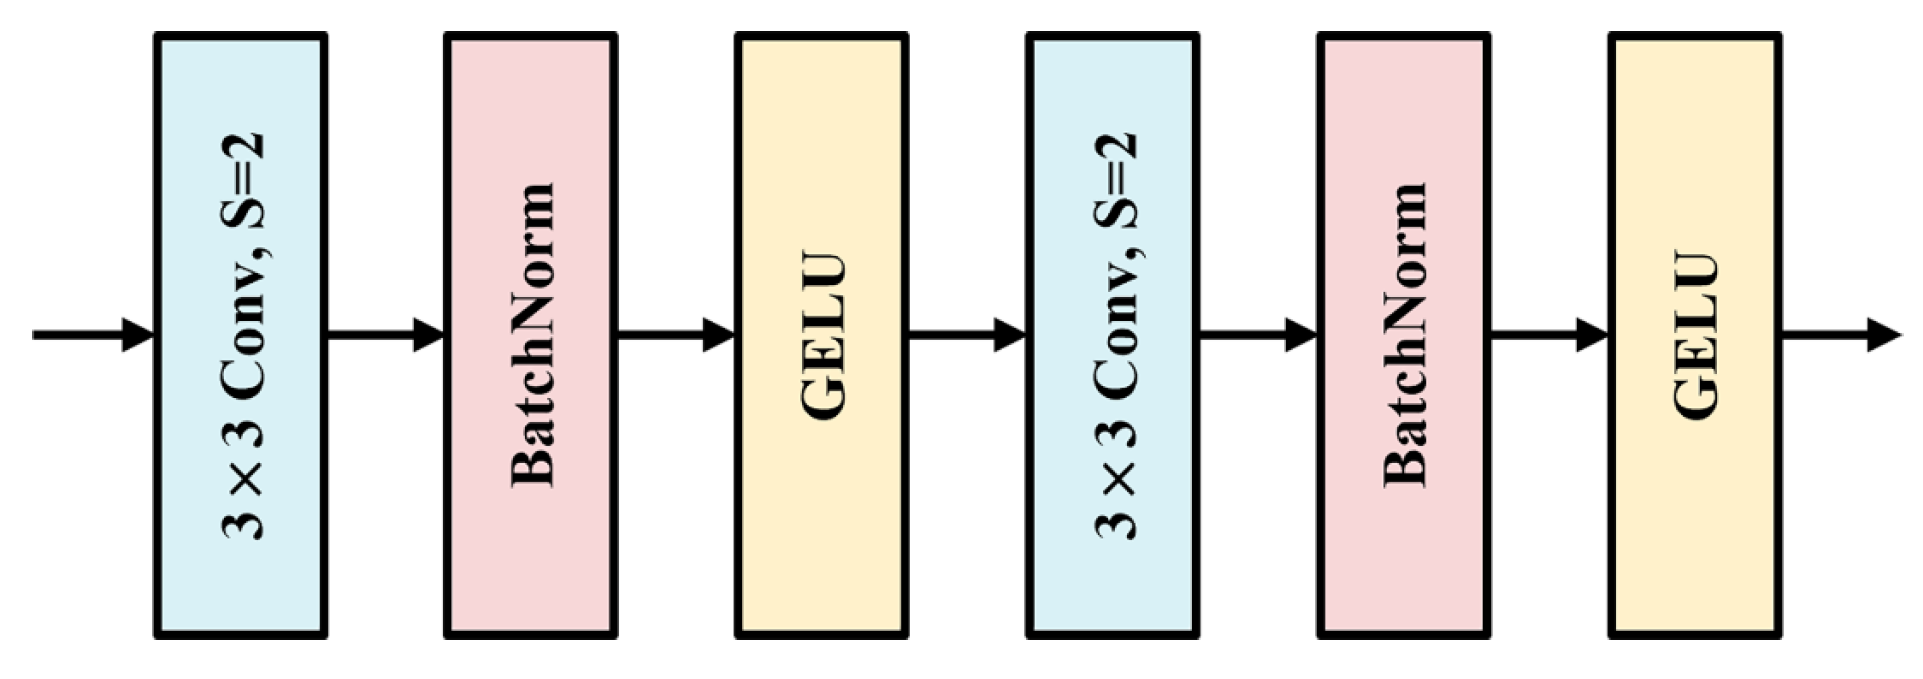
It is worth noting that direct usage of the generated regional scribbles easily introduces excessive noise and leads to the loss of detailed information. To overcome this drawback, a Contour-Skeleton Extractor (CSE) is proposed to obtain comprehensive contour-skeleton representation maps of the positive scribbles and the negative scribbles, with its workflow illustrated in Figure 3. These representation maps provide essential prior information about the location, shape, and structure of target areas, while simultaneously preserving the detail of bi-temporal image features during fusion. The process for generating these representation maps is as follows: First, the Suzuki-Abe algorithm [43] is employed to extract contour maps from the scribbles, which provide shape and boundary information. Second, the Zhang-Suen algorithm [44] is used to skeletonize the scribbles, producing skeleton maps that offer structural and topological information. Subsequently, the contour and skeleton maps are merged via a bitwise OR operation to leverage their complementary information. Finally, a dilation operation is performed on the merged result to enhance spatial coverage, generating the final comprehensive contour-skeleton representation maps. Furthermore, these representation maps are concatenated with the previous CD map along the channel dimension and processed by a downsampling module. This step aligns the interactive features with the bi-temporal image features from the backbone network in terms of spatial size and channel number. The structure of the downsampling module, depicted in Figure 4, consists of two stacked convolutional blocks. Each block contains a 3 × 3 convolutional layer with a stride of 2, a batch normalization layer, and a GELU activation function. Through successive strided convolution operations, the module performs feature extraction, achieves 4 × spatial downsampling, adjusts the channel dimensionality, and ultimately outputs the final interactive features.
Additionally, during the training and evaluation of interactive deep learning models, it is necessary to provide simulated user interactions to the model. To this end, we design an automated regional scribble generation method that can automatically generate simulated regional scribble interactions based on the ground truth and the model’s previous CD result. The detailed workflow of this method is shown in Algorithm 1, which primarily consists of the following five steps:
  • Obtain positive and negative sampling areas: The masks for the positive sampling area ( S A p o s ) and negative sampling area ( S A n e g ) are obtained based on the ground truth ( G T ) and the previous CD result ( C D p r e v ). Specifically, during the initial sampling round—due to the absence of C D p r e v —the sampling areas are initialized directly from G T . More precisely, if change areas exist in G T , they are designated as S A p o s ; otherwise, G T itself is treated as S A n e g . During iterative sampling, the masks for missed detection areas and false positive areas are computed by evaluating the discrepancies between C D p r e v and G T . These resulting discrepancy masks are then used as S A p o s and S A n e g , respectively.
  • Sampling area preprocessing: To address the inevitable annotation ambiguity and high uncertainty near the boundaries of the sampling area masks, a morphological erosion operation is applied for optimization [38]. During the erosion of these masks, 1 to 5 iterations are randomly performed. The dual purpose of this strategy is to mitigate the influence of boundary noise while enhancing sampling diversity. While this enables the generation of variably sized regional scribbles that better simulate real user interactions, it is crucial to avoid excessive iterations, which would unduly shrink the effective sampling area. Therefore, the upper limit for the number of iterations is set to 5.
  • Determine final sampling area and type: The largest connected components of the positive and negative sampling areas ( L C C p o s and L C C n e g ) are extracted and their areas are compared. If the area of L C C p o s is larger, it is designated as the final sampling area ( S A f i n ), and a positive regional scribble ( S p o s ) is sampled within it. Otherwise, L C C n e g is used as S A f i n for sampling a negative regional scribble ( S n e g ).
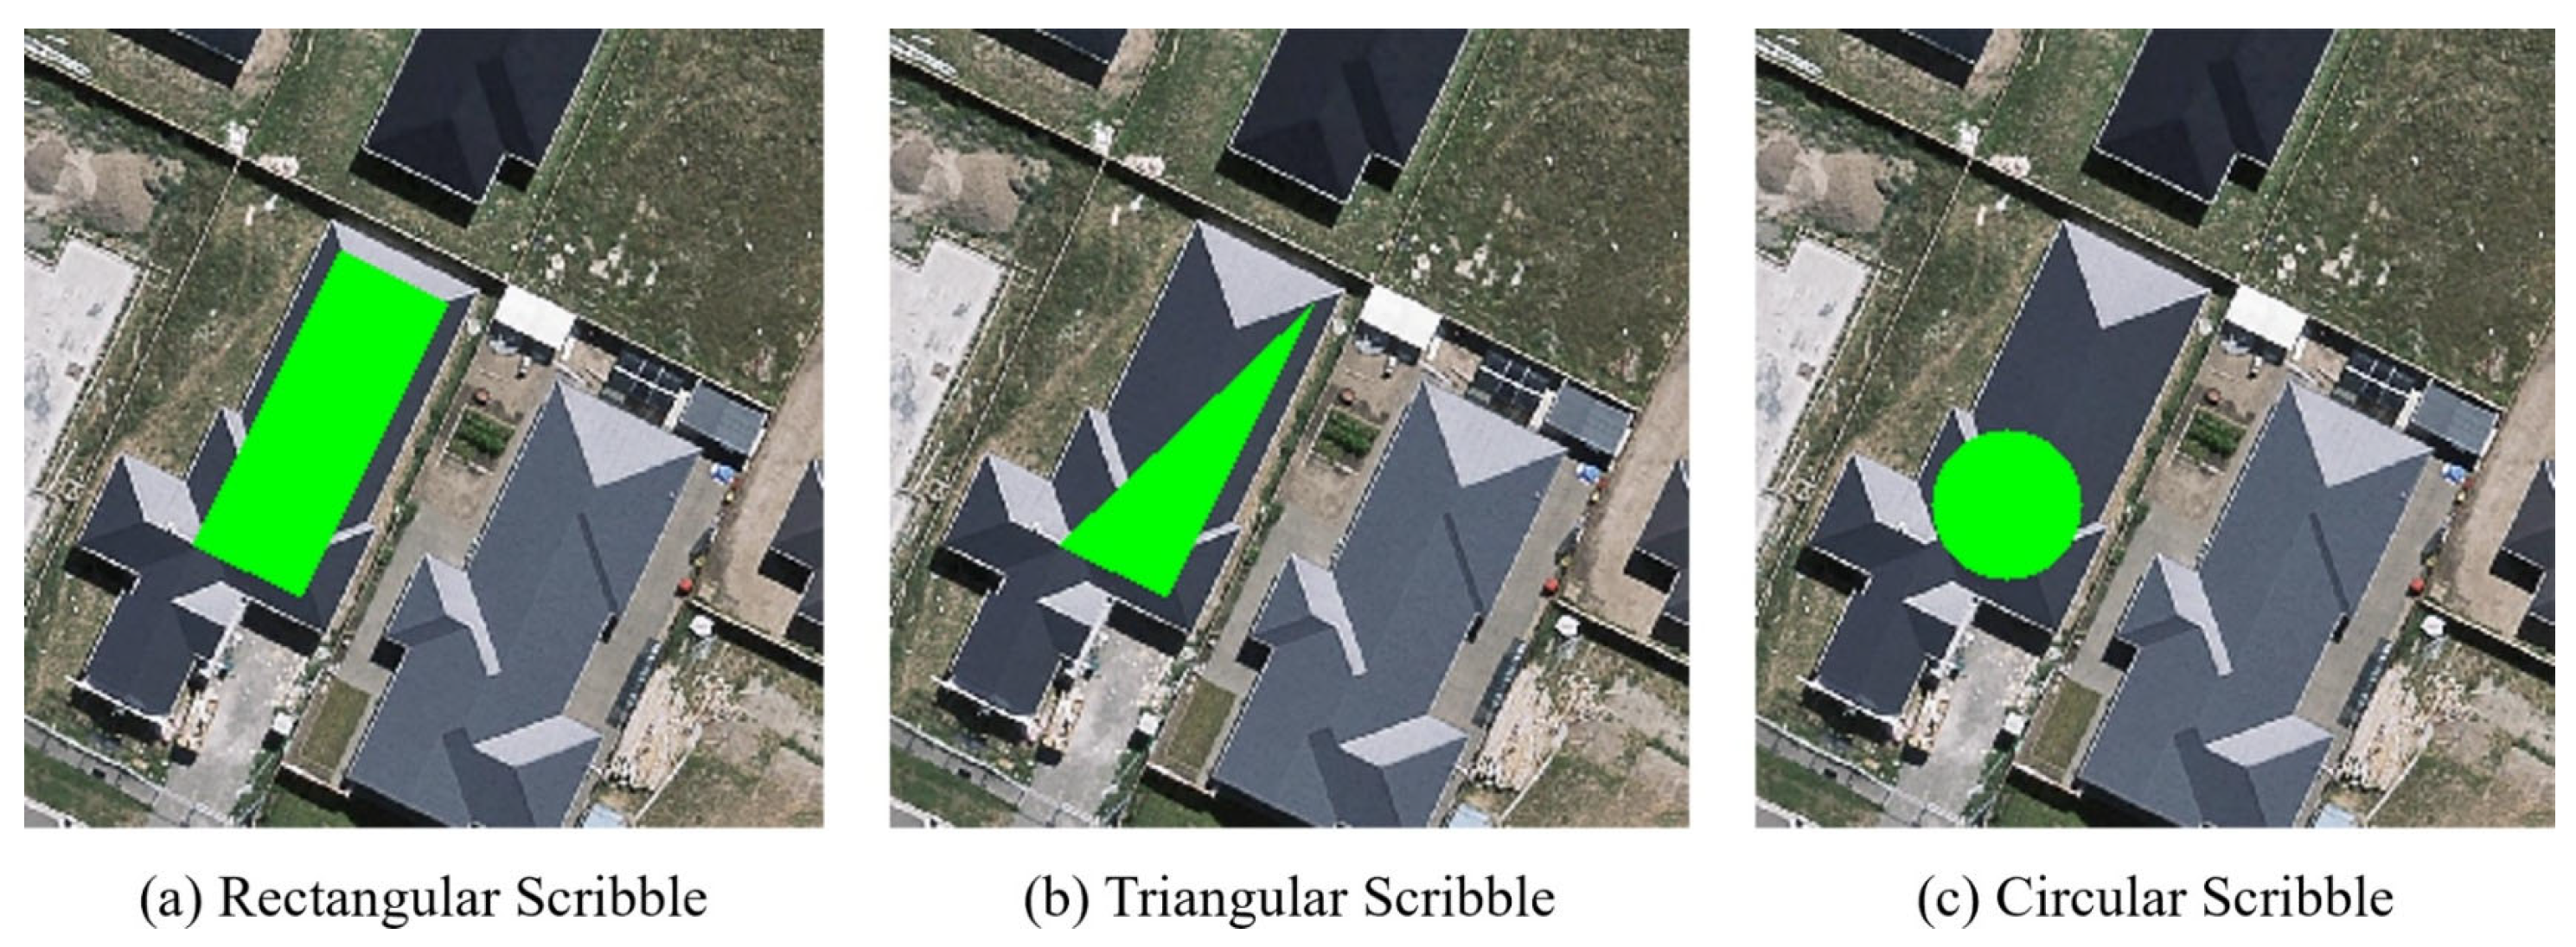
  • Generate three shapes of regional scribbles: Based on S A f i n , three shapes of regional scribbles are generated, including a rectangular scribble ( S r e c t ), triangular scribble ( S t r i ), and circular scribble ( S c i r c ), as shown in Figure 5. Specifically, S r e c t is obtained by extracting the inscribed rectangle of S A f i n ; S t r i is obtained by randomly selecting three vertices from S r e c t and connecting them sequentially; and S c i r c is obtained by extracting the largest inscribed circle of S A f i n .
  • Output regional scribble: One scribble is randomly selected from the three generated shapes ( S r e c t , S t r i , S c i r c ) and provided to RSICDNet as either S p o s or S n e g .
Algorithm 1 Automated Regional Scribble Generation Method
Input :   G T :   Ground   truth ;   C D p r e v : previous CD result.
Output :   S p o s :   Positive   regional   scribble ;   S n e g : Negative regional scribble.
Step1: Obtain positive and negative sampling areas
1 :     if   C D p r e v exists then
2 :     S A p o s     ( C D p r e v   = =   0   and   G T   = = 1)
3 :     S A n e g     ( C D p r e v   = =   1   and   G T   = = 0)
4:   else
5 :     if   G T contains change areas then
6 :     S A p o s     G T
7 :     S A n e g     zeros _ like ( G T )
8:     else
9 :     S A p o s     zeros _ like ( G T )
10 : S A n e g     G T
11:   end if
12: end if
Step2: Sampling areas preprocessing
13 : S A p o s     Erode ( S A p o s ,   iterations   randint(1, 5))
14 : S A n e g     Erode ( S A n e g ,   iterations   randint(1, 5))
Step3: Determine final sampling area and type
15 : L C C p o s     GetLargestConnectedComponent ( S A p o s )
16 : L C C n e g     GetLargestConnectedComponent ( S A n e g )
17 : if   area ( L C C p o s )   >   area ( L C C n e g ) then
18 : S A f i n     L C C p o s
19 : i s _ p o s   true
20:  else
21 : S A f i n     L C C n e g
22 : i s _ p o s   false
23:  end if
Step4: Generate three shapes of regional scribbles
24 : S r e c t     GetInscribedRectangle ( S A f i n )
25 : v e r t s     GetVertices ( S r e c t )
26 : S t r i     GeneratePolygon ( sample ( v e r t s , 3))
27 : S c i r c     GetMaxInscribedCircle ( S A f i n )
Step5: Output regional scribble
28 : if   i s _ p o s   = = true then
29 : S p o s     random _ choice ( S r e c t ,   S t r i ,   S c i r c )
30 : S n e g   None
31: else
32 : S p o s   None
33 : S n e g     random _ choice ( S r e c t ,   S t r i ,   S c i r c )
34: end if
35 : return   S p o s ,   S n e g

2.3. Interactive Feature Fusion and Refinement

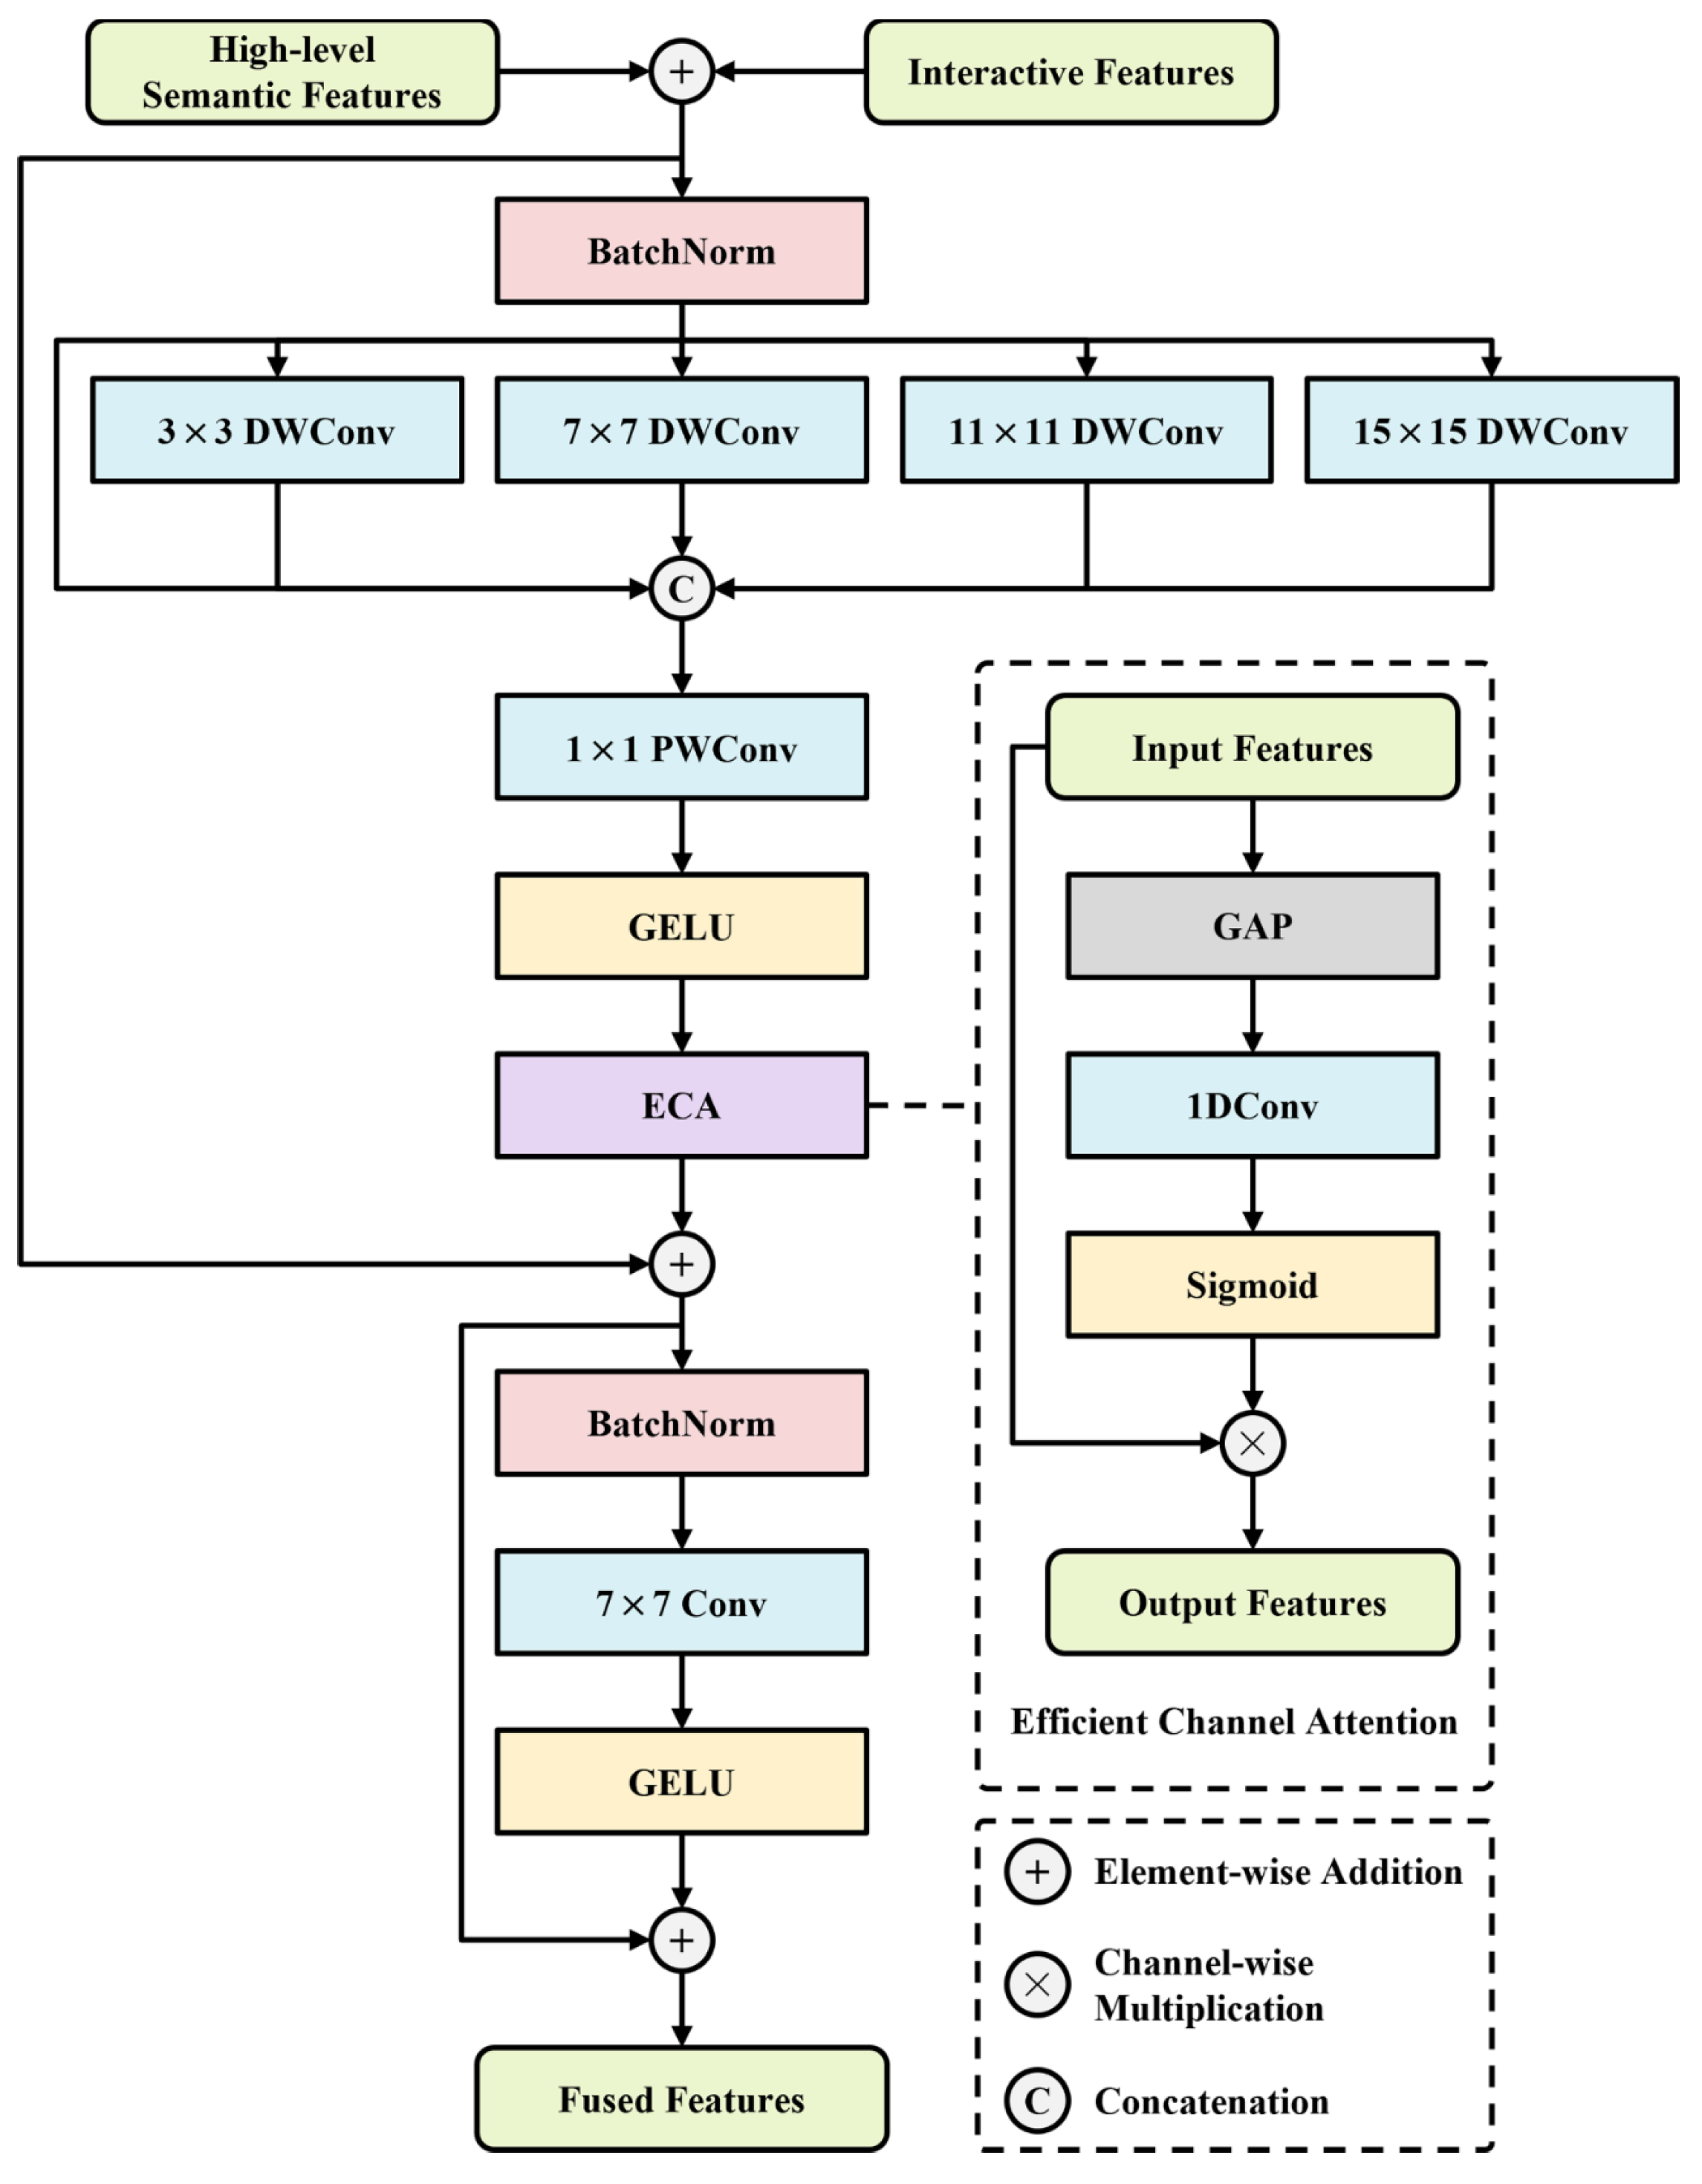
Integrating interactive features with the high-level semantic features extracted by the backbone network can effectively refine the feature representations, thereby enhancing the performance of the interactive deep learning model. To this end, we design an Interaction Fusion and Refinement Module (IFRM) and integrate it at the end of the high-resolution main branch in the fourth stage of the HRNet backbone network. Its structure is illustrated in Figure 6.
First, the IFRM fuses the interactive features with the high-level semantic features through element-wise addition, thereby injecting spatially guided prior information into the high-level semantic features and enhancing their representational capacity for target areas:
F a = F H + F I
where F a denotes the features after additive fusion; F H denotes the high-level semantic features; and F I denotes the interactive features.
Second, the fused features are processed using a parallel multi-scale depthwise separable convolution block. This block contains four parallel depthwise convolutional branches with kernel sizes sequentially set to 3, 7, 11, and 15. To capture multi-scale contextual information, this design systematically covers receptive fields from local details to global structures. The rationality of this specific multi-scale kernel combination has been validated through ablation studies, where it proved to be the optimal choice among various size configurations. The output features from the different branches are concatenated along the channel dimension to form a multi-scale fused feature map, which is then integrated and compressed via a pointwise convolution to further fuse complementary cross-scale information. Overall, this design allows the model to effectively capture and integrate multi-scale contextual information by utilizing varied receptive fields. Consequently, it expands the interactive perception range and enhances the use of prior information, thus achieving improved adaptability to multi-scale objects and complex scenes. This process can be described as:
  F 1 = D W C o n v 3 × 3 B N F a
F 2 = D W C o n v 7 × 7 B N F a
F 3 = D W C o n v 11 × 11 B N F a
F 4 = D W C o n v 15 × 15 B N F a
F b = G E L U P W C o n v 1 × 1 C o n c a t B N F a , F 1 , F 2 , F 3 , F 4
where F b denotes the output feature of the parallel multi-scale depthwise separable convolution block; F 1 , F 2 , F 3 , and F 4 denote the output features of the four depthwise convolutional branches, respectively; G E L U ( ) denotes the GELU activation operation; B N ( ) denotes the batch normalization operation; D W C o n v N × N ( ) denotes the N × N depthwise convolution operation; P W C o n v 1 × 1 ( ) denotes the 1 × 1 pointwise convolution operation; and C o n c a t ( ) denotes the channel-wise concatenation operation.
Subsequently, to enhance the model’s selective attention to inter-channel information, a lightweight Efficient Channel Attention (ECA) module [45] is introduced. It employs one-dimensional convolution to capture local cross-channel interactions, enabling adaptive learning of the importance of each channel. The feature maps are then recalibrated using a channel-wise attention mechanism to emphasize salient information:
F c = F b σ 1 D C o n v G A P F b + F a
where F c denotes the features enhanced by the ECA module; G A P ( ) denotes the global average pooling operation; 1 D C o n v ( ) denotes the one-dimensional convolution operation; σ ( ) denotes the Sigmoid activation operation; and denotes the channel-wise multiplication operation.
Finally, a 7 × 7 convolution is employed to further aggregate and refine the semantic features that have been infused with spatial prior information, thereby producing a more stable and discriminative feature representation:
F d = G E L U C o n v 7 × 7 B N F c + F c
where F d denotes the final output feature of the IFRM; C o n v 7 × 7 ( ) denotes the 7 × 7 convolution operation.

2.4. Loss Function

To mitigate the class imbalance issue while enhancing training stability, the Normalized Focal Loss (NFL) [46] is adopted as the loss function:
N F L i , j , M ^ = 1 P M ^ 1 p i , j γ log   p i , j
p i , j = p M ^ i , j = M i , j
P M ^ = i , j 1 p i , j γ
where M ^ denotes the predictions by the model; p i , j denotes the model’s confidence in making a correct prediction for the pixel at coordinates i , j ; P M ^ denotes the sum of the loss values for all pixels in the image; M i , j denotes the pixel value at coordinates i , j in the ground truth map; and M ^ i , j denotes the pixel value at coordinates i , j in the model’s predictions.

3. Results

3.1. Datasets

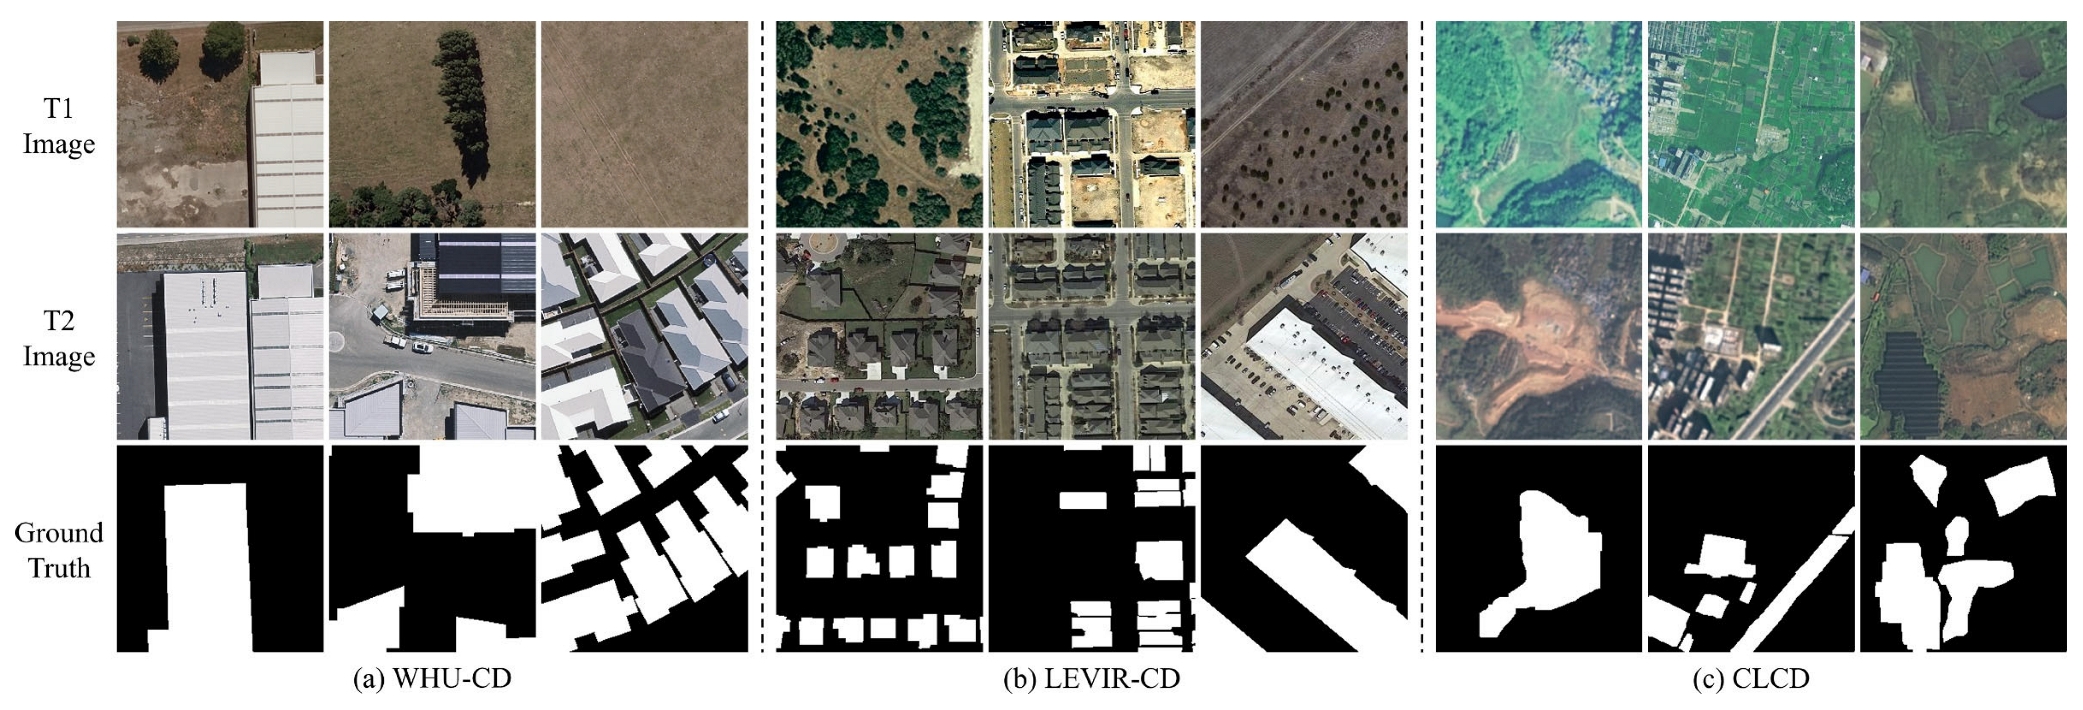
To validate the effectiveness of the proposed RSICDNet, extensive experiments are conducted using the WHU-CD dataset [47], the LEVIR-CD dataset [17], and the CLCD dataset [48]. Example images from all three datasets are shown in Figure 7.
The WHU-CD dataset consists of aerial images captured in 2012 and 2016, along with binary change maps. The aerial images have a spatial resolution of 0.3 m. This dataset documents building changes in the New Zealand region after an earthquake, covering over ten thousand buildings. The LEVIR-CD dataset comprises 637 pairs of bi-temporal remote sensing images and binary change maps, captured between 2002 and 2018 in the Texas region of the United States. The images have a spatial resolution of 0.5 m and a size of 1024 × 1024 pixels, encompassing various types of building changes. The CLCD dataset comprises 600 pairs of bi-temporal remote sensing images and binary change maps, focusing primarily on cropland changes. The bi-temporal remote sensing images in this dataset were acquired in 2017 and 2019, covering the Guangdong region of China, and feature a spatial resolution ranging from 0.5 to 2 m with a size of 512 × 512 pixels. Due to GPU memory constraints, images from all three CD datasets were uniformly cropped into patches of 256 × 256 pixels. The cropped WHU-CD and LEVIR-CD datasets were then split into training, validation, and testing sets in a ratio of 8:1:1, while the cropped CLCD dataset was split into training, validation, and testing sets in a ratio of 6:2:2.

3.2. Experimental Environment and Parameter Settings

The experiments in this study were conducted on a workstation equipped with an NVIDIA GeForce GTX 1080 Ti GPU, an Intel(R) Xeon(R) W-2123 CPU, a Windows 10 operating system, and the PyTorch 1.12.1 deep learning framework. During the training phase, the Adam optimizer was employed to optimize the model parameters, with the initial learning rate set to 0.0005, the batch size set to 16, and training epochs set to 230. Furthermore, to enhance the model’s generalization capability, data augmentation techniques including random scaling, random cropping, horizontal flipping, and random adjustments to brightness and contrast were applied during training.

3.3. Evaluation Metrics

To quantitatively evaluate the performance of the proposed RSICDNet, three evaluation metrics of NoI80, NoI85, and NoI90 are adopted. These metrics are derived from the Number of Interactions (NoI) [38] and represent the average number of interactions required for the model’s prediction to reach an Intersection over Union (IoU) of 80%, 85%, and 90%, respectively. A lower value indicates that the model can achieve the specified IoU with fewer interactions, implying higher interaction efficiency.
Furthermore, when comparing RSICDNet with end-to-end CD models, we adopt IoU, Overall Accuracy (OA), and F1-score (F1) as evaluation metrics. Specifically, IoU measures the overlap between prediction and ground truth, OA represents the proportion of correctly classified samples, and F1 is the harmonic mean of precision and recall. The definitions of these metrics are as follows:
I o U = T P T P + F N + F P
O A = T P + T N T P + T N + F N + F P
P = T P T P + F P
R = T P T P + F N
  F 1 = 2 × P × R P + R
where T P denotes the number of pixels that are truly changed and correctly predicted as changed; F P denotes the number of pixels that are truly unchanged but incorrectly predicted as changed; T N denotes the number of pixels that are truly unchanged and correctly predicted as unchanged; F N denotes the number of pixels that are truly changed but incorrectly predicted as unchanged; P denotes precision; and R denotes recall.

3.4. Comparative Experiments

To evaluate the superiority of the proposed RSICDNet, the following interactive deep learning models are selected for comparison:
  • f-BRS [31]: This method employs ResNet-101 [49] as its backbone network. It achieves adaptive fusion of the distance maps of click interactions and images through a Distance Maps Fusion (DMF) module, and adopts a feature backpropagation refinement scheme to enhance model performance.
  • RITM [33]: This method employs HRNet-W32 as its backbone network. It processes disk-encoded click interactions through a Conv1S module and performs feature fusion via element-wise addition. Furthermore, it leverages the previous prediction as an additional input to enhance stability across iterative refinements.
  • FocalClick [35]: This method employs HRNet-W32 as its backbone network. It utilizes two convolutional layers to adjust the dimensionality of the click maps and performs feature fusion at the shallow layers of the backbone. By predicting and updating masks within local regions, it effectively enhances model efficiency.
  • SimpleClick [36]: This method employs ViT-B [50] as its backbone network. It processes click interactions using an embedding layer and fuses the user click information into the backbone network through element-wise addition.
The quantitative results of different models are presented in Table 1.

3.4.1. WHU-CD Dataset

As shown in Table 1, RSICDNet achieves NoI80, NoI85, and NoI90 values of 1.15, 1.25, and 1.51, respectively, on the WHU-CD dataset, representing improvements of at least 0.03, 0.06, and 0.16 over other comparative models, thus demonstrating its superior quantitative performance. Among the comparative models, f-BRS performs poorly, which can be attributed to its lack of an iterative refinement mechanism based on previous CD result, leading to inferior stability during iterative inference. In contrast, RITM and FocalClick, which incorporate such an iterative refinement mechanism using previous CD results, exhibit relatively better performance. They outperform f-BRS on the three metrics by 0.24, 0.43, and 0.76, and 0.28, 0.47, and 0.69, respectively. It is noteworthy that SimpleClick achieves NoI80, NoI85, and NoI90 values of 1.18, 1.31, and 1.67, respectively, obtaining the second-best performance. This is because SimpleClick employs ViT as its backbone network, which possesses global context modeling capabilities, enabling it to detect target change areas more completely with minimal click guidance.
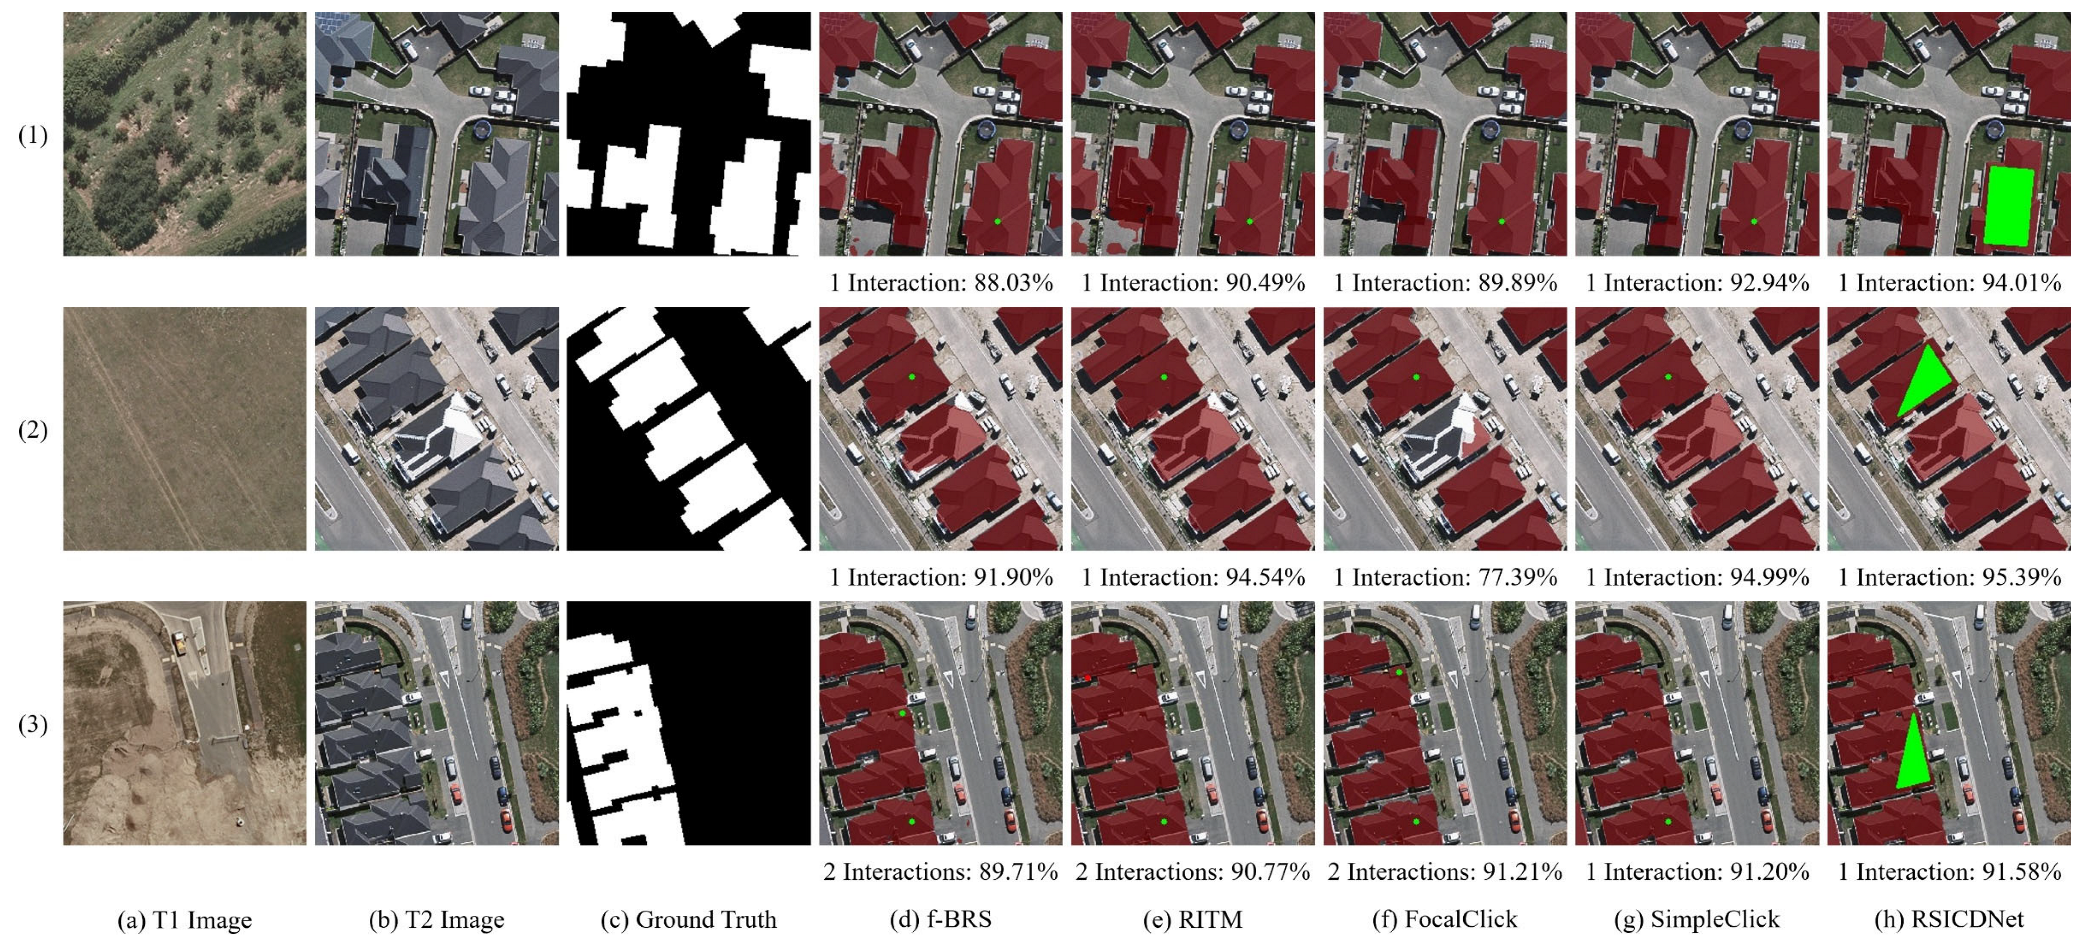
Figure 8 presents a visual comparison of different models on the WHU-CD dataset. In the first case, which contains multiple newly built buildings with significant morphological variations, RSICDNet achieves the most accurate boundary localization and the best visual effect under the same condition of one interaction. The second case displays a scene with dense building changes, where one building’s roof material substantially differs from the others. After the same number of interactions, only RSICDNet and SimpleClick detect nearly all changed targets completely, while the other three models exhibit varying degrees of missed detections. The third case illustrates a change scenario involving irregularly shaped buildings. RSICDNet achieves the best CD results with the same or even fewer interactions. This performance is primarily attributed to the IFRM, which effectively establishes connections between the regional scribble interactions and multi-scale contextual regions. This design significantly enhances the guidance effect of the interactions, which in turn improves the model’s ability to capture geometric contours and structural details of irregular change areas.

3.4.2. LEVIR-CD Dataset

According to Table 1, RSICDNet significantly outperforms the comparative models across the NoI80, NoI85, and NoI90 on the LEVIR-CD dataset, achieving values of 1.45, 1.98, and 4.67, respectively. These values represent improvements of at least 0.30, 0.55, and 1.21 over other models, clearly demonstrating the higher interaction efficiency of RSICDNet. Among the comparative models, f-BRS has the lowest interaction efficiency, as it requires the highest average number of interactions for its CD results to reach the specified IoU. The performance gap among RITM, FocalClick, and SimpleClick on the LEVIR-CD dataset is relatively small. Specifically, SimpleClick achieves NoI80, NoI85, and NoI90 values of 1.75, 2.59, and 6.25, respectively. Its second-best performance on NoI80 indicates that it can produce satisfactory results with relatively few user interactions. Furthermore, RITM achieves the second-best performance on the NoI85 and NoI90 metrics, with average interaction counts of 2.53 and 5.88, respectively. This can be attributed to the strong detail preservation capability of its HRNet backbone, which allows it to correct errors in the CD results with only a small number of click interactions.
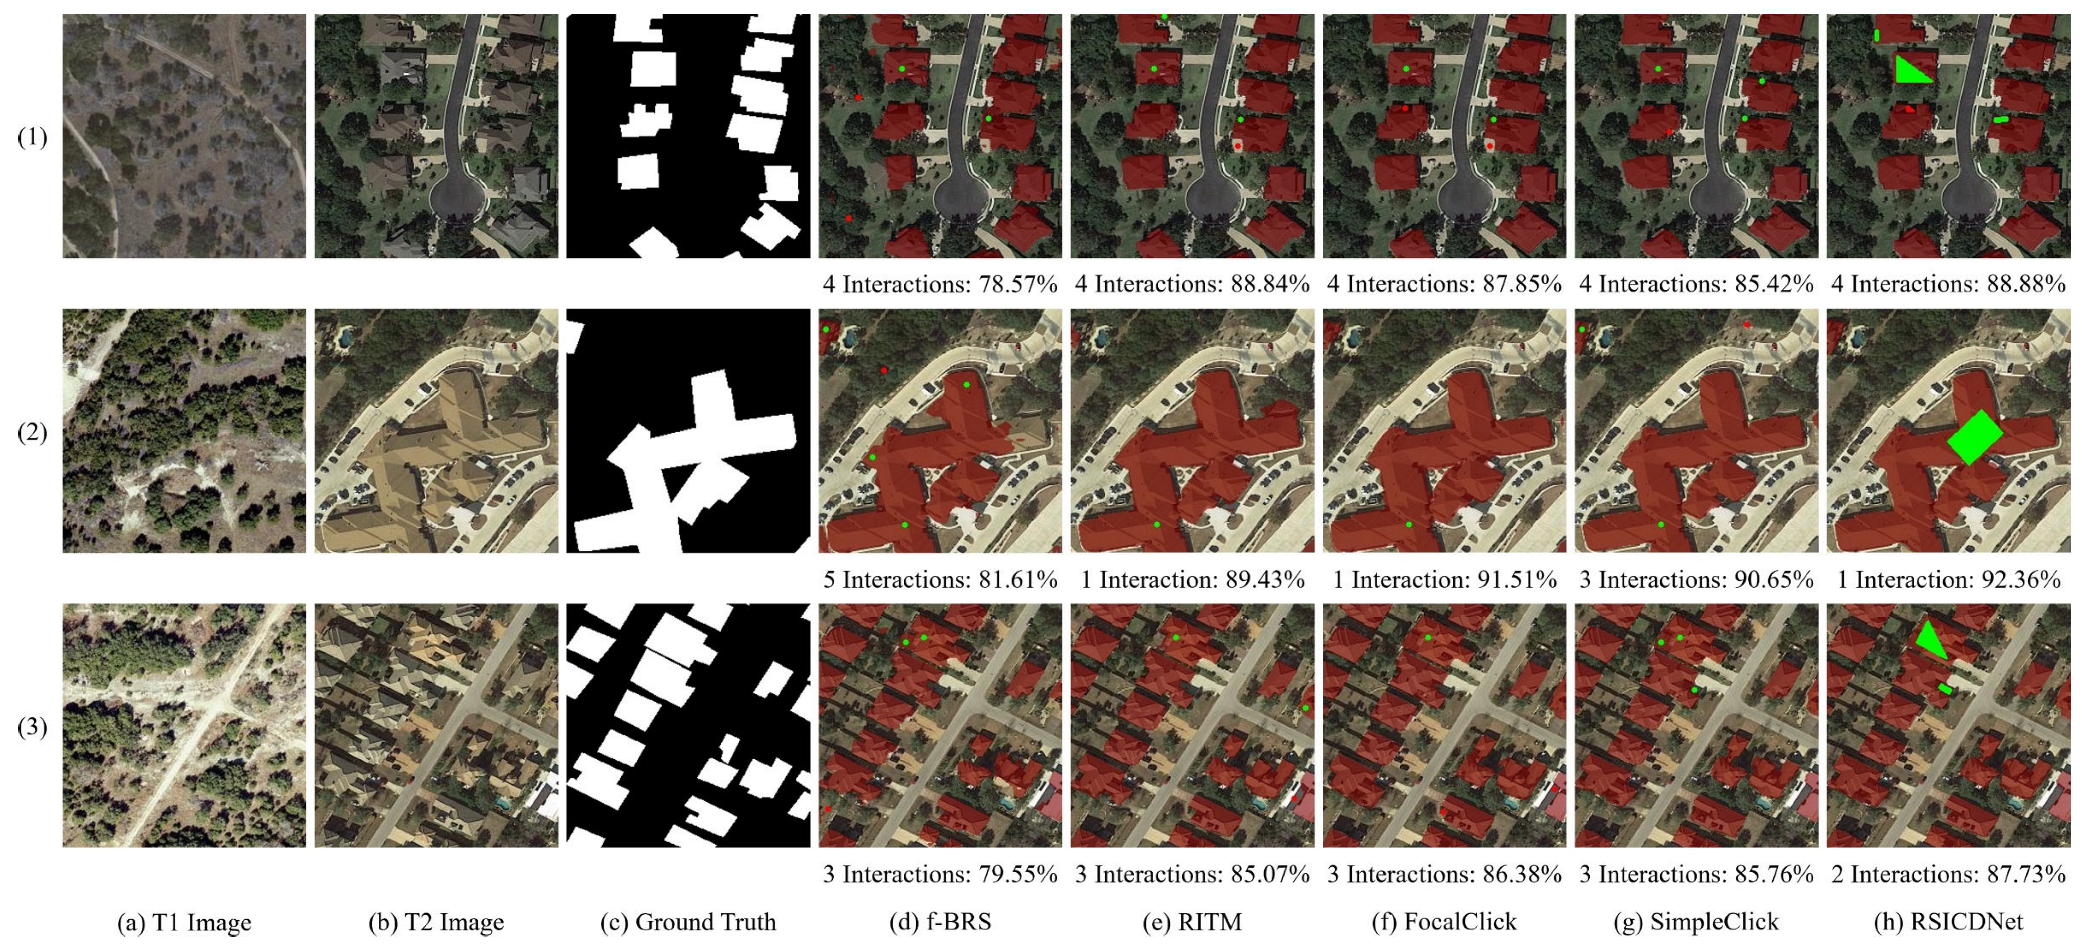
Figure 9 presents the visual results of different models on the LEVIR-CD dataset. The first case shows a change scenario with occlusion interference. Under the condition of four interactions, RSICDNet produces a change mask with the fewest false positives and missed detections, achieving the best visual effect. This is because the regional scribble interaction possesses stronger error correction capability than click-based interaction, allowing it to effectively filter out false positives and missed detections along change target boundaries during iterative prediction. The second case involves a large, geometrically complex building. Compared to other methods, RSICDNet successfully detects the complete building entity with higher edge accuracy, demonstrating its advantage in detecting large-scale change areas. The third case presents a scenario with densely distributed building changes. It can be observed that, compared to the comparative models requiring three interactions, RSICDNet achieves optimal CD results with just two interactions, sufficiently proving the effectiveness and superiority of the proposed method.

3.4.3. CLCD Dataset

As presented in Table 1, on the CLCD dataset, RSICDNet achieves NoI80, NoI85, and NoI90 values of 3.42, 5.14, and 7.59, respectively. It achieves the target IoU levels with the fewest average interactions across all specified thresholds. SimpleClick attains the second-best performance across all metrics, with NoI80, NoI85, and NoI90 values of 4.66, 6.52, and 8.94, respectively. Compared to SimpleClick, RSICDNet demonstrates improvements of 1.24, 1.38, and 1.35 on these three metrics, highlighting its significant advantage. In contrast, f-BRS, RITM, and FocalClick exhibit relatively poorer performance, each requiring more than five average interactions to achieve an IoU of 80%, indicating lower interaction efficiency. Particularly, compared to the WHU-CD and LEVIR-CD datasets, the CLCD dataset, which primarily focuses on cropland changes, contains more complex change scenarios. This complexity entails that ICD models require more interactions to achieve satisfactory change detection performance. Notably, RSICDNet shows the most substantial improvement in interaction efficiency on the CLCD dataset, fully demonstrating its superior capability in handling complex change scenarios.
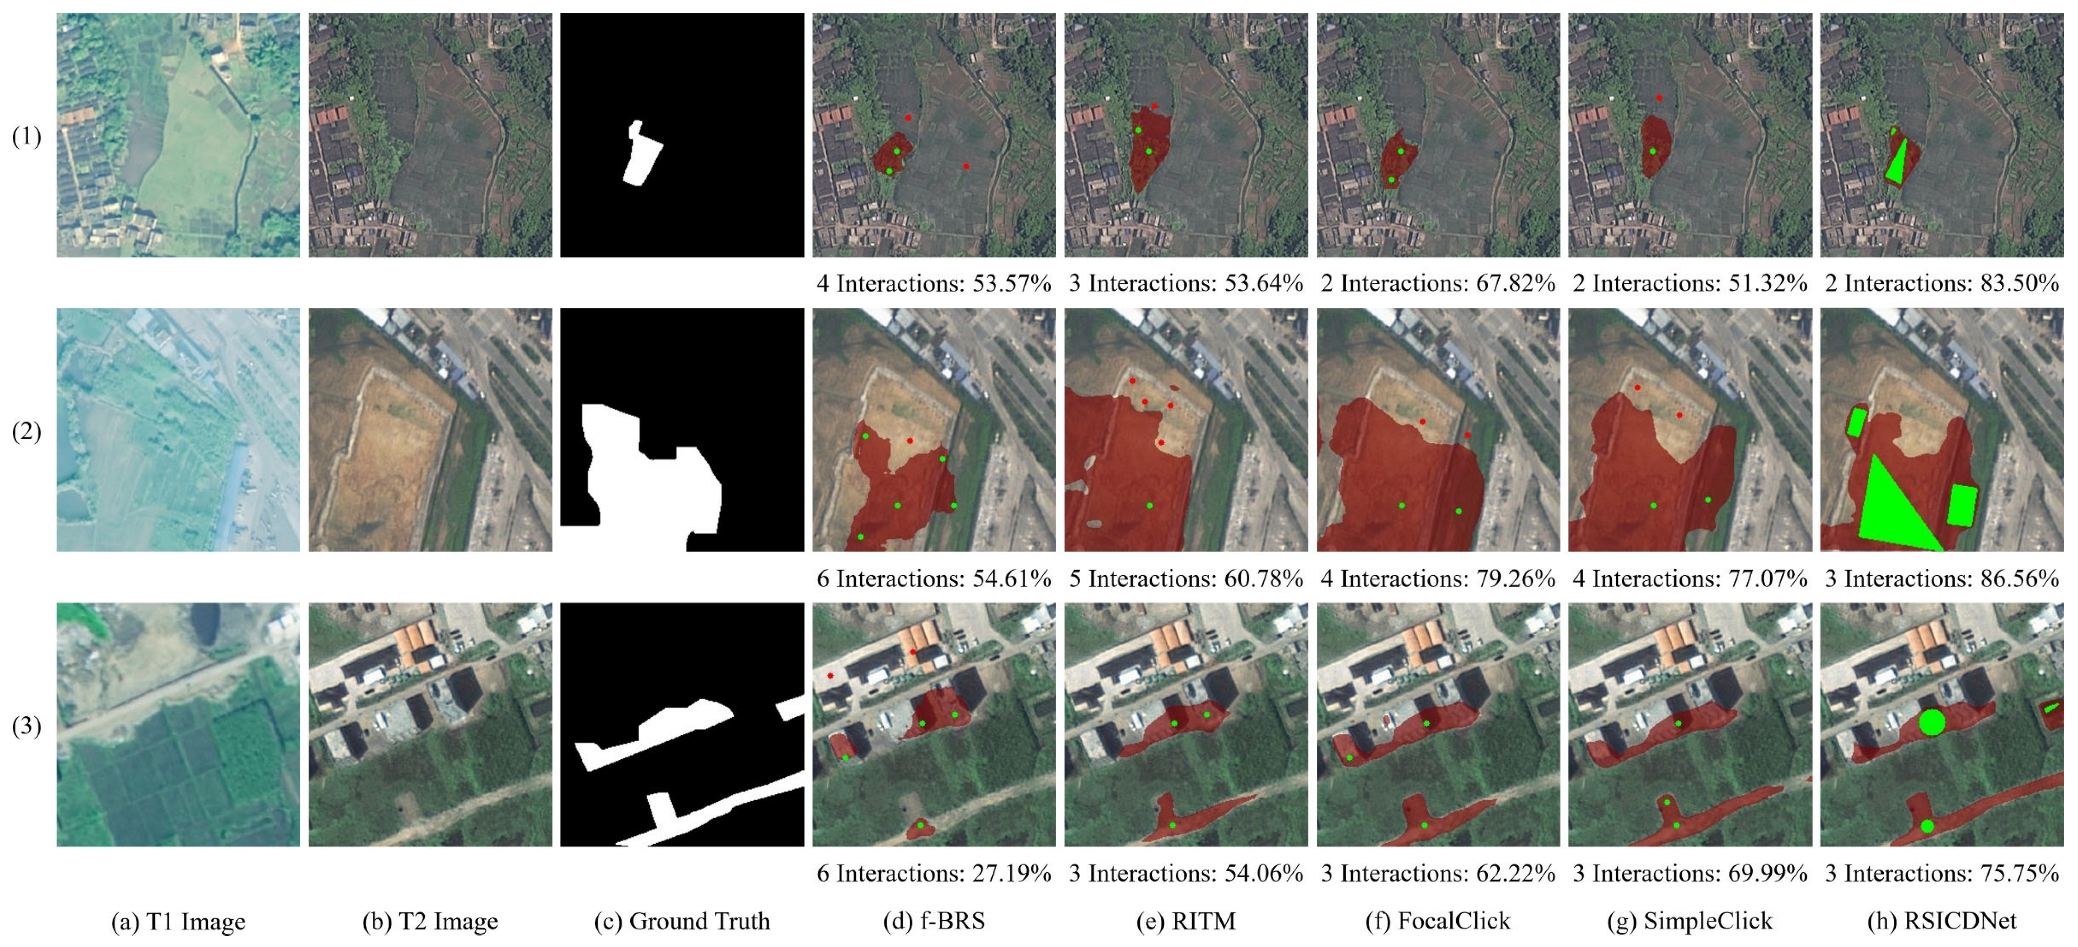
Figure 10 presents a visual comparison of different models on the CLCD dataset. The first case shows a change scenario from cropland to tree cover. With only two interactions, RSICDNet achieves the best CD results, delivering a visual output that is markedly superior to other comparative models. The second case demonstrates a change from cropland to wasteland, where the change area exhibits complex shapes and blurred boundaries. For this case, RSICDNet accurately detects the change area with only three interactions. In contrast, models like RITM, FocalClick, and SimpleClick tend to generate numerous false positives, which then require multiple negative interactions to correct. As for f-BRS, it still suffers from extensive missed detections even after six interactions. The third case involves changes from cropland to buildings and roads. It can be observed that RSICDNet detects nearly all change areas relatively completely, while all other models exhibit more severe missed detections, particularly in identifying the change from cropland to roads.

4. Discussion

4.1. Ablation Study

To validate the effectiveness of the proposed IFRM, regional scribble interaction (RSI), and CSE, an ablation study is conducted on the WHU-CD, LEVIR-CD, and CLCD datasets. The study comprises the following models:
  • Base: The baseline model for RSICDNet. It performs interactive feature fusion only at the shallow layers of the HRNet backbone and employs click-based interaction.
  • Base + IFRM: This variant introduces the IFRM to the Base, fusing click interactions with high-level semantic features.
  • Base + RSI + CSE: This variant replaces click-based interaction with regional scribble interaction and processes this input with the CSE-equipped IPSNet.
  • Base + RSI + IFRM: This variant incorporates both regional scribble interaction and the IFRM, but does not equip the IPSNet with the CSE.
  • RSICDNet: The complete model proposed in this paper, integrating regional scribble interaction, the CSE, and the IFRM.
The quantitative and visual results of the ablation study are presented in Table 2 and Figure 11, respectively.
As presented in Table 2, after introducing the IFRM, Base + IFRM achieves NoI80, NoI85, and NoI90 values of 1.24, 1.39, and 1.72 on the WHU-CD dataset, respectively. These metrics show improvement compared to the Base, sufficiently validating the effectiveness of IFRM in enhancing the performance of ICD models. These results are further strengthened by the quantitative comparisons, where RSICDNet demonstrates superior and more consistent performance than Base + RSI + CSE across all three datasets. Furthermore, with the introduction of regional scribble interaction, Base + RSI + CSE significantly outperforms the Base across all metrics on the three datasets. For example, on the LEVIR-CD dataset, its NoI80, NoI85, and NoI90 show improvements of 0.29, 0.48, and 1.25 over the Base, respectively, indicating a marked gain in interaction efficiency. Meanwhile, RSICDNet, which also employs regional scribble interaction, demonstrates significant superiority over the click-based Base + IFRM across all metrics on the three datasets. These results collectively confirm that regional scribble interaction can effectively reduce the number of interactions required by users, thereby substantially enhancing the interaction efficiency of ICD models. Moreover, RSICDNet’s quantitative results are superior to those of Base + RSI + IFRM, which lacks the CSE in its IPSNet. Specifically, on the CLCD dataset, RSICDNet achieves improvements of 0.18, 0.02, and 0.10 in NoI80, NoI85, and NoI90 over Base + RSI + IFRM, respectively. This comparative analysis demonstrates that the CSE is essential for the effective extraction of interactive features.
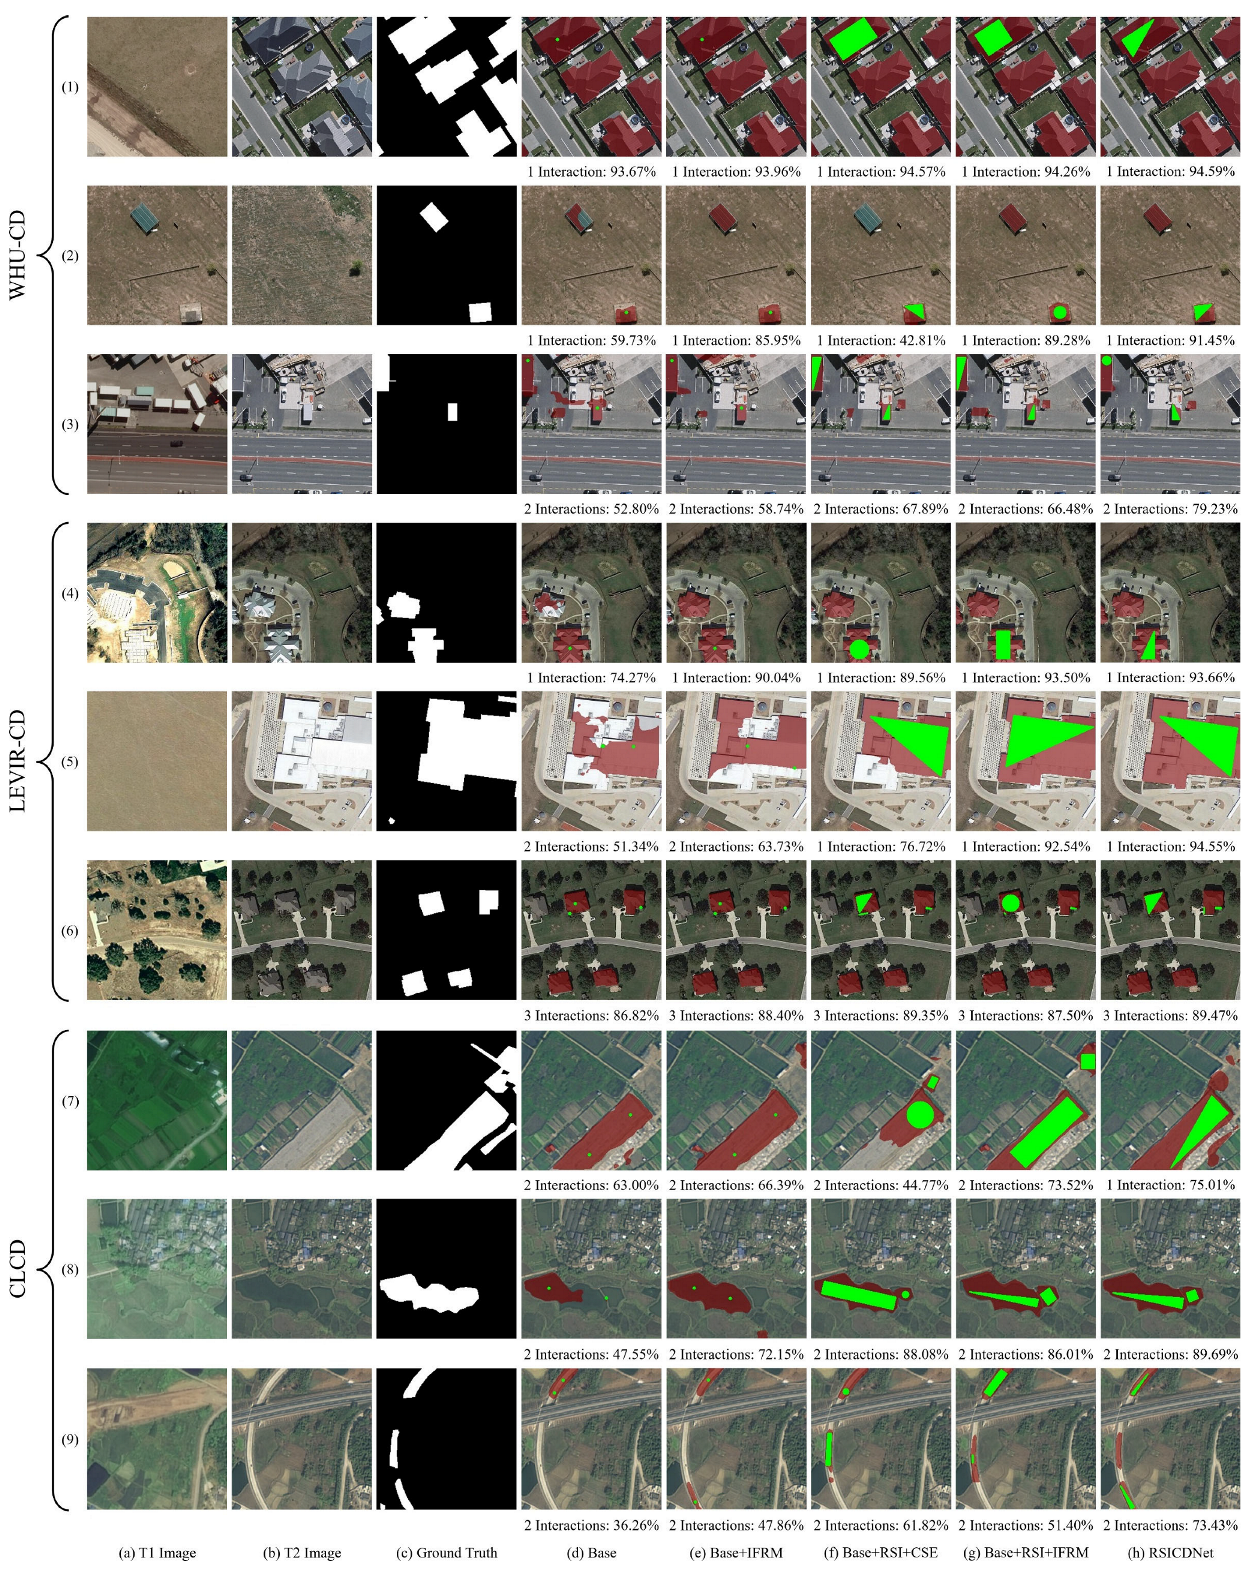
As shown in Figure 11, the first case shows a typical scenario of newly constructed buildings, where RSICDNet achieves the best CD results among all models, with its prediction mask exhibiting higher overlap with the ground truth than others. The second case involves a relatively rare instance of building disappearance in the dataset, featuring two widely separated demolished buildings. For Base and Base + RSI + CSE, which lack the IFRM, the former fails to completely detect both disappeared buildings, while the latter only detects the building directly indicated by the interaction. In contrast, Base + IFRM, Base + RSI + IFRM, and RSICDNet, which incorporate the IFRM, detect all disappeared buildings more completely. This result demonstrates that the IFRM can effectively expand the influence range of interactions and refine feature representations, thereby enhancing the model’s perception of change targets. The third case involves a change scenario with complex backgrounds. Although all five models successfully identify the change targets after two interactions, RSICDNet yields significantly fewer false positives than its counterparts, demonstrating its superior ability to suppress complex background interference. In the fourth case, which involves a change from buildings under construction to completed structures, Base, Base + IFRM, and Base + RSI + CSE all exhibit pronounced missed detections. In contrast, both Base + RSI + IFRM and RSICDNet show virtually no omissions, delivering superior CD results. The fifth case features a large building with complex morphology and structure. The click-based models (Base and Base + IFRM) fail to resolve substantial missed detections even after two interactions, whereas RSICDNet with regional scribble interaction accurately identifies changes in a single interaction. This contrast underscores that regional scribble interaction supplies richer spatial priors, thereby enabling the model to efficiently and accurately identify large-scale, complex change targets. For the sixth case featuring sparsely distributed change targets, RSICDNet demonstrates superior detection capability. Even after three interactions, it consistently generates higher-fidelity change masks than all competing models. The seventh case presents a relatively complex cropland change scenario. RSICDNet achieves the most accurate CD results with only one interaction, delivering a visual effect superior to that of other models even after two interactions. The eighth case involves a change from cropland to water bodies. With just two interactions, models using regional scribble interaction capture change areas more comprehensively. Among them, RSICDNet, which integrates both the IFRM and CSE, achieves the most accurate boundary localization for the change areas. In the ninth case, which involves multiple changes from cropland to roads, RSICDNet successfully detects all three change areas with two interactions. The other models, in contrast, identify only one or two.
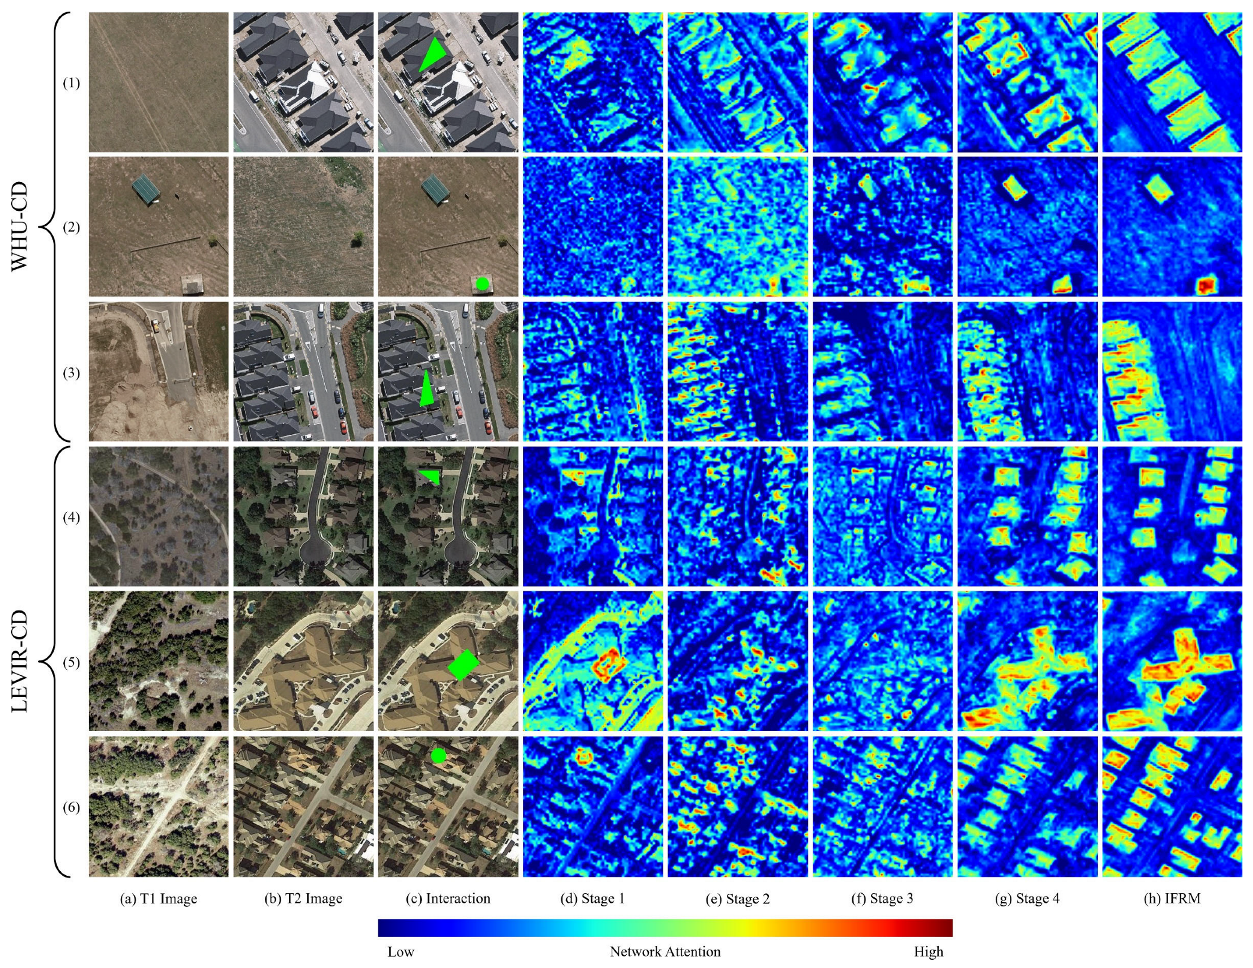
For the benefit of visual analysis, we visualize the feature maps for each stage of the features on the WHU-CD and LEVIR-CD datasets, as shown in Figure 12. The results demonstrate that feature fusion via the IFRM—which integrates the interactive features with high-level semantic features—significantly enhances the model’s attention to change areas. This sharpened attention produces more distinct feature responses near change boundaries while partially suppressing background noise. Consequently, the discriminative power of the resulting feature maps is substantially improved.
To optimize the IFRM, we investigated the performance of three multi-scale kernel combinations—(3,5,7,9), (3,7,11,15), and (3,9,15,21)—within its depthwise convolutional branches on the WHU-CD dataset, aiming to select the most effective design. The quantitative results are presented in Table 3. The experimental results indicate that the IFRM configuration with kernel sizes (3, 7, 11, 15) delivers optimal performance on NoI80 and NoI85, while achieving near-optimal results on NoI90. This demonstrates the effectiveness of this specific multi-scale combination.
For the CSE design, we perform an ablation study on the three constituent operations of contour extraction, skeletonization, and dilation using the WHU-CD dataset. We compare the model featuring the complete CSE against three ablation variants that remove contour extraction, skeletonization, and dilation, respectively. Experimental results in Table 4 indicate that the model with the complete CSE achieves the best performance. The performance degradation observed when any operation is removed justifies the specific combination of contour extraction, skeletonization, and dilation in CSE.

4.2. Comparison with End-to-End Models

To further evaluate the performance of the proposed RSICDNet and illustrate the performance gap between interactive and non-interactive CD methods, we compare RSICDNet with the following advanced end-to-end CD models on the WHU-CD, LEVIR-CD, and CLCD datasets:
  • Spatial-Temporal Attention Neural Network (STANet) [17]: This method employs a Siamese convolutional network as the encoder and incorporates a spatial–temporal attention mechanism in the decoder to capture spatial–temporal dependencies.
  • ChangeFormer [18]: This method utilizes a Siamese Transformer encoder to extract multi-scale features and employs an MLP in the decoder to generate the change map.
  • ChangeViT [20]: This method employs a plain ViT as the feature extractor. It introduces a detail-capture module to address ViT’s limitations in identifying small objects and merges the extracted detailed features with high-level semantic features through a feature injector.
  • CD-Lamba [23]: This method employs a Locally Adaptive State-Space Scan strategy to enhance bi-temporal local perception, and achieves pixel-wise cross-fusion through a Cross-Temporal State-Space Scan strategy.
The comparison between RSICDNet (with only one interaction per sample) and end-to-end CD models on the WHU-CD, LEVIR-CD, and CLCD datasets are presented in Table 5. As can be seen, RSICDNet achieves superior IoU, OA, and F1 over all compared end-to-end models across the three datasets. Specifically, RSICDNet achieves IoU improvements of at least 1.79%, 1.29%, and 11.96% over other models on the WHU-CD, LEVIR-CD, and CLCD datasets, respectively. This benefit stems from the regional scribble interaction, which provides RSICDNet with rich spatial prior information, enabling it to outperform end-to-end CD models with just one interaction. Furthermore, RSICDNet can further enhance CD accuracy by incorporating additional interactions, indicating the significant potential of interactive models in CD applications. It is noteworthy that RSICDNet demonstrates particularly outstanding performance on the CLCD dataset, which contains more complex change scenarios. On the CLCD dataset, compared to other models, RSICDNet improves IoU, OA, and F1 by at least 11.96%, 1.27%, and 8.34%, respectively. This demonstrates its significant advantage in handling complex change scenarios. The comparison with advanced end-to-end models fully demonstrates the superiority of RSICDNet and validates the effectiveness of interactive models for CD tasks.

4.3. Model Complexity Analysis

To comprehensively evaluate different ICD methods, we analyze their complexity on the LEVIR-CD dataset, employing three metrics: the number of parameters, Multiply-Accumulate Operations (MACs), and inference time. As shown in Table 6, f-BRS exhibits both the highest MACs and inference time, reflecting its highest computational complexity and insufficient computational efficiency. In contrast, RITM and FocalClick possess fewer parameters and lower MACs, making them more lightweight. Notably, SimpleClick achieves the lowest inference time, showing advantages in real-time performance. However, it has the largest number of parameters and relatively high MACs, resulting in higher memory consumption and computational cost, which may pose challenges for deployment on resource-constrained devices. Compared to RITM, which has the fewest parameters and lowest MACs, RSICDNet incurs only a slight increase in both, yet achieves the highest IoU. This demonstrates that RSICDNet attains superior performance at a low additional complexity cost, striking a favorable balance between performance and complexity. In addition, while RSICDNet’s inference time is slightly longer, it remains well within acceptable limits for practical use, thus retaining considerable application value.

4.4. Human–Computer Interactive Change Detection Application

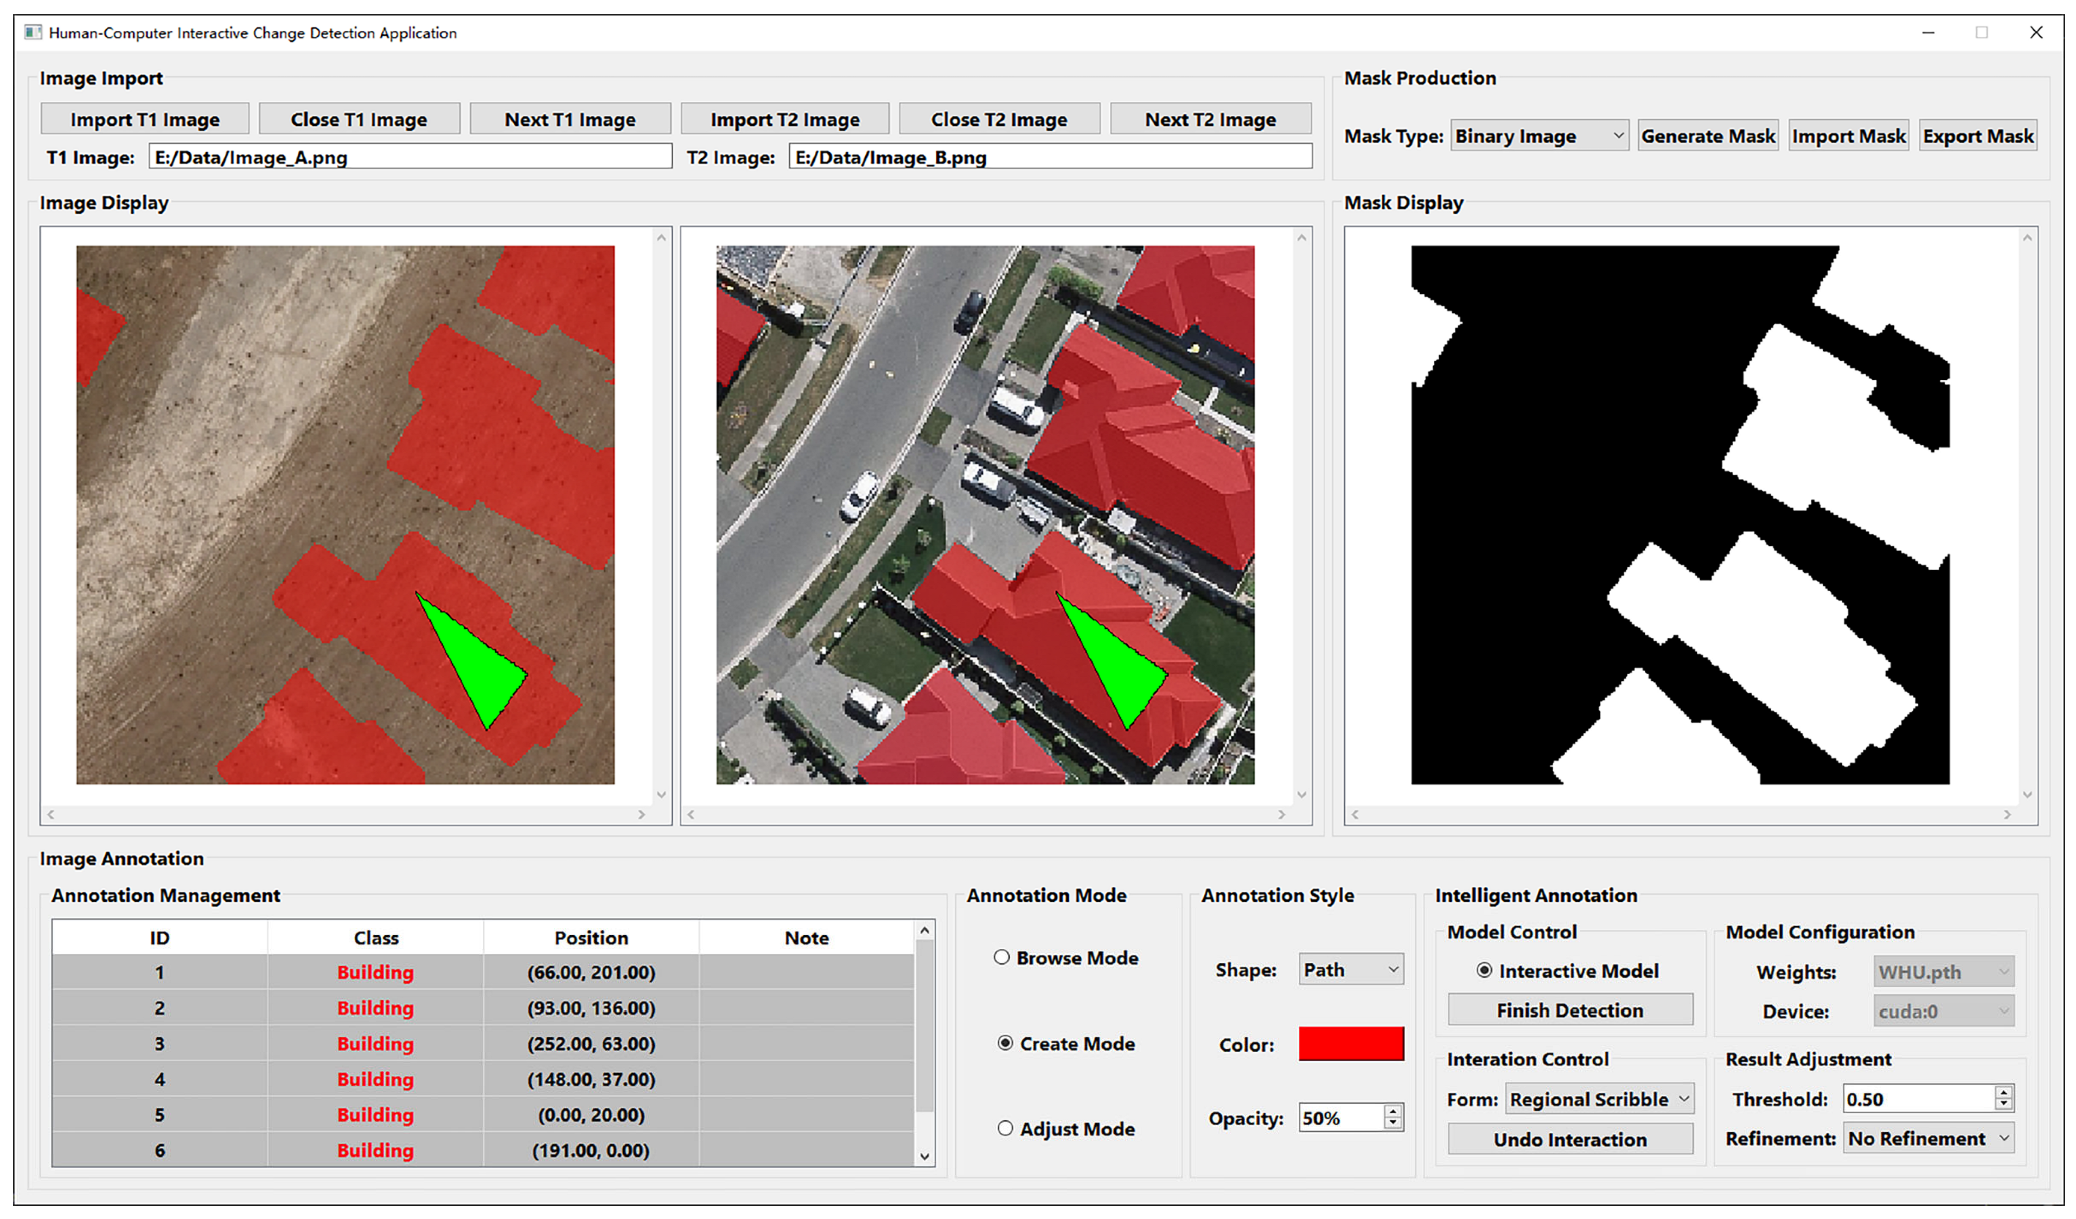
To meet the practical demand for efficient CD tools, we integrate RSICDNet with a user-friendly GUI to develop a fully featured yet easy-to-operate human–computer interactive CD application (https://github.com/JYD-KEN/RSICD (accessed on 25 December 2025), as shown in Figure 13.
The application primarily comprises the following four core functions:
  • Image import and browsing: Users can import pre-change and post-change images into the application via the “Import T1 Image” and “Import T2 Image” buttons. The application then displays the two images in two separate graphics views. Users can zoom and pan the graphics views using the mouse for flexible browsing of the bi-temporal images.
  • Interactive change detection: After switching to annotation creation mode, users can click the “Interactive Model” radio button to load the pre-trained weights and deploy RSICDNet to the specified device. The application then allows users to invoke RSICDNet for ICD by drawing regional scribbles with the mouse in the graphics views, where pressing and dragging with the left mouse button draws a positive interaction and doing so with the right mouse button draws a negative one. Furthermore, iterative prediction can be performed by adding interactions to progressively refine the CD results until satisfactory. If an erroneous scribble is drawn, users can click the “Undo Interaction” button to undo the last scribble, and the application will automatically restore the CD results to the previous state. Finally, clicking the “Finish Detection” button creates annotation instances based on the current results.
  • Annotation instance recording and management: The application records all created annotation instances and displays their attributes in the “Annotation Management” table. In annotation adjustment mode, users can manage selected instances, such as modifying their class, editing notes, or deleting them.
  • Change map generation and export: Clicking the “Generate Mask” button produces a change map based on the annotation instances. The application supports three output types: binary, grayscale, and color maps. The generated change map is displayed in the “Mask Display” graphics view for inspection. Finally, users can click the “Export Mask” button to export the change map as an image file to a specified file path.
We conduct a preliminary functional verification and effectiveness evaluation of the developed human–computer interactive change detection application. Specifically, 20 pairs of bi-temporal images are selected from the test set of the WHU-CD dataset and annotated using this application. The results indicate that using this application requires an average of only about 6 s to complete the annotation of a pair of bi-temporal images, saving approximately 50% of the annotation time compared to manual pixel-level labeling. The application effectively streamlines the annotation workflow and enhances the production efficiency of high-quality change label data.

4.5. Limitations and Future Work

The proposed RSICDNet has achieved outstanding performance in remote sensing CD task. However, it still has certain limitations, which can be outlined in the following aspects:
  • By employing regional scribble interaction, RSICDNet requires fewer user inputs to handle complex changes. However, click-based interaction still holds advantages in terms of operational simplicity. The user workload and time cost of drawing a regional scribble are relatively high, which could somewhat affect practical interaction efficiency. Future work will aim to reduce the interaction burden of regional scribbles and further explore synergistic mechanisms among different interaction forms, thereby enhancing the flexibility and efficiency of ICD systems.
  • The limitation of generating only regular scribbles fails to fully emulate real user behavior. Consequently, the model may develop a bias towards these shapes during training, limiting its ability to generalize to diverse, real-world interactions. Future work will focus on two key improvements: advancing free-form scribble simulation and refining automated generation, both aimed at more accurately emulating real user behavior.
  • The proposed RSICDNet follows a fully supervised learning paradigm, which heavily relies on large amounts of annotated data. Building on rapid advances in visual foundation models, future work will explore their integration with RSICDNet. We aim to capitalize on their zero-shot generalization to develop robust semi- and weakly supervised ICD methods, thereby enhancing performance on unseen scenarios and strengthening cross-domain generalization.

5. Conclusions

To address the challenges of suboptimal detection performance and low interaction efficiency in complex change scenarios with existing interactive models, this paper proposes RSICDNet, a novel ICD model driven by regional scribble interaction. Specifically, the introduction of regional scribble interaction provides richer spatial prior information, while the designed IFRM effectively fuses interactive features with high-level semantic features, thereby significantly improving ICD performance. Furthermore, a fully featured human–computer interactive CD application was developed based on RSICDNet, substantially improving its practical deployment and application capabilities. To validate the effectiveness of RSICDNet, extensive experiments were conducted on three public datasets. In comparison to the comparative models, RSICDNet achieved superior performance in both quantitative metrics and visual results, demonstrating its advantages. The ablation study confirms that the regional scribble interaction, IFRM, and CSE can significantly improve the performance of RSICDNet, thereby fully validating their effectiveness. The model complexity analysis further demonstrates that our proposed RSICDNet strikes a favorable balance between performance and complexity.

Author Contributions

Conceptualization, D.P. and C.H.; methodology, D.P. and C.H.; software, C.H.; validation, D.P. and C.H.; visualization, D.P. and C.H.; data curation, C.H.; formal analysis, D.P. and C.H.; investigation, D.P. and C.H.; resources, D.P. and H.G.; writing—original draft preparation, D.P. and H.G.; writing—review and editing, D.P. and H.G.; supervision, D.P.; project administration, D.P.; funding acquisition, D.P. All authors have read and agreed to the published version of the manuscript.

Funding

This research was funded by the National Natural Science Foundation of China (No. 42371449).

Data Availability Statement

The data will be made available upon reasonable request.

Acknowledgments

The authors sincerely appreciate the helpful comments and constructive suggestions given by the academic editors and reviewers.

Conflicts of Interest

The authors declare no conflicts of interest.

Abbreviations

The following abbreviations are used in this manuscript:
CDChange detection
DLCDDeep learning-based change detection
CNNConvolutional neural network
HRNetHigh-resolution network
OCRObject-contextual representation
MLPMultilayer perceptron
ViTVision transformer
SSMState space models
SAMSegment anything model
f-BRSFeature backpropagation refinement scheme
ICDInteractive change detection
RSICDNetInteractive change detection model with regional scribble interaction
IFRMInteraction fusion and refinement module
GUIGraphical user interface
IPSNetInteraction processing sub-network
CDSNetChange detection sub-network
CSEContour-skeleton extractor
ECAEfficient channel attention
NFLNormalized focal loss
NoINumber of interactions
IoUIntersection over union
OAOverall accuracy
F1F1-score
DMFDistance maps fusion
RSIRegional scribble interaction
STANetSpatial-temporal attention neural network
MACsMultiply-accumulate operations

References

  1. Tian, S.; Zhong, Y.; Zheng, Z.; Ma, A.; Tan, X.; Zhang, L. Large-scale deep learning based binary and semantic change detection in ultra high resolution remote sensing imagery: From benchmark datasets to urban application. ISPRS J. Photogramm. Remote Sens. 2022, 193, 164–186. [Google Scholar] [CrossRef]
  2. Pelletier, F.; Cardille, J.A.; Wulder, M.A.; White, J.C.; Hermosilla, T. Inter- and intra-year forest change detection and monitoring of aboveground biomass dynamics using Sentinel-2 and Landsat. Remote Sens. Environ. 2024, 301, 113931. [Google Scholar] [CrossRef]
  3. Zou, Y.; Shen, T.; Chen, Z.; Chen, P.; Yang, X.; Zan, L. A Transformer-Based Neural Network with Improved Pyramid Pooling Module for Change Detection in Ecological Redline Monitoring. Remote Sens. 2023, 15, 588. [Google Scholar] [CrossRef]
  4. Wang, X.; Fan, X.; Xu, Q.; Du, P. Change detection-based co-seismic landslide mapping through extended morphological profiles and ensemble strategy. ISPRS J. Photogramm. Remote Sens. 2022, 187, 225–239. [Google Scholar] [CrossRef]
  5. Mas, J.-F. Monitoring land-cover changes: A comparison of change detection techniques. Int. J. Remote Sens. 1999, 20, 139–152. [Google Scholar] [CrossRef]
  6. Bovolo, F.; Bruzzone, L. A Theoretical Framework for Unsupervised Change Detection Based on Change Vector Analysis in the Polar Domain. IEEE Trans. Geosci. Remote Sens. 2007, 45, 218–236. [Google Scholar] [CrossRef]
  7. Wu, C.; Du, B.; Cui, X.; Zhang, L. A post-classification change detection method based on iterative slow feature analysis and Bayesian soft fusion. Remote Sens. Environ. 2017, 199, 241–255. [Google Scholar] [CrossRef]
  8. Hussain, M.; Chen, D.; Cheng, A.; Wei, H.; Stanley, D. Change detection from remotely sensed images: From pixel-based to object-based approaches. ISPRS J. Photogramm. Remote Sens. 2013, 80, 91–106. [Google Scholar] [CrossRef]
  9. Miller, O.; Pikaz, A.; Averbuch, A. Objects based change detection in a pair of gray-level images. Pattern Recogn. 2005, 38, 1976–1992. [Google Scholar] [CrossRef]
  10. Hazel, G.G. Object-level change detection in spectral imagery. IEEE Trans. Geosci. Remote Sens. 2001, 39, 553–561. [Google Scholar] [CrossRef]
  11. Volpi, M.; Tuia, D.; Bovolo, F.; Kanevski, M.; Bruzzone, L. Supervised change detection in VHR images using contextual information and support vector machines. Int. J. Appl. Earth Obs. Geoinf. 2013, 20, 77–85. [Google Scholar] [CrossRef]
  12. Im, J.; Jensen, J.R. A change detection model based on neighborhood correlation image analysis and decision tree classification. Remote Sens. Environ. 2005, 99, 326–340. [Google Scholar] [CrossRef]
  13. Bai, T.; Sun, K.; Deng, S.; Li, D.; Li, W.; Chen, Y. Multi-scale hierarchical sampling change detection using Random Forest for high-resolution satellite imagery. Int. J. Remote Sens. 2018, 39, 7523–7546. [Google Scholar] [CrossRef]
  14. Bai, T.; Wang, L.; Yin, D.; Sun, K.; Chen, Y.; Li, W.; Li, D. Deep learning for change detection in remote sensing: A review. Geo-spat. Inf. Sci. 2023, 26, 262–288. [Google Scholar] [CrossRef]
  15. Peng, D.; Zhang, Y.; Guan, H. End-to-End Change Detection for High Resolution Satellite Images Using Improved UNet++. Remote Sens. 2019, 11, 1382. [Google Scholar] [CrossRef]
  16. Wang, Z.; Liu, D.; Liao, X.; Pu, W.; Wang, Z.; Zhang, Q. SiamHRnet-OCR: A Novel Deforestation Detection Model with High-Resolution Imagery and Deep Learning. Remote Sens. 2023, 15, 463. [Google Scholar] [CrossRef]
  17. Chen, H.; Shi, Z. A Spatial-Temporal Attention-Based Method and a New Dataset for Remote Sensing Image Change Detection. Remote Sens. 2020, 12, 1662. [Google Scholar] [CrossRef]
  18. Bandara, W.G.C.; Patel, V.M. A Transformer-Based Siamese Network for Change Detection. In Proceedings of the IGARSS 2022—2022 IEEE International Geoscience and Remote Sensing Symposium, Kuala Lumpur, Malaysia, 17–22 July 2022; pp. 207–210. [Google Scholar]
  19. Yan, W.; Cao, L.; Yan, P.; Zhu, C.; Wang, M. Remote sensing image change detection based on swin transformer and cross-attention mechanism. Earth Sci. Inform. 2024, 18, 106. [Google Scholar] [CrossRef]
  20. Zhu, D.; Huang, X.; Huang, H.; Shao, Z.; Cheng, Q. ChangeViT: Unleashing Plain Vision Transformers for Change Detection. arXiv 2024, arXiv:2406.12847. [Google Scholar]
  21. Chen, H.; Song, J.; Han, C.; Xia, J.; Yokoya, N. ChangeMamba: Remote Sensing Change Detection with Spatiotemporal State Space Model. IEEE Trans. Geosci. Remote Sens. 2024, 62, 4409720. [Google Scholar] [CrossRef]
  22. Zhang, H.; Chen, K.; Liu, C.; Chen, H.; Zou, Z.; Shi, Z. CDMamba: Incorporating Local Clues into Mamba for Remote Sensing Image Binary Change Detection. IEEE Trans. Geosci. Remote Sens. 2025, 63, 4405016. [Google Scholar] [CrossRef]
  23. Wu, Z.; Ma, X.; Lian, R.; Zheng, K.; Ma, M.; Zhang, W.; Song, S. CD-Lamba: Boosting Remote Sensing Change Detection via a Cross-Temporal Locally Adaptive State Space Model. arXiv 2025, arXiv:2501.15455. [Google Scholar] [CrossRef]
  24. Kirillov, A.; Mintun, E.; Ravi, N.; Mao, H.; Rolland, C.; Gustafson, L.; Xiao, T.; Whitehead, S.; Berg, A.C.; Lo, W.-Y.; et al. Segment Anything. In Proceedings of the 2023 IEEE/CVF International Conference on Computer Vision (ICCV), Paris, France, 1–6 October 2023; pp. 3992–4003. [Google Scholar]
  25. Radford, A.; Kim, J.W.; Hallacy, C.; Ramesh, A.; Goh, G.; Agarwal, S.; Sastry, G.; Askell, A.; Mishkin, P.; Clark, J.; et al. Learning Transferable Visual Models From Natural Language Supervision. In Proceedings of the International Conference on Machine Learning, Virtual, 18–24 July 2021; pp. 8748–8763. [Google Scholar]
  26. Caron, M.; Touvron, H.; Misra, I.; Jegou, H.; Mairal, J.; Bojanowski, P.; Joulin, A. Emerging Properties in Self-Supervised Vision Transformers. In Proceedings of the 2021 IEEE/CVF International Conference on Computer Vision (ICCV), Montreal, QC, Canada, 10–17 October 2021; pp. 9630–9640. [Google Scholar]
  27. Tan, X.; Chen, G.; Wang, T.; Wang, J.; Zhang, X. Segment Change Model (SCM) for Unsupervised Change Detection in VHR Remote Sensing Images: A Case Study of Buildings. In Proceedings of the IGARSS 2024—2024 IEEE International Geoscience and Remote Sensing Symposium, Athens, Greece, 7–12 July 2024; pp. 8577–8580. [Google Scholar]
  28. Qin, Y.; Chen, J.; Wang, C.; Pan, C. BiSAM-CD: Zero-Shot Remote Sensing Change Detection via Bidirectional Temporal Memory in SAM2. IEEE Trans. Geosci. Remote Sens. 2025, 63, 4417812. [Google Scholar] [CrossRef]
  29. Li, K.; Cao, X.; Deng, Y.; Pang, C.; Xin, Z.; Meng, D.; Wang, Z. DynamicEarth: How Far are We from Open-Vocabulary Change Detection? arXiv 2025, arXiv:2501.12931. [Google Scholar]
  30. Xu, N.; Price, B.; Cohen, S.; Yang, J.; Huang, T. Deep Interactive Object Selection. In Proceedings of the 2016 IEEE Conference on Computer Vision and Pattern Recognition (CVPR), Las Vegas, NV, USA, 27–30 June 2016; pp. 373–381. [Google Scholar]
  31. Sofiiuk, K.; Petrov, I.; Barinova, O.; Konushin, A. f-BRS: Rethinking Backpropagating Refinement for Interactive Segmentation. In Proceedings of the 2020 IEEE/CVF Conference on Computer Vision and Pattern Recognition (CVPR), Seattle, WA, USA, 13–19 June 2020; pp. 8620–8629. [Google Scholar]
  32. Lin, Z.; Zhang, Z.; Chen, L.-Z.; Cheng, M.-M.; Lu, S.-P. Interactive Image Segmentation with First Click Attention. In Proceedings of the 2020 IEEE/CVF Conference on Computer Vision and Pattern Recognition (CVPR), Seattle, WA, USA, 13–19 June 2020; pp. 13336–13345. [Google Scholar]
  33. Sofiiuk, K.; Petrov, I.A.; Konushin, A. Reviving Iterative Training with Mask Guidance for Interactive Segmentation. In Proceedings of the 2022 IEEE International Conference on Image Processing (ICIP), Bordeaux, France, 16–19 October 2022; pp. 3141–3145. [Google Scholar]
  34. Liu, Q.; Zheng, M.; Planche, B.; Karanam, S.; Chen, T.; Niethammer, M.; Wu, Z. PseudoClick: Interactive Image Segmentation with Click Imitation. In Proceedings of the 2022 European Conference on Computer Vision (ECCV), Tel Aviv, Israel, 23–27 October 2022; pp. 728–745. [Google Scholar]
  35. Chen, X.; Zhao, Z.; Zhang, Y.; Duan, M.; Qi, D.; Zhao, H. FocalClick: Towards Practical Interactive Image Segmentation. In Proceedings of the 2022 IEEE/CVF Conference on Computer Vision and Pattern Recognition (CVPR), New Orleans, LA, USA, 18–24 June 2022; pp. 1290–1299. [Google Scholar]
  36. Liu, Q.; Xu, Z.; Bertasius, G.; Niethammer, M. SimpleClick: Interactive Image Segmentation with Simple Vision Transformers. In Proceedings of the 2023 IEEE/CVF International Conference on Computer Vision (ICCV), Paris, France, 1–6 October 2023; pp. 22233–22243. [Google Scholar]
  37. Jiang, Z.; Zhou, X.; Cao, W.; Sun, Z.; Wu, C. ICD: VHR-Oriented Interactive Change-Detection Algorithm. ISPRS Int. J. Geo-Inf. 2022, 11, 503. [Google Scholar] [CrossRef]
  38. Wang, Z.; Xu, M.; Wang, Z.; Guo, Q.; Zhang, Q. ScribbleCDNet: Change detection on high-resolution remote sensing imagery with scribble interaction. Int. J. Appl. Earth Obs. Geoinf. 2024, 128, 103761. [Google Scholar] [CrossRef]
  39. Chen, X.; Cheung, Y.S.J.; Lim, S.-N.; Zhao, H. ScribbleSeg: Scribble-based Interactive Image Segmentation. arXiv 2023, arXiv:2303.11320. [Google Scholar]
  40. Xu, N.; Price, B.; Cohen, S.; Yang, J.; Huang, T. Deep GrabCut for Object Selection. arXiv 2017, arXiv:1707.00243. [Google Scholar] [CrossRef]
  41. Wang, J.; Sun, K.; Cheng, T.; Jiang, B.; Deng, C.; Zhao, Y. Deep High-Resolution Representation Learning for Visual Recognition. IEEE Trans. Pattern Anal. Mach. Intell. 2021, 43, 3349–3364. [Google Scholar] [CrossRef]
  42. Yuan, Y.; Chen, X.; Wang, J. Object-Contextual Representations for Semantic Segmentation. In Proceedings of the 2020 European Conference on Computer Vision (ECCV), Glasgow, UK, 23–28 August 2020; pp. 173–190. [Google Scholar]
  43. Suzuki, S.; Abe, K. Topological structural analysis of digitized binary images by border following. Comput. Vis. Graph. Image Process. 1985, 30, 32–46. [Google Scholar] [CrossRef]
  44. Zhang, T.Y.; Suen, C.Y. A fast parallel algorithm for thinning digital patterns. Commun. ACM 1984, 27, 236–239. [Google Scholar] [CrossRef]
  45. Wang, Q.; Wu, B.; Zhu, P.; Li, P.; Zuo, W.; Hu, Q. ECA-Net: Efficient Channel Attention for Deep Convolutional Neural Networks. In Proceedings of the 2020 IEEE/CVF Conference on Computer Vision and Pattern Recognition (CVPR), Seattle, WA, USA, 13–19 June 2020; pp. 11531–11539. [Google Scholar]
  46. Sofiiuk, K.; Barinova, O.; Konushin, A. AdaptIS: Adaptive Instance Selection Network. In Proceedings of the 2019 IEEE/CVF International Conference on Computer Vision (ICCV), Seoul, Republic of Korea, 27 October–2 November 2019; pp. 7354–7362. [Google Scholar]
  47. Ji, S.; Wei, S.; Lu, M. Fully Convolutional Networks for Multisource Building Extraction From an Open Aerial and Satellite Imagery Data Set. IEEE Trans. Geosci. Remote Sens. 2019, 57, 574–586. [Google Scholar] [CrossRef]
  48. Liu, M.; Chai, Z.; Deng, H.; Liu, R. A CNN-Transformer Network With Multiscale Context Aggregation for Fine-Grained Cropland Change Detection. IEEE J. Sel. Top. Appl. Earth Obs. Remote Sens. 2022, 15, 4297–4306. [Google Scholar] [CrossRef]
  49. He, K.; Zhang, X.; Ren, S.; Sun, J. Deep Residual Learning for Image Recognition. In Proceedings of the 2016 IEEE Conference on Computer Vision and Pattern Recognition (CVPR), Las Vegas, NV, USA, 27–30 June 2016; pp. 770–778. [Google Scholar]
  50. Dosovitskiy, A.; Beyer, L.; Kolesnikov, A.; Weissenborn, D.; Zhai, X.; Unterthiner, T.; Dehghani, M.; Minderer, M.; Heigold, G.; Gelly, S.; et al. An image is worth 16x16 words: Transformers for image recognition at scale. arXiv 2020, arXiv:2010.11929. [Google Scholar]
Figure 1. Overall architecture of RSICDNet.
Remotesensing 18 00204 g001
Figure 2. Examples of click-based interaction and regional scribble interaction (Green point and region denote the positive interactions).
Remotesensing 18 00204 g002
Figure 3. Illustration of the Contour-Skeleton Extractor (CSE).
Remotesensing 18 00204 g003
Figure 4. Structure of the downsampling module.
Remotesensing 18 00204 g004
Figure 5. Examples of the three shapes of regional scribbles provided by the automated regional scribble generation method (Green regions denote the positive regional scribbles).
Remotesensing 18 00204 g005
Figure 6. Structure of the Interaction Fusion and Refinement Module (IFRM).
Remotesensing 18 00204 g006
Figure 7. Example images of the three datasets.
Remotesensing 18 00204 g007
Figure 8. Visual results of different models on the WHU-CD dataset (Dark red masks denote the CD results; Green points and regions denote the positive interactions; Red points denote the negative interactions. (1) Change scenario with buildings of significant morphological variations; (2) Change scenario where one building’s roof material differs; (3) Change scenario with irregularly shaped buildings).
Remotesensing 18 00204 g008
Figure 9. Visual results of different models on the LEVIR-CD dataset (Dark red masks denote the CD results; Green points and regions denote the positive interactions; Red points and regions denote the negative interactions. (1) Change scenario with occlusion interference; (2) Change scenario with a large, geometrically complex building; (3) Change scenario with densely distributed buildings).
Remotesensing 18 00204 g009
Figure 10. Visual results of different models on the CLCD dataset (Dark red masks denote the CD results; Green points and regions denote the positive interactions; Red points denote the negative interactions. (1) Change scenario from cropland to tree cover; (2) Change scenario from cropland to wasteland; (3) Change scenario from cropland to buildings and roads).
Remotesensing 18 00204 g010
Figure 11. Visual results of the ablation study (Dark red masks denote the CD results; Green points and regions denote the positive interactions. (1) Change scenario with newly constructed buildings; (2) Change scenario with disappeared buildings; (3) Change scenario with complex backgrounds; (4) Change scenario with buildings under construction; (5) Change scenario with a large building; (6) Change scenario with sparsely distributed buildings; (7) Change scenario with complex morphology of the changed areas; (8) Change scenario from cropland to water bodies; (9) Change scenario from cropland to roads).
Remotesensing 18 00204 g011
Figure 12. Feature map visualization results of RSICDNet ((1) Change scenario with one building’s roof material differs; (2) Change scenario with disappeared buildings; (3) Change scenario with irregularly shaped buildings; (4) Change scenario with occlusion interference; (5) Change scenario with a large, geometrically complex building; (6) Change scenario with densely distributed buildings).
Remotesensing 18 00204 g012
Figure 13. GUI of human–computer interactive CD application.
Remotesensing 18 00204 g013
Table 1. Quantitative results of different models.
ModelsWHU-CDLEVIR-CDCLCD
NoI 80   NoI 85   NoI 90   NoI 80   NoI 85   NoI 90   NoI 80   NoI 85   NoI 90  
f-BRS1.541.872.522.334.098.198.6310.5712.62
RITM1.301.441.761.792.535.885.177.229.89
FocalClick1.261.401.831.892.626.135.297.109.38
SimpleClick1.181.311.671.752.596.254.666.528.94
RSICDNet1.151.251.511.451.984.673.425.147.59
Note: The best results are in bold black; denotes that lower values are better.
Table 2. Quantitative results of the ablation study.
ModelsWHU-CDLEVIR-CDCLCD
NoI 80   NoI 85   NoI 90   NoI 80   NoI 85   NoI 90   NoI 80   NoI 85   NoI 90  
Base1.301.471.771.792.505.955.227.209.64
Base + IFRM1.241.391.721.792.435.764.967.139.48
Base + RSI + CSE1.211.311.521.502.024.703.625.247.97
Base + RSI + IFRM1.161.321.591.472.014.853.605.167.69
RSICDNet1.151.251.511.451.984.673.425.147.59
Note: The best results are in bold black; denotes that lower values are better.
Table 3. Quantitative results of different multi-scale kernel combinations for the IFRM (IFRM-(3,5,7,9), IFRM-(3,7,11,15), and IFRM-(3,9,15,21) denote the IFRM with the (3,5,7,9), (3,7,11,15), and (3,9,15,21) kernel combinations, respectively).
Models NoI 80   NoI 85   NoI 90  
RSICDNet w/IFRM-(3,5,7,9)1.181.271.55
RSICDNet w/IFRM-(3,7,11,15)1.151.251.51
RSICDNet w/IFRM-(3,9,15,21)1.171.271.50
Note: The best results are in bold black; denotes that lower values are better.
Table 4. Quantitative Results of Different CSE Designs (CSE-(C + D), CSE-(S + D), CSE-(C + S), and CSE-(C + S + D) denote the CSE without skeletonization, without contour extraction, without dilation, and with all three operations, respectively).
Models NoI 80   NoI 85   NoI 90  
RSICDNet w/CSE-(C + D)1.161.281.56
RSICDNet w/CSE-(S + D)1.171.251.53
RSICDNet w/CSE-(C + S)1.171.291.59
RSICDNet w/CSE-(C + S + D)1.151.251.51
Note: The best results are in bold black; denotes that lower values are better.
Table 5. Quantitative results of RSICDNet and end-to-end models.
ModelsWHU-CDLEVIR-CDCLCD
IoUOAF1IoUOAF1IoUOAF1
STANet73.6198.7384.8078.7098.6188.0847.5294.5864.43
ChangeFormer75.7998.9586.2282.3298.9290.3041.5694.0358.72
ChangeViT89.6699.5794.5584.3999.0591.5463.5496.7777.70
CD-Lamba86.4999.4492.7681.7998.8689.9862.5396.6876.94
RSICDNet (1 Interaction)91.4599.6595.5385.6899.1492.2975.5098.0486.04
Note: The best results are in bold black and all values are reported as percentages (%).
Table 6. Model complexity analysis for different ICD models on the LEVIR-CD dataset.
Models NoI 80   Parameters (M)MACs (G)Inference Time (ms)
f-BRS2.3358.4362.8481.69
RITM1.7930.9516.9765.56
FocalClick1.8930.9717.1569.41
SimpleClick1.7597.0527.8725.26
RSICDNet1.4531.0417.2176.76
Note: The best results are in bold black; denotes that lower values are better.
Disclaimer/Publisher’s Note: The statements, opinions and data contained in all publications are solely those of the individual author(s) and contributor(s) and not of MDPI and/or the editor(s). MDPI and/or the editor(s) disclaim responsibility for any injury to people or property resulting from any ideas, methods, instructions or products referred to in the content.