


Highlights
What are the main findings?
- Observations reveal a larger and more consistent afternoon AOD enhancement over Quetta than Karachi.
- Meteorological spatial associations differed by city and observation period, while annual fine absorbing aerosol regime share increased significantly in both regions.
What are the implications of the main findings?
- Diurnal observations and balanced temporal sampling are important for assessing aerosol variability in contrasting environments.
- Integrating satellite observations, reanalysis meteorology, and available ground measurements provide a practical approach to characterizing aerosol loading and aerosol regimes in sparsely monitored regions.
Abstract
Aerosol properties and effects vary by region because of emission sources, meteorological conditions, topography, elevation, and land–sea interaction. These factors can produce substantial aerosol changes within a day, rendering it important to study the aerosol diurnal behavior. Using available 2015–2025 observations from Quetta and Karachi, this study demonstrates an integrated approach for characterizing diurnal aerosol variability where ground monitoring is limited. The approach combines DSCOVR EPIC aerosol optical depth (AOD) and ultraviolet aerosol index (UVAI), MODIS Ångström exponent (AE), ERA5 meteorology, and Karachi AERONET measurements. Paired representative-scene analysis showed a larger afternoon enhancement over Quetta (ΔAOD = 0.159) than over Karachi (ΔAOD = 0.066). In the GeoDetector analysis, wind speed showed the strongest morning spatial association over Quetta, and multiyear mean annual precipitation the strongest afternoon association. Surface pressure ranked highest in both Karachi periods, closely followed by relative humidity in the Karachi morning. City-specific AE–UVAI models identified four aerosol regimes per city. The models showed a small redistribution toward strongly absorbing regimes in Quetta and a larger coarse-to-fine regime shift in Karachi. Across the nine clustering years, fine–absorbing aerosols increased significantly. These case studies demonstrate how complementary observations and explicit temporal sampling controls can jointly characterize daytime aerosol loading, aerosol regimes, and meteorological spatial associations in sparsely monitored regions.
1. Introduction
Atmospheric aerosols are solid or liquid particles suspended in air. They arise from natural and anthropogenic sources and affect climate, air quality, visibility, clouds, and human health [1,2]. By scattering and absorbing radiation, aerosols alter the Earth’s energy balance; absorbing particles can also heat the atmosphere and modify stability [3,4]. Their abundance and optical properties reflect emissions, transport, chemical transformation, removal, and meteorological conditions. Wind, precipitation, humidity, temperature, circulation, and boundary-layer structure can therefore covary with regional AOD [5,6]. Ground-based observations also show that daytime AOD varies with location and atmospheric conditions, so a single satellite overpass may not represent the full daytime cycle [7]. Accounting for these observed diurnal changes can also affect estimates of aerosol direct radiative effect [8], and EPIC’s repeated daylight observations offer an opportunity to examine this variability at regional scales [9].
Episodic dust storms can rapidly elevate particulate loading in source and downwind regions [10]. Pakistan also experiences substantial particulate pollution associated with traffic, industry, fuel combustion, construction, and mineral dust, while routine ground monitoring remains limited [11]. Satellites provide an important data source to study these pollution episodes on a wider scale. Pakistan-wide satellite analysis has also characterized aerosol variability during winter-fog episodes [12]. Satellite observations are therefore particularly valuable, but their interpretation requires careful treatment of retrieval uncertainty and spatial representativeness.
Quetta and Karachi provide contrasting environments. Quetta is an elevated, arid inland valley surrounded by mountains. Dust-prone surfaces coexist with urban combustion, road dust, heating, and traffic; field measurements and local emission evidence for Quetta document particulate pollution and local anthropogenic contributions [13,14,15]. Karachi is a densely populated coastal megacity affected by traffic, industry, port activity, marine aerosols, and regional dust. Earlier satellite studies describe seasonal and longer-term aerosol variability across Pakistan, including Karachi and Quetta [16,17]. Measurements in Karachi identify contributions from road and soil dust, traffic, industry, sea salt, and absorbing carbonaceous aerosols [18,19,20,21,22]. Comparative evidence on sub-daily column aerosol behavior remains sparse, especially for Quetta.
Satellite remote sensing provides repeated, spatially extensive AOD observations, although retrievals depend on surface reflectance, clouds, viewing geometry, and aerosol assumptions [23]. Ground-based Sun photometry offers an independent column measurement for evaluation. The Aerosol Robotic Network (AERONET) standardizes instruments, calibration, processing, and data distribution across a global network [24,25]. EPIC observations from the Sun–Earth L1 point complement polar-orbiting sensors by sampling the sunlit disk several times per day; published evaluations show both the utility and limitations of its aerosol products [26]. MODIS evaluations over Karachi further show why retrieval coverage, quality screening, and comparison with local AERONET measurements matter when interpreting satellite AOD [27,28].
AOD alone describes column aerosol loading rather than particle identity. The Ångström exponent (AE) reflects the spectral dependence of AOD and offers a qualitative indication of fine- versus coarse-mode dominance, although mixed size distributions complicate fixed cutoffs [29,30,31,32]. The ultraviolet aerosol index (UVAI) is sensitive to ultraviolet-absorbing aerosols but also depends on aerosol-layer height and retrieval conditions [33,34,35]. Kayetha et al. [36] combined AERONET and OMI–MODIS observations to retrieve UV–visible aerosol absorption.
This study aims to demonstrate an integrated observational approach to characterizing daytime aerosol variability in regions with limited ground-based monitoring. Using Quetta and Karachi as contrasting case studies, we combine repeated DSCOVR EPIC observations, MODIS aerosol optical information, ERA5 meteorology, and available Karachi AERONET measurements. The central question is how the magnitude and seasonal persistence of morning–afternoon AOD differences vary between the two regions under standardized daily scene selection and year-balanced paired comparisons. Complementary analyses characterize aerosol-regime distributions and exploratory spatial associations with meteorological variables. This work documents an approach to combining these observations and provides quantitative evidence of daytime aerosol variability in two contrasting, sparsely monitored settings.
2. Materials and Methods
2.1. Study Areas
2.1.1. Quetta
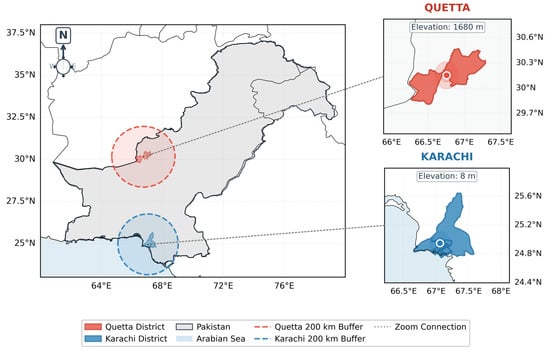
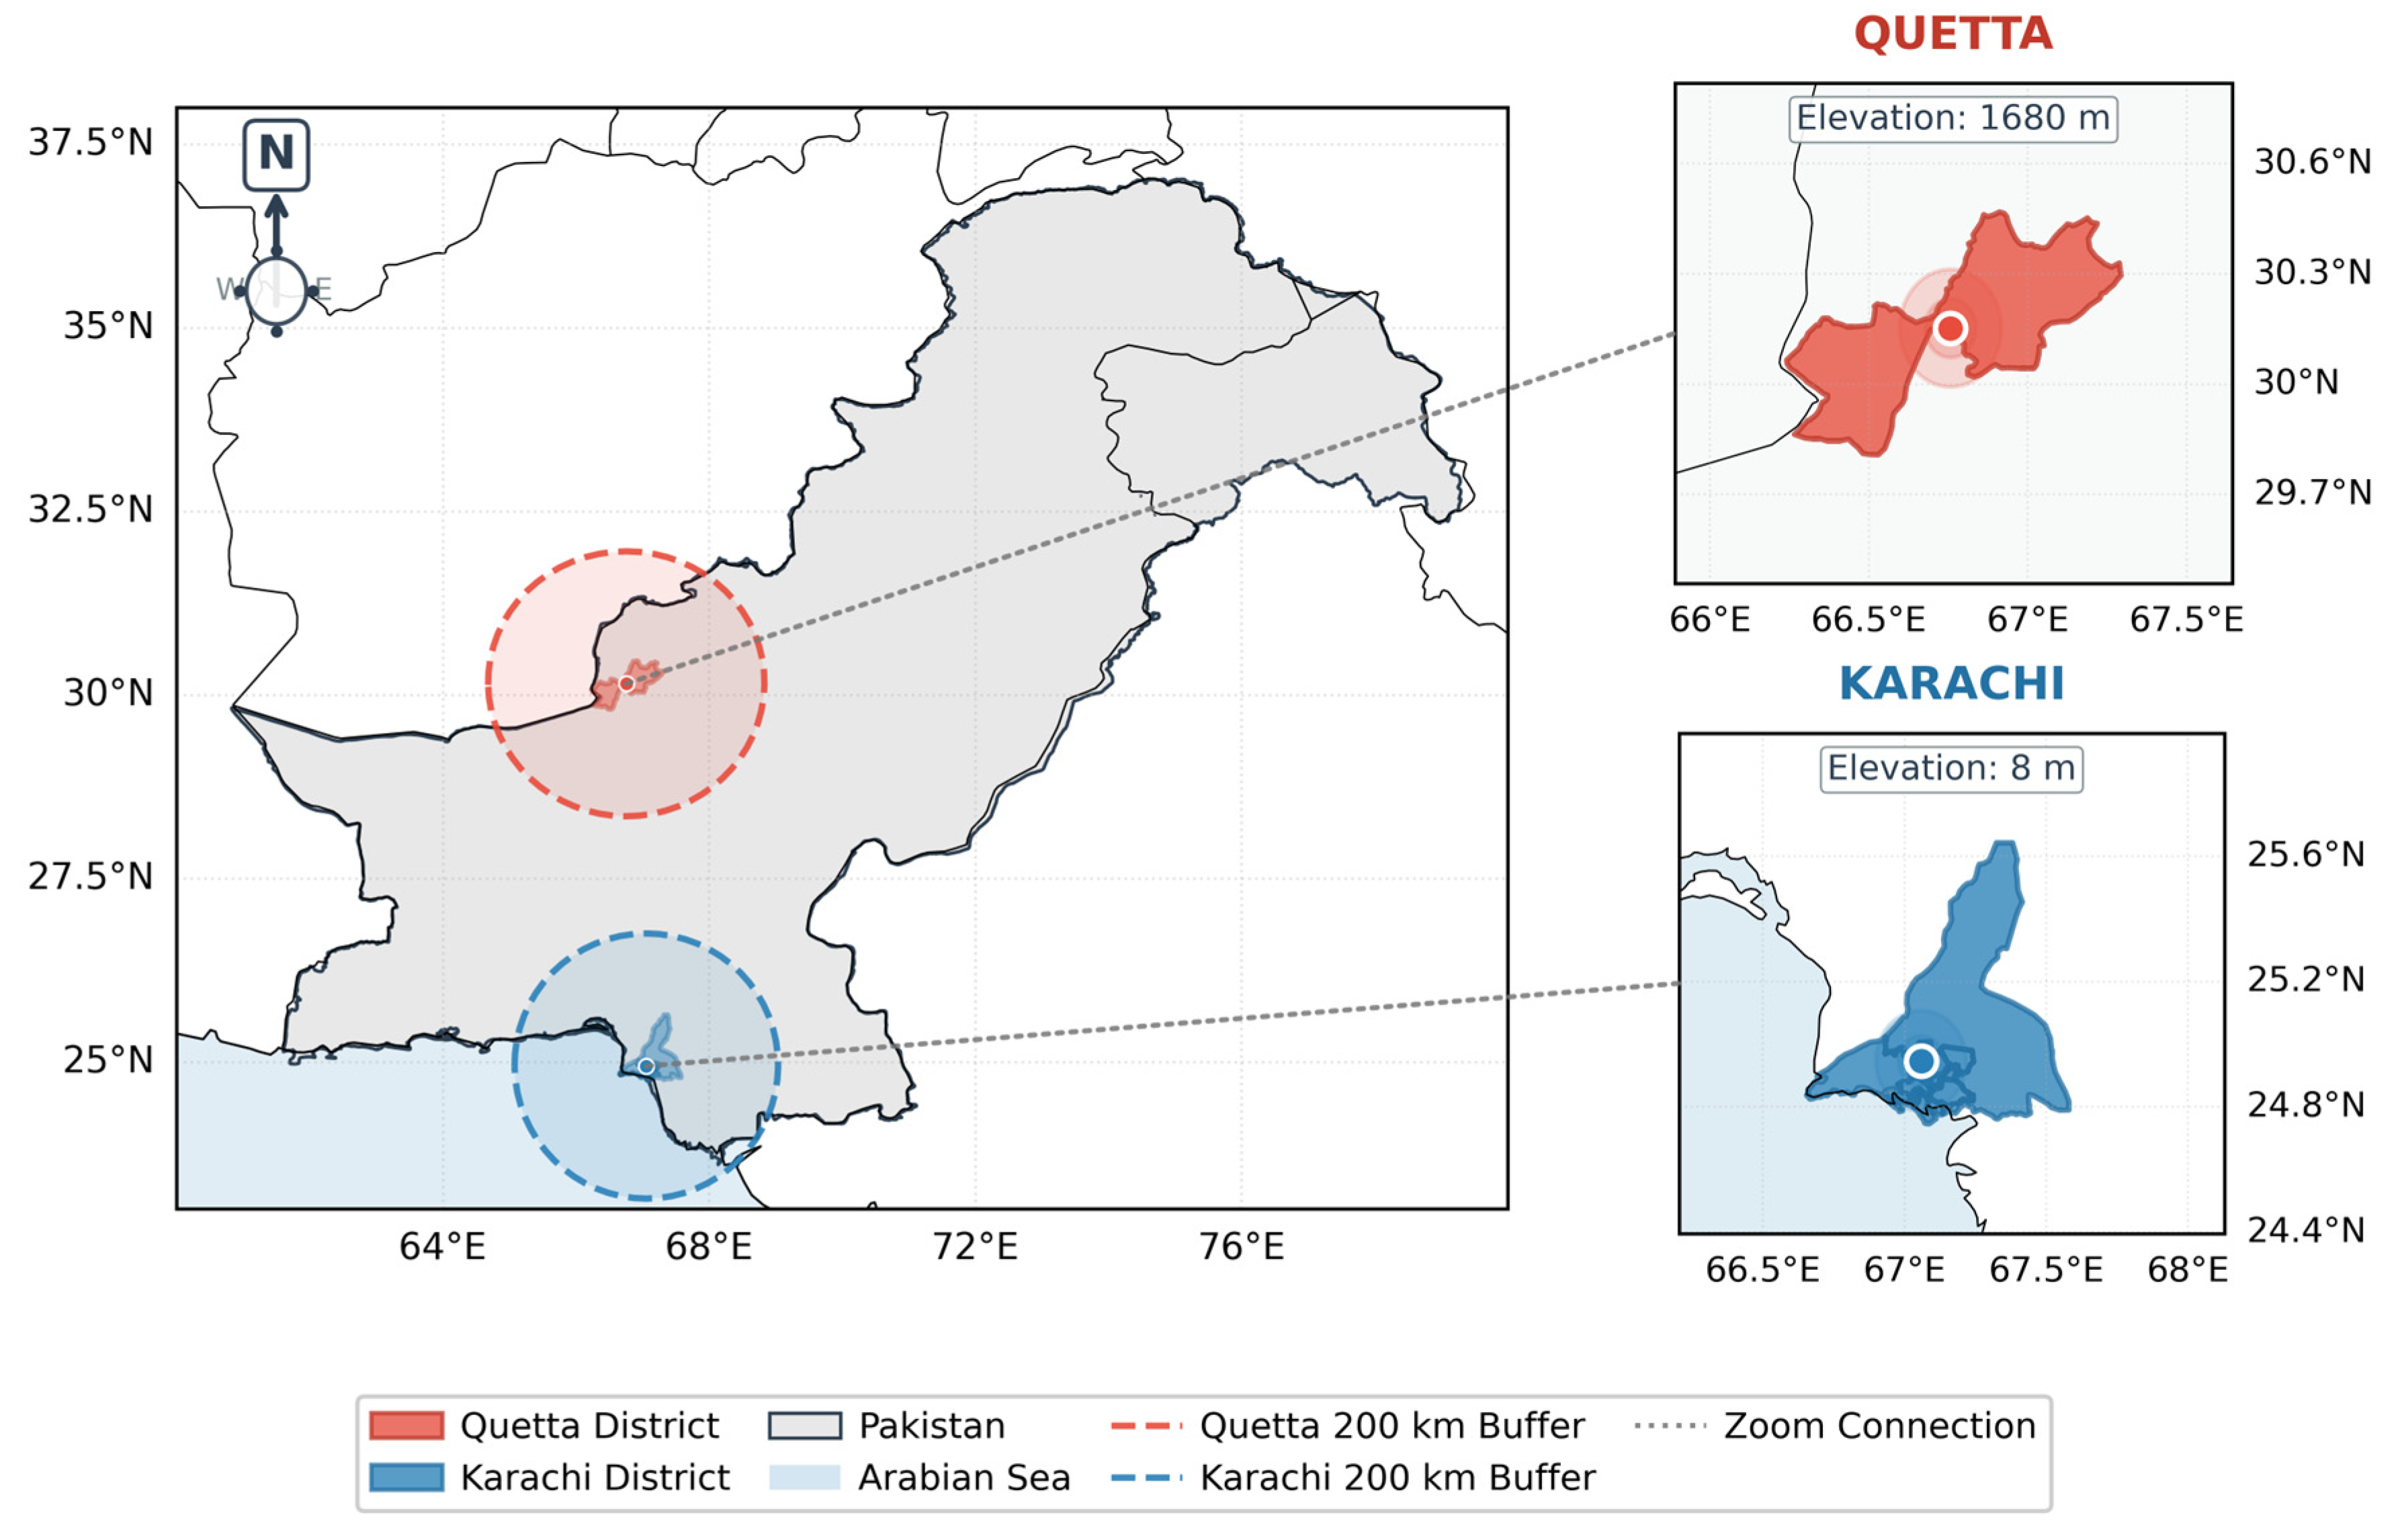
Quetta, the provincial capital of Balochistan, lies in a high-elevation valley at approximately 1680 m above sea level (30.11°N, 67.01°E; Figure 1). The surrounding arid mountains, alluvial surfaces, sparse vegetation, and regional desert systems provide potential mineral-dust sources. Local traffic, unpaved surfaces, domestic heating, and other combustion activities can also contribute to particulate loading; available measurements document both elevated particulate concentrations and local anthropogenic influences [13,14,15]. Accordingly, Quetta is treated here as a complex inland arid environment rather than as a purely natural-dust site.
Figure 1.
Locations of the Quetta and Karachi study regions.
2.1.2. Karachi
Karachi is Pakistan’s largest metropolitan area and its principal industrial and port center. Located on the Arabian Sea coast (approximately 24.86°N, 67.01°E; Figure 1), it is influenced by traffic, industry, port operations, marine aerosols, local dust, and transported mineral dust. Earlier studies report strong seasonal aerosol variability and substantial urban particulate-emission pressures [11,18,19]. The combination of urban emissions, coastal circulation, and regional transport makes Karachi a contrasting coastal setting for the diurnal analysis.
2.2. Datasets
2.2.1. AERONET
AERONET is a federated network of calibrated Sun–sky photometers that provides spectral AOD and inversion products [24,25]. AERONET distributes direct-Sun AOD products as Level 1.0 (unscreened), Level 1.5 (cloud-screened), and Level 2.0 (quality-assured). We used measured 500 nm AOD Version 3 Level 2.0 from the Karachi site (24.945740°N, 67.135940°E).
No suitable AERONET observations were available within or sufficiently close to the Quetta study domain during the analysis period. Consequently, the ground-based validation is restricted to Karachi and should not be interpreted as a direct assessment of EPIC retrieval accuracy over Quetta.
2.2.2. DSCOVR EPIC
The Deep Space Climate Observatory observes the sunlit Earth from near the Sun–Earth L1 point. Its Earth Polychromatic Imaging Camera samples backscattered radiance from the ultraviolet to near-infrared several times per day. We used 500 nm AOD from the Level 2 UV Aerosol Version 3 product (DSCOVR_EPIC_L2_AER_03), whose aerosol retrieval characteristics are described by Ahn et al. [26]. Only pixels having FinalAlgorithmFlags = 0 at 500 nm were retained. We assigned native product pixels within the 200 km study buffers to 10 km UTM grid cells without spatial interpolation; when multiple native pixels occupied the same cell, we used their mean. AOD values were restricted to 0 < AOD < 3. The available archive spans June 2015 to December 2025, with incomplete temporal coverage in 2015 and a substantial observational interruption in 2019.
2.2.3. MODIS
The Moderate Resolution Imaging Spectroradiometer (MODIS) instruments aboard Terra and Aqua acquire near-daily global observations in 36 spectral bands. We used AOD and Deep Blue AE from Collection 6.1 Level 2 products MOD04_L2 (Terra) and MYD04_L2 (Aqua), distributed at a nominal resolution of 10 km. The Deep Blue retrieval and the broader Collection 6 aerosol products are documented in [37,38]. Earlier Deep Blue studies assessed Terra Collection 6 radiometric-calibration improvements and evaluated Collection 6.1 AOD and AE against AERONET [39,40].
2.2.4. ERA5 Reanalysis
ERA5 is the global atmospheric reanalysis produced by the European Centre for Medium-Range Weather Forecasts [41]. Hourly 2 m air temperature (T2M), surface pressure (SP), 10 m wind components, boundary-layer height (BLH), and total column water (TCW) were processed on the 0.25° × 0.25° grid. We additionally used hourly 2 m dew-point temperature to derive relative humidity and hourly total precipitation (PREC) to construct a multiyear mean annual precipitation field. These variables were included in the revised spatial-association analysis. The Quetta domain was 28–32°N, 65–69°E, and the Karachi domain was 23–27°N, 65–69°E.
2.3. Methodology
2.3.1. AERONET Validation
EPIC and AERONET AOD were compared at the common wavelength of 500 nm using the available records from June 2015 through December 2025. For each EPIC acquisition, native pixels were retained if they had QA = 0, their centers lay within a 20 km great-circle radius of the Karachi AERONET station, and their viewing zenith angles were ≤70°. The retained pixels were averaged to obtain one EPIC AOD value per acquisition; at least one valid pixel was required.
AERONET Version 3 Level 2.0 direct-Sun observations were averaged within ±10 min and ±30 min of each EPIC acquisition. The ±10 min window was treated as the primary comparison, whereas ±30 min was retained as a temporal-window sensitivity analysis. Matching was performed using UTC timestamps, with times converted to Pakistan Standard Time (PKT; UTC+5) for reporting.
Evaluation statistics included Pearson R, R2, ordinary least-squares slope and intercept, root-mean-square error (RMSE), mean absolute error (MAE), EPIC-minus-AERONET mean bias, and the proportion of observations within the expected-error criterion ± max (0.10, 0.30 × AODAERONET) adopted from Ahn et al. [26]. Ninety-five percent confidence intervals were estimated using 1000 bootstrap resamples clustered by observation date with a random seed of 42.
2.3.2. Diurnal AOD Aggregation
EPIC acquisition times were converted from UTC to Pakistan Standard Time (PKT; UTC+5). For each acquisition, we calculated a scene-level AOD value as the spatial mean of all valid QA = 0 grid cells within the corresponding 200 km study buffer. We excluded scenes with no valid AOD cells.
To reduce unequal temporal sampling, each date contributed at most one representative morning and one representative afternoon scene to the spatial, annual, monthly, and seasonal analyses. The morning observation was the scene closest to 09:00 PKT within 08:00–10:00 PKT; whereas, the afternoon observation was the scene closest to 13:30 PKT within 12:30–14:30 PKT. For the multiyear maps, representative scenes were first averaged within each year and the available annual maps were then averaged with equal weighting. This prevented years containing more EPIC acquisitions from dominating the multiyear spatial mean.
Because the EPIC record began in June 2015 while 2019 had a major observational interruption, these years were excluded from the multiyear maps and the annual, monthly, and hourly summaries. The included years were therefore 2016–2018 and 2020–2025. They were retained in the seasonal analysis when at least two constituent months were available. December was assigned to the following DJF season–year.
The hourly climatology used all valid scene-level means between 08:00 and 16:59 PKT. The 07:00 and 17:00 observations were excluded because a coverage audit showed markedly lower retrieval success and substantially fewer valid grid cells at these edge hours.
Annual, monthly, and hourly means are presented with the standard error of the contributing scene-level spatial means. The linear regressions shown in the annual and seasonal figures are descriptive and were not used as evidence of statistically significant temporal trends.
Morning–afternoon differences were evaluated using dates for which both representative observations were available. For each paired date, ΔAOD was calculated as afternoon-minus-morning AOD. For the overall comparison, daily differences were averaged within each year, producing nine annual replicates from 2016 to 2018 and 2020 to 2025. Their mean was tested against zero using a two-sided one-sample t-test with a Student’s t-based 95% confidence interval. For the month-specific analysis, paired daily differences were first averaged within each year–month. The resulting 8–9 year–month replicates for each calendar month were tested against zero, and the 12 monthly p-values were adjusted separately within each city using the Benjamini–Hochberg false-discovery-rate procedure [42]. Statistical tests were two-sided and used α = 0.05.
2.3.3. Meteorological Analysis and GeoDetector
For the GeoDetector analysis, the quality-assured EPIC AOD field was retained on its approximately 10 km analysis grid, and continuous ERA5 fields were bilinearly interpolated from the native 0.25° grid to the EPIC grid. On each date, the morning EPIC scene closest to 09:00 PKT within 08:00–10:00 PKT and the afternoon scene closest to 13:30 PKT within 12:30–14:30 PKT were selected independently. ERA5 meteorology was matched to each selected scene’s actual acquisition time using the nearest hourly field within 31 min. Relative humidity was calculated from ERA5 2 m temperature and dew-point temperature on the native ERA5 grid before interpolation; wind speed was calculated from the interpolated 10 m wind components. At each ERA5 precipitation cell, hourly total precipitation was summed to an annual total for each of the nine analysis years, 2016–2018 and 2020–2025. Years with less than 99% valid hourly precipitation at a cell were excluded, and cells were retained in the multiyear precipitation field only when all nine annual totals were available. The mean annual precipitation field, in mm yr−1, was then interpolated to the EPIC grid. It is a fixed spatial climatology for both observation periods, not precipitation occurring during an EPIC overpass.
Morning and afternoon complete-case domains were formed separately: an EPIC cell-date required valid AOD and finite matched values of (T2M), (SP), (TCW), (BLH), (WS), (RH), and mean annual precipitation (PREC). For each city and period, matched observations were averaged within each EPIC cell to form one spatial climatology per variable; cells with fewer than 30 matched dates were excluded. GeoDetector q was calculated as
Here, h identifies a class of the meteorological factor. For a single factor, the three classes are low, medium, and high. Nh is the number of retained EPIC cells in class h, while N is the total number of retained cells for that city and period. σh2 is the variance of cell-mean AOD within class h, and σ2 is the variance across all retained cells. SSW and SST are the within-stratum and total sums of squares, respectively. Thus, q is the proportion of spatial AOD variation between the factor’s classes; a larger q indicates a stronger spatial association [43]. Each continuous predictor was divided into three equal-frequency classes using predictor values alone; the same rule was applied to all factors without selecting class boundaries to maximize q. A single-factor stratum required at least five cells. An interaction was reported only when every nonempty intersection stratum contained at least five cells; otherwise, it was marked NA.
2.3.4. City-Specific Classification of Aerosol Regimes
Aerosol regimes were classified using MODIS Deep Blue Ångström exponent (AE) and DSCOVR EPIC ultraviolet aerosol index (UVAI). Original MOD04_L2 Terra granules supplied the morning observations, and MYD04_L2 Aqua granules supplied the afternoon observations. MODIS pixels were retained when the Deep Blue quality flag was at least 2 and paired AE and AOD values were valid. Granule start times and scan-time information were used to estimate each city overpass time. For each overpass, the closest EPIC observation on the same Pakistan local date was selected if its time differed by no more than 60 min; at most one matched overpass per city and period was retained per day. MODIS AE and AOD were aggregated to approximately 10 km cells, and UVAI from the quality-assured EPIC product was aligned to that grid. Cells were retained when AE and UVAI were valid and 0.10 < MODIS AOD ≤ 3.0. AOD was used for screening only, not as a clustering feature. The regime analysis included 2016–2025, excluding 2019.
A separate K-means model was fitted for each city using its combined morning and afternoon observations. AE and UVAI were standardized, and observation weights gave the two periods equal total influence without discarding valid cells. Candidate cluster counts from four to seven were assessed using the silhouette coefficient and Davies–Bouldin index [44,45]. The automatic selection yielded four clusters for each city; no cluster count was forced. The final models used 30 initializations and a random seed of 42 [46].
Regime names describe the cluster centroids. AE centroids below 0.7 were termed coarse, those from 0.7 to 1.2 mixed-size, and those above 1.2 fine. We applied study-defined UVAI centroid categories of 0.25 to <1 (moderately absorbing), 1 to <2 (absorbing), and ≥2 (highly absorbing). These are descriptive optical-regime labels, not direct measurements of intrinsic absorption or chemical composition. Monthly climatologies were calculated by first obtaining the regime percentage for each observed year and calendar month, then averaging those percentages across available years. Annual percentages were calculated from all valid classified cells within each year. Ordinary least-squares trends used the nine observed annual percentages for each regime; the eight trend p-values within each city were adjusted for false discovery rate [42]. Published AE–UVAI classifications use different instruments and wavelength combinations [36]; their numerical boundaries were therefore not transferred to the present EPIC–MODIS cluster centroids.
3. Results
3.1. Validation of DSCOVR EPIC AOD Against AERONET
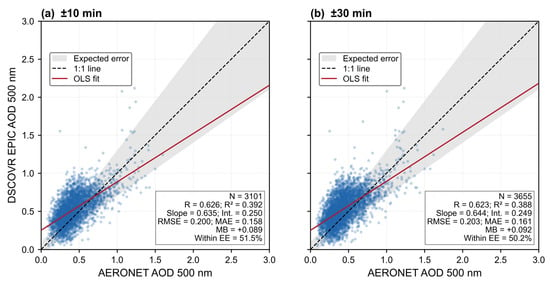
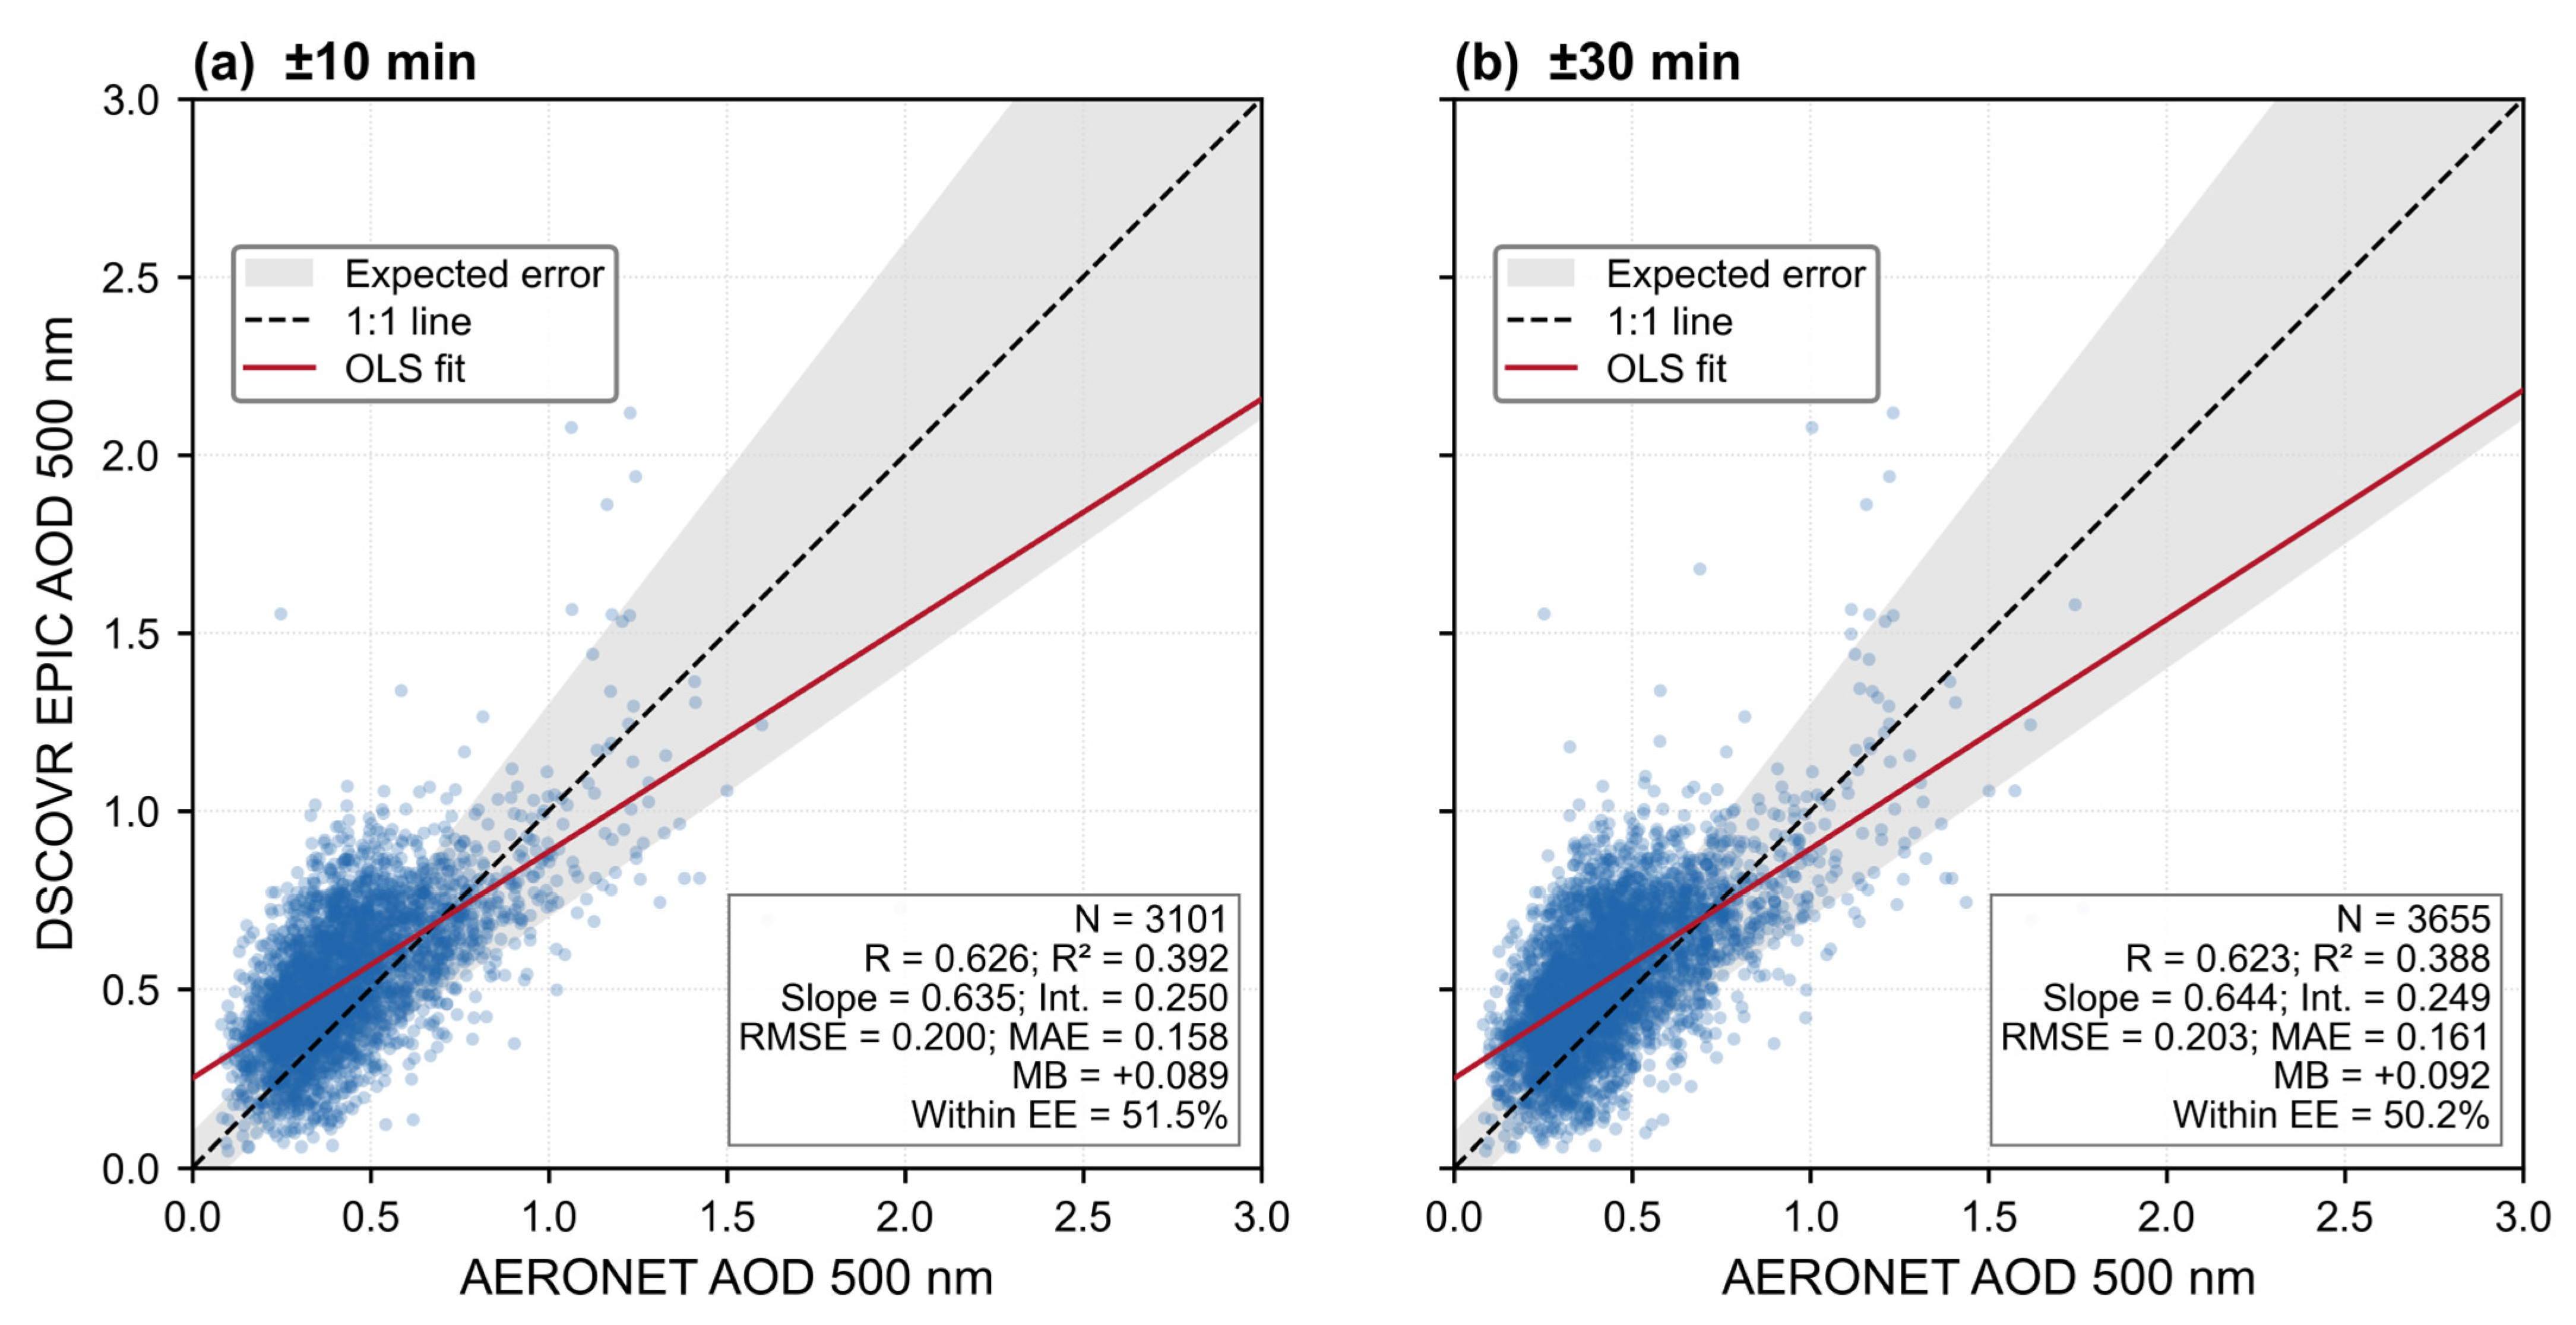
After applying the QA = 0, 20 km spatial, viewing-zenith-angle, and AOD-range criteria, 6097 EPIC acquisitions with valid 500 nm AOD remained over Karachi. The primary ±10 min comparison produced 3101 EPIC–AERONET matchups distributed across 1109 days (R = 0.626; R2 = 0.392; p < 0.001) (Figure 2). The ±30 min sensitivity comparison produced 3655 matchups across 1190 days (R = 0.623; R2 = 0.388; p < 0.001). Widening the temporal window therefore added 554 matchups without materially changing the correlation.
Figure 2.
Quality-controlled comparison of DSCOVR EPIC and Karachi AERONET Version 3 Level 2.0 AOD at 500 nm using (a) ±10 min and (b) ±30 min temporal-collocation windows.
For the ±10 min comparison, the regression slope was 0.635 and the intercept was 0.250. RMSE was 0.200, MAE was 0.158, and mean EPIC-minus-AERONET bias was +0.089. Overall, 51.5% of the matchups satisfied the expected-error criterion. For ±30 min, the slope was 0.644, the intercept was 0.249, RMSE was 0.203, MAE was 0.161, mean bias was +0.092, and 50.2% of the matchups satisfied the expected-error criterion. The two windows consequently showed nearly identical performance, characterized by moderate correspondence, positive EPIC bias, and substantial residual dispersion.
3.2. Diurnal Variability of AOD
3.2.1. Morning and Afternoon Spatial Patterns
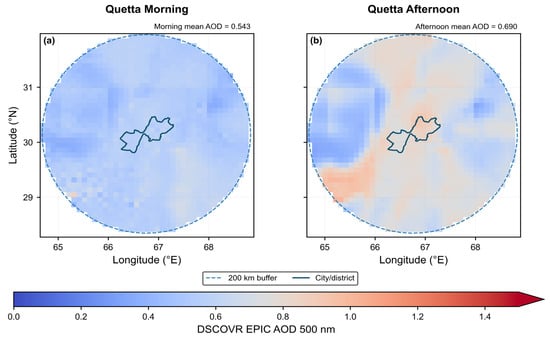
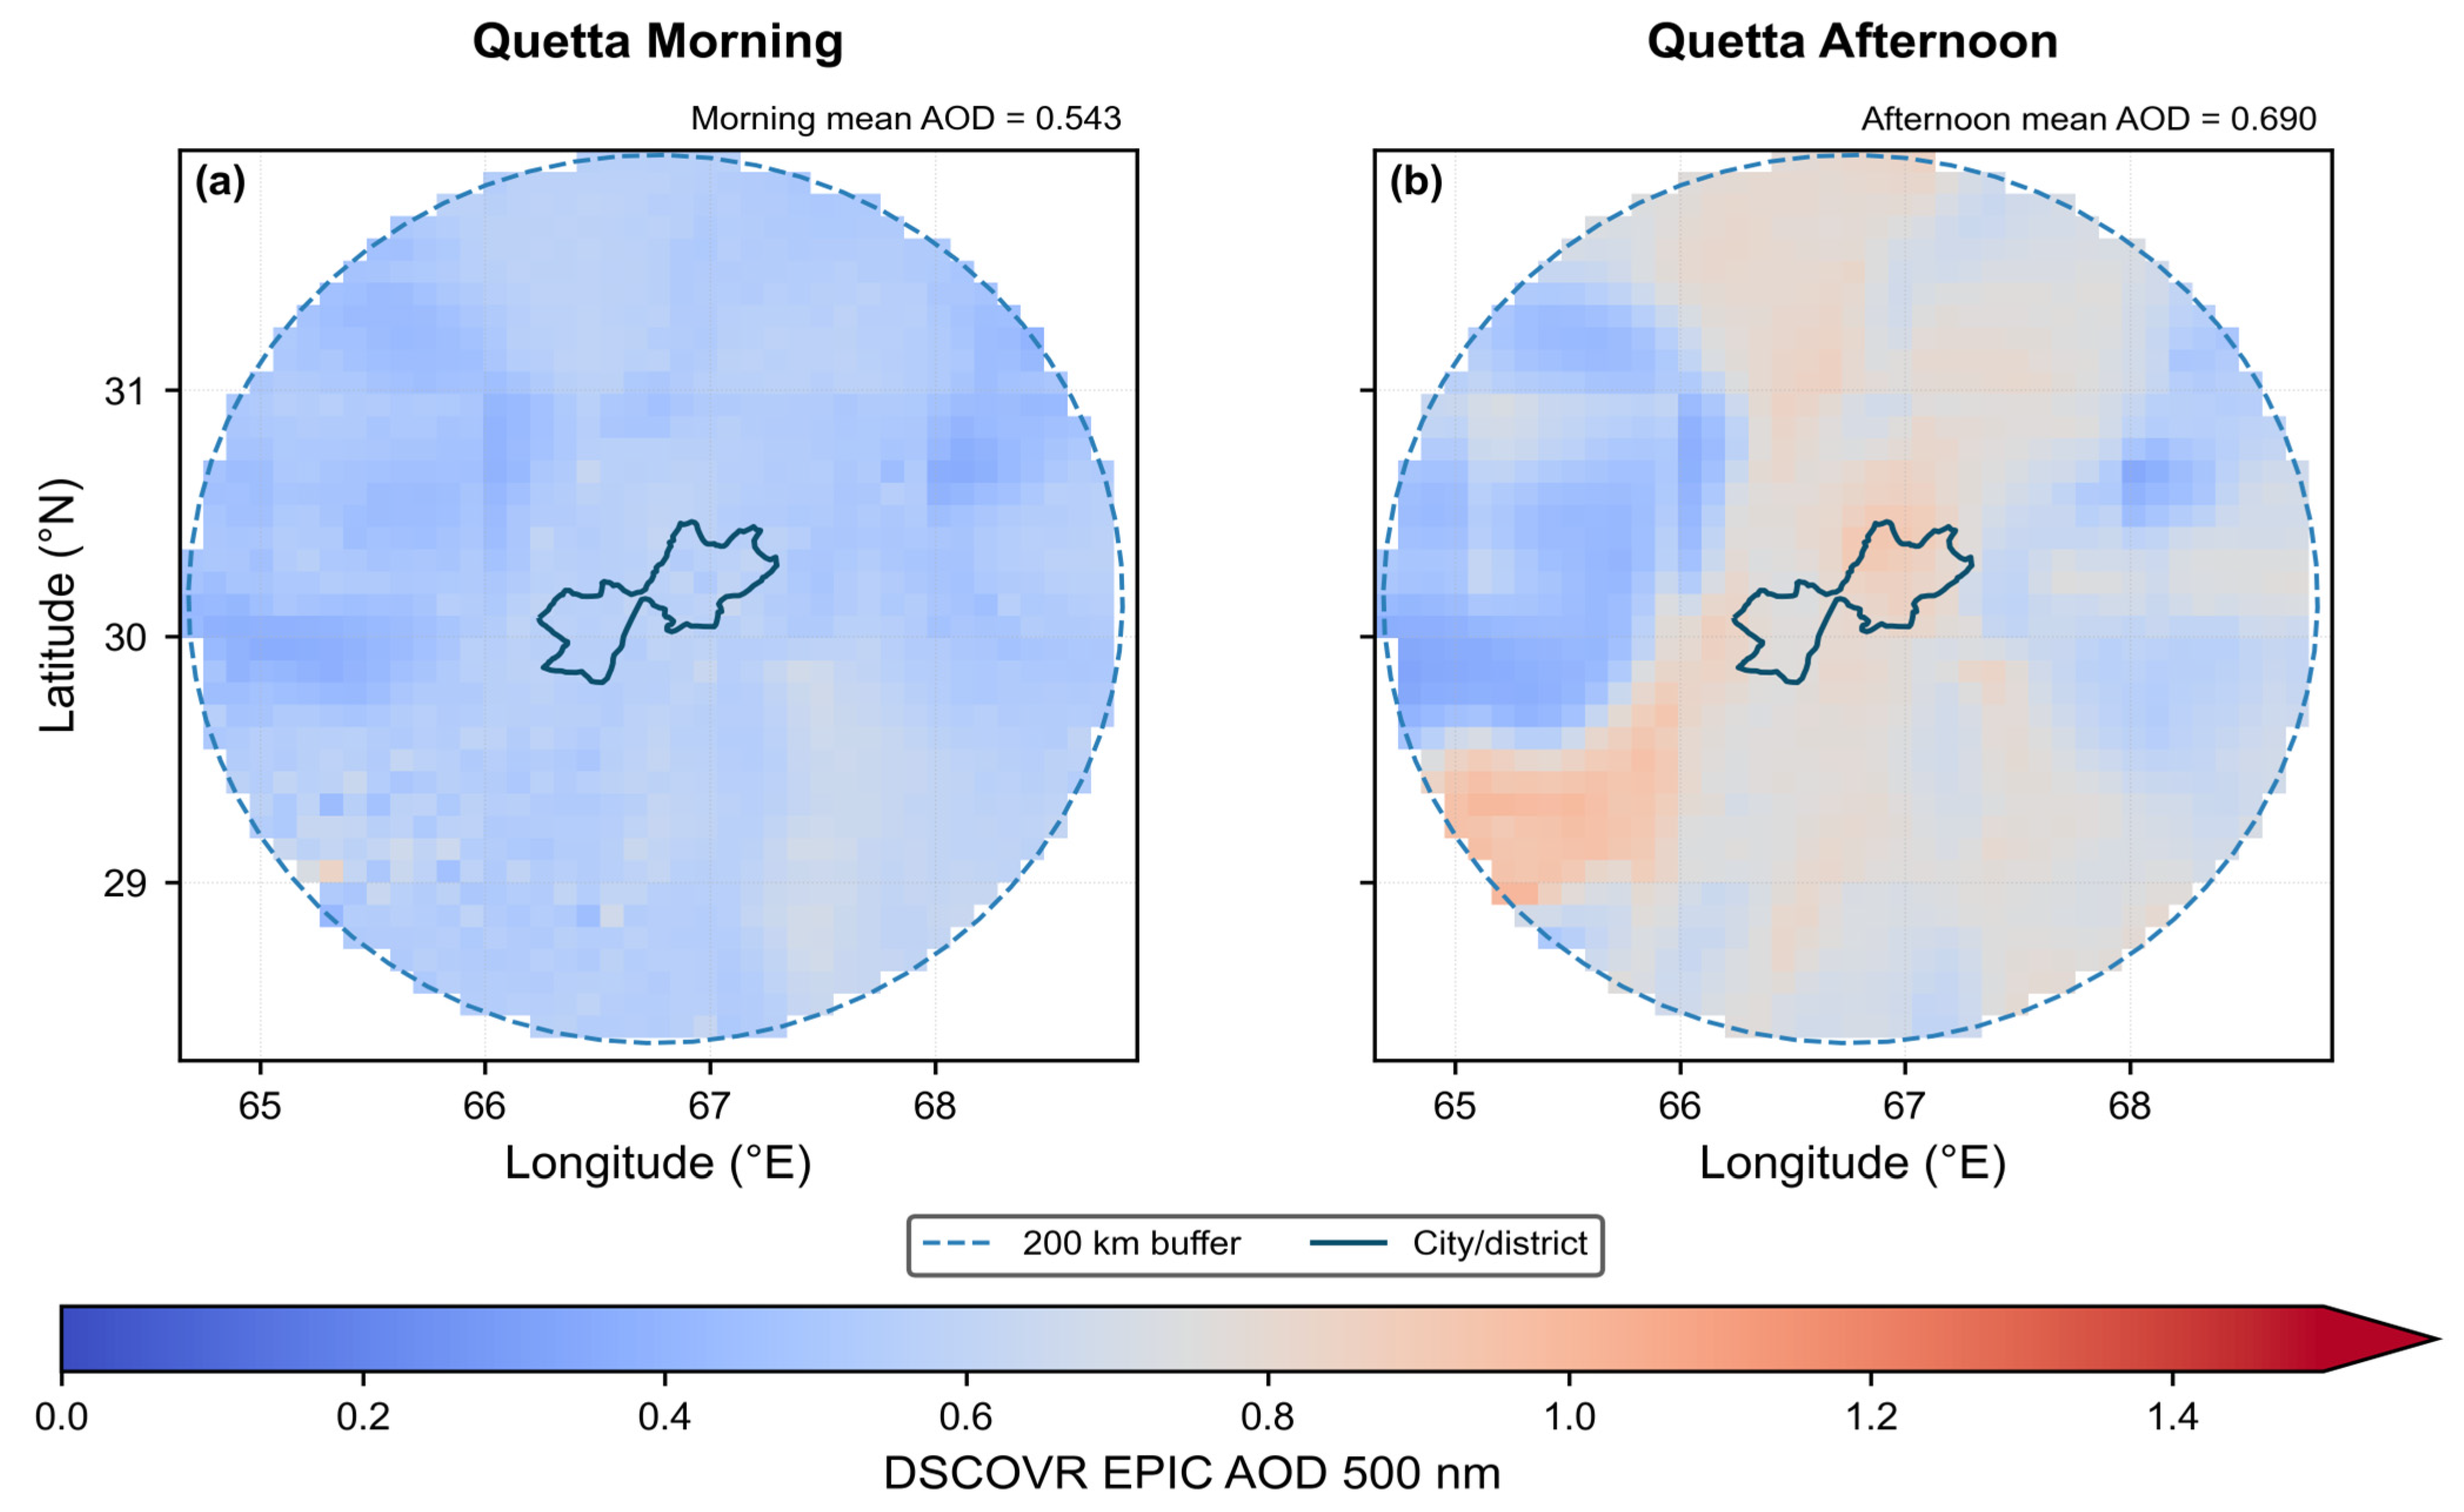
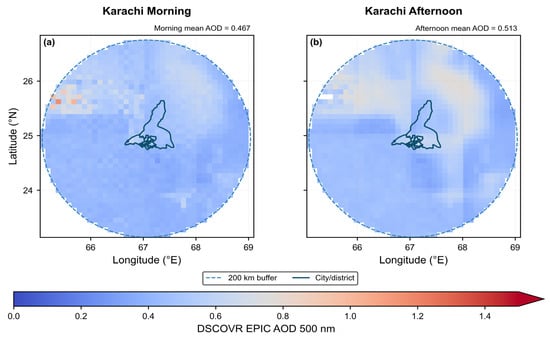
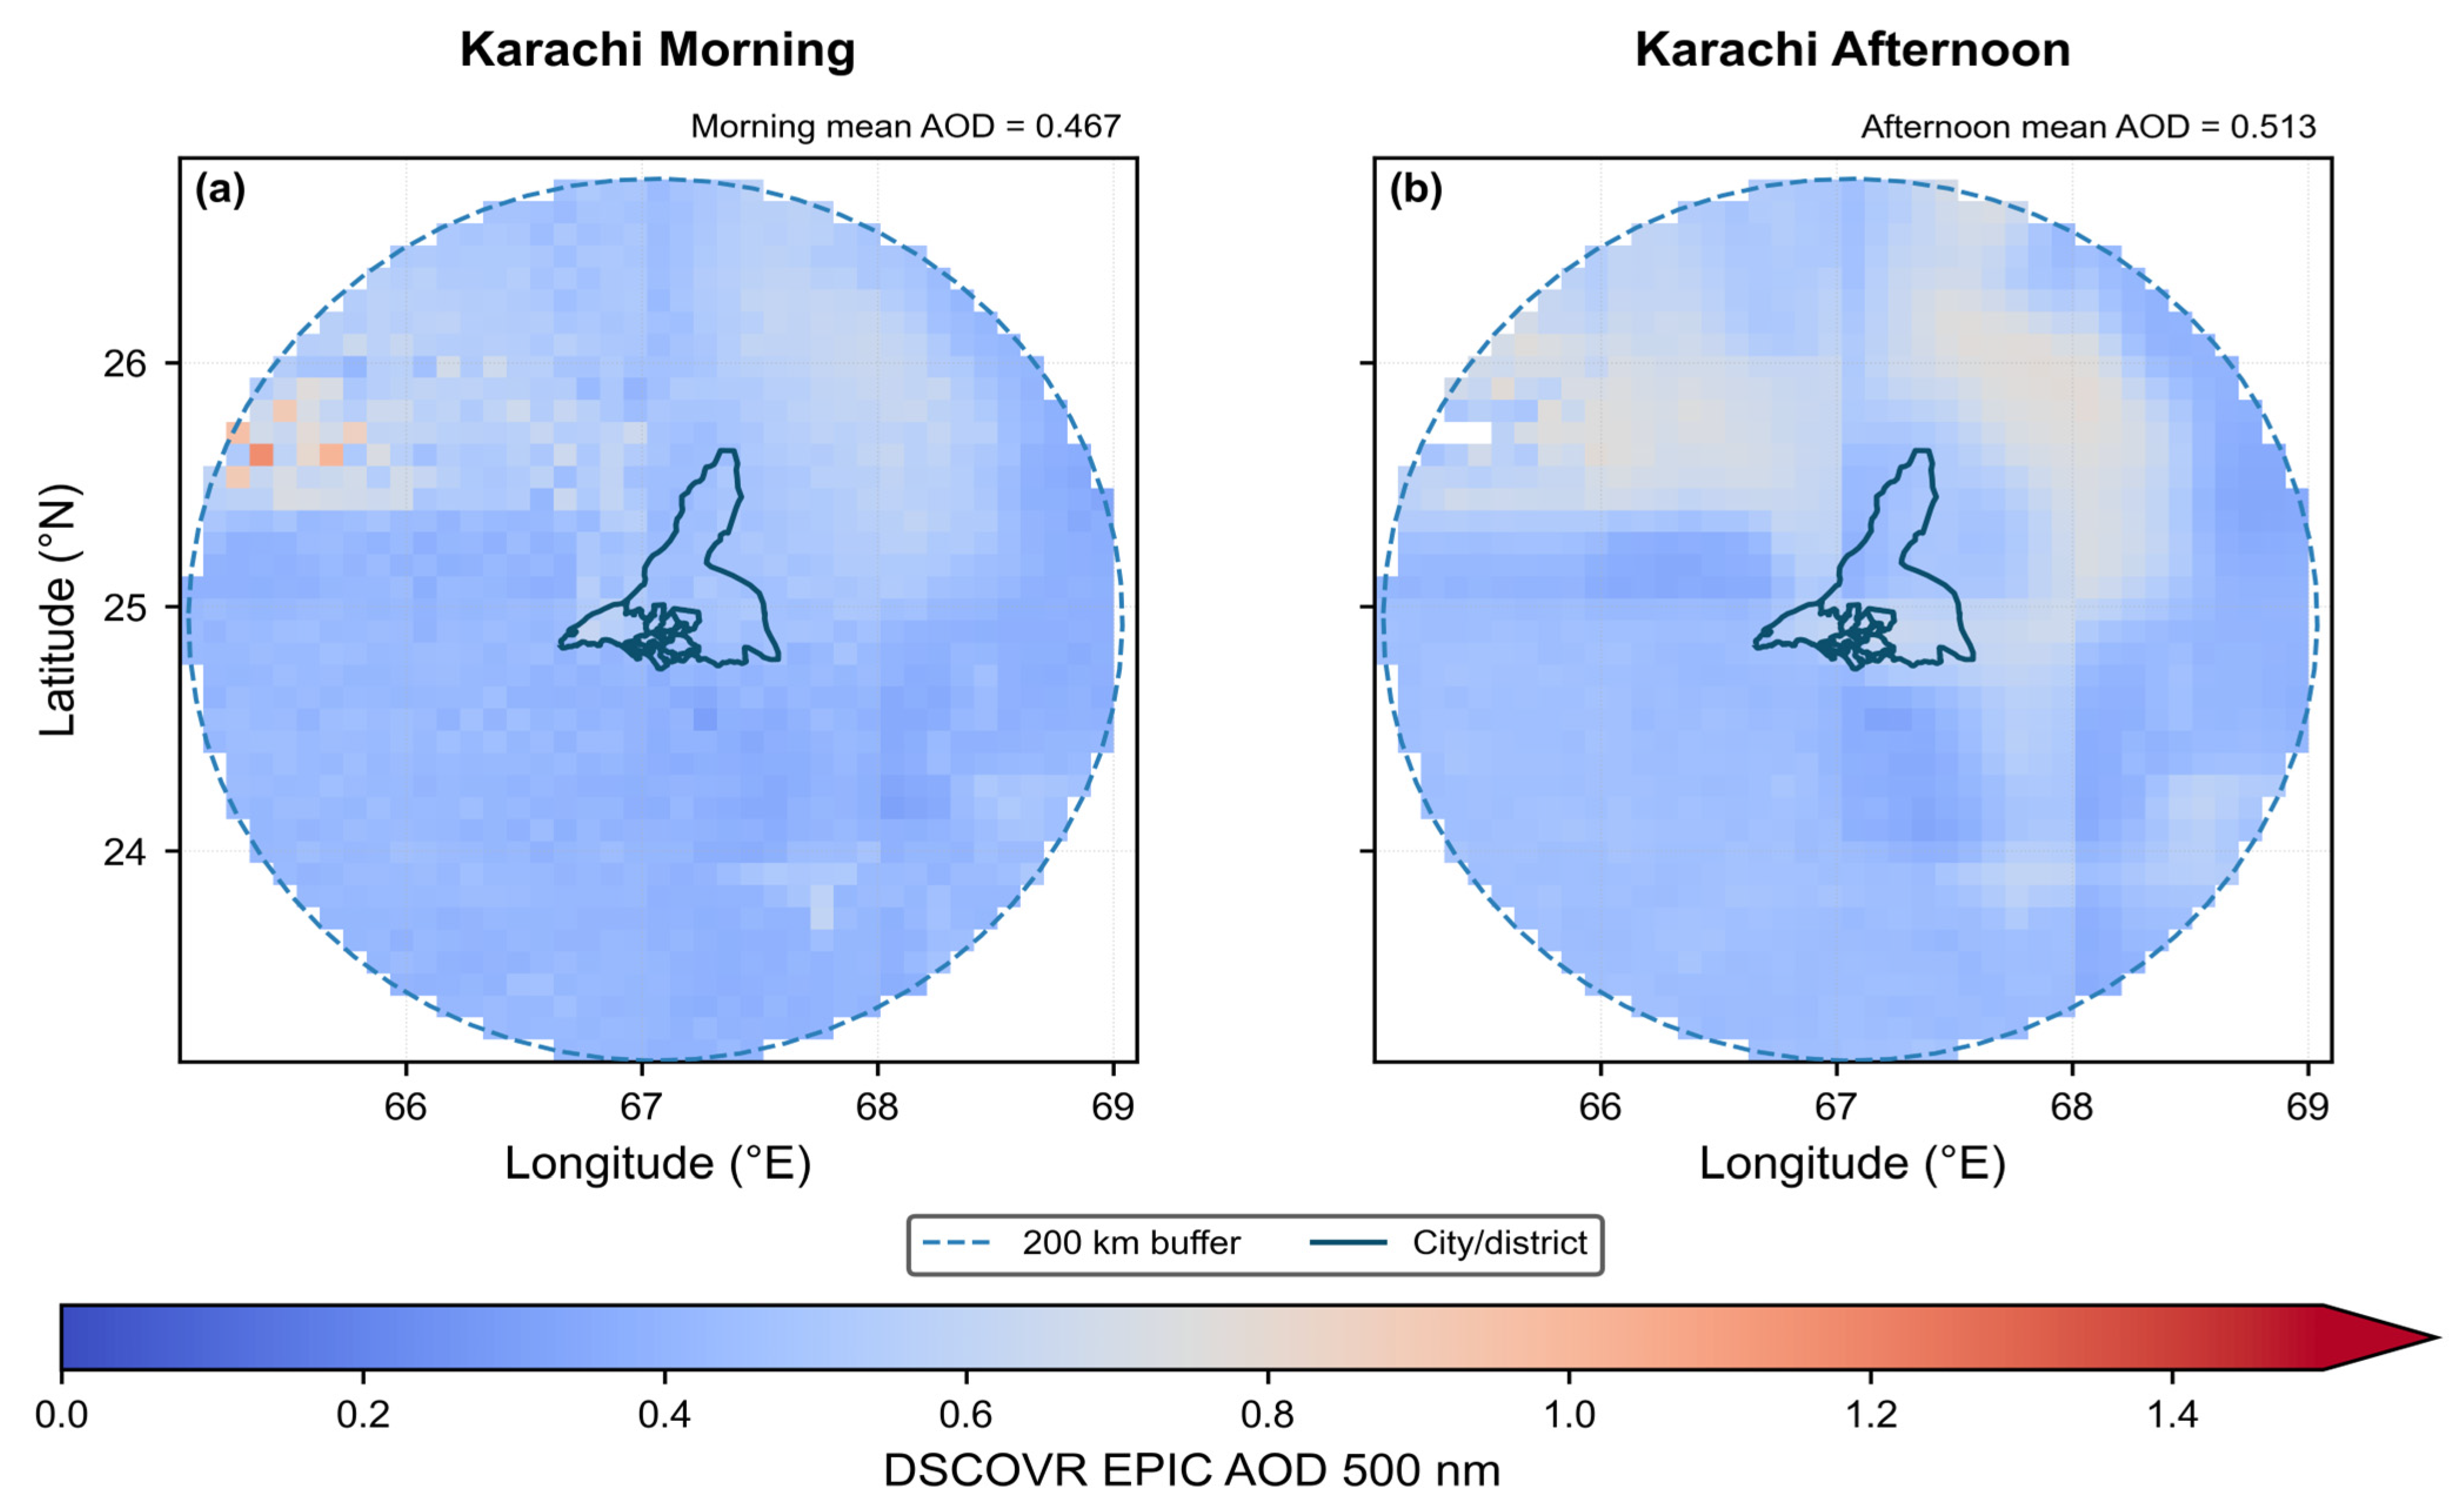
The QA = 0 equal-year composites showed higher afternoon AOD over both study regions, although the contrast was substantially stronger over Quetta (Figure 3 and Figure 4). Mean Quetta AOD increased from 0.543 in the morning to 0.690 in the afternoon, corresponding to an absolute increase of 0.146, or 26.9% relative to the morning mean. Karachi mean AOD increased from 0.467 to 0.513, an absolute increase of 0.046, or 9.8%.
Figure 3.
Equal-year multiyear mean quality-assured DSCOVR EPIC AOD at 500 nm within the 200 km Quetta buffer during (a) morning and (b) afternoon. Morning and afternoon fields were constructed from daily representative scenes closest to 09:00 and 13:30 PKT, respectively. The composite includes 2016–2018 and 2020–2025.
Figure 4.
Equal-year multiyear mean quality-assured DSCOVR EPIC AOD at 500 nm within the 200 km Karachi buffer during (a) morning and (b) afternoon. Morning and afternoon fields were constructed from daily representative scenes closest to 09:00 and 13:30 PKT, respectively. The composite includes 2016–2018 and 2020–2025.
Quetta exhibited a broad afternoon enhancement across much of the 200 km study buffer. Over Karachi, the morning composite contained a localized higher-AOD feature west–northwest of the city, whereas the afternoon distribution was more spatially diffuse.
The Karachi morning and afternoon composite also contains a localized higher-AOD feature toward the west-northwestern part. This feature lies substantially west of the Hub industrial estate near Karachi. These two regions (Karachi and Hub) are highly industrialized and are a source of pollution. These sources combined with the wind transport as may prevail over the region. It is less localized in the afternoon composite (Figure 4b). Because these maps average the available quality-assured observations across nine years, they do not establish that the enhancement persisted on every day or in every year. Seasonal changes in wind direction, regional transport, and dust resuspension could influence AOD in this area.
3.2.2. Annual and Monthly AOD Patterns
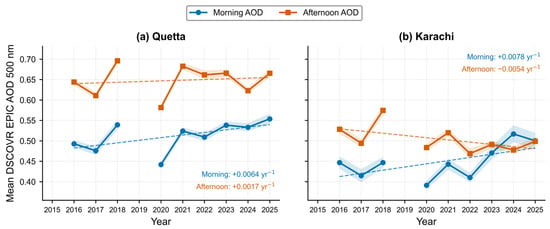
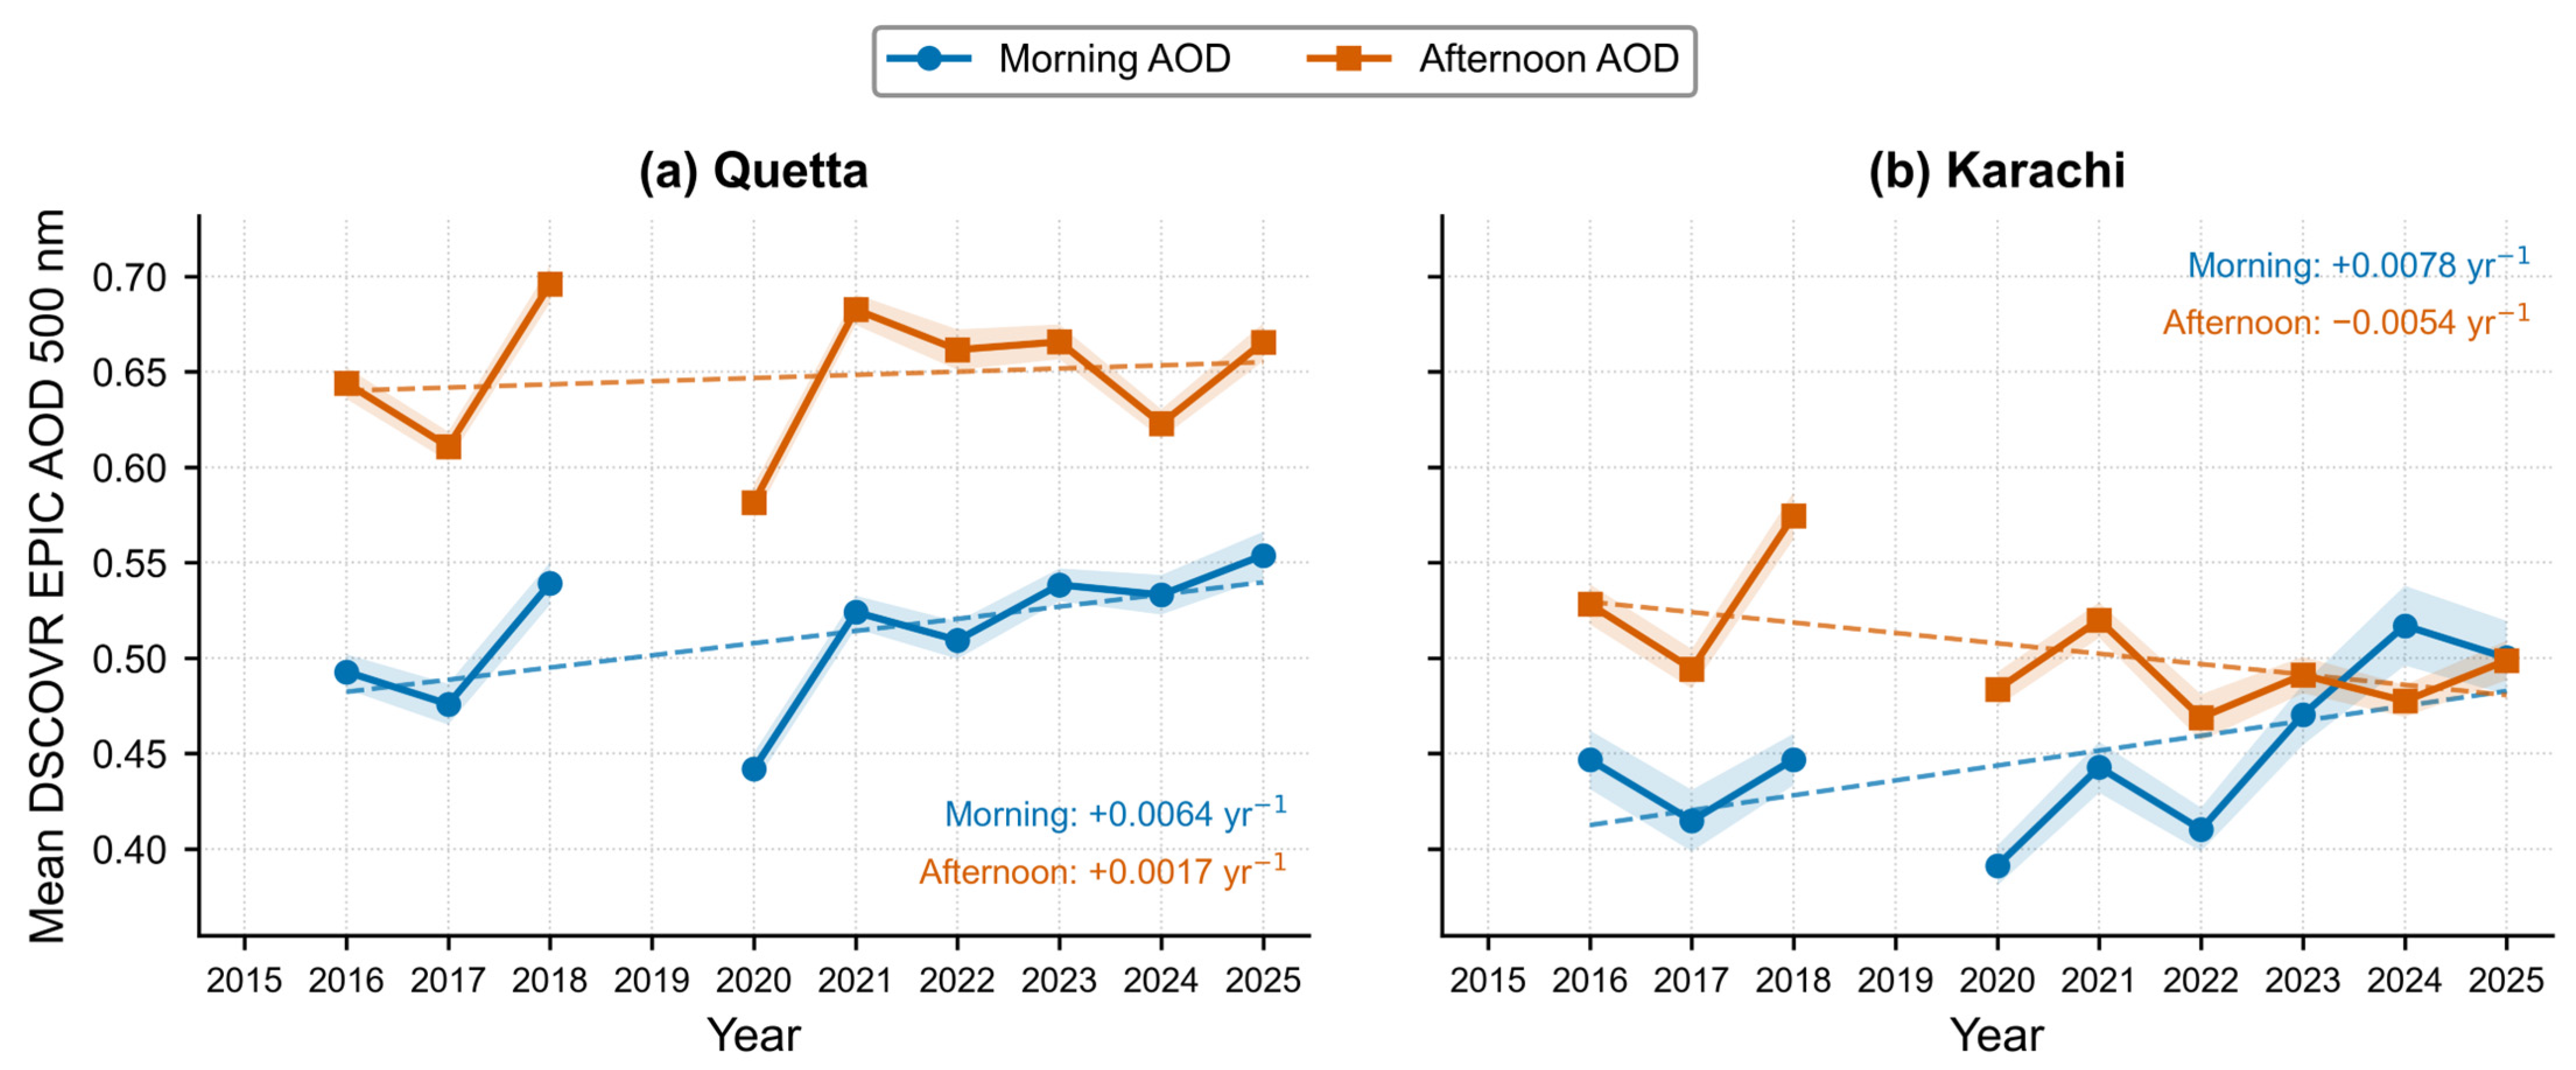
Using one daily representative scene for each period and the nine sufficiently complete years, Quetta mean annual AOD was 0.512 in the morning and 0.648 in the afternoon (Figure 5). Afternoon AOD exceeded morning AOD in all nine years, with annual differences ranging from +0.090 to +0.159. The descriptive linear slopes were +0.0064 AOD yr−1 in the morning and +0.0017 AOD yr−1 in the afternoon. Morning AOD reached its highest annual value in 2025 (0.554), whereas the highest afternoon value occurred in 2018 (0.696). Both periods had their lowest annual means in 2020.
Figure 5.
Annual mean morning and afternoon quality-assured DSCOVR EPIC AOD at 500 nm over (a) Quetta and (b) Karachi during 2016–2018 and 2020–2025. Dashed lines indicate ordinary least-squares linear trends, with slopes (yr−1) annotated in each panel. Shaded bands represent ±1 standard error around the annual means.
Karachi mean annual AOD was 0.449 in the morning and 0.504 in the afternoon. Afternoon AOD was higher in seven of the nine years and slightly lower in 2024 and 2025. The descriptive slopes differed in direction, increasing by +0.0078 AOD yr−1 in the morning and decreasing by −0.0054 AOD yr−1 in the afternoon. The highest morning mean occurred in 2024 (0.517), whereas the highest afternoon mean occurred in 2018 (0.575). These slopes describe the sampled interannual direction and are not interpreted as significant long-term trends.
The same-date, year-balanced analysis confirmed an afternoon enhancement in both regions. Quetta increased from a mean annual paired value of 0.510 in the morning to 0.669 in the afternoon (mean ΔAOD = +0.159; 95% CI: +0.138 to +0.180; p < 0.001; 2407 paired dates). Karachi increased from 0.444 to 0.510 (mean ΔAOD = +0.066; 95% CI: +0.026 to +0.106; p = 0.005; 2385 paired dates). The Karachi enhancement was therefore smaller and less temporally consistent than the Quetta enhancement, but it was not absent.
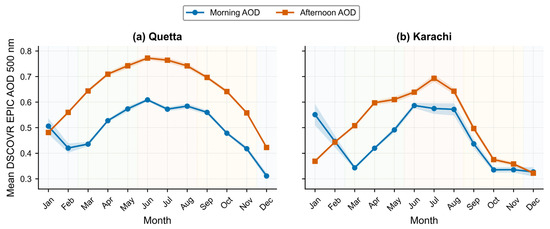
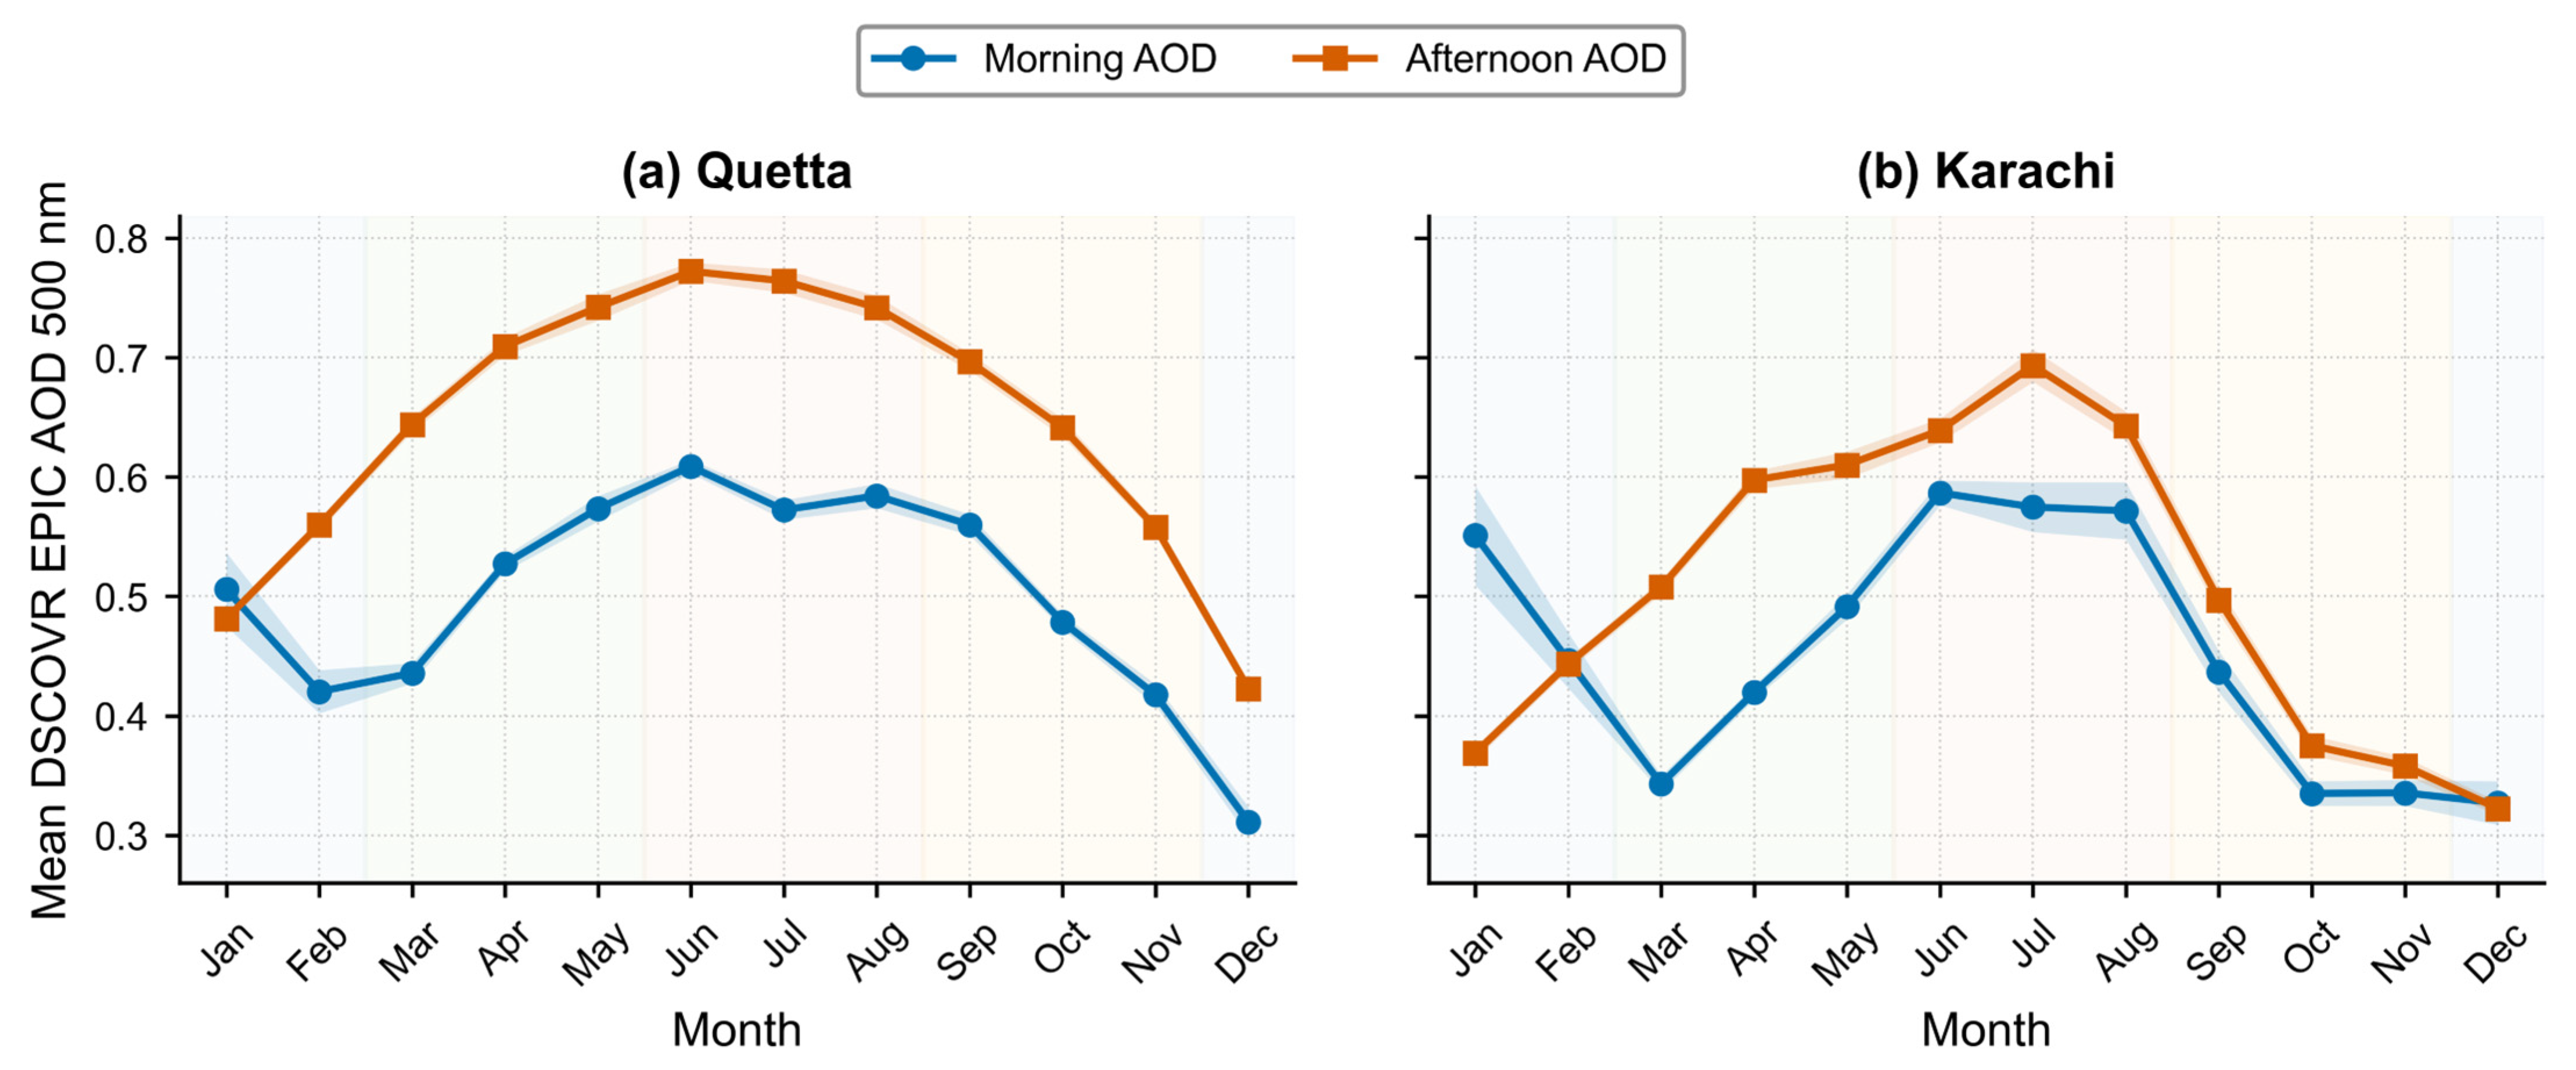
The monthly climatology retained the strong afternoon enhancement in Quetta (Figure 6). Afternoon AOD exceeded morning AOD from February through December, while January showed a small negative descriptive difference. Both periods peaked in June, with morning and afternoon means of 0.609 and 0.772, respectively. The largest descriptive monthly difference occurred in March (+0.208).
Figure 6.
Monthly climatology of morning and afternoon quality-assured DSCOVR EPIC AOD at 500 nm over (a) Quetta and (b) Karachi, calculated from 2016 to 2018 and 2020 to 2025.
Karachi exhibited stronger seasonal changes in the morning–afternoon contrast. Afternoon AOD was higher from March through November, nearly equal to morning AOD in February and December, and lower in January. Morning AOD peaked in June (0.587), whereas afternoon AOD peaked in July (0.694). The largest positive descriptive difference occurred in April (+0.178), while January showed the largest negative difference (−0.182).
The paired month-specific tests produced a clearer distinction between the regions (Table 1). After FDR correction, Quetta afternoon AOD was significantly higher from February through December; January was not significant. Karachi showed significant positive differences from March through July. The remaining Karachi monthly differences did not remain significant after FDR correction, although October was close to the threshold (pFDR = 0.052).
Table 1.
Paired monthly afternoon-minus-morning AOD differences based on year–month mean daily differences.
3.2.3. Seasonal AOD Patterns
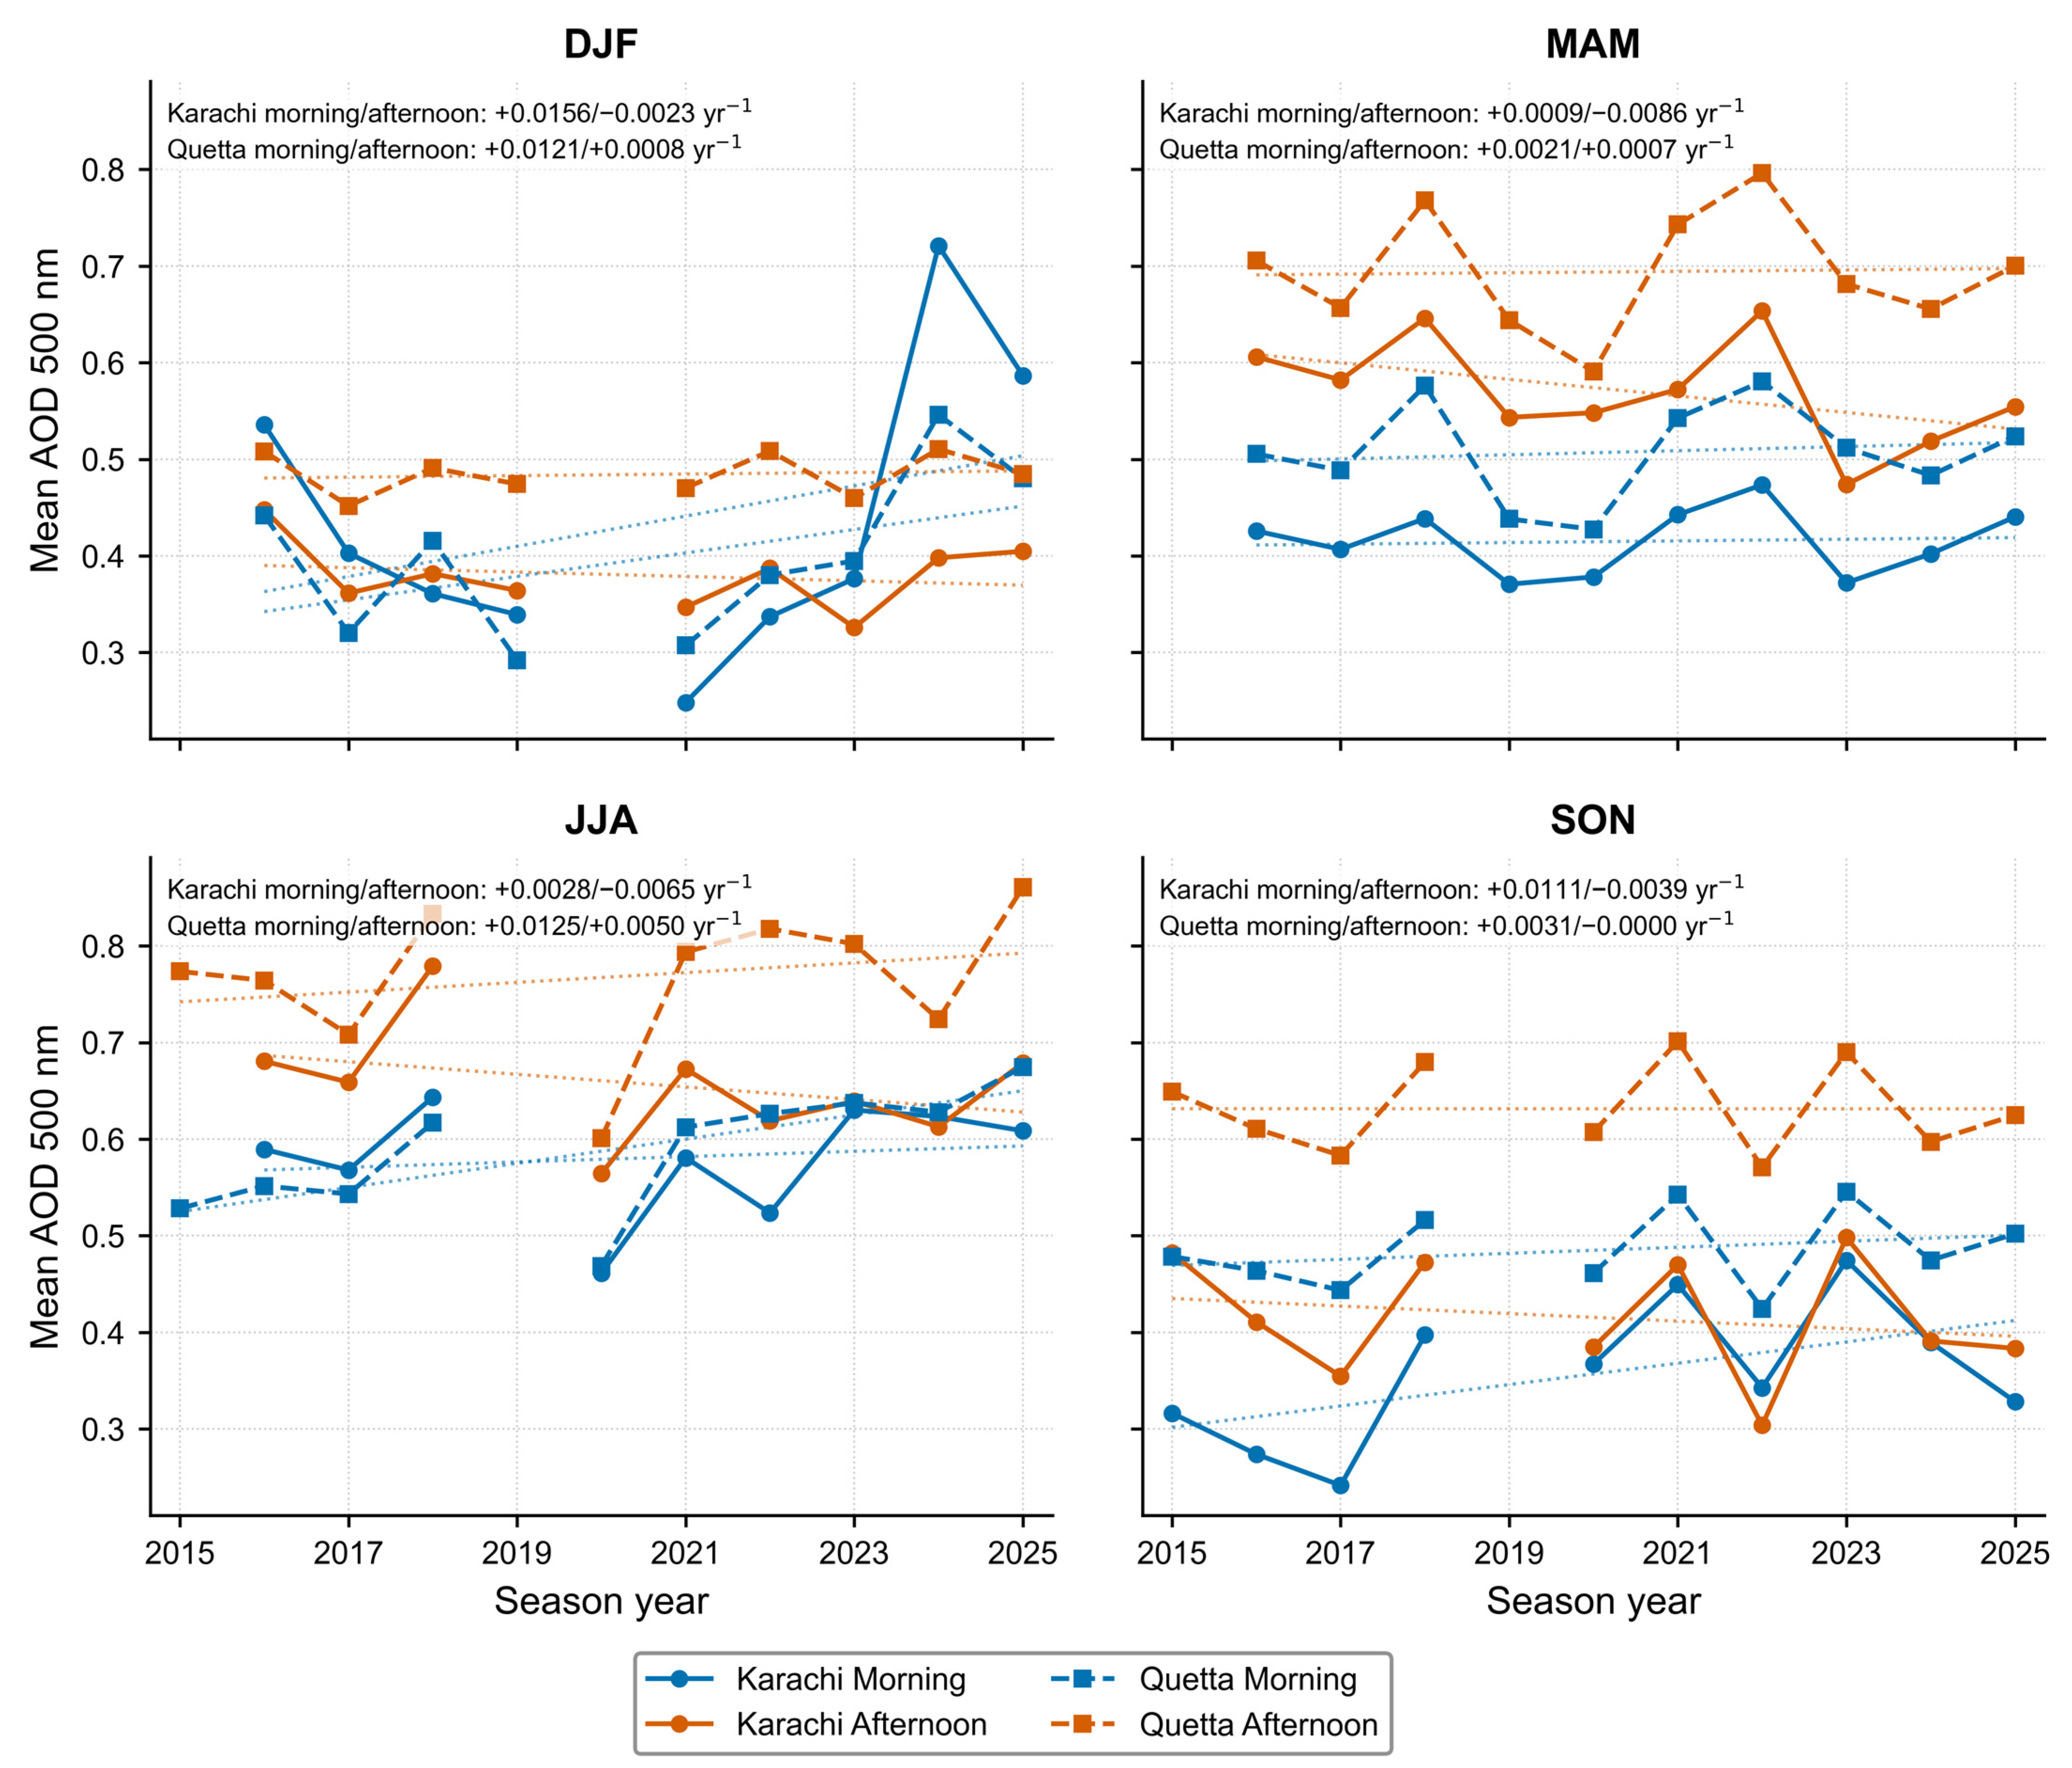
Quetta afternoon AOD exceeded morning AOD in all four seasons (Figure 7). The seasonal morning and afternoon means were 0.398 and 0.484 in winter, 0.508 and 0.694 in spring, 0.589 and 0.768 in summer, and 0.485 and 0.631 in autumn. The largest difference occurred in spring (+0.186), followed by summer (+0.179), autumn (+0.146), and winter (+0.087). Summer had the highest mean AOD during both periods.
Figure 7.
Seasonal time series of morning and afternoon quality-assured DSCOVR EPIC AOD at 500 nm over Quetta and Karachi during 2015–2025. Dotted lines show ordinary least-squares linear trends, with slopes (yr−1) annotated in each panel.
Karachi showed a season-dependent contrast. Afternoon AOD was lower than morning AOD in winter (0.380 versus 0.434; ΔAOD = −0.054) but higher in spring (0.570 versus 0.415; +0.155), summer (0.656 versus 0.581; +0.075), and autumn (0.415 versus 0.358; +0.057). Summer again had the highest AOD during both periods.
The seasonal linear slopes were descriptive. Quetta morning slopes were positive in all seasons, while afternoon slopes were small, ranging from approximately zero in autumn to +0.0050 AOD yr−1 in summer. Karachi morning slopes were positive in all seasons, whereas its afternoon slopes were negative.
3.2.4. Hourly AOD Behavior
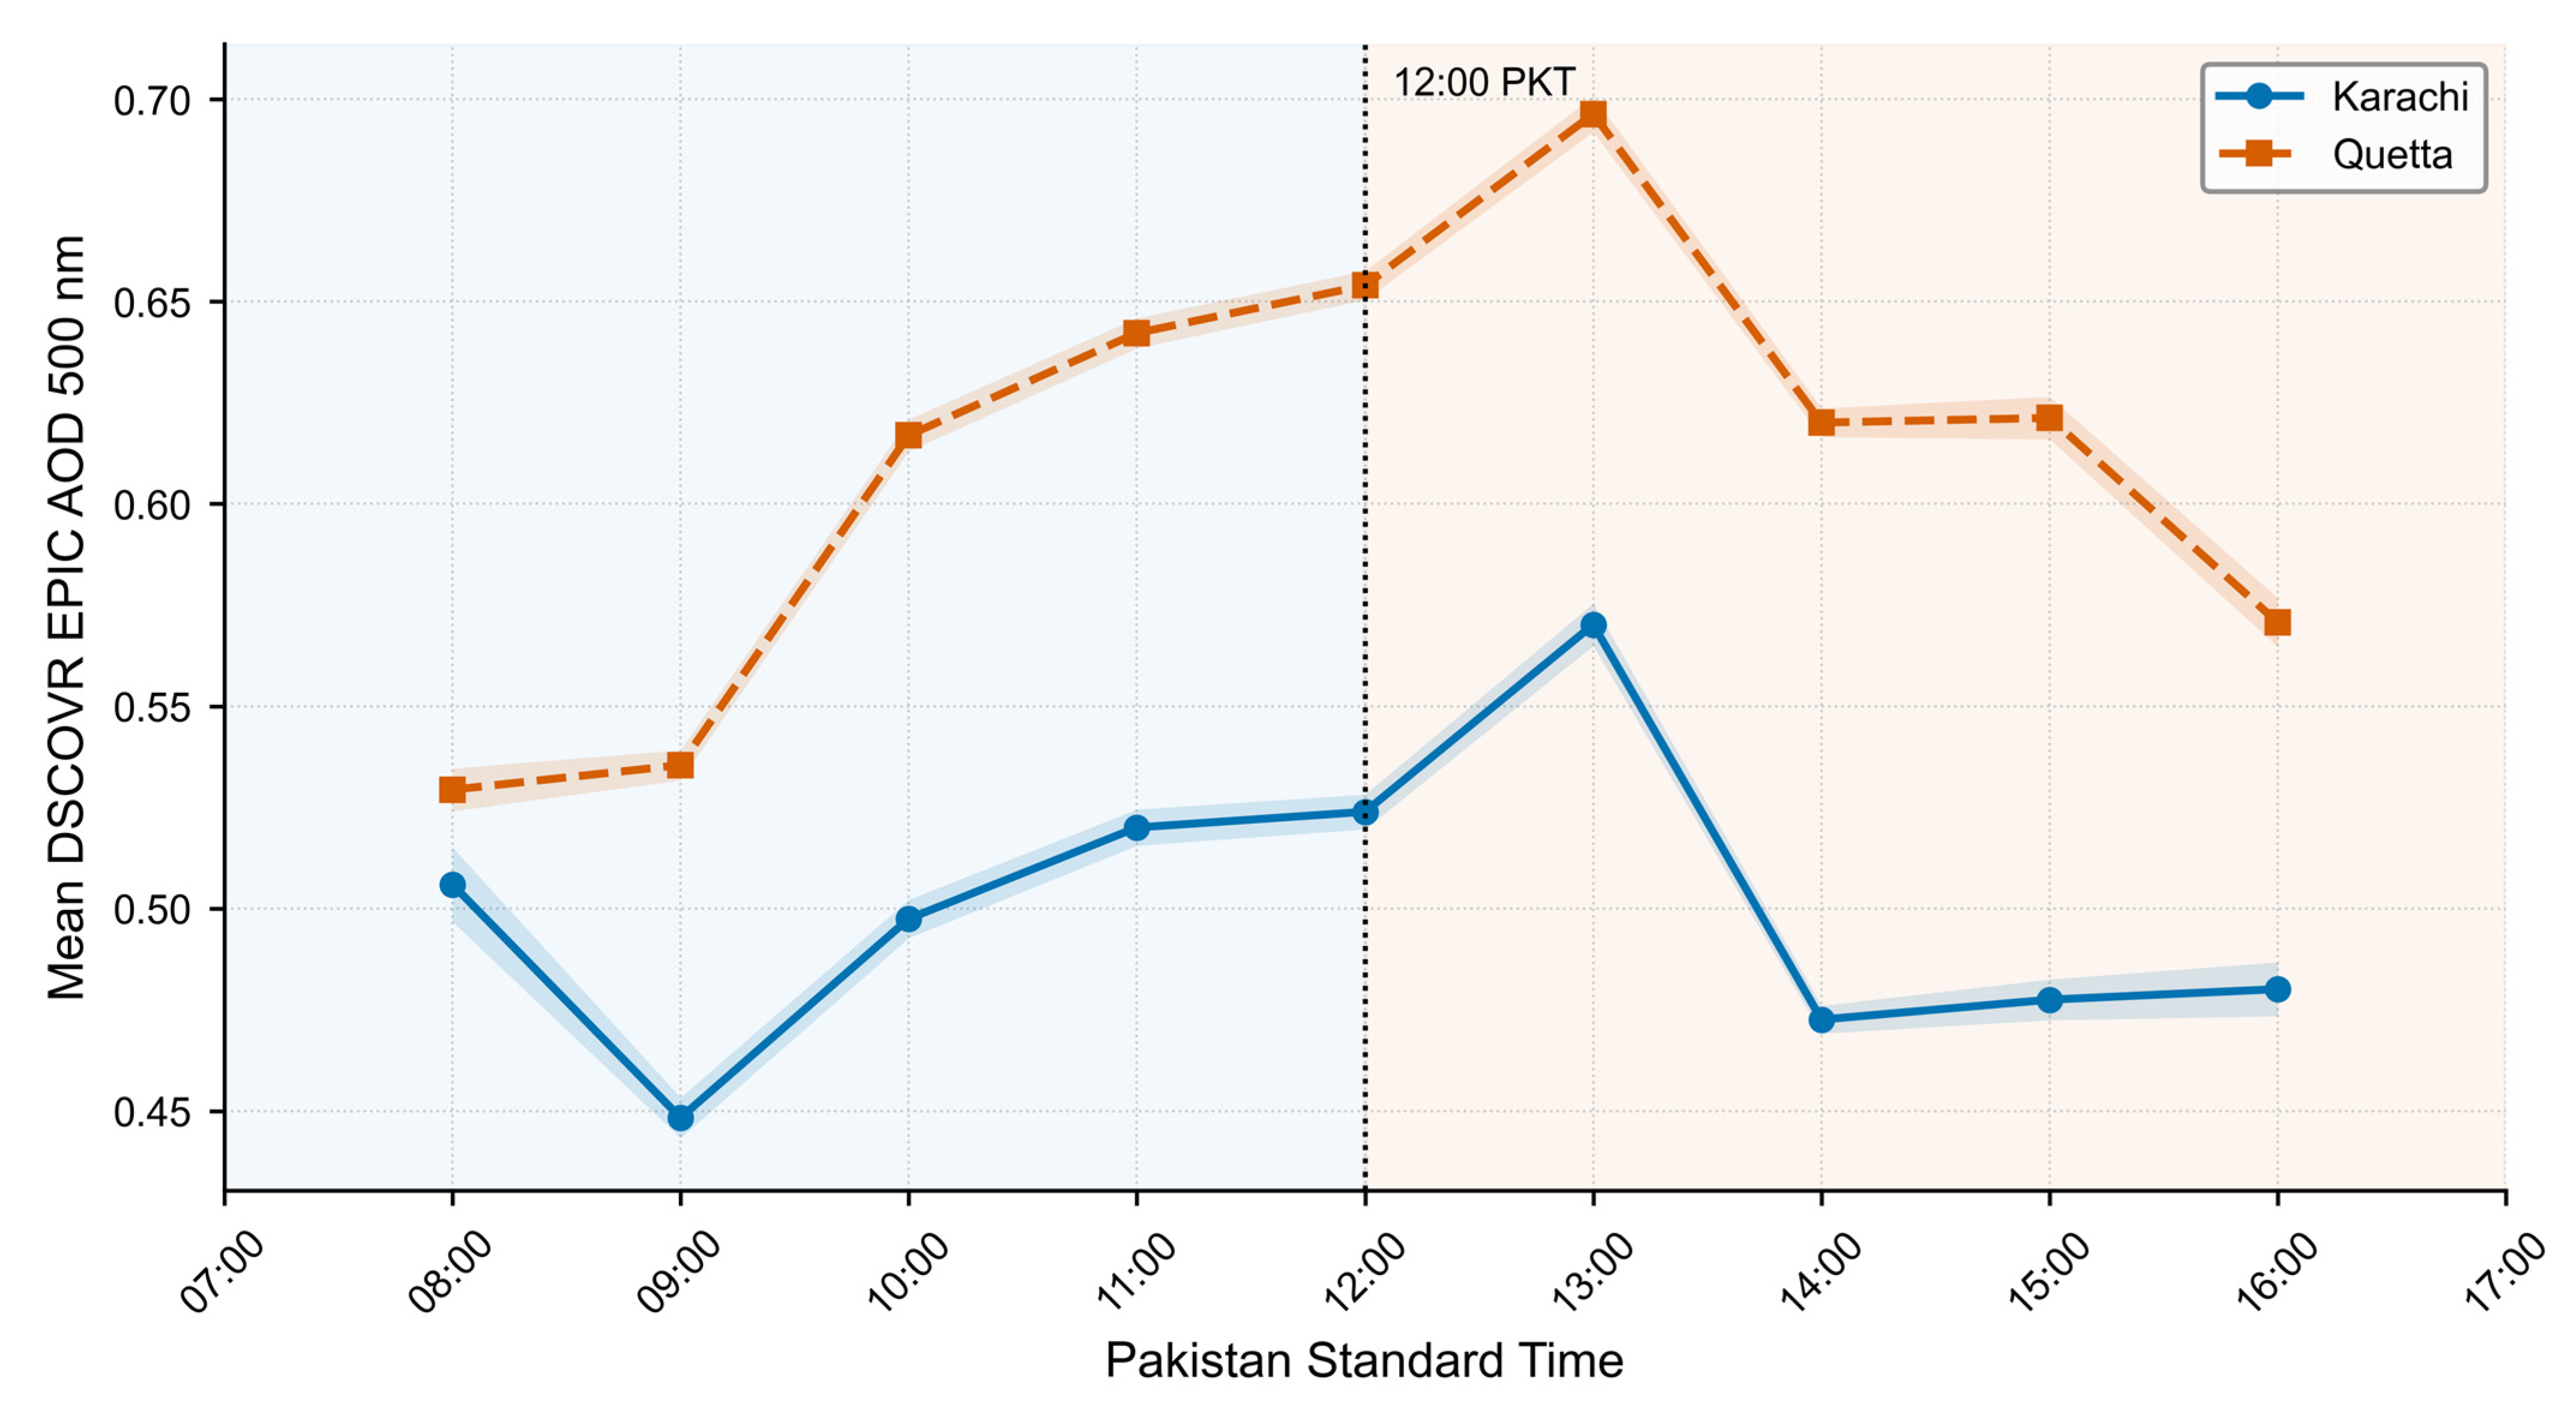
Between 08:00 and 16:00 PKT, Quetta AOD increased from 0.529 at 08:00 to a maximum of 0.696 at 13:00, before decreasing to 0.620–0.621 at 14:00–15:00 and 0.571 at 16:00 (Figure 8). The hourly range was 0.167. The mean of the post-noon hourly bins was 0.632, compared with 0.581 before noon, corresponding to an increase of 0.051, or 8.9%.
Figure 8.
Hourly climatology of quality-assured DSCOVR EPIC AOD at 500 nm over Quetta and Karachi from 08:00 to 16:00 PKT, calculated using all valid scene-level means from 2016 to 2018 and 2020 to 2025.
Karachi AOD decreased from 0.506 at 08:00 to a minimum of 0.448 at 09:00, then increased to 0.570 at 13:00. It subsequently decreased to 0.473 at 14:00 and remained near 0.48 through 16:00. The hourly range was 0.122, and the mean post-noon value was only 0.012 higher than the pre-noon value.
The increase between the central daytime hours was also evident using only dates containing observations at both 09:00 and 13:00 PKT. Across 1162 matched Karachi dates, mean AOD increased from 0.471 to 0.563 (mean change = +0.092), and 79.9% of the paired dates had higher AOD at 13:00. This supports a genuine daytime increase toward early afternoon. The raw 07:00 and 17:00 bins were not included because their markedly lower retrieval success, reduced spatial coverage, and seasonally uneven availability made their climatological means sensitive to sampling and retrieval geometry.
3.3. Meteorological Conditions
3.3.1. Temperature, Boundary-Layer Height, and Wind Speed
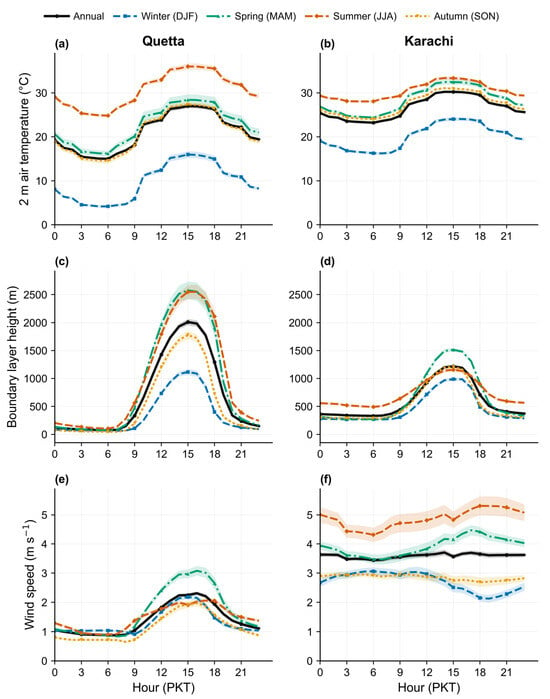
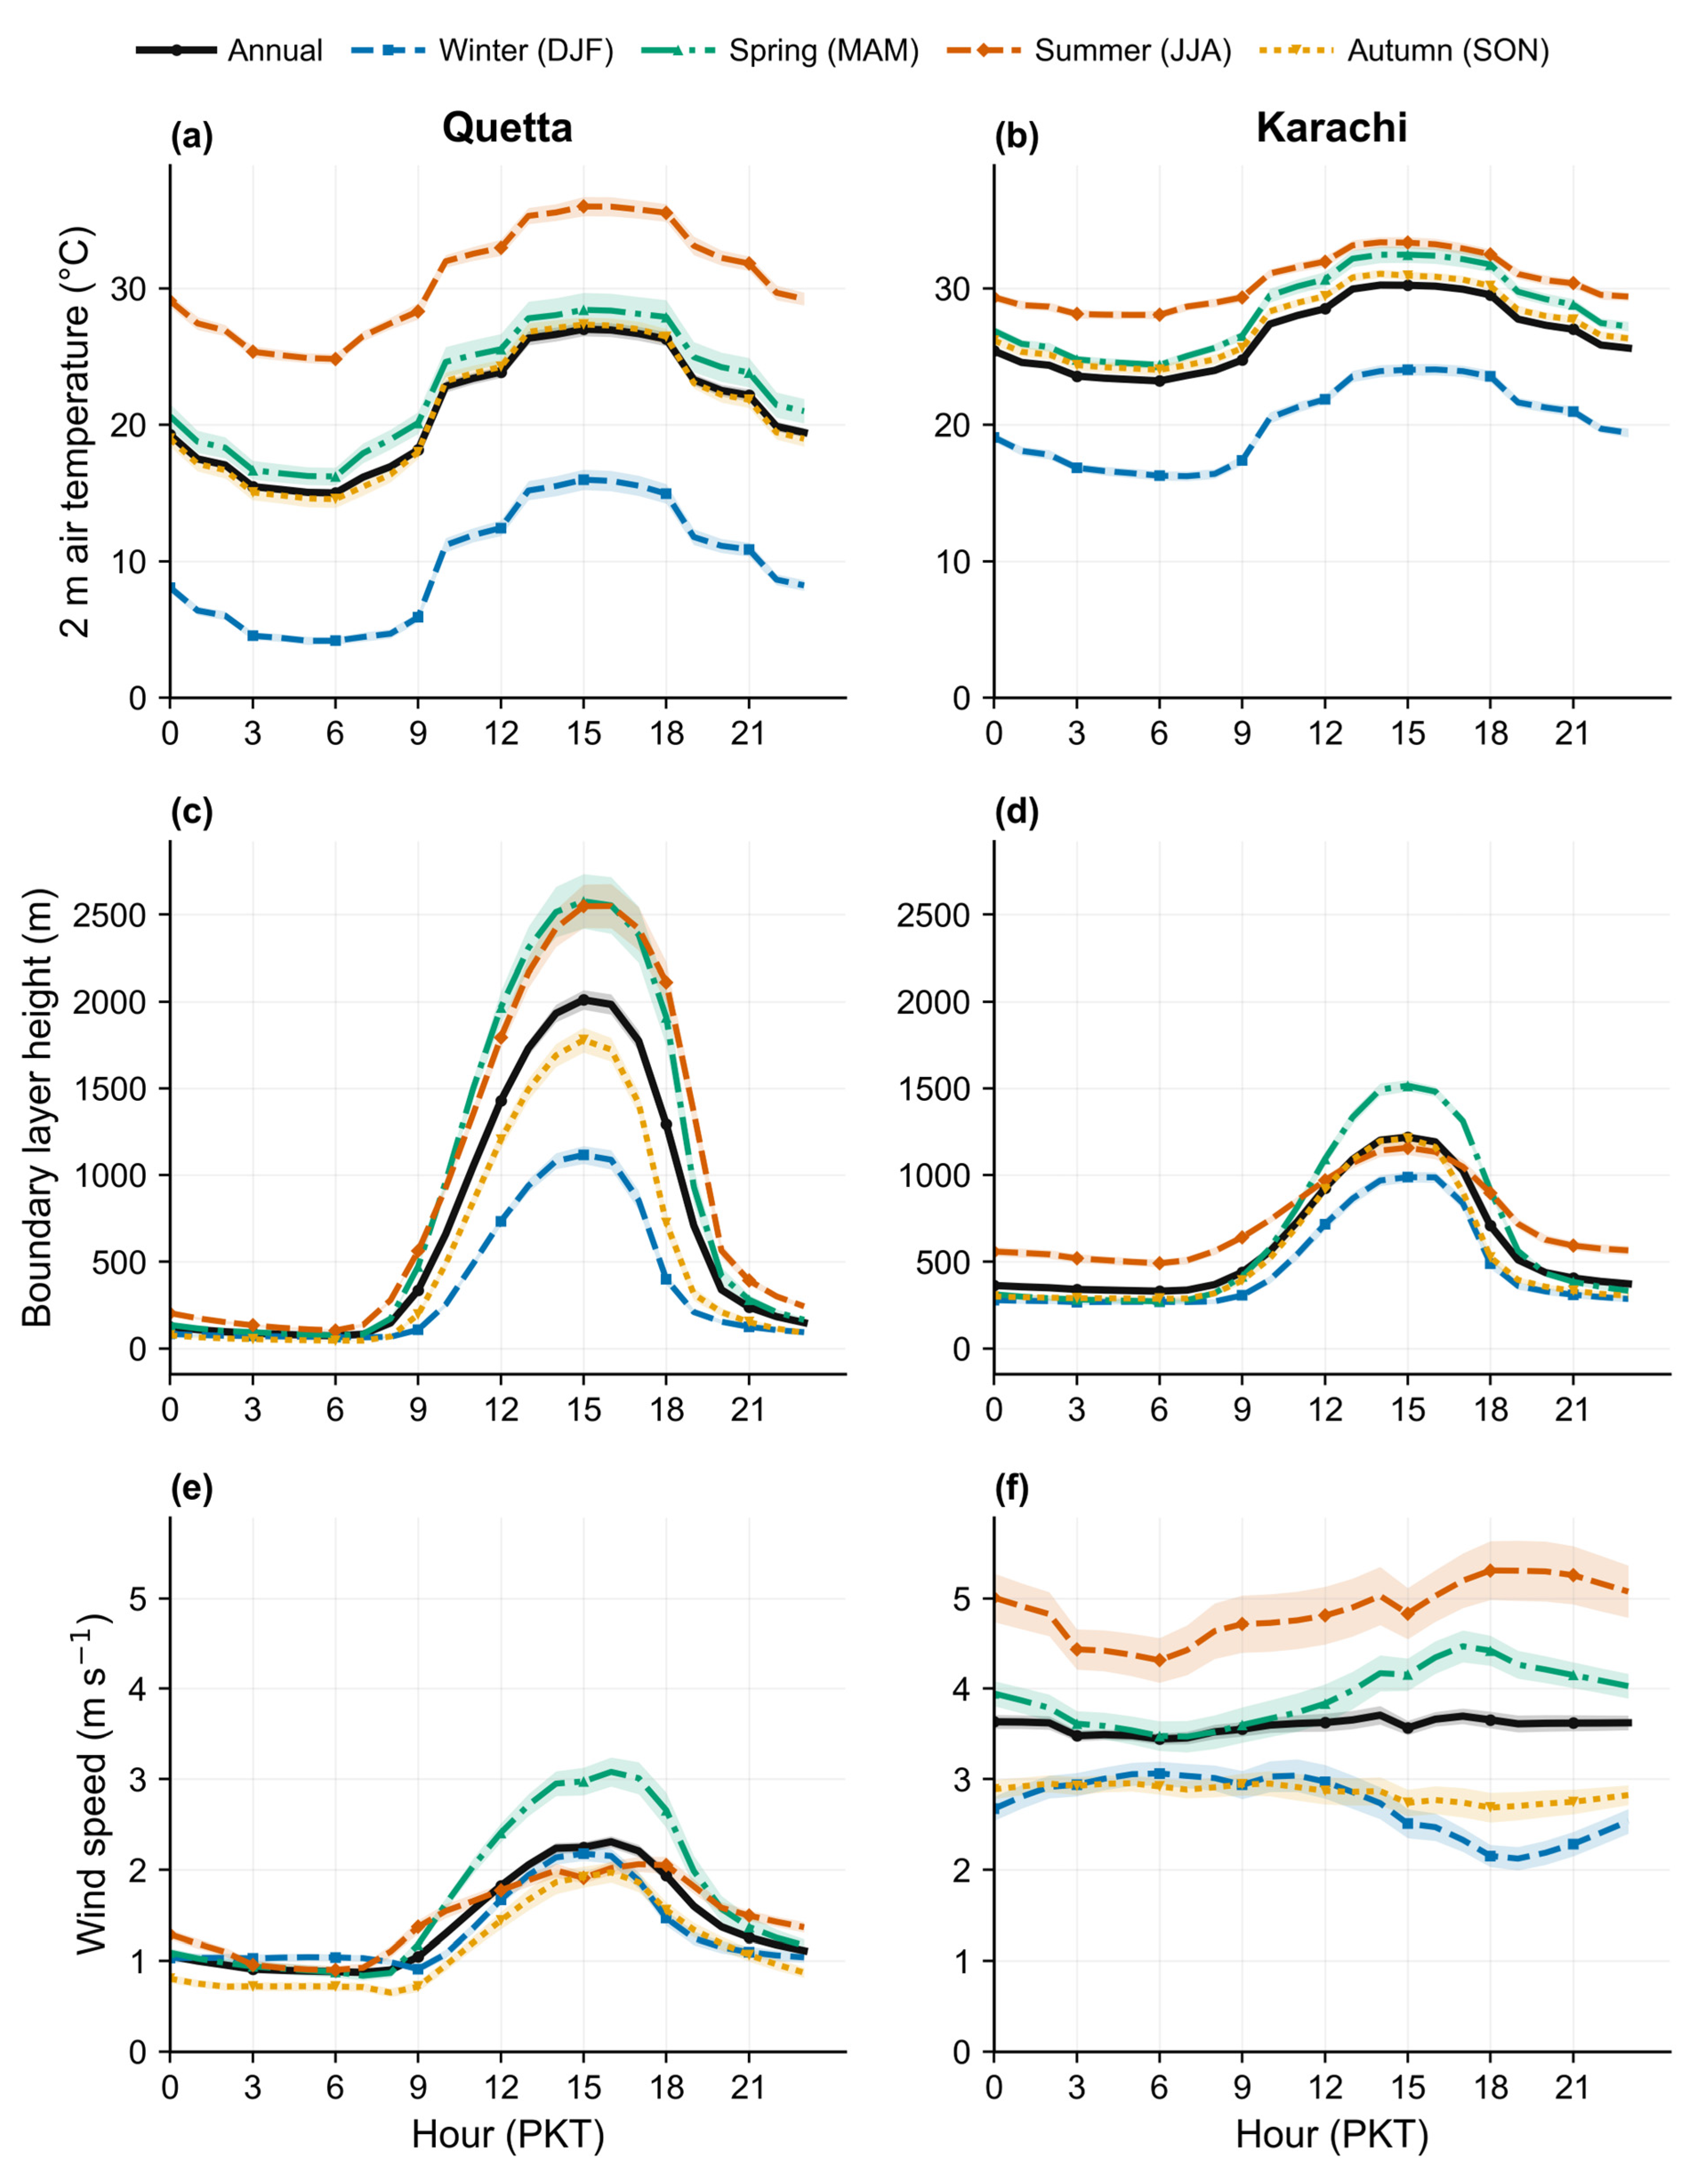
Karachi was warmer on average than Quetta, but it had smaller diurnal and seasonal temperature ranges (Figure 9). Mean T2M was 26.57 ± 5.24 °C in Karachi and 20.96 ± 9.70 °C in Quetta. Karachi hourly T2M ranged from 23.22 °C at 06:00 to 30.24 °C at 14:00 (7.02 °C amplitude), whereas Quetta ranged from 15.00 °C at 06:00 to 27.01 °C at 15:00 (12.01 °C amplitude).
Figure 9.
Mean hourly climatologies of (a,b) 2 m air temperature (T2M), (c,d) boundary-layer height (BLH), and (e,f) wind speed (WS) for Quetta (left column) and Karachi (right column) during 2015–2025. Black curves show annual means, and colored curves show seasonal means. Shading denotes Student’s t-based 95% confidence intervals calculated across complete yearly or season–year hourly climatologies.
BLH increased from 330 m at 06:00 to 1218 m at 15:00 in Karachi (888 m amplitude) and from 73 m to 2010 m over the same interval in Quetta (1938 m amplitude). Mean wind speed was 3.59 ± 1.70 m s−1 in Karachi and 1.40 ± 0.92 m s−1 in Quetta. Karachi wind speed peaked seasonally in summer (4.87 m s−1), whereas Quetta’s annual hourly wind speed increased from 0.88 m s−1 at 07:00 to 2.31 m s−1 at 16:00.
3.3.2. Surface Pressure and Total Column Water
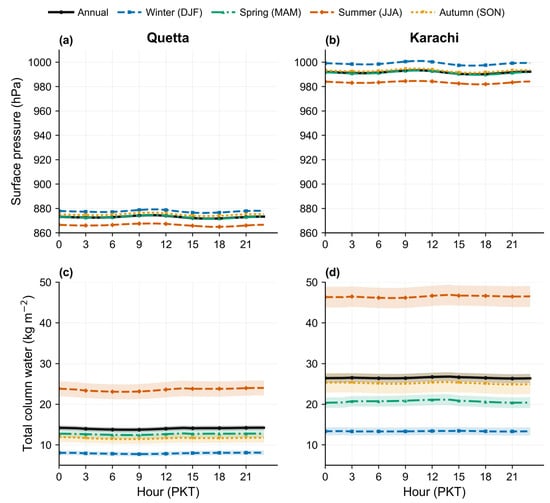
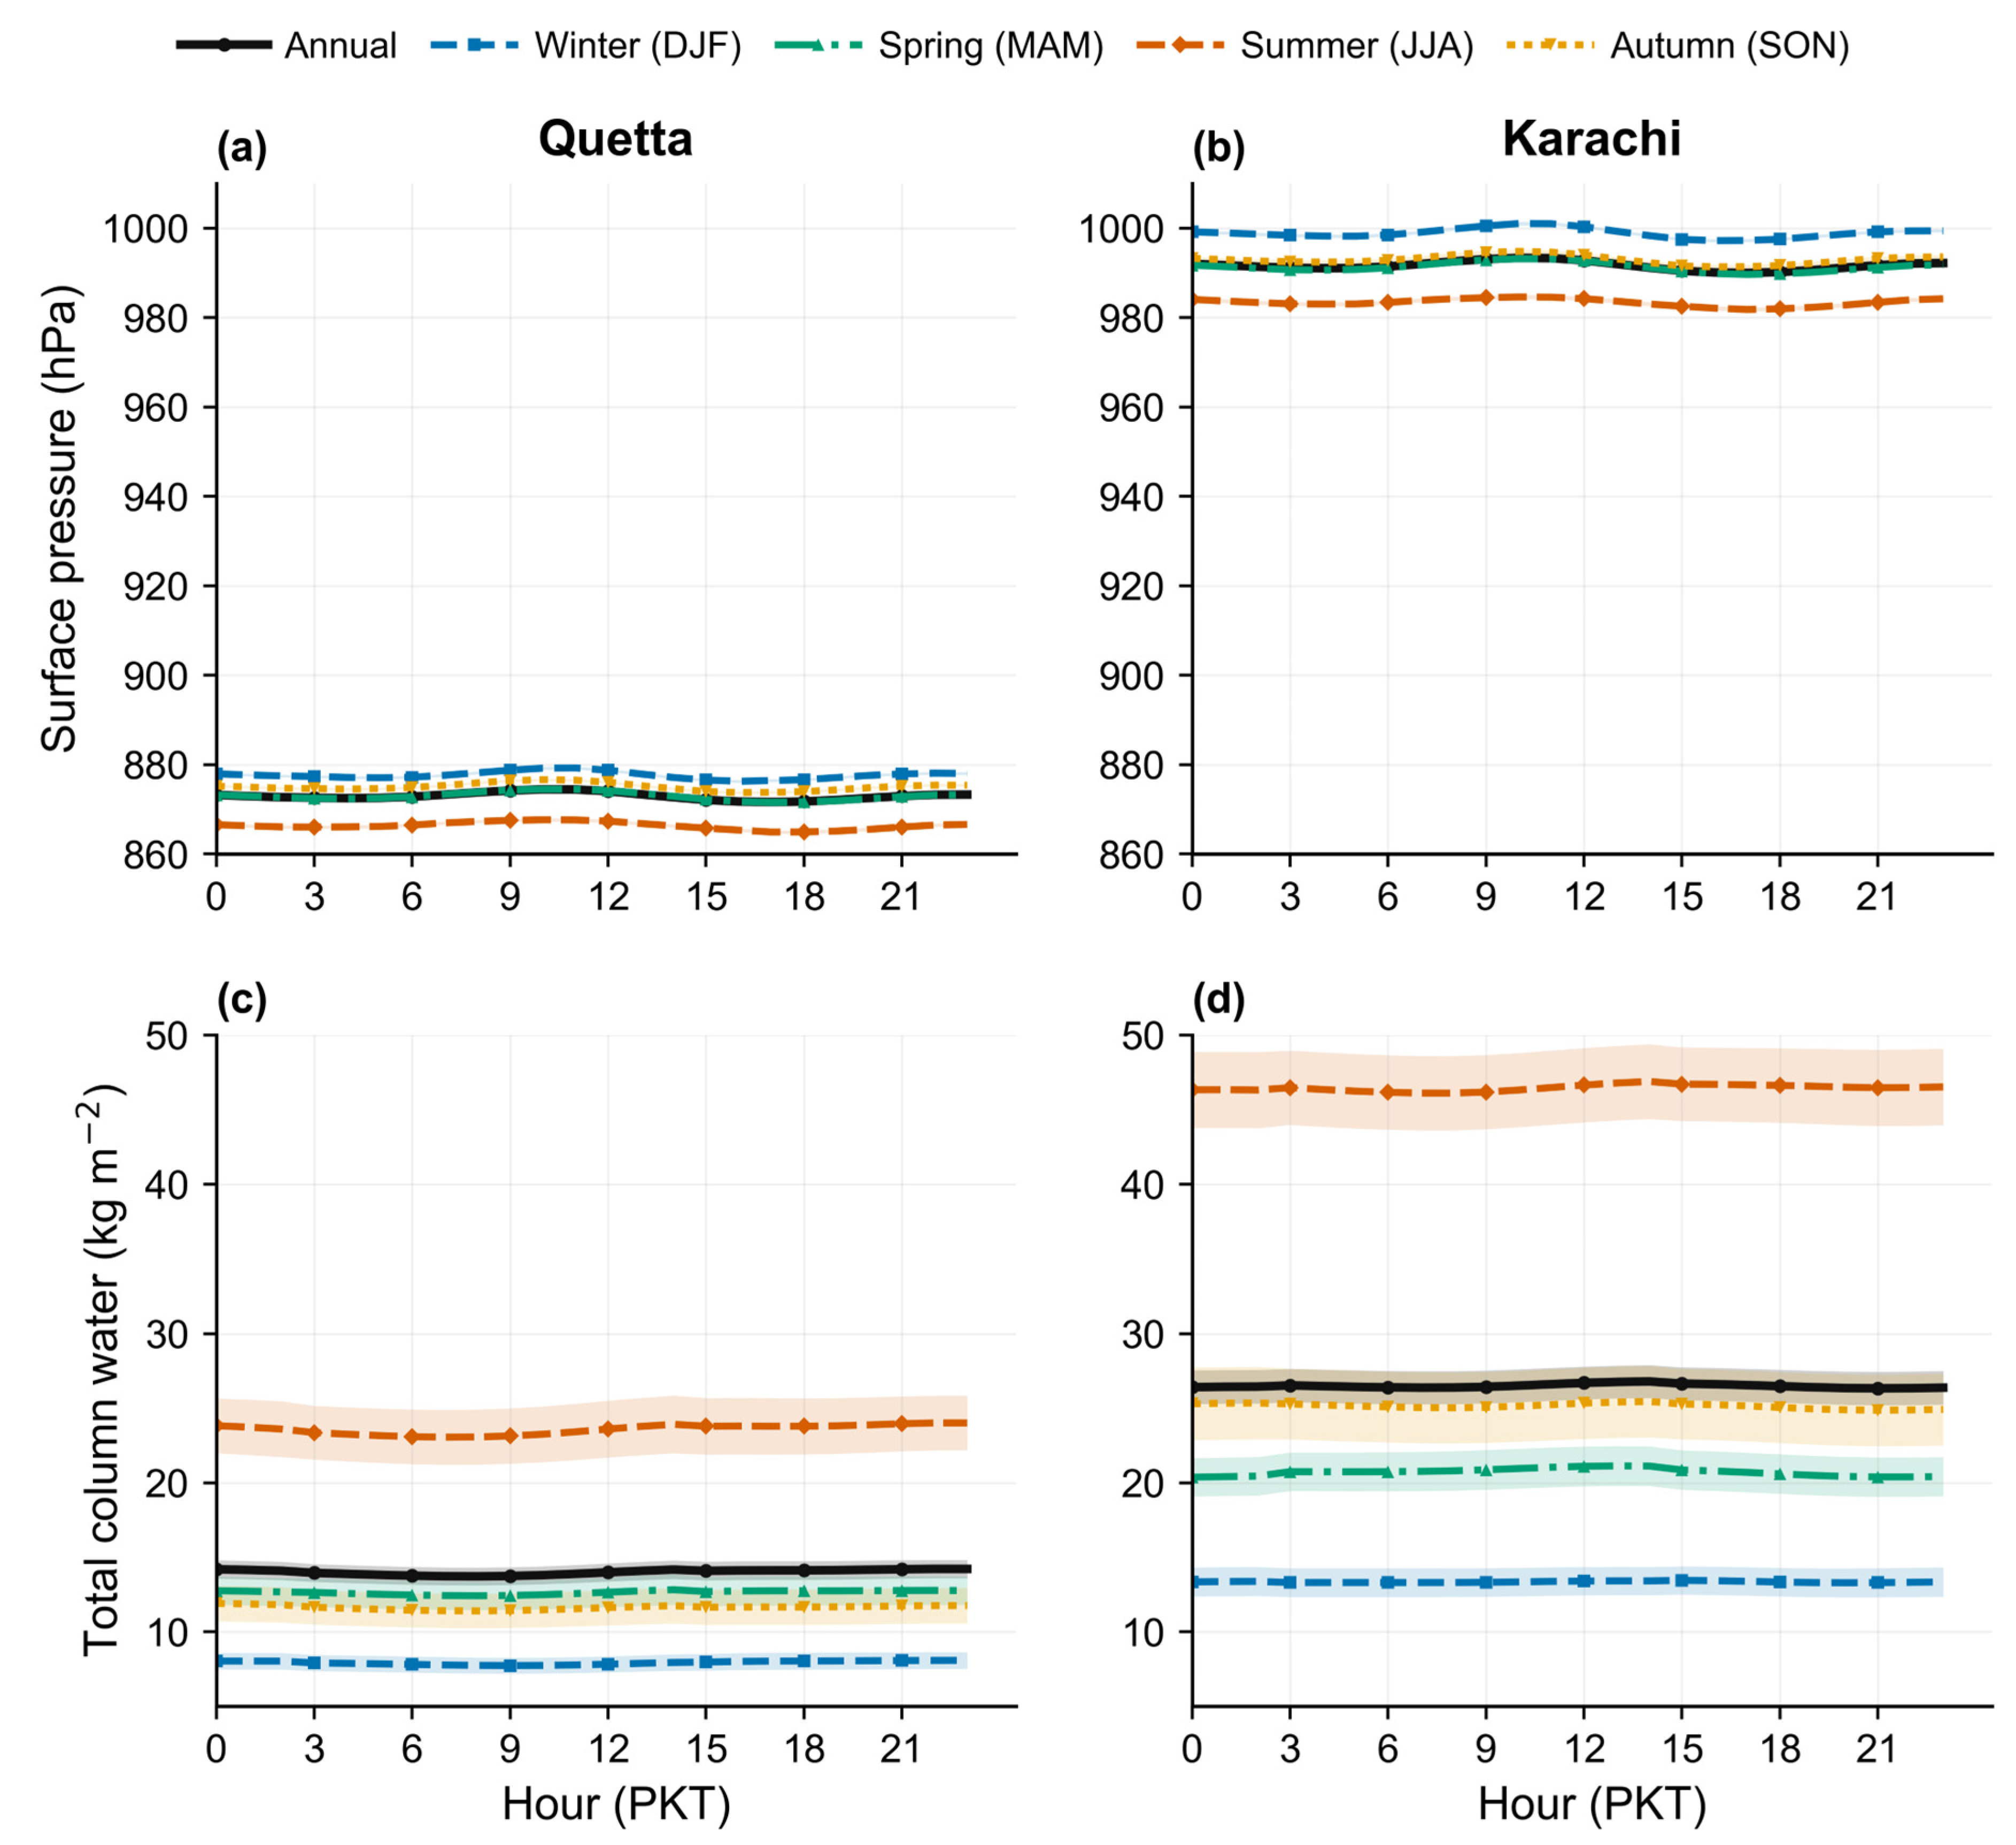
For the common 2015–2025 TCW record (Figure 10), Karachi had an overall mean of 26.53 ± 15.57 kg m−2, compared with 14.07 ± 8.38 kg m−2 over Quetta. Summer means were 46.41 and 23.58 kg m−2, while winter means were 13.39 and 7.95 kg m−2. Annual hourly amplitudes were 0.45 kg m−2 in Karachi and 0.49 kg m−2 in Quetta.
Figure 10.
Mean hourly climatologies of (a,b) surface pressure (SP) and (c,d) total column water (TCW) for Quetta (left column) and Karachi (right column) during 2015–2025. Black curves show annual means, and colored curves show seasonal means. Shading denotes Student’s t-based 95% confidence intervals calculated across complete yearly or season–year hourly climatologies.
Mean surface pressure was 991.62 ± 6.62 hPa in Karachi and 872.97 ± 5.15 hPa in Quetta. Both cities reached the annual hourly maximum at 10:00 and the minimum at 17:00 PKT, with amplitudes of 3.38 and 2.83 hPa, respectively. Karachi has higher mean surface pressure and total column water compared to Quetta.
3.3.3. Wind Direction
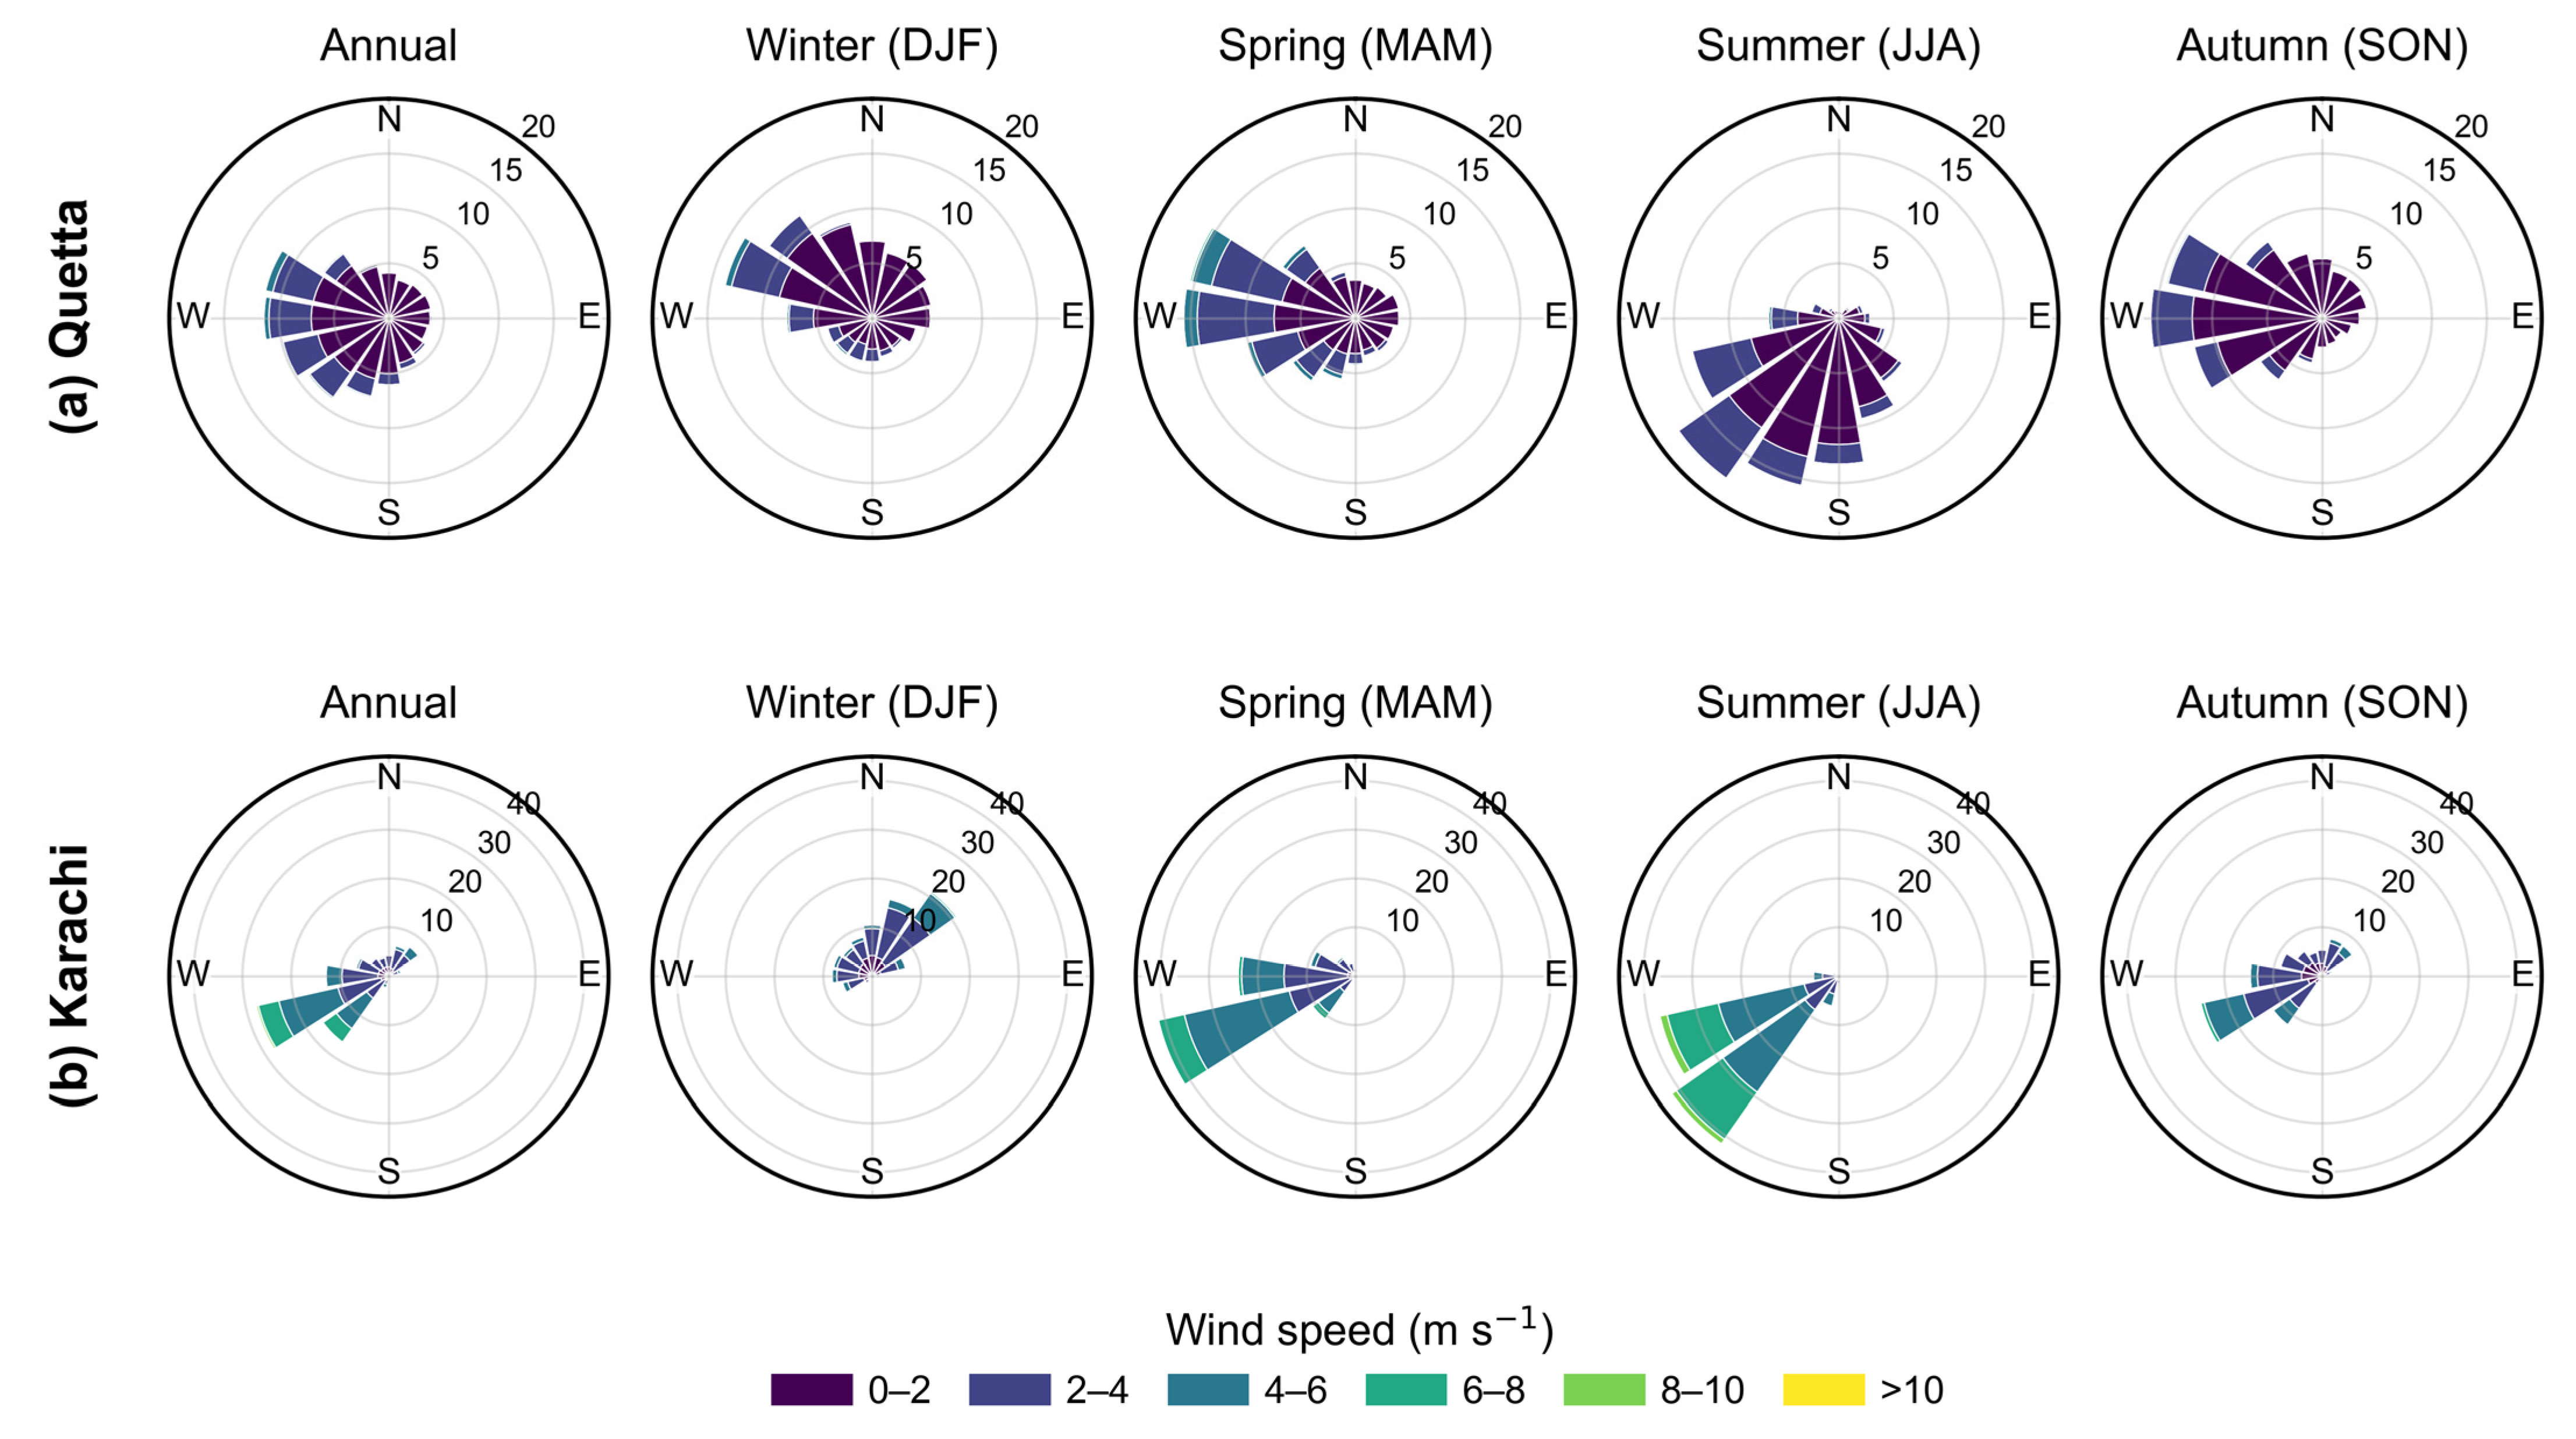
Karachi summer winds most frequently came from the southwest (41.81%), while west-southwesterly winds had the largest share annually (27.86%), in spring (41.58%), and in autumn (25.45%; Figure 11). Northeasterly winds were most frequent in winter (21.14%). Quetta directions were more dispersed: west-northwesterly winds had an annual share of 11.58%, westerly winds led in spring and autumn (15.71% in each), and southwesterly winds led in summer (17.84%).
Figure 11.
Annual and seasonal wind roses for (a) Quetta and (b) Karachi during 2015–2025. Bars indicate the wind direction, radial axes show percentage frequency, and stacked colors represent WS classes (m s−1). Frequencies were calculated using 16 directional sectors of 22.5° each. Each city row uses a common radial scale; radial maxima differ between Quetta (20%) and Karachi (40%) to preserve visibility of their different directional distributions.
3.3.4. GeoDetector Spatial Associations
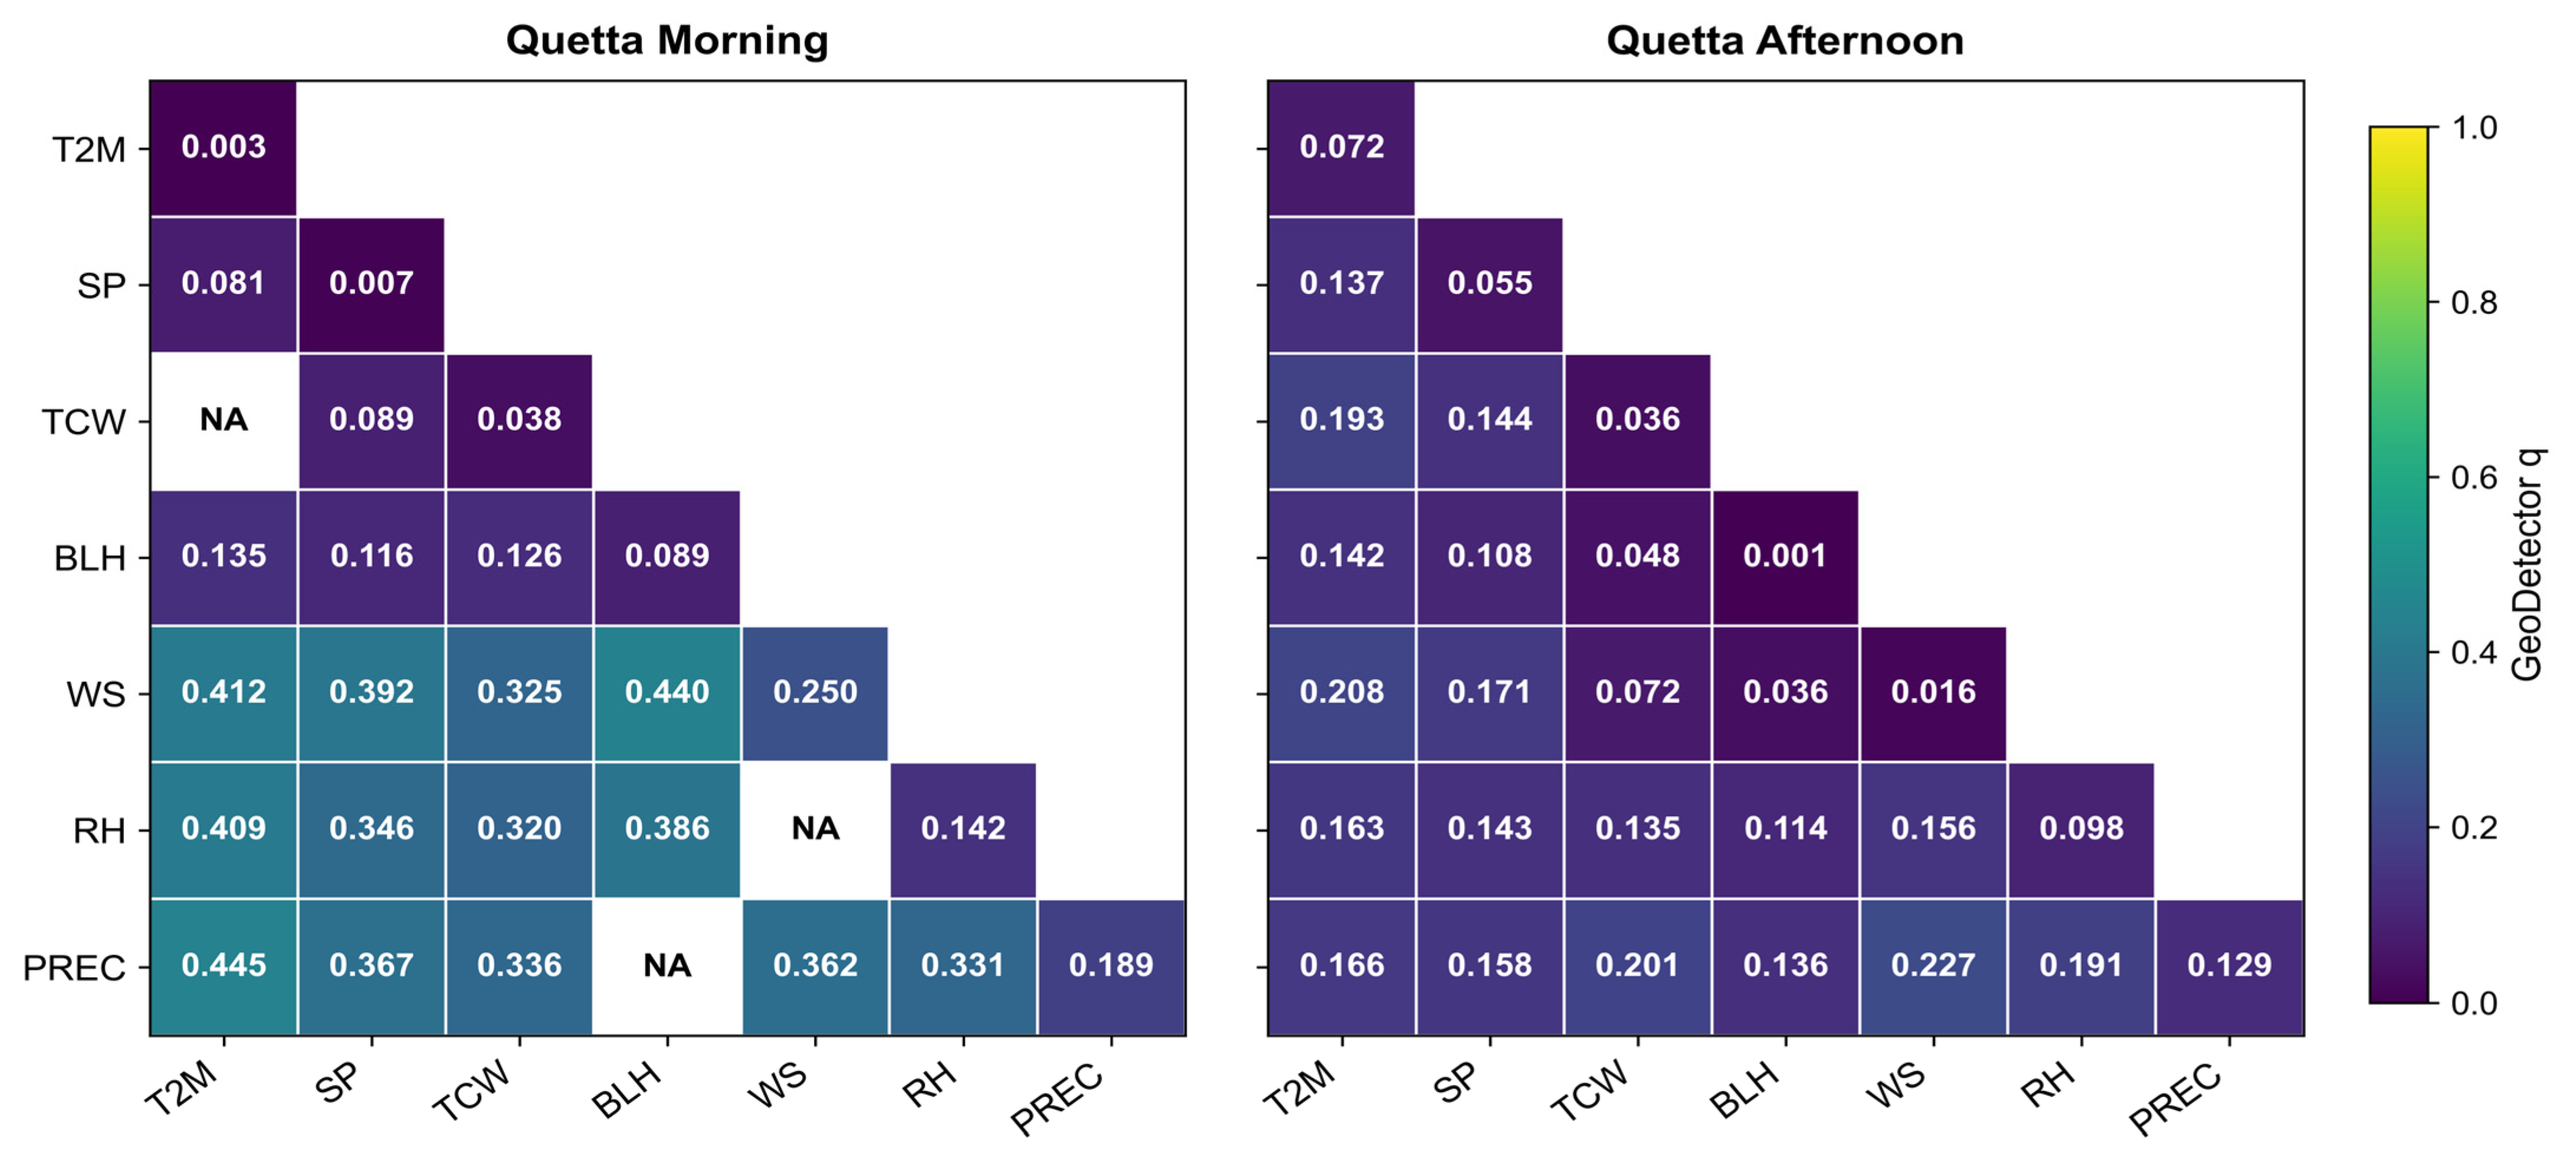
For Quetta, the morning spatial climatology contained 1200 EPIC cells (Figure 12). WS had the largest single-factor q (0.250), followed by PREC (0.189) and RH (0.142). The largest admissible interaction q was T2M × PREC (0.445), closely followed by BLH × WS (0.440). The independent afternoon climatology contained 1235 cells. PREC had the largest single-factor q (0.129), followed by RH (0.098) and T2M (0.072); WS × PREC had the largest admissible interaction q (0.227). These afternoon single-factor q values are modest and should not be read as evidence that precipitation during an overpass caused an AOD change.
Figure 12.
Descriptive GeoDetector factor and interaction q values for Quetta morning (left) and afternoon (right). Diagonal cells show single-factor q, and lower-triangular cells show interaction q.
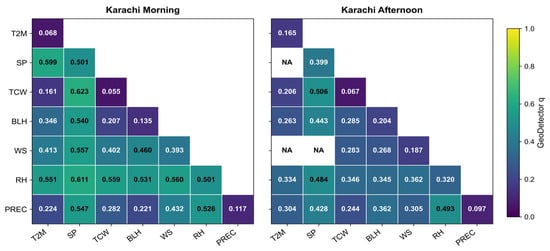
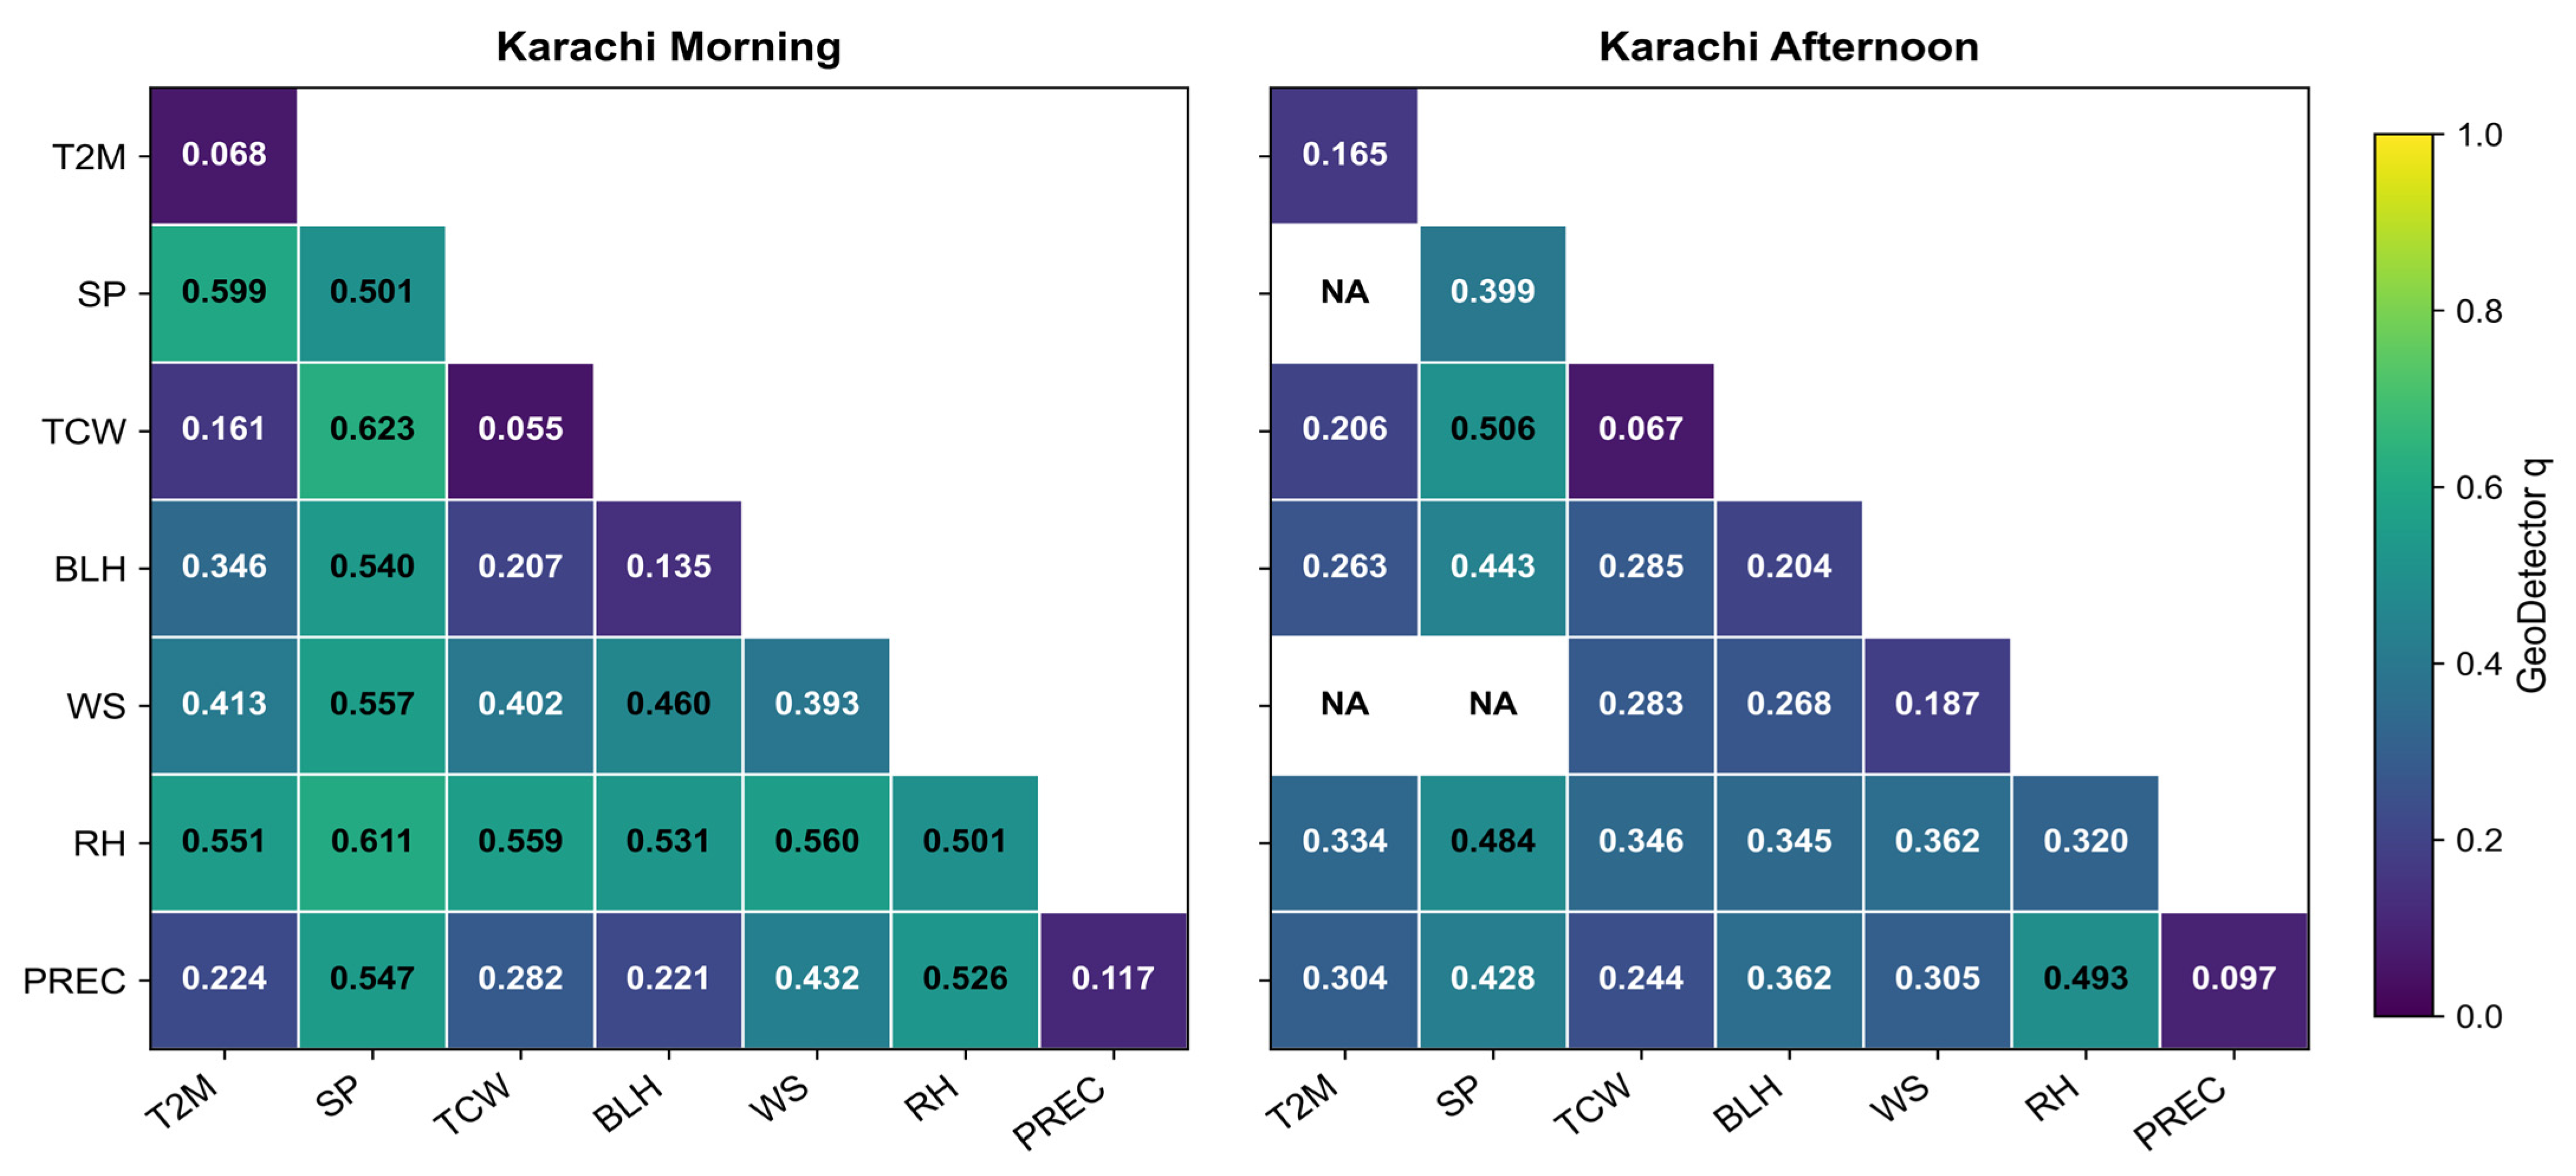
For Karachi, the morning climatology contained 1208 cells (Figure 13). SP and RH had nearly identical leading single-factor q values (0.501 after rounding), followed by WS (0.393). SP × TCW had the largest admissible interaction q (0.623). The afternoon climatology contained 1223 cells; SP had the largest single-factor q (0.399), followed by RH (0.320) and BLH (0.204). SP × TCW again had the largest admissible interaction q (0.506).
Figure 13.
Descriptive GeoDetector factor and interaction q values for Karachi morning (left) and afternoon (right). Diagonal cells show single-factor q and lower-triangular cells show interaction q.
Across the four city-period analyses, 78 of 84 possible factor pairs met the minimum occupancy rule. The remaining six pairs are marked NA in Figure 12 and Figure 13 because at least one nonempty intersection stratum contained fewer than five cells. Interaction q values describe the spatial fit of a finer joint stratification.
3.4. Aerosol Regimes
3.4.1. Multiyear Morning–Afternoon Differences
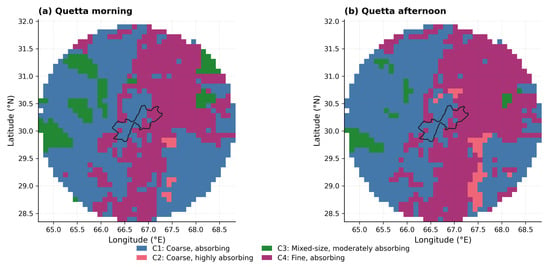
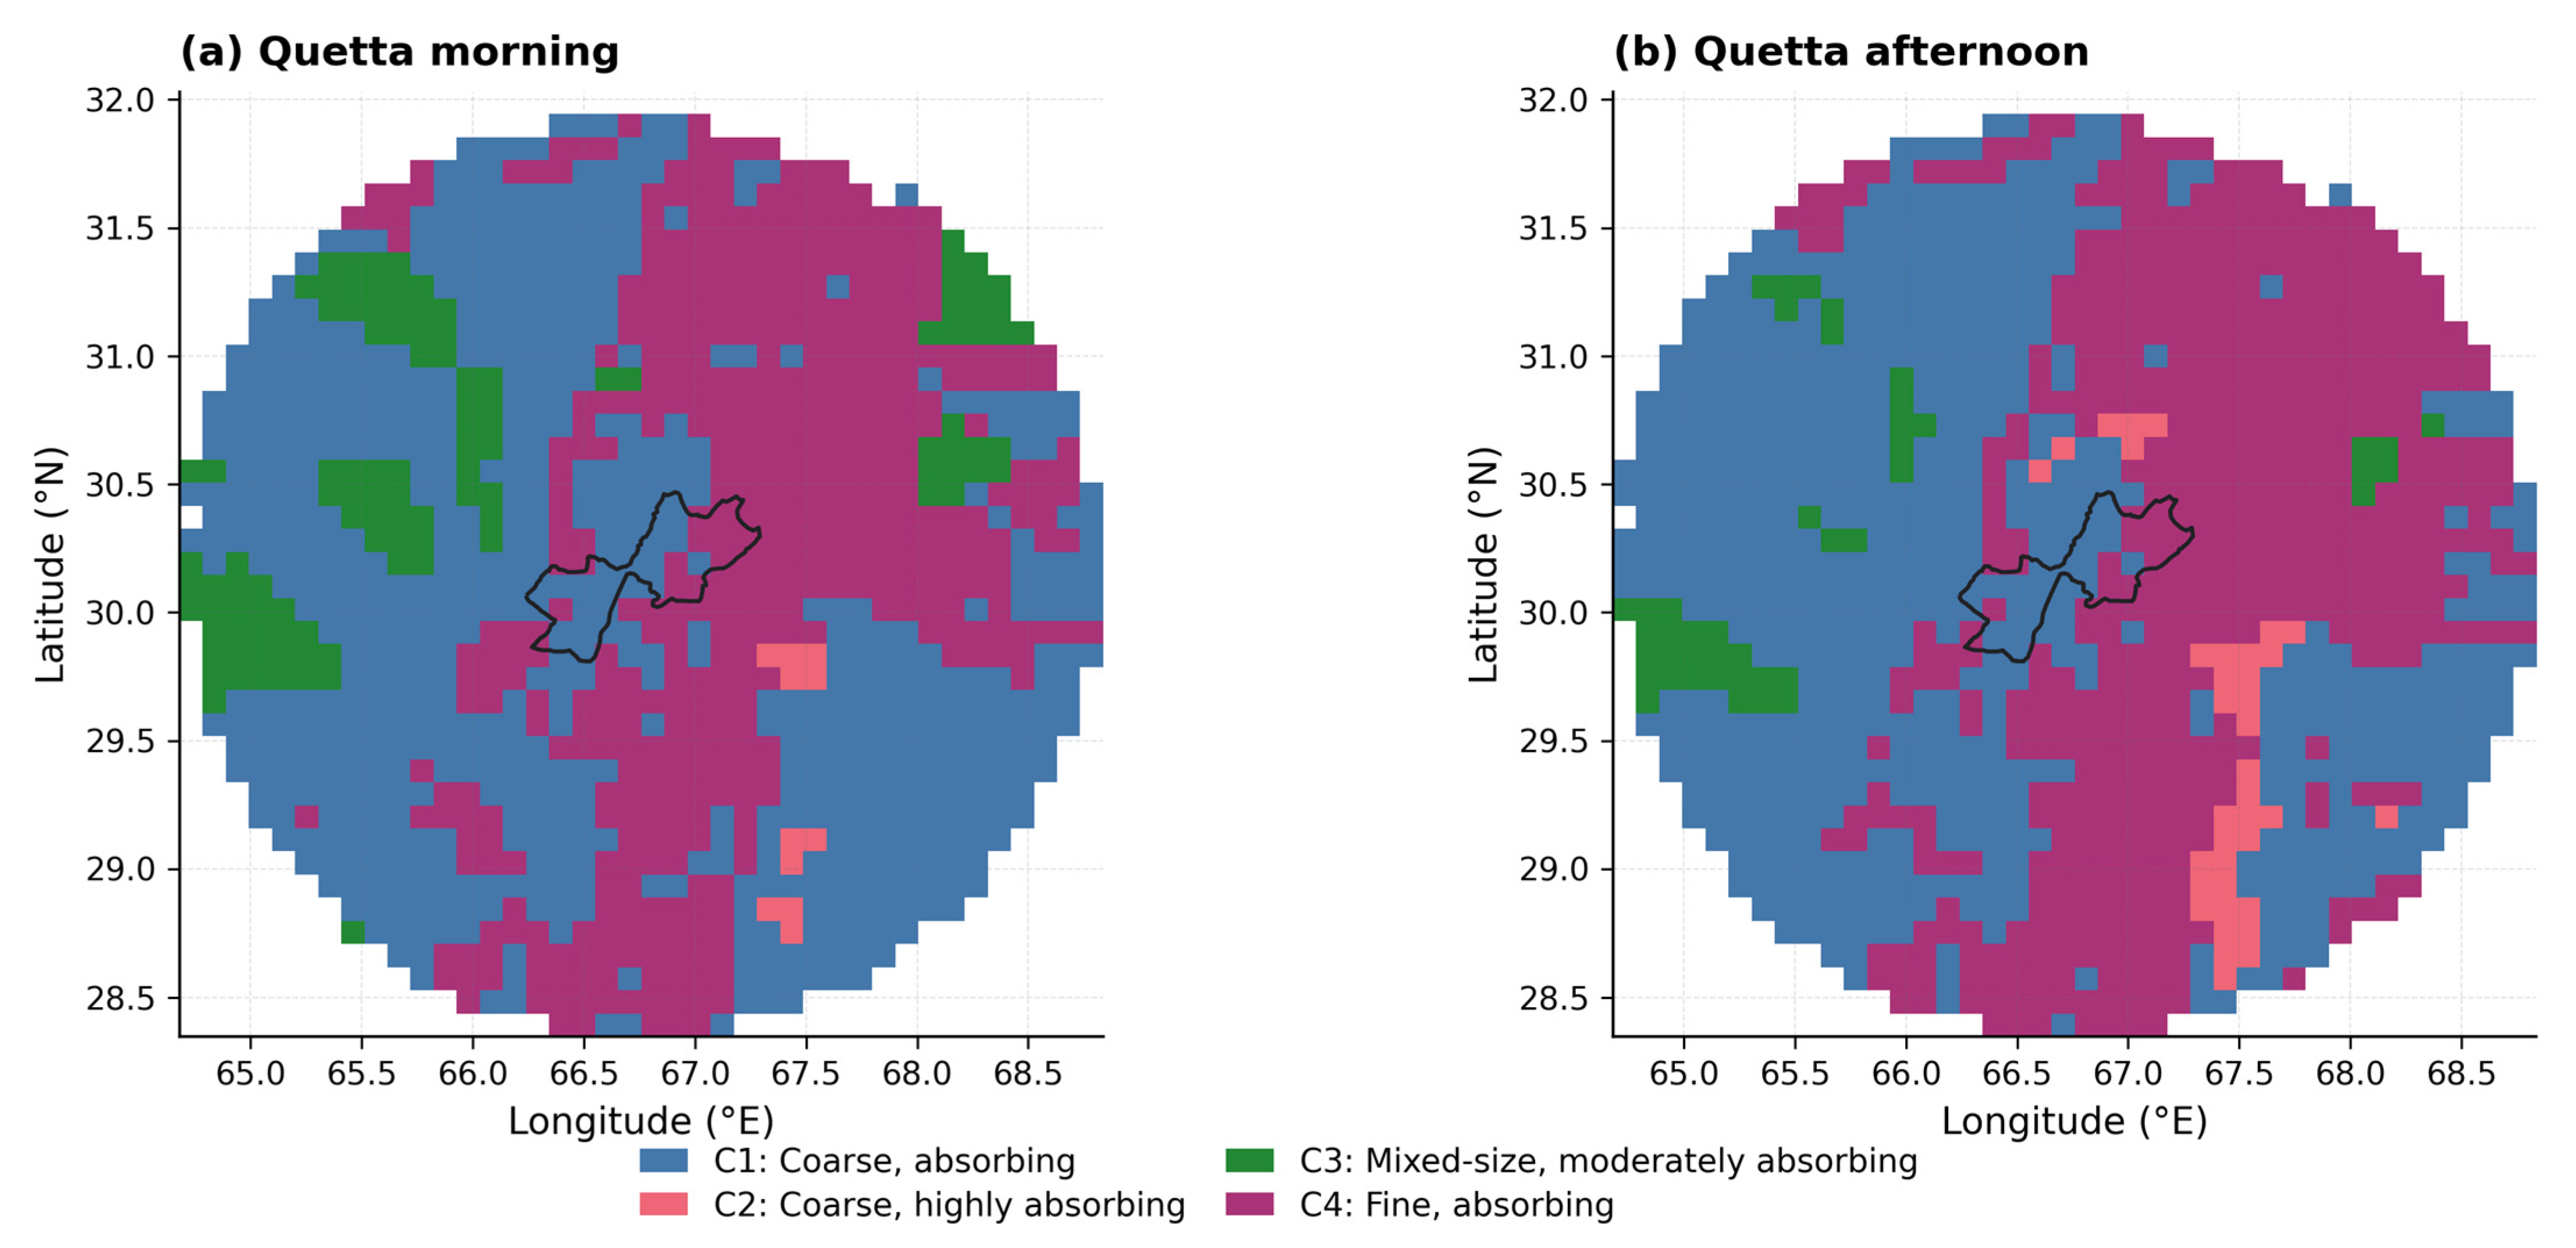
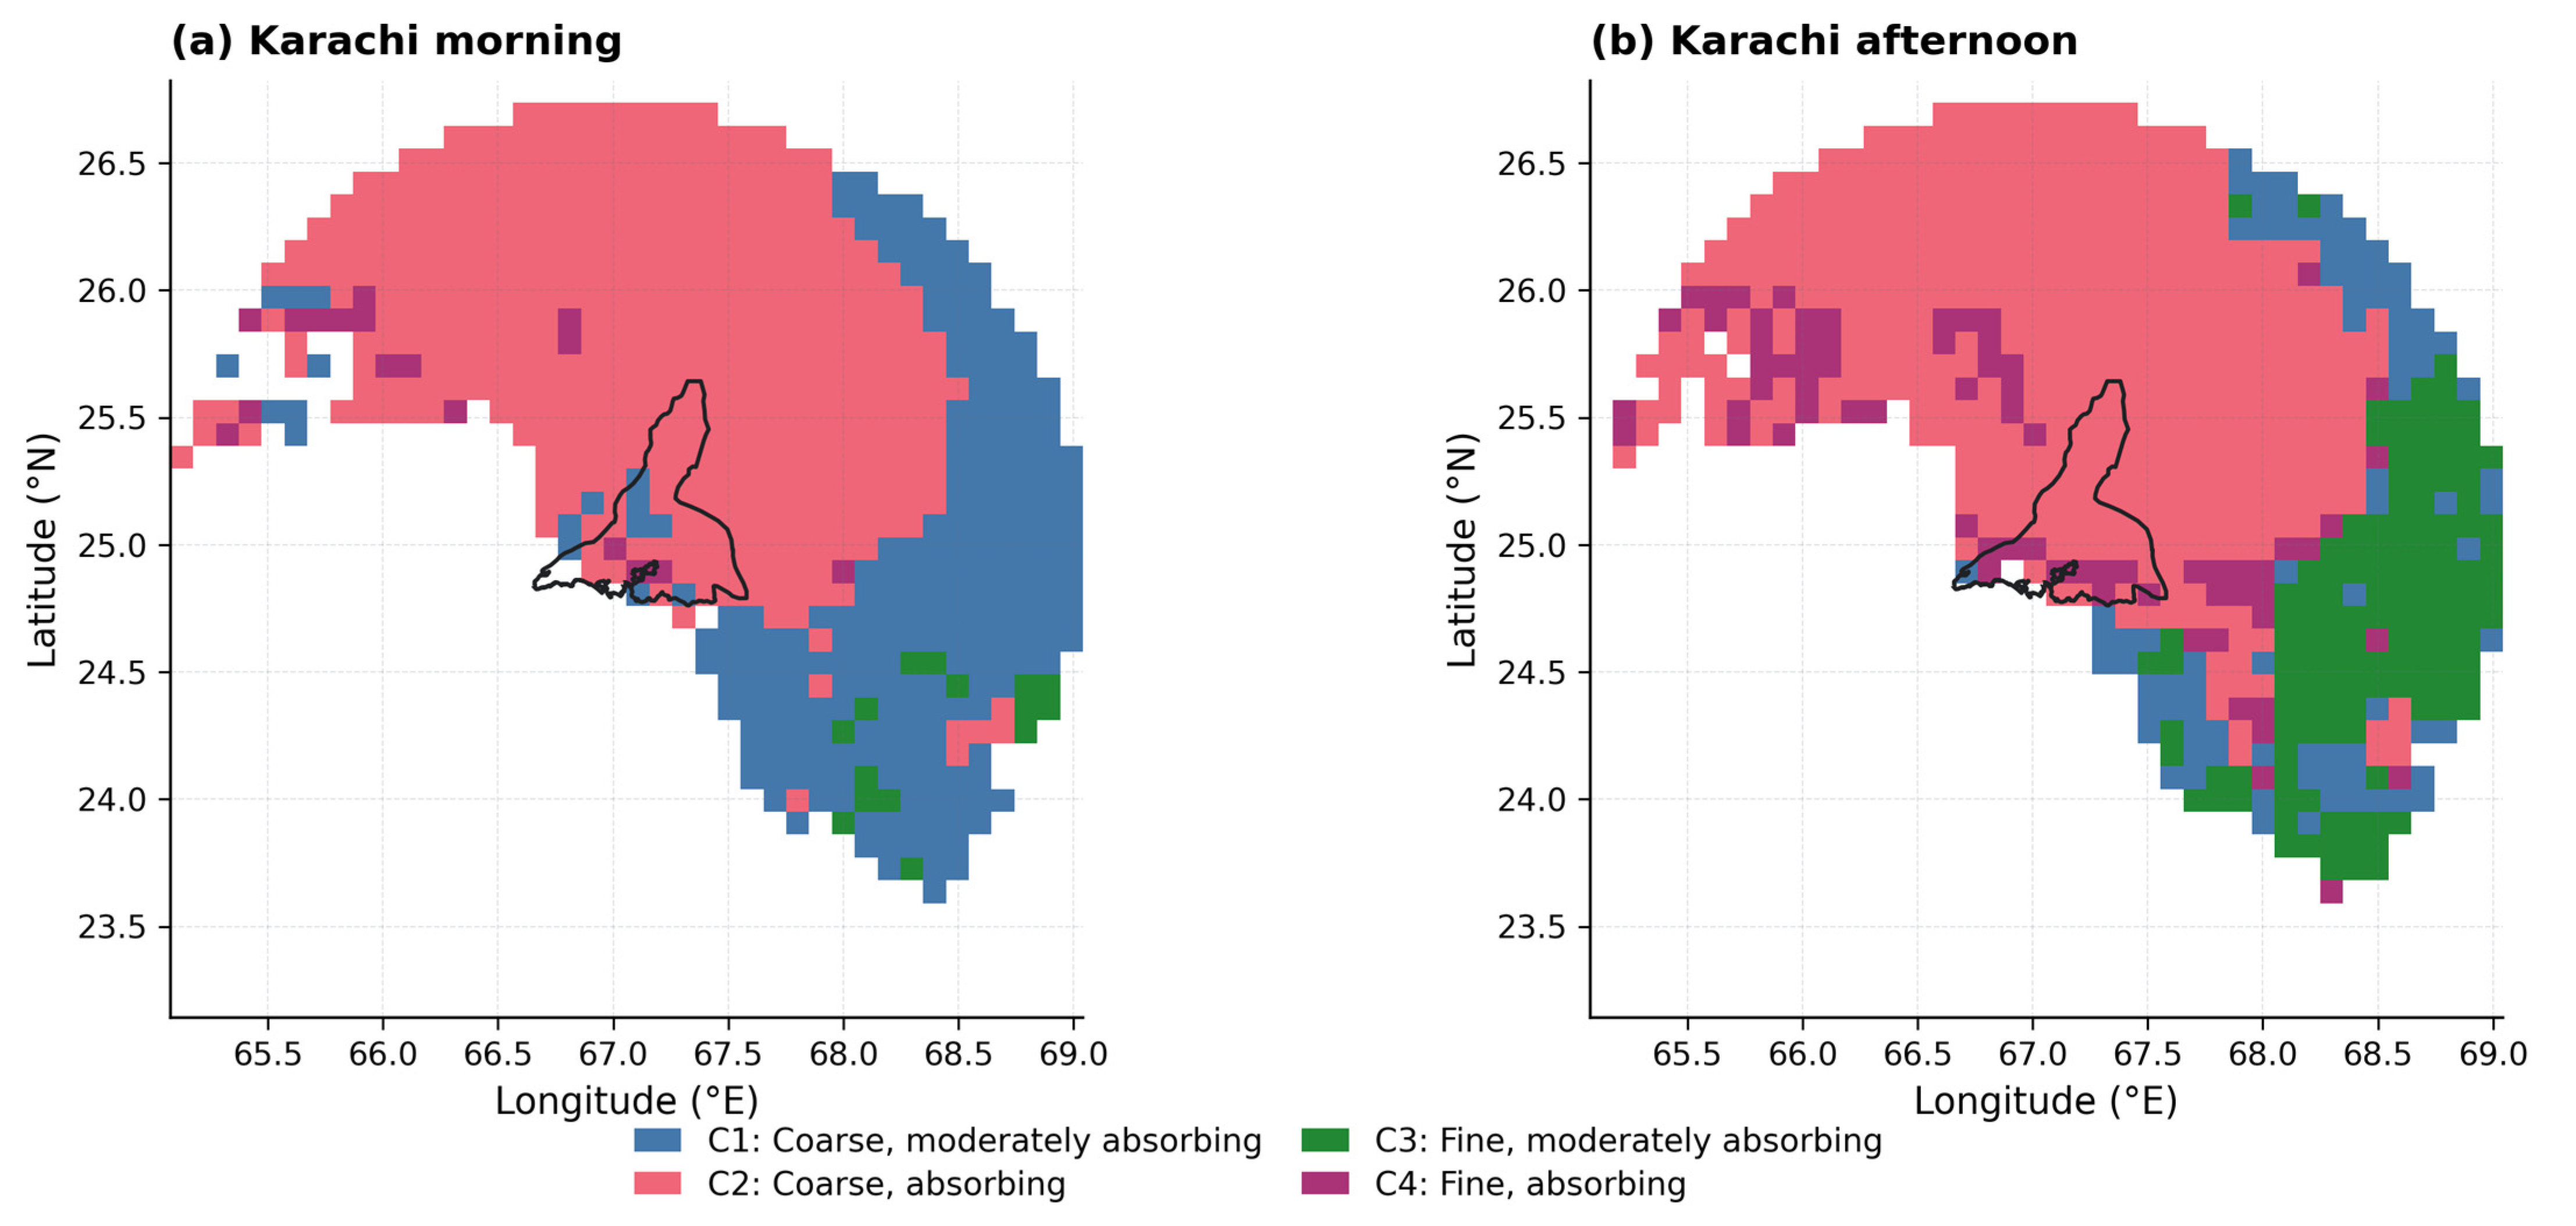
Figure 14 and Figure 15 displays the morning and afternoon aerosol regimes in Quetta and Karachi respectively obtained using the K-mean clustering. The four-cluster solutions had silhouette coefficients of 0.585 for Quetta and 0.555 for Karachi, with Davies–Bouldin indices of 0.654 and 0.636, respectively. Quetta contributed 511,743 valid cell-date observations to its joint model, and Karachi contributed 274,759.
Figure 14.
Spatial distribution of morning and afternoon aerosol regimes over Quetta.
Figure 15.
Spatial distribution of morning and afternoon aerosol regimes over Karachi.
In Quetta, the morning-to-afternoon share of the coarse–absorbing regime (C1) decreased by 3.50 percentage points, while the coarse–highly absorbing regime (C2) increased by 2.84 percentage points. The mixed-size–moderately absorbing regime (C3) decreased by 1.69 points, and the fine–absorbing regime (C4) increased by 2.35 points (Table 2). These changes indicate a modest redistribution among the four regimes.
Table 2.
Quetta city-specific AE–UVAI cluster centroids and morning–afternoon frequency changes.
In Karachi, the coarse moderately absorbing regime (C1) decreased by 12.68 percentage points and the coarse–absorbing regime (C2) by 1.41 points. The fine–moderately absorbing (C3) and fine–absorbing (C4) regimes increased by 3.36 and 10.73 points, respectively (Table 3). Together, the two coarse regimes decreased by 14.09 points, matched by a 14.09-point increase in the two fine regimes.
Table 3.
Karachi city-specific AE–UVAI cluster centroids and morning–afternoon frequency changes.
3.4.2. Monthly Climatology Aerosol Regimes
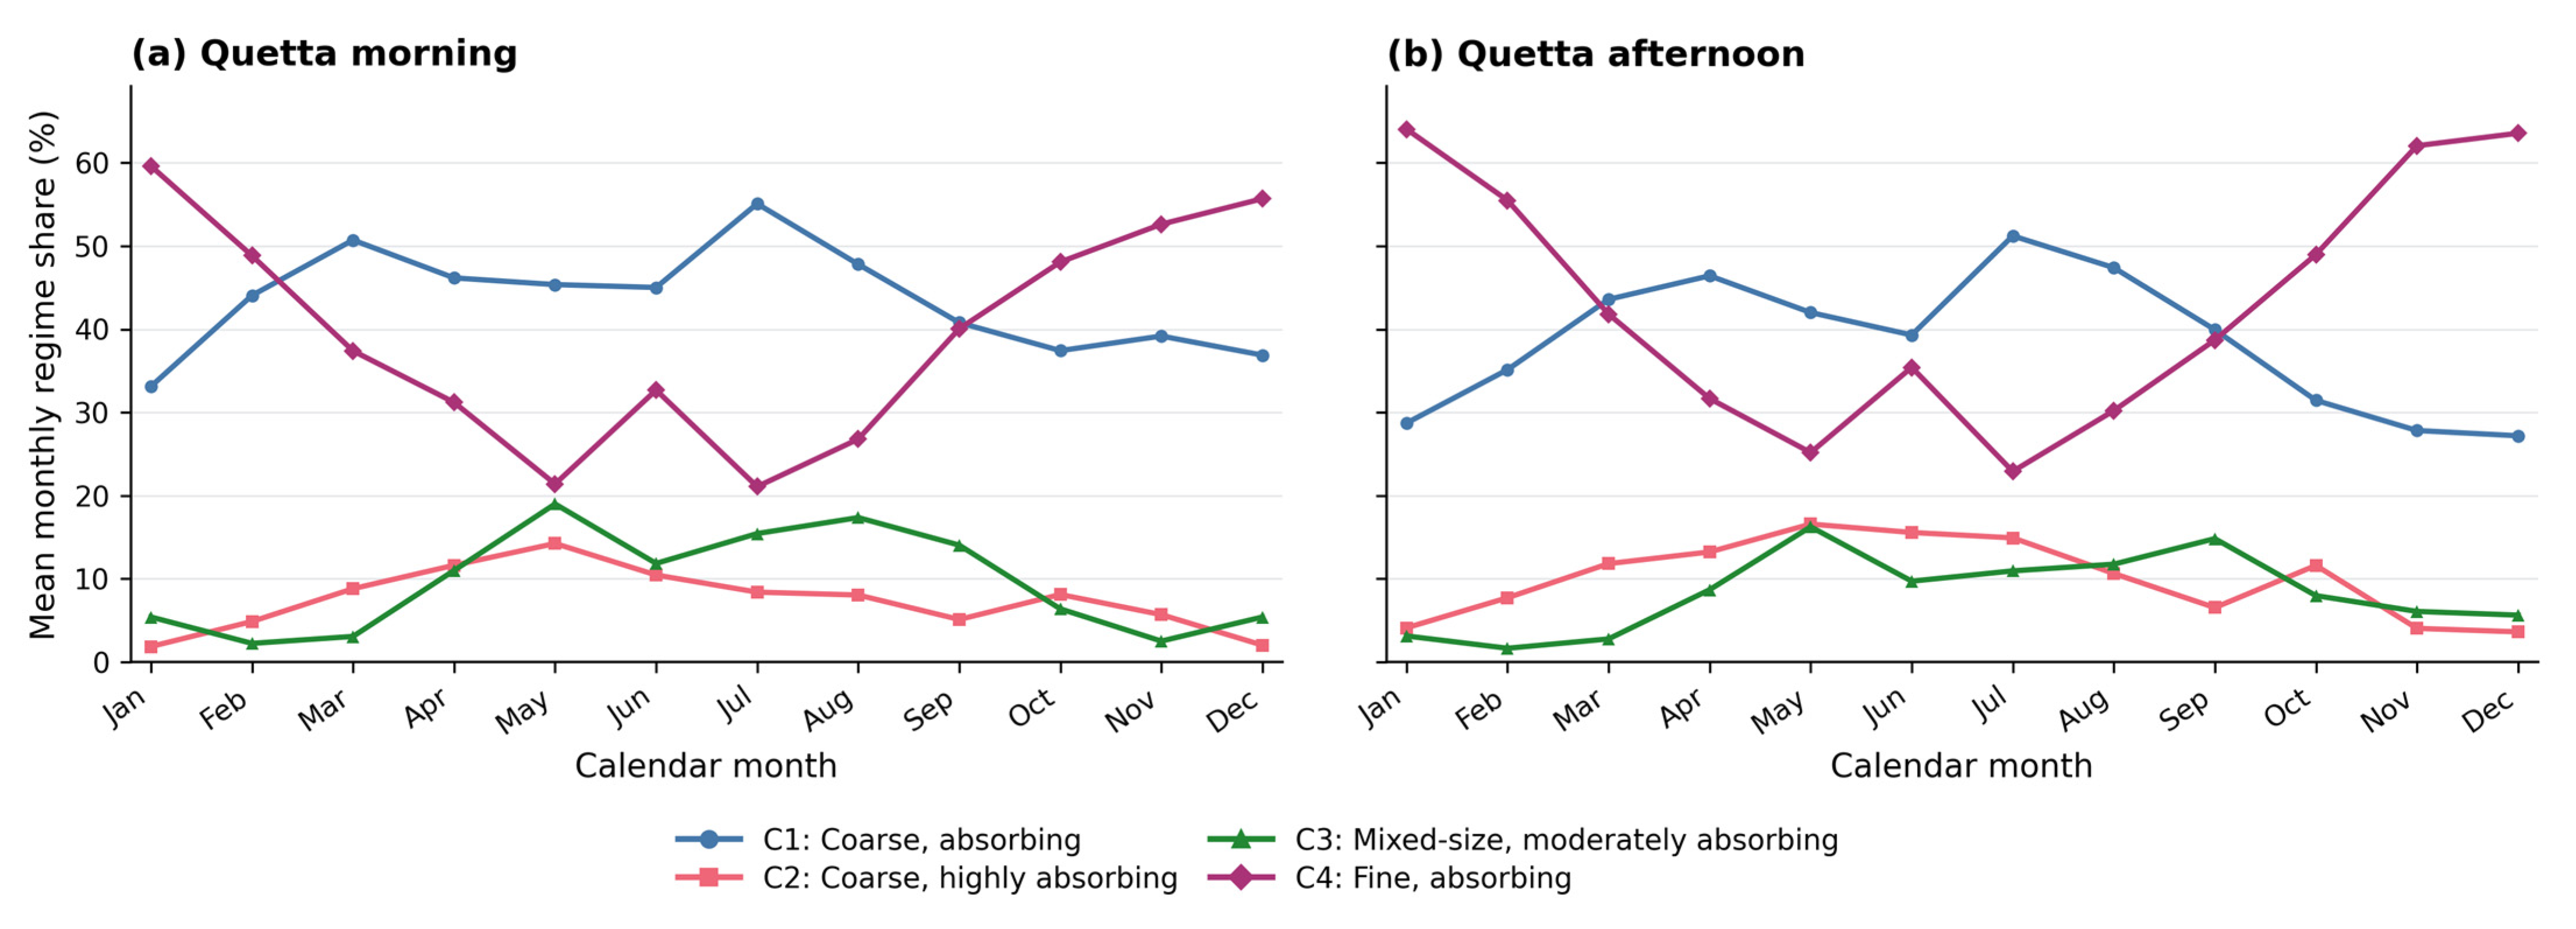
Quetta showed a similar monthly pattern in the morning and afternoon (Figure 16). The fine–absorbing regime (C4) was most frequent in January, accounting for 59.6% of morning and 64.0% of afternoon observations, but fell to 21.1% and 22.9% in July. Conversely, the coarse–absorbing regime (C1) reached its highest monthly shares in July: 55.1% in the morning and 51.2% in the afternoon. The smaller coarse–highly absorbing (C2) and mixed-size–moderately absorbing (C3) regimes both reached their highest shares in May.
Figure 16.
Multiyear monthly climatology of Quetta aerosol-regime shares for (a) morning and (b) afternoon observations.
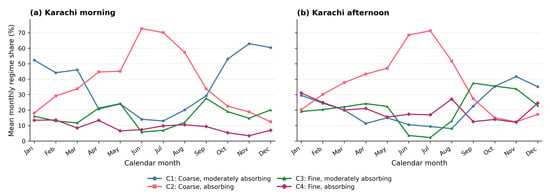
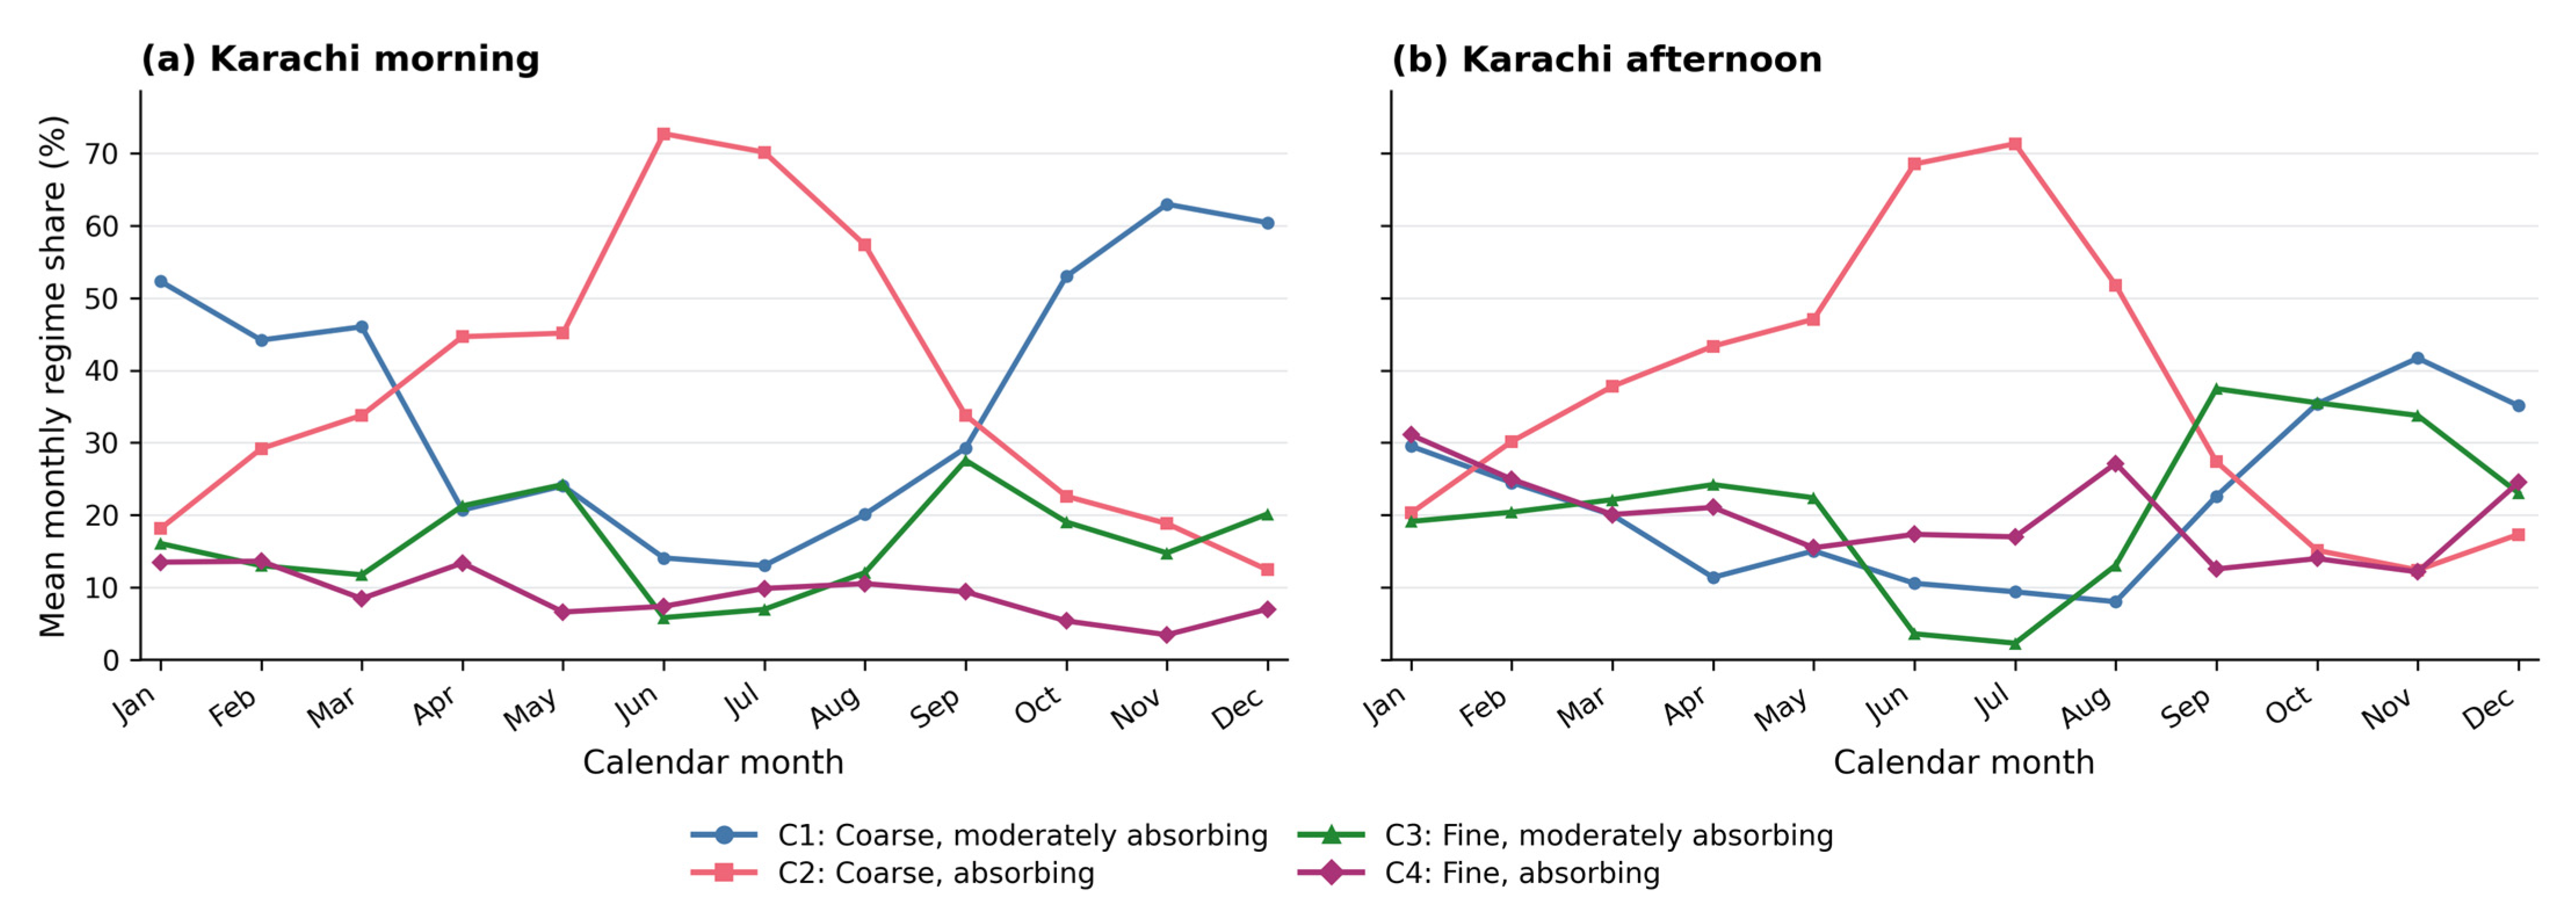
In Karachi, the coarse–absorbing regime (C2) dominated summer observations, reaching 72.7% in June mornings and 71.3% in July afternoons. (Figure 17). The coarse moderately absorbing regime (C1) was more prominent later in the year, peaking in November in both periods. Afternoon fine–moderately absorbing observations (C3) were most frequent in September, while the afternoon fine–absorbing share (C4) was highest in January. Each plotted month is the mean of the available year-specific percentages for that calendar month.
Figure 17.
Multiyear monthly climatology of Karachi aerosol-regime shares for (a) morning and (b) afternoon observations.
3.4.3. Annual Regime Trends
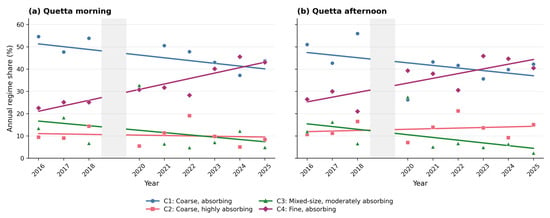
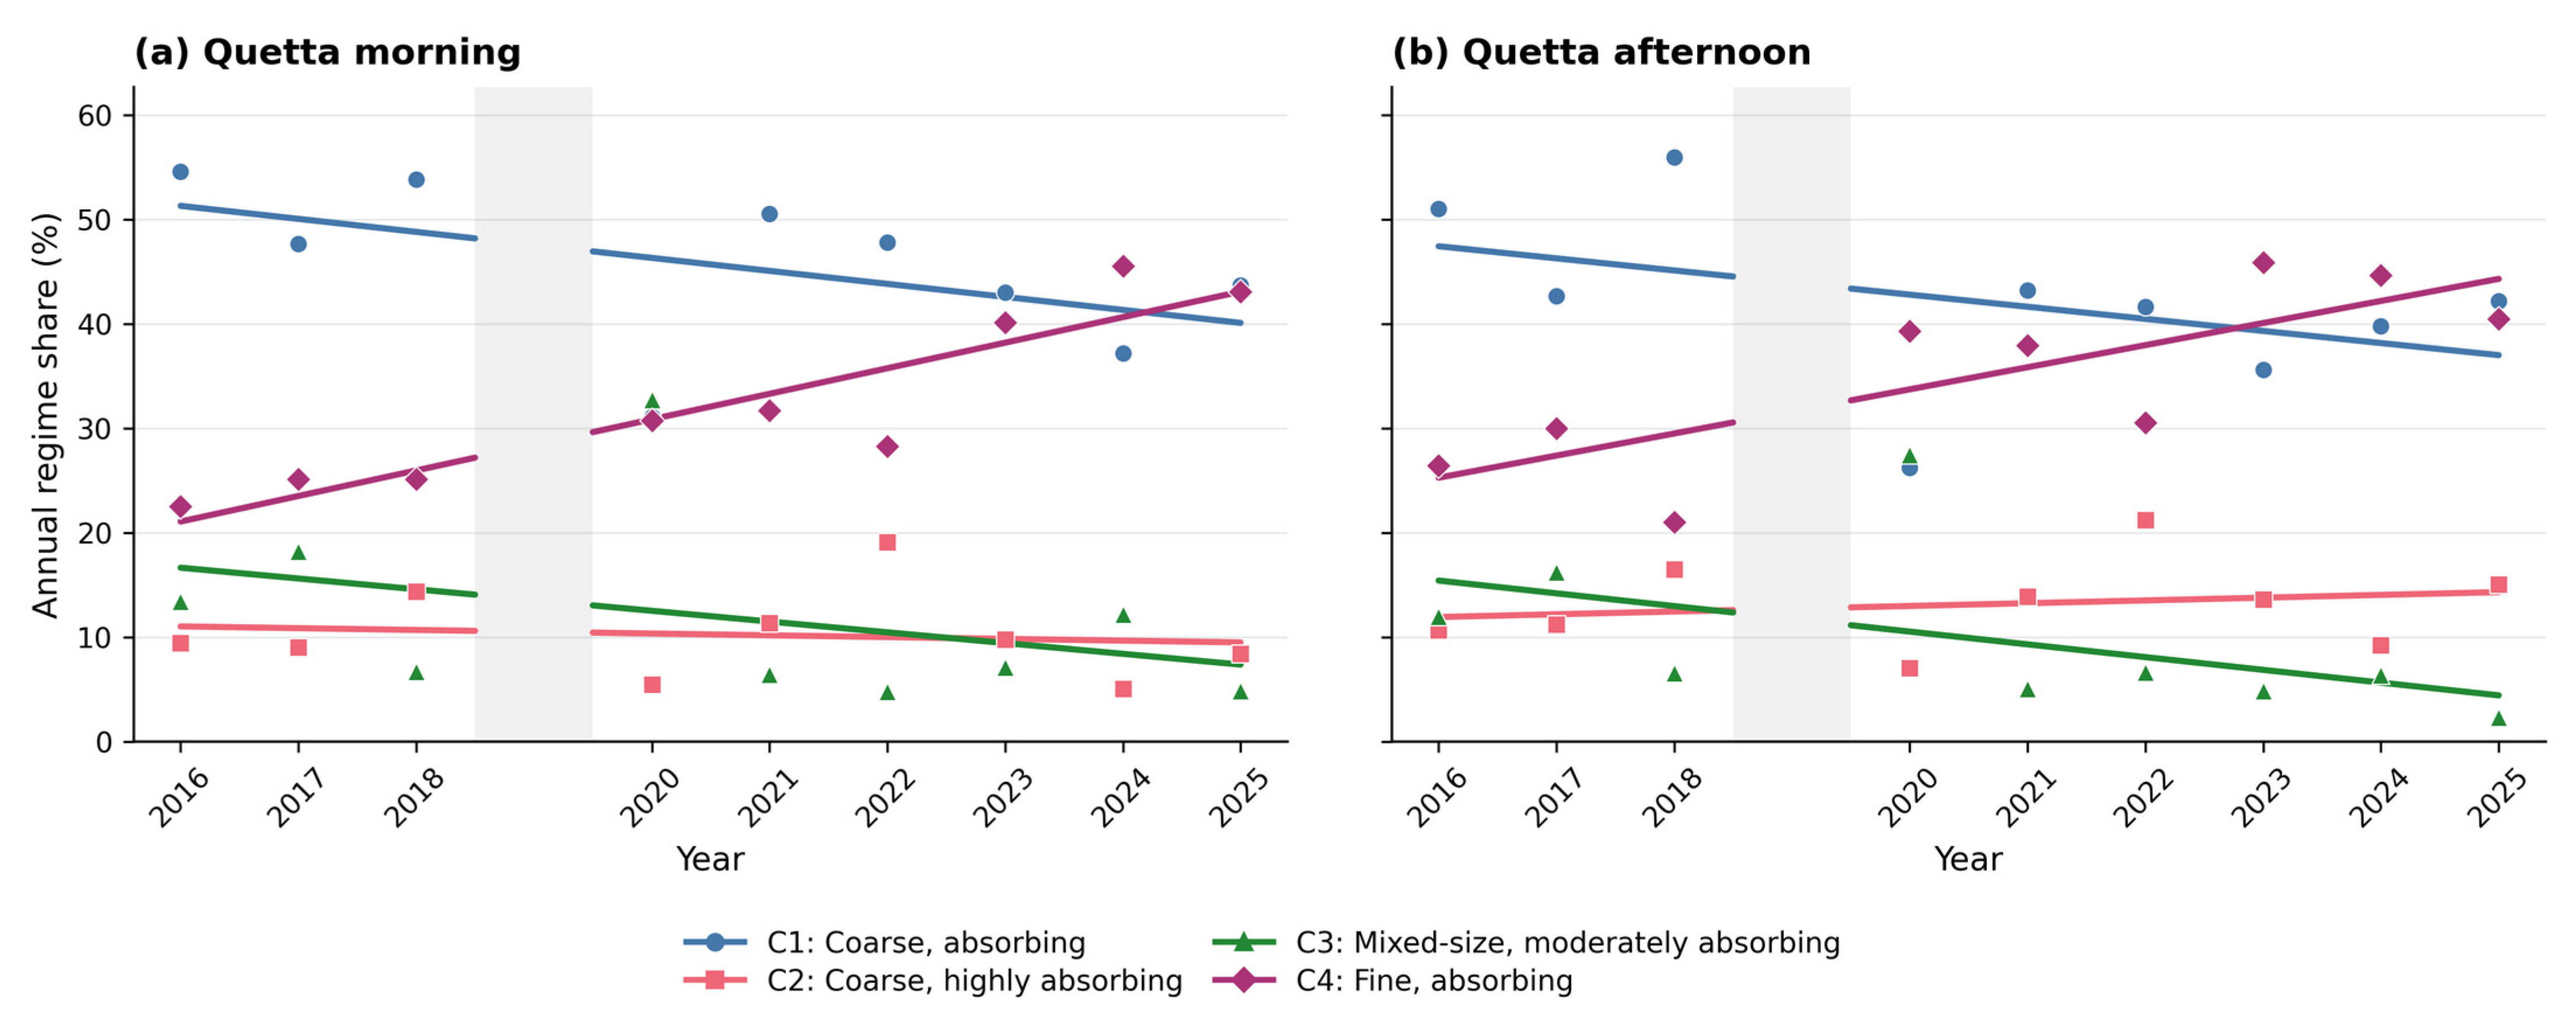
Figure 18 and Figure 19 show annual regime shares and their ordinary least-squares fits for the nine analyzed years. In Quetta, the fine–absorbing regime (C4) increased by 24.47 percentage points per decade in the morning (95% CI: 14.89–34.05; FDR-adjusted p = 0.0042). Its afternoon slope was also positive (+21.16 points per decade), but its FDR-adjusted p-value of 0.0503 did not meet the 0.05 threshold. None of the other Quetta regime trends remained significant after adjustment.
Figure 18.
Quetta annual Aerosol-regime shares for (a) morning and (b) afternoon observations, 2016–2025 excluding 2019.
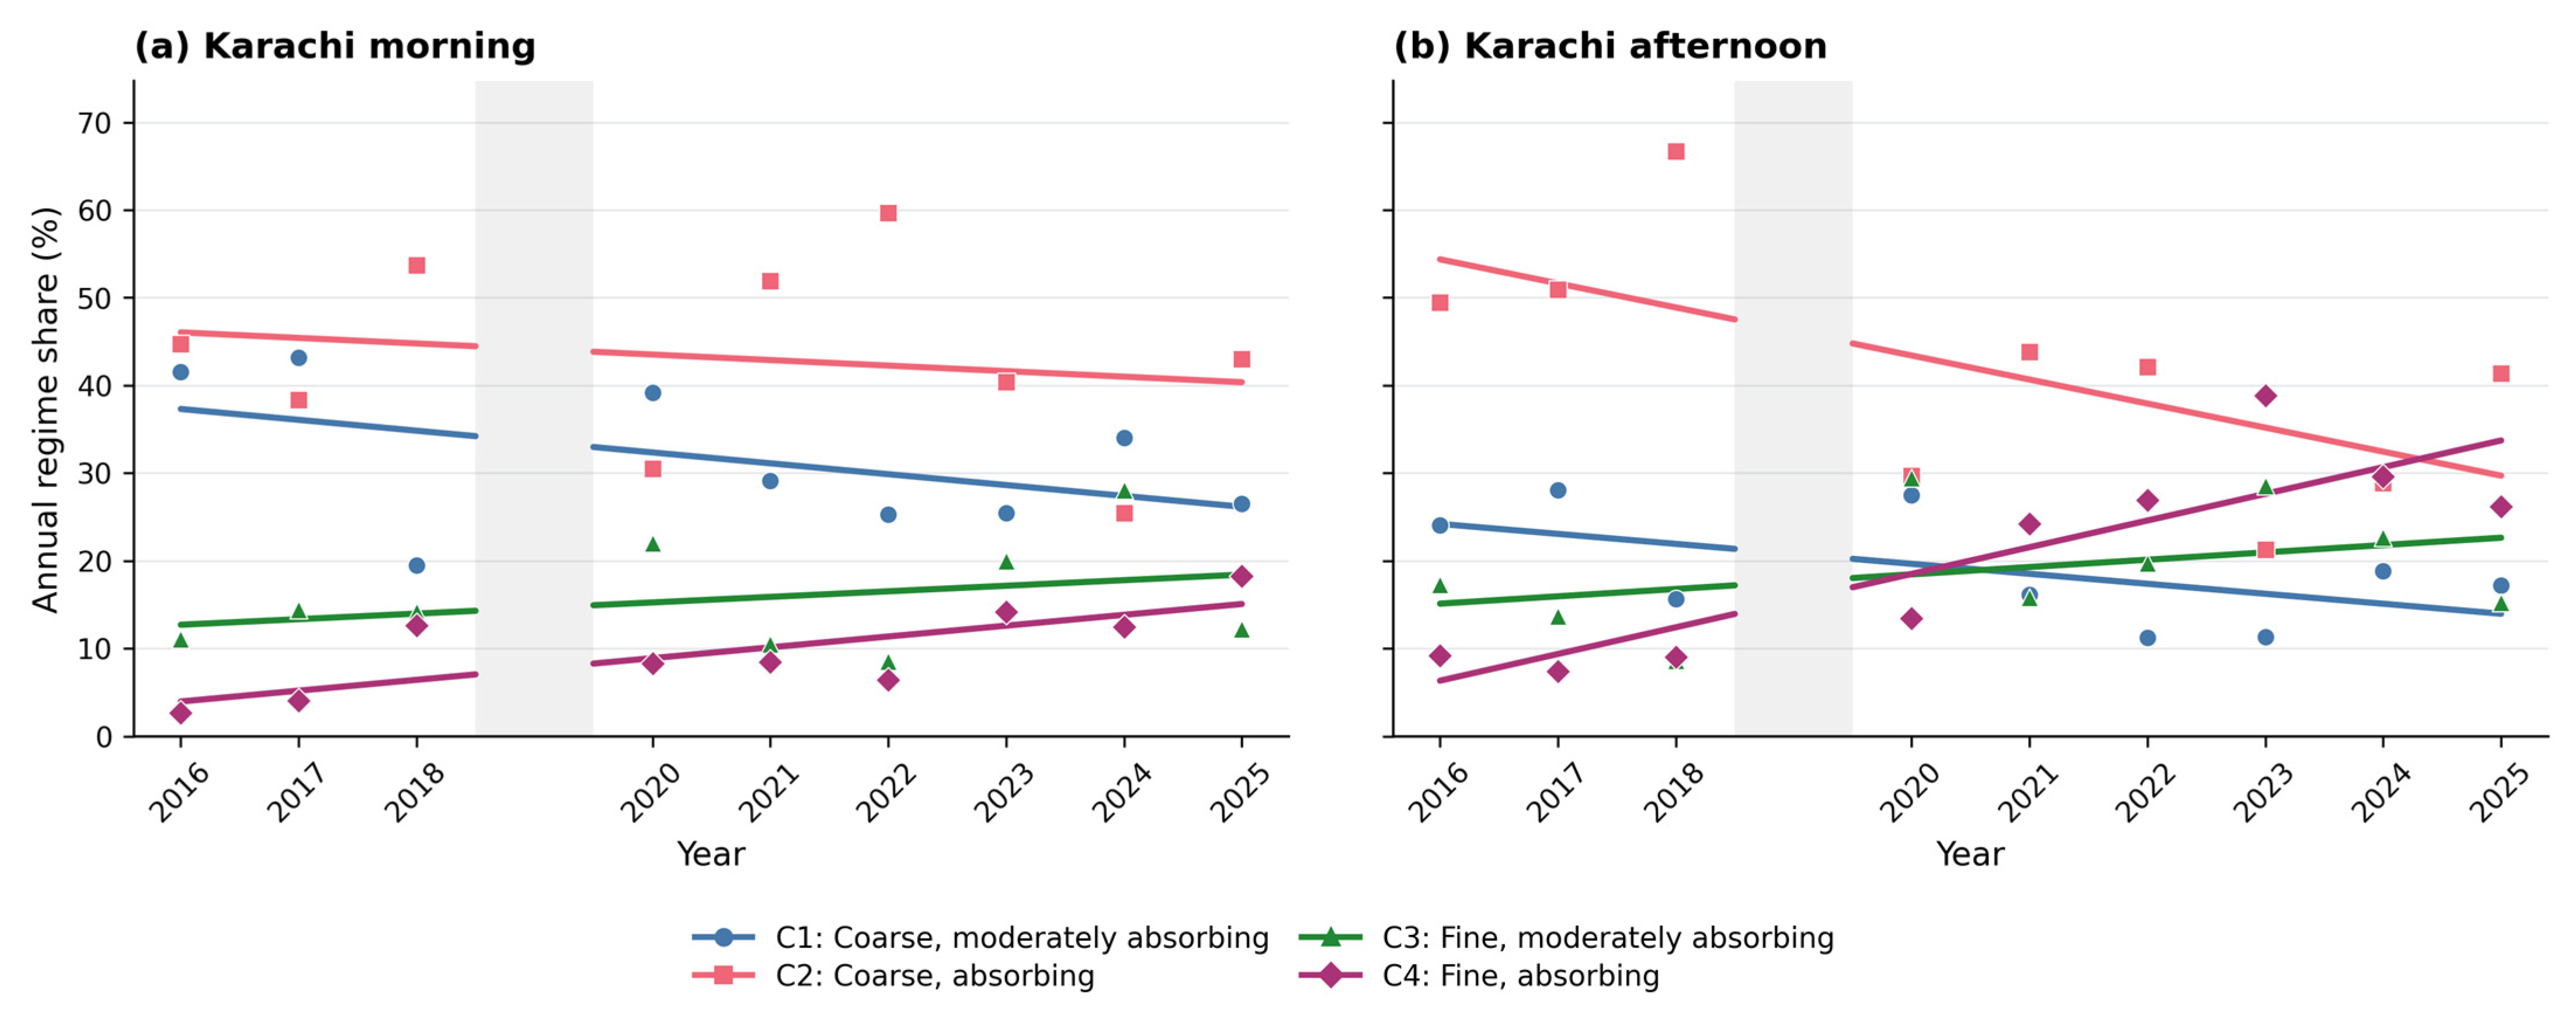
Figure 19.
Karachi annual aerosol-regime shares for (a) morning and (b) afternoon observations, 2016–2025 excluding 2019.
In Karachi, the fine–absorbing regime (C4) increased by 30.43 percentage points per decade in the afternoon (95% CI: 14.77–46.09; FDR-adjusted p = 0.0200). Its morning slope was +12.35 points per decade, but was not significant after adjustment (FDR-adjusted p = 0.0606). The other Karachi trends also did not remain significant after adjustment. Points in Figure 18 and Figure 19 represent observed annual shares; the straight lines are descriptive linear fits, with 2019 excluded.
4. Discussion
4.1. EPIC–AERONET Agreement
The quality-controlled Karachi comparison indicates moderate correspondence between EPIC and AERONET AOD, together with a persistent positive bias and substantial residual scatter. Performance was nearly identical for the two temporal windows: R2 was 0.392 for ±10 min and 0.388 for ±30 min, while RMSE was 0.200 and 0.203, respectively. Consequently, increasing the temporal window added matchups but did not materially improve or degrade agreement. These findings are broadly consistent with published EPIC evaluations showing useful aerosol information alongside sensitivity to viewing geometry, surface reflectance, clouds, and aerosol-model assumptions [26].
Only 51.5% and 50.2% of the ±10 min and ±30 min matchups, respectively, satisfied the expected-error criterion. Moreover, the positive intercepts of approximately 0.25 combined with slopes of approximately 0.64 indicate an elevated EPIC response at relatively low AOD and a compressed response across the observed AOD range. EPIC should therefore not be treated as interchangeable with point-based AERONET AOD or used for overconfident fine-scale absolute loading comparisons. The validation instead supports its use for cautiously interpreted regional and temporal aerosol patterns.
The 20 km EPIC neighborhood represents a spatial average, whereas AERONET measures a narrow atmospheric column. Point-to-area representativeness differences, residual subpixel clouds, viewing geometry, and surface-reflectance effects can therefore contribute to the remaining disagreement [25,26,47].
The Karachi validation cannot be transferred quantitatively to Quetta because the elevated, arid, mountainous Quetta domain differs substantially from Karachi in surface reflectance, elevation, topography, and aerosol environment. In particular, bright arid surfaces and complex terrain may introduce retrieval uncertainties that are not represented by the coastal validation. Therefore, the Quetta results are interpreted as internally consistent regional and temporal patterns rather than as independently validated absolute AOD values.
4.2. Contrasting Diurnal AOD Behavior
The strongest and most consistent diurnal result is the Quetta afternoon enhancement. Under the standardized daily representative-scene design, the nine annual paired means increased from 0.510 in the morning to 0.669 in the afternoon (ΔAOD = 0.159; 95% CI: 0.138–0.180; p < 0.001). The enhancement was also apparent in the equal-year spatial composites, all nine annual comparisons, the February–December monthly tests, and all four seasonal summaries. Daytime heating, slope and valley circulations, resuspension, and regional transport are physically plausible contributors in this arid mountain environment. However, boundary-layer development alone cannot explain the column AOD increase without corresponding evidence concerning emissions, transport, and vertical aerosol structure. Diurnal aerosol studies elsewhere also show that integrating ground, satellite, and modeled meteorology is necessary to separate accumulation, transport, and mixing [48].
Karachi showed a smaller but statistically significant overall afternoon enhancement. The paired annual means increased from 0.444 in the morning to 0.510 in the afternoon (ΔAOD = 0.066; 95% CI: 0.026–0.106; p = 0.005). Nevertheless, this contrast was less temporally uniform than that over Quetta. After FDR correction, significant monthly increases occurred only from March through July. The descriptive seasonal difference was negative in winter but positive in spring, summer, and autumn. The hourly climatology similarly increased from 0.448 at 09:00 to 0.570 at 13:00 PKT, then declined. This heterogeneity is consistent with competing influences from urban emissions, sea-breeze circulation, ventilation, hygroscopic growth, transported dust, and cloud-conditioned sampling.
To reduce temporal-sampling imbalance, the multiyear maps, annual summaries, monthly climatologies, seasonal series, and inferential comparisons used at most one representative morning and afternoon observation per day. Morning scenes were selected closest to 09:00 PKT within 08:00–10:00, and afternoon scenes closest to 13:30 PKT within 12:30–14:30. The hourly climatology was descriptive and used all quality-assured scenes from 08:00 through 16:59 PKT. Therefore, the hourly analysis excluded observations at 07:00 and 17:00.
4.3. Meteorological Spatial Associations
The spatial analysis suggests different patterns of meteorological correspondence in the two environments. WS ranked highest in Quetta’s morning field, while the long-term precipitation climatology ranked highest in its afternoon field. SP ranked highest in both Karachi periods, although morning RH was almost indistinguishable from SP to three decimal places. These rankings describe how spatial AOD differences align with the chosen factor strata; they do not identify independent meteorological effects. In particular, mean annual precipitation represents a persistent spatial climate gradient and cannot demonstrate rain-related removal during or shortly before an EPIC observation.
The fixed three-class rule avoids selecting the discretization that produces the largest observed q, and the five-cell intersection rule prevents reporting the six sparsest pairwise results. Nevertheless, combining two factors creates finer strata, which can increase q even without a physical interaction. These patterns are consistent with evidence that meteorology modulates aerosol loading and transport [5,6,49]. Spatial dependence, correlated predictors, and interpolation of ERA5 fields to the EPIC grid further limit interpretation. We therefore present the factor and interaction q values as exploratory spatial associations.
4.4. Aerosol Regimes and Interannual Change
The morning–afternoon redistribution was smaller in Quetta than in Karachi. Quetta showed increases in its coarse–highly absorbing and fine–absorbing regimes alongside decreases in its coarse–absorbing and mixed-size–moderately absorbing regimes. Karachi showed a larger, 14.09-percentage-point difference between combined coarse and fine regime shares. Cluster numbers identify separate city-specific models: for example, C1 in Quetta and C1 in Karachi should be interpreted through their respective AE and UVAI centroids rather than treated as the same aerosol type. The clusters are therefore aerosol regimes, not chemically verified dust, black carbon, sulfate, nitrate, or sea-salt classes. Similar AE–UVAI classification approaches can organize satellite observations, but source labels require independent evidence [50,51].
The strongest evidence for an adjusted annual trend concerns the fine–absorbing regime in Quetta mornings and Karachi afternoons. Annual regime shares sum to 100%, so these slopes describe changes in the composition of classified, matched observations, not changes in absolute aerosol amount. Differences in monthly coverage and possible sensor-related changes also limit the interpretation of the annual patterns; the present matching analysis does not independently quantify Terra/Aqua calibration or orbital-drift effects.
4.5. Contribution, Limitations and Implications
The methodological contribution is integrating established datasets and analytical methods into a workflow with explicit temporal sampling. Same-date morning–afternoon pairing and equal weighting of annual paired means reduce temporal sampling imbalance in the AOD comparison. Additionally, aerosol optical-regime and meteorological analyses extend the characterization beyond column loading. For example, Quetta exhibited the larger afternoon AOD enhancement, whereas Karachi showed the larger redistribution between coarse and fine optical regimes. Because these analyses use different temporal selections and matched samples, this comparison illustrates their complementary information rather than establishing a direct relationship between the two quantities. The approach provides a basis for similar observational assessments where data coverage is suitable.
Several limitations constrain the interpretation of the results. First, ground-based validation was possible only at Karachi because no suitable AERONET station was available within or near the Quetta domain during the study period. The observed EPIC performance over Karachi therefore cannot establish retrieval accuracy over Quetta’s elevated, bright, and topographically complex surface. Second, the EPIC archive begins in June 2015 and has incomplete coverage during the latter half of 2019, January 2020, and August–September 2025. We excluded the severely incomplete 2015 and 2019 years from the multiyear maps and annual, monthly, and hourly analyses. Seasonal values were retained only when at least two constituent months were available. Unequal observation numbers among hours, months, and years nevertheless remain an important limitation.
We matched the Terra and Aqua samples to EPIC using their estimated observation times, but this procedure does not hold the MODIS local overpass time constant across years or independently assess changes in AE calibration. Consequently, the annual regime-share slopes describe the matched satellite sample and cannot, on their own, establish long-term changes in aerosol microphysics or source emissions.
Accordingly, the most defensible conclusions are the stronger, more temporally consistent Quetta enhancement and the smaller, seasonally heterogeneous but statistically significant Karachi enhancement; the morning–afternoon differences in meteorological spatial associations; and the observed redistribution of aerosol regimes. Future work should add AERONET or other column observations near Quetta, analyze aerosol vertical structure and trajectories, and combine aerosol classifications with chemical measurements or source-oriented models.
5. Conclusions
This study combined available 2015–2025 DSCOVR EPIC AOD and UVAI, MODIS AE, ERA5 meteorology, and Karachi AERONET observations to compare inland Quetta with coastal Karachi. The Karachi evaluation showed moderate EPIC–AERONET agreement, indicating that EPIC captured part of the temporal variability measured from the ground. Standardized selection of morning and afternoon EPIC observations, followed by paired comparisons balanced across years, revealed a persistent afternoon AOD enhancement over Quetta and a smaller, more seasonally variable enhancement over Karachi. These two cases show that daytime aerosol behavior can differ in both magnitude and seasonal consistency.
In the GeoDetector analysis, wind speed had the strongest spatial association with AOD in Quetta mornings, while long-term mean annual precipitation ranked highest in afternoons. In Karachi, surface pressure ranked highest in both periods, with relative humidity showing a nearly equal association in the morning. Quetta showed a modest shift toward stronger absorbing regimes, whereas Karachi showed a larger shift from coarse- to fine-particle-dominated regimes.
For 2016–2025, excluding 2019, the proportions of coarse regimes generally declined, while fine–absorbing regimes increased in the morning and afternoon samples of both cities. This work offers a documented approach to combining satellite observations, reanalysis meteorology, and available ground measurements to characterize diurnal aerosol variability in sparsely monitored regions. The Quetta and Karachi applications show how this approach quantifies differences in the magnitude and seasonal persistence of daytime AOD contrasts while separately describing optical-regime distributions and meteorological spatial associations. Its potential application to other regions depends on suitable observational coverage. Future studies should incorporate additional ground-based observations, aerosol vertical-profile measurements, and air-mass trajectories to better determine the mechanisms responsible for the observed patterns.
Author Contributions
H.J.: Conceptualization, methodology, software, validation, formal analysis, investigation, data curation, visualization, writing—original draft, and writing—review and editing. X.S.: Conceptualization, supervision, funding acquisition, project administration, and writing—review and editing. X.L.: Investigation, data curation, funding acquisition, and writing—review and editing. All authors have read and agreed to the published version of the manuscript.
Funding
This research was funded by the Aerospace Science and Technology Innovation Application Research Project, grant E23Y0H555S1, and the Aviation Science and Technology Innovation Application Research Project, grant 62502510201.
Data Availability Statement
DSCOVR EPIC Level 2 UV Aerosol Version 3 data (DSCOVR_EPIC_L2_AER_03) and MODIS Terra/Aqua Collection 6.1 Level 2 aerosol products (MOD04_L2 and MYD04_L2) are available through NASA Earthdata (https://search.earthdata.nasa.gov). ERA5 hourly single-level data are available through the Copernicus Climate Data Store (https://cds.climate.copernicus.eu). The AERONET Version 3 Level 2.0 aerosol optical depth data used in this study are publicly available from the AERONET website Aerosol Robotic Network (AERONET) Homepage (https://aeronet.gsfc.nasa.gov/).
Acknowledgments
The authors acknowledge the China Scholarship Council, the University of Science and Technology of China, the Chinese Academy of Sciences, and the Hefei Institutes of Physical Science for institutional support. The authors thank NASA, the AERONET principal investigators and site managers, and ECMWF/Copernicus for providing the datasets used in this study.
Conflicts of Interest
The authors declare no conflicts of interest.
Abbreviations
The following abbreviations are used in this manuscript:
| AE | Ångström exponent |
| AOD | Aerosol Optical Depth |
| AERONET | Aerosol Robotic Network |
| UVAI | Ultraviolet Aerosol Index |
| DSCOVR | Deep Space Climate Observatory |
| EPIC | Earth Polychromatic Imaging Camera |
| ERA5 | Fifth-generation ECMWF atmospheric reanalysis |
| BLH | Boundary-Layer Height |
| FDR | False discovery rate |
| MODIS | Moderate Resolution Imaging Spectroradiometer |
| PKT | Pakistan Standard Time |
| SP | Surface Pressure |
| T2M | 2 m air temperature |
| TCW | Total Column Water |
| RH | Relative Humidity |
| WS | Wind Speed |
| PREC | Precipitation |
References
- Kommalapati, R.R.; Valsaraj, K.T. Atmospheric aerosols and their importance. In Atmospheric Aerosols; ACS Symposium Series; American Chemical Society: Washington, DC, USA, 2009; Volume 1005, pp. 1–10. [Google Scholar] [CrossRef] [Scilit]
- Che, H.; Xia, X.; Zhao, H.; Li, L.; Gui, K.; Zheng, Y.; Song, J.; Qi, B.; Zhu, J.; Miao, Y.; et al. Aerosol optical and radiative properties and their environmental effects in China: A review. Earth-Sci. Rev. 2024, 248, 104634. [Google Scholar] [CrossRef] [Scilit]
- Li, J.; Carlson, B.E.; Yung, Y.L.; Lv, D.; Hansen, J.; Penner, J.E.; Liao, H.; Ramaswamy, V.; Kahn, R.A.; Zhang, P.; et al. Scattering and absorbing aerosols in the climate system. Nat. Rev. Earth Environ. 2022, 3, 363–379. [Google Scholar] [CrossRef] [Scilit]
- Perumpully, S.J.; Gautam, S. Impact of aerosols on atmospheric processes and climate variability: A synthesis of recent research findings. Geosyst. Geoenviron. 2025, 4, 100317. [Google Scholar] [CrossRef] [Scilit]
- Che, H.; Gui, K.; Xia, X.; Wang, Y.; Holben, B.N.; Goloub, P.; Cuevas-Agulló, E.; Wang, H.; Zheng, Y.; Zhao, H.; et al. Large contribution of meteorological factors to inter-decadal changes in regional aerosol optical depth. Atmos. Chem. Phys. 2019, 19, 10497–10523. [Google Scholar] [CrossRef] [Scilit]
- Zhao, T.L.; Gong, S.L.; Huang, P.; Lavoué, D. Hemispheric transport and influence of meteorology on global aerosol climatology. Atmos. Chem. Phys. 2012, 12, 7609–7624. [Google Scholar] [CrossRef] [Scilit]
- Smirnov, A.; Holben, B.N.; Eck, T.F.; Slutsker, I.; Chatenet, B.; Pinker, R.T. Diurnal variability of aerosol optical depth observed at AERONET (Aerosol Robotic Network) sites. Geophys. Res. Lett. 2002, 29, 2115. [Google Scholar] [CrossRef] [Scilit]
- Arola, A.; Eck, T.F.; Huttunen, J.; Lehtinen, K.E.J.; Lindfors, A.V.; Myhre, G.; Smirnov, A.; Tripathi, S.N.; Yu, H. Influence of observed diurnal cycles of aerosol optical depth on aerosol direct radiative effect. Atmos. Chem. Phys. 2013, 13, 7895–7901. [Google Scholar] [CrossRef] [Scilit]
- Torres, O.; Ahn, C. Local and regional diurnal variability of aerosol properties retrieved by DSCOVR/EPIC UV algorithm. J. Geophys. Res. Atmos. 2024, 129, e2023JD039908. [Google Scholar] [CrossRef] [Scilit]
- Che, Y.; Yang, L.; She, L.; Leys, J.; Yang, X. Tracking spatiotemporal dynamics of dust aerosols in China: Emissions, transport, and mitigation insights. J. Hazard. Mater. 2025, 500, 140576. [Google Scholar] [CrossRef] [Scilit]
- Anwar, M.N.; Shabbir, M.; Tahir, E.; Iftikhar, M.; Saif, H.; Tahir, A.; Murtaza, M.A.; Khokhar, M.F.; Rehan, M.; Aghbashlo, M.; et al. Emerging challenges of air pollution and particulate matter in China, India, and Pakistan and mitigating solutions. J. Hazard. Mater. 2021, 416, 125851. [Google Scholar] [CrossRef] [Scilit]
- Khokhar, M.F.; Yasmin, N.; Chishtie, F.; Shahid, I. Temporal variability and characterization of aerosols across the Pakistan region during the winter fog periods. Atmosphere 2016, 7, 67. [Google Scholar] [CrossRef] [Scilit]
- Ilyas, S.Z.; Khattak, A.I.; Nasir, S.M.; Qurashi, T.; Durrani, R. Air pollution assessment in urban areas and its impact on human health in the city of Quetta, Pakistan. Clean Technol. Environ. Policy 2010, 12, 291–299. [Google Scholar] [CrossRef] [Scilit]
- Hussain, M.; Akhtar, F.; Khan, S.S. Impact and ratio of lead in ambient air from vehicular emission in Quetta Valley, Pakistan. IOP Conf. Ser. Mater. Sci. Eng. 2018, 414, 012044. [Google Scholar] [CrossRef] [Scilit]
- Leghari, S.K.; Zaidi, M.A.; Ahmed, M.; Sarangzai, A.M. Assessment of suspended particulate matter levels and role of vegetation in ambient air of north-east Balochistan, Pakistan. FUUAST J. Biol. 2013, 3, 37–43. Available online: https://fuuastjb.org/index.php/fuuastjb/article/view/234 (accessed on 30 November 2025). [CrossRef] [Scilit]
- Ahmad, M.; Tariq, S.; Alam, K.; Anwar, S.; Ikram, M. Long-term variation in aerosol optical properties and their climatic implications over major cities of Pakistan. J. Atmos. Sol.-Terr. Phys. 2020, 210, 105419. [Google Scholar] [CrossRef] [Scilit]
- Khalid, B.; Khalid, A.; Muslim, S.; Habib, A.; Khan, K.; Alvim, D.S.; Shakoor, S.; Mustafa, S.; Zaheer, S.; Zoon, M.; et al. Estimation of aerosol optical depth in relation to meteorological parameters over eastern and western routes of China Pakistan economic corridor. J. Environ. Sci. 2021, 99, 28–39. [Google Scholar] [CrossRef] [Scilit]
- Alam, K.; Trautmann, T.; Blaschke, T.; Majid, H. Aerosol optical and radiative properties during summer and winter seasons over Lahore and Karachi. Atmos. Environ. 2012, 50, 234–245. [Google Scholar] [CrossRef] [Scilit]
- Bajwa, A.U.; Sheikh, H.A. Contribution of road transport to Pakistan’s air pollution in the urban environment. Air 2023, 1, 237–257. [Google Scholar] [CrossRef] [Scilit]
- Mansha, M.; Ghauri, B.; Rahman, S.; Amman, A. Characterization and source apportionment of ambient air particulate matter (PM2.5) in Karachi. Sci. Total Environ. 2012, 425, 176–183. [Google Scholar] [CrossRef] [Scilit]
- Bibi, S.; Alam, K.; Chishtie, F.; Bibi, H.; Rahman, S. Temporal variation of black carbon concentration using Aethalometer observations and its relationships with meteorological variables in Karachi, Pakistan. J. Atmos. Sol.-Terr. Phys. 2017, 157–158, 67–77. [Google Scholar] [CrossRef] [Scilit]
- Chen, P.; Kang, S.; Gul, C.; Tripathee, L.; Wang, X.; Hu, Z.; Li, C.; Pu, T. Seasonality of carbonaceous aerosol composition and light absorption properties in Karachi, Pakistan. J. Environ. Sci. 2020, 90, 286–296. [Google Scholar] [CrossRef] [Scilit]
- Wei, X.; Chang, N.-B.; Bai, K.; Gao, W. Satellite remote sensing of aerosol optical depth: Advances, challenges, and perspectives. Crit. Rev. Environ. Sci. Technol. 2020, 50, 1640–1725. [Google Scholar] [CrossRef] [Scilit]
- Holben, B.N.; Eck, T.F.; Slutsker, I.; Tanré, D.; Buis, J.P.; Setzer, A.; Vermote, E.; Reagan, J.A.; Kaufman, Y.J.; Nakajima, T.; et al. AERONET—A federated instrument network and data archive for aerosol characterization. Remote Sens. Environ. 1998, 66, 1–16. [Google Scholar] [CrossRef] [Scilit]
- Giles, D.M.; Sinyuk, A.; Sorokin, M.G.; Schafer, J.S.; Smirnov, A.; Slutsker, I.; Eck, T.F.; Holben, B.N.; Lewis, J.R.; Campbell, J.R.; et al. Advancements in the Aerosol Robotic Network (AERONET) Version 3 database—Automated near-real-time quality control algorithm with improved cloud screening for Sun photometer aerosol optical depth measurements. Atmos. Meas. Tech. 2019, 12, 169–209. [Google Scholar] [CrossRef] [Scilit]
- Ahn, C.; Torres, O.; Jethva, H.; Tiruchirapalli, R.; Huang, L.-K. Evaluation of aerosol properties observed by DSCOVR/EPIC instrument from the Earth–Sun Lagrange 1 orbit. J. Geophys. Res. Atmos. 2021, 126, e2020JD033651. [Google Scholar] [CrossRef] [Scilit]
- Ali, G.; Bao, Y.; Boiyo, R.; Tang, W.; Lu, Q.; Min, J. Evaluating MODIS and MISR aerosol optical depth retrievals over environmentally distinct sites in Pakistan. J. Atmos. Sol.-Terr. Phys. 2019, 183, 19–35. [Google Scholar] [CrossRef] [Scilit]
- Gupta, P.; Khan, M.N.; da Silva, A.; Patadia, F. MODIS aerosol optical depth observations over urban areas in Pakistan: Quantity and quality of the data for air quality monitoring. Atmos. Pollut. Res. 2013, 4, 43–52. [Google Scholar] [CrossRef] [Scilit]
- Jin, J.; Henzing, B.; Segers, A. How aerosol size matters in aerosol optical depth (AOD) assimilation and the optimization using the Ångström exponent. Atmos. Chem. Phys. 2023, 23, 1641–1660. [Google Scholar] [CrossRef] [Scilit]
- Eck, T.F.; Holben, B.N.; Reid, J.S.; Dubovik, O.; Smirnov, A.; O’Neill, N.T.; Slutsker, I.; Kinne, S. Wavelength dependence of the optical depth of biomass burning, urban, and desert dust aerosols. J. Geophys. Res. Atmos. 1999, 104, 31333–31349. [Google Scholar] [CrossRef] [Scilit]
- Schuster, G.L.; Dubovik, O.; Holben, B.N. Angstrom exponent and bimodal aerosol size distributions. J. Geophys. Res. Atmos. 2006, 111, D07207. [Google Scholar] [CrossRef] [Scilit]
- Gobbi, G.P.; Kaufman, Y.J.; Koren, I.; Eck, T.F. Classification of aerosol properties derived from AERONET direct sun data. Atmos. Chem. Phys. 2007, 7, 453–458. [Google Scholar] [CrossRef] [Scilit]
- Khan, M.; Tariq, S.; Ul Haq, Z. An investigation of the ultraviolet aerosol index and Ångström exponent and their relationship with meteorological parameters over Nigeria using satellite remote sensing. Pure Appl. Geophys. 2024, 181, 2651–2676. [Google Scholar] [CrossRef] [Scilit]
- Torres, O.; Bhartia, P.K.; Herman, J.R.; Ahmad, Z.; Gleason, J. Derivation of aerosol properties from satellite measurements of backscattered ultraviolet radiation: Theoretical basis. J. Geophys. Res. Atmos. 1998, 103, 17099–17110. [Google Scholar] [CrossRef] [Scilit]
- Torres, O.; Tanskanen, A.; Veihelmann, B.; Ahn, C.; Braak, R.; Bhartia, P.K.; Veefkind, P.; Levelt, P. Aerosols and surface UV products from Ozone Monitoring Instrument observations: An overview. J. Geophys. Res. Atmos. 2007, 112, D24S47. [Google Scholar] [CrossRef] [Scilit]
- Kayetha, V.; Torres, O.; Jethva, H. Retrieval of UV–visible aerosol absorption using AERONET and OMI–MODIS synergy: Spatial and temporal variability across major aerosol environments. Atmos. Meas. Tech. 2022, 15, 845–877. [Google Scholar] [CrossRef] [Scilit]
- Hsu, N.C.; Jeong, M.-J.; Bettenhausen, C.; Sayer, A.M.; Hansell, R.; Seftor, C.S.; Huang, J.; Tsay, S.-C. Enhanced Deep Blue aerosol retrieval algorithm: The second generation. J. Geophys. Res. Atmos. 2013, 118, 9296–9315. [Google Scholar] [CrossRef] [Scilit]
- Levy, R.C.; Mattoo, S.; Munchak, L.A.; Remer, L.A.; Sayer, A.M.; Patadia, F.; Hsu, N.C. The Collection 6 MODIS aerosol products over land and ocean. Atmos. Meas. Tech. 2013, 6, 2989–3034. [Google Scholar] [CrossRef] [Scilit]
- Sayer, A.M.; Hsu, N.C.; Bettenhausen, C.; Jeong, M.-J.; Meister, G. Effect of MODIS Terra radiometric calibration improvements on Collection 6 Deep Blue aerosol products: Validation and Terra/Aqua consistency. J. Geophys. Res. Atmos. 2015, 120, 12157–12174. [Google Scholar] [CrossRef] [Scilit]
- Sayer, A.M.; Hsu, N.C.; Lee, J.; Kim, W.V.; Dutcher, S.T. Validation, stability, and consistency of MODIS Collection 6.1 and VIIRS Version 1 Deep Blue aerosol data over land. J. Geophys. Res. Atmos. 2019, 124, 4658–4688. [Google Scholar] [CrossRef] [Scilit]
- Hersbach, H.; Bell, B.; Berrisford, P.; Hirahara, S.; Horányi, A.; Muñoz-Sabater, J.; Nicolas, J.; Peubey, C.; Radu, R.; Schepers, D.; et al. The ERA5 global reanalysis. Q. J. R. Meteorol. Soc. 2020, 146, 1999–2049. [Google Scholar] [CrossRef] [Scilit]
- Benjamini, Y.; Hochberg, Y. Controlling the false discovery rate: A practical and powerful approach to multiple testing. J. R. Stat. Soc. Ser. B 1995, 57, 289–300. [Google Scholar] [CrossRef] [Scilit]
- Wang, J.-F.; Xu, C.-D. Geodetector: Principle and prospective. Acta Geogr. Sin. 2017, 72, 116–134. (In Chinese) [Google Scholar] [CrossRef]
- Rousseeuw, P.J. Silhouettes: A graphical aid to the interpretation and validation of cluster analysis. J. Comput. Appl. Math. 1987, 20, 53–65. [Google Scholar] [CrossRef] [Scilit]
- Davies, D.L.; Bouldin, D.W. A cluster separation measure. IEEE Trans. Pattern Anal. Mach. Intell. 1979, PAMI-1, 224–227. [Google Scholar] [CrossRef] [Scilit]
- Pedregosa, F.; Varoquaux, G.; Gramfort, A.; Michel, V.; Thirion, B.; Grisel, O.; Blondel, M.; Prettenhofer, P.; Weiss, R.; Dubourg, V.; et al. Scikit-learn: Machine learning in Python. J. Mach. Learn. Res. 2011, 12, 2825–2830. [Google Scholar]
- Christopher, S.A.; Gupta, P. Satellite remote sensing of particulate matter air quality: The cloud-cover problem. J. Air Waste Manag. Assoc. 2010, 60, 596–602. [Google Scholar] [CrossRef] [Scilit]
- Lennartson, E.M.; Wang, J.; Gu, J.; Castro Garcia, L.; Ge, C.; Gao, M.; Choi, M.; Saide, P.E.; Carmichael, G.R.; Kim, J.; et al. Diurnal variation of aerosol optical depth and PM2.5 in South Korea: A synthesis from AERONET, satellite (GOCI), KORUS-AQ observation, and the WRF-Chem model. Atmos. Chem. Phys. 2018, 18, 15125–15144. [Google Scholar] [CrossRef] [Scilit]
- Fan, C.; de Leeuw, G.; Yan, X.; Dong, J.; Kang, H.; Fang, C.; Li, Z.; Zhang, Y. Evolution of aerosol optical depth over China in 2010–2024: Increasing importance of meteorological influences. Atmos. Chem. Phys. 2025, 25, 11951–11973. [Google Scholar] [CrossRef] [Scilit]
- Zheng, Y.-C.; Li, L.-L.; Wang, Y.-P. An aerosol type classification method based on remote sensing data in Guangdong, China. Int. Arch. Photogramm. Remote Sens. Spat. Inf. Sci. 2019, XLII-3/W9, 239–243. [Google Scholar] [CrossRef] [Scilit]
- Ali, M.A.; Nichol, J.E.; Bilal, M.; Qiu, Z.; Mazhar, U.; Wahiduzzaman, M.; Almazroui, M.; Islam, M.N. Classification of aerosols over Saudi Arabia from 2004–2016. Atmos. Environ. 2020, 241, 117785. [Google Scholar] [CrossRef] [Scilit]

Disclaimer/Publisher’s Note: The statements, opinions and data contained in all publications are solely those of the individual author(s) and contributor(s) and not of MDPI and/or the editor(s). MDPI and/or the editor(s) disclaim responsibility for any injury to people or property resulting from any ideas, methods, instructions or products referred to in the content. |
© 2026 by the authors. Licensee MDPI, Basel, Switzerland. This article is an open access article distributed under the terms and conditions of the Creative Commons Attribution (CC BY) license.