


Highlights
What are the main findings?
- Joint AIS and satellite observations improved port-disruption assessment beyond text alone.
- Evidence gating further improved assessment and reduced acceptance of misleading reports.
What are the implications of the main findings?
- AIS and satellite imagery provide complementary temporal and spatial evidence of port activity.
- Cross-modal evidence grounding enables more reliable and auditable port monitoring.
Abstract
Textual accounts establish essential context for port disruptions but can bias large language model synthesis before independent observations are examined. We present Port Agent, a remote-sensing agent that aligns Automatic Identification System (AIS) trajectories, Sentinel-2 vessel detections, and documents while retaining acquisition time, footprint, processing, and uncertainty. The evaluation follows the evidence chain from physical observation to agent synthesis across 12 views of 11 U.S. event-or-control groups, 24 quality-screened scenes, and 145,570,911 AIS positions. AIS first resolved distinct operational responses: cargo/tanker occupancy fell by 58.8% during the New York/New Jersey strike, 41.5% during the Baltimore channel restriction, and 44.1% around Hurricane Beryl at Houston, whereas the Seattle cyber case showed no comparable portwide contraction. Sentinel-2 then added spatially explicit evidence through a validated detector, georeferenced AIS–image correspondence, and observations during near-synchronous AIS gaps. Finally, a fixed-backend experiment tested how this evidence affected synthesis. Adding the aligned physical record improved concise review, and applying the evidence gate to that same record produced a further gain, particularly for misleading reports. The complete configuration achieved the highest scores under both report conditions. Relative to concise text-only review, it improved the common-outcome score by 19.24 and 22.16 points and reduced misleading-claim false acceptance from 100.0% to 33.3%. Supporting analyses found no detectable model-interface difference, little change in mean performance across temperatures, and no benefit from a longer prompt. Although the system comparison remains exploratory, the results support an auditable evidence chain in which AIS and satellite observations constrain text-led synthesis.
1. Introduction
Port disruptions propagate across vessel approaches, channels, anchorages, terminals, and their inland connections. Because ports connect ocean transport to regional economies, energy supply, and logistics networks [1,2], even short interruptions may alter arrivals, departures, berth occupancy, and tug activity. Textual notices establish event context, Automatic Identification System (AIS) trajectories resolve vessel movement through time, and satellite remote sensing (RS) provides an independently acquired observation of vessels and infrastructure. Their observation limits differ: AIS is affected by reception and reporting gaps [3,4], whereas optical imagery is constrained by revisit timing, clouds, coverage, preprocessing, and detector error [5,6,7].
Text identifies the event, its institutional context, and the operational decisions made in response. When incorporated before observational consistency checks, this information can bias a language model toward a salient explanation. The resulting synthesis may overlook acquisition time, footprint, image quality, or the availability of a comparison scene. Truthfulness benchmarks and geospatial-agent studies likewise show that model fluency and tool access alone provide limited assurance of evidence-grounded reasoning [8,9,10].
These complementary observation processes motivate Port Agent. AIS describes identified vessel motion at high temporal frequency, a Sentinel-2 image records physical objects within a specific footprint and acquisition time, and text describes the event context. Agreement strengthens an interpretation, while disagreement directs attention to acquisition gaps, reporting behavior, detector error, or an inconsistent textual claim. Cross-modal integration must therefore preserve the measurement conditions that allow each source to constrain the others before agent synthesis.
Port Agent integrates a geospatial data layer, imagery services, a browser-based exploration interface, and configurable large language model (LLM) backends. AIS aggregates, georeferenced detector outputs, and event documents are transformed into evidence records that retain source, time, footprint, processing, observable, and uncertainty. For controlled evaluation, standardized records are presented to each selected LLM under fixed evidence conditions, separating synthesis performance from variation in retrieval.
The evaluation comprises 12 views of 11 U.S. port event-or-control groups from 2023 to 2025, including labor disruption, infrastructure failure, tropical cyclones, a cyber incident, a vessel fire, low water, and a policy-related cargo shock. Scene-to-event quality screening retains 24 Sentinel-2 scenes with associated detection records for remote-sensing analysis. Five views, representing four independent groups, also include direct port-level AIS indicators, and two additional views support image-footprint matching to raw AIS. This observation pattern enables assessment of both the contribution and the empirical boundaries of cross-modal grounding.
The research questions are:
- 1.
- How can an intelligent agent determine whether a Sentinel-2 observation is aligned in location, time, and observable with AIS and event text strongly enough to inform port-disruption analysis?
- 2.
- What disruption signatures emerge when AIS trajectories and georeferenced vessel detections constrain one another, and how sensitive are those signatures to port boundaries and detector thresholds?
- 3.
- How does agent assessment vary with AIS–remote-sensing evidence-chain availability and explicit gating under reference and misleading event text?
- 4.
- How stable is cross-modal synthesis across model interfaces, repeated calls, prompt policies, and provider-supported temperature settings?
The resulting contribution is a remote-sensing agent organized around explicit evidence alignment across modalities. Port Agent links port-scale AIS change to scene-scale physical observations through spatial and temporal correspondence, validates the oriented detector used to derive visual evidence, and propagates uncertainty into synthesis. The evaluation first establishes the physical evidence chain from AIS event signatures and georeferenced Sentinel-2 observations. It then tests whether that evidence improves LLM assessment and whether explicit gating adds further benefit. Model-, prompt-, and temperature-sensitivity analyses assess implementation stability. Together, these analyses show how independently acquired sensing can constrain text-led port-disruption assessment and identify the decisions that continue to require expert supervision.
2. Related Work
2.1. AIS-Based Port Activity Indicators
AIS supports trajectory reconstruction, arrival/departure detection, dwell analysis, traffic-density mapping, and behavioral anomaly detection. Spatial–temporal analysis of large AIS collections can identify traffic-density and speed hotspots at both global and local scales [4]. Port indicators are sensitive to the region of interest, sampling density, vessel-type coding, and the operational meaning assigned to a polygon. We therefore report the state-transition rules and quantify boundary sensitivity using 0, 500, and 1000 m buffers.
Port conditions also span scales. Berth-level obstruction, channel-level closure, portwide labor action, multi-port shocks, and regional rerouting represent different processes that a single “port abnormality” label may obscure. Multi-scale coastal research similarly emphasizes that observations and management questions vary with spatial and temporal scale [11,12]. Port Agent therefore records a claim’s scope and tests only the portions supported by each footprint and data interval.
2.2. Vessel Detection and AIS–Remote-Sensing Fusion
Optical and synthetic aperture radar (SAR) imagery can observe vessel presence independently of AIS. HRSID, DIOR, and xView3 illustrate both the value and difficulty of detecting small, rotated maritime targets under clutter, scale variation, and incomplete labels [7,13,14]. Prior fusion methods associate AIS reports with image detections to support surveillance and candidate non-cooperative-vessel review [6,15,16].
For ports, remote sensing provides an independent physical constraint on operational interpretation. Satellite imagery and AIS have been combined to study terminal congestion [5]. This study evaluates the detector under a fixed protocol, georeferences every vessel candidate used in cross-modal matching, and measures one-to-one AIS correspondence over multiple score, distance, and time thresholds. The analysis quantifies image-count sensitivity and distinguishes object detections from cargo-throughput indicators.
2.3. Geospatial Agents and Evidence-Grounded LLM Evaluation
Foundation and vision–language models have broadened remote-sensing interpretation, while geospatial reasoning still requires explicit spatial, temporal, and scale constraints [17,18,19]. ReAct separates reasoning from tool actions [8]; GeoAgent connects LLMs to geospatial operations [9]; GeoGraphRAG organizes geospatial relations for retrieval and modeling [20]; and ChangeGPT uses an agent framework for remote-sensing change analysis [21]. Port Agent focuses on preserving the measurement conditions under which AIS and satellite observations can test an event claim. Each observation carries acquisition time, footprint, provenance, transformation, and uncertainty, and controlled evaluation reconciles the resulting physical evidence with text before synthesis.
Table 1 compares Port Agent with representative method families. The controlled experiments then distinguish the joint evidence-chain configuration from internal variation in prompt organization under a fixed model backend.
Table 1.
Comparison of Port Agent with representative agentic and multimodal geospatial approaches.
LLM evaluation is stochastic and version-dependent. Evaluation research therefore recommends recording model/provider settings, repeating calls, and quantifying uncertainty [22,23]. Automated LLM judges can introduce their own preferences [24]; consequently, our primary evaluation follows structured outcomes with fixed, machine-checkable reference annotations and reports repeat variability alongside mean performance.
3. Materials and Methods
3.1. Port Agent Architecture and Evidence Integration
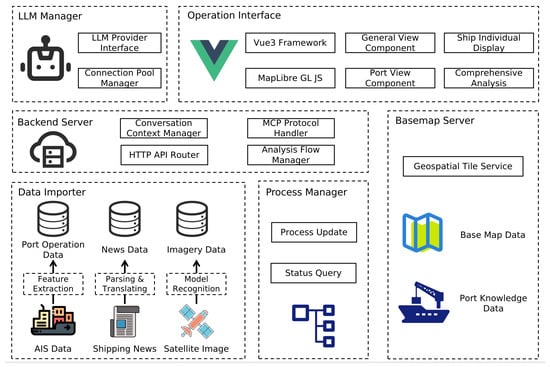
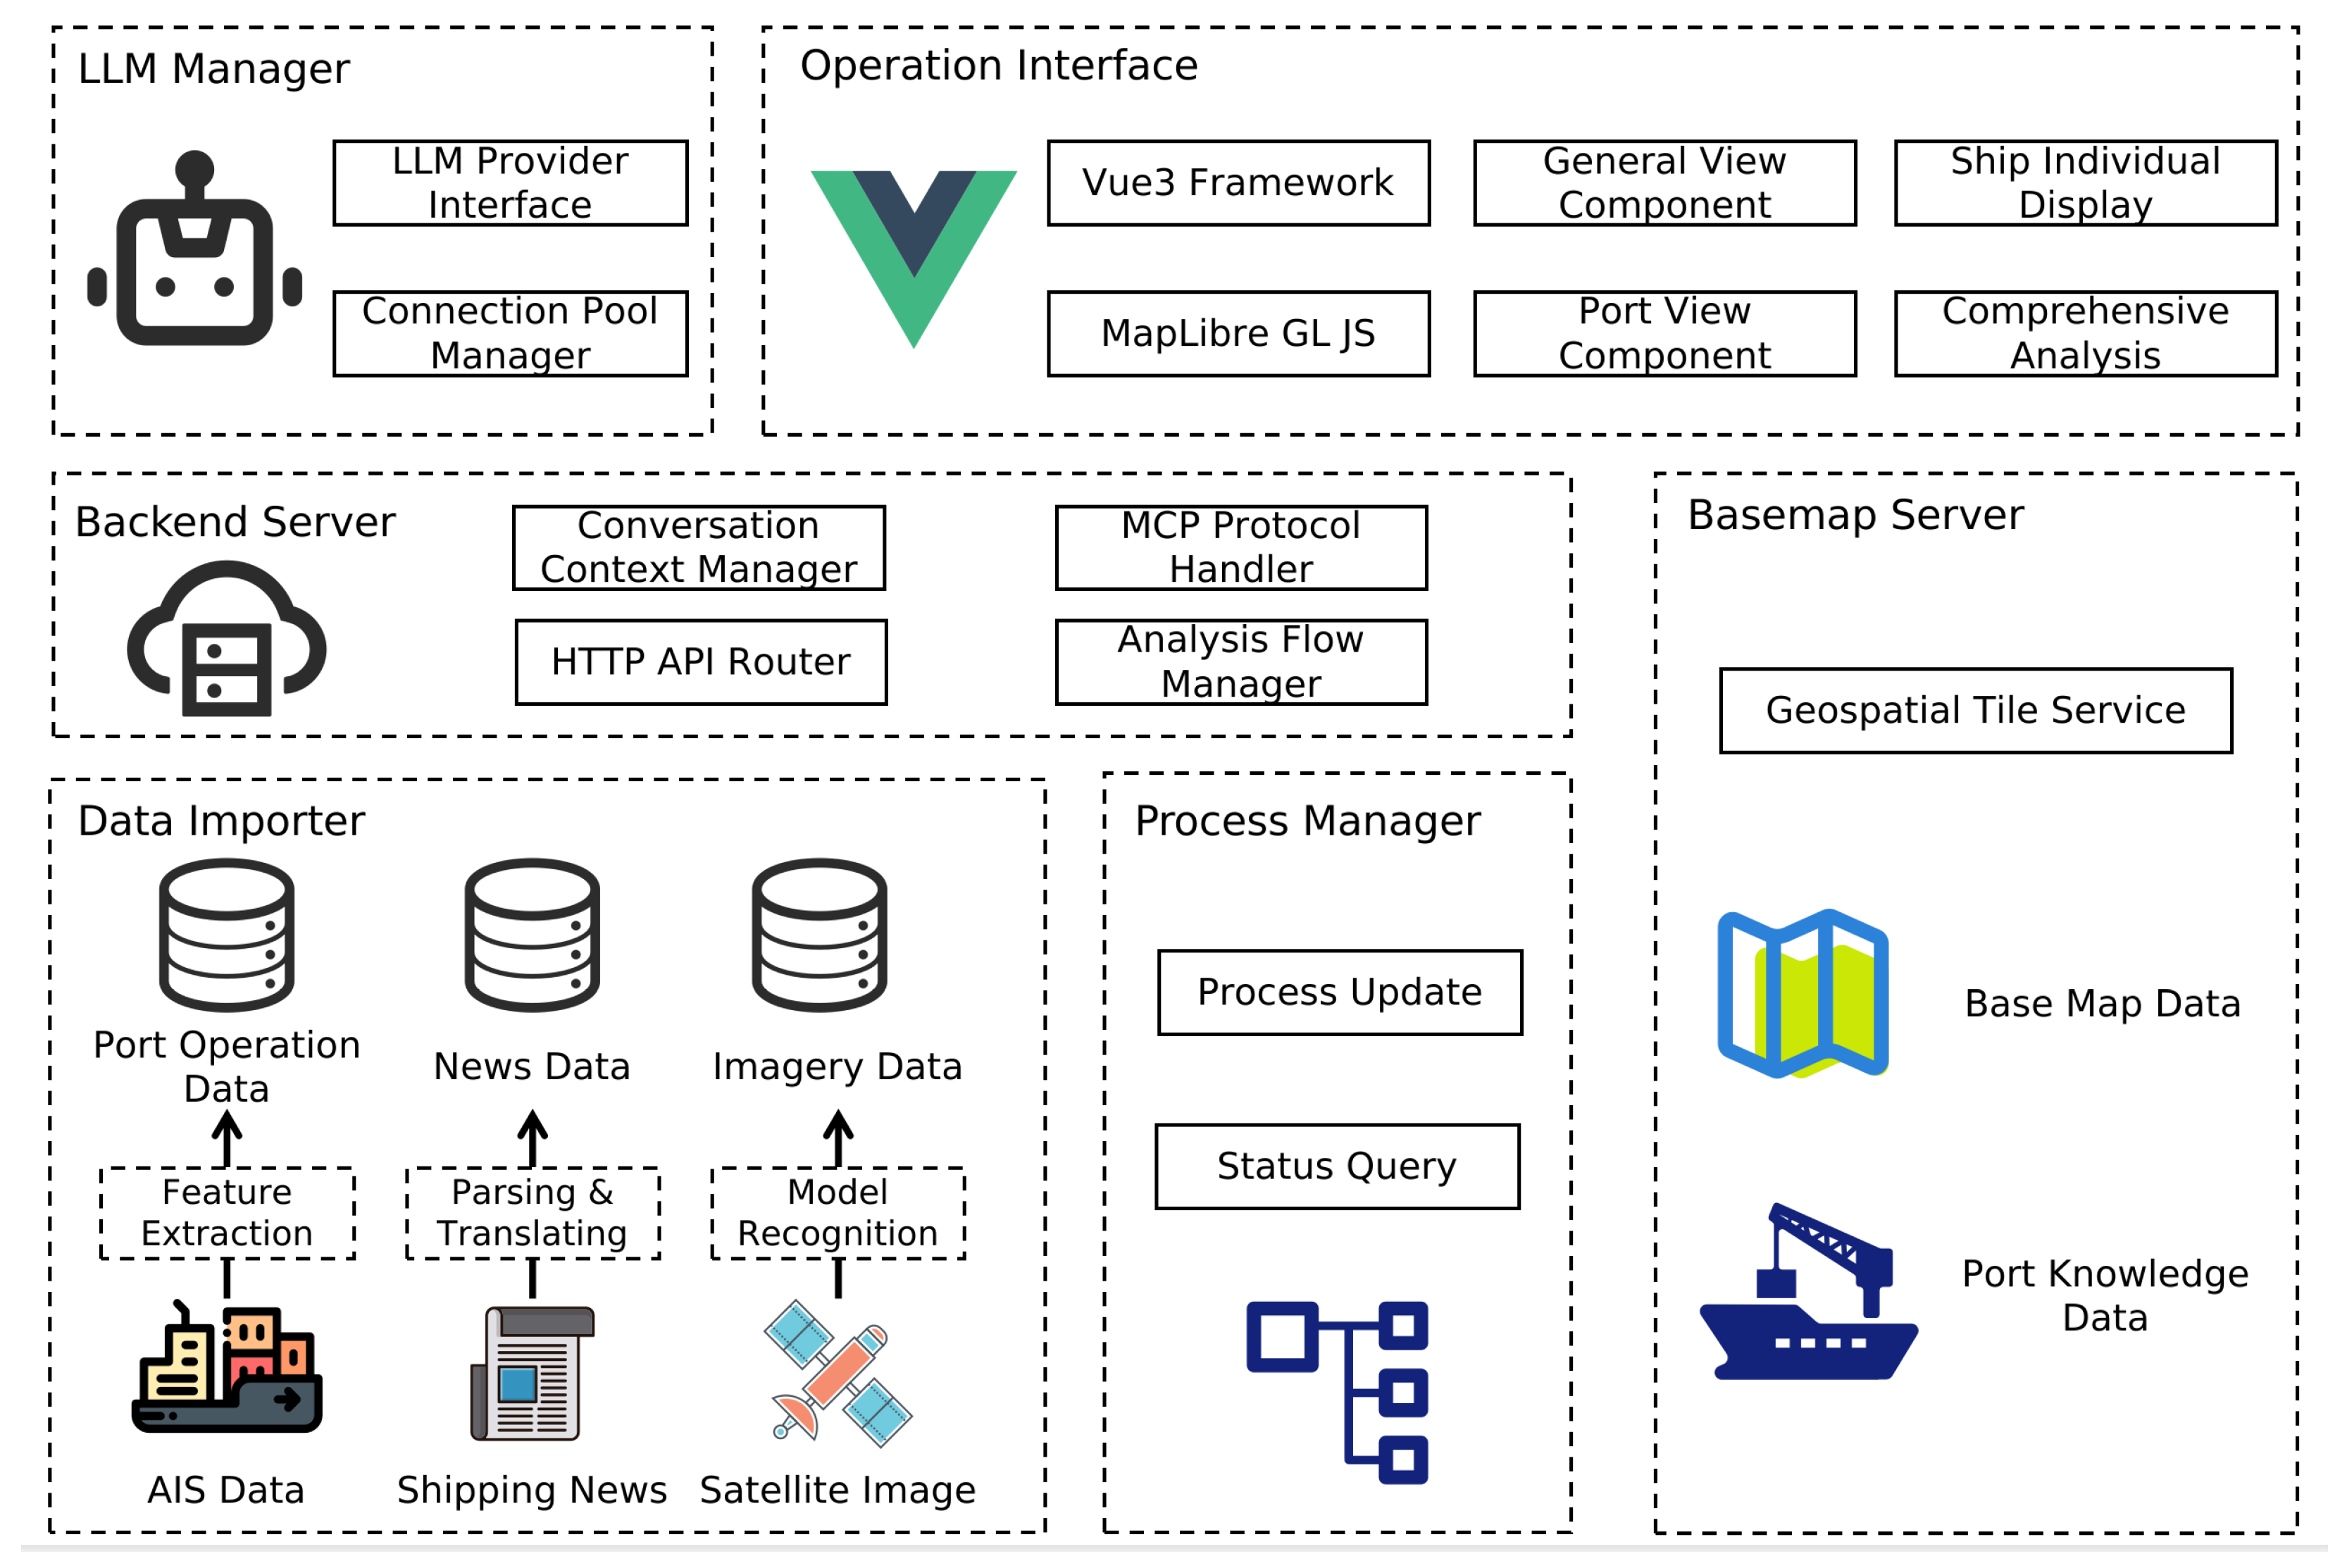
Port Agent integrates six functional components from data acquisition to evidence synthesis (Figure 1). The Data Importer transforms AIS, shipping news, and satellite observations into port-operation, documentary, and imagery records. The Basemap Server supplies geospatial tiles and port knowledge, the Backend Server maintains context and coordinates analysis, the LLM Manager mediates configured model-provider interfaces, and the Process Manager records analysis progress. The Vue (version 3.5.18) and MapLibre GL JS (version 5.6.1) Operation Interface [25] presents these capabilities through global, port, individual-vessel, and integrated-analysis views.
Figure 1.
Functional architecture of Port Agent.
These components represent functional responsibilities within a shared deployment. The browser interface connects to a FastAPI (version 0.121.0) orchestration layer, PostgreSQL (version 15.13) with PostGIS (version 3.5.2) stores port geometries and derived AIS indicators, and dedicated imagery and basemap services supply the map products. The MCP block is an in-process compatibility layer rather than an independent service, and the system does not rely on external functional plug-ins. Evidence and provenance remain within the system until model inference is requested from a configured provider.
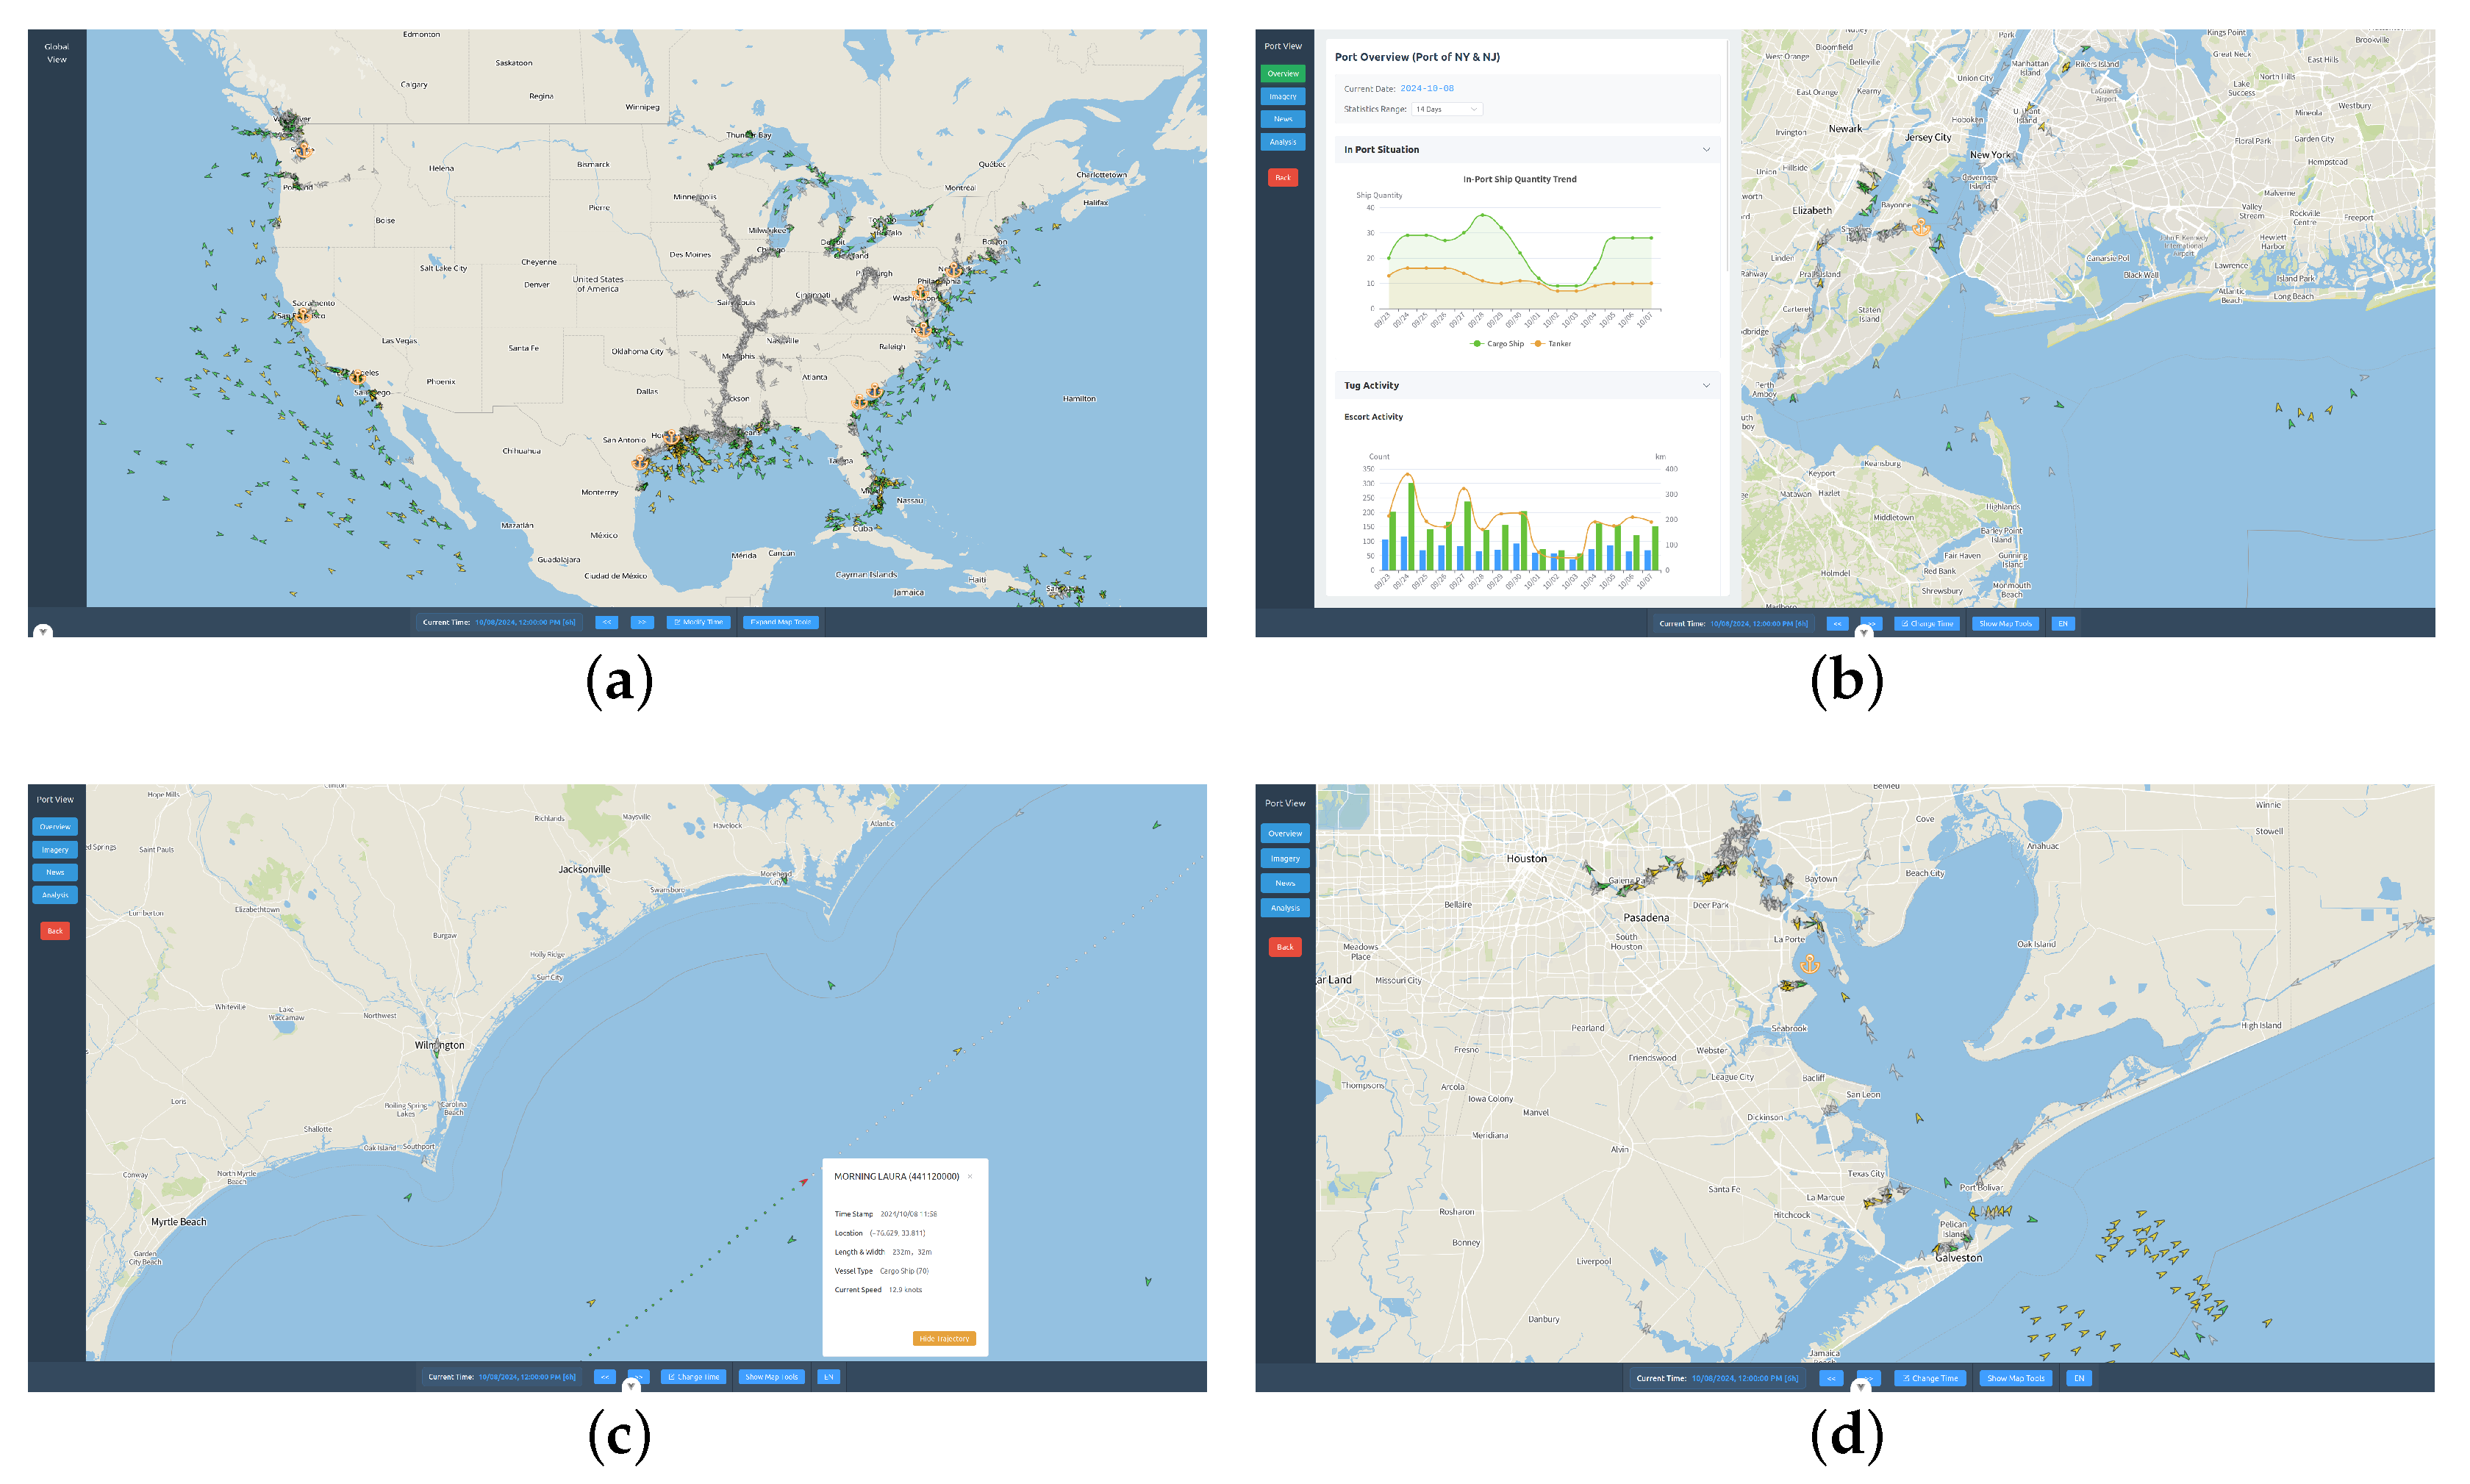
Figure 2 presents representative Port Agent interfaces at complementary spatial scales. The global view situates vessels and ports within the national traffic field, the New York/New Jersey view combines a port area of interest with operational time series, the vessel view resolves an individual trajectory and its attributes, and the Houston view applies the same visual framework to a second port.
Figure 2.
Representative Port Agent interfaces at global, port, and individual-vessel scales: (a) global view; (b) New York/New Jersey port view; (c) vessel trajectory; and (d) Houston port view.
3.2. Study Events and Multimodal Data
The AIS database contains 145,570,911 quality-controlled trajectory observations from 1 March to 15 October 2024, derived from public MarineCadastre records and stored in PostgreSQL/PostGIS [26,27]. It follows ten port regions—Oakland, Charleston, Houston, Long Beach, New York/New Jersey, Virginia, Savannah, Seattle/Tacoma, Corpus Christi, and Baltimore—and provides the occupancy, transition, and tug indicators used below. Every AIS result is confined to this observed interval.
After applying the scene-to-event quality screen, the remote-sensing analysis retains 24 Sentinel-2 scenes with associated detection records across 12 case views [28]. Each record links the raster acquisition time and footprint to oriented detections of vessels, storage tanks, and bridges. This screened collection forms the visual observation layer used for detector-threshold analysis and, where contemporaneous AIS exists, georeferenced cross-sensor matching.
Table 2 summarizes the labor, weather, infrastructure, cyber, navigation, and policy events. C01 and C02 provide two spatial views of the same ILA event and form one inferential cluster. “Port AIS” denotes derived port indicators, while C05 and C06 use raw positions for image-footprint matching. The 12 views therefore represent 11 independent groups.
Table 2.
Study events and AIS data availability.
Scene coverage varies across events and spatial scales. C01 observes the southern New York approach, C03 compares restricted and reopened Baltimore conditions in the absence of a pre-collapse acquisition, and the Houston pair brackets the Beryl disruption without a cloud-free storm-day scene. The Tampa images occur immediately before closure and after restricted reopening, whereas the Seattle pair observes maritime activity associated with an event whose information-technology effects lie outside the satellite observable. These acquisition and scope attributes are retained during evidence synthesis.
Event timing and scope were established from archived public institutional statements [29,30,31,32,33,34,35,36,37,38,39,40,41]. Reference annotations distinguish source-supported event dates from study-defined observation windows; dates remain unspecified when the source lacks day-level information. The annotations used to score the original 636-call benchmark were reconciled after those calls and before their final aggregate scoring, with the original prompts and raw responses retained unchanged. The reconciled annotations were then frozen before the separate 120-call factorial. For the ILA case, 1–3 October defines both the source-supported interruption and the AIS exposure interval.
3.3. AIS Indicators and Sensitivity Analysis
For vessel v at time t, its state relative to study polygon P is
An inbound event is an adjacent transition and an outbound event is in the ordered MMSI trajectory. Daily distinct cargo/tanker occupancy and transition counts are then
Port polygons are treated as study-defined spatial analysis units. Boundary sensitivity is assessed by buffering each geometry by 0, 500, and 1000 m and recomputing cargo/tanker vessel-days for the four directly tested events.
The escort procedure retains one representative observation per 5 min interval, requires tug speed > 0.3 knots and target-vessel speed > 0.1 and <5 knots, and associates a pair within m. Consecutive intervals are merged into one service. Tug mileage uses 1 min samples, excludes gaps over 1800 s and segments over 50 km, and sums the retained geodesic distances. These preprocessing rules were applied consistently across cases, and the association radius was included in the study’s sensitivity framework.
For each directly modeled case view, the primary statistical model is an interrupted time series on the daily count :
where is standardized time, marks the analytical exposure interval, marks the post-event interval, and are day-of-week fixed effects. Analytical exposure windows support the observational AIS comparison and are maintained separately from source-supported dates in the LLM rubric. The event estimate is with Newey–West heteroscedasticity/autocorrelation-consistent intervals at lag 7. The three-day C01 interval limits causal interpretation, so its confidence interval quantifies model-based precision. C02 separately compares mean pre-to-event changes for seven affected Atlantic/Gulf ports with three West Coast controls using the exact port allocations and shares an event cluster with C01.
3.4. Sentinel-2 Vessel Detection and Evaluation
An oriented-bounding-box detector was applied to Sentinel-2 imagery to identify Ship, Tank, and Bridge candidates. Scene-level radiometric normalization, overlapping tiled inference, and class-wise rotated non-maximum suppression were applied consistently. Configuration and threshold selection used an independent Houston scene; the operating confidence threshold of approximately 0.168 maximized pooled micro-F1 at oriented IoU 0.50.
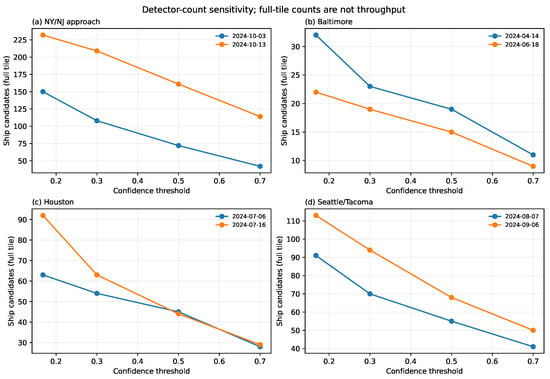
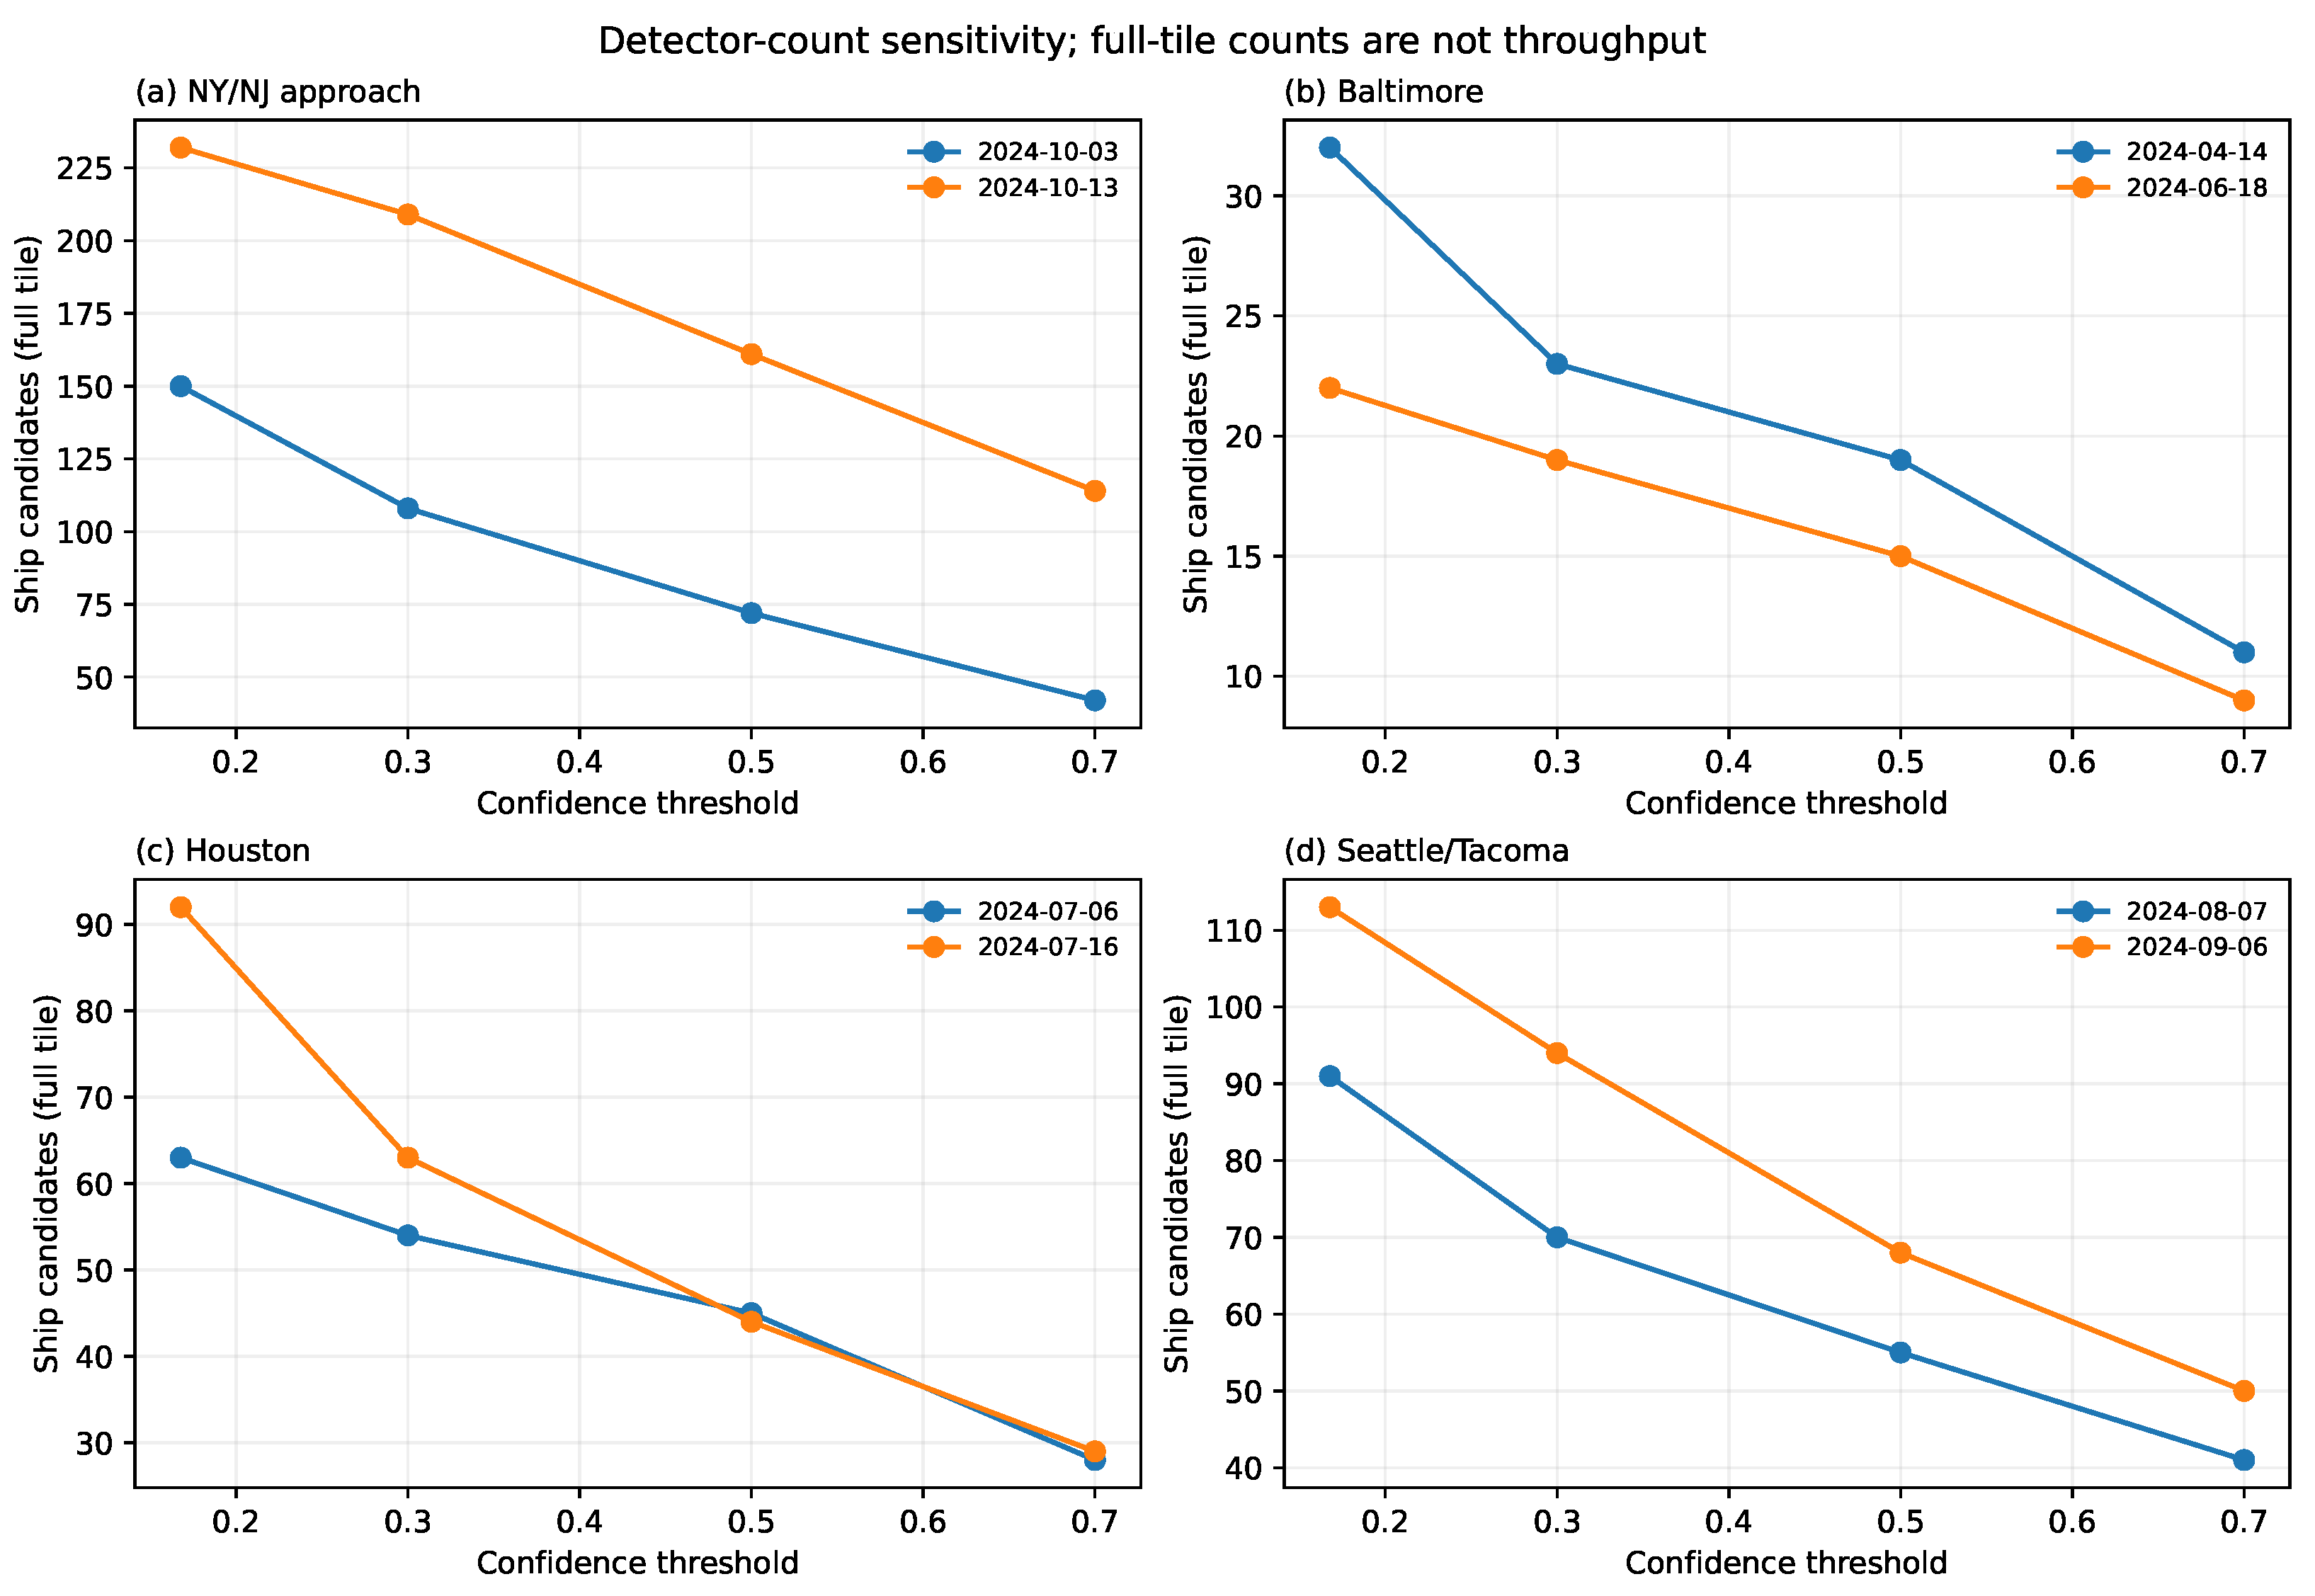
Evaluation used two reserved New York scenes containing 716 annotated objects (514 Ship, 32 Tank, and 170 Bridge). Predictions were matched one-to-one within scene and class. Precision, recall, and F1 were calculated at the operating threshold, while average precision was evaluated from IoU 0.50 to 0.95. Candidate-count sensitivity was examined at confidence thresholds of 0.168, 0.3, 0.5, and 0.7. The complete preprocessing and evaluation protocol is provided in the Supplementary Materials.
3.5. Georeferenced AIS–Image Alignment
The centroid of each detected Ship polygon is transformed through the image affine transform and coordinate reference system. For scene time s, detections and unique AIS MMSIs are linked by globally sorted greedy one-to-one matching when
The main analysis uses the detector operating threshold (approximately 0.168), min, and m. Sensitivity crosses score thresholds 0.168/0.3/0.5/0.7, time tolerances 5/10/15 min, and distances 250/500/1000 m. Matching is scene-wide and includes all AIS vessel types because small craft and tugs can resemble Ship candidates at 10 m resolution. The resulting match rate quantifies cross-sensor correspondence, while identity-level attribution requires independent validation. Unmatched detections and AIS positions are retained as unmatched observations.
3.6. Evidence Representation and Model Interfaces
For controlled evaluation, every case card contains an anonymous identifier, an observation window, one event document, de-identified daily AIS aggregates when present, and metadata for the retained scenes associated with that case. Reference outcomes remain outside the prompt. The model returns structured fields for operational status and scope, event timing, cause attribution, AIS interpretation, scene suitability, cross-modal consistency, confidence, and cited evidence identifiers. Before synthesis, the workflow checks whether an observation covers the relevant place and time, whether preprocessing permits comparison, and whether the measured quantity addresses the claim.
These standardized evidence records support the primary fixed-backend comparison described next. A separate compatibility analysis exposes the same evidence contract to ten model interfaces spanning flagship international and domestic systems and representative parameter scales (Table 3). Six model developers are represented: DeepSeek, Zhipu AI (Z.ai), Alibaba Cloud, ByteDance, OpenAI, and Google DeepMind. Interface settings were recorded at experiment time. The GPT interface uses an effective temperature of 1.0 under its provider configuration, whereas the remaining primary runs use 0.2.
Table 3.
Model interfaces and temperature settings used in the evaluation.
In the broader interface benchmark, each model received the same standardized evidence input, and the provider, effective temperature, completion status, and response were recorded. Provider-specific inference settings and quality-control criteria are documented in the Supplementary Materials. These prompts contain event text, de-identified daily aggregates, and scene-level candidate summaries rather than raster pixels or raw vessel trajectories.
3.7. Evaluation of Evidence-Grounded LLM Reasoning
The LLM evaluation was organized as a cumulative test of Port Agent’s central proposition: independently acquired physical observations should add information beyond a textual report and then constrain how that report is interpreted. Three configurations form the main sequence. Concise text-only review provides the baseline. Supplying the same review policy with aligned text, AIS, and remote-sensing observations tests what the physical record adds. Applying the Port Agent evidence gate to that full record then tests whether explicit claim adjudication makes the evidence more effective. A fourth cell applies the gate without physical observations only to complete the factorial and diagnose whether the gate can operate independently; it is not an operational Port Agent configuration.
The fixed-backend experiment comprises 120 calls with DeepSeek V4 Pro at temperature 0.2. It crosses the two review policies, the two evidence conditions, and reference versus misleading reports over five case views, with three repetitions per cell. Two views describe the same labor disruption, yielding four independent event groups for inference. All conditions use the same system message, output schema, neutral source labels, and matched report style. The evidence gate determines operational state and scope from available AIS and spatiotemporally applicable remote sensing before adjudicating the textual claim, and it distinguishes physical contradiction from insufficient evidence. This controlled evidence-contract experiment evaluates the evidence organization and decision logic used by Port Agent rather than the production interface’s live retrieval and delivery path.
To compare evidence conditions without rewarding fields that exist only in the multimodal record, the primary endpoint is the condition-invariant common-outcome score,
where operational state, scope, three date fields, and event type contribute 8, 12, 15, and 12 points, respectively. These study defined weights follow the corresponding components of the 100-point rubric in Table 4, with the 15-point temporal component assigning 5 points each to the event start, event end, and recovery dates. For each view, the gold labels for these components are identical across all conditions. Operational-state accuracy, scope accuracy, false acceptance of a misleading claim, and correct identification of contradiction are reported alongside this score.
Table 4.
Dimensions and weights of the outcome-grounded evaluation rubric.
The contrasts follow the same cumulative order as the design. Concise review with and without the full record measures the added value of evidence under a fixed review policy. Concise review and evidence gating over the same full record measure the added value of explicit adjudication. Their end-to-end contrast compares the integrated Port Agent configuration with the text-only baseline. The evidence–policy interaction tests whether the value of the gate depends on physical-evidence availability. Runs are averaged within event groups before inference. Event-cluster bootstrap intervals are descriptive, and paired tests use exact two-sided sign flips; the limited number of independent groups precludes population-level generalization or causal decomposition of the integrated contrast.
Complementary experiments then examine model-interface compatibility, prompt organization, and temperature; these analyses contextualize implementation choices rather than define the primary Port Agent comparison. They use a 100-point rubric (Table 4) covering operational change, spatial and temporal extent, cause attribution, AIS and image interpretation, cross-modal consistency, traceability, and uncertainty. Dates, categorical outcomes, evidence identifiers, and unsupported-claim flags are checked against archived reference annotations. The executable rubric and reconciled annotations were fixed before final aggregate scoring.
Each of the three 5-point date fields receives full credit within one day of a supported date, 0.75 within three days, 0.50 within seven days, 0.25 within 14 days, and zero otherwise; where the source supports no day-level label, the expected response is unspecified. AIS magnitude items receive full credit within 10 percentage points of the reference change, half credit within 20, one-quarter credit within 30, and zero otherwise. Closely related categorical outcomes receive half credit for predefined adjacent categories. Traceability combines the cited source identifier with its source-specific interpretation, and confidence calibration is evaluated when evidence is incomplete. Detailed scoring mappings are provided in the Supplementary Materials.
All ten model interfaces analyze the 12 views in three repeated calls, with inference clustered by 11 event groups because C01 and C02 represent the same labor action. With the full evidence record and DeepSeek fixed, direct assessment, concise evidence review, and extended reconciliation form the internal prompt-policy ablation. DeepSeek is also evaluated at temperatures 0, 0.2, and 0.7. Within each model–view–condition cell, repeated calls are averaged before event-group inference. Percentile intervals use 20,000 event-cluster bootstrap draws, prompt-policy tests use exact sign flips, and the model-interface omnibus test uses 100,000 event-blocked permutations while preserving the observed completion pattern. Planned contrasts to DeepSeek are Holm-adjusted, failed runs remain missing without imputation, and the outcome-only sensitivity removes the 15 points assigned to conflict handling, traceability, and restraint. Exact random seeds and implementation settings are reported in the Supplementary Materials.
4. Results
4.1. Multimodal Coverage Across Study Events
Multimodal coverage differs across the 12 retained views. Five views include direct port-level AIS indicators, and two additional views support scene-footprint matching to raw AIS. The remaining five fall outside the 2024 AIS interval and are evaluated using retained imagery and documentary context. Some image pairs bracket an interruption, while others observe recovery or a broader region. Port Agent preserves these observation conditions in each evidence record.
The aligned records define the inference supported by each case. C03 compares restricted and reopened conditions at Baltimore, with pre-collapse conditions outside the available acquisitions. C09 tests maritime activity around the Seattle cyber incident, while the information-system outage itself lies outside the satellite observable. Associating each scene with its measurement scale and observable establishes the evidential contribution before LLM synthesis.
4.2. AIS-Derived Port Responses and Boundary Sensitivity
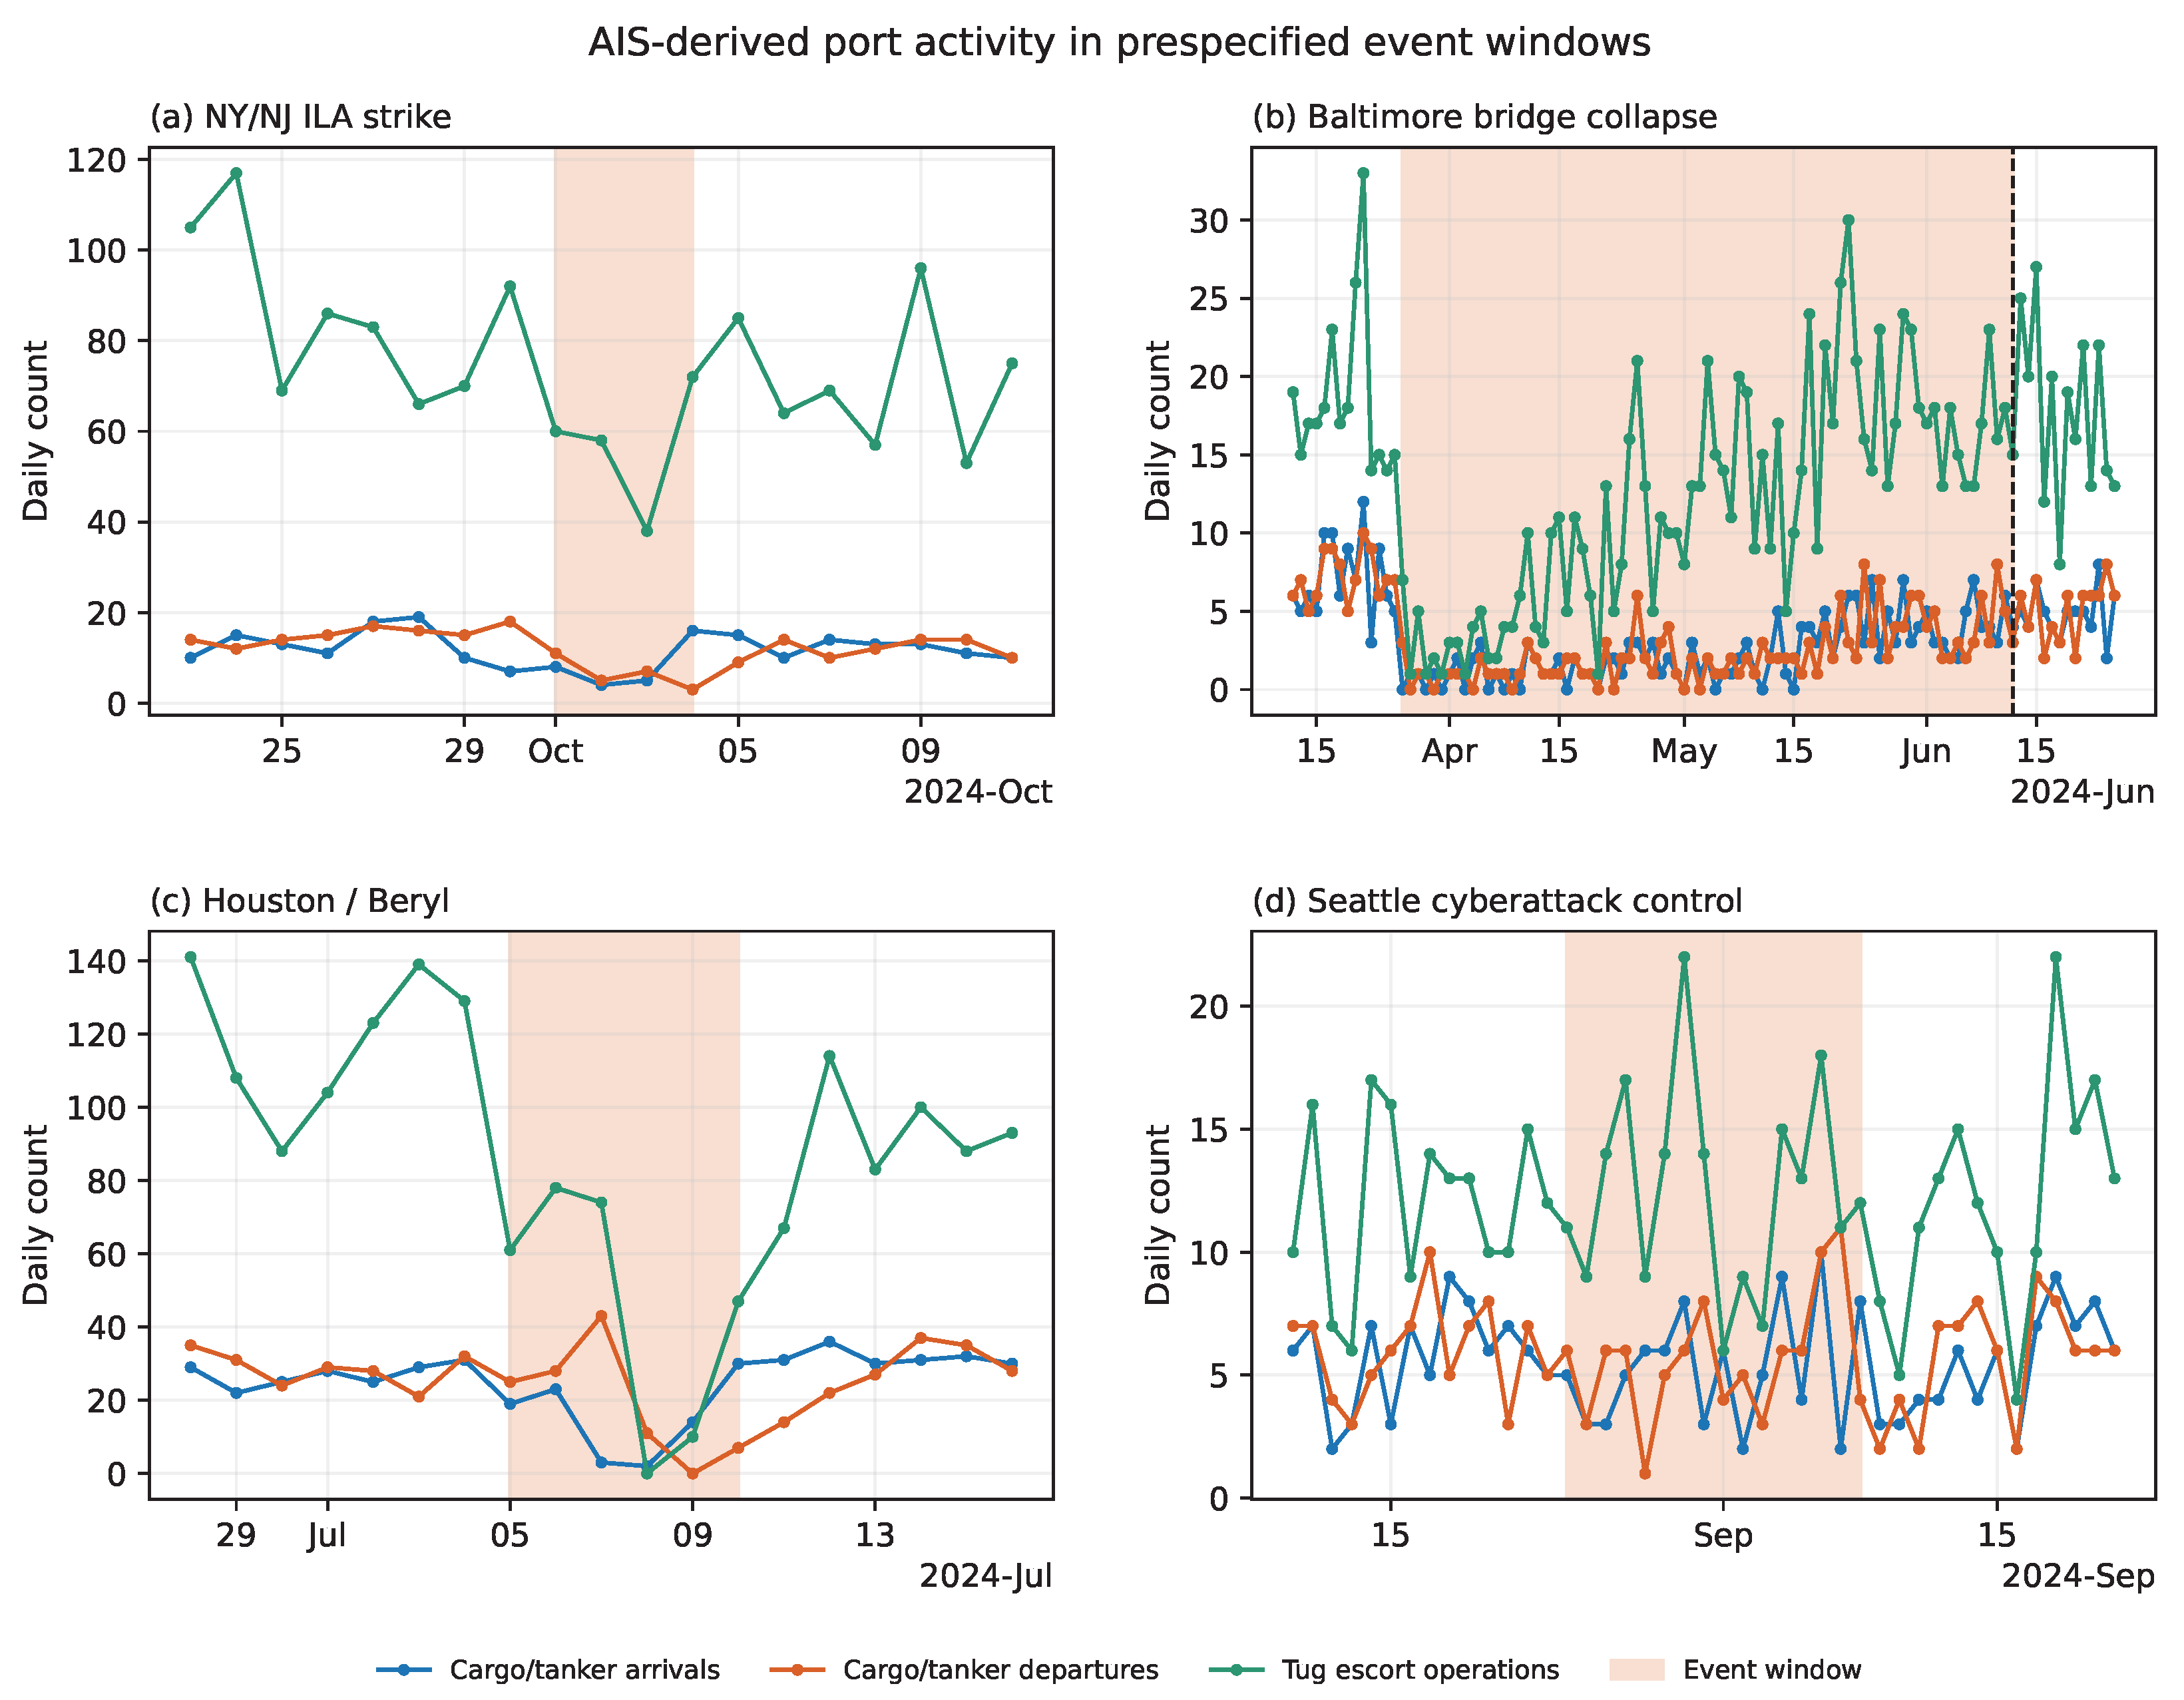
AIS trajectories distinguish the operational responses associated with four event types (Figure 3). At New York/New Jersey, cargo/tanker occupancy fell from 44.14 vessel-days per day before the strike to 18.00 during 1–3 October and recovered to 36.75 afterward. Inbound, outbound, and tug-escort activity changed in the same direction. The interrupted-time-series estimates indicate a 58.8% occupancy reduction and declines of 41.7–52.9% across movement and escort indicators (Table 5). These measures provide consistent physical support for the labor-disruption assessment; the three-day interval remains insufficient for causal attribution.
Figure 3.
Daily cargo/tanker and tug indicators during the analytical exposure windows.
Table 5.
Interrupted time-series estimates with Newey–West HAC(7) 95% intervals.
Baltimore, Houston, and Seattle/Tacoma exhibit distinct response profiles. The Baltimore channel restriction produces the deepest inbound and outbound reductions, whereas Beryl produces a short, broad contraction that is especially strong in tug-escort activity. At Seattle/Tacoma, the in-port and escort intervals cross zero despite moderate reductions in movements. These contrasts distinguish limited traffic variation during the cyber incident from the portwide contraction asserted in the misleading document and relate each assessment to the spatial and operational scale observed by AIS.
The regional ILA view provides consistent directional evidence. All four indicators declined more at the seven Atlantic/Gulf ports than at the three West Coast controls; inbound traffic showed the clearest separation ( versus ). Given the exact permutation result () and the ten-port sample, the pattern is interpreted as regional corroboration.
The direction of each cargo/tanker occupancy contrast is unchanged when port polygons are expanded by 500 or 1000 m. Baltimore and Houston are numerically unchanged, while additional vessel-days at New York and Seattle leave the interpretation stable. This robustness applies to the occupancy metric; transition and escort indicators were outside the boundary-sensitivity analysis.
4.3. Detector Performance and Threshold Sensitivity
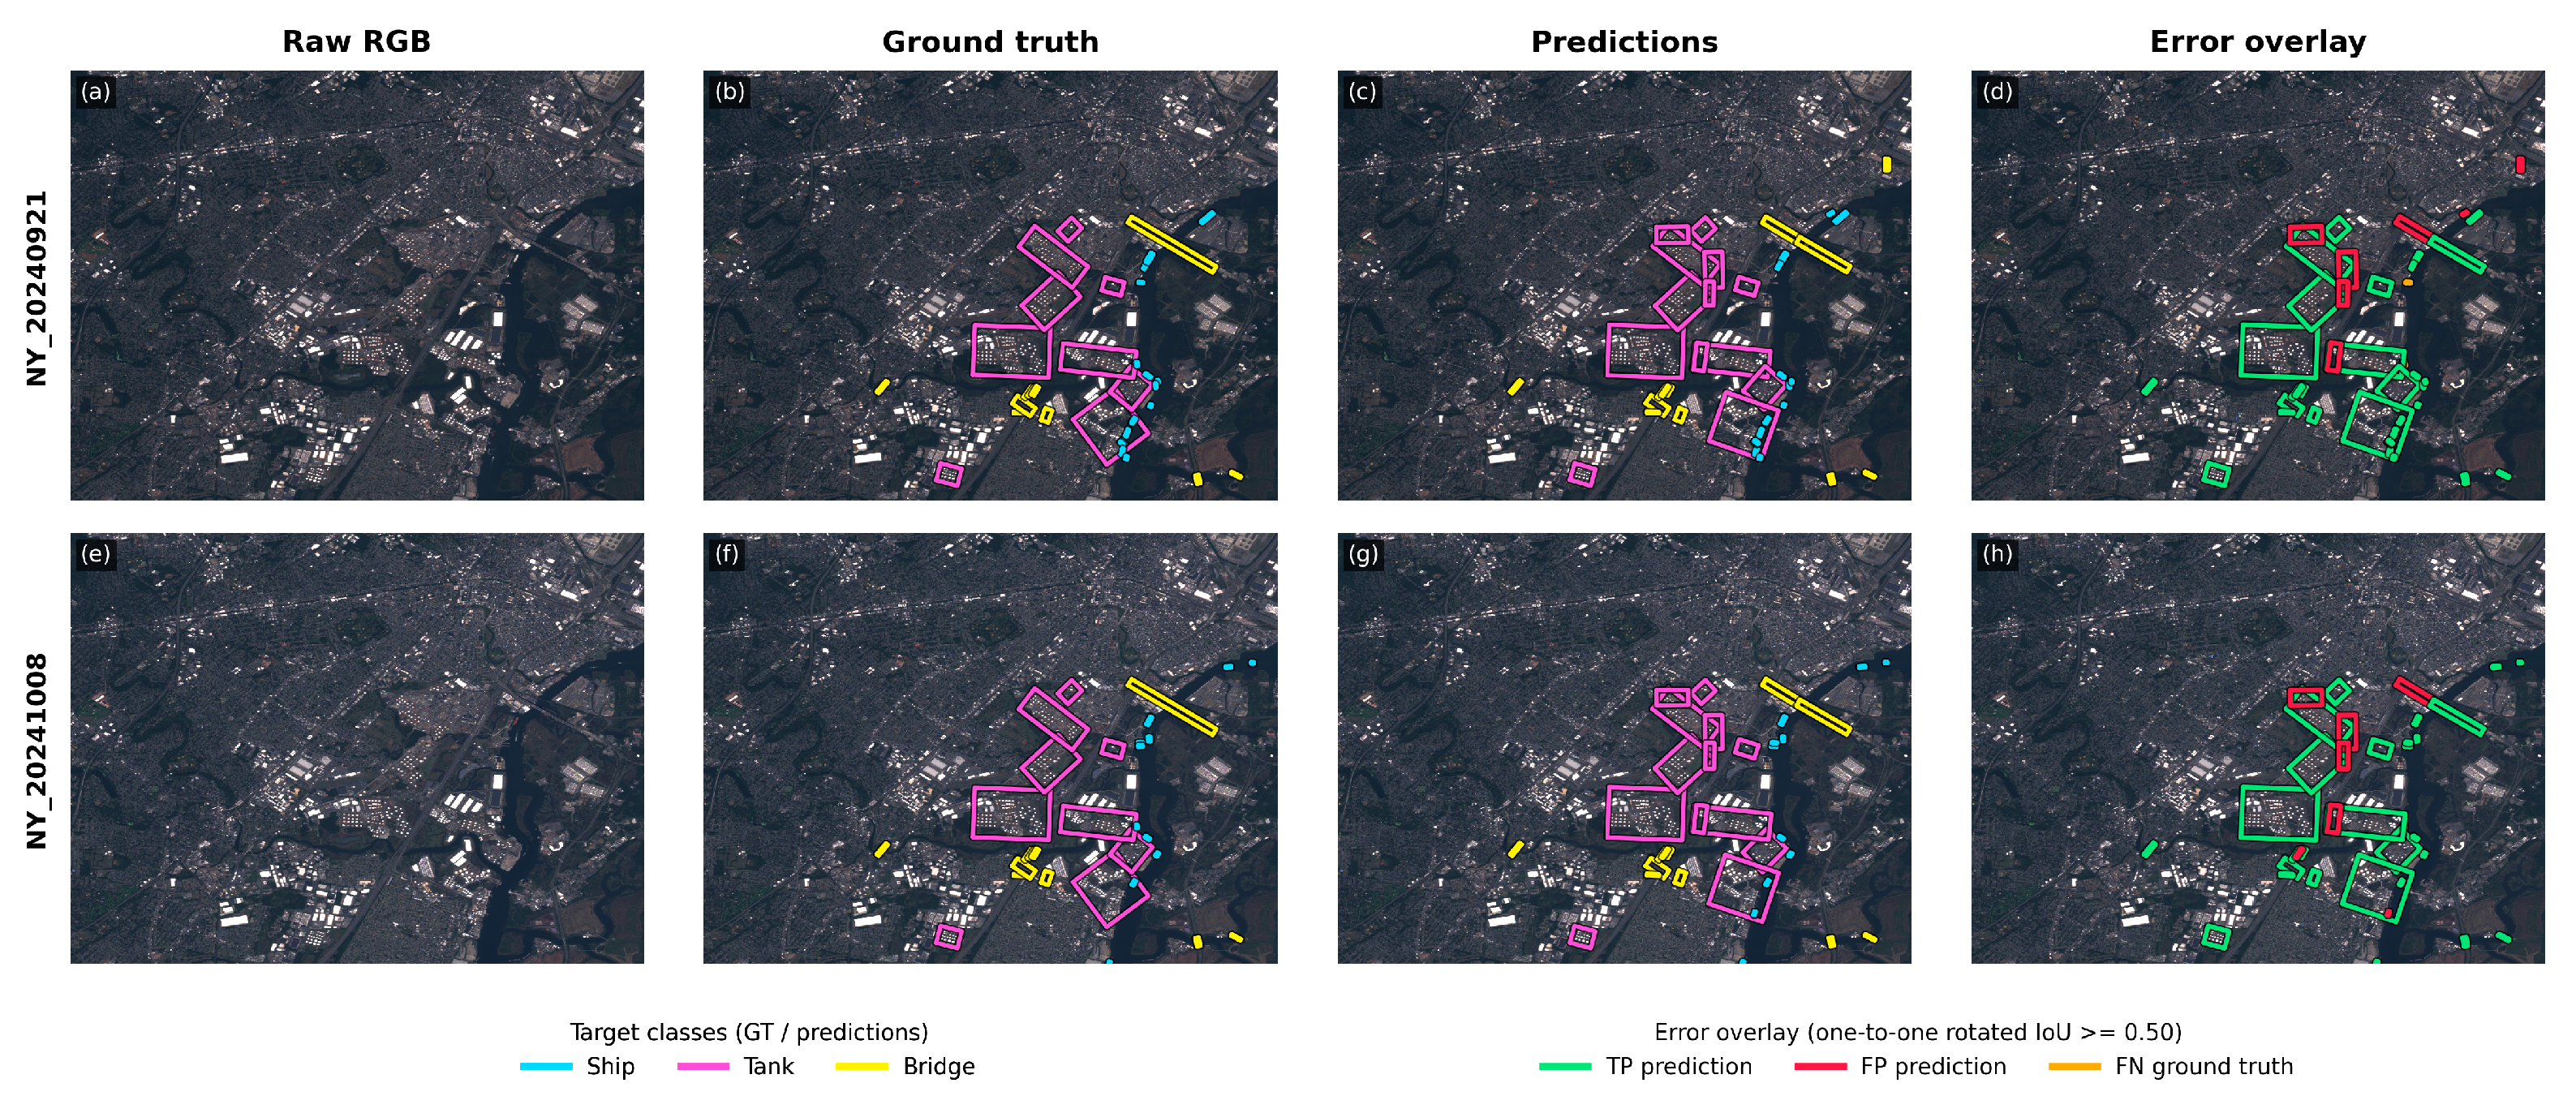
The remote-sensing branch contributes quantitative physical observations. On the two reserved New York scenes, the detector achieves macro-F1 = 0.8321 and macro AP50:95 = 0.5933 (Table 6); Figure 4 illustrates detection performance in dense port settings. Ship is the most challenging class (AP50:95 = 0.3511), while the Tank estimate is based on 32 annotated targets and consequently has limited generalizability.
Table 6.
Detector performance on the two reserved Sentinel-2 scenes.
Figure 4.
Detection examples from the reserved New York scenes: (a) RGB imagery acquired on 21 September 2024; (b) reference annotations for (a); (c) detector predictions for (a); (d) detection-error overlay for (a); (e) RGB imagery acquired on 8 October 2024; (f) reference annotations for (e); (g) detector predictions for (e); (h) detection-error overlay for (e). In the annotation and prediction panels, cyan, magenta, and yellow denote Ship, Tank, and Bridge, respectively. In the error overlays, green, red, and orange indicate true positives, false positives, and false negatives, respectively, based on one-to-one matching at an oriented IoU threshold of 0.50.
Detector confidence thresholds materially affect candidate counts. At the operating threshold, Houston increases from 63 Ship candidates before Beryl to 92 after recovery; at a score of 0.5, the same scenes contain 45 and 44 candidates (Figure 5). Port Agent preserves the score and threshold with each count, allowing the synthesis to distinguish threshold-sensitive detections from changes in port operations.
Figure 5.
Ship-candidate counts across confidence thresholds for four Sentinel-2 scene pairs.
4.4. AIS–Image Correspondence
Georeferencing enables reciprocal association between image candidates and contemporaneous AIS-reported vessels. At the primary ±10 min/500 m gate, 21.9–45.5% of Baltimore candidates and 43.5–46.0% of Houston candidates are paired with AIS (Table 7). The Virginia approach scene on 3 October links 10 of 54 candidates to 10 of 19 AIS vessels. These matches connect a physical snapshot to vessel records, while detector error, small craft, transmission gaps, and residual geolocation or timing differences remain plausible sources of unmatched observations.
Table 7.
Scene-level AIS–Ship-candidate correspondence under the primary matching criteria.
The 13 October New York/Virginia acquisitions illustrate complementarity during an AIS temporal gap. Port-level daily AIS is available, yet no regional position occurs within the tested ±5, ±10, or ±15 min windows around the approximately 15:42 UTC Sentinel-2 overpass. The satellite images therefore provide a physical observation without a near-synchronous AIS counterpart. Port Agent records this temporal asymmetry and retains the detections as unmatched observations for targeted review.
4.5. Evidence-Grounded LLM Assessment
The preceding AIS and remote-sensing analyses established a physical record of event timing, operational change, and scene-level conditions. The LLM experiments next tested whether that record improved synthesis and whether an explicit gate made the evidence more effective. The results follow this same cumulative sequence.
Under concise review, adding aligned AIS and remote-sensing evidence increased the common-outcome score from 57.36 to 70.21 for reference reports and from 19.06 to 22.96 for misleading reports (Table 8). It also reduced false acceptance from 100.0% to 83.3% and increased correct contradiction from 0.0% to 16.7%. Physical evidence therefore improved assessment before explicit gating, although supplying it as additional context provided only limited protection against misleading text.
Table 8.
Progressive contribution of multimodal evidence and evidence gating to port-disruption assessment.
When the same multimodal record was organized through the Port Agent evidence gate, the common-outcome score increased further to 76.60 for reference reports and 41.22 for misleading reports. Under misleading reports, operational-state accuracy rose from 29.2% to 66.7%, scope accuracy from 0.0% to 41.7%, correct contradiction from 16.7% to 58.3%, and false acceptance fell from 83.3% to 33.3%. For misleading reports, the largest incremental gains thus occurred when physical observations were used as explicit constraints on claim adjudication rather than supplied as context alone.
Relative to concise text-only review, the integrated Port Agent configuration improved the common-outcome score by points for reference reports (descriptive cluster-bootstrap 95% CI , exact sign-flip ) and points for misleading reports (95% CI , ). False acceptance was percentage points lower (Port Agent minus baseline, ; descriptive 95% CI ; ). These end-to-end results complete the experimental chain: aligned physical observations add information beyond text, and the evidence gate makes that information more effective when textual claims are unreliable.
The gate-without-evidence cell predominantly abstained and was interpreted only as a diagnostic: a gate designed to adjudicate claims against physical observations cannot replace those observations. The evidence–policy interaction was positive for reference reports ( points, 95% CI , exact ) and misleading reports ( points, 95% CI , ), with the same direction in every evaluated event group. These estimates remain exploratory and describe the evaluated suite rather than population-level superiority.
Supporting analyses next assessed implementation stability rather than the primary mechanism. Across the supporting experiment suite, 619 of 636 planned runs (97.3%) returned a conforming result on the first invocation and 627 (98.6%) after permitted retries; the nine final failures remained missing. In the cross-model component, means ranged from 71.01 to 81.62, but the event-blocked omnibus test detected no interface difference (; Table 9). With DeepSeek and the full record fixed, extended reconciliation scored below concise evidence review (76.13 versus 85.10; paired difference , 95% CI , exact ; Table 10). Temperature changed the mean little between 0.0 and 0.7, although repeat variability increased at 0.7. An earlier sensitivity analysis likewise found no detectable benefit from appending remote-sensing metadata to AIS under the extended prompt. These findings support the selected implementation settings while leaving the fixed-backend progression as the primary evidence for Port Agent’s system-level benefit.
Table 9.
Cross-model performance across 12 case views and 11 independent event-or-control groups.
Table 10.
Internal prompt-policy ablation using the separate 100-point rubric across 12 views and 11 independent groups.
5. Discussion
5.1. Contribution to Geospatial Agent Design
Port Agent’s contribution lies in the ordered use of evidence rather than the accumulation of additional inputs. Text establishes event context, AIS measures vessel movement at high temporal frequency, and satellite imagery provides spatially explicit observations at discrete acquisition times. Their spatial and temporal alignment creates a physical record against which textual claims can be evaluated. Preserving source, footprint, acquisition time, processing history, and uncertainty also limits each observation to the inference it can support.
The empirical analyses follow this order. AIS and Sentinel-2 first captured complementary aspects of port activity, including operational contraction, spatially limited effects, and physical observations during near-synchronous AIS gaps. Adding this record improved LLM assessment over text alone. Applying the Port Agent evidence gate to the same record produced a further and larger improvement for misleading reports, yielding the strongest overall configuration and sharply reducing false acceptance. The evidence-starved diagnostic and the underperformance of the extended prompt are consistent with a joint contribution from independent physical evidence and explicit adjudication, rather than an advantage from prompt length or multimodal input volume alone. The effect estimates remain specific to the evaluated suite and motivate broader validation rather than unrestricted generalization.
5.2. Remote-Sensing Evidence Across Spatial Scales
Remote sensing provides independently acquired physical evidence in the framework. Detector performance is quantitatively evaluated, oriented candidates are transformed to geographic coordinates, and their correspondence with AIS is measured across explicit thresholds. In Houston, the apparent increase in candidates at the operating threshold disappears at stricter scores, demonstrating the importance of propagating detector confidence into synthesis. The 13 October acquisitions demonstrate a complementary role: satellite imagery retains a scene-level observation during a near-synchronous AIS gap and marks the temporal asymmetry for follow-up.
Optical remote-sensing imagery may be affected by cloud contamination, while AIS records can be incomplete within certain observation windows. These limitations highlight the importance of jointly interpreting AIS and remote sensing, allowing the two sources to complement and cross-check each other when either is incomplete or uncertain.
Reference geometry determines the scale of inference. Berth safety zones, channel obstructions, portwide work stoppages, and multi-port labor actions require different spatial units. The 0/500/1000 m buffers quantify local boundary sensitivity, while C02 extends comparison across port regions. Future development can formalize berth, anchorage, port, county, and port-range units and incorporate spatial hotspot statistics before LLM interpretation.
5.3. Operational Relevance
The integrated representation supports joint inspection of port-event evidence at map, time-series, and source levels. This structure is relevant to sustainable-port monitoring, where operational and environmental indicators require transparent provenance and separate interpretation [42]. It can also incorporate community or local observations with explicit provenance, analogous to standardized coastal community-science imagery [43]. This establishes a common analytical basis for subsequent stakeholder and longitudinal evaluations.
5.4. Scope and Future Directions
The 12-view suite establishes cross-event feasibility under diverse observation conditions. A subsequent phase will extend the analysis to multi-year AIS, systematically timed imagery, geographically stratified sampling, and additional matched event–control windows. This design will support population-level estimates and stronger causal comparisons across ports and disruption types.
Sensor-level evaluation will be extended through geographically independent annotations, higher-resolution optical and SAR observations, probabilistic AIS–image association, and standardized nested geometries for berths, anchorages, ports, and port regions. Model-level evaluation will combine repeated calls with blinded domain-expert assessment and prospective tests of retrieval, evidence delivery, and explicit cross-modal decision rules. Together, these extensions will evaluate generalization from standardized evidence synthesis to end-to-end port monitoring.
6. Conclusions
Port Agent establishes a traceable evidence chain that aligns documentary context with AIS-derived vessel movement and Sentinel-2 observations. Across the evaluated port events, AIS distinguished marked operational contractions from spatially limited or absent portwide effects, while georeferenced imagery corroborated vessel activity and preserved physical observations when near-synchronous AIS was unavailable. Retaining spatial scale, acquisition timing, detector confidence, and cross-modal correspondence allowed each observation to be used according to its evidential scope.
The LLM evaluation reached the same conclusion through a staged comparison. Multimodal evidence improved assessment beyond text-only review, and the evidence gate further strengthened its use, particularly when reports were misleading. The integrated Port Agent configuration achieved the highest scores under both report conditions and reduced false acceptance from 100.0% to 33.3%, whereas a longer reconciliation prompt provided no corresponding benefit. This pattern is consistent with Port Agent’s central design: satellite observations and AIS are made mutually informative, and the resulting physical evidence constrains text-led synthesis. Multi-year, independently annotated event and control data are still required to evaluate generalization.
Supplementary Materials
The following supporting information can be downloaded at https://www.mdpi.com/article/10.3390/rs18193376/s1, Supplementary methods, analysis code, and supporting experimental data for Port Agent.
Author Contributions
Conceptualization, M.Z. and G.H.; methodology, M.Z. and Y.Z.; software, W.W. and B.S.; validation, H.R., Y.Z. and S.L.; formal analysis, M.Z.; investigation, Y.Z., W.W. and H.R.; resources, G.H.; data curation, Y.Z. and B.S.; writing—original draft preparation, M.Z.; writing—review and editing, M.Z., Y.Z., H.R., G.H. and L.M.; visualization, W.W. and B.S.; supervision, L.M.; project administration, L.M.; funding acquisition, G.H. All authors have read and agreed to the published version of the manuscript.
Funding
This research was funded by the National Natural Science Foundation of China (Grant Nos. 42671467 and 42171304).
Institutional Review Board Statement
Not applicable. This study does not involve human subjects, human tissue, or personal data.
Informed Consent Statement
Not applicable.
Data Availability Statement
The case manifest, analysis and prompt-generation code, detector annotations and protocol, derived evidence tables, remote-sensing checksums and products, model responses, and summary statistics are included in the Supplementary Materials and will be deposited in a persistent public repository before publication. Prompts can be reconstructed from the archived evidence records and analysis code. Public AIS source files are available from MarineCadastre.gov, and Sentinel-2 rasters can be reacquired through the Copernicus program using the scene identifiers in the manifest. Redistribution of third-party model artifacts and selected processed imagery remains subject to the originating terms; these materials are available from the corresponding author where permitted.
Acknowledgments
The authors acknowledge MarineCadastre.gov for public AIS resources and the Copernicus programme for Sentinel-2 data. During the preparation of this manuscript, the authors used OpenAI Codex (GPT-5-based model, accessed September 2026) for language editing, code inspection, experiment-script development, figure-layout support, and LaTeX formatting. The authors reviewed and edited the output as needed and take full responsibility for the content of this publication.
Conflicts of Interest
The authors declare no conflicts of interest.
Abbreviations
The following abbreviations are used in this manuscript:
| Abbreviation | Definition |
| AIS | Automatic Identification System |
| API | Application programming interface |
| HAC | Heteroscedasticity and autocorrelation consistent |
| ILA | International Longshoremen’s Association |
| IoU | Intersection over union |
| LLM | Large language model |
| MCP | Model Context Protocol |
| MMSI | Maritime Mobile Service Identity |
| RAG | Retrieval-augmented generation |
| RS | Remote sensing |
| SAR | Synthetic aperture radar |
References
- Notteboom, T.E.; Rodrigue, J.-P. Port regionalization: Towards a new phase in port development. Marit. Policy Manag. 2005, 32, 297–313. [Google Scholar] [CrossRef] [Scilit]
- Munim, Z.H.; Dushenko, M.; Jimenez, V.J.; Shakil, M.H.; Imset, M. Big data and artificial intelligence in the maritime industry: A bibliometric review and future research directions. Marit. Policy Manag. 2020, 47, 577–597. [Google Scholar] [CrossRef] [Scilit]
- Mazzarella, F.; Vespe, M.; Tarchi, D.; Aulicino, G.; Vollero, A. AIS reception characterisation for AIS on/off anomaly detection. In Proceedings of the 19th International Conference on Information Fusion, Heidelberg, Germany, 5–8 July 2016; pp. 1867–1873. Available online: https://ieeexplore.ieee.org/document/7528110 (accessed on 3 September 2026).
- Zhang, L.; Meng, Q.; Fwa, T.F. Big AIS data based spatial-temporal analyses of ship traffic in Singapore port waters. Transp. Res. Part E Logist. Transp. Rev. 2019, 129, 287–304. [Google Scholar] [CrossRef] [Scilit]
- Yasuda, K.; Shibasaki, R.; Yasuda, R.; Murata, H. Terminal congestion analysis of container ports using satellite images and AIS. Remote Sens. 2024, 16, 1082. [Google Scholar] [CrossRef] [Scilit]
- Rodger, M.; Guida, R. Classification-aided SAR and AIS data fusion for space-based maritime surveillance. Remote Sens. 2021, 13, 104. [Google Scholar] [CrossRef] [Scilit]
- Paolo, F.; Lin, T.-t.T.; Gupta, R.; Goodman, B.; Patel, N.; Kuster, D.; Kroodsma, D.; Dunnmon, J. xView3-SAR: Detecting dark fishing activity using synthetic aperture radar imagery. In Advances in Neural Information Processing Systems; Neural Information Processing Systems Foundation, Inc.: San Diego, CA, USA, 2022; Volume 35, pp. 37604–37616. [Google Scholar] [CrossRef] [Scilit]
- Yao, S.; Zhao, J.; Yu, D.; Du, N.; Shafran, I.; Narasimhan, K.; Cao, Y. ReAct: Synergizing reasoning and acting in language models. In Proceedings of the Eleventh International Conference on Learning Representations (ICLR 2023), Kigali, Rwanda, 1–5 May 2023; Available online: https://openreview.net/forum?id=WE_vluYUL-X (accessed on 3 September 2026).
- Huang, C.; Chen, S.; Li, Z.; Qu, J.; Xiao, Y.; Liu, J.; Chen, Z. GeoAgent: To empower LLMs using geospatial tools for address standardization. In Findings of the Association for Computational Linguistics: ACL 2024; Association for Computational Linguistics: Kerrville, TX, USA, 2024; pp. 6048–6063. [Google Scholar] [CrossRef] [Scilit]
- Lin, S.; Hilton, J.; Evans, O. TruthfulQA: Measuring how models mimic human falsehoods. In Proceedings of the 60th Annual Meeting of the Association for Computational Linguistics (Volume 1: Long Papers); Association for Computational Linguistics: Stroudsburg, PA, USA, 2022; pp. 3214–3252. [Google Scholar] [CrossRef] [Scilit]
- Lu, B.; Wang, W.; Jordan, N.; Wright, D.B.; Bechle, A.J.; Zoet, L.K.; Wu, C. A multi-scale assessment for managing coastal geomorphic changes in southwestern Lake Michigan. J. Environ. Manag. 2025, 395, 127878. [Google Scholar] [CrossRef] [Scilit] [PubMed]
- Ariel, A.; Feitelson, E.; Marinov, U. Economic and environmental explanations for the scale and scope of coastal management around the Mediterranean. Ocean Coast. Manag. 2021, 209, 105639. [Google Scholar] [CrossRef] [Scilit]
- Wei, S.; Zeng, X.; Qu, Q.; Wang, M.; Su, H.; Shi, J. HRSID: A high-resolution SAR images dataset for ship detection and instance segmentation. IEEE Access 2020, 8, 120234–120254. [Google Scholar] [CrossRef] [Scilit]
- Li, K.; Wan, G.; Cheng, G.; Meng, L.; Han, J. Object detection in optical remote sensing images: A survey and a new benchmark. ISPRS J. Photogramm. Remote Sens. 2020, 159, 296–307. [Google Scholar] [CrossRef] [Scilit]
- Chen, L.; Hu, Z.; Chen, J.; Sun, Y. SVIADF: Small vessel identification and anomaly detection based on wide-area remote sensing imagery and AIS data fusion. Remote Sens. 2025, 17, 868. [Google Scholar] [CrossRef] [Scilit]
- Wang, X.; Song, X.; Zhao, Y. Identification and positioning of abnormal maritime targets based on AIS and remote sensing image fusion. Sensors 2024, 24, 2443. [Google Scholar] [CrossRef] [Scilit] [PubMed]
- Tao, L.; Zhang, H.; Jing, H.; Liu, Y.; Yan, D.; Wei, G.; Xue, X. Advancements in vision–language models for remote sensing: Datasets, capabilities, and enhancement techniques. Remote Sens. 2025, 17, 162. [Google Scholar] [CrossRef] [Scilit]
- Huo, C.; Chen, K.; Zhang, S.; Wang, Z.; Yan, H.; Shen, J.; Hong, Y.; Qi, G.; Fang, H.; Wang, Z. When remote sensing meets foundation model: A survey and beyond. Remote Sens. 2025, 17, 179. [Google Scholar] [CrossRef] [Scilit]
- Ji, Y.; Gao, S.; Nie, Y.; Majić, I.; Janowicz, K. Foundation models for geospatial reasoning: Assessing the capabilities of large language models in understanding geometries and topological spatial relations. Int. J. Geogr. Inf. Sci. 2025, 39, 1866–1903. [Google Scholar] [CrossRef] [Scilit]
- Liang, J.; Hou, S.; Jiao, H.; Qing, Y.; Zhao, A.; Shen, Z.; Xiang, L.; Wu, H. GeoGraphRAG: A graph-based retrieval-augmented generation approach for empowering large language models in automated geospatial modeling. Int. J. Appl. Earth Obs. Geoinf. 2025, 142, 104712. [Google Scholar] [CrossRef] [Scilit]
- Xiao, Z.; Ma, J. LLM agent framework for intelligent change analysis in urban environment using remote sensing imagery. Autom. Constr. 2025, 177, 106341. [Google Scholar] [CrossRef] [Scilit]
- Blackwell, R.E.; Barry, J.; Cohn, A.G. Towards reproducible LLM evaluation: Quantifying uncertainty in LLM benchmark scores. arXiv 2024, arXiv:2410.03492. [Google Scholar] [CrossRef] [Scilit]
- Windisch, P.; Koechli, C.; Dennstädt, F.; Aebersold, D.M.; Zwahlen, D.R.; Förster, R.; Schröder, C. Is one run enough? Reproducibility of flagship large language models across temperature and reasoning settings in biomedical text processing. J. Am. Med. Inform. Assoc. 2026, 33, 1179–1184. [Google Scholar] [CrossRef] [Scilit] [PubMed]
- Liu, Y.; Iter, D.; Xu, Y.; Wang, S.; Xu, R.; Zhu, C. G-Eval: NLG evaluation using GPT-4 with better human alignment. In Proceedings of the 2023 Conference on Empirical Methods in Natural Language Processing; Association for Computational Linguistics: Stroudsburg, PA, USA, 2023; pp. 2511–2522. [Google Scholar] [CrossRef] [Scilit]
- MapLibre GL JS. Open-Source Map Rendering Library. Available online: https://maplibre.org/ (accessed on 3 September 2026).
- Bureau of Ocean Energy Management (BOEM); National Oceanic and Atmospheric Administration (NOAA). MarineCadastre.gov: Nationwide Automatic Identification System 2024. Available online: https://www.fisheries.noaa.gov/inport/item/73064 (accessed on 3 September 2026).
- PostGIS Project. PostGIS: Spatial and Geographic Objects for PostgreSQL. Available online: https://postgis.net/ (accessed on 3 September 2026).
- European Space Agency. Copernicus Sentinel-2 Data Collection: Level-1C and Level-2A Products. Available online: https://dataspace.copernicus.eu/data-collections/copernicus-sentinel-missions/sentinel-2 (accessed on 3 September 2026).
- Frittelli, J. The Port Strike’s Effect on Maritime Commerce. CRS Insight IN12432; Congressional Research Service, 1 October 2024. Available online: https://www.congress.gov/crs-product/IN12432 (accessed on 3 September 2026).
- U.S. Environmental Protection Agency. Atlantic and Gulf Coast Port Labor Contract. Updated 27 March 2025. Available online: https://www.epa.gov/waterutilityresponse/atlantic-and-gulf-coast-port-labor-contract (accessed on 3 September 2026).
- Office of the Governor of Maryland. Governor Moore Announces the Full Reopening of the Port of Baltimore. 12 June 2024. Available online: https://governor.maryland.gov/news/press-releases/governor-moore-announces-full-reopening-port-baltimore (accessed on 3 September 2026).
- U.S. Coast Guard. Coast Guard Begins Reopening Ports and Waterways Following Hurricane Beryl. 9 July 2024. Available online: https://www.news.uscg.mil/Press-Releases/Article/3833309/coast-guard-begins-reopening-ports-and-waterways-following-hurricane-beryl/ (accessed on 3 September 2026).
- Port Tampa Bay. Port Conditions Update—Hurricane Helene. 29 September 2024. Available online: https://www.porttb.com/2024/09/28/news-tropical-weather-update-tropical-cyclone-9/ (accessed on 3 September 2026).
- Port of New Orleans. Francine Media Advisory 2. 13 September 2024. Available online: https://portnola.com/info/news-media/press-releases/francine-media-advisory-2 (accessed on 3 September 2026).
- Drake, J. What You Need to Know About West Coast Ports Labor Negotiations. U.S. Chamber of Commerce, 15 June 2023. Available online: https://www.uschamber.com/employment-law/unions/what-you-need-to-know-about-west-coast-ports-labor-negotiations (accessed on 3 September 2026).
- Port of Los Angeles. Tariffs Slow Port of Los Angeles Cargo Volume: May Imports Drop 9% Year-over-Year, 19% from April. 13 June 2025. Available online: https://portoflosangeles.org/references/2025-news-releases/news_061325_may_cargo (accessed on 4 September 2026).
- Port of Los Angeles. Tariff “Whipsaw Effect” Boosts June Cargo to New Record at Port of Los Angeles. 14 July 2025. Available online: https://portoflosangeles.org/references/2025-news-releases/news_071425_june_cargo (accessed on 3 September 2026).
- Port of Seattle. Port Cyberattack Archive. 2 April 2025; Archive of Incident Communications from 24 August to 22 November 2024. Available online: https://www.portseattle.org/news/port-cyberattack-archive (accessed on 3 September 2026).
- Port Tampa Bay. Hurricane Idalia Update: Port Tampa Bay Re-Opens and Returns to Normal Operations. 31 August 2023. Available online: https://www.porttb.com/2023/08/31/news-port-tampa-bay-is-monitoring-the-tropics/ (accessed on 3 September 2026).
- U.S. Coast Guard. UPDATE 2: Unified Command Continues Response to Fire Aboard Motor Vessel Grande Costa D’Avorio at Port Newark. 9 July 2023. Available online: https://www.news.uscg.mil/Press-Releases/Article/3452162/update-2-unified-command-continues-response-to-fire-aboard-motor-vessel-grande/ (accessed on 3 September 2026).
- U.S. Coast Guard. MSIB Vol. XXIII Issue 038 Low Water Safety Advisory: MM 167 to MM 303 AHP LMR (12’ and Below). 11 June 2023. Available online: https://content.govdelivery.com/accounts/USDHSCG/bulletins/35f6f56 (accessed on 3 September 2026).
- Puig, M.; Wooldridge, C.; Darbra, R.M. Identification and selection of environmental performance indicators for sustainable port development. Mar. Pollut. Bull. 2014, 81, 124–130. [Google Scholar] [CrossRef] [Scilit] [PubMed]
- Harley, M.D.; Kinsela, M.A. CoastSnap: A global citizen science program to monitor changing coastlines. Cont. Shelf Res. 2022, 245, 104796. [Google Scholar] [CrossRef] [Scilit]

Disclaimer/Publisher’s Note: The statements, opinions and data contained in all publications are solely those of the individual author(s) and contributor(s) and not of MDPI and/or the editor(s). MDPI and/or the editor(s) disclaim responsibility for any injury to people or property resulting from any ideas, methods, instructions or products referred to in the content. |
© 2026 by the authors. Licensee MDPI, Basel, Switzerland. This article is an open access article distributed under the terms and conditions of the Creative Commons Attribution (CC BY) license.