


Highlights
What are the main findings?
- A method for determining the minimum interpretation scale of landslides without relying on a complete inventory is proposed by reducing the order of magnitude of the maximum landslide scale.
- Provides optimal strategies for landslide distribution studies when a complete inventory cannot be obtained, using the landslide area for the distribution analysis rather than the landslide number.
What are the implications of the main findings?
- This method reduces reliance on the interpreted landslide number in establishing inventories and provides an objective criterion for evaluating the availability of historical inventories that miss small-scale landslides.
- This method establishes an objective evaluation index of inventory, enhancing trust and cooperation in landslide research. It guides image selection during emergency interpretation, ensuring cataloging quality while reducing workload.
Abstract
An earthquake-induced landslide inventory with acceptable completeness is critical for the effectiveness and accuracy of research, yet its creation is technically challenging and time-consuming. This study proposes a method to determine the minimum interpretation scale for inventories with acceptable completeness without a complete census. Four earthquakes of varying magnitudes and settings were selected. By comparing landslide distributions across inventories with different completeness, we identified the minimum interpretable scale for these earthquakes. Then, we derived an empirical relationship between the maximum and minimum landslide scales. Assuming a similar geological environment for landslides in the same earthquake, the minimum interpretation scale can be calculated from the maximum scale. Results show that when the maximum landslide area is 10x m2, the distribution of the inventory in which interpreted landslides ≥ 10x−3 m2 is similar to that of the complete inventory. A consistency check using 24 global public inventories supports the empirical robustness of this methodology. Therefore, the minimum acceptable interpretation scale can be set solely by the order of magnitude of the maximum landslide area. Methodology aids in assessing the feasibility of historical earthquake-landslide studies, guiding the selection of remote sensing image resolution for interpretation, reducing the interpretation workload, and shortening post-earthquake response time.
1. Introduction
Earthquake-induced landslide inventories with acceptable completeness are the foundation for earthquake landslide research. Their applications span both practical applications and scientific research [1,2,3,4,5]. Contemporary inventories rapidly generated after earthquakes can provide critical support for emergency, seismic intensity mapping, and reconstruction planning [6,7,8,9]. Historical earthquake inventories reconstructed from geological evidence can enable the estimation of seismic parameters (magnitude, epicenter, and intensity) [10,11,12], providing a vital window into understanding historical earthquakes. The scientific validity of these applications fundamentally depends on whether the earthquake landslide inventory is sufficiently complete. A sufficiently complete inventory must include most small-scale landslides [13]. Overlooking small-scale landslides will affect the landslide distribution patterns [14,15] and then lead to errors in studies that rely on seismic landslide inventories. Ideally, we hope to interpret all-scale landslides. However, it has always been challenging. Historical earthquake landslides, subjected to environmental processes over decades, centuries, or even millennia, often remove evidence of small-scale landslides by erosion, vegetation growth, and human activities [13]. Recently, despite the surge in remote sensing data and advances in interpretation technologies, it remains difficult to rapidly acquire all landslides, especially small-scale landslides, after an earthquake [16,17,18,19]. Therefore, thoroughly exploring the impact of earthquake landslide inventories with varying completeness on research results and determining the minimum interpretation scale required for inventories with acceptable completeness is a prerequisite for conducting landslide application research. It is also key to ensuring the effectiveness of landslide studies.
Remote sensing image acquisition and interpretation are vital factors that affect the minimum scale of landslide inventories. In remote sensing image acquisition, although there are many data sources available now, optical images with abundant spectral, geometric, and texture features [20] are particularly conducive to establishing landslide interpretation markers [21]. Thus, optical images are the main data source for interpreting landslides [22]. If optical sensor parameters (instantaneous field of view, total number of pixels, etc.) are fixed, higher spatial resolution images will correspond to lower flight altitudes, resulting in narrower image swath widths [23,24]. It may take longer to cover the entire earthquake landslide region. For interpretation methods, automatic extraction technologies still have notable shortcomings and cannot completely replace visual interpretation. The spectral similarity between landslides and bare land or impermeable surfaces often leads to errors in automatic extraction [9]. However, such errors are rare in the visual interpretation results. Researchers widely regard visual interpretation as the most reliable method [6,25,26,27]. It may make the interpretation process take longer. Moreover, the characteristics of different-scale earthquake landslides also considerably influence the scale of interpretation. Large-scale landslides are fewer, and their features are significant. They are easy to interpret, and their image spatial resolution requirements are low. In contrast, small-scale landslides are abundant, and their features are often not apparent, necessitating high-resolution remote sensing images for adequate characterization. They have a heavy workload of interpretation [6]. Thus, the interpretation difficulties of small-scale landslides are generally greater than those of large-scale landslides. In most studies, inventories are interpreted incompletely due to limitations in time, interpreters’ skills, and image spatial resolution. Developments in remote sensing and interpretation technologies are expected to mitigate these challenges in the future. Nevertheless, exploring the scale of minimum interpretation is still of great significance.
Xu and Xu [6] discussed the minimum interpretation scale of landslides triggered by significant earthquakes in the early 21st century. They proposed a set of principles for building sufficiently complete earthquake landslide inventories. However, the minimum landslide area that needs to be interpreted depends on the image’s spatial resolution rather than on the landslide’s characteristics in their method. It is easy to create insufficiently complete inventories when using low-resolution images. Malamud et al. [13] took the divergence between an inventory’s frequency-area distribution curves and the theoretical frequency-area distribution curves as an indication of an insufficiently complete inventory. However, this approach provides no information about the minimum interpretation scale. Tanyaş et al. [28] used the rollover point as a proxy for the minimum mapped landslide [29,30,31]. However, the rollover can only be determined after obtaining the majority of the landslides in an inventory. The determination of this proxy did not consider the differences in the geological environment. Xu et al. [32] assume that the current interpreted earthquake landslide inventory has acceptable completeness. They use the Wenchuan earthquake landslide inventory as a reference and attempt to infer the missing part of the 1718 Tongwei earthquake landslide inventory by the geological principle of “the present is the key to the past”. According to the Wenchuan inventory statistics, middle- and large-scale landslides account for ~80% of the total area of earthquake landslides, while small- and middle-scale landslides, despite more counts, contribute only 20% of the total landslide area [33]. They believe that the remaining middle- and large-scale landslides can still represent the main characteristics of historical earthquake landslides [34]. They did not consider the potential influence of different geological environments on the landslide’s scale. The proportions in this conclusion still need to be determined by the complete inventory. This approach is complex and hard to apply to historical landslide inventories. Additionally, the landslide scale range and the minimum landslide scale vary in earthquakes of different magnitudes. Although a few researchers have made progress in exploring the minimum landslide interpretation scale, it remains difficult to find an index that can adapt to every earthquake’s geological environment without relying on most landslides in inventories.
This study aims to develop a method to determine the minimum interpretation scale for landslide inventories with acceptable completeness suitable for different earthquakes. Firstly, we selected several representative earthquakes in recent years to ensure the diversity of the earthquake landslide inventory. Then, the research conducts a comparative analysis of landslide distributions across various interpretation-completeness inventories to determine whether these inventories are sufficiently complete. Finally, based on the assumption that the geological environment that induces landslides is similar in the same earthquake, this study explores the relationship between the maximum and minimum landslide scales in inventories with acceptable completeness. It establishes a method that determines the minimum interpretation scale from the easily obtainable maximum landslide scale, without relying on a complete inventory. This study provides a criterion for assessing the usability of landslide inventories, a reference for selecting the landslide interpretation scale, and the spatial resolution of remote sensing images.
2. Materials and Methods
2.1. Selection of Earthquake Case and Data
Several principles must be followed when selecting study areas: (1) The studied earthquake cases must have high spatial resolution remote sensing images, which facilitate interpreting landslides accurately. This criterion can meet the requirement for studying the different interpretation scales of landslide inventories with acceptable completeness by excluding small-scale landslides. (2) The earthquake cases selected should encompass different magnitudes. The scale of landslides induced by earthquakes varies with magnitude, allowing for exploring the interpretation scale across different magnitudes. (3) The earthquake landslides studied should come from diverse geological environments whenever possible. This diversity allows for the investigation of similarities and differences in the interpretation scale of earthquake landslides across different geological environments.
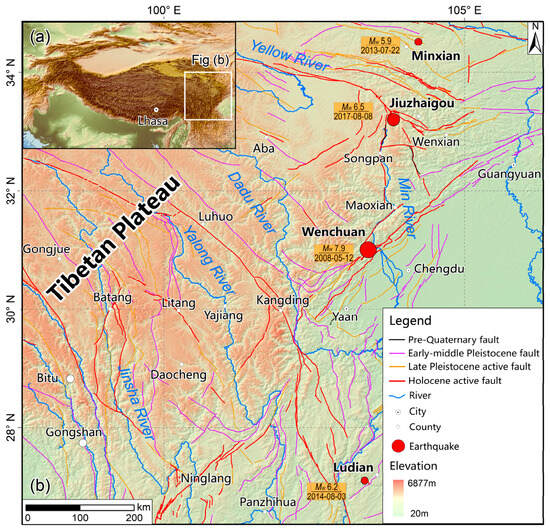
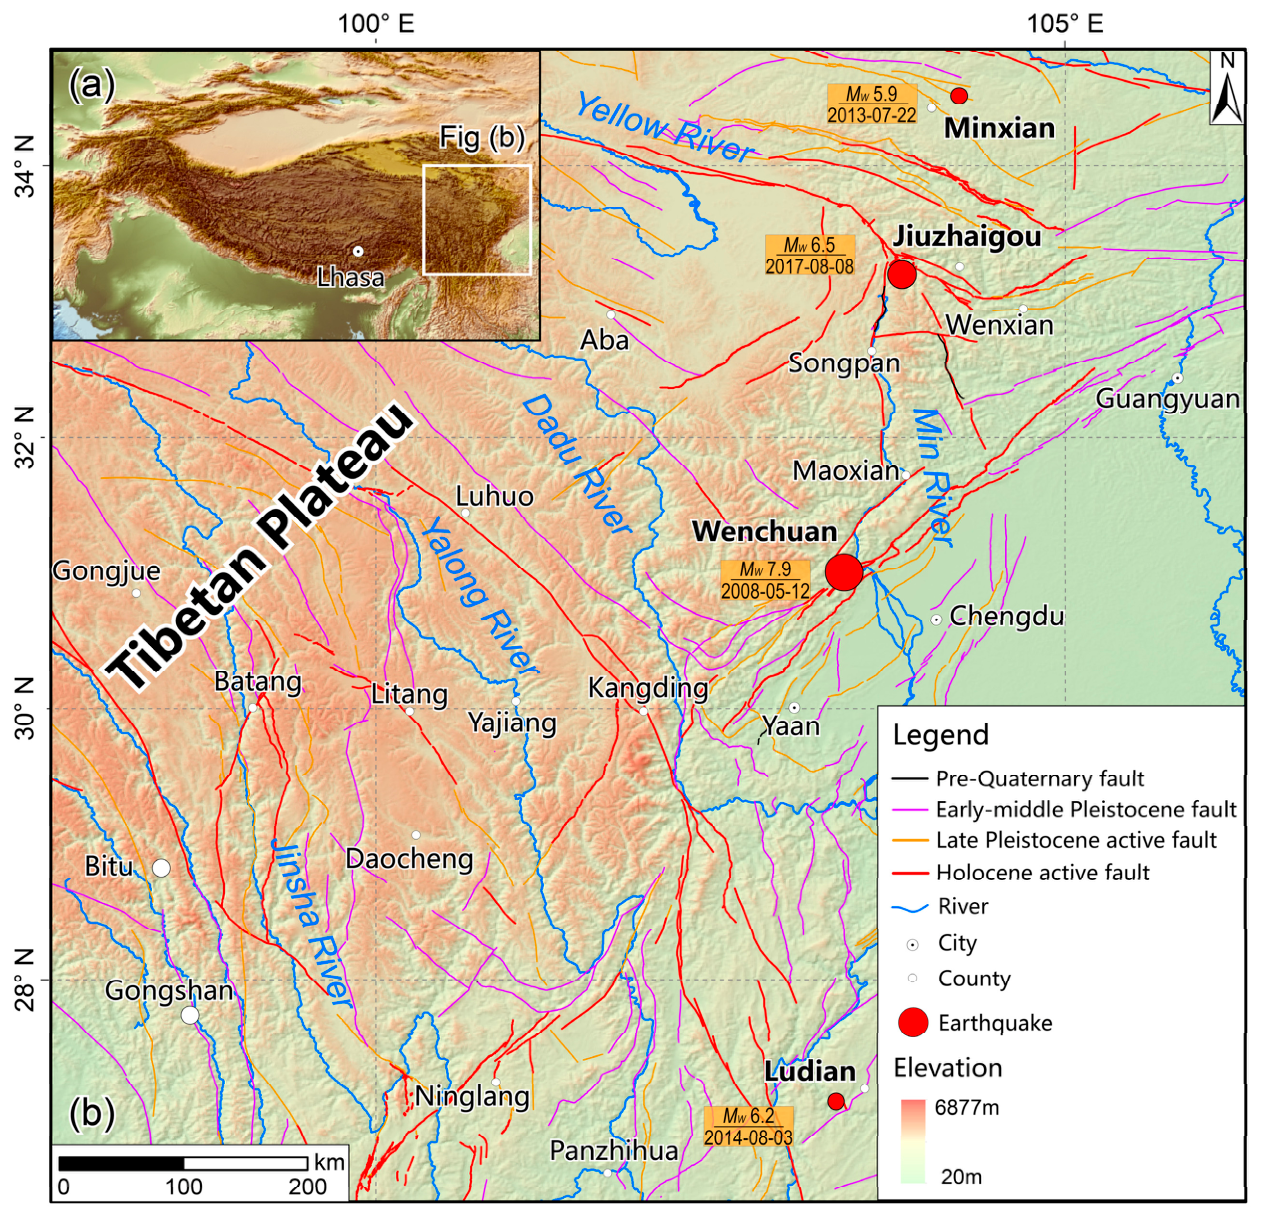
The eastern margin of the Tibetan Plateau is located at the front edge of the collision and extrusion between the Indian plate and the Eurasian plate. The tectonic movement is extremely strong, and various large-scale active faults are intertwined [35,36], resulting in broken crust, deep valleys, and significant topography, providing sufficient dynamic conditions and a structural plane foundation for the preparation of earthquake landslides. The region not only develops rock landslides controlled by fault damage zones and earthquake-fractured rock mass, but also widely distributes loess landslides induced by loess liquefaction and earthquake cracking [37,38]. This unique geological environment makes the region one of the most landslide-prone and complex areas in China and the world. This area provides a suitable experimental setting for selecting this research case. According to the above principles, this study selected the Wenchuan earthquake in 2008, the Minxian earthquake in 2013, the Ludian earthquake in 2014, and the Jiuzhaigou earthquake in 2017 as the research objects (Figure 1).
Figure 1.
Earthquakes used in this study. (a) Tibetan Plateau. (b) Active tectonic map of the Eastern Tibetan Plateau.
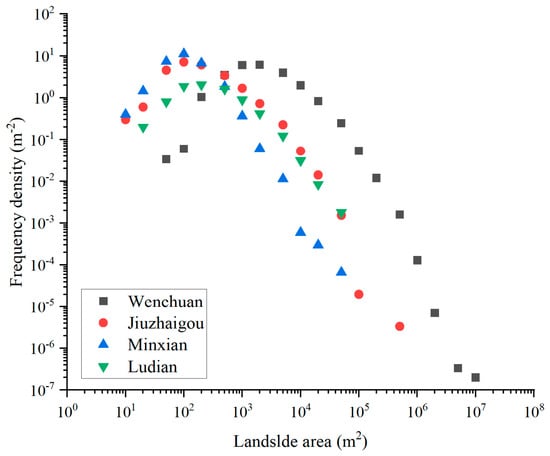
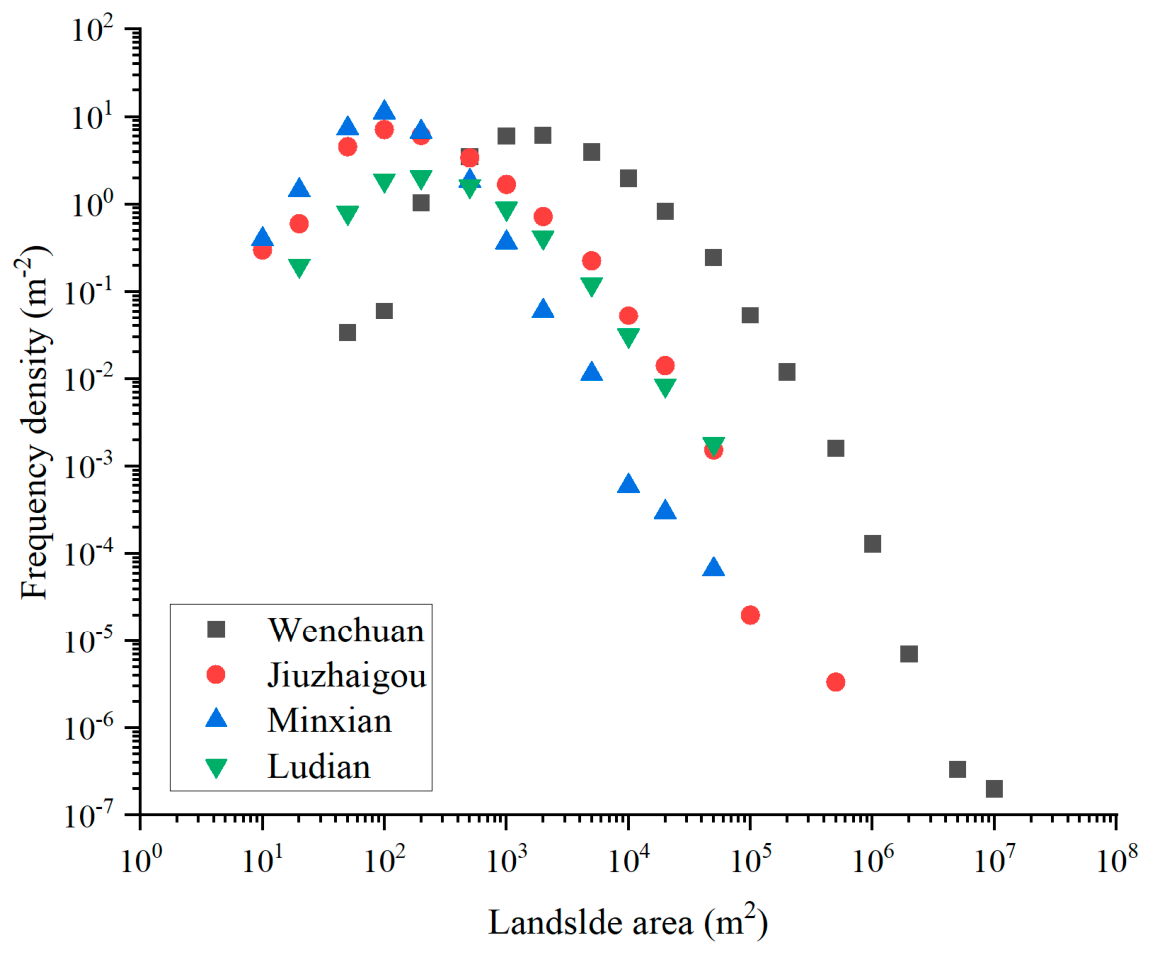
The sources and detailed information of the earthquake landslide inventories are shown in Table 1. These four landslide inventories were drawn using remote sensing images from multiple time periods before and after the earthquake, with a resolution of up to 1 m or 0.5 m. The explanation method adopts visual interpretation. The Wenchuan and Ludian landslide inventories are primarily interpreted using Google Earth images. Minxian landslide inventory and Jiuzhaigou landslide inventory were interpreted using Pleiades and GeoEye-1 satellite images, respectively. We have checked and partially modified these four inventories. The study drew frequency-area curves of four earthquakes to reflect the completeness of inventories (Figure 2).
Table 1.
Earthquake landslide inventories.
Figure 2.
Frequency-area distribution curves of the research objects.
Numerous studies on landslide distribution have shown that earthquake-induced landslides are closely related to topography, geological structures, and lithology [46,47]. This study selected terrain, geological, and seismic factors as influencing factors in the analysis of landslide distribution, based on an extensive literature review [48,49,50,51]. Specifically, the seismic factor selects the distance to the fault; the terrain factor includes elevation, slope, and aspect; and the geological factor pertains to lithology. The terrain factors were derived from the processing of ALOS DEM (12.5 m) (https://search.asf.alaska.edu, accessed on 25 March 2025), while the geological and seismic factors were obtained from 1:200,000 geological maps (https://geocloud.cgs.gov.cn, accessed on 25 March 2025) [52].
Slope is the most direct terrain factor that controls slope stability. The greater the slope, the greater the gravity component of the slope body, the stronger the sliding force, and the relatively weaker the anti-sliding force. The slope is more prone to instability during ground-motion triggering [53]. Numerous studies have shown that slope is one of the most important controlling factors in the spatial distribution of earthquake landslides [48,49,54]. Elevation indirectly reflects multiple details, such as terrain undulation, vegetation coverage, and seismic amplification effects. Across different elevation zones, differences in the degree of rock weathering, stress state, and groundwater conditions affect landslide development. In addition, the topographic amplification effect of seismic waves on ridges and mountaintops makes high-altitude areas more prone to landslides [55,56]. The aspect affects the intensity and duration of solar radiation received by the slope, which in turn affects the temperature and the degree of weathering of the rock and soil mass. The vegetation cover, soil development, and rock weathering characteristics vary across different aspects, resulting in differences in slope stability [53,57]. In addition, the relationship between aspect, seismic wave propagation direction, and fault rupture direction may also affect the spatial distribution of landslides. The distance from the seismogenic fault directly reflects the attenuation characteristics of seismic motion and the influence range of the fault rupture zone. Areas close to faults typically experience stronger ground vibrations and higher levels of rock fragmentation, resulting in significantly higher landslide density than in areas far from the fault [58,59]. Many studies have shown that landslides are concentrated within a certain distance of the fault and exhibit an exponential decay with increasing distance. Lithology determines the mechanical strength, degree of weathering, and permeability of the rock mass and is the material basis for controlling slope stability. Soft rocks have low strength and are prone to weathering, making them more susceptible to landslides during movement; Hard rocks are relatively stable. The density and scale of landslides vary significantly among different lithologies [60,61,62].
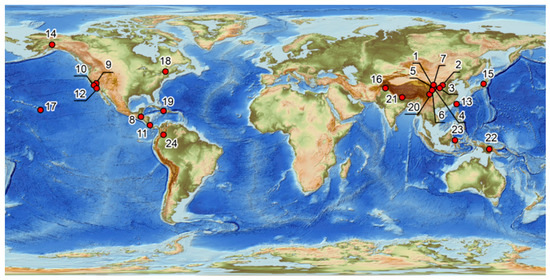
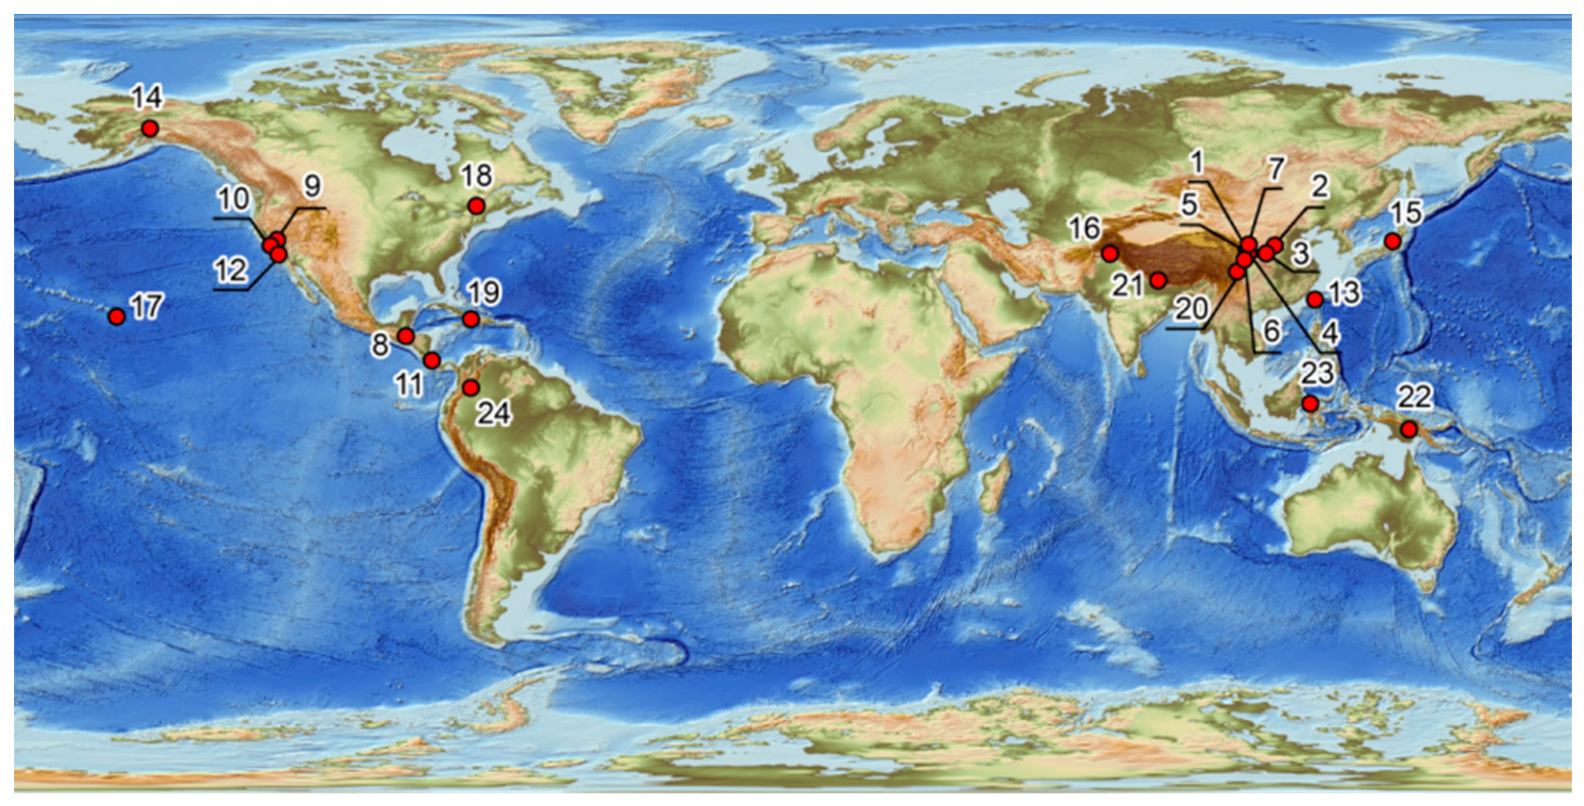
We believe that the public inventories and those used in published articles have undergone multiple checks and have been used extensively, suggesting that their completeness of interpretation is high. This study selected 24 earthquake landslide inventories (Figure 3) worldwide from AD734 to AD2019 to perform a consistency check of this study’s method, as shown in Table 2. These inventories contain landslides in diverse geological, climatic, geomorphic, and mapping environments worldwide.
Figure 3.
Global earthquake landslide inventories. The numbers in the figure represent the earthquake, which corresponds to the No. of the earthquake in Table 2.
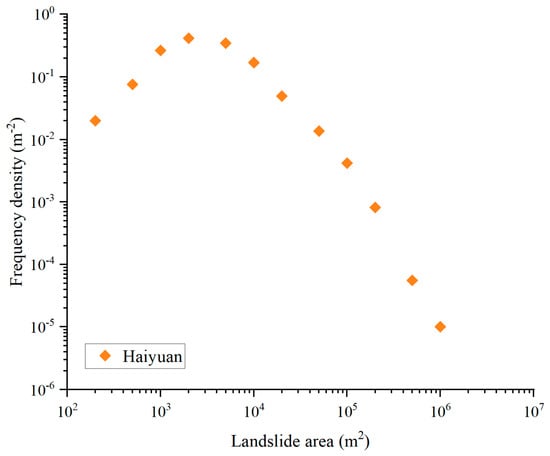
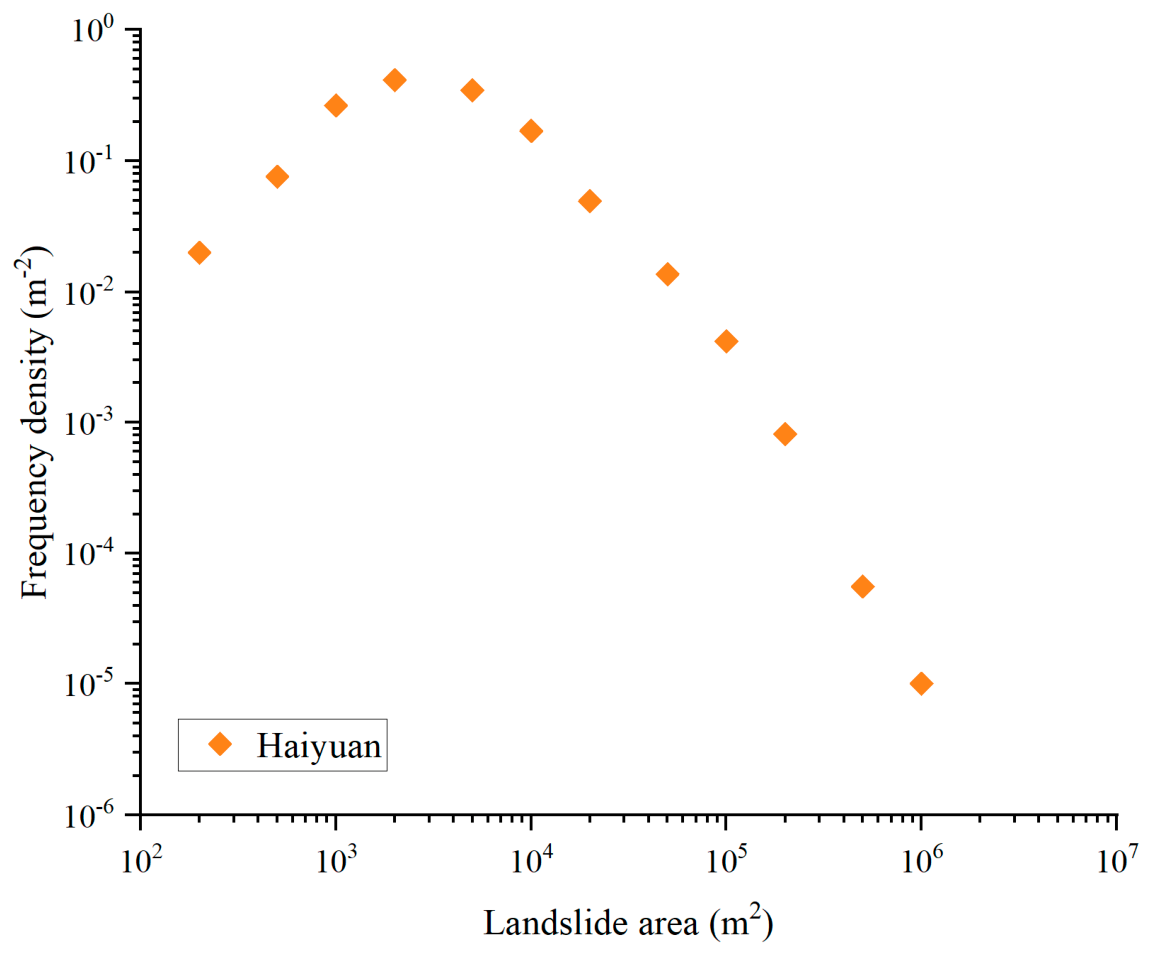
In addition, the Haiyuan earthquake landslide inventory was randomly selected as the validation inventory. This inventory was constructed through visual interpretation of multi-temporal, high-resolution Google Earth imagery, supplemented by extensive field investigations, and covers an area of over 67,500 km2 affected by the earthquake. Landslides were identified based on diagnostic geomorphic features such as source-area material depletion and steep headscarps. In total, 7834 coseismic landslides were recognized. With respect to data quality, the inventory explicitly excludes landslides triggered by non-seismic factors such as rainfall or human activity. The reliability and completeness of the inventory are supported by the temporal stability of landslide morphology observed over the past ~30 years on satellite and UAV images, as well as by direct field verification, as previously demonstrated by Xu et al. [63]. The study also drew frequency-area curves to reflect the completeness of this inventory (Figure 4).
Figure 4.
Frequency-area distribution curves of the Haiyuan earthquake landslide inventory.
Table 2.
Global earthquake landslide inventories.
2.2. Methods
To avoid conceptual confusion, we first define the terms to be used in the following text. We refer to the ideally completely interpreted landslide inventory as the complete landslide inventory. In the actual interpretation process, too small landslides cannot be interpreted due to various problems, and there will be a minimum interpretation area for landslides that can actually be interpreted. Given the complexities of selecting image resolution during interpretation, we believe that determining the order of magnitude of the minimum landslide area is more convenient for selecting the image resolution. Therefore, the order of magnitude of the minimum interpret area for an inventory usable for the vast majority of subsequent spatial distribution research is called the minimum interpretation scale. The inventory generated by different interpretation scales is called a different interpretation scale inventory.
Studies based on earthquake landslide inventories, such as assessing landslide susceptibility and estimating some historical earthquake parameters, rely on landslide distributions most of the time. Consequently, this study aims to evaluate the quality and usability of earthquake landslide inventories by investigating whether significant differences in landslide distribution exist across inventories interpreted at varying scales. It is assumed that the landslide inventories used in this study have been thoroughly and accurately interpreted. The study simulates landslide inventories with varying interpretation scales by excluding landslides of various scales, from small to large. Previous research on landslide distribution typically employs both landslide numbers and landslide areas [48,83,84]. So, this study characterizes landslide distribution by calculating percentages of landslide numbers and areas within each classification of influencing factors. The landslide distribution from the complete inventory serves as the reference for this analysis. Since each classification interval is an independent category, when comparing spatial distributions, only the absolute difference in percentages within the same interval should be compared. Here, we introduce Mean Absolute Deviation (MAD) as an objective statistical indicator to quantify the deviation of each interpretation scale inventory from the complete inventory. The calculation formula is as follows:
where n is the total number of classes for that factor. yi represents the percentage of landslide number (or area) in class i of a given factor in the complete inventory. represents the percentage of landslide number (or area) in class i of a given factor in different interpretation-scale inventory.
Considering potential rounding errors in the calculation process, this study suggests that an inventory is considered to have a distribution comparable to the complete inventory if the MAD values across all five factors are consistently ≤0.5%. If the MAD value is greater than 0.5% and less than 1%, it is considered that the deviation of landslide distribution is acceptable.
After obtaining landslide distributions from earthquake landslide inventories with varying accuracies, this study investigates the minimum interpretation scale by comparing their similarity with the landslide distribution of the complete landslide inventory. Establishing a minimum interpretation scale index is critical for determining the appropriate spatial resolution of remote sensing imagery for effective interpretation. In emergency response following an earthquake, collecting geological environment data and interpreting landslides are often carried out simultaneously. If interpreters must delay the landslide interpretation work until data collection is complete, the efficiency of the interpretive process may be significantly compromised. Balancing geological environment factors and the need for rapid interpretation is a challenge. Theoretically, a single earthquake can trigger numerous landslides across an extensive area. However, landslides induced by the same earthquake exhibit considerable similarities in their geological environments, aside from the same triggering factors, compared to those induced by different earthquakes. Suppose landslides easily interpreted in the same earthquake can be referenced to determine the minimum interpretation scale. In that case, the rationality of this method should be greater than the index relying solely on earthquake parameters.
The maximum landslide in an earthquake is often the most significant and easiest to interpret. It is easy to determine the maximum landslide scale induced by an earthquake. In this study, the maximum landslide refers to a landslide induced by a single sliding source area and does not include multiple connected landslides. In addition, when a single large rock collapse is decomposed into discrete polygon features by the interpreter, it also needs to be merged. This study aims to establish a method to determine the minimum interpretation scale, using the maximum landslide scale as a reference. This study determines the minimum landslide area magnitude suitable for distribution analysis across various earthquake landslide inventories by comparing landslide distributions from inventories with differing interpretation scales with the complete inventory. Subsequently, we will conduct a statistical analysis of the minimum and maximum landslide area magnitudes for four specific seismic events to explore their correlations. Ultimately, this research seeks to establish a relationship between the maximum landslide scale and the minimum interpretation scale in landslide inventories across different earthquake magnitudes, thereby determining the minimum interpretation scale by utilizing the maximum landslide scale.
In terms of consistency checking, this study employs the established method to assess the minimum interpretation scale of 24 global earthquake landslide inventories. The chosen inventories are characterized by a broad distribution of landslides and notable variations in geological environments. By examining whether these inventories satisfy the proposed relationship, we can assess the empirical consistency of our criterion across diverse settings.
3. Results
3.1. Wenchuan
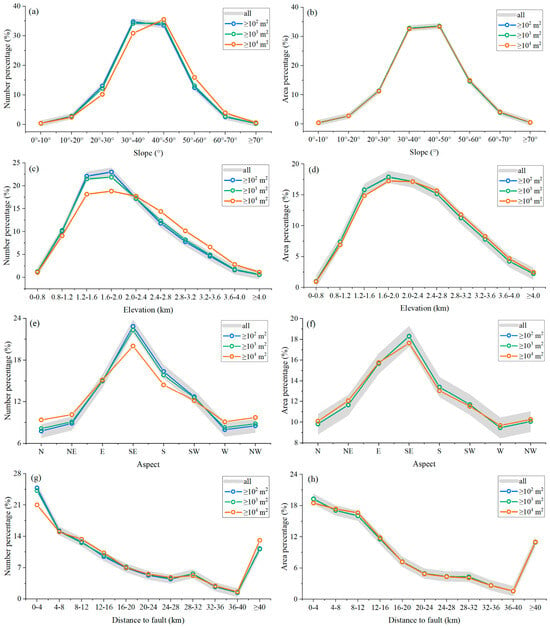
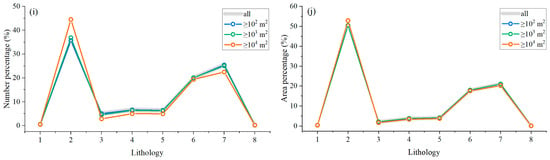
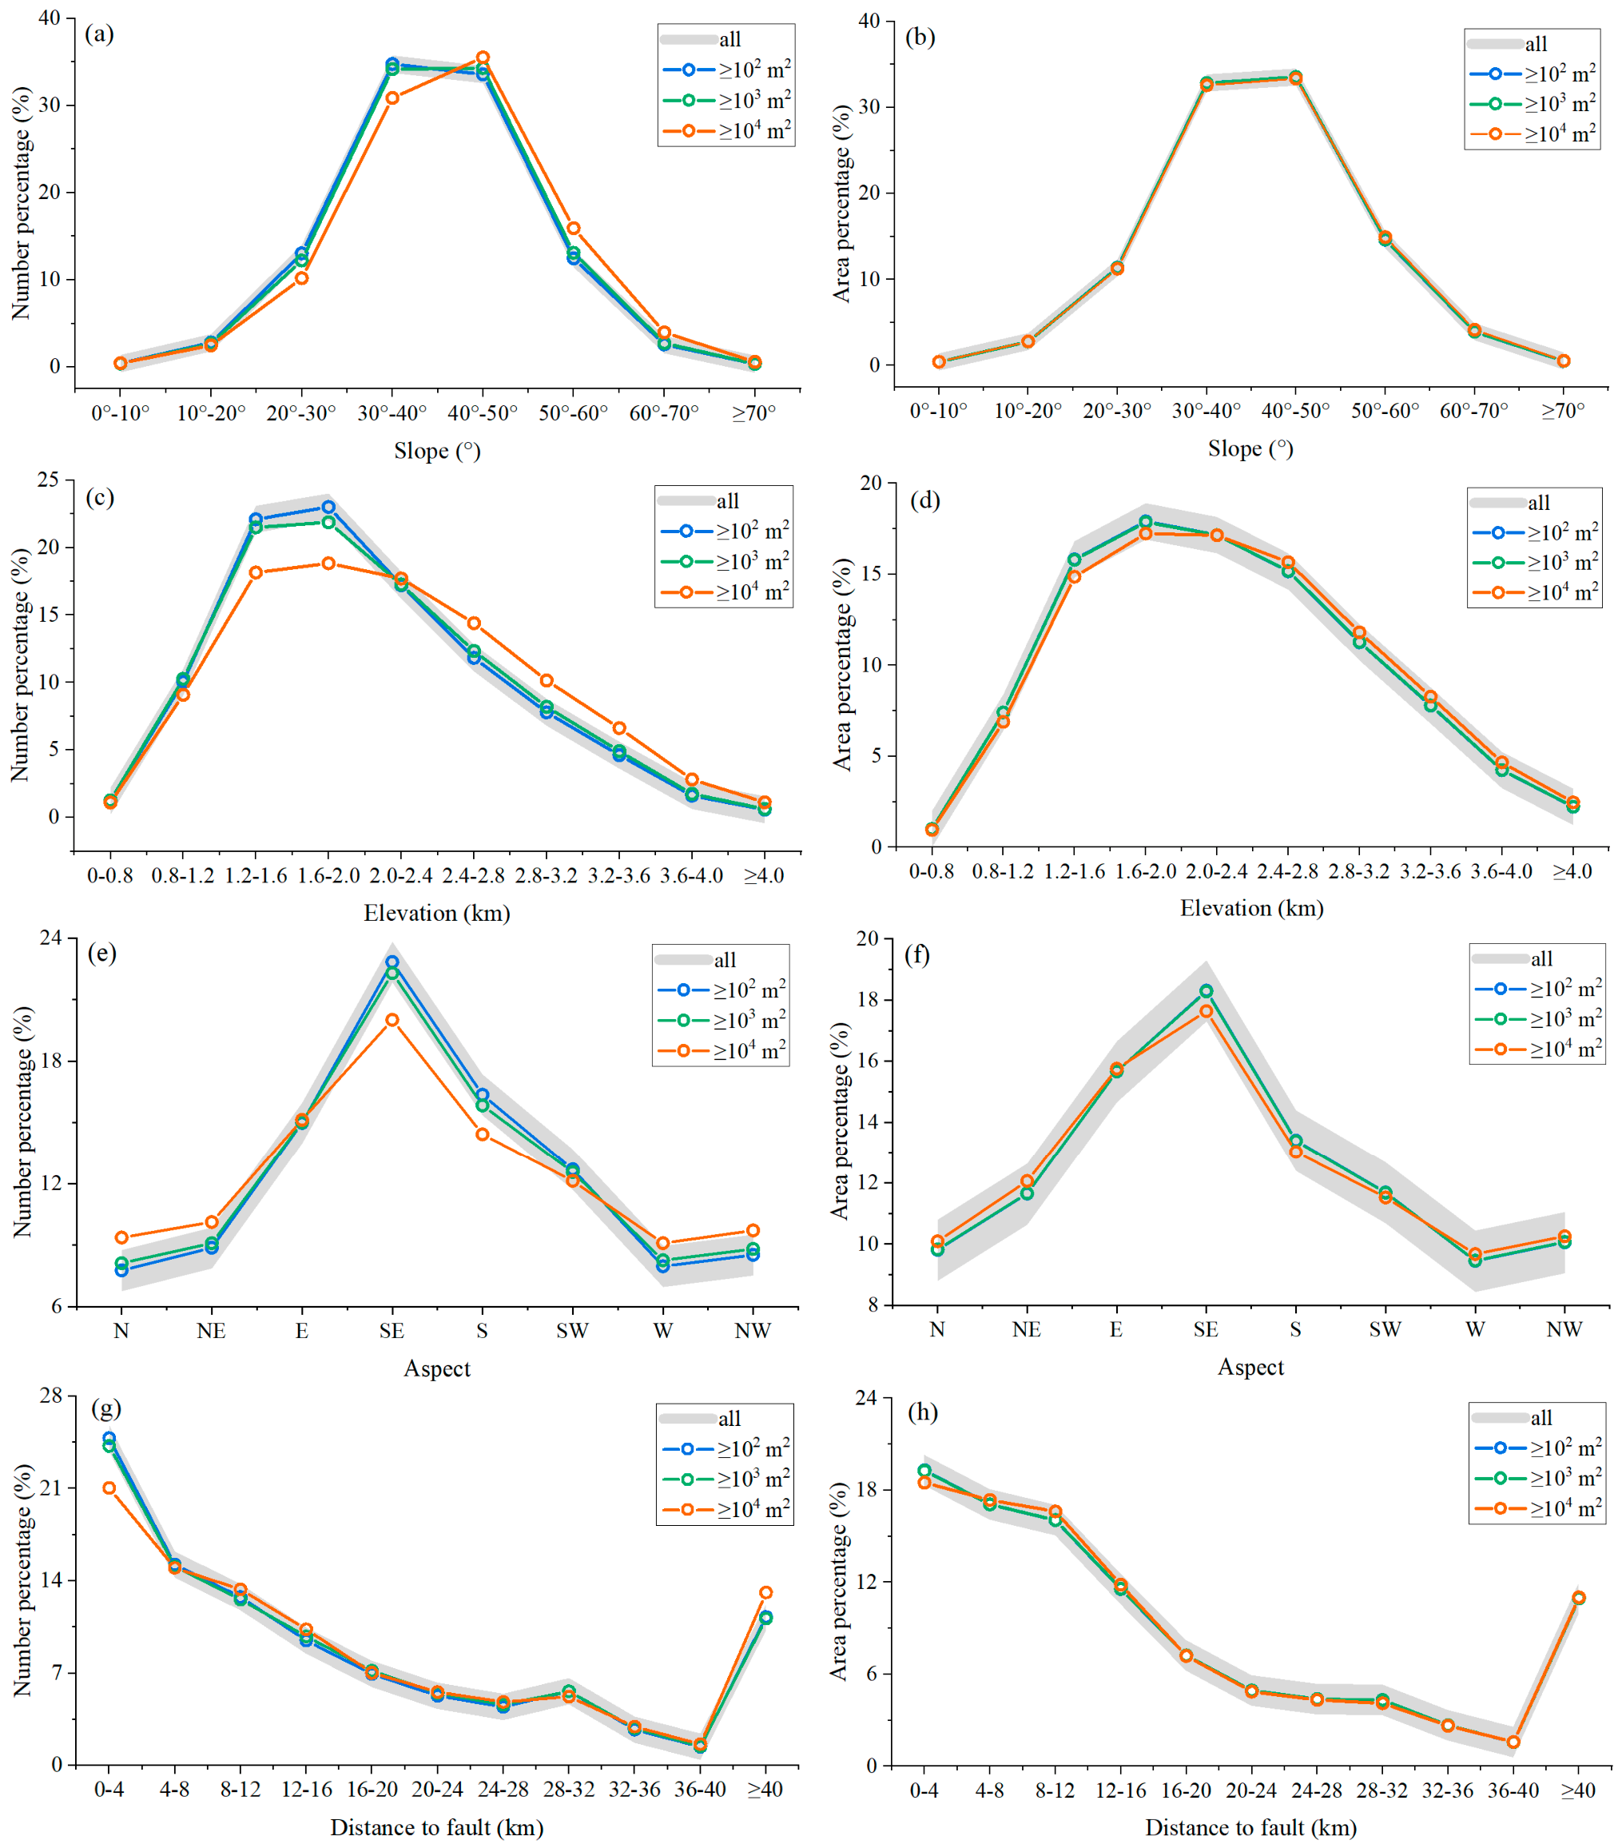
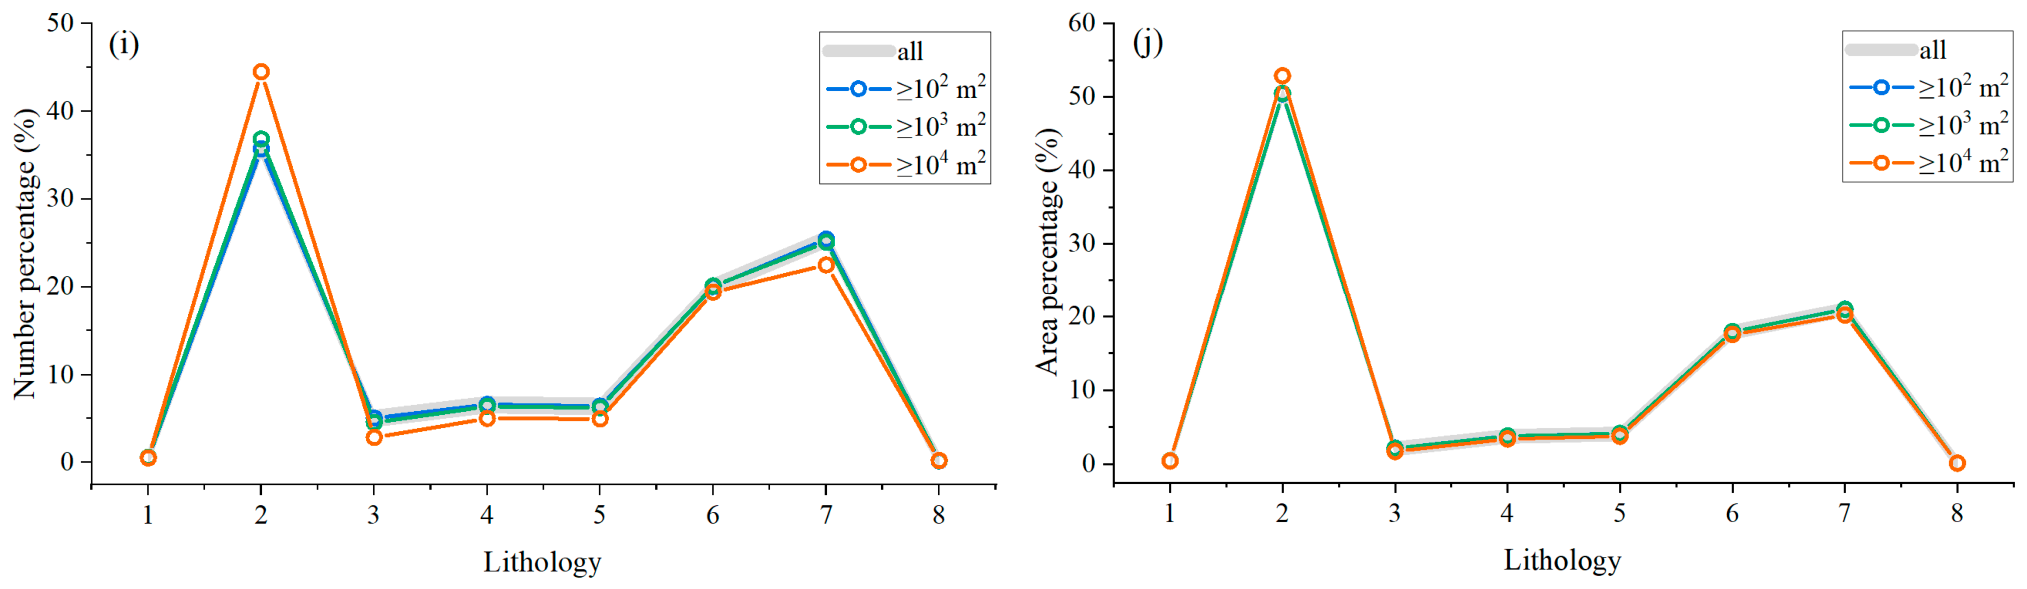
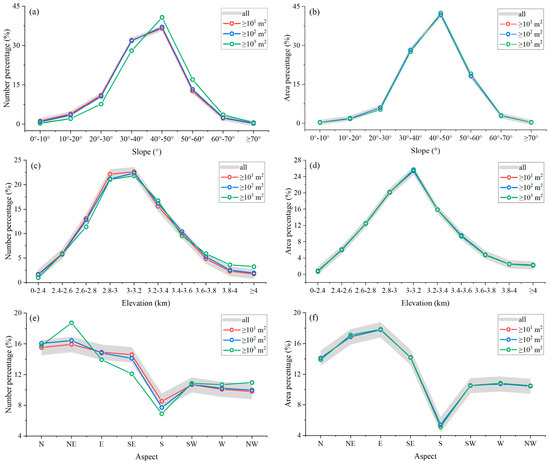
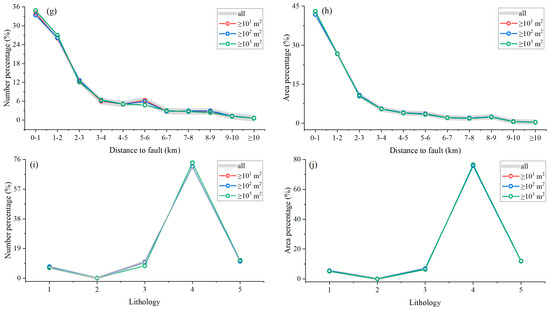
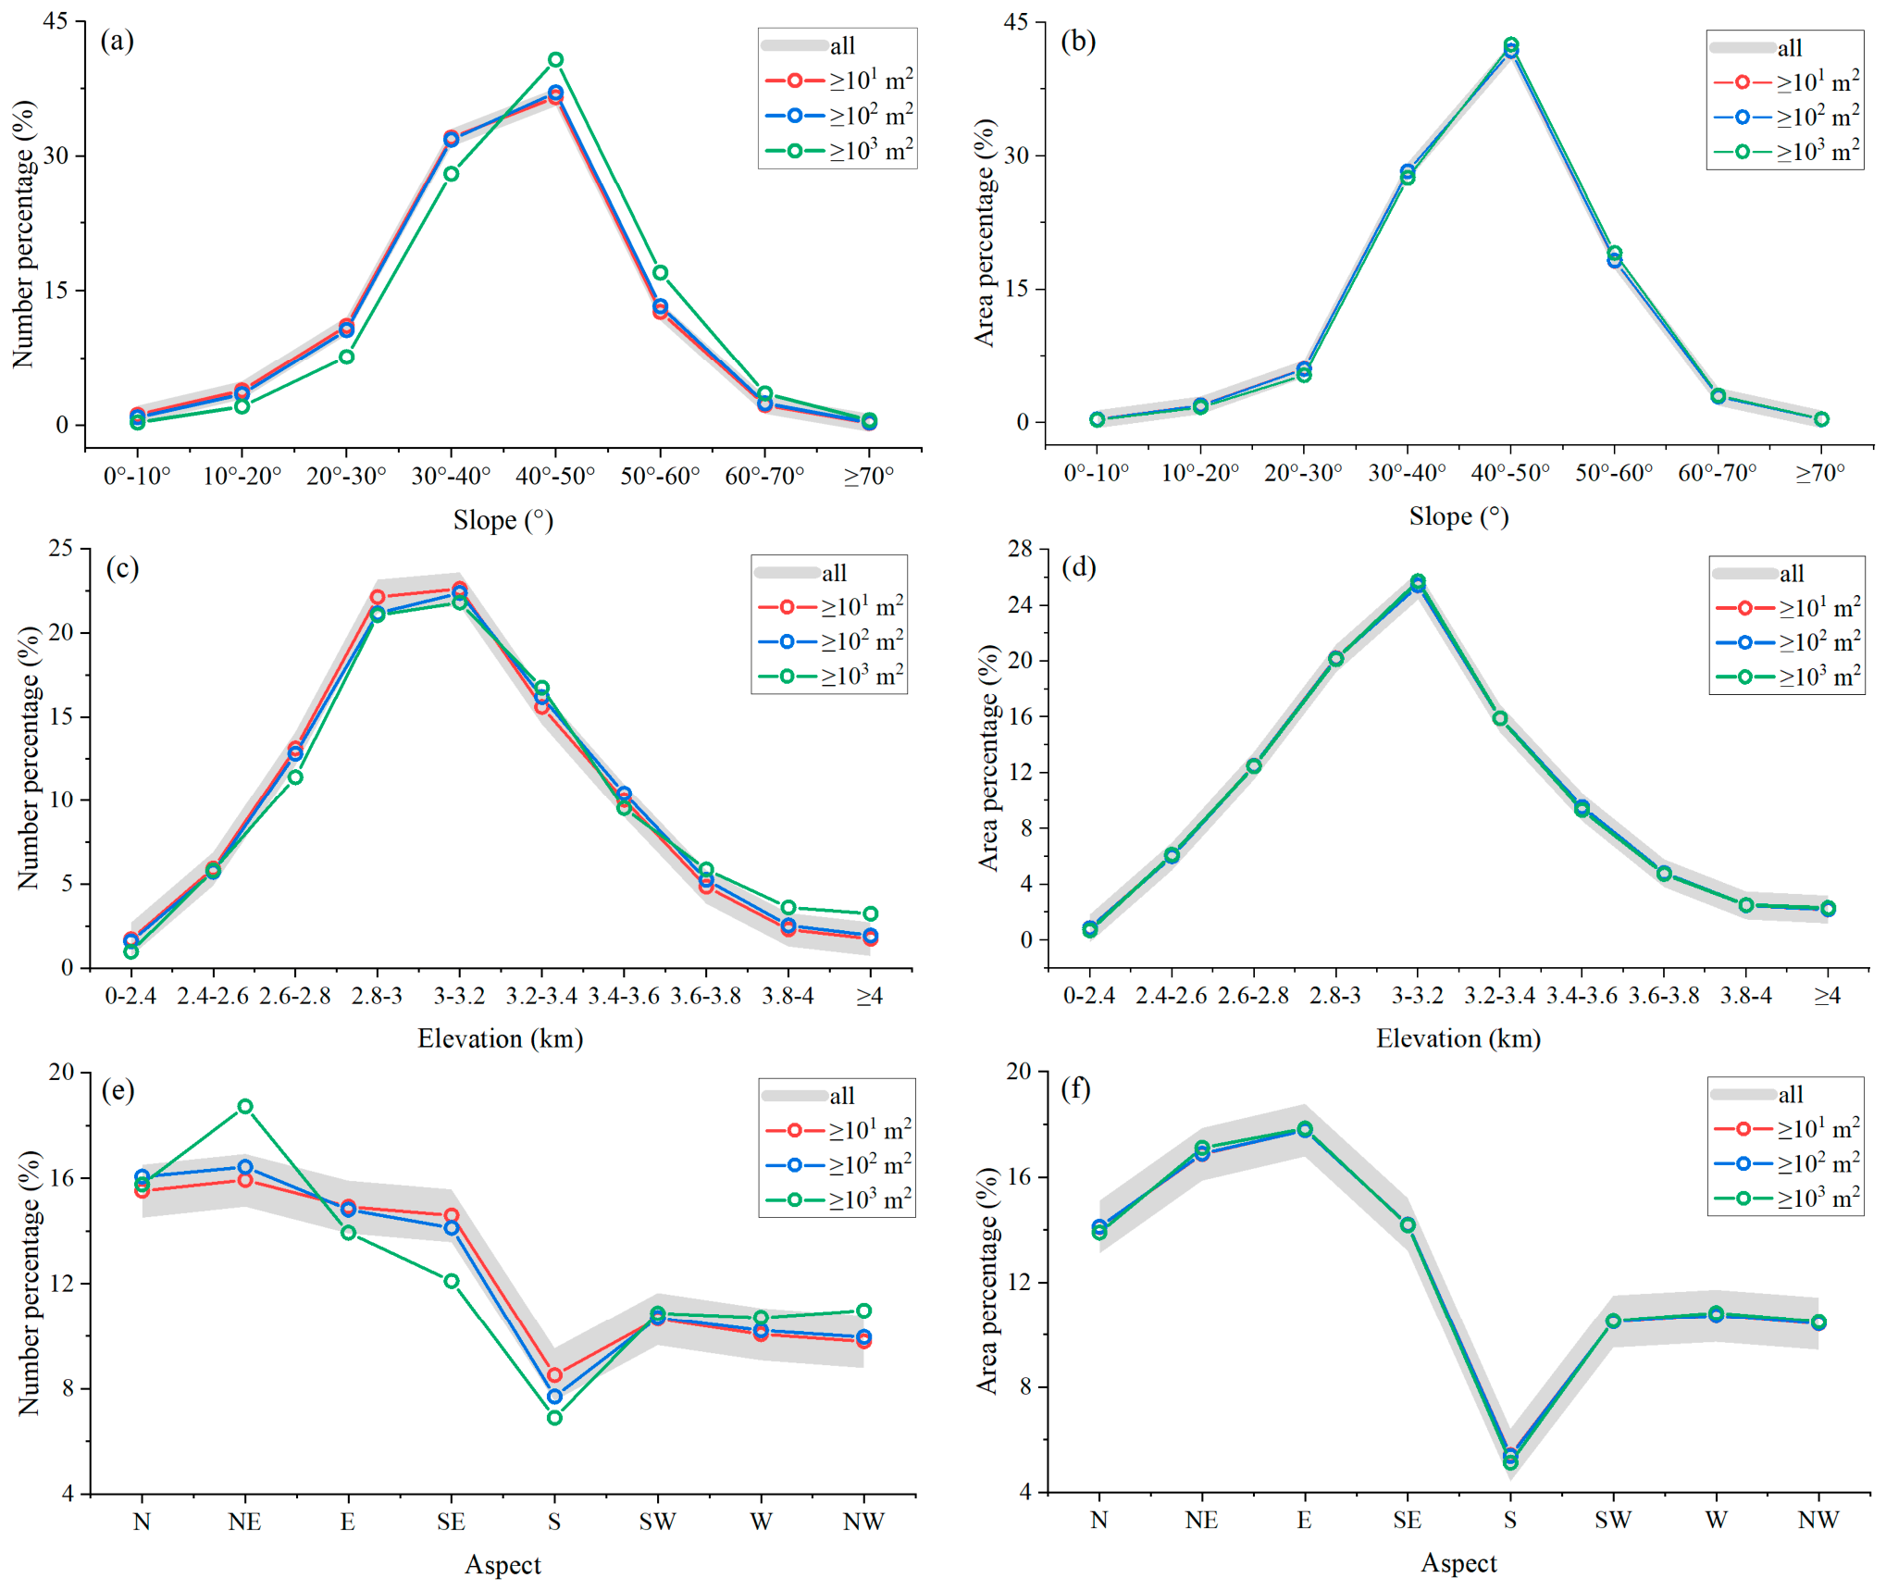
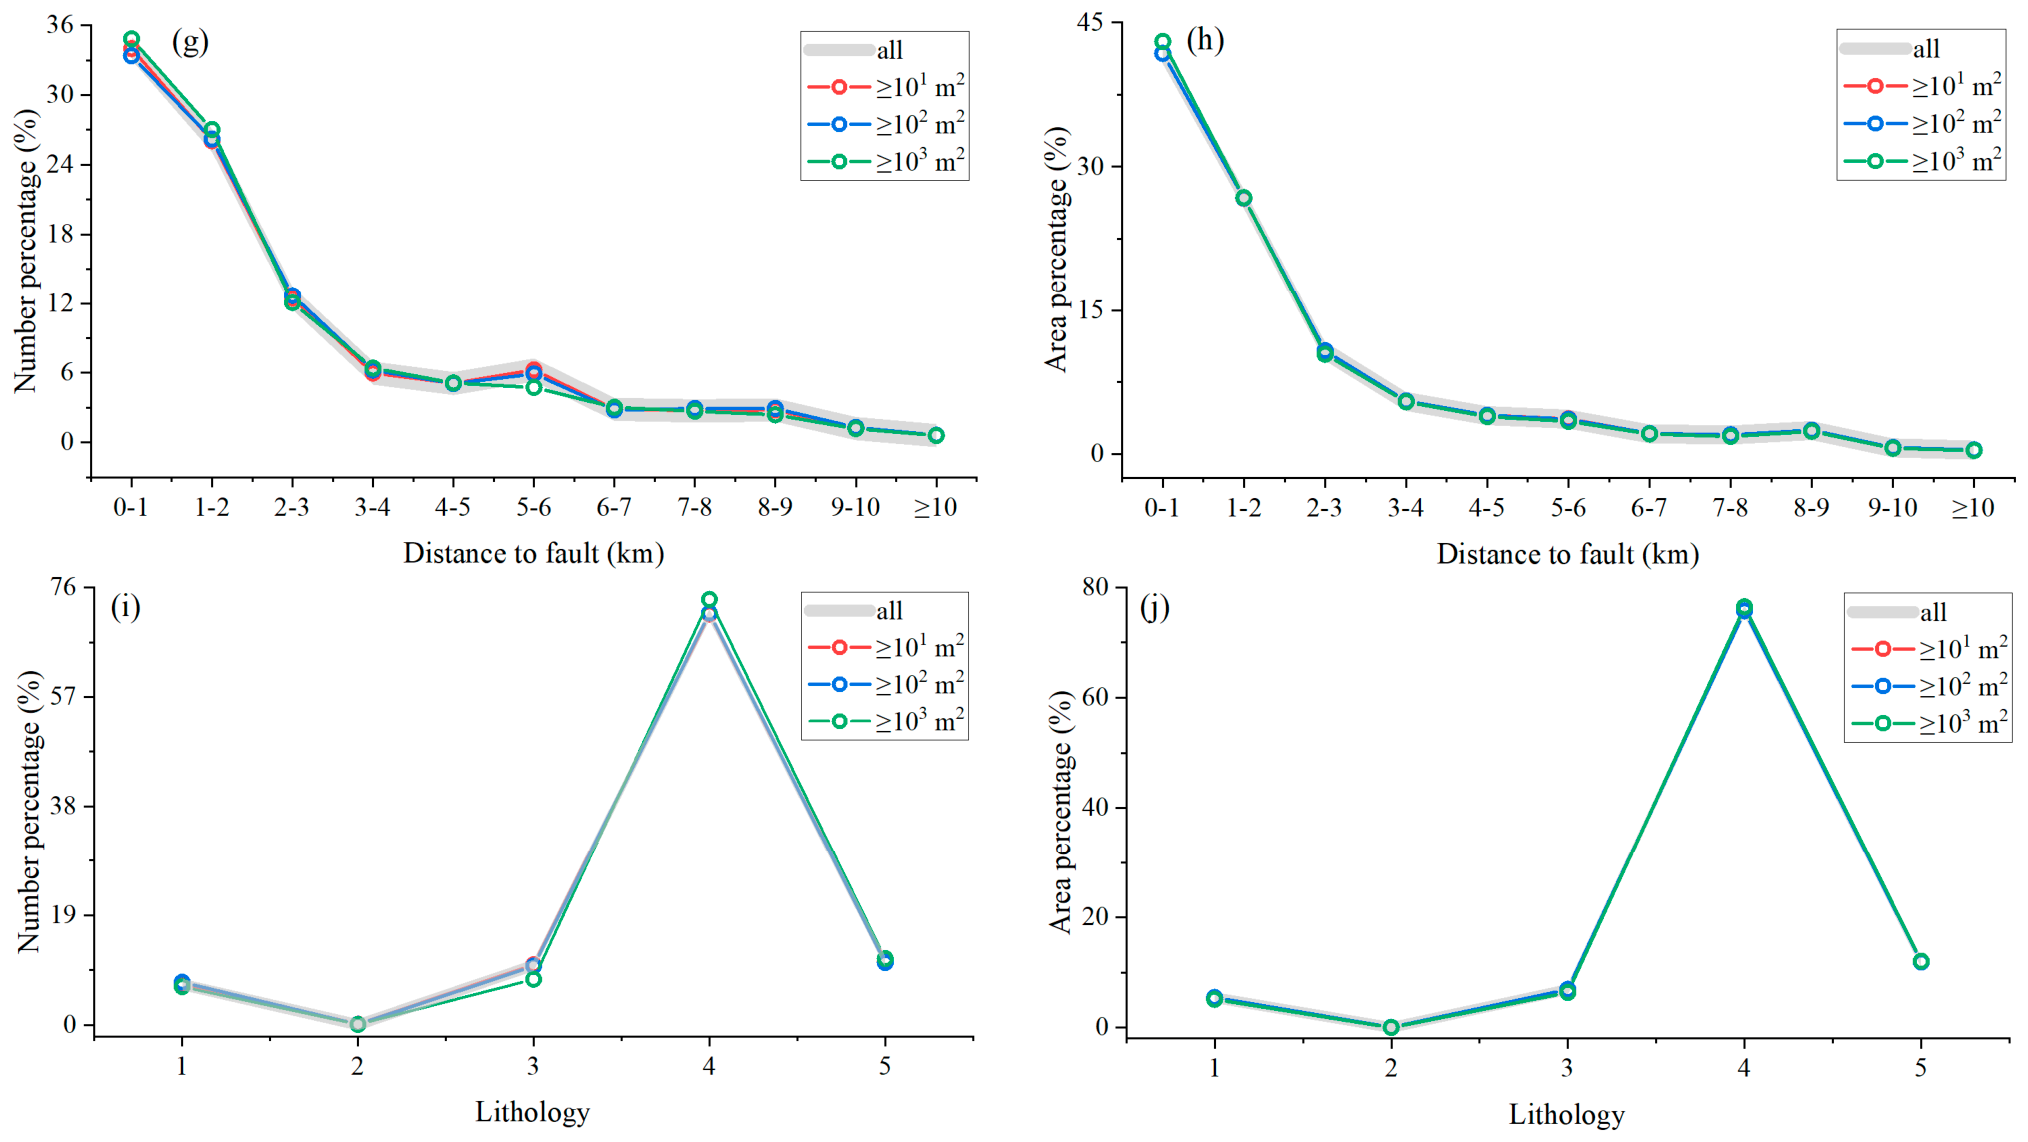
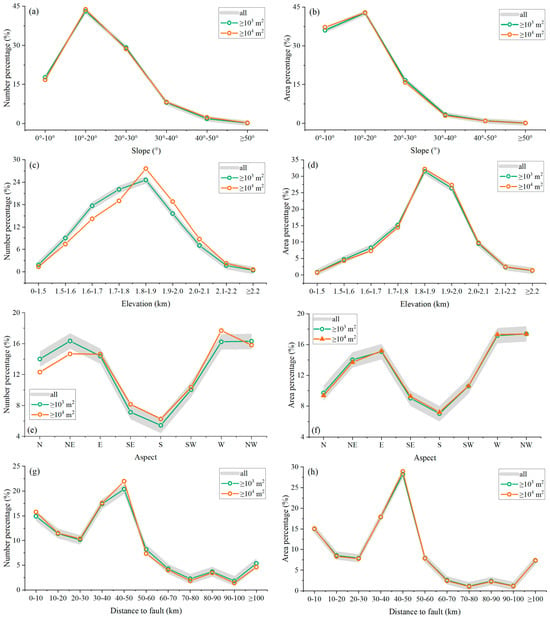
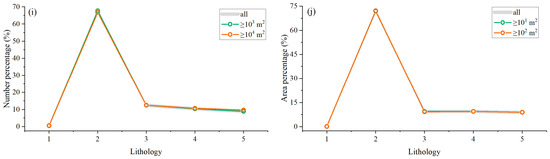
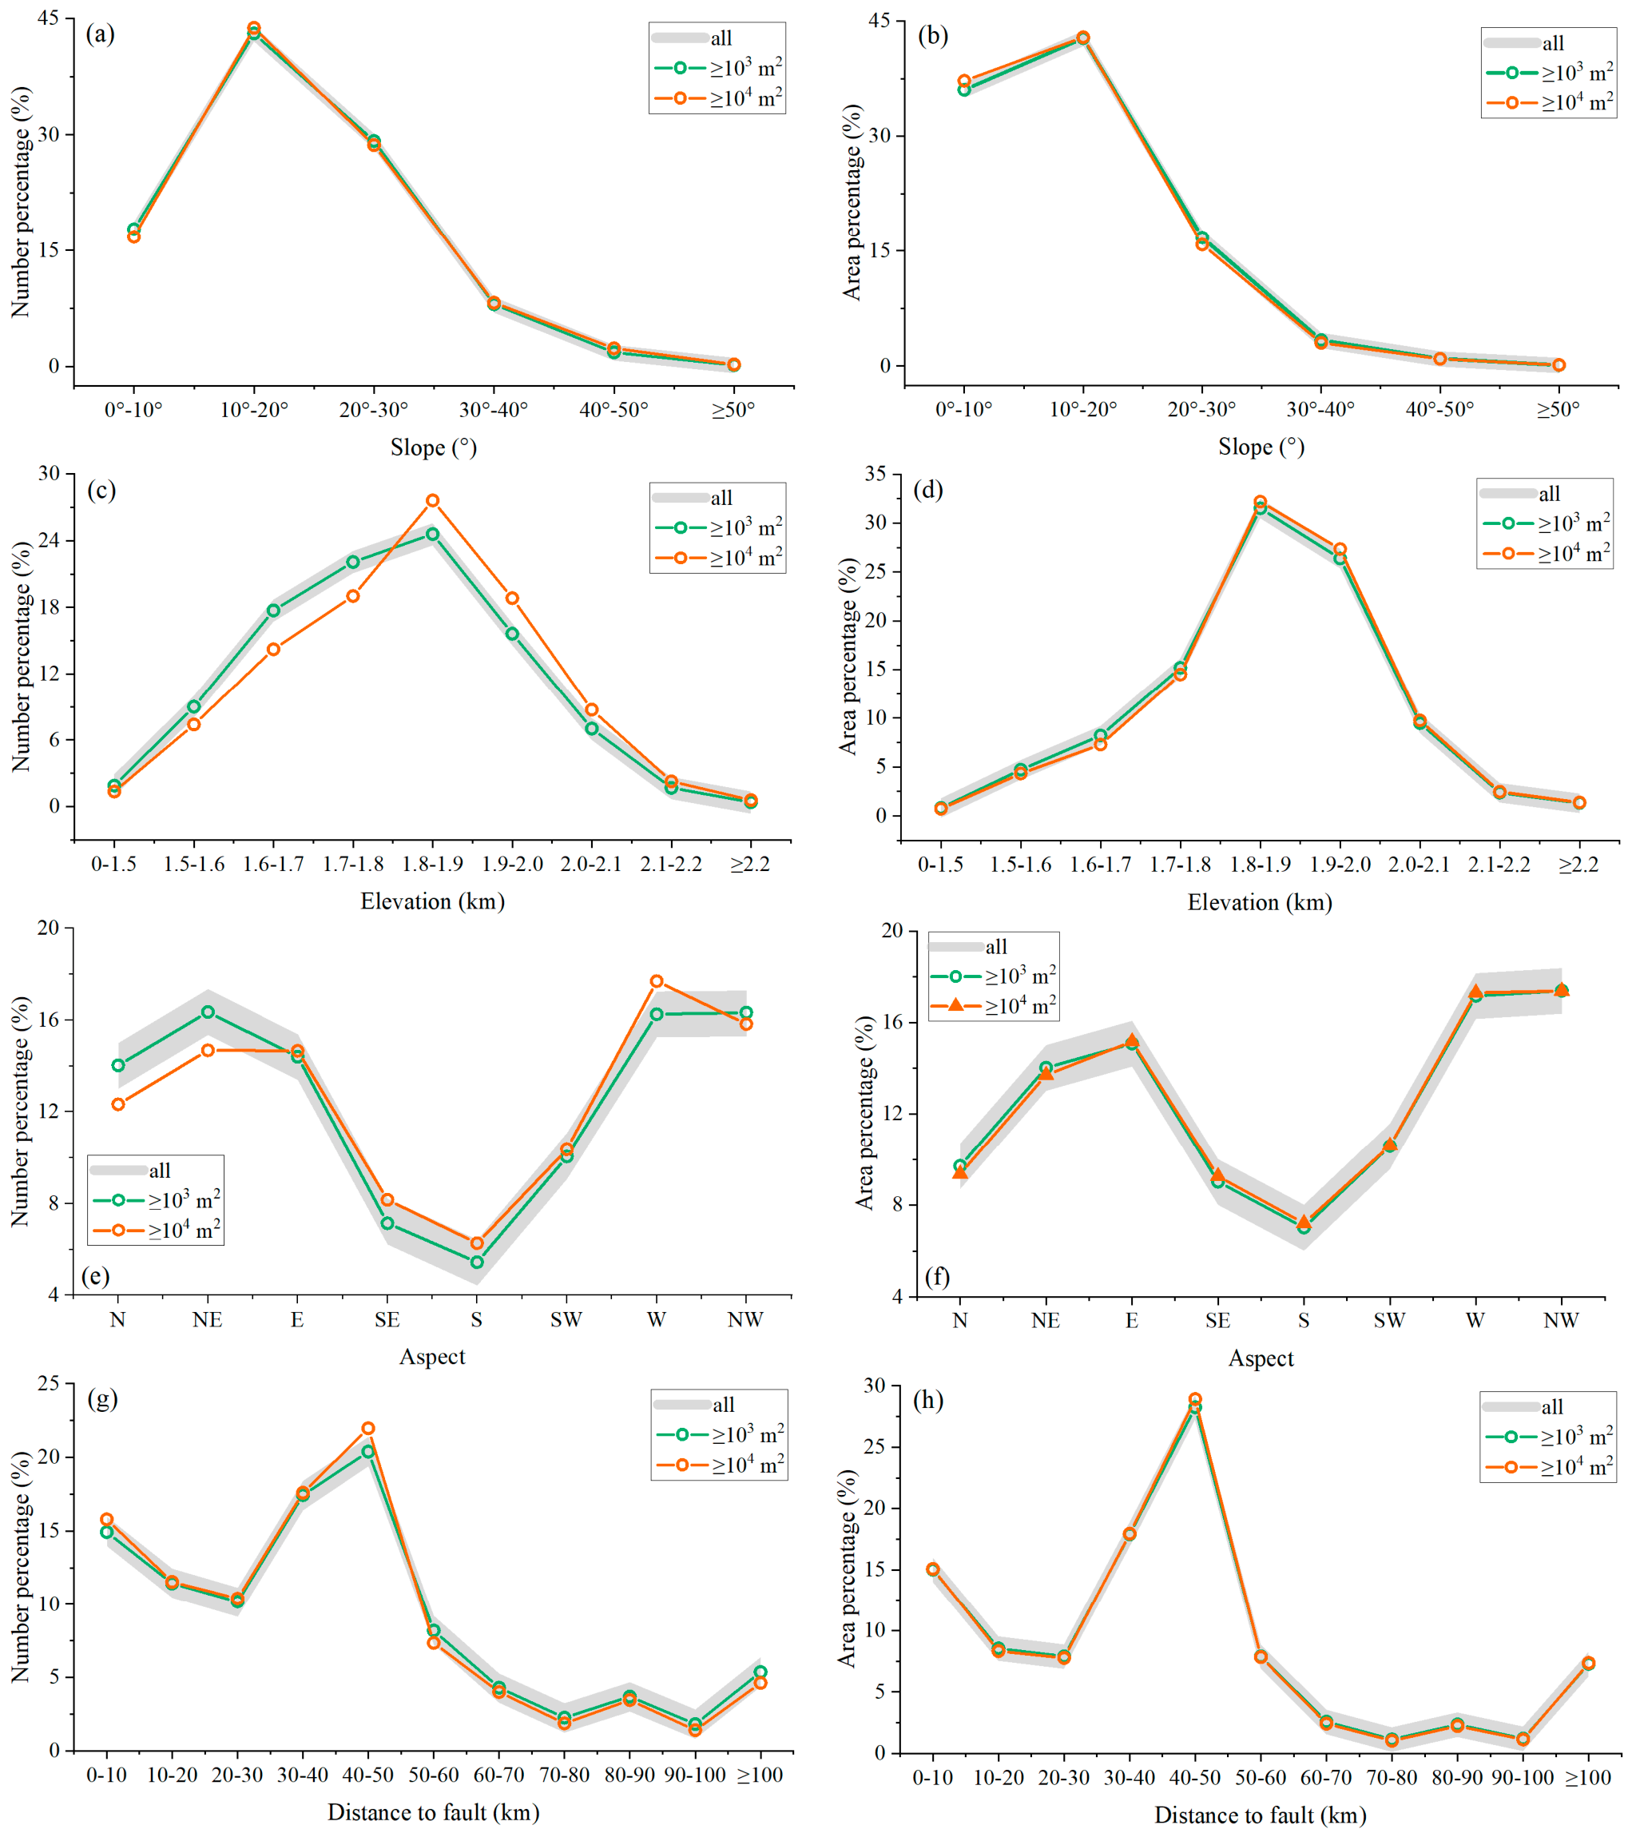
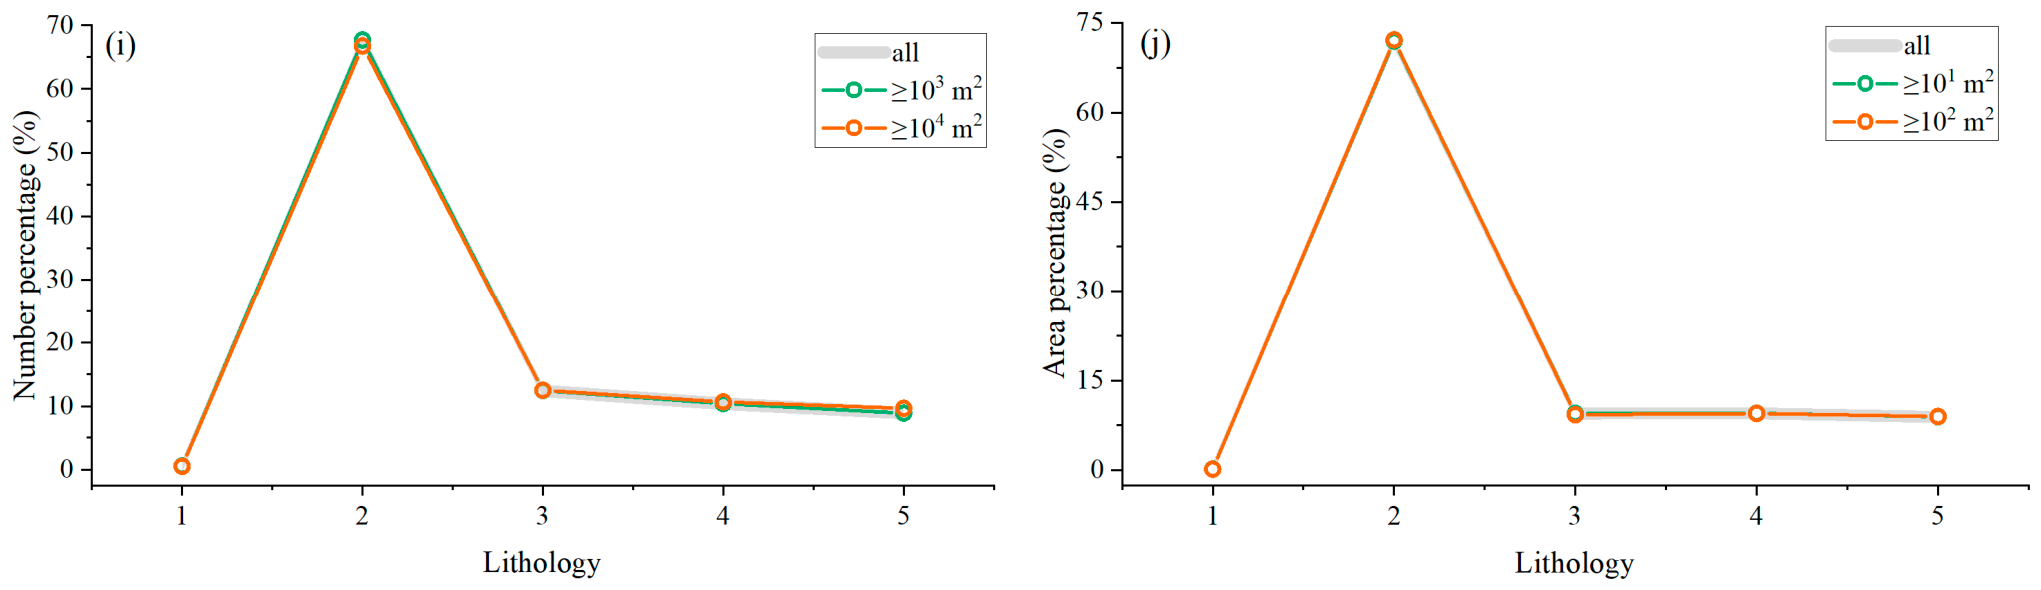
The Wenchuan earthquake had a high magnitude, and the induced landslides were predominantly rock landslides with a wide range of scales. This study examines the landslide distribution of inventories with different interpretation accuracies, as shown in Figure 5 and Table A1 and Table A2. In terms of slope, a notable deviation in the landslide number distribution occurs when the minimum landslide area exceeds 104 m2. The MAD for landslide number reaches 1.77%, with the peak distribution range shifting from 30°–40° to 40°–50°. In contrast, the MAD for minimum landslide area exceeding the 104 m2 threshold is only 0.15%, confirming that the distribution of landslide area remains consistent across different interpretation-scale inventories. Elevation analysis reveals that when the minimum landslide area exceeds 103 m2, the MAD for landslide number is 0.35%, representing a slight but acceptable deviation. However, when the minimum landslide area exceeds 104 m2, the MAD rises sharply to 1.84%, and the distribution of landslide numbers moves toward higher elevations. The MAD for landslide area at the 103 m2 threshold is 0.02%, and the distribution of landslide area remains consistent with a complete inventory. Deviations increase to 0.45% when the minimum area is above 104 m2. Regarding aspect, when the minimum landslide area is greater than 104 m2, the MAD for landslide number reaches 1.33%, indicating a significant deviation in the number distribution is evident; the MAD for landslide area is 0.30%, showing only a slight deviation. Similarly, proximity to the fault shows deviations in the number and area distributions when the minimum landslide area is over 104 m2. However, the overall MAD of the distribution of landslide numbers and areas is not significant, at 0.81% and 0.22%, respectively. For lithology, the MAD of landslide numbers reaches 2.20% when the minimum landslide area exceeds 104 m2, indicating a significant deviation in the distribution of landslide numbers. The MAD for landslide area remains at 0.61%, confirming that the landslide area distribution across lithological units is uniform across different interpretation-scale inventories.
Figure 5.
Distribution of the Wenchuan earthquake landslide number and area in different factors. Number distribution: (a) slope, (c) elevation, (e) aspect, (g) distance to fault, and (i) lithology. Area distribution: (b) slope, (d) elevation, (f) aspect, (h) distance to fault, and (j) lithology (1: Dike and altered rock zone; 2: Intrusive rocks; 3: Extrusive rocks; 4: Clastic sedimentary soft rocks: sandstone; 5: Clastic sedimentary hard rocks: mudstone; 6: Chemical sedimentary rocks: limestone and dolomite; 7: Metamorphic rocks; 8: Quaternary loose deposits). “all” represents the complete landslide inventory; The width of the gray strip represents an error margin of ±1%; “>102 m2” indicates that the landslide inventory lacks landslides < 102 m2.
For the Wenchuan earthquake landslide inventory, the impact of changes in interpretation accuracy on the area distribution patterns is smaller than that on the number of landslides. Specifically, regarding slope, elevation, aspect, and lithology, deviations in landslide number distribution become significant when the minimum landslide area of the inventory exceeds 104 m2. When the minimum landslide area of inventory is above 103 m2, the number distribution and area distribution divergence remain within acceptable limits. Interpreting landslides above this scale can yield distributions similar to those obtained from the complete landslide inventory. Combined with the maximum area in the Wenchuan earthquake landslide inventory, we infer that the primary distribution of these landslides lies within the range of 103–106 m2. It is noted that the minimum interpretation accuracy of the Wenchuan landslide inventory with acceptable completeness is three orders of magnitude lower than the maximum observed landslide scale.
3.2. Minxian
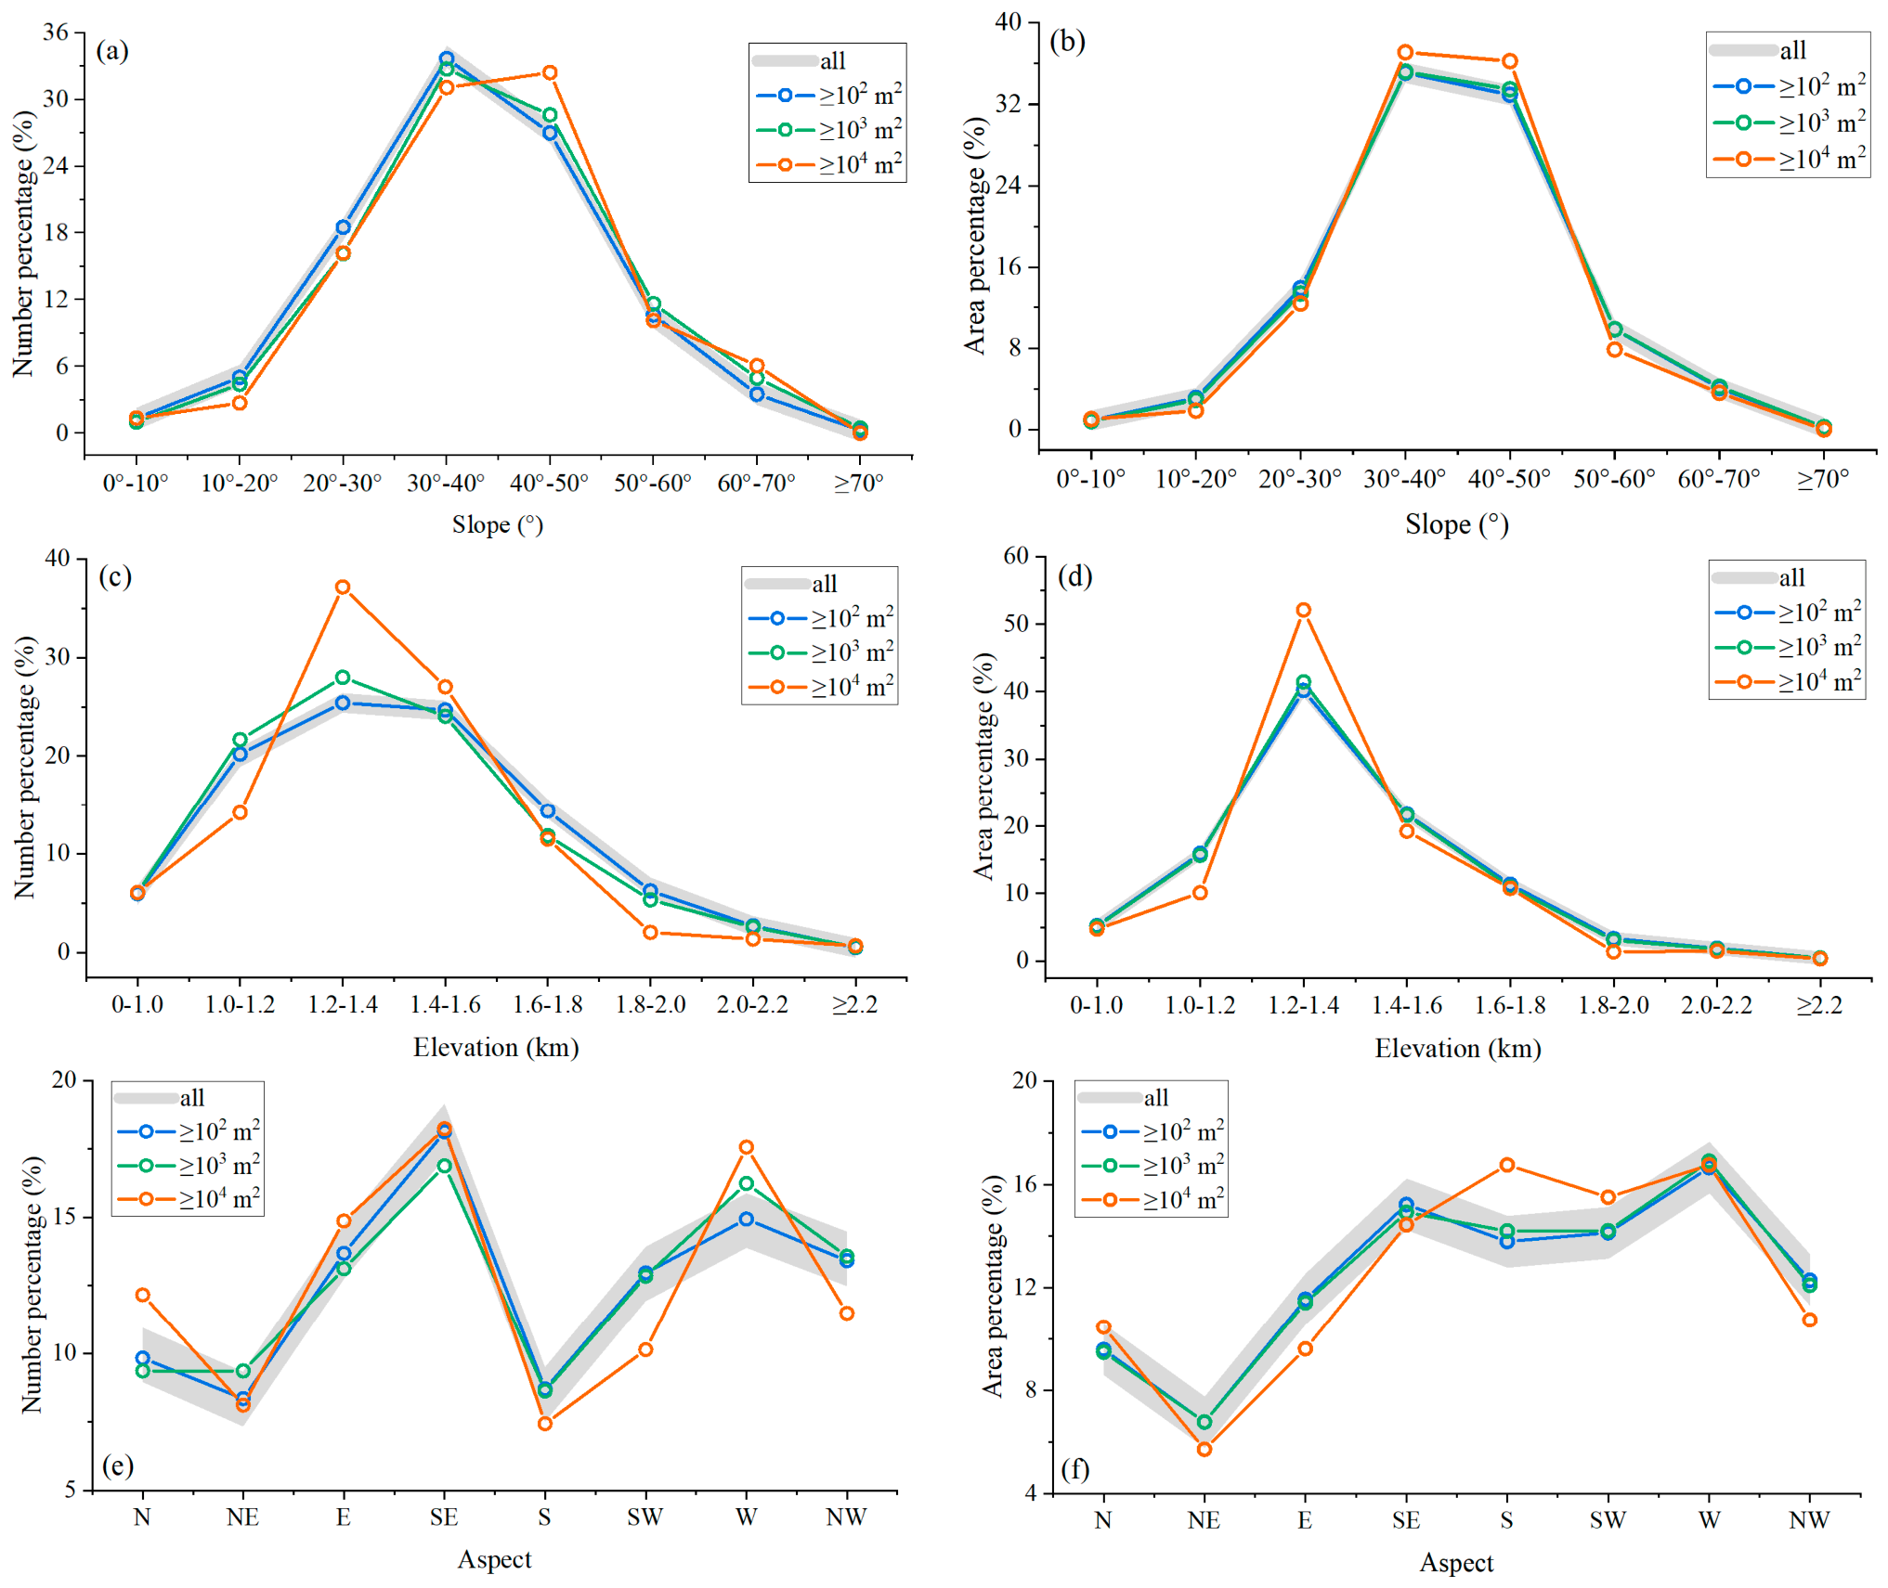
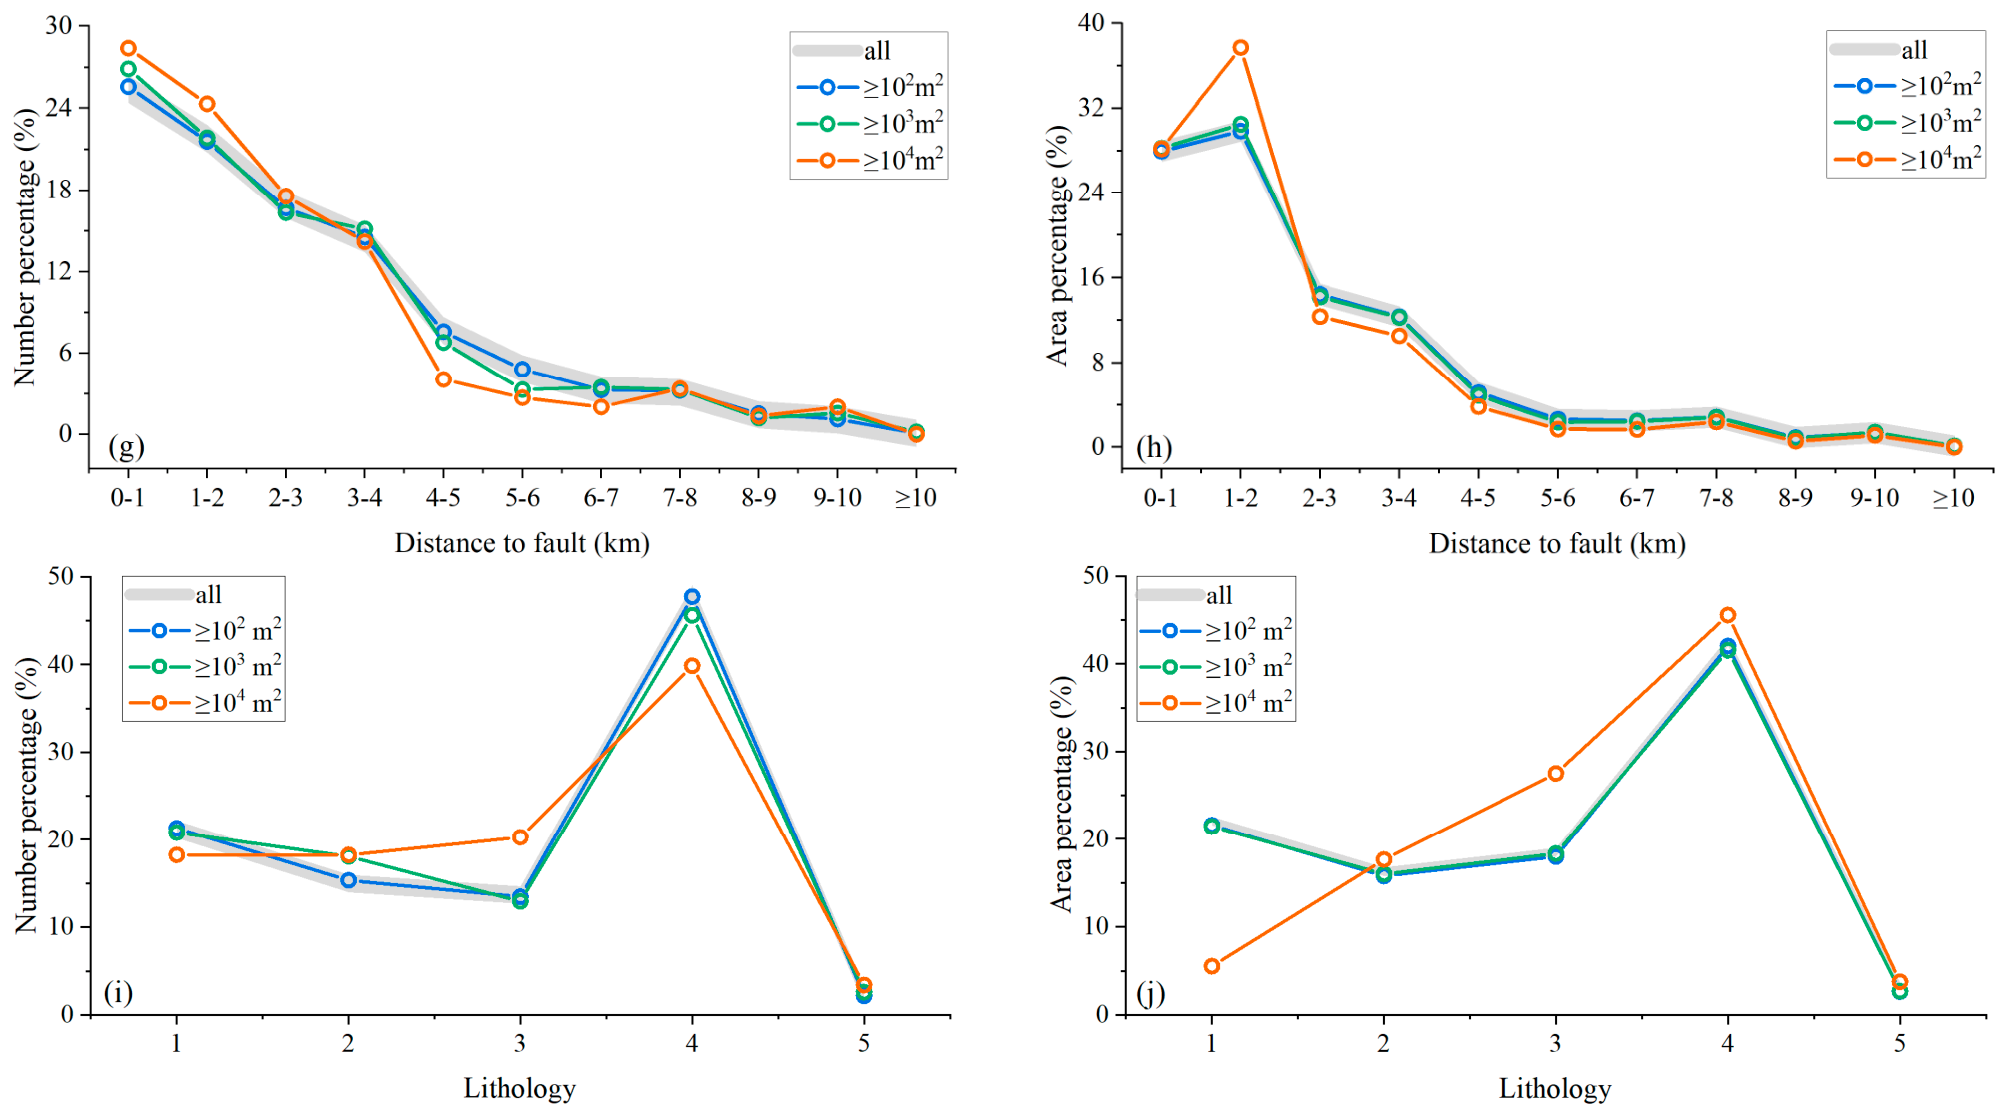
The Minxian earthquake landslides are loess landslides, and their scale is relatively modest compared to other earthquake-induced landslides. This study analyzed the landslide distribution of inventories with varying interpretation scales, as shown in Figure 6, Table A3 and Table A4. In terms of slope, when considering landslides with a minimum area exceeding 102 m2, the MAD for landslide number is 0.56%, indicating a slight deviation, while the MAD for landslide area is 0.16%, confirming that the area distribution remains consistent across different interpretation scale inventories. Regarding elevation, when the minimum area criterion is set above 102 m2, the MAD for landslide number reaches 1.75%, indicating a significant deviation in the landslide number distribution, whereas the MAD for landslide area is 0.20%, confirming that the landslide area distribution across each interpretation scale inventory remains consistent. For aspect, when the minimum area exceeds 102 m2, the MAD for landslide number is 0.78%, while the MAD for landslide area is 0.28%, indicating discrepancies in the number distribution and a slight deviation in area distribution. For distance to fault, when the minimum landslide area exceeds 102 m2, the MAD for landslide number is 0.43%, indicating a slight variation in the number distribution, while the MAD for landslide area is 0.10%, showing that the area distribution remains unchanged. Regarding lithology, when the minimum landslide area exceeds 102 m2, the MAD for landslide number is 2.92% across different interpretation-scale inventories, and the MAD for landslide area is 0.27%, indicating that deviation in number distribution is much more significant than in area distribution.
Figure 6.
Distribution of the Minxian earthquake landslide number and area in different factors. Number distribution: (a) slope, (c) elevation, (e) aspect, (g) distance to fault, and (i) lithology. Area distribution: (b) slope, (d) elevation, (f) aspect, (h) distance to fault, and (j) lithology (1: Glutenite and mudstone; 2: Silty mudstone; 3: Slate; 4: Slate, lightly metamorphosed sandstone, siltstone, and limestone in rhythmic interbedding; 5: Limestone). “all” represents the complete landslide inventory; The width of the gray strip represents an error margin of ± 1%; “>102 m2” indicates that the landslide inventory lacks landslides < 102 m2.
Like the Wenchuan earthquake landslide inventory, the Minxian earthquake landslide inventory indicates that the scale of interpretation has a more pronounced impact on the landslide number distribution than the landslide area distribution. Specifically, when the minimum landslide area of the inventory is greater than 102 m2, notable deviations in the landslide number distribution arise concerning elevation and lithology, but acceptable discrepancies occur for slope and the distance from the fault. For aspect, the area distribution exhibits some deviation but remains within acceptable limits. When the minimum landslide area of the inventory exceeds 10 m2, the number and area distribution discrepancies remain tolerable. It suggests that analyzing landslides exceeding 10 m2 can yield results that are almost congruent with those derived from a complete landslide inventory. Combined with the maximum landslide area in the Minxian earthquake landslide inventory, we infer that the primary range of landslide areas lies between 101 m2 and 104 m2. Notably, the minimum interpretation scale of the Minxian landslide inventory with acceptable completeness is three orders of magnitude lower than the maximum landslide scale.
3.3. Ludian
The Ludian earthquake landslide scale ranges between the Wenchuan and Minxian events. This study evaluated the landslide distribution of inventories with varying interpretation scales, as shown in Figure 7, Table A5 and Table A6. For slope analysis, when the minimum landslide area exceeds 104 m2, the MAD for landslide number reaches 1.99%, with the maximum distribution range transitioning from 30°–40° to 40°–50°, indicating a notable shift, while the MAD for landslide area is 1.36%, indicating a deviation in area distribution as well. When the minimum landslide area exceeds 103 m2, the MAD for landslide number is 1.11%, representing a deviation. Regarding elevation, when the minimum area exceeds 103 m2, the MAD for landslide number is 1.18%, indicating a deviation; this deviation intensifies when the minimum area surpasses 104 m2, with the MAD rising to 3.67%, showing a pronounced trend towards higher altitudinal zones. The MAD for landslide area remains at 0.32% when the minimum area exceeds 103 m2, indicating consistency with the complete inventory, but rises to 2.99% when the minimum area exceeds 104 m2, indicating a marked deviation. For aspect, the MAD for landslide number is 0.65% when the minimum area exceeds 103 m2, and increases to 1.52% when the minimum area is greater than 104 m2, indicating notable deviations in the number distribution; the MAD for landslide area at the 104 m2 threshold is 1.33%, confirming a significant deviation in area distribution as well. For distance to fault, the MAD for landslide number is 0.59% when the minimum area exceeds 103 m2, and increases to 1.35% when the minimum area exceeds 104 m2; the MAD for landslide area at the 104 m2 threshold is 1.47%. Both MADs are big, indicating significant deviations in both number and area distributions. Concerning lithology, the MAD for landslide number is 1.40% when the minimum area exceeds 103 m2, and rises to 4.44% when the minimum area exceeds 104 m2, indicating a pronounced deviation in number distribution; the MAD for landslide area remains at 0.25% at the 103 m2 threshold, indicating consistency with the complete inventory, but increases to 6.42% when the minimum area exceeds 104 m2, confirming a significant deviation in area distribution as well.
Figure 7.
Distribution of the Ludian earthquake landslide number and area in different factors. Number distribution: (a) slope, (c) elevation, (e) aspect, (g) distance to fault, and (i) lithology. Area distribution: (b) slope, (d) elevation, (f) aspect, (h) distance to fault, and (j) lithology (1: Basalt; 2: Shale; 3: Sandstone and Conglomerate; 4: Limestone; 5: Metamorphic rocks). “all” represents the complete landslide inventory; The width of the gray strip represents an error margin of ± 1%; “>102 m2” indicates that the landslide inventory lacks landslides < 102 m2.
In the landslide inventory of the Ludian earthquake, the impact of minimum interpretation scale changes on the distribution of landslide areas is smaller than that on the landslide number. When the minimum landslide area of inventory exceeds 104 m2, there is a marked deviation in the number distribution and area distribution across every factor. For minimum landslide areas of inventory greater than 103 m2, deviations in the number distribution persist, though the area distribution remains within an acceptable range. Conversely, when the minimum landslide area of inventory is above 102 m2, the number and area distributions closely align with those of the complete inventory. It suggests that analyzing landslides larger than 102 m2 can yield distribution results comparable to those from the complete inventory. Combined with the maximum landslide scale of the Ludian earthquake inventory, we infer that the primary range of landslide areas lies between 102 m2 and 105 m2. Notably, we determined that the minimum interpretation scale for maintaining the Ludian landslide inventory with acceptable completeness is three orders of magnitude lower than the maximum landslide scale.
3.4. Jiuzhaigou
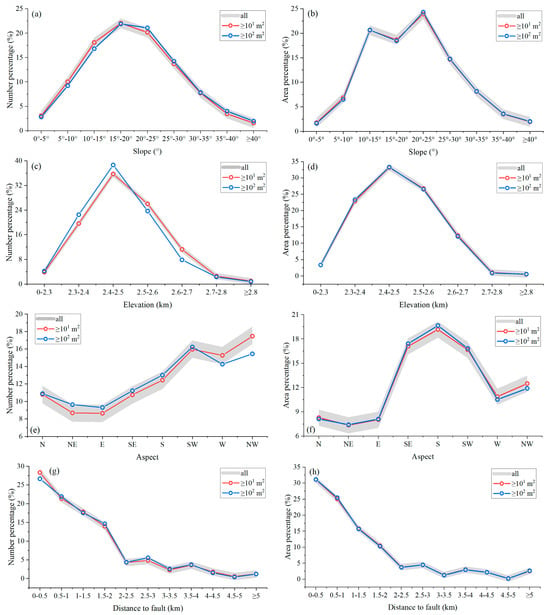
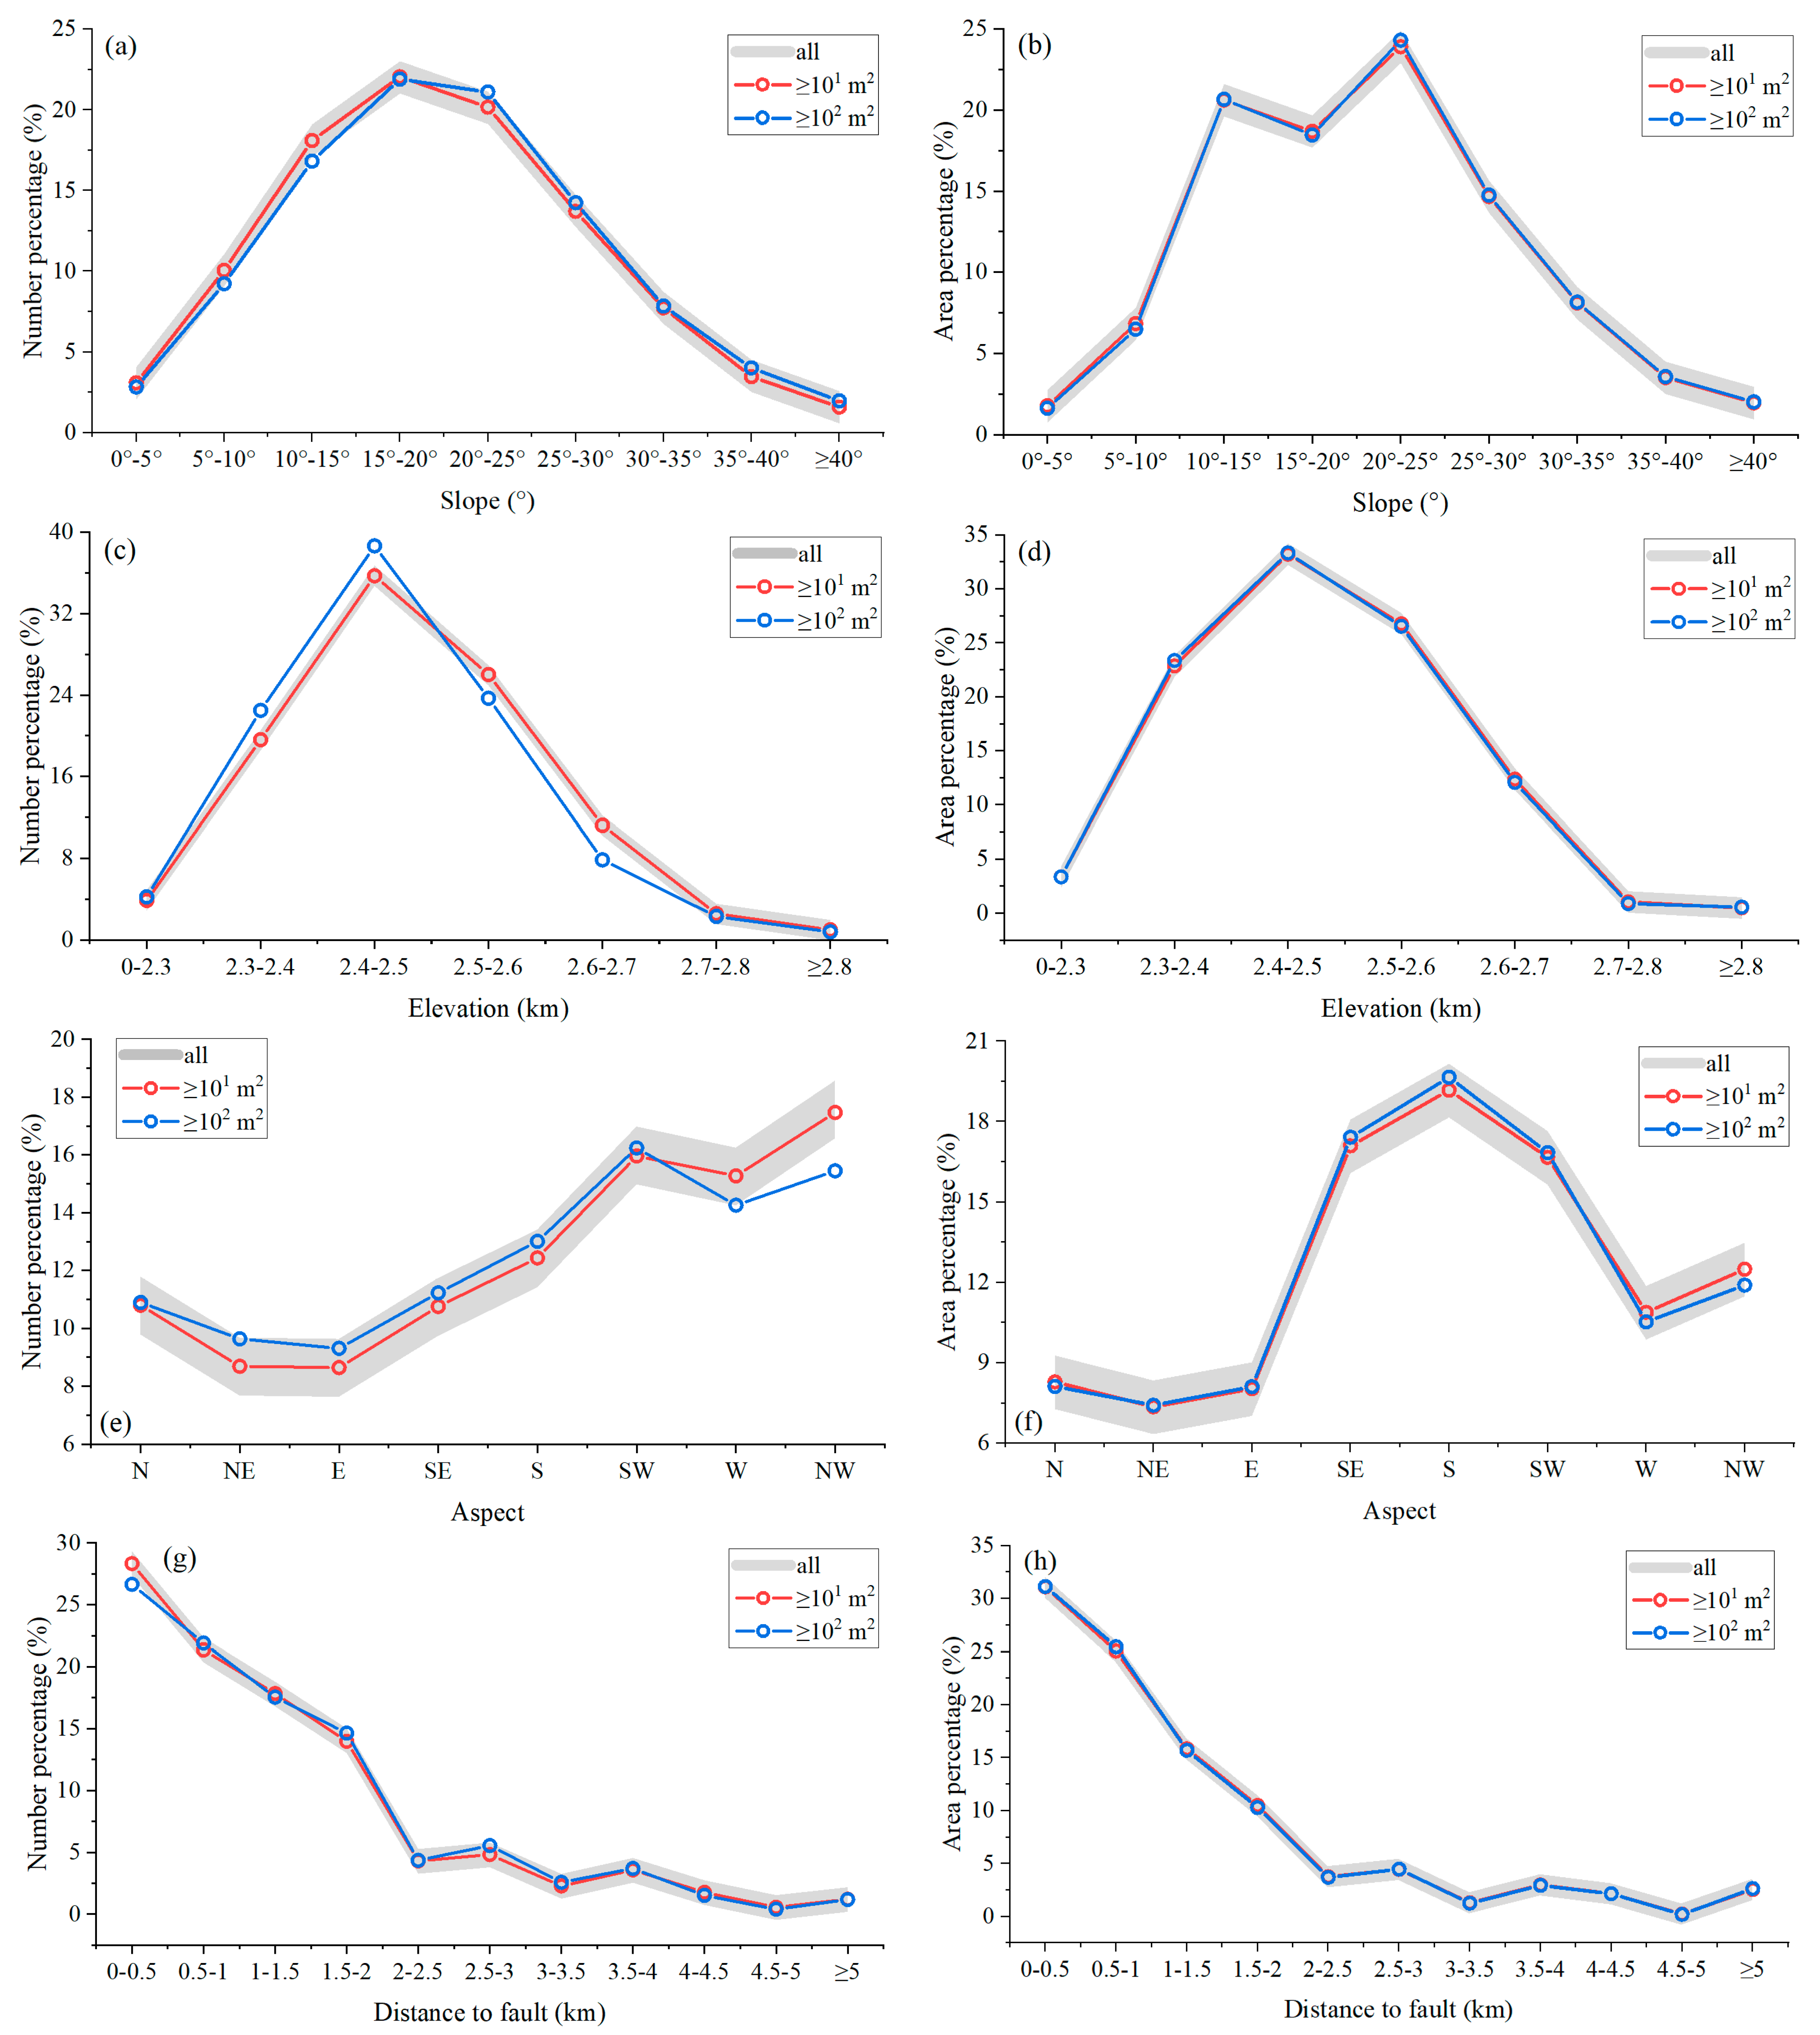
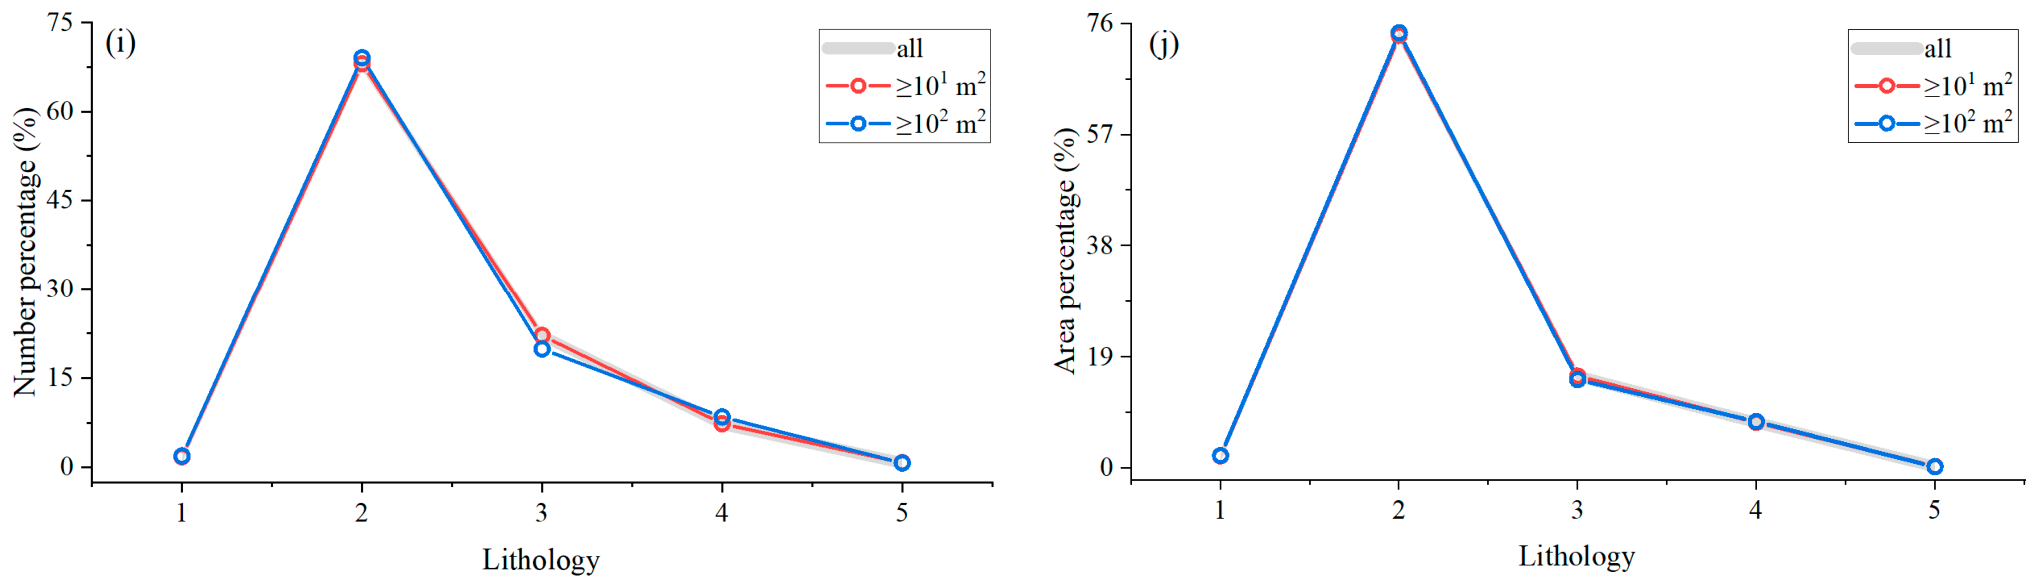
The Jiuzhaigou earthquake landslide scale falls between that of the Wenchuan and Minxian earthquakes. This study delves into the landslide distribution of inventories with varying interpretation scales, as illustrated in Figure 8 and Table A7 and Table A8. In terms of slope, when the minimum landslide area exceeds 103 m2, the MAD for landslide number reaches 2.53%, indicating a marked deviation, while the MAD for landslide area is 0.45%, confirming that the area distribution remains relatively consistent across different interpretation-scale inventories. Regarding elevation, when the minimum area exceeds 102 m2, the MAD for landslide number is 0.37%, indicating a slight but acceptable deviation; however, when the minimum area exceeds 103 m2, the MAD rises to 0.99%, indicating a more pronounced deviation. The distribution of the landslide area is still stabilizing, with a MAD of 0.12% when the minimum landslide area exceeds 103 m2. Aspect analysis reveals that when the minimum landslide area exceeds 102 m2, the MAD for landslide number is 0.35%, representing acceptable deviations; when the minimum area exceeds 103 m2, the MAD increases to 1.28%, indicating significant deviations. The area distribution of landslide inventories across different interpretation scales tends to be consistent, with all MAD values below 0.14%. Concerning the distance to fault, the MAD for landslide number is below 0.43%, and the MAD for landslide area is below 0.24% across different interpretation-scale inventories, indicating that both number and area distributions align with the complete inventory. For lithology, the MAD for landslide number is 1.20%, and the MAD for landslide area is 0.37% when the minimum landslide area exceeds 103 m2. It confirms considerable congruence in area distributions across different interpretation scale inventories.
Figure 8.
Distribution of the Jiuzhaigou earthquake landslide number and area in different factors. Number distribution: (a) slope, (c) elevation, (e) aspect, (g) distance to fault, and (i) lithology. Area distribution: (b) slope, (d) elevation, (f) aspect, (h) distance to fault, and (j) lithology (1: Quaternary loose deposits; 2: Clastic sedimentary rocks; 3: Metamorphic rocks; 4: Chemical sedimentary rocks; 5: Mafic volcanic rocks). “all” represents the complete landslide inventory; The width of the gray strip represents an error margin of ± 1%; “>102 m2” indicates that the landslide inventory lacks landslides < 102 m2.
Overall, variations in the minimum interpretation scale exert a greater influence on the distribution of landslide numbers than on the distribution of landslide area. When the minimum landslide area of the inventory is set above 103 m2, discrepancies in number distribution become pronounced across various influencing factors, whereas area distribution remains largely unaffected. For minimum areas of inventory exceeding 102 m2, slight acceptable deviations in number distributions existed in slope, elevation and aspect, with area distribution showing almost no variation. It suggests that interpreting landslides at scales over 102 m2 yields distributions similar to those derived from a complete landslide inventory. Correlating this with the maximum landslide scale in the Jiuzhaigou inventory, we estimate that the predominant distribution of Jiuzhaigou earthquake landslides falls within the 102–105 m2 range. Furthermore, we note a three-order-of-magnitude discrepancy between Jiuzhaigou’s minimum and maximum landslide scales.
3.5. Consistency Check and Independent Validation
The results indicate that variations in the scale of landslide inventory interpretation significantly influence landslide research findings. This study found that when the maximum landslide scale is a × 10x m2 (x is a natural number), and the minimum landslide scale is less than or equal to 10x−3 m2 in a thoroughly interpreted landslide inventory, the landslide distribution of this inventory closely aligns with that of a complete inventory. The landslide inventory is sufficiently complete. Conversely, if the inventory’s minimum landslide scale is greater than 10x−3 m2, the landslide distribution of this inventory usually diverges from that of the complete inventory. In that case, it indicates that the inventory lacks acceptable completeness. Based on these observations, we propose a practical criterion: for any given earthquake, if the order of magnitude of its maximum landslide scale is 10x, the inventory’s minimum interpretation scale is 10x−3.
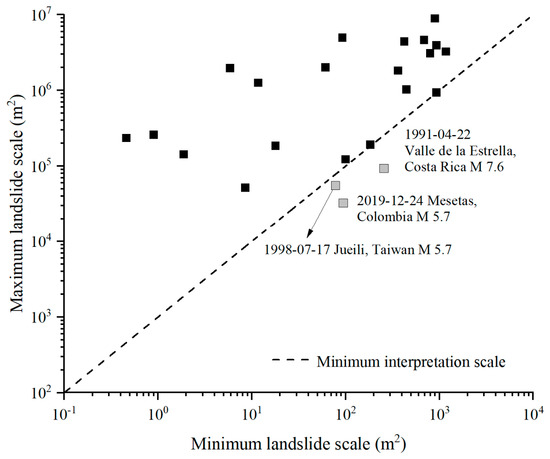
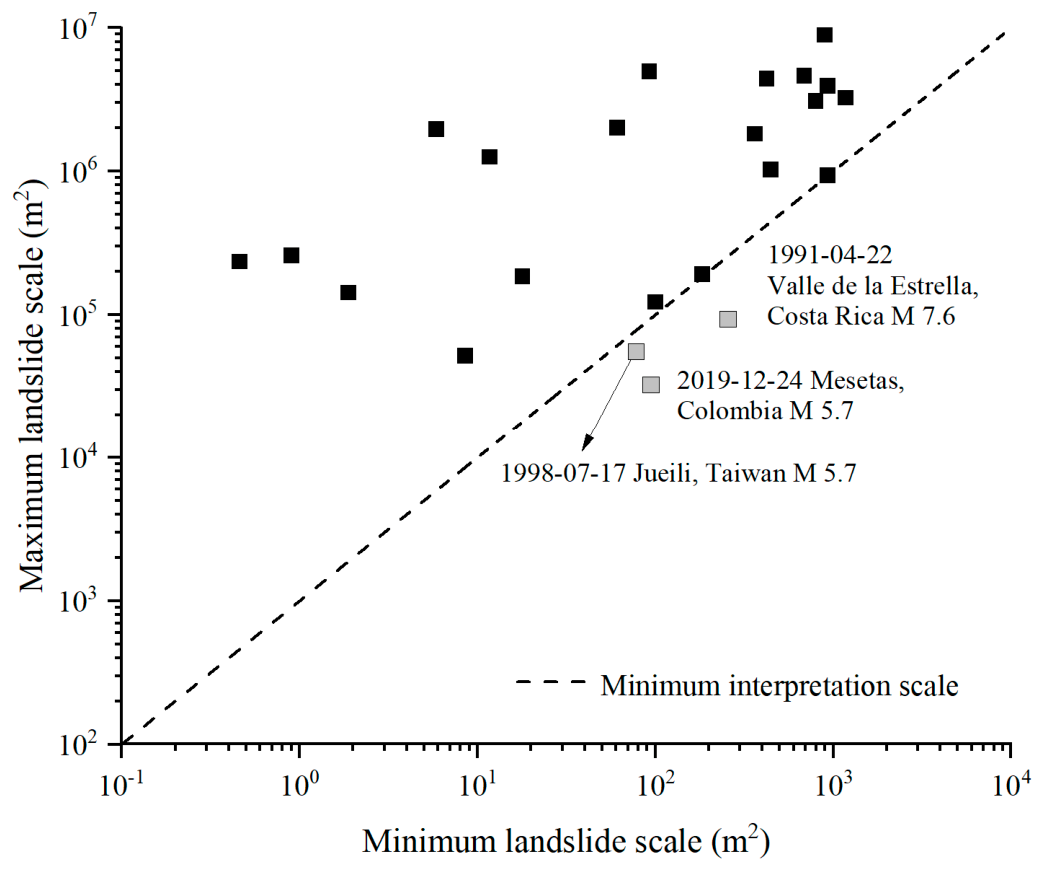
We apply the method of this study to conduct a consistency check on the 24 earthquake landslide inventories globally, examining whether their reported maximum and minimum landslide areas satisfy the proposed criterion. As shown in Figure 9, we calculate the minimum landslide scale that should be interpreted in the 24 earthquake landslide inventories. In the figure, the horizontal axis represents the minimum landslide area (Amin) of the earthquake landslide inventory, while the vertical axis denotes the maximum landslide area (Amax) of the inventory. The criterion can be expressed as Amax = 103 × Amin. Theoretically, the points above this straight line indicate that the inventory’s minimum landslide scale is smaller than the theoretical minimum interpretation scale, meaning the actual interpretation accuracy of landslide inventories is high, and the inventories can be utilized for subsequent research. Twenty-one earthquake landslide inventories fall above the line, while three are positioned below it, resulting in a satisfaction rate of 87.5%. Notably, these three inventories are not considered misclassifications in a negative sense; rather, they represent cases where the reported minimum landslide area exceeds the threshold required for acceptable completeness according to our criterion. In this sense, our criteria for determining the minimum interpretation scale of landslide inventories are higher than the existing high-quality standards typically applied in the literature. These inventories may still be suitable for certain applications. This high compliance rate suggests that most public inventories, or those used in published articles, have relatively high interpretation completeness, providing empirical support for the criterion. However, as this analysis only compares the reported minimum and maximum areas without repeating the full truncation-and-distribution procedure, we treat this as a consistency check rather than a formal validation.
Figure 9.
Consistency check using global earthquake landslide inventories. The black boxes represent inventories that satisfy the criterion, and the gray boxes represent those that do not.
To further validate the correctness of our method’s judgments, we randomly selected the landslide inventory of the 1920 M8.3 Haiyuan earthquake, a strong historical earthquake event, as the subject. The Haiyuan earthquake triggered widespread loess landslides. It caused many casualties, prompting extensive studies. The maximum and minimum landslide scales recorded were 1.82 × 10⁶ m2 and 3.61 × 10² m2, respectively. As illustrated in Figure 10, when the minimum landslide scale exceeds 103 m2, the distribution results demonstrate a notable deviation, confirming that the judgment result of our method is correct. It not only validates the scale of our approach but also highlights its applicability.
Figure 10.
Distribution of the Haiyuan earthquake landslide number and area in different factors. Number distribution: (a) slope, (c) elevation, (e) aspect, (g) distance to fault, and (i) lithology. Area distribution: (b) slope, (d) elevation, (f) aspect, (h) distance to fault, and (j) lithology (1: Glutenite and mudstone; 2: Silty mudstone; 3: Slate; 4: Slate, lightly metamorphosed sandstone, siltstone, and limestone in rhythmic interbedding; 5: Limestone). “all” represents the complete landslide inventory; The width of the gray strip represents an error margin of ± 1%; “>103 m2” indicates that the landslide inventory lacks landslides < 103 m2.
4. Discussion
The existing methods for determining the minimum interpretation scale of landslide inventories have the problem of overly relying on the number of interpreted landslides and not considering the potential impact of different geological environments. To determine the minimum interpretation scale required for landslide inventories with acceptable completeness across different geological environments, this study selected four representative earthquakes, each characterized by diverse geological environments, seismogenic fault types, and magnitudes. By constraining the distribution deviation of landslides in multiple influencing factors, the requirements of various environments are forcibly met. Based on the above research cases, we propose a method that does not rely on the number of interpreted landslides. For any given earthquake, reducing the order of magnitude of its maximum landslide scale(10x) by 3 can determine the inventory’s order of magnitude of minimum interpretation scale (10x−3).
Compared to the previous need to obtain most of the landslides in landslide inventories [28,29,30,31], determining the minimum scale in this study does not require explaining most of the landslides in the inventory. Compared with the method of taking well-documented inventories as references [32], this method does not require a complete landslide inventory with the same earthquake magnitude. On the contrary, analyzing the landslide with the largest area of this earthquake is sufficient to determine the minimum interpretation scale. This method breaks the dependence of other methods on the number of interpreted landslides and, to some extent, avoids the inherent inaccuracy in the methodologies that rely solely on similar earthquake magnitudes to determine the scale of a landslide induced by specific earthquakes. This study established a minimum interpretation scale for earthquake landslide inventory without a complete inventory. It was found that interpreting landslides with a scale better than the minimum interpretation scale can yield an acceptable landslide distribution result. This advancement addresses the dilemma in existing retrospective research, particularly the difficulty of evaluating the usability of unknown historical landslide inventories. Secondly, compared with existing methods that rarely account for differences in geological environments, this study determines the minimum interpretation scale based on landslide inventories across various magnitudes (M5.9-M7.9), fault types (thrust and strike-slip), and geological environments (rock and loess). The case selection in this study addresses the lack of diversity in geological environments and earthquake cases in previous research. The approach adequately accounts for differences in the geological environments where earthquakes occur, and the earthquake cases are representative, enabling the derivation of the earthquake landslide scale. In addition, compared with the method of Xu and Xu [6], which determines the interpretation scale based on remote sensing image resolution, this method is based on the landslide’s own characteristics. It establishes a simple way to calculate the minimum interpretation scale from the maximum landslide scale, thereby avoiding tedious scale-by-scale comparative analysis. This method makes the determined scale independent and reasonable.
In short, this study offers several key contributions to the interpretation scale of earthquake-induced landslide inventory with acceptable completeness: (1) Methodology for Minimum Interpretation Scale: This study provides a methodology for determining the minimum interpretation scale and the appropriate spatial resolution of remote sensing images used for emergency interpretation, based on the characteristics of landslides themselves. It uses the easily interpretable maximum landslide scale to determine the minimum interpretation scale, thereby greatly reducing image acquisition pressures and the interpretation workload. It provides a general magnitude relationship across seismic events, so the new earthquake can calculate the minimum interpretation scale without repeating the complete scale calibration work. It also enhances the applicability and transferability of this methodology. (2) Usability Discriminant Index for Historical Inventories: The study provides a practical discriminant index (minimum interpretation scale) that allows researchers to evaluate whether historical earthquake landslide inventories, which may lack some small-scale landslides, can be used for distribution analysis and the inversion of historical earthquake parameters. (3) Resolution of Expert Discrepancies: Our method addresses longstanding debates among experts regarding the quality of landslide inventories by establishing an objective evaluation criterion. Discrepancies in interpreters’ expertise sometimes lead to significant differences in landslide counts, undermining the potential for collaboration in landslide research. Our approach assesses the quality and reliability of public landslide inventories by using a minimum interpretation scale, fostering trust and consistency in landslide research.
We emphasize that the minimum interpretation scale is a crucial criterion for ensuring the quality of landslide inventories. Although our method has made the above contributions, we do not advocate its unlimited use. Firstly, our method cannot completely bypass dependence on image resolution, as it still requires sufficient resolution to interpret large-scale landslides. If remote sensing images for all regions cannot be obtained, the largest landslide required for this study may be omitted, and this method will not be used in that case. Secondly, this method is only used for application scenarios with low requirements for small landslides. Suppose the research objectives focus on landslide frequency, spatial density, or hazards caused by small landslides. This method cannot compensate for the error arising from the absence of small-scale landslides. Thirdly, this method is not suitable for scenes with few landslides. Because this method is based on statistical results, when the total number of landslides is small, the method will be invalid. In addition, although the 24 global inventories support the external validity of the criterion, the relationship was originally derived from four earthquakes, all located in the eastern margin of the Tibetan Plateau. Therefore, this criterion is most applicable to the Tibetan Plateau and surrounding areas. The extrapolation of this criterion to other regions should be made with caution. Fundamentally, the workload of interpreting landslides remains directly proportional to the completeness of the landslide inventory. So, we suggest using it only when necessary. If conditions permit, we encourage researchers to provide a comprehensive explanation of the earthquake-landslide inventory whenever possible to enable more in-depth research. A landslide inventory with acceptable completeness requires thorough interpretation of landslides with an area equal to or exceeding the minimum scale. Our future work will focus on expanding our inventory of earthquake-induced landslides. We will use a larger and more diverse set of calibration events to refine the applicability of the minimum interpretation scale.
5. Conclusions
To address the challenge of establishing the minimum interpretation scale for earthquake landslide inventories, this study analyzed landslide distributions across different interpretation scale inventories in representative earthquake cases, each characterized by different magnitudes, fault types, and geological environments. This study preliminarily established a method to determine the minimum interpretation scale that uses only the maximum landslide scale, without relying on a complete inventory. This method provides a practical solution: if the order of magnitude of the maximum landslide scale is x, thoroughly interpreting landslides with the scale of 10x−3 m2 and above can obtain a landslide inventory with a distribution similar to the complete inventory. A consistency check across 24 public or published global landslide inventories showed that 21 inventories (87.5%) met the proposed criterion, providing empirical support.
From an operational perspective, our findings provide concrete guidelines for the inventory with acceptable completeness interpretation and analysis of the landslide distribution. The scale of this study is more suitable for research based on the landslide area than on the landslide number. In scenarios where landslide inventories are incompletely interpreted, using landslide area for distribution analysis is closer to a complete interpretation and more reasonable. This study provides a criterion for assessing the feasibility of historical earthquake landslide research. It serves as a reference for selecting the appropriate remote sensing image spatial resolution for current earthquake landslide interpretation scales. In the future, we will focus on expanding the calibration inventories by including more earthquake cases from different tectonic and climatic regimes, such as subduction zones, volcanic settings, and regions with different lithological and vegetation conditions.
Author Contributions
Conceptualization, S.Q.; methodology, X.G. and S.Q.; validation, X.G., F.T., and X.L.; formal analysis, X.G. and S.Q.; investigation, X.G. and S.Q.; resources, X.G. and S.Q.; data curation, X.G. and S.Q.; writing—original draft preparation, X.G.; writing—review and editing, S.Q., F.T., and X.L.; visualization, X.G.; supervision, S.Q.; project administration, X.G. and S.Q.; funding acquisition, X.G. All authors have read and agreed to the published version of the manuscript.
Funding
This research was funded by the National Natural Science Foundation of China, grant number 42407240.
Data Availability Statement
Data are available from the corresponding author upon request. The data are not publicly available due to that the landslide interpretation data is produced by multiple people and needs to be confirmed with collaborators before use.
Acknowledgments
We sincerely thank Yueren Xu and Chong Xu for providing the Wenhuan, Ludian, Minxian, and Jiuzhaigou landslide inventories.
Conflicts of Interest
The authors declare no conflicts of interest.
Appendix A
Table A1.
Landslide number percentage of the Wenchuan landslide inventory.
Table A2.
Landslide area percentage of the Wenchuan landslide inventory.
Table A3.
Landslide number percentage of the Minxian landslide inventory.
Table A4.
Landslide area percentage of the Minxian landslide inventory.
Table A5.
Landslide number percentage of the Ludian landslide inventory.
Table A6.
Landslide area percentage of the Ludian landslide inventory.
Table A7.
Landslide number percentage of the Jiuzhaigou landslide inventory.
Table A8.
Landslide area percentage of the Jiuzhaigou landslide inventory.
References
- Keefer, D.K. Landslides caused by earthquakes. Geol. Soc. Am. Bull. 1984, 95, 406–421. [Google Scholar] [CrossRef]
- Gorum, T.; Fan, X.M.; van Westen, C.J.; Huang, R.Q.; Xu, Q.; Tang, C.; Wang, G.H. Distribution pattern of earthquake-induced landslides triggered by the 12 May 2008 Wenchuan earthquake. Geomorphology 2011, 133, 152–167. [Google Scholar] [CrossRef] [Scilit]
- Gorum, T.; van Westen, C.J.; Korup, O.; van der Meijde, M.; Fan, X.M.; van der Meer, F.D. Complex rupture mechanism and topography control symmetry of mass-wasting pattern, 2010 Haiti earthquake. Geomorphology 2013, 184, 127–138. [Google Scholar] [CrossRef] [Scilit]
- Xu, C.; Xu, X.W. Spatial distribution difference of landslides triggered by slipping-fault type earthquake on two sides of the fault. Geol. Bull. China 2012, 31, 532–540, (In Chinese with English abstract). [Google Scholar]
- Xu, C. Detailed inventory of the 2008 Wenchuan earthquake triggered landslides and its comparison with global other earthquake events. Sci. Technol. Rev. 2012, 30, 18–26, (In Chinese with English abstract). [Google Scholar] [CrossRef]
- Xu, C.; Xu, X.W. Construction of basic earthquake-triggered landslides dataset for several large earthquake events at the beginning of the twenty-first century. Seismol. Geol. 2014, 36, 90–104, (In Chinese with English abstract). [Google Scholar] [CrossRef]
- Xu, C.; Xu, X.W.; Zhou, B.G.; Yu, G.H. Revisions of the M8.0 Wenchuan earthquake seismic intensity map based on co-seismic landslide abundance. Nat. Hazards 2013, 69, 1459–1476. [Google Scholar] [CrossRef] [Scilit]
- Xu, C. Landslide seismology geology: A sub-discipline of environmental earth sciences. J. Eng. Geol. 2018, 26, 207–222, (In Chinese with English abstract). [Google Scholar] [CrossRef]
- Guo, X.Y.; Fu, B.H.; Du, J.; Shi, P.L.; Li, J.X.; Li, Z.; Du, J.X.; Chen, Q.Y.; Fu, H. Monitoring and assessment for the susceptibility of landslide changes after the 2017 Ms7.0 Jiuzhaigou earthquake using the remote sensing technology. Front. Earth Sci. 2021, 9, 633117. [Google Scholar] [CrossRef] [Scilit]
- Ding, Y.H.; Wang, Y.Q.; Sun, J.Z. Correlation between landslides and seislides and seismic parameters and its application in predicing slope earthquake disaster. Acta Geophys. Sin. 1999, 42, 101–107, (In Chinese with English abstract). [Google Scholar]
- Xu, Y.R.; He, H.L.; Li, W.Q.; Zhang, W.H.; Tian, Q.J. New evidences for amendment of macro-epicenter location of 1303AD Hongdong earthquake. Seismol. Geol. 2018, 40, 945–966, (In Chinese with English abstract). [Google Scholar] [CrossRef]
- Zhou, H.F.; Fang, T.; Wei, Y.T. Research situations and suggestions on earthquake-induced landslides. Sediment. Geol. Tethyan Geol. 2023, 43, 615–628, (In Chinese with English abstract). [Google Scholar] [CrossRef]
- Malamud, B.D.; Turcotte, D.L.; Guzzetti, F.; Reichenbach, P. Landslide inventories and their statistical properties. Earth Surf. Process. Landf. 2004, 29, 687–711. [Google Scholar] [CrossRef] [Scilit]
- Hurst, M.D.; Ellis, M.A.; Royse, K.R.; Lee, K.A.; Freeborough, K. Controls on the magnitude-frequency scaling of an inventory of secular landslides. Earth Surf. Dyn. 2013, 1, 67–68. [Google Scholar] [CrossRef] [Scilit]
- Chen, M.; Wang, Y.S.; Liang, R.F.; Yang, S.C. Research on development and distribution rules of large-scale landslides in Bailongjiang river basin. J. Eng. Geol. 2018, 26, 325–333, (In Chinese with English abstract). [Google Scholar] [CrossRef]
- Huang, Y.D.; Xie, C.C.; Li, T.; Xu, C.; He, X.L.; Shao, X.Y.; Xu, X.W.; Zhan, T.; Chen, Z.N. An open-accessed inventory of landslides triggered by the Ms6.8 Luding earthquake, China on 5 September 2022. Earthq. Res. Adv. 2022, 3, 100181, Erratum in Earthq. Res. Adv. 2024, 4, 100293. https://doi.org/10.1016/j.eqrea.2024.100293. [Google Scholar] [CrossRef] [Scilit]
- Zhao, B.; Hu, K.H.; Yang, Z.J.; Liu, Q.; Zou, Q.; Chen, H.Y.; Zhang, B.; Zhang, W.F.; Zhu, L.; Su, L.J. Geomorphic and tectonic controls of landslides induced by the 2022 Luding earthquake. J. Mt. Sci. 2022, 19, 3323–3345. [Google Scholar] [CrossRef] [Scilit]
- Ma, S.Y.; Lu, Y.; Xia, C.X.; Liu, X.M.; Qi, W.H.; Yuan, R.M. Brief report of landslides triggered by the 2022 Ms6.8 Luding earthquake, Sichuan, China. Landslides 2023, 20, 2695–2707. [Google Scholar] [CrossRef] [Scilit]
- Shao, X.Y.; Ma, S.Y.; Xu, C.; Xie, C.C.; Li, T.; Huang, Y.D.; Huang, Y.; Xiao, Z.K. Landslides triggered by the 2022 Ms6.8 Luding strike-slip earthquake: An update. Eng. Geol. 2024, 335, 107536. [Google Scholar] [CrossRef] [Scilit]
- Zhao, H.Q.; Yu, B.; Chen, F.; Wang, L. Research status of landslide extraction methods based on high-resolution satellite remote sensing images. Remote Sens. Technol. Appl. 2023, 38, 108–115, (In Chinese with English abstract). [Google Scholar] [CrossRef]
- Tong, L.Q.; Guo, Z.C. A study of remote sensing image features of typical landslides. Remote Sens. Nat. Resour. 2013, 25, 86–92, (In Chinese with English abstract). [Google Scholar] [CrossRef]
- Tavakkoli, P.S.; Shahabi, H.; Jarihani, B.; Ghorbanzadeh, O.; Blaschke, T.; Gholamnia, K.; Meena, S.R.; Aryal, J. Landslide detection using multi-scale image segmentation and different machine learning models in the higher Himalayas. Remote Sens. 2019, 11, 2575. [Google Scholar] [CrossRef] [Scilit]
- Li, X.W. Principle and Application of Remote Sensing; Science Press: Beijing, China, 2008; pp. 68–69. [Google Scholar]
- Zhou, T.G. Principle and Application of Remote Sensing, 3rd ed.; Science Press: Beijing, China, 2022; pp. 59–60. [Google Scholar]
- Parker, R.N.; Densmore, A.L.; Rosser, N.J.; Michele, M.; Li, Y.; Huang, R.Q.; Whadcoat, S.; Petley, D.N. Mass wasting triggered by the 2008 Wenchuan earthquake is greater than orogenic growth. Nat. Geosci. 2011, 4, 449–452. [Google Scholar] [CrossRef] [Scilit]
- Sun, G.Q.; Chen, F.; Yu, B.; Wang, N. Landslide change and its influence factors in central Nepal from 2001 to 2017. J. Univ. Chin. Acad. Sci. 2020, 037, 308–316, (In Chinese with English abstract). [Google Scholar]
- Zhao, B.; Su, L.; Xu, Q.; Li, W.; Xu, C.; Wang, Y. A review of recent earthquake-induced landslides on the Tibetan Plateau. Earth-Sci. Rev. 2023, 244, 104534. [Google Scholar] [CrossRef] [Scilit]
- Tanyaş, H.; Westen, C.J.; Allstadt, K.E.; Jibson, R.W. Factors controlling landslide frequency-area distributions. Earth Surf. Process. Landf. 2019, 44, 900–917. [Google Scholar] [CrossRef] [Scilit]
- Tanyaş, H.; van Westen, C.J.; Allstadt, K.E.; Anna Nowicki Jessee, M.; Gorum, T.; Jibson, R.W.; Godt, J.W.; Sato, H.P.; Schmitt, R.G.; Marc, O.; et al. Presentation and analysis of a worldwide database of earthquake-induced landslide inventories. J. Geophys. Res. Earth Surf. 2017, 122, 1991–2015. [Google Scholar] [CrossRef] [Scilit]
- Tanyas, H.; Lombardo, L. Completeness index for earthquake-induced landslide inventories. Eng. Geol. 2019, 264, 105331. [Google Scholar] [CrossRef] [Scilit]
- Parker, R.; Hancox, G.; Petley, D.; Massey, C.; Densmore, A.; Rosser, N. Spatial distributions of earthquake-induced landslides and hillslope preconditioning in the northwest South Island, New Zealand. Earth Surf. Dyn. 2015, 3, 501–525. [Google Scholar] [CrossRef] [Scilit]
- Xu, Y.R.; Du, P.; Li, W.Q.; Zhang, W.H.; Tian, Q.J.; Xiong, R.W.; Wang, L. A case study on AD1718 Tongwei M7.5 earthquake triggered landslides—Application of landslide database triggered by historical strong earthquakes on the Loess Plateau. Acta Geophys. Sin. 2020, 63, 1235–1248, (In Chinese with English abstract). [Google Scholar] [CrossRef]
- Du, P.; Xu, Y.R.; Tian, Q.J.; Zhang, W.H.; Liu, S. The spatial distribution and attribute parameter statistics of landslides triggered by the May 12, 2008, MW7.9 Wenchuan earthquake. Earthq. Res. China 2020, 34, 29–49. [Google Scholar] [CrossRef]
- Xu, Y.R.; Liu-Zeng, J.; Allen, M.; Du, P.; Zhang, W.H.; Li, W.Q.; Tian, Q.J. Understanding historical earthquakes by mapping coseismic landslides in the Loess Plateau, northwest China. Earth Surf. Process. Landf. 2022, 47, 2266–2282. [Google Scholar] [CrossRef] [Scilit]
- Deng, Q.D.; Zhang, P.Z.; Ran, Y.K.; Yang, X.P.; Min, W.; Chu, Q.Z. Basic characteristics of active tectonics in China. Sci. China Ser. D Earth Sci. 2003, 46, 356–372+417–418. [Google Scholar] [CrossRef] [Scilit]
- Wen, X.Z.; Zhang, P.Z.; Du, F.; Long, F. The background of historical and modern seismic activities of the occurrence of the 2008 M8.0 Wenchuan, Sichuan. earthquake. Chin. J. Geophys. 2009, 52, 444–454. (In Chinese) [Google Scholar]
- Guo, C.B.; Wu, R.A.; Zhong, N.; Yang, Z.H.; Yuan, H.; Li, C.h.; Qiu, Z.D.; Cao, S.C. Large Landslides along Active Tectonic Zones of Eastern Tibetan Plateau: Background and Mechanism of Landslide Formation. Geosciences 2024, 49, 4635–4658. [Google Scholar]
- Yan, L.Y.; Li, X.B.; Ouyang, G.L. Some advances in the study of the formation mechanism of loess seismic landslide. J. Coll. Disaster Prev. Technol. 2021, 23, 46–53. [Google Scholar] [CrossRef]
- Liu-Zeng, J.; Zhang, Z.; Wen, L.; Tapponnier, P.; Sun, J.B.; Xing, X.; Hu, G.Y.; Xu, Q.; Zeng, L.S.; Ding, L. Coseismic ruptures of the 12 May 2008, MS8.0 Wenchuan earthquake, Sichuan: East-west crustal shortening on oblique, parallel thrusts along the eastern edge of Tibet. Earth Planet. Sci. Lett. 2009, 286, 355–370. [Google Scholar] [CrossRef] [Scilit]
- Xu, C.; Xu, X.W.; Shyu, J.B.H.; Zheng, W.J.; Min, W. Landslides triggered by the 22 July 2013 Minxian-Zhangxian, China, Mw5.9 earthquake: Inventory compiling and spatial distribution analysis. J. Asian Earth Sci. 2014, 92, 125–142. [Google Scholar] [CrossRef] [Scilit]
- Zheng, W.J.; Yuan, D.Y.; He, W.G.; Min, W.; Ren, Z.K.; Liu, X.W.; Wang, A.G.; Xu, C.; Ge, W.P.; Li, F. Geometric pattern and active tectonics in Southeastern Gansu province: Discussion on seismogenic mechanisms of the Minxian-Zhangxian Ms6.6 earthquake on July 22, 2013. Chin. J. Geophys. 2013, 56, 4058–4071, (In Chinese with English abstract). [Google Scholar]
- Xiao, J.Y.; Xu, Y.R.; Liu, L.; Zhang, W.H.; Li, W.Q.; Du, P. Study on coseismic landslides triggered by Ludian Ms6.5 earthquake, Yunnan Province, on August 3rd, 2014, using remote sensing images. Earthquake 2023, 43, 101–118, (In Chinese with English abstract). [Google Scholar] [CrossRef]
- Xu, X.W.; Xu, C.; Yu, G.H.; Wu, X.Y.; Li, X.; Zhang, J.G. Primary surface ruptures of the Ludian Mw6.2 earthquake, southeastern Tibetan Plateau, China. Seismol. Res. Lett. 2015, 86, 1622–1635. [Google Scholar] [CrossRef] [Scilit]
- Tian, Y.Y.; Xu, C.; Ma, S.Y.; Xu, X.W.; Wang, S.Y.; Zhang, H. Inventory and spatial distribution of landslides triggered by the 8th August 2017 MW6.5 Jiuzhaigou earthquake, China. J. Earth Sci. 2019, 30, 206–217. [Google Scholar] [CrossRef] [Scilit]
- Zhang, Y.Q.; Dong, S.W.; Jia, D. A new sinistral strike-slip fault in the Minshan area of northeastern Tibetan Plateau revealed by the 2017 Jiuzhaigou Ms7.0 earthquake. Acta Geol. Sin. 2018, 92, 2377–2387. [Google Scholar]
- Frattini, P.; Crosta, G.B. The role of material properties and landscape morphology on landslide size distributions. Earth Planet. Sci. Lett. 2013, 361, 310–319. [Google Scholar] [CrossRef] [Scilit]
- Massey, C.; Townsend, D.; Rathje, E.; Allstadt, K.E.; Lukovic, B.; Kaneko, Y.; Bradley, B.; Wartman, J.; Jibson, R.W.; Petley, D.N.; et al. Landslides triggered by the November 14 2016, MW7.8 Kaikoura earthquake, New Zealand. Bull. Seismol. Soc. Am. 2018, 108, 1630–1648. [Google Scholar] [CrossRef] [Scilit]
- Qi, S.W.; Xu, Q.; Lan, H.X.; Zhang, B.; Liu, J.Y. Spatial distribution analysis of landslides triggered by 2008.5.12 Wenchuan Earthquake, China. Eng. Geol. 2010, 116, 95–108. [Google Scholar] [CrossRef] [Scilit]
- Zou, Y.; Qi, S.W.; Guo, S.F.; Zheng, B.W.; Zhan, Z.F.; He, N.W.; Huang, X.L.; Hou, X.K.; Liu, H.Y. Factors controlling the spatial distribution of coseismic landslides triggered by the MW6.1 Ludian earthquake in China. Eng. Geol. 2022, 296, 106477. [Google Scholar] [CrossRef] [Scilit]
- Yao, X.L.; Qi, S.W.; Liu, C.L.; Guo, S.F.; Huang, X.L.; Xu, C.; Zheng, B.W.; Zhan, Z.F.; Zou, Y. An empirical attenuation model of the peak ground acceleration (PGA) in the near field of a strong earthquake. Nat. Hazards 2020, 105, 1–25. [Google Scholar] [CrossRef] [Scilit]
- Fan, X.M.; Yunus, A.P.; Scaringi, G.; Catani, F.; Subramanian, S.S.; Xu, Q.; Huang, R.Q. Rapidly evolving controls of landslides after a strong earthquake and implications for hazard assessments. Geophys. Res. Lett. 2020, 48, e2020GL090509. [Google Scholar] [CrossRef] [Scilit]
- Li, C.; Wang, X.; He, C.; Wu, X.; Kong, Z.; Li, X. National 1:200,000 Digital Geological Map (Public Version) Spatial Database (V1). Geological Development Research Center, China Geological Survey; China Geological Survey [Creating Institution]. 1957. Available online: https://geocloud.cgs.gov.cn (accessed on 25 March 2025).
- Gu, L.Y.; Du, G.L.; Zou, L.; Wang, X. Spatial distribution patterns and hazard assessment of co-seismic landslides triggered by the 2022 Luding earthquake (MS6.8): An RF-AdaBoost model approach. China Geol. 2026, 9, 349–365. [Google Scholar] [CrossRef] [Scilit]
- Wang, J.; Zang, M.D.; Peng, J.B.; Xu, C.; Su, Z.D.; Liu, T.H.; Li, M.B. Identification of dominant controlling factors and susceptibility assessment of coseismic landslides triggered by the 2022 Luding earthquake. Remote Sens. 2025, 17, 2797. [Google Scholar] [CrossRef] [Scilit]
- Dunham, A.M.; Kiser, E.; Kargel, J.S.; Haritashya, U.K.; Watson, C.S.; Shugar, D.H.; Hughes, A.; DeCelles, P.G. Topographic control on ground motions and landslides from the 2015 Gorkha earthquake. Geophys. Res. Lett. 2022, 49, e2022GL098582. [Google Scholar] [CrossRef] [Scilit]
- Totani, F.; Aloisio, A.; Pasca, D.P. Mountains topographic amplification: Implications for gravitational phenomena triggering. Nat. Hazards 2025, 121, 13237–13266. [Google Scholar] [CrossRef] [Scilit]
- Qiu, H.J.; Regmi, A.D.; Cui, P.; Hu, S.; Wang, Y.M.; He, Y. Slope aspect effects of loess slides and its spatial differentiation in different geomorphologic types. Arab. J. Geosci. 2017, 10, 344. [Google Scholar] [CrossRef] [Scilit]
- Xiao, Z.K.; Xu, C.; Huang, Y.D.; He, X.L.; Xiao, Z.K.; Chen, Z.N.; Xie, C.C.; Li, T.; Xu, X.W. Analysis of spatial distribution of landslides triggered by the Ms 6.8 Luding earthquake in China on September 5, 2022. Geoenviron. Disasters 2023, 10, 3. [Google Scholar] [CrossRef] [Scilit]
- Xu, X.; Yan, W.; Xiao, R.; Liu, X.; Hao, J. Spatial Distribution Patterns of Earthquake-Induced Landslides in the Loess Region of Tongwei County, Gansu Province. Appl. Sci. 2026, 16, 3575. [Google Scholar] [CrossRef] [Scilit]
- Shi, X.; Yin, T.; Dai, K.; Sun, W.; Motagh, M.; Liu, C.; Feng, S.; Xu, Q. Lithological predominance in landslide distribution in western Sichuan (China), revealed by multi-sensor remote sensing analysis. Adv. Space Res. 2026, 77, 5591–5604. [Google Scholar] [CrossRef] [Scilit]
- Wang, Y.-F.; Chen, P.-H.; Qian, J.-Z.; Cheng, Q.-G.; Ming, J.; Li, C.-B. Geomorphic and geologic controls on large-scale landslides in the Himalayan region of China. Landslides 2025, 22, 1725–1741. [Google Scholar] [CrossRef] [Scilit]
- Yao, X.; Xu, C.; Dai, F.C.; Zhang, Y.S. Contribution of strata lithology and slope gradient to landslides triggered by Wenchuan MS 8 earthquake, Sichuan, China. Geol. Bull. China 2009, 28, 1156–1162. [Google Scholar] [CrossRef]
- Xu, Y.R.; Liu-Zeng, J.; Allen, M.B.; Zhang, W.H.; Du, P. Landslides of the 1920 Haiyuan earthquake, northern China. Landslides 2021, 18, 935–953. [Google Scholar] [CrossRef] [Scilit]
- Xu, Y.R.; Zhang, W.H.; Li, W.Q.; Tian, Q.J. Distribution characteristics of the AD 1556 Huaxian earthquake triggered disasters and its implications. Seismol. Geol. 2018, 40, 721–737. [Google Scholar] [CrossRef]
- Zhang, W.H.; Xu, Y.R.; Guo, X.Y.; Li, W.Q.; Du, P.; Tian, Q.J. Distribution and characteristics of damming landslides triggered by 1920 M8 Haiyuan earthquake, NW China. Remote Sens. 2022, 14, 2427. [Google Scholar] [CrossRef] [Scilit]
- Harp, E.L.; Wilson, R.C.; Wieczorek, G.F. Landslides from the February 4, 1976, Guatemala Earthquake. Center for Integrated Data Analytics Wisconsin ence Center. 1204-A, 35p., 2pl., Scale 1:50,000. 1981. Available online: https://pubs.er.usgs.gov/publication/pp1204A (accessed on 25 March 2025).
- Harp, E.L.; Tanaka, K.; Sarmiento, J.; Keefer, D.K. Landslides from the May 25–27, 1980, Mammoth Lakes, California, Earthquake Sequence: U.S. Geological Survey Miscellaneous Investigations Map I-1612, Scale 1:62,500. 1984. Available online: https://pubs.er.usgs.gov/publication/i1612 (accessed on 25 March 2025).
- Harp, E.L.; Keefer, D.K. Landslides Triggered by the Earthquake. In Rymer, M.J. and Ellsworth, W.L., Eds., The Coalinga, California, Earthquake of May 2, 1983: U.S. Geological Survey Professional Paper 1487, p. 335–347, 1 pl., Scale 1:48,000. 1990. Available online: https://pubs.usgs.gov/pp/1487/report.pdf (accessed on 25 March 2025).
- Marc, O.; Hovius, N.; Meunier, P.; Gorum, T.; Uchida, T. A seismologically consistent expression for the total area and volume of earthquake-triggered landsliding. J. Geophys. Res. Earth Surf. 2016, 121, 640–663. [Google Scholar] [CrossRef] [Scilit]
- Harp, E.L.; Jibson, R.W. Inventory of Landslides Triggered by the 1994 Northridge, California Earthquake. Bull. Seismol. Soc. Am. 1996. [Google Scholar] [CrossRef] [Scilit]
- Huang, T.F. Landslides Triggered by Jueili Earthquake. Master’s Thesis, National Central University, Taiwan, China, 1999. (In Chinese with English abstract). [Google Scholar]
- Gorum, T.; Korup, O.; van Westen, C.J.; van der Meijde, M.; Xu, C.; van der Meer, F.D. Why so few? Landslides triggered by the 2002 Denali earthquake, Alaska. Quat. Sci. Rev. 2014, 95, 80–94. [Google Scholar] [CrossRef] [Scilit]
- Sekiguchi, T.; Sato, H.P. Feature and Distribution of Landslides Induced by the Mid Niigata Prefecture Earthquake in 2004, Japan. Landslides 2006, 43, 142–154. [Google Scholar] [CrossRef] [Scilit][Green Version]
- Sato, H.P.; Hasegawa, H.; Fujiwara, S.; Tobita, M.; Koarai, M.; Une, H.; Iwahashi, J. Interpretation of landslide distribution triggered by the 2005 Northern Pakistan earthquake using SPOT5 imagery. Landslides 2007, 4, 113–122. [Google Scholar] [CrossRef] [Scilit]
- Harp, E.L.; Hartzell, S.H.; Jibson, R.W.; Ramirez-Guzman, L.; Schmitt, R.G. Relation of landslides triggered by the Kiholo Bay earthquake to modeled ground motion. Seismol. Soc. Am. Bull. 2014, 104, 2529–2540. [Google Scholar] [CrossRef] [Scilit]
- Sepulveda, S.; Serey, M.; Lara, P.A.; Rebolledo, S. Landslides induced by the April 2007 Aisen Fjord earthquake, Chilean Patagonia. Landslides 2010, 7, 483–492. [Google Scholar] [CrossRef] [Scilit]
- Harp, E.L.; Jibson, R.W.; Schmitt, R.G. Map of Landslides Triggered by the January 12, 2010, Haiti Earthquake: U.S. Geological Survey Scientific Investigations Map 3353, 15 p., 1 Sheet, Scale 1:150,000. 2016. Available online: https://pubs.usgs.gov/publication/sim3353 (accessed on 25 March 2025).
- Xu, C.; Xu, X.W.; Shyu, J.B.H. Database and spatial distribution of landslides triggered by the Lushan, China MW6.6 earthquake of 20 April 2013. Geomorphology 2015, 248, 77–92. [Google Scholar] [CrossRef] [Scilit]
- Valagussa, A.; Frattini, P.; Valbuzzi, E.; Crosta, G.B. Role of landslides on the volume balance of the Nepal 2015 earthquake sequence. Sci. Rep. 2021, 11, 3434. [Google Scholar] [CrossRef] [Scilit] [PubMed]
- Tanyaş, H.; Hill, K.; Mahoney, L.; Fadel, I.; Lombardo, L. The world’s second-largest recorded landslide event: Lessons learnt from the landslides triggered during and after the 2018 MW7.5 Papua New Guinea earthquake. Eng. Geol. 2022, 297, 106504. [Google Scholar] [CrossRef] [Scilit]
- Zhao, B. Landslides triggered by the 2018 MW7.5 Palu Supershear earthquake in Indonesia. Eng. Geol. 2021, 294, 106406. [Google Scholar] [CrossRef] [Scilit]
- García-Delgado, H.; Chaparro, J.; Gamboa, C.; Ruiz, G. Landslides triggered by the December 24, 2019 Mesetas (Meta, Colombia) Earthquake. In Proceedings of the 13th International Symposium on Landslides; Cabrera, M.A., Prada-Sarmiento, L.F., Eds.; ISSMGE: Cartagena, Spain, 2021. [Google Scholar]
- Shao, X.Y.; Ma, S.Y.; Xu, C. Distribution and characteristics of shallow landslides triggered by the 2018 Mw7.5 Palu earthquake, Indonesia. Landslides 2023, 20, 157–175. [Google Scholar] [CrossRef] [Scilit]
- Xu, C. Spatial Distribution and Susceptibility Mapping of the Wenchuan Earthquake-Triggered Landslides. Doctor’s Thesis, Graduate University of Chinese Academy of Sciences, Beijing, China, 30 May 2010. (In Chinese with English abstract). [Google Scholar]

Disclaimer/Publisher’s Note: The statements, opinions and data contained in all publications are solely those of the individual author(s) and contributor(s) and not of MDPI and/or the editor(s). MDPI and/or the editor(s) disclaim responsibility for any injury to people or property resulting from any ideas, methods, instructions or products referred to in the content. |
© 2026 by the authors. Licensee MDPI, Basel, Switzerland. This article is an open access article distributed under the terms and conditions of the Creative Commons Attribution (CC BY) license.