


Highlights
We present 32 years of technological evolution of a ground-based camera network for the continuous monitoring of active Sicilian volcanoes, introducing novel, in-house developed software tools for the real-time extraction of quantitative eruptive parameters to support the identification of eruptive scenarios.
What are the main findings?
- Over 32 years of technological evolution, the INGV-OE camera network has expanded to 21 permanent optical/thermal stations and 3 mobile units across Etna, Stromboli, and Vulcano.
- In-house developed software tools enable automated, real-time extraction of key eruptive parameters, including mass eruption rate and plume height at Etna, explosion intensity at Stromboli, and fumarolic thermal variations at Vulcano.
What are the implications of the main findings?
- Continuous camera surveillance enables the prompt identification of eruptive activity and of associated phenomena;
- The near real-time image analysis substantially improves volcanic hazard assessment and risk management.
Abstract
Video surveillance systems are well-established tools for monitoring eruptive phenomena at active volcanoes. Consequently, video records have become a primary source of data for describing and quantifying volcanic activity worldwide. Prominent examples include the Sicilian volcanoes (Etna, Stromboli, and Vulcano), which are among the most active and closely monitored globally. The increasingly widespread use of thermal and high-definition visible cameras provides insights into eruptive processes and their evolution. In this study, we detail 32 years of technological evolution of the camera surveillance network installed on Sicilian volcanoes. We demonstrate how dedicated, in-house software tools for real-time image analysis enable the detection and identification of eruptive scenarios. Furthermore, these systems allow for the quantification of key physical parameters, including explosion intensity at Stromboli, mass eruption rate and column height during lava fountains at Etna, and variations in fumarolic activity at Vulcano. Additionally, visual and thermal imagery allows volcanologists to issue timely and effective warnings to the Italian Department of Civil Protection, as well as regional and international authorities. Overall, these results highlight the substantial advantages of continuous video monitoring infrastructure for real-time volcanic hazard assessment and risk mitigation.
1. Introduction
Volcanic eruptions pose significant threats to local populations, infrastructure, and aviation [1]. Consequently, the continuous monitoring of active volcanoes is essential to effectively improve hazard assessment and risk management [2,3]. Among the various geophysical techniques employed by global volcano observatories, ground-based optical and thermal imaging systems have become fundamental, providing continuous, remote observations of eruptive processes with high temporal resolution. Over the last decades, volcanic video surveillance has evolved from visible-wavelength Closed-Circuit Television (CCTV) cameras to advanced high-definition (HD) and thermal Infrared (TIR) imaging systems [4,5,6,7,8]. Visible cameras, although useful, have inherent limitations: their performance is severely degraded at night and during adverse weather conditions. The adoption of thermal cameras has provided a major improvement in this field (see [9] for a review). As demonstrated extensively in the Hawaiian context at Kīlauea and Mauna Loa volcanoes [6,10], thermal sensors provide uninterrupted observations regardless of sunlight and are now extensively used to analyze fumaroles [11], lava flows [12], explosive activity [13,14] and pyroclastic deposits [15].
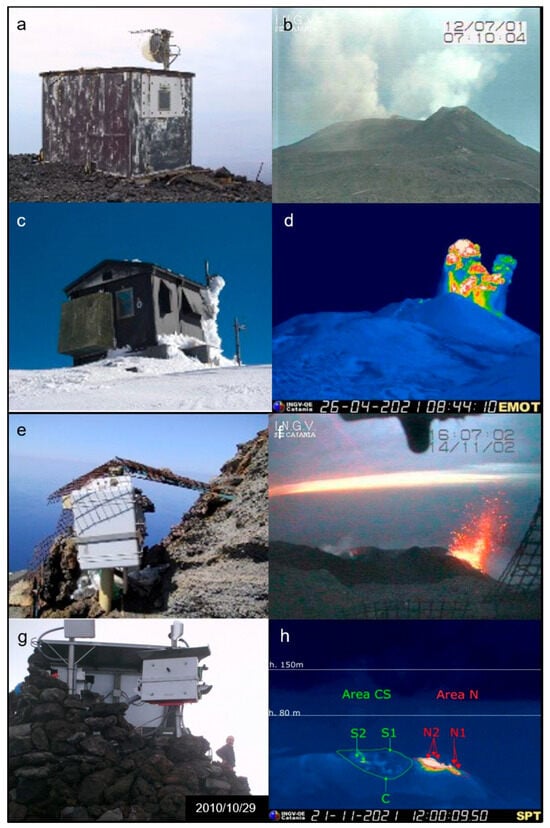
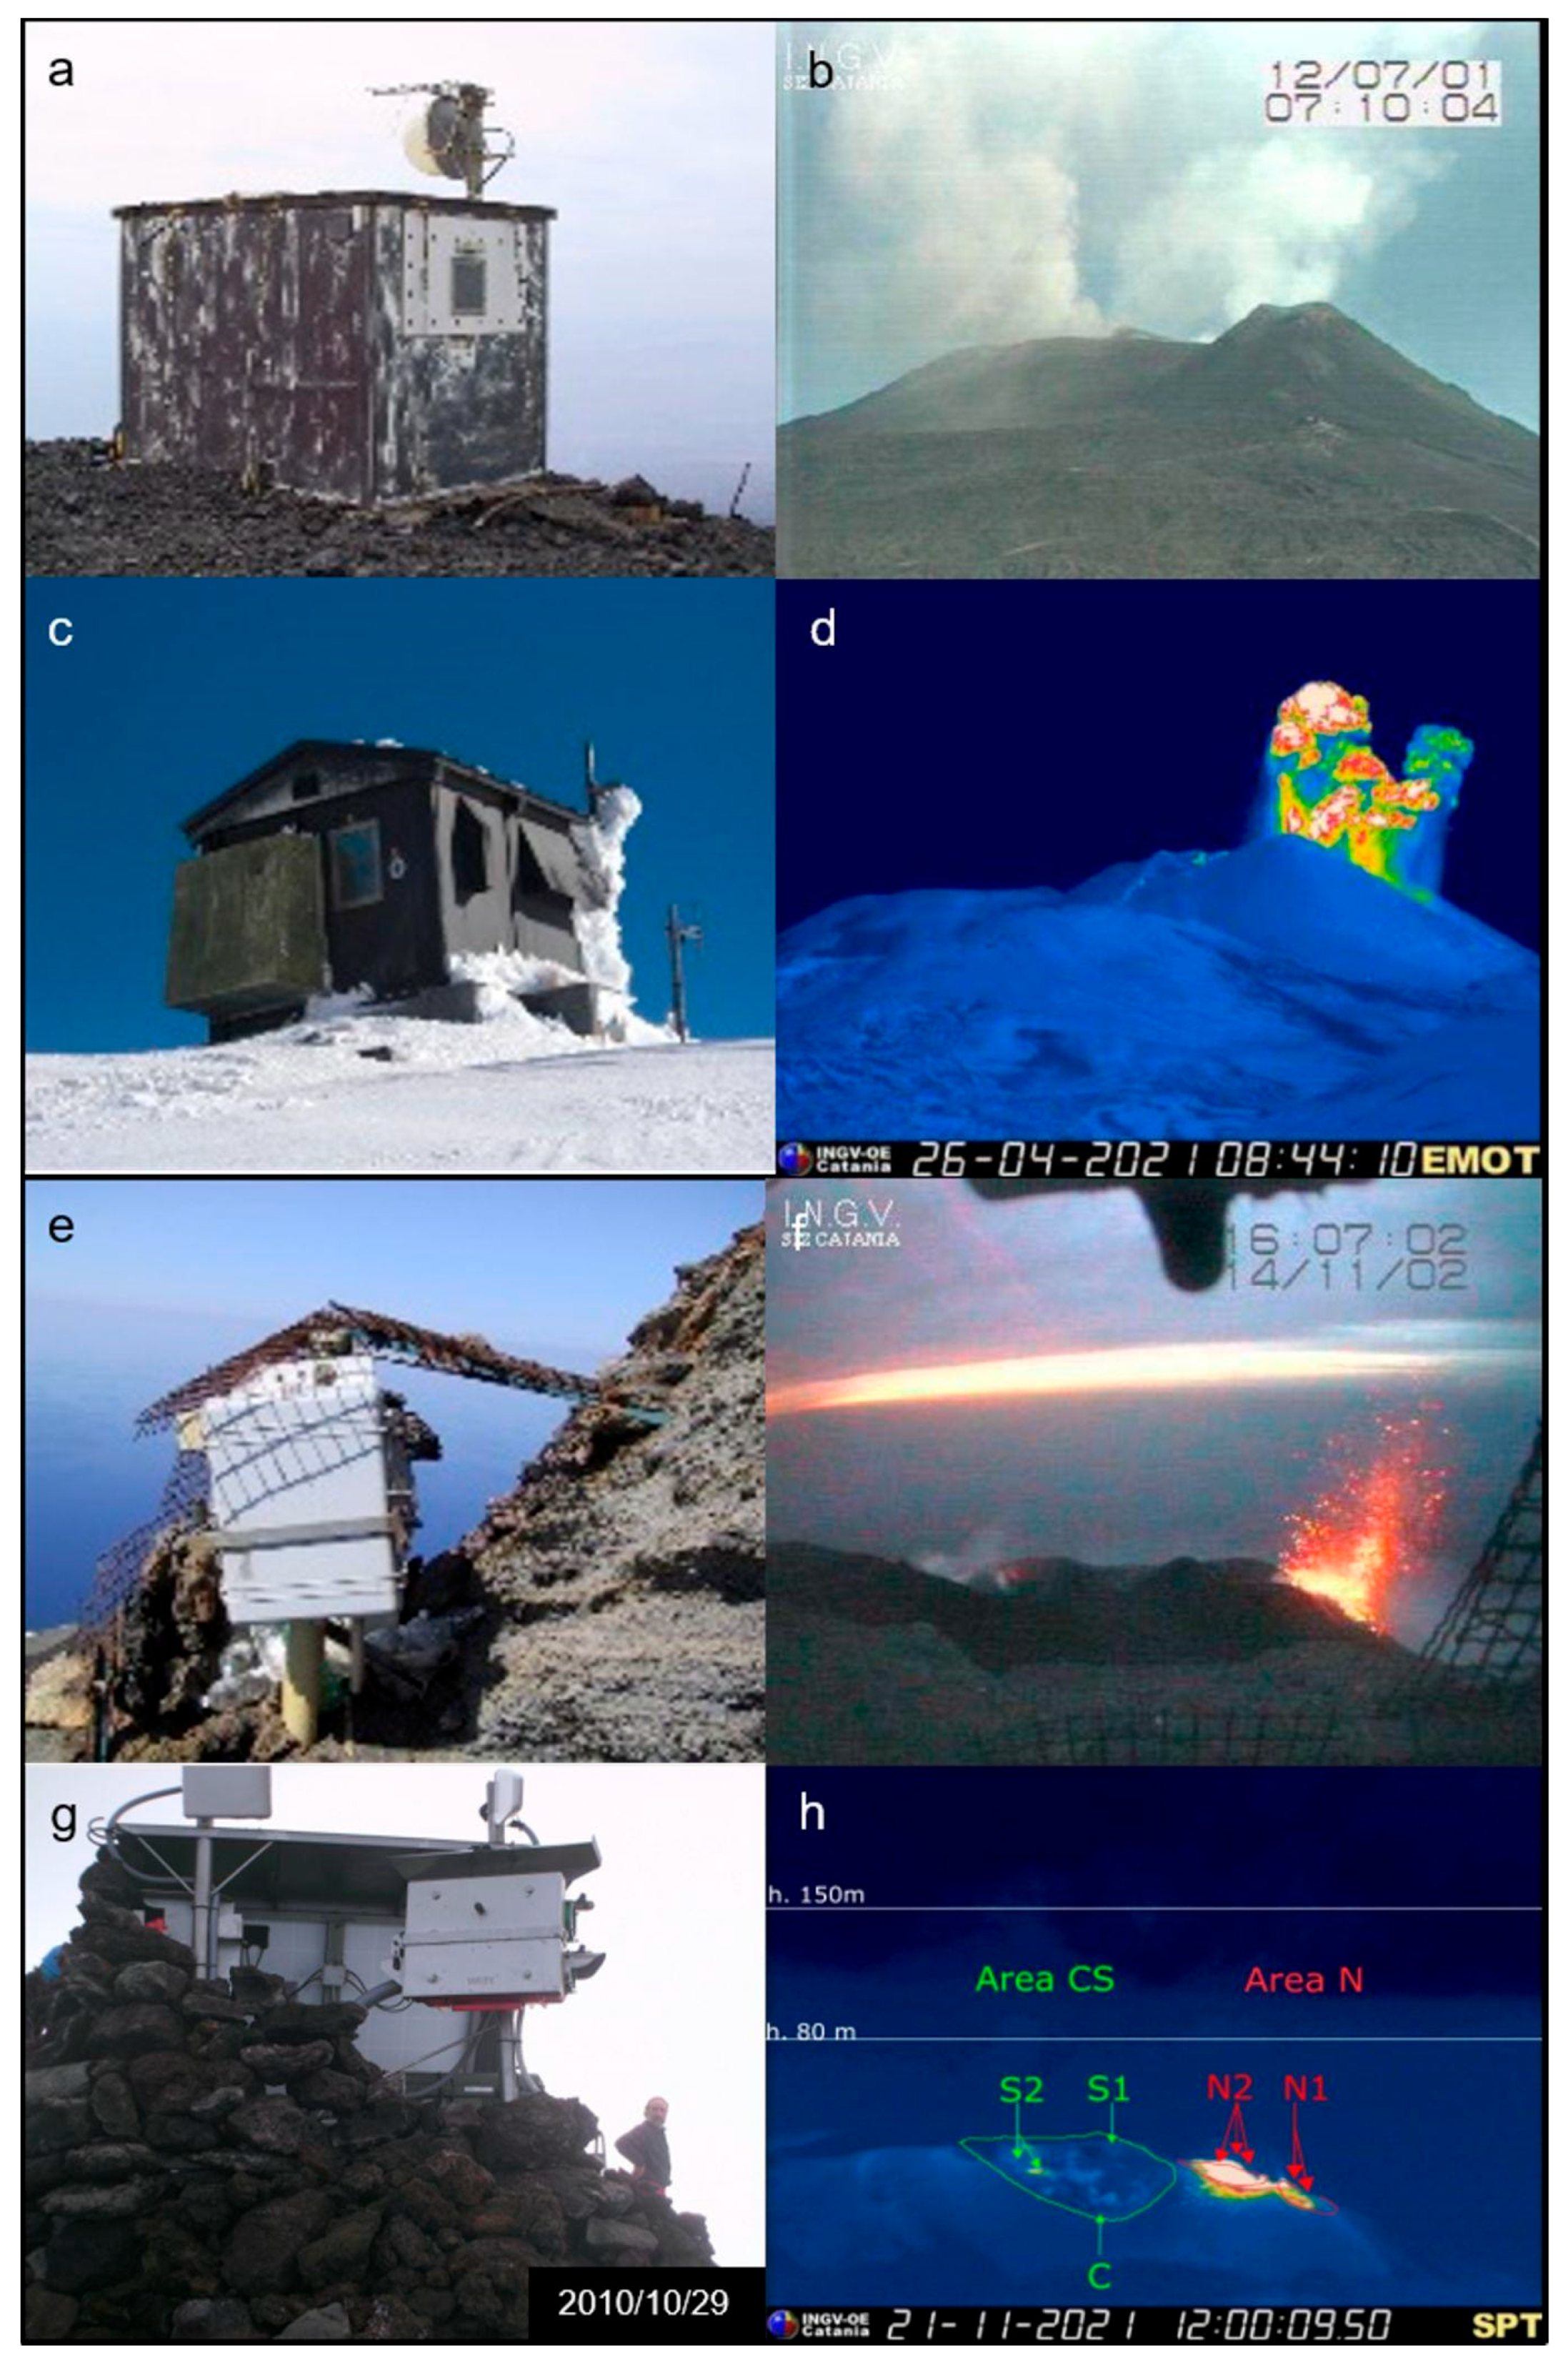
In this global framework, the Sicilian volcanoes (Etna, Stromboli and Vulcano) have played a pioneering role in the development of continuous volcanic video monitoring (Figure 1). Etna was one of the first active volcanoes to be continuously monitored using a permanent ground-based video station, with the installation of the first legacy analog camera in 1993. Shortly after, in the summer of 1994, continuous monitoring began at Stromboli and in the early 1990s at Vulcano from the Lipari Geophysical Observatory. The long-term operation of these monitoring systems has proven particularly valuable given the recent evolution of volcanic activity across all three volcanoes. During the last three decades, Etna’s eruptions have shifted toward more explosive styles, primarily from its summit craters [16]. Similarly, Stromboli’s persistent, low-energy explosive activity is sporadically interrupted by major explosions or severe paroxysmal events that pose significant hazards to tourists and local inhabitants [17]. Moreover, Vulcano has undergone a phase of volcanic unrest between 2021 and 2023, which posed a sudden and significant risk to the exposed population, especially during the summer season due to the high number of tourists on the island [18,19]. For these reasons, continuous monitoring of volcanic activity at Sicilian volcanoes is essential. Consequently, video observations rapidly became one of the primary sources of information for real-time characterization of eruptive activity, supporting both scientific investigations and operational decision-making [14,20]. Despite the widespread adoption of video surveillance in volcano monitoring on Sicilian volcanoes [20,21,22,23,24,25,26], no study has yet provided a comprehensive overview of the long-term evolution of an operational camera network, documenting both the technological developments and the realization of novel tools developed in-house for real-time volcanic monitoring and surveillance.
Figure 1.
(a) The old shelter at the ‘La Montagnola’ site at Etna that was destroyed after the 2001 eruption; (b) image of the Etna summit crater captured by the old professional Sony analog camera; (c) the new shelter at the ‘La Montagnola’; and (d) thermal image captured by the Flir thermal camera (EMOT). (e) The first video station installed on “Pizzo sopra la Fossa” at Stromboli; (f) an old image of the Stromboli crater area captured by the first Sony visible camera; (g) the new video station installed on “Pizzo sopra la Fossa” and (h) a thermal image captured by the Flir thermal camera (SPT) including the name of summit crater area and the height of the explosions (white lines).
This study details the evolution of one of the world’s longest-running operational volcanic camera networks. We illustrate how technological advancements, from analog imaging to HD visible and thermal systems integrated with processing tools, have continuously improved operational monitoring and hazard assessment. We also present different software developed at the Istituto Nazionale di Geofisica e Vulcanologia, Osservatorio Etneo (INGV-OE), which supports early warning and both qualitative and quantitative characterization of eruptive activity. Lastly, we highlight the network’s role in real-time civil protection operations, demonstrating how tools effectively resolve image overload by processing large volumes of data in near-real-time to generate alerts and quantify key eruptive parameters.
2. Materials and Methods
2.1. Evolution of the Camera Network
The first installation of a monitoring and surveillance camera was carried out in 1993 on Etna at the “La Montagnola” site, at about 2700 m above sea level (a.s.l.). A small shelter was built containing a professional Sony analog Charge-Coupled Device (CCD) camera, an in-house-developed PC-controlled camera system, a defrosting system for the window protection to maintain operability during severe winter conditions, and an analog microwave transmission system (Figure 1). This link connected the station to the International Institute of Volcanology of the National Research Council (IIV-CNR) in Catania. The transmitted video images were archived using time-lapse video recorders and displayed on dedicated monitors in a control room for volcanic monitoring and surveillance. This was one of the first video stations in the world dedicated to continuous monitoring of an active volcano. Unfortunately, this station was destroyed by the 2001 Etna eruption [16]. Instead, at Stromboli, the continuous visual surveillance of eruptive activity started with the installation of a camera on “Pizzo Sopra la Fossa”, located approximately 300 m from the Stromboli crater terrace in the summer of 1994 (Figure 1). For this initial video station, a specialized waterproof housing was utilized, containing a Sony analog CCD visible-light camera. By means of a professional microwave transmission system (operating at 10 GHz), equipped with a relay station at the “I Vancori” site near the summit of Stromboli, the footage was transmitted in real time simultaneously to both the Gruppo Nazionale Vulcanologia (GNV) Center on Stromboli and the Navy Observatory on Lipari. There, it was recorded using time-lapse video cassette recordings (VCRs) and displayed on special monitors. This video station was completely destroyed by the paroxysmal explosion on 5 April 2003 [21]. Although this site provides an exceptional viewpoint, it exposes the equipment to frequent damage caused not only by the strongest volcanic explosions but also by harsh environmental conditions characterized by the presence of corrosive gases. Indeed, over 32 years of video surveillance from Pizzo Sopra la Fossa, six cameras have been replaced, having been either destroyed by volcanic activity or degraded by the aforementioned severe environmental factors. The first video monitoring stations installed on the Sicilian volcanoes (Etna, Stromboli, and Vulcano) were designed, built, and deployed through the fundamental technical support of Moreno Bernacchi (West Systems s.r.l.).
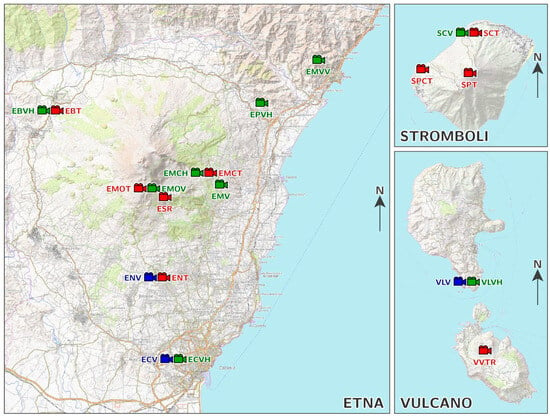
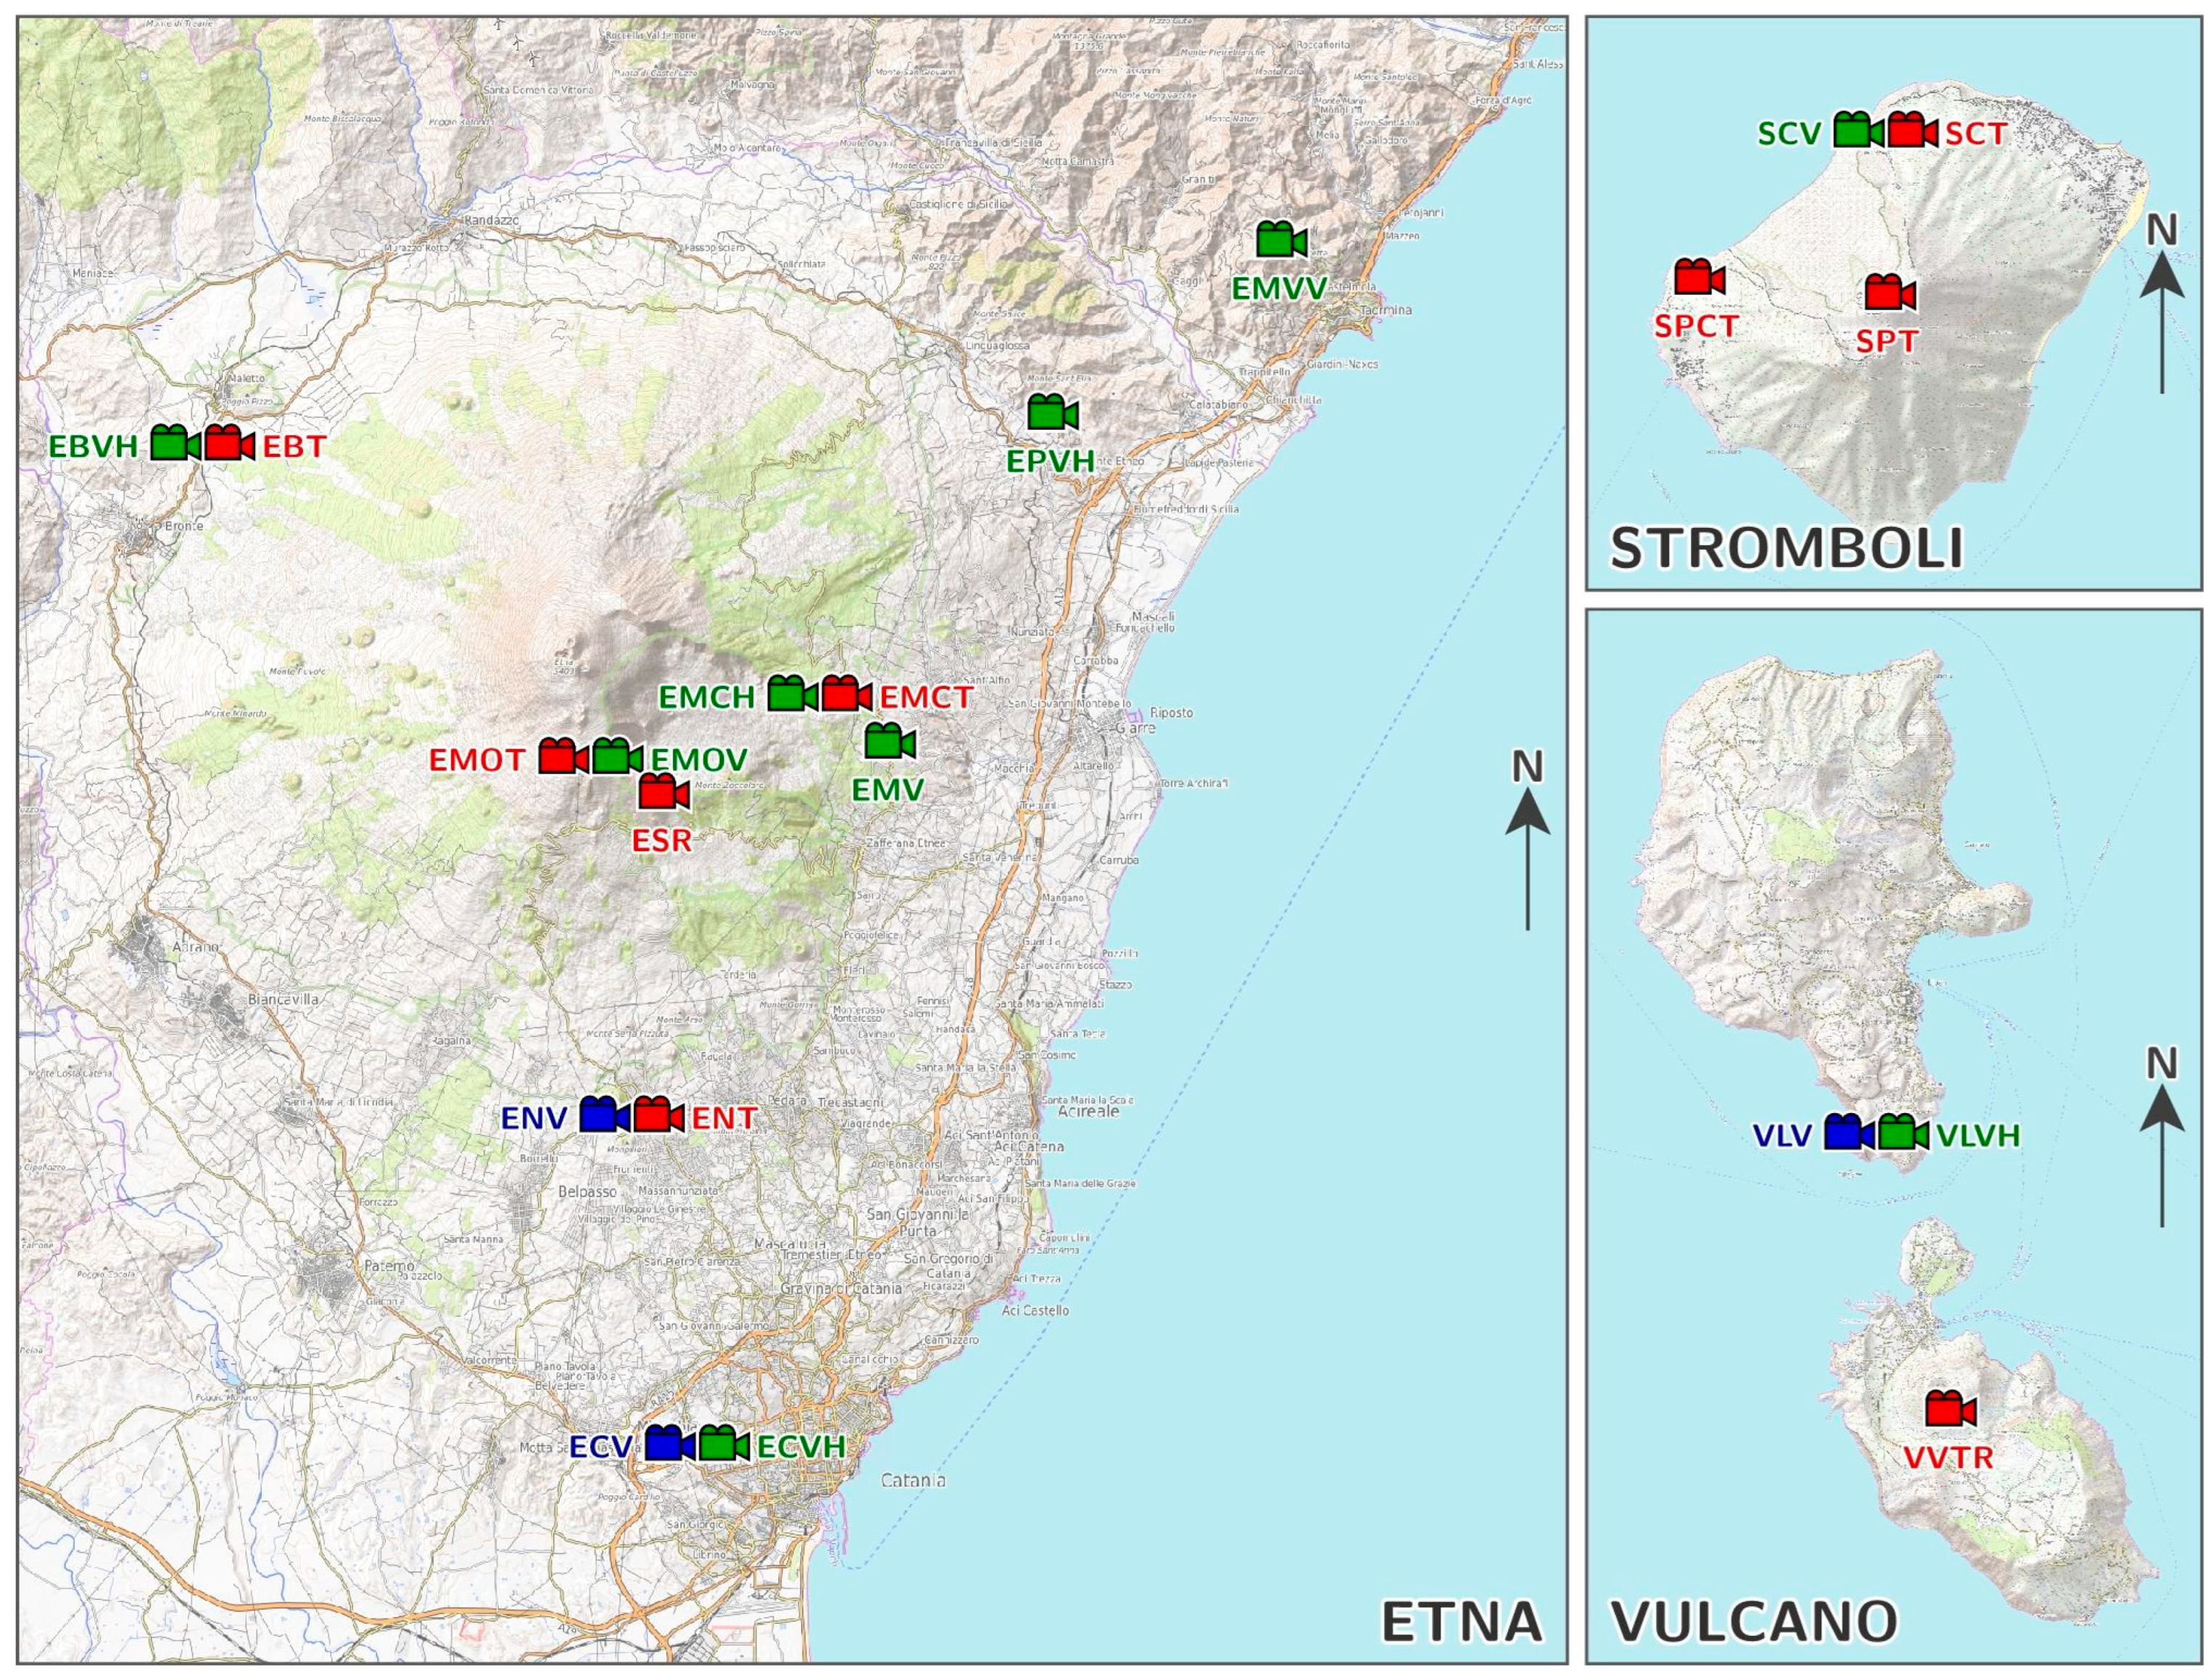
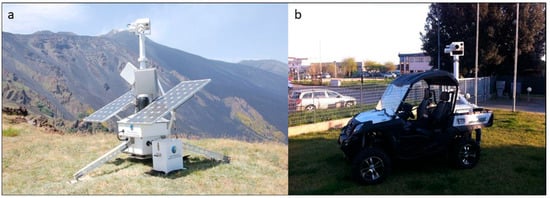
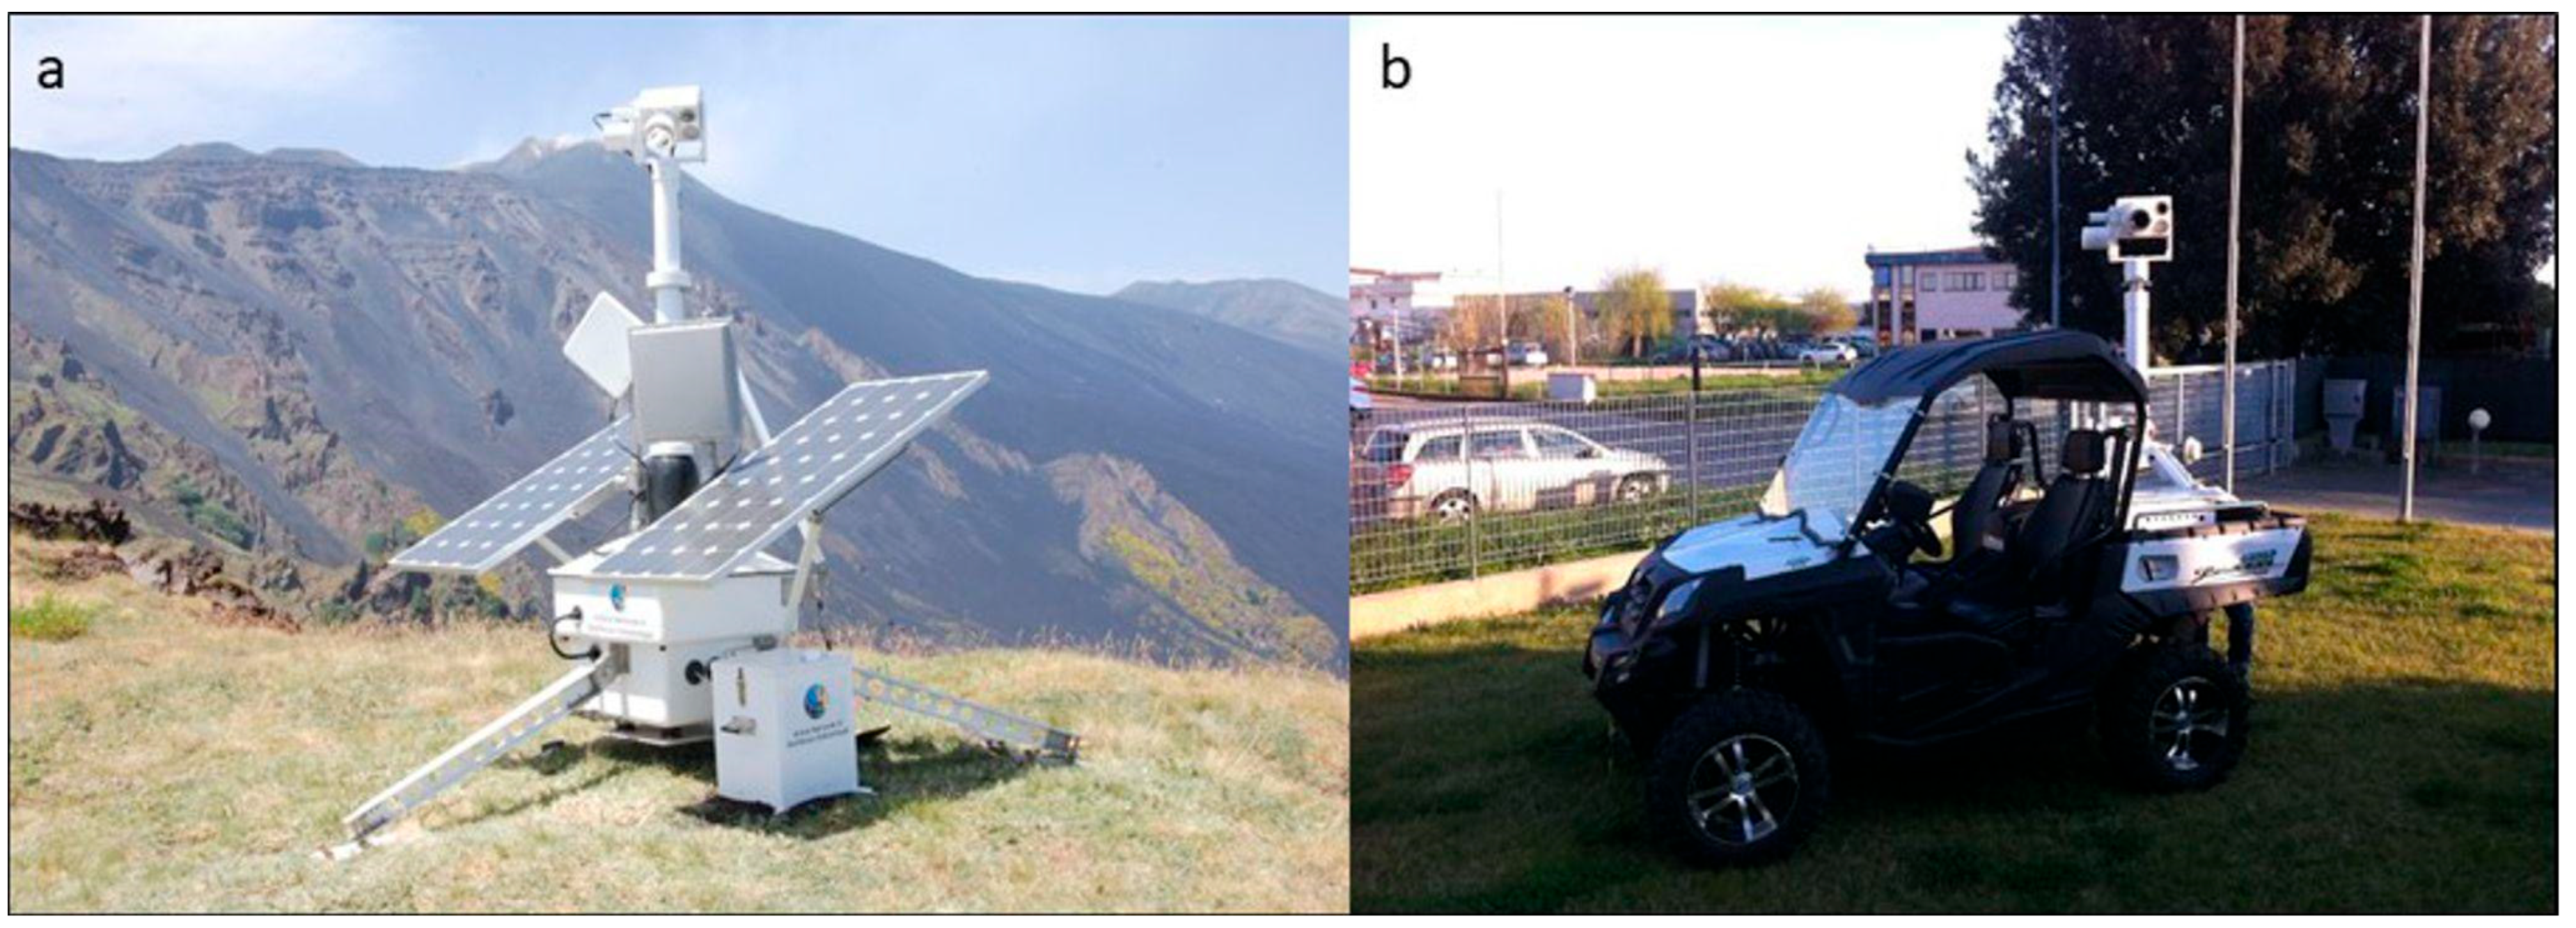
Over the years, the camera network on Sicilian active volcanoes has progressively increased, forming the current comprehensive ground-based camera network managed by INGV-OE. Currently, 21 cameras operate continuously: 14 on Etna (9 in the visible and 5 in the thermal infrared spectrum), 4 on Stromboli (1 visible and 3 in the thermal infrared spectrum), and 3 on Vulcano (2 visible and 1 in the thermal infrared spectrum) (Figure 2). Furthermore, three mobile video and thermal stations were designed and built to be deployed directly from modified vehicles (e.g., quads) in areas temporarily not covered by the fixed network during specific volcanic emergencies (Figure 3). Table 1 summarizes the location of each camera, its acronym, type (visible vs. thermal), coordinates, elevation, and distance from the crater.
Figure 2.
Map showing the location of the thermal (red labels), visible (blue labels) and HD visible (green labels) camera stations (see Table 1 for details) at Etna, Stromboli and Vulcano.
Figure 3.
(a) Mobile video stations and (b) the quad used for supporting the activities.
Table 1.
Location, acronym, sensor type, latitude, longitude, elevation, distance from the craters.
2.2. Imaging Systems
Thermal imaging has become a standard remote sensing tool for monitoring active volcanoes. The study of temperature variations within open-conduit systems, at eruptive fissures, active vents, domes, lava lakes, lava fields, and other volcanic features has proven fundamental to better understand volcanic system behavior in both the short and long term (see [27] for a review). Thermal cameras detect the thermal radiation (W/m2) emitted by bodies and transform it into temperature (K) using the Stefan-Boltzmann law. The network predominantly utilizes uncooled microbolometer detectors operating in the thermal infrared band. The deployed models include the FLIR A40 M (320 × 240 pixels, 7.5–13 µm spectral range), the FLIR A320 M (320 × 240 pixels, 7.5–13 µm spectral range), and the more advanced FLIR A665 SC (640 × 480 pixels, 7.5–14 µm spectral range, measurement accuracy ±2 °C). To optimize power consumption and performance, the older FLIR models (such as the A320 M) will be upgraded to FLIR A70 thermal cameras. This thermal camera will feature low power consumption, compact dimensions, high spatial resolution, and a fixed focus.
In the early 2000s, several analog Canon VC-C4 color pan–tilt–zoom (PTZ) cameras were installed on Etna. Recently, these older systems have almost entirely been replaced with new 5-megapixel (MP) and 6-MP digital cameras from VIVOTEK and Mobotix to substantially improve image quality and resolution. To standardize the network and further enhance image quality, the remaining Canon VC-C4 color PTZ cameras and VIVOTEK IP8172P models will soon be progressively replaced by the high-resolution Mobotix M26B-6D network IP cameras. Table 2 shows the technical specifications of the deployed camera stations.
Table 2.
Acronym, Visible and Thermal Sensor Specifications, Transmission Data, and Power Supply Systems.
New optical and thermal monitoring stations were designed by INGV-OE technologists to modernize the surveillance network across active Sicilian volcanoes. Produced in partnership with IMC Service S.r.l., these systems are presently awaiting installation.
2.3. Network Infrastructure and Software Development
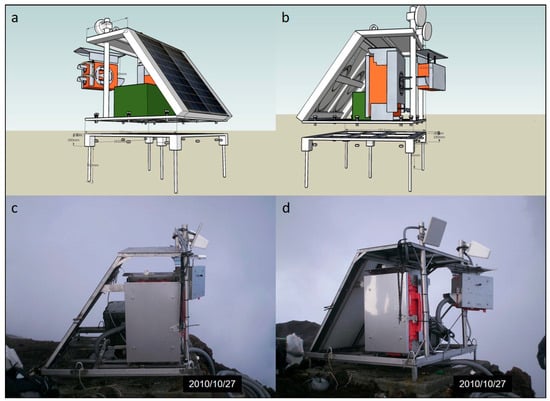
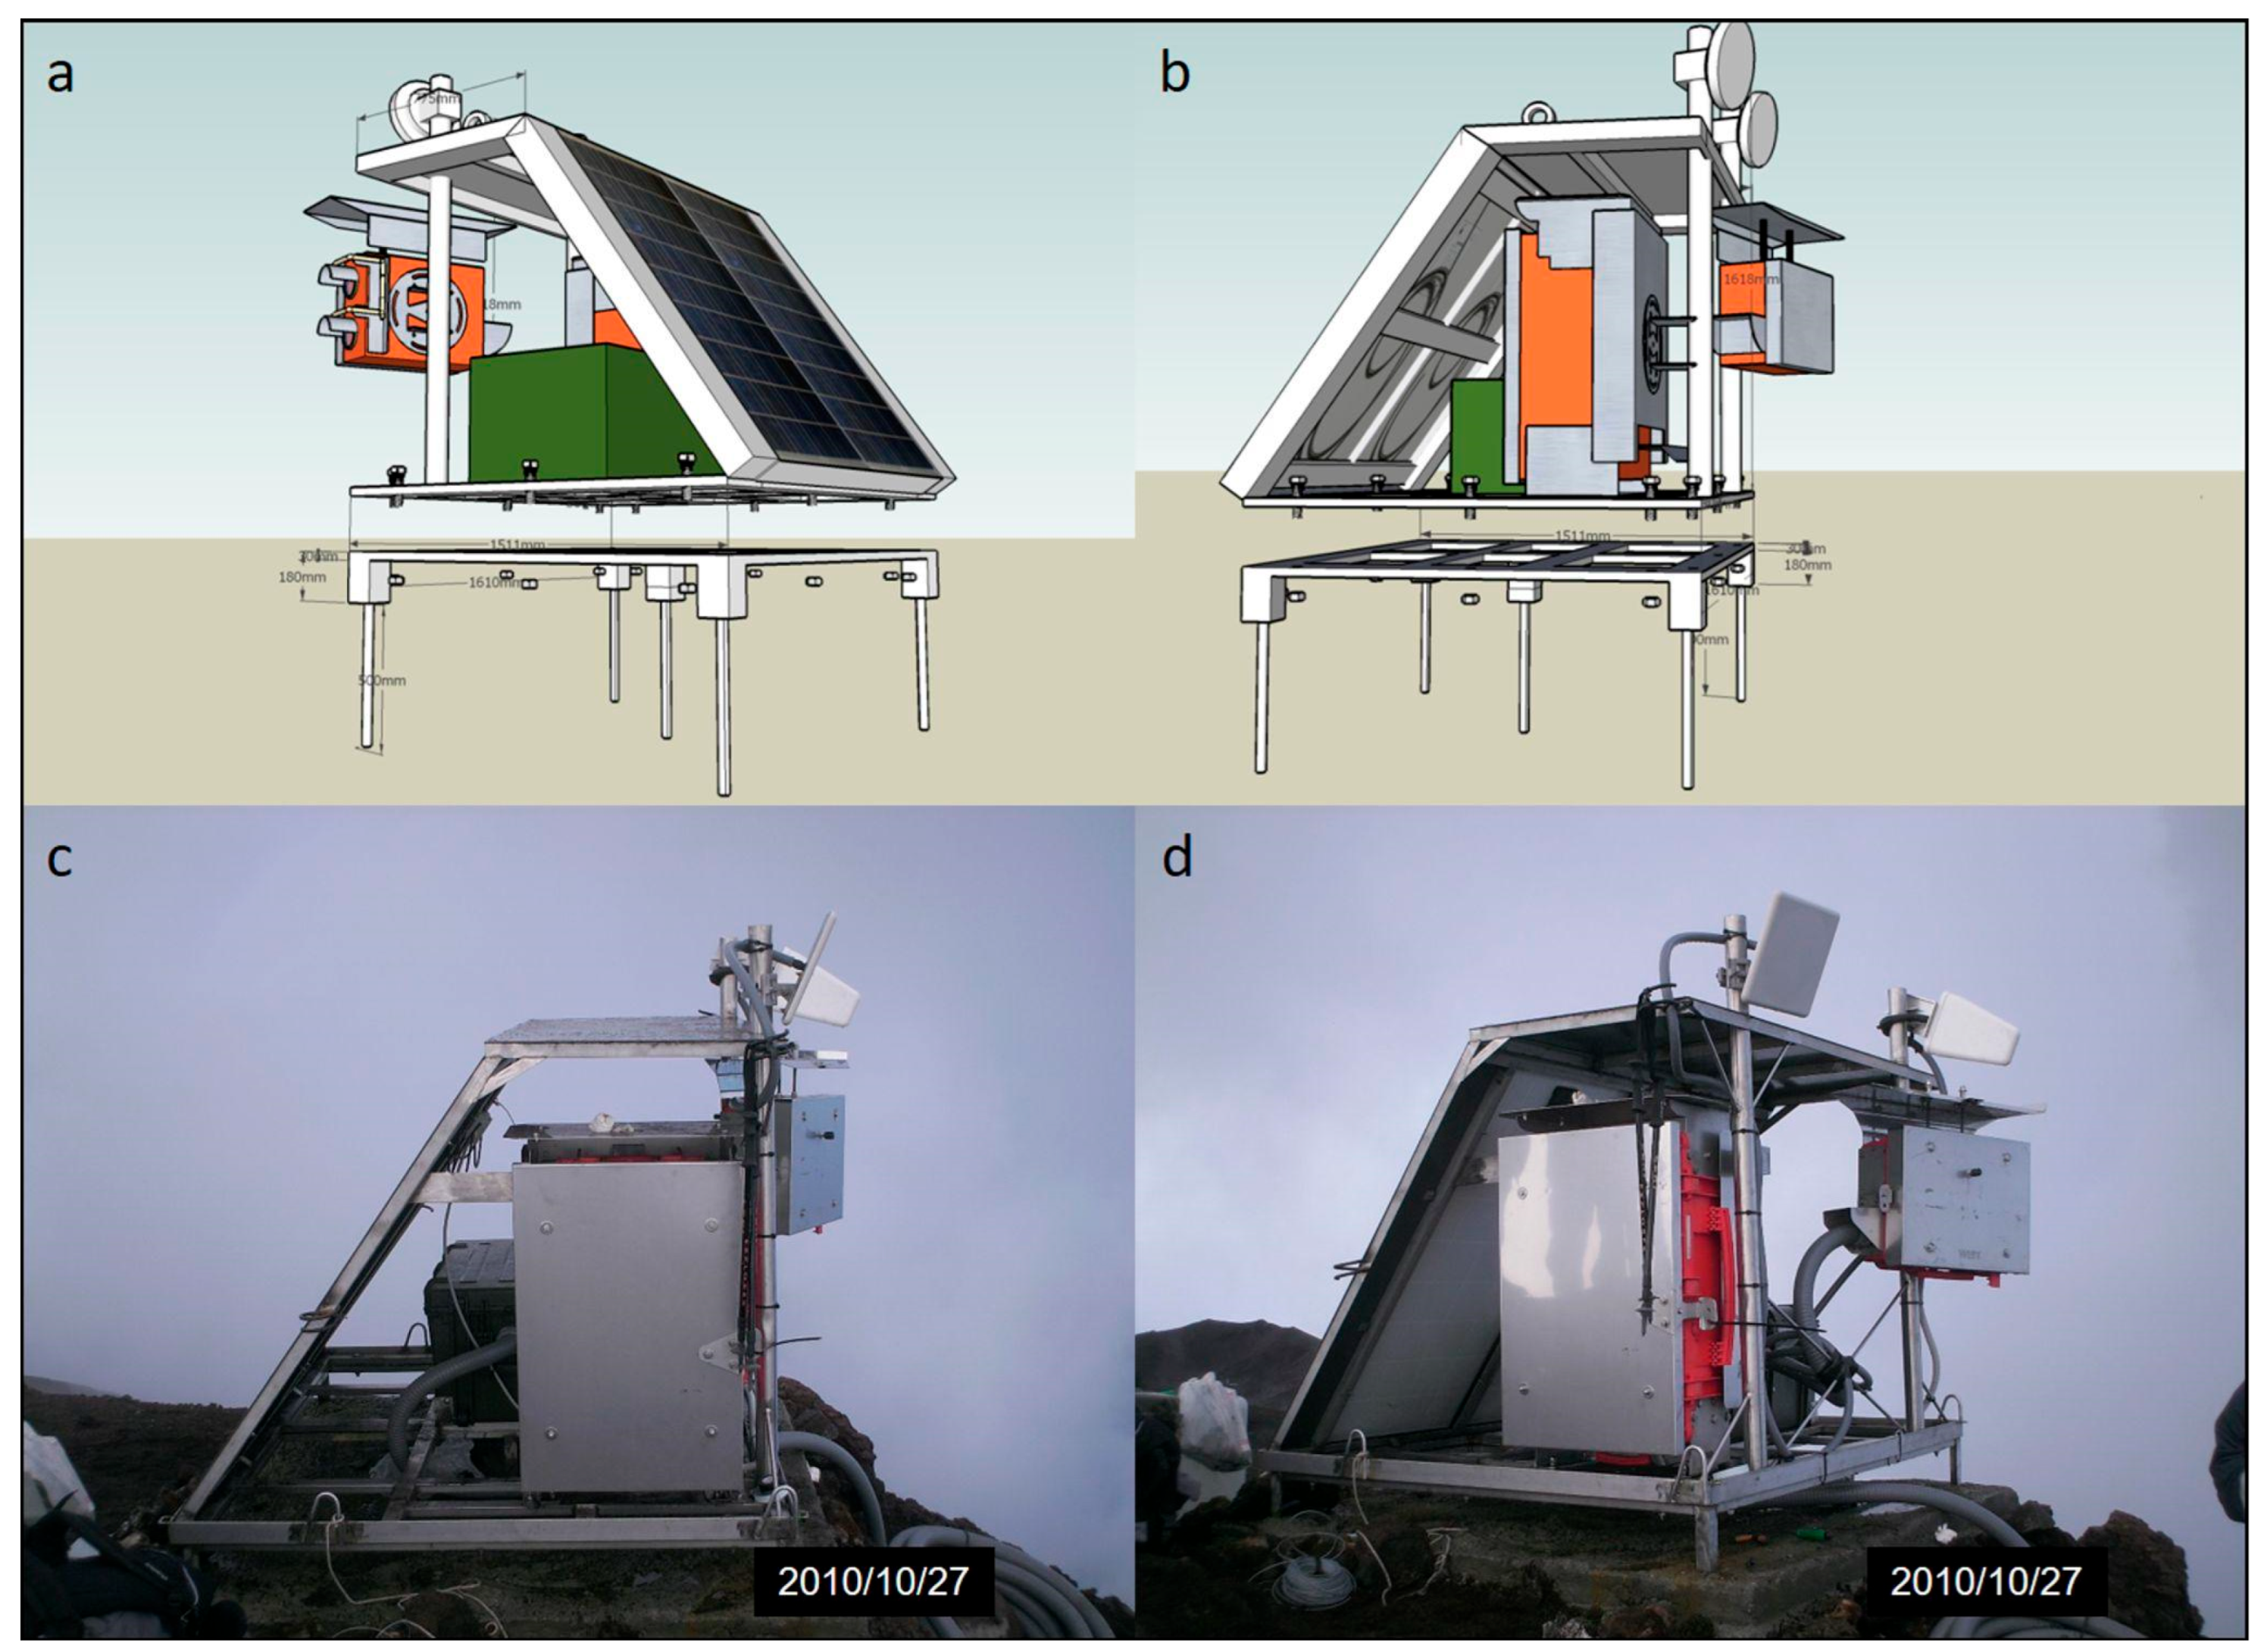
The structural parts and the frames of the recent stations were designed using a 3D CAD software (Google SketchUp 6), subsequently built and assembled by the INGV-OE staff or through collaboration with external companies. Durable materials were selected and used, such as stainless steel frames and polycarbonate rugged protection cases, to host and support sensors and systems of control, communication, and photovoltaic power. These materials are suitable to withstand the harsh environmental conditions in which the stations operate. Figure 4 shows an example of the design, construction, and installation of the structural component of a video station.
Figure 4.
(a,b) The design phase using the Google SketchUp 6 software; (c,d) the installation of the complete station on the top of Stromboli, in the site named “Il Pizzo Sopra la Fossa”.
Given the remote locations and extreme environmental conditions of the monitoring stations, ensuring a reliable and uninterrupted power supply is essential for continuous operation. The primary energy source consists of photovoltaic systems integrating solar panels, Maximum Power Point Tracking (MPPT) charge controllers, and sealed AGM lead-acid or lithium-ion batteries. At the stations that are more easily accessible, or during volcanic emergencies, methanol fuel cells are used either as primary or backup power sources to enhance system reliability. Local station control is provided by industrial fanless computers (e.g., Fitlet2), specifically designed to operate under severe environmental conditions (from −40 °C to +85 °C). These computers are integrated with IP-controlled relay modules, enabling remote management of power supply and device operation, thereby minimizing the need for field interventions and ensuring continuous monitoring even under adverse conditions.
Video streaming requires high-bandwidth and reliable digital transmission systems. Depending on the site, the network utilizes a combination of 5 GHz Wi-Fi links (e.g., Ubiquiti airMAX), 4G LTE routers (such as the LR77 v2 and SmartFlex SR303) capable of data transfer speeds up to 100 Mbit/s, and dedicated GARR fixed-line networks. For stations in remote areas, such as Stromboli, a Starlink satellite broadband connection provides a redundant, high-bandwidth, and ultra-low latency communication channel, ensuring continuous data transmission even during terrestrial network disruptions.
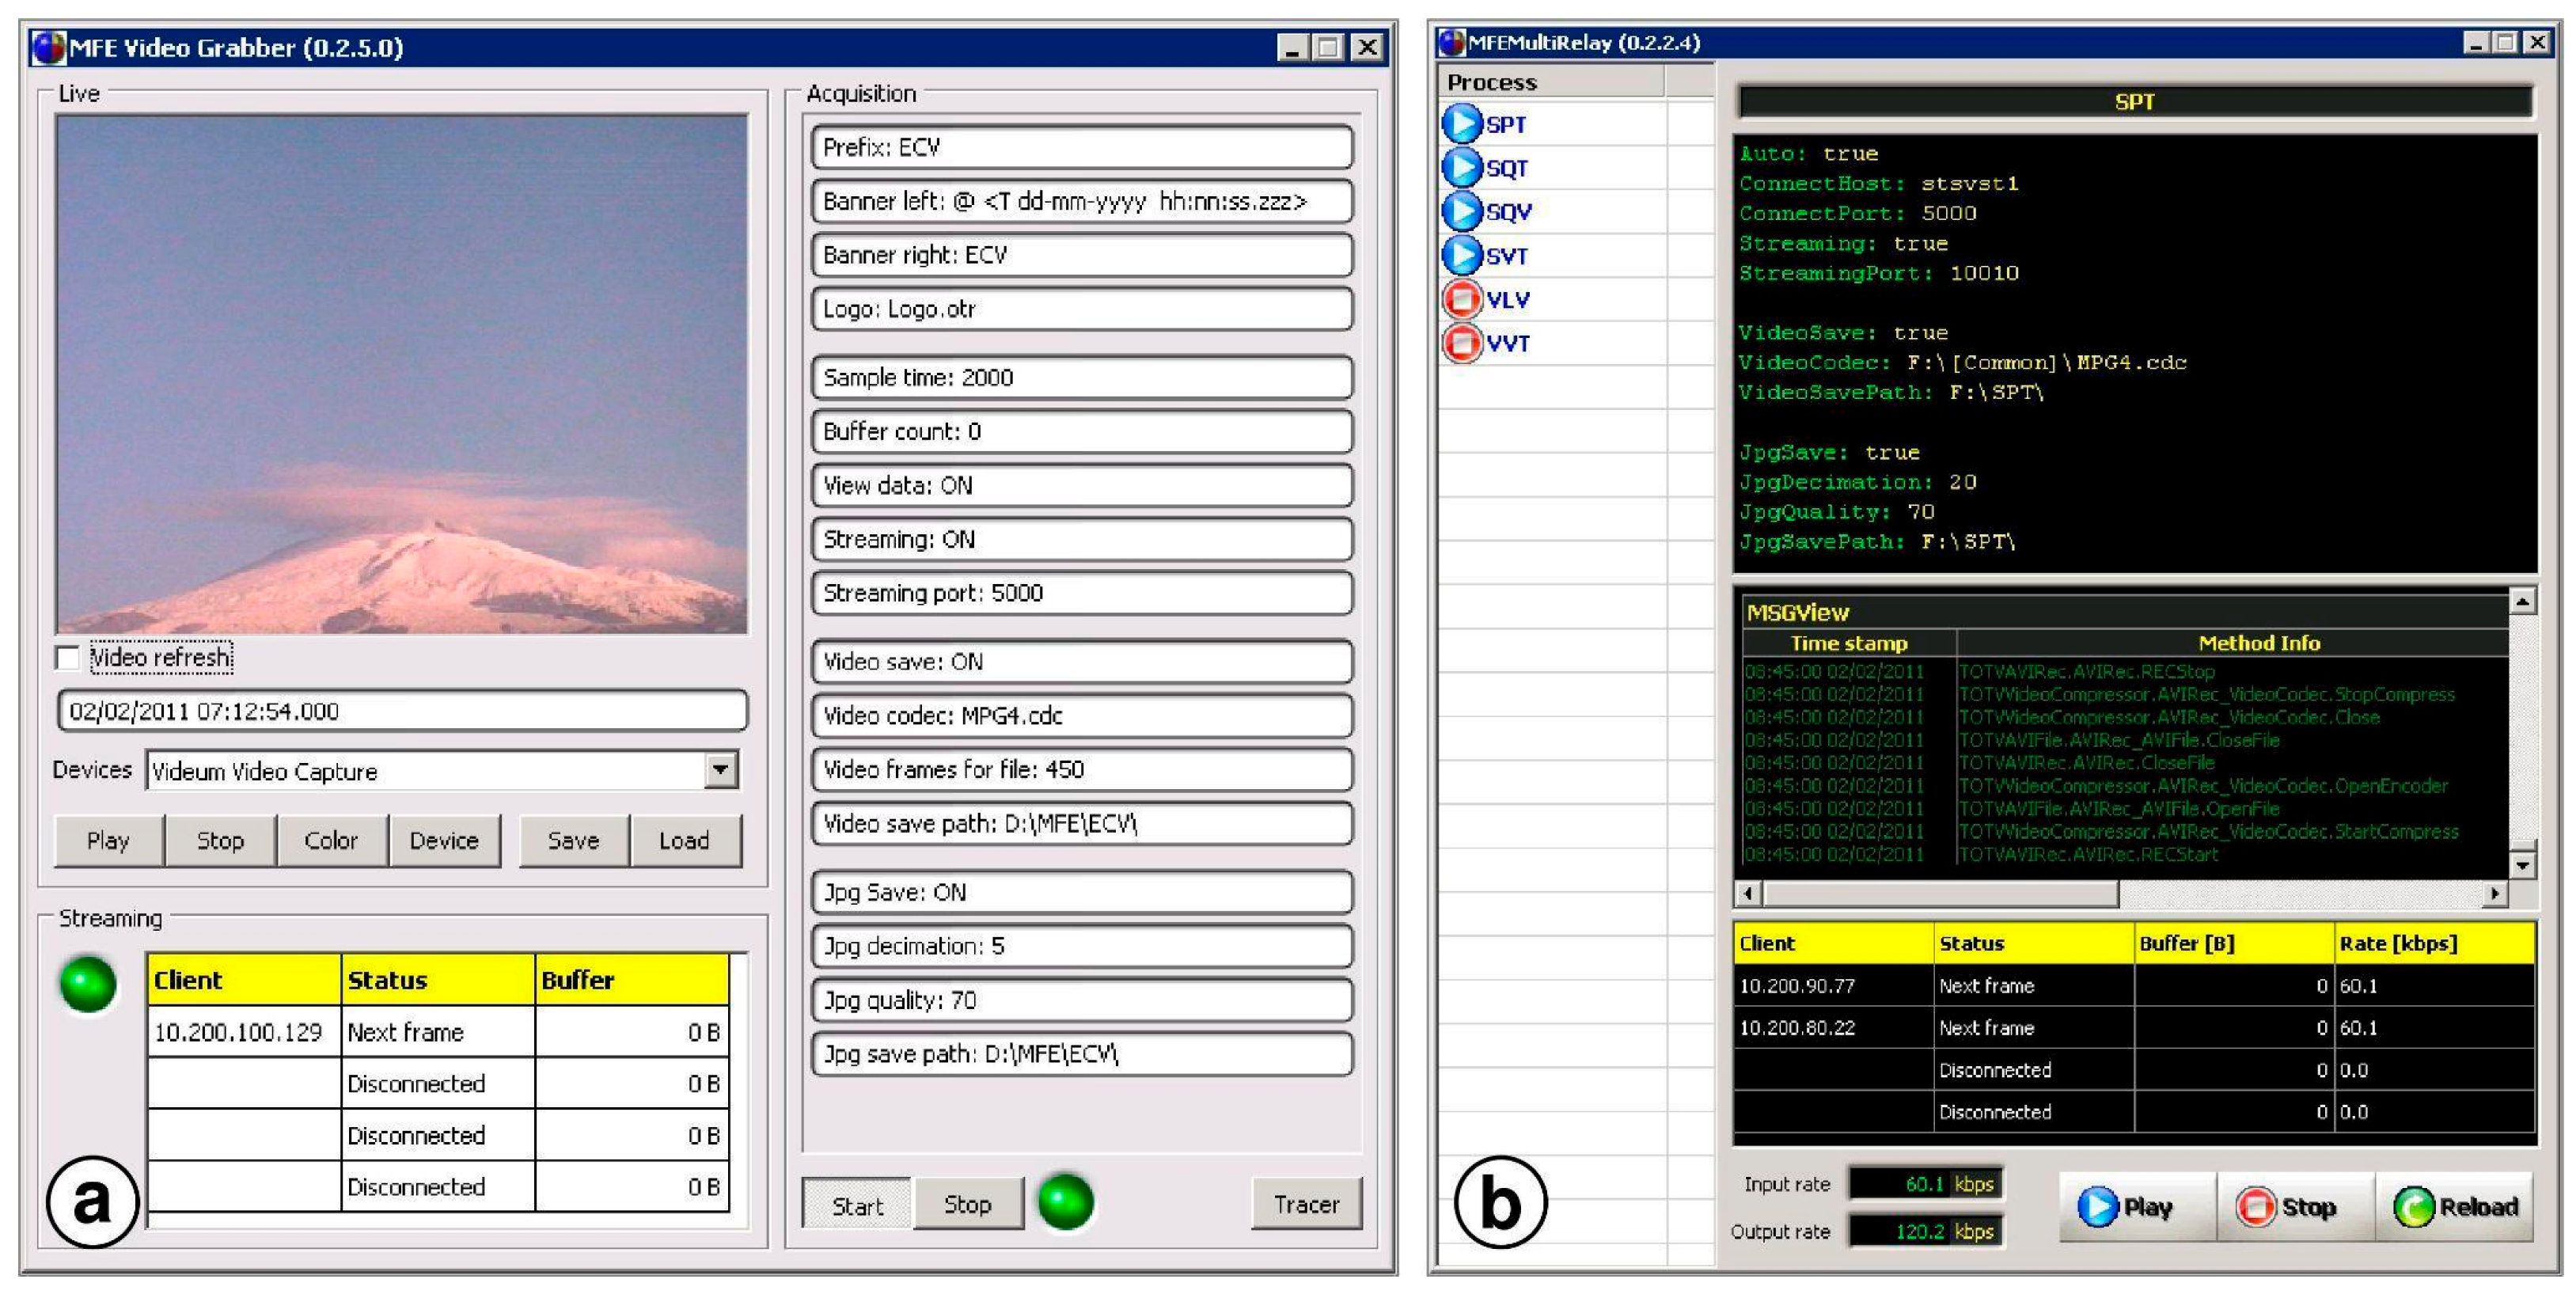
A dedicated software suite was developed at INGV-OE to guarantee time-lapse acquisition, real-time streaming with ultra-low latency, and optimal frame quality with low compression bit-rates. The suite consists of three modules: (i) Grabber: it interfaces with the cameras, processes the frames (crop, rotation, overlaid graphics), and compresses the stream using the FFmpeg library and H.264/MP4 codecs. It employs zero-latency tuning for immediate remote viewing and saves a local AVI copy synchronized with timestamps; (ii) MultiRelay: it acts as a remote extension that receives the stream and allows multiple retransmissions, creating a tree-structure transmission network where local storage is possible at each junction point; (iii) Viewer: it shows the last decoded data without any buffering delay, a requirement that is essential for real-time surveillance activities (Figure 5).
Figure 5.
(a) The Grabber software interface. (b) The MultiRelay software interface.
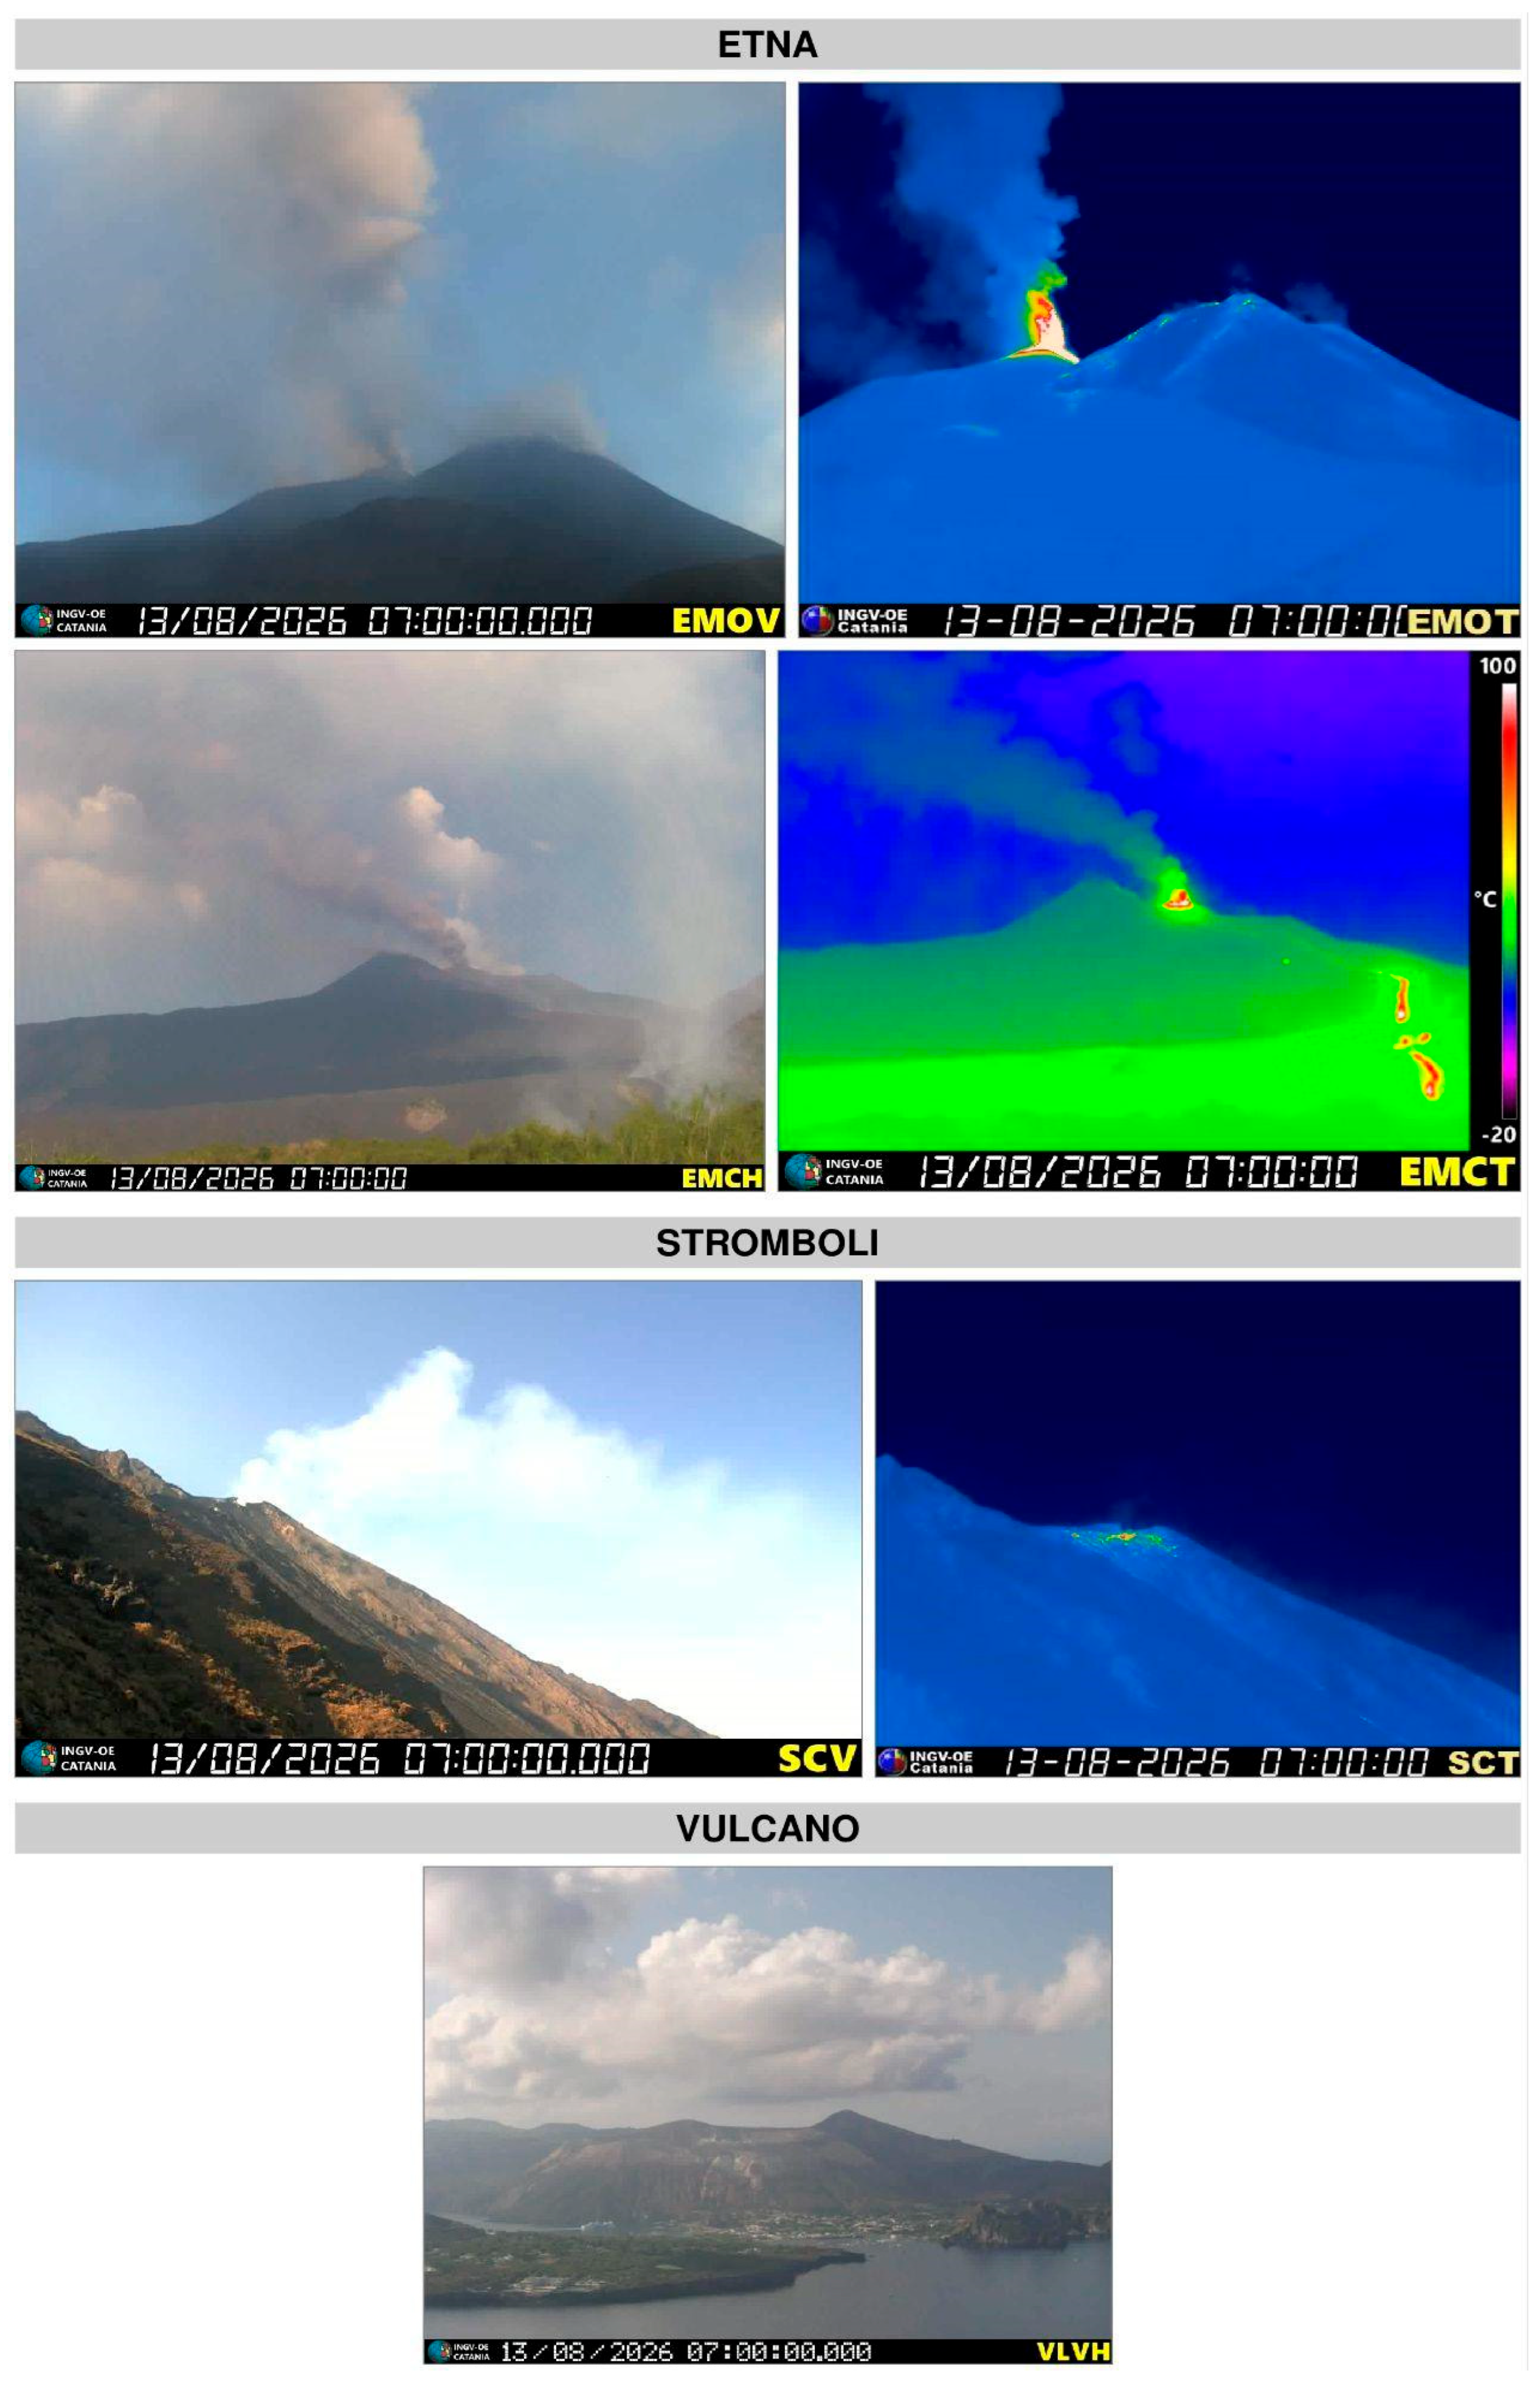
Video streams from camera stations are displayed in the INGV-OE surveillance room, while individual frames and videos are published on the INGV-OE intranet and internet pages (Figure 6). Time-lapse videos from each camera, captured at 5-min intervals, are stored on dedicated storage devices.
Figure 6.
The streaming of some webcams displayed in the control room, downloaded on 13 August 2026 for Etna, Stromboli and Vulcano.
3. Results
3.1. Operational Applications of the INGV-OE Cameras Network
The progressive expansion and technological evolution of the INGV-OE cameras network have substantially enhanced the capability to monitor and characterize volcanic activity at the Sicilian volcanoes. The integration of high-definition visible cameras, thermal infrared imaging, and dedicated processing software has transformed the network from a visual surveillance system into an operational remote sensing platform supporting both scientific investigations and hazard assessment [14,20]. At Etna, where eruptive activity has progressively shifted toward more frequent and energetic summit explosive eruptions since the early 2000s [16], continuous visible and thermal observations have become an essential source of information for rapidly tracking the evolution of eruptive phenomena. The long-term image archive maintained by INGV-OE has supported numerous studies aimed at quantifying eruptive source parameters, investigating relationships between explosive activity and other geophysical observations, including volcanic tremor and radon emissions [14,25,26,27], estimating column heights [28,29] and total erupted volume [22] during lava fountain events, and rapidly mapping lava flow fields during effusive eruptions [24]. At Stromboli, continuous thermal and visible observations have significantly improved the characterization of the persistent explosive activity, occurring every few minutes and occasionally interrupted by major explosions and paroxysmal events. These more energetic eruptions represent the principal volcanic hazard for both visitors and residents. Using continuous image acquisition by the monitoring network, together with seismic and ground deformation data, Calvari et al. [30] developed an operational approach to distinguish ordinary Strombolian explosions from major explosions and paroxysms, providing valuable support for hazard assessment and emergency management. Beyond their scientific applications, the camera network has become an integral component of the operational surveillance activities carried out by INGV-OE volcanologists. During volcanic crises, real-time visible and thermal imagery is routinely used to analyze eruptive activity, support multidisciplinary monitoring reports and bulletins, and issue Volcano Observatory Notice for Aviation (VONA) [20], providing timely information to authorities. Camera monitoring is mainly limited by severe weather conditions. In these cases, the volcanologist on duty uses other monitoring tools (e.g., satellite images, geophysical and geochemical data) to support operational decisions.
3.2. Thermal Early-Warning System
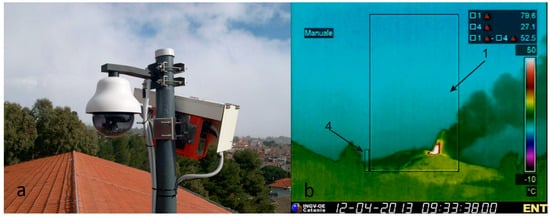
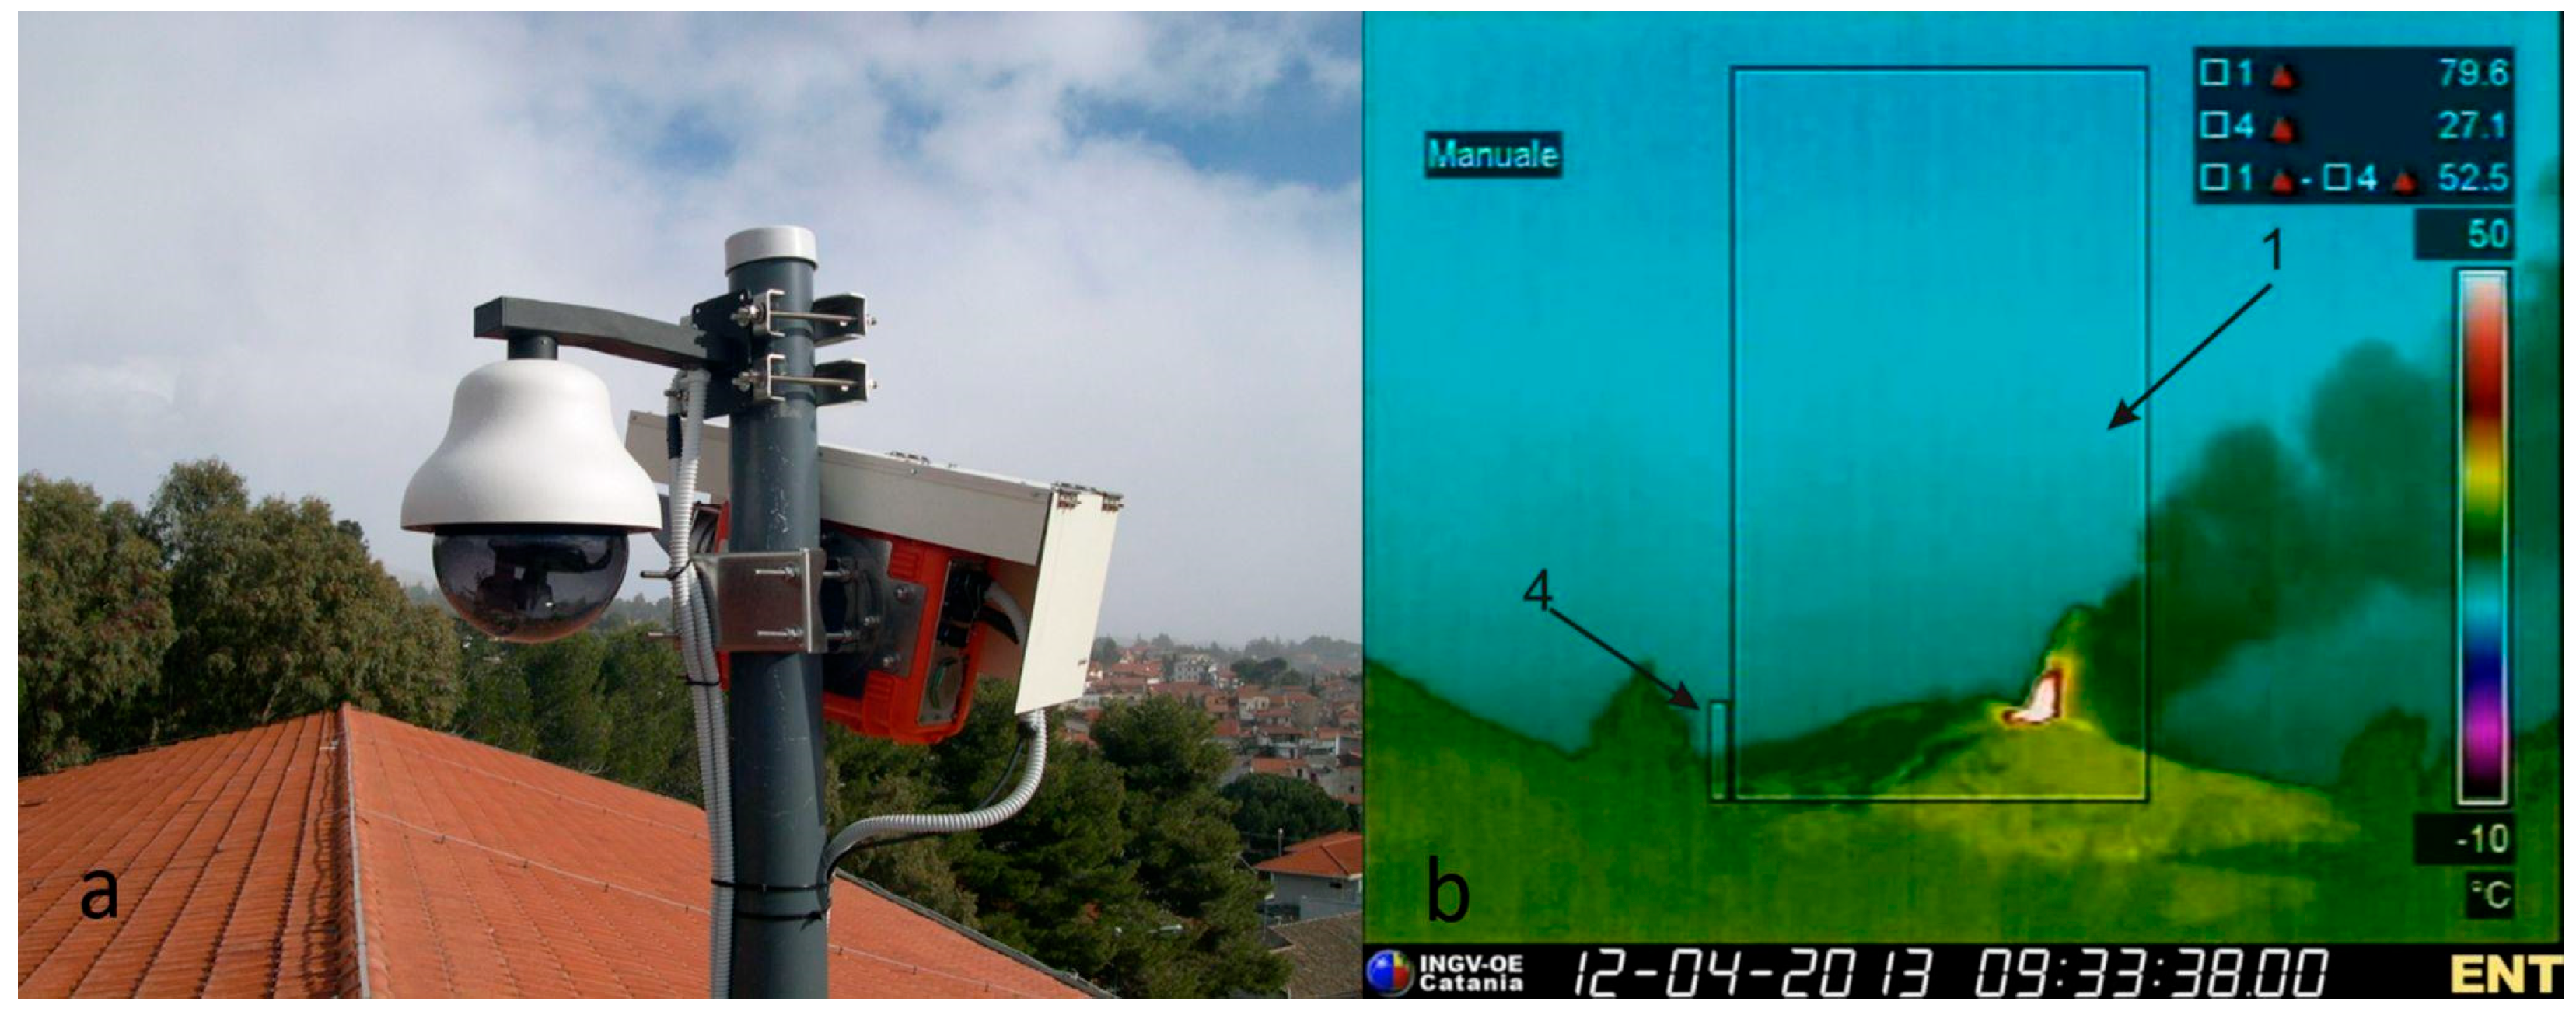
The NewSaraterm alarm system is based on the real-time acquisition and processing of images and radiometric data [4]. Thermal data and frames are recorded in the long-wave infrared (LWIR) by a FLIR ThermoVision A40M infrared camera located in Nicolosi, 15 km south of the Etna summit craters (ENT). The camera is installed on the roof of a school building (Figure 7a). Thermal images are converted into a single metric representing the maximum temperature detected within a region of interest (ROI) centered on the summit craters, including areas exposed to potential eruptive activity (Figure 7b). This value is transmitted at a frequency of 1 Hz via a WiFi link to the acquisition center of INGV-OE in Nicolosi. Thermal data are processed by a novel software (NewSaraterm) developed with LabVIEWTM 8.0 to detect explosive and effusive activity. The system is able to recognize accurately over 99% of the Etna thermal activity. In favorable weather conditions, approximately 1% of false alarms are triggered by transient anthropogenic thermal sources, such as passing helicopters or controlled fires within the ROI (Figure 7b). An initial version of this software was developed in collaboration with the University of Catania [4].
Figure 7.
(a) The video and thermal station installed on the roof of the school in front of the INGV-OE site in Nicolosi. (b) A frame captured by the Flir A 40 M thermal camera observing the explosive activity of Etna volcano on 12 April 2013.
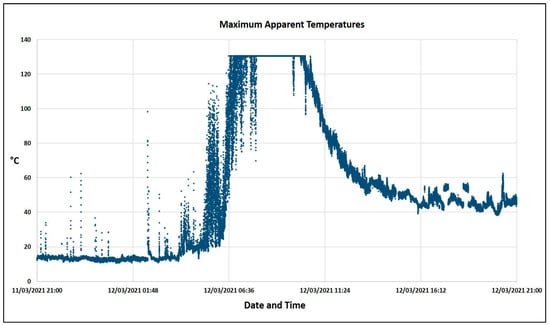
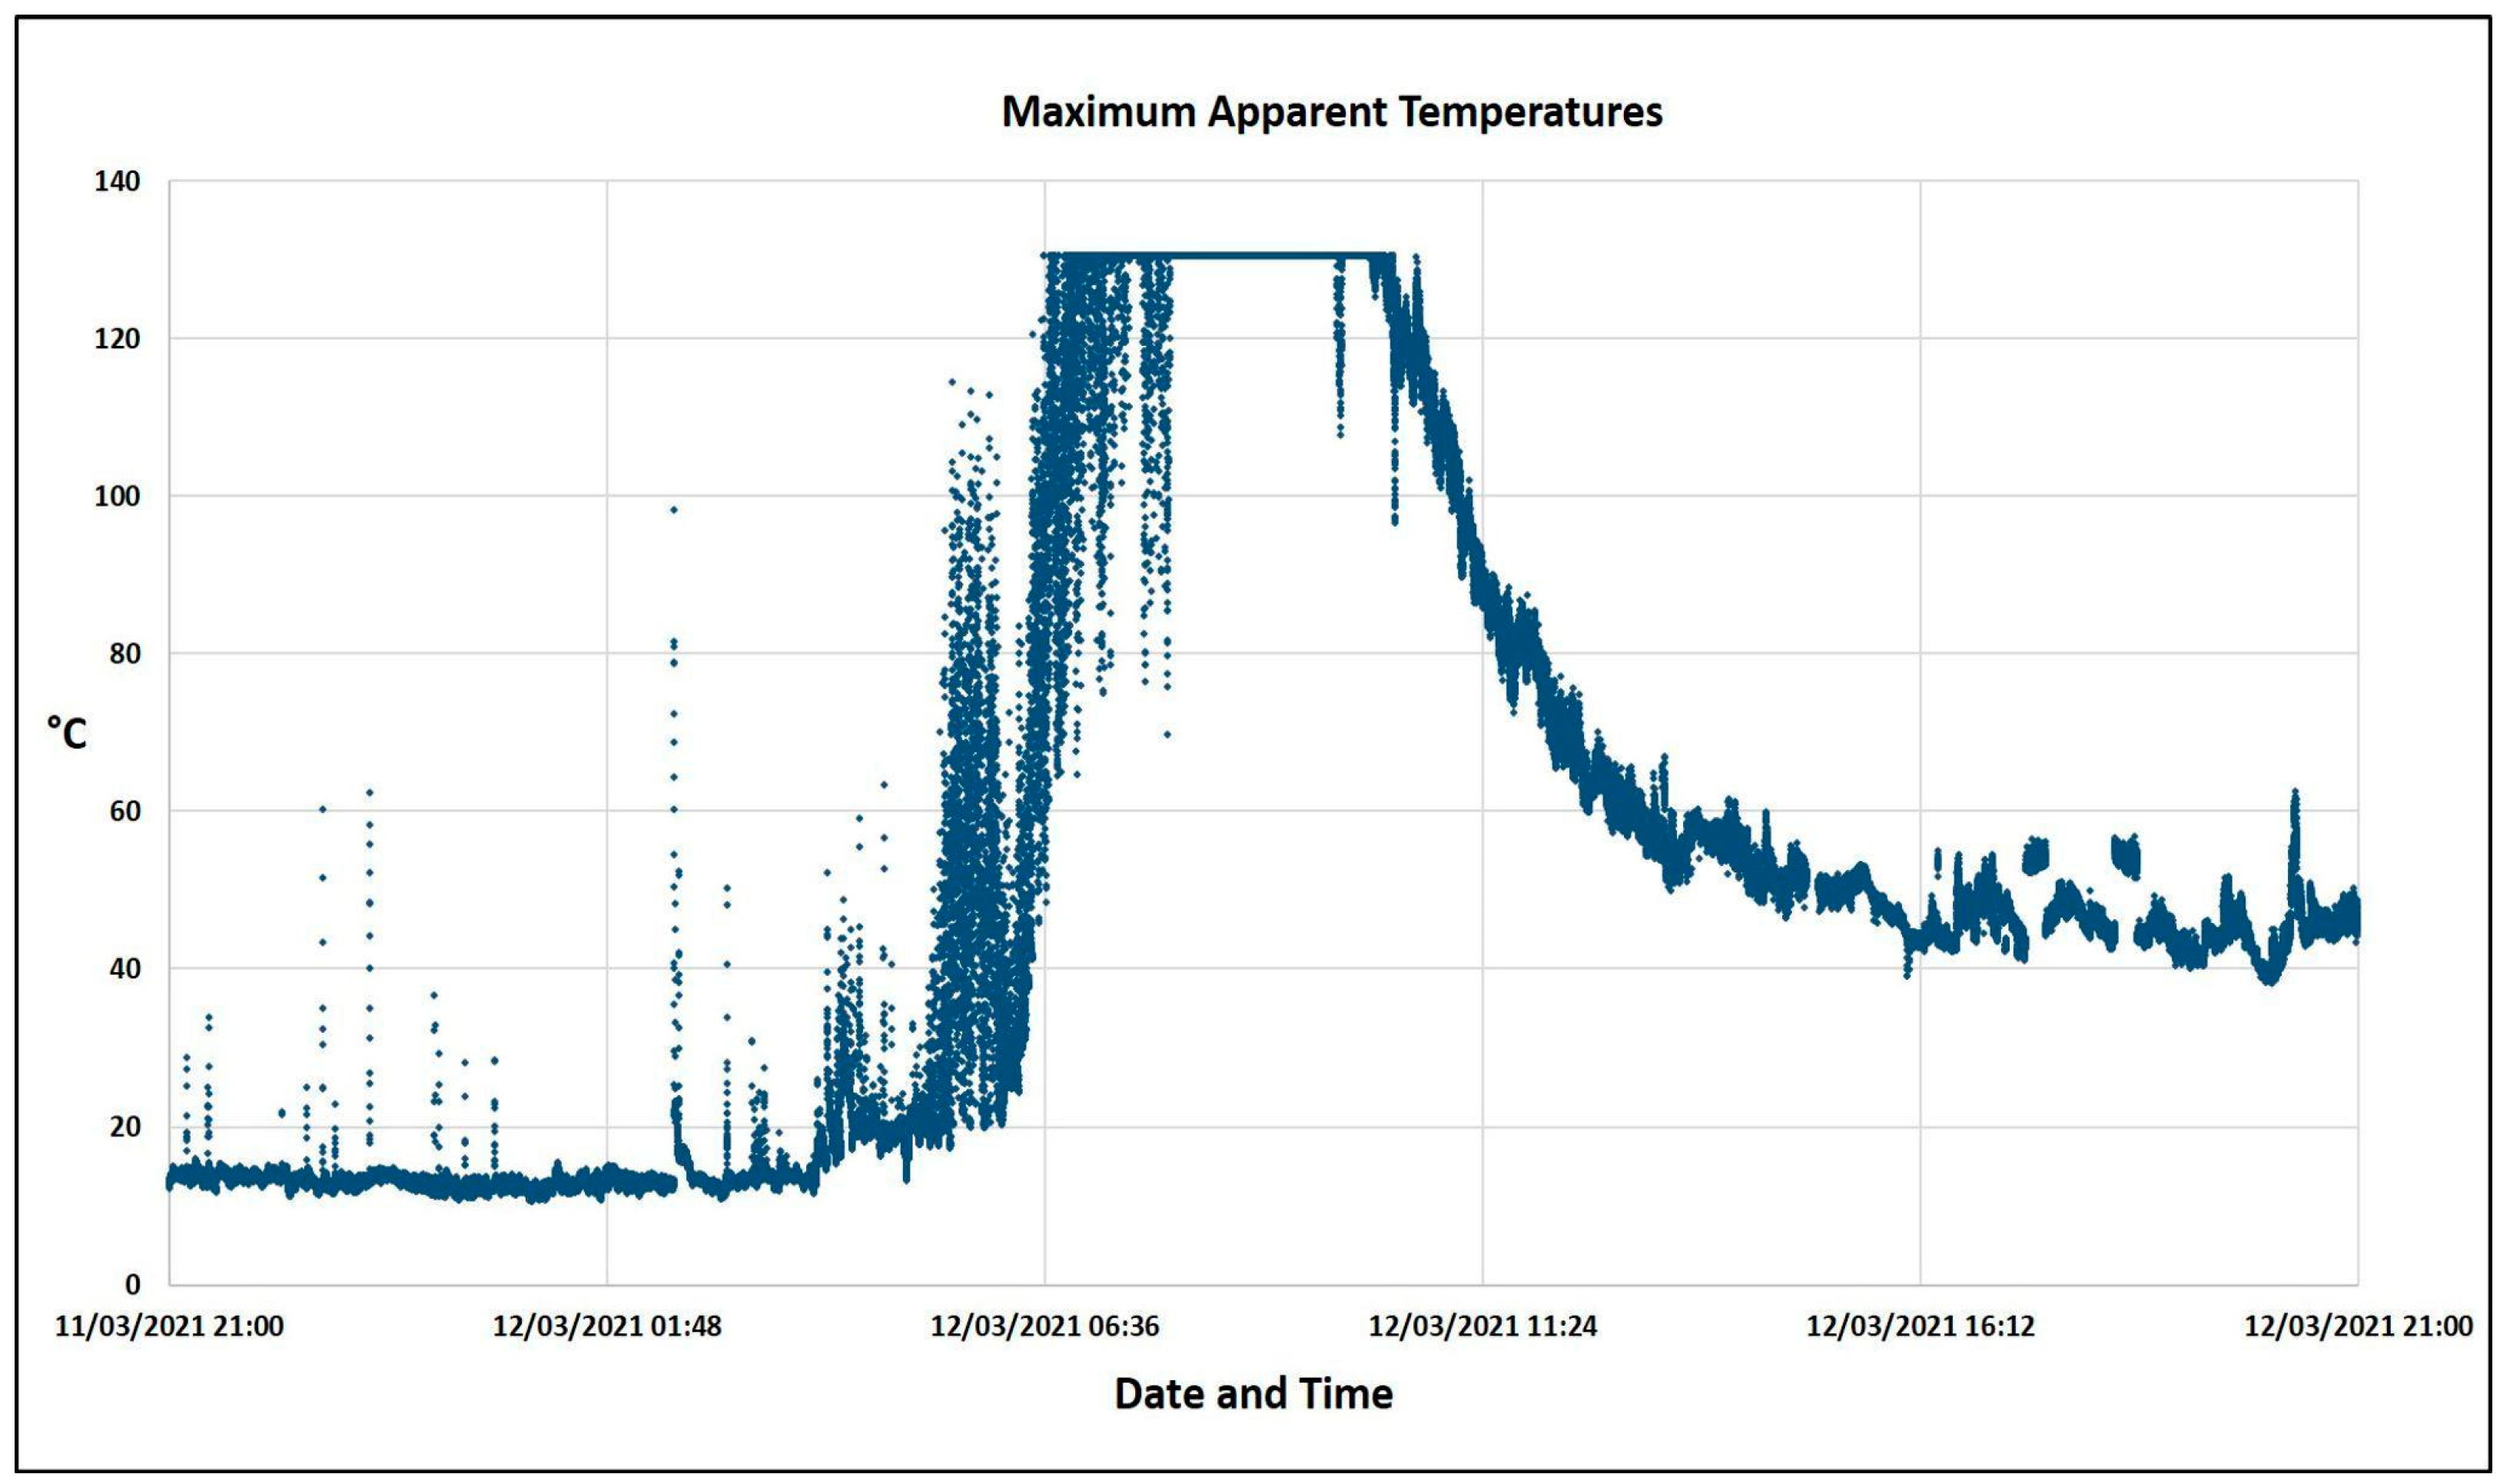
The tool calculates, with a median filter, the daily thermal offset and extracts for each measure the difference between the detected value and the dynamic thermal offset. The NewSaraterm also sends messages to the INGV-OE Control Room whenever predefined thresholds are exceeded, alerting on-duty personnel. Figure 8 shows the system’s capability to recognize thermal anomalies in background temperatures due to daily variations. The temperatures displayed in the video frames are significantly lower than the actual target temperatures because of the distance between the location of the thermal camera and the target (Etna summit craters), environmental factors such as air humidity, pressure, air temperature, and the presence of an additional protective lens on the camera [31,32,33]. Furthermore, not all of these environmental and hardware variables can be fully known or quantified under real-time operational conditions. Consequently, the retrieved temperatures represent apparent rather than absolute radiometric values, as they are not corrected for the aforementioned factors. Nevertheless, for surveillance purposes, tracking relative thermal variations is sufficient to detect changes in volcanic activity.
Figure 8.
The maximum apparent temperatures acquired by this thermal camera. Note that maximum temperatures during the most intense activity are below the cut-off threshold of 130 °C. This depends on the temperature range selected on the thermal camera.
3.3. Quantitative Monitoring of Lava Fountains
In order to derive the mass eruption rate (denoted as QM), we apply the Surface Flux Approach (SFA). This method physically relates QM(t) to the normal exit velocity vex(t) of pyroclastic material, the mixture density ρx, and the crater surface Sc, which is assumed to be circular [33,34]:
QM(t)≃ ρx · vex(t) · Sc (kg/s)
Etna volcanic plumes are generally characterized by ρx with a fractional gas content of 2–3% [27], assuming a gas density ρg of 0.10–0.20 kg/m3 and a magma density ρm of 2500–3000 kg/m3 [35,36]. We computed a ρx value of ∼15 kg/m3. For a crater featuring a cylindrical conduit with a cross-sectional area Sc = πrv2, the radius rv can range between 5 and 30 m with an uncertainty of ∼10% [14,27]. To derive the normal vex(t), we apply a temperature gradient algorithm on the thermal infrared frames acquired by the ENT and/or EMOT cameras. This allows us to first identify the height of the Incandescent Jet region (HIJR), assumed as a proxy for the height of the lava fountain, and subsequently derive vex(t) using the Bernoulli equation [35], evaluating an uncertainty of 10%. Integrating QM(t) in the time range of eruption observed by the thermal camera, we derive the Total Mass MT:
The Tephra volume VT of the eruptive plume can be computed by applying the relation described in [22] to thermal images:
where D denotes the total duration of the explosive eruption as detectable by thermal cameras. We deduce the same quantity by analysing the ratio:
VT − ENT = vex(t) · Sc · D (m3)
VT− SFA = QM(t)/ρx (m3/s)
The Total Volume VTot is obtained by integrating VT over the eruptive interval considered:
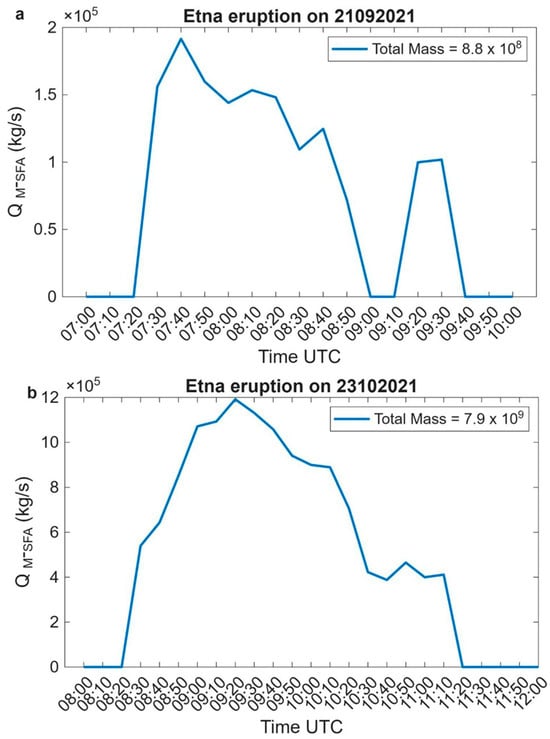
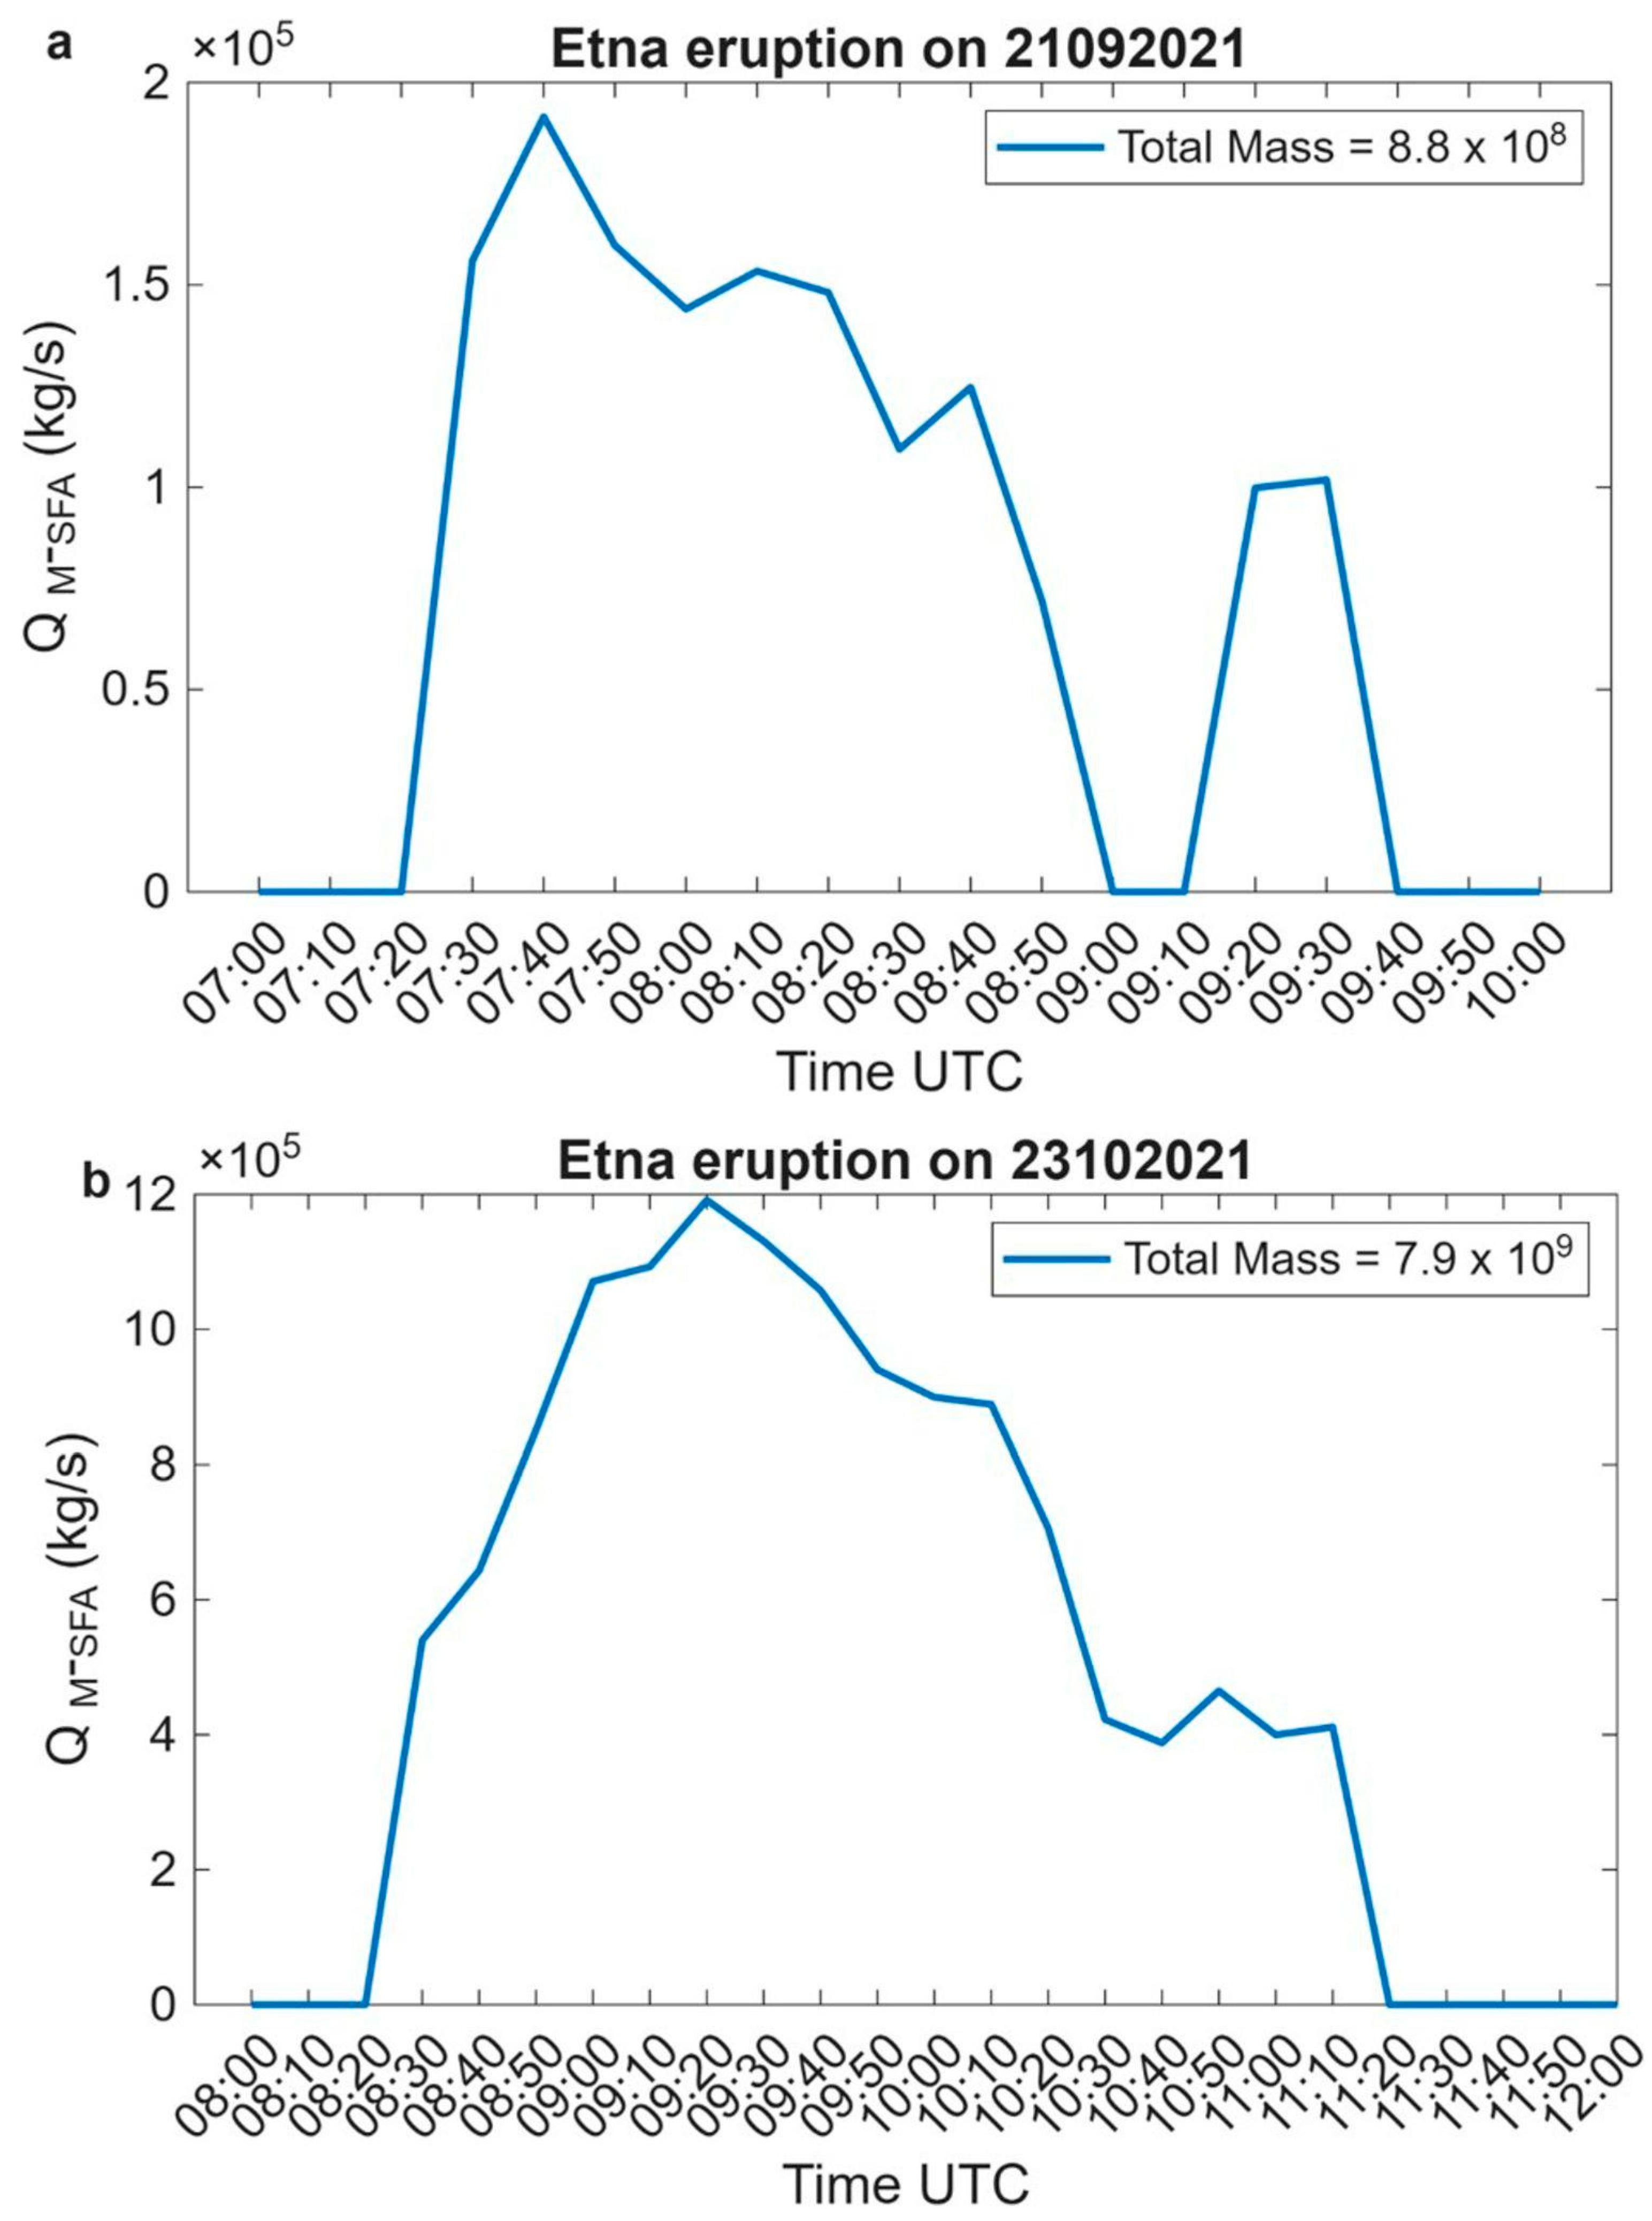
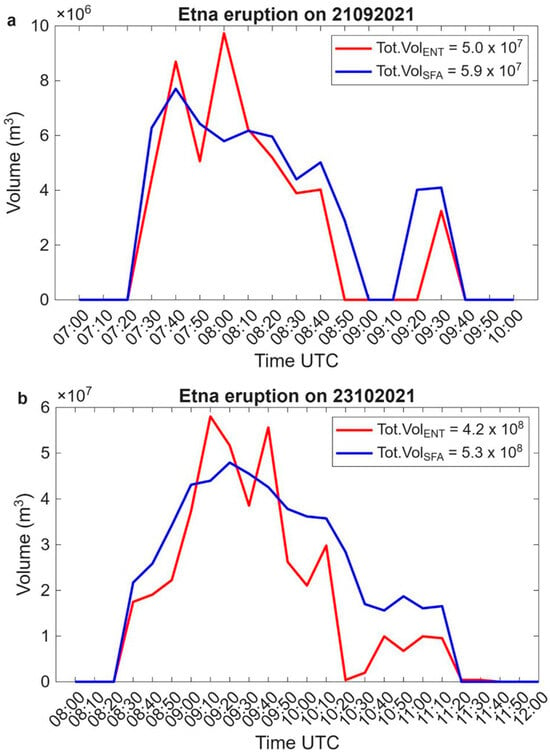
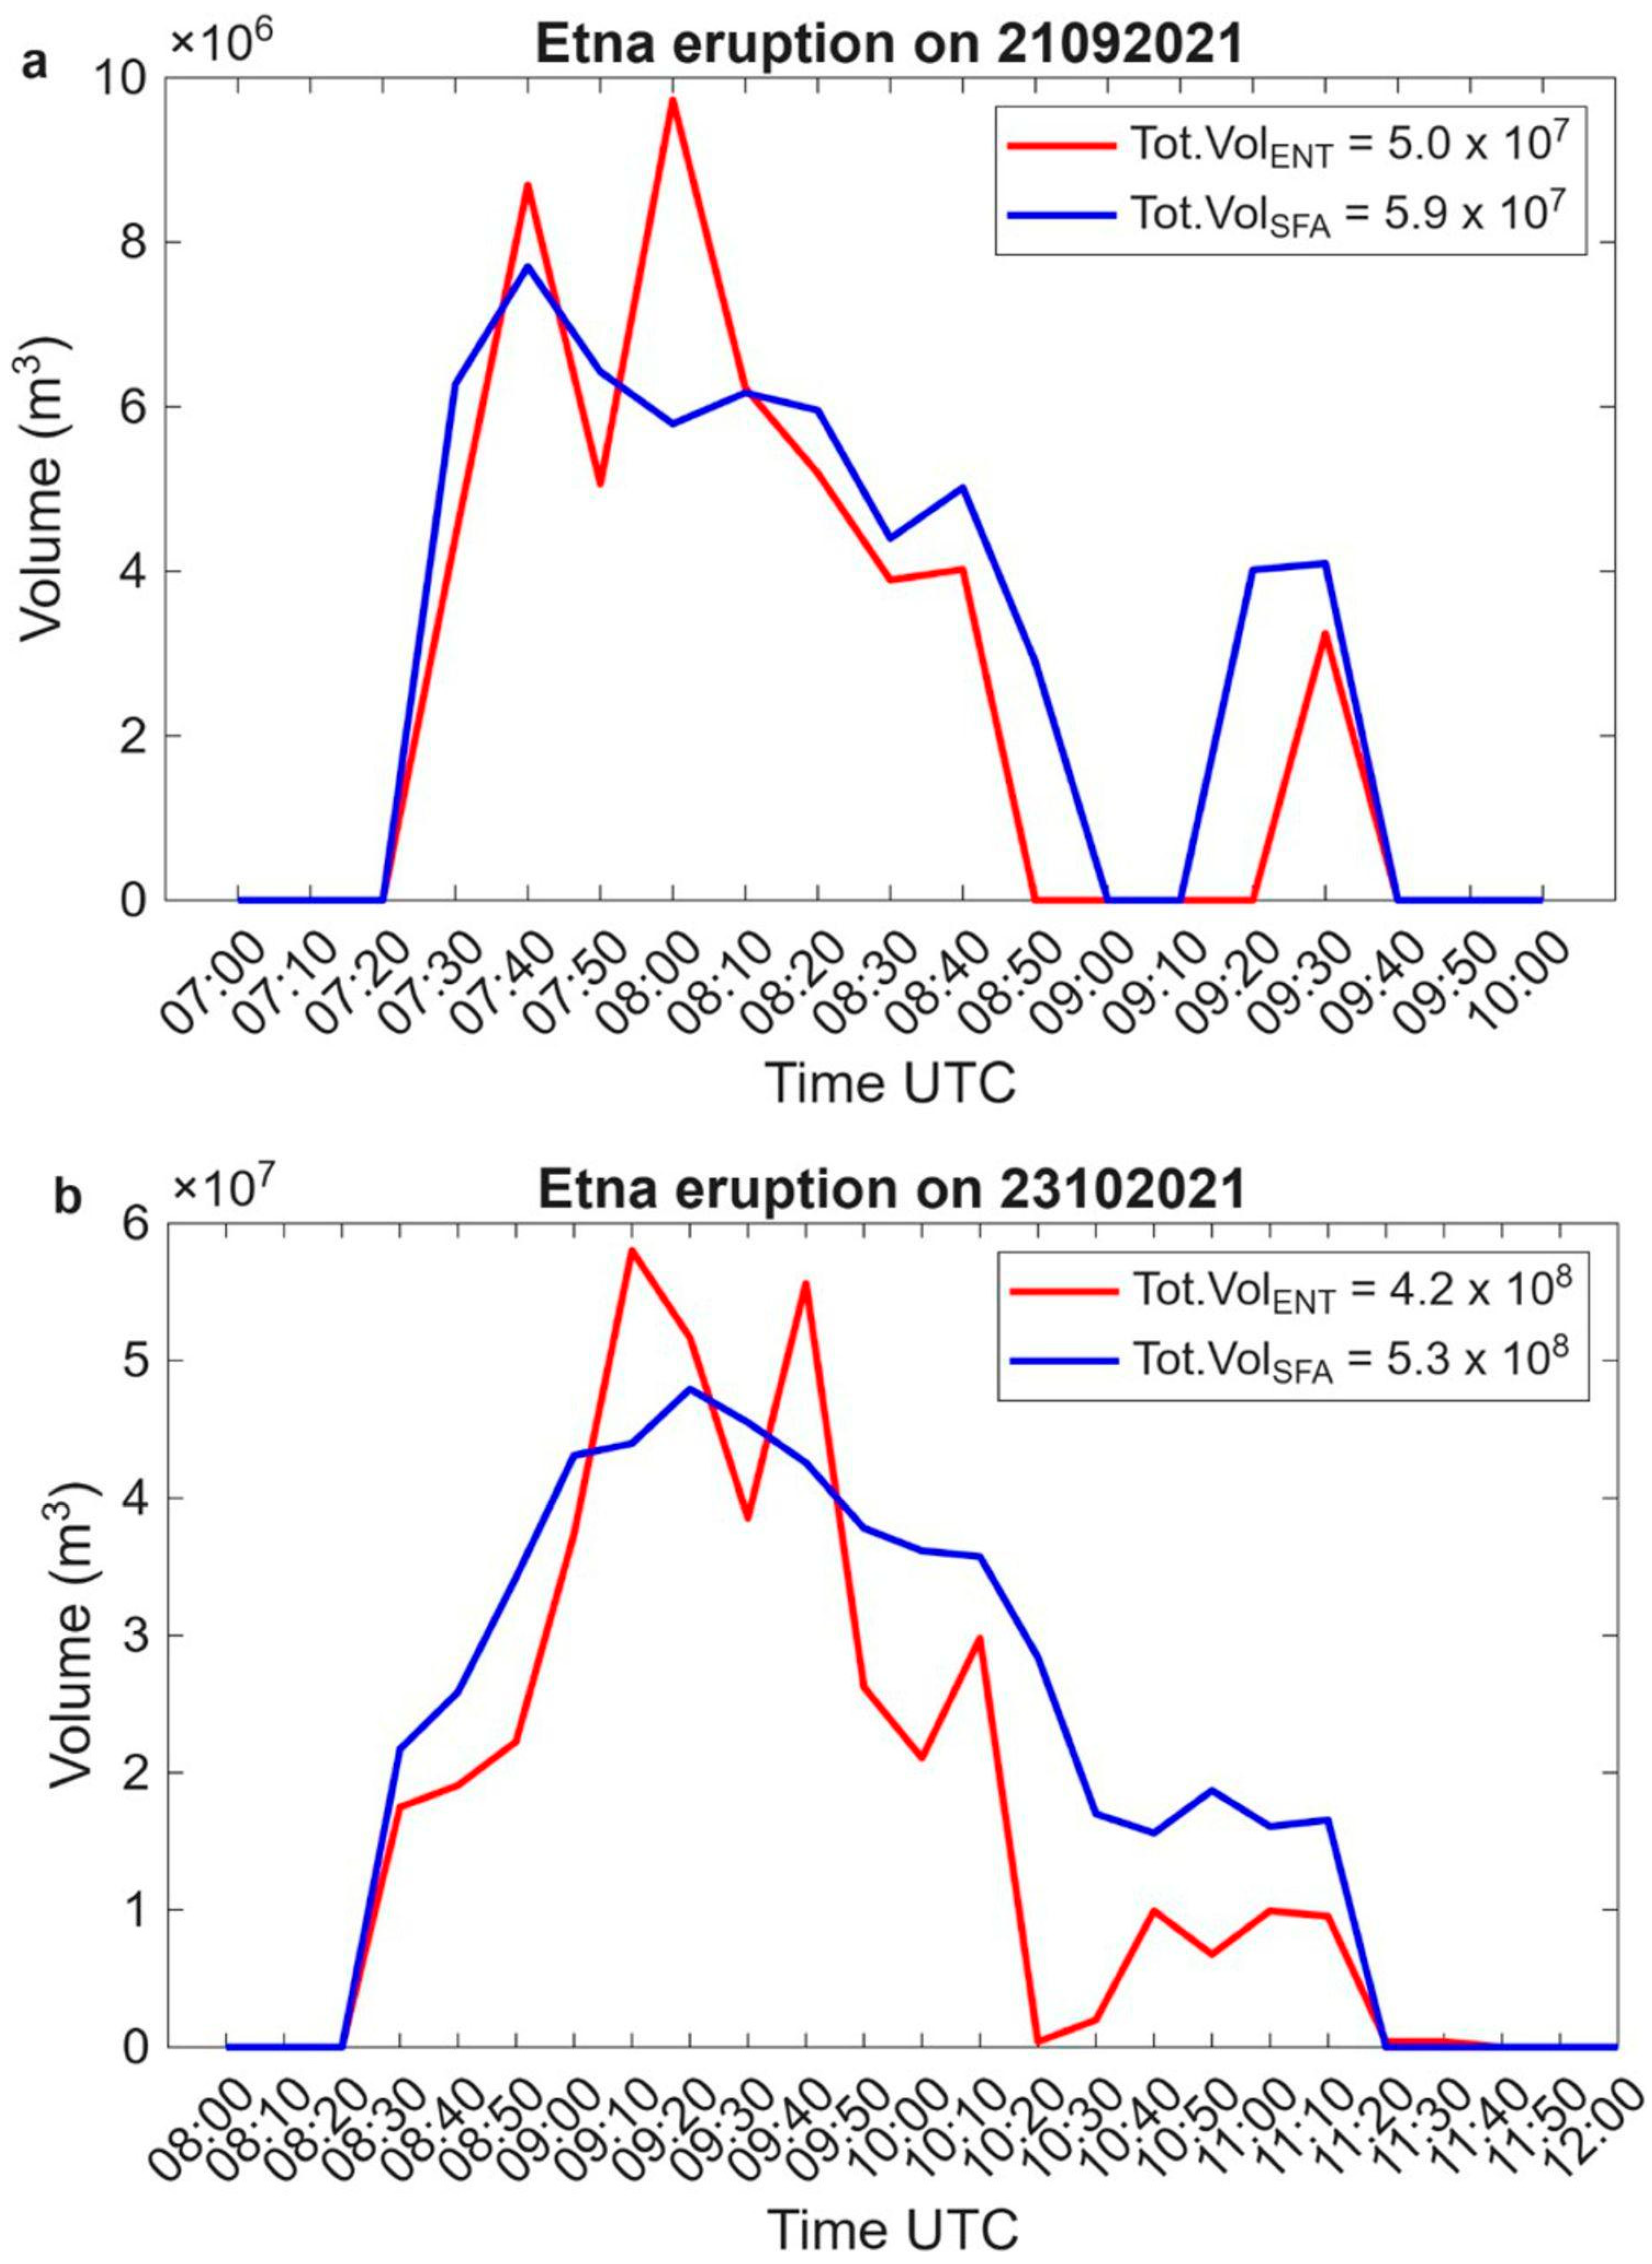
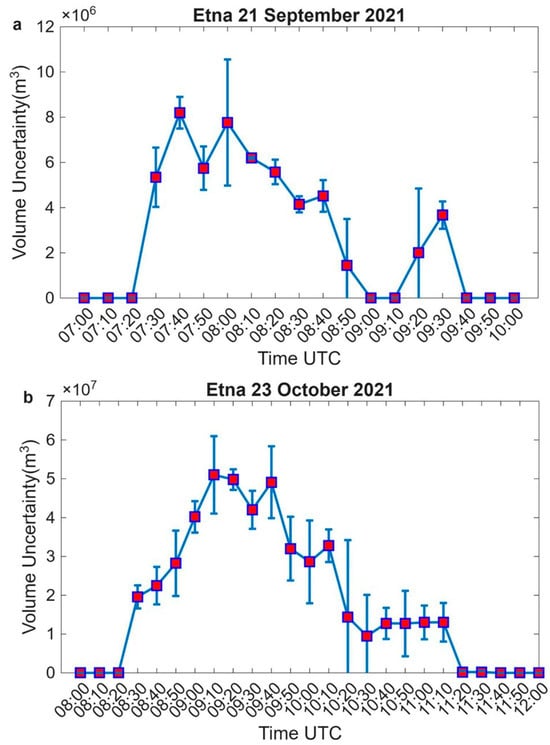
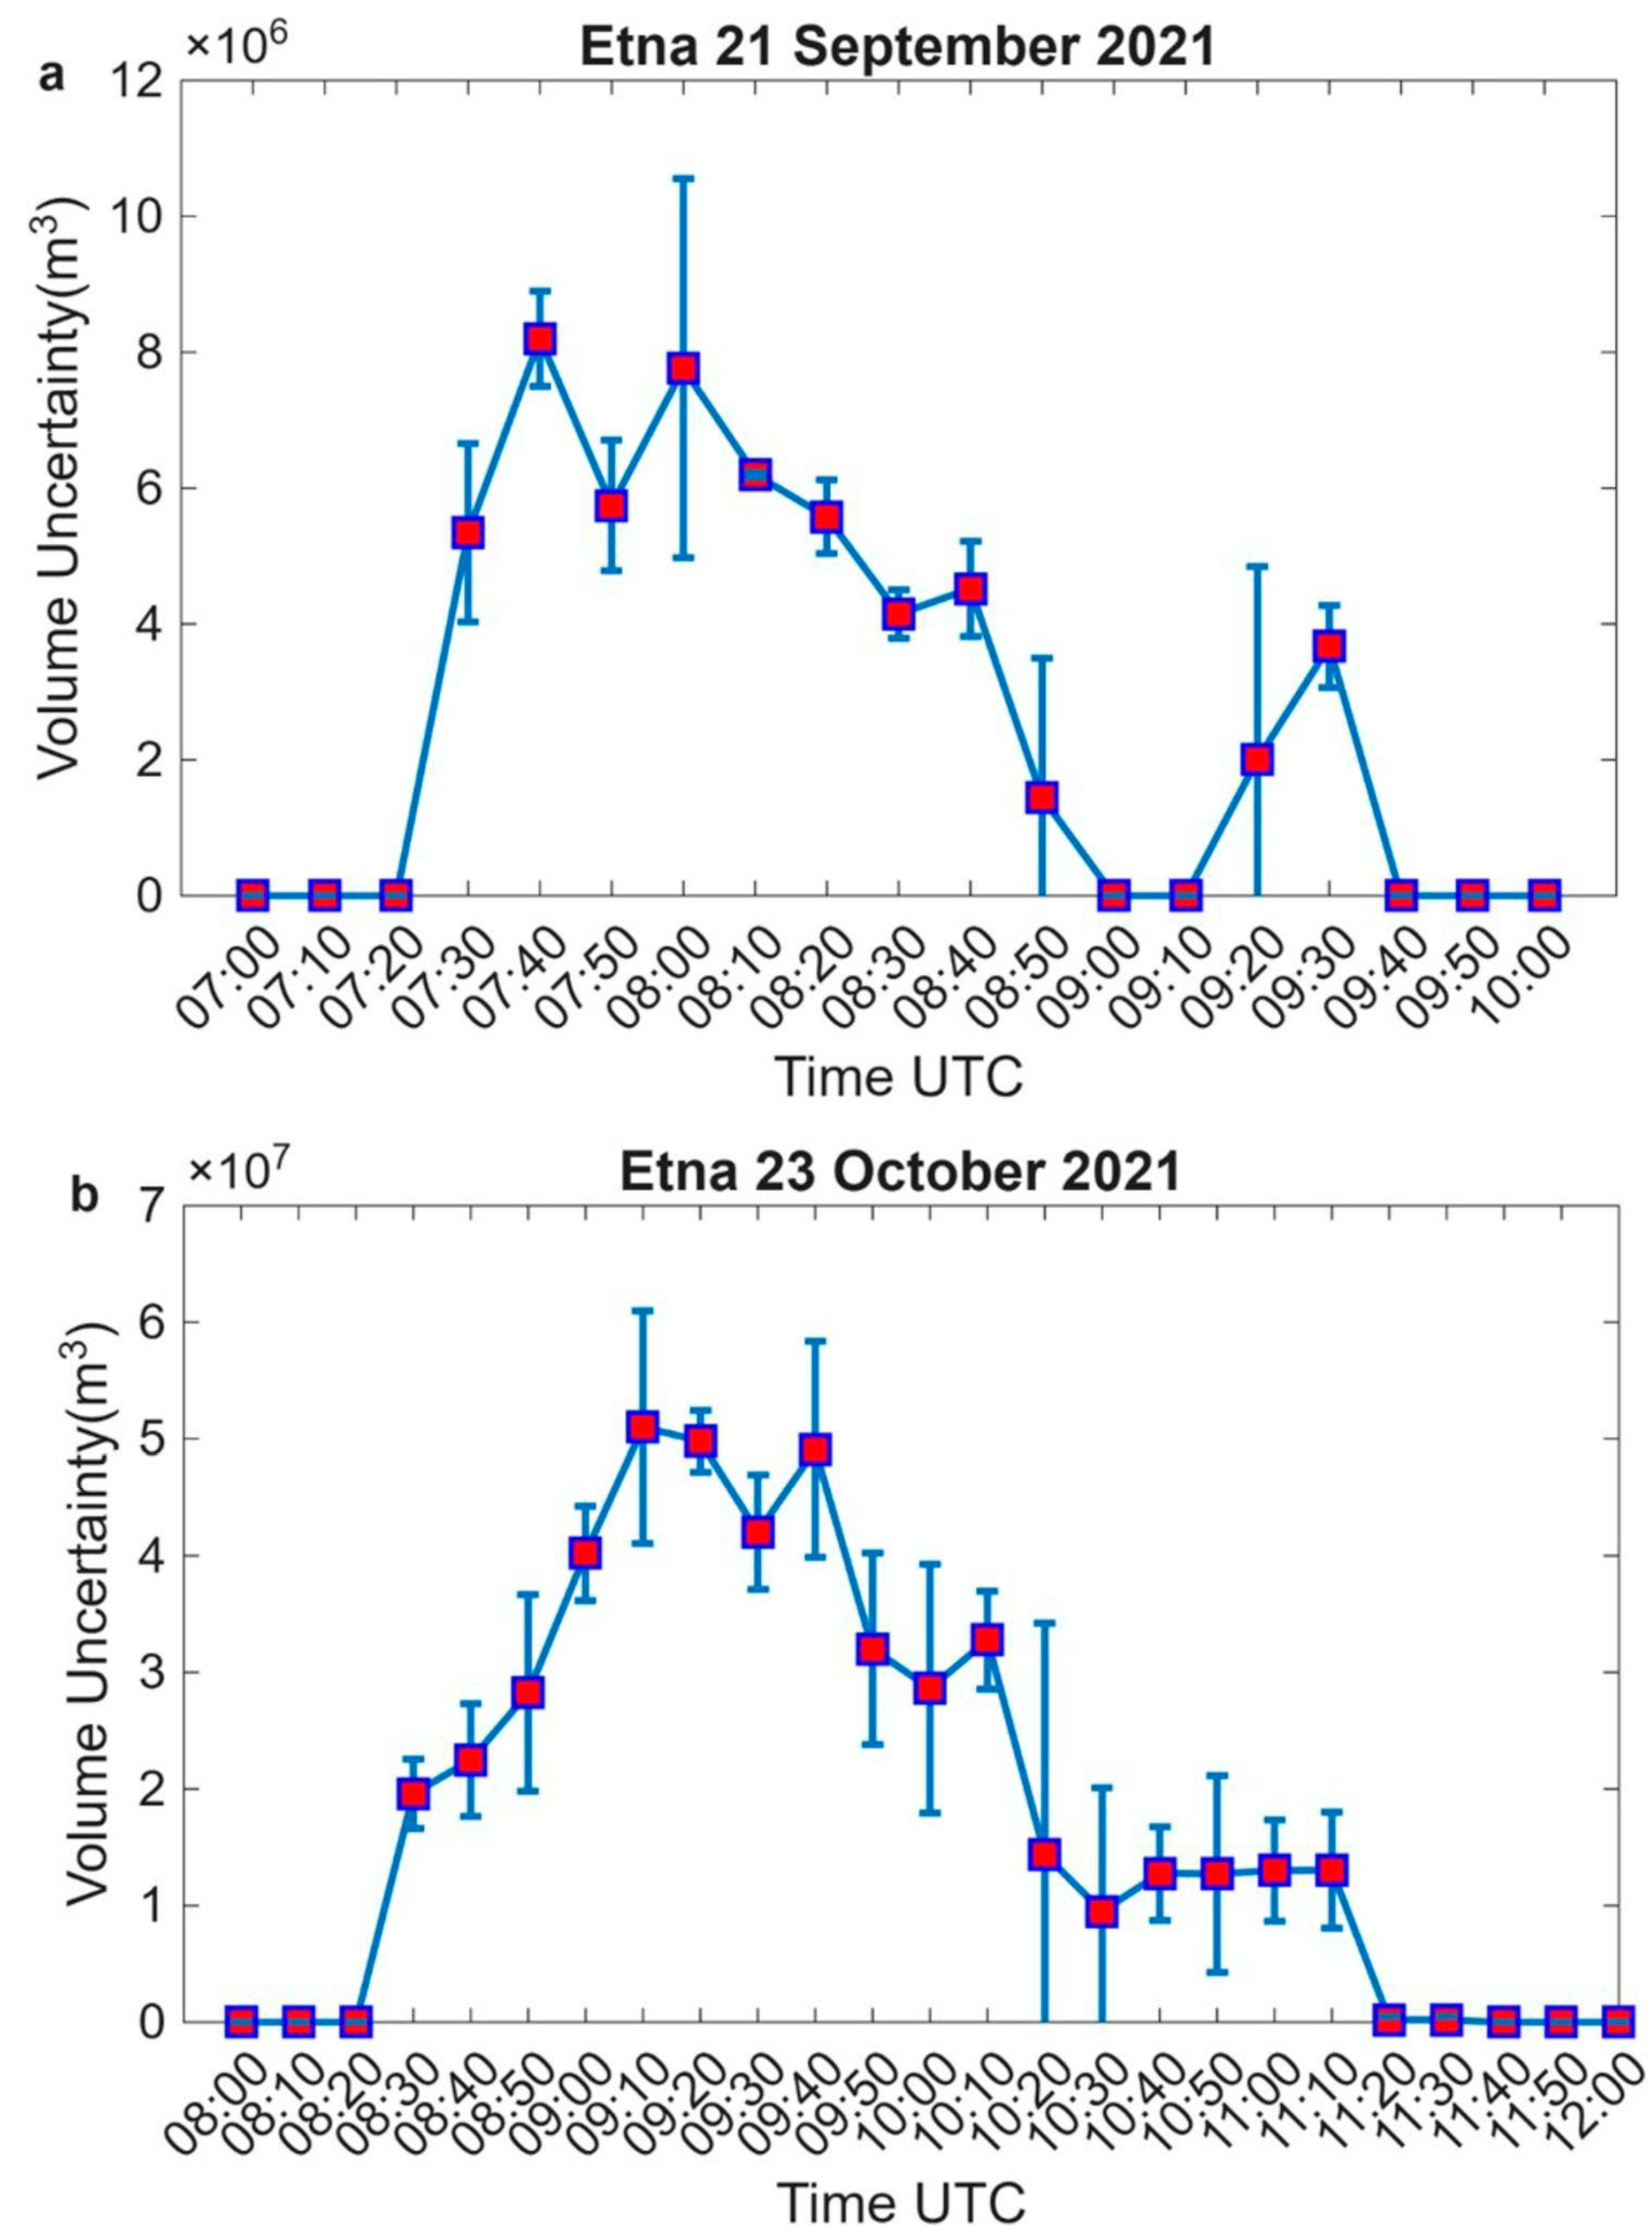
In the following figures, we show the results of the previously described relations. We analysed two Etna eruptions that occurred on 21 September and 23 October 2021. Figure 9 shows the trend of QM(t) as computed using Equation (1), with peaks of 1.9 × 10⁵ kg/s at 07:40 UTC and 1.2 × 10⁶ kg/s at 09:20 UTC, respectively, for the Etna event on 21 September (Figure 9a) and 23 October (Figure 9b) 2021. Following Equation (2), the estimated TM values are approximately 8.8 × 10⁸ kg and 7.9 × 10⁹ kg, which are in agreement with the QM estimates. By accounting for independent maximum errors in mixture density, crater radius, and the height of the incandescent region, the relative error was estimated at 31.6% [36]. Figure 10 shows the overlap between the VT curves derived by applying Equation (3), with the red line, and Equation (4), with the blue line. Each panel reports the VTot value computed with Equation (5), highlighting that the estimated volumes are in agreement in terms of their order of magnitude, 107 m3 and 108 m3, respectively. We also evaluate the statistical trend (Figure 11) by computing the mean and standard deviation between VT estimates, highlighting a variability within +/− 5 times the estimated value.
Figure 9.
Time series of QM (kg/s) retrievals deduced from SFA methods on 21 September and 23 October 2021, (a) and (b) respectively.
Figure 10.
Time series of VT derived from ENT frame analysis (red line) and from the QM -SFA (blue line) on (a) 21 September and (b) 23 October 2021, respectively. In each panel, in the upper box on the right side, the total volume value for each approach is shown.
Figure 11.
Time series of mean volume (red squares) and relative standard deviation (vertical blue bars centered in each red square) on (a) 21 September and (b) 23 October 2021, respectively.
3.4. Plume-Height Retrieval
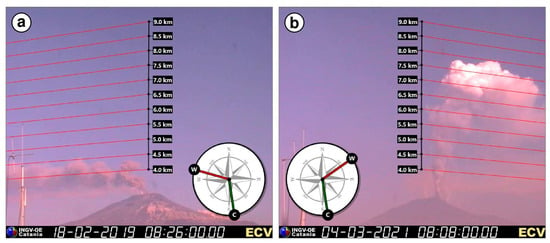
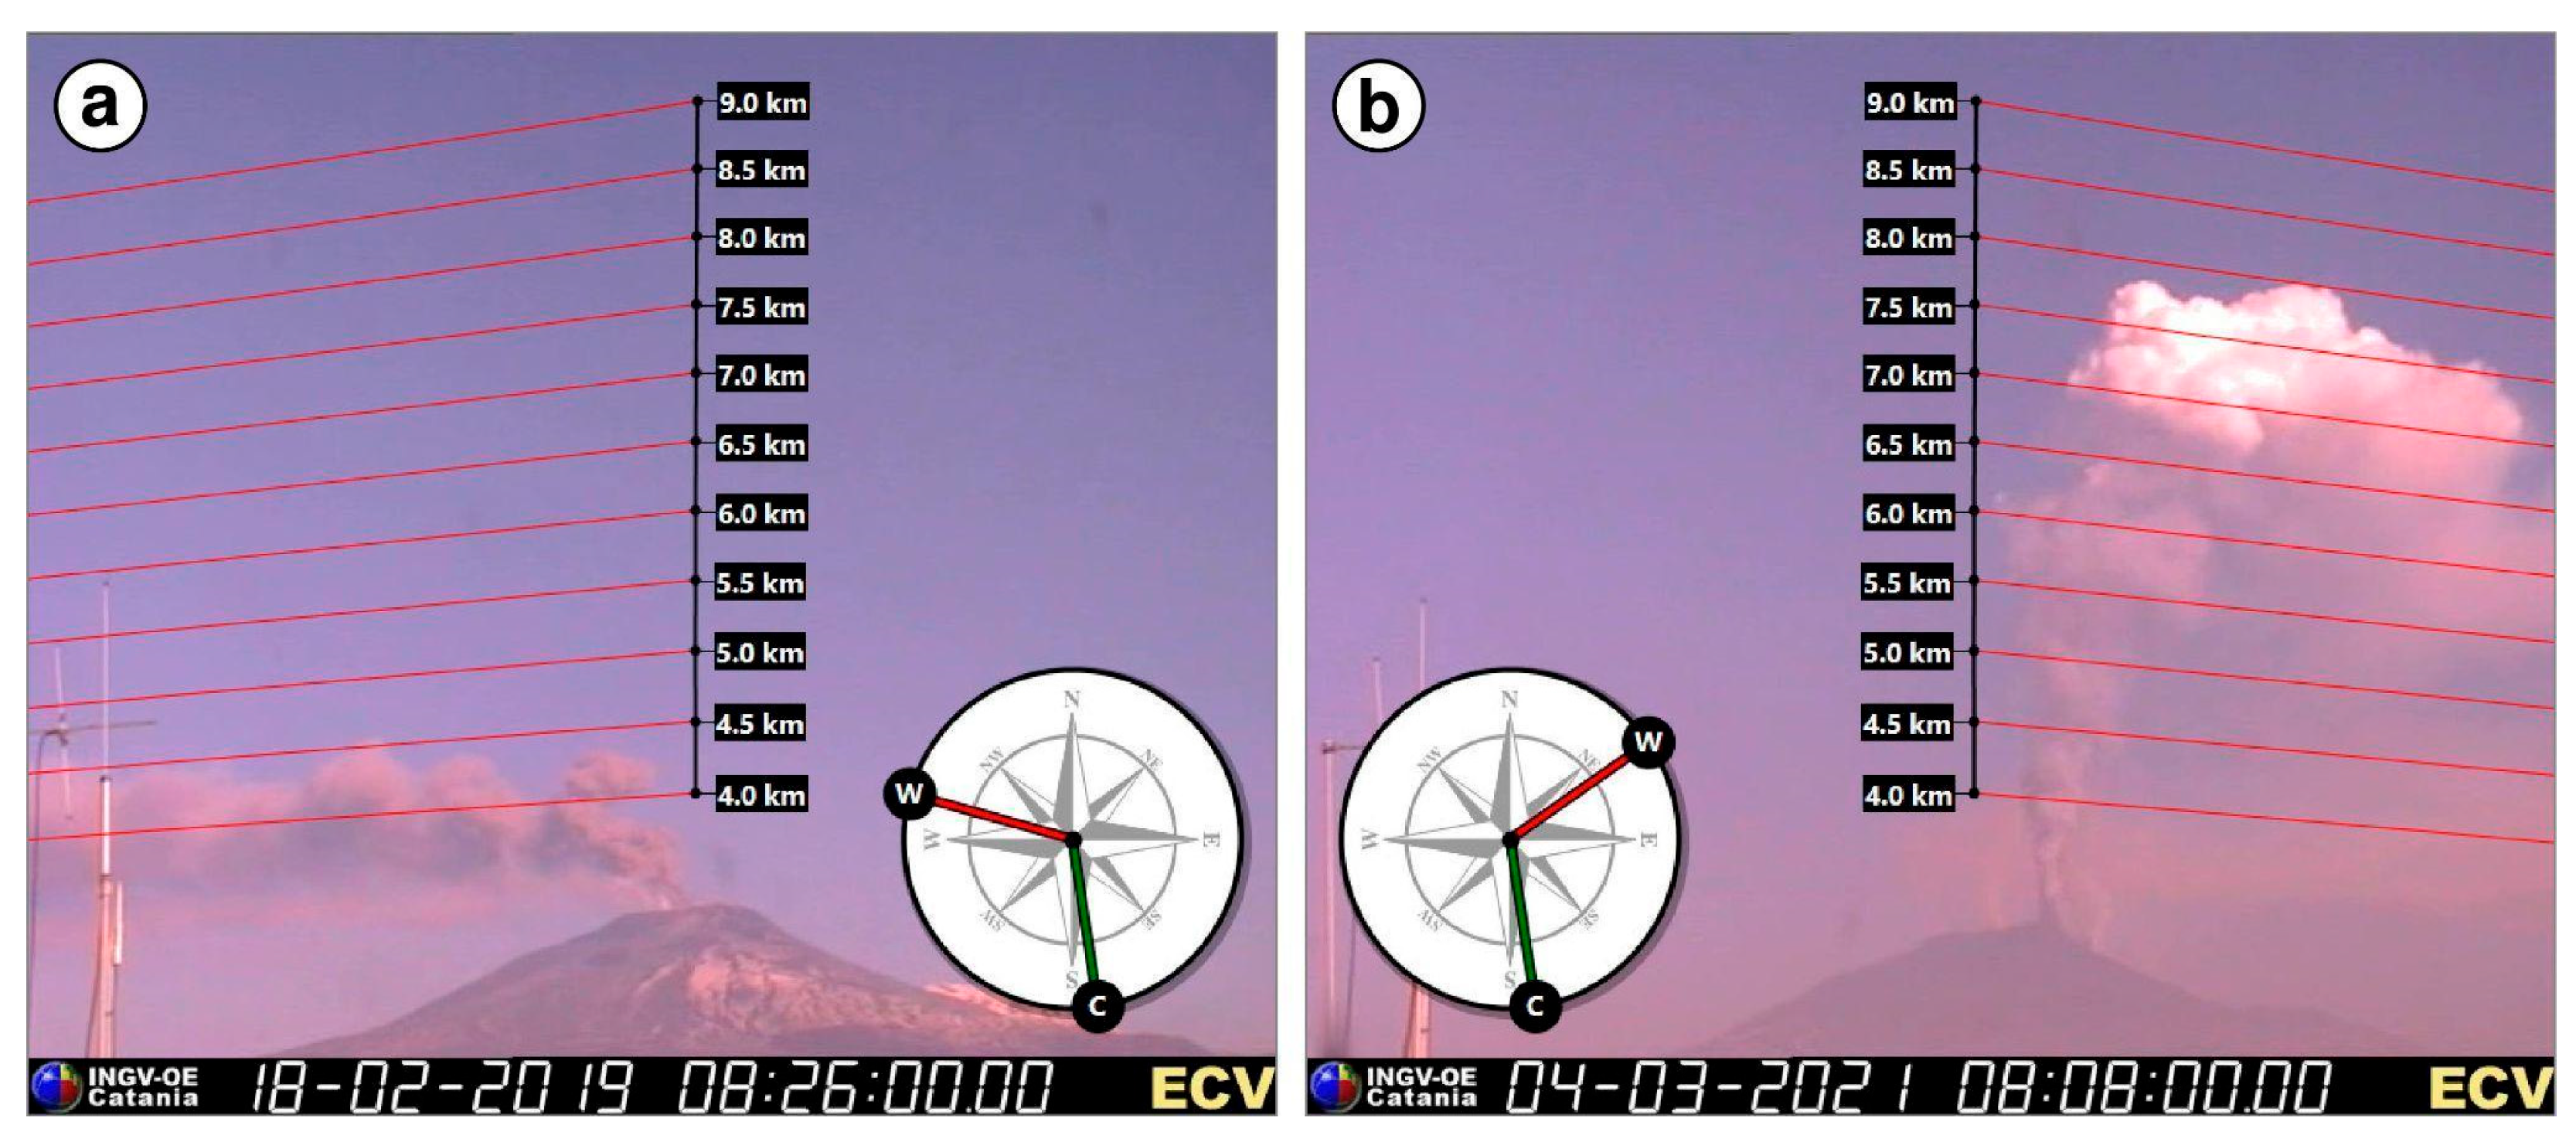
Accurate estimation of eruption column height is fundamental during explosive activity at Etna. Typically, real-time detection is performed using various ground-based instruments, such as visible cameras, weather radar, lidar, and satellite radiometers. Among these, calibrated visible cameras represent the most cost-effective solution, taking into account the prevailing wind directions. A camera-based monitoring approach is extensively employed at INGV-OE, since it is a mandatory component of the VONA messages when the aviation color code is set to red. Those images are available to volcanologists on duty in the INGV-OE control room in Catania (Figure 12). During a powerful lava fountain, when the eruption column exceeds the camera’s field of view (about 9 km for the ECV camera), the eruption column can be estimated using satellite systems. Eruption column heights derived from the camera network during the 2015–2021 period are available in the open-access CIELO database (https://doi.org/10.13127/etna/cielo). Among the recorded paroxysms, approximately 60% of the lava fountain events were suitable for quantitative analysis. The overall uncertainty in column height estimates obtained from the calibrated visible cameras is evaluated at approximately ±10% (or ±0.5 km).
Figure 12.
Image of column height produced during the explosive activity of Etna and obtained from the visible calibrated images available in the INGV-OE control room (a) on 18 February 2019; (b) 4 March 2021.
3.5. Automated Explosion Analysis
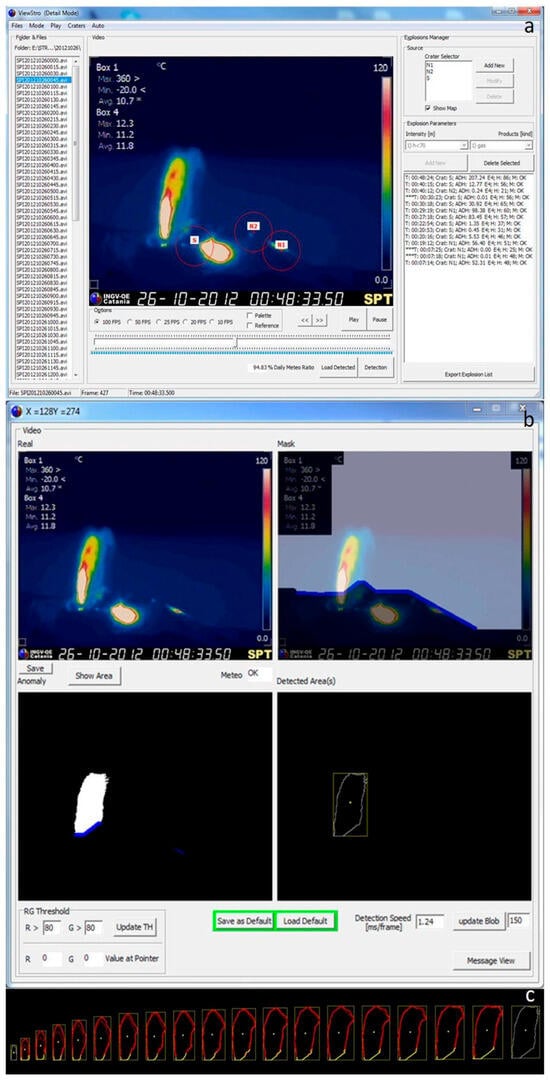
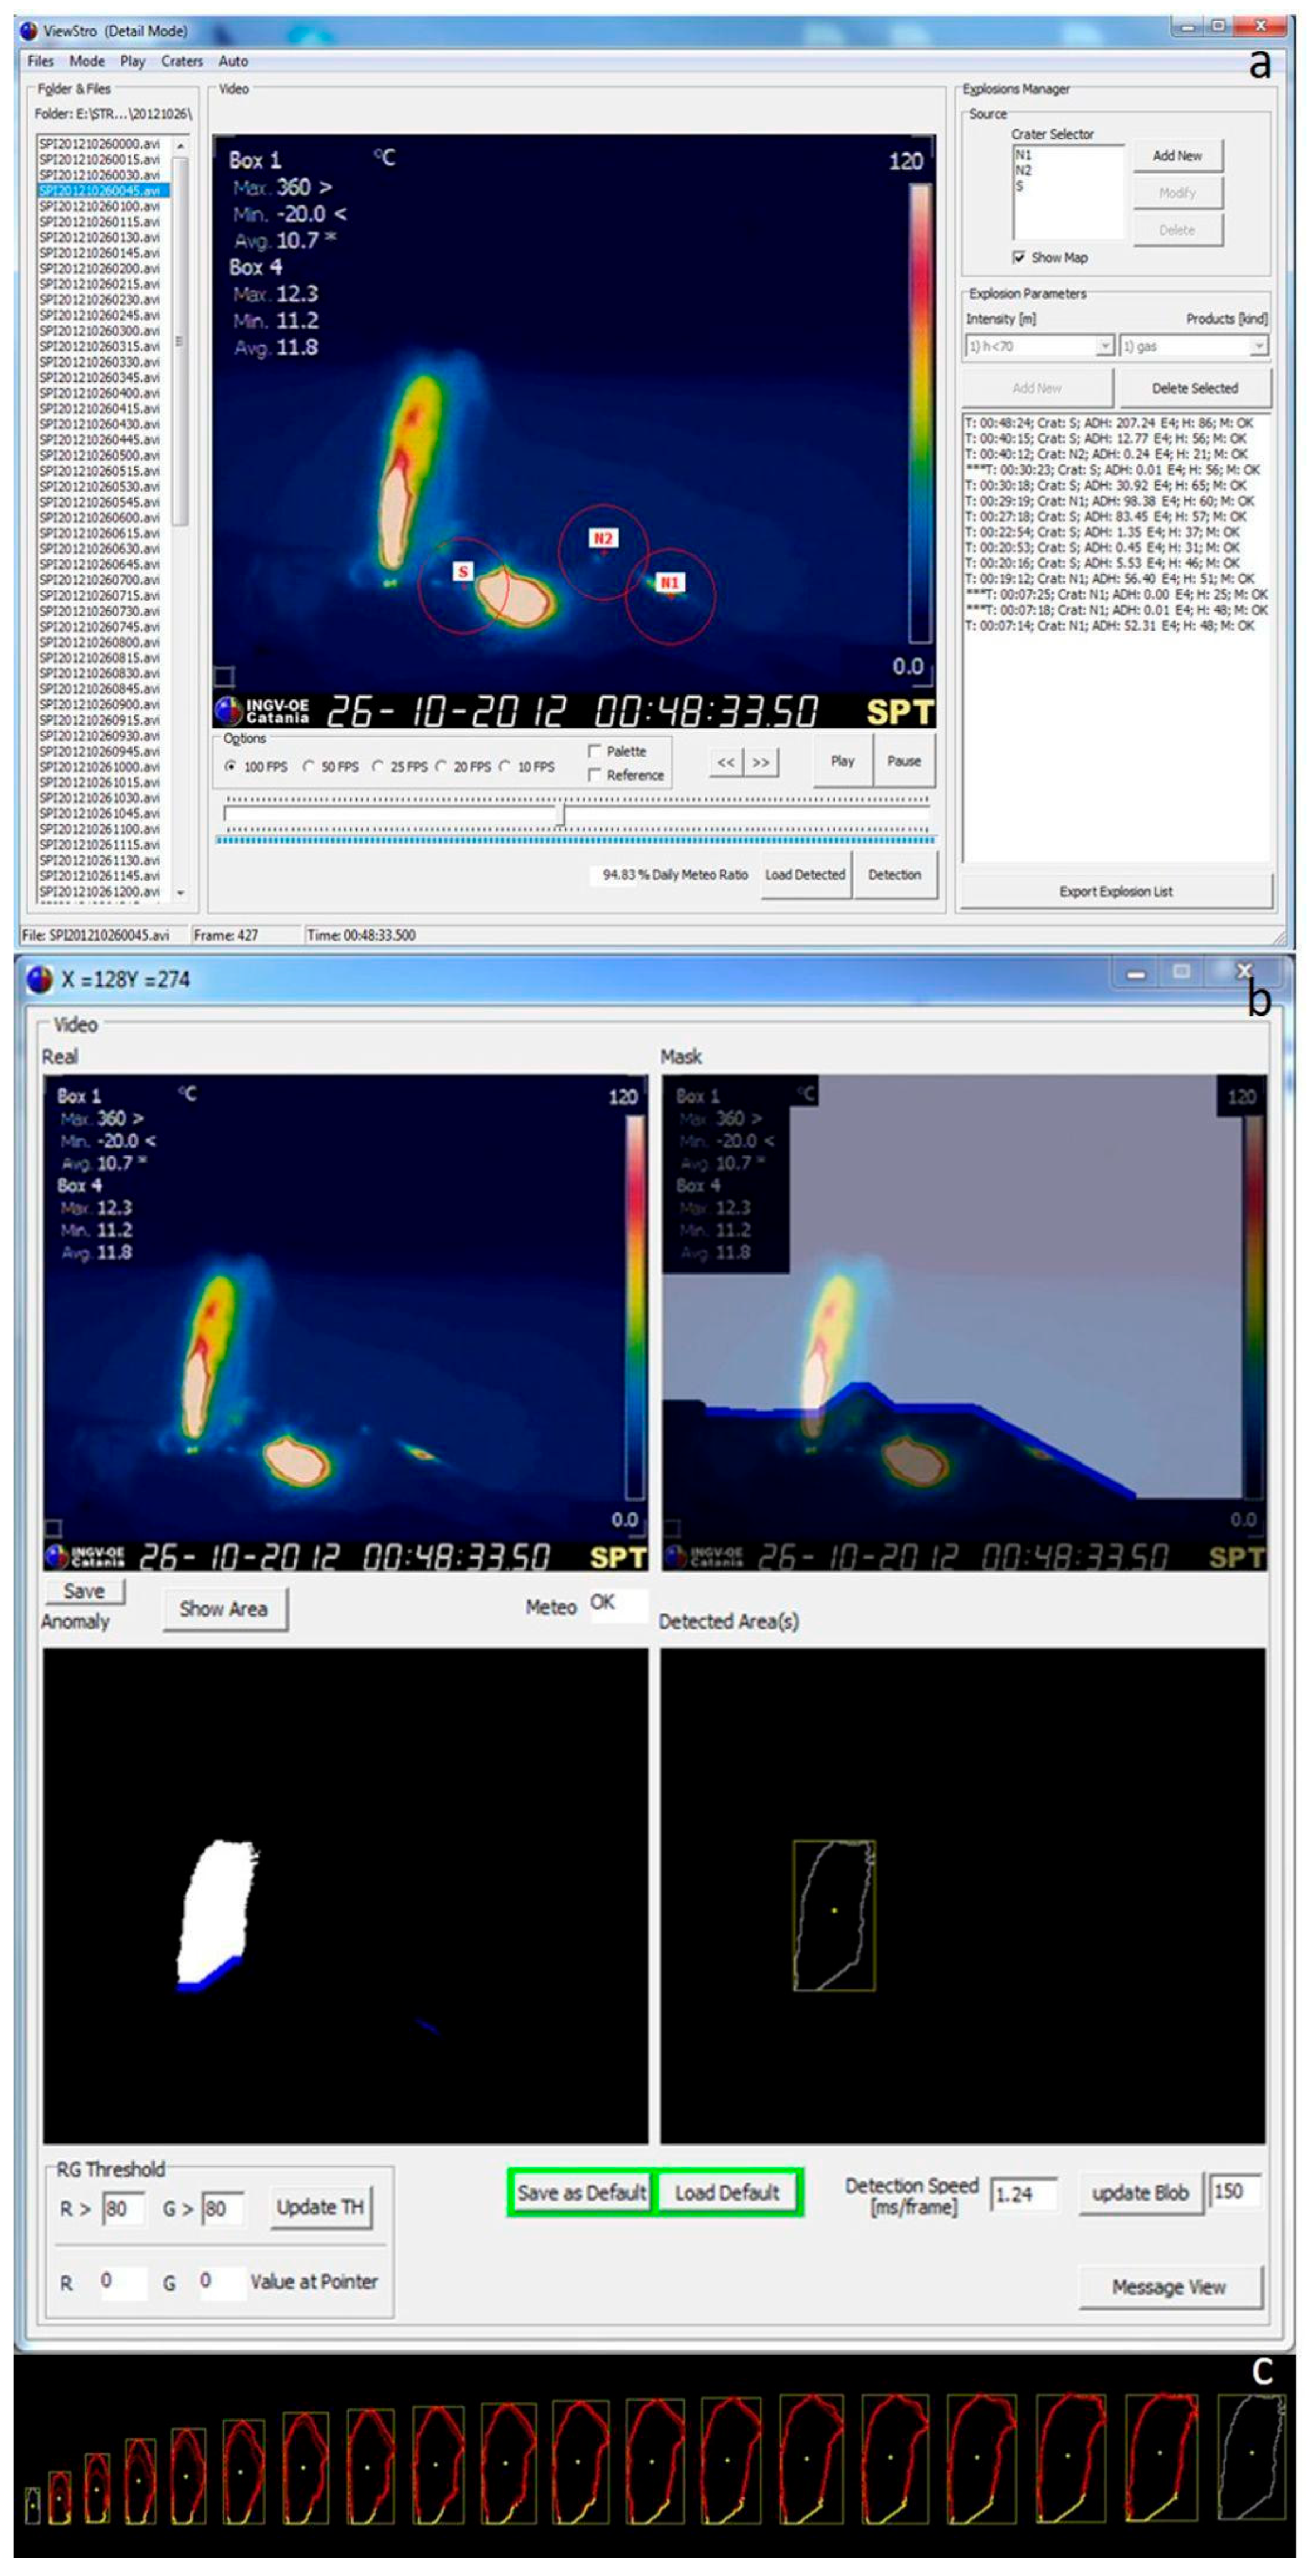
Several methods have been developed to evaluate the explosive activity at Stromboli volcano, observed by the SPT thermal camera. A dedicated tool analyzes the videos and automatically detects all explosions originating from the summit craters, extracting their main features and assigning a reliability grade to the detection (which can be affected by bad weather conditions or lack or failure of the video files). Under good weather conditions, the automated detection rate of explosions exceeding the crater rim is 100%. Each explosion is tracked from its trigger time up to the maximum expansion of the ejected material, which is identified as a thermal anomaly, as shown in Figure 13. The result is a daily dataset that records the following seven features for each event: 1. Trigger Time [hh:mm:ss.zzz]; 2. Source of emission (vent); 3. Duration of the event [s]; 4. Dispersion, that is, the area involved in a thermal anomaly due to the event [px]; 5. Maximum Height of the anomaly [m]; 6. Maximum Width of the anomaly [m]; 7. Frame of maximum expansion.
Figure 13.
Automated detection of an explosive event at Stromboli recorded by the SPT thermal camera. (a) Main software interface; (b) extracted contour and surface area of the explosion. (c) Temporal evolution of a processed explosive event.
A proxy for the energy released during a single event has also been considered. Generally, the majority of the energy related to an explosion correlates with the amount of ejected material, which can be tracked via geometrical parameters. While height and dispersion of the explosions are well-correlated during ordinary low-energy activity, for stronger, less usual, or non-ordinary explosions, the area involved in the thermal anomaly is not accompanied by a proportionate height of the jets. Thus, the dispersion positions itself as a reliable proxy for the mass of the ejected material during any type of explosion.
An additional tool has been developed to link all files over a given period, summarizing their features and plotting the variation in the activity at an hourly temporal resolution. Using this approach, it is possible to continuously quantify both the hourly frequency of the explosions and the dispersion of the involved material. The automatic retrieval (Figure 13) of trigger time, dispersion, and height leads to an automatic quantification of the intensity of the explosions at Stromboli volcano.
3.6. Thermal Monitoring of Fumarolic Activity at Vulcano
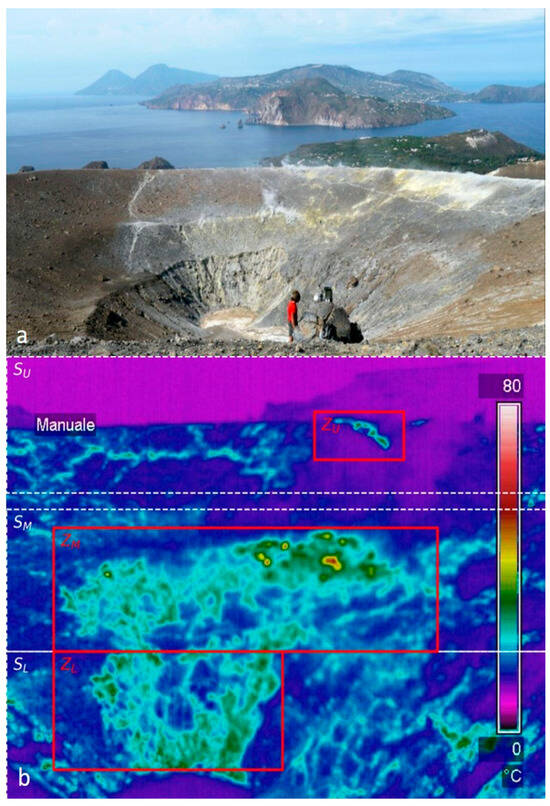
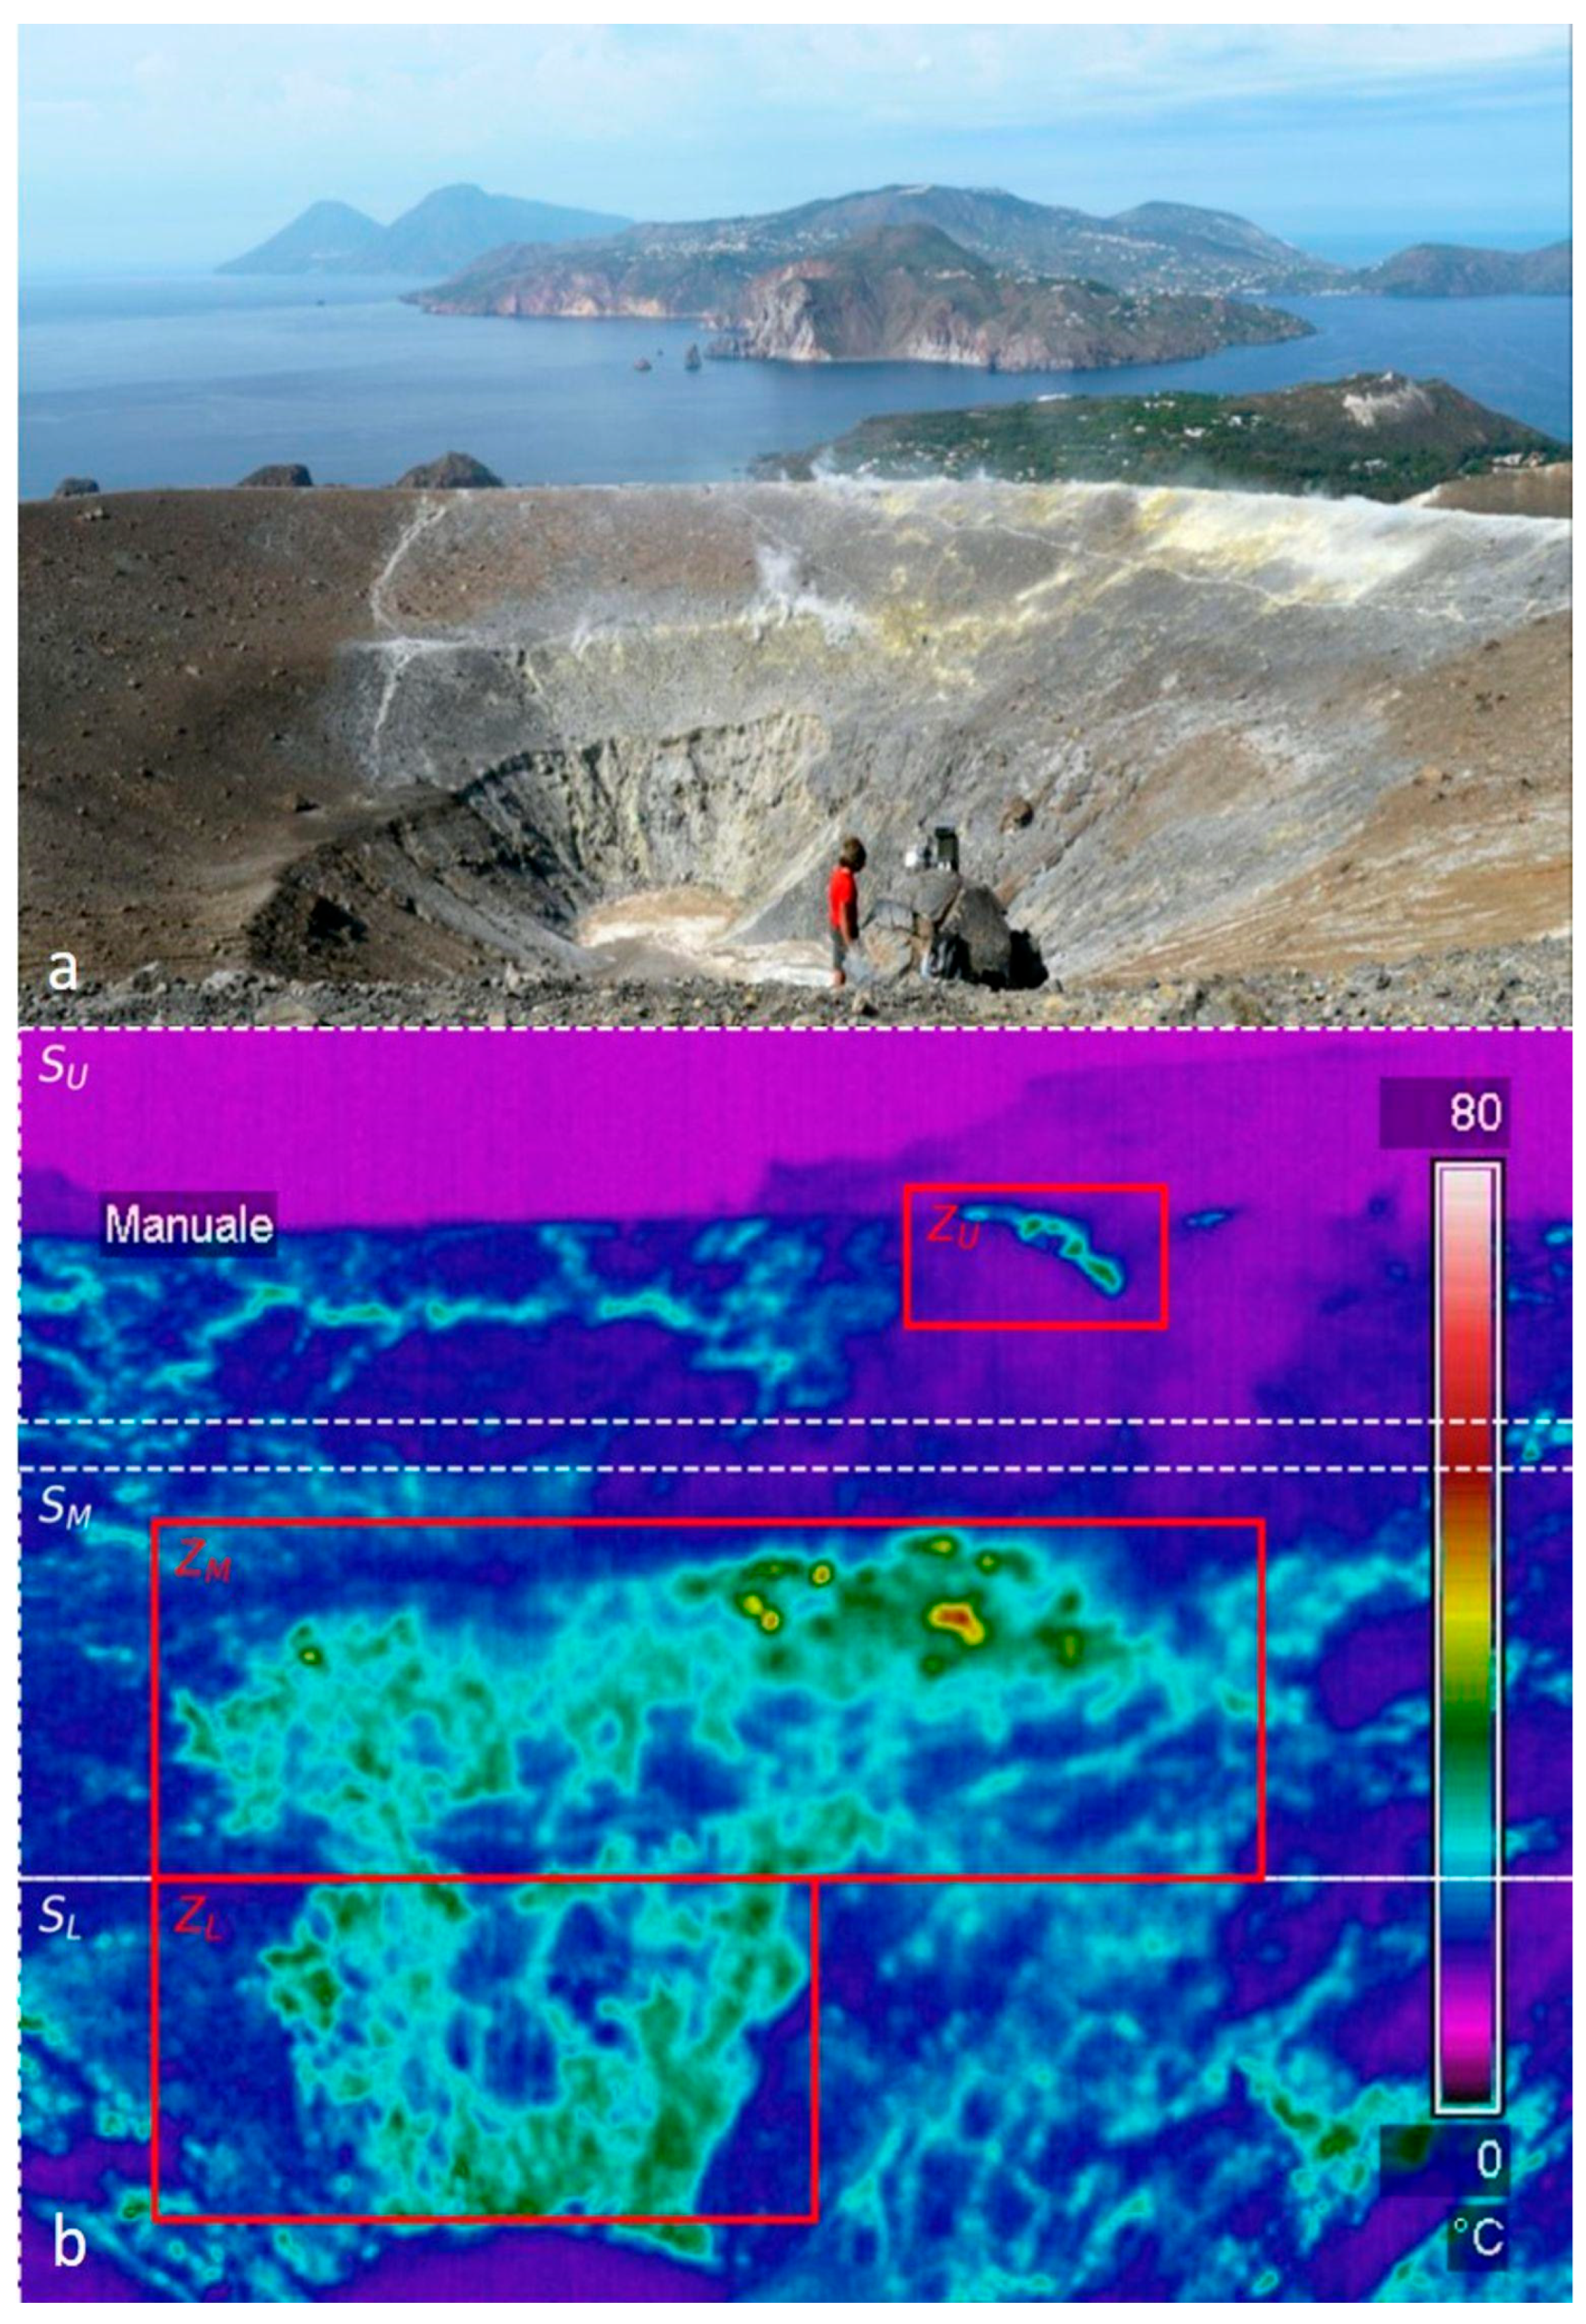
At Vulcano, data acquisition is configured to record 48 radiometric frames per day (one every 30 min). To isolate the pure endogenous volcanic signal from atmospheric interference, each thermal frame is synchronized with local meteorological data. Frames acquired during periods when meteorological data are unavailable, or during high-humidity events (relative humidity > 80%), are automatically discarded from the analysis to prevent signal attenuation caused by atmospheric water vapor. The “La Fossa” fumarolic field is commonly divided into three main zones (the upper, middle and lower zones) shown in Figure 14. When deep hydrothermal flux increases, hot fluids naturally propagate through the surrounding permeable ground, breaching the boundaries of the historical main vents. To quantify the true spatial evolution of the system, a dedicated software suite has been developed. By performing a day-by-day comparison between the apparent temperatures within these fixed fumarole zones and the temperature of the surrounding ground, it is possible to mitigate the instrumental issues related to the thermal sensors, such as the aging of the germanium glass of the covering case of the station [37].
Figure 14.
(a) Photograph of the INGV-OE infrared station installed on the crater rim of Vulcano; (b) Thermal frame illustrating the overlapping spatial discretization scheme designed for software analysis. Solid-colored boxes represent the fixed historical Reference Zones, whereas the broader horizontal bands depict the dynamic Macro-Sections monitored for spatial expansion.
4. Discussion
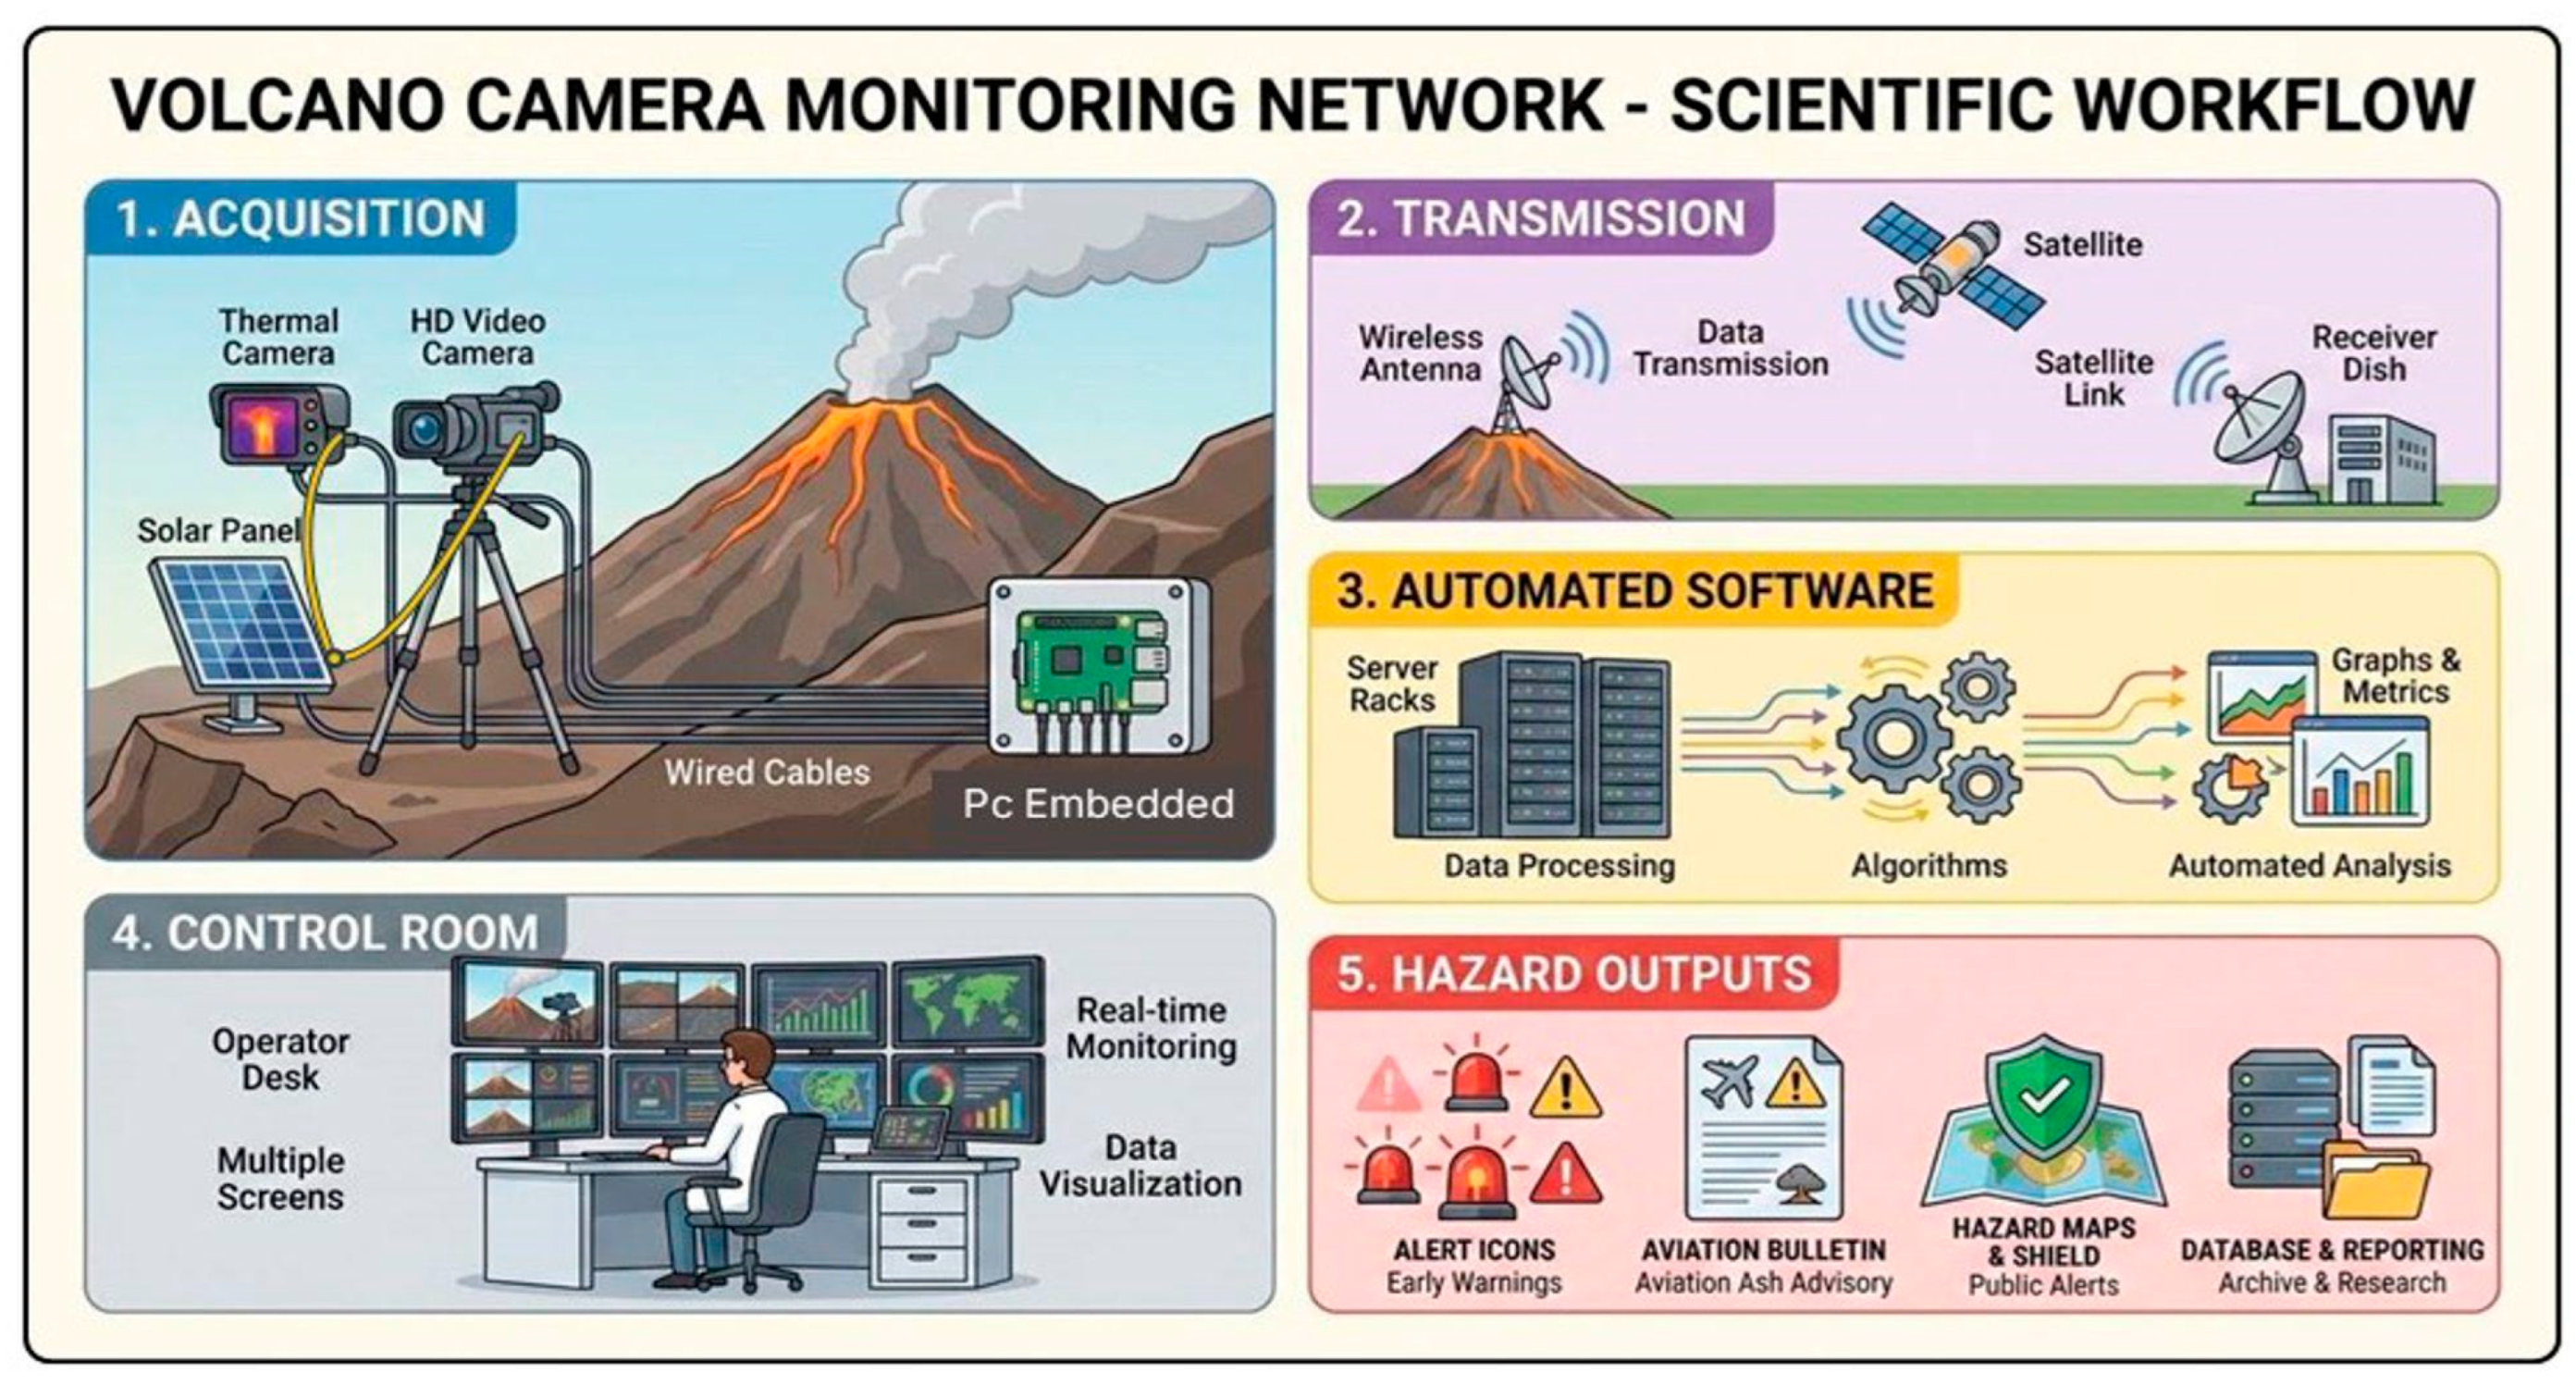
The 32-year evolution of the INGV-OE camera network demonstrates the transition of ground-based imaging from basic monitoring to a fully integrated remote-sensing surveillance infrastructure. Although often used interchangeably, monitoring and surveillance serve distinct scientific and operational purposes, with surveillance specifically focusing on continuous, real-time observation to support hazard management and emergency response. A major milestone in this transition was the shift from analog visible cameras to modern thermal infrared systems [9]. By providing 24/7 observations regardless of daylight, thermal sensors allow on-duty volcanologists to quickly identify eruptive events and issue reliable reports to the Italian Civil Protection Department and aviation authorities. Figure 15 shows a flowchart summarizing the methodology presented in this paper.
Figure 15.
Flowchart summarizing the methodology presented in this paper.
Volcanic monitoring, on the other hand, extends beyond simple observation by providing quantitative measurements of physical parameters that can be used to investigate eruptive dynamics and constrain volcanic processes. As demonstrated in this study and at other volcanoes worldwide [38], the long-term image archive acquired by the INGV-OE network enables the retrieval of quantitative parameters such as eruption column height, mass eruption rate, lava-flow dimensions, explosion frequency, and fumarolic thermal anomalies. The quantitative analyses have also enabled the development of openly accessible databases, including the RESPIRA [39], CIELO [40], and Etna Output Rate [22] databases. These resources provide valuable benchmarks for validating remote sensing techniques and investigating long-term eruptive trends. Consequently, the camera network should not be regarded simply as a visual surveillance system, but rather as a distributed remote sensing platform capable of providing near-real-time qualitative observations and quantitative estimates.
The operational experience gained over more than three decades has also highlighted some intrinsic limitations of ground-based imaging. The accuracy of quantitative measurements is controlled not only by sensor performance and calibration, but also by the fixed viewing geometry of permanent stations. For example, during lava-flow mapping, portions of the lava flow front may become obscured by local topography, preventing the complete observation of the active flow field. In contrast, satellite observations or integrated multi-sensor approaches can provide a synoptic view of the entire lava field. This limitation can be partially overcome by deploying mobile camera stations during volcanic crises, allowing rapid repositioning of sensors to observe previously hidden sectors. Additional limitations arise from adverse meteorological conditions, including cloud cover, rain, fog, and optically dense volcanic plumes, which can reduce image quality in both visible and thermal imagery. Although thermal cameras significantly improve monitoring at night, atmospheric attenuation remains an unavoidable source of uncertainty for all ground-based optical systems. Therefore, ground-based and satellite observations should be regarded as complementary rather than alternative monitoring techniques.
The automated processing tools in our network (e.g., SFA for the mass eruption rate estimation at Etna, thermal tracking at Stromboli, and fumarolic flux analysis at Vulcano) rely on deterministic algorithms rather than machine-learning models. They do not autonomously classify eruptive events or trigger public alerts; instead, they function as real-time decision-support systems that extract key physical and geometrical parameters. These data are continuously streamed to the INGV-OE control room to assist on-duty volcanologists during operational surveillance. We remark that a primary limitation of the tools presented here is the dependence on ambient meteorological conditions. Persistent cloud cover, dense volcanic degassing and heavy precipitation can degrade image quality and obscure eruptive phenomena. For these reasons, these can be considered real-time decision-support systems rather than fully autonomous classification engines, relying on validation by on-duty volcanologists. Future work will focus on conducting systematic quantitative tests and implementing machine learning algorithms to improve feature extraction under degraded visibility conditions. Moreover, thermal measurements obtained at long distances (e.g., 15 km from the ENT camera to Etna’s summit craters) represent apparent radiometric temperatures rather than absolute target temperatures, due to atmospheric attenuation, target emissivity uncertainties, and protective camera lenses. Nevertheless, tools like NewSaraterm effectively overcome this limitation by calculating dynamic daily thermal offsets using median filtering. By evaluating relative thermal anomalies rather than absolute values, the system reliably triggers early-warning alerts regardless of seasonal ambient fluctuations. Missed events are strictly limited to low-energy, short-duration phenomena (such as weak Strombolian activity or minor ash puffing) or events occurring during total cloud obstruction of the volcanic craters. High-intensity eruptive events exhibit robust thermal and visual contrast and are consistently detected.
One of the main challenges is no longer data acquisition, but rather efficient data processing. The continuous operation of the network generates a massive volume of visible and thermal imagery, making manual analysis increasingly impractical. Future developments will therefore rely on Artificial Intelligence (AI) and deep learning techniques capable of automatically detecting eruptive phenomena, segmenting volcanic plumes, filtering out images degraded by adverse weather, and extracting quantitative parameters in near real time. To date, most AI-based applications in volcanology have focused on satellite imagery (see [41] for a review); however, integrating these methods into ground-based monitoring infrastructure holds significant potential to enhance operational surveillance while simultaneously reducing the workload of volcano observatory staff.
Finally, the integration of ground-based imaging with satellite observations, radar, lidar, seismic, geodetic, and geochemical measurements represents the natural evolution of operational volcanic monitoring. Such multi-sensor approaches will provide more robust characterization of eruptive processes and improve both quantitative analyses and real-time hazard assessment. Future developments will focus on the integration of both ground- and satellite-based imagery, considering also the integration with global volcano monitoring infrastructure database [42]. To our knowledge, the INGV-OE network represents one of the longest operating ground-based volcanic imaging systems worldwide, providing a unique archive for both operational surveillance and quantitative analyses.
5. Conclusions
Over the past 32 years, the INGV-OE camera network has evolved from a single analog camera into a comprehensive infrastructure comprising three mobile units and 21 permanent visible and thermal stations across Etna, Stromboli, and Vulcano. Dedicated in-house software tools enable real-time automated extraction of key eruptive parameters, such as plume height, mass eruption rate, explosion frequency, and fumarolic thermal flux. Those parameters are used to support on-duty volcanologists at INGV-OE and the development of open-access databases (RESPIRA, CIELO). Despite the limitations of viewing geometry and atmospheric attenuation, tracking dynamic relative thermal anomalies minimizes false alarms and ensures the reliable detection of major eruptive events. Thus, ground-based camera networks function as robust real-time decision-support systems that strictly complement satellite observations. Future developments will focus on integrating deep learning algorithms for automated image filtering and plume segmentation, also under degraded visibility. Ultimately, the INGV-OE imaging network provides a unique long-term archive supporting both operational volcanic surveillance and scientific research.
Author Contributions
Conceptualization, E.P., M.C.; methodology, E.P., E.B., F.C. (Francesco Ciancitto), M.P., M.C., L.L., L.M., S.S.; software, E.P., E.B., M.P., F.C. (Francesco Ciancitto), P.P.; validation, M.C., S.S., M.P., L.M., L.L.; formal analysis, E.P., F.C. (Francesco Ciancitto), L.L., M.C., M.P., L.M., S.S.; investigation, E.P., E.B., F.C. (Francesco Ciancitto), M.P., P.P., M.C., M.S., L.P., F.C. (Francesco Calvagna), L.L., L.M., S.S.; resources, E.P., E.B., F.C. (Francesco Ciancitto), M.P., P.P., M.C., M.S., L.P., F.C. (Francesco Calvagna), L.L., L.M., S.S.; data curation, E.P., E.B., F.C. (Francesco Ciancitto), M.P., P.P., M.C., L.P., M.S., F.C. (Francesco Calvagna), L.L., L.M., S.S.; writing—original draft preparation, E.P., S.S.; writing—review and editing, E.P., F.C. (Francesco Ciancitto), L.M., S.S.; visualization, F.C. (Francesco Ciancitto), E.P., E.B., M.P., P.P.; supervision, E.P., S.S.; project administration, E.P.; funding acquisition, E.P. All authors have read and agreed to the published version of the manuscript.
Funding
This work was partially supported and funded under the Three-year Programme for the Extension and Strengthening of Volcanic and Seismic Monitoring Systems in Sicily (“Progetto Sicilia”), pursuant to the Institutional Framework Agreement (Intesa Istituzionale di Programma) of 7 November 2003, and the subsequent Framework Programme Agreement (APQ of 27 October 2006), by the VULCAMED Infrastructure Strengthening Project (“Potenziamento strutturale di centri di ricerca per lo studio di aree VULCAniche ad alto rischio e del loro potenziale geotermico nel contesto della dinamica geologica e ambientale MEDiterranea”), project code PONa3_00278, funded by the Italian Ministry of University and Research (MUR) under the National Operational Programme (PON) for Research and Competitiveness, by funds of Department of Italian Civil Protection (DPC). This research was supported by the Space It Up project funded by ASI and the Ministry of University and Research, MUR, under contract n. 2024-5-E.0 CUP n. I53D24000060005.
Data Availability Statement
The original contributions presented in this study are included in the article. The custom software tools (e.g., Grabber, MultiRelay, and NewSaraterm) are the property of INGV-OE and are not publicly available.
Acknowledgments
We thank the Department of Italian Civil Protection for logistical support in the installation phase of the camera network. We thank S. Calvari, who greatly contributed to the scientific discussions. We thank all the INGV-OE technicians who contributed to the installation and maintenance of the camera network. The authors have reviewed and edited the output and take full responsibility for the content of this publication.
Conflicts of Interest
The authors declare no conflicts of interest. The funders had no role in the design of the study; in the collection, analyses, or interpretation of data; in the writing of the manuscript; or in the decision to publish the results.
Abbreviations
| INGV-OE | Istituto Nazionale di Geofisica e Vulcanologia-Osservatorio Etneo |
| IIV-CNR | Istituto Internazionale di Vulcanologia del Consiglio Nazionale delle Ricerche |
| GNV | Gruppo Nazionale Vulcanologia |
| VONA | Volcano Observatory Notice for Aviation |
| QM | Mass Eruption Rate |
| SFA | Surface Flux Approach |
| HD | High Definition |
| TIR | Thermal InfraRed |
| CCD | Charge-Coupled Device |
| CMOS | Complementary Metal-Oxide Semiconductor |
| PTZ | Pan–Tilt–Zoom |
| MP | MegaPixel |
| VCR | Video Cassette Recording |
| PC | Personal Computer |
| 3D | Three-dimensional |
| EMOT | Etna Montagnola Thermal |
| EMOV/EMOH | Etna Montagnola HD Visible |
| ESR | Etna Schiena dell’Asino Thermal |
| ESV | Etna Schiena dell’Asino Visible |
| EMV | Etna Milo Visible/HD Visible |
| ENT | Etna Nicolosi Thermal |
| ENV | Etna Nicolosi Visible |
| ECV | Etna Cuad Visible |
| ECVH | Etna Cuad HD Visible |
| EBT | Etna Bronte Thermal |
| EBVH | Etna Bronte HD Visible |
| EMVV | Etna Monte Veneretta HD Visible |
| EMCT | Etna Monte Cagliato Thermal |
| EMCH | Etna Monte Cagliato HD Visible |
| EPVH | Etna Piedimonte Etneo HD Visible |
| SPT | Stromboli Pizzo Sopra la Fossa Thermal |
| SCT | Stromboli Quota 190 m Thermal |
| SCV | Stromboli Quota 190 m HD Visible |
| SPCT | Stromboli Punta dei Corvi Thermal |
| VLV | Lipari Osservatorio Geofisico Visible |
| VLVH | Lipari Osservatorio Geofisico HD Visible |
| VVTR | Vulcano Cratere la Fossa Thermal |
References
- Mani, L.; Tzachor, A.; Cole, P. Global catastrophic risk from lower magnitude volcanic eruptions. Nat. Commun. 2021, 12, 4756. [Google Scholar] [CrossRef] [Scilit] [PubMed]
- McGuire, W.J. Monitoring active volcanoes. J. Geol. Soc. 1991, 148, 561–562. [Google Scholar] [CrossRef] [Scilit]
- Tilling, R.I. The critical role of volcano monitoring in risk reduction. Adv. Geosci. 2008, 14, 3–11. [Google Scholar] [CrossRef] [Scilit]
- Andò, B.; Pecora, E. An advanced video-based system for monitoring active volcanoes. Comput. Geosci. 2006, 32, 85–91. [Google Scholar] [CrossRef] [Scilit]
- Barnie, T.; Hjörvar, T.; Titos, M.; Sigursson, E.M.; Pálsson, S.K.; Bergsson, B.; Ingvarsson, Þ.; Pfeffer, M.A.; Barsotti, S.; Arason, P.; et al. Volcanic plume height monitoring using calibrated web cameras at the Icelandic Meteorological Office: System overview and first application during the 2021 Fagradalsfjall eruption. J. Appl. Volcanol. 2023, 12, 4. [Google Scholar] [CrossRef] [Scilit]
- Patrick, M.; Orr, T.; Fisher, G.; Trusdell, F.; Kauahikaua, J. Thermal mapping of a pāhoehoe lava flow, Kīlauea Volcano. J. Volcanol. Geotherm. Res. 2017, 332, 71–87. [Google Scholar] [CrossRef] [Scilit]
- Gómez Martínez, D.M.; López Vélez, C.M.; Monsalve Bustamante, M.L.; Agudelo Restrepo, A.; Cortés Jiménez, G.P.; Calvache Velasco, M.L. Active volcanism in Colombia and the role of the Servicio Geológico Colombiano. Volcanica 2021, 4, 113–139. [Google Scholar] [CrossRef] [Scilit]
- Hidalgo, S.; Bernard, B.; Mothes, P.; Beate, B.; Albino, F.; Arrais, S.; Almeida, M.; Vasconez, F. Hazard assessment and monitoring of Ecuadorian volcanoes: Challenges and progresses during four decades since IG-EPN foundation. Bull. Volcanol. 2024, 86, 4. [Google Scholar] [CrossRef] [Scilit]
- Ramsey, M.; Harris, A. Volcanology 2020: How will thermal remote sensing of volcanic surface activity evolve over the next decade? J. Volcanol. Geotherm. Res. 2013, 249, 217–233. [Google Scholar] [CrossRef] [Scilit]
- Patrick, M.R.; Orr, T.R.; Tollett, W.D.; Kamibayashi, K.P. Thermal camera images of lava lake and crater filling activity at Puʻuʻōʻō, East Rift Zone of Kīlauea Volcano, Island of Hawaiʻi, 2011–2019. US Geol. Surv. Data Release 2024. [Google Scholar] [CrossRef]
- Chiodini, G.; Vilardo, G.; Augusti, V.; Granieri, D.; Caliro, S.; Minopoli, C.; Terranova, C. Thermal monitoring of hydrothermal activity by permanent infrared automatic stations: Results obtained at Solfatara di Pozzuoli, Campi Flegrei (Italy). J. Geophys. Res. Solid Earth 2007, 112, B12206. [Google Scholar] [CrossRef] [Scilit]
- Harris, A.; Pirie, D.; Horton, K.; Garbeil, H.; Pilger, E.; Ramm, H.; Hoblitt, R.; Thornber, C.; Ripepe, M.; Marchetti, E.; et al. DUCKS: Low cost thermal monitoring units for near-vent deployment. J. Volcanol. Geotherm. Res. 2005, 143, 335–360. [Google Scholar] [CrossRef] [Scilit]
- Patrick, M.; Harris, A.L.; Ripepe, M.; Dehn, J.; Rothery, D.; Calvari, S. Strombolian explosive styles and source conditions: Insights from thermal (FLIR) video. Bull. Volcanol. 2007, 69, 769–784. [Google Scholar] [CrossRef] [Scilit]
- Calvari, S.; Salerno, G.G.; Spampinato, L.; Gouhier, M.; La Spina, A.; Pecora, E.; Harris, A.J.L.; Labazuy, P.; Biale, E.; Boschi, E. An unloading foam model to constrain Etna’s 11–13 January 2011 lava fountaining episode. J. Geophys. Res. Solid Earth 2011, 116, B11207. [Google Scholar] [CrossRef] [Scilit]
- Carter, A.J.; Girina, O.; Ramsey, M.S.; Demyanchuk, Y.V. ASTER and field observations of the 24 December 2006 eruption of Bezymianny Volcano, Russia. Remote Sens. Environ. 2008, 112, 2569–2577. [Google Scholar] [CrossRef] [Scilit]
- Behncke, B.; Neri, M. Cycles and trends in the recent eruptive behaviour of Mount Etna (Italy). Can. J. Earth Sci. 2003, 40, 1405–1411. [Google Scholar] [CrossRef] [Scilit]
- Re, G.; Di Roberto, A.; Del Carlo, P.; Pompilio, M. Evolution of the eruptive activity at Stromboli (Aeolian Islands-Italy) during the last 4 millennia. A tephrostratigraphic investigation on the early-phase of recent Stromboli eruptive epoch. J. Volcanol. Geotherm. Res. 2025, 462, 108300. [Google Scholar] [CrossRef] [Scilit]
- Federico, C.; Cocina, O.; Gambino, S.; Paonita, A.; Branca, S.; Coltelli, M.; Italiano, F.; Bruno, V.; Caltabiano, T.; Camarda, M.; et al. Inferences on the 2021 ongoing volcanic unrest at Vulcano Island (Italy) through a comprehensive multidisciplinary surveillance network. Remote Sens. 2023, 15, 1405. [Google Scholar] [CrossRef] [Scilit]
- Neri, A.; Barberi, F.; Carapezza, M.L. Lessons from the 2021–2023 unrest crisis on Vulcano (Italy). Bull. Volcanol. 2025, 87, 79. [Google Scholar] [CrossRef] [Scilit]
- Bonfanti, P.; Branca, S.; Cassisi, C.; Coltelli, M.; D’Agostino, M.; Prestifilippo, M.; Scollo, S. A fast compilation of the VONA messages using a computer-assisted procedure. Bull. Volcanol. 2024, 86, 39. [Google Scholar] [CrossRef] [Scilit]
- Calvari, S.; Spampinato, L.; Lodato, L. The 5 April 2003 vulcanian paroxysmal explosion at Stromboli volcano (Italy) from field observations and thermal data. J. Volcanol. Geotherm. Res. 2006, 149, 160–175. [Google Scholar] [CrossRef] [Scilit]
- Calvari, S.; Nunnari, G. Comparison between automated and manual detection of lava fountains from fixed monitoring thermal cameras at Etna volcano, Italy. Remote Sens. 2022, 14, 2392. [Google Scholar] [CrossRef] [Scilit]
- Behncke, B.; Neri, M.; Pecora, E.; Zanon, V. The exceptional activity and growth of the Southeast Crater, Mount Etna (Italy), between 1996 and 2001. Bull. Volcanol. 2006, 69, 149–173. [Google Scholar] [CrossRef] [Scilit]
- Coltelli, M.; D’Aranno, P.J.V.; De Bonis, E.; Guerrero Tello, J.F.; Marsella, M.; Nardinocchi, C.; Pecora, E.; Proietti, C.; Scifoni, S.; Scutti, M.; et al. The use of surveillance cameras for the rapid mapping of lava flows: An application to Mount Etna volcano. Remote Sens. 2017, 9, 192. [Google Scholar] [CrossRef] [Scilit]
- Falsaperla, S.; Behncke, B.; Langer, H.; Neri, M.; Salerno, G.; Giammanco, S.; Pecora, E.; Biale, E. “Failed” eruptions revealed by pattern classification analysis of gas emission and volcanic tremor data at Mt. Etna, Italy. Int. J. Earth Sci. 2014, 103, 827–840. [Google Scholar] [CrossRef] [Scilit][Green Version]
- Neri, M.; Behncke, B.; Burton, M.; Galli, G.; Giammanco, S.; Pecora, E.; Privitera, E.; Reitano, D. Continuous soil radon monitoring during the July 2006 Etna eruption. Geophys. Res. Lett. 2006, 33, L24316. [Google Scholar] [CrossRef] [Scilit]
- Carbone, D.; Zuccarello, L.; Messina, A.; Scollo, S.; Rymer, H. Balancing bulk gas accumulation and gas output before and during lava fountaining episodes at Mt. Etna. Sci. Rep. 2015, 5, 18041. [Google Scholar] [CrossRef] [Scilit] [PubMed]
- Scollo, S.; Prestifilippo, M.; Pecora, E.; Corradini, S.; Merucci, L.; Spata, G.; Coltelli, M. Eruption column height estimation of the 2011–2013 Etna lava fountains. Ann. Geophys. 2014, 57, S0214. [Google Scholar] [CrossRef] [Scilit]
- Scollo, S.; Prestifilippo, M.; Bonadonna, C.; Cioni, R.; Corradini, S.; Degruyter, W.; Rossi, E.; Silvestri, M.; Biale, E.; Carparelli, G.; et al. Near real-time tephra fallout assessment at Mt. Etna, Italy. Remote Sens. 2019, 11, 2987. [Google Scholar] [CrossRef] [Scilit]
- Calvari, S.; Giudicepietro, F.; Di Traglia, F.; Bonaccorso, A.; Macedonio, G.; Casagli, N. Variable magnitude and intensity of Strombolian explosions: Focus on the eruptive processes for a first classification scheme for Stromboli volcano (Italy). Remote Sens. 2021, 13, 944. [Google Scholar] [CrossRef] [Scilit]
- Ball, M.; Pinkerton, H. Factors affecting the accuracy of thermal imaging cameras in volcanology. J. Geophys. Res. Solid Earth 2006, 111, B11203. [Google Scholar] [CrossRef] [Scilit]
- Sawyer, G.M.; Burton, M.R. Effects of a volcanic plume on thermal imaging data. Geophys. Res. Lett. 2006, 33, L14311. [Google Scholar] [CrossRef] [Scilit]
- Marzano, F.S.; Mereu, L.; Scollo, S.; Donnadieu, F.; Bonadonna, C. Tephra mass eruption rate from ground-based X-band and L-band microwave radars during the November 23, 2013, Etna paroxysm. IEEE Trans. Geosci. Remote Sens. 2020, 58, 3314–3327. [Google Scholar] [CrossRef] [Scilit]
- Mereu, L.; Scollo, S.; Bonadonna, C.; Freret-Lorgeril, V.; Marzano, F.S. Multisensor characterization of the incandescent jet region of lava fountain-fed tephra plumes. Remote Sens. 2020, 12, 3629. [Google Scholar] [CrossRef] [Scilit]
- Sparks, R.S.J.; Huppert, H.E. Density changes during the fractional crystallization of basaltic magmas: Fluid dynamic implications. Contrib. Mineral. Petrol. 2022, 85, 300–309. [Google Scholar] [CrossRef] [Scilit]
- Mereu, L.; Scollo, S.; Bonadonna, C.; Donnadieu, F.; Freret-Lorgeril, V.; Marzano, F.S. Ground-based remote sensing and uncertainty analysis of the mass eruption rate associated with the 3–5 December 2015 paroxysms of Mt. Etna. IEEE J. Sel. Top. Appl. Earth Obs. Remote Sens. 2022, 15, 504–518. [Google Scholar] [CrossRef] [Scilit]
- Ciancitto, F.; Lodato, L. Automated monitoring of fumarolic field spatial evolution via infrared thermography: A robust approach to long-term sensor degradation at La Fossa Crater (Vulcano, Italy). Remote Sens. 2026; submitted.
- Vásconez, F.; Moussallam, Y.; Harris, A.J.L.; Nauret, F.; Hidalgo, S.; Bernard, B.; Battaglia, J. VIGIA: A thermal and visible imagery system to track volcanic explosions. Remote Sens. 2022, 14, 3355. [Google Scholar] [CrossRef] [Scilit]
- Mereu, L.; Scollo, S. Remote sEnsing obServations of source Parameters and data IntegRation at EtnA: The RESPIRA database. Sci. Data 2026, 13, 1256. [Google Scholar] [CrossRef] [Scilit] [PubMed]
- Mereu, L.; Prestifilippo, M.; Scollo, S. Column HeIght during Etna expLosive eruptiOn: The CIELO database. Sci. Data, 2026; submitted. [PubMed]
- Corradino, C. How artificial intelligence and Earth observation satellites are re-shaping volcano monitoring. Ann. Geophys. 2025, 68, V228. [Google Scholar] [CrossRef] [Scilit]
- Widiwijayanti, C.; Thin Zar Win, N.; Espinosa-Ortega, T.; Costa, F.; Taisne, B. The global volcano monitoring infrastructure database (GVMID). Front. Earth Sci. 2024, 12, 1284889. [Google Scholar] [CrossRef] [Scilit]

Disclaimer/Publisher’s Note: The statements, opinions and data contained in all publications are solely those of the individual author(s) and contributor(s) and not of MDPI and/or the editor(s). MDPI and/or the editor(s) disclaim responsibility for any injury to people or property resulting from any ideas, methods, instructions or products referred to in the content. |
© 2026 by the authors. Licensee MDPI, Basel, Switzerland. This article is an open access article distributed under the terms and conditions of the Creative Commons Attribution (CC BY) license.