


Highlights
What are the main findings?
- Reverse-time SAM2 labeling expanded the multi-source training set to 170,573 frames and 128,185 smoke boxes, while extending FIgLib smoke labels 2–3 frames earlier than the base detection.
- On 144 held-out FIgLib 2023–2025 videos, RT-DETR-L detected smoke in 111 sequences at 6.98 ± 6.31 min, about 35% faster than YOLOv11x, while YOLOv11x produced only 4 false-positive videos.
What are the implications of the main findings?
- Automated temporal labeling can substantially accelerate the creation of large and diverse wildfire-smoke datasets for training and evaluating early-warning models.
- Combining a fast detector for initial alerts with a precise confirmation model provides a practical approach for reliable, real-world wildfire-smoke monitoring under challenging environmental conditions.
Abstract
Early wildfire detection from camera networks is limited less by detector architecture than by the quality of supervision. Human annotators often label faint, early-stage smoke plumes less reliably, causing models to perform poorly during this critical period. We address this bottleneck with an automated video-labeling pipeline based on SAM2 mask propagation performed in reverse temporal order, allowing masks anchored on clearly visible smoke to propagate backward to its earliest faint appearance. With targeted human validation to reject cloud-related artifacts, the pipeline produced a training dataset of 170,573 frames containing 128,185 smoke bounding boxes drawn from four data sources spanning fixed and pan-tilt-zoom camera networks as well as daytime and nighttime conditions. Using this dataset, we trained two complementary detectors: RT-DETR-L for high-recall early warning and YOLOv11x for high-precision confirmation. When evaluated on 144 HPWREN FIgLib ignition sequences, RT-DETR-L detected smoke in 111 of 144 sequences, with a mean detection time of 7.0 min after ignition, while YOLOv11x achieved high-precision confirmation with only four false-positive videos across the complete test set. The remaining detection failures were concentrated primarily under nighttime and foggy conditions, which we quantify and discuss in detail.
1. Introduction
The global frequency of wildfires has risen sharply in recent decades, with recent events occurring in unexpected regions such as Europe and U.S. national parks. In 2021 alone, 58,985 wildfires burned 7.1 million acres, compared to 18,229 fires consuming 1.3 million acres in 1983, a 223% increase [1,2]. In California, the 2020 wildfires released more than 91 million metric tons of CO2, approximately 25% of the state’s annual fossil fuel emissions [3]. While wildfires can provide certain ecological benefits, effective management is critical to minimize emissions, property damage, and loss of life. Early detection remains central to mitigating these impacts [4].
Because most wildfires begin with visible smoke, smoke serves as the primary indicator for early detection. Camera networks are specifically designed to detect smoke and issue timely alerts, leveraging its upward, dispersive motion as a distinguishing feature [5]. Earlier research relied on handcrafted features such as color, motion, texture, and shape, which were then classified using algorithms like SVMs, k-nearest neighbors, or ensemble methods. While effective in controlled environments, these approaches struggled with real-world variability in lighting, background complexity, and smoke density [5].
Deep learning approaches now dominate wildfire smoke detection, automatically learning discriminative features and outperforming traditional pipelines. CNNs such as AlexNet and subsequent deeper architectures improved accuracy, while frameworks including Faster R-CNN, DeepLabV3+, GANs, and 3D CNNs enhanced spatial localization and temporal modeling. Hybrid pipelines that combine handcrafted cues with real-time detectors like YOLO or lightweight backbones (e.g., MobileNetV2) have further advanced smoke detection for surveillance and edge devices [5].
The effectiveness of deep learning depends heavily on access to large, diverse, and representative datasets [6]. Although data augmentation is commonly used to increase diversity, excessive or poorly designed transformations risk introducing semantic drift for example, color jitter may cause clouds to resemble smoke. Such artifacts can mislead models into learning shortcuts rather than meaningful patterns, thereby undermining generalization [6].
Labels remain essential for supervised learning, as they provide the ground truth needed for training. However, manual annotation is costly and time-consuming. Automated labeling methods have emerged as scalable alternatives, offering improved speed, consistency, and reduced human bias, thereby supporting more efficient and reliable model training [7,8,9,10].
Recent advances such as SAM2 [11], trained on the large-scale SA-V dataset, offer strong generalization and an interactive prompt-based framework. In this work, we employ SAM2 not for segmentation itself, but to accelerate the annotation process by generating object masks that are automatically converted into bounding boxes around smoke. This reduces manual effort and ensures consistent annotations. Comparable applications in medical imaging, remote sensing, and agriculture further highlight SAM-based methods’ versatility [12,13,14].
For dataset development, we utilized open-source wildfire ignition videos from AlertCalifornia [15] and the HPWREN Fire Ignition Image Library (FIgLib) [16], which we annotated with the assistance of SAM2 [11]. Combined with existing labeled datasets such as D-Fire [17] and Pyro-SDIS [18], this effort enabled us to compile a large-scale, diverse smoke detection dataset designed to support robust model training.
In real-world scenarios, wildfire data is inherently stochastic, shaped by unpredictable environmental and observational factors. Prior studies, such as Guede-Fernández et al. [19], evaluated early detection performance on 16 daytime FIgLib videos (2016–2018) by reporting the time of first smoke identification. More recently, Park and Lee [20] extended this evaluation to 68 additional FIgLib sequences [16], though they did not explicitly clarify whether training and testing data were fully separated, since both phases relied on FIgLib [16]. In contrast, our study emphasizes the stochastic nature of real-world conditions by employing all available FIgLib ignition sequences from 2023–2025 including both daytime and nighttime videos that were strictly excluded from training to assess early detection performance. Additionally, we analyze the impact of different input resolutions (480 × 480, 640 × 640, and 960 × 960 pixels) and present both quantitative and qualitative evaluation metrics to identify the optimal model configuration and trade-offs for various edge-computing scenarios.
The main objectives of this research are as follows:
- Build a large, diverse smoke dataset with minimal manual labeling by introducing a reverse-frame propagation strategy during SAM2 inference, where video frames are fed in reverse temporal order. This allows masks to be propagated backward from clearly visible smoke to its earliest faint appearance, significantly improving supervision for early-stage detection.
- Design and evaluate a two-stage detector where RT-DETR triggers fast, high-recall alerts and YOLOv11 provides high-precision confirmation to suppress false alarms.
- Quantify real-world early-detection performance on a strict held-out benchmark (FIgLib 2023–2025), reporting detection-time distributions and key failure modes across lighting and weather conditions.
2. Materials and Methods
2.1. Dataset
In our study, we used the Pyro-SDIS dataset as the first of two baseline resources for the detection of wildfire smoke. Developed in collaboration with the French Fire and Rescue Services (SDIS) and the Pyronear association, it contains 33,636 images, including 28,103 with smoke and 31,975 annotated smoke instances, captured by Pyronear cameras and annotated by volunteers. The dataset is formatted for compatibility with the Ultralytics YOLO framework, making it well suited for training and evaluating detection models [18].
As the second baseline resource, we use the D-Fire dataset, an image collection of fire and smoke occurrences designed for machine learning and object detection. It contains more than 21,000 images, including 5867 with only smoke and 4658 with fire and smoke, with a total of 11,865 annotated smoke bounding boxes in YOLO format [17].
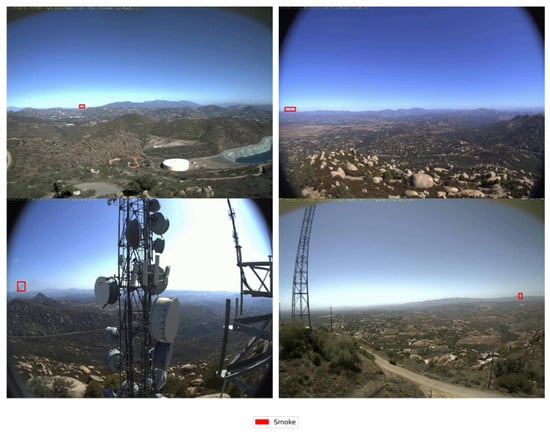
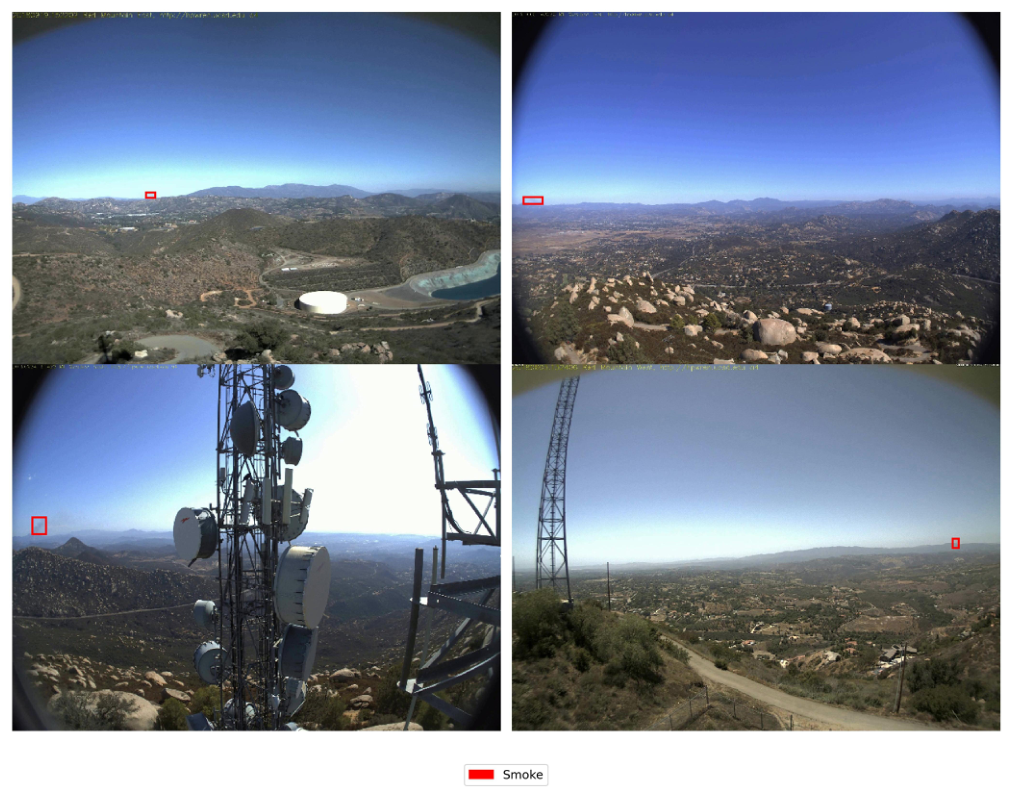
As the third resource, we used the HPWREN Fire Ignition image Library (FIgLib), maintained by UCSD’s High Performance Wireless Research and Education Network (HPWREN) [16]. FIgLib contains more than 400 fire ignition sequences captured by fixed field-of-view cameras throughout California, with full-resolution JPEG imagery and time-lapse sequences spanning approximately 40 min before and after ignition events [16]. Figure 1 presents representative samples from the FIgLib dataset, illustrating wildfire smoke imagery captured across different fire events and camera locations. This archive provides a valuable temporal resource for studying the early development of wildfire smoke plumes.
Figure 1.
Sample of SAM-2 labeled FIgLib Dataset [16].
For preprocessing, the available FIgLib JPEG frames for each year were first collected and chronologically combined into continuous video sequences. During video construction, each source image was matched to its corresponding frame index in the generated video, and a frame-mapping table was created to preserve the relationship between every encoded video frame and its original FIgLib image. Because FIgLib imagery originates from different cameras, wildfire events, and acquisition settings [16], the source images contained variations in spatial resolution. To provide a consistent input representation while preserving the diversity of the original camera network, all images within a given year were standardized to the spatial resolution of the first valid frame available for that year. Images with different dimensions were therefore resized to this reference resolution before video encoding. This year-level resolution standardization ensured consistent spatial dimensions during subsequent video-based processing while retaining variability across different years, cameras, locations, and wildfire events, thereby supporting model generalizability.
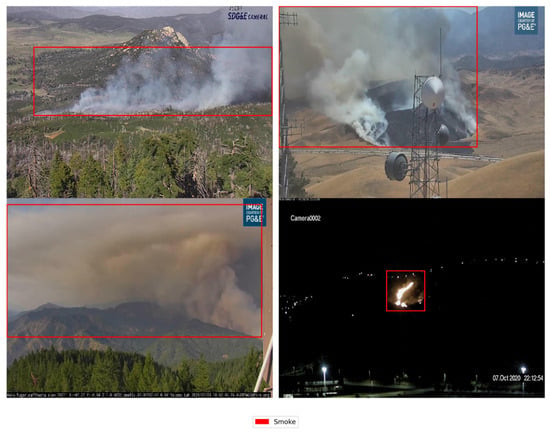
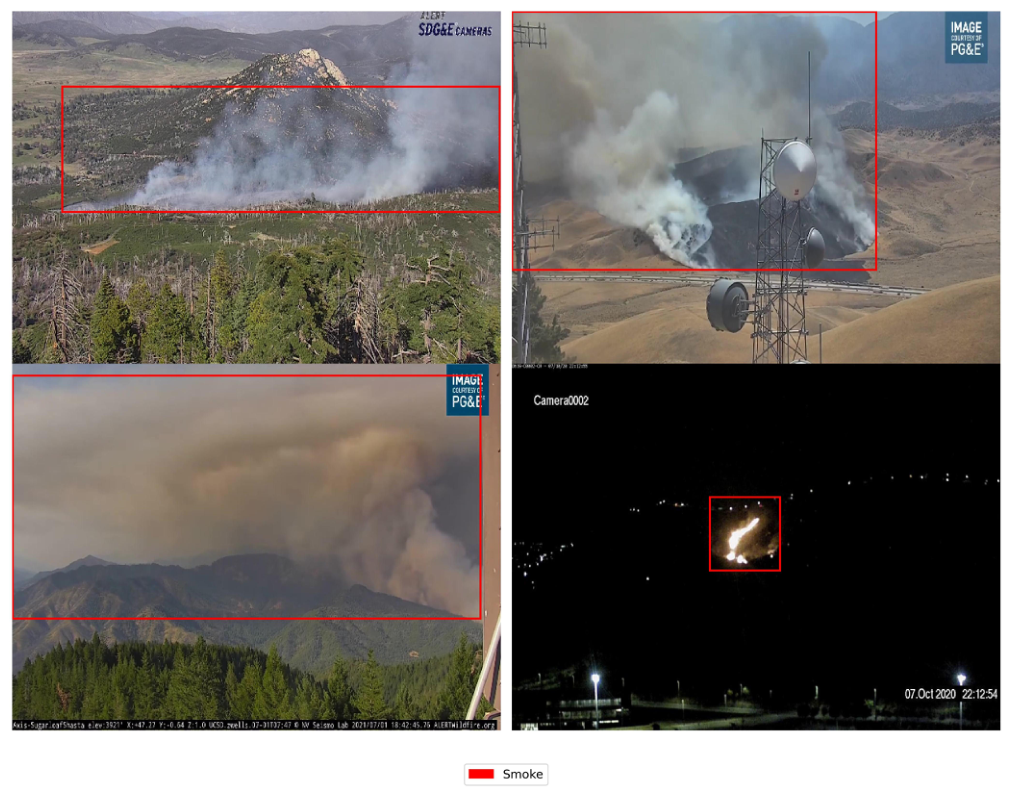
As the fourth resource, we used the AlertCalifornia dataset, based on the University of California San Diego’s statewide monitoring program. AlertCalifornia manages more than 1190 cameras and sensor arrays throughout California (as of July 2025) and provides open-source data for natural-hazard monitoring, including wildfires. We obtained relevant wildfire-related camera sequences from YouTube using the yt-dlp library [21] and labeled smoke occurrences with the assistance of SAM2 [11] and a YOLOv11x [22] model trained on the baseline datasets. Figure 2 presents representative samples from the labeled AlertCalifornia dataset, illustrating smoke annotations across different wildfire scenes and camera viewpoints. To ensure annotation quality, the generated labels were visually inspected, and videos containing persistent misannotations of clouds or other non-smoke regions were excluded before incorporation into the final training dataset. Additional examples of SAM2 misannotation failure modes and the corresponding quality-control procedure are provided in Appendix A.2. Since AlertCalifornia cameras include pan-tilt-zoom functionality, they provide greater variation in viewpoint and scene composition than the fixed-field-of-view HPWREN system.
Figure 2.
Sample of SAM2 labeled AlertCalifornia Dataset [15].
To ensure a comprehensive and diverse wildfire smoke detection resource, we integrated the Pyro-SDIS, D-Fire, FIgLib (2016–2021), and AlertCalifornia datasets. This combined collection encompasses a broad array of environmental scenarios and optical setups, ranging from fixed-view surveillance to dynamic zoom-enabled systems. The resulting dataset was partitioned into training (), validation (), and testing () subsets. Furthermore, we evaluated real-world performance using the FIgLib (2022–2025) dataset. Table 1 provides a detailed breakdown of the total frames and smoke labels across all sources.
Table 1.
Datasets used for wildfire smoke detection.
Because the combined dataset was constructed from multiple heterogeneous sources, it does not originate from a single continuous video collection. D-Fire [17] contributes an image-based object-detection dataset, whereas Pyro-SDIS [18], FIgLib [16], and AlertCalifornia [15] contain imagery derived from video or temporally ordered camera sequences acquired using different camera networks, locations, and acquisition settings. Consequently, although temporally similar neighboring frames may occur within the video-derived portions of the dataset, the combined resource contains substantial variation across independent wildfire events, camera viewpoints, scene compositions, and data sources. This reduces the likelihood that the internal test set consists predominantly of near-duplicate frames from the training set compared with a dataset constructed by randomly splitting frames from a single continuous video source. Nevertheless, some temporal similarity among neighboring frames may remain, and the internal test split was therefore not considered the sole measure of model generalization.
To provide a more stringent assessment of real-world generalization, we additionally evaluated the trained models on later FIgLib sequences [16] that were not included during model development. This temporally separated evaluation was designed to assess performance on previously unseen wildfire events rather than relying exclusively on metrics obtained from the randomly held-out portion of the combined dataset. The independent FIgLib evaluation therefore complements the conventional test-set metrics and provides a more realistic indication of how the models may perform when deployed on new wildfire events, camera conditions, and environmental scenarios. The results of this real-world evaluation are discussed in the subsequent sections.
For the spatial and meteorological analysis of the FIgLib evaluation sequences, the latitude, longitude, and elevation of each camera were manually compiled from the HPWREN camera network metadata [23]. Meteorological parameters were obtained from the NOAA National Weather Service Real-Time Mesoscale Analysis (RTMA) dataset accessed through Google Earth Engine [24]. For each ignition event, weather conditions were extracted at the corresponding camera location using the RTMA record from the nearest available hour to the reported ignition time. The extracted variables included atmospheric pressure, air temperature, dew-point temperature, specific humidity, wind direction, wind speed, wind-gust speed, visibility, total cloud cover, and hourly total precipitation. These spatial and meteorological attributes were subsequently used to evaluate their correlations with the video-level outcomes of RT-DETR-L and YOLOv11x.
2.2. SAM2 Preliminaries
SAM2 [11] is a promptable visual segmentation model designed for both image and video tasks. For video segmentation, the model processes a sequence of frames and may additionally receive user prompts associated with individual frames [11]. Its objective is to produce a segmentation mask for each frame, where each predicted mask corresponds to the visual content of its associated frame [11]. Internally, each frame is encoded into a feature representation by an image encoder, and (when provided) prompts are encoded into embeddings by a prompt encoder to condition the segmentation on user intent [11]. To incorporate temporal context, SAM2 maintains a memory bank that stores information from a fixed number of recent frames, enabling temporal consistency across motion, appearance variation, and partial occlusions [11]. The current-frame visual features, the memory representations from prior frames, and the prompt embeddings are then fused via a memory attention mechanism to produce an attended representation that is informed by both temporal history and prompt guidance [11]. Finally, a mask decoder maps this attended representation to the segmentation output for the current frame; repeating this across frames yields a mask sequence over the entire video [11].
In our workflow, we employed SAM2 to automatically generate YOLO-compatible labels from Figlib [16] and AlertCalifornia [15] video streams. Following mask propagation, these segmentation masks were converted into YOLO bounding boxes to serve as training labels by extracting the four spatial extrema ()of each mask, defining the tightest possible axis-aligned rectangle enclosing the detected object.
2.3. Object Detection Models
- Study Context
We use YOLOv11 and RT-DETR in our smoke detection study to balance accuracy, speed, and scalability. YOLOv11 provides a wide range of model sizes for flexible deployment, while RT-DETR enables end-to-end object detection without post-processing steps such as Non-Maximum Suppression (NMS), offering competitive accuracy with simplified inference.
- YOLOv11 for Object Detection
YOLOv11 [22] follows a single-stage detection paradigm, predicting bounding boxes and class probabilities in a unified framework. The training objective jointly optimizes three components: (1) a bounding box regression loss that measures overlap between predicted and ground-truth boxes (typically using IoU-based losses), (2) an objectness loss that determines whether an object is present in a predicted region, and (3) a classification loss that assigns the correct class label.
During inference, YOLOv11 applies Non-Maximum Suppression (NMS) to eliminate duplicate detections. This process retains the highest-confidence bounding box and removes overlapping boxes whose Intersection-over-Union (IoU) with it exceeds a predefined threshold, ensuring that each object is detected only once.
- RT-DETR for Object Detection
RT-DETR [25] is a real-time Transformer-based detector that formulates object detection as a set prediction problem. Instead of relying on post-processing steps like NMS, it directly predicts a fixed number of object candidates and uses bipartite matching to associate predictions with ground-truth objects during training.
The training objective combines a classification loss, typically based on focal loss to handle class imbalance, with a bounding box regression loss that integrates both distance and generalized IoU (GIoU) to ensure accurate localization. This end-to-end formulation enables RT-DETR to produce non-redundant detections while maintaining real-time performance.
2.4. Labeling AlertCalifornia Dataset
We trained our base model, YOLOv11x [22], using the D-Fire [17] and Pyronear Pyro-SDIS [18] datasets (further details are provided in Appendix A). For AlertCalifornia, the videos were processed in segments of 3000 consecutive frames for SAM2 propagation. Prompts were generated from detections produced by the YOLOv11x base model trained on D-Fire and Pyro-SDIS. SAM2 masks were subsequently converted into YOLO-compatible bounding boxes using the spatial extrema of the smoke-mask pixels, . When a smoke mask was spatially fragmented within a frame, the extrema of the mask components were used to construct a single enclosing bounding box. This strategy was selected to avoid losing disconnected portions of the same smoke plume, although it can produce a larger bounding box when two spatially separated smoke regions occur in the same frame. Generated annotations were visually reviewed, and sequences containing persistent non-smoke propagation artifacts were excluded.
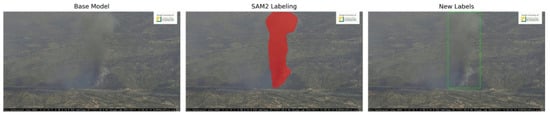
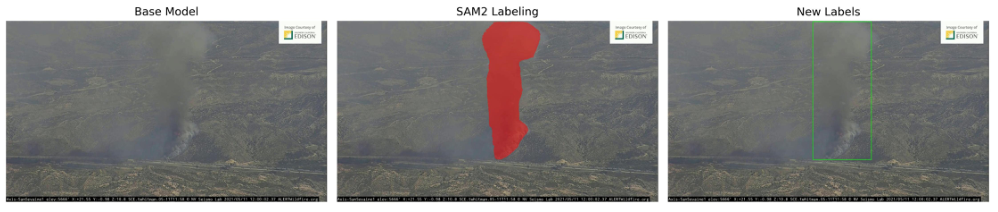
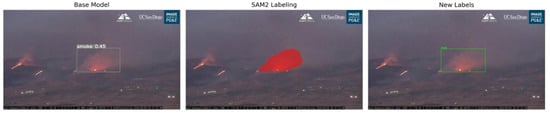
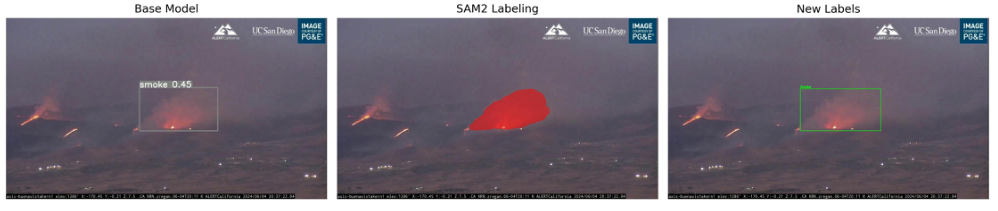
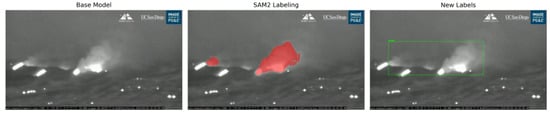
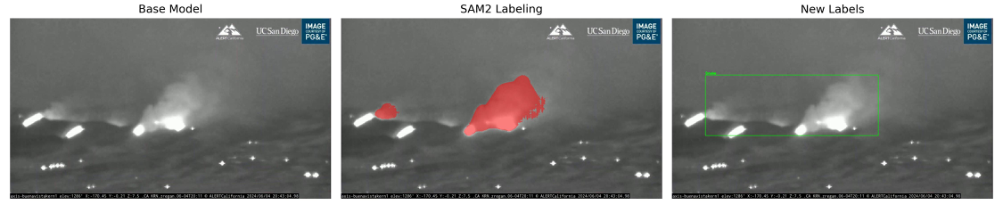
SAM2 demonstrated the ability to generate accurate smoke labels even under nighttime conditions. Its memory attention mechanism, combined with training on a large-scale dataset, enabled reliable segmentation of smoke regardless of lighting. Figure 3 illustrates how the segmentation masks generated by SAM2 were converted into YOLO-format bounding-box annotations for model training. Figure 4 demonstrates how smoke regions initially missed by the base detection model were subsequently identified through SAM2 mask propagation. Figure 5 and Figure 6 illustrate examples where SAM2 successfully labeled nighttime smoke that the base model failed to detect.
Figure 3.
Labeling workflow: detection by YOLOv11x (left), segmentation propagation with SAM2 (middle), and conversion into refined YOLO bounding boxes (right).
Figure 4.
Example where base YOLOv11x failed to detect smoke, but SAM2, leveraging memory attention, successfully segmented the smoke plume. The segmentation was subsequently converted into YOLO labels.
Figure 5.
Transition from daylight to evening: both the base model and SAM2 identified smoke, with SAM2 providing refined segmentation that propagated reliably across frames.
Figure 6.
Nighttime scenario: while the base model did not identify smoke, SAM2 successfully segmented the plume and propagated the labels through low-light conditions.
2.5. Labeling FigLib Dataset
The HPWREN Fire Ignition Library (FigLib) [16] provides image sequences where each frame corresponds to a one-minute interval, capturing the temporal progression of wildland fire ignitions. Each video spans 40 min prior to and 40 min following the initial appearance of visible smoke, creating a complete 80-min window around ignition events. This time-series structure makes the dataset highly valuable for studying the dynamics of early fire development, but also introduces challenges for labeling: smoke may emerge gradually, fluctuate in intensity, or be partially obscured across consecutive frames, making consistent annotation difficult. The combination of dense temporal coverage and subtle visual changes highlights both the strength and complexity of using FigLib for neural network training and evaluation.
We trained an additional YOLOv11x [22] model as a base detector using the D-Fire [17], Pyronear Pyro-SDIS [18], and labeled AlertCalifornia [15] datasets, and subsequently applied it to assist in labeling FigLib. Although the FigLib [16] archive spans from 2016 through 2025, we limited our labeling effort to videos from 2016 to 2021. Unlike the AlertCalifornia dataset [15], annotating FigLib [16] was more challenging because of its continuous time-series structure and the subtle appearance of smoke during the earliest stages of ignition. To address this challenge, we employed a reverse-frame labeling strategy.
The FIgLib workflow differed from the AlertCalifornia workflow in both prompt generation and sequence construction. AlertCalifornia was processed in 3000-frame segments using prompts generated by a YOLOv11x model trained on D-Fire and Pyro-SDIS, whereas the FIgLib sequences were reversed and organized into year-level concatenated sequences for SAM2 [11] propagation. Prompts for FIgLib were generated using the updated YOLOv11x base detector trained on D-Fire, Pyro-SDIS, and the SAM2-labeled AlertCalifornia dataset. The propagated masks were converted into bounding boxes using the minimum and maximum spatial coordinates of all smoke-mask pixels in each frame. This approach provided a single enclosing box when a smoke plume mask was fragmented, although it could include additional background when multiple spatially separated smoke regions occurred within the same frame.
During initial year-wise concatenated processing, visual quality control identified occasional erroneous mask propagation across source-video boundaries. To prevent such cross-video propagation, the SAM2 propagation state was subsequently reset at each original video boundary, while affected sequences containing persistent erroneous annotations were excluded from the final training dataset. The resulting FIgLib annotations were therefore subjected to manual visual quality control before inclusion in model training. Details of the excluded sequences and their corresponding failure modes are provided in Appendix A.2.
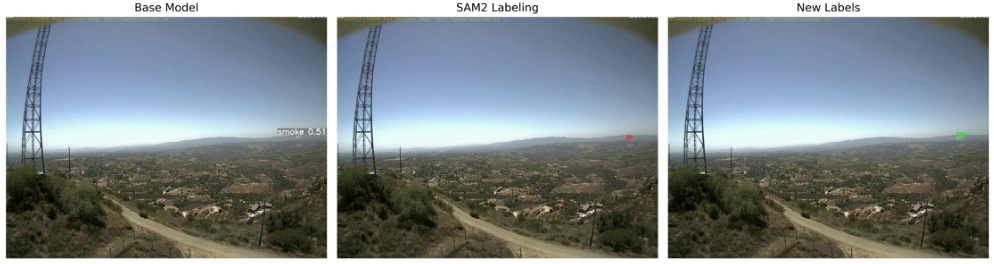
If the base detector identified smoke at frame m, reversing the sequence allowed that relatively clear smoke observation to become an earlier prompt in the SAM2 propagation direction. SAM2’s temporal memory could then propagate the smoke representation toward chronologically earlier and often more visually ambiguous frames, allowing labels to extend from frame m to , , …, . In contrast, conventional forward propagation must begin from earlier frames in which smoke may still be extremely faint or absent, providing weaker visual information for stable mask propagation. Therefore, the reverse-frame strategy effectively uses a clearer later observation as contextual evidence for identifying the weaker spatial signature of smoke in preceding frames.
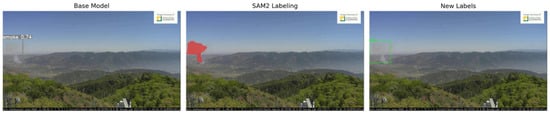
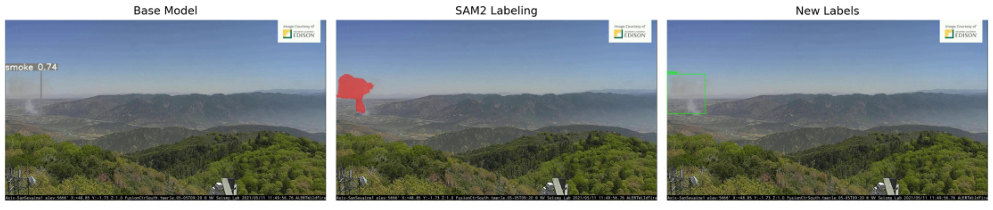
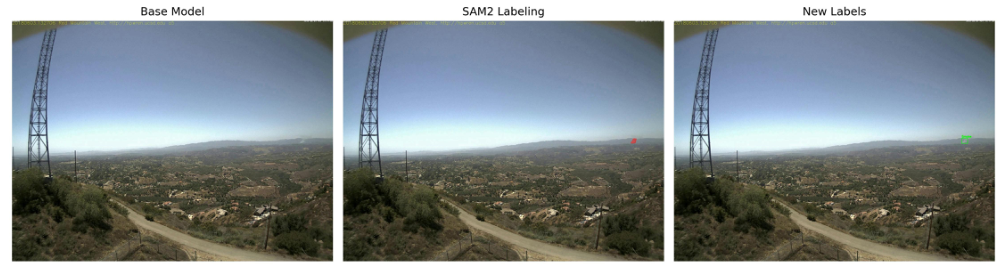
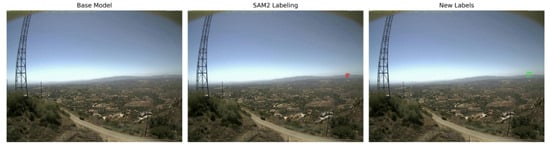
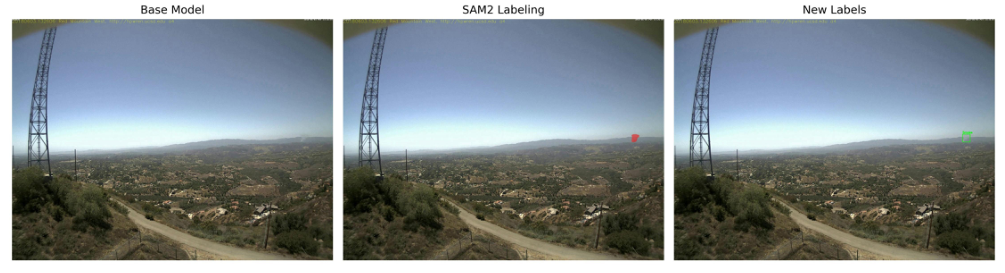
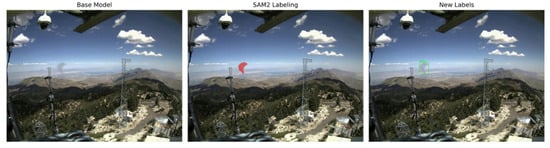
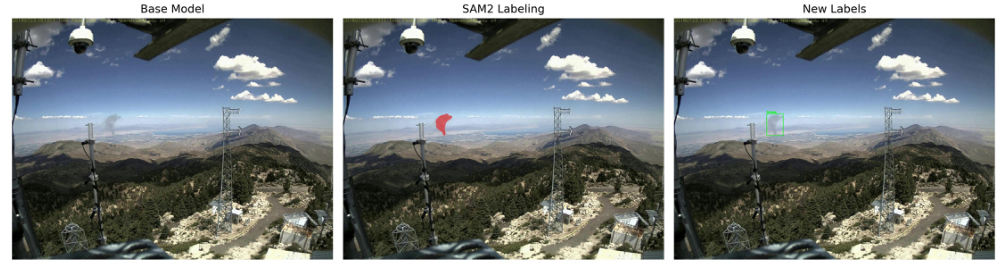
Figure 7, Figure 8 and Figure 9 illustrate this behavior, where the reverse sequence enables SAM2 to extend annotations one and two minutes earlier than the first detection produced by the base model. Furthermore, by stacking multiple reversed videos, we achieved consistent labeling even in cases where the base model failed to identify smoke in individual frames, as demonstrated in Figure 10. This strategy is particularly relevant for early wildfire smoke detection because it increases the number of temporally consistent annotations near the onset of smoke while reducing dependence on manual frame-by-frame labeling and the associated human subjectivity.
Figure 7.
Example where the base model first detects visible smoke in the FigLib [16] dataset.
Figure 8.
Using the reverse-frame strategy, SAM2 extends the labeling one frame earlier ( min), capturing smoke emergence before the base model.
Figure 9.
SAM2 further propagates the labeling to an earlier frame ( min), highlighting the importance of this strategy for early wildfire smoke detection.
Figure 10.
Example where stacking multiple videos allowed SAM2 to detect smoke that the base model missed, improving labeling for early wildfire smoke detection.
FigLib also provides a particularly appropriate dataset for quantitatively assessing the effect of reverse propagation. Unlike datasets used primarily to train the base detector, FigLib provides an explicit temporal ordering with fixed one-minute spacing between frames and timestamps referenced to the initial visible-smoke event. Consequently, forward and backward propagation can be compared on the same ignition sequences while controlling for scene, camera viewpoint, and event-specific visual conditions. This makes the comparison substantially more interpretable than it would be on datasets without a standardized temporal reference.
The quantitative comparison in Table 2 further supports the usefulness of the reverse-frame propagation strategy. For the temporal analysis, the forward propagation mean ± standard deviation was calculated using frames detected through forward propagation but not detected through backward propagation. Conversely, the backward propagation mean ± standard deviation was calculated using frames detected through backward propagation but not detected through forward propagation. This allows the timing analysis to focus specifically on frames for which the propagation direction produced a different detection outcome.
Table 2.
Comparison of forward and backward SAM2 propagation timing for the FigLib [16] training data used in this study from 2016 to 2021.
Across all evaluated years, frames contributing to the backward-propagation timing analysis occurred earlier in the temporal sequence than those contributing to the forward-propagation timing analysis. The mean temporal positions for forward propagation were 25.00, 28.16, 25.53, 25.46, 25.91, and 30.05 min for 2016 through 2021, respectively. In comparison, the corresponding backward-propagation means were 12.55, 18.33, 14.66, 14.55, 10.75, and 7.02 min. Thus, depending on the year, the backward-propagation detections occurred approximately 9.8–23.0 min earlier on average than the corresponding forward-propagation detections.
The number of uniquely detected frames also shows that the two propagation directions provide complementary labeling information. For example, in 2018, 186 frames were uniquely detected through forward propagation and 155 through backward propagation, while in 2019 the corresponding counts were 132 and 147. These results demonstrate that the two propagation directions do not simply reproduce identical annotations. More importantly for early smoke labeling, the consistently lower mean temporal positions of the backward-only detections indicate that reverse propagation preferentially contributes additional annotations earlier in the smoke-development sequence.
FigLib [16] is particularly suitable for evaluating this behavior because of its controlled temporal structure. Its image sequences maintain a fixed one-minute interval and a common temporal reference around each ignition event. Forward and backward propagation can therefore be compared using the same wildfire events, camera viewpoints, and scene conditions, reducing variability associated with comparisons across unrelated datasets.
Together, the qualitative examples and quantitative comparison demonstrate the usefulness of reverse-frame propagation for labeling the FigLib training dataset. Figure 7, Figure 8 and Figure 9 illustrate the frame-level behavior of backward mask propagation, while Table 2 shows that frames uniquely recovered through backward propagation are consistently concentrated earlier in the temporal sequence. Representative videos and corresponding labeled frames from the 2017 analysis are included in the Supplementary Materials for additional qualitative comparison of the two propagation directions.
2.6. Real-Time Conditions Testing Dataset
A meaningful assessment of a deep learning model requires evaluating its performance beyond a random hold-out split. While a conventional 5% test set helps verify basic generalization, it does not fully capture the complexities of real-time wildfire conditions. Our training set integrated multiple heterogeneous sources including D-Fire [17], Pyronear Pyro-SDIS [18], AlertCalifornia [15], and FigLib [16] sequences from 2016 to 2021 yet testing solely on randomized partitions remains insufficient for measuring temporal robustness and early detection capability.
We utilized sequences from 2023–2025 in the FigLib [16] dataset to facilitate temporally independent testing. By using this time-series independent data, we can more accurately assess how the model generalizes to future environmental conditions. These sequences contain dense time-series ignition events, enabling us to measure both overall detection accuracy and the model’s ability to pinpoint the first visible appearance of smoke in previously unseen footage. Because this dataset differs from the training split in environmental conditions, acquisition dates, illumination patterns, and camera configurations, it provides a challenging and realistic benchmark for assessing robustness and early-detection performance under operational, real-world conditions.
3. Results and Discussion
For model development, the datasets summarized in Table 1 were split into 80% training, 15% validation, and 5% testing. All models were trained for 300 epochs with a batch size of 64 and an image size of 640 by 640 pixels. A cosine learning rate scheduler was applied with an initial learning rate of 0.0001 and a final learning rate of 0.00001. The warm-up period was set to 2 epochs. The Adam optimizer was used. Training was carried out on NVIDIA B200 GPUs through the HiPerGator 4 [26] supercomputing facility at the University of Florida. Default augmentation settings provided by Ultralytics were employed, as augmentation was not explicitly disabled.
3.1. Detection Model Training and Evaluation
To ensure a fair comparison, a range of YOLOv11 [22] architectures—from the lightweight YOLOv11n to the larger YOLOv11x—were trained. For RT-DETR [25], both RT-DETR-l and RT-DETR-x variants were evaluated. Additionally, the RT-DETR-l model was trained with higher input resolutions of 960 by 960 and 480 by 480 pixels to examine the influence of image size on false-positive behavior and early-detection capability, as discussed further in Section 3.3.
The evaluation metrics on the test dataset are summarized in Table 3. Among the YOLO models, YOLOv11l [22] achieved the highest precision (0.9503), indicating fewer false positives, while YOLOv11x [22] obtained the best mAP50-95 score (0.8801), reflecting robust overall detection performance. The relatively high mAP50-95 values across YOLO variants can be attributed in part to effective Non-Maximum Suppression (NMS) [22], which improves multi-object localization. On the other hand, RT-DETR-l [25] achieved the highest recall (0.9373), a key advantage for early wildfire smoke detection. High recall ensures fewer false negatives, which is especially critical in this application, since missing an ignition event can be far more costly than a false alarm. These differences in performance trends are further explored in Section 3.2 through real-world evaluation.
Table 3.
Evaluation of different models on the test dataset.
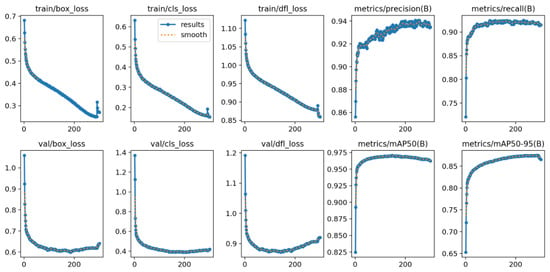
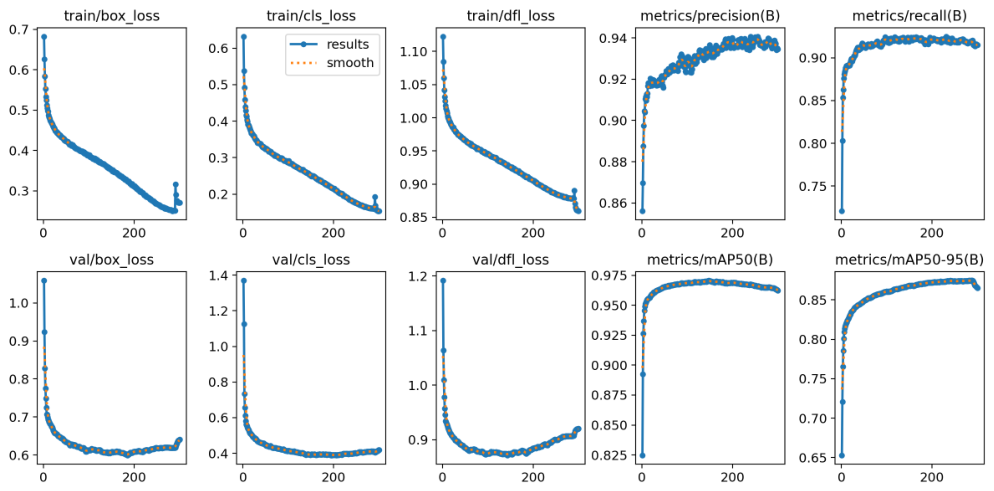
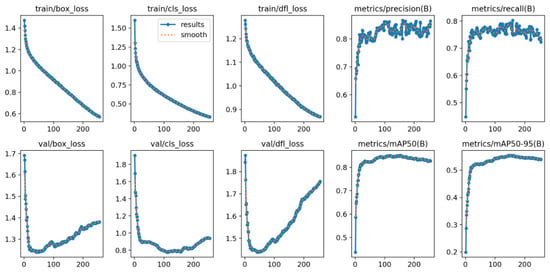
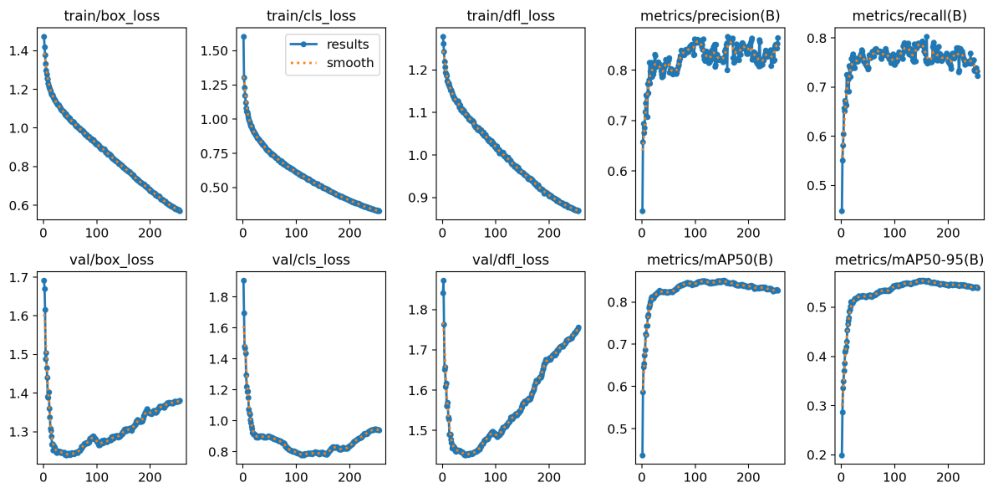
The training and validation profiles in Figure 11 and Figure 12 reveal a clear performance distinction between the baseline YOLOv11x model, trained solely on the Pyro-SDIS and D-Fire datasets, and the extended YOLOv11x model trained on a substantially larger and more heterogeneous dataset summarized in Table 1. The baseline exhibits higher overall losses, slower convergence, and early metric saturation, with box, classification, and distribution focal losses stabilizing around 0.6, 0.5, and 1.2, respectively. In contrast, the proposed model demonstrates smooth, monotonic convergence across all loss components, reaching significantly lower final values of approximately 0.28, 0.20, and 0.85 without any late-epoch rebounds, indicating stable optimization and reduced overfitting. The validation curves mirror this improvement, maintaining a consistent downward trajectory throughout 300 epochs, while the baseline begins to diverge after roughly 120 epochs. Metric trends further highlight the superiority of the extended model: precision and recall stabilize at 0.94 and 0.91, compared to 0.82 and 0.78 for the baseline, evidencing stronger calibration and higher prediction confidence. Similarly, the extended model achieves mAP@50 = 0.97 and mAP@50–95 = 0.86, surpassing the baseline’s 0.80 and 0.52, reflecting substantial gains in both detection accuracy and localization consistency. These results demonstrate that the inclusion of large-scale, diverse, and multi-source annotations decisively enhances model robustness by capturing broader feature distributions across varying atmospheric, geometric, and illumination conditions, resulting in faster convergence, improved generalization, and more reliable early smoke plume detection under real-world wildfire scenarios.
Figure 11.
Training and validation performance for the YOLOv11x model. The first three columns show convergence of Box, Classification, and Distribution Focal loss for both training (top) and validation (bottom) sets. The final two columns display primary accuracy metrics: Precision, Recall, mAP@50, and mAP@50–95. Performance stabilizes after approximately 120 epochs, reaching a precision of 0.94 and mAP@50 of 0.97, indicating robust generalization across diverse wildfire smoke conditions.
Figure 12.
Training and validation curves of the baseline YOLOv11x model. The first three columns display Box, Classification, and Distribution Focal loss; unlike the proposed model, the validation losses (bottom row) show clear divergence after epoch 100. The final two columns track Precision, Recall, and mAP metrics, which saturate at lower thresholds (mAP@50–95 of 0.52). This behavior reflects limited generalization and a higher tendency toward overfitting on the Pyro-SDIS + D-Fire dataset compared to the extended multi-source dataset.
3.2. Real World Performance
Detection time is defined as the first frame after the dataset-provided ignition reference at which a model produces a smoke detection above threshold.
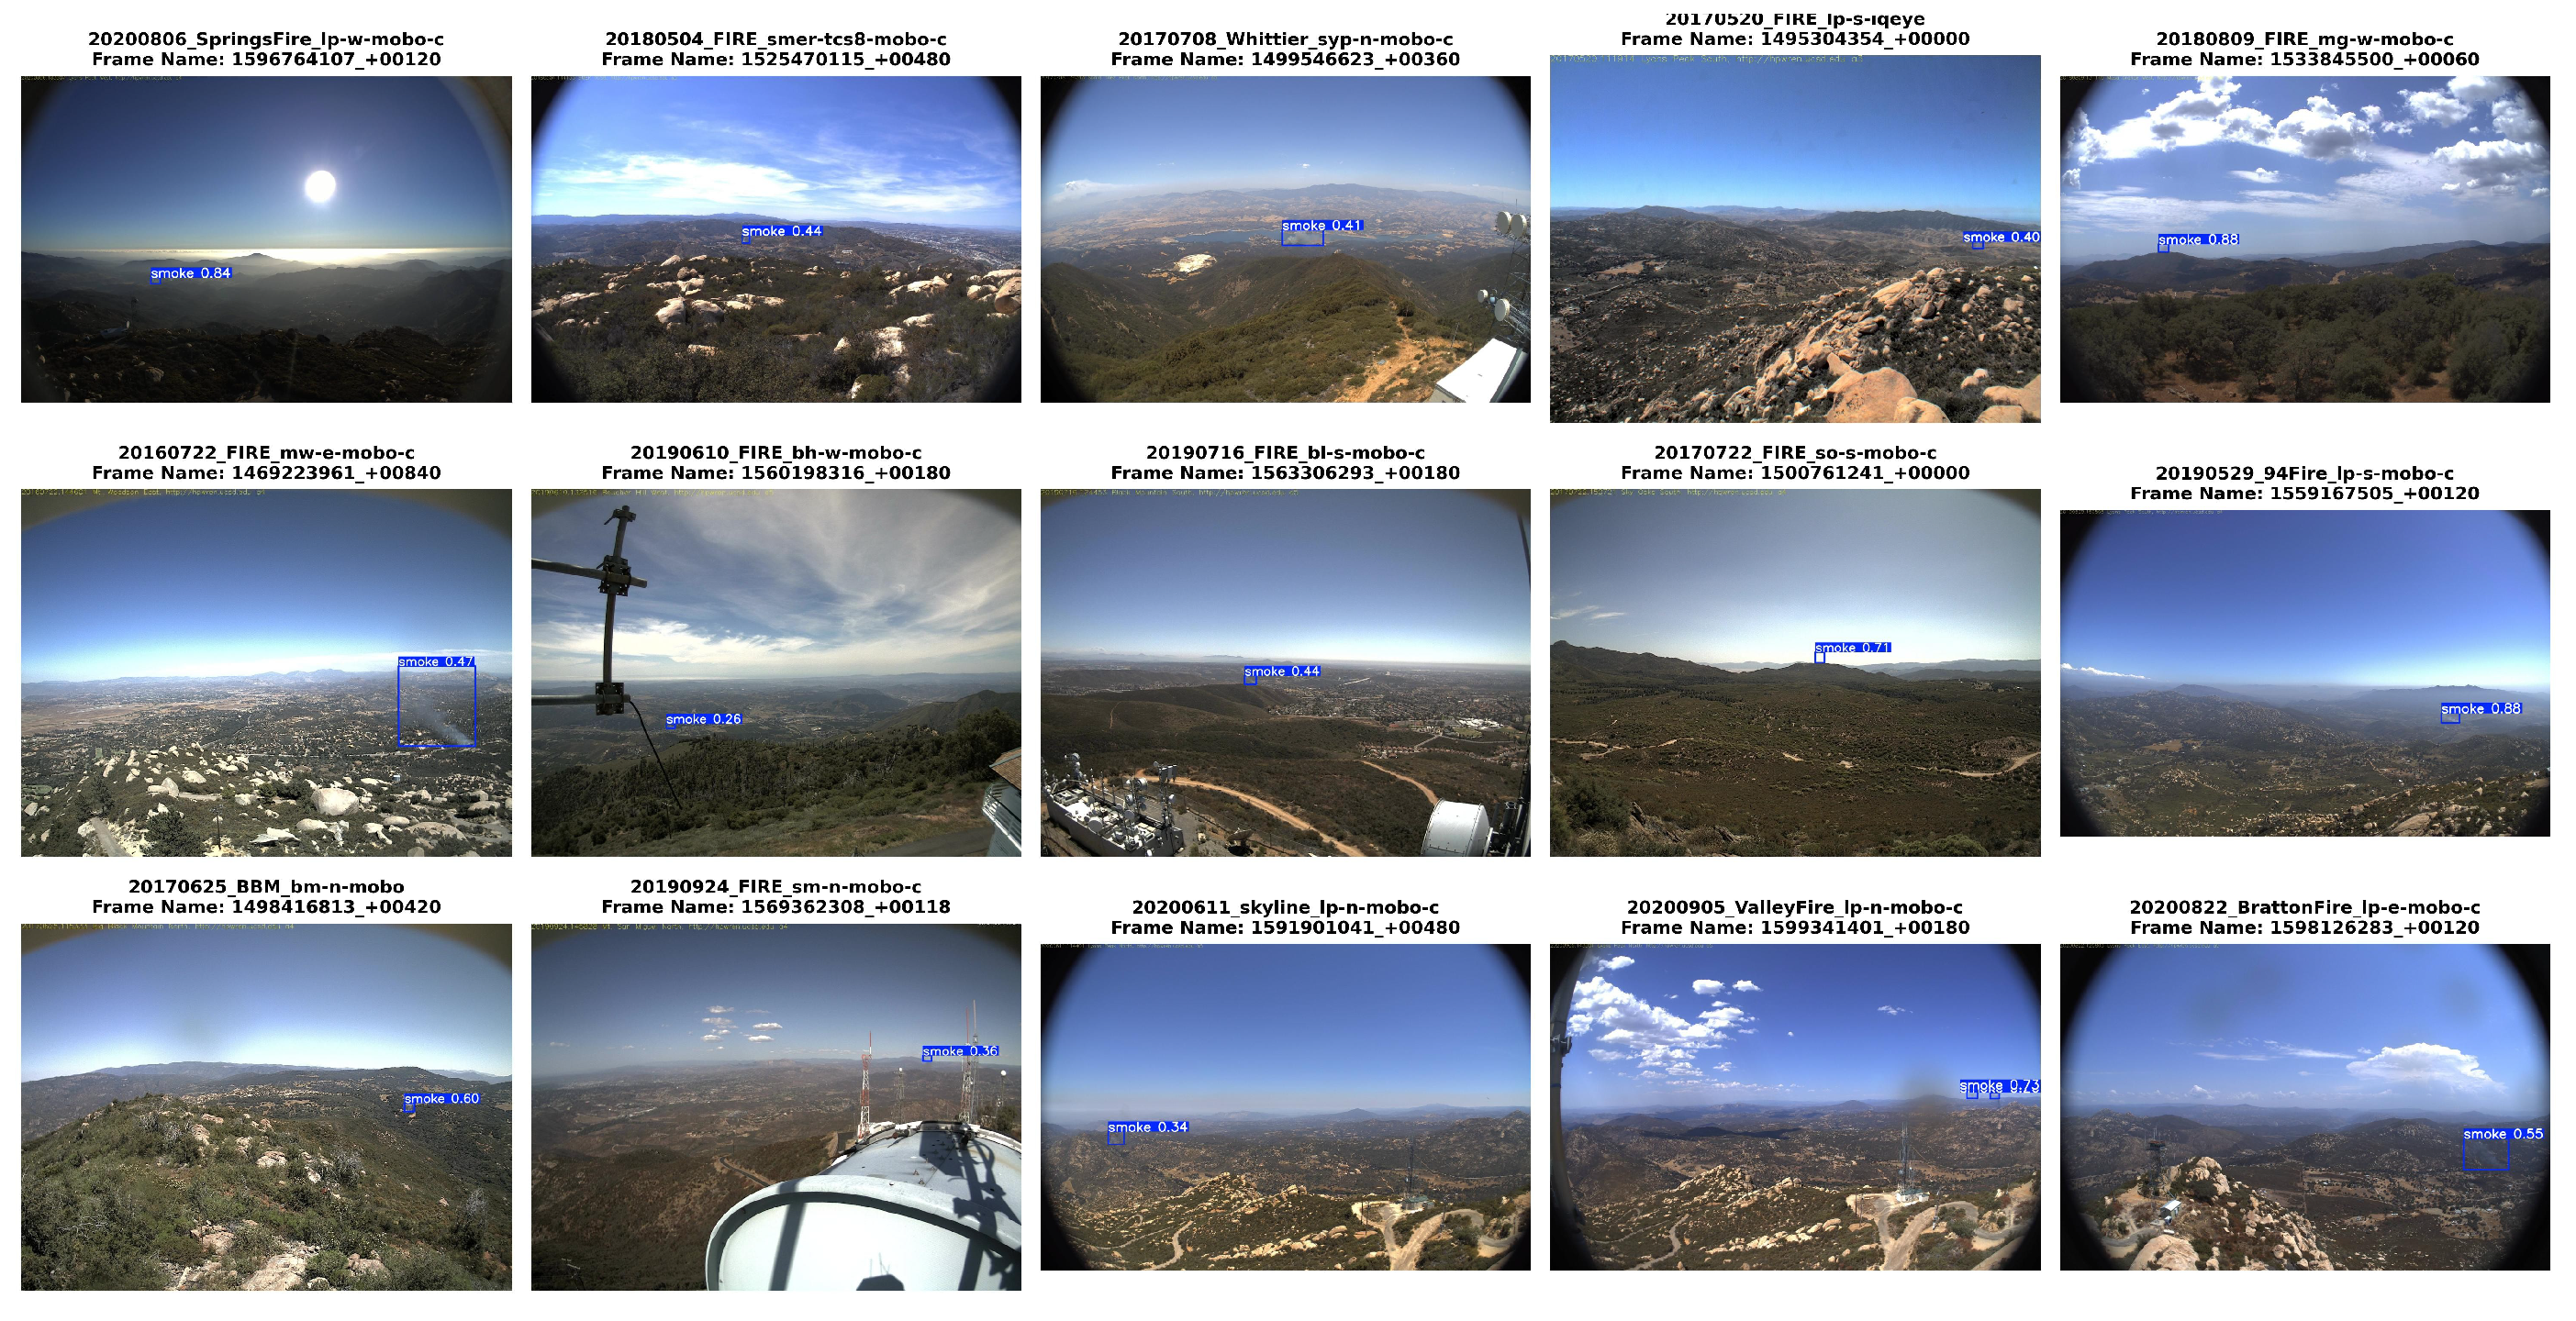
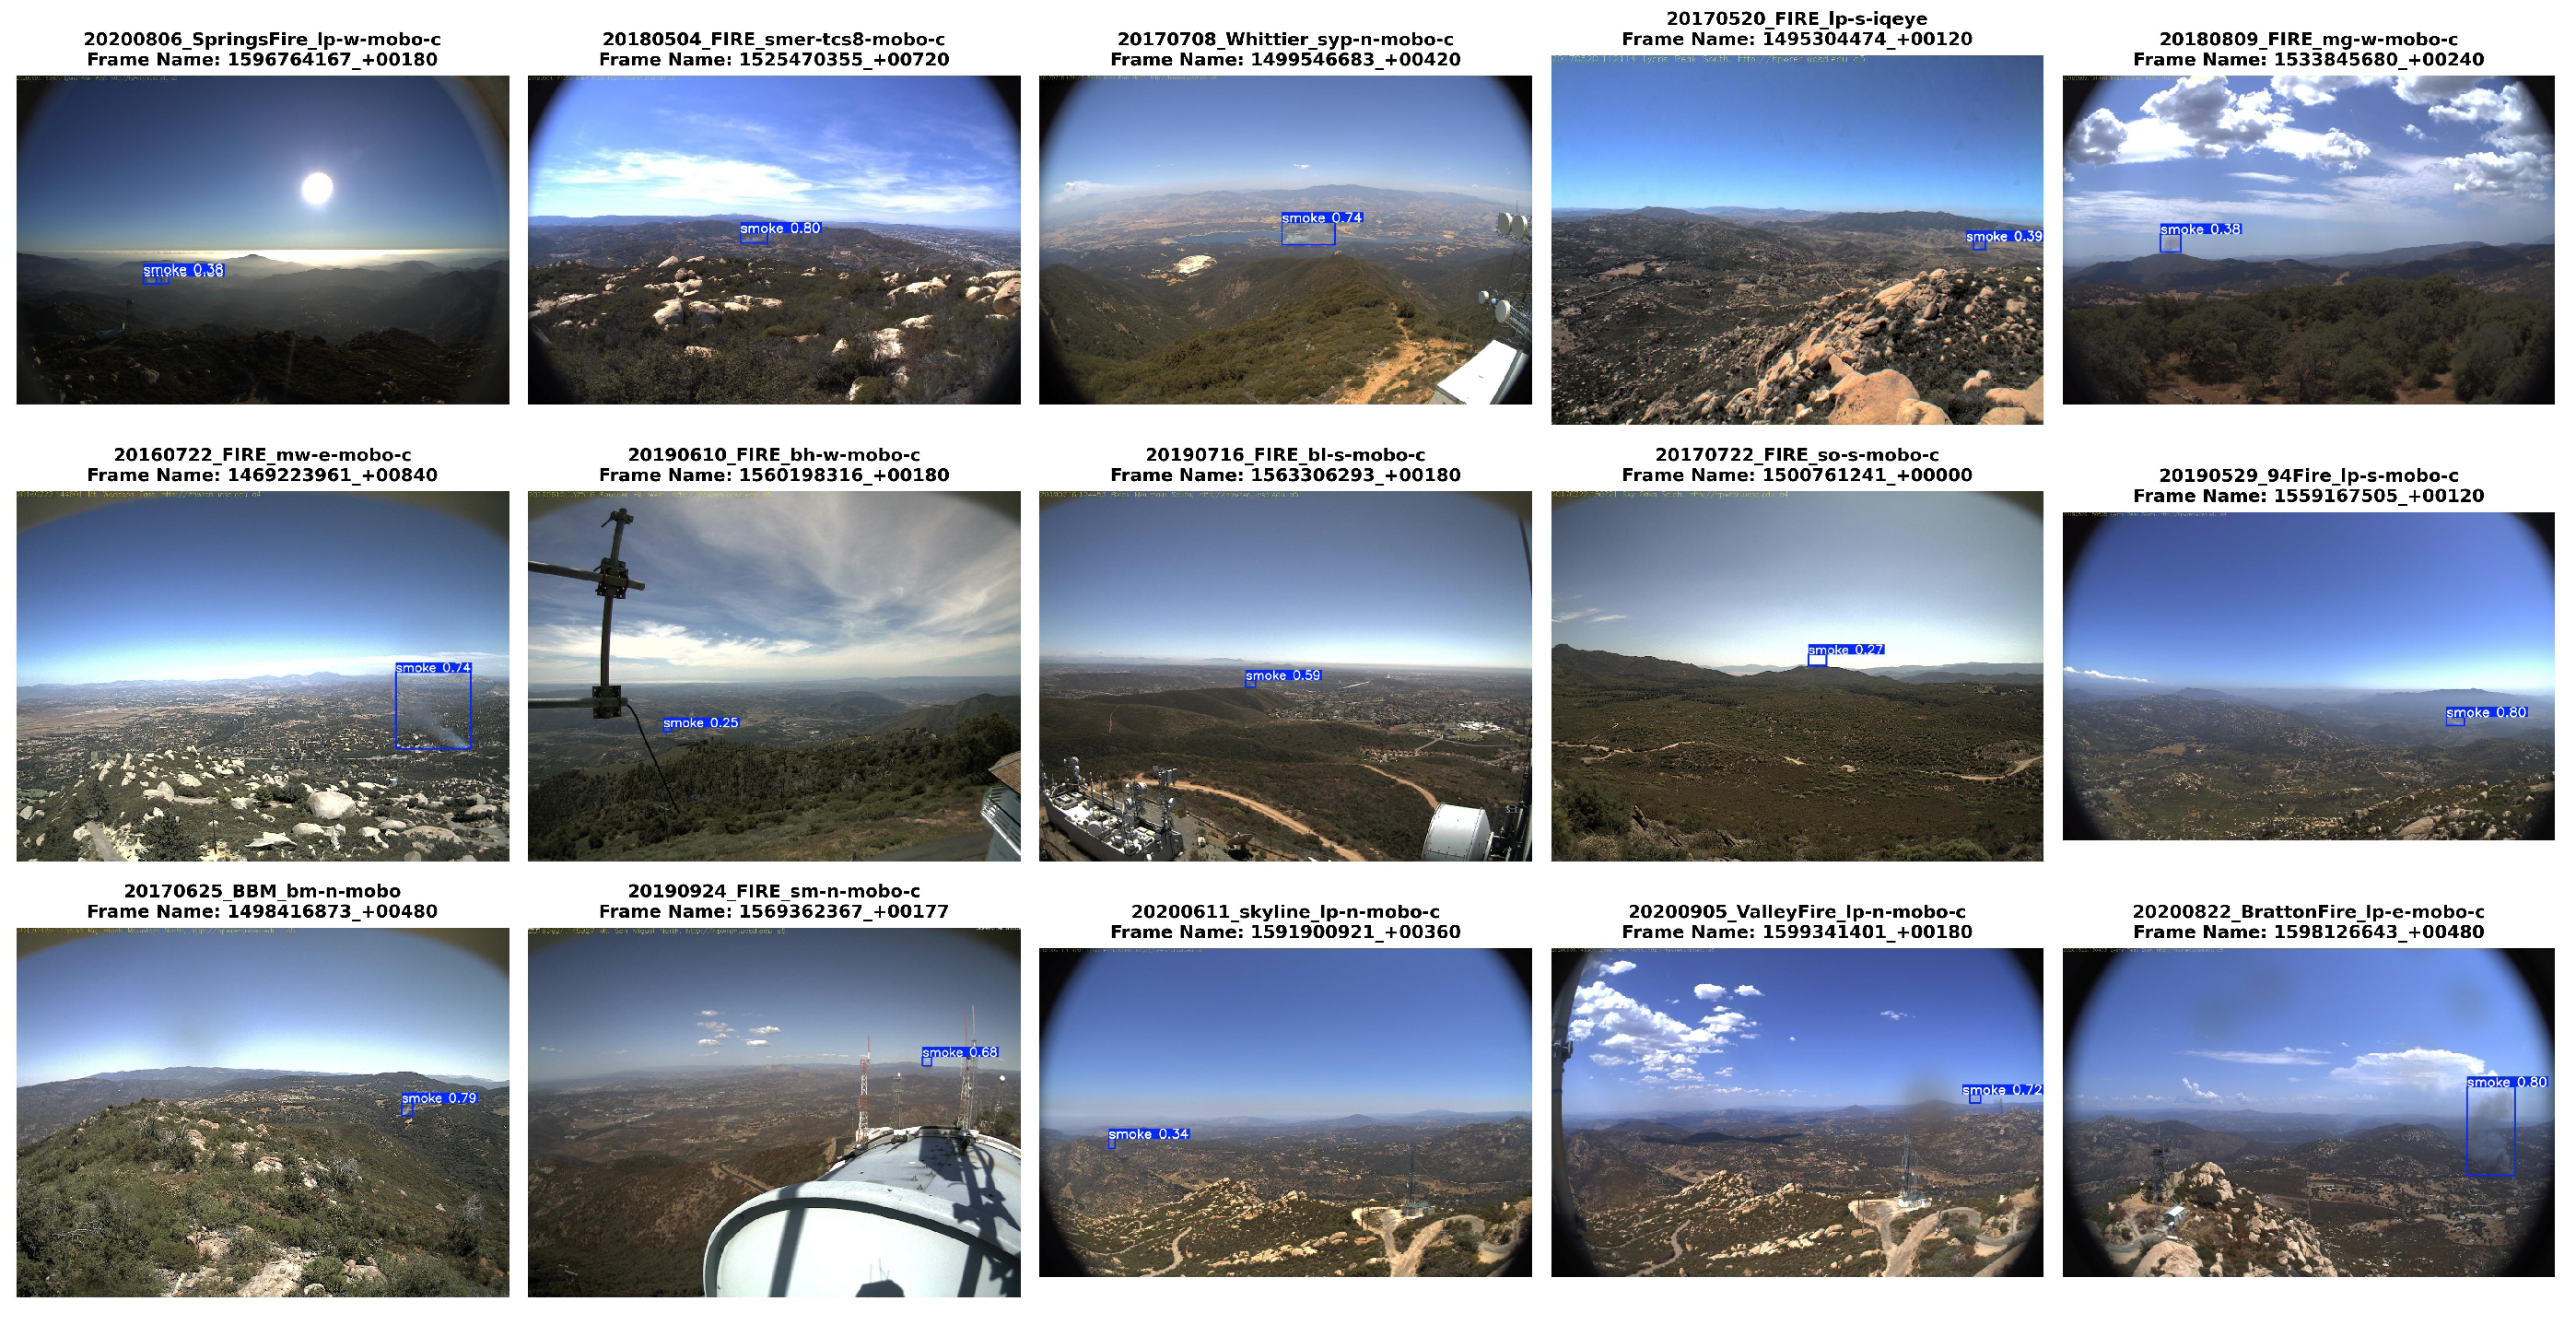
For real-time evaluation, we first applied our trained YOLOv11x and RT-DETR-L models to the 15 daytime fire sequences previously analyzed by Guede-Fernández et al. [19]. This experiment was included as a reference benchmark because it enables comparison of detection latency on the same publicly reported fire sequences. Both of our models successfully detected smoke in all 15 sequences, with RT-DETR-L detecting the developing smoke plume at an average of min after ignition (Table 4). Figure 13 and Figure 14 show representative detections from these sequences.
Table 4.
Daytime Fire Detection Time of smoke sequences extracted from the FIgLib [16] Database. We compare our model with the results reported by Guede-Fernández et al. [19].
Figure 13.
Example frames of wildfire smoke early detection using our RT-DETR-L model on 15 sequences from the FIgLib dataset [16]. The samples correspond to the events listed in Table 4, showing that the model successfully identifies smoke in diverse conditions and viewpoints, as also listed in Guede-Fernández et al. [19].
Figure 14.
Example frames of wildfire smoke early detection using our Yolov11-x model on 15 sequences from the FIgLib dataset [16]. The samples correspond to the events listed in Table 4, showing that the model successfully identifies smoke in diverse conditions and viewpoints, as also listed in Guede-Fernández et al. [19].
We emphasize, however, that this benchmark comparison is not used to claim architectural superiority over the models evaluated in prior work, since differences in training-data scale, diversity, and model development can also influence detection latency. Instead, the principal evidence for the performance of the proposed system is provided by our independent evaluation on the substantially broader 2023–2025 FIgLib dataset. This evaluation contains 144 wildfire sequences that were excluded from training and includes both daytime and nighttime events together with diverse illumination and atmospheric conditions. Under these held-out conditions, RT-DETR-L detected smoke in 111 of 144 sequences with an average latency of min, while YOLOv11x detected smoke in 110 sequences with an average latency of min. Therefore, the earlier detection observed for RT-DETR-L in this study is supported not only by the historical benchmark comparison, but also by a substantially larger and more diverse independent evaluation.
3.3. Performance Based on Image Size
We varied the input image size of the RT-DETR(l) model to analyze how resolution influences both detection performance and processing time. As summarized in Table 5, increasing the input resolution from 640 × 640 to 960 × 960 pixels led to a slight improvement in true positives (116 vs. 111 across 2023–2025), accompanied by a marginal rise in false positives. This higher resolution enhanced detection sensitivity but increased the mean detection time by roughly one minute and the standard deviation by 0.5 min, indicating a trade-off between accuracy and efficiency.
Table 5.
Evaluation of our Yolo v11x and RT DETR l on FIgLib [16] 2023–2025 Dataset.
It is important to note that the current evaluation relies on open-source static datasets rather than continuous live camera feeds. Consequently, metrics such as precision and recall provide a controlled but limited view of real-world performance. In future deployments, when continuous camera access becomes available, additional operational metrics such as the estimated number of alerts per day per 100 cameras or false-alert rates under varying environmental conditions can be incorporated. These qualitative and time-based indicators will provide a more realistic assessment of model reliability and practical usability for real-time wildfire monitoring systems.
3.4. Two-Stage Model Demonstration
The independent evaluation results indicate that YOLOv11x and RT-DETR-L exhibit complementary detection characteristics that are useful for practical wildfire monitoring. RT-DETR-L generally provides earlier smoke detection and detects a slightly larger number of ignition sequences, whereas YOLOv11x produces substantially fewer false-positive detections. These characteristics motivate an operational two-stage strategy in which RT-DETR-L serves as a high-recall early-warning detector and YOLOv11x provides a higher-precision confirmation of candidate smoke detections.
This complementary behavior is particularly apparent in the 2025 FIgLib evaluation. As reported in Table 5, RT-DETR-L correctly detected smoke in 31 of 38 sequences, compared with 30 for YOLOv11x, while achieving a substantially lower mean detection latency of min compared with min for YOLOv11x. However, RT-DETR-L produced three false-positive sequences, whereas YOLOv11x produced only one. Consequently, among sequences for which the models produced a positive response, 30 of 31 YOLOv11x responses corresponded to true smoke detections, compared with 31 of 34 RT-DETR-L responses. Thus, RT-DETR-L provides an advantage in sensitivity and detection latency, while YOLOv11x provides a more conservative confirmation signal that can reduce unnecessary alarms.
Table 6 provides a sequence-level comparison for the 31 2025 FIgLib sequences detected by both models. Detection time is reported in minutes after ignition, and TP and FP indicate true-positive and false-positive sequence classifications, respectively. The difference column is calculated as RT-DETR-L detection time minus YOLOv11x detection time; therefore, negative values indicate an earlier RT-DETR-L response. Importantly, an earlier response does not necessarily correspond to an earlier valid smoke detection, as demonstrated by the false-positive example discussed below.
Table 6.
Comparison of YOLOv11x and RT-DETR-L detections for 2025 FIgLib sequences detected by both models. Detection times are reported in minutes after ignition, with the sequence-level detection classification shown in parentheses.
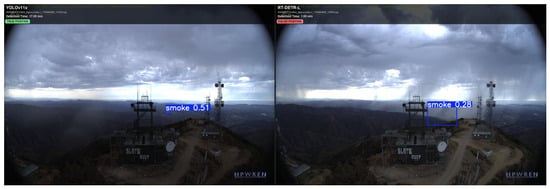
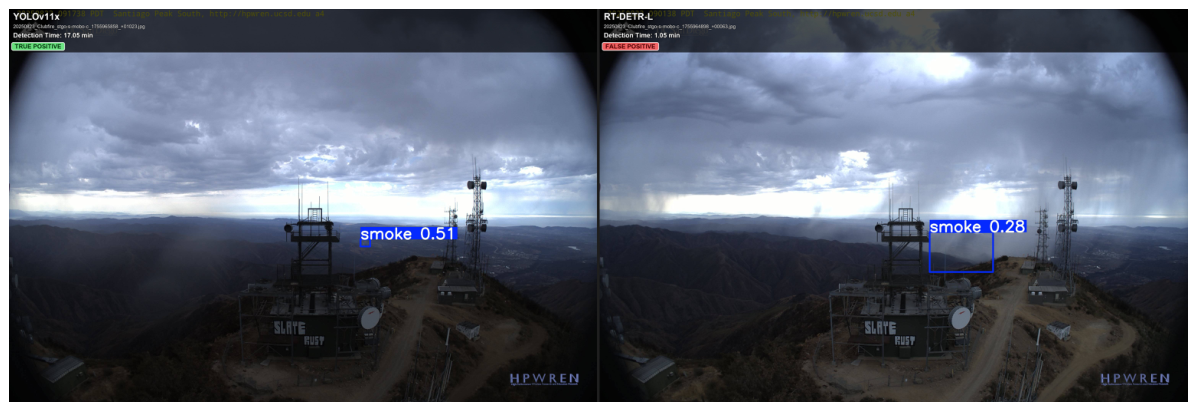
Figure 15 illustrates why detection latency must be considered together with detection correctness. For 20250823_Clubfire_stgo-s-mobo-c, RT-DETR-L produces its first response only 1.05 min after ignition, approximately 16 min earlier than the YOLOv11x detection at 17.05 min. However, visual inspection shows that the early RT-DETR-L response is a false positive, whereas the later YOLOv11x detection correctly identifies the developing smoke plume. Thus, in this sequence, the nominal latency advantage of RT-DETR-L does not translate into an earlier valid wildfire alarm.
Figure 15.
Complementary behavior of YOLOv11x and RT-DETR-L for 20250823_Clubfire_stgo-s-mobo-c. YOLOv11x produces a true-positive smoke detection at 17.05 min after ignition (left), whereas the substantially earlier RT-DETR-L response at 1.05 min is a false positive (right). This example demonstrates the value of using the higher-precision YOLOv11x detector to confirm candidate early warnings generated by RT-DETR-L.
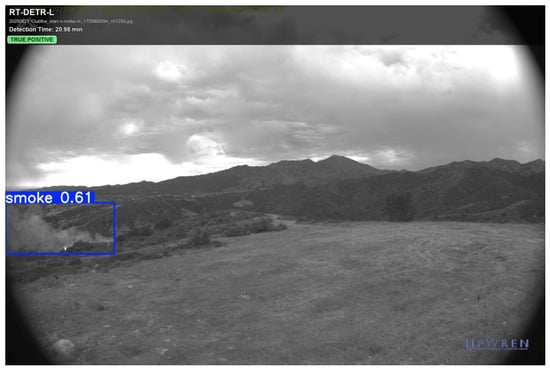
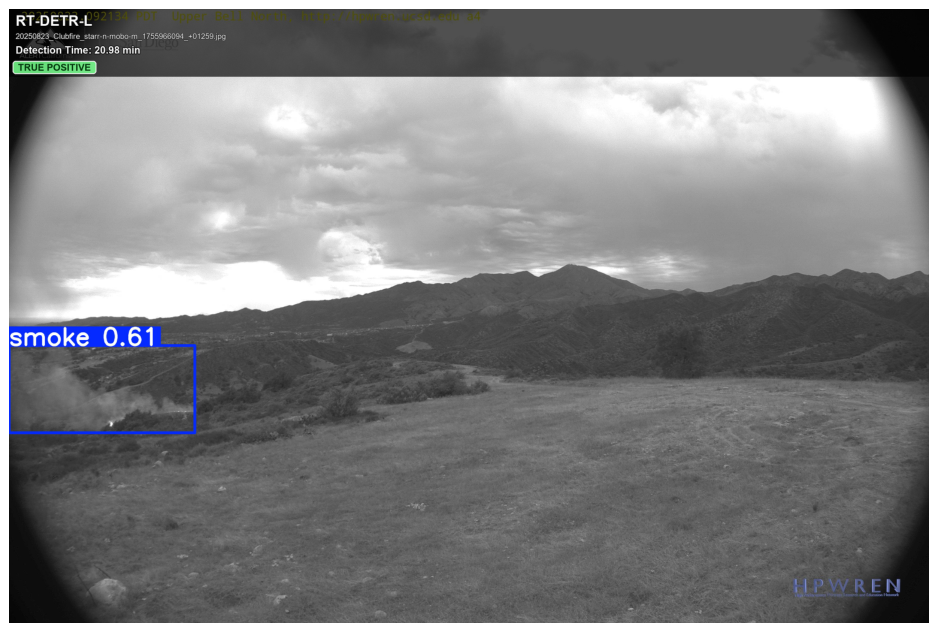
The complementary advantage of RT-DETR-L is demonstrated by a different sequence, 20250823_Clubfire_starr-n-mobo-m, shown in Figure 16. This sequence is not included in Table 6 because the table contains only sequences detected by both models. In this case, YOLOv11x produced no valid smoke detection, whereas RT-DETR-L successfully detected the smoke plume at 20.98 min after ignition. This sequence therefore demonstrates the additional sensitivity provided by RT-DETR-L and explains why relying exclusively on the higher-precision YOLOv11x detector could result in missed wildfire events.
Figure 16.
Example of the complementary sensitivity of RT-DETR-L for 20250823_Clubfire_starr-n-mobo-m. RT-DETR-L correctly detects the visible smoke plume at 20.98 min after ignition, whereas YOLOv11x produces no valid smoke detection for this sequence. This example demonstrates the value of RT-DETR-L as the high-recall component of the proposed two-stage strategy.
The only YOLOv11x false-positive sequence in the 2025 evaluation further illustrates the conservative nature of our evaluation protocol. For 20250123_Border2Fire_om-w-mobo-c, YOLOv11x initially responds to a lake region at timestamp 1737667438. Although the model subsequently detects the actual wildfire smoke at approximately 10.98 min after ignition, the sequence remains categorized as a false positive because the first model-generated alarm did not correspond to smoke. This strict first-alarm criterion prevents a later correct detection from concealing an earlier erroneous alarm and therefore provides a more conservative assessment of operational reliability.
Taken together, these observations support the use of YOLOv11x and RT-DETR-L as complementary components rather than as competing alternatives. RT-DETR-L provides greater sensitivity and generally lower detection latency, making it suitable for generating early candidate alarms. YOLOv11x, in contrast, produces substantially fewer false positives and can therefore provide a more conservative confirmation signal. An operational two-stage strategy can therefore exploit the sensitivity of RT-DETR-L for early warning while using YOLOv11x confirmation to reduce the likelihood that clouds, water surfaces, illumination changes, or other smoke-like scene features generate false alarms.
3.5. Spatial and Meteorological Correlation Analysis
Pearson correlation analysis was used to examine the relationships between camera location, elevation, ignition-hour meteorological conditions, and the video-level true-positive (TP), false-positive (FP), and false-negative (FN) outcomes of RT-DETR-L and YOLOv11x. Because the TP, FP, and FN variables were represented as binary video-level outcomes, these analyses are equivalent to point-biserial correlations. Weather variables were obtained through Google Earth Engine for the corresponding camera location and ignition hour.
For each correlation, the Pearson correlation coefficient (r), two-sided p-value, number of valid observations (N), number of videos belonging to the positive outcome category, and 95% confidence interval were calculated. Confidence intervals were estimated using bootstrap resampling at the video level. Because some FP and FN categories contained relatively few positive observations, correlations involving these sparse outcome categories were considered exploratory and were interpreted cautiously.
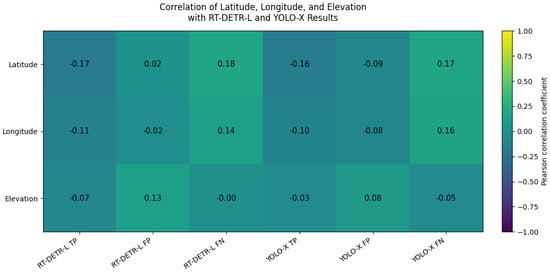
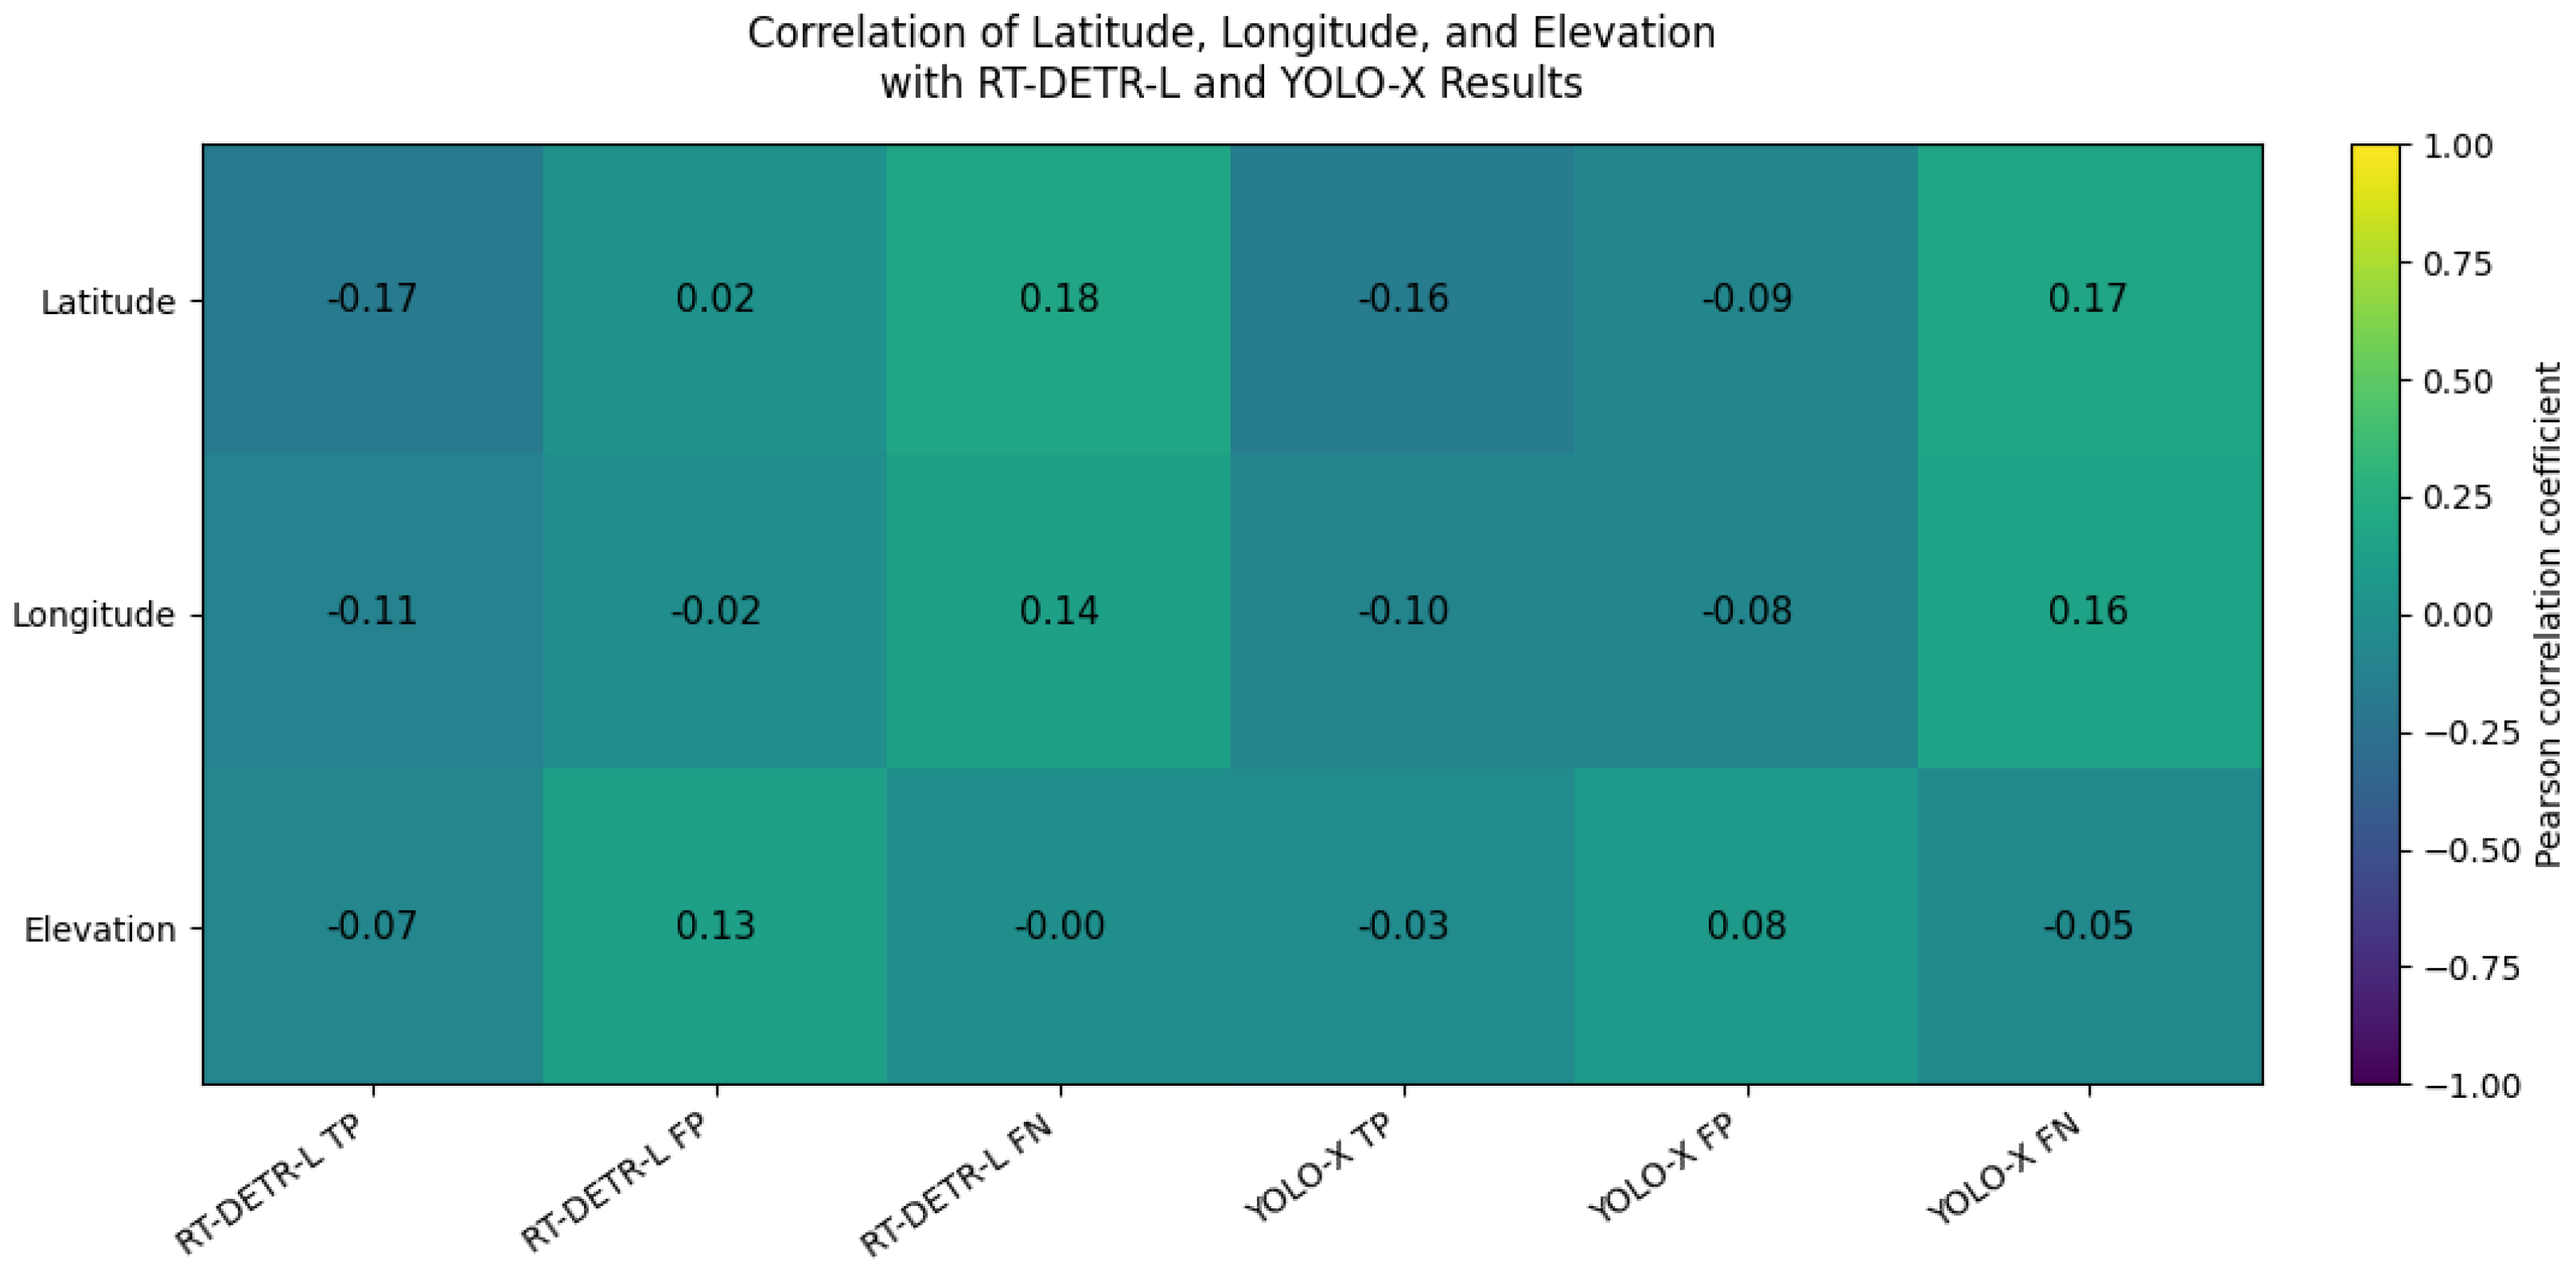
As shown in Figure 17, the spatial variables exhibited only weak associations with model outcomes, with all absolute correlation coefficients below 0.20. Latitude was weakly positively associated with false-negative outcomes for RT-DETR-L () and YOLOv11x (), whereas correlations involving elevation ranged from to . Longitude similarly showed only weak associations with model outcomes. Overall, the magnitude of these correlations provides little evidence of a strong linear relationship between camera location or elevation and model prediction outcomes within the evaluated camera network. However, given the limited number of observations in some error categories, these associations should not be interpreted as evidence of complete spatial invariance.
Figure 17.
Pearson correlation analysis between camera latitude, longitude, and elevation and the video-level prediction outcomes of RT-DETR-L [25] and YOLOv11x [22]. Heatmap cells report the Pearson correlation coefficient (r) and corresponding two-sided p-value. Correlations involving sparse TP, FP, or FN categories should be interpreted cautiously.
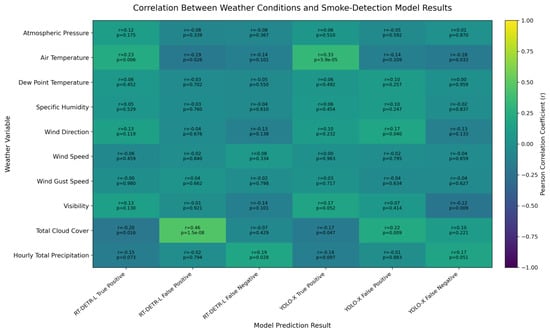
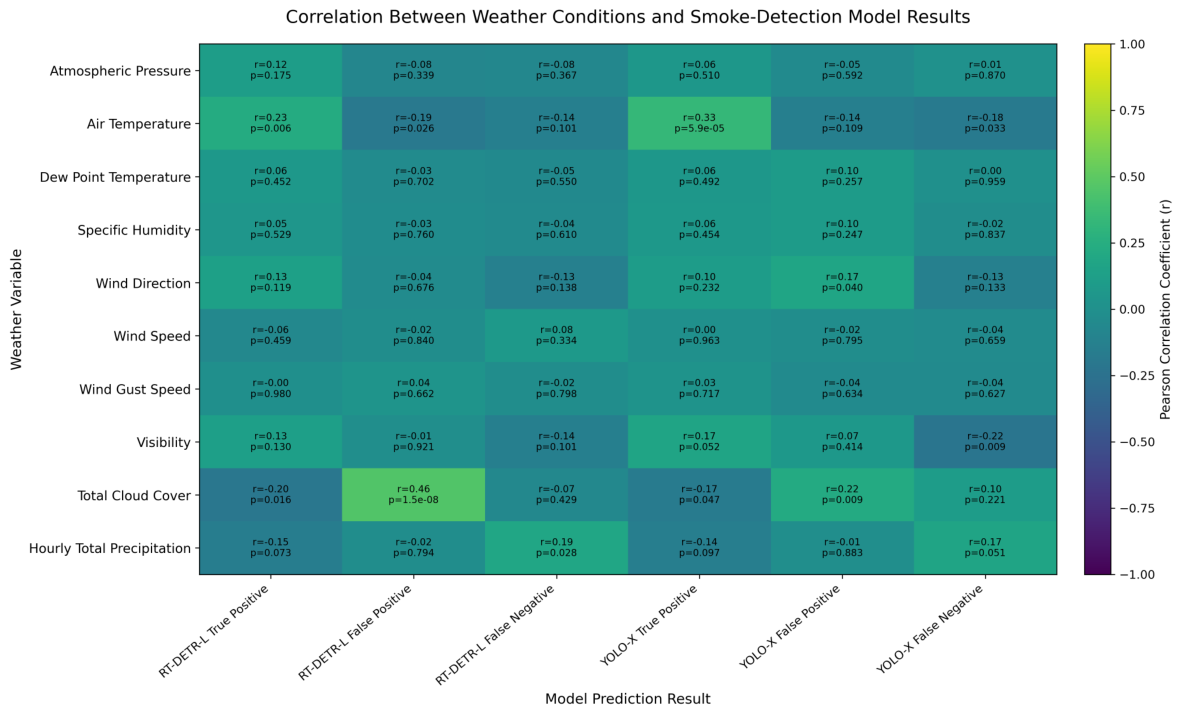
The relationships between ignition-hour meteorological conditions and model outcomes are shown in Figure 18. Most meteorological variables exhibited weak linear associations with model outcomes. Total cloud cover showed the largest observed correlation, particularly with RT-DETR-L false-positive outcomes (, ). A weaker positive association was observed between total cloud cover and YOLOv11x false positives (, ).
Figure 18.
Pearson correlation analysis between ignition-hour meteorological variables retrieved through Google Earth Engine [27] and the video-level prediction outcomes of RT-DETR-L [25] and YOLOv11x [22]. Each heatmap cell reports the Pearson correlation coefficient (r) and its corresponding two-sided p-value.
Air temperature was positively associated with true-positive outcomes for both RT-DETR-L (, ) and YOLOv11x (, ). Air temperature was also negatively associated with RT-DETR-L false positives (, ) and YOLOv11x false negatives (, ).
Visibility showed a negative association with YOLOv11x false-negative outcomes (, ), indicating that false-negative outcomes were less frequent under conditions of greater visibility in this dataset. Hourly precipitation showed a weak positive association with RT-DETR-L false negatives (, ), while the corresponding association for YOLOv11x was similar in magnitude but more uncertain (, ).
Total cloud cover was additionally negatively associated with RT-DETR-L true positives (, ) and YOLOv11x true positives (, ). In contrast, atmospheric pressure, dew-point temperature, specific humidity, wind speed, and wind-gust speed generally exhibited weak or negligible correlations with model outcomes.
These results indicate that cloud cover and, to a lesser extent, temperature and visibility may be associated with variation in smoke-detection outcomes. However, the observed correlations should not be interpreted as causal effects. Several FP and FN categories contained only a small number of positive videos, which can increase the uncertainty and instability of correlation estimates. Accordingly, correlations involving these sparse categories are treated as exploratory. Furthermore, the present univariate analysis does not account for interactions among meteorological variables, repeated observations from the same camera, seasonal variation, time of day, or imbalance among prediction-outcome categories.
3.6. Discussion
The results show a consistent operational trade-off between the two detectors. RT-DETR-L provides earlier, recall-oriented alerts, whereas YOLOv11x is more conservative and produces fewer false positives. This complementarity supports the proposed two-stage use of RT-DETR-L as a trigger and YOLOv11x as a confirmation model. The temporally independent FIgLib evaluation further indicates that the observed performance extends beyond a randomized hold-out split, although nighttime, fog, low-light, and cloud conditions remain the principal failure modes.
The image-size experiments show that higher resolution can increase the number of detected events, but the relationship among resolution, detection latency, and false positives is not monotonic. The meteorological analysis also indicates that cloud cover has the strongest observed association with false positives, particularly for RT-DETR-L, whereas the spatial variables show only weak associations with model outcomes. These findings support the use of additional verification under adverse visibility and cloud conditions before escalating an operational alert.
The present evaluation is based on archived open-source camera sequences rather than continuous live camera feeds. Future deployment-oriented evaluation should therefore quantify false-alert frequency over continuous operation, camera-specific behavior, and alert burden, while expanding nighttime and low-light training data to address the dominant failure conditions identified in the current benchmark.
4. Conclusions
This study introduced a scalable wildfire-smoke labeling framework based on SAM2-assisted temporal mask propagation, with particular emphasis on reverse-frame propagation for recovering annotations near the earliest visible stages of smoke development. By integrating D-Fire, Pyro-SDIS, FIgLib, and AlertCalifornia imagery, the proposed workflow produced a diverse training resource containing 170,573 frames and 128,185 smoke bounding boxes while reducing dependence on manual frame-by-frame annotation.
The trained models were evaluated on temporally independent FIgLib sequences from 2023–2025 that were excluded from model development. Across 144 ignition sequences, RT-DETR-L achieved 111 true-positive detections with a mean detection time of min, while YOLOv11x achieved 110 true-positive detections with a mean detection time of min. YOLOv11x produced 4 false-positive videos compared with 10 for RT-DETR-L. Sequence-level analysis further showed that detection latency alone is insufficient for assessing operational performance, since an earlier response can occasionally correspond to a false alarm. The two detectors can therefore be used jointly when an application requires both early candidate detection and subsequent confirmation, as demonstrated in Section 3.4.
The remaining failure cases were concentrated primarily under difficult nighttime, fog, cloud, and low-visibility conditions. Meteorological analysis further indicated that total cloud cover had the strongest observed association with false-positive behavior, particularly for RT-DETR-L, whereas spatial variables exhibited comparatively weak relationships with model outcomes. These findings identify adverse visibility as an important target for future dataset expansion and model development.
Overall, the principal contribution of this work is the reverse-time SAM2 labeling strategy and the resulting scalable workflow for generating supervision for faint, early-stage wildfire smoke. Future work should evaluate the system on continuous live-camera streams, quantify operational false-alert rates and alert frequency, and expand nighttime and adverse-weather training data to further improve reliability under deployment conditions.
Supplementary Materials
The following supporting information can be downloaded at https://www.mdpi.com/article/10.3390/rs18193315/s1.
Author Contributions
Conceptualization, S.A.N. and I.B.; methodology, S.A.N.; software, S.A.N.; validation, S.A.N.; formal analysis, S.A.N. and I.B.; investigation, S.A.N., C.Z. and I.B.; resources, I.B.; data curation, S.A.N.; writing—original draft preparation, S.A.N.; writing—review and editing, C.Z. and I.B.; visualization, S.A.N.; supervision, C.Z. and I.B.; project administration, I.B.; funding acquisition, I.B. All authors have read and agreed to the published version of the manuscript.
Funding
University of Florida and Kartasoft.
Data Availability Statement
The data are available from the authors upon request.
Conflicts of Interest
Author Srikantnag Angondalli Nagaraja was employed by the company KartaSoft. The remaining authors declare that the research was conducted in the absence of any commercial or financial relationships that could be construed as a potential conflict of interest.
Appendix A. Base Model
The YOLOv11x [22] and RT-DETR-l [25] base models were trained on a unified dataset constructed by merging the D-Fire and Pyro-SDIS collections. The combined dataset was partitioned into 80% for training, 15% for validation, and 5% for testing. Training was conducted for 300 epochs with a batch size of 64 and an input resolution of 640 pixels. A cosine-annealing learning-rate schedule was employed, decreasing from 0.0001 to 0.00001 with a two-epoch warm-up period, and the Adam optimizer was used for model optimization.
Table A1.
Evaluation of base models on the test dataset.
The trained YOLOv11x model was subsequently employed, in conjunction with SAM2, to automatically annotate the Alert California dataset as described in Section 2.4. The quantitative evaluation of the YOLOv11x and RT-DETR-l base models on the test set is summarized in Table A1.
Appendix A.1. Performance of Base Model
As shown in Table A2, the YOLOv11x and RT-DETR-L base models trained solely on the D-Fire and Pyro-SDIS datasets exhibit a higher number of false positives compared to our model trained on a more diverse dataset (Table 5). For instance, the RT-DETR-L model produced 37 false positives even before ignition. Although it successfully detected 96 fires at the moment of ignition in real-time, such a high false-positive rate would increase the need for human oversight and reduce the overall reliability of the system.
Table A2.
Evaluation of base models on the FIgLib [16] 2023–2025 dataset.
Appendix A.2. FIgLib SAM2 Quality Control
During visual quality control of the FIgLib training data from 2016–2021, 12 videos were removed because SAM2 propagated masks over non-smoke regions. The excluded sequences and reasons are listed in Table A3.
The cell-tower cases illustrate an important limitation of long-range SAM2 propagation. A cell tower falsely segmented in 20180728-FIRE-rm-w-mobo-c persisted through SAM2 memory and propagated into the subsequently concatenated 20180727-FIRE-bl-e-mobo-c sequence. This shows that false masks can persist across artificial video boundaries when independently recorded sequences are concatenated without resetting the SAM2 memory state. Similar errors were observed for lakes, clouds, fog, illumination effects, cloud shadows, and vegetation. These sequences were therefore removed before the generated annotations were used for detector training.
Table A3.
FIgLib training videos removed during SAM2 quality control.
References
- National Interagency Fire Center. National Fire News. Available online: https://www.nifc.gov/fire-information/nfn (accessed on 20 August 2025).
- National Interagency Fire Center. Wildfires and Acres. Available online: https://www.nifc.gov/fire-information/statistics/wildfires (accessed on 20 August 2025).
- Alberts, E.C. “Off the Chart”: CO2 from California Fires Dwarf State’s Fossil Fuel Emissions. 2020. Available online: https://news.mongabay.com/2020/09/off-the-chart-co2-from-california-fires-dwarf-states-fossil-fuel-emissions/ (accessed on 20 August 2025).
- Zhang, A.; Zhang, A.S. Real-Time Wildfire Detection and Alerting with a Novel Machine Learning Approach. Int. J. Adv. Comput. Sci. Appl. (IJACSA) 2022, 13, 1–5. [Google Scholar] [CrossRef] [Scilit]
- Shi, J.; Wang, W.; Gao, Y.; Yu, N. Optimal Placement and Intelligent Smoke Detection Algorithm for Wildfire-Monitoring Cameras. IEEE Access 2020, 8, 72326–72339. [Google Scholar] [CrossRef] [Scilit]
- Mumuni, A.; Mumuni, F. Data augmentation: A comprehensive survey of modern approaches. Array 2022, 16, 100258. [Google Scholar] [CrossRef] [Scilit]
- Dietterich, T.G. Machine Learning for Sequential Data: A Review. In Proceedings of the Structural, Syntactic, and Statistical Pattern Recognition (SSPR/SPR 2002); Lecture Notes in Computer Science; Springer: Berlin/Heidelberg, Germany, 2002; Volume 2396, pp. 15–30. [Google Scholar] [CrossRef] [Scilit] [PubMed]
- Ng, A.Y.; Jordan, M.I. On Discriminative vs. Generative Classifiers: A comparison of logistic regression and naive Bayes. Proc. Adv. Neural Inf. Process. Syst. 2001, 14, 841–848. [Google Scholar]
- Sebastiani, F. Machine Learning in Automated Text Categorization. ACM Comput. Surv. 2002, 34, 1–47. [Google Scholar] [CrossRef] [Scilit]
- Russakovsky, O.; Deng, J.; Su, H.; Krause, J.; Satheesh, S.; Ma, S.; Huang, Z.; Karpathy, A.; Khosla, A.; Bernstein, M.; et al. ImageNet Large Scale Visual Recognition Challenge. Int. J. Comput. Vis. 2015, 115, 211–252. [Google Scholar] [CrossRef] [Scilit]
- Ravi, N.; Gabeur, V.; Hu, Y.T.; Hu, R.; Ryali, C.; Ma, T.; Khedr, H.; Rädle, R.; Rolland, C.; Gustafson, L.; et al. SAM 2: Segment Anything in Images and Videos. arXiv 2025. [Google Scholar] [CrossRef] [Scilit]
- Zhang, Y.; Shen, Z.; Jiao, R. Segment Anything Model for Medical Image Segmentation: Current Applications and Future Directions. Comput. Biol. Med. 2024, 171, 108238. [Google Scholar] [CrossRef] [Scilit] [PubMed]
- Parulekar, B.; Singh, N.; Ramiya, A.M. Evaluation of Segment Anything Model (SAM) for Automated Labelling in Machine Learning Classification of UAV Geospatial Data. Earth Sci. Inform. 2024, 17, 4407–4418. [Google Scholar] [CrossRef] [Scilit]
- Kovačević, V.; Pejak, B.; Marko, O. Enhancing Machine Learning Crop Classification Models through SAM-based Field Delineation Based on Satellite Imagery. In Proceedings of the 2024 12th International Conference on Agro-Geoinformatics (Agro-Geoinformatics), Novi Sad, Serbia, 15–18 July 2024; pp. 1–4. [Google Scholar] [CrossRef] [Scilit]
- ALERTCalifornia Program. ALERTCalifornia: Statewide Wildfire and Natural Hazard Monitoring Network. University of California, San Diego. 2025. Available online: https://alertcalifornia.ucsd.edu/ (accessed on 5 July 2025).
- Braun, H.W. HPWREN Fire Ignition Image Library (FIgLib). 2020. High Performance Wireless Research and Education Network (HPWREN), University of California, San Diego. Last Updated: 18 December 2024. Available online: https://www.hpwren.ucsd.edu/FIgLib/ (accessed on 5 July 2025).
- Borges de Venâncio, P.V.A.; Lisboa, A.C.; Barbosa, A.V. An automatic fire detection system based on deep convolutional neural networks for low-power, resource-constrained devices. Neural Comput. Appl. 2022, 34, 15349–15368. [Google Scholar] [CrossRef] [Scilit]
- Pyronear Team. Pyro-SDIS Dataset. Hugging Face, 2024. Available online: https://huggingface.co/datasets/pyronear/pyro-sdis (accessed on 5 May 2025).
- Guede-Fernández, F.; Martins, L.; de Almeida, R.V.; Gamboa, H.; Vieira, P. A Deep Learning Based Object Identification System for Forest Fire Detection. Fire 2021, 4, 75. [Google Scholar] [CrossRef] [Scilit]
- Park, G.; Lee, Y. Wildfire Smoke Detection Enhanced by Image Augmentation with StyleGAN2-ADA for YOLOv8 and RT-DETR Models. Remote Sens. 2025, 7, 369. [Google Scholar] [CrossRef] [Scilit]
- yt-dlp Developers. yt-dlp: A Feature-Rich Command-Line Audio/Video Downloader. 2025. Available online: https://github.com/yt-dlp/yt-dlp (accessed on 10 September 2025).
- Khanam, R.; Hussain, M. YOLOv11: An Overview of the Key Architectural Enhancements. arXiv 2024, arXiv:2410.17725. [Google Scholar] [CrossRef] [Scilit]
- High Performance Wireless Research and Education Network. HPWREN Camera Network. Available online: https://www.hpwren.ucsd.edu/cameras/#mode=realTime&realTimeShowType=color&cams= (accessed on 15 July 2026).
- Google Earth Engine Data Catalog. NOAA/NWS Real-Time Mesoscale Analysis (RTMA). Available online: https://developers.google.com/earth-engine/datasets/catalog/NOAA_NWS_RTMA (accessed on 18 July 2026).
- Zhao, Y.; Lv, W.; Xu, S.; Wei, J.; Wang, G.; Dang, Q.; Liu, Y.; Chen, J. DETRs Beat YOLOs on Real-time Object Detection. arXiv 2023, arXiv:2304.08069. [Google Scholar]
- University of Florida Research Computing. HiPerGator—Research Computing, University of Florida. 2025. Available online: https://www.rc.ufl.edu/hipergator/ (accessed on 6 September 2025).
- Gorelick, N.; Hancher, M.; Dixon, M.; Ilyushchenko, S.; Thau, D.; Moore, R. Google Earth Engine: Planetary-scale geospatial analysis for everyone. Remote Sens. Environ. 2017, 202, 18–27. [Google Scholar] [CrossRef] [Scilit]

Disclaimer/Publisher’s Note: The statements, opinions and data contained in all publications are solely those of the individual author(s) and contributor(s) and not of MDPI and/or the editor(s). MDPI and/or the editor(s) disclaim responsibility for any injury to people or property resulting from any ideas, methods, instructions or products referred to in the content. |
© 2026 by the authors. Licensee MDPI, Basel, Switzerland. This article is an open access article distributed under the terms and conditions of the Creative Commons Attribution (CC BY) license.