


Highlights
What are the main findings?
- Five dominant AOD spatial organizations characterize global aerosol variability within each climatological season, with spatial patterns consistent with major aerosol source regions and transport pathways.
- Global AOD variability is characterized by the seasonal redistribution and interannual variability of recurrent spatial organizations rather than by fundamental changes in their geographical structures.
What are the implications of the main findings?
- The proposed season-specific framework provides a compact and physically interpretable representation of seasonal and interannual global AOD variability from satellite observations.
- The framework establishes a general low-dimensional strategy for analyzing long-term Earth observation datasets through recurrent spatial organizations and their temporal variability.
Abstract
This study presents a season-specific non-negative matrix factorization (NMF) framework for investigating the long-term spatiotemporal variability of global aerosol optical depth (AOD) at 550 nm using monthly MODIS Collection 6.1 observations (MOD08_M3) spanning 2000–2025. To maximize spatial completeness in the long-term dataset, NMF is performed independently for each calendar month, followed by a season-specific mode-matching strategy that establishes consistent correspondence among the extracted spatial organizations within each climatological season. The proposed framework represents the global AOD field using a limited number of dominant spatial organizations and their corresponding temporal coefficients, revealing recurrent AOD patterns spatially associated with major continental aerosol regions, trans-Atlantic Saharan dust transport, biomass-burning regions over tropical Africa and South America, and large-scale continental background variability. The extracted spatial organizations remain highly coherent within individual seasons, while their temporal coefficients exhibit pronounced interannual variability. Independent assessment using the MODIS Deep Blue Ångström exponent provides complementary particle-size information that supports the physical interpretation of these AOD spatial organizations. These results demonstrate that global AOD variability can be characterized by the seasonal redistribution and varying expression of recurrent spatial organizations rather than by fundamental changes in their geographical structures. This framework provides a compact, physically interpretable, and low-dimensional representation of global aerosol spatial and temporal variability and establishes a general strategy for investigating long-term satellite observations of atmospheric and other Earth system variables.
1. Introduction
Atmospheric aerosols are a fundamental and highly dynamic component of the Earth system, profoundly influencing the planetary radiative balance, atmospheric chemistry, cloud microphysical processes, ecosystem productivity, and human health [1,2,3,4]. By scattering and absorbing solar radiation, these liquid and solid particles directly modulate the top-of-atmosphere (TOA) energy budget and drive changes in the atmospheric thermal structure [5,6,7]. Concurrently, they serve as cloud condensation nuclei and ice nuclei, thereby governing cloud albedo, lifetime, and subsequent precipitation efficiency [8,9,10,11,12,13]. Owing to their diverse chemical compositions, short tropospheric lifetimes, and sporadic transport pathways, aerosol distributions exhibit pronounced spatiotemporal heterogeneity. Consequently, identifying the dominant mechanisms that govern this large-scale variability remains a paramount yet challenging prerequisite in modern climate research [14,15,16,17].
Over the past two decades, space-borne remote sensing has fundamentally improved our ability to observe and monitor aerosol properties from a planetary perspective [18,19,20,21,22,23]. Among operational satellite radiometers, the Moderate Resolution Imaging Spectroradiometer (MODIS) aboard the Terra and Aqua platforms provides one of the longest, most continuous, and globally consistent records of aerosol optical depth (AOD), spanning more than 25 years [24,25,26,27,28,29,30,31,32,33,34,35,36]. Dedicated analyses using the MODIS Collection 6.1 Level-3 monthly products (NASA MODIS Adaptive Processing System, Goddard Space Flight Center, Greenbelt, MD, USA) have revolutionized our understanding of aerosol climatology, long-term environmental variations, biomass burning emissions, anthropogenic pollution events, and complex aerosol–cloud–climate interactions [37,38,39]. Compared with localized ground-based observations or sporadic field campaigns, this extensive record offers a unique opportunity to investigate global aerosol dynamics on a planetary scale.
Previous investigations using this long-term MODIS data archive have significantly advanced our understanding of global aerosol fields by mapping persistent decadal trends, tracking transcontinental transport pathways, and evaluating how aerosol loadings respond to natural and anthropogenic forcing [40,41,42,43,44,45,46,47,48]. For instance, systematic decreases in regional aerosol loading have been widely reported across eastern North America, Europe, and eastern China following the stringent implementation of emission control policies; conversely, increasing loading trends have been observed over South Asia and several rapidly developing regions [49,50,51,52,53]. Extensive studies have also characterized the transatlantic evolution of Saharan dust plumes, the seasonal dynamics of smoke over central Africa and South America, and the modulation of dust activity by large-scale climate oscillations [40,54,55,56,57,58].
Despite these important advances, most previous studies have focused primarily on pixel-wise temporal trends or localized regional variations. A complementary perspective is to investigate whether the global aerosol field exhibits an intrinsic spatial organization that can be captured by a limited set of dominant spatial modes. Although global AOD distributions appear highly heterogeneous due to multiple aerosol sources, atmospheric transport, and removal processes, their long-term variability may still be governed by a relatively compact set of recurrent large-scale spatial patterns. Characterizing these dominant spatial organizations would provide a concise, physically interpretable description of the global aerosol field and offer a complementary perspective on long-term aerosol variability from satellite observations.
Various linear subspace methods, including empirical orthogonal function (EOF) analysis, principal component analysis (PCA), maximum covariance analysis (MCA), and unsupervised clustering techniques, have been used to characterize large-scale patterns in atmospheric and remote sensing datasets [51,59,60,61,62,63,64,65]. However, aerosol optical depth is inherently nonnegative and represents the additive contributions of multiple aerosol systems, including mineral dust, anthropogenic pollution, biomass-burning smoke, and marine aerosols [42,66,67,68]. Conventional EOF- and PCA-based approaches enforce orthogonality and inevitably produce basis vectors with both positive and negative values, which are often difficult to interpret physically. In contrast, Nonnegative Matrix Factorization (NMF) constrains both the spatial basis vectors and their corresponding coefficients to be nonnegative, preserving a parts-based representation that is more consistent with the additive nature of aerosol observations. NMF has been widely applied in hyperspectral unmixing and other remote sensing applications [69,70,71,72,73]. The motivation of the present study is therefore not to introduce a new NMF formulation, but to exploit its nonnegative low-dimensional representation within a framework specifically designed to investigate the recurrent spatial organization and long-term variability of the global aerosol field.
Global aerosol distributions exhibit pronounced seasonal variability, while the major aerosol source and transport systems recur throughout the annual cycle. The geographical distributions of Saharan dust, Asian anthropogenic aerosol, biomass-burning aerosol, and other major aerosol regimes are already well documented by previous observations [19,31,66]. A remaining question addressed here is how these regional aerosol systems are organized into recurrent, covarying large-scale spatial structures and how the relative contributions of these structures vary over multi-decadal timescales. This perspective differs from conventional aerosol climatology, which primarily describes the mean geographical and seasonal distribution of aerosol loading, and from orthogonal decomposition approaches, which represent variability through mathematically orthogonal positive and negative anomalies. By separating the global AOD field into nonnegative spatial organizations and their corresponding temporal coefficients, NMF provides a means of examining whether long-term aerosol variability is expressed primarily through changes in the geographical structures themselves or through changes in the relative contributions of recurrent spatial organizations.
Motivated by these considerations, this study investigates the long-term spatiotemporal organization of global aerosol optical depth using twenty-five years (2000–2025) of MODIS observations. Independent NMF decompositions are performed for each calendar month, followed by a season-specific mode-matching strategy to establish consistent correspondence among the extracted spatial modes within each climatological season. Rather than simply reproducing known regional aerosol climatologies, the analysis focuses on recurrent large-scale spatial organizations and their temporal evolution. Specifically, the objectives of this study are as follows: (1) to identify and quantify the dominant spatial organizations of global aerosol loading; (2) examine their seasonal persistence and interannual variability; and (3) establish a physically interpretable, low-dimensional framework for characterizing multi-decadal global aerosol variability.
2. Data Processing and Methodology
2.1. Study Dataset
In this investigation, we use the Collection 6.1 monthly Level-3 atmospheric product (MOD08_M3; NASA MODIS Adaptive Processing System, Goddard Space Flight Center, Greenbelt, MD, USA), compiled from observations acquired by the MODIS instrument onboard the Terra satellite. The MOD08_M3 product provides global fields of atmospheric parameters on an equidistant cylindrical grid at a standard spatial resolution [37]. Owing to its extensive observational record, near-global coverage, and consistent retrieval methodology, this dataset has been widely used as a baseline constraint for aerosol climatology mapping, long-term trend analysis, and atmospheric radiative effect modeling [39,71,72].
To extract a spatially complete representation of the global aerosol field, this study uses the variable AOD_550_Dark_Target_Deep_Blue_Combined_Mean_Mean. This variable represents the monthly mean of daily aerosol optical depth (AOD) reported at the standard reference wavelength of 550 nm. The AOD retrieval is derived from multispectral MODIS observations through the Dark Target (DT) and Deep Blue (DB) aerosol retrieval algorithms, which exploit wavelength-dependent aerosol–surface radiative characteristics to retrieve aerosol loading over different surface conditions [30,32,36,74]. The combined DT–DB product integrates the complementary strengths of these algorithms over land, together with the standard MODIS aerosol retrieval over ocean, thereby providing substantially improved global coverage across vegetated, arid, semi-arid, and other bright surfaces. The resulting 550 nm AOD therefore provides a spatially continuous and spectrally consistent measure of aerosol loading that is particularly suitable for the global-scale spatiotemporal decomposition conducted in this study.
The MOD08_M3 monthly product is generated by aggregating daily Level-3 aerosol retrievals into monthly means, thereby suppressing high-frequency meteorological variability while preserving the seasonal and interannual characteristics of the global aerosol field. Monthly datasets from February 2000 to December 2025 were compiled for this study, with January 2000 excluded because routine Terra observations began after the start of that month. To investigate season-specific aerosol variability, the complete dataset was partitioned into 12 independent calendar-month groups, each containing approximately 25 annual samples, and each group was analyzed separately in the subsequent NMF decomposition.
To provide complementary information for interpreting the NMF-derived spatial organizations, the MOD08_M3 Deep Blue Ångström exponent (AE), Deep_Blue_Angstrom_Exponent_Land_Mean_Mean, was additionally analyzed. This dimensionless parameter represents the monthly mean Deep Blue AE over land between 0.412 and 0.47 μm. Only the Deep Blue AE product was used because it provides extensive land coverage while avoiding inconsistencies arising from AE products derived from different wavelength pairs. In contrast to AOD, which represents the magnitude of column-integrated aerosol extinction, AE describes its spectral dependence and provides qualitative information on particle-size characteristics, with lower values generally indicating a stronger coarse-mode contribution and higher values a greater fine-mode contribution.
The Deep Blue AE data were not included in the NMF decomposition and therefore did not influence the derived AOD spatial modes. Instead, for each season and mode, AE fields from the three months with the largest temporal coefficients (H) were composited using the corresponding H values as pixel-wise weights over valid observations. These H-weighted composites provide an independent physical-consistency assessment of the particle-size regimes associated with periods when each AOD spatial organization is strongly expressed. Because total-column AOD alone cannot uniquely determine aerosol composition or source type, the AE analysis is used to support physical interpretation rather than to identify individual NMF modes as specific aerosol types or sources.
The overall workflow of the proposed methodology is summarized in Figure 1. The framework comprises MODIS data preprocessing and matrix construction, independent calendar-month NMF decomposition, rank-sensitivity and initialization-robustness assessments, and season-specific mode matching based on spatial correlation. The resulting spatial modes (W) and temporal coefficients (H) are subsequently used to characterize the seasonal spatial organization and interannual variability of global aerosol loading. In parallel, the Deep Blue AE data are incorporated as a post-decomposition diagnostic to provide complementary particle-size information for assessing the physical consistency of the inferred aerosol organizations. Details of the individual methodological components are provided in the following sections.
Figure 1.
Overall workflow of the season-specific NMF framework for analyzing the long-term spatiotemporal variability of global aerosol loading. Monthly MODIS AOD observations at 550 nm are quality controlled, temporally interpolated, and organized into 12 calendar-month matrices for independent NMF decomposition. Rank sensitivity and initialization robustness are evaluated to assess the reconstruction performance and stability of the decomposition, followed by season-specific mode matching based on spatial correlation to establish consistent mode correspondence within each climatological season. The resulting spatial modes (W) and temporal coefficients (H) are used to characterize the seasonal spatial organization and interannual variability of global aerosol loading. As a complementary physical-consistency assessment, MODIS Deep Blue Ångström exponent (AE) fields over land are composited for the three months with the largest H values for each seasonal mode using the corresponding H values as weights. The resulting H-weighted AE distributions provide complementary particle-size information for the physical interpretation of the NMF-derived spatial organizations. Arrows indicate the direction of data processing and information flow; green denotes the input MODIS dataset, orange denotes the selected input and derived data products, blue denotes processing and analysis steps, and purple denotes the final analysis output.
2.2. Data Preparation and Matrix Construction
Before matrix construction, quality control was applied to remove invalid retrievals, including predefined fill values and physically unrealistic AOD values. For each calendar month and each spatial grid cell, the percentage of valid observations over the study period was calculated. Grid cells with valid observations in at least 60% of the study years were retained, and missing values within these qualified time series were filled using one-dimensional linear interpolation along the temporal dimension. This procedure maximizes the spatial completeness of the dataset while minimizing interpolation in regions that are persistently missing.
Following preprocessing, each monthly dataset was reshaped into a two-dimensional nonnegative matrix suitable for NMF. If a monthly dataset contains valid spatial grid cells and annual observations, the corresponding data matrix is expressed as
where denotes the calendar month; each row of represents the temporal evolution of AOD at a single spatial location, whereas each column corresponds to the global AOD distribution for a particular year within the same calendar month. The resulting 12 monthly matrices were analyzed independently in the subsequent NMF decomposition.
2.3. Nonnegative Matrix Factorization Formulation
For each calendar month, the corresponding data matrix was decomposed independently. Given the nonnegative monthly matrix , the low-rank factorization problem can be formulated as:
where denotes the nonnegative spatial basis matrix whose columns represent the dominant spatial modes of AOD, denotes the corresponding temporal coefficient matrix describing the contribution of each spatial mode to individual annual observations, and denotes the predefined number of decomposition modes.
The optimal factor matrices were obtained by minimizing the scalar-valued cost function defined as the Frobenius norm of the reconstruction residuals, subject to strict nonnegativity constraints:
To solve this nonlinear optimization problem, numerical iterations were performed using the NMF_BPAS package, which employs an alternating nonnegative least-squares (ANLS) framework [75,76,77,78]. The default block principal pivoting (BPP) algorithm was used to solve the nonnegative least-squares subproblems for the alternating updates of the basis matrix and coefficient matrix . Compared with conventional multiplicative-update schemes, the ANLS-BPP approach provides efficient convergence and favorable numerical performance for large-scale matrix factorization problems [79]. Because NMF is non-convex and NMF_BPAS initializes and randomly, the sensitivity of the decomposition to initialization was additionally examined through repeated independent runs using the same input data and default solver configuration. After accounting for the inherent permutation ambiguity of NMF by matching corresponding basis vectors, the dominant spatial modes were found to be highly consistent among independent runs, with differences occurring primarily in mode ordering rather than in the spatial structures themselves. This consistency demonstrates that the large-scale spatial AOD modes identified in this study are robust to random initialization under the adopted NMF_BPAS configuration.
The decomposition rank determines the balance between reconstruction fidelity and the complexity of the extracted aerosol structures. A rank that is too small may merge physically distinct large-scale aerosol organizations, whereas an unnecessarily large rank may progressively subdivide dominant structures into increasingly localized components and reduce the compactness and physical interpretability of the decomposition. To quantitatively assess the sensitivity to rank, systematic NMF experiments were conducted for = 2–8 using the same preprocessed monthly AOD matrices and solver configuration. Reconstruction performance was evaluated using the mean absolute error (MAE) and root mean square error (RMSE) between the original and reconstructed AOD fields. As shown in Figure 2, the 12-month mean MAE and RMSE decrease systematically from 0.037 and 0.070 at = 2 to 0.033 and 0.061 at = 5, respectively, and further decrease to 0.030 and 0.056 at = 8. The results indicate continued improvement in reconstruction fidelity with increasing rank, while the incremental reduction becomes progressively smaller. Considering reconstruction accuracy together with model parsimony and the physical interpretability of the resulting spatial patterns, = 5 was selected as a balanced low-dimensional representation for all 12 calendar-month datasets. This configuration captures the major recurrent spatial organizations of global AOD while avoiding unnecessary subdivision of the dominant aerosol patterns.
Figure 2.
Sensitivity of MODIS AOD reconstruction errors at 550 nm to the prescribed NMF rank ( = 2–8). Bars represent the mean absolute error (MAE) and root mean square error (RMSE) averaged across the 12 calendar-month NMF decompositions, and error bars indicate ±1 standard deviation among the monthly values.
2.4. Season-Specific Mode Matching
Since NMF was performed independently for each calendar month, the extracted spatial modes are mathematically unordered and therefore cannot be directly compared across different months. Rather than establishing correspondence across all twelve months simultaneously, a Season-Specific Mode Matching (SSMM) strategy was adopted to account for the continuous seasonal evolution of the global aerosol field. The twelve calendar months were grouped into four climatological seasons (winter, spring, summer, and autumn), and one representative month near the center of each season was selected as the reference for matching the remaining two months within the corresponding season. January, April, July, and October were used as the reference months in the primary analysis.
For each season, the spatial correlation coefficient between every pair of extracted spatial modes was computed as
where denotes the i-th spatial mode of the reference month and represents the j-th spatial mode extracted from another month within the same season. Because five modes were prescribed for each monthly decomposition (), all possible permutations () were evaluated. The optimal correspondence was determined by maximizing the total spatial correlation,
where denotes a one-to-one matching function that assigns each reference mode to a corresponding mode in the target month. Accordingly, represents the matched mode index associated with the i-th reference mode, and denotes the optimal matching that maximizes the overall spatial similarity. After the optimal correspondence was determined, both the spatial basis matrix and the corresponding temporal coefficient matrix were reordered according to , thereby preserving the mathematical consistency of the NMF decomposition.
The spatial consistency of the resulting mode correspondence was further quantified using the Pearson correlation coefficients between the reordered monthly spatial modes and their corresponding reference-month modes. Using January, April, July, and October as the reference months, respectively, the correlations for the matched nonzero spatial modes ranged from 0.500 to 0.869, with a mean of 0.719 and a median of 0.724 (Table 1), indicating generally moderate-to-strong spatial correspondence among independently decomposed monthly modes. In a small number of cases, although = 5 was prescribed consistently for all monthly decompositions, one of the five NMF components converged to a zero-valued spatial mode, such that only four nonzero spatial modes were effectively resolved for that month. Because a zero-valued mode contains no spatial variability, its Pearson spatial correlation is undefined and is therefore reported as a dash in Table 1. The remaining nonzero modes were retained and matched according to their spatial correspondence.
Table 1.
Pearson spatial correlation coefficients of the seasonally matched NMF spatial modes, using January (Jan), April (Apr), July (Jul) and October (Oct) as representative reference months for winter, spring, summer and autumn, respectively. Note: Dashes indicate cases in which one of the corresponding NMF components converged to a zero-valued spatial mode; consequently, the Pearson spatial correlation was undefined.
To examine whether the SSMM results depend on the choice of reference month, the matching procedure was additionally repeated using each of the other two months within every climatological season as the reference. The resulting mode correspondences were highly consistent with those obtained using January, April, July and October as the reference months, with only minor differences involving weaker higher-order components. Importantly, the correspondence of the dominant spatial modes and their principal large-scale aerosol structures remained essentially unchanged. This sensitivity assessment indicates that the seasonal mode correspondence is primarily determined by the spatial similarity of the NMF-derived aerosol patterns rather than by the specific reference month selected for the matching procedure.
3. Results
3.1. Subsection Global Monthly Climatology of Aerosol Optical Depth
Figure 3 shows the global monthly climatological mean AOD at 550 nm, compiled from the MOD08_M3 Collection 6.1 product for the multi-decadal period from 2000 to 2025. The global aerosol fields exhibit pronounced seasonal patterns in both their baseline magnitudes and geographical distributions, reflecting the coupled effects of localized natural emissions, regional anthropogenic activities, and long-range atmospheric transport. On the global scale, several large-scale atmospheric aerosol anomalies show persistent geographical patterns throughout the annual cycle.
Figure 3.
Monthly climatological mean AOD at 550 nm derived from the MOD08_M3 Collection 6.1 product during 2000–2025. Each panel represents the multi-year mean AOD for an individual calendar month, illustrating the seasonal evolution of the global aerosol distribution.
The maximum AOD columns are systematically centered over northern Africa, the Arabian Peninsula, South Asia, and eastern China, which correspond directly to prominent desert dust source regions and densely populated, heavily industrialized centers. Elevated column densities are concurrently evident over central Africa and South America during their respective fire seasons, whereas low background AOD values systematically dominate remote oceanic basins and high-latitude zones. These persistent spatial patterns are consistent with the established physical understanding of planetary aerosol source distributions [31,66].
Although the core column centroids remain geographically stable, their loading intensities and spatial dimensions vary substantially seasonally. The trans-Atlantic Saharan dust plume expands westward across the tropical Atlantic during the boreal summer, driven by the seasonal intensification of the trade-wind regimes, which constitutes one of the most prominent radiative features worldwide [35,54,80]. Concurrently, biomass-burning smoke plumes become increasingly distinct over central Africa and South America from July through October, whereas continental anthropogenic pollution over eastern and southern Asia persists throughout the annual cycle, exhibiting distinct seasonal fluctuations regulated by local boundary-layer conditions and variable emission strengths [57,58,81]. These cyclic oscillations collectively drive the continuous reorganization of global aerosol distributions.
Despite pronounced month-to-month variability, the recurrent appearance of major aerosol hotspots suggests that the global AOD field has an intrinsic spatial organization. To identify these dominant spatial modes, independent NMF decompositions were performed for each calendar month, followed by season-specific mode matching for inter-month comparisons.
3.2. Season-Specific Spatial AOD Modes in Winter
Figure 4 and Figure 5 jointly summarize the spatial and temporal characteristics of the winter NMF decomposition. Figure 4 shows the five matched spatial AOD modes for December, January and February, whereas Figure 5 presents the corresponding temporal coefficients from 2000 to 2025. For consistent visualization and direct comparison, the spatial modes were scaled to a common range of 0–1, and the corresponding coefficients were scaled accordingly within the NMF factorization. The resulting coefficients generally fall between 0 and 1.2, with only a few isolated values exceeding unity. The rescaling affects only the representation of the factors and does not alter their relative spatial or temporal characteristics. After season-specific mode matching, the dominant spatial organizations remain highly coherent throughout winter, while their temporal contributions exhibit substantial interannual variability. Because these modes are derived solely from total-column AOD at 550 nm, their physical interpretation is based primarily on their spatial correspondence with known aerosol regimes and is further evaluated using the independent Deep Blue AE analysis presented in Section 3.6; the modes are therefore interpreted as AOD spatial organizations rather than uniquely identified aerosol types or sources.
Figure 4.
Season-specific dominant spatial AOD modes during winter (December–February). Each row represents one matched spatial mode, and each column corresponds to an individual month. The modes were reordered using the proposed correlation-based matching strategy to facilitate intra-seasonal comparison. For visualization and comparison, the spatial modes were proportionally scaled to a common range of 0–1. Dec, Jan, and Feb are abbreviations for December, January, and February, respectively.
Figure 5.
Temporal coefficients (H) corresponding to the season-specific spatial AOD modes during winter (December–February) from 2000 to 2025. Each panel represents one matched mode, with grouped bars showing the coefficients for December, January, and February. The coefficients were scaled consistently with the corresponding spatial modes and generally fall between 0 and 1.2, with only a few isolated values exceeding 1. Dec, Jan, and Feb are abbreviations for December, January, and February, respectively.
Mode 1 is characterized by pronounced aerosol loading over eastern China and the Indo-Gangetic Plain, along with weaker continental signals extending across North Africa and the Middle East. This organization changes little from December to February and is spatially consistent with previous observations of persistent winter aerosol accumulation over eastern and southern Asia [31,66,82,83]. The corresponding coefficients in Figure 4 remain relatively large throughout much of the record, particularly from the mid-2000s to the mid-2010s, suggesting that this continental AOD organization was more strongly expressed during this portion of the observational record.
Mode 2 represents a broad aerosol pattern extending from northern Africa across the Arabian Peninsula toward South Asia. Its spatial configuration remains highly consistent across the three winter months and broadly coincides spatially with the major North African–Arabian mineral dust belt [35,80]. In contrast to its stable geographical structure, the associated coefficients tend to be larger during portions of the latter record, particularly after the mid-2010s. Because no formal trend or significance analysis is applied to the latent NMF coefficients, this behavior is interpreted descriptively as enhanced expression of the corresponding AOD spatial organization during these years rather than as evidence of a statistically significant long-term increase.
Mode 3 exhibits a more diffuse continental organization spanning North Africa, the Middle East, and parts of Eurasia and eastern Asia [42]. Its coefficients are generally small except for several isolated enhancements, including pronounced early-record contributions and an episodic peak around 2016. Modes 4 and 5 account for weaker regional and residual structures. Mode 4 shows intermittent coefficient enhancements without an evident persistent temporal pattern, whereas Mode 5 contributes only episodically and becomes negligible in February, consistent with its nearly vanishing spatial pattern in Figure 3.
Collectively, Figure 4 and Figure 5 show that the winter aerosol field can be represented by a limited number of recurrent spatial organizations whose geographical structures remain relatively stable, while their temporal contributions vary substantially from year to year. The temporal coefficients are therefore used here to characterize the relative expression and interannual variability of these recurrent AOD organizations, rather than to establish statistically significant multi-decadal trends.
3.3. Season-Specific Spatial AOD Modes in Spring
Figure 6 and Figure 7 present the spring aerosol modes and their corresponding temporal coefficients for March–May. Compared with winter, spring is characterized by a broader spatial extent of continental AOD structures and enhanced spatial connectivity among major aerosol-influenced regions. While the dominant aerosol organizations remain largely consistent with those identified during winter, both their geographical extent and interannual variability become substantially more pronounced.
Figure 6.
Same as Figure 4, but for the spring season (March–May). Mar and Apr are abbreviations for March and April, respectively.
Figure 7.
Same as Figure 5, but for the spring season (March–May). Mar and Apr are abbreviations for March and April, respectively.
The most prominent organization is Mode 2, which exhibits a broad AOD pattern extending from North Africa across the tropical North Atlantic toward the Arabian Peninsula. As shown in Figure 6, this spatial pattern closely corresponds to the well-established Saharan dust transport corridor and reaches a much broader spatial extent than in winter, consistent with the seasonal strengthening of Saharan dust emissions and long-range transport [35,54,80]. The corresponding coefficients in Figure 7 tend to be larger after approximately 2010, with several pronounced values during the most recent decade, suggesting stronger expression of this dust-associated AOD organization during these periods. This temporal behavior is interpreted descriptively rather than as evidence of a statistically significant long-term trend.
Mode 1 is characterized by enhanced AOD over eastern China and the Indo-Gangetic Plain, regions frequently influenced by substantial anthropogenic aerosol loading. Relative to winter, its spatial extent expands toward northern China and surrounding regions, consistent with changes in regional aerosol distributions during spring. The temporal coefficients exhibit substantial year-to-year fluctuations throughout the study period, indicating pronounced interannual variability without a consistently monotonic temporal pattern.
Mode 3 describes a broader continental aerosol organization linking North Africa, the Middle East, and eastern Asia. Compared with winter, this background continental structure becomes more spatially connected, while its temporal coefficients remain active across most years and show no clear monotonic temporal pattern. This behavior suggests that Mode 3 primarily represents persistent continental-scale aerosol variability with spatial characteristics consistent with the seasonal expansion of large-scale aerosol transport pathways.
Mode 4 represents another spatial organization concentrated over the western Sahara and the Arabian Peninsula, broadly coinciding with major dust-influenced regions. Rather than showing the broad trans-Atlantic spatial pattern associated with Mode 2, this mode emphasizes regional variability within these source regions. Its coefficients remain relatively small throughout the study period, indicating that this regional AOD organization is generally less strongly expressed than the dominant spring modes.
Mode 5 accounts for a weak residual background component distributed over continental and remote oceanic regions. Although its spatial pattern remains relatively diffuse, the corresponding coefficients tend to be smaller during portions of the record after the early 2010s. This behavior indicates weaker expression of the residual AOD organization during these periods, without implying a statistically significant long-term decrease.
Taken together, the spring decomposition indicates that the seasonal transition from winter is governed primarily by the spatial expansion of an AOD organization consistent with the Saharan dust transport corridor, while the principal Asian and continental AOD organizations remain spatially persistent. Rather than generating fundamentally new aerosol structures, spring is characterized by broader and more spatially connected recurrent AOD organizations, accompanied by substantial interannual variations in their relative expression.
3.4. Season-Specific Spatial AOD Modes in Summer
Figure 8 and Figure 9 present the summer aerosol modes and their corresponding temporal coefficients for June–August. Compared with the previous seasons, summer exhibits the clearest separation among the dominant large-scale aerosol organizations. The aerosol field is characterized by several geographically distinct yet spatially connected AOD organizations that broadly correspond to major aerosol source regions and transport pathways and exhibit pronounced interannual variability.
Figure 8.
Same as Figure 4, but for the summer season (June–August). Jun, Jul, and Aug are abbreviations for June, July, and August, respectively.
Figure 9.
Same as Figure 5, but for the summer season (June–August). Jun, Jul, and Aug are abbreviations for June, July, and August, respectively.
The most extensive organization is Mode 2, characterized by a pronounced AOD structure extending from North Africa across the tropical North Atlantic toward the Caribbean and the Americas. This spatial pattern is consistent with the well-established Saharan dust transport corridor. Relative to spring, its spatial extent and continuity increase substantially, consistent with the well-documented peak of trans-Atlantic Saharan dust transport during boreal summer [54,80,84,85]. Enhanced aerosol loading is also evident over boreal North America, where summer wildfire activity can contribute substantially to regional aerosol loading. As shown in Figure 9, the temporal coefficients of Mode 2 exhibit pronounced year-to-year fluctuations, with particularly large values in several recent years, indicating substantial interannual variability in the expression of this large-scale AOD organization.
A second prominent organization, Mode 3, is centered over Central Africa and South America, with a spatial distribution consistent with major biomass-burning regions reported in previous studies and fire-emission datasets [86,87]. Compared with spring, these AOD features become more pronounced and spatially distinct from the Saharan dust-associated pattern, consistent with the seasonal intensification of biomass-burning activity [57,88,89]. The associated temporal coefficients show substantial year-to-year variability, including several pronounced values after the mid-2010s, but do not indicate a consistently monotonic temporal pattern.
Meanwhile, Mode 1 highlights regions of enhanced continental AOD, including eastern China, the Indo-Gangetic Plain, central Africa, and South America. Unlike the broad, transport-dominated pattern represented by Mode 2, this mode emphasizes geographically distinct aerosol hotspots that broadly coincide with major continental emission regions. Its temporal coefficients fluctuate throughout the study period without a clear monotonic temporal pattern, indicating persistent but strongly variable expression of this continental AOD organization.
The remaining components (Modes 4–5) describe a broader continental background and weaker residual aerosol structures. Although their spatial structures remain relatively stable throughout summer, their temporal coefficients show intermittent enhancements in individual years, indicating substantial interannual variability in these secondary AOD organizations.
Overall, the summer decomposition shows that this season exhibits particularly well-separated large-scale AOD organizations. Spatial patterns consistent with trans-Atlantic Saharan dust transport, biomass-burning regions over Africa and South America, wildfire-influenced regions over North America, and other continental aerosol source regions are clearly expressed in the decomposition. Correspondingly, the temporal coefficients show pronounced interannual variability, indicating substantial year-to-year changes in the relative expression of these recurrent spatial organizations, while their overall geographical structures remain comparatively stable.
3.5. Season-Specific Spatial AOD Modes in Autumn
Figure 10 and Figure 11 present the autumn aerosol modes and their corresponding temporal coefficients for September–November. Following the highly organized summer configuration, the global aerosol field gradually transitions toward its winter state. The most apparent seasonal changes are the reduced spatial expression of AOD patterns associated with biomass-burning regions and the contraction of the trans-Atlantic AOD structure consistent with Saharan dust transport, while the principal continental aerosol organizations remain clearly identifiable. Compared with summer, the spatial patterns become less sharply delineated, reflecting the seasonal reorganization of large-scale AOD structures during the seasonal transition.
Figure 10.
Same as Figure 4, but for the autumn season (September–November). Sep, Oct, and Nov are abbreviations for September, October, and November, respectively.
Figure 11.
Same as Figure 5, but for the autumn season (September–November). Sep, Oct, and Nov are abbreviations for September, October, and November, respectively.
Mode 2 continues to exhibit a broad AOD pattern extending from North Africa toward the tropical North Atlantic, consistent with the Saharan dust transport corridor. As shown in Figure 9, the trans-Atlantic AOD structure shortens relative to summer, consistent with the seasonal retreat of long-range Saharan dust transport [54,80]. Nevertheless, the corresponding temporal coefficients in Figure 11 show relatively large values in several years after the mid-2010s, indicating continued interannual variability in the expression of this dust-associated AOD organization during autumn.
Mode 3 exhibits enhanced AOD over the major biomass-burning regions over central Africa and South America. Compared with summer, these AOD features become more localized and less spatially extensive, consistent with the seasonal decline of biomass-burning activity [57,86,88,89]. Its temporal coefficients exhibit pronounced interannual variability, with several large values during the middle of the record generally smaller values in several more recent years, indicating substantial year-to-year variability in the expression of this biomass-burning-associated spatial organization.
Mode 1 highlights regions of enhanced continental AOD, particularly eastern China and the Indo-Gangetic Plain. Although this continental AOD pattern remains evident in September and November, its spatial expression is considerably weaker than in spring and winter and nearly absent in October after seasonal mode matching. The corresponding temporal coefficients fluctuate substantially from year to year, with no clear monotonic temporal pattern, reflecting pronounced interannual variability in this continental AOD organization.
The remaining components (Modes 4–5) primarily describe continental background and residual aerosol patterns. Their spatial structures remain relatively stable throughout the season, while the temporal coefficients show only moderate year-to-year variability, except for a few isolated enhancement events. These modes therefore capture secondary AOD variability that becomes relatively more apparent as the dominant summer spatial organizations weaken.
In summary, the autumn decomposition is characterized by a reduced spatial extent of AOD patterns associated with biomass-burning regions and trans-Atlantic Saharan dust transport, while the major continental AOD organizations remain largely preserved. Rather than introducing new aerosol structures, autumn is characterized by changes in the spatial extent and relative expression of recurrent AOD organizations, providing a transition between the well-separated summer patterns and the winter configuration.
3.6. Seasonal Evolution of Global Aerosol Spatial Organization
The seasonal decompositions presented in Figure 4, Figure 5, Figure 6, Figure 7, Figure 8, Figure 9, Figure 10 and Figure 11 reveal that the global aerosol field evolves through a continuous reorganization of a limited number of recurrent AOD spatial modes rather than through the emergence of entirely new spatial structures. Although the relative expression and geographical extent of individual modes vary substantially among seasons, the dominant AOD organizations remain remarkably persistent throughout the annual cycle. As summarized in Table 2, spatial patterns associated with major continental aerosol regions over eastern China and the Indo-Gangetic Plain, the Saharan dust transport corridor, continental background aerosols, and major biomass-burning regions constitute recurrent features of global AOD variability. Their seasonal evolution is primarily expressed through changes in spatial extent, geographical connectivity, and relative expression, consistent with previous satellite-based investigations of global aerosol climatology and seasonal variability [31,42,66,74].
Table 2.
Summary of the dominant season-specific AOD spatial organizations derived from the NMF analysis. Each NMF mode represents a recurrent large-scale AOD spatial pattern rather than a uniquely identified aerosol type or source. The physical interpretation is based on the geographical characteristics of each mode and its spatial consistency with established aerosol patterns reported in previous studies.
Distinct seasonal characteristics nevertheless emerge from the four decompositions. Winter establishes a relatively stable AOD configuration, with pronounced continental patterns over eastern and southern Asia and broader structures spatially associated with dust-influenced regions. During spring, the AOD pattern associated with the Saharan dust transport corridor expands substantially across the tropical North Atlantic, consistent with the well-documented seasonal evolution of Saharan dust transport. Summer exhibits particularly well-separated large-scale spatial organizations, including patterns consistent with trans-Atlantic Saharan dust transport, major biomass-burning regions over central Africa and South America, wildfire-influenced regions over North America, and other continental aerosol source regions [57,86,89]. During autumn, these dominant spatial patterns become less extensive and gradually reorganize toward the winter configuration, completing a continuous annual cycle of global AOD spatial variability. Taken together, these results demonstrate that the annual variability of global aerosols can be effectively represented as the seasonal redistribution and varying expression of a limited number of recurrent spatial organizations. This low-dimensional representation provides a compact framework for characterizing the seasonal and interannual variability of global aerosol loading without requiring individual NMF modes to be uniquely identified with specific aerosol types or sources.
3.7. Physical Consistency Assessment Using Deep Blue Ångström Exponent
To further assess the physical consistency of the aerosol organizations identified by NMF, the MODIS Deep Blue Ångström exponent (AE) was used to provide complementary information on aerosol particle-size characteristics. The AE data were not included in the NMF decomposition and therefore did not influence the extraction or ordering of the AOD spatial modes. For each seasonal mode, the three months with the largest temporal coefficients (H) were selected, and the corresponding monthly Deep Blue AE fields were composited using their H values as weights (Figure 12). In general, AE values below approximately 0.5 indicate a strong coarse-mode contribution, values of approximately 0.5–1.2 are commonly associated with mixed particle-size conditions, and values above approximately 1.2 indicate an increasing dominance of fine-mode aerosols. These ranges provide a qualitative particle-size indicator rather than a strict aerosol-type classification.
Figure 12.
H-weighted MODIS Deep Blue Ångström exponent (AE) distributions over land associated with the five seasonal NMF spatial modes. For each mode and season, the three months with the largest temporal coefficients (H) were selected, and the corresponding monthly Deep Blue AE fields were composited using their H values as weights. Only valid AE observations were included in the pixel-level weighted averages. Columns represent winter, spring, summer, and autumn, respectively, and rows correspond to NMF Modes 1–5. Lower AE values indicate a stronger coarse-mode contribution, whereas higher AE values indicate a greater relative contribution from fine-mode aerosols. The resulting distributions provide complementary particle-size information for assessing the physical consistency of the aerosol organizations represented by the NMF spatial modes.
Pronounced particle-size contrasts are consistently observed across the seasonal composites. Low AE values dominate North Africa, particularly the Sahara and adjacent arid regions, indicating a strong coarse-mode contribution that is physically consistent with the prominent mineral-dust influence represented in several NMF-derived AOD spatial organizations. In contrast, substantially higher AE values occur over many continental regions, including eastern North America, South America, Europe, and eastern and southern Asia, indicating a greater relative contribution from fine-mode aerosols. The spatial extent of these coarse- and fine-mode regimes also varies seasonally, providing particle-size information that cannot be inferred from the magnitude of AOD at 550 nm alone.
Importantly, individual NMF modes generally encompass multiple AE regimes rather than exhibiting a spatially uniform particle-size signature, and several large-scale AE features are shared among different modes within the same season. This further supports the interpretation that the NMF components represent recurrent large-scale spatial organizations of aerosol loading rather than individual aerosol types. The Deep Blue AE analysis therefore provides a complementary physical-consistency assessment of the NMF-derived spatial modes and strengthens their interpretation without assigning a unique aerosol type to each component.
4. Discussion
4.1. Physical Interpretation of Season-Specific Aerosol Spatial Organizations
The dominant spatial organizations identified by the proposed season-specific NMF framework are highly consistent with the principal global aerosol systems documented by previous satellite observations and aerosol climatology studies [31,42,66,74]. Owing to the non-negativity constraint imposed by NMF, the extracted basis vectors naturally represent geographically coherent aerosol organizations rather than mathematical patterns containing compensating positive and negative structures. However, because the decomposition is based on total-column AOD at 550 nm, the NMF modes should not be interpreted as direct identification of individual aerosol types or emission sources. Instead, their geographical distributions and seasonal evolution reveal AOD spatial patterns that are consistent with major aerosol regimes and transport features, including regions influenced by anthropogenic emissions over eastern China and the Indo-Gangetic Plain, Saharan dust transport across the tropical North Atlantic, biomass-burning activity over tropical Africa and South America, and large-scale continental background aerosol distributions. The close agreement between these spatial organizations and established aerosol climatology indicates that the proposed framework preserves dominant spatial structures associated with seasonal global aerosol variability.
The AE analysis provides independent particle-size information to support the physical interpretation of the NMF modes. The AE characteristics during selected high-contribution periods provide complementary evidence for distinguishing AOD patterns associated with coarse-mode dust from those dominated by fine-mode aerosols. Nevertheless, AE alone cannot uniquely determine aerosol composition or source, and the interpretation therefore relies on the combined evidence from AOD spatial patterns, seasonality, geographical context, and AE characteristics.
An important implication of these results is that long-term aerosol variability can be represented as variations in the relative contributions of recurrent AOD spatial organizations, while allowing their detailed geographical expression to vary seasonally. Throughout the annual cycle, the extracted modes consistently capture AOD patterns associated with the seasonal expansion and retreat of the Saharan dust transport corridor [55,84], regions affected by seasonal biomass-burning activity over tropical Africa and South America [57,86], and the persistent high-AOD centers associated with densely populated and industrialized regions such as eastern China and the Indo-Gangetic Plain [31,66]. These findings suggest that the global aerosol field contains recurrent, low-dimensional spatial structures, while the observed seasonal and interannual variability arises predominantly from changes in the relative importance of these AOD organizations. Such a representation provides a compact, physically interpretable framework for investigating long-term global aerosol variability and for generating hypotheses regarding its relationships with aerosol emissions, atmospheric transport, and climate.
4.2. Rationale for the Season-Specific Framework
A practical motivation for the proposed season-specific framework stems from the characteristics of the MODIS monthly AOD product. The spatial distribution of valid AOD retrievals varies substantially throughout the annual cycle due to seasonal changes in solar illumination, cloud cover, snow cover, and retrieval conditions [31]. Constructing a single data matrix from observations across all calendar months would therefore require restricting the analysis to the spatial intersection of all monthly datasets, resulting in a considerable loss of valid observations. To maximize spatial coverage and retain as much information as possible, NMF decomposition was performed independently for each calendar month.
Performing independent monthly decompositions means the extracted modes lack inherent correspondence across months. The proposed season-specific mode-matching strategy addresses this issue by establishing consistent relationships among neighboring monthly solutions within each climatological season, thereby preserving both seasonal continuity and physical interpretability. Rather than enforcing a single invariant set of annual spatial modes, the framework allows aerosol organizations to evolve naturally with the seasonal cycle while maintaining meaningful comparisons within each season. Consequently, the proposed framework simultaneously maximizes data utilization during matrix decomposition and preserves physically consistent seasonal evolution during interpretation. Nevertheless, because the monthly NMF solutions are obtained independently, the matched coefficients are most appropriately interpreted as relative measures of temporal variability within the corresponding season-specific modes rather than as directly observed aerosol-source contributions. Although developed for the MODIS monthly AOD product, this strategy is readily applicable to other long-term Earth observation datasets exhibiting strong seasonal variations in spatial sampling or observational availability.
4.3. Long-Term Variability Revealed by Seasonal Mode Coefficients
The temporal coefficients provide a compact representation of the interannual evolution of the dominant aerosol organizations while preserving their spatial structures. Rather than requiring a separate spatial pattern for each year, the proposed framework represents long-term global aerosol variability through changes in the relative contributions of a limited set of recurrent aerosol organizations. This separation between relatively stable spatial organizations and evolving temporal coefficients greatly simplifies the interpretation of multi-decadal satellite observations while maintaining a clear physical connection to the underlying aerosol systems. The extracted temporal variability aligns with previous studies showing that major aerosol source regions remain geographically persistent, whereas aerosol loading evolves in response to changes in emissions, atmospheric transport, and meteorological conditions [19,49,90].
It should be emphasized that the temporal coefficients are latent variables derived from matrix factorization rather than direct measurements of individual physical processes. Their variation, therefore, reflects the combined effects of multiple factors, including changes in emissions, long-range transport, meteorological variability, and aerosol removal processes. In addition, because the NMF decompositions are performed independently for individual calendar months and subsequently aligned through the season-specific mode-matching procedure, variations in the matched coefficients should not by themselves be interpreted as statistically established multi-decadal trends. Statements regarding increases, decreases, or enhanced activity of individual modes are therefore intended to describe the temporal behavior evident in the reconstructed AOD organizations rather than to establish formal trends or causal changes in specific aerosol sources. Robust trend attribution would require dedicated statistical analyses, including trend significance and uncertainty assessment, together with independent observational constraints.
The additional AE analysis introduced in this study provides an independent aerosol-size-related constraint for evaluating selected periods in which individual NMF modes exhibit large temporal contributions. The consistency between the spatial AOD patterns, their seasonal occurrence, and the corresponding AE characteristics strengthens the interpretation of several dominant modes. Nevertheless, AE itself is not a unique aerosol-type indicator, and variations in AOD and AE can also reflect changes in relative humidity, aerosol mixing state, transport, boundary-layer structure, and removal processes. Consequently, quantitative attribution of individual peaks or long-term trends requires complementary datasets, such as aerosol-type products, fire-emission inventories, meteorological reanalysis data, and climate indices. Nevertheless, the temporal coefficients provide an efficient, low-dimensional description of long-term aerosol variability, enabling identification of major modes of variability and establishing a physically interpretable basis for future investigations of aerosol–climate interactions, source attribution, and multi-sensor Earth observation datasets.
4.4. Implications and Limitations
The proposed season-specific framework offers a compact, physically interpretable approach to investigating long-term aerosol variability from satellite observations. By combining nonnegative matrix factorization with season-specific mode matching, the framework separates relatively stable spatial organizations from their evolving temporal contributions within a unified analytical framework. Owing to the non-negativity constraint, the extracted spatial modes naturally represent additive aerosol organizations without compensating positive and negative structures [69,70,71]. However, these modes represent AOD spatial organizations rather than uniquely identified aerosol types or sources, and their physical interpretation should therefore rely on consistency with geographical distributions, seasonal behavior, and complementary aerosol information. This low-dimensional representation substantially reduces the complexity of multi-decadal satellite datasets while preserving the dominant spatiotemporal characteristics of global aerosol variability. Although developed using the MODIS monthly AOD product, the methodology itself is independent of a particular sensor and can be readily extended to other long-term Earth observation datasets exhibiting pronounced seasonal variability.
Several limitations should be recognized when interpreting the results. First, the NMF decomposition is based on total-column AOD at 550 nm, which does not directly constrain aerosol composition, source category, or vertical distribution. The AE analysis provides complementary particle-size information and strengthens the interpretation of selected modes, but AE alone cannot uniquely distinguish aerosol types, particularly under mixed aerosol conditions. Second, the NMF temporal coefficients are latent variables rather than direct measurements of aerosol-source strength. Because the monthly decompositions are performed independently and subsequently aligned through season-specific mode matching, variations in these coefficients are more appropriately interpreted as descriptive interannual variability than as statistically established long-term trends. Finally, NMF solutions may depend on the selected rank, initialization, data completeness, and preprocessing, and individual modes do not necessarily correspond one-to-one with independent physical aerosol processes.
Future studies could further constrain the physical attribution and long-term evolution of these modes by incorporating complementary aerosol-type products, fire-emission inventories, meteorological reanalysis data, and other independent observations [19]. Extending the framework to multiple aerosol variables may provide a more comprehensive description of global aerosol variability.
5. Conclusions
This study investigated the long-term spatiotemporal variability of global aerosol optical depth (AOD) using monthly MODIS Collection 6.1 observations from 2000 to 2025. A season-specific non-negative matrix factorization (NMF) framework was developed to decompose the global aerosol field into dominant spatial organizations and their corresponding temporal coefficients. To maximize spatial completeness in the MODIS monthly dataset, matrix decomposition was performed independently for each calendar month, followed by a season-specific mode-matching strategy to establish physically consistent correspondence among the extracted modes within each climatological season. This framework provides a low-dimensional representation in which recurrent seasonal AOD spatial organizations and their interannual variability can be examined separately.
The analysis demonstrates that much of the observed global AOD variability can be represented by a limited number of recurrent spatial organizations whose relative contributions vary across seasons and years. The geographical distributions and seasonal evolution of these modes show characteristics primarily associated with major aerosol regimes, including Saharan dust transport, anthropogenic aerosol loading over eastern China and the Indo-Gangetic Plain, and biomass-burning influence over tropical Africa and South America. The complementary Ångström exponent analysis provides independent particle-size information that further supports the physical interpretation of selected modes. Collectively, these results indicate that a substantial fraction of multi-decadal global AOD variability can be organized into geographically and seasonally coherent structures and their evolving temporal contributions. Importantly, because the decomposition is based on total-column AOD at 550 nm, these modes represent AOD spatial organizations associated with different aerosol regimes rather than unique identification of aerosol types or sources. Similarly, variations in their temporal coefficients characterize interannual variability but do not, by themselves, establish statistically significant long-term trends.
Altogether, the proposed season-specific NMF framework provides a compact, physically interpretable representation of long-term satellite aerosol observations. Its broader value lies in providing a systematic approach for organizing complex satellite records into recurrent spatial structures and their evolving temporal contributions while accommodating seasonally varying data availability. Although demonstrated using the MODIS monthly AOD product, the methodology is sensor-independent and can be readily extended to other long-term Earth observation datasets. Integration with complementary aerosol-type, emission, vertical-profile, and meteorological observations could further constrain the physical attribution and long-term evolution of the identified AOD organizations. More broadly, the framework provides a transferable low-dimensional approach for investigating recurrent spatial organization and temporal variability in long-term Earth observation records.
Author Contributions
Conceptualization, W.H. and J.W.; methodology, W.H.; software, W.H.; validation, W.H.; formal analysis, W.H., X.L. and X.X.; investigation, W.H.; resources, X.L.; data curation, W.H. and X.X.; writing—original draft preparation, W.H.; writing—review and editing, W.H., J.W., X.L. and X.X.; visualization, W.H.; supervision, J.W. and X.L.; funding acquisition, J.W. and X.L. All authors have read and agreed to the published version of the manuscript.
Funding
This research was supported by the Smithsonian Astrophysical Observatory’s subaward S03939-01 to NASA grant 80NSSC22K1047.
Data Availability Statement
The MODIS Collection 6.1 Level-3 monthly aerosol product (MOD08_M3) used in this study is publicly available from the NASA Level-1 and Atmosphere Archive and Distribution System Distributed Active Archive Center (LAADS DAAC): https://ladsweb.modaps.eosdis.nasa.gov/archive/allData/61/MOD08_M3/ (assessed on 22 September 2026).
Acknowledgments
The authors acknowledge Haesun Park (School of Computational Science and Engineering, Georgia Institute of Technology) for developing and publicly distributing the NMF_BPAS toolbox, which provides efficient implementations of alternating nonnegative least squares and block principal pivoting algorithms for nonnegative matrix factorization. The authors also acknowledge the M_Map MATLAB mapping package (v1.4o), developed at The University of British Columbia, which was used to generate the global AOD maps, spatial mode distribution maps, and corresponding coastline overlays presented in this study. In addition, J. Wang’s contribution is made possible by in-kind support provided through the Lichtenberger Family Chair Professorship in Chemical Engineering at the University of Iowa. During the preparation of this manuscript, the first author used Google Gemini to polish the English writing and improve organization. The first author has reviewed and edited the output and takes full responsibility for the content of this publication.
Conflicts of Interest
The authors declare no conflicts of interest.
Abbreviations
The following abbreviations are used in this manuscript:
| AERONET | Aerosol Robotic Network |
| ANLS | Alternating Nonnegative Least Squares |
| AOD | Aerosol Optical Depth |
| BPP | Block Principal Pivoting |
| DB | Deep Blue |
| DT | Dark Target |
| EOF | Empirical Orthogonal Function |
| GFED | Global Fire Emissions Database |
| MCA | Maximum Covariance Analysis |
| MODIS | Moderate Resolution Imaging Spectroradiometer |
| MOD08_M3 | MODIS Level-3 Gridded Atmosphere Monthly Global Joint Product |
| NMF | Non-negative Matrix Factorization |
| PCA | Principal Component Analysis |
| SSMM | Season-Specific Mode Matching |
References
- Kaufman, Y.J.; Tanre, D.; Boucher, O. A satellite view of aerosols in the climate system. Nature 2002, 419, 215–223. [Google Scholar] [CrossRef] [Scilit]
- King, M.D.; Kaufman, Y.J.; Tanré, D.; Nakajima, T. Remote Sensing of Tropospheric Aerosols from Space: Past, Present, and Future. Bull. Am. Meteorol. Soc. 1999, 80, 2229–2259. [Google Scholar] [CrossRef] [Scilit]
- Kokhanovsky, A.A. The modern aerosol retrieval algorithms based on the simultaneous measurements of the intensity and polarization of reflected solar light: A review. Front. Environ. Sci. 2015, 3, 4. [Google Scholar] [CrossRef] [Scilit]
- Dubovik, O.; Li, Z.; Mishchenko, M.I.; Tanré, D.; Karol, Y.; Bojkov, B.; Cairns, B.; Diner, D.J.; Espinosa, W.R.; Goloub, P.; et al. Polarimetric remote sensing of atmospheric aerosols: Instruments, methodologies, results, and perspectives. J. Quant. Spectrosc. Radiat. Transf. 2019, 224, 474–511. [Google Scholar] [CrossRef] [Scilit]
- Haywood, J.; Boucher, O. Estimates of the direct and indirect radiative forcing due to tropospheric aerosols: A review. Rev. Geophys. 2000, 38, 513–543. [Google Scholar] [CrossRef] [Scilit]
- Mishchenko, M.I.; Cairns, B.; Hansen, J.E.; Travis, L.D.; Burg, R.; Kaufman, Y.J.; Vanderlei Martins, J.; Shettle, E.P. Monitoring of aerosol forcing of climate from space: Analysis of measurement requirements. J. Quant. Spectrosc. Radiat. Transf. 2004, 88, 149–161. [Google Scholar] [CrossRef] [Scilit]
- Wang, J.; Christopher, S.A. Mesoscale modeling of Central American smoke transport to the United States: 2. Smoke radiative impact on regional surface energy budget and boundary layer evolution. J. Geophys. Res. 2006, 111, D14S92. [Google Scholar] [CrossRef] [Scilit]
- Kaufman, Y.J.; Koren, I.; Remer, L.A.; Rosenfeld, D.; Rudich, Y. The effect of smoke, dust, and pollution aerosol on shallow cloud development over the Atlantic Ocean. Proc. Natl. Acad. Sci. USA 2005, 102, 11207–11212. [Google Scholar] [CrossRef] [Scilit]
- Myhre, G.; Stordal, F.; Johnsrud, M.; Kaufman, Y.J.; Rosenfeld, D.; Storelvmo, T.; Kristjansson, J.E.; Berntsen, T.K.; Myhre, A.; Isaksen, I.S.A. Aerosol-cloud interaction inferred from MODIS satellite data and global aerosol models. Atmos. Chem. Phys. 2007, 7, 3081–3101. [Google Scholar] [CrossRef] [Scilit]
- Andreae, M.O.; Rosenfeld, D. Aerosol–cloud–precipitation interactions. Part 1. The nature and sources of cloud-active aerosols. Earth-Sci. Rev. 2008, 89, 13–41. [Google Scholar] [CrossRef] [Scilit]
- Alam, K.; Iqbal, M.J.; Blaschke, T.; Qureshi, S.; Khan, G. Monitoring spatio-temporal variations in aerosols and aerosol–cloud interactions over Pakistan using MODIS data. Adv. Space Res. 2010, 46, 1162–1176. [Google Scholar] [CrossRef] [Scilit]
- Rosenfeld, D.; Andreae, M.O.; Asmi, A.; Chin, M.; de Leeuw, G.; Donovan, D.P.; Kahn, R.; Kinne, S.; Kivekäs, N.; Kulmala, M.; et al. Global observations of aerosol-cloud-precipitation-climate interactions. Rev. Geophys. 2014, 52, 750–808. [Google Scholar] [CrossRef] [Scilit]
- Fan, J.; Wang, Y.; Rosenfeld, D.; Liu, X. Review of Aerosol–Cloud Interactions: Mechanisms, Significance, and Challenges. J. Atmos. Sci. 2016, 73, 4221–4252. [Google Scholar] [CrossRef] [Scilit]
- Zan, J.; Maher, B.A.; Fang, X.; Stevens, T.; Ning, W.; Wu, F.; Yang, Y.; Kang, J.; Hu, Z. Global dust impacts on biogeochemical cycles and climate. Nat. Rev. Earth Environ. 2025, 6, 789–807. [Google Scholar] [CrossRef] [Scilit]
- Li, J.; Carlson, B.E.; Yung, Y.L.; Lv, D.; Hansen, J.; Penner, J.E.; Liao, H.; Ramaswamy, V.; Kahn, R.A.; Zhang, P.; et al. Scattering and absorbing aerosols in the climate system. Nat. Rev. Earth Environ. 2022, 3, 363–379. [Google Scholar] [CrossRef] [Scilit]
- Carslaw, K.S.; Boucher, O.; Spracklen, D.V.; Mann, G.W.; Rae, J.G.L.; Woodward, S.; Kulmala, M. A review of natural aerosol interactions and feedbacks within the Earth system. Atmos. Chem. Phys. 2010, 10, 1701–1737. [Google Scholar] [CrossRef] [Scilit]
- Masson-Delmotte, V.; Zhai, P.; Pirani, A.; Connors, S.L.; Péan, C.; Berger, S.; Caud, N.; Chen, Y.; Goldfarb, L.; Gomis, M.I. Climate change 2021: The physical science basis. Contrib. Work. Group I Sixth Assess. Rep. Intergov. Panel Clim. Change 2021, 2, 2391. [Google Scholar]
- Kokhanovsky, A.A.; Leeuw, G.d. Satellite Aerosol Remote Sensing over Land; Kokhanovsky, A.A., Leeuw, G.D., Eds.; Praxis Publishing Ltd.: Chichester, UK, 2009. [Google Scholar]
- Remer, L.A.; Levy, R.C.; Martins, J.V. Opinion: Aerosol remote sensing over the next 20 years. Atmos. Chem. Phys. 2024, 24, 2113–2127. [Google Scholar] [CrossRef] [Scilit]
- Li, Z.; Zhao, X.; Kahn, R.; Mishchenko, M.; Remer, L.; Lee, K.H.; Wang, M.; Laszlo, I.; Nakajima, T.; Maring, H. Uncertainties in satellite remote sensing of aerosols and impact on monitoring its long-term trend: A review and perspective. Ann. Geophys. 2009, 27, 2755–2770. [Google Scholar] [CrossRef] [Scilit]
- Dubovik, O.; Schuster, G.L.; Xu, F.; Hu, Y.; Bösch, H.; Landgraf, J.; Li, Z. Grand Challenges in Satellite Remote Sensing. Front. Remote Sens. 2021, 2, 619818. [Google Scholar] [CrossRef] [Scilit]
- Sayer, A.M.; Govaerts, Y.; Kolmonen, P.; Lipponen, A.; Luffarelli, M.; Mielonen, T.; Patadia, F.; Popp, T.; Povey, A.C.; Stebel, K.; et al. A review and framework for the evaluation of pixel-level uncertainty estimates in satellite aerosol remote sensing. Atmos. Meas. Tech. 2020, 13, 373–404. [Google Scholar] [CrossRef] [Scilit]
- Laszlo, I.; Ciren, P.; Liu, H.; Kondragunta, S.; Tarpley, J.D.; Goldberg, M.D. Remote sensing of aerosol and radiation from geostationary satellites. Adv. Space Res. 2008, 41, 1882–1893. [Google Scholar] [CrossRef] [Scilit]
- Ichoku, C.; Kaufman, Y.J.; Remer, L.A.; Levy, R. Global aerosol remote sensing from MODIS. Adv. Space Res. 2004, 34, 820–827. [Google Scholar] [CrossRef] [Scilit]
- Chu, D.A.; Kaufman, Y.J.; Ichoku, C.; Remer, L.A.; Tanré, D.; Holben, B.N. Validation of MODIS aerosol optical depth retrieval over land. Geophys. Res. Lett. 2002, 29, MOD2-1–MOD2-4. [Google Scholar] [CrossRef] [Scilit]
- Remer, L.A.; Tanré, D.; Kaufman, Y.J.; Ichoku, C.; Mattoo, S.; Levy, R.; Chu, D.A.; Holben, B.; Dubovik, O.; Smirnov, A.; et al. Validation of MODIS aerosol retrieval over ocean. Geophys. Res. Lett. 2002, 29, MOD3-1–MOD3-4. [Google Scholar] [CrossRef] [Scilit]
- Chu, D.A.; Kaufman, Y.J.; Zibordi, G.; Chern, J.D.; Mao, J.; Li, C.; Holben, B.N. Global monitoring of air pollution over land from EOS-Terra MODIS. J. Geophys. Res. 2003, 108, 4661. [Google Scholar] [CrossRef] [Scilit]
- Remer, L.A.; Kaufman, Y.J.; Tanré, D.; Mattoo, S.; Chu, D.A.; Martins, J.V.; Li, R.R.; Ichoku, C.; Levy, R.C.; Kleidman, R.G.; et al. The MODIS aerosol algorithm, products, and validation. J. Atmos. Sci. 2005, 62, 947–973. [Google Scholar] [CrossRef] [Scilit]
- Remer, L.A.; Tanré, D.; Kaufman, Y.J.; Levy, R.; Mattoo, S. Algorithm for remote sensing of tropospheric aerosol from MODIS: Collection 5, Product ID: MOD04/MYD04. Natl. Aeronaut. Space Adm. 2006, 1490, 2229–2259. [Google Scholar]
- Levy, R.C.; Remer, L.A.; Kleidman, R.G.; Mattoo, S.; Ichoku, C.; Kahn, R.; Eck, T.F. Global evaluation of the Collection 5 MODIS dark-target aerosol products over land. Atmos. Chem. Phys. 2010, 10, 10399–10420. [Google Scholar] [CrossRef] [Scilit]
- Levy, R.C.; Mattoo, S.; Munchak, L.A.; Remer, L.A.; Sayer, A.M.; Patadia, F.; Hsu, N.C. The Collection 6 MODIS aerosol products over land and ocean. Atmos. Meas. Tech. 2013, 6, 2989–3034. [Google Scholar] [CrossRef] [Scilit]
- Sayer, A.M.; Munchak, L.A.; Hsu, N.C.; Levy, R.C.; Bettenhausen, C.; Jeong, M.J. MODIS Collection 6 aerosol products: Comparison between Aqua’s e-Deep Blue, Dark Target, and “merged” data sets, and usage recommendations. J. Geophys. Res. Atmos. 2014, 119, 13965–13989. [Google Scholar] [CrossRef] [Scilit]
- Lyapustin, A.; Wang, Y.; Korkin, S.; Huang, D. MODIS Collection 6 MAIAC algorithm. Atmos. Meas. Tech. 2018, 11, 5741–5765. [Google Scholar] [CrossRef] [Scilit]
- Hsu, N.C.; Si-Chee, T.; King, M.D.; Herman, J.R. Deep Blue retrievals of Asian aerosol properties during ACE-Asia. IEEE Trans. Geosci. Remote Sens. 2006, 44, 3180–3195. [Google Scholar] [CrossRef] [Scilit]
- Ginoux, P.; Prospero, J.M.; Gill, T.E.; Hsu, N.C.; Zhao, M. Global-scale attribution of anthropogenic and natural dust sources and their emission rates based on MODIS Deep Blue aerosol products. Rev. Geophys. 2012, 50, RG3005. [Google Scholar] [CrossRef] [Scilit]
- Hsu, N.C.; Jeong, M.J.; Bettenhausen, C.; Sayer, A.M.; Hansell, R.; Seftor, C.S.; Huang, J.; Tsay, S.C. Enhanced Deep Blue aerosol retrieval algorithm: The second generation. J. Geophys. Res. Atmos. 2013, 118, 9296–9315. [Google Scholar] [CrossRef] [Scilit]
- MODIS Atmoshpere Science Team. MODIS/Terra Aerosol Cloud Water Vapor Ozone Monthly L3 Global 1Deg CMG. In NASA Level 1 and Atmosphere Archive and Distribution System Distributed Active Archive Center (DAAC) Data Set; MOD08_M03. 061; NASA’s Goddard Space Flight Center: Greenbelt, MD, USA, 2017. [Google Scholar]
- Wei, J.; Peng, Y.; Guo, J.; Sun, L. Performance of MODIS Collection 6.1 Level 3 aerosol products in spatial-temporal variations over land. Atmos. Environ. 2019, 206, 30–44. [Google Scholar] [CrossRef] [Scilit]
- Filonchyk, M.; Hurynovich, V.; Yan, H.; Zhou, L.; Gusev, A. Climatology of aerosol optical depth over Eastern Europe based on 19 years (2000–2018) MODIS TERRA data. Int. J. Clim. 2020, 40, 3531–3549. [Google Scholar] [CrossRef] [Scilit]
- Zhang, J.; Reid, J.S. A decadal regional and global trend analysis of the aerosol optical depth using a data-assimilation grade over-water MODIS and Level 2 MISR aerosol products. Atmos. Chem. Phys. 2010, 10, 10949–10963. [Google Scholar] [CrossRef] [Scilit]
- Ramachandran, S.; Kedia, S.; Srivastava, R. Aerosol optical depth trends over different regions of India. Atmos. Environ. 2012, 49, 338–347. [Google Scholar] [CrossRef] [Scilit]
- Chin, M.; Diehl, T.; Tan, Q.; Prospero, J.M.; Kahn, R.A.; Remer, L.A.; Yu, H.; Sayer, A.M.; Bian, H.; Geogdzhayev, I.V.; et al. Multi-decadal aerosol variations from 1980 to 2009: A perspective from observations and a global model. Atmos. Chem. Phys. 2014, 14, 3657–3690. [Google Scholar] [CrossRef] [Scilit]
- Kumar, K.R.; Sivakumar, V.; Yin, Y.; Reddy, R.R.; Kang, N.; Diao, Y.; Adesina, A.J.; Yu, X. Long-term (2003–2013) climatological trends and variations in aerosol optical parameters retrieved from MODIS over three stations in South Africa. Atmos. Environ. 2014, 95, 400–408. [Google Scholar] [CrossRef] [Scilit]
- Floutsi, A.A.; Korras-Carraca, M.B.; Matsoukas, C.; Hatzianastassiou, N.; Biskos, G. Climatology and trends of aerosol optical depth over the Mediterranean basin during the last 12years (2002–2014) based on Collection 006 MODIS-Aqua data. Sci. Total Environ. 2016, 551–552, 292–303. [Google Scholar] [CrossRef] [Scilit]
- Klingmüller, K.; Pozzer, A.; Metzger, S.; Stenchikov, G.L.; Lelieveld, J. Aerosol optical depth trend over the Middle East. Atmos. Chem. Phys. 2016, 16, 5063–5073. [Google Scholar] [CrossRef] [Scilit]
- Guleria, R.P.; Chand, K. Emerging patterns in global and regional aerosol characteristics: A study based on satellite remote sensors. J. Atmos. Sol.-Terr. Phys. 2020, 197, 105177. [Google Scholar] [CrossRef] [Scilit]
- Shaheen, A.; Wu, R.; Aldabash, M. Long-term AOD trend assessment over the Eastern Mediterranean region: A comparative study including a new merged aerosol product. Atmos. Environ. 2020, 238, 117736. [Google Scholar] [CrossRef] [Scilit]
- Park, J.M.; McComiskey, A.C.; Painemal, D.; Smith, W.L., Jr. Long-Term Trends in Aerosols, Low Clouds, and Large-Scale Meteorology Over the Western North Atlantic From 2003 to 2020. J. Geophys. Res. Atmos. 2024, 129, e2023JD039592. [Google Scholar] [CrossRef] [Scilit]
- Mehta, M.; Singh, R.; Singh, A.; Singh, N.; Anshumali. Recent global aerosol optical depth variations and trends—A comparative study using MODIS and MISR level 3 datasets. Remote Sens. Environ. 2016, 181, 137–150. [Google Scholar] [CrossRef] [Scilit]
- He, Q.; Zhang, M.; Huang, B. Spatio-temporal variation and impact factors analysis of satellite-based aerosol optical depth over China from 2002 to 2015. Atmos. Environ. 2016, 129, 79–90. [Google Scholar] [CrossRef] [Scilit]
- Tian, X.; Tang, C.; Wu, X.; Yang, J.; Zhao, F.; Liu, D. The global spatial-temporal distribution and EOF analysis of AOD based on MODIS data during 2003–2021. Atmos. Environ. 2023, 302, 119722. [Google Scholar] [CrossRef] [Scilit]
- Sogacheva, L.; Rodriguez, E.; Kolmonen, P.; Virtanen, T.H.; Saponaro, G.; de Leeuw, G.; Georgoulias, A.K.; Alexandri, G.; Kourtidis, K.; van der A, R.J. Spatial and seasonal variations of aerosols over China from two decades of multi-satellite observations—Part 2: AOD time series for 1995–2017 combined from ATSR ADV and MODIS C6.1 and AOD tendency estimations. Atmos. Chem. Phys. 2018, 18, 16631–16652. [Google Scholar] [CrossRef] [Scilit]
- Rahman, M.M.; Wang, S.; Zhao, W.; Arshad, A.; Zhang, W.; He, C. Comprehensive Evaluation of Spatial Distribution and Temporal Trend of NO2, SO2 and AOD Using Satellite Observations over South and East Asia from 2011 to 2021. Remote Sens. 2023, 15, 5069. [Google Scholar] [CrossRef] [Scilit]
- Yu, H.; Chin, M.; Bian, H.; Yuan, T.; Prospero, J.M.; Omar, A.H.; Remer, L.A.; Winker, D.M.; Yang, Y.; Zhang, Y.; et al. Quantification of trans-Atlantic dust transport from seven-year (2007–2013) record of CALIPSO lidar measurements. Remote Sens. Environ. 2015, 159, 232–249. [Google Scholar] [CrossRef] [Scilit]
- Gläser, G.; Wernli, H.; Kerkweg, A.; Teubler, F. The transatlantic dust transport from North Africa to the Americas—Its characteristics and source regions. J. Geophys. Res. Atmos. 2015, 120, 11231–11252. [Google Scholar] [CrossRef] [Scilit]
- Kalashnikova, O.V.; Kahn, R.A. Mineral dust plume evolution over the Atlantic from MISR and MODIS aerosol retrievals. J. Geophys. Res. 2008, 113, D24204. [Google Scholar] [CrossRef] [Scilit]
- Petrenko, M.; Kahn, R.; Chin, M.; Bauer, S.E.; Bergman, T.; Bian, H.; Curci, G.; Johnson, B.; Kaiser, J.W.; Kipling, Z.; et al. Biomass burning emission analysis based on MODIS aerosol optical depth and AeroCom multi-model simulations: Implications for model constraints and emission inventories. Atmos. Chem. Phys. 2025, 25, 1545–1567. [Google Scholar] [CrossRef] [Scilit]
- Ma, X.; Bartlett, K.; Harmon, K.; Yu, F. Comparison of AOD between CALIPSO and MODIS: Significant differences over major dust and biomass burning regions. Atmos. Meas. Tech. 2013, 6, 2391–2401. [Google Scholar] [CrossRef] [Scilit]
- Li, J.; Carlson, B.E.; Lacis, A.A. Application of spectral analysis techniques in the intercomparison of aerosol data: 1. An EOF approach to analyze the spatial-temporal variability of aerosol optical depth using multiple remote sensing data sets. J. Geophys. Res. Atmos. 2013, 118, 8640–8648. [Google Scholar] [CrossRef] [Scilit]
- Li, J.; Carlson, B.E.; Lacis, A.A. Application of spectral analysis techniques in the intercomparison of aerosol data. Part II: Using maximum covariance analysis to effectively compare spatiotemporal variability of satellite and AERONET measured aerosol optical depth. J. Geophys. Res. Atmos. 2014, 119, 153–166. [Google Scholar] [CrossRef] [Scilit]
- Li, J.; Carlson, B.E.; Lacis, A.A. Application of spectral analysis techniques in the intercomparison of aerosol data: Part III. Using combined PCA to compare spatiotemporal variability of MODIS, MISR, and OMI aerosol optical depth. J. Geophys. Res. Atmos. 2014, 119, 4017–4042. [Google Scholar] [CrossRef] [Scilit]
- Ding, Y.; Ni, W.; Dong, J.; Yang, J.; Meng, S.; Li, S. Spatiotemporal Analysis and Anomalous Trends of Asia AOD (2001–2024): Insights from a Deep Learning Fusion Model and EOF Decomposition. Remote Sens. 2025, 17, 1741. [Google Scholar] [CrossRef] [Scilit]
- Kahn, R.A.; Nelson, D.L.; Garay, M.J.; Levy, R.C.; Bull, M.A.; Diner, D.J.; Martonchik, J.V.; Paradise, S.R.; Hansen, E.G.; Remer, L.A. MISR Aerosol Product Attributes and Statistical Comparisons With MODIS. IEEE Trans. Geosci. Remote Sens. 2009, 47, 4095–4114. [Google Scholar] [CrossRef] [Scilit]
- Khoir, A.N.u.; Ooi, M.C.G.; Juneng, L.; Isra Ramadhan, M.A.; Virgianto, R.H.; Tangang, F. Spatio-temporal analysis of aerosol optical depth using rotated empirical orthogonal function over the Maritime Continent from 2001 to 2020. Atmos. Environ. 2022, 290, 119356. [Google Scholar] [CrossRef] [Scilit]
- Li, J.; Hendricks, J.; Righi, M.; Beer, C.G. An aerosol classification scheme for global simulations using the K-means machine learning method. Geosci. Model Dev. 2022, 15, 509–533. [Google Scholar] [CrossRef] [Scilit]
- Remer, L.A.; Kleidman, R.G.; Levy, R.C.; Kaufman, Y.J.; Tanré, D.; Mattoo, S.; Martins, J.V.; Ichoku, C.; Koren, I.; Yu, H.; et al. Global aerosol climatology from the MODIS satellite sensors. J. Geophys. Res. Atmos. 2008, 113, 11–18. [Google Scholar] [CrossRef] [Scilit]
- Dubovik, O.; Holben, B.; Eck, T.F.; Smirnov, A.; Kaufman, Y.J.; King, M.D.; Tanré, D.; Slutsker, I. Variability of Absorption and Optical Properties of Key Aerosol Types Observed in Worldwide Locations. J. Atmos. Sci. 2002, 59, 590–608. [Google Scholar] [CrossRef] [Scilit]
- Giles, D.M.; Holbesn, B.N.; Eck, T.F.; Sinyuk, A.; Smirnov, A.; Slutsker, I.; Dickerson, R.R.; Thompson, A.M.; Schafer, J.S. An analysis of AERONET aerosol absorption properties and classifications representative of aerosol source regions. J. Geophys. Res. Atmos. 2012, 117, D17203. [Google Scholar] [CrossRef] [Scilit]
- Feng, X.-R.; Li, H.-C.; Wang, R.; Du, Q.; Jia, X.; Plaza, A. Hyperspectral unmixing based on nonnegative matrix factorization: A comprehensive review. IEEE J. Sel. Top. Appl. Earth Obs. Remote Sens. 2022, 15, 4414–4436. [Google Scholar] [CrossRef] [Scilit]
- Lee, D.D.; Seung, H.S. Learning the parts of objects by non-negative matrix factorization. Nature 1999, 6755, 788–791. [Google Scholar] [CrossRef] [Scilit]
- Bioucas-Dias, J.M.; Plaza, A.; Dobigeon, N.; Parente, M.; Du, Q.; Gader, P.; Chanussot, J. Hyperspectral Unmixing Overview: Geometrical, Statistical, and Sparse Regression-Based Approaches. IEEE J. Sel. Top. Appl. Earth Obs. Remote Sens. 2012, 5, 354–379. [Google Scholar] [CrossRef] [Scilit]
- Wang, Y.-X.; Zhang, Y.-J. Nonnegative matrix factorization: A comprehensive review. IEEE Trans. Knowl. Data Eng. 2012, 25, 1336–1353. [Google Scholar] [CrossRef] [Scilit]
- Hou, W.; Liu, X.; Wang, J.; Chen, C.; Xu, X. Multispectral Land Surface Reflectance Reconstruction Based on Non-Negative Matrix Factorization: Bridging Spectral Resolution Gaps for GRASP TROPOMI BRDF Product in Visible. Remote Sens. 2025, 17, 1053. [Google Scholar] [CrossRef] [Scilit]
- Remer, L.A.; Levy, R.C.; Mattoo, S.; Tanré, D.; Gupta, P.; Shi, Y.; Sawyer, V.; Munchak, L.A.; Zhou, Y.; Kim, M.; et al. The Dark Target Algorithm for Observing the Global Aerosol System: Past, Present, and Future. Remote Sens. 2020, 12, 2900. [Google Scholar] [CrossRef] [Scilit]
- Kim, H.; Park, H. Sparse non-negative matrix factorizations via alternating non-negativity-constrained least squares for microarray data analysis. Bioinformatics 2007, 23, 1495–1502. [Google Scholar] [CrossRef] [Scilit]
- Kim, H.; Park, H. Nonnegative Matrix Factorization Based on Alternating Nonnegativity Constrained Least Squares and Active Set Method. SIAM J. Matrix Anal. Appl. 2008, 30, 713–730. [Google Scholar] [CrossRef] [Scilit]
- Kim, J.; Park, H. Toward Faster Nonnegative Matrix Factorization: A New Algorithm and Comparisons. In 2008 Eighth IEEE International Conference on Data Mining; IEEE: Piscataway, NJ, USA, 2008; pp. 353–362. [Google Scholar] [CrossRef] [Scilit]
- Kim, J.; Park, H. Fast Nonnegative Matrix Factorization: An Active-Set-Like Method and Comparisons. SIAM J. Sci. Comput. 2011, 33, 3261–3281. [Google Scholar] [CrossRef] [Scilit]
- Chu, D.; Shi, W.; Eswar, S.; Park, H. An Alternating Rank-k Nonnegative Least Squares Framework (ARkNLS) for Nonnegative Matrix Factorization. SIAM J. Matrix Anal. Appl. 2021, 42, 1451–1479. [Google Scholar] [CrossRef] [Scilit]
- Prospero, J.M.; Ginoux, P.; Torres, O.; Nicholson, S.E.; Gill, T.E. Environmental characterization of global sources of atmospheric soil dust identified with the NIMBUS 7 Total Ozone Mapping Specrometer (TOMS) absorbing aerosol product. Rev. Geophys. 2002, 40, 2-1–2-31. [Google Scholar] [CrossRef] [Scilit]
- Wang, J.; Yue, Y.; Wang, Y.; Ichoku, C.; Ellison, L.; Zeng, J. Mitigating Satellite-Based Fire Sampling Limitations in Deriving Biomass Burning Emission Rates: Application to WRF-Chem Model Over the Northern sub-Saharan African Region. J. Geophys. Res. Atmos. 2018, 123, 507–528. [Google Scholar] [CrossRef] [Scilit]
- Streets, D.G.; Bond, T.C.; Carmichael, G.R.; Fernandes, S.D.; Fu, Q.; He, D.; Klimont, Z.; Nelson, S.M.; Tsai, N.Y.; Wang, M.Q.; et al. An inventory of gaseous and primary aerosol emissions in Asia in the year 2000. J. Geophys. Res. Atmos. 2003, 108, 8809. [Google Scholar] [CrossRef] [Scilit]
- Zhang, Q.; Streets, D.G.; Carmichael, G.R.; He, K.B.; Huo, H.; Kannari, A.; Klimont, Z.; Park, I.S.; Reddy, S.; Fu, J.S.; et al. Asian emissions in 2006 for the NASA INTEX-B mission. Atmos. Chem. Phys. 2009, 9, 5131–5153. [Google Scholar] [CrossRef] [Scilit]
- Prospero, J.M.; Lamb, P.J. African Droughts and Dust Transport to the Caribbean: Climate Change Implications. Science 2003, 302, 1024–1027. [Google Scholar] [CrossRef] [Scilit]
- Prospero, J.M.; Mayol-Bracero, O.L. Understanding the Transport and Impact of African Dust on the Caribbean Basin. Bull. Am. Meteorol. Soc. 2013, 94, 1329–1337. [Google Scholar] [CrossRef] [Scilit]
- Giglio, L.; Randerson, J.T.; van der Werf, G.R. Analysis of daily, monthly, and annual burned area using the fourth-generation global fire emissions database (GFED4). J. Geophys. Res. Biogeosci. 2013, 118, 317–328. [Google Scholar] [CrossRef] [Scilit]
- Randerson, J.; Van Der Werf, G.; Giglio, L.; Collatz, G.; Kasibhatla, P. Global fire emissions database, version 4.1 (GFEDv4). In ORNL Distributed Active Archive Center (DAAC) Dataset 10.3334/ORNLDAAC/1293; ORNL Distributed Active Archive Center: Oak Ridge, TN, USA, 2017; Volume 2017, p. 1293. [Google Scholar]
- Duncan, B.N.; Martin, R.V.; Staudt, A.C.; Yevich, R.; Logan, J.A. Interannual and seasonal variability of biomass burning emissions constrained by satellite observations. J. Geophys. Res. Atmos. 2003, 108, ACH 1-1–ACH 1-22. [Google Scholar] [CrossRef] [Scilit]
- Kaiser, J.W.; Heil, A.; Andreae, M.O.; Benedetti, A.; Chubarova, N.; Jones, L.; Morcrette, J.J.; Razinger, M.; Schultz, M.G.; Suttie, M.; et al. Biomass burning emissions estimated with a global fire assimilation system based on observed fire radiative power. Biogeosciences 2012, 9, 527–554. [Google Scholar] [CrossRef] [Scilit]
- Levy, R.C.; Gupta, P.; Shi, Y.R.; Remer, L.A.; Kim, M.; Oo, M.M.; Wei, J.; Sawyer, V.R.; Kiliyanpilakkil, V.P.; Holz, R.E.; et al. A GEO-LEO Imager Data Set for Characterizing Rapid Changes of Global Aerosol Properties. J. Geophys. Res. Atmos. 2026, 131, e2025JD046107. [Google Scholar] [CrossRef] [Scilit]
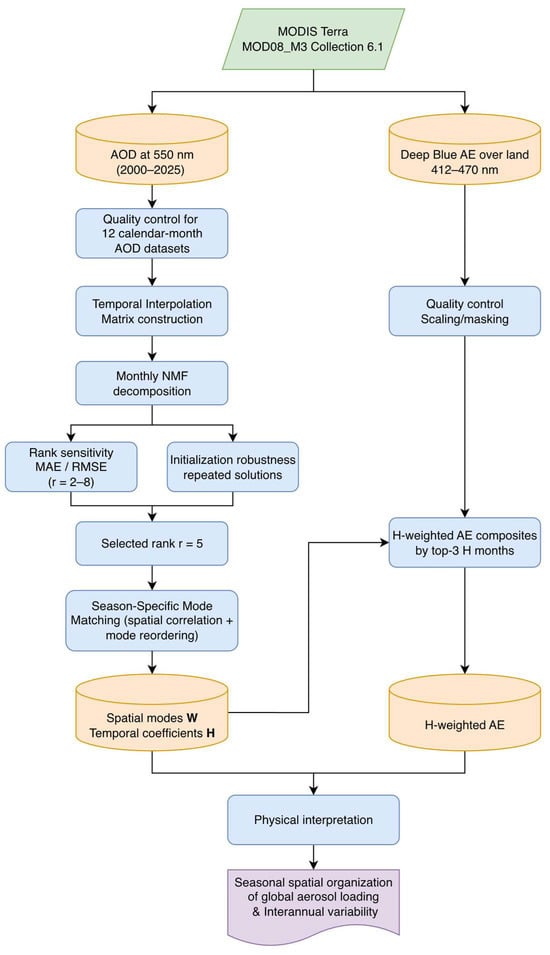
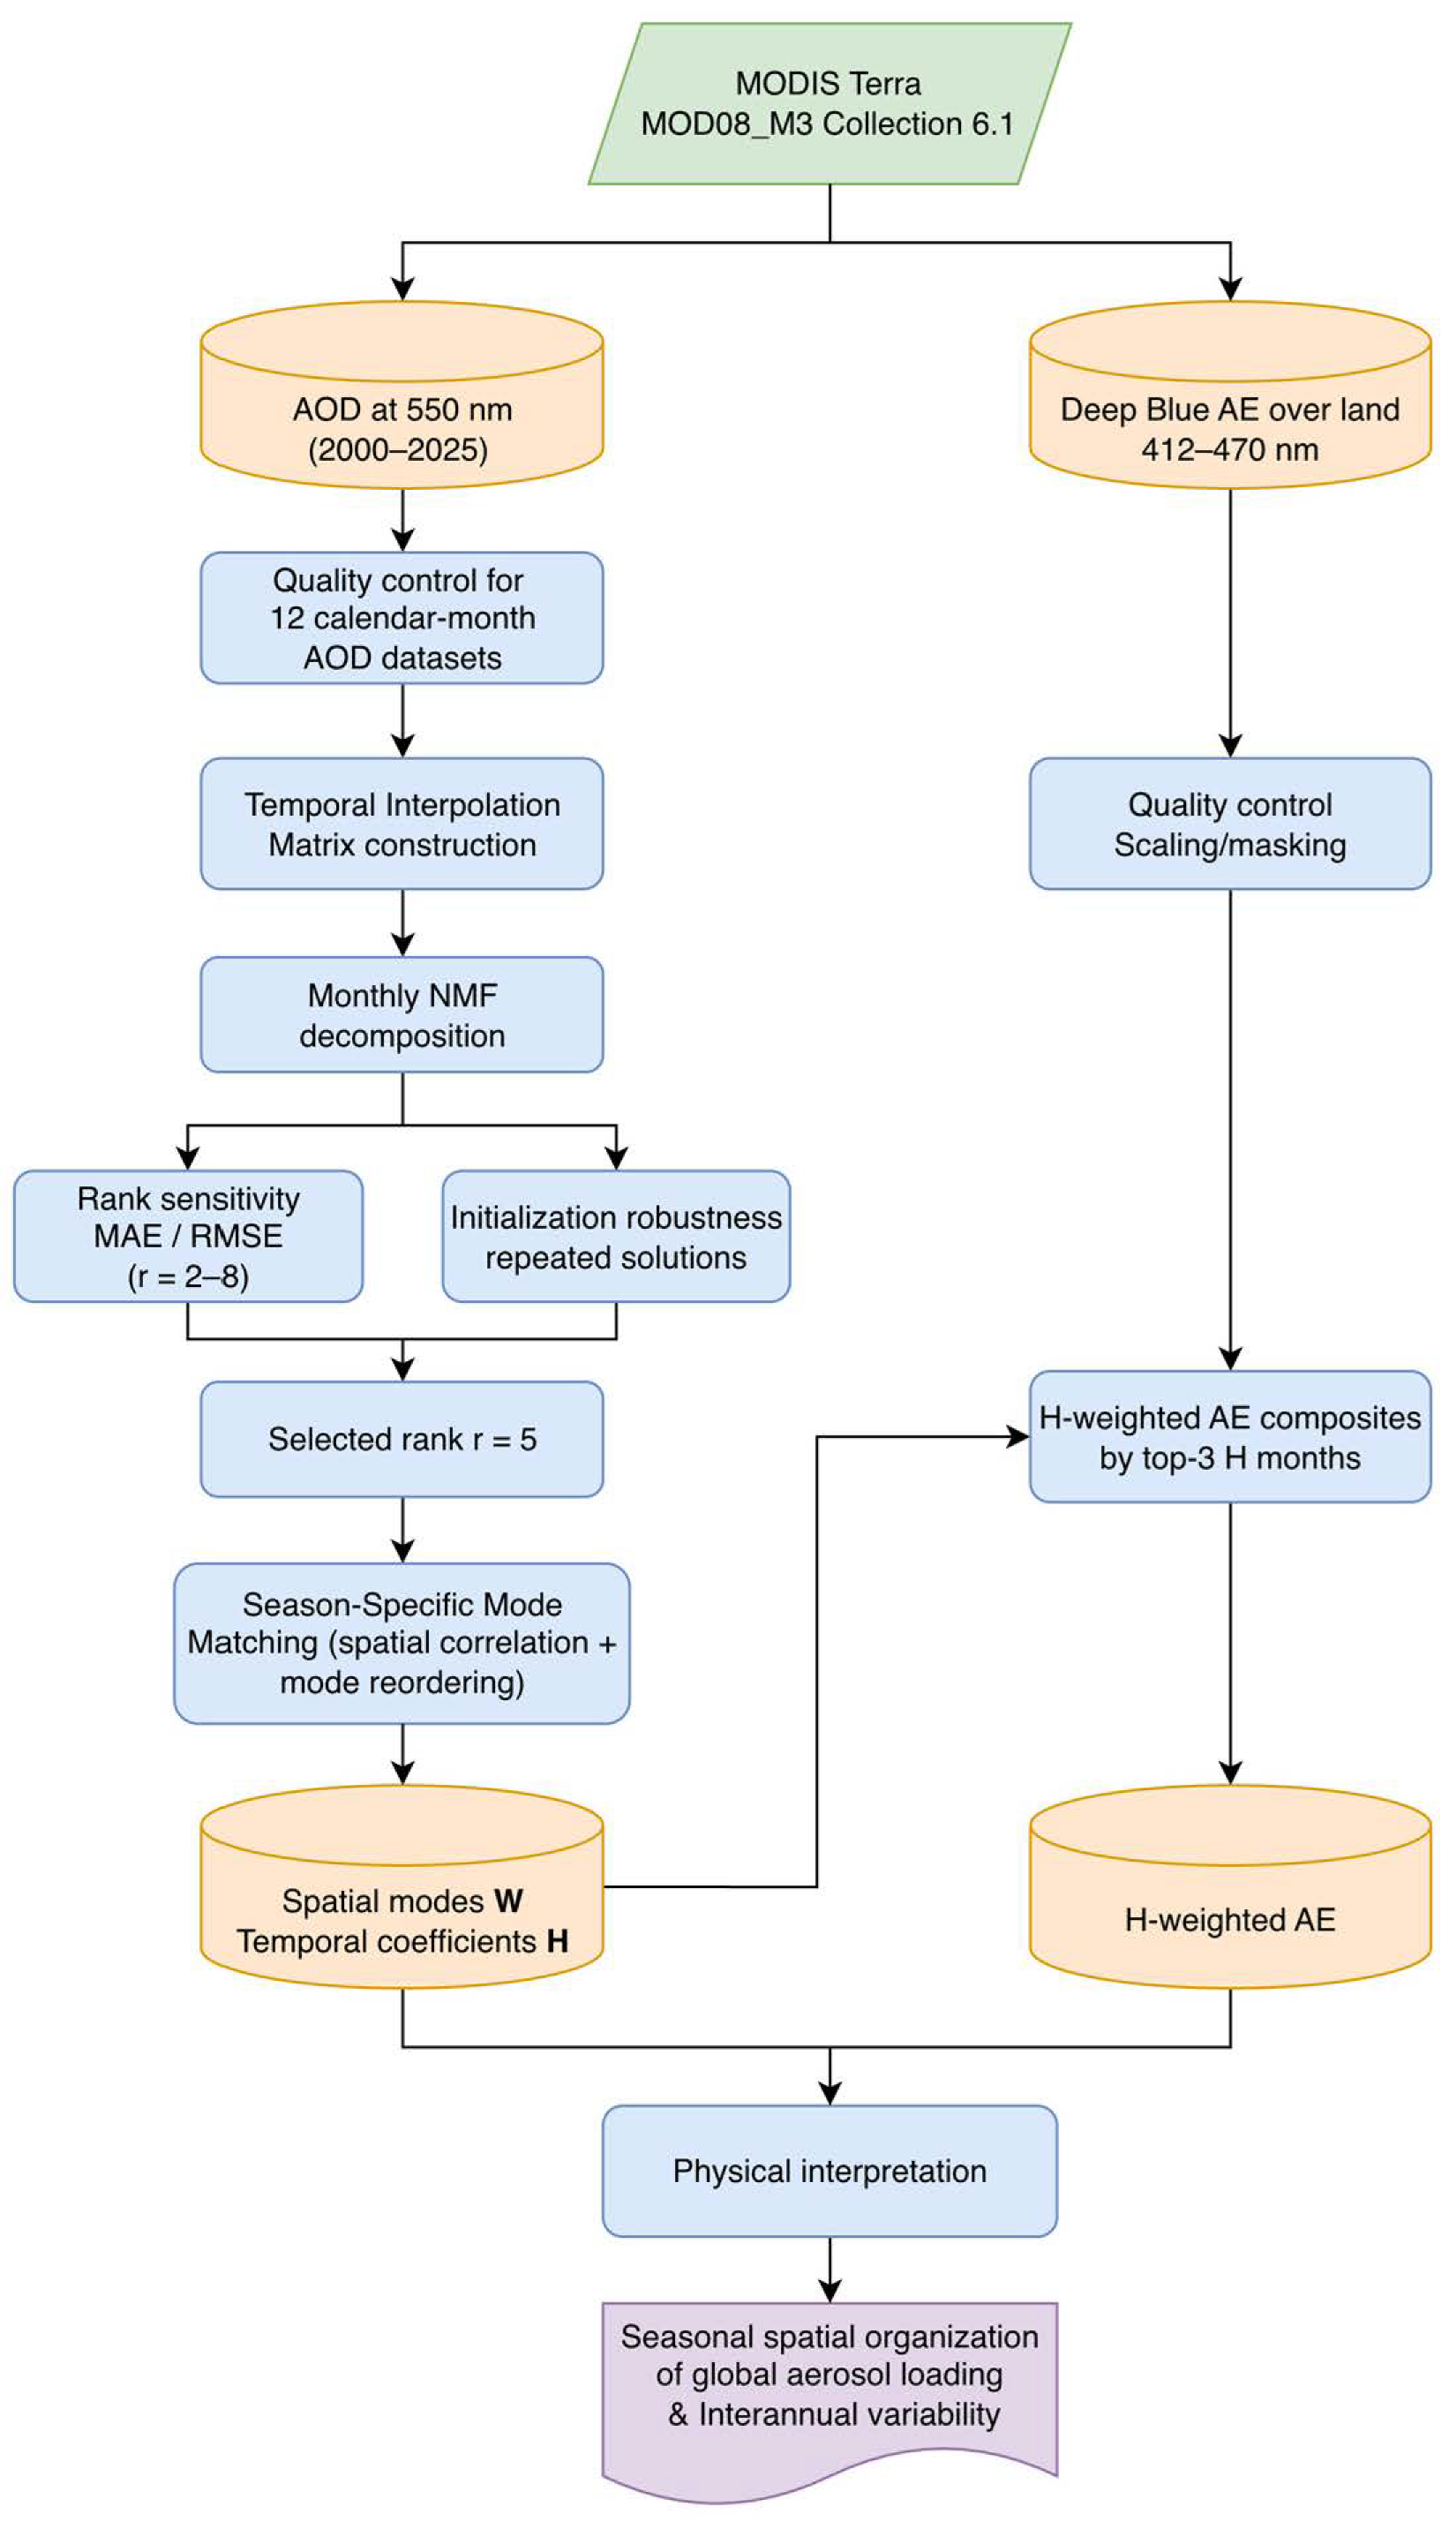
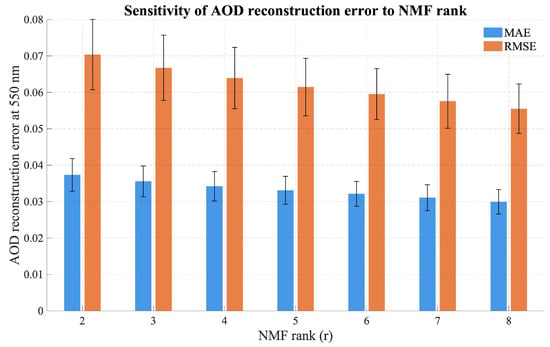
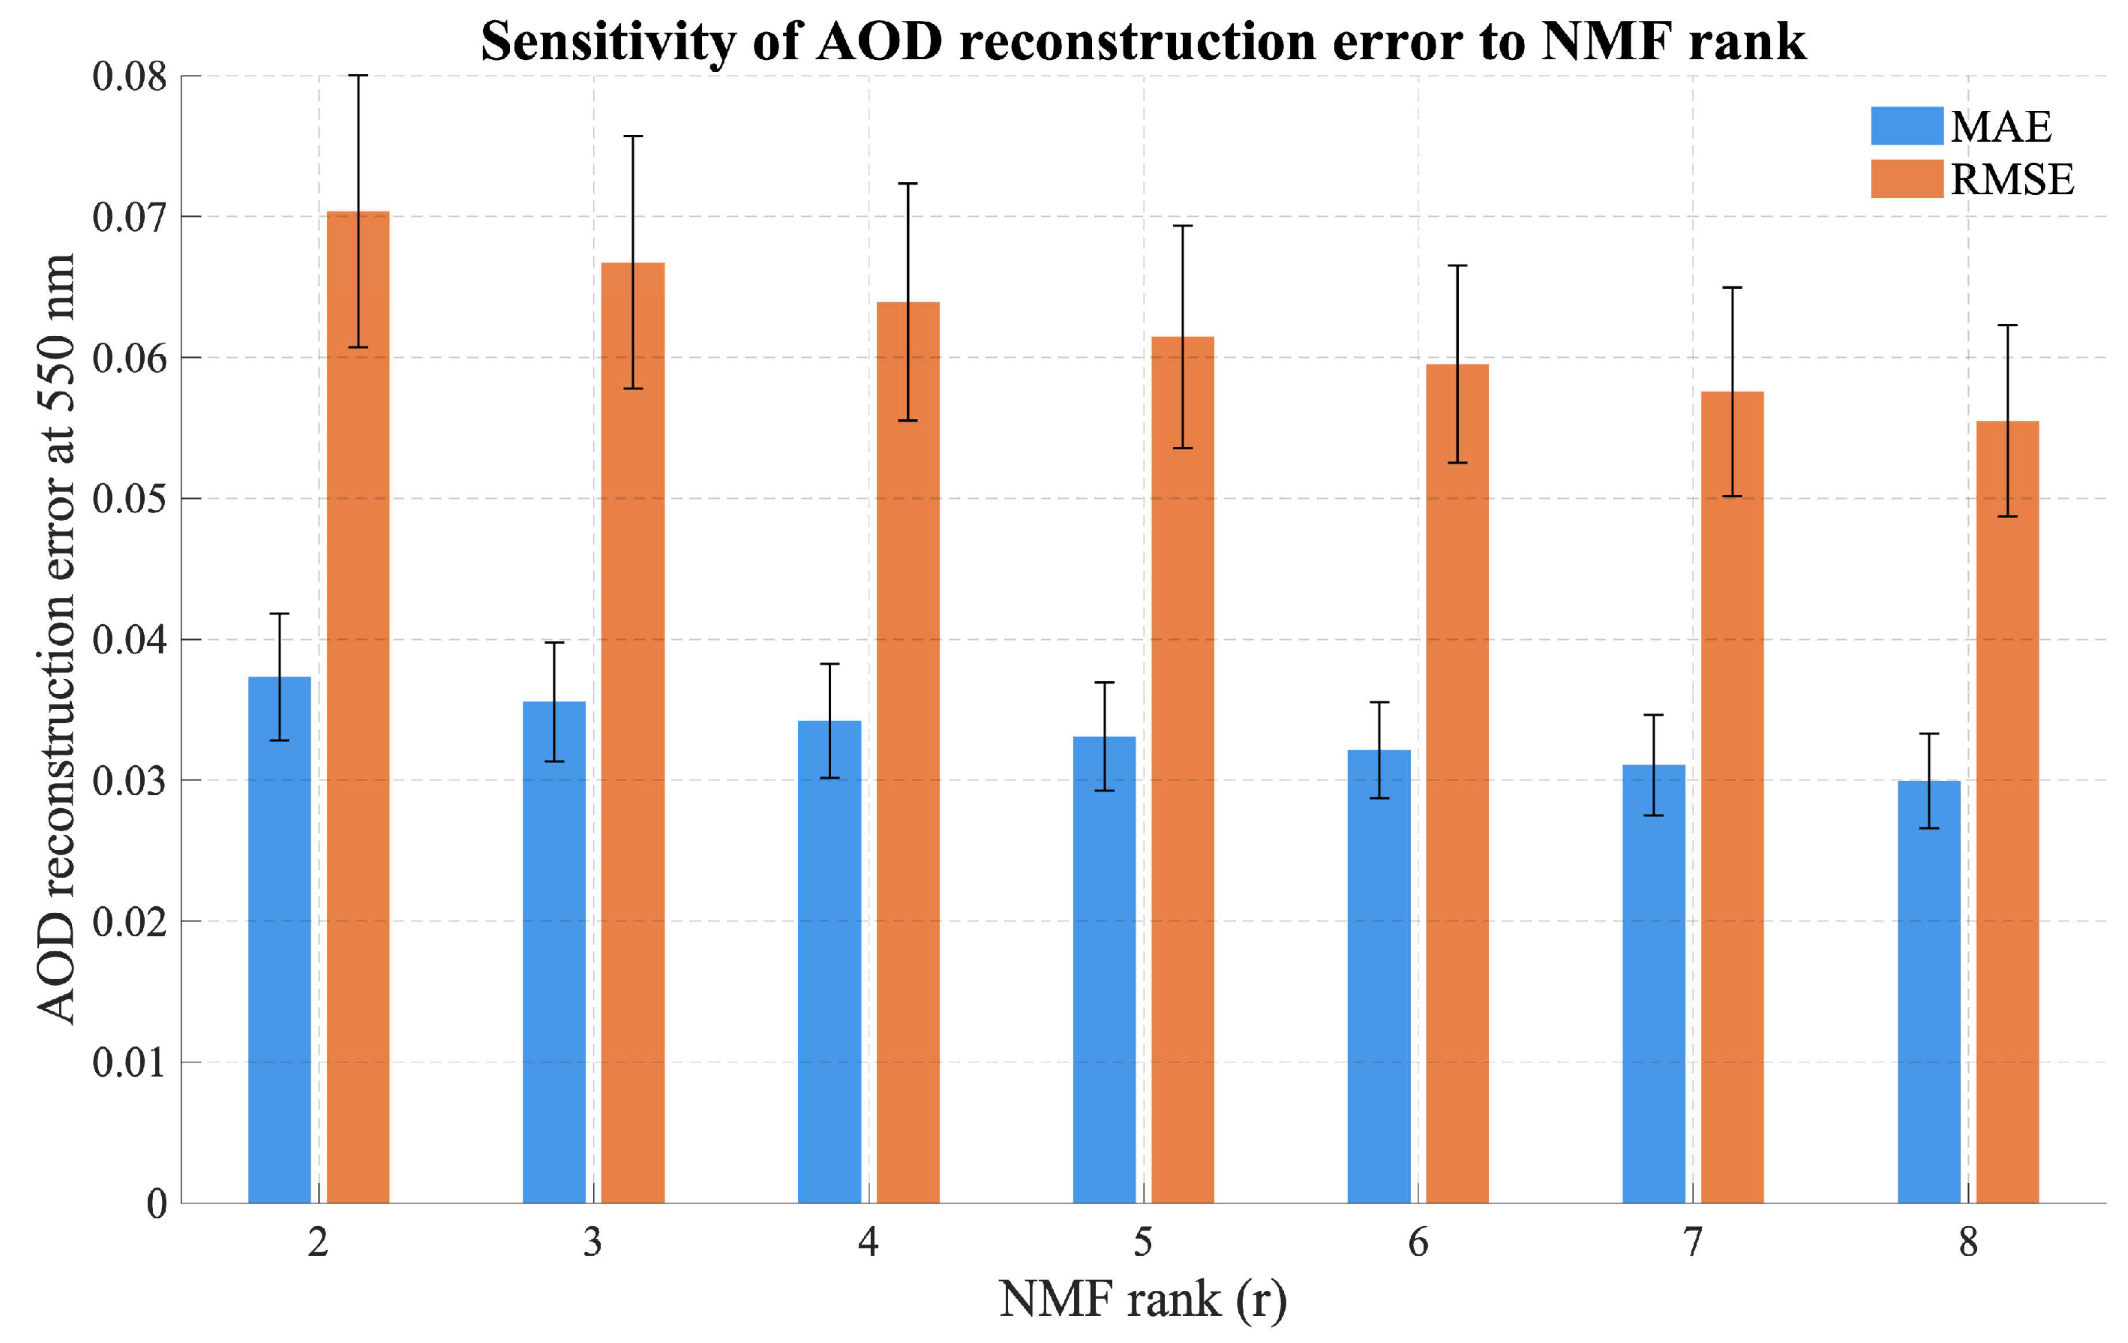
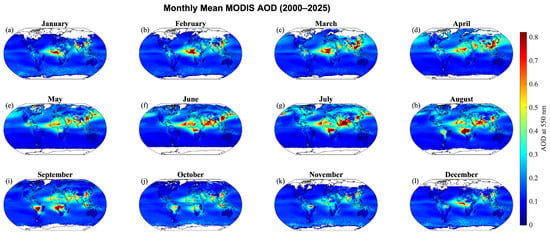
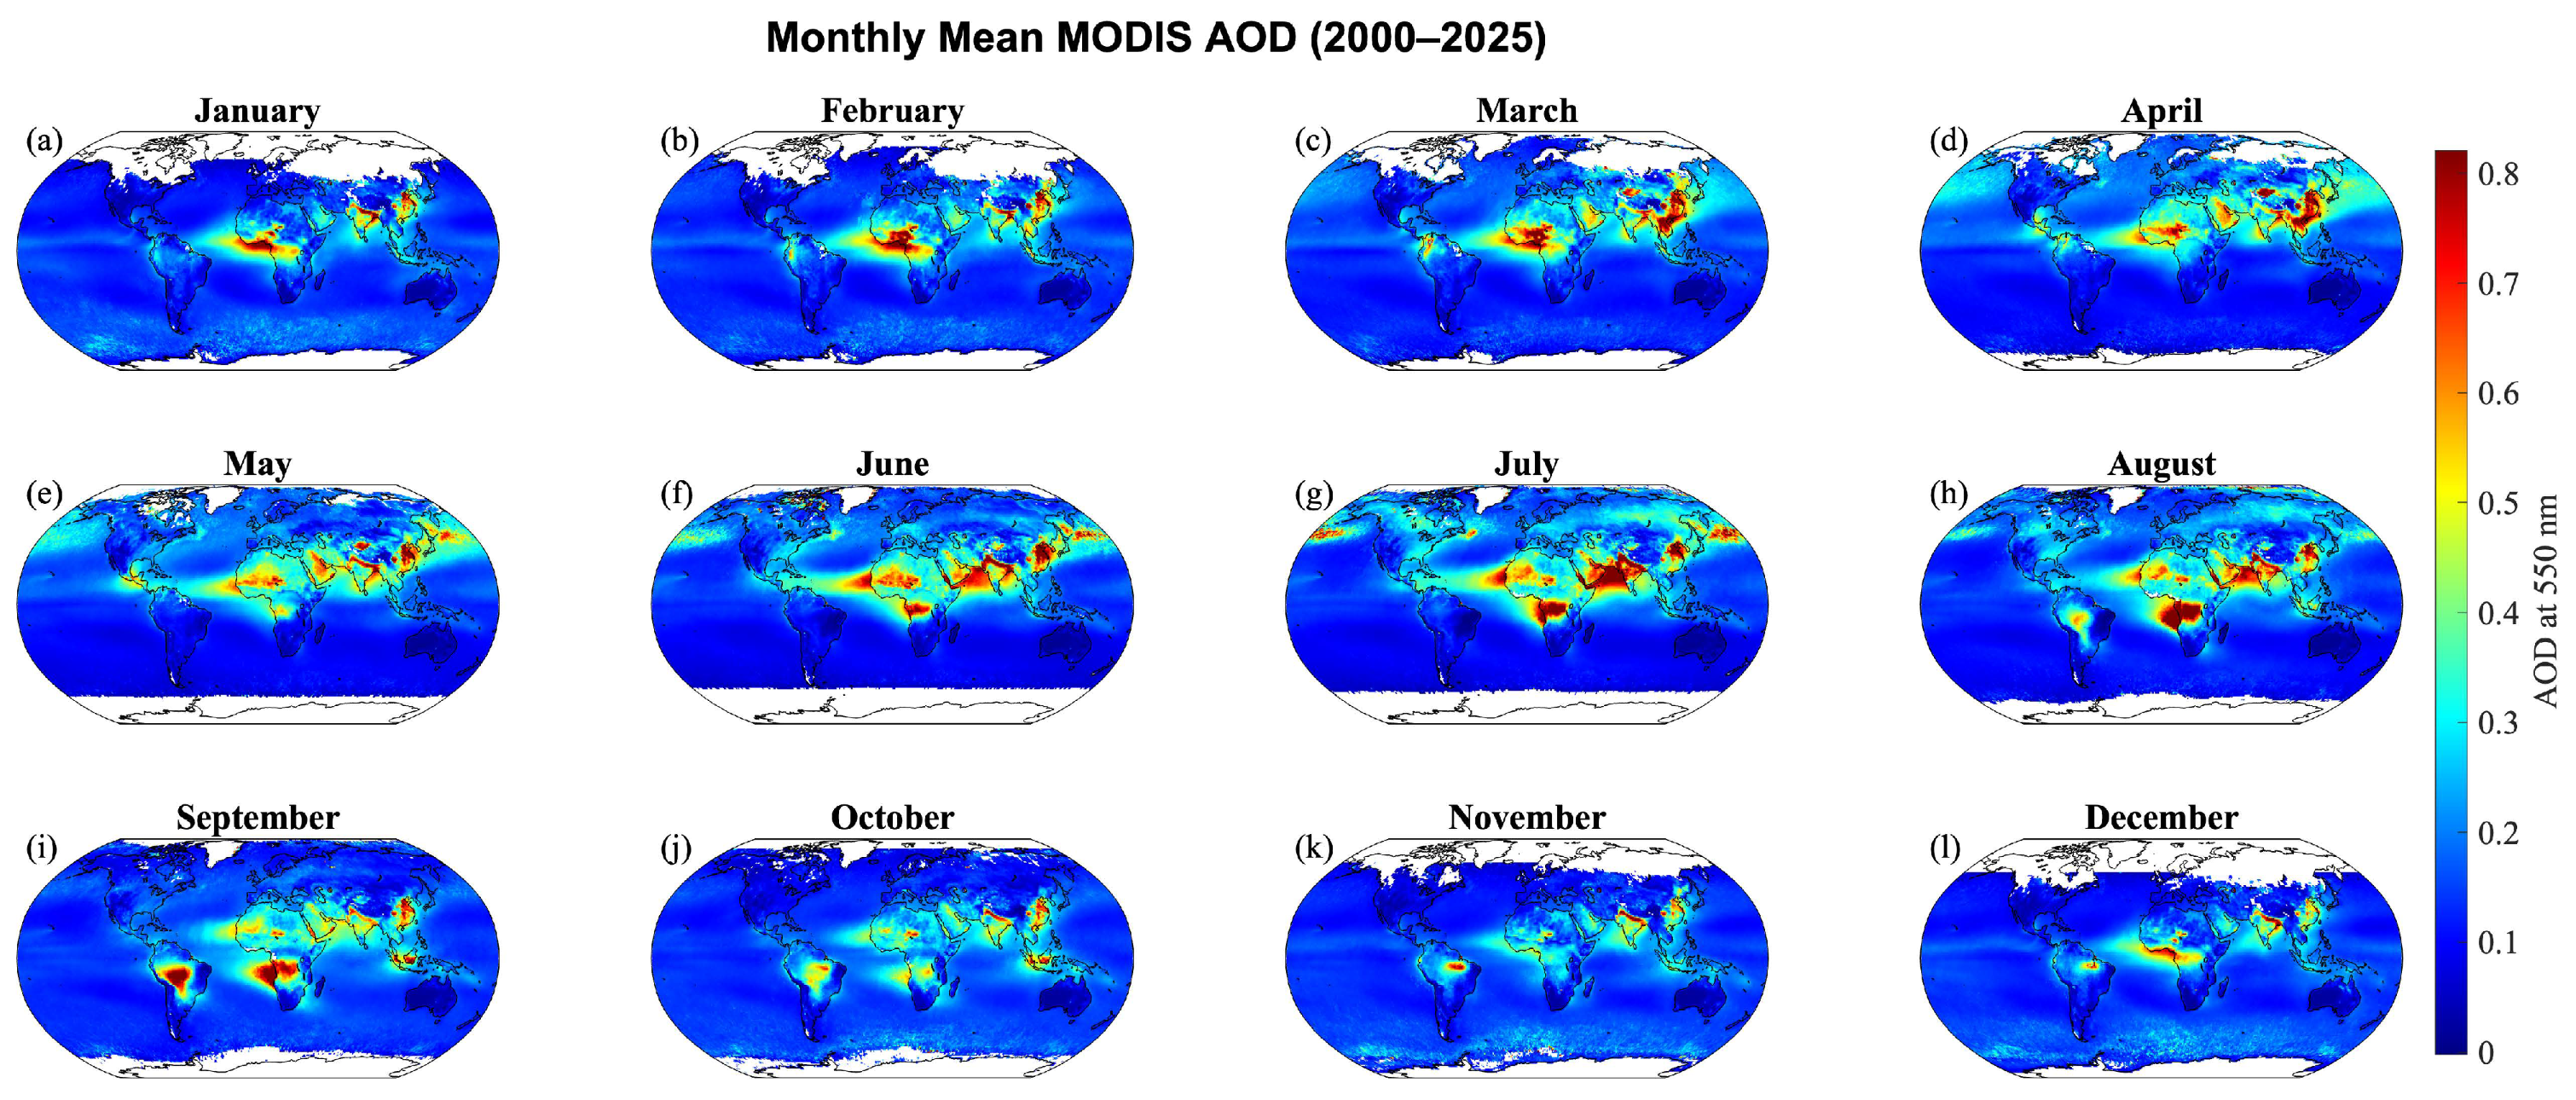
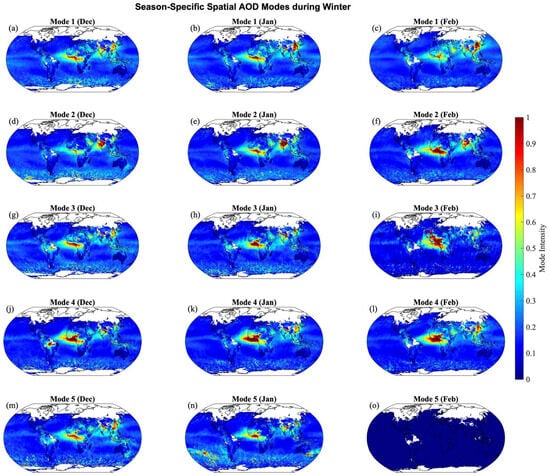
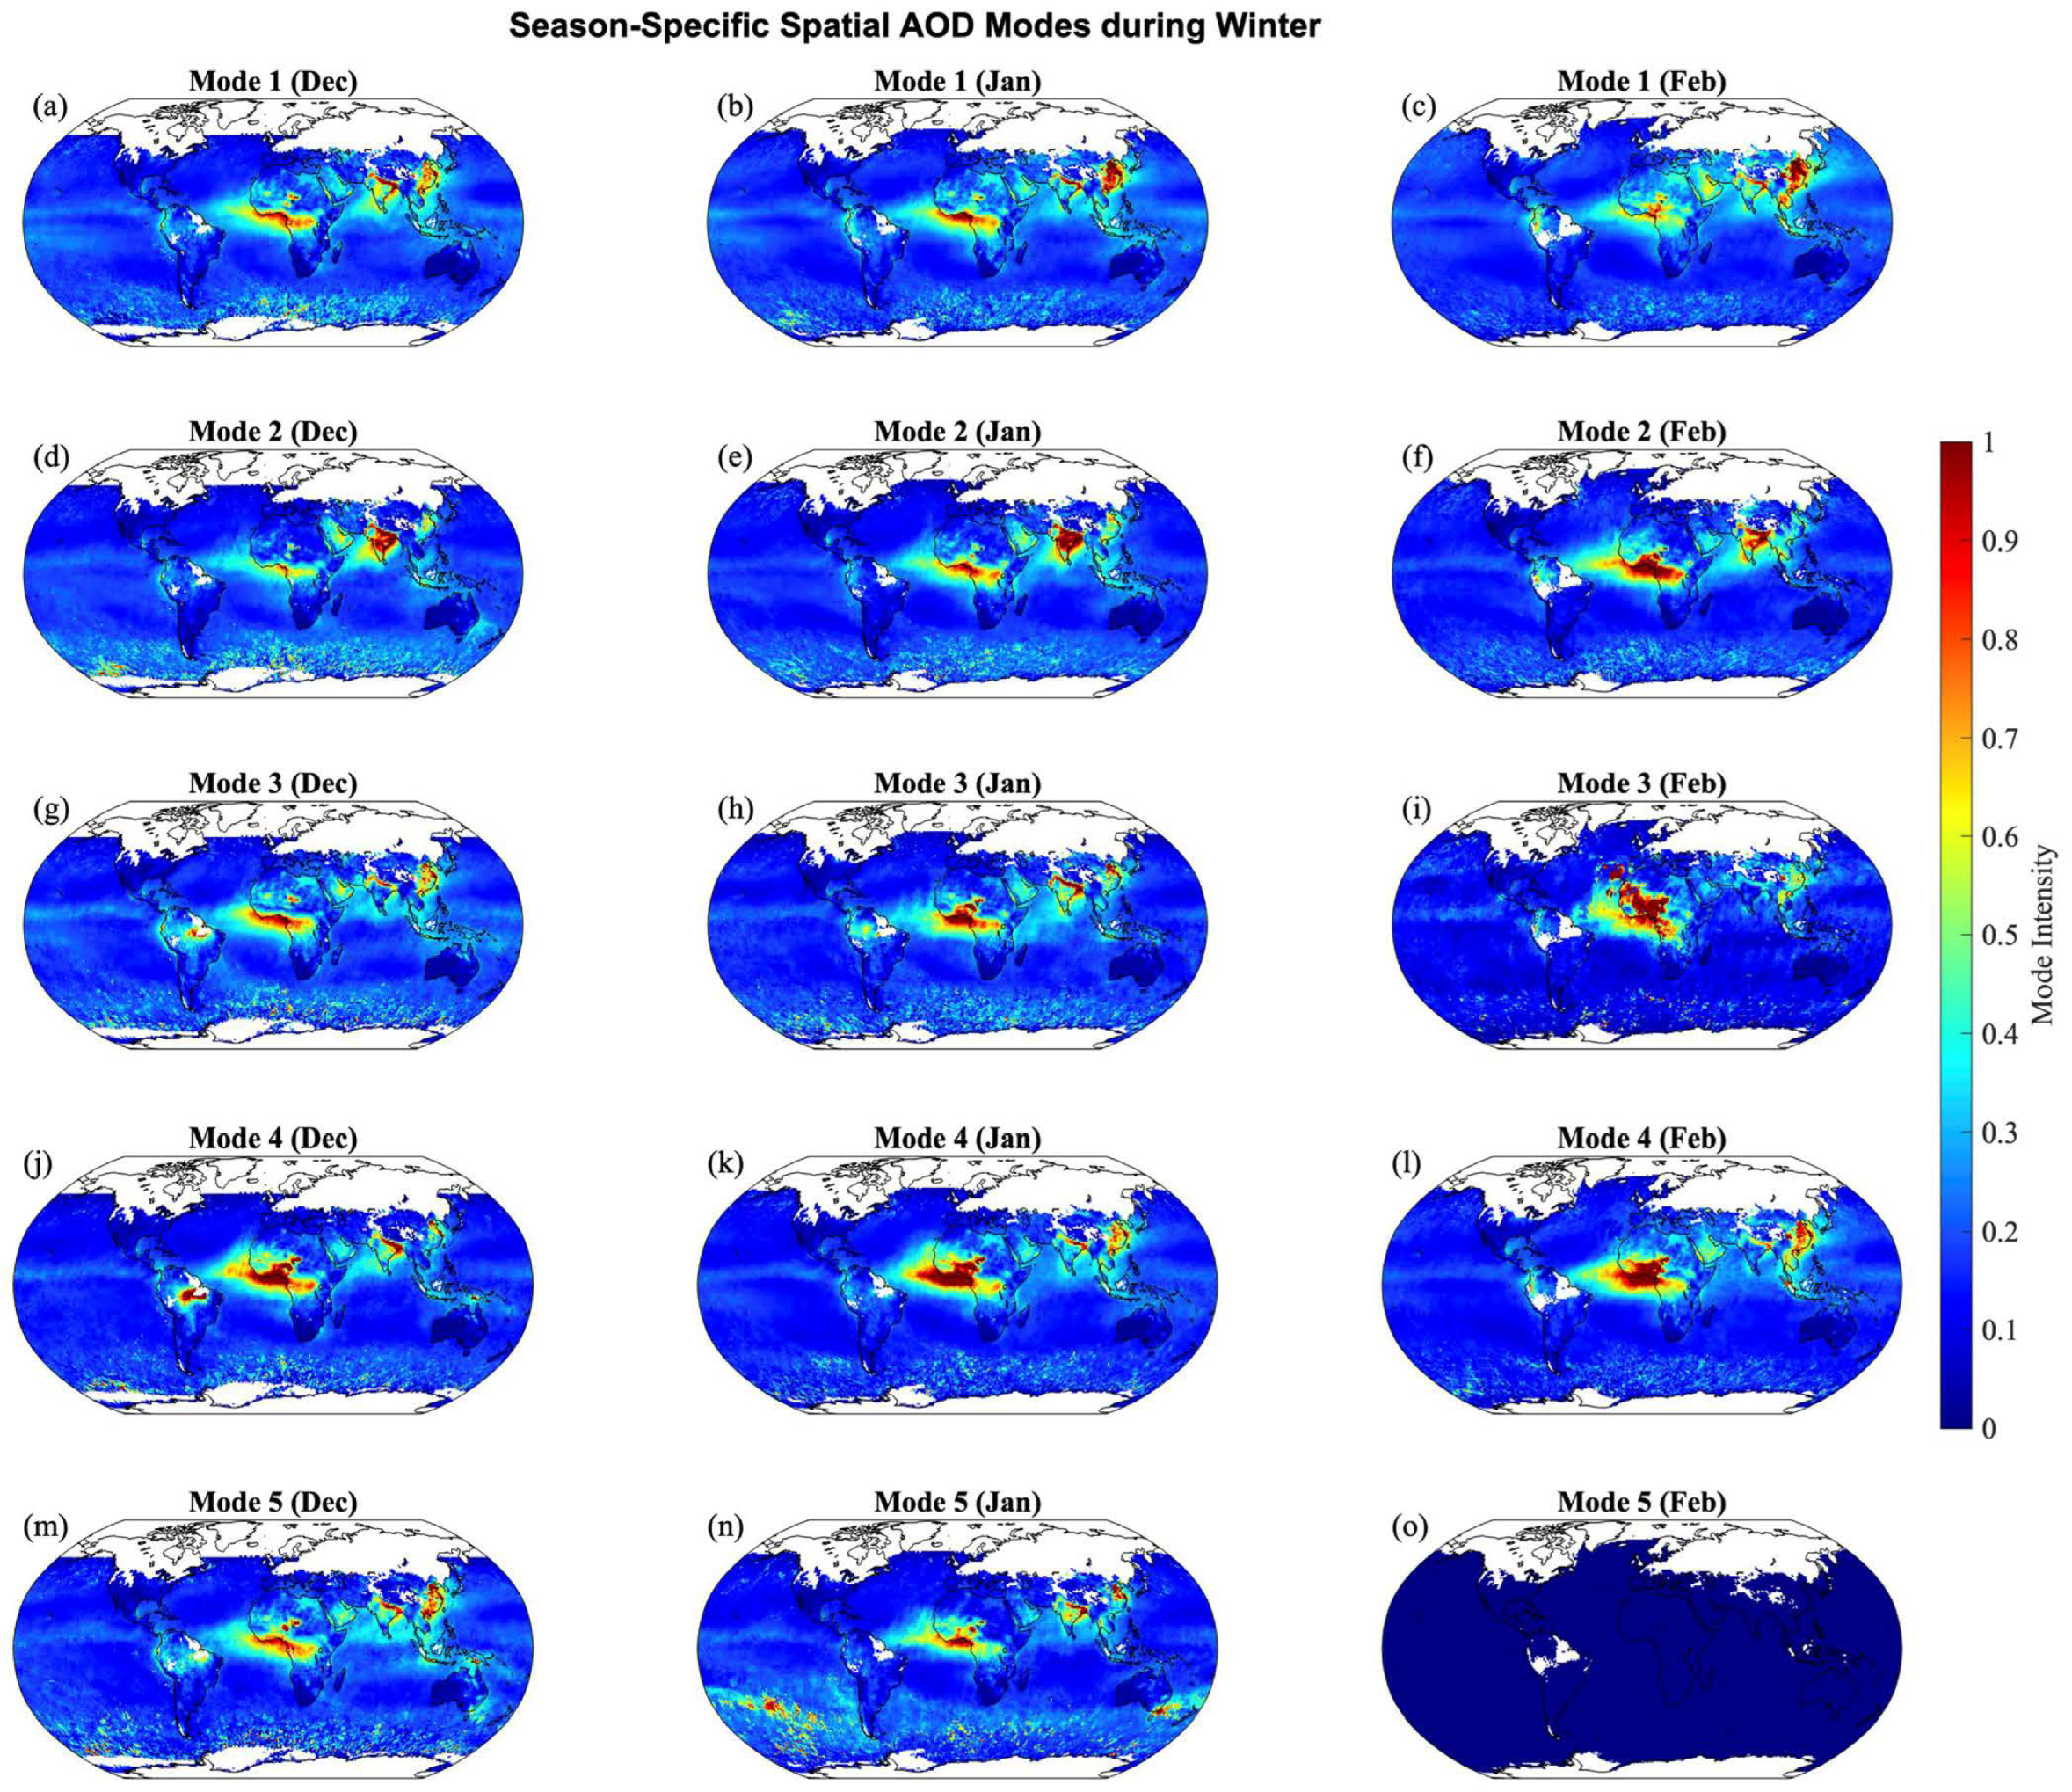
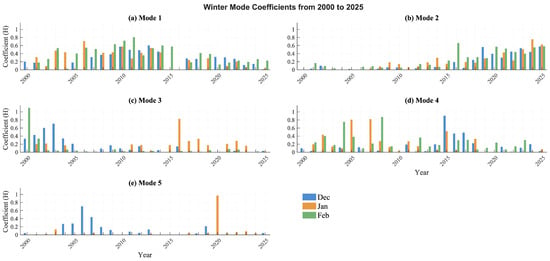
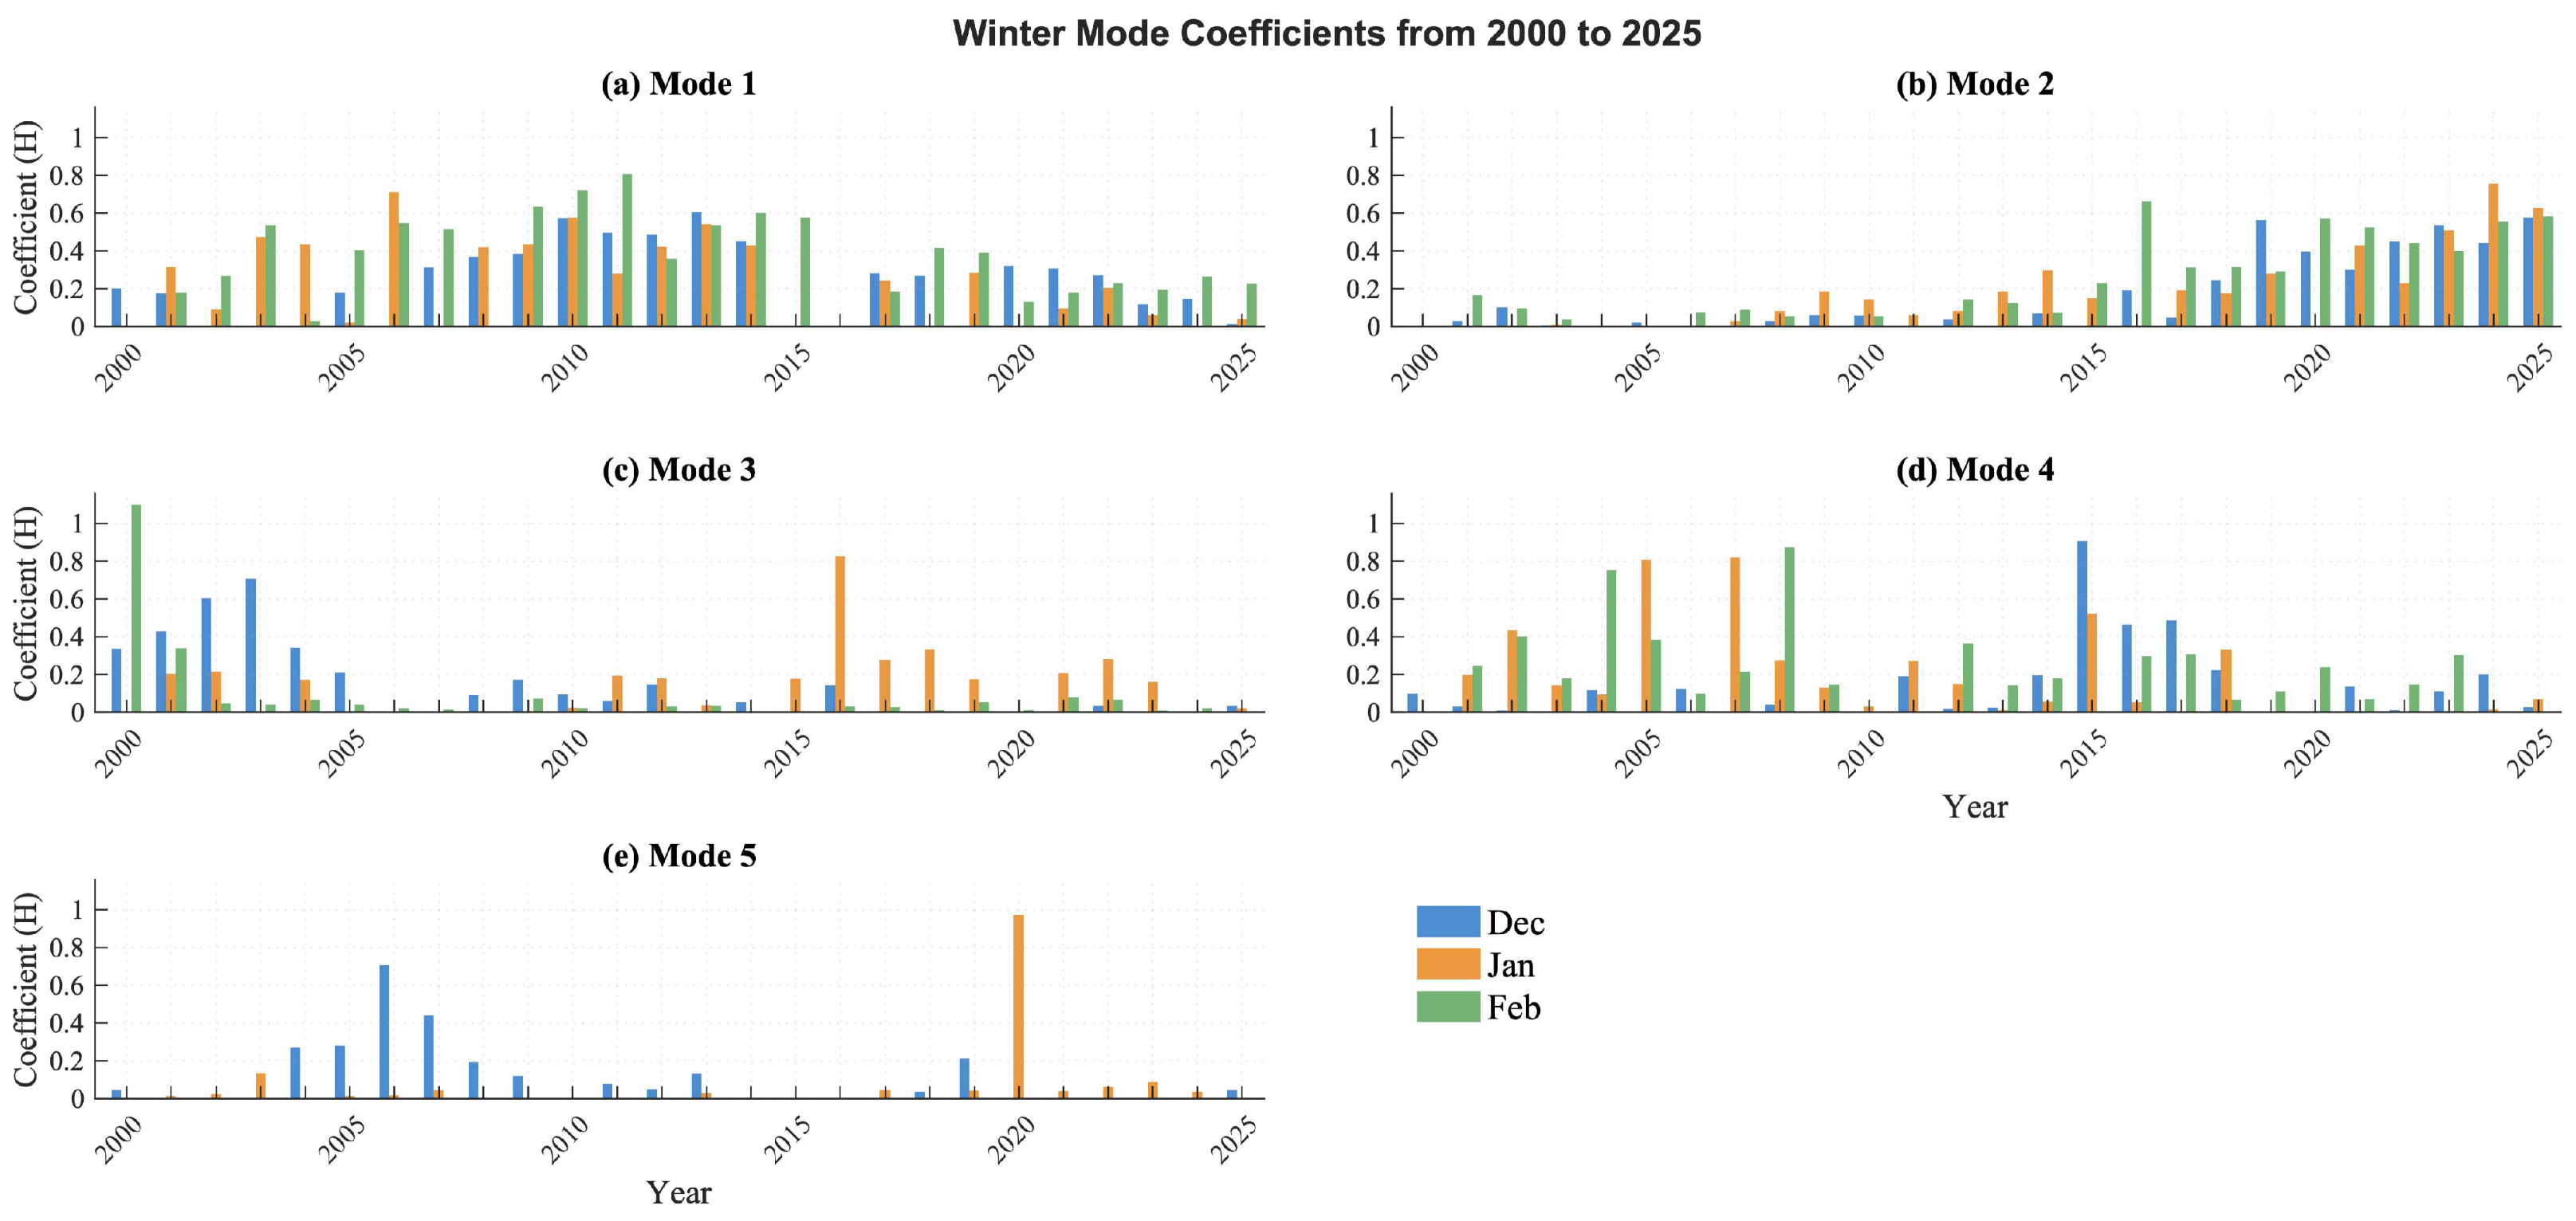
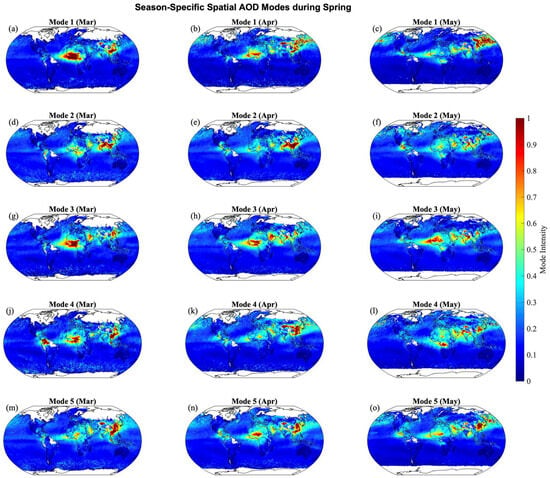
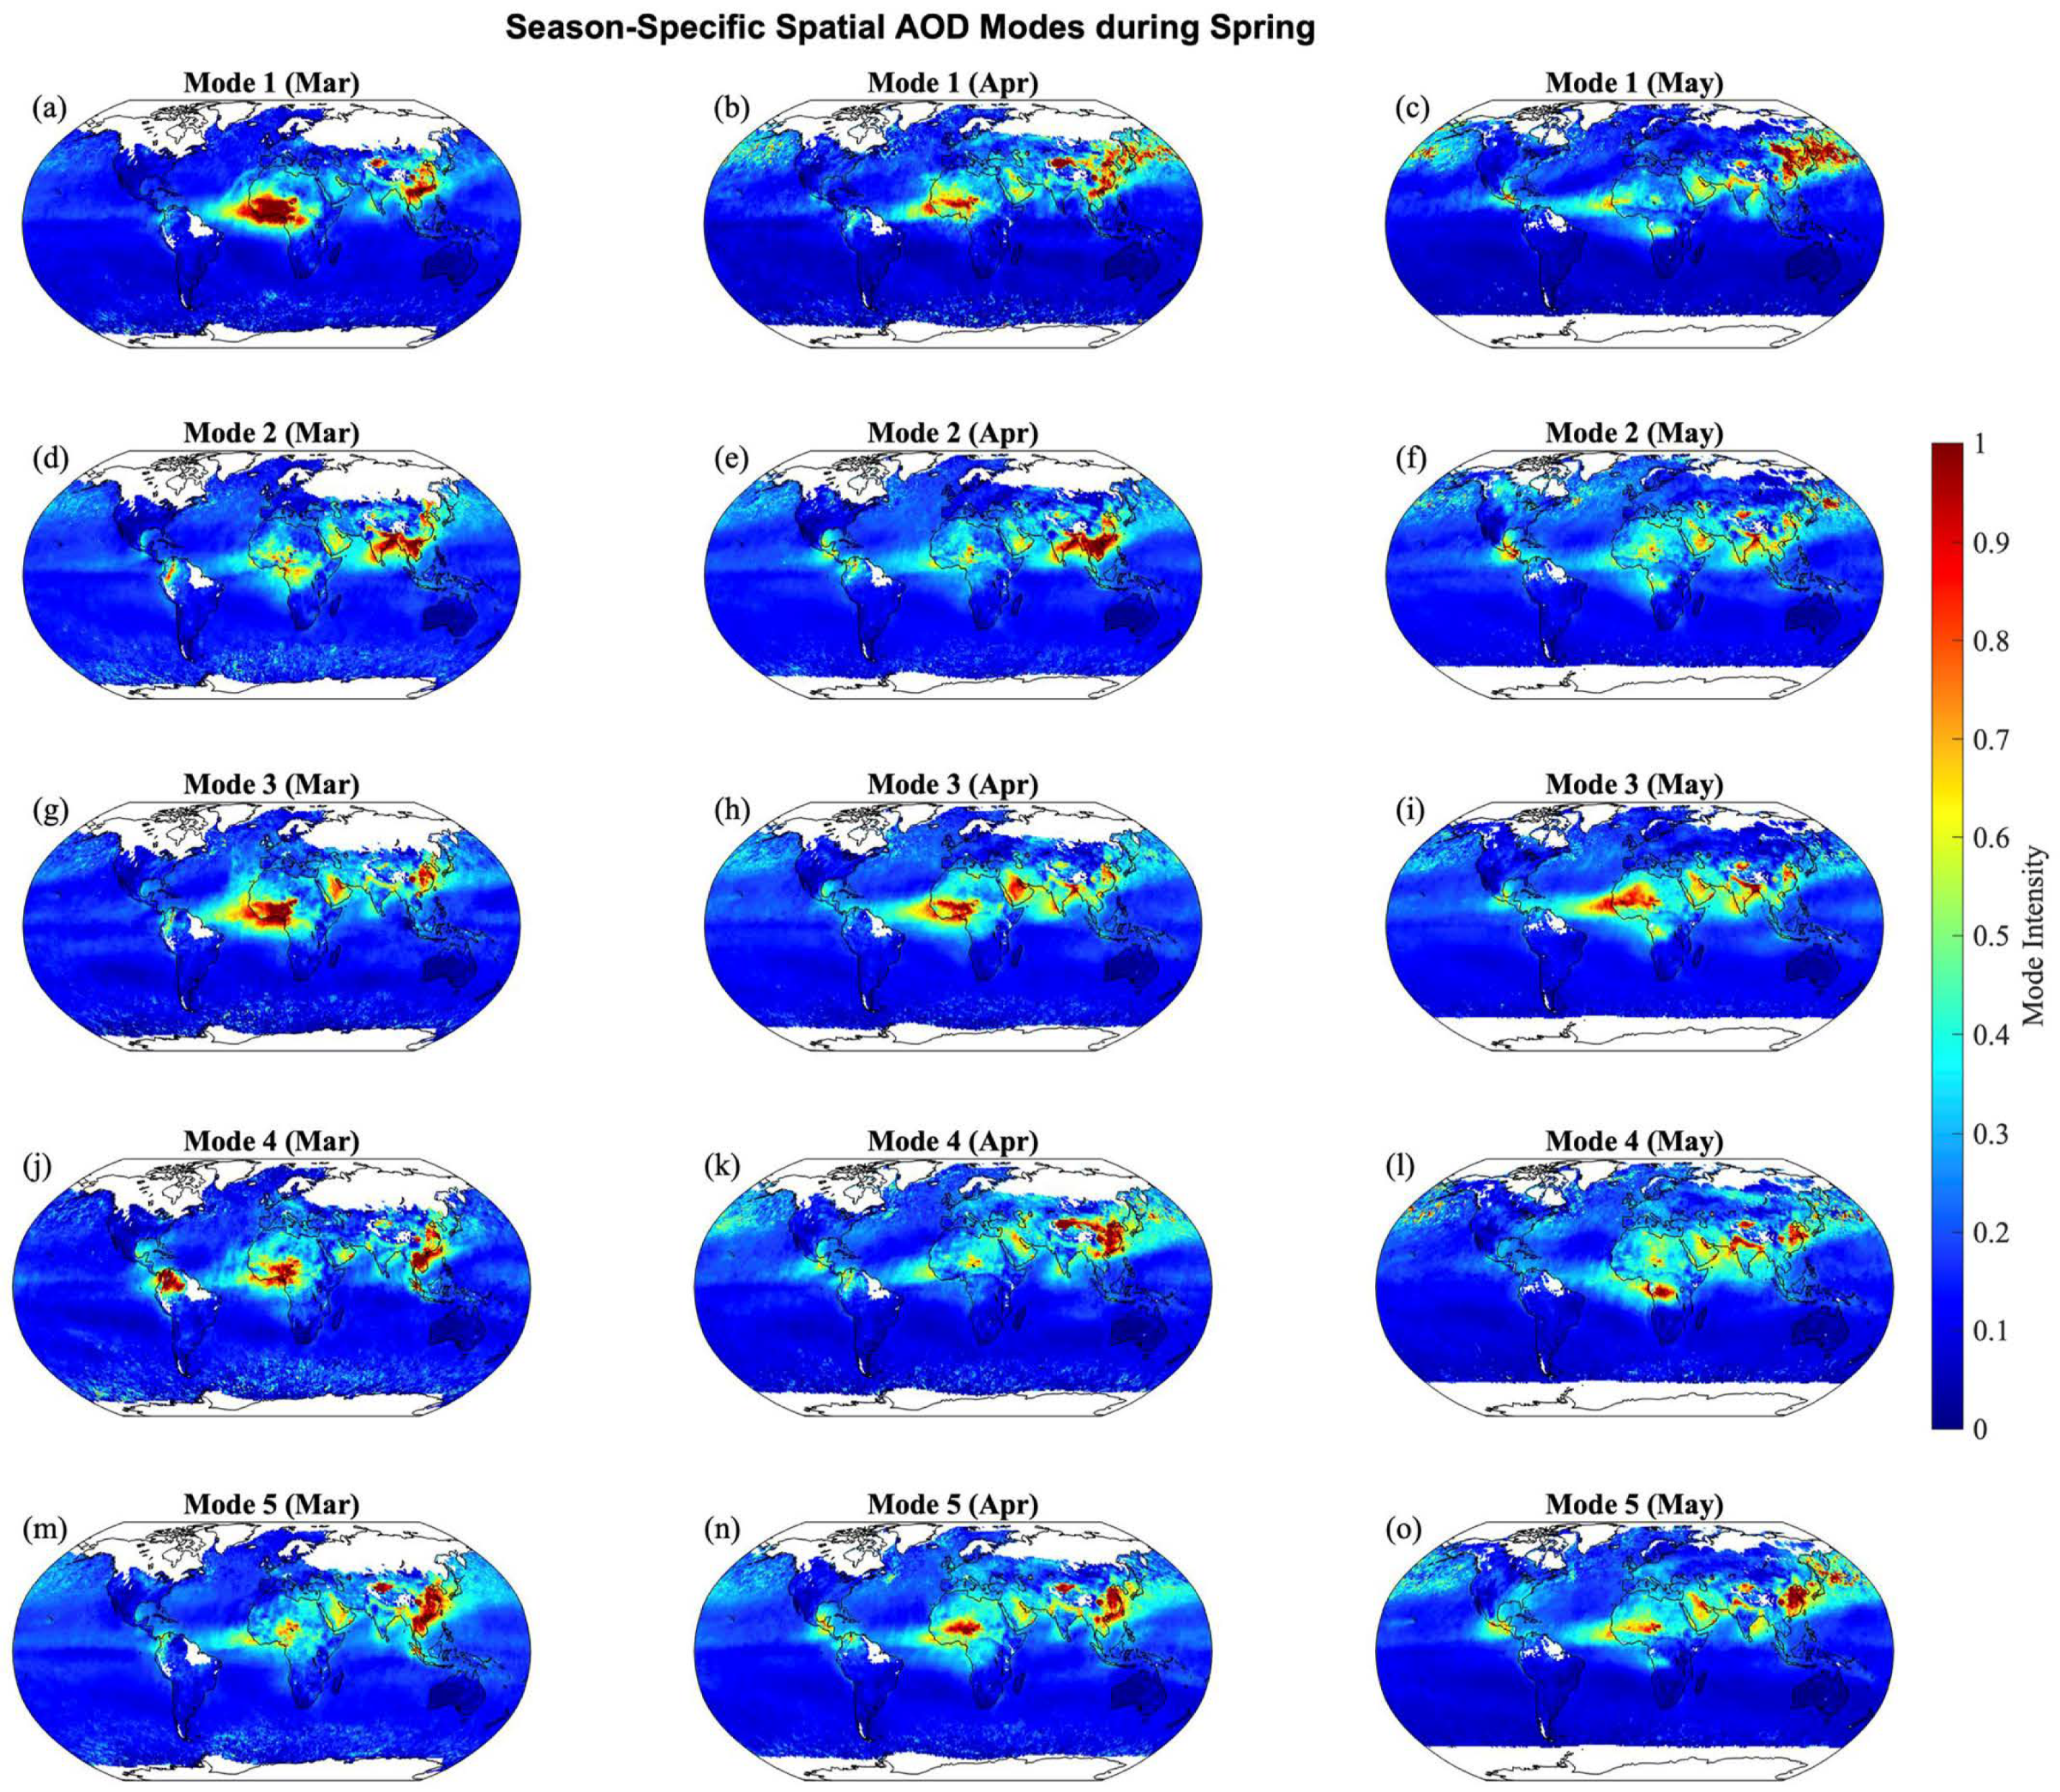
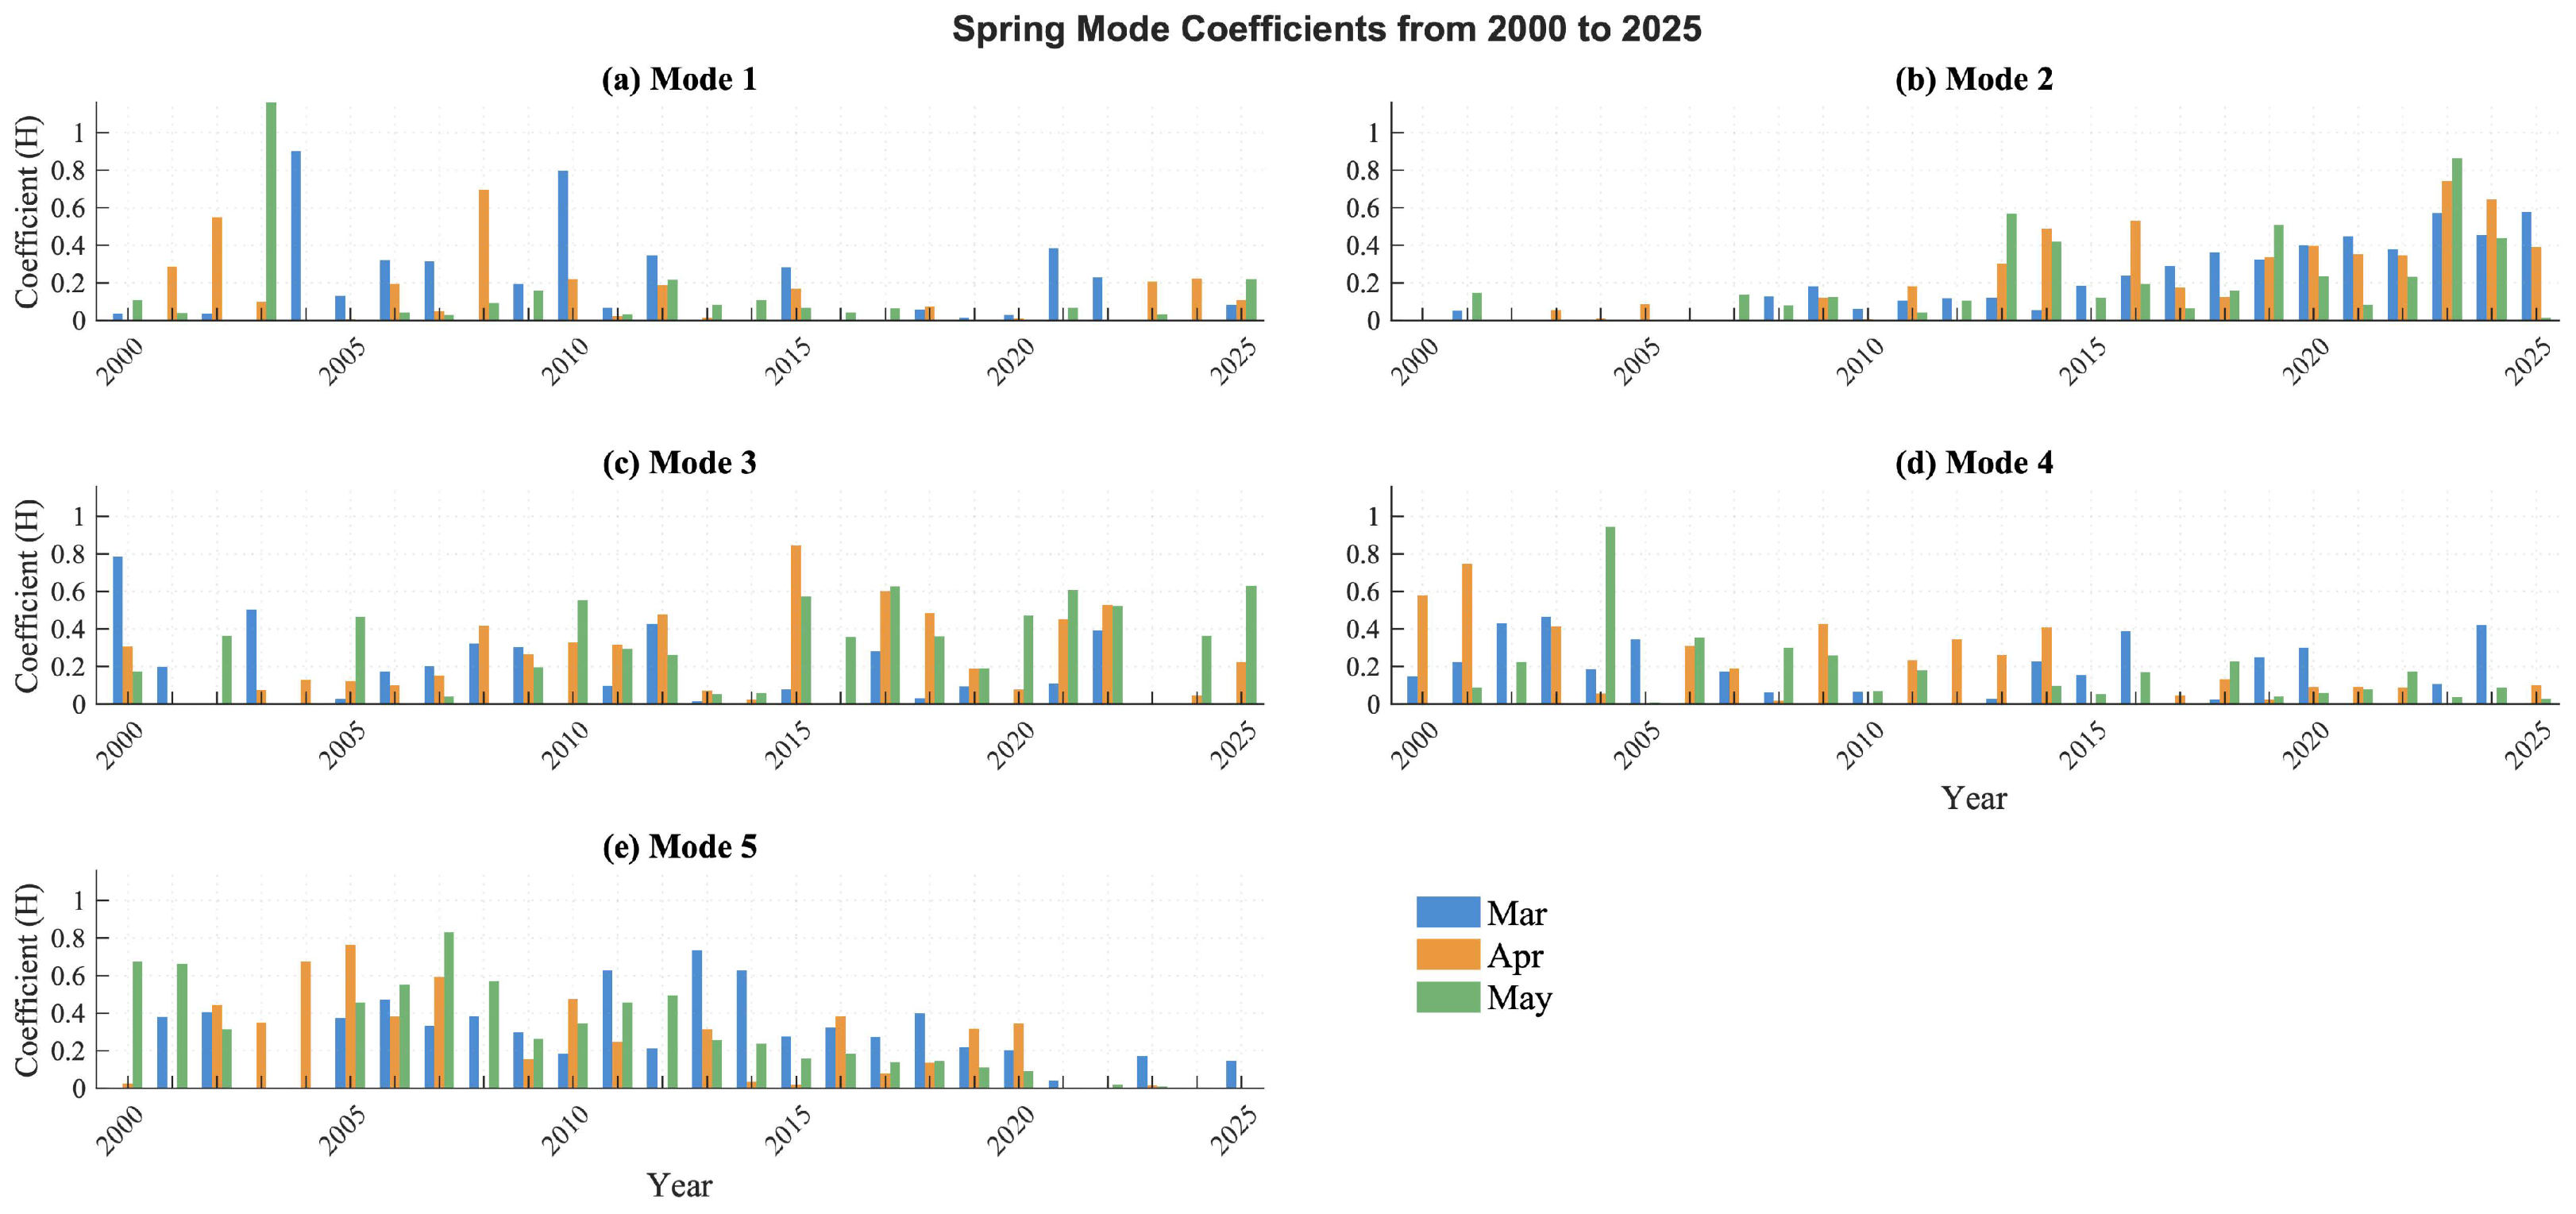
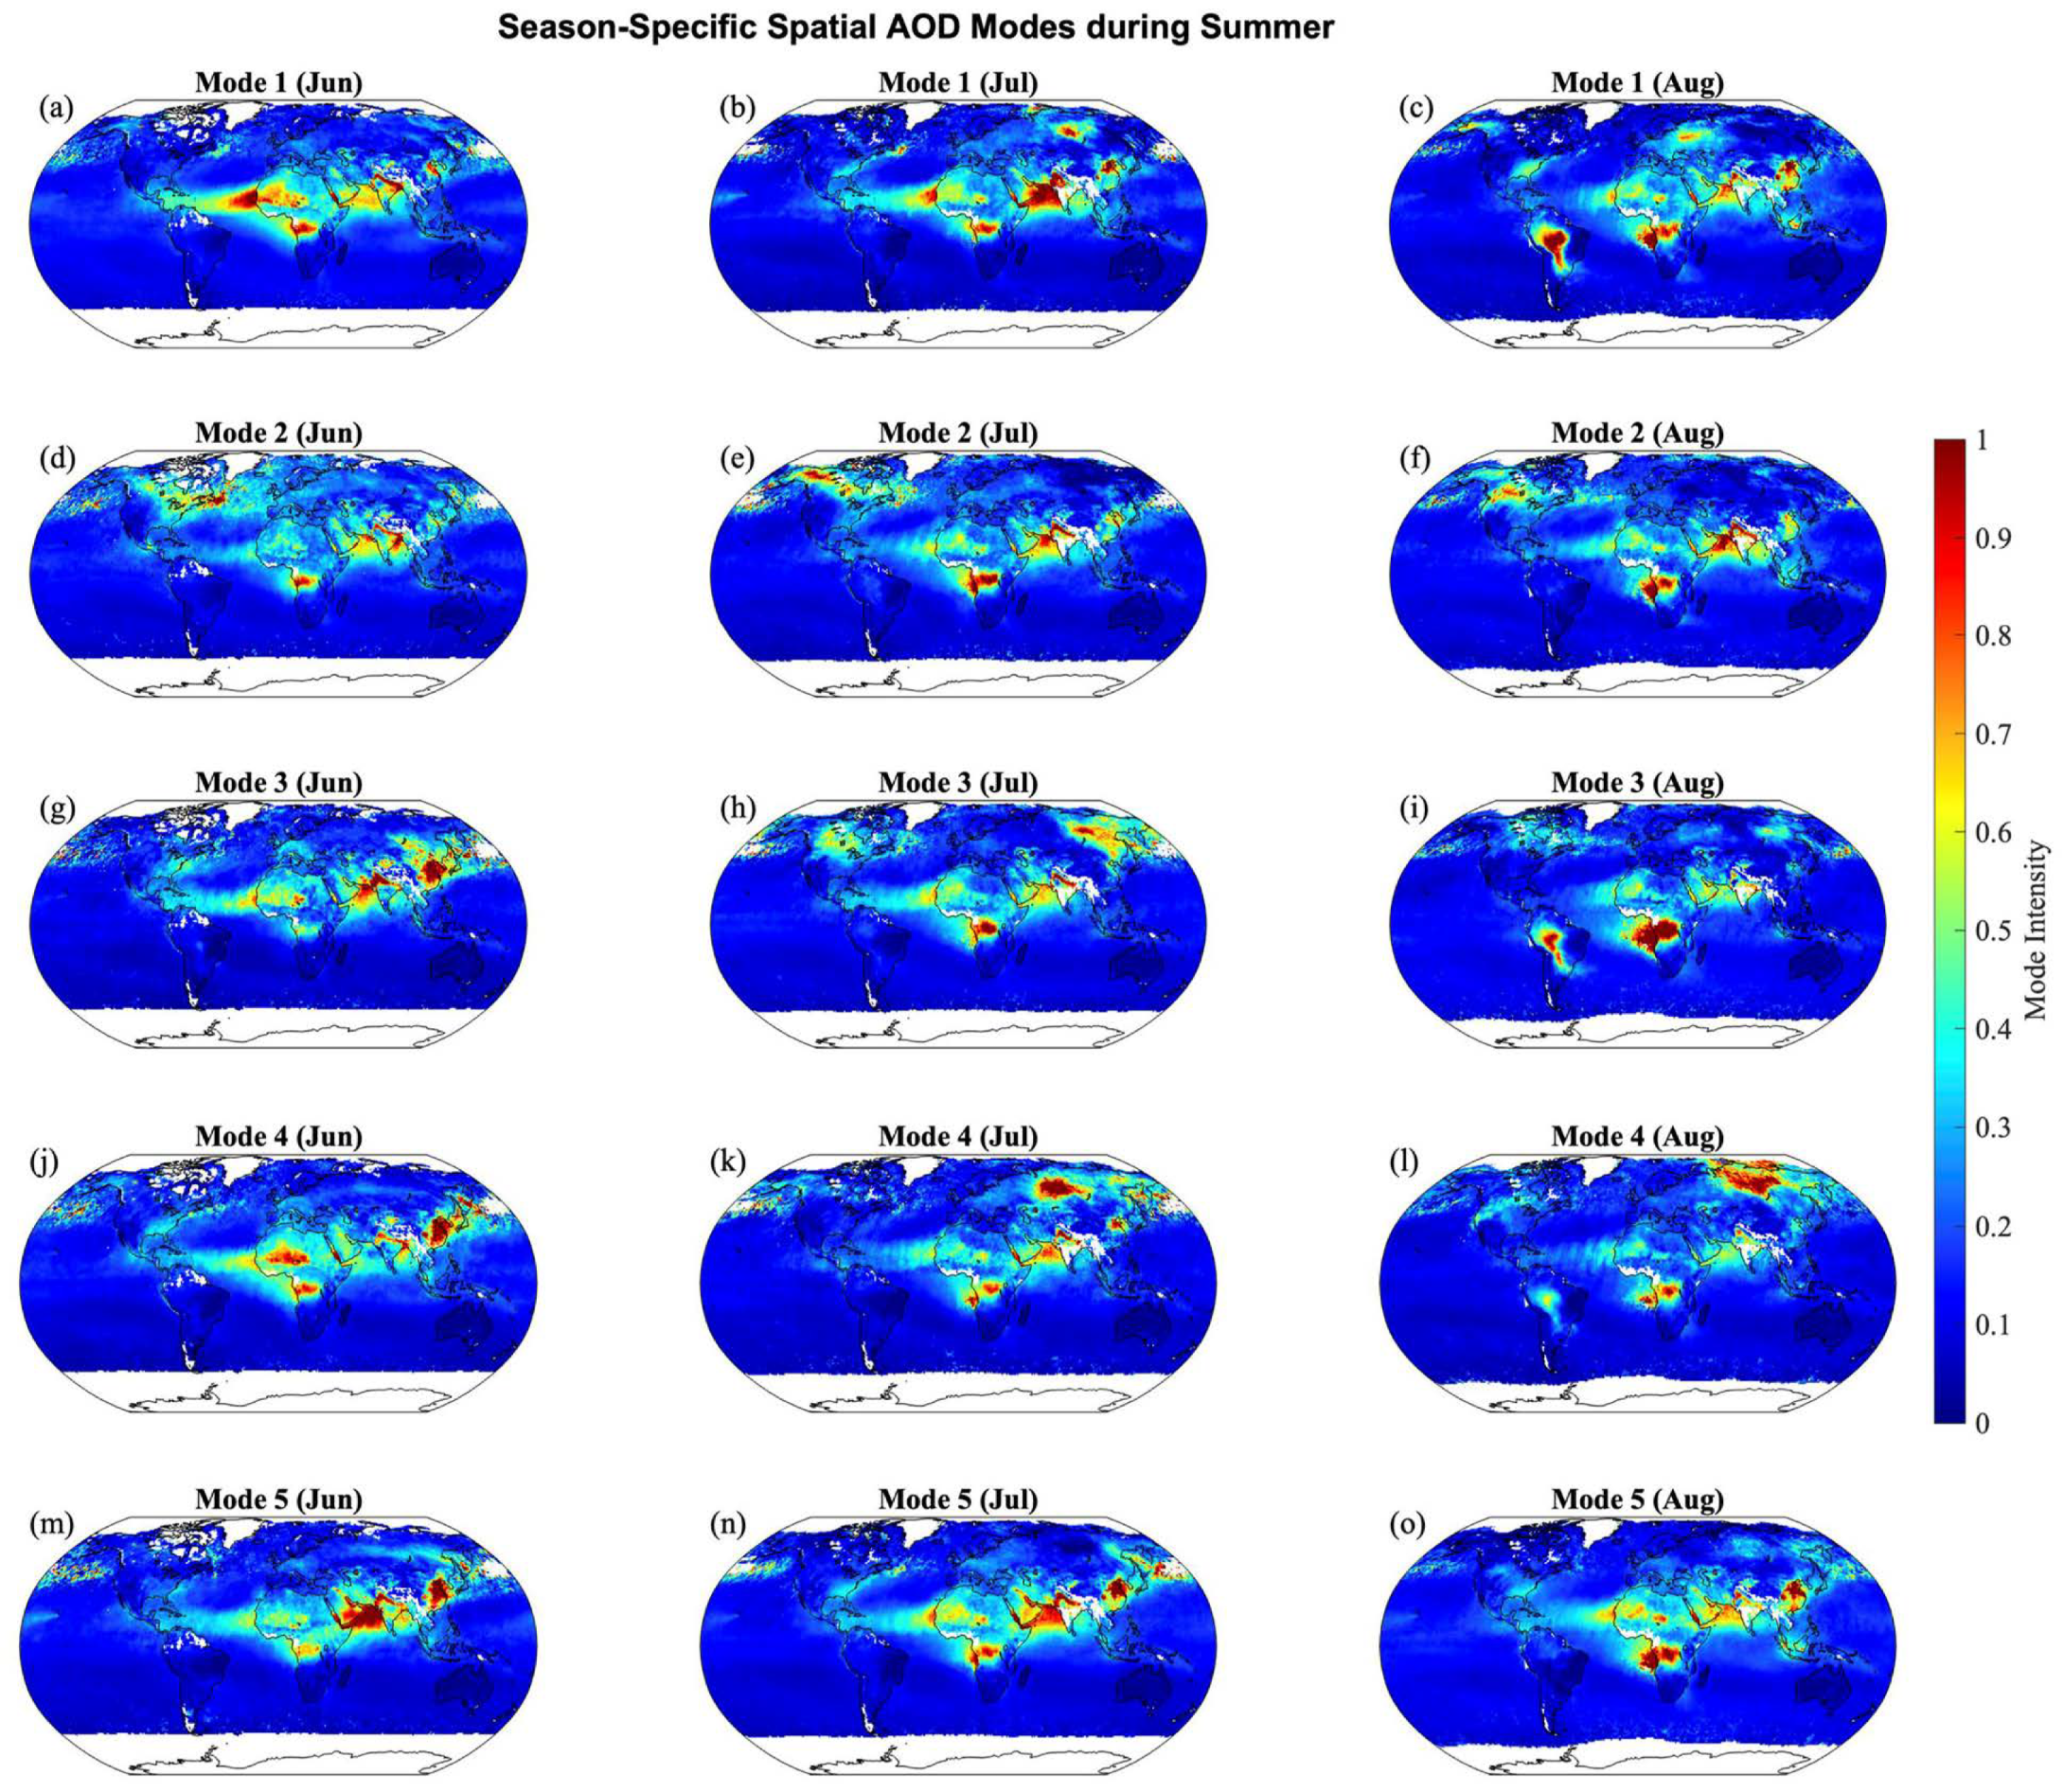
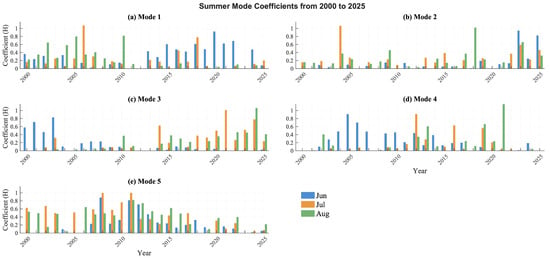
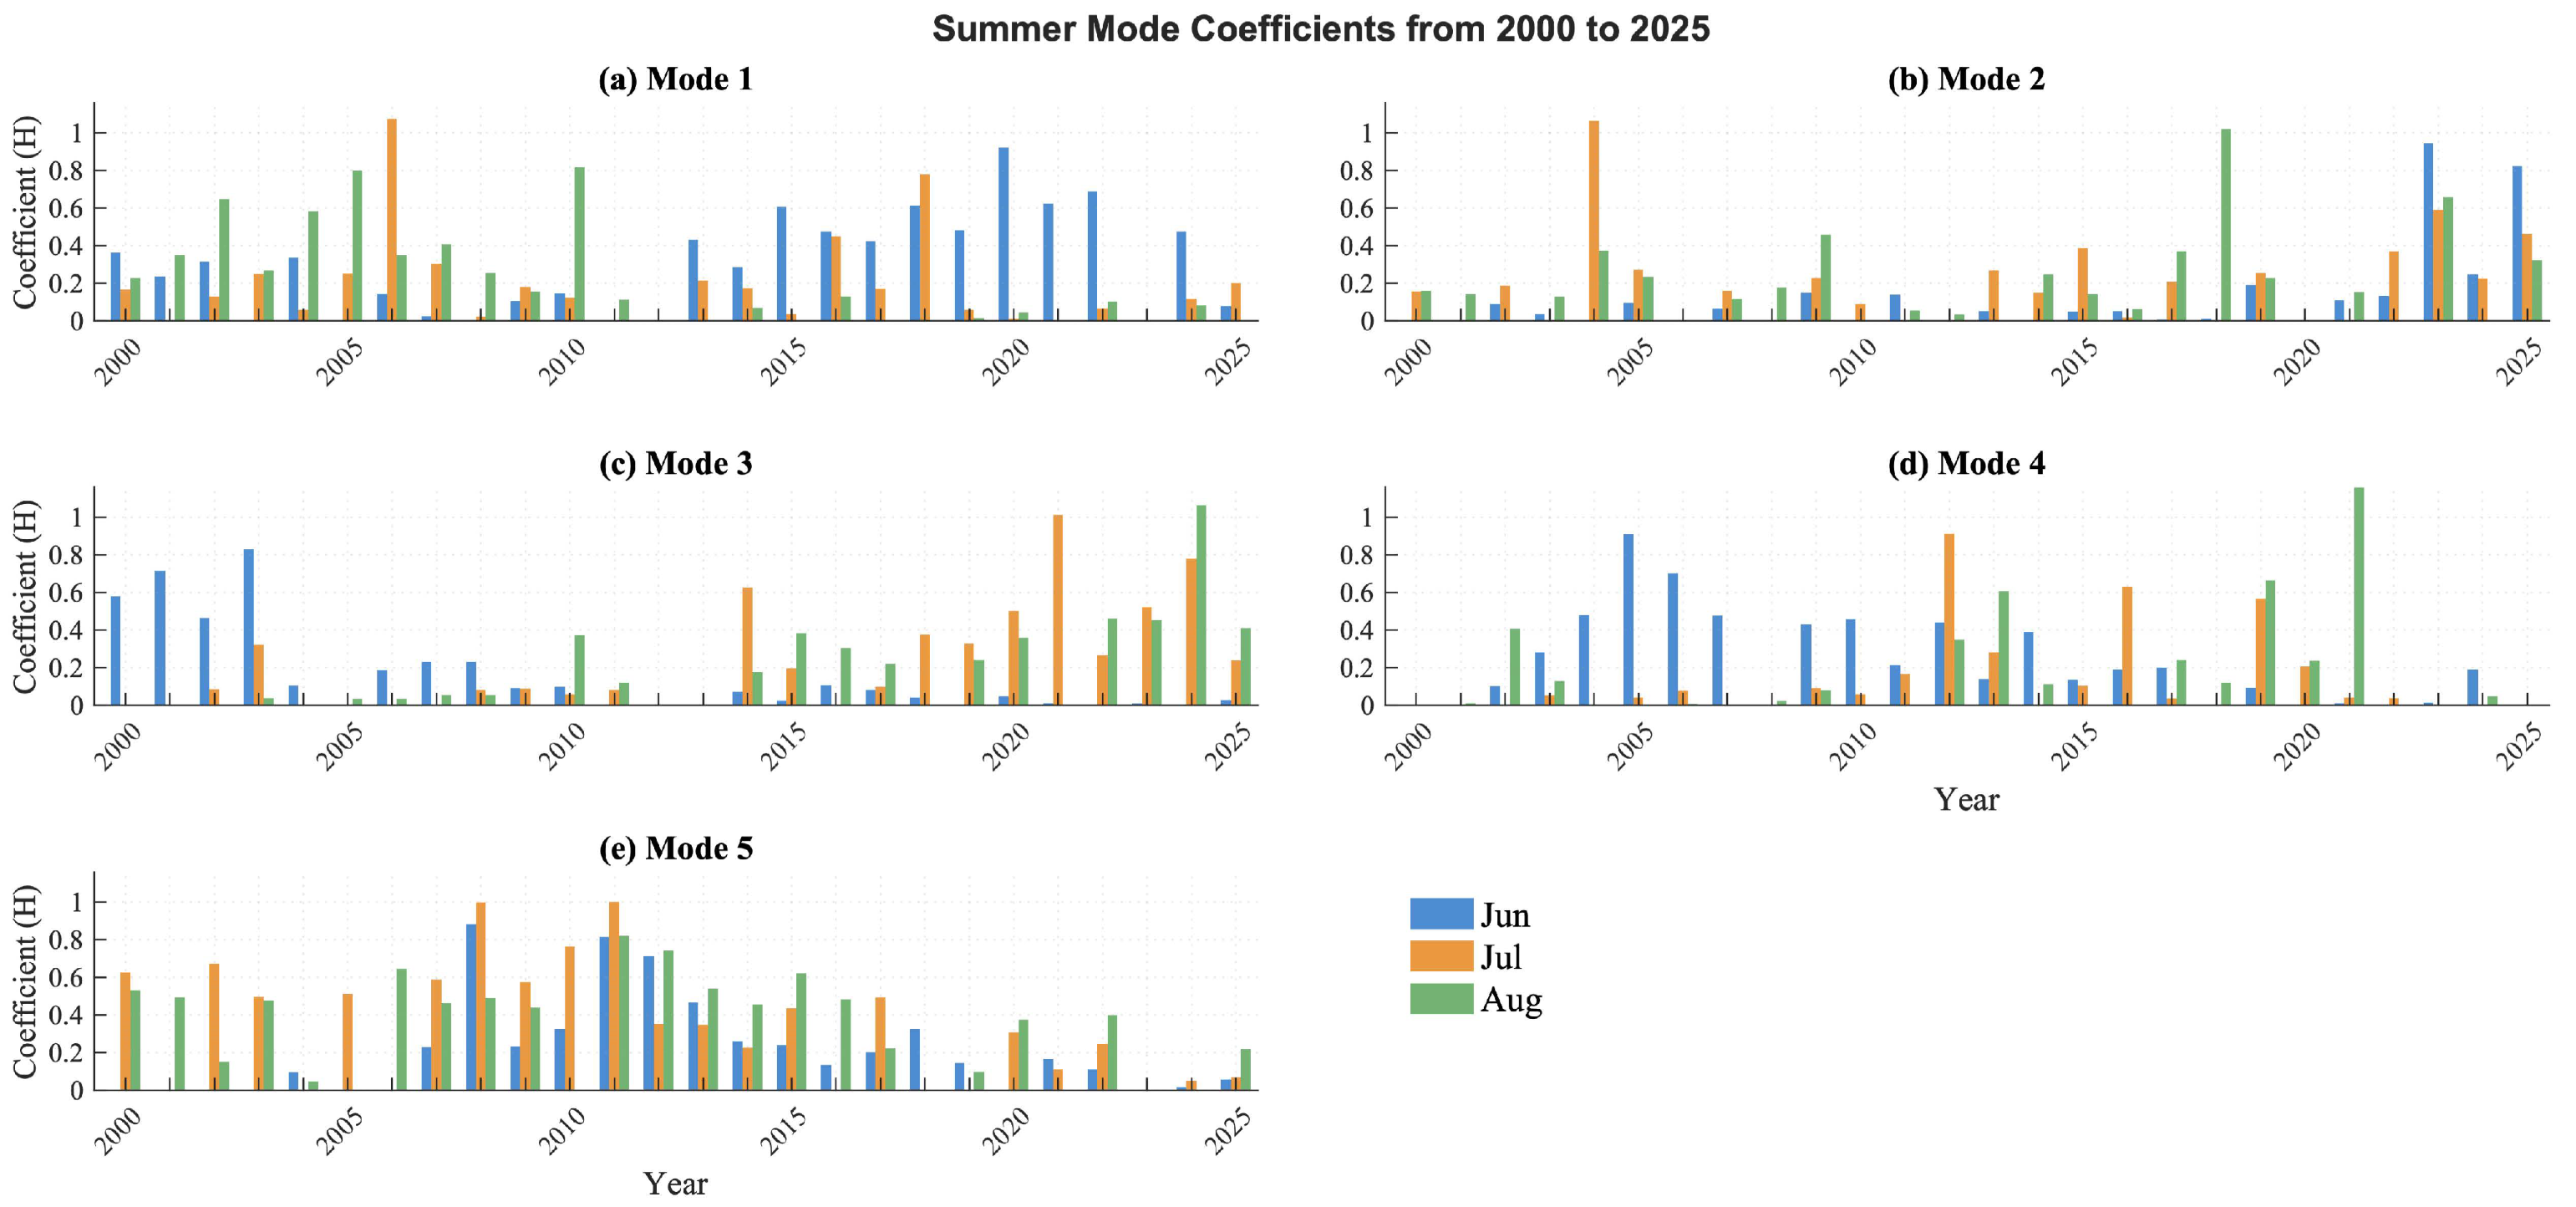
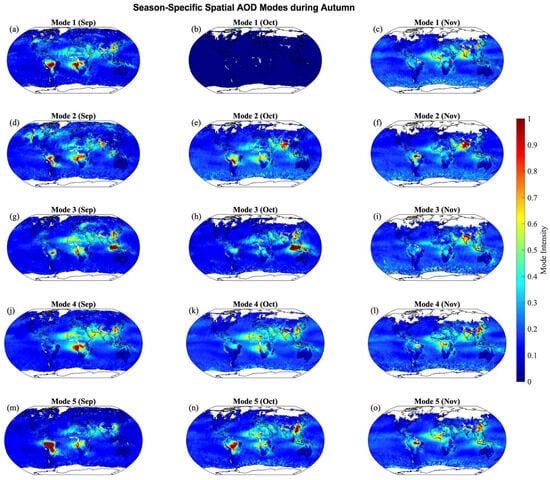
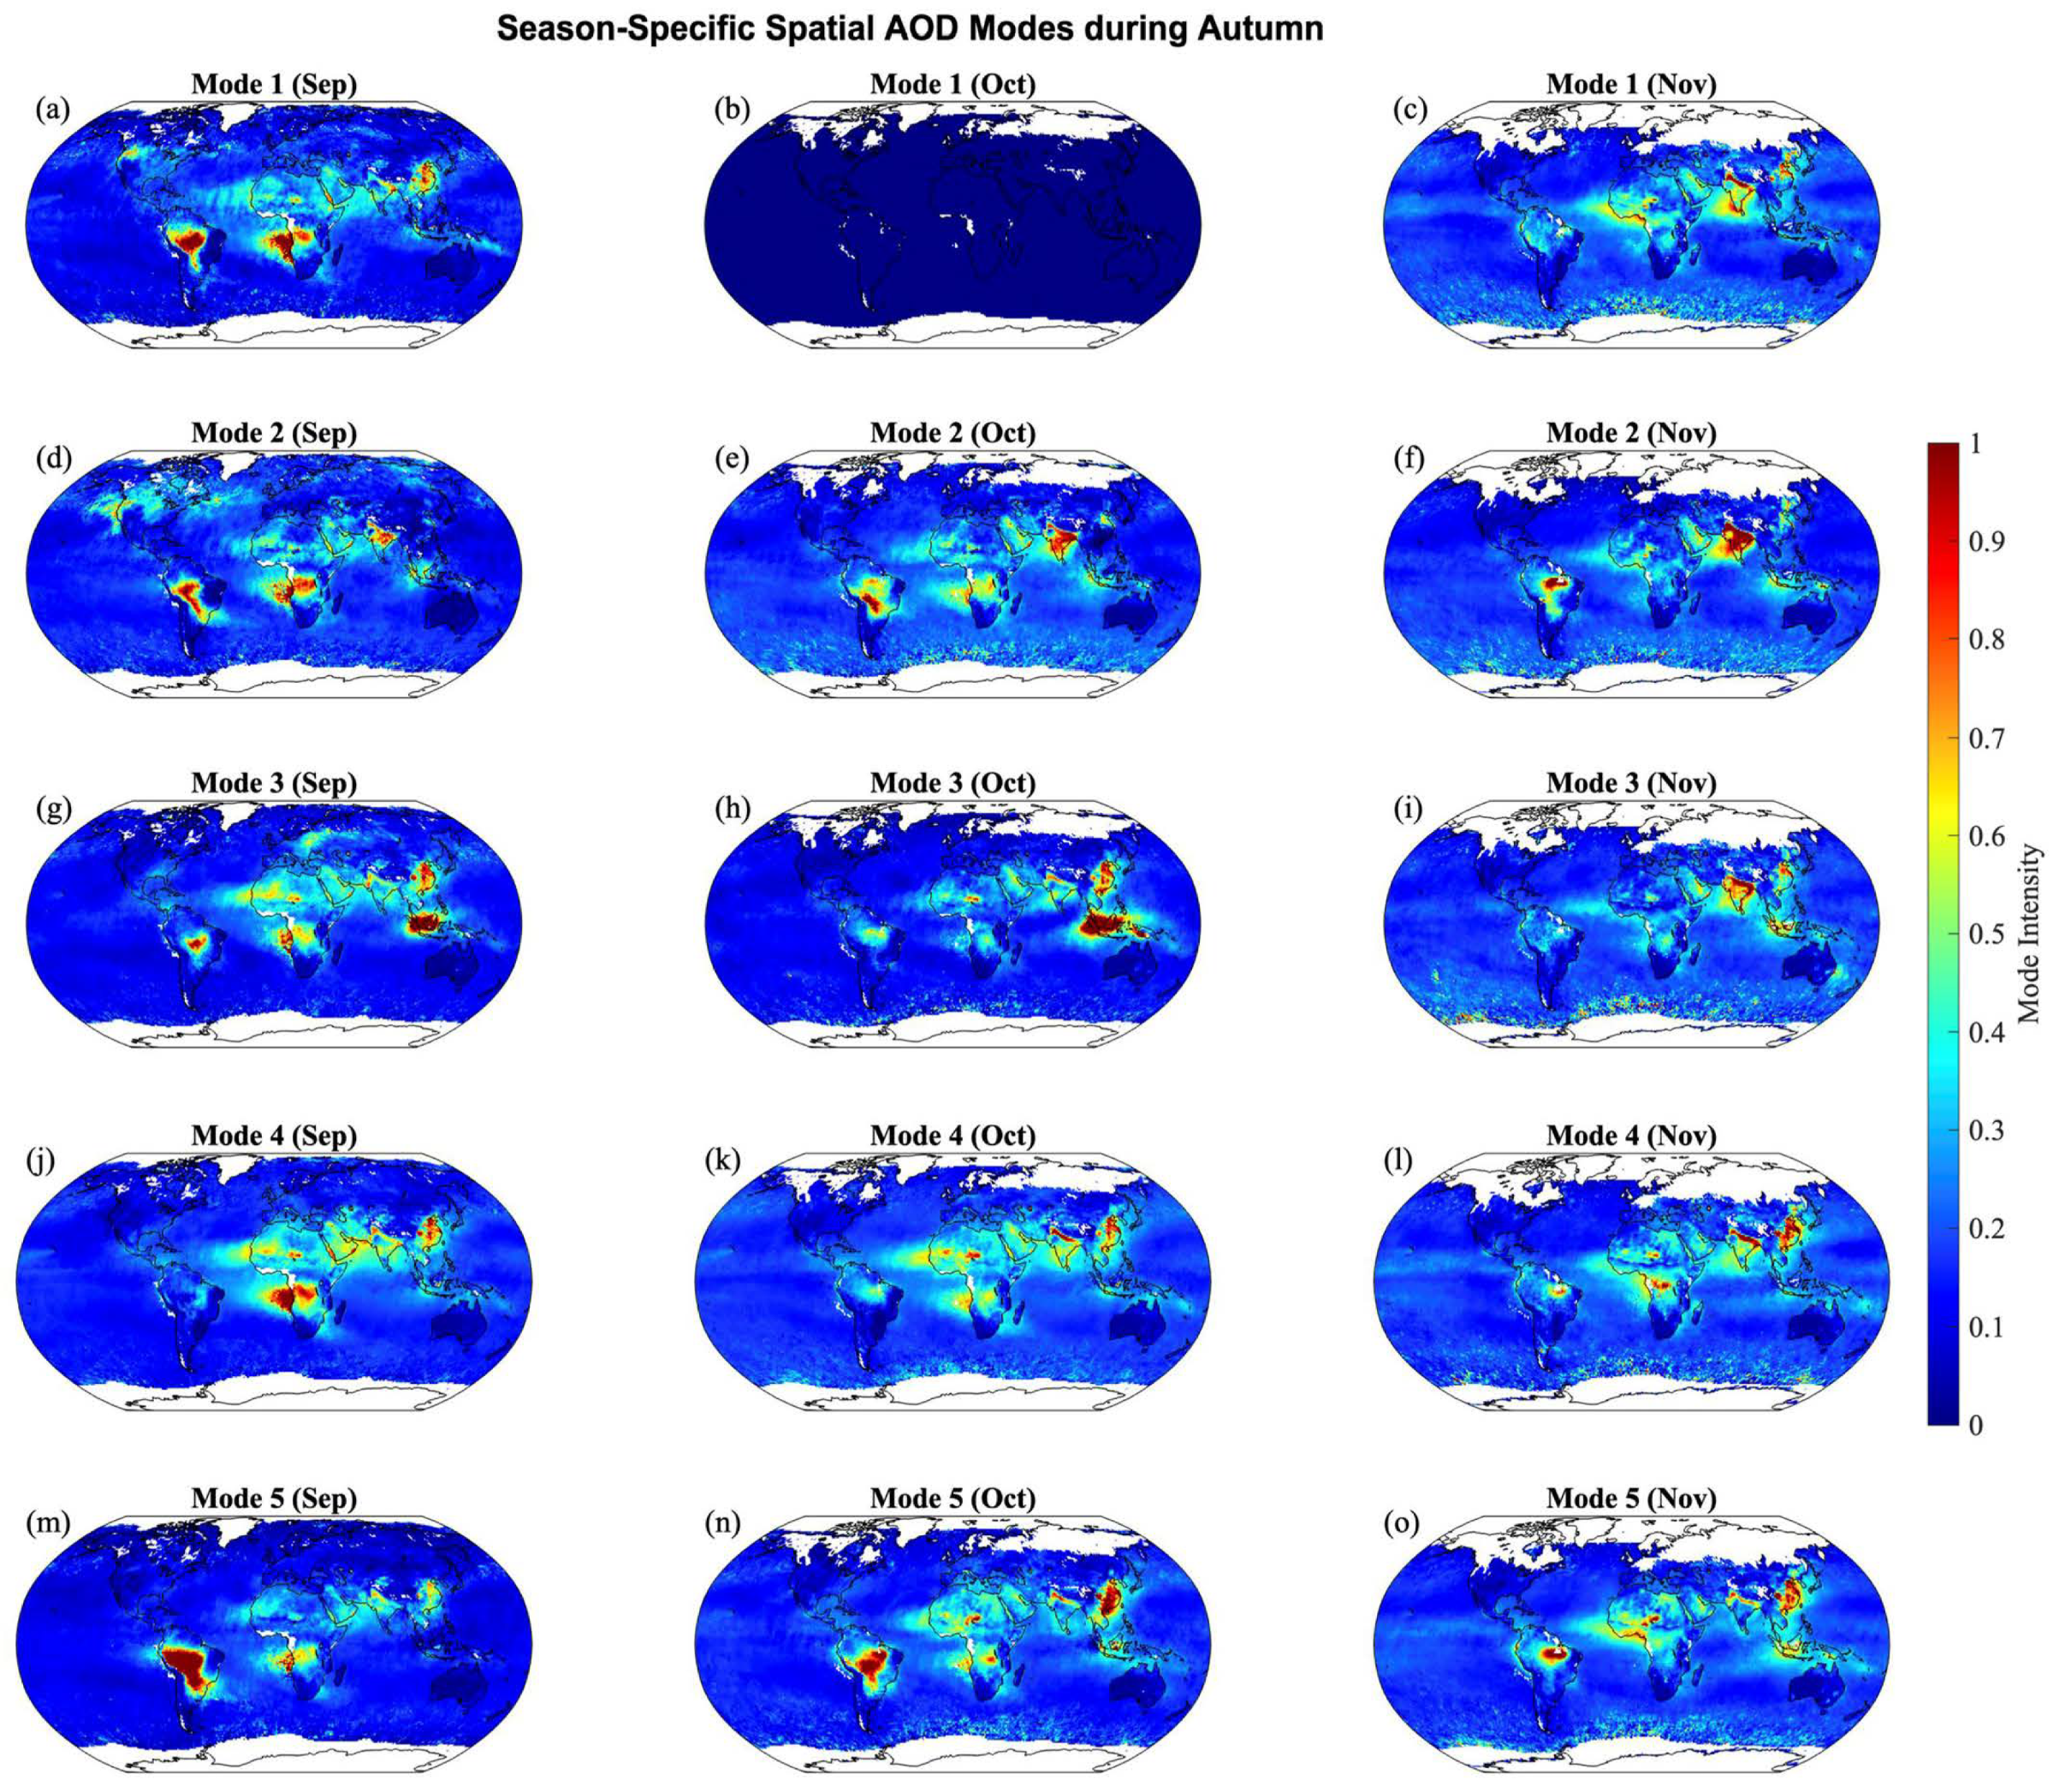
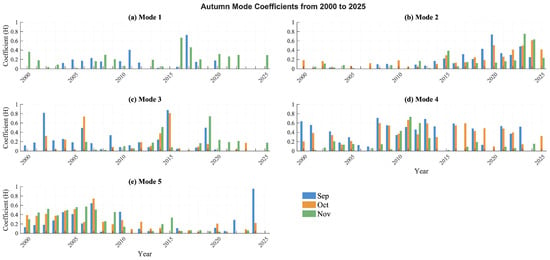
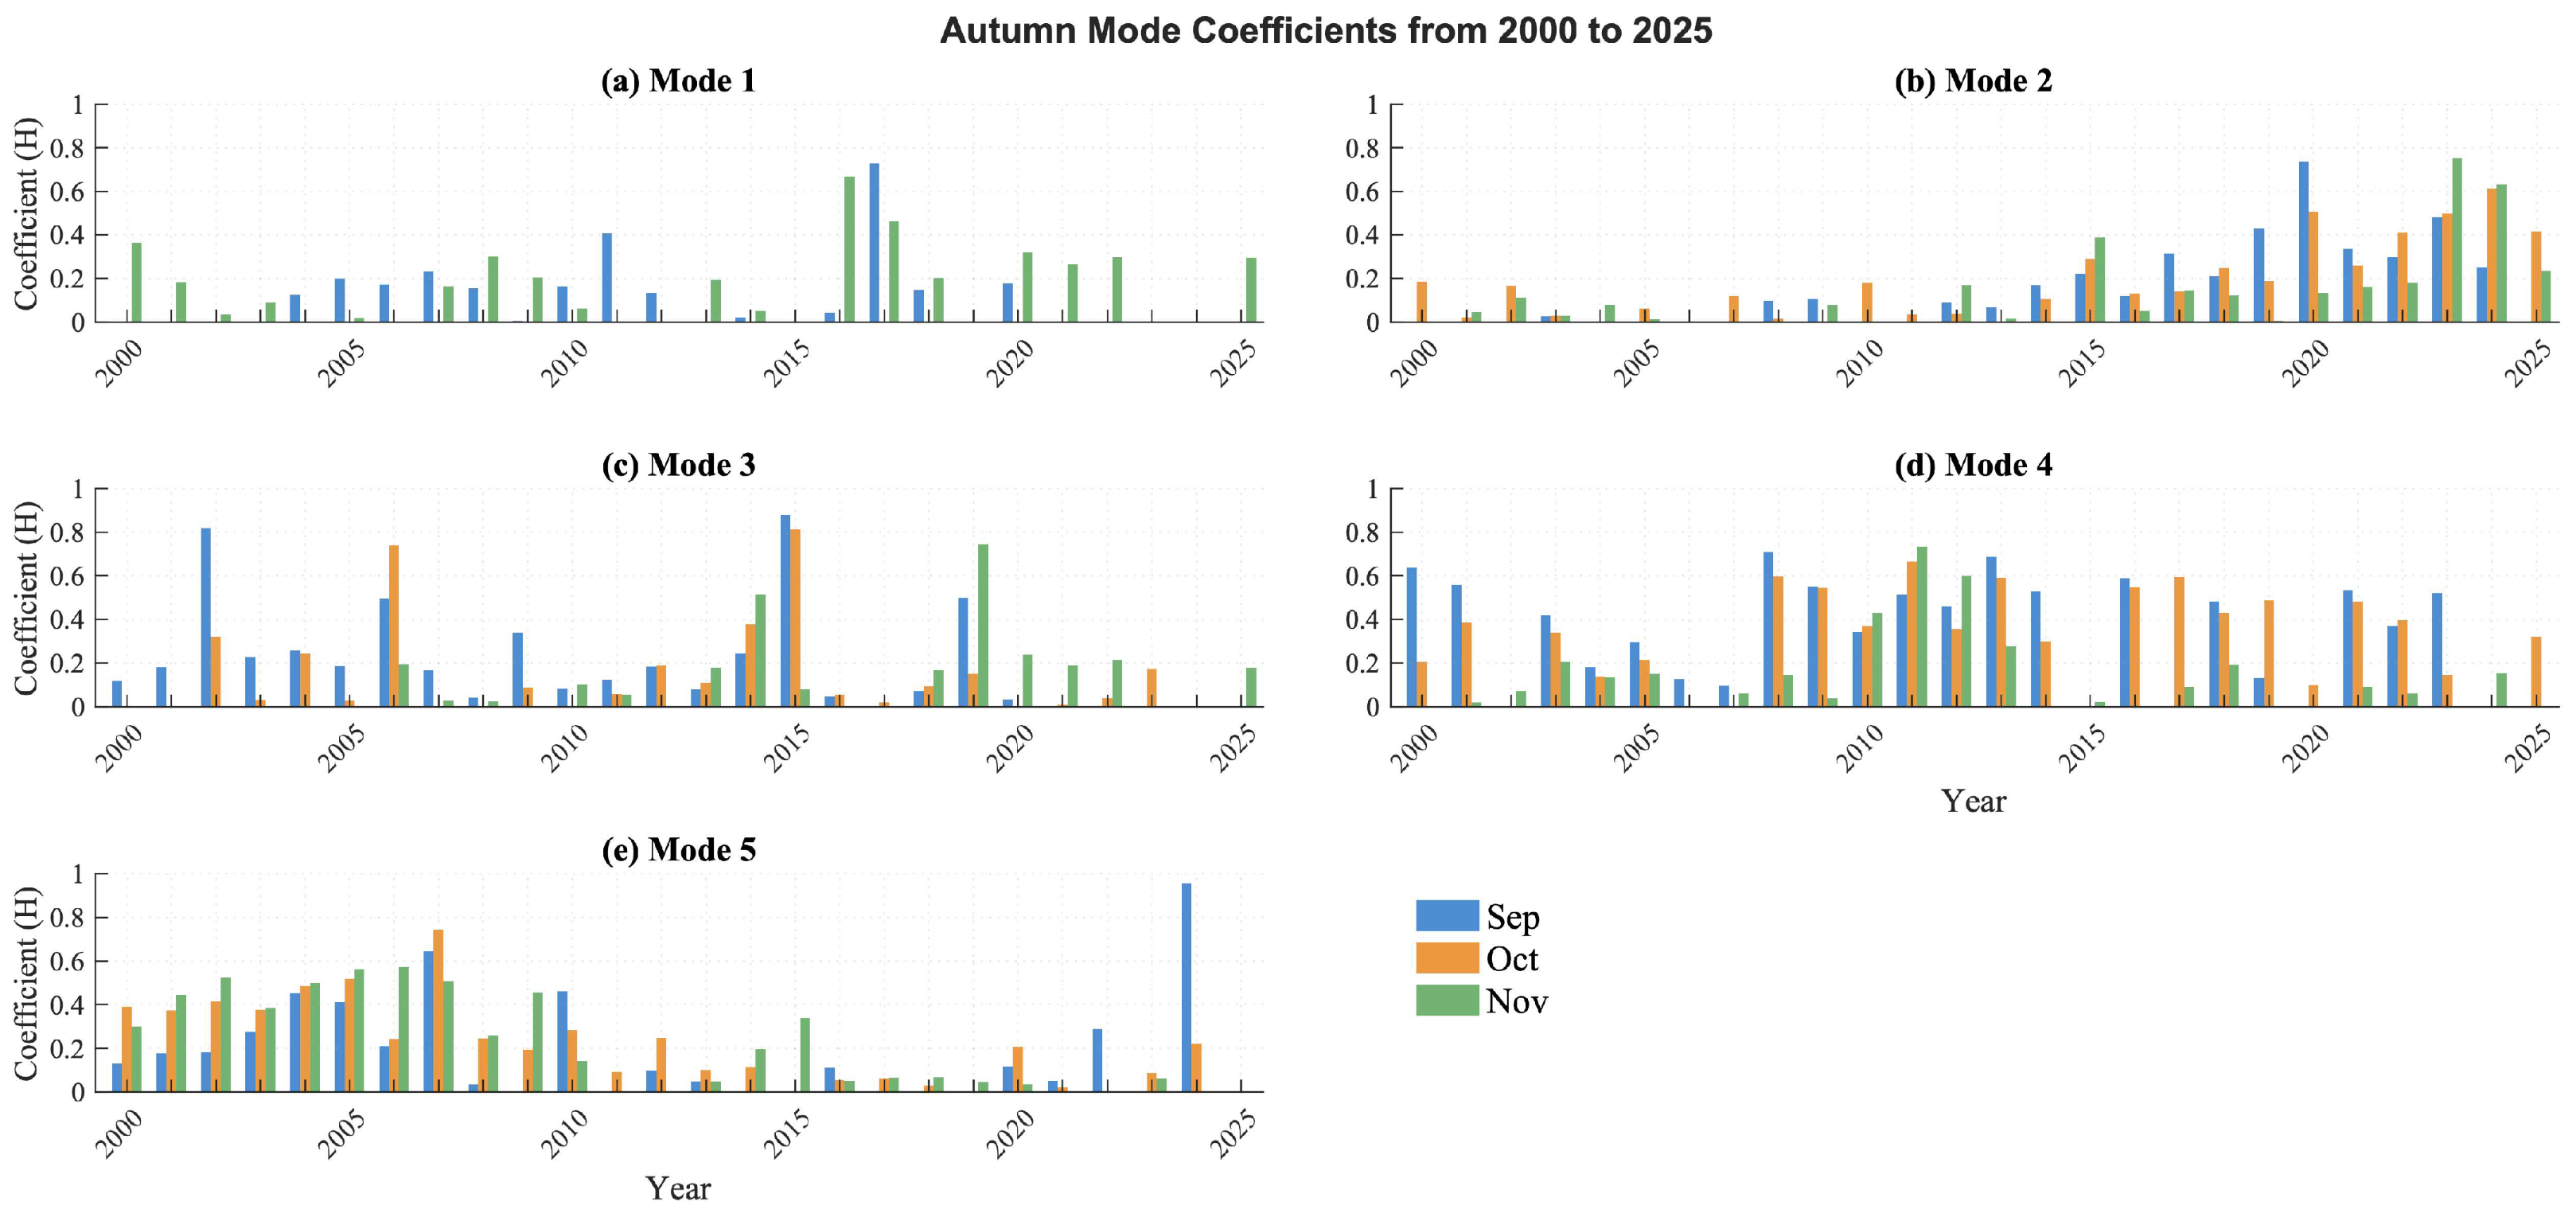
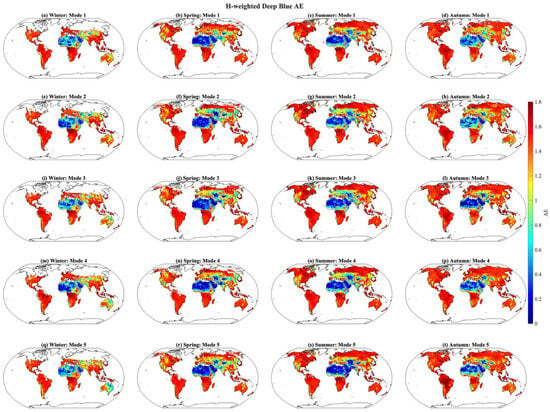
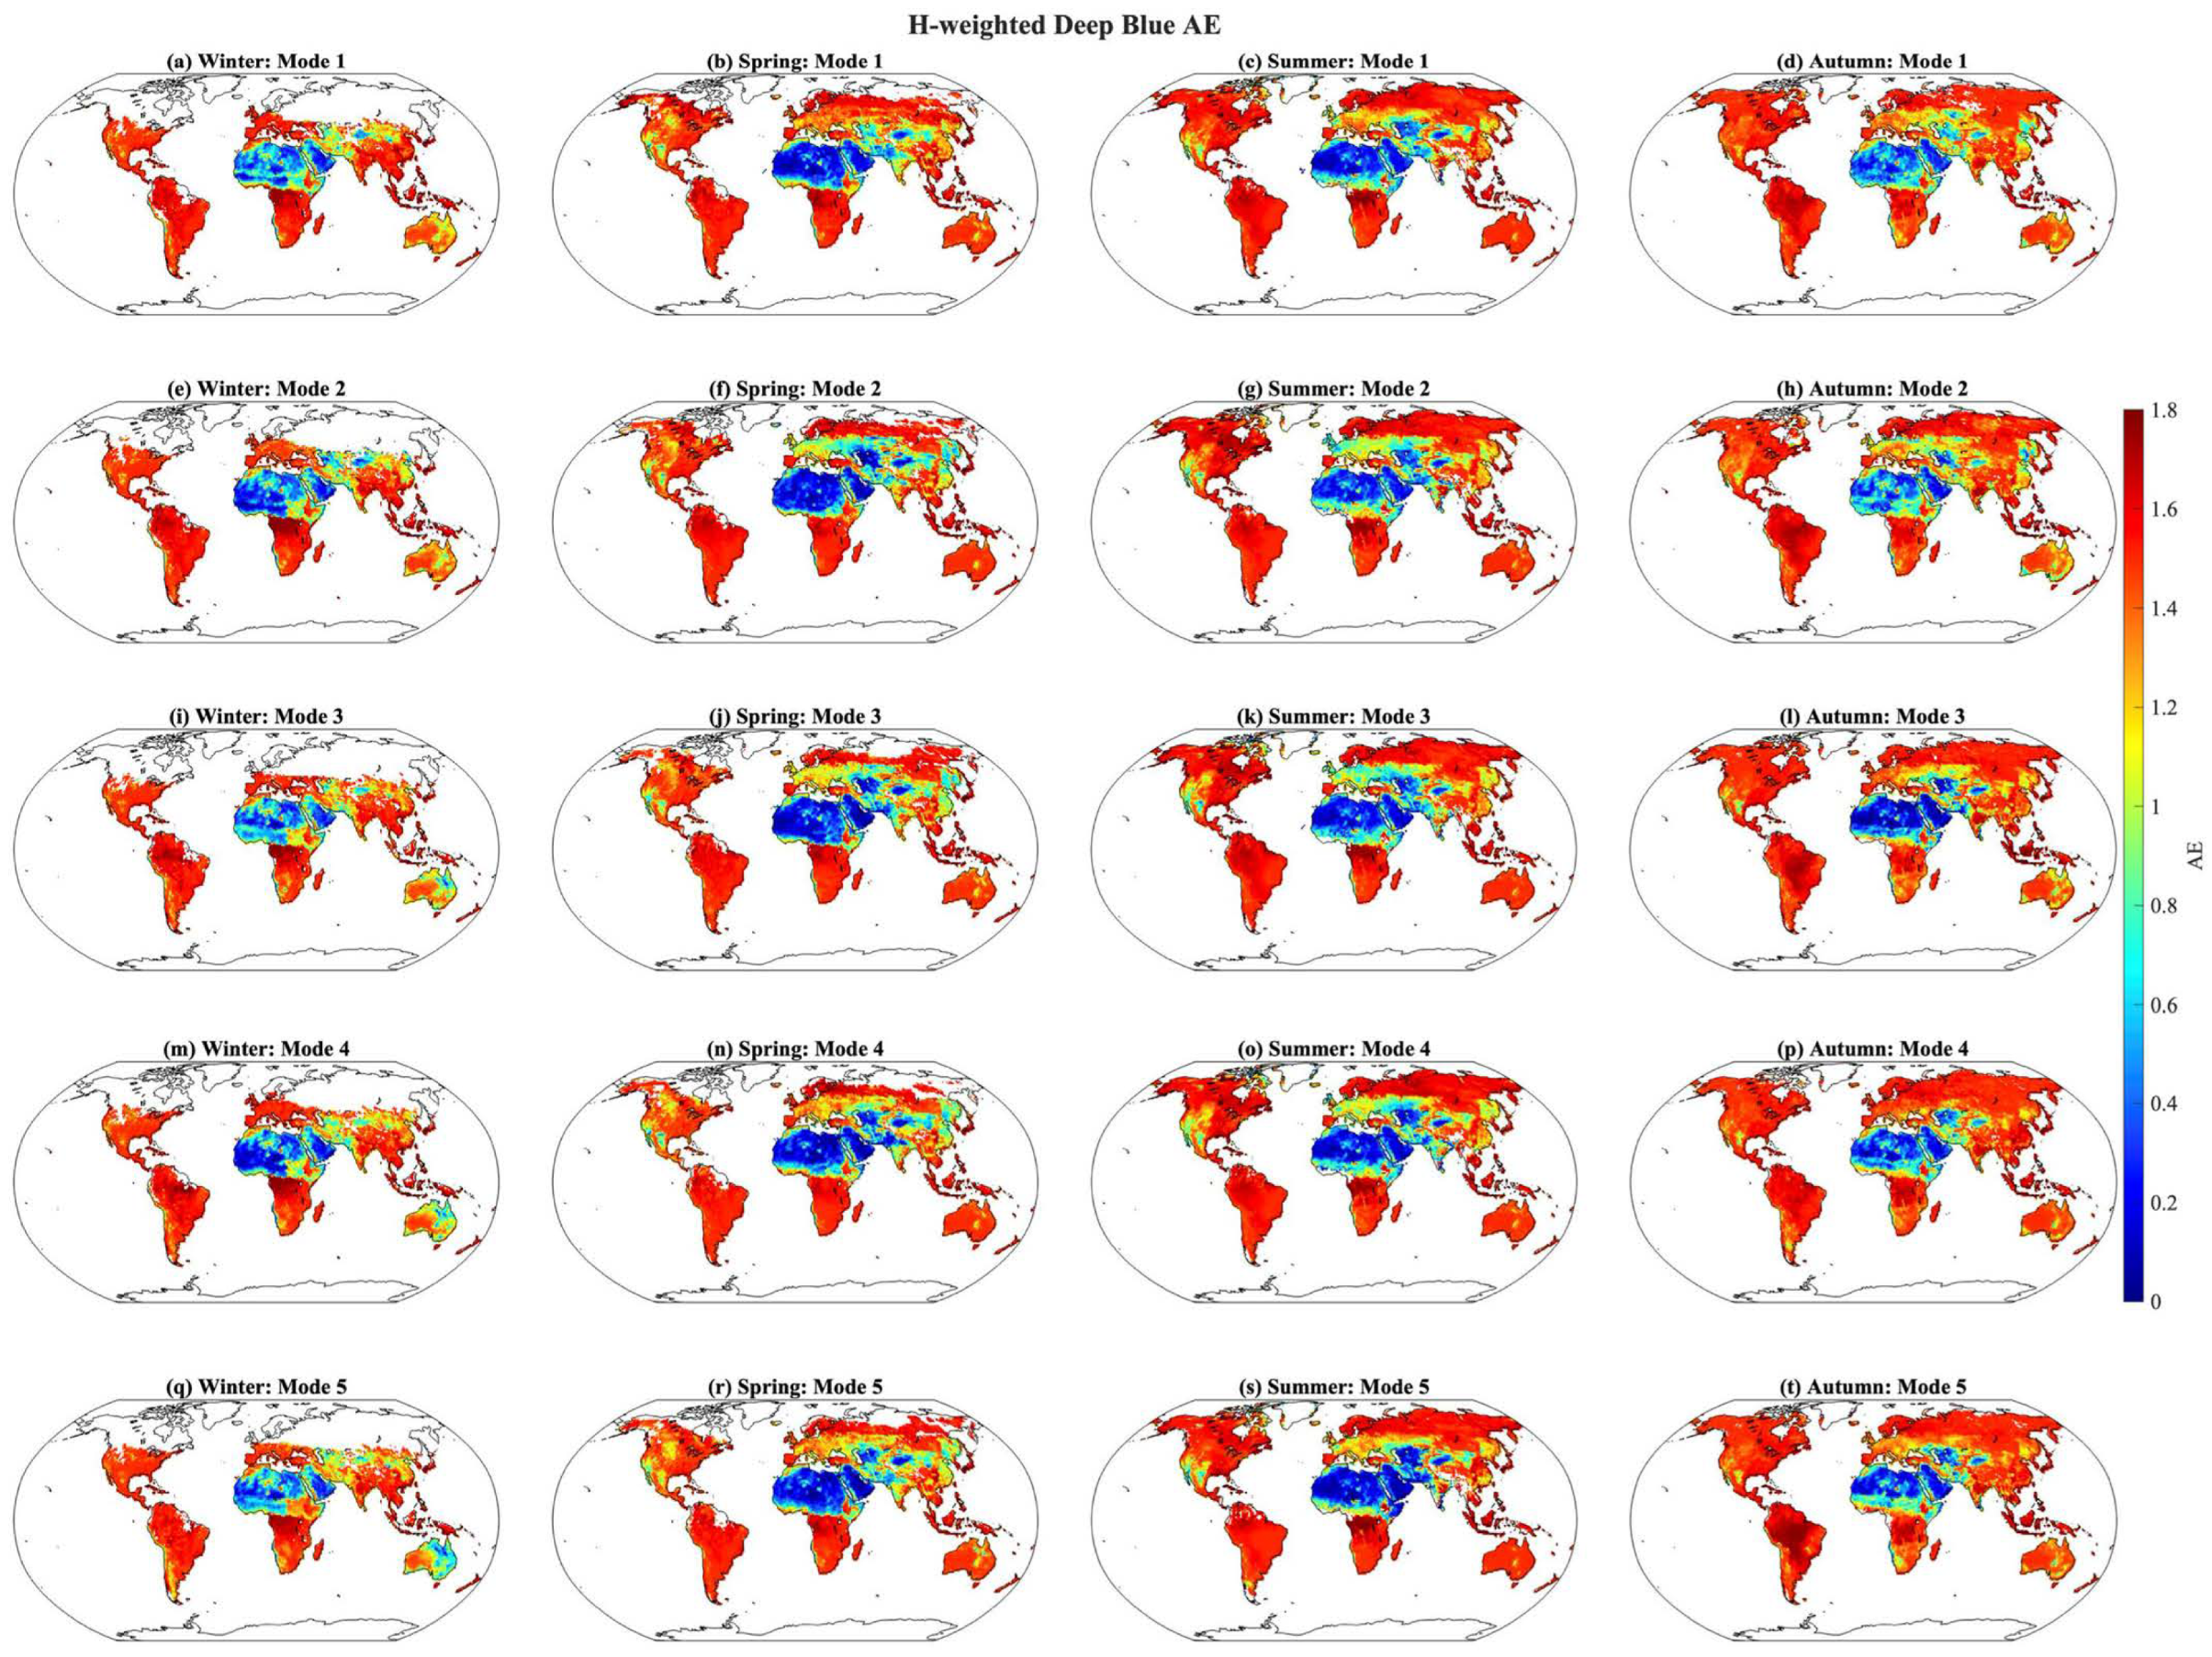

Disclaimer/Publisher’s Note: The statements, opinions and data contained in all publications are solely those of the individual author(s) and contributor(s) and not of MDPI and/or the editor(s). MDPI and/or the editor(s) disclaim responsibility for any injury to people or property resulting from any ideas, methods, instructions or products referred to in the content. |
© 2026 by the authors. Licensee MDPI, Basel, Switzerland. This article is an open access article distributed under the terms and conditions of the Creative Commons Attribution (CC BY) license.