


Highlights
What is the main finding?
- An integrated InVEST–Geodetector–intPLUS–MOP framework was developed to assess carbon storage dynamics and identify their driving mechanisms in Jiangsu Province from 2000 to 2020.
What is the implication of the main finding?
- Pareto-based land-use optimization revealed trade-offs among carbon storage, ecological protection, and development demand, providing decision support for territorial spatial planning and low-carbon development.
Abstract
Ecosystem carbon storage is highly sensitive to land-use/land-cover change (LUCC). However, retrospective carbon assessment, spatial factor analysis, and future land-use optimization are often conducted separately, limiting their ability to support territorial planning involving competing economic, ecological, and carbon-storage objectives. Taking Jiangsu Province, China, as a rapidly urbanizing region, this study developed an integrated framework combining multi-temporal remote-sensing-derived land-use data with the InVEST carbon storage model, Geodetector, multi-objective programming (MOP), and the intPLUS model. Land-use data from 2000, 2010, and 2020 were used to quantify changes in land use and ecosystem carbon storage and to examine how natural, socioeconomic, and accessibility conditions corresponded spatially to the observed land-use configuration. Pareto optimization was then applied to identify non-dominated land-use allocations, which were spatialized to simulate five land-use scenarios for 2030. From 2000 to 2020, cropland decreased by 7475 km2, while construction land increased by 6974 km2. Correspondingly, ecosystem carbon storage declined from 1431.85 Mt to 1402.55 Mt, representing a cumulative loss of 29.30 Mt. This decline was primarily associated with cropland loss and construction land expansion, particularly the conversion of cropland into construction land. Although the overall spatial pattern of carbon storage remained relatively stable, high-value areas gradually contracted, whereas low-value areas expanded in intensively urbanized regions. Geodetector results showed that pairwise factor combinations generally corresponded more closely to the spatial differentiation of land-use patterns than individual topographic factors, and that associations involving socioeconomic activity, transport accessibility, and vegetation cover became more pronounced over time. The 2030 scenario analysis revealed clear trade-offs: the carbon storage maximization scenario produced the highest carbon storage (1497.47 Mt), the economic development scenario generated the highest economic benefit but the lowest ecosystem service value, and the natural development scenario produced the lowest carbon storage (1384.46 Mt). The Pareto-based comprehensive optimization scenario maintained 1487.12 Mt of carbon while achieving a comparatively balanced combination of economic benefit and ecosystem service value. These findings demonstrate that integrating multi-temporal remote sensing, ecosystem-service modeling, and Pareto optimization can translate historical land-use information into flexible spatial planning alternatives for rapidly urbanizing regions.
1. Introduction
Terrestrial ecosystems provide essential functions, including material production, water conservation, climate regulation, food security, carbon sequestration, and oxygen release, and constitute one of the principal carbon pools in the global carbon cycle [1,2]. Ecosystem carbon is stored primarily in vegetation and soils, and its spatial distribution and temporal dynamics are strongly influenced by land-use/land-cover change (LUCC). By modifying surface-cover structure, vegetation composition, and soil conditions, LUCC can alter both the amount and spatial pattern of regional ecosystem carbon storage [3,4,5]. In addition to carbon emissions from energy consumption, LUCC represents a major pathway through which human activities affect the carbon balance of terrestrial ecosystems [6]. Understanding how LUCC is associated with changes in ecosystem carbon storage and anticipating its future effects are therefore important for advancing China’s “dual-carbon” goals and improving regional ecological and territorial spatial governance [7,8,9].
Ecosystem carbon storage is commonly assessed using field inventories, remote sensing estimation, and model-based simulation [10]. Field-based approaches, including plot surveys, carbon-flux observations, and inventory statistics, can provide detailed and relatively accurate measurements. However, their high costs, intensive data requirements, and limited spatial and temporal coverage restrict their application to long-term monitoring over large regions [11,12]. Advances in remote sensing and geospatial technologies have made it possible to monitor land-cover dynamics consistently across broad spatial and temporal scales [13]. Among available modeling tools, the Integrated Valuation of Ecosystem Services and Tradeoffs (InVEST) model has been widely used because of its relatively modest parameter requirements, explicit spatial outputs, and applicability across multiple scales [14,15]. By linking land-use maps with carbon-density coefficients for different carbon pools, InVEST provides a practical means of assessing the effects of land-use transitions on regional ecosystem carbon storage.
Recent studies have increasingly coupled InVEST with land-use simulation models such as CA–Markov, FLUS, and PLUS to evaluate the ecological consequences of future land-use change [16,17,18,19]. These integrated approaches have been applied at provincial, municipal, watershed, and ecological-function-zone scales [20,21,22,23]. Nevertheless, several limitations remain. First, historical carbon assessment, spatial factor analysis, and future land-use simulation are frequently treated as separate analytical tasks, weakening the connection between retrospective evidence and prospective planning. Second, many scenario-based studies emphasize either ecological conservation, carbon storage, or economic development as an individual objective, while the trade-offs among these competing objectives are not explicitly quantified. Third, predetermined scenarios or single optimal solutions provide limited flexibility for decision makers facing different policy priorities. Consequently, a framework capable of translating remote-sensing-derived land-use information into multiple feasible land-allocation alternatives is still needed [24,25,26,27,28].
Jiangsu Province is a highly urbanized and economically developed region in eastern China, characterized by intensive land development, strong human–land interactions, and pronounced spatial heterogeneity. Rapid urban and infrastructure expansion has generated persistent pressure on cropland and ecological space, while substantial differences in natural conditions and development intensity exist between northern, central, and southern Jiangsu. The province therefore faces the interconnected challenges of accommodating development demand, protecting cultivated and ecological land, and enhancing ecosystem carbon storage. These characteristics make Jiangsu an appropriate case for examining how multi-objective land-use optimization can support low-carbon territorial spatial planning in regions experiencing intensive urbanization.
To address these challenges, this study integrates multi-temporal land-use data with the InVEST, Geodetector, multi-objective programming (MOP), and intPLUS models. The specific objectives are to: (1) quantify land-use transitions and the spatiotemporal evolution of ecosystem carbon storage in Jiangsu Province from 2000 to 2020; (2) examine the spatial correspondence between land-use configuration and natural, socioeconomic, vegetation, and accessibility conditions; (3) identify Pareto non-dominated land-use allocations that reveal the trade-offs among economic benefit, ecosystem service value, and carbon storage; and (4) simulate and compare future land-use patterns and carbon-storage outcomes under five scenarios for 2030. By linking historical assessment, exploratory spatial association analysis, land-use quantity optimization, and spatial simulation within a unified framework, this study provides a scientific basis for cultivated-land protection, construction-land regulation, carbon-sink enhancement, and low-carbon territorial spatial planning in Jiangsu Province and other rapidly urbanizing regions.
2. Materials and Methods
2.1. Overview of the Study Area
Jiangsu Province is located along the eastern coast of China and in the lower reaches of the Yangtze River, with geographic coordinates of approximately 116 degrees 18 min to 121 degrees 57 min E and 30 degrees 45 min to 35 degrees 20 min N. It is an important part of the Yangtze River Delta region [29]. The terrain of the province is generally low and flat, dominated by plains, while also featuring low mountains and hills, river–lake networks, and coastal tidal flats, resulting in marked differences in regional physical geographic conditions. Jiangsu belongs to a monsoon climate transition zone from subtropical to warm-temperate, characterized by a mild and humid climate with synchronized rainfall and heat. Extensive water systems, including the Yangtze River, Huaihe River, Beijing–Hangzhou Grand Canal, Taihu Lake, and Hongze Lake, provide a favorable natural foundation for the formation of diverse land-use patterns such as cropland, woodland, water bodies, and wetlands (Figure 1).
Figure 1.
Overview of the research area in Jiangsu Province.
As one of the provinces in China with a relatively high level of economic development, large population density, and rapid urbanization, Jiangsu experiences intensive land development and utilization, with significant human disturbance [30]. In recent years, under the combined influence of rapid urban expansion, industrial restructuring, transportation infrastructure construction, and ecological protection policies, the regional land-use pattern has continued to change, and the contradiction between construction land expansion, cultivated land protection, and ecological spatial regulation has become increasingly prominent. This process has not only altered the surface landscape pattern, but has also profoundly affected the spatiotemporal distribution and evolution of ecosystem carbon storage. At the same time, Jiangsu exhibits marked north–south developmental disparities, and different regions show strong spatial heterogeneity in terms of natural background conditions, land-use modes, and socioeconomic levels, leading to significant regional differences in ecosystem carbon-storage changes and their potential explanations. Therefore, taking Jiangsu Province as the study area to investigate the spatiotemporal evolution and potential explanations of ecosystem carbon storage under the background of land-use change is of strong representativeness and practical significance.
2.2. Data Sources
This study utilized multiple types of datasets, including land use/cover, carbon density, and spatial covariates, to support the dynamic simulation of land-use/-cover transitions, the spatial estimation of carbon storage, and the identification of key mechanisms driving land-use change. In particular, the land-use/-cover data derived from multi-temporal remote sensing imagery provided the fundamental spatial basis for detecting land surface changes and linking land-use dynamics with ecosystem carbon storage.
2.2.1. Land Use/Cover
The land-use/land-cover (LULC) data for 2000–2020 were obtained from the Land Use/Cover Remote Sensing Monitoring Dataset of China, provided by the Resource and Environment Science and Data Center (RESDC), Chinese Academy of Sciences (https://www.resdc.cn). According to the official dataset documentation, the dataset was primarily derived from Landsat remote sensing imagery with a spatial resolution of 30 m and updated through visual interpretation and comparative analysis of multi-temporal images. In this study, the original land-use data were aggregated to a spatial resolution of to maintain consistency with the other spatial datasets and to standardize the analytical units. Based on the secondary land-use classification, the data were reclassified into six primary categories following relevant studies [31]: cropland, forest land, grassland, water area, construction land, and unused land. To ensure spatial consistency among all datasets, projection transformation, boundary alignment, and clipping to the study area were performed in ArcGIS Pro 3.0, thereby minimizing the potential influence of spatial registration errors and boundary effects on the analytical results.
2.2.2. Carbon-Density Data for Jiangsu Province
The carbon-density parameters were mainly derived from previous studies and publicly available sources. To reduce the uncertainty caused by parameter selection and improve the reliability of carbon-storage assessment, this study adopted published carbon-density values for land-use types in Jiangsu Province as the basic parameters for estimating carbon storage under different land-use categories.
2.2.3. Spatial Covariates for Land-Use Prediction
To identify the main factors influencing land-use change in Jiangsu Province, this study selected ten driving variables from the perspective of the coupled human–land system, representing three dimensions: transportation accessibility, socioeconomic development, and natural geomorphological conditions (Table 1). To meet the requirements of model operation, all spatial covariate datasets were resampled to a uniform spatial resolution and standardized in ArcGIS Pro 3.0 to eliminate differences in measurement units among indicators and ensure spatial consistency, thereby facilitating subsequent simulation analysis in the PLUS model.
Table 1.
Spatial covariates and data sources.
2.3. Methods
2.3.1. InVEST Model Carbon-Storage Module
The InVEST (Integrated Valuation of Ecosystem Services and Tradeoffs) model is an ecosystem service assessment model jointly developed by Stanford University, the World Wide Fund for Nature, and The Nature Conservancy. Owing to its low parameter requirements, intuitive spatial representation, and applicability to multi-scale studies, it has been widely used in ecosystem service evaluation research [32,33,34,35]. In this study, the Carbon Storage and Sequestration module of the InVEST model was employed to estimate ecosystem carbon storage in Jiangsu Province. Based on land-use/-cover data, this module calculates the spatial distribution and total variation in carbon storage in the study area by assigning carbon-density parameters per unit area to different land-use types. The InVEST carbon-storage module divides ecosystem carbon pools into four components: above-ground biomass carbon, below-ground biomass carbon, soil organic carbon, and dead organic matter carbon. The total carbon density of each land-use type is the sum of the carbon densities of these four carbon pools [36]. This study assumes that the carbon density corresponding to the same land-use type remains stable within a certain period. Under this assumption, the carbon storage of a given raster cell can be expressed as the product of the total carbon density of that land-use type and the raster area, while the total regional carbon storage is the sum of the carbon storage of all raster cells. The calculation formula is as follows:
where represents the total carbon density of land-use type i; , , , and represent the carbon densities of above-ground biomass, below-ground biomass, soil organic carbon, and dead organic matter, respectively; denotes the area of land-use type i; and C represents the total ecosystem carbon storage in the study area. This module can effectively reflect changes in carbon storage caused by land-use type conversion and is suitable for analyzing the spatiotemporal evolution of ecosystem carbon storage at the regional scale. Therefore, based on multi-period land-use data and carbon-density parameters for each land-use type, this study estimated ecosystem carbon storage in Jiangsu Province for different years and analyzed its spatiotemporal variation characteristics.
2.3.2. intPLUS Model
The intPLUS model is a land-use change model that integrates land-use quantity optimization and spatial pattern simulation, and is capable of dynamically simulating future land-use patterns by comprehensively considering multiple spatial covariates, conversion rules, and spatial neighborhood effects [37]. Building on the spatial simulation advantages of the PLUS model, the intPLUS model can better coordinate the quantitative constraints and spatial conversion relationships among different land-use types, and therefore has strong applicability in regional land-use optimization research [38]. By mining land-use expansion information from historical periods, the intPLUS model establishes response relationships between various land-use changes and factors such as natural geography, locational conditions, and socioeconomic variables, and then combines land-use demand constraints to complete spatial allocation, thereby achieving scenario simulation of land-use patterns. Compared with traditional models such as CA–Markov, the intPLUS model places greater emphasis on the patch generation mechanisms of different land-use type expansions and their spatial heterogeneity during the simulation process, enabling it to better reflect the complex process of land-use change. It is especially suitable for analyzing the evolution of land-use patterns at the regional scale. In this study, the intPLUS model was used to simulate future land-use spatial patterns in Jiangsu Province under different scenarios, and combined with the InVEST model to further analyze the impacts of land-use change on ecosystem carbon storage. To evaluate the reliability of the intPLUS model for land-use simulation in Jiangsu Province, a historical backcasting validation was conducted before simulating the land-use pattern for 2030. Specifically, land-use data from 2000 and 2010 were used to extract historical land-use transition rules and calibrate the model parameters. The calibrated model was then employed to simulate the land-use pattern in 2020, and the simulated results were compared with the actual land-use map for 2020. The results demonstrated a high degree of agreement between the simulated and actual land-use patterns, with a Kappa coefficient of 0.89 and an overall accuracy of 0.96. These findings indicate that the intPLUS model can effectively capture the land-use change processes in Jiangsu Province and is suitable for simulating future land-use patterns under different scenarios, thereby providing a reliable basis for subsequent carbon-storage projections.
2.3.3. Multi-Objective Optimization Model and Objective Setting
The MOP (Multi-Objective Programming) model is designed to derive optimal solutions by simultaneously considering multiple objective functions, and it is one of the important models for optimal land resource allocation [39]. The MOP model consists of objective functions, decision variables, and constraint conditions, and it focuses on decision-making that maximizes the value of one or more objectives under subjective or objective conditions. The formula is as follows:
where denotes the i-th objective function, and n is the number of objectives. The symbol indicates that each objective can be formulated as either a maximization or minimization problem according to the specific research demand. The vector composed of all objective functions, , is also referred to as the objective vector, and the corresponding space is called the objective space. The multi-objective optimization was conducted from a Pareto-optimal perspective, and non-dominated solutions were identified to represent the trade-off relationships among ecological protection, carbon sequestration enhancement, and land development demand. Six decision variables were defined in the multi-objective optimization model, including cropland (S1), forest land (S2), grassland (S3), water area (S4), construction land (S5), and unused land (S6) (Table 2, Table 3 and Table 4).
Table 2.
Ecological service value of each land use.
Table 3.
Economic benefit coefficient of each land use.
Table 4.
Carbon density of different land-use types in Jiangsu (kg·m−2).
Using data from the Jiangsu Statistical Yearbook and findings from previous studies [40,41,42], the economic value per unit area and ecological value per unit area for each land-use type were obtained, and subsequently the formulas for the economic value index and the ecological value index were constructed. Specifically, the economic coefficient for construction land was estimated for 2030 using a grey relational model based on historical changes in construction land area and incremental GDP data in Jiangsu Province. To evaluate the influence of uncertainty in carbon-density coefficients on the estimation of ecosystem carbon storage, a carbon-density sensitivity analysis was conducted. Specifically, the carbon-density coefficient of each land-use type, including cropland, forest land, grassland, water area, construction land, and unused land, was increased and decreased by 10%, respectively, while the carbon-density coefficients of the other land-use types were held constant. Ecosystem carbon storage under the five land-use scenarios was then recalculated accordingly. The calculation was performed as follows:
The sensitivity analysis results showed that, after applying perturbations to the carbon-density coefficient of each land-use type individually, the absolute values of ecosystem carbon storage under the five scenarios changed to varying degrees, whereas the ranking among the scenarios remained unchanged. Under all single-factor perturbation conditions, the ranking of carbon storage consistently remained CSM > EP > COS > ED > ND, indicating that the comparative results of carbon storage among different scenarios were robust to moderate uncertainty in the carbon-density coefficients.
Among the different land-use types, cropland had the greatest influence on changes in total carbon storage due to its relatively large area, followed by construction land, water area, and forest land. Unused land had a relatively weak influence on total carbon storage because of its limited area. Although the difference in carbon storage between the CSM and EP scenarios was relatively small, their ranking was not reversed under any of the single-factor perturbation conditions, further demonstrating the high reliability of the scenario comparison results.
To identify an optimal scenario that simultaneously supports economic development, ecological conservation, and carbon storage from among multiple land-use optimization schemes, this study employed Pareto optimization for scenario selection. Economic benefit represents the economic output of a land-use configuration, ecosystem service value reflects the ecological functions provided by the land-use pattern, and carbon storage indicates the capacity of a given land-use scheme to maintain carbon sinks. On this basis, a composite fitness index was constructed to measure the coordination of economic benefit, ecosystem service value, and carbon storage under each scenario:
where C denotes composite fitness; , , and denote the normalized economic benefit, ecosystem service value, and carbon storage, respectively; and , , and are the weights assigned to the three objectives, subject to . In this study, equal weights were assigned, such that . This index is used solely to identify a compromise solution within the set of Pareto non-dominated solutions and is not used to re-rank all scenarios.
The procedure comprised four steps. First, the economic benefit, ecosystem service value, and carbon storage were calculated for each land-use scenario. Second, the three indicators were normalized to eliminate differences in measurement units and scales. Third, the set of non-dominated solutions was identified according to the Pareto dominance criterion: one scenario was considered to dominate another if it performed no worse for all objectives and strictly better for at least one objective. Finally, the optimal land-use scenario was selected from the Pareto non-dominated solution set by maximizing composite fitness. In this study, the NSGA-II (Non-dominated Sorting Genetic Algorithm II) was employed, yielding a total of 86 non-dominated solutions.
The three-dimensional surface in Figure 2 illustrates the relationships among economic benefit, ecosystem service value, and composite fitness across the evaluated scenarios. The x-axis represents economic benefit, the y-axis represents ecosystem service value, and the z-axis represents composite fitness. The color gradient from blue to red indicates increasing composite fitness. The red region in the upper part of the surface represents Pareto-preferred scenarios with relatively high composite fitness, indicating that these scenarios achieve a comparatively favorable balance among economic returns, ecosystem services, and carbon storage.
Figure 2.
Surface fitting relationships between economic benefit, ecosystem service value, and composite fitness under the Pareto-optimal scenario.
2.3.4. Scenario Setting for Land-Use Simulation
Based on the Jiangsu Statistical Yearbook (2000–2020), Jiangsu Natural Resources Statistical Bulletin, Jiangsu Provincial Territorial Spatial Planning (2021–2035), Implementation Plan for Wetland Protection and Restoration in Jiangsu Province, and relevant policies and development needs—in combination with the characteristics of each scenario—five land use patterns for 2030 were designed. The neighborhood and transition rule matrices were established according to the actual proportional changes in the areas of different land-use types from 2000 to 2020 and were appropriately adjusted in light of practical conditions (Table 3 and Table 4). The specific scenarios are as follows.
Natural development scenario: This scenario mainly continues the historical trend of land-use change from 2000 to 2020, following the transition rules of each land-use type under existing socioeconomic development and natural evolution conditions, without additional policy interventions or target constraints. It primarily reflects the evolutionary trend of the 2030 land-use pattern in Jiangsu Province under inertial development and can serve as the baseline for comparison with other optimized scenarios.
Economic development scenario: Guided by the objective of maximizing regional economic benefits, this scenario gives priority to ensuring the demand for construction land and high-efficiency agricultural land while meeting the overall requirements for territorial spatial development and protection. It appropriately increases the probability of cultivated land, and other suitable developable land being converted into construction land, while also increasing the likelihood that inefficiently used land, unused land, and some land types with relatively low ecological benefits will be transformed into land types with higher economic output. This scenario emphasizes the supporting role of land resources in industrial development, urban expansion, and economic growth, with the aim of maximizing the economic value of land use.
Ecological protection scenario: With the improvement of ecosystem service functions and ecological security as its core objective, this scenario reduces the probability of ecological land types such as forest land, water bodies, and wetlands being converted into other land types, while increasing the probability that some cultivated land, unused land, and ecologically fragile areas will be transformed into ecological land types such as forest land, grassland, water bodies, and wetlands. This scenario highlights an ecology-first orientation and emphasizes enhancing regional ecosystem stability, biodiversity conservation capacity, and ecosystem service provision.
Carbon-storage maximization scenario: Aimed at enhancing regional carbon sink capacity and carbon sequestration levels, this scenario, based on the carbon-density characteristics of different land-use types, gives priority to protecting and expanding land types with high-carbon-storage capacity, such as forest land, wetlands, water bodies, and some stable cultivated land. It strictly controls the conversion of high-carbon-storage land types into construction land and other low-carbon-storage land types, while moderately increasing the probability that unused land and inefficiently used land will be converted into land types with high-carbon-sink capacity. This scenario is intended to optimize the carbon-storage structure of land use and provide spatial support for achieving regional “dual carbon” goals.
Comprehensive optimal scenario: This scenario comprehensively considers multiple objectives, including economic value, ecological value, and carbon storage. Under constraints such as cultivated land protection, ecological redline control, construction land scale control, and regional development needs, a multi-objective optimization model was constructed to derive a Pareto-optimal solution set. Based on a comparative evaluation of the non-dominated solutions, a representative compromise scheme with relatively balanced performance across economic, ecological, and carbon-storage objectives was selected from the Pareto-optimal solution set. On this basis, a representative scheme balancing economic, ecological, and carbon sink benefits was selected as the comprehensive optimal land-use scenario for 2030. This scenario emphasizes the coordinated balance among multiple objectives and aims to achieve overall optimization of the land-use structure and spatial layout in Jiangsu Province.
To further identify the comprehensively optimal scenario among economic benefit, ecosystem service value, and carbon storage, the TOPSIS method was employed to conduct an integrated evaluation of the five land-use scenarios. Because the three indicators differ in their dimensions and orders of magnitude, min–max normalization was applied to transform them into dimensionless values:
The distances between each scenario and the positive and negative ideal solutions were subsequently calculated, and the comprehensive closeness coefficient was obtained as follows:
where and represent the distances of the ith scenario from the positive and negative ideal solutions, respectively, and denotes the comprehensive evaluation score, with a larger value indicating that the scenario is closer to the comprehensive optimum. The evaluation results showed that the COS scenario achieved the highest TOPSIS score, indicating that it was the closest to the ideal solution. Although the ED scenario achieved the highest economic benefit, the EP scenario had the highest ecosystem service value, and the CSM scenario exhibited the highest carbon storage, these scenarios all showed a certain degree of single-objective preference. In contrast, the COS scenario achieved a better balance among economic development, ecological protection, and carbon-storage enhancement and was therefore identified as the comprehensively optimal scenario.
2.3.5. Constraint Setting
Based on five periods of land-use classification data—in combination with the master territorial spatial planning outlines of Nanjing, Suzhou, Wuxi, and Nantong, and the relevant guiding requirements of the 14th Five-Year Plans for national economic and social development at the municipal and county levels—this study constructed a regional land-use optimization model and established the following constraint conditions to ensure the scientific validity, feasibility, and policy consistency of the optimization scheme (Table 5). Specifically, no land-use constraints were imposed under the natural development scenario. The economic development scenario imposed constraints on cultivated land and construction land, whereas the ecological protection scenario constrained ecological land-use types. The comprehensive scenario incorporated all of the above constraints.
Table 5.
Constraint condition settings (km2).
2.3.6. GeoDetector
Geodetector is a spatial statistical approach developed to evaluate spatially stratified heterogeneity and its correspondence with potential explanatory factors. Its underlying premise is that, when the strata of a factor X coincide with the spatial differentiation of a response variable Y, variation within strata should be smaller than variation across the study area. The resulting q-statistic measures the strength of this spatial correspondence without requiring a linear functional form. Geodetector can accommodate categorical factors and assess the joint stratification of two factors through interaction detection. Importantly, the q-statistic describes spatial association and does not, by itself, establish a causal relationship. The formula is as follows.
where represents the stratification of variable Y or factor X, that is, classification or partitioning; and N are the number of units in layer h and the entire area, respectively; and are the variances of Y values in layer h and the entire area, respectively; and and represent the sum of within-layer variances and the total sum of squares for the entire area, respectively. In this study, Y was the carbon-storage surface generated by assigning fixed carbon-density coefficients to the mapped land-use classes. Because spatial variation in this surface was determined primarily by the distribution of those classes, it was treated as a land-use-related response layer. The resulting q-values were therefore used to characterize the spatial correspondence between contextual-factor strata and land-use configuration, rather than the causal effects of those factors on measured biophysical carbon stocks. Before the analysis, continuous spatial covariates were discretized using the natural breaks method, with five classes assigned to each factor to facilitate comparison. The stratified variables were then entered into the factor.
3. Results
3.1. Spatio-Temporal Variation Characteristics of Land Use in Jiangsu Province from 2000 to 2020
The land-use patterns in Jiangsu Province from 2000 to 2020 are shown in Figure 3 and Figure 4 and Table 6. From 2000 to 2020, the land-use structure in the study area underwent relatively significant changes, generally showing a trend characterized by the continuous decline of cultivated land, rapid expansion of construction land, steady increase in water areas, and slight decreases in forest and grassland, reflecting the ongoing adjustment of the land-use pattern under the background of accelerated urbanization.
Figure 3.
Spatial distribution of land use in Jiangsu Province from 2000 to 2020. (a) Land-use distribution in 2000; (b) land-use distribution in 2010; (c) land-use distribution in 2020.
Figure 4.
The proportion of various categories in Jiangsu Province from 2000 to 2020.
Table 6.
Land-use proportions in Jiangsu Province, 2000–2020.
From the perspective of quantitative land-use change, cultivated land remained the dominant land-use type throughout the study period, although its dominance gradually weakened. In 2000, the cultivated land area was 69,890 km2, accounting for 68.72%; in 2010, it declined to 67,198 km2 (66.07%); and by 2020, it further decreased to 62,415 km2 (61.37%). Over the 20-year period, cultivated land decreased by 7475 km2, with its proportion falling by 7.35 percentage points, indicating that agricultural land was under sustained pressure. In contrast, construction land experienced the most significant growth, increasing from 14,351 km2 (14.11%) in 2000 to 21,325 km2 (20.97%) in 2020, with a cumulative increase of 6974 km2 and a proportion increase of 6.86 percentage points. This indicates that land-use change in the study area was primarily characterized by the conversion of cultivated land into construction land, which directly reflects urban expansion and economic development.
The water area showed an overall upward trend, increasing from 12,983 km2 to 14,067 km2, while its proportion rose from 12.77% to 13.83%, suggesting that the water area pattern in the study area remained generally stable with some local expansion. Both forest land and grassland exhibited declining trends: forest land decreased from 3314 km2 to 3036 km2, and grassland declined from 1146 km2 to 716 km2, reflecting a reduction in the total amount of ecological land. Although the area of unused land increased slightly in 2020, its overall scale remained very small, and thus it had only a limited influence on the overall land-use structure.
From the perspective of stage-wise changes, land-use change was relatively moderate during 2000–2010, when cultivated land decreased by 2692 km2 and construction land increased by 2532 km2. In contrast, the changes accelerated significantly during 2010–2020, with cultivated land decreasing by 4783 km2 and construction land increasing by 4442 km2, indicating that the latter decade was a period of much more intense land-use transformation in the study area. Combined with the spatial distribution maps, it can be observed that construction land mainly expanded around existing urban areas and showed a pattern of contiguous and clustered development, while cultivated land continuously shrank in the urban fringe, with its spatial integrity declining to some extent.
Overall, the land-use change in the study area from 2000 to 2020 was mainly characterized by the expansion of construction land and the reduction of cultivated land, accompanied by an increase in water areas and slight declines in forest and grassland. This reflects a clear intensification of human activities. These changing trends suggest that, in the future, while ensuring sufficient space for urban development, greater attention should be paid to the protection of cultivated land and the regulation of ecological land, so as to promote the coordinated optimization of the land-use structure.
3.2. Land-Use Transfer Situation in Jiangsu Province from 2000 to 2020
Figure 5 illustrates the land-use transition relationships in the study area during the three periods of 2000–2010, 2010–2020, and 2000–2020. Overall, land-use transitions in the study area exhibited pronounced directional and stage-specific characteristics. Cultivated land consistently served as the core land-use type in the transition process, with both its inflow and outflow scales being significantly larger than those of other land-use categories, indicating that cultivated land occupied a dominant position in the adjustment of the regional land-use structure.
Figure 5.
Chord diagrams of land-use transfer in Jiangsu Province from 2000 to 2020. (a) Land-use transfer from 2000 to 2010; (b) land-use transfer from 2010 to 2020; (c) land-use transfer from 2000 to 2020.
From the transition pattern during 2000–2010, the sector and chord associated with cultivated land were the widest, indicating that cultivated land not only accounted for a relatively large proportion of the total area during this period, but also underwent the most frequent conversions with other land-use types. There were relatively obvious transition linkages between cultivated land and construction land, water areas, and forest land. Among these, the conversion of cultivated land to construction land was particularly prominent, reflecting the continuous occupation of cultivated land under the background of rapid urbanization and infrastructure expansion in the study area. At the same time, there were also bidirectional flows of a certain scale between cultivated land and water areas, as well as between cultivated land and forest land, indicating that land consolidation, agricultural development, and adjustments in ecological land jointly influenced the evolution of the land-use pattern during this stage.
From the results for 2010–2020, the land-use transition relationships became more complex than in the previous stage, with strengthened interconnections among land-use types, especially the conversion between cultivated land and construction land. The sector of construction land and the chord linking it with cultivated land expanded significantly, indicating that the occupation of cultivated land driven by urban expansion remained pronounced in the later period, and the intensity of transition further increased. Meanwhile, water areas, forest land, and grassland still maintained relatively strong transition relationships with cultivated land, suggesting that, in addition to construction-driven development, factors such as ecological protection, land consolidation, and resource development and utilization also continued to affect the land-use structure during this period. Compared with 2000–2010, the mutual conversions among different land-use types became more frequent in 2010–2020, reflecting an increase in the dynamism of the land-use system in the study area.
From the perspective of the overall changes during 2000–2020, cultivated land, construction land, and water areas constituted the main network of land-use transitions. Among them, cultivated land was the most important source and recipient land-use type, while construction land emerged as one of the most important net receiving types. This indicates that, during the study period, regional land-use change was generally characterized by the conversion of cultivated land to support the expansion of construction land. At the same time, the transition scales of forest land, grassland, and unused land were relatively small, suggesting that these land-use types played a limited role in the overall land-use transformation. Nevertheless, they still maintained certain connections with cultivated land and water areas, reflecting localized ecological space adjustments and marginal land development.
Taken together, the transition characteristics across the three periods indicate that land-use evolution in the study area was mainly driven by multiple factors, including urbanization advancement, population growth, economic development, and ecological governance policies. On the one hand, the continuous expansion of construction land was the most prominent manifestation of land-use change and exerted direct pressure on cultivated land protection. On the other hand, the mutual conversions among ecological land types such as forest land, water areas, and grassland suggest that ecological restoration and functional optimization accompanied the process of land development and utilization to a certain extent. Therefore, future land resource management should—while ensuring the reasonable growth of construction land—strengthen the protection of cultivated land and the regulation of ecological space, so as to promote the coordinated and sustainable evolution of the regional land-use pattern.
3.3. Analysis of the Spatio-Temporal Evolution of Carbon Storage in Jiangsu Province from 2000 to 2020
Figure 6 and Table 7 show that the total carbon storage in Jiangsu Province exhibited an overall declining trend from 2000 to 2020, with the unit expressed in Mt. The provincial carbon storage decreased from 1431.85 Mt in 2000 to 1424.11 Mt in 2010, and further declined to 1402.55 Mt in 2020, representing a cumulative reduction of 29.30 Mt over the 20-year period. In terms of stage-wise variation, carbon storage decreased by 7.74 Mt during 2000–2010 and by 21.56 Mt during 2010–2020, indicating that the decline became significantly more pronounced in the later period.
Figure 6.
Spatial distribution of carbon storage in Jiangsu Province from 2000 to 2020. (a) Carbon-storage distribution in 2000; (b) carbon-storage distribution in 2010; (c) carbon-storage distribution in 2020.
Table 7.
Carbon storage by land-use type in Jiangsu Province, 2000–2020 (Mt).
From the perspective of spatial distribution, the overall pattern of carbon storage in Jiangsu Province remained relatively stable in 2000, 2010, and 2020, although noticeable changes occurred in some local areas. High-value areas were mainly distributed in regions with relatively good vegetation cover, whereas low-value areas were primarily concentrated in regions with intensive construction land and strong human activities. Over time, the extent of high-value areas gradually shrank, while low-value areas expanded to some degree, indicating that urbanization expansion exerted a significant impact on regional carbon storage.
From the perspective of land-use types, cultivated land was the main source of carbon storage in Jiangsu Province. Its carbon storage declined from 940.72 Mt to 904.49 Mt, and further to 840.11 Mt, representing the most significant reduction and constituting the primary reason for the overall decrease in provincial carbon storage. Forest land carbon storage decreased from 151.65 Mt to 138.93 Mt, while grassland carbon storage declined from 17.44 Mt to 10.90 Mt, both showing downward trends. In contrast, water area carbon storage increased from 167.09 Mt to 181.04 Mt, and construction land carbon storage rose from 154.70 Mt to 229.88 Mt, both exhibiting continuous growth. The carbon storage of unused land remained relatively small overall and had only a limited impact on the provincial total.
Overall, the change in carbon storage in Jiangsu Province from 2000 to 2020 was characterized by a continuous decline in total amount, a relatively stable spatial pattern, and the expansion of local low-value areas. The reductions in carbon storage of cultivated land, forest land, and grassland were the main reasons for the decline in total carbon storage, while the increases in carbon storage of water areas and construction land reflected the influence of adjustments in the land-use structure.
3.4. Spatial Associations Between Land-Use Patterns and Contextual Factors in Jiangsu Province from 2000 to 2020
Geodetector was used to examine how the spatial configuration of land use corresponded to natural, socioeconomic, vegetation, and accessibility conditions. Ten variables were considered: nighttime light (), GDP (), population density (), elevation (), slope (), aspect (), distance to railways (), distance to roads (), distance to water bodies (), and NDVI (). The response layer was the carbon-storage surface derived from land-use maps and fixed class-specific carbon-density coefficients. It consequently functioned mainly as a spatial encoding of land-use composition. The q-statistics are therefore interpreted as associations between the strata of these contextual variables and the land-use pattern represented by that response layer, rather than as direct effects on actual carbon stocks.
Across 2000, 2010, and 2020 (Figure 7), pairwise factor combinations generally yielded higher q-values than individual topographic factors. This indicates that the joint spatial stratification of socioeconomic, accessibility, vegetation, and environmental conditions corresponded more closely to land-use differentiation than terrain alone. Most interaction values were approximately 0.4–0.7 in 2000 and rose overall in 2010 and 2020. Combinations involving nighttime light, GDP, population density, or NDVI were especially prominent in 2020. The temporal increase is consistent with a closer spatial alignment between urban development, population and economic agglomeration, vegetation cover, and the reorganization of land use. Because combining two factors also creates finer strata and can reduce within-stratum variance, higher interaction values should not be read as proof of causal synergy.
Figure 7.
Heat maps of Geodetector interaction results for land-use-related spatial differentiation in Jiangsu Province: (a) 2000, (b) 2010, and (c) 2020. Note: The diagonal values represent the q-statistics of individual factors, whereas the off-diagonal values represent the q-statistics of pairwise factor interactions.
The growing associations of nighttime light, GDP, and population density with other variables reflect the increasingly distinct land-use configurations of highly urbanized and less-developed areas. Locations with concentrated economic activity and population commonly coincide with larger shares of construction land and greater conversion pressure on adjacent cropland. Thus, the Geodetector patterns are consistent with the observed expansion of built-up land, but they do not independently identify the direction or magnitude of a causal effect.
NDVI also displayed strong interactions with socioeconomic and accessibility factors. High vegetation cover generally coincided with forest land, grassland, cropland, or other vegetated surfaces, whereas lower NDVI was more frequently associated with construction land or sparsely vegetated classes. Likewise, the relatively high values for combinations involving distance to railways and roads indicate that transport accessibility, development intensity, and construction land concentration share a pronounced spatial structure. Interactions involving distance to water bodies reflect the close relationship between Jiangsu’s river–lake network and the surrounding distribution of cropland, settlements, and ecological land.
Elevation, slope, and aspect showed comparatively weak associations when considered alone, which is reasonable for a province dominated by low-relief plains. Their q-values increased when combined with socioeconomic variables or NDVI, suggesting that even modest environmental differences can condition where development and vegetation patterns occur. Overall, the analysis indicates that Jiangsu’s land-use pattern and its changes over time were spatially associated most strongly with the combined structure of human activity, transport accessibility, and vegetation cover, within the constraints imposed by the physical environment. This interpretation keeps the Geodetector evidence at the level of exploratory spatial association; identifying causal mechanisms of land-use conversion would require transition-based dependent variables, policy information, and longitudinal or quasi-experimental methods.
3.5. Analysis of Multi-Objective Optimization Results in Jiangsu Province in 2030
As shown in Figure 8 and Table 8, there are clear differences in the allocation of various land-use types in Jiangsu Province under different scenarios, reflecting changes in land resource allocation patterns under different development objectives. Overall, cultivated land and construction land remain the dominant land-use types in Jiangsu Province under all scenarios, followed by water areas, while forest land, grassland, and unused land account for relatively small proportions. The overall spatial pattern of land-use remains generally stable, although land conversion is relatively significant in some local areas.
Figure 8.
Simulated land-use patterns in Jiangsu Province under multiple scenarios in 2030. (a) ND scenario; (b) EP scenario; (c) ED scenario; (d) CSM scenario; (e) COS scenario.
Table 8.
Land-use area by scenario in 2030 (km2).
From the perspective of land-use structure, under the Natural Development scenario (ND), the cultivated land area is 58,428 km2, accounting for 57.45% of the total area, while construction land covers 25,880 km2, accounting for 25.45%, indicating that under the continuation of the current development trend, Jiangsu Province still exhibits a strong demand for urban construction land. Under the Ecological Protection scenario (EP), the areas of cultivated land, forest land, and water areas increase to 60,776 km2, 5608 km2, and 16,581 km2, respectively, representing increases of 2348 km2, 2755 km2, and 2790 km2 compared with the ND scenario. Meanwhile, construction land decreases to 17,811 km2, which is 8069 km2 less than under the ND scenario. This indicates that the EP scenario significantly strengthens the protection of ecological land and agricultural space while restraining the disorderly expansion of construction land. Under the Economic Development scenario (ED), construction land reaches 26,344 km2, the highest among all scenarios and 464 km2 more than under the ND scenario, whereas cultivated land declines to 56,182 km2, the lowest among all scenarios. This suggests that an economic growth-oriented strategy further intensifies the occupation of cultivated land by construction land. Under the Carbon-Storage Maximization scenario (CSM), cultivated land reaches 62,438 km2, the highest among all scenarios, while forest land amounts to 5709 km2, also at a relatively high level. Construction land is only 18,139 km2, indicating that this scenario aims to enhance regional carbon storage by increasing the proportion of high-carbon-storage land-use types such as cultivated land and forest land while compressing the scale of construction land. Under the Comprehensive Optimization scenario (COS), the areas of cultivated land, forest land, and water areas are 58,694 km2, 5655 km2, and 15,486 km2, respectively, while construction land covers 21,092 km2. Overall, this scenario lies between the ecological protection and economic development scenarios and reflects a coordinated balance among multiple objectives, including economic development, ecological protection, and carbon-storage enhancement.
From the perspective of spatial pattern, the overall framework of land-use distribution in Jiangsu Province remains basically consistent across different scenarios. Cultivated land is widely distributed in the central and northern plain areas, forming the most important background landscape of the province. Construction land is mainly concentrated in the dense urban agglomeration of southern Jiangsu, as well as along the Yangtze River and coastal development axes, showing prominent characteristics of central agglomeration and corridor-based expansion. Water areas are mainly distributed in the Taihu Lake Basin, Hongze Lake, Gaoyou Lake, coastal tidal flats, and areas with dense river networks. Forest land and grassland are mainly scattered in hilly areas, ecological corridors, and some coastal areas. Although the overall pattern remains stable, the directions of land-use conversion in some local areas differ among scenarios, mainly manifested in the mutual adjustment among construction land, cultivated land, and ecological land.
Specifically, the ND scenario continues the existing trend of land-use evolution, with construction land further expanding outward on the basis of the original urban spatial pattern and continuously encroaching upon surrounding cultivated land. Under the EP scenario, the expansion of construction land is significantly constrained, and cultivated land, water areas, and forest land are restored or retained in some regions, making the land-use pattern more favorable for improving regional ecological security. The ED scenario strengthens the demands of urban construction and industrial development, with construction land expanding more significantly in urban fringes and along transport corridors. As a result, the fragmentation of cultivated land may be further intensified, and ecological spaces may face greater pressure. In contrast, the CSM scenario emphasizes the carbon sink function, under which ecological and production spaces such as forest land, water areas, and cultivated land are preserved to a greater extent, while the intensity of construction land expansion remains relatively low, which is conducive to maintaining a high level of regional carbon-storage capacity. The COS scenario, while controlling the expansion of construction land, also accommodates a certain degree of economic development demand, and therefore exhibits a relatively balanced and optimized land-use pattern.
Overall, the core differences in land-use change among the various scenarios in Jiangsu Province lie in the intensity of construction land expansion and the degree of protection for cultivated land, forest land, water areas, and other ecological–production spaces. The economic development-oriented scenario is mainly characterized by construction land growth and cultivated land reduction, whereas the ecological protection and carbon-storage-oriented scenarios place greater emphasis on ecological space restoration and the conservation of high-carbon-storage land-use types. The comprehensive scenario, under multiple objective constraints, achieves a relatively balanced land-use allocation. This suggests that future land-use optimization in Jiangsu Province should, while meeting the needs of economic development, strengthen the rigid protection of cultivated land and ecological land so as to promote the coordinated realization of regional ecological security and low-carbon development.
Table 9 shows that under different development scenarios, the economic benefits, ecosystem service value, and carbon storage of the study area exhibit substantial differences, indicating that different land-use allocation objectives directly influence the trade-off relationships among regional economic development, ecological protection, and carbon retention.
Table 9.
Economic benefits, ecosystem value, carbon storage, TOPSIS score, and rank by scenario in 2030.
From the perspective of economic benefits, the ED scenario generates the highest economic benefit, reaching 306,179.22 yuan, followed by the ND scenario with 300,704.53 yuan. This indicates that land-use patterns oriented toward economic growth and inertia-driven development can significantly enhance regional economic output, mainly through the expansion of construction land and high-intensity land development. In contrast, the economic benefits under the EP and CSM scenarios are 208,868.82 yuan and 212,497.59 yuan, respectively, which are markedly lower than those under the ND and ED scenarios. This suggests that when land-use allocation gives priority to ecological protection or carbon-storage enhancement, some high-economic-return land uses are restricted, resulting in a decline in overall economic output. The economic benefit under the COS scenario is 245,494.45 yuan, ranking between the economy-priority and ecology-priority scenarios, indicating that comprehensive optimization can partly mitigate the economic losses associated with single-objective ecological or carbon-oriented development.
From the perspective of ecosystem service value, the EP scenario has the highest value, reaching 1953.97 yuan, followed by the CSM scenario with 1618.44 yuan and the COS scenario with 1429.35 yuan. This indicates that ecological-priority land allocation and carbon-storage-oriented optimization can effectively improve regional ecosystem service functions by protecting ecological land and optimizing land-use structure. By comparison, the ecosystem service values under the ED and ND scenarios are much lower, at 575.81 yuan and 449.74 yuan, respectively. The ND scenario has the lowest ecosystem service value, suggesting that continuation of recent development trends may further weaken ecological function. Although the COS scenario does not achieve the highest ecosystem service value, it remains substantially higher than the ND and ED scenarios, showing that comprehensive optimization can improve ecological benefits while maintaining a certain level of economic development.
Carbon-storage outcomes also vary across scenarios. The CSM scenario produces the highest carbon storage, reaching 1497.47 Mt, followed closely by the EP scenario with 1493.95 Mt and the COS scenario with 1487.12 Mt. The ED scenario retains 1401.48 Mt, whereas the ND scenario produces the lowest carbon storage, at 1384.46 Mt. These results indicate that scenarios emphasizing ecological protection or carbon-sink enhancement can preserve substantially more ecosystem carbon than development-oriented or inertia-driven scenarios. Although the COS scenario does not maximize carbon storage, it maintains a relatively high carbon-storage level while achieving better economic performance than the EP and CSM scenarios.
The TOPSIS evaluation further reveals the comprehensive performance of the five scenarios. The COS scenario obtains the highest TOPSIS score, 0.6234, and ranks first, indicating that it provides the most balanced overall performance among economic benefit, ecosystem service value, and carbon storage. The EP scenario ranks second with a TOPSIS score of 0.5818, mainly due to its highest ecosystem service value and high carbon storage. The CSM scenario ranks third with a score of 0.5621, reflecting its advantage in carbon storage but relatively lower economic benefit. The ED scenario ranks fourth with a score of 0.4483, despite having the highest economic benefit, because of its relatively low ecosystem service value and carbon storage. The ND scenario ranks last with a score of 0.4007, indicating that continuation of the current development trend performs poorly in terms of comprehensive sustainability.
Taken together, the five scenarios reveal clear trade-offs among economic development, ecological protection, and carbon storage. The ED scenario achieves the highest economic benefit but performs weakly in ecological value and carbon storage, while the EP and CSM scenarios improve ecological value and carbon storage at the expense of economic output. The COS scenario does not rank first for any single objective, but it achieves the best comprehensive performance according to the TOPSIS results. Therefore, the COS scenario can be regarded as a more balanced and practicable land-use allocation pathway for coordinating economic development, ecosystem service enhancement, and carbon-storage conservation.
4. Discussion
4.1. Land-Use Reallocation Underlies the Estimated Decline in Ecosystem Carbon Storage
Between 2000 and 2020, estimated ecosystem carbon storage in Jiangsu decreased by 29.30 Mt, from 1431.85 to 1402.55 Mt. The loss accelerated after 2010: the reduction during 2010–2020 (21.56 Mt) was almost three times that during 2000–2010 (7.74 Mt). Because the InVEST calculation applied fixed carbon-density coefficients to land-use classes, this trajectory is best understood primarily as a land-use-composition effect. The transition results identify cropland contraction, construction-land expansion, and especially conversion from cropland to construction land as the principal structural changes associated with the decline. This interpretation is consistent with evidence from eastern China’s rapidly urbanizing coastal regions, where industrialization, infrastructure provision, and urban growth have reshaped the balance between production, ecological, and built-up spaces [43].
Cropland made the largest negative contribution because it occupied most of the province and experienced the greatest area loss. Reductions in forest land and grassland added to this decline, whereas the expansion of water bodies and construction land generated positive accounting contributions under the assigned coefficients. The increase attributed to construction land should not be interpreted as an improvement in urban carbon-sequestration capacity: it results from the combination of a fixed coefficient and a larger mapped area, while the conversion of cropland, forest land, or grassland can still reduce ecosystem functions and long-term sequestration potential [44]. At the provincial scale, the gains assigned to water and construction land were insufficient to compensate for losses from the contracting land classes, producing a negative net balance. Comparable patterns have been reported in the Yangtze River Delta, Pearl River Delta, and other areas where built-up expansion has displaced agricultural or ecological land [45].
Jiangsu differs from forest-dominated regions because its carbon outcome is closely tied to the reorganization of an extensive agricultural plain and river–lake landscape. The central planning issue is therefore not limited to increasing forest area; it also involves retaining contiguous cropland, safeguarding remaining forest land and grassland, protecting water-related ecological space, and steering new development toward existing built-up or underused land. Containing fragmented and leapfrog expansion would address the land conversion process most directly associated with the estimated carbon loss. Such measures connect carbon-sink objectives with cultivated-land protection and more efficient territorial development [46,47].
4.2. A Stable Provincial Pattern Conceals Localized Spatial Restructuring
The broad distribution of estimated carbon storage changed less than the provincial total, but this apparent stability masked substantial local restructuring. Areas with higher values remained concentrated in vegetated, water-rich, or less intensively developed landscapes, while lower-value zones expanded around dense built-up areas. The simultaneous contraction of high-value patches and outward growth of low-value areas is consistent with the replacement and fragmentation of cropland and ecological land along urban fringes. Human activity is therefore most visible not as a complete reorganization of the provincial pattern, but as incremental local changes superimposed on a persistent regional land-use framework [48].
North–south differences further condition this process. Southern Jiangsu combines high economic density, extensive construction land, and strong demand for additional development, which increases pressure on remaining agricultural and ecological spaces. Northern Jiangsu and areas surrounding major rivers and lakes retain larger, more continuous tracts of cropland, water bodies, and other non-built land. These contrasts help explain why low-value clusters are more pronounced in highly urbanized locations, whereas higher-value areas persist where vegetated and water-related land classes remain extensive. Similar patterns in other developed coastal provinces show that ecosystem-service distributions reflect both development intensity and the inherited ecological resource base [49].
Nevertheless, “overall stability” should not be equated automatically with ecological resilience. The persistence of broad spatial zones may partly reflect the dominance of long-established land-use classes and the 1 km resolution of the input data, both of which can obscure small or fragmented conversions. Continued outward expansion of construction land could therefore erode high-value patches even if province-wide maps appear visually similar. Planning should combine urban-development boundaries with differentiated protection of contiguous cropland, forests, grasslands, wetlands, and lake–river buffers, particularly in rapidly changing peri-urban areas [50].
4.3. Contextual Factors Are Spatially Associated with Land-Use Differentiation
The Geodetector analysis is most appropriately interpreted as evidence about land-use-related spatial differentiation. The response surface was produced by assigning fixed carbon-density values to land-use classes; consequently, its spatial variance largely encoded the distribution of those classes. Pairwise combinations generally generated higher q-values than individual topographic factors, and associations involving socioeconomic activity, accessibility, or vegetation cover strengthened across the three observation years. These results indicate that Jiangsu’s land-use configuration increasingly coincided with the joint spatial structure of development intensity and locational conditions. They do not demonstrate that the selected factors directly caused changes in measured carbon stocks.
Nighttime light, GDP, and population density showed strong associations when combined with other variables. Their spatial concentration corresponds to urban and industrial agglomeration, larger shares of construction land, and greater conversion pressure at the urban edge. Interactions involving distance to railways and roads similarly point to the corridor-like organization of development and built-up expansion. Transport infrastructure may facilitate land conversion through improved accessibility and changes in industrial and residential location, while the resulting construction corridors can fragment surrounding agricultural and ecological patches [51,52,53,54]. The present results are consistent with these pathways, although the cross-sectional q-statistics cannot isolate them causally.
NDVI interacted strongly with both socioeconomic and accessibility variables because vegetation cover is closely connected to the distribution of forest land, grassland, cropland, and built-up surfaces. By contrast, elevation, slope, and aspect had weaker individual associations, which is unsurprising in Jiangsu’s predominantly flat terrain [55]. Their higher values in combination with human-activity or vegetation variables nevertheless suggest that even limited environmental variation can condition where particular land uses occur. This differs from mountainous regions, where terrain often provides a much stronger first-order constraint on land development [56].
For planning purposes, the important implication is that land-use regulation should account for combinations of development pressure and spatial context. Areas where strong socioeconomic activity, high accessibility, and declining vegetation coincide may deserve closer monitoring for cropland loss and ecological fragmentation. However, converting these spatial associations into causal explanations will require land-use transition variables, explicit policy and zoning information, and longitudinal designs that distinguish temporal ordering from spatial coincidence.
4.4. The Integrated Framework Links Historical Diagnosis to Scenario-Based Planning
Combining InVEST, intPLUS, multi-objective programming, and Geodetector creates a continuous workflow from historical land-use assessment to future spatial allocation. The framework first quantifies land transitions and their carbon-accounting implications, then evaluates how the observed land-use pattern corresponds spatially to environmental and human conditions, and finally explores alternative 2030 allocations under competing objectives. This sequence is more useful for planning than treating historical assessment, spatial association analysis, and scenario simulation as independent exercises.
Each component serves a distinct role. InVEST translates mapped land-use composition into spatially explicit carbon estimates; intPLUS allocates future land demand while representing patch-level expansion; multi-objective programming exposes trade-offs among economic benefit, ecosystem service value, and carbon storage; and Geodetector screens spatial associations between land-use-related differentiation and contextual factors. Describing the last component as an association tool, rather than a mechanism-identification model, clarifies the evidential contribution of the coupled framework. Together, the models move the analysis from retrospective description toward transparent comparison of planning alternatives.
This integration is especially relevant to Jiangsu, where limited land resources must accommodate cultivated-land protection, ecological security, urban development, and carbon objectives simultaneously. The scenario results show why a single-objective solution is unlikely to satisfy all of these demands. The framework can also be adapted to other urbanized coastal regions, provided that local carbon densities, conversion rules, planning constraints, and stakeholder priorities are recalibrated rather than transferred directly [57,58,59,60].
4.5. Limitations and Remaining Uncertainty
Several limitations define the appropriate scope of the findings. First, the InVEST carbon module assigns one carbon-density value to each land-use class and holds it constant through time. This supports comparison of land-use configurations, but it cannot represent within-class variation arising from vegetation age, soil disturbance, management practices, hydrological change, or climate variability [61]. The estimates should therefore be interpreted as consistent scenario and trend indicators rather than as a fully resolved carbon inventory. In addition, the remote-sensing land-use data in this study primarily serve to identify multi-temporal land-use changes and provide inputs for the models, while the methodological innovation focuses on integrating carbon-storage assessment, spatial driving-factor identification, multi-objective optimization, and scenario simulation. It should be noted that land-use classification errors may propagate into carbon-storage estimates through the estimated areas of different land-use classes, their transition relationships, and the corresponding carbon-density parameters. In particular, misclassification of land-use types undergoing substantial transitions, such as cropland and construction land, may affect both the estimated magnitude of carbon-storage change and the identification of spatial hotspots of change.
Second, the 1 km land-use data may smooth narrow corridors, peri-urban conversions, small wetlands, and fragmented ecological patches. Classification error and aggregation can consequently affect both local carbon estimates and the apparent stability of spatial patterns [62]. Higher-resolution remote sensing, field observations, spatially varying carbon-density data, and explicit accuracy propagation would improve future assessments. Moreover, spatial resolution affects the representation of land-use patches, boundaries, and small-scale conversion processes. Coarser-resolution data may smooth fragmented cropland and ecological spaces, thereby influencing the spatial pattern of carbon storage and the spatial allocation of land-use optimization. Although finer-resolution data can better capture spatial heterogeneity, they also impose greater requirements on classification accuracy, parameter matching, and model computation. Therefore, the results of this study should be interpreted as scenario-based assessments obtained under the current conditions of land-use data accuracy, carbon-density parameters, and spatial resolution, rather than as absolute predictions free from uncertainty.
Third, Geodetector results are sensitive to the definition and discretization of factor strata. More importantly, because the response layer was derived directly from land-use classes, the q-statistics mainly describe where contextual conditions coincide with different land-use configurations; they do not identify causal drivers of carbon change. Institutional influences such as zoning, ecological restoration, land-market regulation, and industrial policy were also not represented [63]. Future work could analyze observed land-use transitions directly and combine policy variables with panel, spatial econometric, or quasi-experimental approaches.
Finally, the 2030 outcomes depend on objective weights, demand constraints, conversion rules, and intPLUS parameters. The selected Pareto compromise is one defensible balance rather than a universally optimal plan. Sensitivity tests for weights and constraints, comparison across alternative simulation models, uncertainty propagation, and stakeholder-based preference elicitation would make the recommended allocation more robust and transparent [64].
5. Conclusions
Using land-use maps for 2000, 2010, and 2020, this study linked historical assessment, exploratory spatial association, Pareto-based quantity optimization, and intPLUS spatial simulation to evaluate alternative land-use pathways for Jiangsu Province. The principal conclusions are as follows.
- (1)
- Jiangsu’s land-use structure changed markedly over the study period. Cropland decreased by 7475 km2, whereas construction land increased by 6974 km2; conversion from cropland to construction land was the dominant transition. These changes show that urban and infrastructure expansion occurred primarily through the reallocation of agricultural space.
- (2)
- Estimated ecosystem carbon storage fell from 1431.85 Mt in 2000 to 1402.55 Mt in 2020, a cumulative reduction of 29.30 Mt. The loss accelerated from 7.74 Mt in 2000–2010 to 21.56 Mt in 2010–2020. Under the fixed class-specific carbon densities used by InVEST, this decline mainly reflects the contraction of cropland, forest land, and grassland, whose losses exceeded the positive accounting contributions from expanding water and construction land.
- (3)
- The province-wide spatial pattern remained broadly recognizable, but local restructuring was evident: high-value areas contracted and low-value areas expanded around intensively developed zones. This pattern highlights the need to look beyond provincial totals and protect vulnerable peri-urban cropland and ecological patches.
- (4)
- Geodetector identified increasingly strong spatial associations between land-use configuration and the combined distribution of socioeconomic activity, transport accessibility, and vegetation cover. Pairwise combinations generally corresponded more closely to land-use differentiation than individual topographic factors. Because the response surface was derived from land-use classes with fixed carbon-density coefficients, these q-statistics should be interpreted as exploratory associations related to land-use patterns, not as causal effects on actual carbon stocks.
- (5)
- The 2030 scenarios exposed clear multi-objective trade-offs. CSM produced the highest carbon storage (1497.47 Mt), EP generated the highest ecosystem service value, ED achieved the highest economic benefit but the lowest ecosystem service value, and ND produced the lowest carbon storage (1384.46 Mt). COS retained 1487.12 Mt of carbon while maintaining more balanced economic and ecological outcomes, making it a practical compromise among the evaluated alternatives.
Overall, Jiangsu’s estimated carbon trajectory is inseparable from the way land is allocated among agricultural, ecological, and built-up uses. A planning strategy centered on compact development, strict protection of contiguous cropland and ecological space, and context-sensitive regulation along transport corridors can reduce further conversion pressure. The integrated framework offers a transparent means of comparing such strategies, while its outputs should be updated as higher-resolution land data, spatially variable carbon densities, policy information, and stakeholder preferences become available.
Author Contributions
Writing—original draft preparation, Y.W.; writing—review and editing, G.Y.; validation, I.H. All authors have read and agreed to the published version of the manuscript.
Funding
This research received no external funding.
Data Availability Statement
The datasets used in this study are publicly available. Land-use/-cover data from 2000 to 2020 were obtained from the Resource and Environment Science and Data Center of the Chinese Academy of Sciences (RESDC) (https://www.resdc.cn, accessed on 3 May 2026). Nighttime light data were obtained from the National Tibetan Plateau Data Center (https://data.tpdc.ac.cn/, accessed on 3 May 2026) and the NOAA National Centers for Environmental Information (https://www.ncei.noaa.gov/, accessed on 3 May 2026). GDP, population, elevation, slope, aspect, distance to railway, distance to road, and distance to water bodies data were obtained from RESDC (https://www.resdc.cn, accessed on 3 May 2026). Carbon-density data were derived from previously published studies and publicly available sources.
Conflicts of Interest
The authors declare no conflicts of interest.
References
- Liu, C.; He, C.; Chang, S.X.; Chen, X.; An, S.; Wang, D.; Yan, J.; Zhang, Y.; Li, P. Fertilization and Tillage Influence on Soil Organic Carbon Fractions: A Global Meta-Analysis. CATENA 2024, 246, 108404. [Google Scholar] [CrossRef] [Scilit]
- Bar-On, Y.M.; Li, X.; O’Sullivan, M.; Wigneron, J.-P.; Sitch, S.; Ciais, P.; Frankenberg, C.; Fischer, W.W. Recent Gains in Global Terrestrial Carbon Stocks Are Mostly Stored in Nonliving Pools. Science 2025, 387, 1291–1295. [Google Scholar] [CrossRef] [Scilit]
- Pan, Y.; Yang, X.; Chen, L.; Liu, L.; Wang, C. Land Use Carbon Emissions in China’s Coal-Resource-Based Cities: Quantitative Measurement and Drivers Analysis. Urban Clim. 2025, 64, 102638. [Google Scholar] [CrossRef] [Scilit]
- Guo, S.; Xia, W.; Wan, Y.; Wu, X.; Han, W.; Azadi, H. Towards COP29 Climate Equity: Multi-Scale Trade-Driven Inequality in China’s Land-Use Carbon Emissions. Land Use Policy 2025, 158, 107743. [Google Scholar] [CrossRef] [Scilit]
- Cui, J.; Wei, Z.; Li, X.; Yuan, C.; Liu, L.; Zhang, D. An Integrated Land Use–Carbon Modeling Framework for Net Carbon Emissions and Spatial Optimization in Northeast China. J. Clean. Prod. 2025, 525, 146545. [Google Scholar] [CrossRef] [Scilit]
- Ma, L.; Wang, J.; Wei, Y.; Yu, P.; Hong, Y.; Wu, Z.; Liu, Y.; Zhang, G.-L.; Demattê, J.A.M.; Minasny, B.; et al. Scenario-Based Mapping Reveals Soil Organic Carbon Responses to Land-Use Change in the Amazon Basin. CATENA 2026, 271, 110206. [Google Scholar] [CrossRef] [Scilit]
- Cervelli, E.; Pindozzi, S.; Recchi, P.F.; Romano, N.; Scotto Di Perta, E.; Nasta, P. Projected Effects of Land Use Change on Future Soil Erosion in Southern Italy. CATENA 2026, 270, 110165. [Google Scholar] [CrossRef] [Scilit]
- Wang, H.; Su, M.; Qi, P.; Li, G.; Zou, Y. Climate-Dominated, LUCC-Enhanced Water–Ecosystem Responses in the Humid Temperate Tumen River Basin. CATENA 2026, 270, 110193. [Google Scholar] [CrossRef] [Scilit]
- Delma, S.; Gilmour, D.; Warner, K.; Temphel, K.J.; Herbohn, J. Land Use Change in Rural Bhutan—Implications for Forest Carbon Stocks and Climate Change Mitigation. Land Use Policy 2026, 168, 108064. [Google Scholar] [CrossRef] [Scilit]
- Ugbemuna Ugbaje, S.; Karunaratne, S.; Bishop, T.; Gregory, L.; Searle, R.; Coelli, K.; Farrell, M. Space-Time Mapping of Soil Organic Carbon Stock and Its Local Drivers: Potential for Use in Carbon Accounting. Geoderma 2024, 441, 116771. [Google Scholar] [CrossRef] [Scilit]
- Keith, H.; Vardon, M.; Stein, J.A.; Lindenmayer, D. Contribution of Native Forests to Climate Change Mitigation—A Common Approach to Carbon Accounting That Aligns Results from Environmental-Economic Accounting with Rules for Emissions Reduction. Environ. Sci. Policy 2019, 93, 189–199. [Google Scholar] [CrossRef] [Scilit]
- Wiese, L.; Ros, I.; Rozanov, A.; Boshoff, A.; De Clercq, W.; Seifert, T. An Approach to Soil Carbon Accounting and Mapping Using Vertical Distribution Functions for Known Soil Types. Geoderma 2016, 263, 264–273. [Google Scholar] [CrossRef] [Scilit]
- Pavlovic, M.; Ilic, S.; Ralevic, N.; Antonic, N.; Raffa, D.W.; Bandecchi, M.; Culibrk, D. A Deep Learning Approach to Estimate Soil Organic Carbon from Remote Sensing. Remote Sens. 2024, 16, 655. [Google Scholar] [CrossRef] [Scilit]
- Pi, Z.; Liu, X.; Wei, Y.; Wang, X.; Zang, Z.; Song, X. Spatiotemporal Variation in Carbon Sequestration in the Forest Ecosystem of Hainan Island over a 30-Year Period and Its Driving Factors. Ecol. Indic. 2026, 182, 114587. [Google Scholar] [CrossRef] [Scilit]
- Diao, Y.; Xia, J.; Dong, Q.; Zuo, Q.; Xie, M.; Peng, X.; Jiang, L. A Water-Carbon-Economic Model Coupling System Dynamics and InVEST for Wuhan’s Sustainability Assessment. Ecol. Indic. 2025, 178, 113893. [Google Scholar] [CrossRef] [Scilit]
- Zhao, Q.; Shao, J. Evaluating the Impact of Simulated Land Use Changes under Multiple Scenarios on Ecosystem Services in Ji’an, China. Ecol. Indic. 2023, 156, 111040. [Google Scholar] [CrossRef] [Scilit]
- He, Y.; Ma, J.; Zhang, C.; Yang, H. Spatio-Temporal Evolution and Prediction of Carbon Storage in Guilin Based on FLUS and InVEST Models. Remote Sens. 2023, 15, 1445. [Google Scholar] [CrossRef] [Scilit]
- Wu, Q.; Wang, L.; Wang, T.; Ruan, Z.; Du, P. Spatial–Temporal Evolution Analysis of Multi-Scenario Land Use and Carbon Storage Based on PLUS-InVEST Model: A Case Study in Dalian, China. Ecol. Indic. 2024, 166, 112448. [Google Scholar] [CrossRef] [Scilit]
- Xu, J.; Mu, X.; Ma, Z. Evaluation of the Effectiveness of Regulatory Measures for the Use of Natural Ecological Space Based on the Remote Sensing-Driven PLUS-InVEST Model: A Case Study from the Central Mountainous Area of Hainan Island. Ecol. Evol. 2025, 15, e72025. [Google Scholar] [CrossRef] [Scilit] [PubMed]
- Su, X.; Shi, H.; Liu, Y.; Wen, Z.; Wang, Y.; Yang, G.; Zhang, Y.; Yang, X. Spatiotemporal Analysis and Multi-Scenario Projection of Soil Erosion in the Loess Plateau Using the PLUS-CSLE Model. Remote Sens. 2026, 18, 1202. [Google Scholar] [CrossRef] [Scilit]
- Ma, L.; Xiao, J.; Teng, G.; Zhang, T.; Chen, L. An Integrated Model Based on CNN-Transformer and PLUS for Urban Expansion Simulation in the Yangtze River Delta, China. Remote Sens. 2026, 18, 1071. [Google Scholar] [CrossRef] [Scilit]
- Liu, J.; Kong, X.; Zhu, Y.; Zhang, B. A Study on Land Use Change Simulation Based on PLUS Model and the U-Net Structure: A Case Study of Jilin Province. Ecol. Indic. 2025, 176, 113619. [Google Scholar] [CrossRef] [Scilit]
- Shi, J.; Zhang, P.; Liu, Y.; Tian, L.; Cao, Y.; Guo, Y.; Li, J.; Wang, Y.; Huang, J.; Jin, R.; et al. Study on Spatiotemporal Changes of Wetlands Based on PLS-SEM and PLUS Model: The Case of the Sanjiang Plain. Ecol. Indic. 2024, 169, 112812. [Google Scholar] [CrossRef] [Scilit]
- Yang, Y.; Yang, M.; Zhao, B.; Lu, Z.; Sun, X.; Zhang, Z. Spatially Explicit Carbon Emissions from Land Use Change: Dynamics and Scenario Simulation in the Beijing-Tianjin-Hebei Urban Agglomeration. Land Use Policy 2025, 150, 107473. [Google Scholar] [CrossRef] [Scilit]
- Chen, M.; Samat, N.; Maghsoodi Tilaki, M.J.; Duan, L. Land Use/Cover Change Simulation Research: A System Literature Review Based on Bibliometric Analyses. Ecol. Indic. 2025, 170, 112991. [Google Scholar] [CrossRef] [Scilit]
- Huang, J.; Wang, Y. Ventilation Potential Simulation Based on Multiple Scenarios of Land-Use Changes Catering for Urban Planning Goals in the Metropolitan Area. J. Clean. Prod. 2024, 483, 144301. [Google Scholar] [CrossRef] [Scilit]
- Li, M.; Li, H.; Zhou, Z.; Chen, Y.; Wang, Y.; Li, T.; Fu, Q. Spatial Simulation and Optimization of Cropping Structure Under Climate and Land Use Change Conditions Considering Synergistic Economic Benefits and Carbon Reduction in Crop Growth Processes. Earths Future 2024, 12, e2024EF004684. [Google Scholar] [CrossRef] [Scilit]
- Yang, Y.; Wang, Y.; Lyu, H.; Wang, W.; Ye, Z.; Fu, A.; Zhou, H. Impact of Land Use/Cover Changes on Regional Soil Organic Carbon Storage in the Main Stream of the Tarim River from 1990 to 2020. Land 2025, 14, 2334. [Google Scholar] [CrossRef] [Scilit]
- Jing, X.; Tian, G.; He, Y.; Wang, M. Spatial and Temporal Differentiation and Coupling Analysis of Land Use Change and Ecosystem Service Value in Jiangsu Province. Ecol. Indic. 2024, 163, 112076. [Google Scholar] [CrossRef] [Scilit]
- Liu, Z.; Rommel, J.; Feng, S. Does It Pay to Participate in Decision-Making? Survey Evidence on Land Co-Management in Jiangsu Province, China. Ecol. Econ. 2018, 143, 199–209. [Google Scholar] [CrossRef] [Scilit]
- Xin, S.; Li, Z.; Chen, N.; Zhang, Z.; Zhang, X.; Chen, H.; Ma, X.; Kang, L. The Contribution of Multi-Objective Land Use Optimization to Reducing Ecological Risk: A Case Study of the Lanzhou-Xining Urban Agglomeration. Ecol. Indic. 2024, 168, 112604. [Google Scholar] [CrossRef] [Scilit]
- Bai, X.; Lin, C.; Wang, S.; Xiong, J.; Xu, J.; Xue, K.; Ma, D.; Tong, Y.; Chen, J.; Cui, W. Ponds Greatly Influence Watershed Ecosystem Services Value: An Optimized InVEST Model for Large-Scale. J. Hydrol. 2026, 668, 135026. [Google Scholar] [CrossRef] [Scilit]
- Tian, J.; Su, X.; Zhang, K.; Zhou, H. Ecological Assessment Based on the InVEST Model and Ecological Sensitivity Analysis: A Case Study of Huinan County, Tonghua City, Jilin Province, China. Land 2026, 15, 87. [Google Scholar] [CrossRef] [Scilit]
- Dai, X.; Li, D.; Zheng, Y.; Liu, C.; Li, N.; Lu, H. Analysis of Spatiotemporal Changes and Driving Factors of Green and Blue Carbon Stocks in Zhangzhou City Based on PLUS and InVEST Models. J. Clean. Prod. 2025, 528, 146743. [Google Scholar] [CrossRef] [Scilit]
- Li, Z.; Yan, T.; Du, Y. Scenario-Based Simulation of Carbon Storage in Chengdu Using MCCA–InVEST: Land Use Change, Spatial Patterns, and potential explanations. Carbon Balance Manag. 2025, 20, 40. [Google Scholar] [CrossRef] [Scilit]
- Jiang, D.; Sun, H.; Cui, B.; Li, X.; Li, L.; Li, Y.; Luo, Y. Dynamics of Inorganic and Organic Carbon Stocks under Land Use Change and Tidal Barrier Construction in the Yellow River Delta during 1980–2020. CATENA 2025, 261, 109569. [Google Scholar] [CrossRef] [Scilit]
- Liang, X.; Guan, Q.; Clarke, K.C.; Liu, S.; Wang, B.; Yao, Y. Understanding the Drivers of Sustainable Land Expansion Using a Patch-Generating Land Use Simulation (PLUS) Model: A Case Study in Wuhan, China. Comput 2021, 85, 101569. [Google Scholar] [CrossRef] [Scilit]
- Liang, X.; Liu, X.; Li, D.; Zhao, H.; Chen, G. Urban Growth Simulation by Incorporating Planning Policies into a CA-Based Future Land-Use Simulation Model. Int. J. Geogr. Inf. Sci. 2018, 32, 2294–2316. [Google Scholar] [CrossRef] [Scilit]
- Wang, Y.; Zhou, X.; Cao, K. Multi-Objective Land Use Optimization for Enhanced Urban Livability Using a NSGA-III-Differential Evolution Algorithm. Land Use Policy 2026, 161, 107880. [Google Scholar] [CrossRef] [Scilit]
- Chen, H.X.; Xin, C.L.; Chen, N.; Ma, X.S.; Bai, Y.; Kang, L.G.; Xin, S.J. Carbon Stock Changes and Multi-scenario Prediction in the Sichuan-Chongqing Region Based on PLUS-InVEST Modeling. Environ. Sci. 2026, 47, 360–371. [Google Scholar] [CrossRef] [Scilit]
- Sun, Y.; Qi, M.; Wang, W.; Liu, D.; Cai, J. Research on the Temporal and Spatial Evolution, Trade-offs and Synergistic Relationships of Ecosystem Services in the Qiantang River Basin. J. Ecol. Rural. Environ. 2026, 42, 206–218. [Google Scholar]
- Shi, G.; Wang, Y.; Zhang, J.; Xu, J.; Chen, Y.; Chen, W.; Liu, J. Spatiotemporal Pattern Analysis and Prediction of Carbon Storage Based on Land Use and Cover Change: A Case Study of Jiangsu Coastal Cities in China. Land 2024, 13, 1728. [Google Scholar] [CrossRef] [Scilit]
- Li, H.; Hu, Y.; Li, H.; Ren, J.; Shao, R.; Liu, Z. Assessing the Impact of Spatiotemporal Evolution of Urbanization on Carbon Storage in the Mega-Urban Agglomeration Area: Case Study of Yangtze River Delta Urban Agglomeration, China. Sustainability 2023, 15, 14548. [Google Scholar] [CrossRef] [Scilit]
- Wu, R.; Zhou, S.; Guo, H.; Wang, S. Quantifying the Teleconnections of Carbon Storage in Construction Land and Its Socioeconomic Driving Forces in Guangdong Province. J. Clean. Prod. 2024, 456, 142390. [Google Scholar] [CrossRef] [Scilit]
- Wu, B.A.; Chen, G.F.; Zhao, X.Y.; Qin, Y.J.; Liu, X.; Guo, X.P. Multi-scenario Simulation of Construction Land Expansion and Its Impact on Ecosystem Carbon Storage in Beijing-Tianjin-Hebei Urban Agglomeration. Huanjing Kexue 2024, 45, 2828–2839. [Google Scholar] [CrossRef] [Scilit]
- Sun, Y.; Yuan, X.; Guo, B. Carbon Storage Prediction and Its Dominant Factors in the Yellow River Delta under the Combined Action of Natural and Artificial Factors. Geomat 2025, 16, 2568146. [Google Scholar] [CrossRef] [Scilit]
- Cui, P.; Zheng, Y.; Wang, L.; Tian, J.; Ji, R.; Guo, Z. Research on the Influencing Factors and Prediction Model of Carbon Storage of Urban Forest in Harbin, China. Urban For. Urban Green. 2026, 116, 129237. [Google Scholar] [CrossRef] [Scilit]
- Sun, B.; Wang, H.; Wu, X.; Bi, N.; Wang, G.; Wang, M.; Wang, B. Dual Impacts of Human Activities on Land Cover and Carbon Storage in the Yellow River Delta (1986–2023). Ocean Coast. Manag. 2025, 267, 107655. [Google Scholar] [CrossRef] [Scilit]
- Ma, Z.; Wu, J.; Yang, H.; Yang, J.; Zhang, J. Unraveling the Effects of Land Use Change on Carbon Balance: A Systematic Study in the Beijing-Tianjin-Hebei Region, China. Ecol. Indic. 2025, 179, 114109. [Google Scholar] [CrossRef] [Scilit]
- Mohammed, E.M.I.; Yasin, E.H.E.; Mulyana, B. Analysis of Species Richness Variability, Spatial Distribution, and Carbon Stock in Okalma Natural Forest Reserve, Sudan. Anthr. Sci. 2025, 4, 30–41. [Google Scholar] [CrossRef] [Scilit]
- Niyomugabo, P.; Li, L.; Mind’je, R.; Muhirwa, F.; Maniraho, A.P. Influencing Factors of Ecosystem Services and Their Spatiotemporal Change Assessment Based on Land Use in Rwanda. Environ. Monit. Assess. 2025, 197, 721. [Google Scholar] [CrossRef] [Scilit]
- Aboye, B.H.; Gebre-Egziabher, T.; Kebede, B. Farm Factors Influencing Spatial Variations of Cropland Use and Change in the Context of Urban Expansion: The Case of Jimma City, Southwest Ethiopia. J. Agric. Food Res. 2024, 16, 101069. [Google Scholar] [CrossRef] [Scilit]
- Giljum, S.; Maus, V.; Sonter, L.; Luckeneder, S.; Werner, T.; Lutter, S.; Gershenzon, J.; Cole, M.J.; Siqueira-Gay, J.; Bebbington, A. Metal Mining Is a Global Driver of Environmental Change. Nat. Rev. Earth Environ. 2025, 6, 441–455. [Google Scholar] [CrossRef] [Scilit]
- Chi, J. Exploring the Drivers of Ecological Footprint: Impacts of Road Transportation Infrastructure, Transport Tax, and Environment Technologies. Int. J. Sustain. Transp. 2024, 18, 920–934. [Google Scholar] [CrossRef] [Scilit]
- Lu, Y.; Fang, G.; Deng, M.; Fang, G.; Zhu, Z.; Sun, C.; Yang, Z. Ecological Health Assessment of Riparian Zone of Yangtze River Based on Trapezoid Cloud Model in Jiangsu Province, China. Ecol. Indic. 2024, 169, 112796. [Google Scholar] [CrossRef] [Scilit]
- Zhang, B.; Liu, L.; Zhang, Y.; Wei, B.; Qi, H.; Gong, D.; Gu, C.; Li, L. Land Cover Change and Its Influencing Factors in the Southeast Xizang Autonomous Region, China. J. Mt. Sci. 2026, 23, 1702–1723. [Google Scholar] [CrossRef] [Scilit]
- Chen, Z.; Li, S.; Liu, Z.; Huo, Y.; Wu, T.; Zhou, X. Multi-Objective Land Use Simulation by Integrating Urban Spatial Suitability and Ecological Carrying Capacity Evaluations. J. Geogr. Sci. 2026, 36, 799–824. [Google Scholar] [CrossRef] [Scilit]
- Chen, N.; Xin, C.; Zhang, B.; Xin, S.; Tang, D.; Chen, H.; Ma, X. Contribution of Multi-Objective Land Use Optimization to Carbon Neutrality: A Case Study of Northwest China. Ecol. Indic. 2023, 157, 111219. [Google Scholar] [CrossRef] [Scilit]
- Luan, C.; Liu, R. Integrated Ecological and Environmental Spatial Soft Constraint Mechanism: Urban Multi-Objective Land Use Optimization under Multiple Scenarios. J. Environ. Manag. 2025, 385, 125661. [Google Scholar] [CrossRef] [Scilit]
- Luan, C.; Liu, R.; Zhang, Q.; Sun, J.; Liu, J. Multi-Objective Land Use Optimization Based on Integrated NSGA–II–PLUS Model: Comprehensive Consideration of Economic Development and Ecosystem Services Value Enhancement. J. Clean. Prod. 2024, 434, 140306. [Google Scholar] [CrossRef] [Scilit]
- Wang, L.; Wang, Y.; Wu, X.; Guo, J.; Zhou, J. Decipher Soil Organic Carbon Density Dynamics, Driving Forces and Future Stability across Southwest China. Geoderma 2025, 463, 117537. [Google Scholar] [CrossRef] [Scilit]
- Wang, R.; Wu, H.; Chen, G.; Zhao, J. Land Use Prediction for SSPs Climate Scenarios with Carbon Emission Gradients: A FiLM-Modulated Conditional GAN Framework. J. Clean. Prod. 2026, 563, 148520. [Google Scholar] [CrossRef] [Scilit]
- Liu, Z.; Zhou, Q.; Gong, M.; Qu, S. Temporal and Spatial Effect Distribution on Soil Erosion from Nationwide Forest Restoration Policies in China Revealed by Causal Machine Learning. ACS Environ. Au 2026, 6, 261–272. [Google Scholar] [CrossRef] [Scilit]
- Yu, M.; Zhou, T.; Yi, J.; Wang, W.; Zhou, M.; Tao, J.; Guo, J. Multi-Scenario Land Use Optimization towards Carbon Neutrality: An Integrated Predict-Optimize-Evaluate Decision Support Framework. J. Clean. Prod. 2026, 564, 148502. [Google Scholar] [CrossRef] [Scilit]
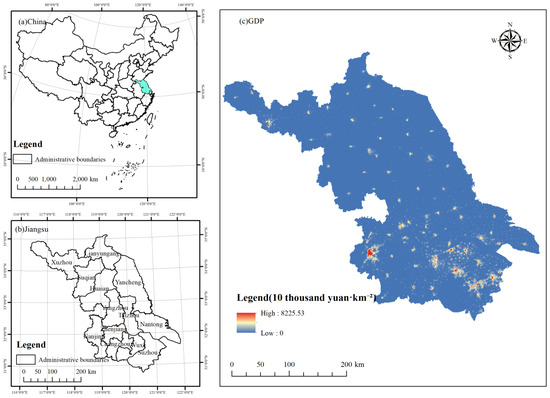
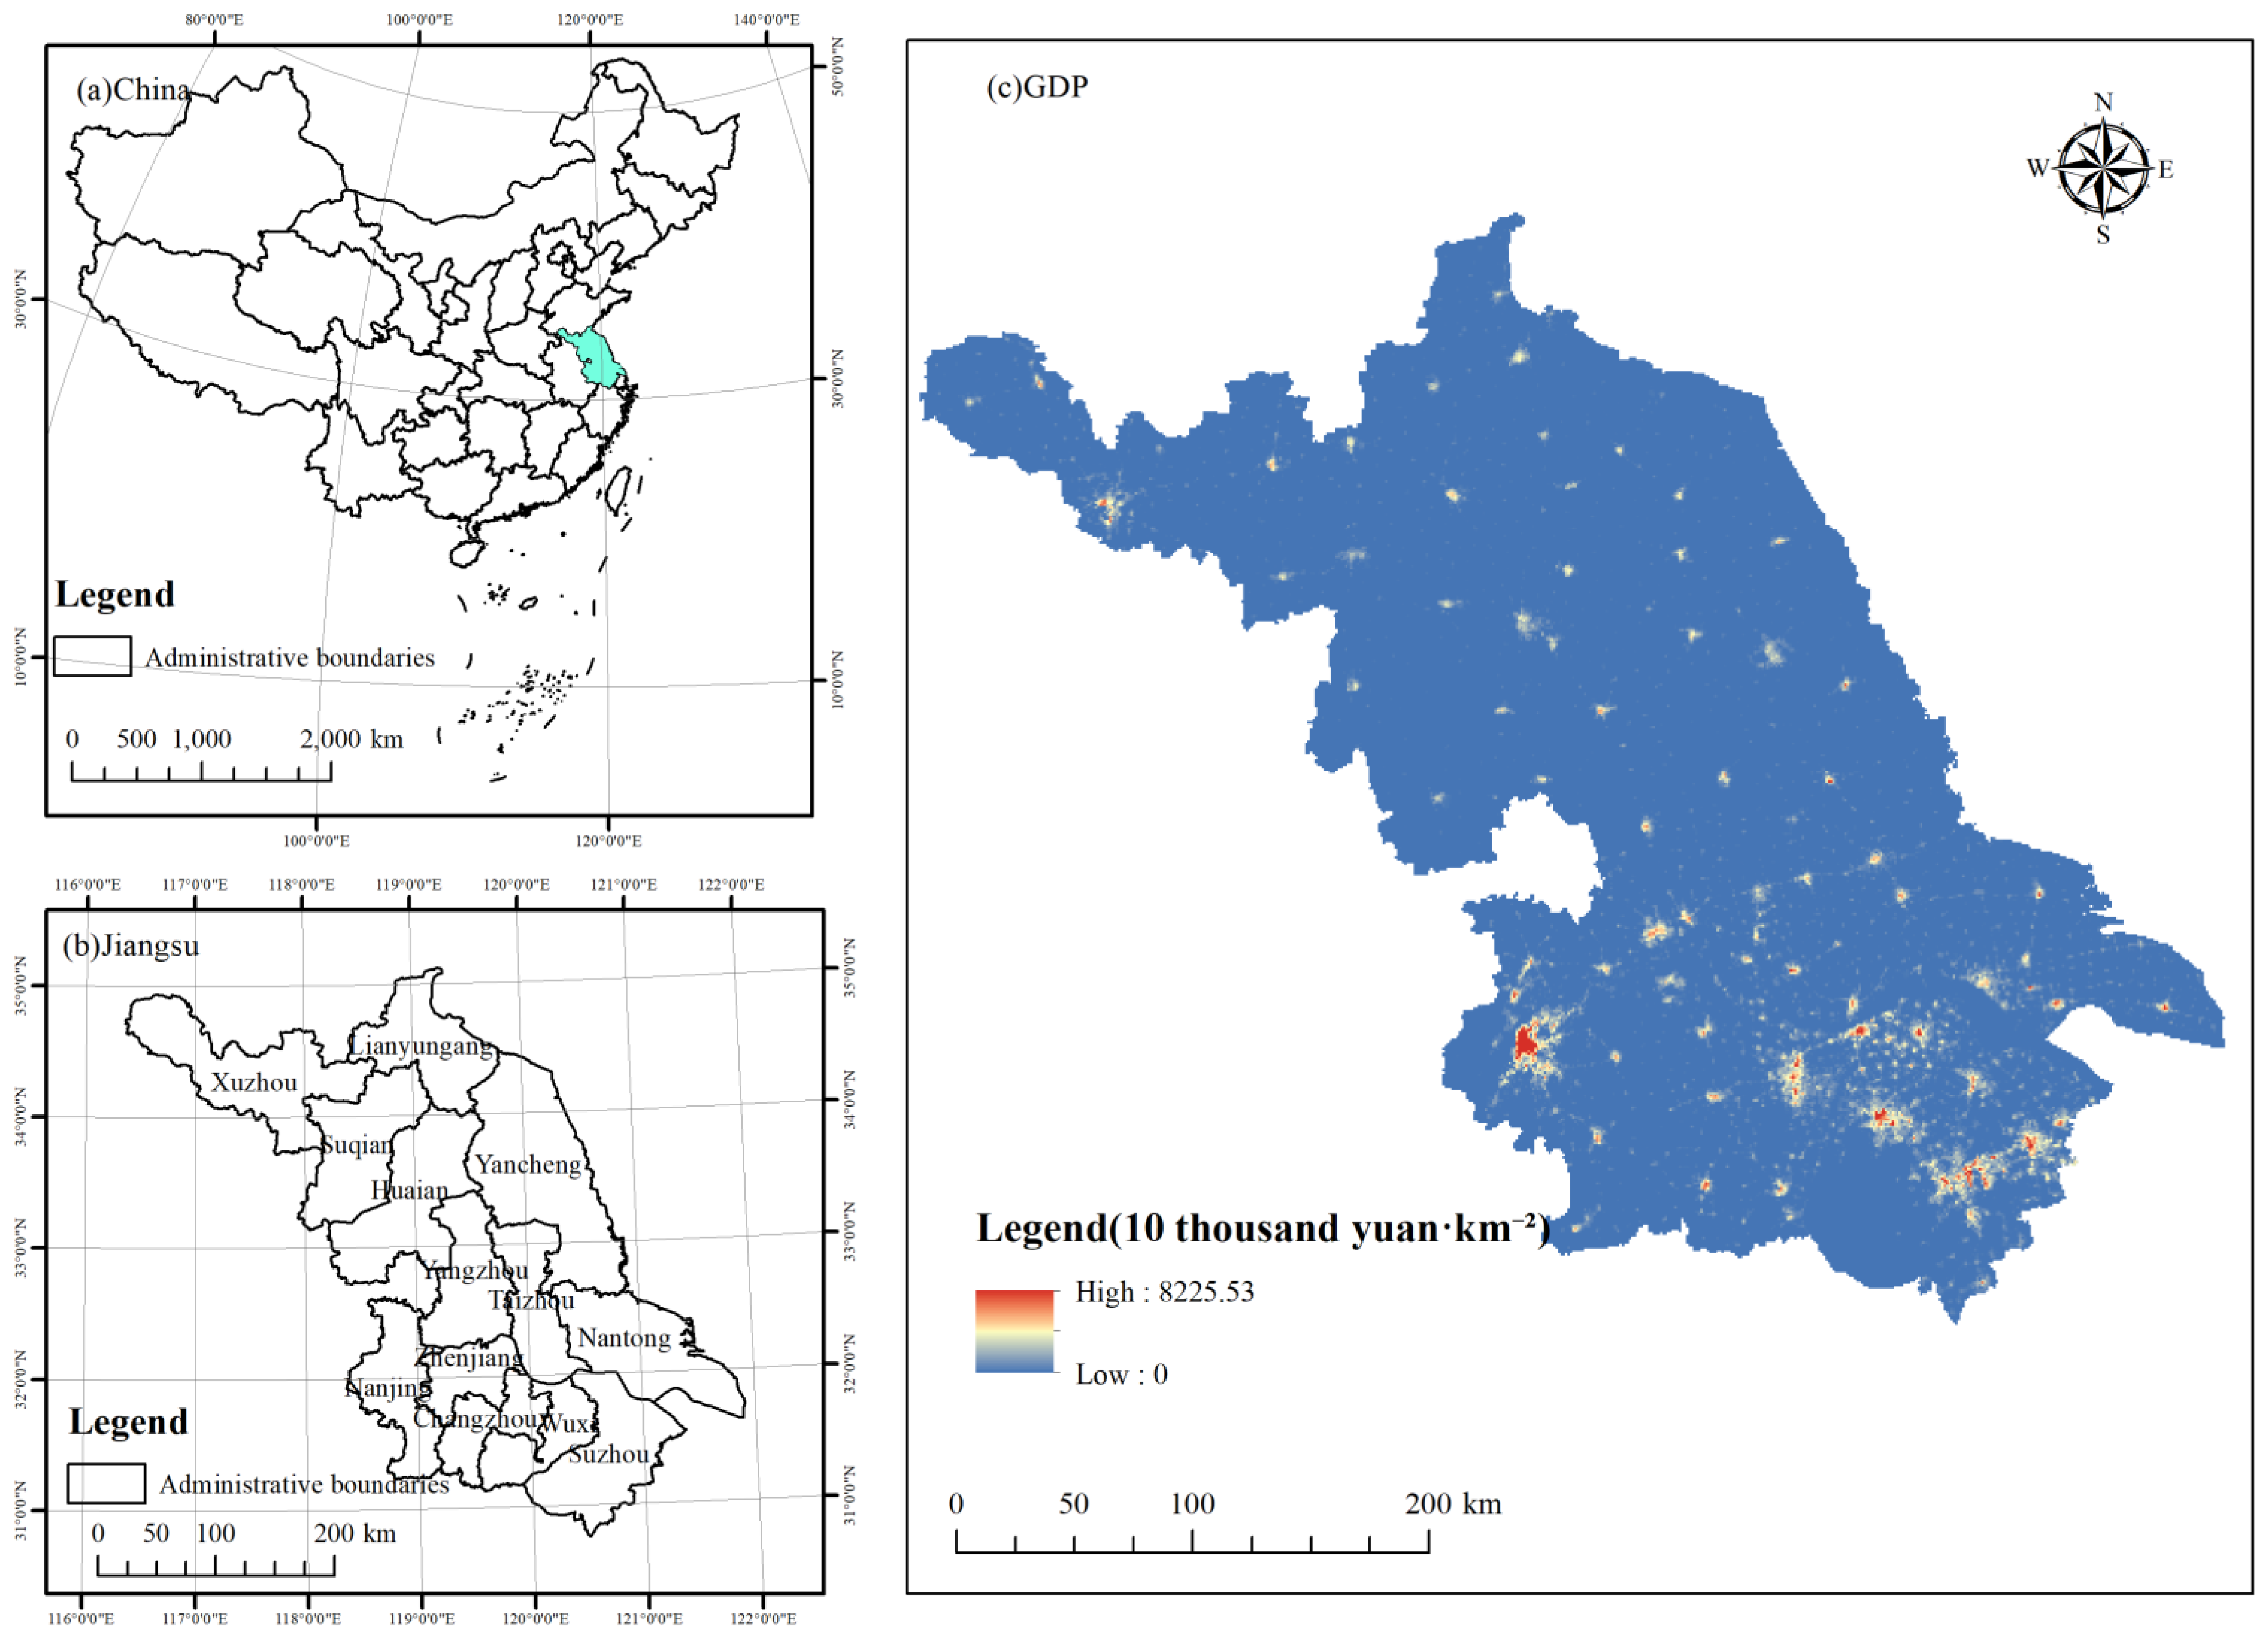
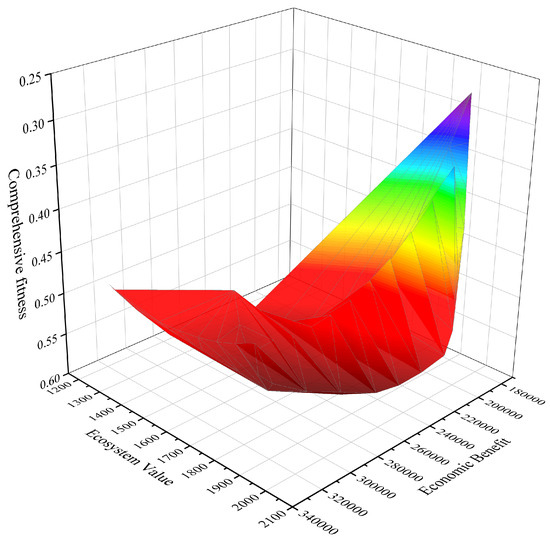
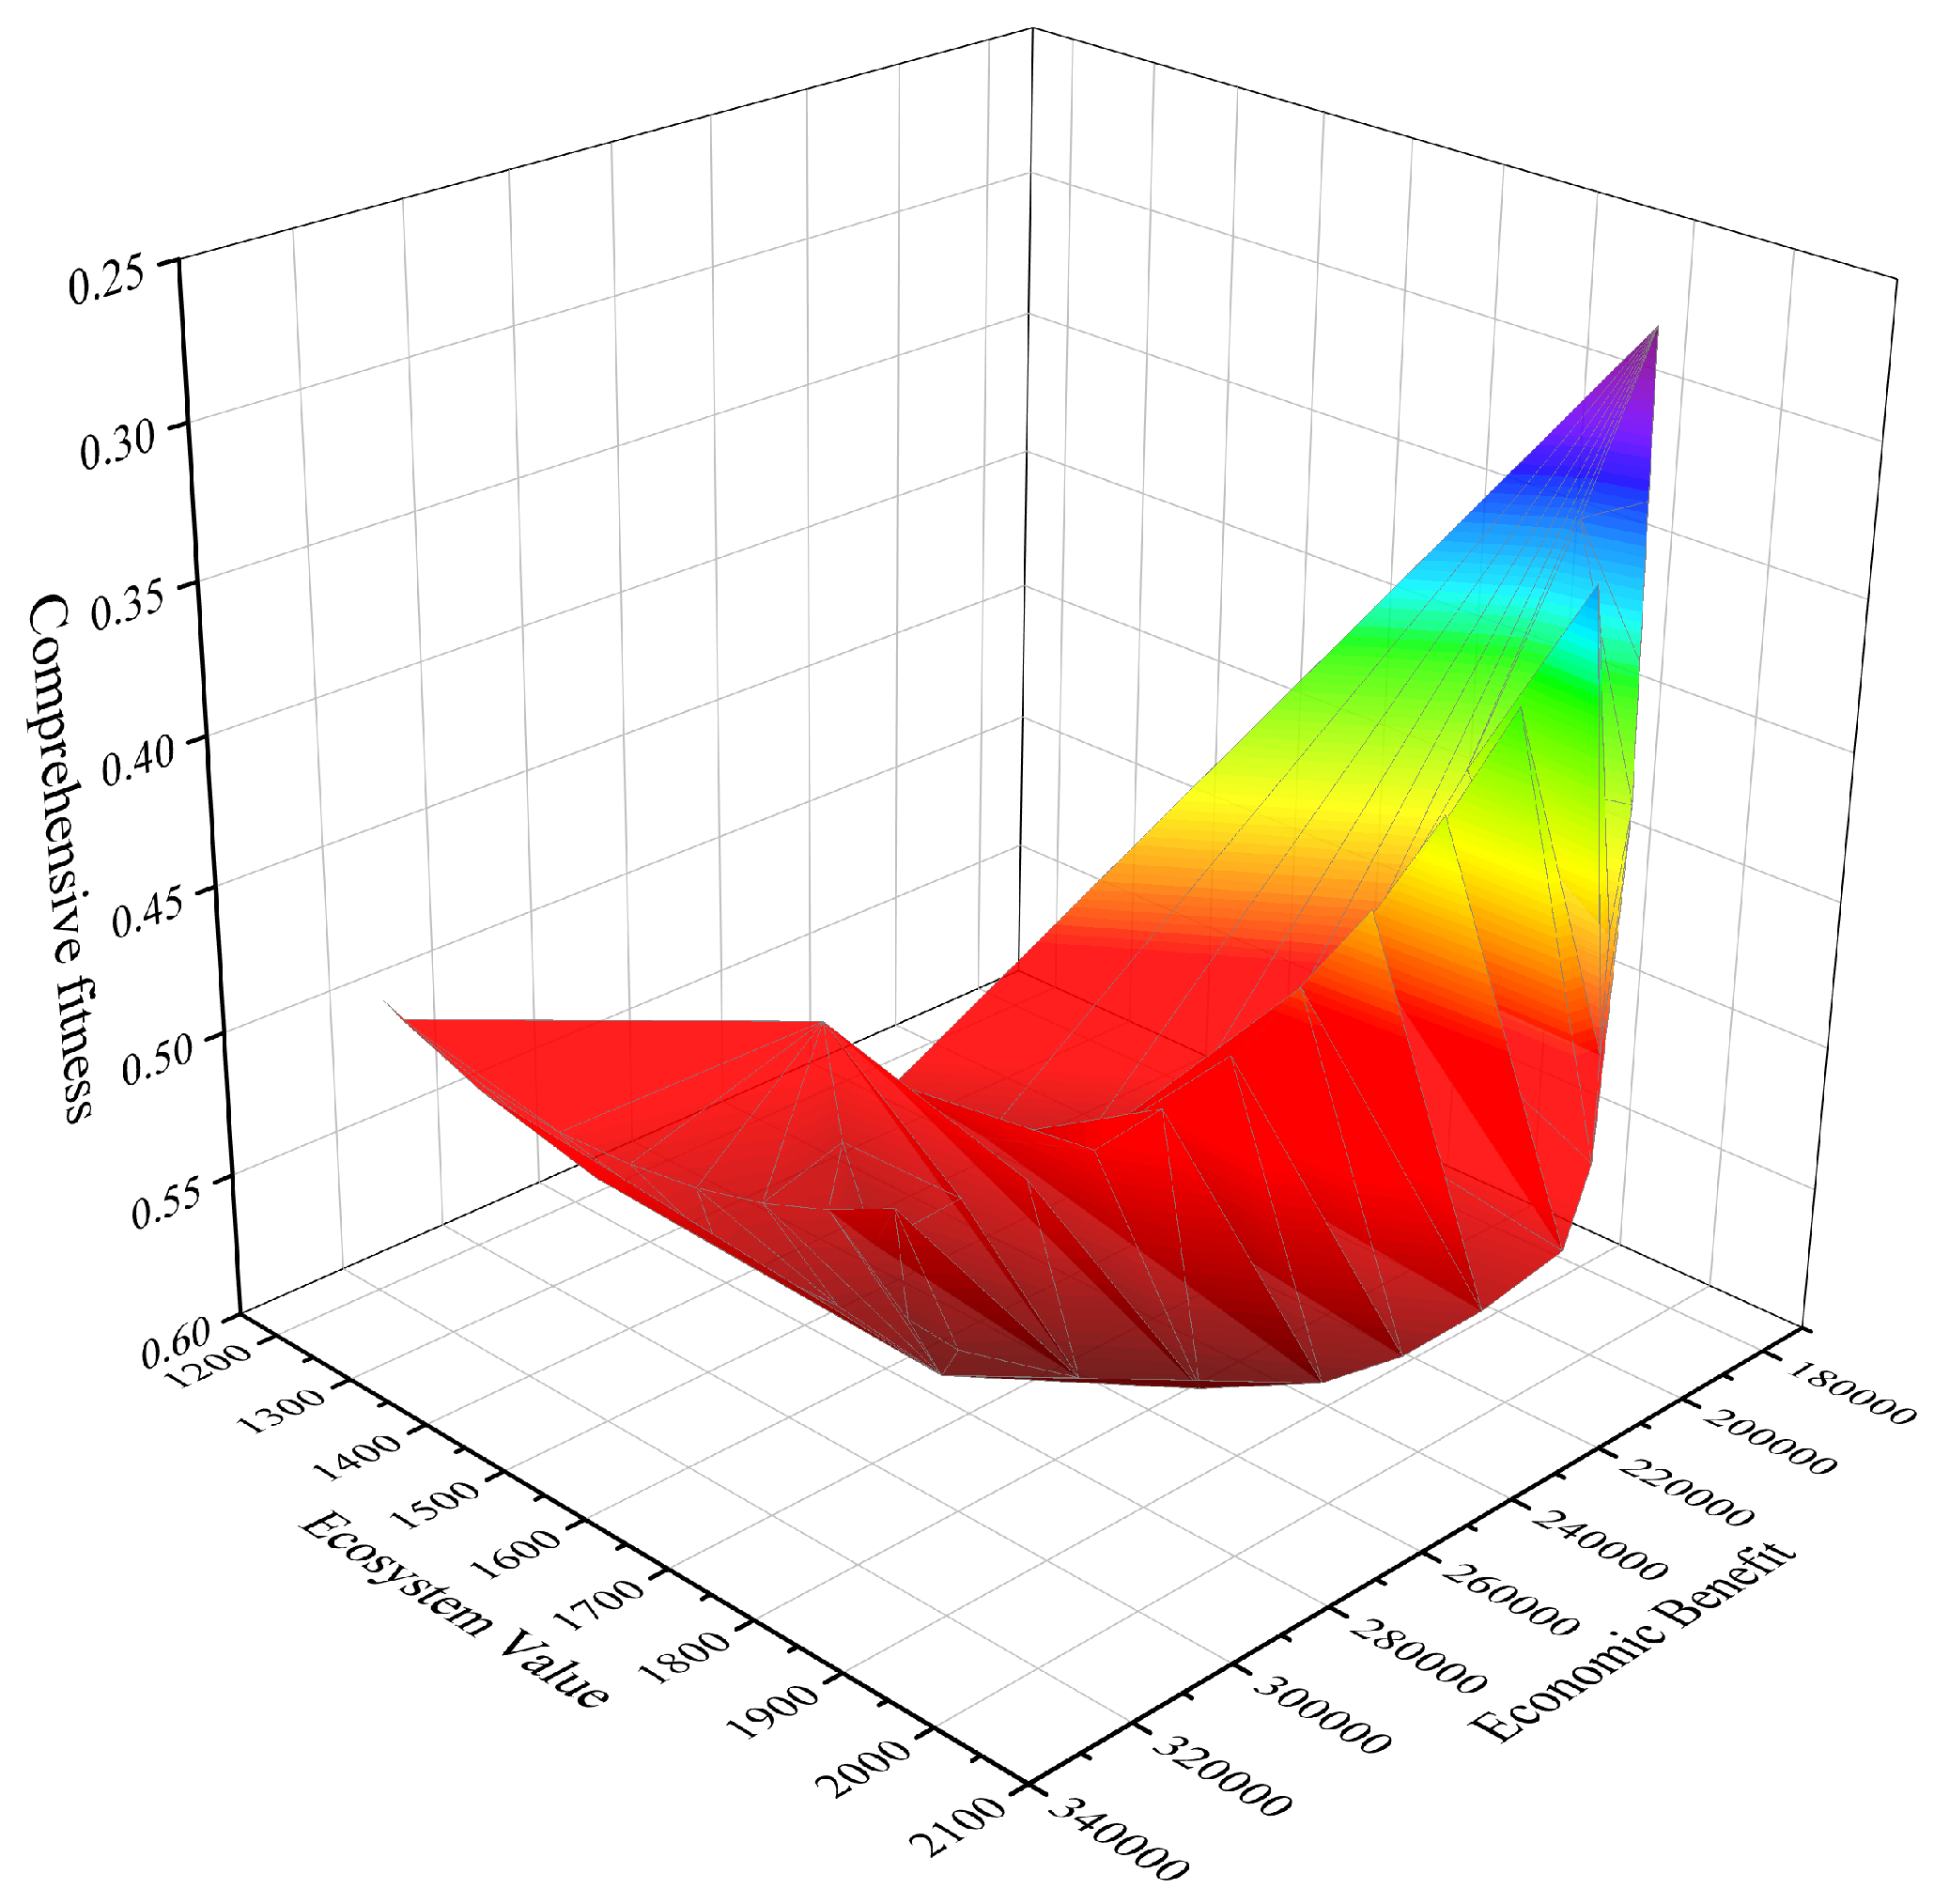
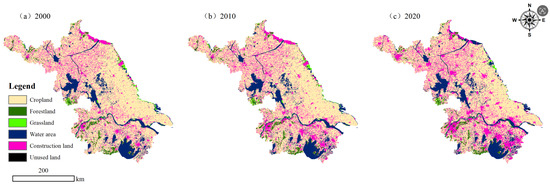
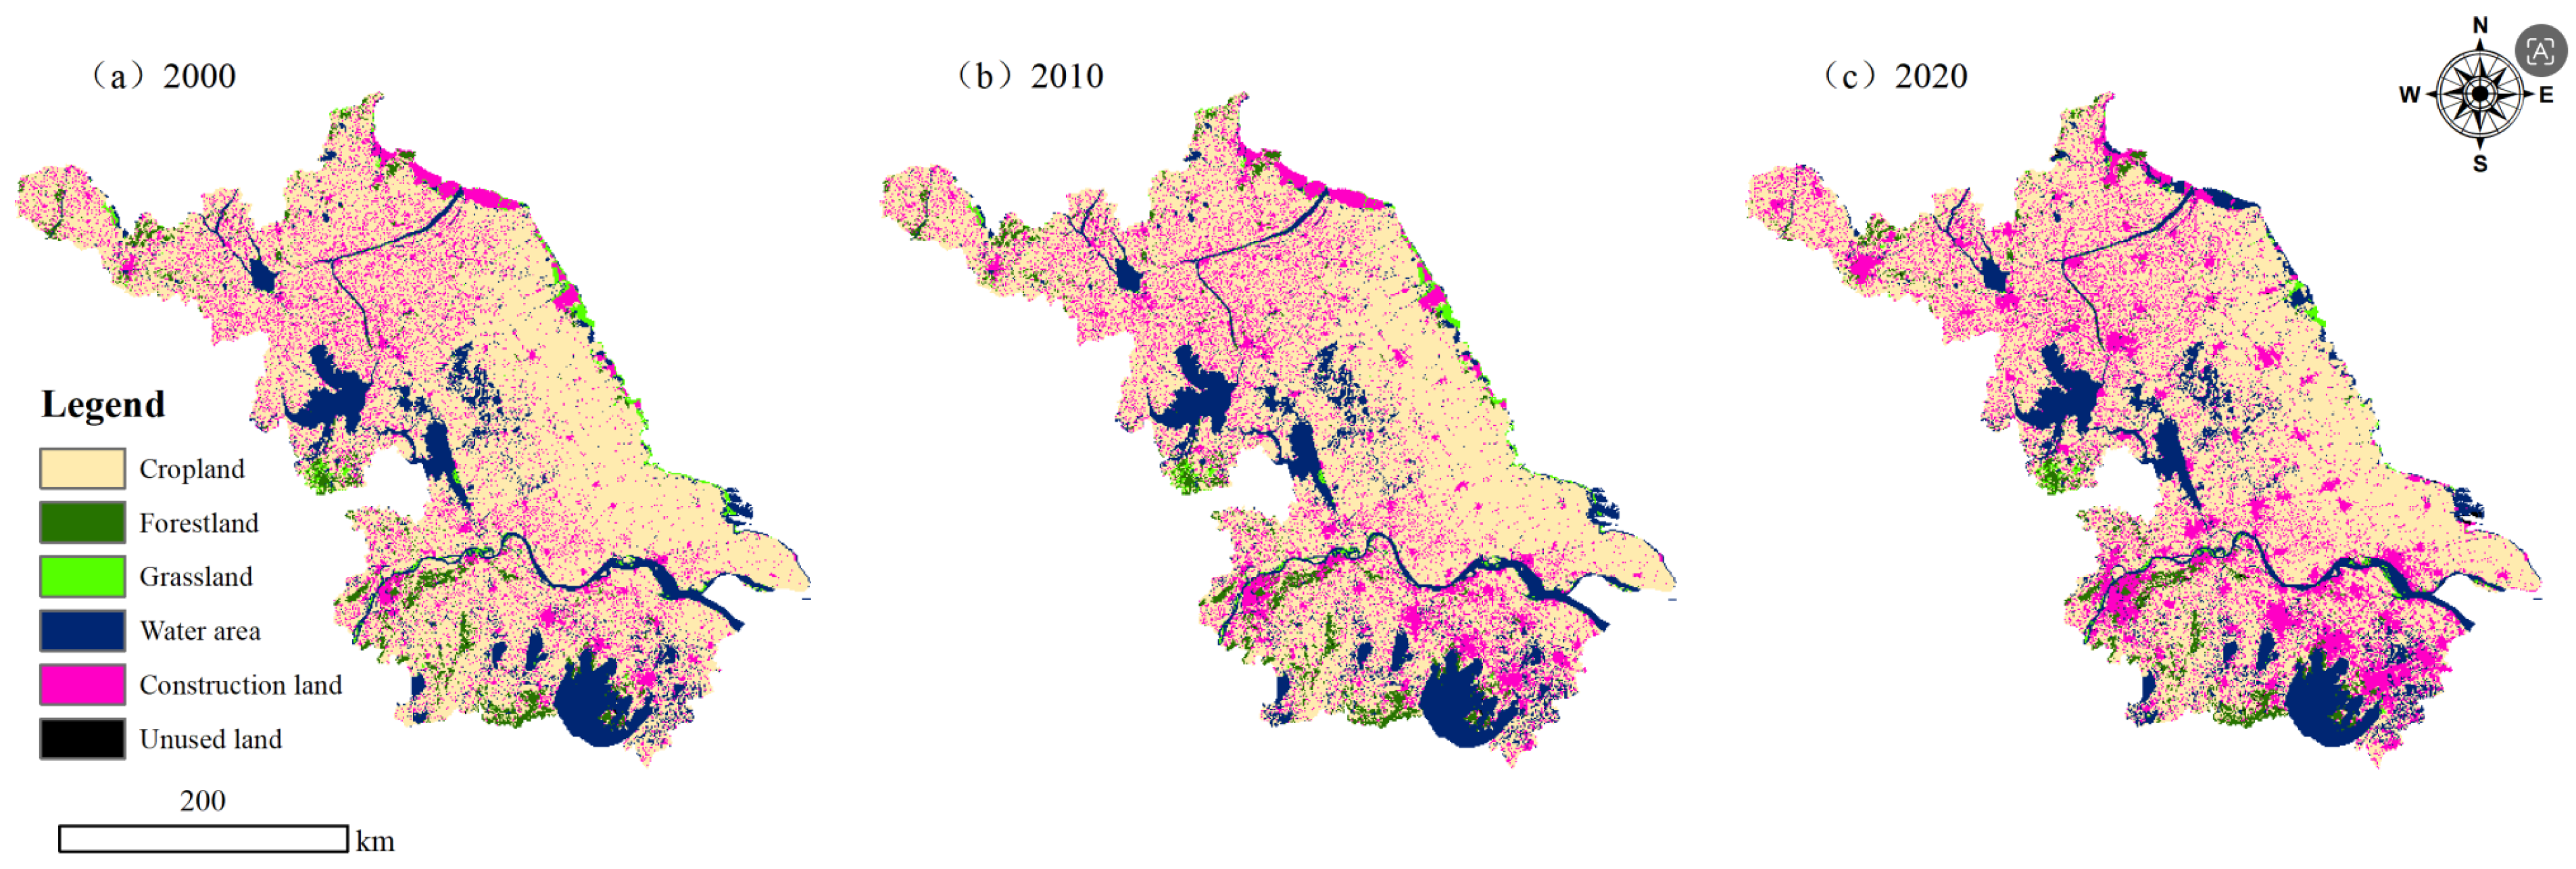
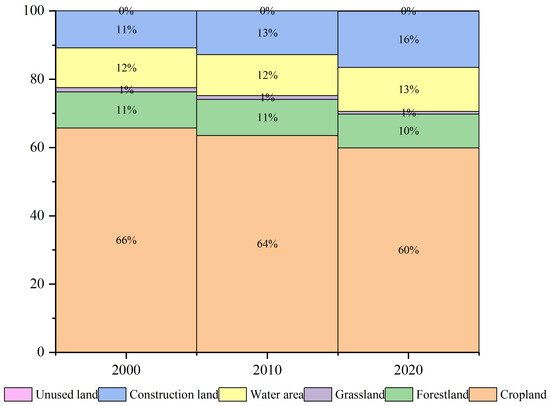
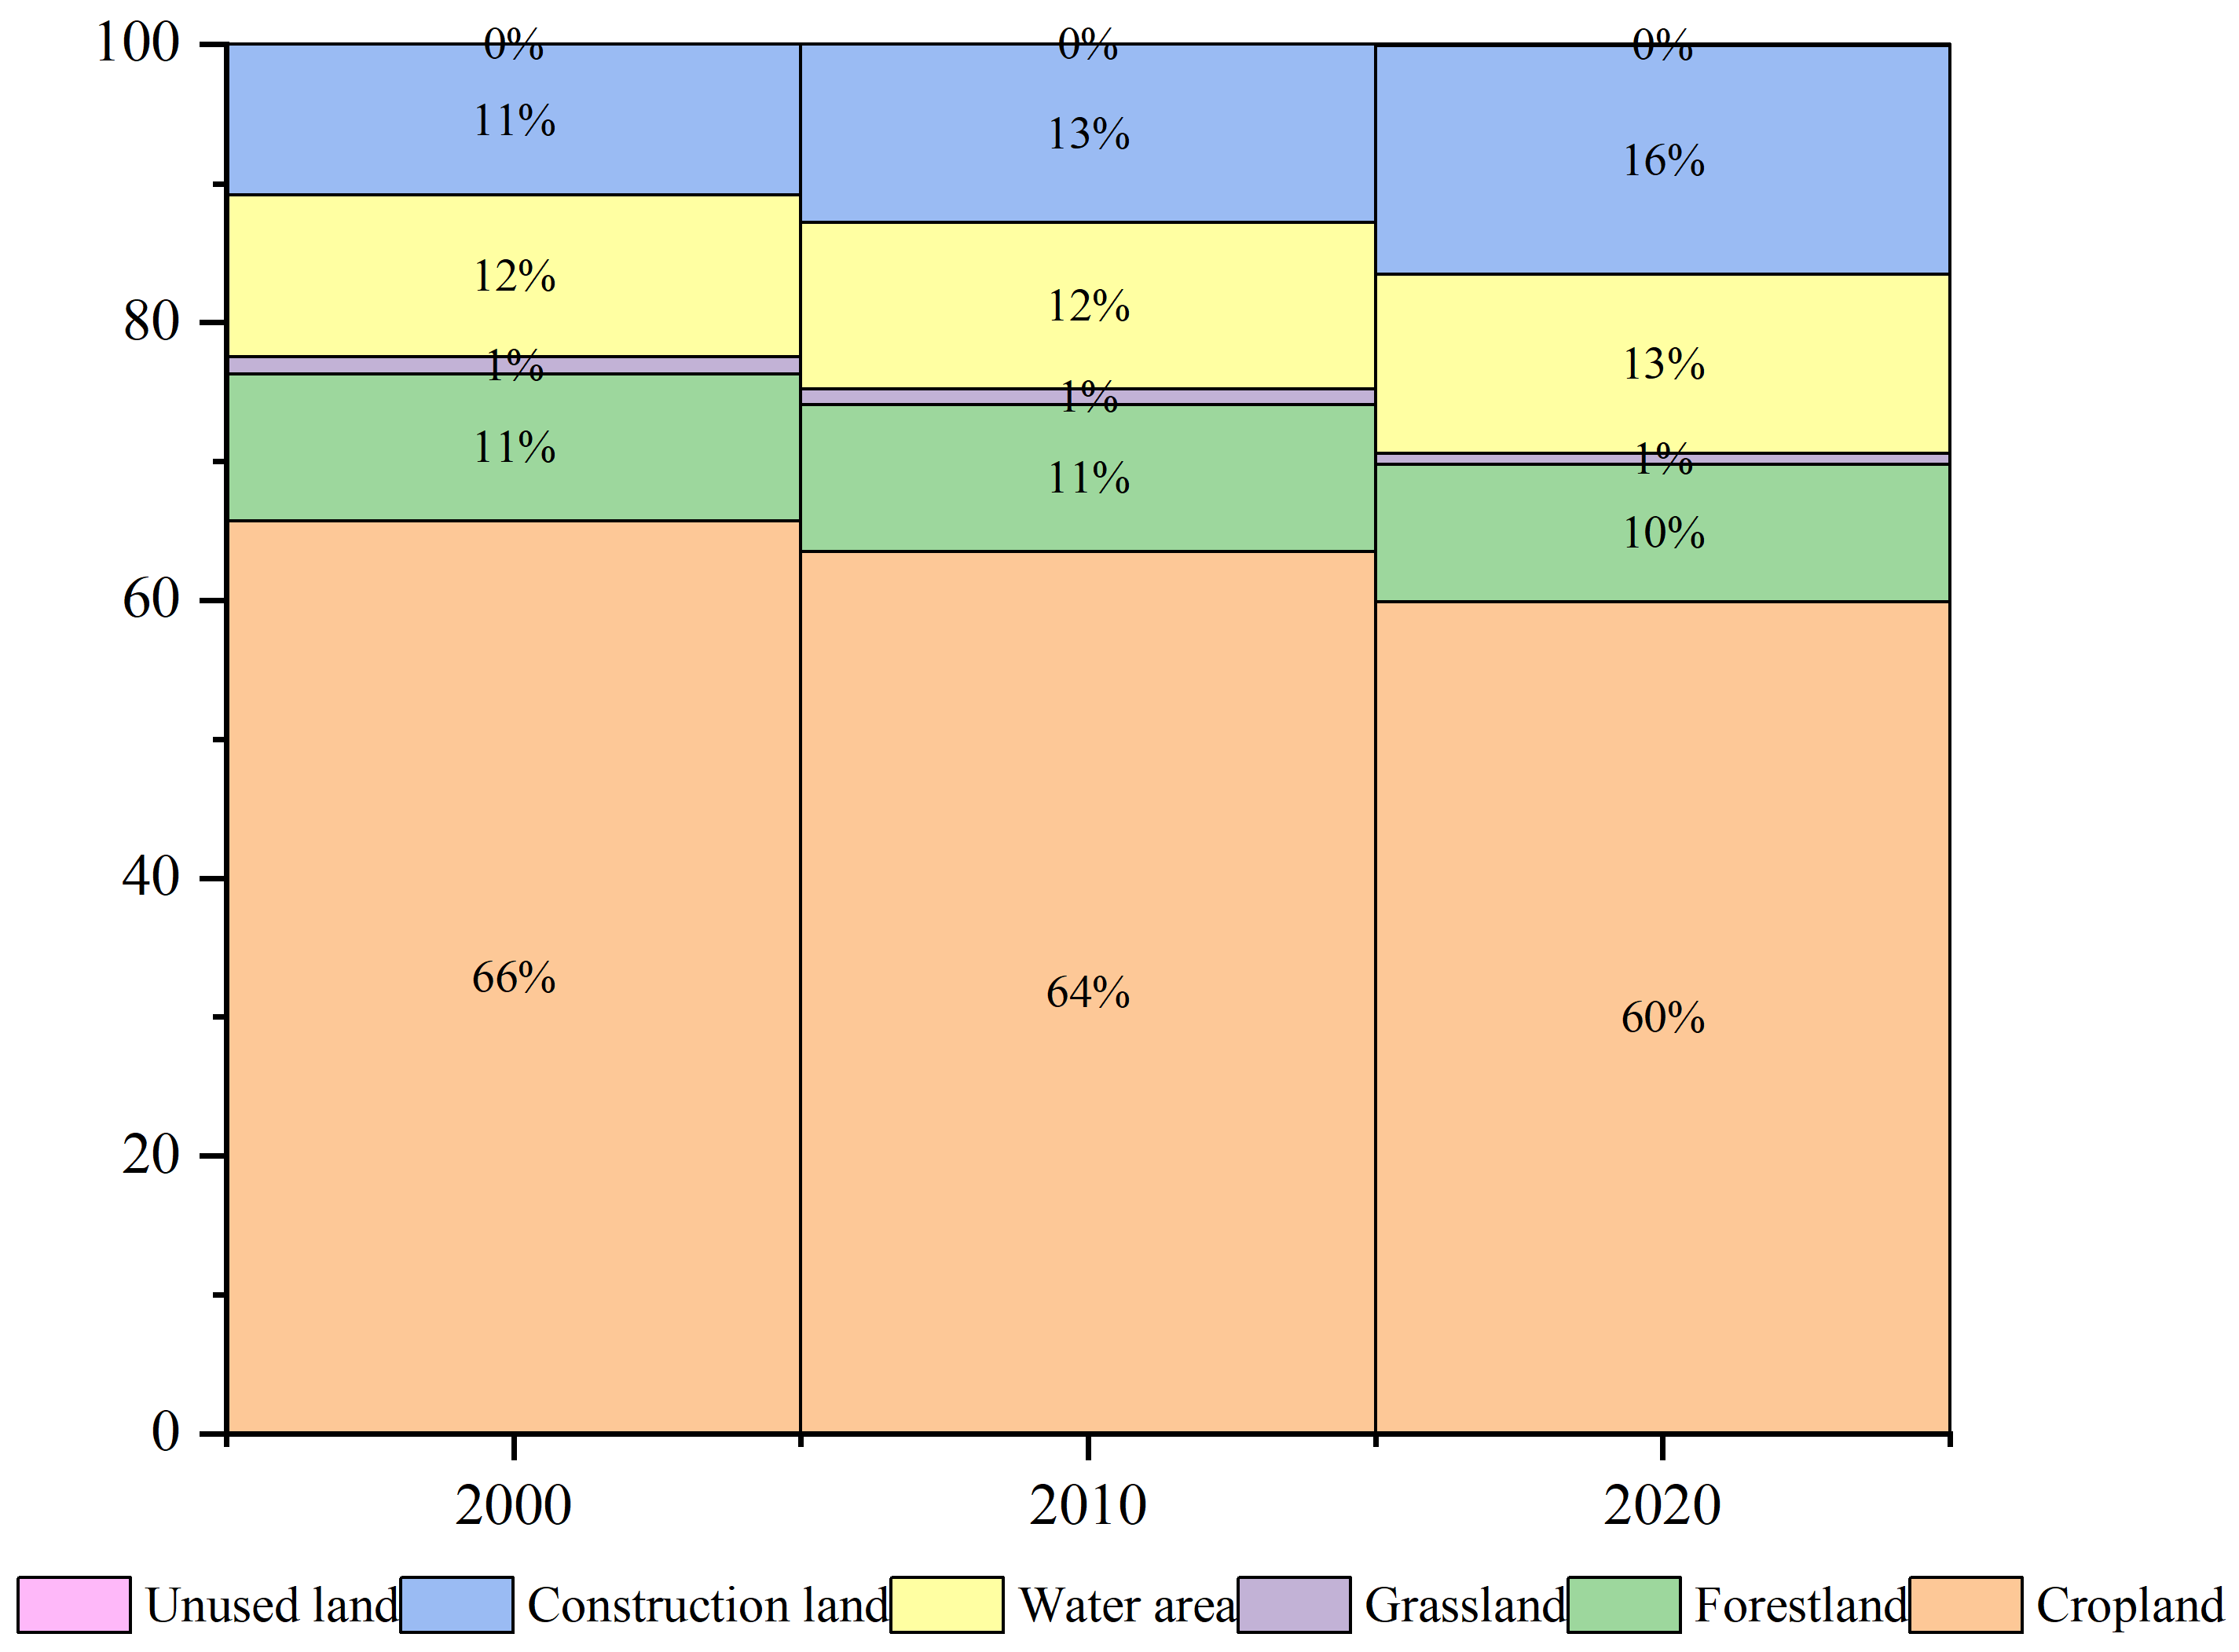
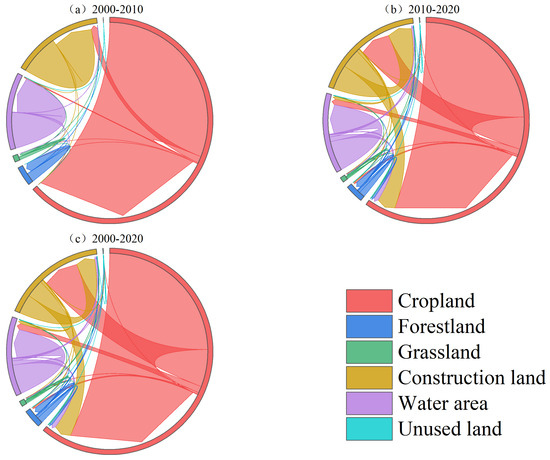
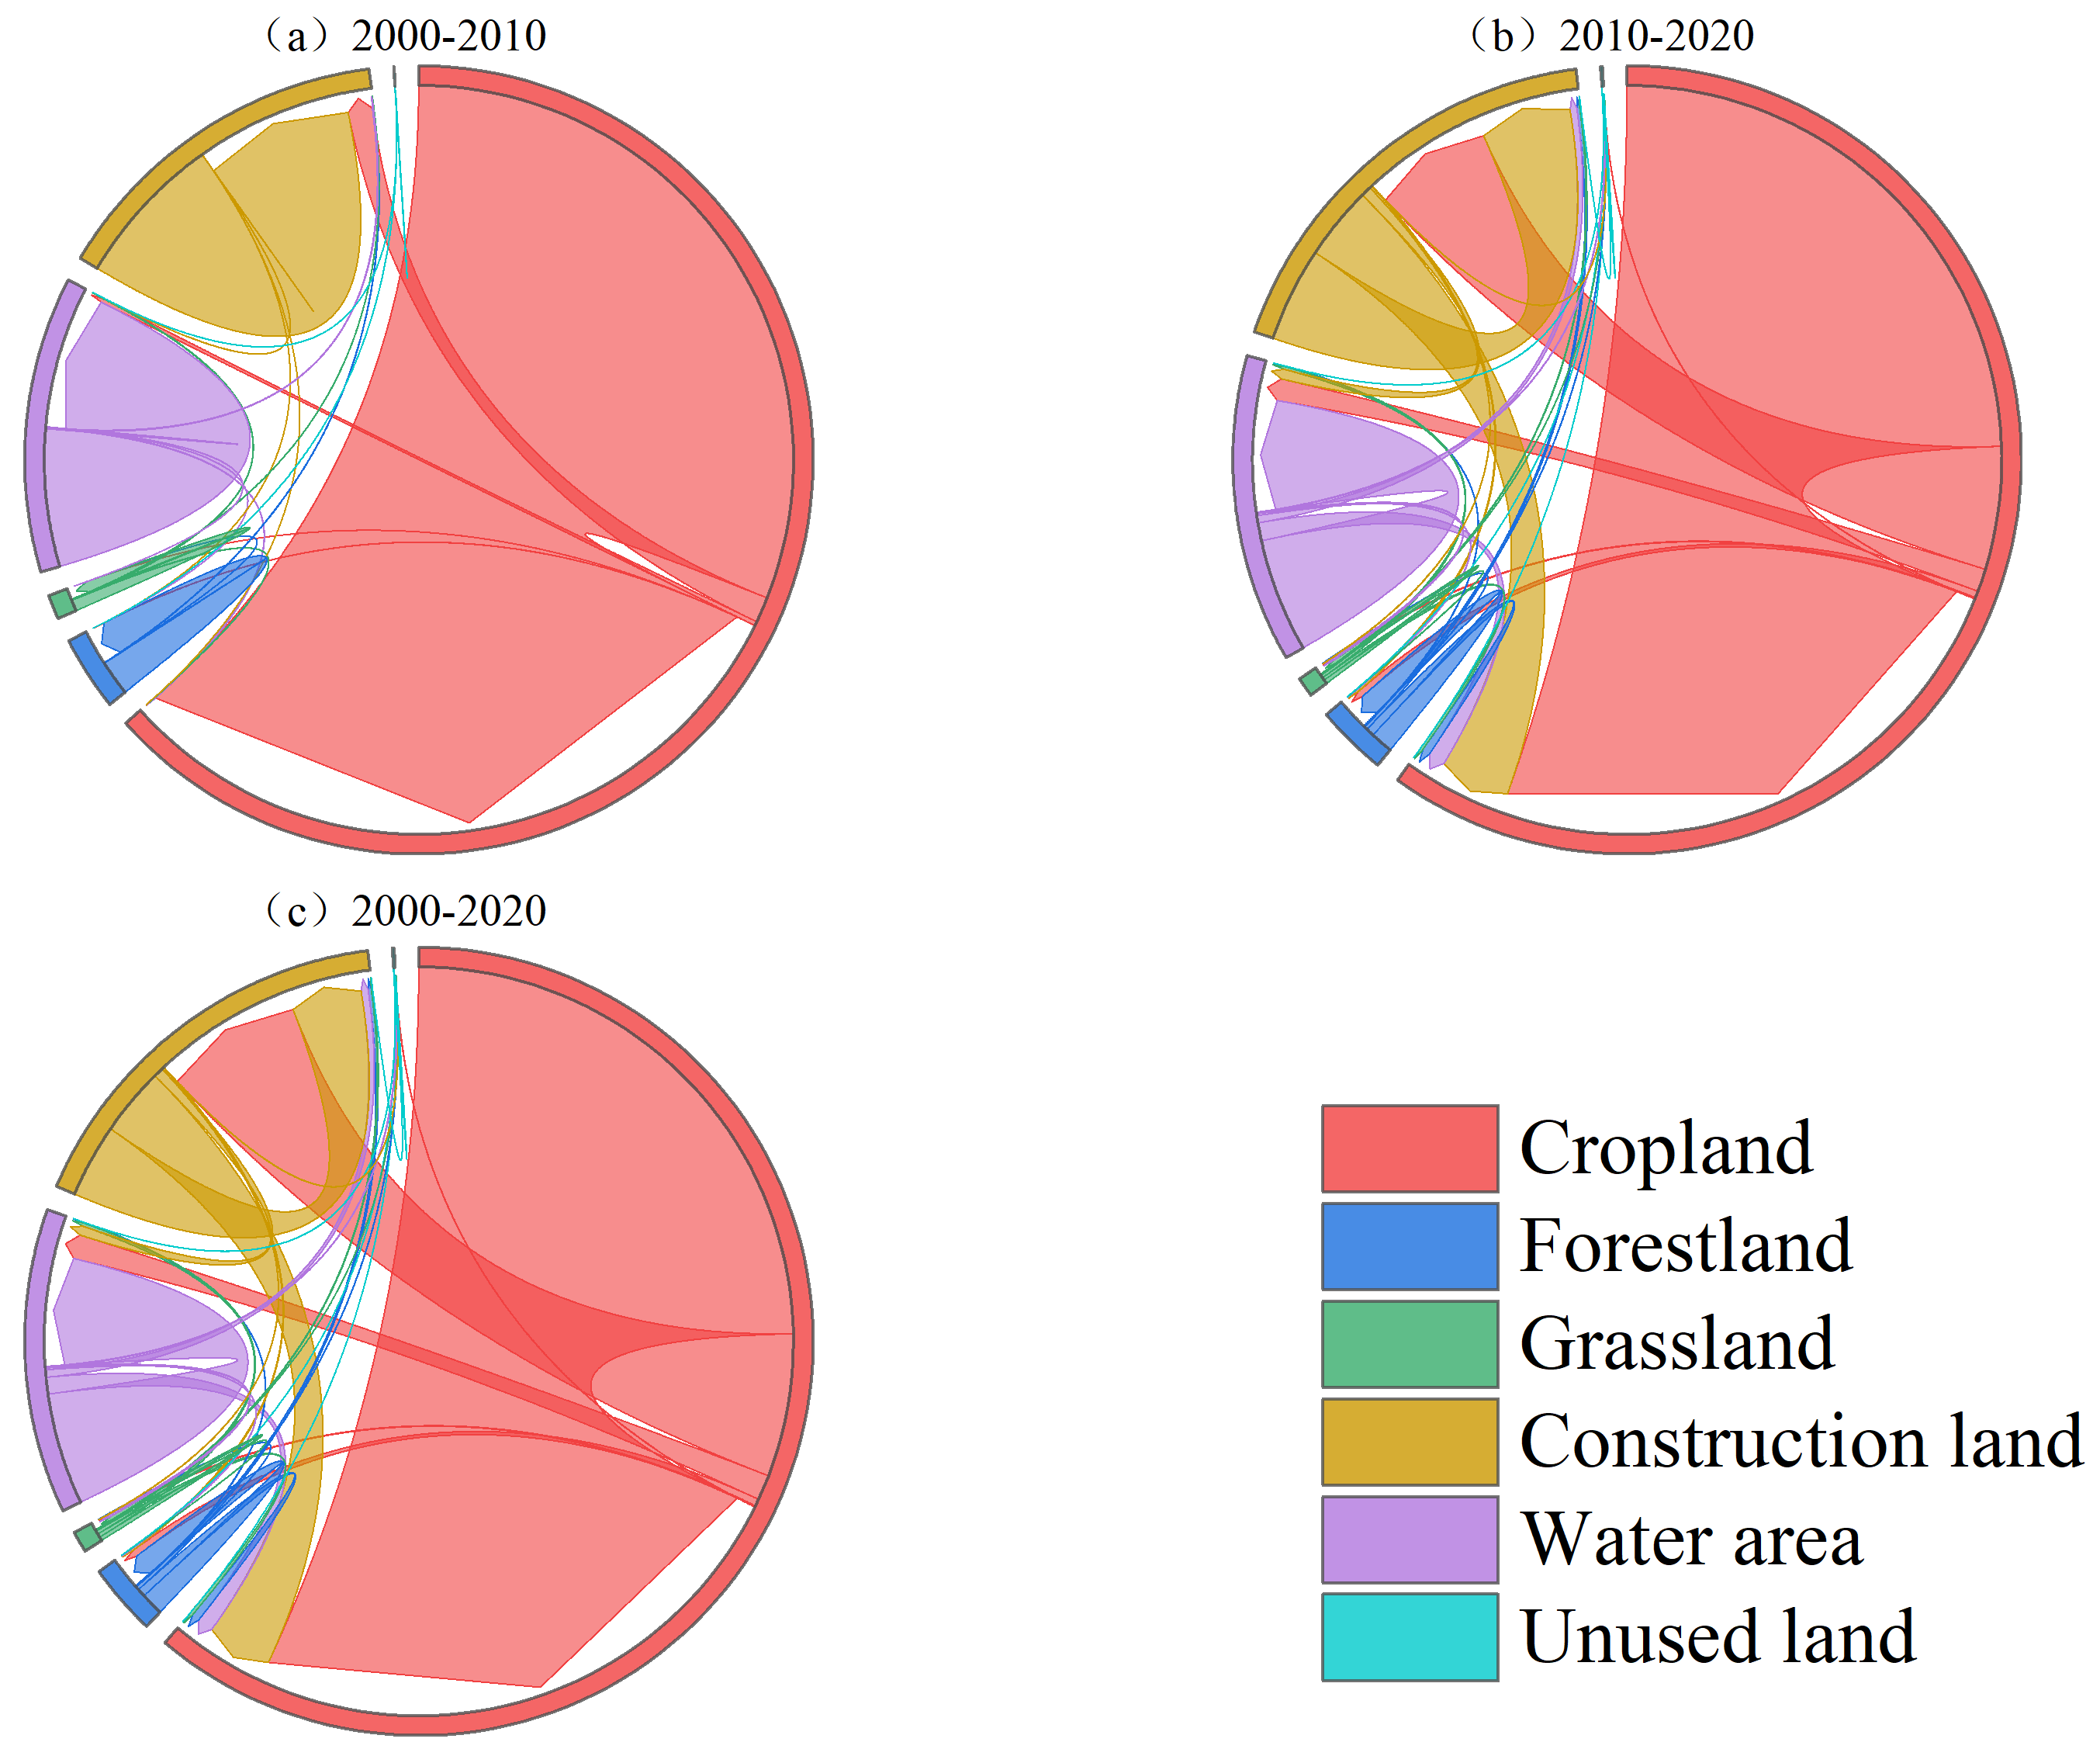
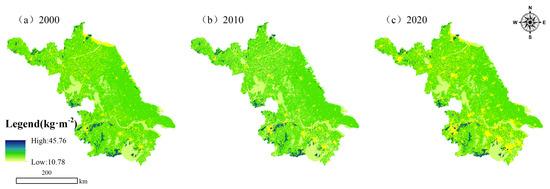
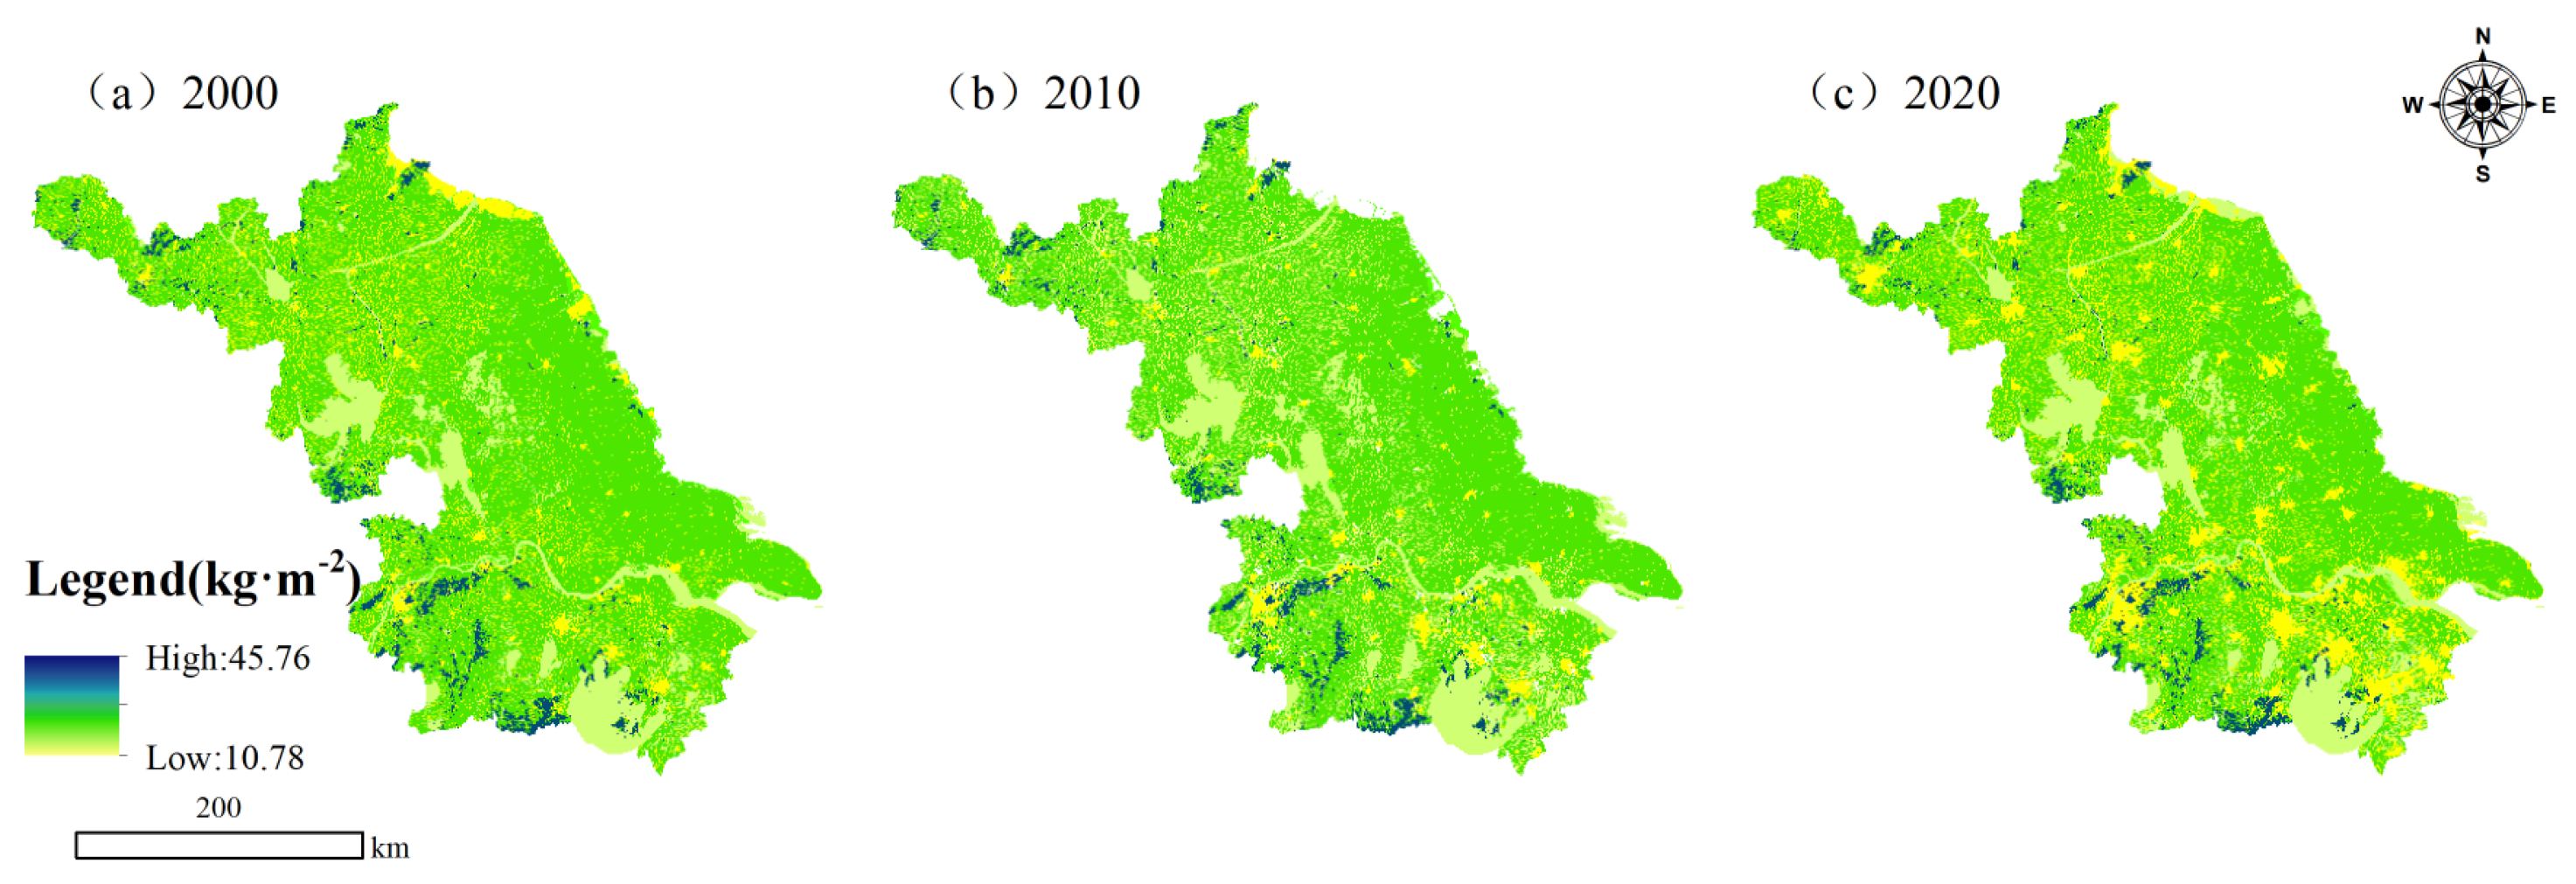
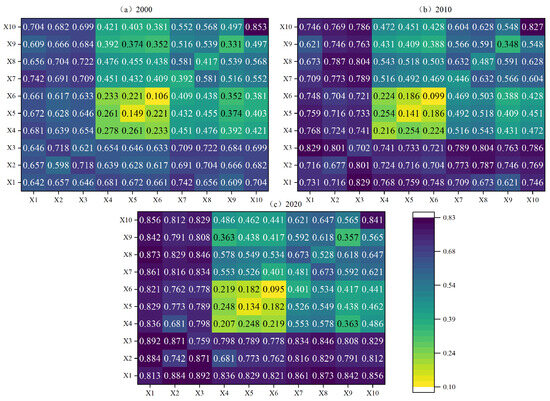
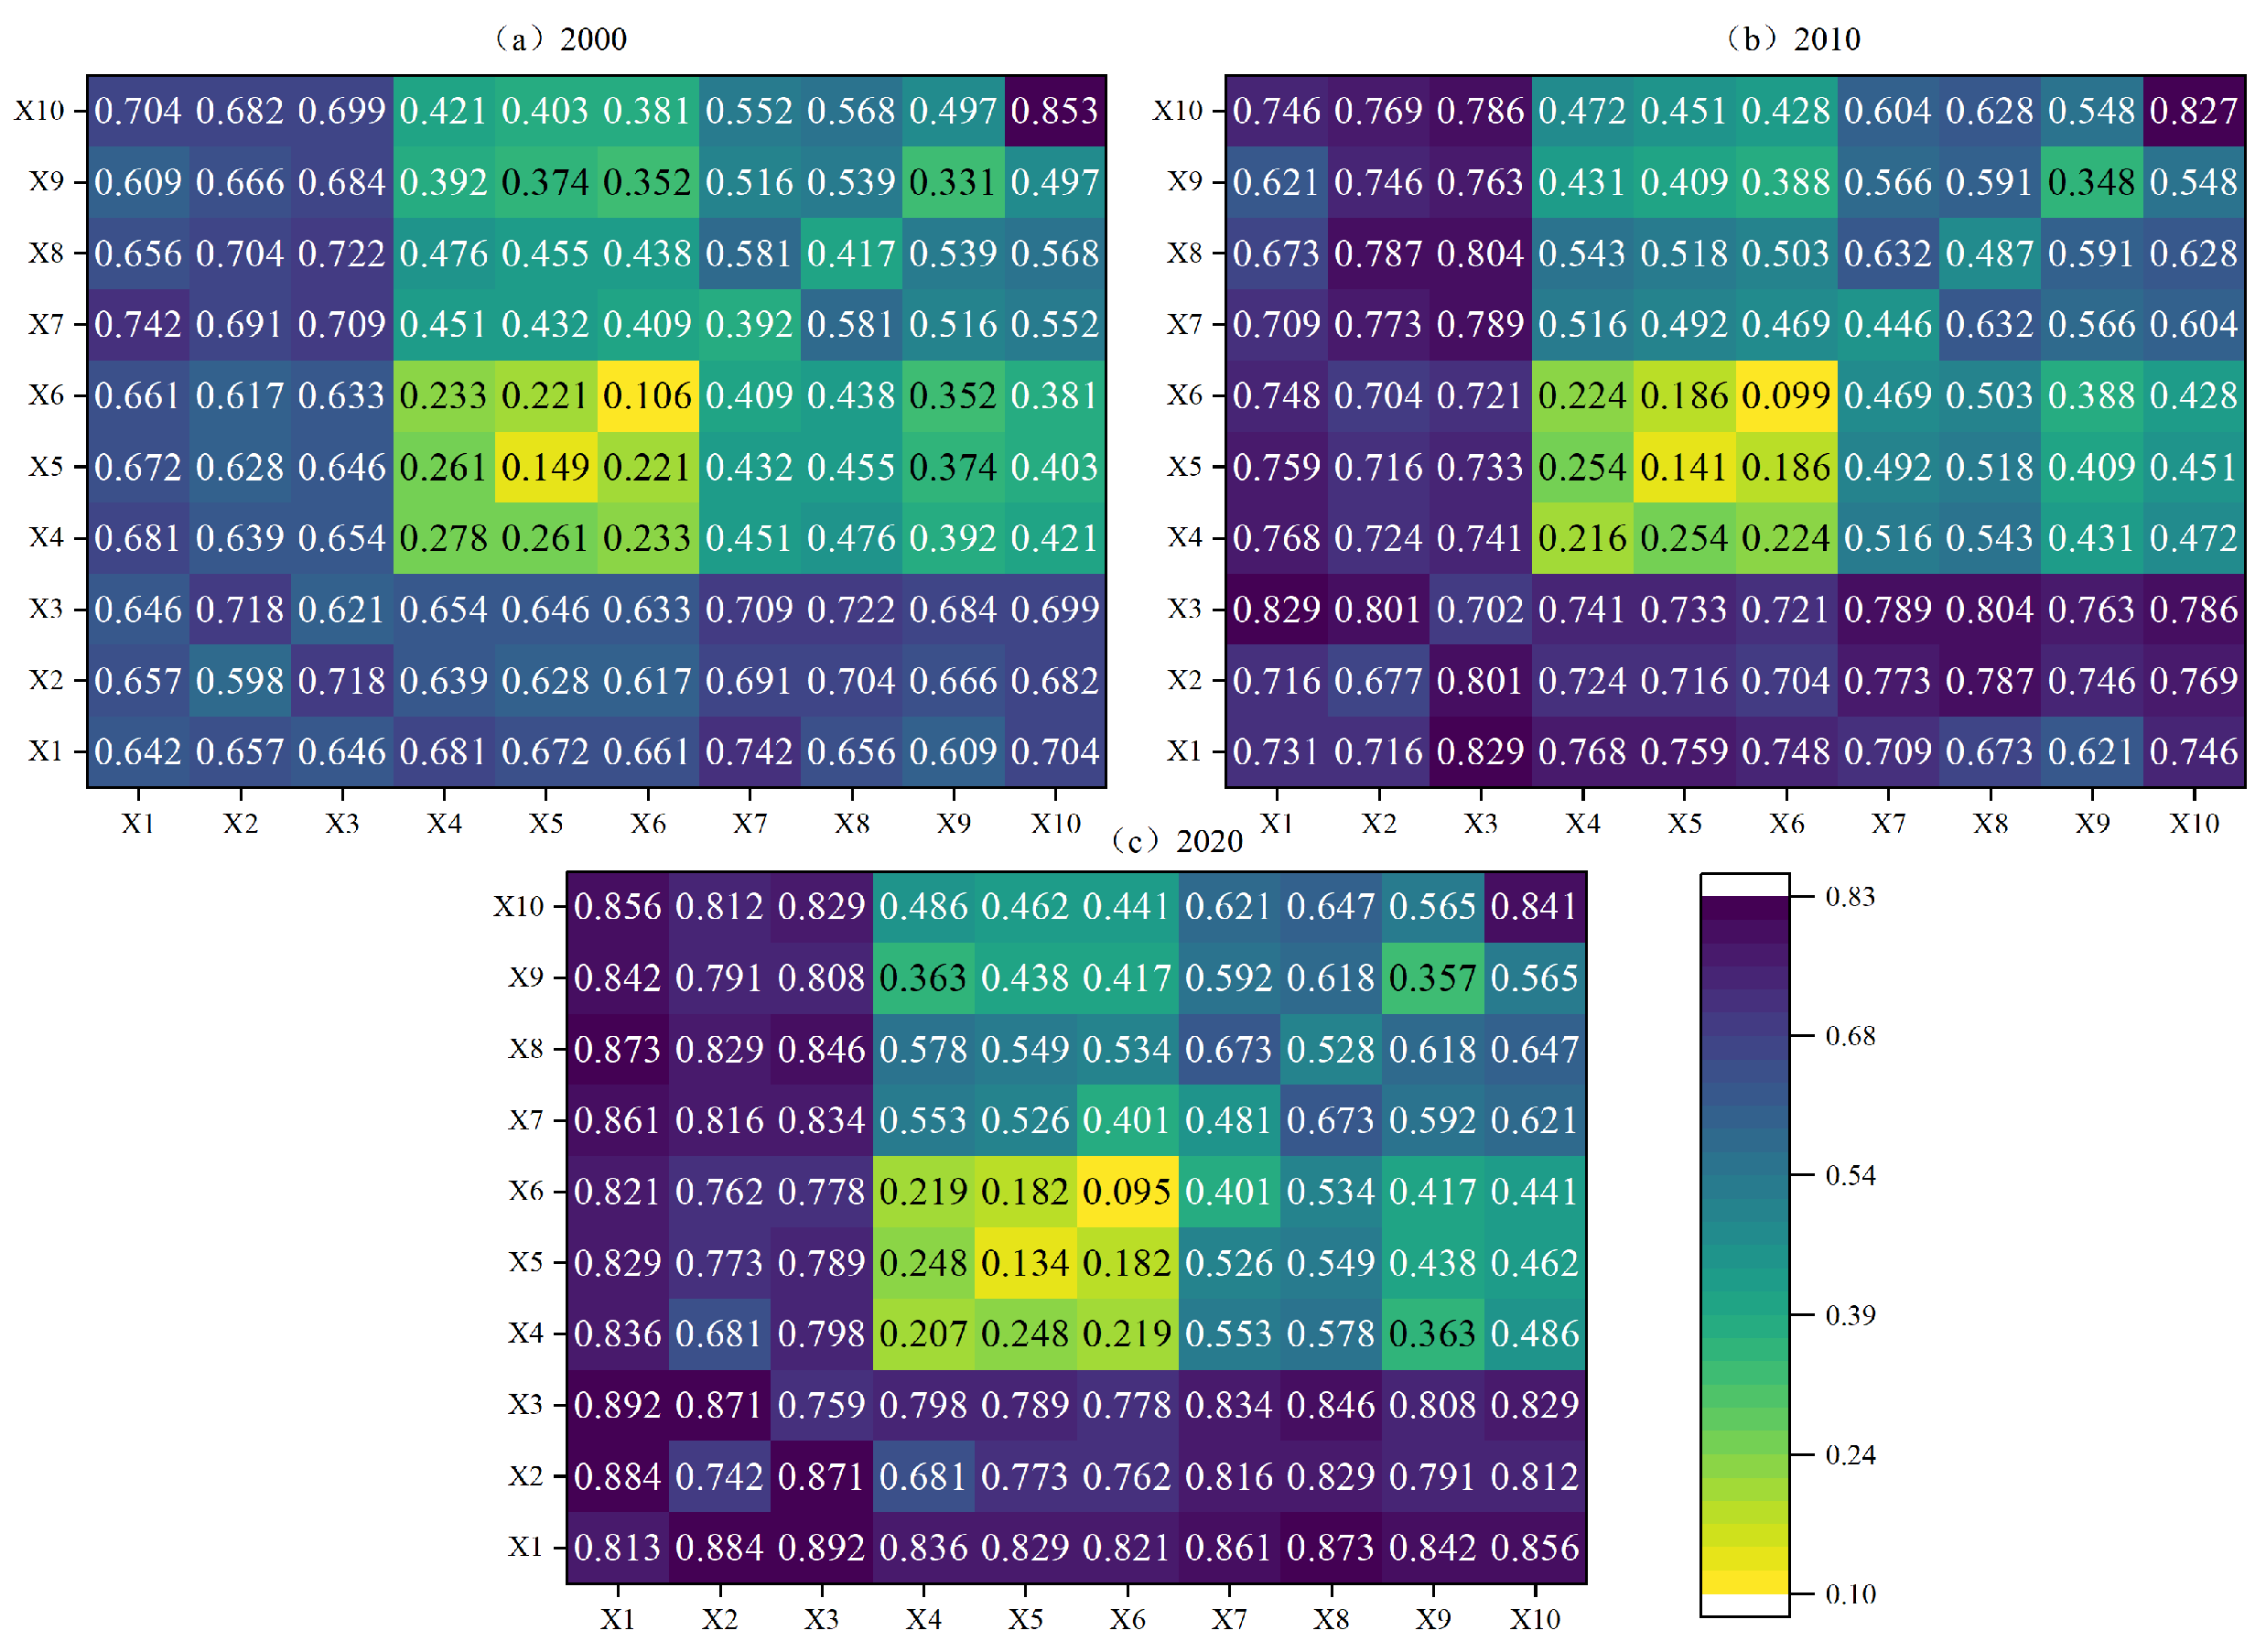
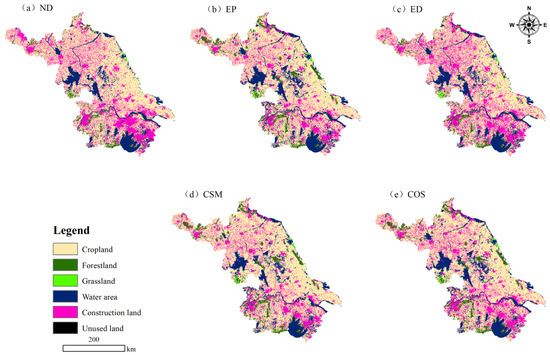
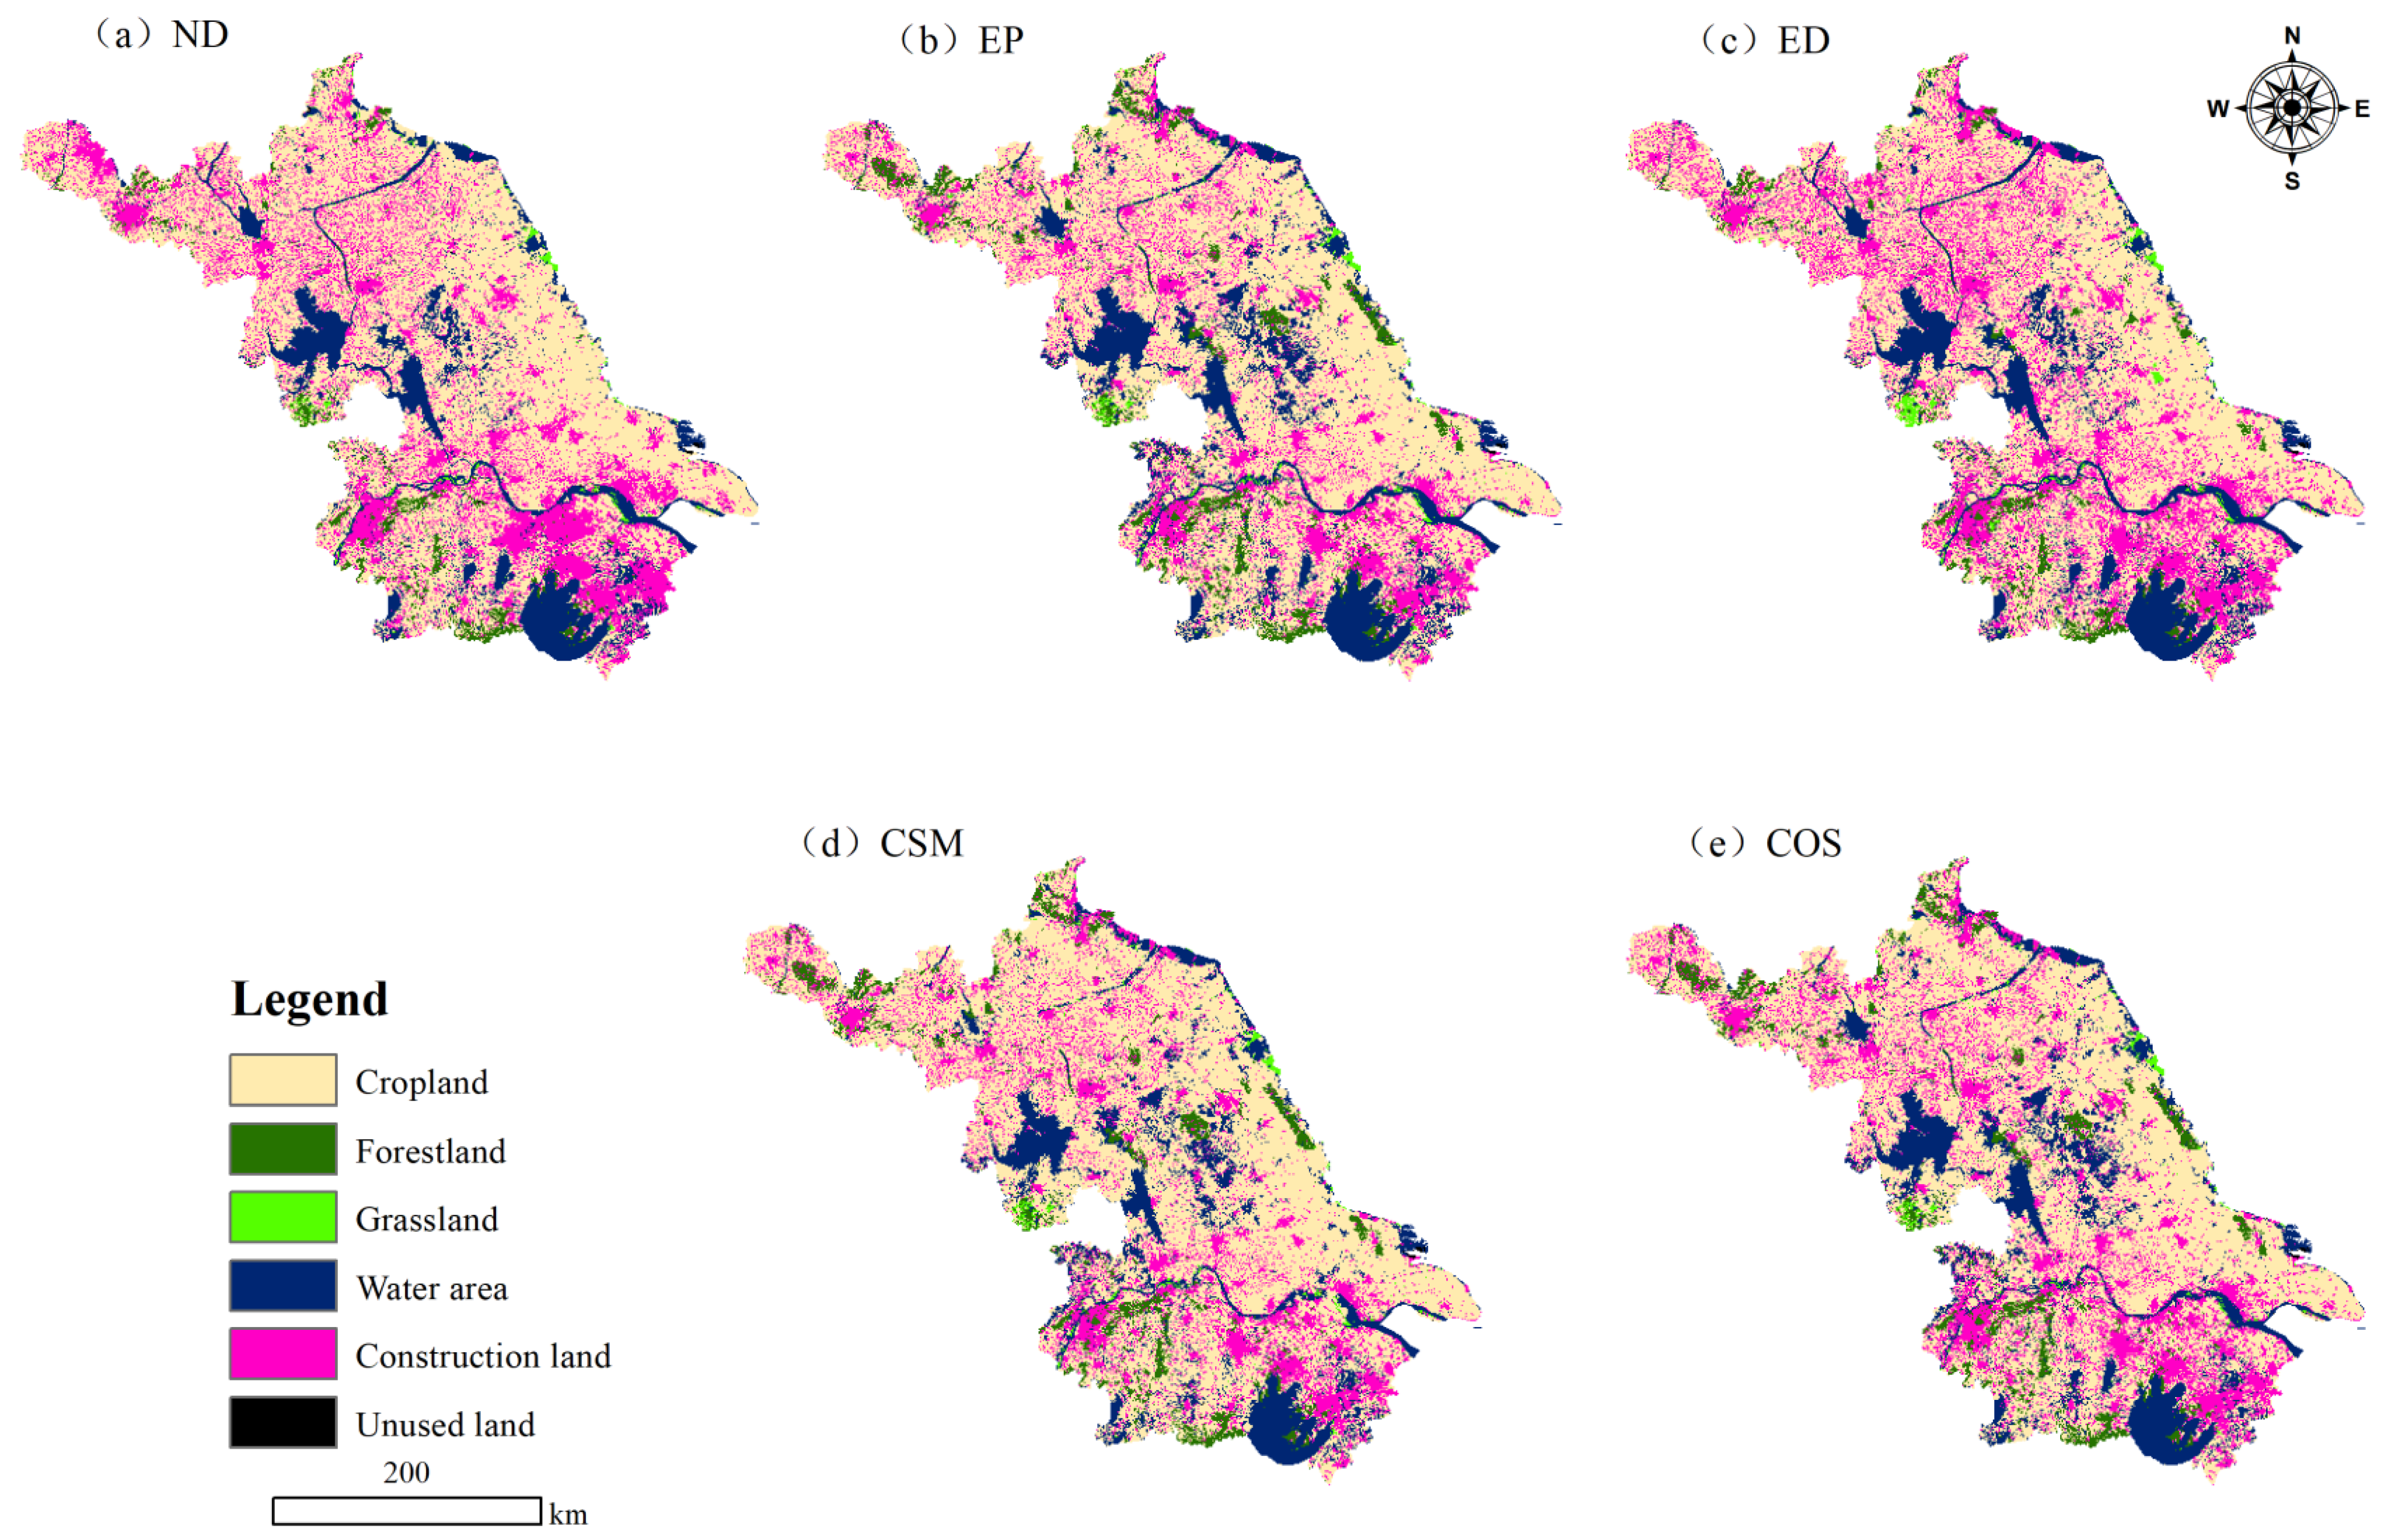

Disclaimer/Publisher’s Note: The statements, opinions and data contained in all publications are solely those of the individual author(s) and contributor(s) and not of MDPI and/or the editor(s). MDPI and/or the editor(s) disclaim responsibility for any injury to people or property resulting from any ideas, methods, instructions or products referred to in the content. |
© 2026 by the authors. Licensee MDPI, Basel, Switzerland. This article is an open access article distributed under the terms and conditions of the Creative Commons Attribution (CC BY) license.