Article

Deep Learning-Based Monitoring of Tea Plant Growth and Nitrogen Status Using UAV Multisource Remote Sensing Features


1
College of Horticulture, Nanjing Agricultural University, Nanjing 210095, China
2
National Engineering and Technology Center for Information Agriculture, MOE Engineering Research Center of Smart Agricultural, MARA Key Laboratory for Crop System Analysis and Decision Making, Jiangsu Key Laboratory for Information Agriculture, Institute of Smart Agriculture, Nanjing Agricultural University, Nanjing 210095, China
*
Author to whom correspondence should be addressed.
These authors contributed equally to this work.
Remote Sens. 2026, 18(17), 2923; https://doi.org/10.3390/rs18172923
Submission received: 13 June 2026 / Revised: 17 August 2026 / Accepted: 18 August 2026 / Published: 1 September 2026
(This article belongs to the Special Issue Near Real-Time (NRT) Agriculture Monitoring)

Highlights

What are the main findings?
  • Multi-domain fusion indices integrating spectral, texture, and harmonic features improved tea plant biomass and nitrogen accumulation estimation over conventional spectral indices.
  • Deep learning models effectively integrated UAV-derived multi-domain features for estimating tea plant biomass and nitrogen accumulation.
What are the implications of the main findings?
  • Multi-feature fusion enhances UAV-based monitoring of tea plant biomass and nitrogen status by exploiting complementary multispectral information.
  • Spatial prediction maps revealed substantial spatial heterogeneity and interannual variation in tea plant biomass and nitrogen status.

Abstract

Accurate and efficient monitoring of tea plant growth parameters via remote sensing is essential for precision plantation management. However, spectral indices relying solely on reflectance often exhibit limited sensitivity in capturing complex tea canopy characteristics. This study developed a data-driven framework integrating spectral reflectance, frequency-domain harmonic components, and spatial texture features to construct tri-feature fusion indices (TFIs) and establish machine learning and deep learning models for tea growth monitoring. Ten-band multispectral imagery was acquired using a UAV alongside synchronous field measurements of leaf and plant biomass and nitrogen accumulation. TFIs were constructed through exhaustive feature combinations and optimized via a data-driven search strategy. Subsequently, random forest (RF), multilayer perceptron (MLP), convolutional neural network (CNN), and transformer models were evaluated using a leave-one-site-out cross-validation (LOSO-CV) strategy. The selected TFIs showed strong associations with tea growth parameters within the investigated dataset, with R2 values up to 0.63 and 0.62 for leaf dry matter and leaf nitrogen accumulation, respectively. Models incorporating selected TFIs achieved cross-validated R2 values of 0.56 for leaf dry matter (MLP), 0.59 for plant dry matter (MLP), 0.73 for leaf nitrogen accumulation (MLP), and 0.68 for plant nitrogen accumulation (CNN). These models exhibited competitive predictive performance comparable to RF, although no statistically significant differences in mean absolute error were observed under site-held-out evaluation. Furthermore, model-derived spatial maps provided insights into fine-scale spatial heterogeneity and potential interannual variations in tea growth parameters across representative plantations from 2024 to 2025. Overall, this study provides a UAV-based framework for tea growth parameter estimation by integrating multi-domain information without requiring additional environmental observations.

1. Introduction

Tea plants with a high nitrogen demand rely heavily on optimal nitrogen fertilization for their growth and yield formation [1]. However, inadequate knowledge of crop nitrogen requirements and fertilization dynamics has resulted in excessive nitrogen application in approximately 36% of tea plantations in China. This overuse not only decreases the nitrogen use efficiency, but also induces severe environmental impacts, including soil acidification, water contamination, and greenhouse gas emissions [2]. Consequently, real-time and non-destructive monitoring of key growth parameters, such as biomass and nitrogen accumulation, is essential for precision nitrogen management and the sustainable, low-carbon development of the tea industry.
Traditional crop growth monitoring primarily relies on destructive field sampling and laboratory-based chemical analysis. Although these methods provide highly accurate physiological measurements, they are labor-intensive and temporally delayed, making them difficult to implement at large scales [3,4]. Remote sensing technologies enable efficient and non-destructive monitoring of crop growth. Compared with satellite-based remote sensing, which is often constrained by cloud contamination and long revisit intervals, low-altitude unmanned aerial vehicle (UAV) platforms offer distinct advantages, including high flexibility, low operational cost, and centimeter-level ultra-high spatial resolution, making them particularly suitable for capturing subtle variations in canopy growth [5]. Vegetation indices (VIs) and spectral feature engineering from UAV imagery have been widely used to characterize crop photosynthetic activity, biomass, and nitrogen status [6,7]. However, spectral information alone primarily reflects the leaf biochemical properties and is insufficient to fully describe complex canopy structure and spatial heterogeneity. Unlike annual crops, tea plants are perennial evergreen shrubs with a complex canopy architecture characterized by the coexistence of leaves at various developmental stages and continuous seasonal flushing. Furthermore, intensive management practices like repeated pruning, combined with dense and overlapping canopies, exacerbate spectral saturation and temporal variability [8]. Consequently, relying solely on conventional reflectance-based indices is often insufficient. Therefore, integrating complementary spectral, structural, and spatial information provides a promising pathway for improving quantitative monitoring of tea plant growth.
To address these limitations, the integration of complementary information from different feature domains within and across remote sensing datasets has attracted increasing attention in recent years. Li et al. [9] demonstrated that integrating Light Detection and Ranging (LiDAR)-derived structural information with multispectral or RGB imagery significantly improved the estimation accuracy of the nitrogen nutrition index (NNI) in tea plants, highlighting the importance of structural information in addition to spectral characteristics. In addition, texture features, which quantify spatial heterogeneity, can capture fine-scale canopy structural variations associated with differences in branch distribution and leaf density. The integration of texture and spectral features has been widely shown to alleviate spectral saturation effects in dense canopies while providing complementary biophysical information [10,11]. Previous studies have demonstrated the potential of hyperspectral and UAV remote sensing approaches for estimating tea plant growth parameters. Jiang et al. [12] developed hyperspectral-based models for estimating tea plant biomass and nitrogen accumulation by extracting informative spectral features and combining them with machine learning algorithms. Although hyperspectral measurements provide abundant spectral information and achieved promising prediction performance, the requirement for specialized instruments and point-scale data acquisition limits their operational application for large-scale plantation monitoring. Furthermore, Jiang et al. [13] developed a UAV-based framework for tea growth monitoring by integrating multispectral features, texture and color information, and meteorological variables with machine learning algorithms and parameter optimization strategies. Their study demonstrated the potential of combining UAV-derived information with environmental factors for estimating tea plant leaf dry matter and nitrogen accumulation, providing an important foundation for UAV-based precision management of tea plantations. However, this framework primarily explored the benefits of integrating UAV-derived information with external environmental variables and optimized machine learning models for improving prediction accuracy. In contrast, the present study investigates whether the intrinsic information contained within a single UAV multispectral dataset can be further exploited through the construction of compact multi-domain indices integrating spectral, textural, and harmonic information. Therefore, rather than relying on additional environmental observations, this study aims to improve the information utilization efficiency of conventional UAV multispectral imagery by transforming heterogeneous intrinsic features into interpretable empirical indices.
Acquiring comprehensive multi-domain features is only the first step; effectively translating these heterogeneous datasets into accurate agricultural parameters requires robust modeling strategies. Traditional machine learning algorithms, such as random forest (RF), have demonstrated strong performance in crop parameter estimation by effectively handling general nonlinear relationships [14]. However, when dealing with highly heterogeneous feature representations integrating spectral, textural, and harmonic information, conventional ensemble models may have limited capacity to explicitly characterize complex higher-order interactions among different feature domains. With the advancement of artificial intelligence, deep learning architectures, including multilayer perceptrons (MLPs) [15], convolutional neural networks (CNNs) [16,17], and transformers [18,19], have increasingly been explored in remote sensing inversion studies. Their hierarchical representation learning and nonlinear approximation capabilities provide an alternative framework for extracting latent patterns from complex fused datasets. Nevertheless, considering the limited sample sizes commonly encountered in agricultural remote sensing studies, the effectiveness of deep learning models remains dependent on appropriate model complexity control and rigorous validation strategies to ensure reliable and transferable predictions.
Building upon previous UAV-based tea monitoring studies, this study aims to develop a UAV-only feature construction strategy that maximizes the utilization of intrinsic information within standard multispectral imagery. By exploiting complementary information from the spectral, textural, and harmonic domains, this study focuses on establishing interpretable data-driven tri-feature fusion indices (TFIs). Specifically, this study aims to: (1) identify informative data-driven remote sensing indices from a large multi-domain feature space, including spectral, harmonic, and textural information, to improve feature representation for leaf and plant dry matter (LDM and PDM) as well as leaf and plant nitrogen accumulation (LNA and PNA); (2) systematically evaluate the performance of RF and representative deep learning models in processing these multi-domain features; and (3) employ the selected modeling framework to generate model-derived high-resolution plantation-scale maps, thereby exploring the spatial heterogeneity and potential inter-annual variations of tea plant growth parameters across different plantations.

2. Materials and Methods

2.1. Experimental Design

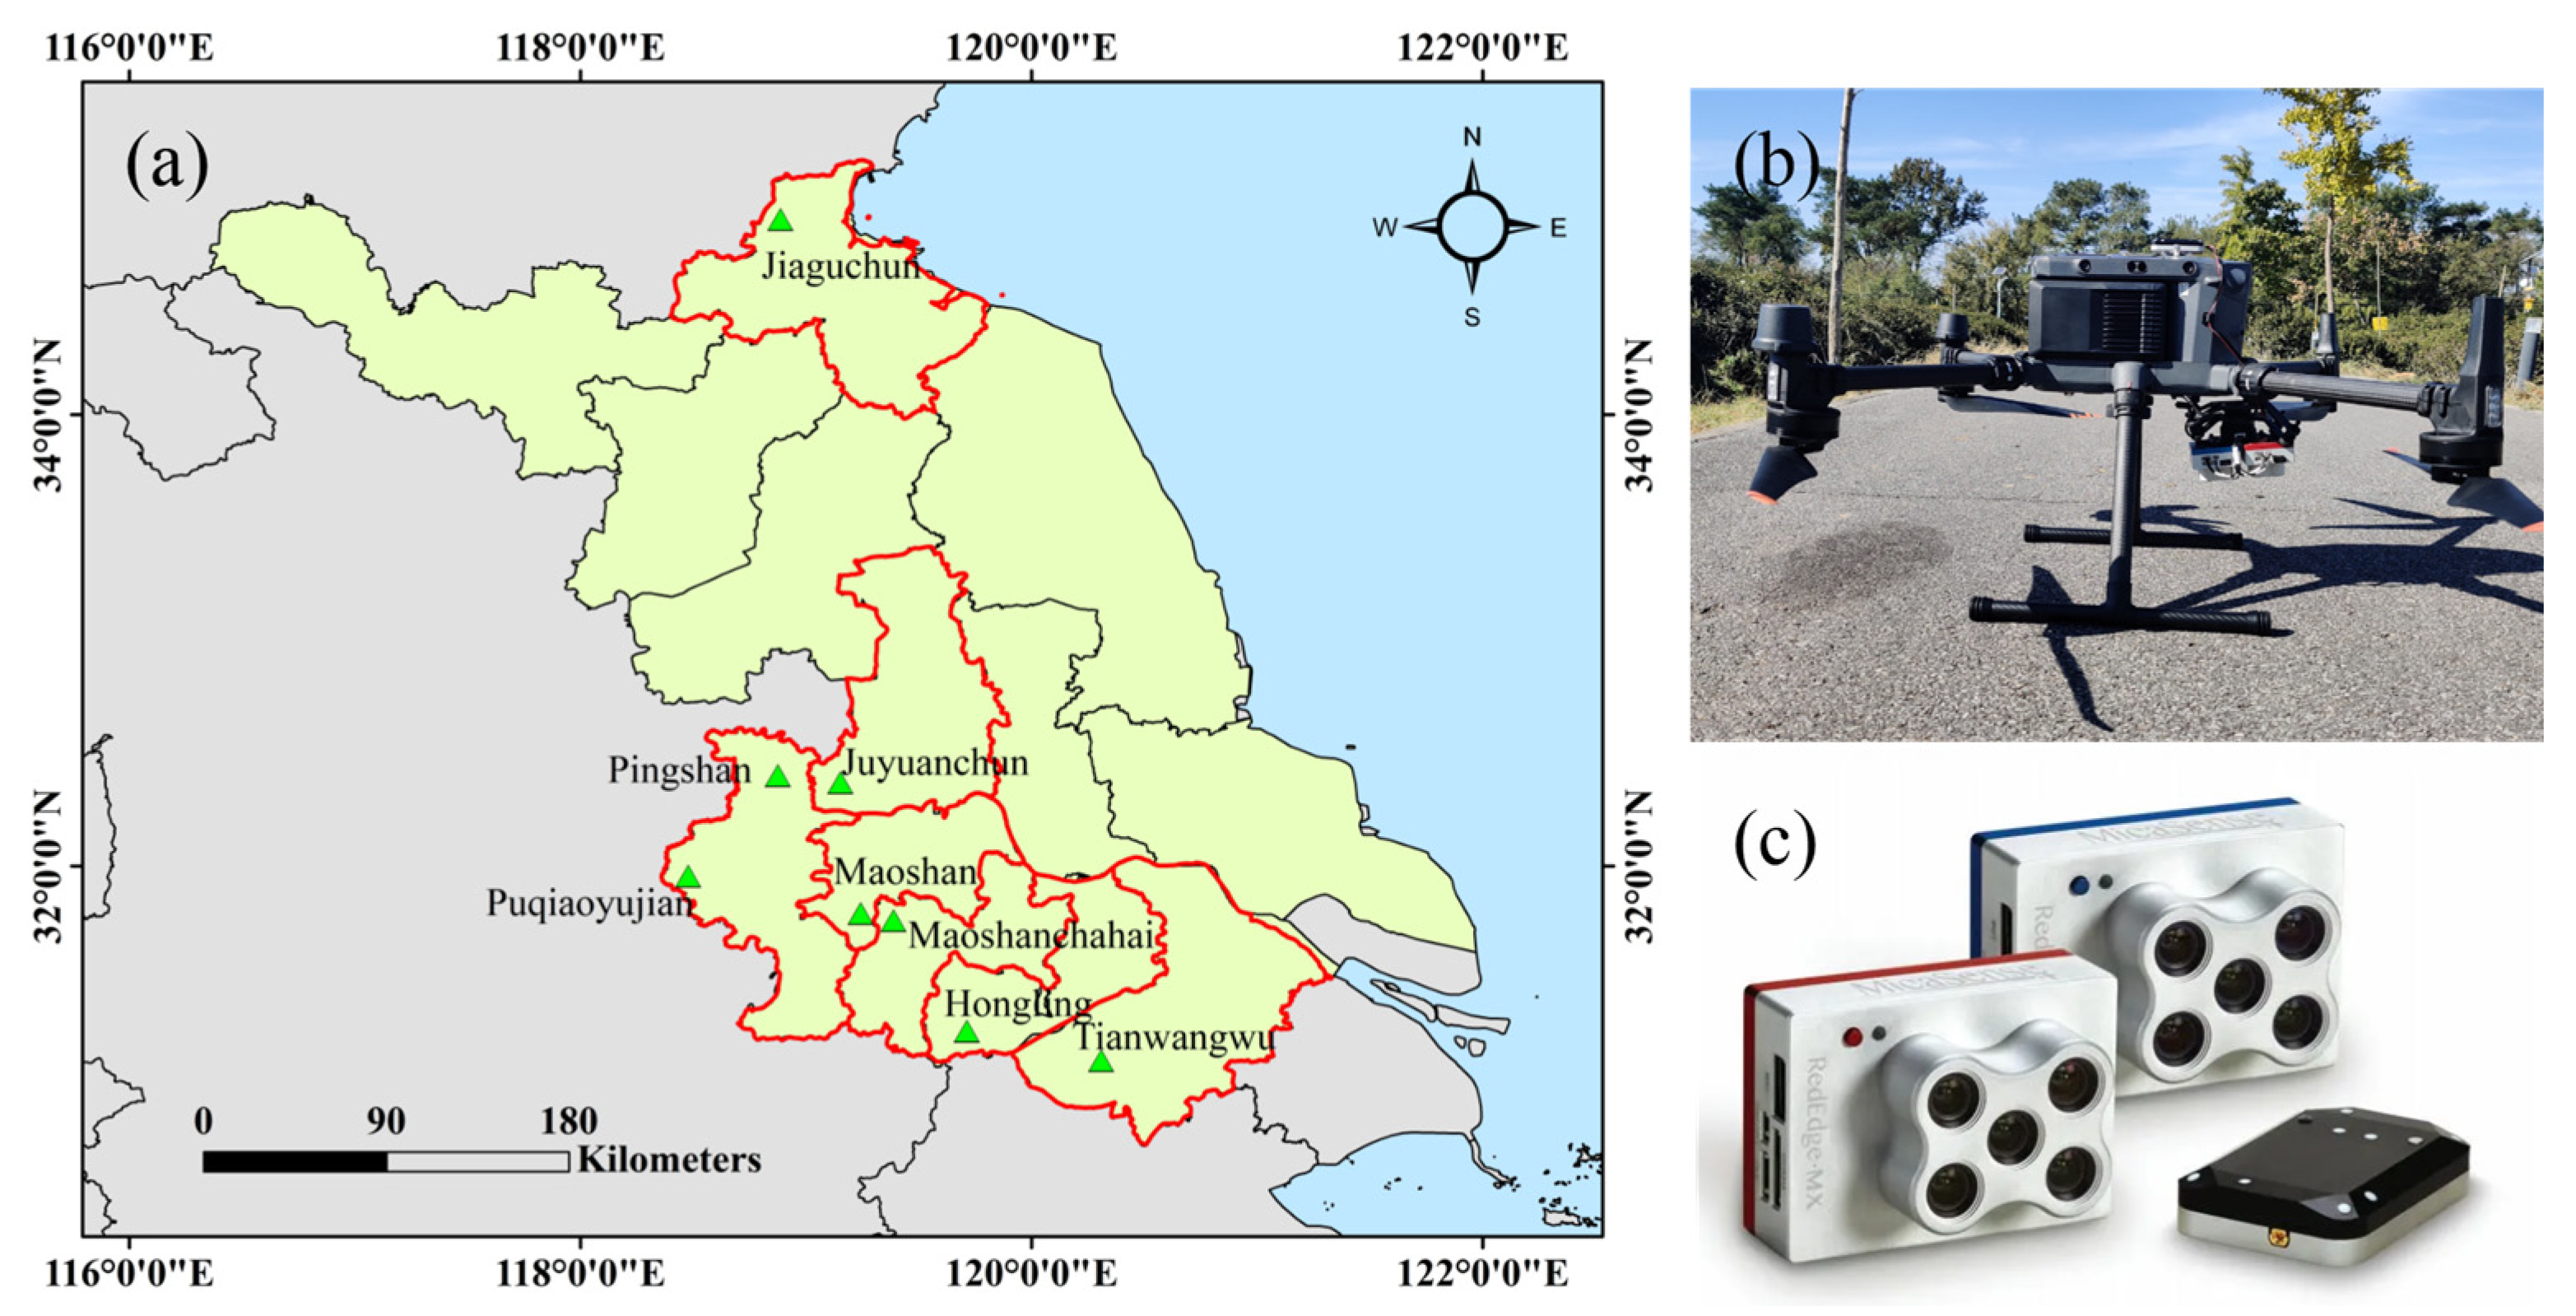
Field experiments were carried out in the spring of 2024 and 2025 at eight tea plantations in Jiangsu Province, China (Figure 1). The study sites included the Pingshan Tea Plantation (Luhe District) and the Puqiaoyujian Tea Plantation (Pukou District) in Nanjing; the Juyuanchun Tea Plantation in Yangzhou; the Tianwangwu Tea Plantation in Suzhou; the Maoshan Tea Plantation in Zhenjiang; the Hongling Tea Plantation in Wuxi; the Maoshanchahai Plantation in Changzhou; and the Jiaguchun Tea Plantation in Lianyungang. This region, situated along the southeastern coast of China, experienced an average annual precipitation of 1011–1302 mm and a mean annual temperature of 16.9–17.4 °C during the study period. The mild and humid climatic conditions are highly favorable for tea plant growth. Comprehensive details of the study sites are presented in Table 1.

2.2. Tea Plant Growth Data Collection

Sampling locations were randomly assigned within each tea plantation, with their geographic coordinates recorded using a GNSS device. At each location, tea samples were collected from a 0.5 m × 0.5 m quadrat. The collected samples were subjected to heating at 120 °C for 60 min to stop physiological activity, and then oven-dried at 90 °C for 24 h until constant weight was achieved. Subsequently, LDM, stem dry matter (SDM), and PDM were determined. The dried samples were then ground into a fine powder, and subsamples of 10.00–10.50 mg were weighed and analyzed using an elemental analyzer to determine the total nitrogen concentration in the leaves (LNC) and stems (SNC). Based on the measured dry matter and nitrogen concentrations, LNA and stem nitrogen accumulation (SNA) were calculated, and their sum was used to estimate the total PNA. The corresponding calculation methods are provided in Equations (1)–(3).
L N A = L D M × L N C
S N A = S D M × S N C
P N A = L N A + S N A

2.3. UAV Multispectral Data Acquisition and Feature Extraction

2.3.1. UAV Multispectral Data Acquisition

Multispectral imagery of the tea plantations was acquired during the spring seasons of 2024–2025 using a DJI Matrice 350 UAV platform. The UAV was equipped with a RedEdge-MX-Blue multispectral camera, which captures 10 spectral bands spanning 444–842 nm, including coastal blue, blue, green, red, red-edge, and near-infrared wavelengths, with bandwidths ranging from 10 to 57 nm. The detailed band information of the camera is summarized in Table 2. All UAV flights were conducted between 11:00 and 14:00 under stable illumination conditions. The flight altitude was set at 100 m above the canopy, with forward and side overlaps of 80% and 70%, respectively. Images of a calibrated reflectance panel were collected before each flight to enable radiometric correction. The acquired images were processed using Agisoft Metashape Professional 2.1.1 to generate orthomosaics. The workflow included three main steps: (1) photo alignment, (2) dense point cloud generation, and (3) construction of the digital surface model (DSM) and orthomosaic. Subsequently, the orthomosaic imagery was imported into ArcMap 10.8.1 for geometric correction. Ground control points (GCPs) obtained from field surveys were used for georeferencing. The Georeferencing tool was applied to align the imagery with the GCPs, thereby reducing geometric distortions. Finally, for each sampling point, the mean spectral reflectance of each band was extracted from a 0.5 m × 0.5 m region of interest (ROI) centered on the corresponding field location.

2.3.2. Harmonic Feature Extraction

To comprehensively characterize the spectral waveform variations of tea canopies in the frequency domain, harmonic analysis was introduced. The spectral reflectance values of the 10 bands at each sampling point were treated as a discrete sequence arranged along the band-order axis rather than the physical wavelength axis and analyzed using the numpy.fft module in Python (PyCharm 2024.3.4). The discrete Fourier transform (DFT), efficiently implemented through the fast Fourier transform (FFT) algorithm, was applied to decompose the ordered multispectral sequence into harmonic components [20]. For a given sampling point, the reflectance sequence R(k) consisting of N bands (N = 10) can be expressed as a summation of harmonic components, as shown in Equation (4).
R ( k ) = A 0 2 + n = 1 M ( A n cos 2 π n k N + B n sin 2 π n k N ) + ε ( k )
In the equation, k is the band index (k = 1, 2, …, 10); M represents the order of the harmonic decomposition; A0/2 is the DC component, representing the average spectral reflectance energy at that sampling point; and ε(k) represents the residual term. An and Bn are the cosine amplitude (CA) and sine amplitude (SA) of the n-th harmonic, respectively, which are calculated according to Equations (5) and (6):
A n = 2 N k = 1 N R ( k ) cos ( 2 π n k N )
B n = 2 N k = 1 N R ( k ) sin ( 2 π n k N )
Based on An and Bn, Formulas (7) and (8) can be further utilized to derive the harmonic amplitude (A, denoted mathematically as Cn)—which reflects the overall energy intensity of the nth-order harmonic—and the phase angle (P, denoted mathematically as φ n )—which reflects the positional shift of the waveform:
C n = A n 2 + B n 2
ϕ n = tan 1 ( A n / B n )
In this study, FFT was applied to the 10-band spectral reflectance sequence of each sampling point using the numpy.fft module. Since the spectral sequence is a real-valued discrete signal, the Fourier coefficients exhibit conjugate symmetry. Therefore, for a 10-point DFT, components from n = 6 to n = 9 correspond to conjugate-symmetric components of lower-order harmonics and do not provide additional independent information. The components n = 0–5 contain independent information, where n = 0 represents the mean spectral level (DC component) and n = 5 corresponds to the Nyquist-frequency component. The zero-frequency component (n = 0) was excluded because it largely overlapped with the original spectral reflectance features. Although n = 5 is mathematically independent, it represents the highest-frequency oscillatory component within the 10-point DFT and mainly describes rapid alternating variations between adjacent spectral bands. Considering that this study focused on characterizing broader spectral shape variations associated with tea canopy traits rather than isolated high-frequency fluctuations, harmonic orders n = 1–4 were retained, generating 16 frequency-domain features including cosine amplitude, sine amplitude, harmonic amplitude, and phase. This selection was based on the inherent properties of DFT rather than data-driven optimization. For each retained harmonic order, the CAn, SAn, An, and Pn were calculated, resulting in 16 frequency-domain features for subsequent feature construction.

2.3.3. Texture Feature Extraction

Texture features were extracted using the gray-level co-occurrence matrix (GLCM) method via the scikit-image 0.25.2 Python library [21]. To ensure reproducibility, GLCM parameters were explicitly set with a gray-level quantization of 64, a step size of 1 pixel, and averaged across four directions (0°, 45°, 90°, and 135°) for rotation invariance. Instead of using a sliding window, extraction was performed globally over all valid pixels within the 0.5 m × 0.5 m region of interest (ROI) mask for each sampling quadrat. Ultimately, nine second-order GLCM features were calculated per unit: GLCM mean (MEA), variance (VAR), standard deviation (STD), homogeneity (HOM), contrast (CON), dissimilarity (DIS), entropy (ENT), second moment (SEM), and correlation (COR).

2.4. Construction of Spectral Indices

To comprehensively explore the relationships among raw spectral features, harmonic features (SA, CA, A, and P), texture features (GLCM), and tea plant growth parameters, multi-domain feature fusion indices, including dual-feature indices and TFIs, were constructed through exhaustive combinations within the feature space. The corresponding formulations are summarized in Table 3.
For dual-feature index construction, four widely used mathematical formulations were adopted: the Difference Spectral Index (DSI), Ratio Spectral Index (RSI), Normalized Difference Spectral Index (NDSI), and Soil-Adjusted Vegetation Index (SAVI). All possible pairwise combinations of features were systematically evaluated, and candidate indices were initially screened and ranked based on their Pearson correlation coefficients (r) with the target parameters using the pooled dataset. In addition, four commonly used vegetation indices were included as benchmarks to evaluate the improvement achieved by the proposed indices (Table S1).
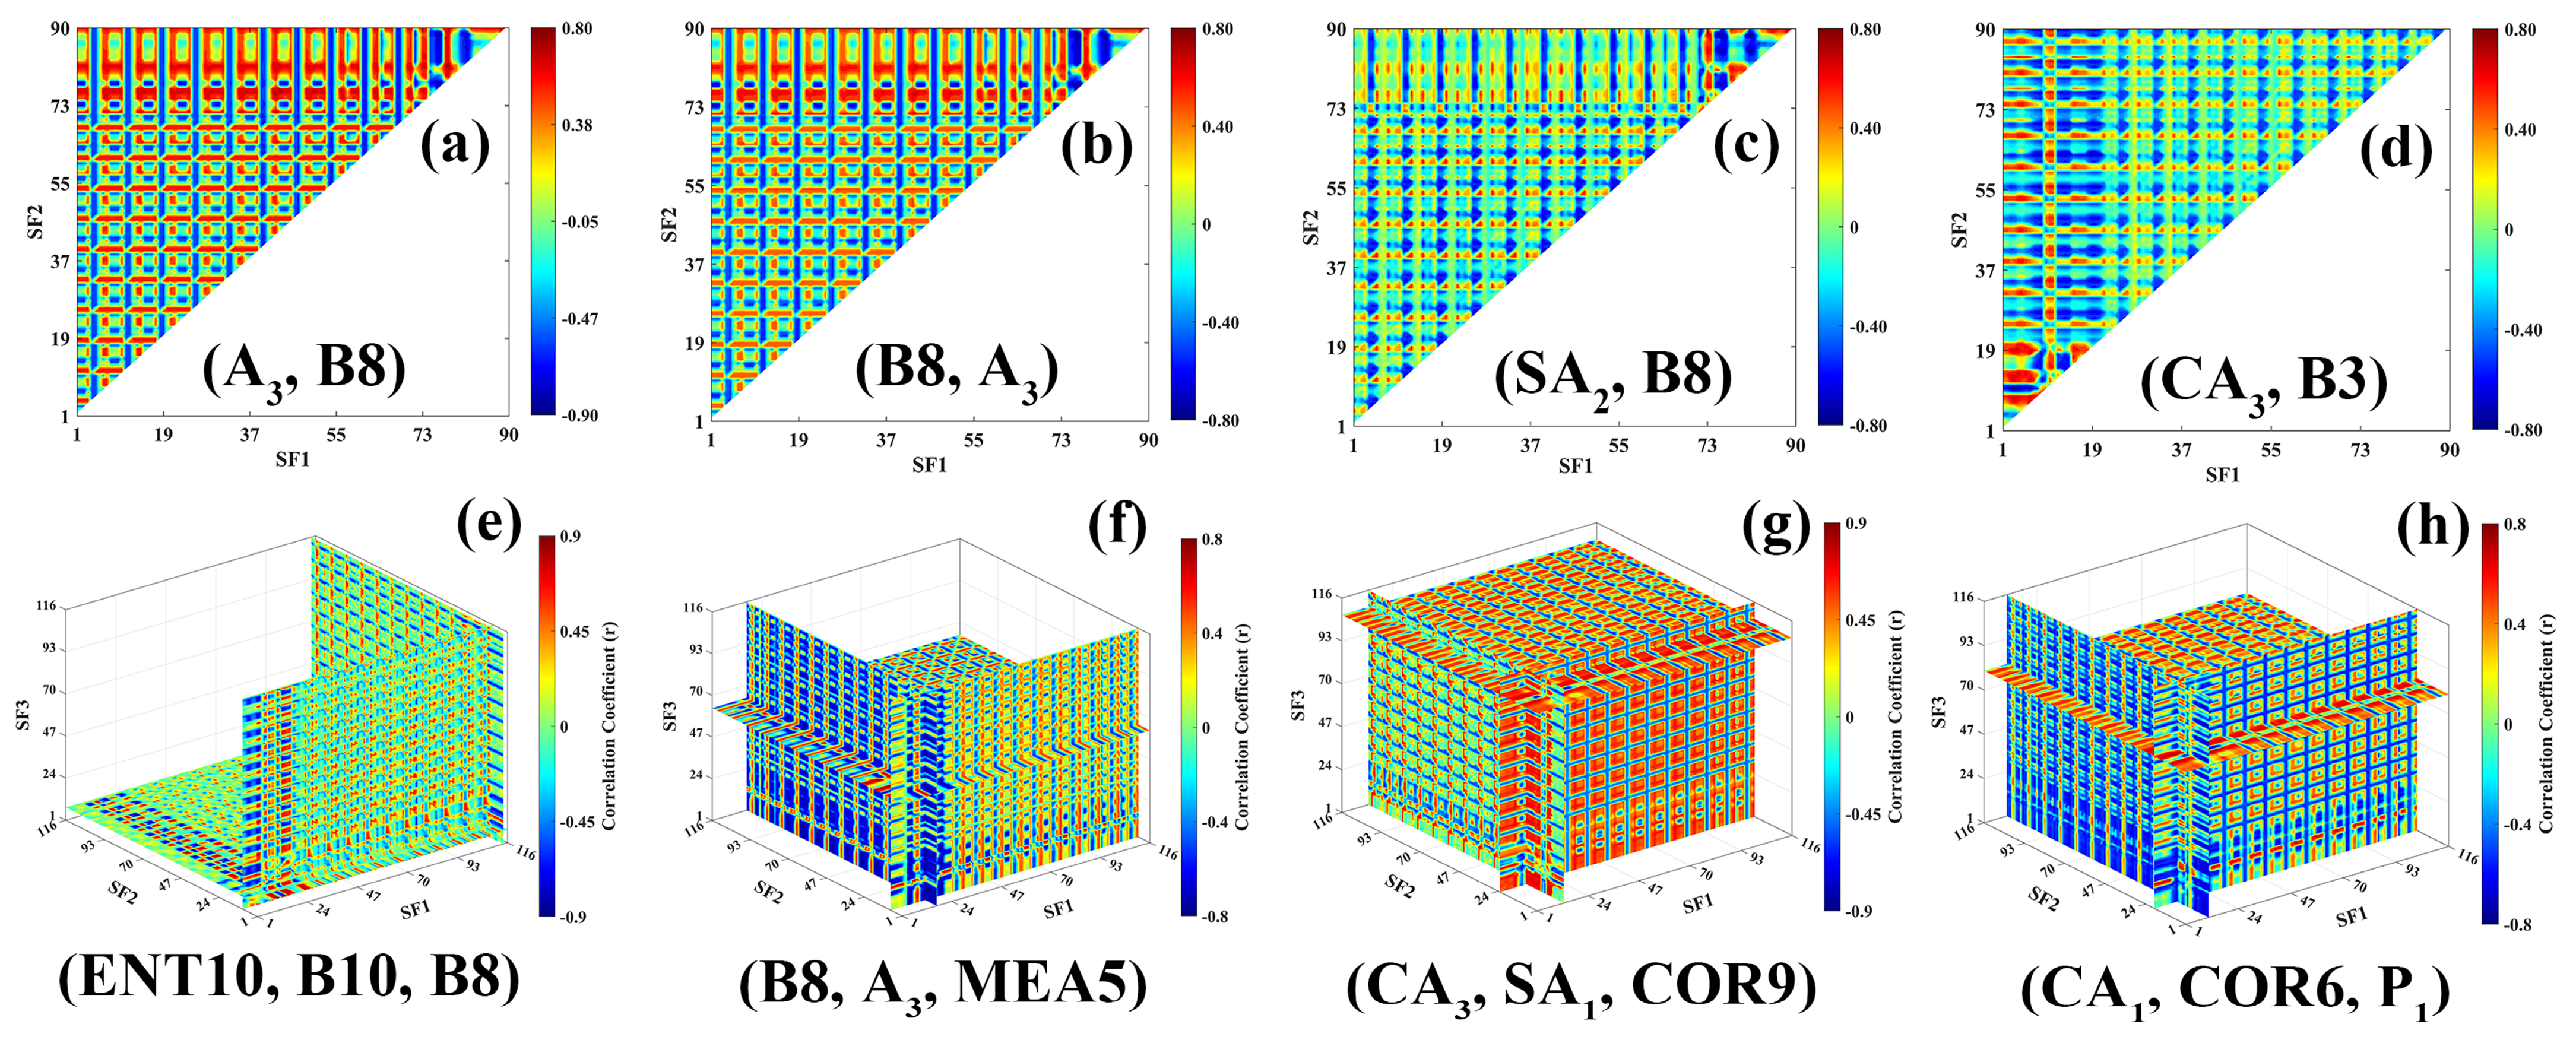
To further capture higher-order interactions among heterogeneous feature domains, tri-feature indices were developed by introducing a third feature dimension. Four representative nonlinear formulations (TFI-1 to TFI-4) were designed. Within a three-dimensional feature space, all candidate combinations of three features (Fi, Fj, Fk) were exhaustively substituted into these formulations. Specifically, repeated selection of the same feature was prohibited, whereas different feature orders were retained because the mathematical formulations were asymmetric with respect to the three input dimensions. Therefore, with 116 available features, a total of 116 × 115 × 114 = 1,520,760 ordered feature triplets were evaluated for each TFI formulation. The relationships between all candidate indices and target variables were systematically assessed using Pearson correlation analysis based on the pooled dataset. Furthermore, three-dimensional slice heatmaps were generated to visualize the distribution of correlation coefficients across the feature space. The highest-ranking feature combinations were subsequently identified as representative TFIs through this automated exploratory screening procedure. The primary purpose of this screening strategy was to empirically identify informative multi-domain feature representations with strong associations with tea plant growth parameters within the investigated dataset. Based on the screening results, the selected TFIs were subsequently incorporated into machine learning and deep learning models as input variables. The predictive performance of these models was further assessed using a leave-one-site-out cross-validation (LOSO-CV) strategy, where each tea plantation was iteratively treated as an unseen test site to evaluate the predictive behavior and cross-site generalization capability of different modeling algorithms. It should be noted that the TFI screening procedure was conducted prior to model evaluation using the pooled dataset. Therefore, the resulting prediction performance metrics should be interpreted as conditional performance estimates associated with the selected feature combinations rather than fully unbiased estimates of the entire feature discovery and modeling pipeline. The automated exhaustive search procedure and three-dimensional correlation heatmap visualization were implemented using MATLAB R2024b (MathWorks, Inc., Natick, MA, USA).

2.5. Data Analysis

The subsequent predictive modeling, cross-validation analyses, and statistical evaluations were conducted in a Python environment using scikit-learn 1.6.1 and the TensorFlow 2.20.0 (Keras 3.11.3) framework. RF was employed as a traditional machine learning baseline due to its robustness and generalization capability. The RF model was configured with 100 decision trees (n_estimators = 100), unlimited tree depth (max_depth = None), a minimum of two samples required for node splitting (min_samples_split = 2), a minimum of one sample required at leaf nodes (min_samples_leaf = 1), and square-root feature sampling (max_features = ‘sqrt’), with fold-specific random seeds (calculated as a base seed of 42 + fold number) applied during each LOSO iteration.
To further capture complex nonlinear relationships between multi-source features and tea plant growth parameters, three deep learning architectures were developed, including an MLP, a 1D-CNN, and a transformer model. Given that the inputs consisted of customized one-dimensional multi-source features rather than standard imagery, all deep learning models were trained from scratch using randomly initialized weights, and no pre-trained weights were utilized. The MLP consisted of three fully connected layers with 128, 64, and 32 neurons, respectively, each using the ReLU activation function. Dropout layers (rate = 0.2) were applied after the first two hidden layers to alleviate overfitting, followed by a single-neuron output layer for regression. The 1D-CNN model comprised two convolutional layers with 16 and 32 filters, respectively, using a kernel size of 3, same padding, ReLU activation, and L2 regularization (λ = 0.01). Each convolutional layer was followed by Batch Normalization and a Dropout layer (rate = 0.3). The extracted feature maps were flattened and passed to a fully connected layer with 32 neurons (regularized with L2 λ = 0.01 and followed by a Dropout layer with rate = 0.3) before the final regression output. To model global dependencies among input features, a lightweight transformer architecture was implemented. The standardized input features were first treated as individual feature tokens and projected into a 16-dimensional embedding space. The model consisted of two stacked transformer encoder blocks, each incorporating a four-head multi-head self-attention mechanism, residual connections, Layer Normalization, and a feed-forward network with 64 hidden units using the ReLU activation function. The encoded feature representations were aggregated using a Global Average Pooling layer, followed by a fully connected layer with 32 neurons and a final single-neuron output layer for regression. Dropout layers (rate = 0.2) and L2 regularization (λ = 0.001) were applied to the feed-forward layers and regression head to reduce overfitting.
All deep learning models were optimized using the Adam optimizer with mean squared error (MSE) as the loss function. Model architectures and training parameters were predefined based on preliminary experiments and empirical considerations regarding model complexity and convergence stability. Specifically, the MLP employed three hidden layers (128–64–32 neurons) with an initial learning rate of 0.001; the 1D-CNN used two convolutional layers (16 and 32 filters) with a learning rate of 0.0005; and the transformer adopted two encoder blocks with four attention heads, a 16-dimensional embedding space, and a learning rate of 0.001. Across all models, the batch size was fixed at 16, and the maximum number of training epochs ranged from 200 to 300 depending on the model architecture. Early stopping based on validation loss was implemented within each LOSO iteration using an inner group-based validation split. Specifically, after one tea plantation was excluded as the outer test site, the remaining seven plantations were further divided using GroupShuffleSplit, where one plantation was randomly assigned as an internal validation set for monitoring validation loss and restoring the optimal model weights. The outer test plantation was never involved in early stopping, weight restoration, or any preprocessing procedures, supporting a site-held-out model evaluation conditional on the globally selected feature combinations. To improve reproducibility, fold-specific random seeds (calculated as a base seed of 42 + fold number) were applied to Python, NumPy 2.2.6, and TensorFlow before training each LOSO fold. In addition, the TensorFlow computational graph was cleared before rebuilding each model to ensure independent training across LOSO folds. Each model was evaluated using the LOSO cross-validation strategy, in which samples from one tea plantation were excluded from model fitting and reserved as the evaluation fold, while samples from the remaining tea plantations were used for model training. Model performance was assessed using the coefficient of determination (R2), root mean square error (RMSE, Equation (9)), mean absolute error (MAE, Equation (10)), and normalized mean absolute error (NMAE, Equation (11)). In these equations, n represents the total number of samples, while Oi and Pi denote the observed and predicted values, respectively. To rigorously verify whether each deep learning model provided statistically significant improvements over the traditional RF baseline, two-sided paired t-tests were independently conducted between each deep learning model and RF using site-level MAE values derived from the LOSO folds. Statistical significance was defined at p < 0.05. Furthermore, Cohen’s dz was calculated alongside the 95% confidence intervals to quantify the standardized effect size of the observed performance differences.
R M S E = 1 n i = 1 n ( P i O i )
M A E = 1 n i = 1 n P i O i
N M A E = 1 n i = 1 1 P i O i O ¯
Finally, all model training and evaluation procedures were executed on a workstation equipped with an Intel® Core™ i9-14900HX processor, an NVIDIA GeForce RTX 4060 Laptop GPU (8 GB VRAM), and 16 GB DDR5-5600 RAM. Under this hardware configuration, each deep learning architecture required approximately 2 min to complete the entire LOSO training and evaluation procedure. The final model performance was reported by pooling the predictions from all LOSO test folds, thereby providing an overall assessment of predictive accuracy and cross-site predictive behavior conditional on the selected feature combinations.

2.6. Spatial Distribution Mapping and Spatiotemporal Variability Analysis of Tea Plantations

For representative tea plantations (e.g., Juyuanchun and Maoshan), vector boundaries of regions of interest (ROIs), including tea rows and operational plots, were first delineated from the orthomosaics in ArcGIS. A mask was generated in ArcGIS to remove non-tea pixels (e.g., bare soil and shadows), thereby retaining only pure tea canopy regions. The masked imagery was then converted into point data, with each pixel preserving reflectance values across all 10 spectral bands. Subsequently, multi-source feature extraction was conducted at the pixel level using Python (PyCharm 2024.3.4). Harmonic features were derived by applying the DFT to the spectral reflectance sequences, while texture features were extracted based on local neighborhood information. Following feature extraction, pixel-wise calculations were performed using the optimal dual-feature and tri-feature index formulations identified in this study. The resulting feature dataset was then input into the trained deep learning models with the best predictive performance. Finally, the pixel-level predictions were mapped back to their original geographic coordinate system to generate high-resolution spatial distribution maps of PDM and PNA. To quantify interannual variability, the Raster Math tool in ArcMap 10.8.1 was used to compute difference maps between 2024 and 2025. The relative change rate and coefficient of variation (CV) were calculated at the pixel scale to characterize spatial and temporal variations in tea plant growth. Furthermore, the mean predicted values within each delineated operational plot were extracted to summarize plantation-level variations between 2024 and 2025. Descriptive statistics, including the minimum, maximum, mean, standard deviation (SD), and CV, were calculated to characterize the distribution of model-derived growth parameters and their interannual variations within each plantation.

3. Results

3.1. Construction of Multi-Feature Remote Sensing Indices

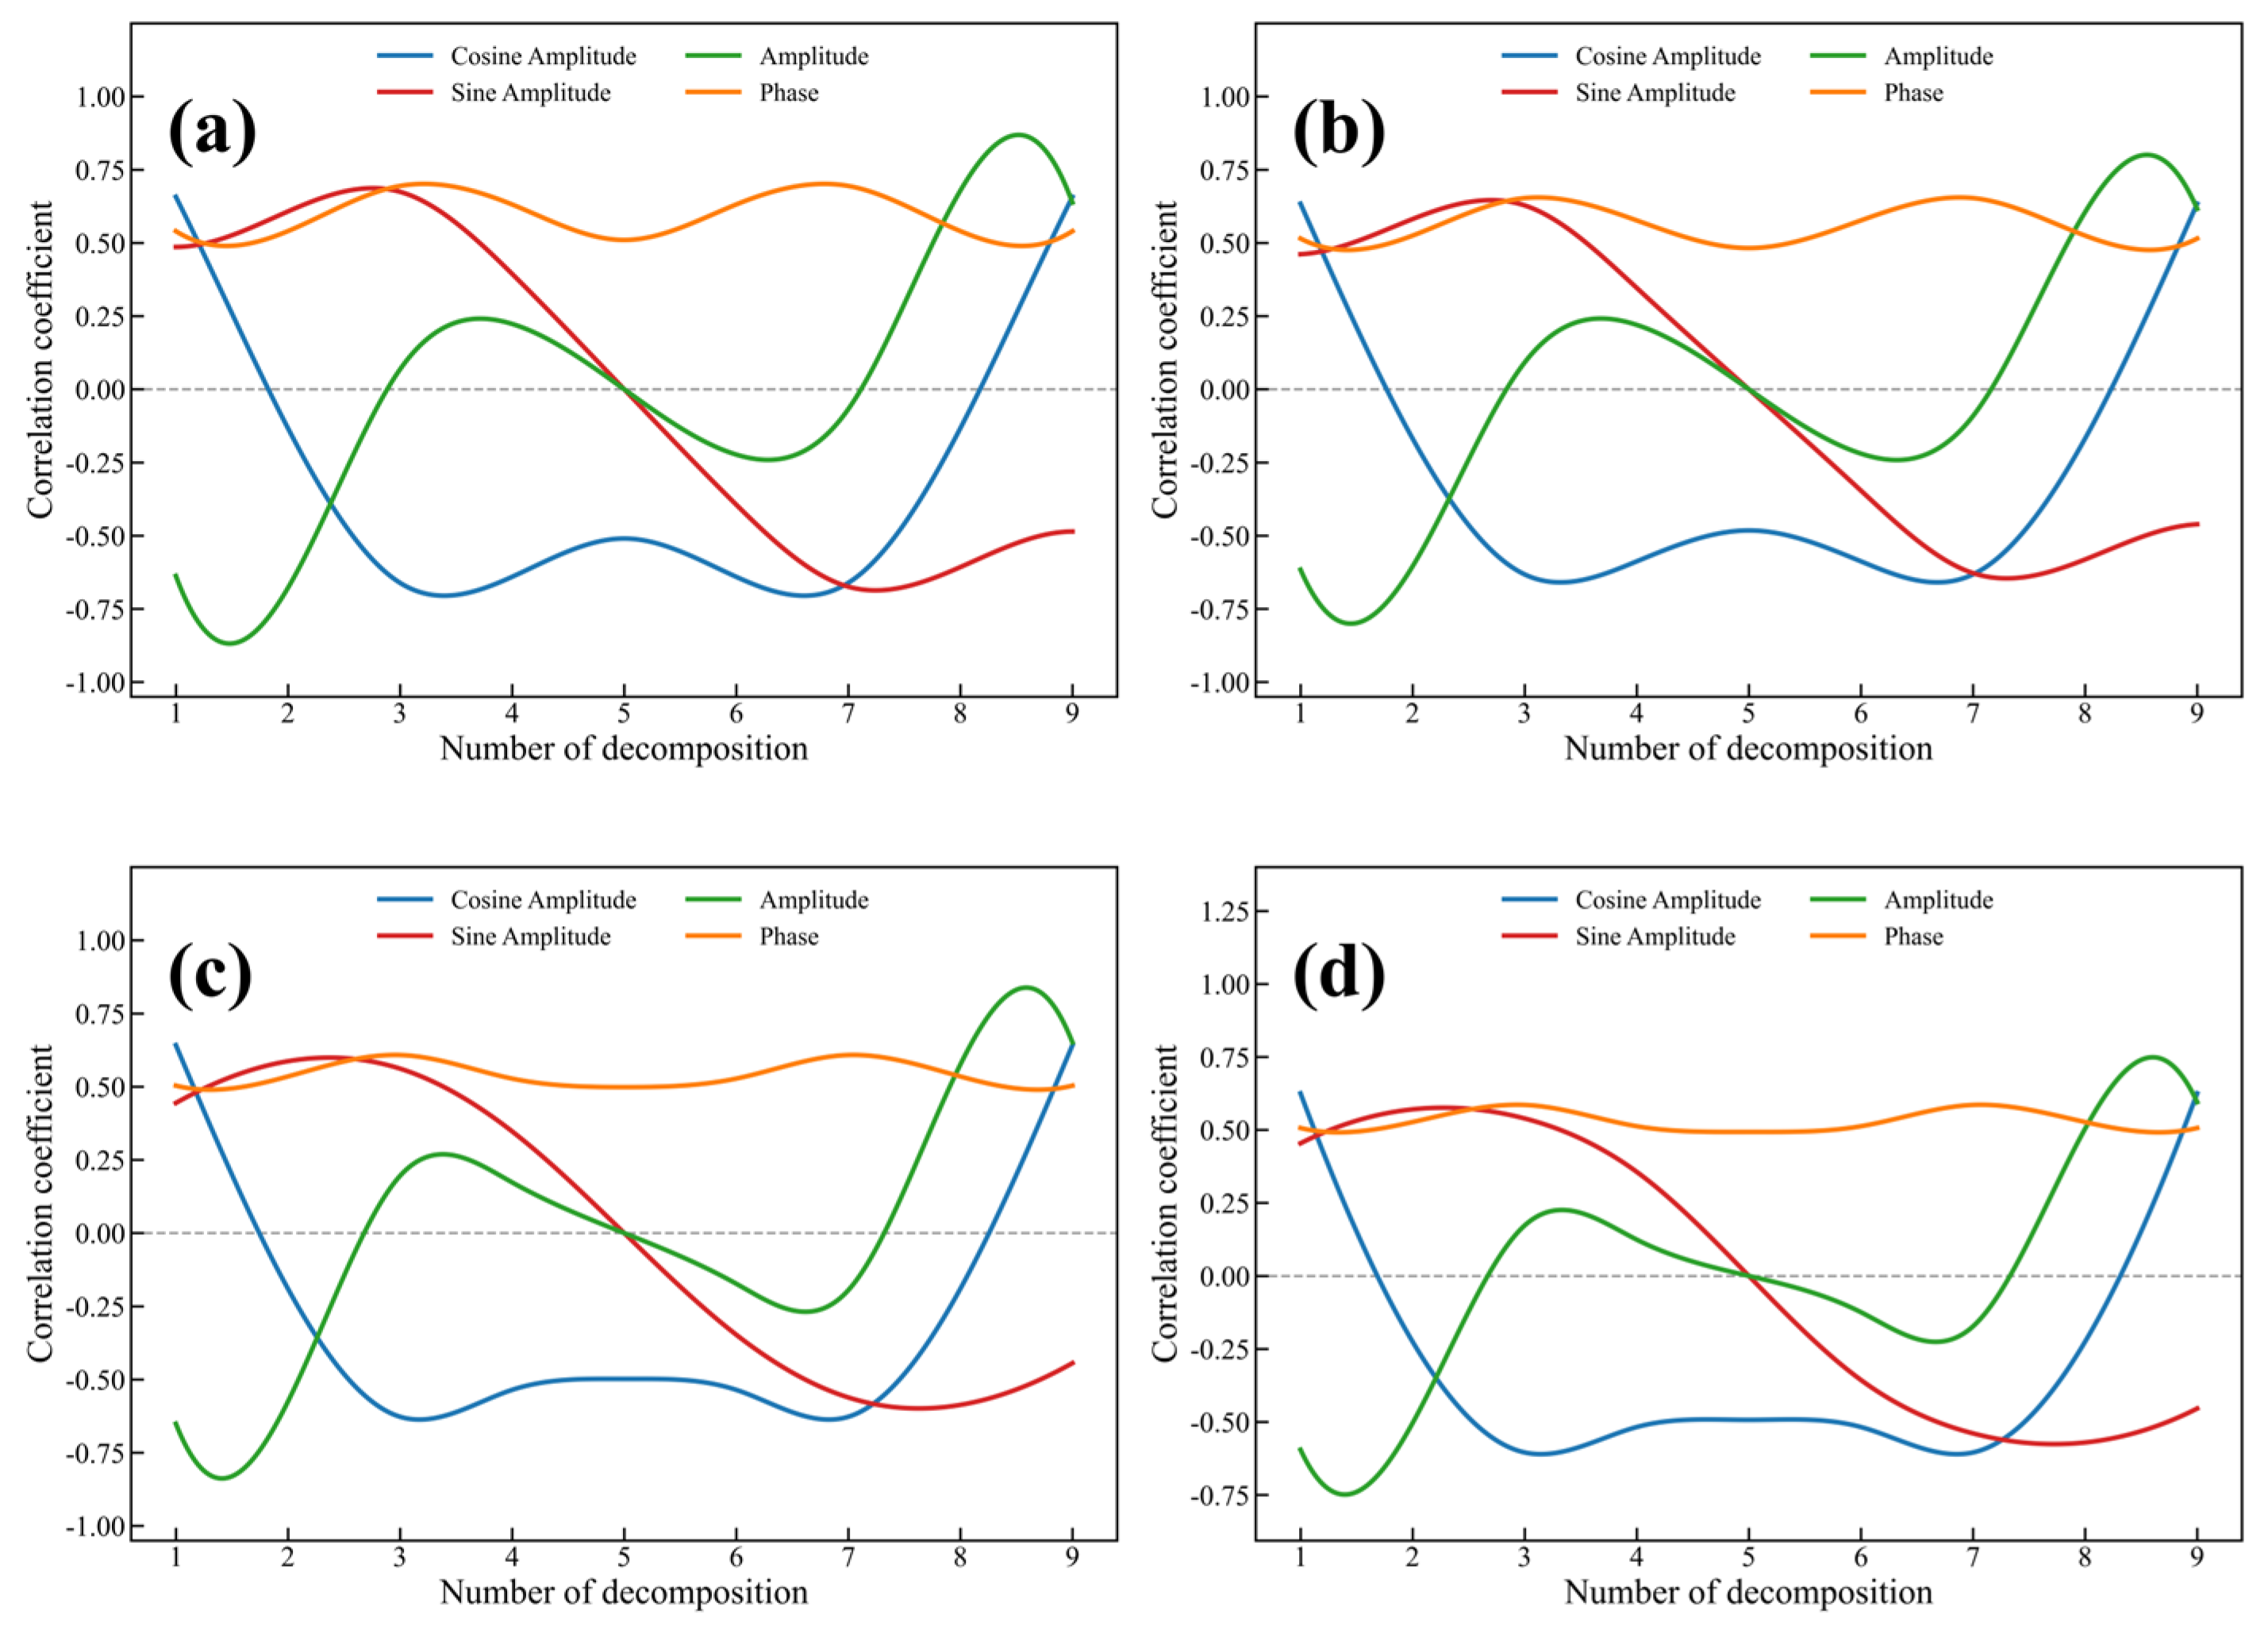
Multi-feature remote sensing indices were constructed by fusing the original spectral reflectance, harmonic features, and texture features. As established in Section 2.3.2, variables from the 1st to 4th harmonic orders were retained for subsequent combination screening due to the conjugate symmetry of the discrete Fourier transform. The correlation analysis between all extracted harmonic decomposition components and the target variables is illustrated in Figure 2.
Accordingly, based on original spectral reflectance, harmonic features, and texture features, the optimal dual-feature spectral indices for LDM, PDM, LNA, and PNA were screened and identified as SAVI (A3, B8), SAVI (B8, A3), RSI (SA2, B8), and RSI (CA3, B3), respectively. Furthermore, through systematic evaluation, the optimal tri-feature combinations for each indicator were ultimately determined as follows: TFI-3 (ENT10, B10, B8) for LDM, TFI-1 (B8, A3, MEA5) for PDM, TFI-4 (CA3, SA1, COR9) for LNA, and TFI-4 (CA1, COR6, P1) for PNA. The distribution of the R2 for each combination is detailed in Figure 3.

3.2. Linear Quantitative Analysis of Multi-Feature Remote Sensing Indices and Tea Plant Growth

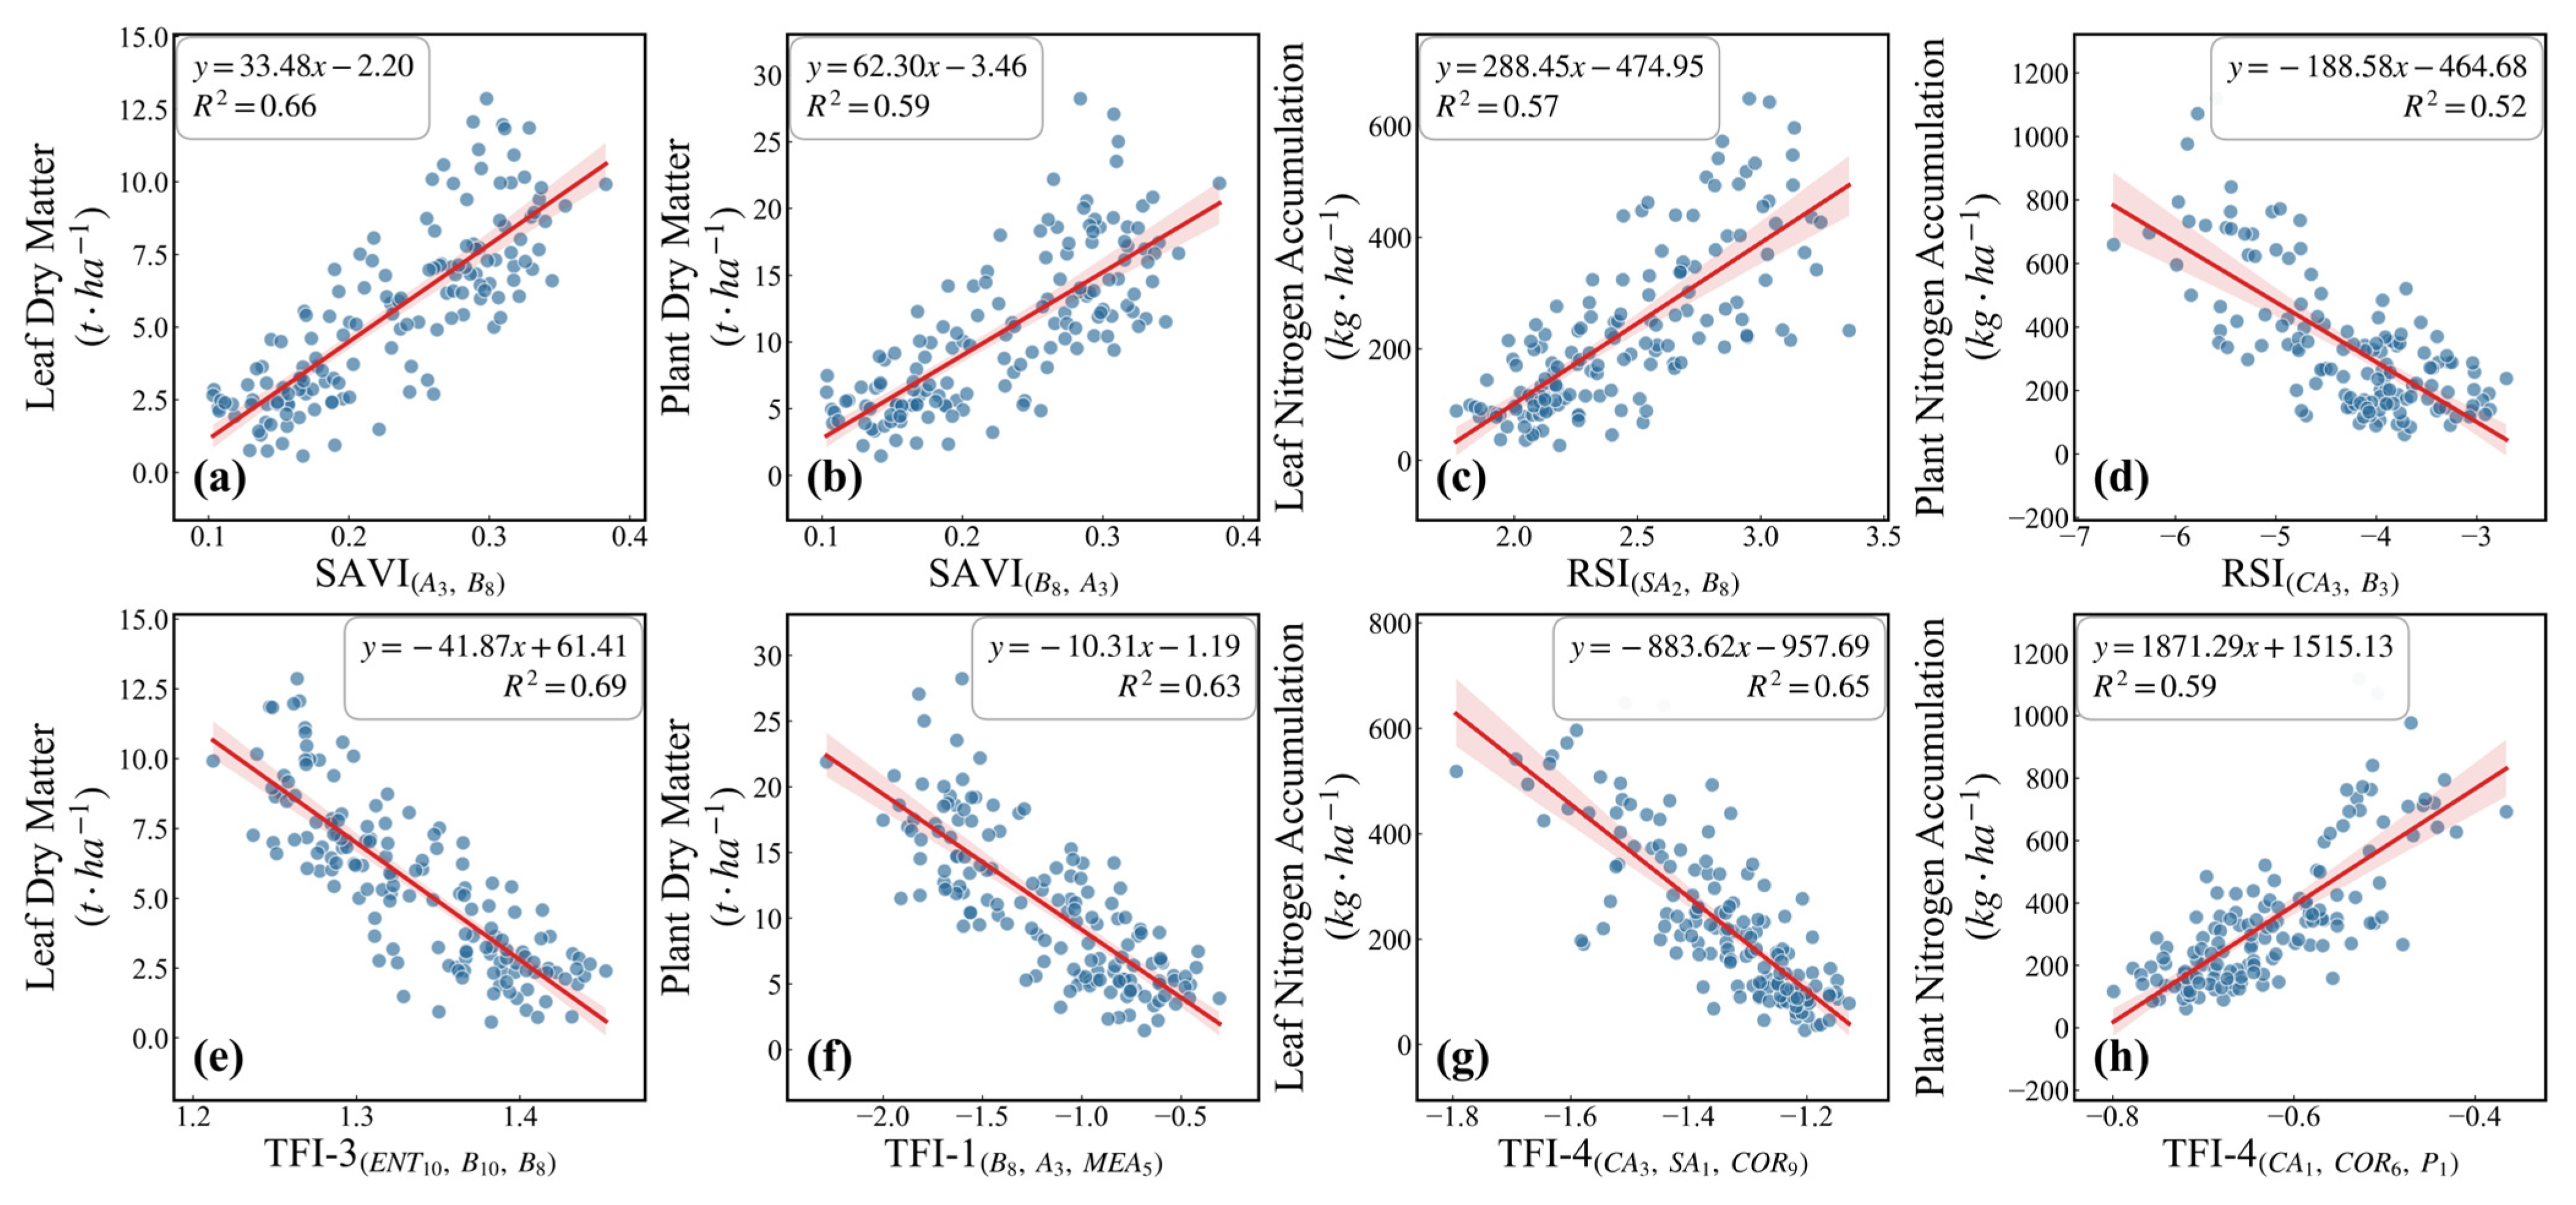
Univariate linear regression analyses were performed between the selected optimal dual- and tri-feature indices and LDM, PDM, LNA, and PNA (Figure 4). The results show that the tri-feature index TFI-3 (ENT10, B10, B8) achieved an R2 of 0.69 for LDM, while the TFI-1 (B8, A3, MEA5) model yielded an R2 of 0.63 for PDM. Regarding the estimation of nitrogen parameters, TFI-4 (CA3, SA1, COR9) and TFI-4 (CA1, COR6, P1) yielded an R2 of 0.65 and 0.59 for LNA and PNA, respectively. It should be noted that these represent apparent-fit values evaluated on the full sample; more rigorous and defensible cross-validated figures for these indices are reported subsequently in Table 4.

3.3. Performance Comparison Between Novel Multi-Feature Indices and Conventional Vegetation Indices for Estimating Growth Parameters of Tea Plant

Based on the univariate linear regression models under the LOSO-CV framework, the predictive performance of models using the selected dual- and tri-feature spectral indices was evaluated (Table 4). In biomass estimation, the dual-feature indices SAVI (A3, B8) and SAVI (B8, A3) yielded cross-validated R2 of 0.62 and 0.55 for LDM and PDM, respectively. Among the tri-feature indices, TFI-3 (ENT10, B10, B8) achieved an R2 of 0.63 and an RMSE of 1.78 t·ha−1 for LDM, while TFI-1 achieved an R2 of 0.57 and an RMSE of 3.77 t·ha−1 for PDM. In contrast, the best-performing conventional indices, GNDVI and EVI, showed lower performance, with R2 values of only 0.26 and 0.25 for LDM and PDM, respectively. Regarding nitrogen parameter estimation, the dual-feature index RSI yielded an R2 of 0.49 and 0.44 for LNA and PNA, respectively. The tri-feature index TFI-4 demonstrated higher accuracy for LNA and PNA, with an R2 of 0.62 and 0.52 and RMSE values of 90.14 kg·ha−1 and 160.54 kg·ha−1, respectively. Notably, the cross-validated R2 values of the best-performing conventional index GNDVI for LNA and PNA were only 0.31 and 0.28, respectively. These results indicate that the selected multi-feature indices provided more informative feature representations than conventional vegetation indices within the investigated dataset. However, these comparisons should be interpreted as conditional on the selected feature combinations, because the index screening procedure was performed prior to the LOSO-CV evaluation.
To further compare the prediction errors associated with models using selected multi-feature indices and conventional vegetation indices, site-level paired t-tests based on mean absolute error (MAE) were conducted under the LOSO-CV framework (Table 5). The results demonstrated that the selected TFIs achieved significantly lower MAE than the corresponding best-performing conventional vegetation indices for all four growth parameters (p < 0.05), with large effect sizes (Cohen’s dz = 0.84–1.44). Although the improvements yielded by the dual-feature indices did not reach statistical significance (p > 0.05), their moderate to large effect sizes for parameters such as LDM, PDM, and PNA (Cohen’s dz = 0.53–0.80) indicate a meaningful practical reduction in prediction error. This suggests that the lack of statistical significance for dual-feature indices may be primarily attributed to the limited statistical power associated with the small sample size (n = 8 independent sites) under the LOSO-CV framework, rather than an absence of actual predictive advantage.

3.4. Construction of Monitoring Models Based on Deep Learning Methods

Under the LOSO-CV framework, tea plant growth monitoring models were constructed by integrating the optimal data-driven feature combinations as input variables into RF and three deep learning architectures (CNN, MLP, and transformer). The results (Table 6) indicated that the deep learning models achieved competitive cross-validated performance compared with the RF baseline, although their performance varied among different growth indicators. In biomass estimation, the MLP model achieved the best predictive performance for LDM (R2 = 0.56, RMSE = 1.93 t·ha−1), showing comparable accuracy with RF (R2 = 0.55, RMSE = 1.96 t·ha−1). For PDM estimation, the MLP model performed best, yielding an R2 of 0.59 and an RMSE of 3.70 t·ha−1. Regarding nitrogen parameter estimation, the MLP model achieved the highest accuracy for LNA (R2 = 0.73, RMSE = 75.33 kg·ha−1), whereas the CNN model yielded the best performance for PNA (R2 = 0.68, RMSE = 130.19 kg·ha−1). Furthermore, the NMAE values of the optimal models across all tasks remained relatively low (0.25–0.30), indicating reliable prediction performance for different tea plant physiological parameters.
To further evaluate whether the deep learning architectures provided statistically significant improvements over the RF model, site-level paired t-tests based on MAE were conducted under the LOSO-CV framework (Table S2). The results demonstrated that none of the optimal deep learning models showed statistically significant reductions in MAE compared with RF (p > 0.05), although several deep learning models achieved slightly lower prediction errors for specific indicators. Overall, RF remained a robust baseline model under the site-held-out LOSO-CV evaluation framework, while the appropriately selected deep learning architectures provided competitive predictive performance for different tea plant growth parameters, suggesting their potential to capture complex nonlinear relationships between multi-source remote sensing features and physiological traits. In addition, all reported R2 values were calculated from pooled predictions across the eight held-out LOSO test folds, representing the overall predictive capability across all sampling sites. These values were interpreted together with site-level MAE statistics (Table S2) to account for variability caused by spatial heterogeneity among tea plantations.

3.5. Spatiotemporal Variability Analysis of Tea Plant Growth Status Based on Optimal Monitoring Model

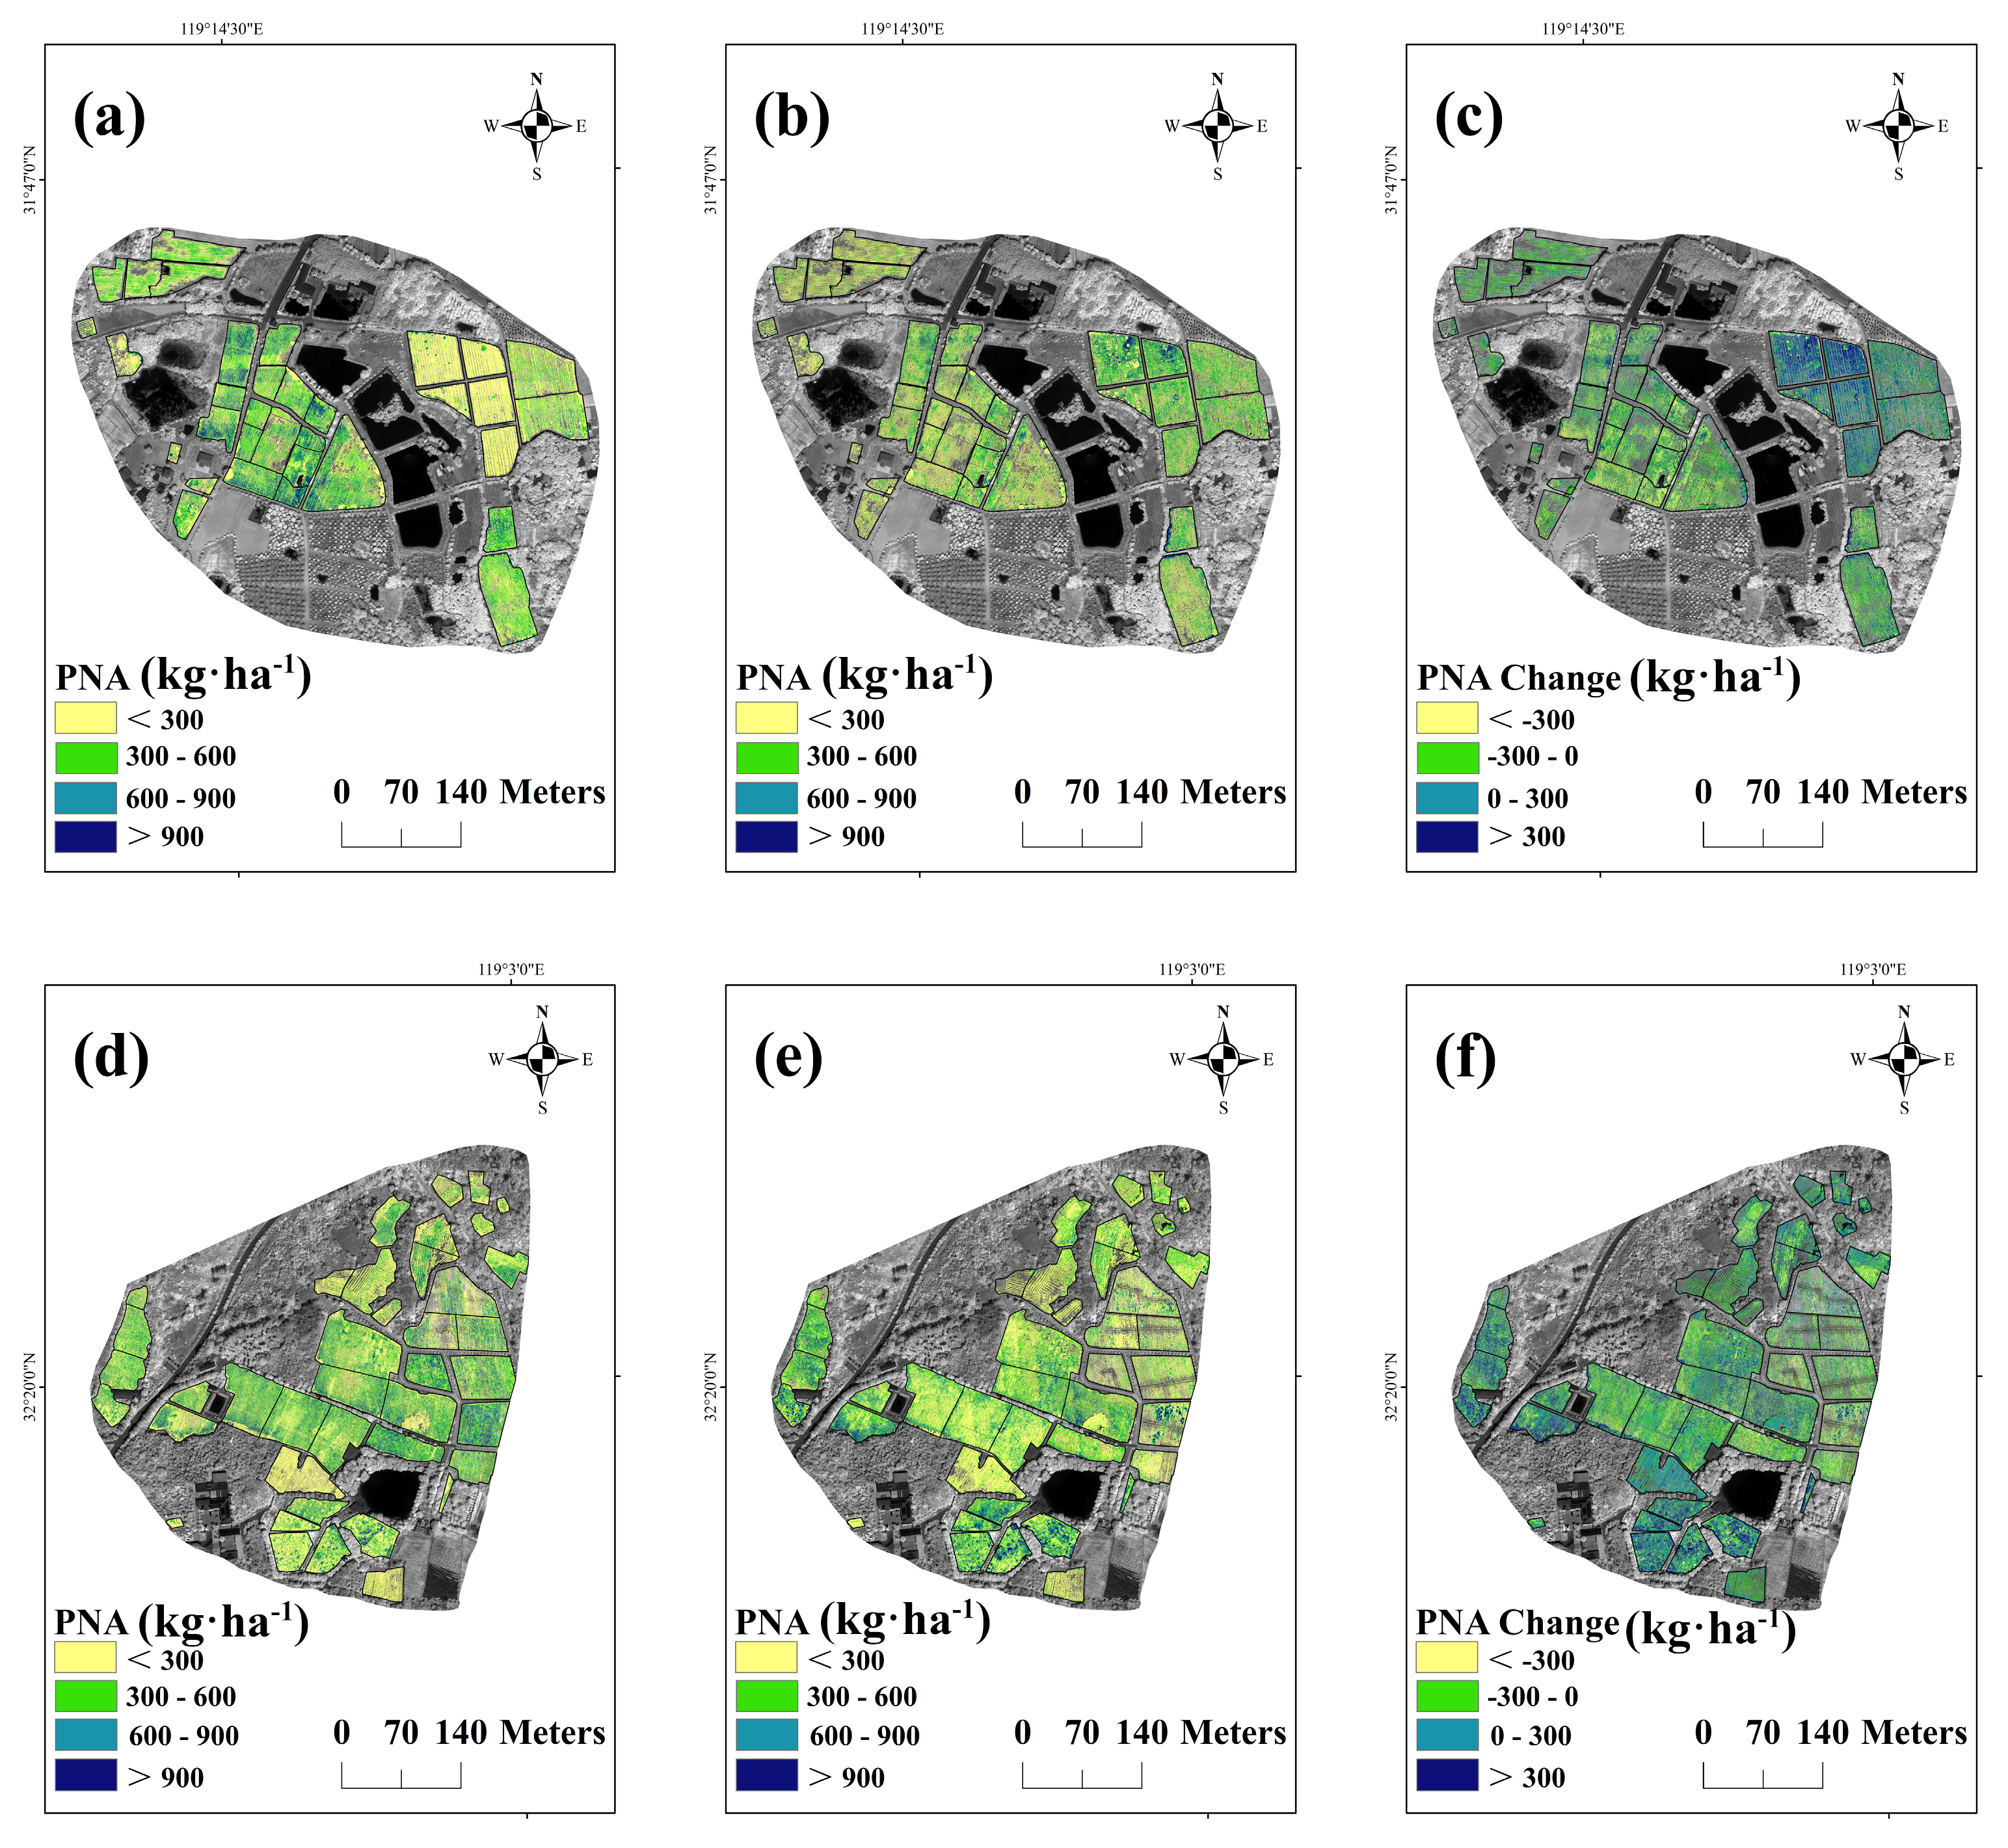
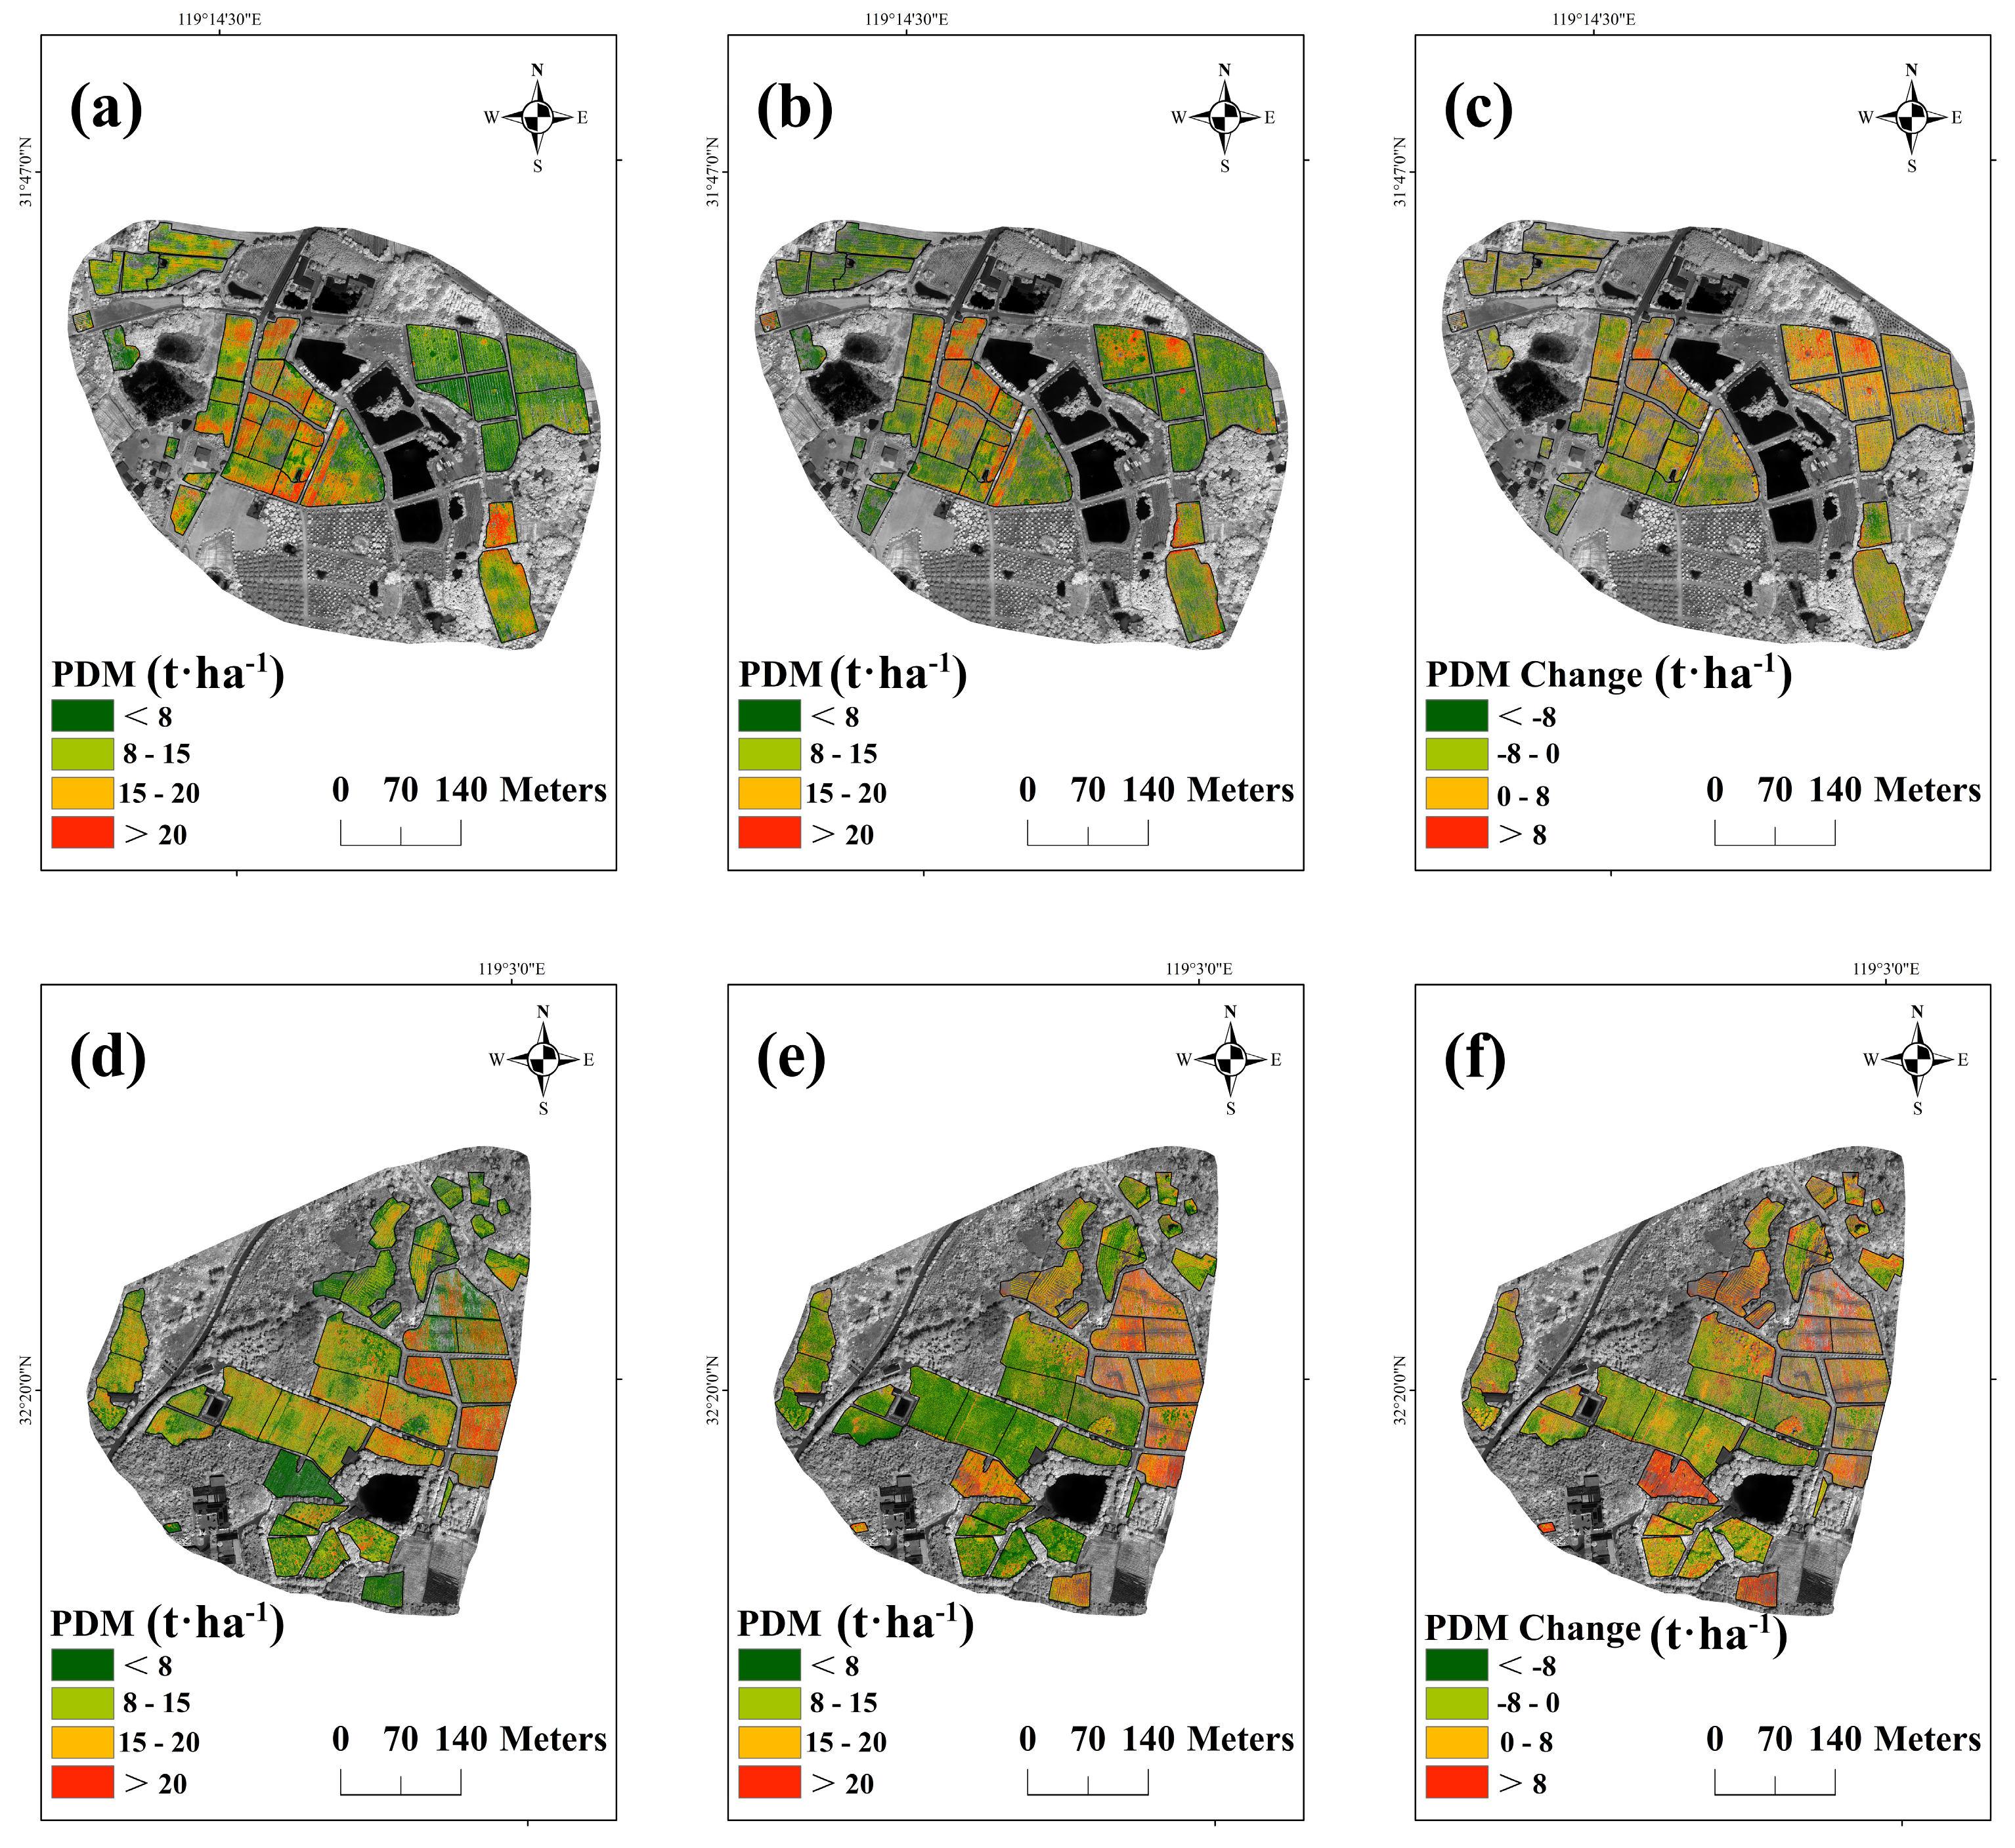
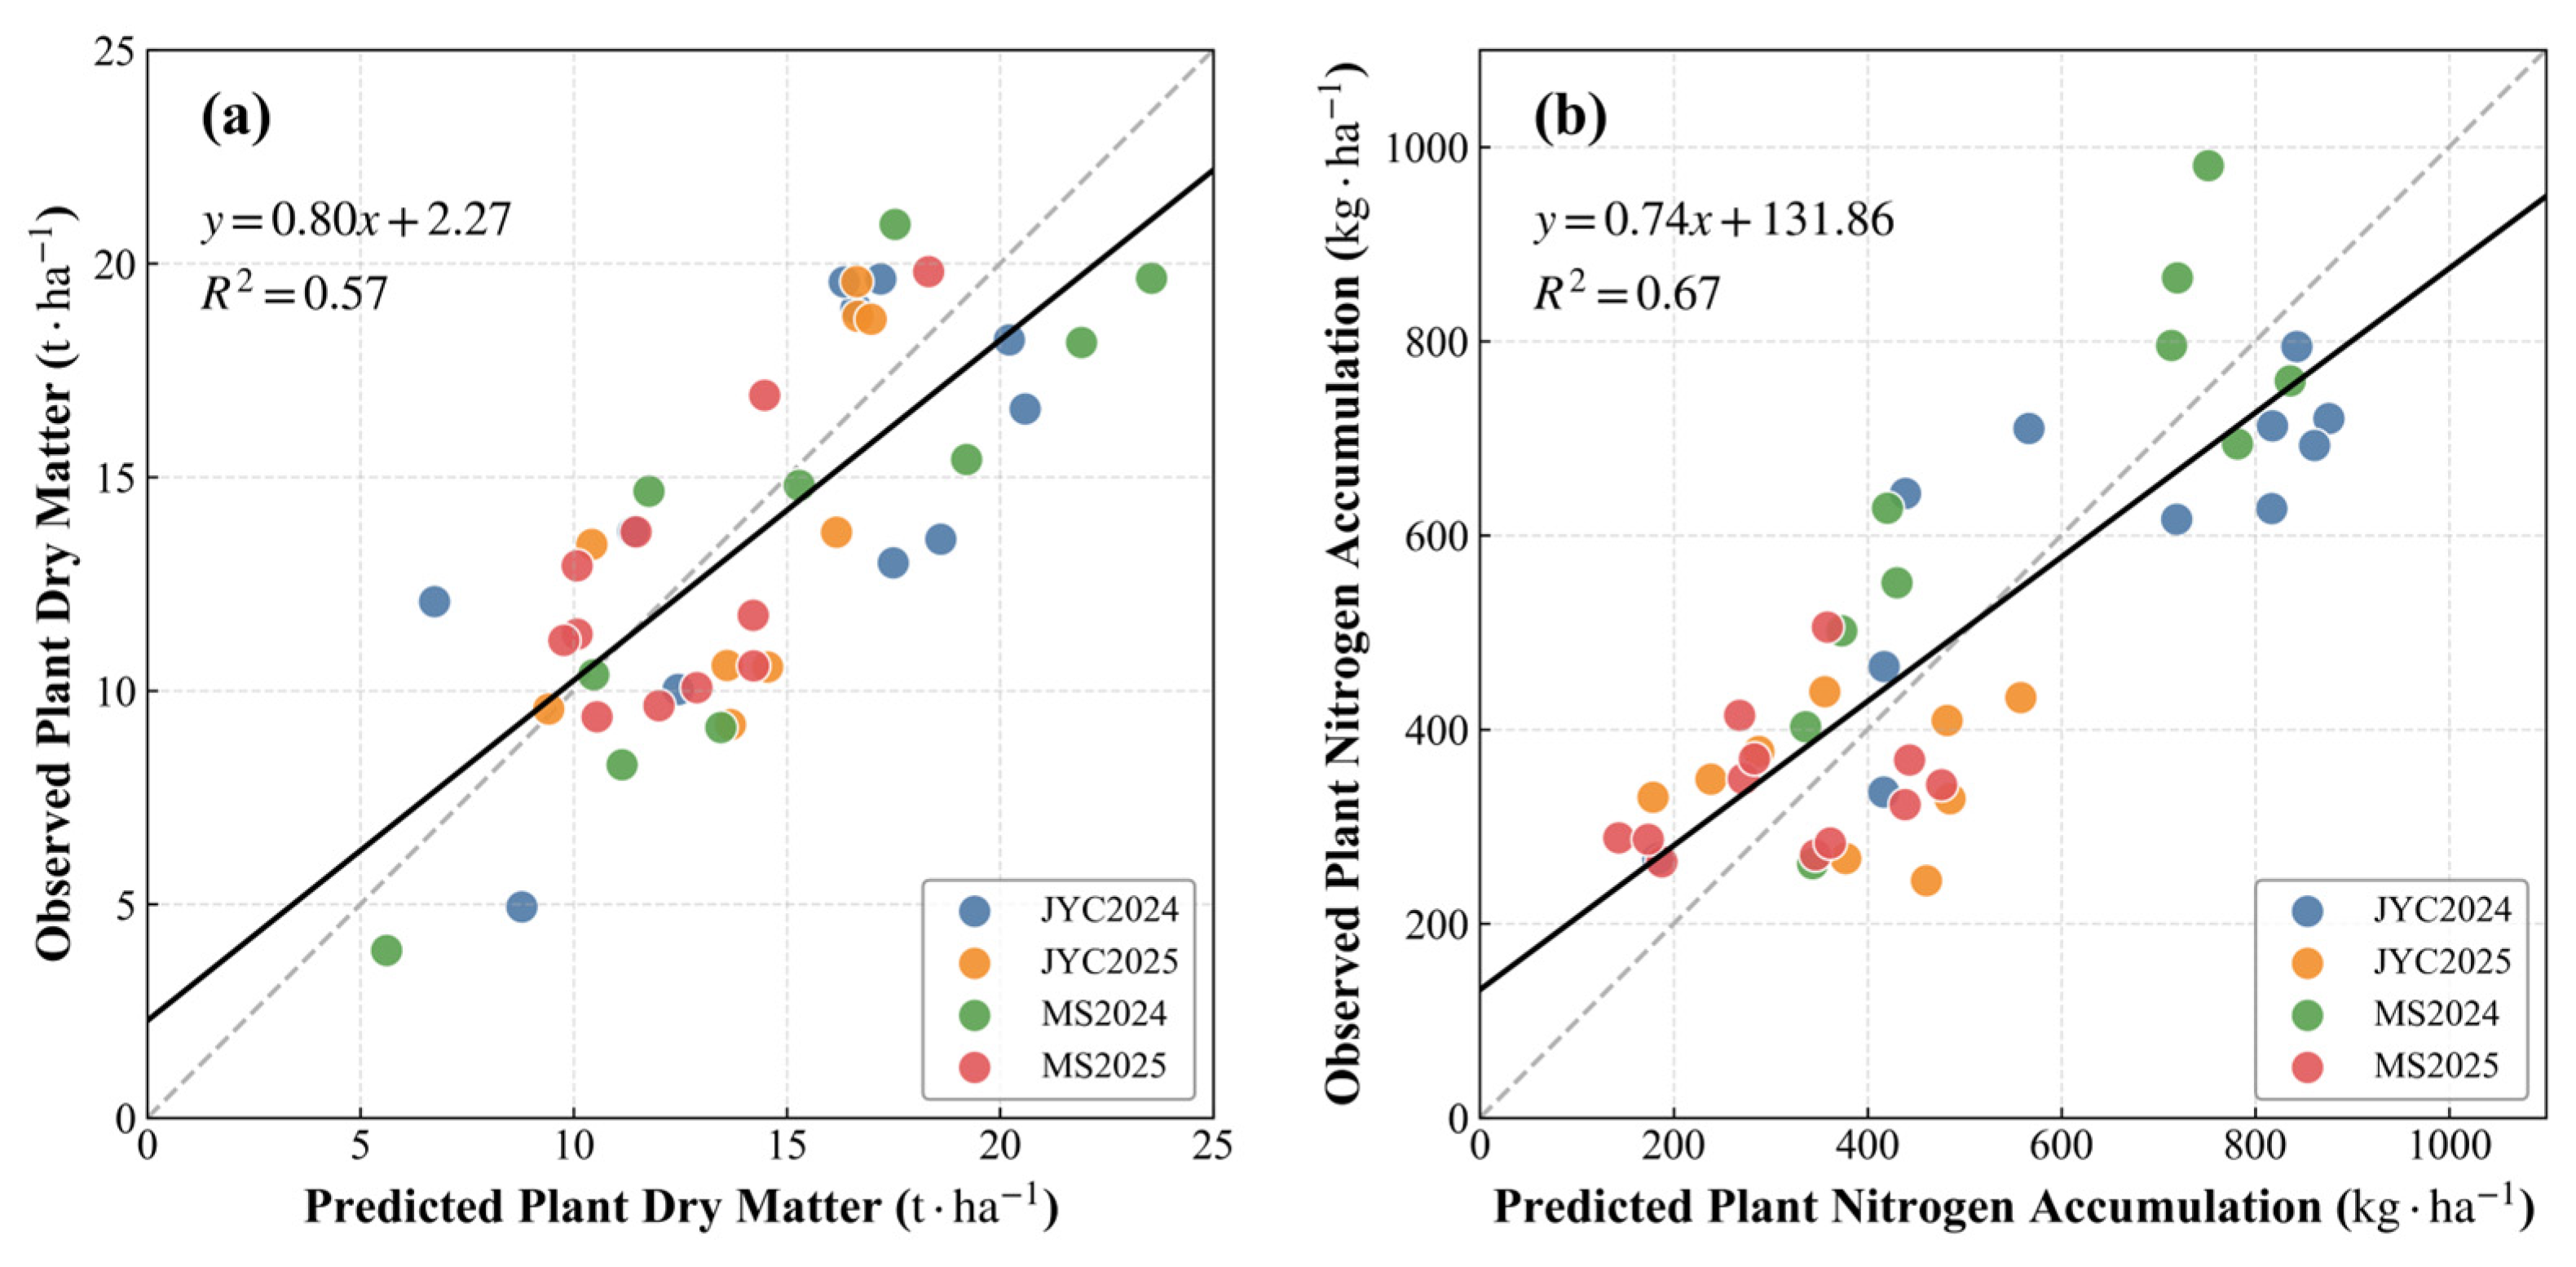
The optimal-performing deep learning models identified under the LOSO-CV framework were applied to UAV multispectral imagery of the experimental tea plantations, achieving pixel-wise retrieval of PDM and PNA (Figure 5 and Figure 6). The 2024–2025 spatial distribution maps generated by the models revealed heterogeneous spatial patterns of PDM and PNA, characterized by interleaved regions with relatively high and low values within the tea plantations. To assess the consistency between the model-derived maps and field observations, pixel values corresponding to the GPS coordinates of field sampling points were extracted from the spatial prediction maps using GIS and compared with the corresponding laboratory-measured values. The validation set showed that the coefficients of determination (R2) for PDM and PNA reached 0.57 and 0.67 (Figure 7), respectively, with the scatter points closely distributed around the 1:1 reference line.
Based on descriptive statistics (Table 7), the temporal dynamics of the two tea plantations exhibited distinct interannual variations rather than identical temporal patterns. The Juyuanchun (JYC) tea plantation showed an increasing trend in model-derived growth parameters from 2024 to 2025, with the mean PDM increasing from 10.68 to 12.72 t·ha−1 and the mean PNA increasing from 338.22 to 343.18 kg·ha−1. The spatial CV values of PDM and PNA increased from 28.68% and 27.48% to 32.98% and 31.86%, respectively, indicating increased spatial variability.
In contrast, the Maoshan (MS) tea plantation exhibited relatively limited interannual changes during the same period, with only slight decreases in the estimated growth parameters. The mean PDM decreased marginally from 11.59 to 11.32 t·ha−1, while the mean PNA decreased from 359.87 to 327.85 kg·ha−1. Meanwhile, the spatial CV values of PDM and PNA decreased from 30.07% and 33.43% to 28.30% and 27.92%, respectively. These differences derived from the spatial prediction maps should be interpreted as model-derived estimates of interannual variation rather than direct measurements of physiological changes, because the magnitude and direction of the mapped differences may be influenced by retrieval models, acquisition timing, phenological stages, and plantation characteristics. The results highlight the potential of the proposed deep learning framework for characterizing plantation-specific spatial heterogeneity and temporal variations in tea plant growth across different plantations.

4. Discussion

4.1. Construction of New Remote Sensing Indices Based on Multi-Type Feature Fusion

The accurate retrieval of crop growth parameters relies on a feature representation strategy capable of comprehensively capturing canopy biochemical and structural characteristics. Single spectral reflectance or conventional vegetation indices often exhibit limited sensitivity under dense canopy conditions due to spectral saturation and insufficient representation of canopy structural heterogeneity. In this study, a data-driven strategy was developed to systematically explore complementary information from original spectral reflectance, spatial texture features, and frequency-domain harmonic components. All candidate feature combinations were exhaustively generated under predefined mathematical formulations, and representative TFIs were identified through exploratory screening according to their associations with tea growth parameters within the investigated dataset. Previous studies have demonstrated that optimized multi-band indices can identify informative spectral combinations and improve crop trait estimation by exploiting complementary spectral responses [22,26]. Recent studies have demonstrated the effectiveness of integrating UAV-derived features with environmental information for tea growth monitoring. Jiang et al. [13] achieved high prediction accuracy by combining UAV spectral, texture, color features, and meteorological variables with optimized machine learning algorithms. However, their framework incorporated synchronous environmental observations as additional predictive information to further enhance model performance. In contrast, the present study focused on extracting complementary information from standard UAV multispectral imagery through spectral–textural–harmonic feature construction. In addition to meteorological variables, some multi-source fusion frameworks incorporate additional sensing modalities, such as hyperspectral measurements or structural sensors (e.g., LiDAR), which may increase data acquisition complexity and limit scalability for large-scale tea plantation monitoring [9,13]. To clarify the methodological differences between previous feature integration strategies and the present study, Table 8 summarizes representative studies regarding feature types, fusion strategies, sensing requirements, and their relevance to crop trait monitoring. Therefore, the main contribution of this study lies not simply in combining multiple feature sources, but in developing compact empirical indices that enable multi-domain information fusion using only conventional UAV multispectral imagery, thereby providing an alternative strategy that reduces dependence on additional hyperspectral, LiDAR, or environmental observations.
Regarding predictive performance, models using the selected TFIs achieved cross-validated R2 values up to 0.63 for biomass parameters and 0.62 for nitrogen accumulation parameters under the LOSO-CV framework. By integrating these compact multi-domain features with deep learning architectures, the predictive performance was further improved, with the optimal models achieving R2 values of 0.56 for LDM (MLP), 0.59 for PDM (MLP), 0.73 for LNA (MLP), and 0.68 for PNA (CNN). The difference between the present study and Jiang et al. [13] should be interpreted considering their distinct input configurations and validation objectives. Jiang et al. [13] emphasized maximizing prediction accuracy through multi-source data integration, whereas the present study evaluated the cross-site predictive behavior of UAV-derived intrinsic information using a site-held-out LOSO-CV framework. Notably, the present UAV-only framework achieved competitive predictive capability, particularly for LNA, despite not incorporating external meteorological variables. The lower prediction errors obtained by models using the selected TFIs compared with conventional vegetation indices were further supported by site-level paired t-tests (Table 5), which confirmed that the selected TFIs achieved significantly lower prediction errors than the best-performing conventional indices (p < 0.05). These results suggest that within the investigated dataset, complementary information from different feature domains may provide more informative representations of tea canopy characteristics compared with traditional reflectance-based indices alone. Rather than representing direct physical or optical mechanisms, the optimal feature combinations should be interpreted as empirical predictors associated with tea growth parameters. For structural parameters (LDM and PDM), the optimal indices—TFI-3 (ENT10, B10, B8) for LDM (R2 = 0.63) and TFI-1 (B8, A3, MEA5) for PDM (R2 = 0.57)—showed strong contributions from near-infrared, red-edge, harmonic, and texture features. The NIR region is widely recognized for its sensitivity to canopy structure and biomass-related variation, while red-edge information has been reported to maintain sensitivity under dense canopy conditions and may reduce the saturation effects commonly observed in traditional vegetation indices [4,27,28]. Furthermore, texture features such as ENT10 and MEA5 provide complementary information related to canopy spatial heterogeneity and structural variation [10,11]. These findings suggest that integrating spectral and spatial information can improve biomass estimation by capturing both spectral responses and canopy structural characteristics. In this study, however, the selected feature combinations should not be interpreted as direct physiological indicators. Although the SAVI formulation (with L = 0.5) was originally designed to reduce soil-background effects in reflectance-based vegetation indices, its application involving harmonic amplitude (A3) does not represent a literal soil-adjustment mechanism. Instead, the SAVI-type formulation functions as a nonlinear mathematical transformation between heterogeneous feature domains, which empirically improved prediction performance within the evaluated dataset. Therefore, the contribution of these constructed indices should be understood from a data-driven feature representation perspective rather than from direct physiological or optical mechanisms.
Table 8. Summary of previously reported remote sensing features for crop monitoring and feature fusion.
Target CropFeature Domains IntegratedKey Findings Supporting Multi-Feature FusionReference
RiceSpectral + TexturalIntegrating spatial texture features with spectral reflectance effectively mitigates the canopy saturation bottlenecks in high-density vegetation rows.Lu et al. (2020) [22]
Winter WheatSpectral + TexturalMachine learning models utilizing fused multimodal features outperform single-source single-index approaches in monitoring crop growth parameters.Su et al. (2025) [11]
Tea PlantsLiDAR-derived Structure + MultispectralThe synergistic mechanism between canopy 3D structure and spectral features yields highly robust non-destructive estimation of the nitrogen nutrition index (NNI).Li et al. (2026) [9]
Tea PlantsSpectral + HarmonicFrequency-domain variables (amplitude and phase) via FFT can uncover latent wave morphology variations that are completely missed by conventional broadband indices.Jiang et al. (2025) [29]
Tea plantsUAV-derived spectral, texture, and color features + meteorological dataDemonstrated that integrating UAV-derived spectral, texture, and color features with meteorological variables improved the machine learning-based estimation of tea growth parameters (leaf dry matter and nitrogen accumulation) and enhanced plantation-scale spatial variability assessment.Jiang et al. (2025) [13]
Tea PlantsSpectral + Textural + HarmonicThe proposed data-driven tri-feature optimization framework provides a deeper empirical decoupling of multi-source heterogeneous signals for high-precision growth tracking.This Study
For nitrogen-related parameters (LNA and PNA), the optimal indices—TFI-4 (CA3, SA1, COR9) for LNA (R2 = 0.62) and TFI-4 (CA1, COR6, P1) for PNA (R2 = 0.52)—were mainly composed of harmonic and texture features. This finding suggests that frequency-domain transformations may capture spectral response patterns associated with canopy nitrogen variation rather than directly representing nitrogen concentration itself. Although harmonic components do not directly measure biochemical traits, their selection indicates that frequency-domain representations of spectral waveform variation contain useful predictive information associated with nitrogen-related canopy changes [30]. The harmonic amplitude describes variations in spectral energy distribution, whereas phase components should be regarded as mathematical descriptors of waveform characteristics rather than direct indicators of physiological shifts [31,32]. Similarly, texture correlation features provide complementary information related to canopy spatial consistency and local growth variability. Therefore, the contribution of harmonic and texture features should be interpreted as an empirical representation of complex canopy responses rather than a direct physiological mechanism. Overall, the proposed multi-feature fusion framework demonstrated the potential of integrating spectral, spatial, and frequency-domain information for tea growth monitoring using standard UAV multispectral imagery. The experimental design, including multiple representative tea-producing regions, major cultivars, and two consecutive spring harvest seasons in Jiangsu Province, enabled an evaluation under heterogeneous field conditions. By evaluating model performance under a site-held-out LOSO-CV framework conditional on the selected feature combinations, these findings suggest that the proposed data-driven feature screening strategy provides a potential pathway for constructing compact multi-domain indicators and improving UAV-based tea plantation monitoring.

4.2. Performance Comparison and Interpretation of Deep Learning Algorithms in Tea Plant Growth Monitoring

The deep learning models achieved competitive predictive performance compared with the traditional RF model for different tea plant growth indicators, which is consistent with recent empirical findings in remote sensing-based crop monitoring. For instance, Wang et al. [17] demonstrated that deep neural networks could effectively utilize UAV-derived multi-source features for crop monitoring tasks and improve prediction performance compared with conventional machine learning approaches. In this study, statistical analysis (Table S2) indicated that under the site-held-out LOSO-CV framework conditional on the selected feature combinations, none of the optimal deep learning models exhibited statistically significant reductions in MAE compared with RF (p > 0.05), although several deep learning models achieved lower numerical errors for specific indicators. These results suggest that the predictive advantages of deep learning should be interpreted within the evaluated dataset rather than considered as universal superiority over traditional machine learning approaches. While RF effectively captures nonlinear relationships through ensemble decision trees, deep neural networks provide an alternative hierarchical representation strategy that may facilitate the modeling of complex associations among heterogeneous feature combinations consisting of spectral, texture, and harmonic information. This advantage may become more relevant when processing multi-domain feature spaces, although model performance ultimately depends on the interaction between architecture, feature representation, and dataset characteristics [14].
Within the comparison of different deep learning architectures, the optimal models varied across physiological targets: the MLP achieved the best performance for LDM, PDM, and LNA, whereas the CNN achieved the optimal performance for PNA. These divergent results should be interpreted as empirical performance differences under the current experimental conditions rather than definitive relationships between specific network architectures and crop physiological traits. For biomass-related indicators (LDM and PDM) and LNA, the relatively stable performance of MLP may be associated with the suitability of its compact nonlinear mapping structure for the selected feature representations. Compared with more complex architectures, the relatively simple structure of MLP may facilitate the establishment of stable feature-response mappings under limited sample conditions.
Conversely, the CNN achieved the best performance for PNA prediction, which may be related to its capability to extract local feature patterns and hierarchical combinations within the organized multi-source feature representations. Although transformer-based models theoretically provide global feature interaction through the self-attention mechanism [33], their performance was relatively limited in this study. This may be attributed to the restricted sample size and the higher architectural complexity, which increases the difficulty of achieving robust generalization under limited training conditions. Similarly, the optimal performance of CNN for PNA should not be interpreted as evidence of an inherent physiological specificity of convolutional structures, but rather as an empirical outcome related to the current feature representation and dataset characteristics [19]. Overall, the results demonstrate that high-precision agricultural remote sensing depends not only on integrating multi-source features, but also on selecting modeling strategies that match the characteristics of the available feature representations and dataset size. Rather than indicating the universal superiority of a specific deep learning architecture, this study highlights that the interaction between feature representation and model structure is a critical factor determining predictive performance.

4.3. Precision Management Decision-Making for Tea Plantations Based on UAV Remote Sensing Platforms and Intelligent Models

In modern intensive tea plantation management, the spatial precision and timeliness of growth information represent the primary constraints to achieving precision agriculture. While traditional point-wise field surveys are accurate, they inherently mask the existing spatial variability. Although satellite remote sensing offers broad coverage, it is frequently hindered by cloud interference and long revisit periods, limiting its ability to satisfy the requirements of precise monitoring in the hilly and fragmented tea plantations of southern China [5,34]. In contrast, the high-resolution “area-based” mapping developed in this study—utilizing UAV low-altitude remote sensing integrated with deep learning—provides considerable advantages for characterizing fine-scale spatial variability within tea plantations. Unlike most current studies that remain limited to small-scale validation or single-indicator pixel-level assessments (e.g., Wang et al. [17]), this research successfully extends deep learning retrieval to macro-scale spatial heterogeneity analysis. This leap from “micro-retrieval” to a “synoptic monitoring” perspective provides a robust data foundation for transitioning tea plantation management from coarse plot-level interventions to plant-level precision operations.
Another important finding of this study is the capability of the proposed framework to characterize interannual patterns and spatial heterogeneity across different tea plantations. In the case analysis of Section 3.5, the mapping results and descriptive statistics (Table 7) revealed distinct temporal trajectories between Juyuanchun (JYC) and Maoshan (MS) from 2024 to 2025, with noticeable but plantation-specific variations in growth parameters. Specifically, the estimated mean values increased by 2.04 t·ha−1 for PDM and 4.96 kg·ha−1 for PNA in JYC, whereas MS showed decreases of 0.27 t·ha−1 and 32.02 kg·ha−1 for PDM and PNA, respectively. These differences should therefore be interpreted as model-derived estimates of interannual patterns rather than direct evidence of physiological changes, because the observed patterns may be affected by multiple factors, including growth conditions, acquisition timing, phenological stages, and plantation characteristics. The observed differences may also reflect variations in cultivar composition and local environmental conditions (e.g., Longjing 43 and Wuniuzao at MS). While previous UAV-based crop monitoring studies have typically focused on broader evolution patterns during natural growth stages [34,35], the ability of the proposed “multi-source feature + deep learning” framework to characterize plantation-specific temporal responses and spatial variability demonstrates its potential for the continuous monitoring of tea plantation growth dynamics.
This highly visualized “growth and nutrition diagnostic report” directly empowers precision decision-making in modern tea plantations. By identifying low-value areas (nitrogen deficiency) from the PNA distribution maps, managers can generate targeted variable-rate topdressing prescription maps, fundamentally transforming the traditional “one-size-fits-all” uniform fertilization model. This not only effectively enhances fertilizer use efficiency, but also controls soil acidification and water non-point source pollution caused by over-fertilization at the source, balancing economic benefits with ecological sustainability [1,2]. Furthermore, based on the spatial distribution patterns of PDM, differentiated harvesting plans can be implemented to rationally allocate labor and machinery resources according to growth conditions, significantly improving operational efficiency. This study successfully established a technical closed-loop of “UAV sensing–deep learning retrieval–precision mapping”. The framework demonstrated potential for monitoring spatial and temporal variations in tea growth parameters across multiple plantations and years. Future studies should further incorporate longer-term observations and additional environmental variables to improve the interpretation and uncertainty assessment of mapped interannual changes.

4.4. Model Applicability and Limitations

While the proposed multi-domain feature fusion and deep learning framework demonstrated robust predictive performance across multiple tea plantations, several boundary conditions and limitations must be acknowledged. Given the relatively limited field sample size, the deep learning models developed in this study should be interpreted as exploratory models rather than fully generalized operational solutions. Although rigorous LOSO-CV, compact feature representation, and regularization strategies were employed to mitigate overfitting risks, broader applicability requires further validation using larger datasets covering more cultivars, regions, and growth seasons. As an exploratory data-driven study, the empirical indices and models were optimized based on spring tea harvest data in Jiangsu Province. Because nutrient allocation and biochemical metabolic processes in tea canopies vary significantly across growing seasons [36], the current models may experience reduced accuracy if directly applied to summer and autumn without recalibration. Furthermore, the model’s applicability outside the current dataset—such as under extreme climatic conditions, complex mountainous topography, or diverse soil backgrounds (e.g., high-altitude regions in Southwest China or red-soil regions in South China)—remains to be systematically validated. Future research should extend the monitoring window to the entire annual growth cycle and incorporate a wider range of cultivars and environmental conditions. Additionally, while standard multispectral imagery was utilized to ensure large-scale operational efficiency, integrating precise three-dimensional structural parameters from LiDAR or canopy temperature features from thermal infrared sensors could further enhance the robustness of this non-destructive diagnostic system against environmental noise [9,19].

5. Conclusions

The results demonstrated that the selected multi-domain feature combinations, including TFI-3 (ENT10, B10, B8) and TFI-1 (B8, A3, MEA5), provided informative representations for LDM and PDM estimation, respectively. Similarly, TFI-4 (CA3, SA1, COR9) and TFI-4 (CA1, COR6, P1) showed improved predictive performance for LNA and PNA estimation compared with conventional vegetation indices within the investigated dataset. Furthermore, this study demonstrated the potential of machine learning and deep learning approaches for modeling heterogeneous multi-source remote sensing features. Under the LOSO-CV framework, models incorporating the selected feature combinations achieved cross-validated R2 values of 0.56, 0.59, 0.73, and 0.68 for LDM, PDM, LNA, and PNA estimation, respectively. Specifically, the MLP model achieved the best performance for LDM (R2 = 0.56), PDM (R2 = 0.59), and LNA (R2 = 0.73), whereas the CNN model showed the highest accuracy for PNA estimation (R2 = 0.68). Although deep learning models exhibited competitive predictive performance compared with the RF baseline, no statistically significant reductions in MAE were observed under the site-held-out LOSO-CV evaluation conditional on the selected feature combinations. The plantation-scale spatial distribution maps generated using the optimal models provided model-derived estimates of spatial heterogeneity and potential interannual variations in biomass and nitrogen status, which should be interpreted considering the influence of the retrieval models. Overall, the proposed framework provides a UAV-based strategy for tea growth monitoring by integrating spectral, spatial texture, and frequency-domain information without requiring additional environmental observations. By transforming heterogeneous UAV-derived features into compact empirical representations, this framework offers a potential approach for improving information utilization efficiency in UAV-based tea plantation monitoring.

Supplementary Materials

The following supporting information can be downloaded at: https://www.mdpi.com/article/10.3390/rs18172923/s1, Supplementary Table S1: Calculation formulas for the conventional vegetation indices. Supplementary Table S2: Statistical significance analysis of the optimal deep learning models compared with the random forest baseline based on LOSO-CV MAE values. Supplementary Figure S1: Distribution patterns of the standardized values (Z-scores) of the selected optimal features used for constructing the optimal tri-feature indices (TFIs). Violin plots illustrate the probability density, median, interquartile range, and overall variability of each feature across all samples. Supplementary Listing S1: MATLAB implementation for the exhaustive search of tri-domain feature indices (TFIs). Refs. [37,38,39,40] have been cited in the Supplementary Materials.

Author Contributions

L.Y. and J.J. conceived the work. Y.L. conducted the modeling, data gathering, and analysis; analyzed the results; and wrote the first draft of the manuscript. W.F. and J.J. contributed to funding acquisition. All authors contributed to data gathering. All authors have read and agreed to the published version of the manuscript.

Funding

This research was funded by the Postdoctoral Fellowship Program of CPSF (GZC20240720), the General Program of China Postdoctoral Science Foundation (2024M761440), the China Agriculture Research System of MOF and MARA (CARS-19), the Jiangsu Province Industry-University-Research Cooperation Project (BY20240370), the Nanjing Digital Agriculture Science and Technology Achievement Integration Innovation and Demonstration Project (202510), the Changzhou Agricultural Science and Technology Innovation Project (202506), the Suzhou Science and Technology Project (SNG2023001), and the Major Science and Technology Projects in Yunnan Province (202402AE090015).

Data Availability Statement

Supplementary Materials contains the index-search code and additional supporting information related to feature construction and index optimization. The original UAV multispectral data, field measurements, feature datasets, optimized index combinations, and model implementation files are not publicly available due to data management considerations but can be obtained from the corresponding author upon reasonable request.

Acknowledgments

We thank all of the reviewers who provided valuable comments for this paper.

Conflicts of Interest

The authors declare no conflicts of interest.

Abbreviations

The following abbreviations are used in this manuscript:
SNAStem nitrogen accumulation
LNALeaf nitrogen accumulation
PNAPlant nitrogen accumulation
LDMLeaf dry matter
SDMStem dry matter
PDMPlant dry matter
CNNConvolutional neural network
MLPMultilayer perceptron
LNCLeaf nitrogen concentration
SNCStem nitrogen concentration
NNINitrogen nutrition index
TFIsTri-feature fusion indices
ROIsRegions of interest
DFTDiscrete Fourier transform
MSEMean squared error
FFTFast Fourier transform
GLCMGray-level co-occurrence matrix
RFRandom forest
UAVUnmanned aerial vehicle
DLDeep learning
MAEMean absolute error
NMAENormalized mean absolute error
R2Coefficient of determination
RMSERoot mean square error
RERelative error

References

  1. Ye, J.; Wang, Y.H.; Kang, J.Q.; Chen, Y.L.; Hong, L.; Li, M.Z.; Jia, Y.; Wang, Y.C.; Jia, X.L.; Wu, Z.Y.; et al. Effects of long-term use of organic fertilizer with different dosages on soil improvement, nitrogen transformation, tea yield and quality in acidified tea plantations. Plants 2023, 12, 122. [Google Scholar] [CrossRef] [Scilit] [PubMed]
  2. Ni, K.; Liao, W.; Yi, X.; Niu, S.; Ma, L.; Shi, Y.; Zhang, Q.; Liu, M.; Ruan, J. Fertilization status and reduction potential in tea gardens of China. J. Plant Nutr. Fert. 2019, 25, 421–432. [Google Scholar]
  3. Wei, Y.; Wen, Y.Q.; Huang, X.L.; Ma, P.H.; Wang, L.; Pan, Y.; Lv, Y.J.; Wang, H.X.; Zhang, L.; Wang, K.B.; et al. The dawn of intelligent technologies in tea industry. Trends Food Sci. Technol. 2024, 144, 104337. [Google Scholar] [CrossRef] [Scilit]
  4. Liu, Y.; Fan, Y.; Yue, J.; Jin, X.; Ma, Y.; Chen, R.; Bian, M.; Yang, G.; Feng, H. A model suitable for estimating above-ground biomass of potatoes at different regional levels. Comput. Electron. Agric. 2024, 222, 109081. [Google Scholar] [CrossRef] [Scilit]
  5. Riihimäki, H.; Luoto, M.; Heiskanen, J. Estimating fractional cover of tundra vegetation at multiple scales using unmanned aerial systems and optical satellite data. Remote Sens. Environ. 2019, 224, 119–132. [Google Scholar] [CrossRef] [Scilit]
  6. Zhang, C.; Kovacs, J.M. The application of small unmanned aerial systems for precision agriculture: A review. Precis. Agric. 2012, 13, 693–712. [Google Scholar] [CrossRef] [Scilit]
  7. Tsouros, D.C.; Bibi, S.; Sarigiannidis, P.G. A review on UAV-based applications for precision agriculture. Information 2019, 10, 349. [Google Scholar] [CrossRef] [Scilit]
  8. Kong, X.; Xu, B.; Meng, Y.; Liao, Q.; Wang, Y.; Li, Z.; Yang, G.; Xu, Z.; Yang, H. Assessing tea foliar quality by coupling image segmentation and spectral information of multispectral imagery. Eur. J. Agron. 2025, 164, 127491. [Google Scholar] [CrossRef] [Scilit]
  9. Li, Z.; Gong, S.; Jiang, X.; Yang, W.; Wang, W.; Qian, W.; Wang, Y.; Ding, Z.; Fan, K. Integrating UAV multi-sensor imagery and machine learning for non-destructive estimation of nitrogen nutrition index in tea plants. Sci. Hortic. 2026, 357, 114614. [Google Scholar] [CrossRef] [Scilit]
  10. Zheng, H.; Ma, J.; Zhou, M.; Li, D.; Yao, X.; Cao, W.; Zhu, Y.; Cheng, T. Enhancing the nitrogen signals of rice canopies across critical growth stages through the integration of textural and spectral information from unmanned aerial vehicle (UAV) multispectral imagery. Remote Sens. 2020, 12, 957. [Google Scholar] [CrossRef] [Scilit]
  11. Su, Y.; Yan, X.; Li, H.; Liang, Z.; Zhao, S.; Chen, P.; Zhang, Z.; Qiao, X.; Zhao, Y.; Feng, M.; et al. Monitoring the growth status of winter wheat by using the machine learning algorithm and the fusion of spectral and texture features derived from the UAV remote sensing. Comput. Electron. Agric. 2025, 237, 110758. [Google Scholar] [CrossRef] [Scilit]
  12. Jiang, J.; Ji, H.; Yan, Y.; Zhao, L.; Pan, R.; Liu, X.; Yin, J.; Duan, Y.; Ma, Y.; Zhu, X.; et al. Mining sensitive hyperspectral feature to non-destructively monitor biomass and nitrogen accumulation status of tea plant throughout the whole year. Comput. Electron. Agric. 2024, 225, 109358. [Google Scholar] [CrossRef] [Scilit]
  13. Jiang, J.; Ji, H.; Zhou, G.; Pan, R.; Zhao, L.; Duan, Z.; Liu, X.; Yin, J.; Duan, Y.; Ma, Y.; et al. Non-Destructive Monitoring of Tea Plant Growth through UAV Spectral Imagery and Meteorological Data Using Machine Learning and Parameter Optimization Algorithms. Comput. Electron. Agric. 2025, 229, 109795. [Google Scholar] [CrossRef] [Scilit]
  14. Maimaitijiang, M.; Sagan, V.; Sidike, P.; Hartling, S.; Esposito, F.; Fritschi, F.B. Soybean yield prediction from UAV using multimodal data fusion and deep learning. Remote Sens. Environ. 2020, 237, 111599. [Google Scholar] [CrossRef] [Scilit]
  15. Li, H.; Li, Q.; Yu, C.; Luo, S. Unified estimation of rice canopy leaf area index over multiple periods based on UAV multispectral imagery and deep learning. Plant Methods 2025, 21, 73. [Google Scholar] [CrossRef] [Scilit] [PubMed]
  16. Huang, S.; Wang, X.; Cui, H.; Liang, Q.; Ning, S.; Yang, H.; Wang, P.; Sheng, J. Estimation of cotton aboveground biomass based on UAV multispectral images: Multi-feature fusion and CNN model. Agronomy 2026, 16, 74. [Google Scholar] [CrossRef] [Scilit]
  17. Wang, S.M.; Ma, J.H.; Zhao, Z.M.; Yang, H.Z.Y.; Xuan, Y.M.; Ouyang, J.X.; Fan, D.M.; Yu, J.F.; Wang, X.C. Pixel-class prediction for nitrogen content of tea plants based on unmanned aerial vehicle images using machine learning and deep learning. Expert Syst. Appl. 2023, 227, 120351. [Google Scholar] [CrossRef] [Scilit]
  18. Jamali, A.; Lu, B.; Gerbrandt, E.M.; Teasdale, C.; Burlakoti, R.R.; Sabaratnam, S.; McIntyre, J.; Yang, L.; Schmidt, M.; McCaffrey, D.; et al. High-resolution UAV-based blueberry scorch virus mapping utilizing a deep vision transformer algorithm. Comput. Electron. Agric. 2025, 229, 109726. [Google Scholar] [CrossRef] [Scilit]
  19. Zhang, L.; Li, C.; Zhang, G.; Wu, X.; Zhou, L.; Chen, L.; Jiao, Y.; Liu, G.; Hei, W. Winter wheat yield estimation based on multisource remote sensing data: A dual-branch TCN-Transformer model and analysis of growth-stage feature transition mechanisms. Comput. Electron. Agric. 2025, 239, 111014. [Google Scholar] [CrossRef] [Scilit]
  20. Cooley, J.W.; Tukey, J.W. An algorithm for the machine calculation of complex Fourier series. Math. Comput. 1965, 19, 297–301. [Google Scholar] [CrossRef]
  21. Haralick, R.M.; Shanmugam, K.; Dinstein, I. Textural features for image classification. IEEE Trans. Syst. Man Cybern. 1973, 3, 610–621. [Google Scholar] [CrossRef] [Scilit]
  22. Lu, J.; Yang, T.; Su, X.; Qi, H.; Yao, X.; Cheng, T.; Zhu, Y.; Cao, W.; Tian, Y. Monitoring leaf potassium content using hyperspectral vegetation indices in rice leaves. Precis. Agric. 2020, 21, 324–348. [Google Scholar] [CrossRef] [Scilit]
  23. Huete, A.R. A soil-adjusted vegetation index (SAVI). Remote Sens. Environ. 1988, 25, 295–309. [Google Scholar] [CrossRef] [Scilit]
  24. Peñuelas, J.; Baret, F.; Filella, I. Semi-empirical indices to assess carotenoids/chlorophyll a ratio from leaf spectral reflectance. Photosynthetica 1995, 31, 221–230. [Google Scholar]
  25. Wang, W.; Yao, X.; Tian, Y.; Liu, X.; Ni, J.; Cao, W.; Zhu, Y. Estimating leaf nitrogen concentration with three-band vegetation indices in rice and wheat. Field Crops Res. 2012, 129, 90–98. [Google Scholar] [CrossRef] [Scilit]
  26. Cao, Q.; Miao, Y.; Wang, H.; Huang, S.; Cheng, S.; Khosla, R.; Jiang, R. Non-destructive estimation of rice plant nitrogen status with Crop Circle multispectral active canopy sensor. Field Crops Res. 2013, 154, 133–144. [Google Scholar] [CrossRef] [Scilit]
  27. Mutanga, O.; Skidmore, A.K. Narrow band vegetation indices overcome the saturation problem in biomass estimation. Int. J. Remote Sens. 2004, 25, 3999–4014. [Google Scholar] [CrossRef] [Scilit]
  28. Yin, Y.; Chen, C.; Wang, Z.; Chang, J.; Guo, S.; Li, W.; Han, H.; Cai, Y.; Feng, Z. Research on remote sensing monitoring of key indicators of corn growth based on double red edges. Agronomy 2025, 15, 447. [Google Scholar] [CrossRef] [Scilit]
  29. Jiang, J.; Zhou, G.; Ji, H.; Pan, R.; Yang, L.; Zhao, S.; Fang, Z.; Liu, X.; Ma, Y.; Zhu, X.; et al. Advanced hyperspectral feature engineering for real-time prediction of tea quality in support of high-grade cultivation. Comput. Electron. Agric. 2025, 236, 110485. [Google Scholar] [CrossRef] [Scilit]
  30. Filella, I.; Peñuelas, J. The red edge position and shape as indicators of plant chlorophyll content, biomass and hydric status. Int. J. Remote Sens. 1994, 15, 1459–1470. [Google Scholar] [CrossRef] [Scilit]
  31. Mutanga, O.; Skidmore, A.K. Red edge shift and biochemical content in grass canopies. ISPRS J. Photogramm. Remote Sens. 2007, 62, 34–42. [Google Scholar] [CrossRef] [Scilit]
  32. Liu, Y.; Feng, H.; Fan, Y.; Yue, J.; Chen, R.; Ma, Y.; Bian, M.; Yang, G. Improving potato above ground biomass estimation combining hyperspectral data and harmonic decomposition techniques. Comput. Electron. Agric. 2024, 218, 108699. [Google Scholar] [CrossRef] [Scilit]
  33. Vaswani, A.; Shazeer, N.; Parmar, N.; Uszkoreit, J.; Jones, L.; Gomez, A.N.; Kaiser, Ł.; Polosukhin, I. Attention is all you need. Adv. Neural Inf. Process. Syst. 2017, 30, 5998–6008. [Google Scholar] [CrossRef] [Scilit]
  34. Xu, L.; Zhou, L.; Meng, R.; Zhao, F.; Lv, Z.; Xu, B.; Zeng, L.; Yu, X.; Peng, S. An improved approach to estimate ratoon rice aboveground biomass by integrating UAV-based spectral, textural and structural features. Precis. Agric. 2022, 23, 1276–1301. [Google Scholar] [CrossRef] [Scilit]
  35. Zeng, L.; Peng, G.; Meng, R.; Man, J.; Li, W.; Xu, B.; Lv, Z.; Sun, R. Wheat yield prediction based on unmanned aerial vehicles-collected red–green–blue imagery. Remote Sens. 2021, 13, 2937. [Google Scholar] [CrossRef] [Scilit]
  36. Zaman, F.; Zhang, E.; Khattak, W.A.; Li, J.; Ilyas, M.; Deng, X.; Ihtisham, M.; Guo, F.; Wang, P.; Wang, M.; et al. Natural variations and dynamics of macronutrients for 87 tea plant (Camellia sinensis) varieties throughout the growing seasons in Wuhan. Sci. Hortic. 2022, 306, 111425. [Google Scholar] [CrossRef] [Scilit]
  37. Tucker, C. Red and photographic infrared linear combinations for monitoring vegetation. Remote Sens. Environ. 1979, 8, 127–150. [Google Scholar] [CrossRef] [Scilit]
  38. Gitelson, A.A.; Kaufman, Y.J.; Merzlyak, M.N. Use of a green channel in remote sensing of global vegetation from EOS-MODIS. Remote Sens. Environ. 1996, 58, 289–298. [Google Scholar] [CrossRef] [Scilit]
  39. Barnes, E.M.; Clarke, T.R.; Richards, S.E.; Colaizzi, P.D.; Haberland, J.; Kostrzewski, M.; Waller, P.; Choi, C.; Riley, E.; Thompson, T.; et al. Coincident detection of crop water stress, nitrogen status, and canopy density using ground based multispectral data. In Proceedings of the Fifth International Conference on Precision Agriculture, Bloomington, MN, USA, 16–19 July 2000. [Google Scholar]
  40. Huete, A.; Didan, K.; Miura, T.; Rodriguez, E.P.; Gao, X.; Ferreira, L.G. Overview of the radiometric and biophysical performance of the MODIS vegetation indices. Remote Sens. Environ. 2002, 83, 195–213. [Google Scholar] [CrossRef] [Scilit]
Figure 1. Experimental sites and UAV-based multispectral remote sensing system. (a) Geographical locations of the eight tea plantation study sites. (b) The DJI Matrice 350 RTK UAV (DJI, Shenzhen, China). (c) The RedEdge-MX-Blue multispectral camera (MicaSense, Inc., Seattle, WA, USA).
Remotesensing 18 02923 g001
Figure 2. Correlation analysis between the harmonic decomposition components and target variables. Subplots (ad) illustrate the variations in the correlation coefficients of cosine amplitude, sine amplitude, amplitude, and phase with LDM (a), PDM (b), LNA (c), and PNA (d), respectively, as a function of the decomposition order.
Remotesensing 18 02923 g002
Figure 3. Heatmaps of the R2 between spectral indices based on different feature combinations and tea plant growth indicators. Note: (ad) R2 distributions of dual-feature indices with LDM, PDM, LNA, and PNA, respectively; (eh) R2 distributions of tri-feature indices with the aforementioned four growth indicators, respectively. SA, CA, A, and P represent the sine amplitude, cosine amplitude, harmonic amplitude, and phase of the harmonic features, respectively; ENT, MEA, and COR represent the entropy, mean, and correlation of the texture features, respectively.
Remotesensing 18 02923 g003
Figure 4. Linear quantitative analysis between the multi-feature remote sensing indices and tea plant growth indicators. (ad) Univariate linear regression results of the optimal dual-feature indices with LDM, PDM, LNA, PNA, respectively; (eh) Univariate linear regression results of the optimal tri-feature indices with LDM, PDM, LNA, and PNA, respectively.
Remotesensing 18 02923 g004
Figure 5. Spatial distribution maps of PDM for the Maoshan (ac) and Juyuanchun (df) tea gardens in 2024 and 2025, and their differences, respectively.
Remotesensing 18 02923 g005
Figure 6. Spatial distribution maps of PNA for the Maoshan (ac) and Juyuanchun (df) tea gardens in 2024 and 2025, and their differences, respectively.
Remotesensing 18 02923 g006
Figure 7. Simple linear regression analysis between the predicted and measured values for (a) PDM and (b) PNA. The solid line represents the linear regression line, and the dashed line represents the 1:1 line.
Remotesensing 18 02923 g007
Table 1. Summary of key information for the experiments performed in the current research.
Experiment NumberTea Plantation
Location
CultivarNumber of
Sampling Points
Sampling Stage
1PingshanJiukeng481 May 2024, 15 April 2025
2MaoshanLongjing 43, Wuniuzao2223 April 2024, 18 April 2025
3JuyuanchunLongjingchangye, Jiukeng2418 April 2024, 20 April 2025
4MaoshanchahaiZhongcha 108, Zhongcha 503, Shifocui1124 April 2024
5JiaguchunJiukeng111 May 2025
6TianwangwuChuyeqi248 May 2024, 23 April 2025
7HonglingXicha 11237 May 2024, 26 April 2025
8PuqiaoyujianLongjing 431214 April 2025
Table 2. Band information of RedEdge-MX-Blue multispectral camera.
Band NumberCenter Wavelength (nm)Band NameBand Width (nm)
B1444Coastal Blue28
B2475Blue32
B3531Green14
B4560Green27
B5650Red16
B6668Red14
B7705Red edge10
B8717Red edge12
B9740Red edge18
B10842Near infrared57
Table 3. Formula for calculating the vegetation index, band selection, and references.
CategoryVegetation IndexCalculation FormulaReference
Dual-Feature Spectral IndicesDifference Spectral Index (DSI)FiFjLu et al., 2020 [22]
Ratio Spectral Index (RSI)Fi/FjLu et al., 2020 [22]
Normalized Difference Spectral Index (NDSI)(FiFj)/(Fi + Fj)Lu et al., 2020 [22]
Soil Adjusted Vegetation Index (SAVI)(FiFj) × (1 + L)/(Fi + Fj + L)Huete, 1988 [23]
Tri-Feature fusion IndicesTri-Feature Index 1 (TFI-1)(FiFj)/(Fk + 0.1)Modified from Huete, 1988 [23]
Tri-Feature Index 2 (TFI-2)(Fi × Fj)/(Fk2 + 0.01)Modified from Lu et al., 2020 [22]
Tri-Feature Index 3 (TFI-3)(FiFj)/(FiFk) × (1 + Fk/Fj)Modified from Peñuelas et al., 1995 [24]
Tri-Feature Index 4 (TFI-4)(FiFjFk)/(Fi + Fj + Fk + 0.1)Modified from Wang et al., 2012 [25]
Note: OR: original reflectance; HF: harmonic features; TF: texture features. Fi, Fj, and Fk represent the optimal features selected from the comprehensive multi-source feature space encompassing OR, HF, and TF. For dual-feature indices, the optimal pair (Fi, Fj) was utilized, whereas for tri-feature indices, the optimal triplet (Fi, Fj, Fk) was applied. L represents the soil adjustment factor, which was set to 0.5 in this study.
Table 4. Results of the LOSO-CV-based univariate linear models for tea plant growth indicator estimation using selected feature indices.
IndicatorIndex TypeR2RMSENMAEMAE
LDM
(t·ha−1)
NDRE0.242.590.402.19
GNDVI0.262.530.392.10
NDVI0.032.950.452.46
EVI0.232.580.402.18
SAVI (A3, B8)0.621.820.261.41
TFI-3 (ENT10, B10, B8)0.631.780.261.40
PDM
(t·ha−1)
NDRE0.165.400.424.50
GNDVI0.245.070.394.23
NDVI0.125.470.414.47
EVI0.254.990.384.10
SAVI (B8, A3)0.553.880.283.04
TFI-1 (B8, A3, MEA5)0.573.770.283.04
LNA
(kg·ha−1)
NDRE0.12139.730.51117.10
GNDVI0.31121.230.44100.82
NDVI0.22129.190.44101.18
EVI0.26125.360.4399.38
RSI (SA2, B8)0.49103.920.3682.27
TFI-4 (CA3, SA1, COR9)0.6290.140.3068.14
PNA
(kg·ha−1)
NDRE0.09224.700.50181.37
GNDVI0.28195.160.44159.79
NDVI0.23205.040.45161.66
EVI0.25200.410.43156.50
RSI (CA3, B3)0.44172.330.39141.27
TFI-4 (CA1, COR6, P1)0.52160.540.33120.16
Note: The RMSE, NMAE, and MAE values reported in this table were calculated by pooling the predictions across all samples from the LOSO test folds. Bold values indicate the optimal index and the corresponding best prediction results for each tea plant growth parameter.
Table 5. Statistical comparison of prediction errors between models using selected multi-feature indices (dual- and tri-feature) and conventional vegetation indices under LOSO-CV.
TargetComparisonProposed Index MAEBest VI MAEtpCohen’s dzResult
LDMSAVI (A3, B8) vs. GNDVI1.331.77−1.650.140.58ns
TFI-3 (ENT10, B10, B8) vs. GNDVI1.261.77−2.380.0490.84*
PDMSAVI (B8, A3) vs. EVI2.984.11−2.250.060.80ns
TFI-1 (B8, A3, MEA5) vs. EVI3.034.11−2.980.021.06*
LNARSI (SA2, B8) vs. GNDVI83.5895.41−0.730.490.26ns
TFI-4 (CA3, SA1, COR9) vs. GNDVI66.5995.41−4.090.011.44*
PNARSI (CA3, B3) vs. GNDVI141.68154.12−1.510.170.53ns
TFI-4 (CA1, COR6, P1) vs. GNDVI125.82154.12−3.180.021.12*
Note: The MAE values represent the mean absolute prediction error for each independent test site (n = 8) obtained under the LOSO-CV framework. Importantly, this site-level mean differs from the pooled overall MAE reported in Table 4, as these specific values were used to conduct the paired t-tests. The MAE reduction was calculated relative to the best-performing conventional vegetation index for each target parameter. The statistical significance of the MAE reduction was assessed using site-level paired t-tests. The asterisk (*) denotes a statistically significant difference (p < 0.05), while ‘ns’ indicates no significant difference. Cohen’s dz is reported to quantify the standardized effect size of the improvement.
Table 6. LOSO-CV results of growth indicator monitoring models based on deep learning algorithms and multi-index fusion.
IndicatorIndexR2RMSENMAEMAE
LDM
(t·ha−1)
RF0.551.960.281.52
CNN0.522.030.301.62
MLP0.561.930.291.57
Transformer0.412.240.341.86
PDM
(t·ha−1)
RF0.464.240.313.32
CNN0.394.490.333.61
MLP0.593.700.272.96
Transformer0.533.960.303.19
LNA
(kg·ha−1)
RF0.7178.280.2659.64
CNN0.7079.400.2761.19
MLP0.7375.330.2557.73
Transformer0.40112.690.4193.25
PNA
(kg·ha−1)
RF0.62142.450.28101.51
CNN0.68130.190.2795.91
MLP0.62141.430.31112.09
Transformer0.55154.440.33118.87
Note: The RMSE, NMAE, and MAE values reported in this table were calculated by pooling the predictions across all samples from the LOSO test folds. Bold values indicate the best-performing model and its corresponding prediction results for each tea plant growth parameter.
Table 7. Descriptive statistics of growth parameters in typical tea gardens from 2024 to 2025.
Garden NameParameterYearMinMaxMeanSDCV/%
JYCPDM
(t·ha−1)
20244.1519.1410.683.0628.68
20258.1021.2112.724.1932.98
2025–2024+3.95+2.07+2.04+1.13
PNA
(kg·ha−1)
2024125.90572.60338.2292.9627.48
2025173.90535.59343.18109.3231.86
2025–2024+48.00−37.01+4.96+16.36
MSPDM
(t·ha−1)
20245.2619.311.593.4830.07
20255.5917.5811.323.2028.30
2025–2024+0.33−1.72−0.27−0.28
PNA
(kg·ha−1)
2024173.95634.39359.87120.3033.43
2025173.32551.05327.8591.5327.92
2025–2024−0.63−83.34−32.02−28.77
Disclaimer/Publisher’s Note: The statements, opinions and data contained in all publications are solely those of the individual author(s) and contributor(s) and not of MDPI and/or the editor(s). MDPI and/or the editor(s) disclaim responsibility for any injury to people or property resulting from any ideas, methods, instructions or products referred to in the content.