


Highlights
What are the main findings?
- A mask- and contiguity-constrained power pattern matching method (MC-PMM) is proposed for SAR subarray power-pattern synthesis.
- MC-PMM improves mask-constrained pattern synthesis while preserving physically contiguous subarray topologies.
What are the implications of the main findings?
- The method supports lower-cost SAR antenna array design by optimizing subarray partitions and weights while maintaining ambiguity suppression and mainlobe sensitivity.
- The physically contiguous topology avoids feed-line crossovers and improves the engineering realizability of clustered phased arrays.
Abstract
In high-resolution wide-swath (HRWS) spaceborne synthetic aperture radar (SAR) systems, clustered phased array (CPA) architectures alleviate hardware costs but face critical subarray synthesis challenges: manually prescribed pattern masks, redundant equality matching, and unrealizable crossover topologies. This paper proposes a mask- and contiguity-constrained power pattern matching method (MC-PMM) to address these limitations. First, a semidefinite programming (SDP) procedure constructs an SAR-metric-aware SDP-relaxed reference mask for the noise equivalent sigma zero (NESZ) and range ambiguity-to-signal ratio (RASR) requirements within the relaxed covariance space. Second, a dynamic programming (DP) strategy is integrated with a novel mask-constrained iterative projection method (Mask-IPM) to optimize physically contiguous partitions and weights. By transforming equality waveform fitting into mask-violation-based inequality matching, MC-PMM focuses restricted spatial degrees of freedom onto critical performance boundaries. Simulations on a 64-element array demonstrate that, at a subarray ratio of , MC-PMM achieves a 100% crossover-free topology. Furthermore, relative to the conventional equality matching framework, it lowers the mean RASR by dB, with a negligible worst-case NESZ degradation of under dB.
1. Introduction
Synthetic aperture radar (SAR), with its all-weather high-resolution microwave imaging capability, has become an indispensable remote sensing payload for Earth observation [1,2]. In contemporary spaceborne SAR system design, the high-resolution wide-swath (HRWS) imaging framework [3] drives the evolution of platform-level performance. Under the conventional single-channel SAR configuration, high azimuth resolution and wide range coverage impose conflicting requirements on the pulse repetition frequency (PRF): the former demands a higher PRF to satisfy the azimuth sampling criterion, whereas the latter requires a lower PRF to avoid range ambiguity [4]. The multi-channel receive-processing architecture has thus become the mainstream technical pathway for next-generation HRWS spaceborne SAR missions [5,6], in which digital beamforming with scan-on-receive (DBF-SCORE) [7,8,9] and frequency scanning (f-SCAN) [10] achieve range ambiguity suppression and sensitivity optimization through distinct routes. Additionally, advanced beamforming frameworks have been widely investigated for adaptive sidelobe level and interference control [11]. Recently, multiple-input multiple-output (MIMO) architectures have been introduced, which fundamentally rely on precise elevation spatial filtering to simultaneously separate orthogonal echoes and suppress range ambiguities [12].
To realize such exquisite spatial filtering under metric constraints, the conventional design workflow inversely maps the radar equation to construct antenna pattern masks from system-level metrics, namely the range ambiguity-to-signal ratio (RASR) and noise equivalent sigma zero (NESZ) [4,13,14]. To solve the resulting mask-constrained problems, heuristic techniques such as particle swarm optimization [15,16,17] are widely utilized, though they lack global optimality guarantees. More generally, mask-constrained shaped-beam power synthesis has also been studied for fixed-geometry arrays [18]. As a rigorous alternative, deterministic convex programming based on semidefinite programming (SDP) emerged. Early SDP formulations achieved global optimality for complex field-pattern matching [19] and were later advanced to strictly bounded power pattern synthesis under shaped-beam envelopes and polarization constraints [20,21]. Recently, this deterministic framework was extended to spaceborne SAR range ambiguity suppression [22]. Nevertheless, a critical limitation persists: existing SAR mask-design methods usually start from prescribed NESZ and RASR requirements and construct antenna masks that satisfy these given thresholds. They do not explicitly probe what NESZ/RASR-related mask levels the given array aperture can deliver. Consequently, the subsequent CPA synthesis may start from a conservative mask, although a more demanding reference may be supported by the same array.
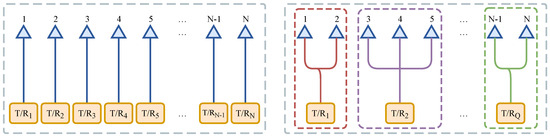
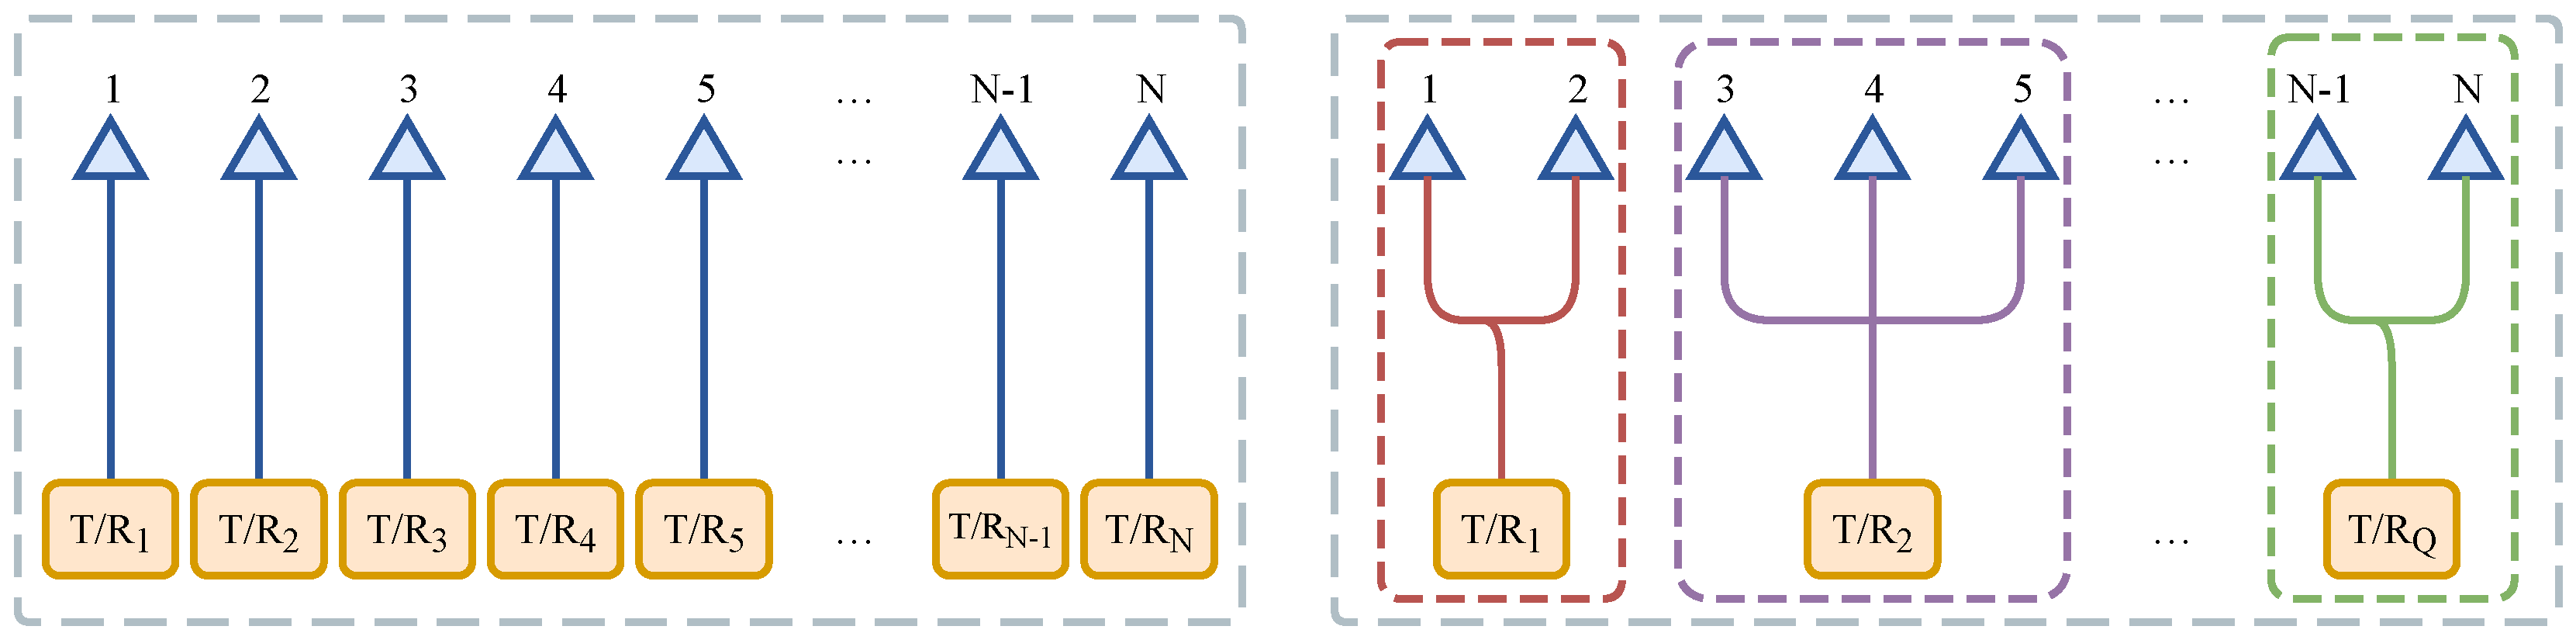
Meanwhile, the hardware implementation of an ideal fully populated phased array (FPA) for large-aperture configurations becomes impractical [23,24] since each antenna element requires an independent transmit/receive module (TRM), as illustrated in the left panel of Figure 1. Consequently, the clustered phased array (CPA) architecture, which partitions array elements into subarrays sharing a single TRM (see the right panel of Figure 1), serves as the standard engineering compromise [25,26]. While existing subarray synthesis predominantly targets azimuth high-gain mainlobes, the subarray synthesis of elevation arrays is substantially more challenging due to the stringent null-depth demands for range ambiguity suppression. This difficulty is further amplified because the mainlobe gain required by NESZ must be maintained while the ambiguity-region sidelobes constrained by RASR must be deeply suppressed. This TRM-count reduction irreversibly degrades both RASR and NESZ.
Figure 1.
Schematic diagram of antenna array architectures: (left), the ideal FPA architecture; (right), the CPA architecture.
The subarray synthesis under CPA architectures jointly involves two coupled design variables: the subarray partition and the subarray weights. The subarray partitioning problem determines which antenna elements each TRM connects to, while the subarray weighting determines the complex excitation applied to each TRM, and both jointly shape the resulting power pattern. Mathematically, the subarray partitioning task is a highly non-convex integer combinatorial optimization problem whose solution space scales exponentially with the element count [27]. Owing to practical microwave feed-network constraints, each subarray is further required to occupy a contiguous physical segment of antenna elements, a property hereafter referred to as physical spatial contiguity. Such contiguous routing reduces crossover feed lines and helps simplify feed routing, shorten or regularize line lengths, and alleviate loss and phase-stability imbalances [25,26]. For broadside pattern synthesis, classical grouping theory [28] establishes that the contiguous partition is inherently optimal, which underpins a series of early excitation matching methods (EMM) [29,30] that jointly optimize the partition and the subarray weights, with the latter determined by directly averaging the ideal full-array excitations. Subsequent EMM variants further employ K-means clustering in the excitation-ratio feature space to replace the earlier heuristic searches for the partitioning subproblem [31,32]. Clustered-array pattern optimization has also been investigated as a route to reducing feed-network complexity [33]. Recent subarray synthesis studies further show that the problem can also be treated under compressive-sensing and off-grid optimization frameworks, although these formulations may involve non-uniform arrays and element-position optimization [34]. When the design scope is extended to scanned or shaped beams [35], however, the contiguous partition is no longer guaranteed to be optimal, and the excitation-matching strategy exposes inherent suboptimality due to the nonlinear excitation-to-power pattern mapping. To resolve this domain misalignment, the power pattern matching method (PMM) [36] relocates the joint optimization directly into the power pattern domain. The weighting subproblem draws upon the classical iterative projection method (IPM) framework [37,38]; although the IPM inherently supports inequality constraints suitable for mask envelope optimization, the PMM [36] restricts itself to an equality projection, which enforces excessive matching of sidelobe regions outside the range ambiguity zones and squanders the scarce spatial degrees of freedom inherent to CPA. The partitioning subproblem, in turn, is addressed by K-means clustering in the element power pattern feature space without incorporating physical spatial contiguity, inevitably yielding a crossover subarray topology that violates practical feed-network requirements. These limitations indicate that SAR elevation subarray synthesis requires a design route that first derives SAR-metric-aware pattern constraints and then searches for a physically contiguous subarray realization under those constraints.
To address the methodological limitations discussed above, this paper proposes a mask- and contiguity-constrained power pattern matching method (MC-PMM). The MC-PMM consists of two progressive phases corresponding to three methodological innovations:
- SAR-metric-aware reference mask generation. Instead of only constructing a mask from prescribed NESZ and RASR thresholds, phase I uses SDP relaxation to search for a reference envelope for the given array under the SAR metric constraints. The resulting SDP-relaxed mask and extracted full-array reference pattern provide a numerical benchmark for the subsequent CPA synthesis. The approximately rank-one behavior is also checked from the covariance solution itself, and the reference pattern is evaluated by its mask violation.
- Physically contiguous topology generation. Physical contiguity is introduced as a hard constraint, which equivalently transforms the partitioning problem into identifying optimal segmentation points within a one-dimensional ordered element sequence. A DP framework based on Bellman’s principle of optimality is then constructed, generating a physically contiguous subarray topology satisfying the feed network engineering constraints within polynomial time complexity.
- Mask-violation-based inequality matching. The optimization objective is reformulated from the conventional equality matching framework to an inequality envelope matching framework, which imposes penalty only on pattern components that violate the mask constraint. The proposed mask-constrained iterative projection method (Mask-IPM), a mask-constrained variant of the IPM, enables the limited subarray degrees of freedom to be precisely steered toward critical constraint regions such as the mainlobe swath and ambiguous zones, thereby eliminating the excessive matching that arises from the conventional equality matching framework.
The remainder of this paper is organized as follows: Section 2 establishes the array signal model under the spaceborne SAR elevation observation geometry and translates system-level metrics into a mask-constrained squared Euclidean distance cost function; Section 3 elaborates on the two-phase MC-PMM solution procedure; Section 4 validates the proposed method through numerical simulations; Section 5 discusses model assumptions and practical extensions; Section 6 concludes the paper.
2. System Model and Problem Formulation
2.1. SAR System Geometry and Performance Metrics
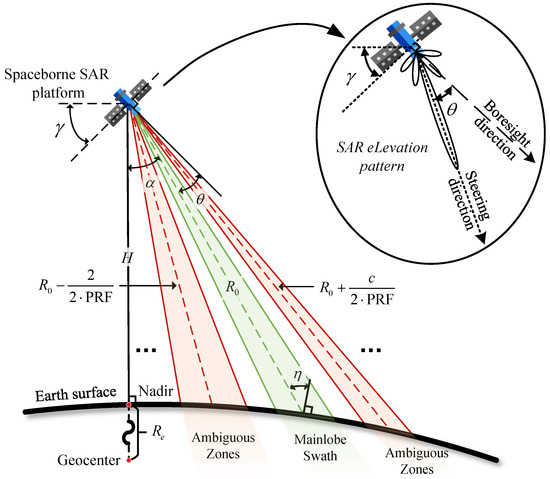
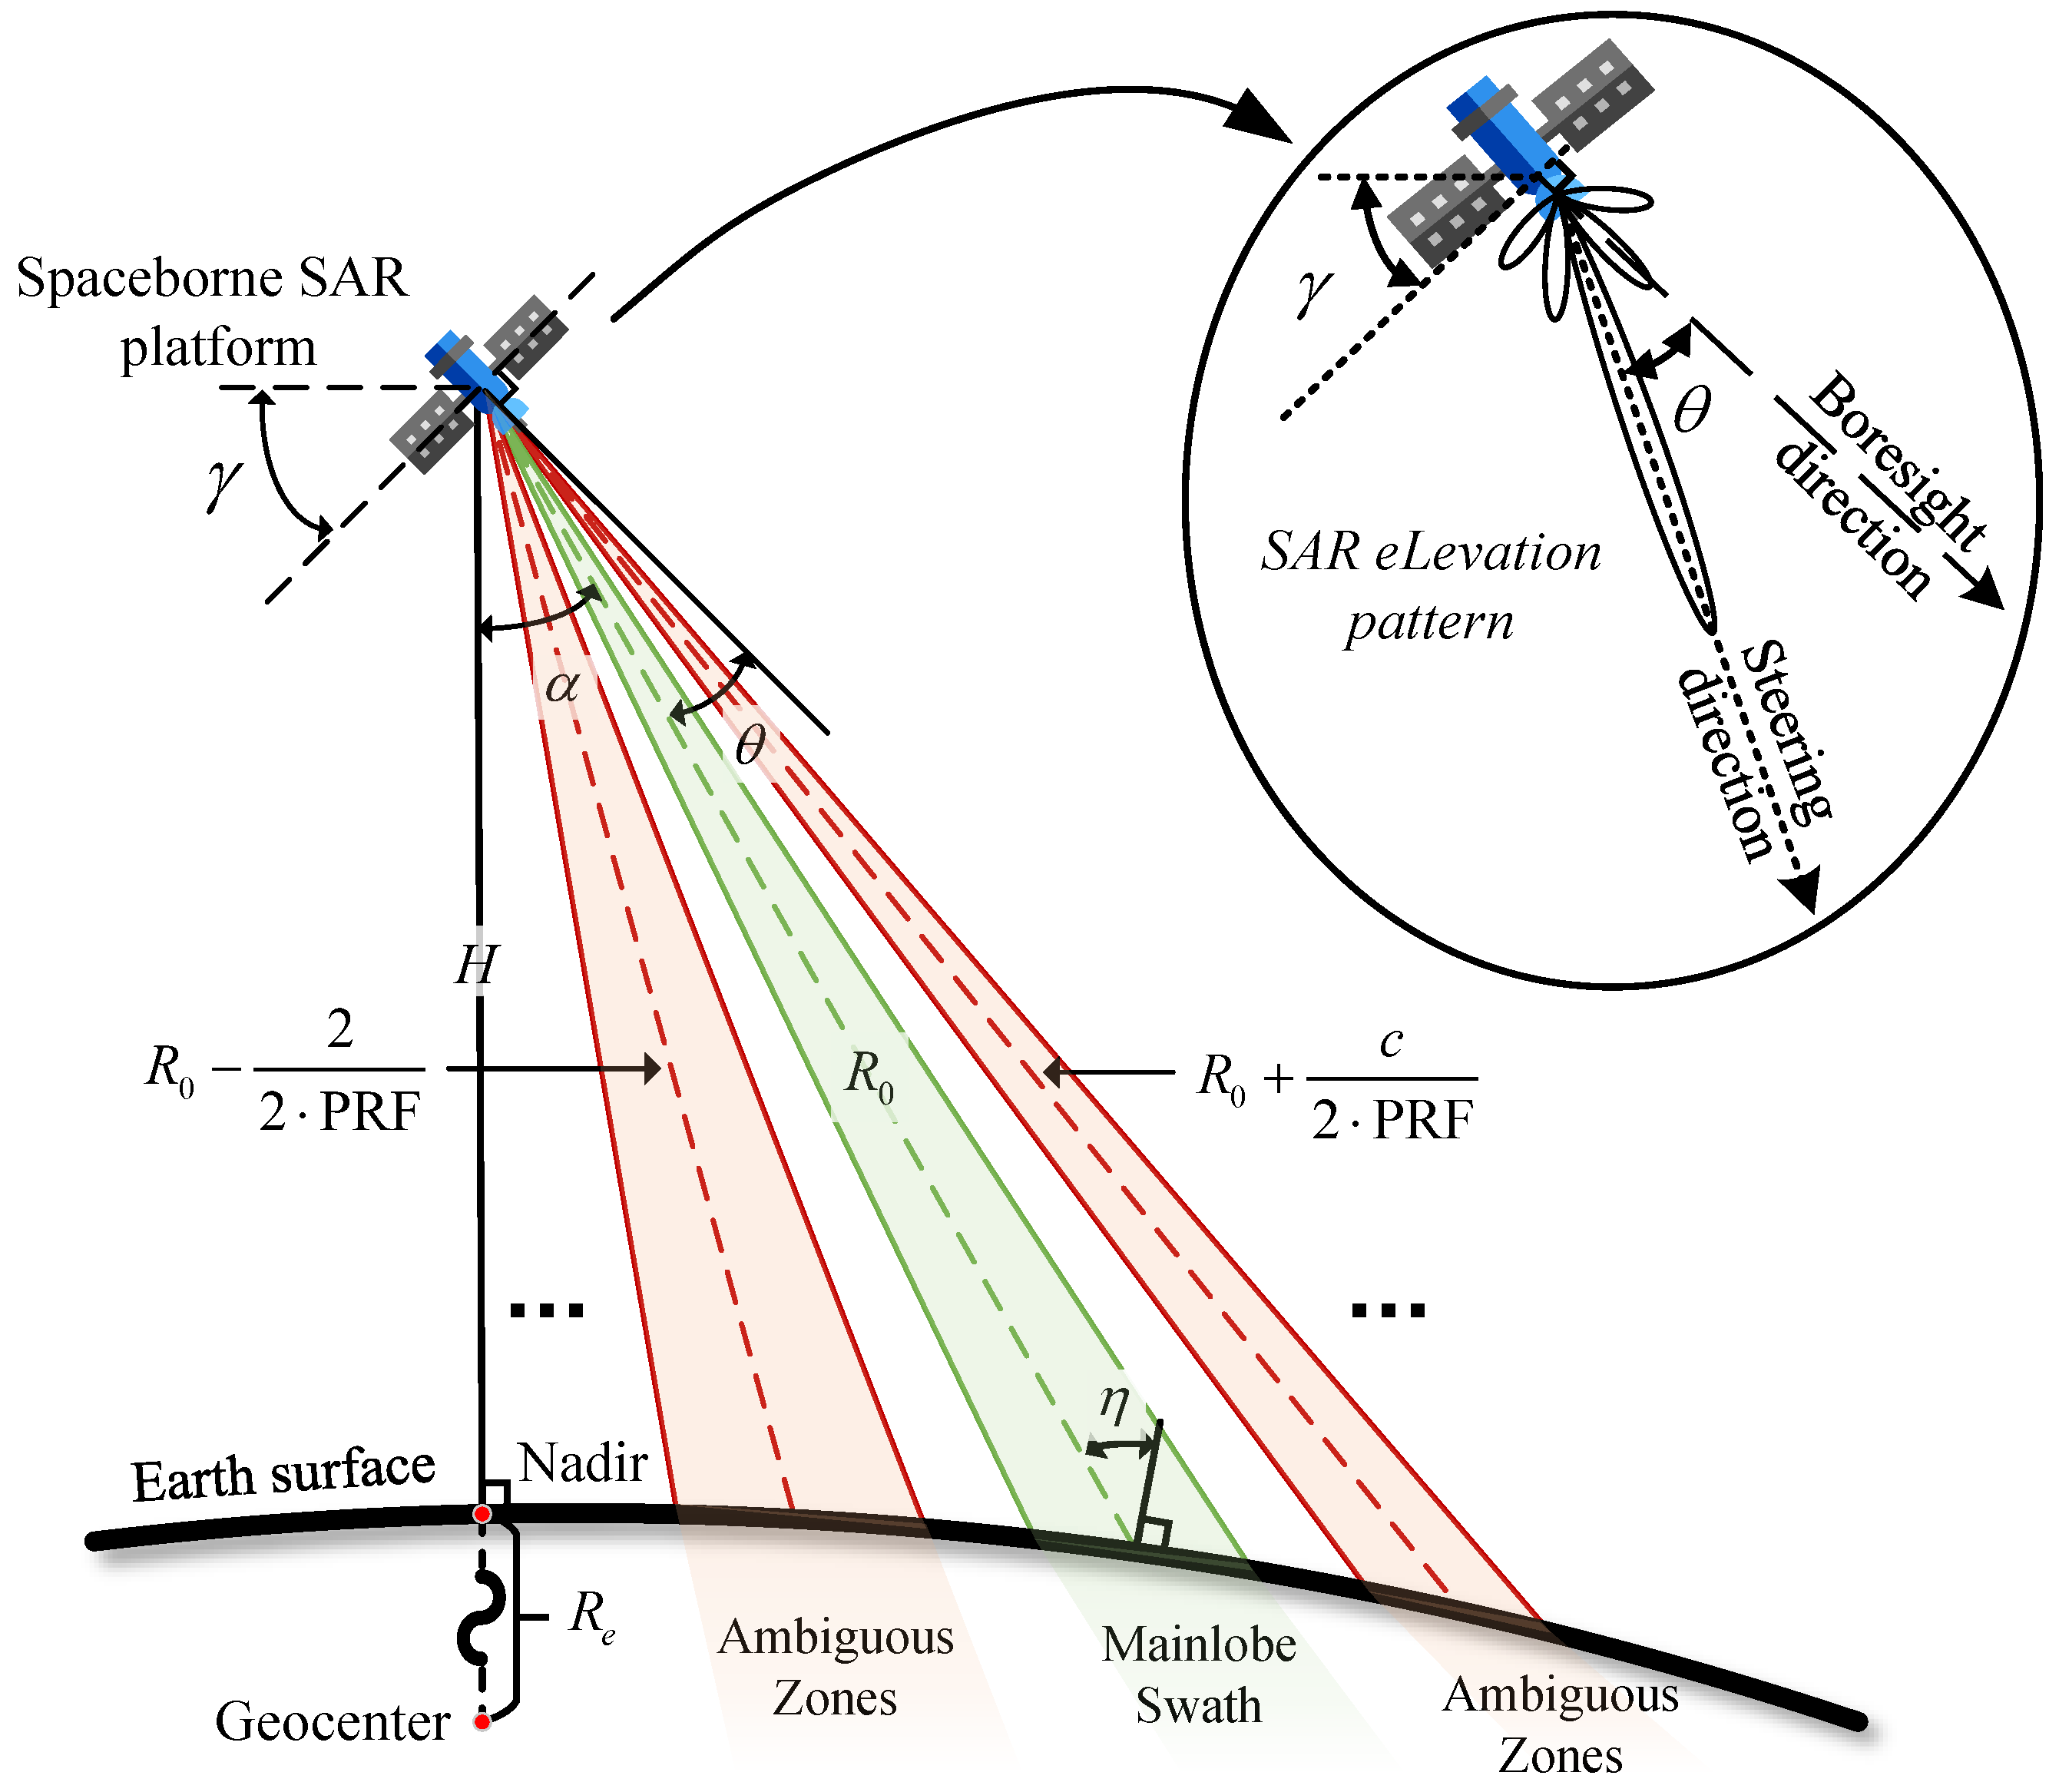
The elevation observation geometry of spaceborne SAR is the physical foundation for evaluating system imaging performance and conducting antenna pattern design. As illustrated in Figure 2, the orbital altitude of the radar platform is denoted by H, and the Earth radius by . The angle between the satellite nadir direction and the radar line-of-sight is defined as the system look angle . To unify the mapping of system-level metrics onto a single spatial variable , several geometric relations need to be established. According to the law of sines, for a given look angle , the local incidence angle between the radar line-of-sight and the Earth surface normal at the corresponding ground point satisfies:
Figure 2.
Schematic of the spaceborne SAR elevation observation geometry.
The corresponding slant range between the spaceborne platform and the surface point can be expressed as:
Furthermore, as illustrated in the detailed inset of Figure 2, the spaceborne SAR platform operates with a fixed mechanical tilt angle , which defines the boresight direction relative to the satellite nadir. Consequently, the local electronic scan angle , defined as the angular deviation of the steering direction (the beam center) from the boresight direction, satisfies:
At the system level, the imaging quality of SAR is primarily characterized by two core metrics: sensitivity and range ambiguity suppression. First, the system’s sensitivity to weakly scattering regions within the swath is typically measured by the NESZ. The NESZ is defined as the surface backscatter coefficient corresponding to a unit output signal-to-noise ratio at the receiver. Under the monostatic configuration, the NESZ is expressed as follows [2,14]:
where denotes the satellite orbital velocity; represents the equivalent noise power, with being the Boltzmann constant, the system noise temperature, and the receiver bandwidth; L is the total system loss; is the peak transmit pulse power; is the pulse width; is the operating wavelength; c is the speed of light; and is the antenna elevation gain function. Here, denotes the one-way antenna power gain. Therefore, is equivalent to the product when the same elevation pattern is used for transmission and reception in the monostatic configuration.
Second, to obtain sufficient azimuth sampling, the SAR system transmits pulses continuously at a specific PRF. The same PRF also determines the range-ambiguity spacing, because echoes from distinct slant ranges may overlap in the time domain.
As shown in Figure 2, let denote the reference principal slant range along the steering direction, which specifically points to the functional center of the mainlobe swath. For any principal slant range evaluated at a look angle , the corresponding slant range of the -th order ambiguity is expressed as:
where and , with denoting the upper bound of the ambiguity order under consideration. It is worth noting that any ambiguous slant range intersects the curved Earth surface at two symmetrical look angles ( and ) relative to the nadir. Although Figure 2 conceptualizes only the unilateral right-looking swath for visual clarity, these opposite-side intersections remain within the antenna’s visible spatial domain.
When the echo energy from the ambiguous zones determined by enters the main receive window, range ambiguity is formed. Under the monostatic configuration, the system’s suppression capability against this interference is quantified by the RASR [2,14]:
where and denote the system look angle and the surface incidence angle back-derived from the -th order ambiguity point, respectively, and is the empirical normalized backscatter coefficient model characterizing the variation of surface electromagnetic reflectance with incidence angle. Only geometrically valid ambiguity orders satisfying the Earth-surface intersection condition are included in the RASR summation; orders yielding an ambiguous slant range below the satellite altitude or exceeding the horizon slant range are discarded.
For fixed orbital, RF-front-end, PRF, and backscatter parameters, the antenna elevation gain function is the controllable term that links the array synthesis result to the NESZ and RASR metrics in (4) and (6). This not only requires the function to maintain high gain within the mainlobe swath to suppress , but also requires it to form spatial notches at the relevant ambiguity angles to reduce .
2.2. Array Signal Model
Consider a uniform linear array along the elevation direction consisting of N isotropic elements with inter-element spacing d. Taking the array center as the origin, the coordinate of the n-th element is , where . Under the ideal FPA architecture, each element is equipped with an independent transmit/receive module. Let the complex excitation vector of the array be , where the superscript denotes transposition. At the spatial look angle , the steering vector element corresponding to the n-th element is , and the full-array steering manifold vector is defined as , where is the wavenumber and is the imaginary unit. The full-array factor and its corresponding one-way power pattern at the look angle are then expressed as:
where the superscript denotes complex conjugation, and denotes complex conjugate transposition.
To enable direct measurement and optimization of the array partitioning in the power pattern domain, Equation (8) is expanded as a cross-multiplication of complex excitations:
By rearrangement, the above expression can be reformulated as a superposition of N element patterns, i.e., . The element pattern (EP) corresponding to the n-th element is defined as:
Equation (10) indicates that comprises not only its own self-power term but also the spatial cross-correlation terms with all other elements in the array. To eliminate the magnitude disparity, the normalized element pattern is further defined as .
Assume that the N elements are partitioned into Q subarrays (), and introduce the partitioning mapping , where denotes the subarray index to which the n-th element belongs. Let the complex weight vector of the CPA be . Under this hardware dimensionality reduction constraint, the array factor of the CPA and its corresponding one-way subarray power pattern are expressed as:
2.3. Mask-Constrained Optimization Problem Formulation
To establish a rigorous mathematical framework for subarray synthesis, the continuous angular domain is uniformly discretized into a finite set of angular samples , where M denotes the total grid size. Based on the elevational spaceborne SAR observation geometry, is partitioned into four mutually exclusive subsets: the mainlobe swath set , the multi-order ambiguous set , the non-ambiguous sidelobe set , and the unconstrained transition set . In the subsequent two-phase algorithm (Section 3), phase II will further traverse this discrete set as outer-loop anchors; i.e., each serves both as an evaluation grid point in the inner loop and as a driving anchor in the outer loop, with the index s reserved exclusively for the latter.
Conventional CPA synthesis frameworks focus on forcing the subarray power pattern to match the full-array reference power pattern (formally generated by phase I and defined in Section 3.1) across the entire spatial spectrum. Within the discretized sampling workspace, this conventional approach is formulated as a global equality pattern matching problem, minimizing the squared Euclidean distance [36]:
However, realistic spaceborne SAR system metrics fundamentally impose inequality envelope constraints rather than absolute waveform identity. Specifically, the NESZ dictates a spatial gain lower-bound mask within the swath , the RASR governs a spatial notch upper-bound mask within , and the background clutter level is controlled by a constant suppressive floor within . To simplify the mathematical notation, we define the linear-scale masks as , , and . To bypass redundant optimization penalties inside the mask safety zones and reallocate the limited array degrees of freedom onto critical performance boundaries, the mask violation cost function is formulated via one-sided piecewise quadratic operators:
By embedding physical realization topology into the mathematical boundary conditions, the joint optimization of the discrete array architecture and continuous weighting is cast as a mixed-integer nonlinear programming (MINLP) problem:
The step constraint jointly with the boundary conditions strictly guarantees physical spatial contiguity along the linear array aperture, systematically eliminating crossover feed lines in the microwave network while ensuring no empty subarrays are formed. This constraint implicitly fixes the subarray index labeling to follow the physical aperture order; i.e., subarray q occupies a contiguous physical segment indexed before subarray .
3. Proposed Method: MC-PMM
The proposed method consists of two progressive phases. In phase I, SAR metrics are used as constraints. It constructs an SDP-relaxed reference mask in the positive semidefinite covariance space through two SDP steps. The extracted reference excitation and reference pattern serve as the benchmark for phase II. In phase II, the method uses this mask as the constraint target. It then optimizes the partitioning mapping and the subarray weight vector via DP and Mask-IPM. This enables the CPA pattern to approach the SDP-derived reference mask under the hardware dimensionality reduction constraint . In short, the phase I step defines the SAR-driven mask to be pursued, and the phase II step then searches for a contiguous CPA design that reduces the violation of this mask.
3.1. Phase I: Limit Mask Generation via SDP
This phase aims to establish a synthesis benchmark for the subsequent subarray synthesis phase through full-array degree-of-freedom optimization. The procedure consists of the following four steps.
- Step I.1: Initial Mask Construction
To bridge the gap between abstract system requirements and concrete antenna pattern constraints, we first invert the SAR performance models to derive the initial power pattern masks via (4) and (6). By substituting the preset system requirements and into the radar equations, the initial mainlobe lower bound and the initial ambiguous-region upper bound are constructed as follows:
where traverses each candidate principal look angle in to derive the most stringent RASR constraint at . The positive linear-domain requirements are defined as and . Under the unit-energy normalization , the physical one-way power gain and the array-factor power satisfy . Here, is the peak physical gain of the full antenna aperture, including both azimuth and elevation aperture contributions, whereas supplies the normalized elevation-pattern variation for the azimuth-boresight cut considered in this work. Therefore, the gain-domain mapping offset in (16) is , where . Let denote the gain-independent coefficient in (4), such that . The factor 5 in (16) follows from the square root required to convert the two-way NESZ constraint into a one-way gain constraint. The quantity is the ideal peak power, in dB, of the normalized array factor and is used in (17), where the common absolute gain factor cancels in the RASR. For the non-ambiguous sidelobe regions , a constant suppressive floor is assigned. These initial masks serve as the foundational boundaries for the phase I optimization.
It is worth noting that the defining scaling factors are optimized within the relaxed positive semidefinite cone, whereas a physically implemented full-array excitation must be rank one. The resulting mask is therefore interpreted as an SDP-relaxed reference mask rather than a rigorously proven global boundary for the rank-one array. This distinction motivates the subsequent use of mask-constrained inequality matching in phase II, where the finite subarray degrees of freedom are directed toward reducing actual mask violations instead of enforcing equality matching over the entire angular domain.
- Step I.2: Mainlobe Gain Maximization
Introduce the full-array covariance matrix variable , where denotes the trace operator. Subject to the total transmit energy constraint and the baseline sidelobe level , the limit of system sensitivity is explored by maximizing the scaling factor :
where is the manifold matrix; the notation denotes that is positive semidefinite; and normalizes the total transmit energy to unity. This SDP problem is numerically solved via the CVX toolbox [39]. The resulting optimal scaling factor is denoted as .
- Step I.3: Ambiguous-Region Gain Minimization
To release spatial degrees of freedom for the subsequent deep-notch exploration, a small positive relaxation margin is introduced in the logarithmic power domain. The relaxed mainlobe scaling factor is then defined as . The margin is an empirical trade-off parameter: a smaller value retains more of the mainlobe lower-bound margin associated with NESZ preservation, whereas a larger value releases more degrees of freedom for ambiguity suppression and hence affects RASR. Therefore, in practical applications, can be adjusted according to the required NESZ–RASR trade-off. The scaling factor for the ambiguous region is then minimized via SDP:
The problem in (19) defines the relaxed-domain target for the ambiguous-region upper-mask scaling factor. In the numerical implementation, is located by a monotonic feasibility search. For each candidate value of , the corresponding SDP is solved using CVX with this candidate value fixed while retaining the same mainlobe, ambiguous-region, non-ambiguous sidelobe, and total-power constraints. The returned covariance matrix is retained only when is close to unity, where denotes the largest eigenvalue. The resulting covariance matrix is denoted as .
- Step I.4: Limit Mask Generation
The full-array reference excitation is obtained by performing eigenvalue decomposition on and selecting the eigenvector corresponding to the largest eigenvalue. The reference power pattern is then computed. Crucially, rather than recursively mapping the synthesized metrics back to the spatial domain, the spatial limit mask boundaries are directly extracted from the actual constraint boundaries imposed during the SDP optimization. The resulting mask is used as an SDP-derived reference envelope for the subsequent subarray synthesis. The approximately rank-one behavior is checked from the covariance matrix itself, and the extracted full-array reference excitation is used to evaluate the reference pattern and its mask violation. Specifically, the lower limit mask for the mainlobe swath is constructed by shifting the initial baseline mask by the relaxed mainlobe scaling factor :
Similarly, the upper limit mask for the ambiguous region is formed by shifting the initial multi-order ambiguity bound by the optimal sidelobe scaling factor obtained in Step I.3:
The non-ambiguous sidelobe upper bound is retained as . This generated limit mask serves as the SDP-derived reference constraint for the subsequent subarray synthesis phase.
3.2. Phase II: Mask-Driven Subarray Synthesis
Since the joint optimization formulated in (15) is a highly non-convex MINLP problem, this paper inherits the two-step iterative structure of Benoni et al. [36]. The algorithm traverses the discrete angular set in an outer loop to extract local features. To clearly distinguish it from the inner-loop spatial evaluation index m defined in Section 2.3, we introduce as the index for the outer-loop anchor. Consequently, let the superscript denote the candidate variables and cost values generated when the s-th sample is selected as the driving anchor. The specific procedure is as follows.
- Step II.1: Outer Traversal and Feature Extraction
The energy contribution of antenna elements to the far-field pattern varies dynamically across space. Therefore, in the outer loop, the s-th angular sample () is selected as the anchor. The element pattern (EP) features of the full-array reference power pattern are extracted via (10) to construct a one-dimensional ordered sequence , providing the data basis for the inner clustering.
- Step II.2: Physically Contiguous Partitioning via DP
Conventional phased array subarray partitioning strategies typically employ the K-means algorithm for unordered clustering in the element pattern feature space prior to weighting [36]. However, since K-means lacks physical spatial constraints, elements close in the feature space may occupy entirely separate positions on the physical antenna aperture, leading to complex crossover feed lines within subarrays that are difficult to realize in practical microwave feed networks. To address this engineering constraint, this paper introduces physical contiguity as a hard constraint, equivalently transforming the subarray partitioning problem into identifying optimal segmentation points within the one-dimensional ordered sequence . To break through the combinatorial explosion of exhaustive search, this paper adopts the DP framework, building on the classical one-dimensional optimal grouping theory [28] and its modern interval clustering extensions [40,41].
Let a subarray contain contiguous elements from index i to j (). The local mean of EP features within this subarray is defined as:
The intra-segment matching error of this physical segment is then defined as:
This intra-segment matching error physically characterizes the similarity of electromagnetic contributions from contiguous elements at a specific angle. The smaller this intra-segment matching error, the lower the spatial degree-of-freedom loss incurred by assigning these elements to the same subarray. This similarity-based segment cost follows the common subarray-synthesis rationale that elements with similar excitation or pattern contributions can be grouped into a shared subarray with a smaller loss of spatial degrees of freedom [31,35]. In the present formulation, DP is used to enforce this similarity principle under the additional physical-contiguity requirement by restricting the grouping to ordered aperture segments.
To solve for the global minimum partitioning error, define the state variable as the minimum cumulative error obtained when partitioning the first j elements into q contiguous subarrays. The recurrence state transition equation is then established as:
with the boundary initial condition . By constructing the two-dimensional state table and recursively computing according to (24), the global minimum error of partitioning all N elements can be obtained. The optimal segmentation point indices are synchronously recorded during recursion, and the optimal discrete subarray partitioning topology at the current angle can be derived through backward tracing upon completion.
Since the single-interval cost can be evaluated in time by precomputing the cumulative sums and cumulative squared sums of EP features, the overall time complexity of the DP algorithm is strictly bounded by , enabling efficient topology generation under the physical contiguity constraint.
- Step II.3: Subarray Weighting via Mask-IPM
After obtaining the candidate subarray partitioning topology for the s-th anchor, the optimization objective transforms into solving for the corresponding candidate subarray complex weight vector under the given topology manifold, so as to minimize the global cost function J defined in (14). Unlike the conventional IPM, this paper introduces the Mask-IPM.
Initialization. To place the search starting point near a feasible solution, the reference excitation extracted in phase I is used to generate the initial weights:
where is the total number of elements in the q-th subarray under the current candidate topology . Meanwhile, the global minimum cost recorder is initialized as .
Forward and backward projection iteration. Let the candidate subarray weight at the t-th iteration be . To evaluate the pattern compliance, for any evaluation grid point (), the array factor and its power response are:
In the forward projection iteration, the power response at all grid points is evaluated and classified based on its position relative to the limit mask. Define the linear-scale limit masks as and . For grid points within the mask violation zone, the array factor phase is preserved while the magnitude is forced to project onto the linear voltage limit; for grid points within the mask safety zone, the original array factor value is retained. The target projection vector is generated as:
In the backward projection iteration, two sub-steps are performed: element-domain recovery and topology constraint imposition. Construct the full-array element manifold matrix over all M sample points. The Moore-Penrose pseudoinverse of , denoted as , is then used to map the projected array factor back to the full-array element domain via the least-squares solution, yielding the N-dimensional ideal excitation vector :
Subsequently, the ideal excitations within the same subarray are arithmetically averaged to obtain the updated subarray weight vector , whose elements are given by:
After each backward projection, the algorithm performs cost evaluation and state update. The actual power pattern produced by is substituted into (14) to compute the current cost . If , the minimum is updated as and the current weights are recorded. In the numerical experiments, Mask-IPM is terminated after the preset maximum number of iterations , and the best historical solution associated with is retained as the output for the current candidate.
Upon iteration termination, the optimal subarray weight at the current outer angle and its corresponding minimum cost are output. Here, denotes the final value of the inner-loop recorder for the s-th outer angular sample, and denotes the recorded weight vector associated with this minimum. The proposed Mask-IPM essentially seeks the nearest point between the current subarray reduced-dimension manifold and the mask safety zone defined by the SDP-derived reference mask. Since the mask safety zone constitutes a closed set in the power pattern space, the alternating projection process inherits the non-increasing distance property of the intersection approach [37]. Meanwhile, because the inverse projection and subarray averaging steps repeatedly map the iterate back onto the reduced-dimensional subarray manifold, the overall behavior is assessed in this paper mainly through the numerical evolution of the mask-violation cost rather than claimed as a rigorous global convergence guarantee.
- Step II.4: Global Optimal Solution
The outer angular sampling traversal (Step II.1) drives the inner alternating execution of contiguous partitioning (Step II.2) and Mask-IPM (Step II.3), ultimately generating M candidate solutions . The configuration corresponding to the global minimum of the cost function is extracted as the final dimensionality-reduced synthesis result :
3.3. Algorithm Workflow
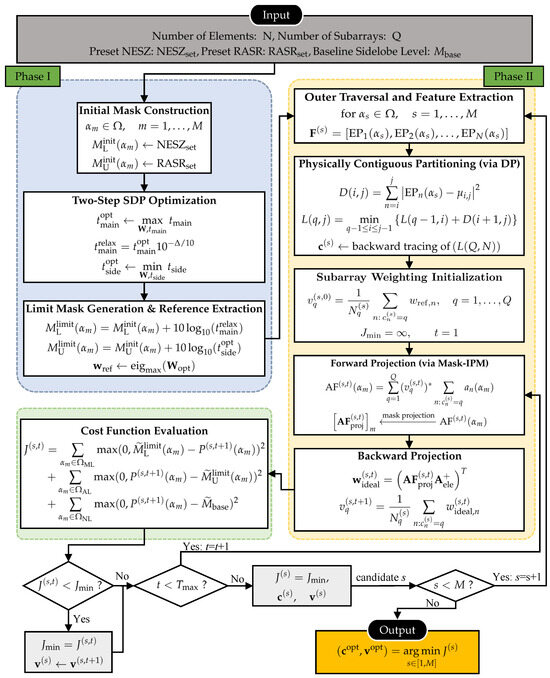
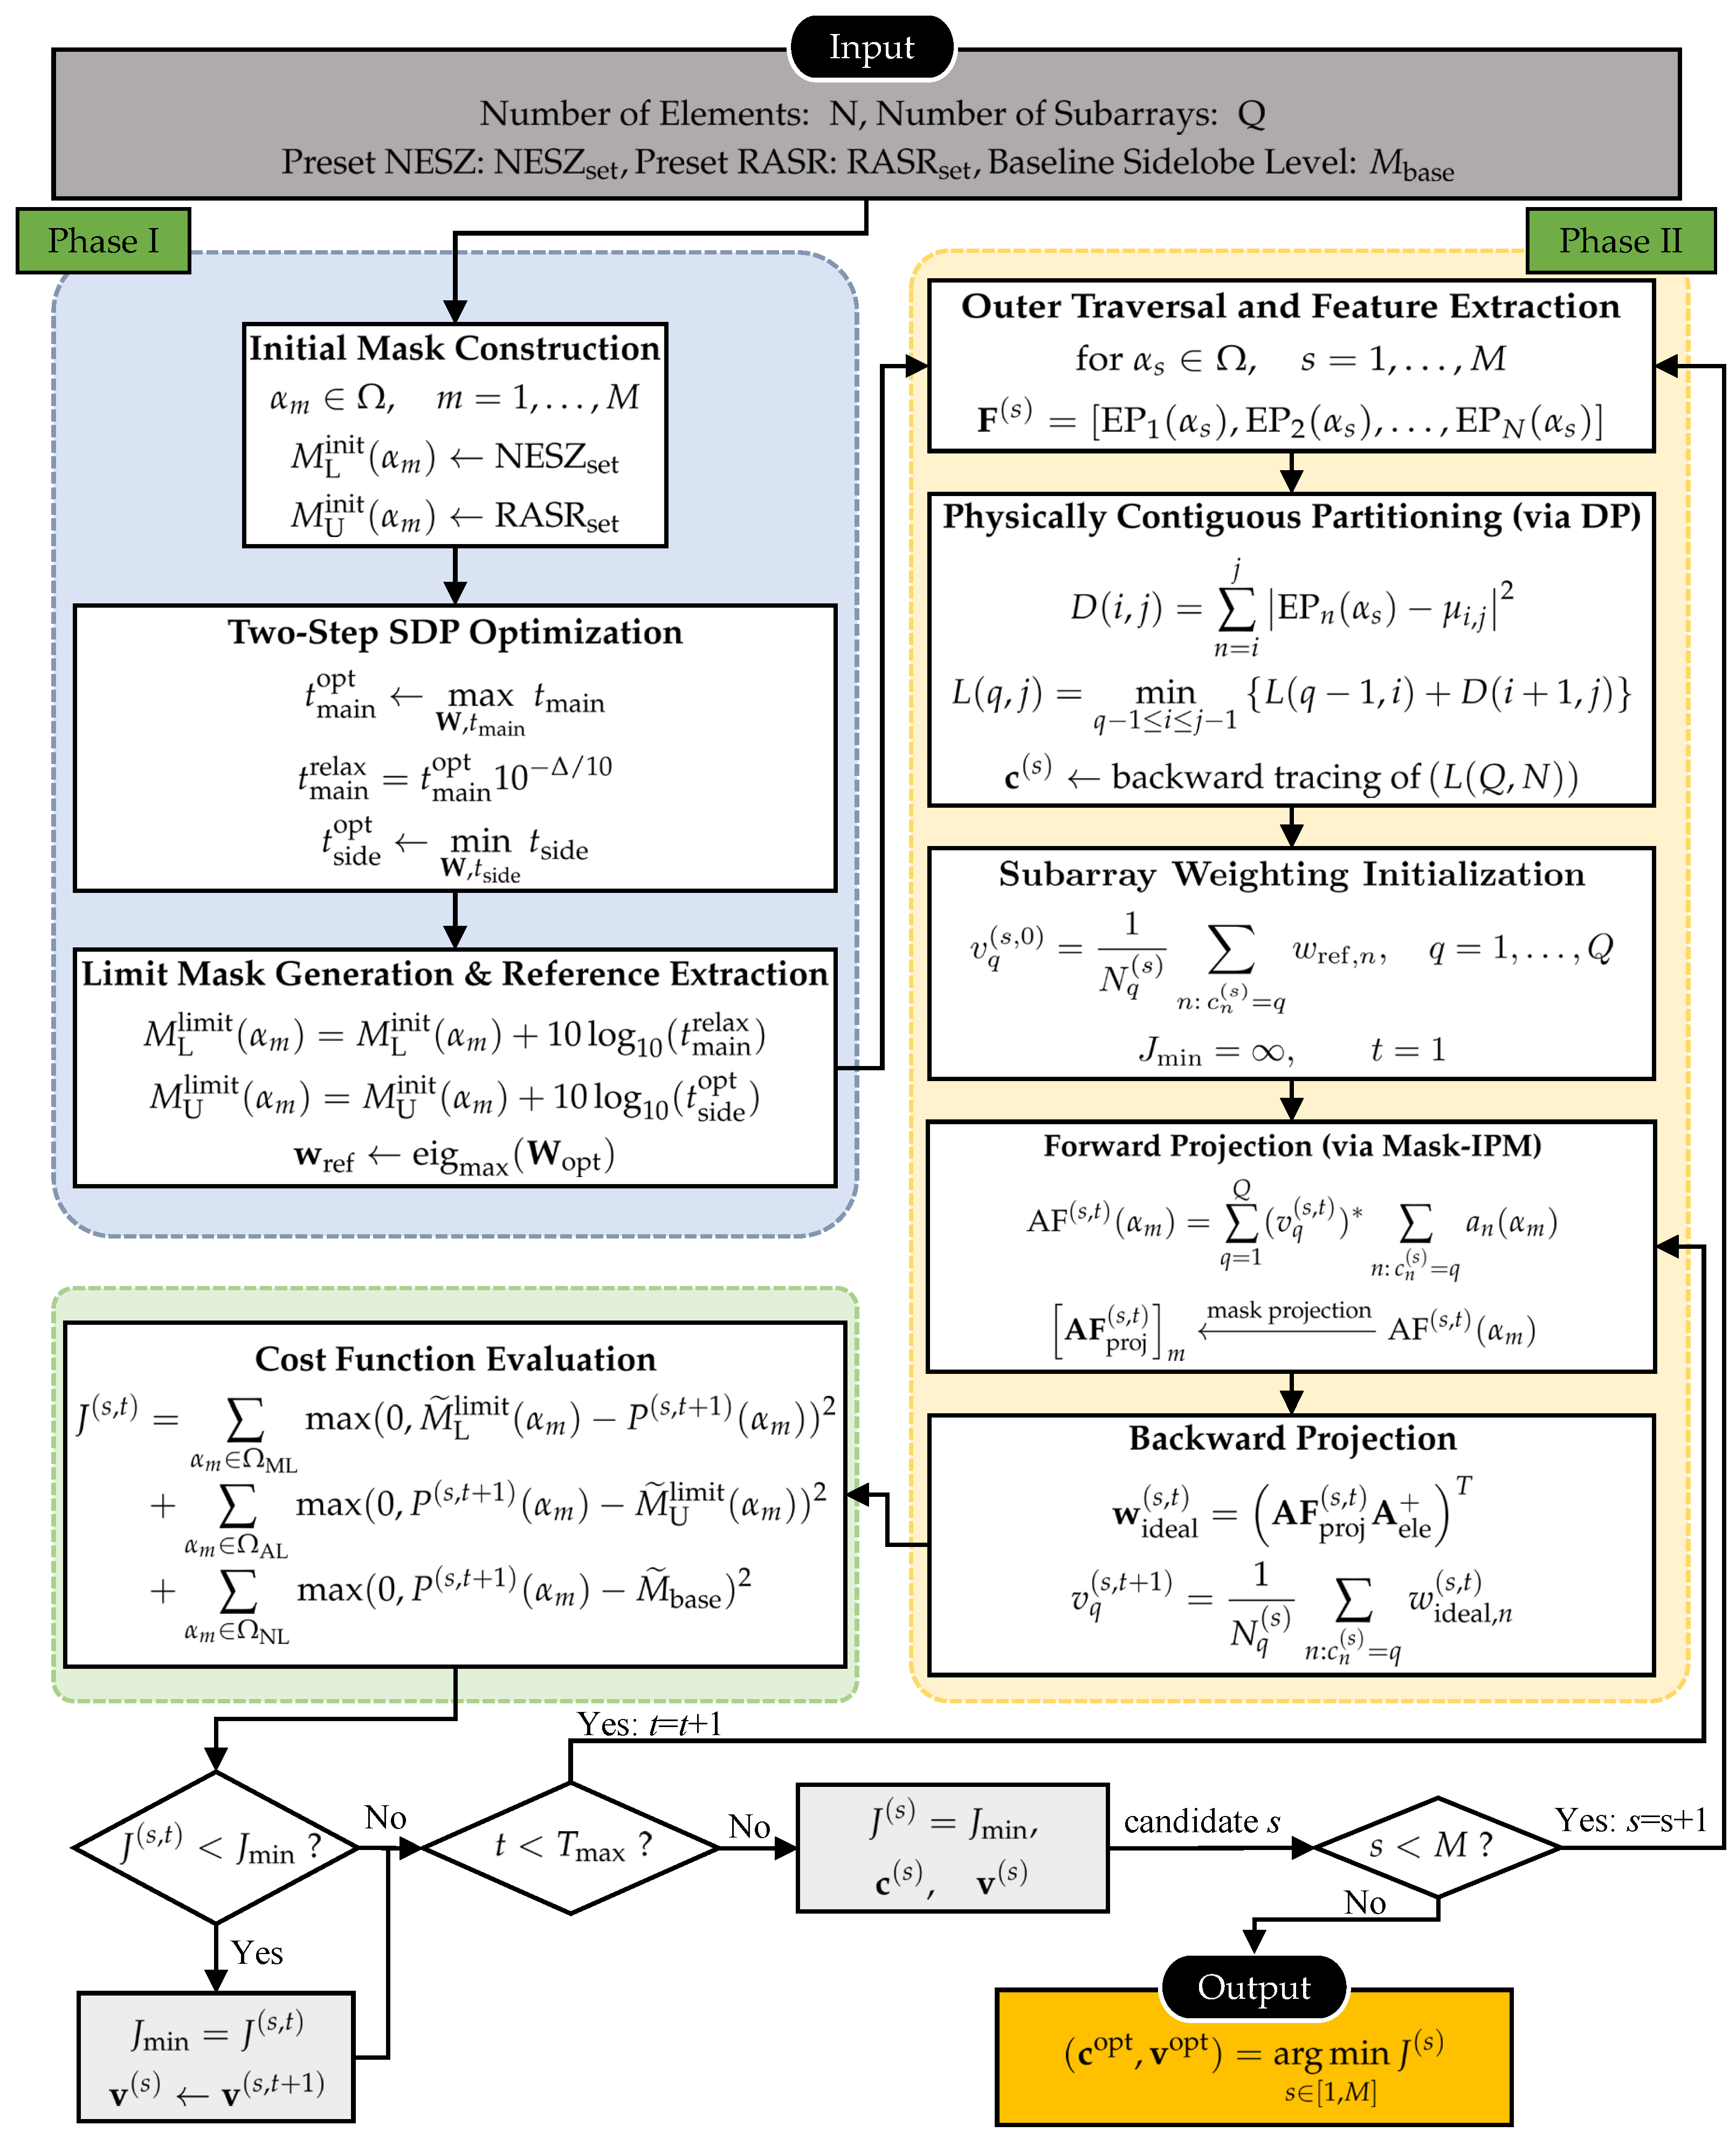
Integrating the above stages, the complete algorithm workflow of the proposed MC-PMM is illustrated in Figure 3.
Figure 3.
Overall workflow of the proposed method (MC-PMM).
4. Numerical Results
To validate the effectiveness of the proposed MC-PMM across the dimensions of partitioning topology, pattern matching, and system-level performance, numerical experiments are conducted in this section based on a typical spaceborne X-band SAR elevation antenna array scenario, wherein the SAR system parameters are set with reference to classical literature [4,14,16] to ensure physical validity and engineering relevance. The complete SAR system and algorithm parameters are summarized in Table 1. The simulation considers a uniform linear array consisting of isotropic elements with half-wavelength spacing. Unless otherwise specified, is the representative subarray configuration; the parameter sweep in Section 4.6 examines the selected representative Q values. The azimuth dimension is kept fixed and is represented by an equivalent aperture length in the absolute gain calculation, whereas the subarray partitioning and weighting variables are optimized along the elevation dimension.
Table 1.
SAR system and algorithm parameter configuration.
Since PRF determines the range-ambiguity spacing and constrains azimuth-ambiguity performance in HRWS SAR systems [4,14,16], the azimuth ambiguity-to-signal ratio (AASR) is evaluated using the formulation in [4]:
where f is the azimuth Doppler frequency, ℓ is the nonzero azimuth ambiguity order, L is the maximum azimuth ambiguity order in the summation, and is the processed azimuth Doppler bandwidth. For the rectangular equivalent azimuth aperture, , where is the satellite platform velocity and is the equivalent azimuth aperture length. The values Hz, m/s, and m follow the representative SAR parameter setting in [4]. With the recalculated PRF of 4509 Hz, dB, meeting the typical SAR-system requirement. After the PRF and azimuth configuration are fixed, AASR is independent of the elevation subarray design considered in this paper.
For the numerical candidate-screening rule, the final solution of each method is selected according to its corresponding objective function after all M outer angular samples have been traversed. Specifically, PMM and the contiguity-constrained PMM (C-PMM) retain the candidate that minimizes the equality-matching metric , whereas the mask-constrained PMM (M-PMM) and MC-PMM retain the candidate that minimizes the mask-violation cost J.
To demonstrate the effectiveness of the proposed method more quantitatively, an evaluation metric framework spanning the topology level, the pattern level, and the system level is established, given by
Topology level. The physical contiguity adjacency rate is defined to quantify the practical realizability of the subarray partitioning:
where denotes the number of subarrays whose elements occupy physically adjacent positions on the array aperture. This metric reflects the degree to which the partitioning topology satisfies the engineering constraint of the feed network; corresponds to a strictly crossover-free topology that is engineering-realizable.
Pattern level. The cost function J defined in (14) is employed to quantify the violation of the limit mask constraint by the subarray power pattern.
System level. To accurately reflect the total integrated noise and interference power across the observation swath, the mean NESZ and mean RASR are evaluated by performing the arithmetic mean within the linear power domain and subsequently converting the results back to the logarithmic scale. The mean NESZ is evaluated as:
and the mean RASR is similarly defined as:
where denotes the cardinality of the mainlobe swath angular sample set.
To systematically validate the effectiveness of MC-PMM along the two core dimensions of the physical contiguity constraint and the mask constraint, four baseline methods are designed in this section through ablation experiments on the partitioning scheme and the weighting algorithm, as detailed in Table 2. Among them, PMM strictly corresponds to the method proposed by Benoni et al. [36] and serves as the existing method baseline; C-PMM and M-PMM are ablation baselines constructed in this paper to independently validate the contribution of the physical contiguity constraint and the mask constraint, respectively, to the final synthesis performance. Here, C-PMM and M-PMM are introduced as ablation baselines constructed in this study, rather than as previously established standalone methods. All four compared methods use the same SAR system parameters, elevation array geometry, equivalent azimuth aperture length, total-power normalization, subarray number, angular sampling grid, and NESZ/RASR definitions; the method-dependent settings, including the partitioning strategy, weighting method, and optimization objective, are summarized in Table 2.
Table 2.
Comparison of CPA subarray synthesis methods.
4.1. Limit Mask and Reference Pattern
The initial preset targets for phase I are set as dB and dB, with the non-ambiguous background baseline sidelobe level dB. The key scalar parameters obtained from the two-step SDP optimization are: the mainlobe scaling factor dB; and dB. By setting the empirical relaxation margin to dB for this specific array configuration, the relaxed mainlobe scaling factor satisfies dB. Thus, this relaxation gives up part of the additional mainlobe margin obtained in Step I.2, while the relaxed mainlobe lower bound still remains above the initial system-derived lower mask.
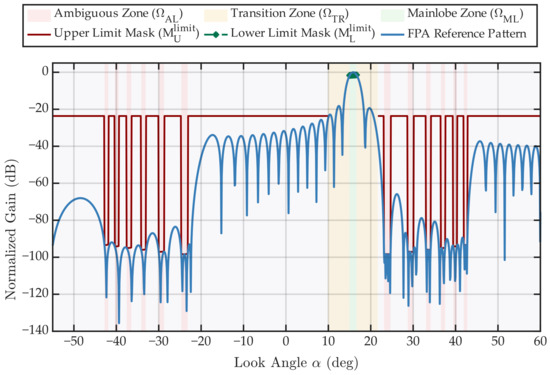
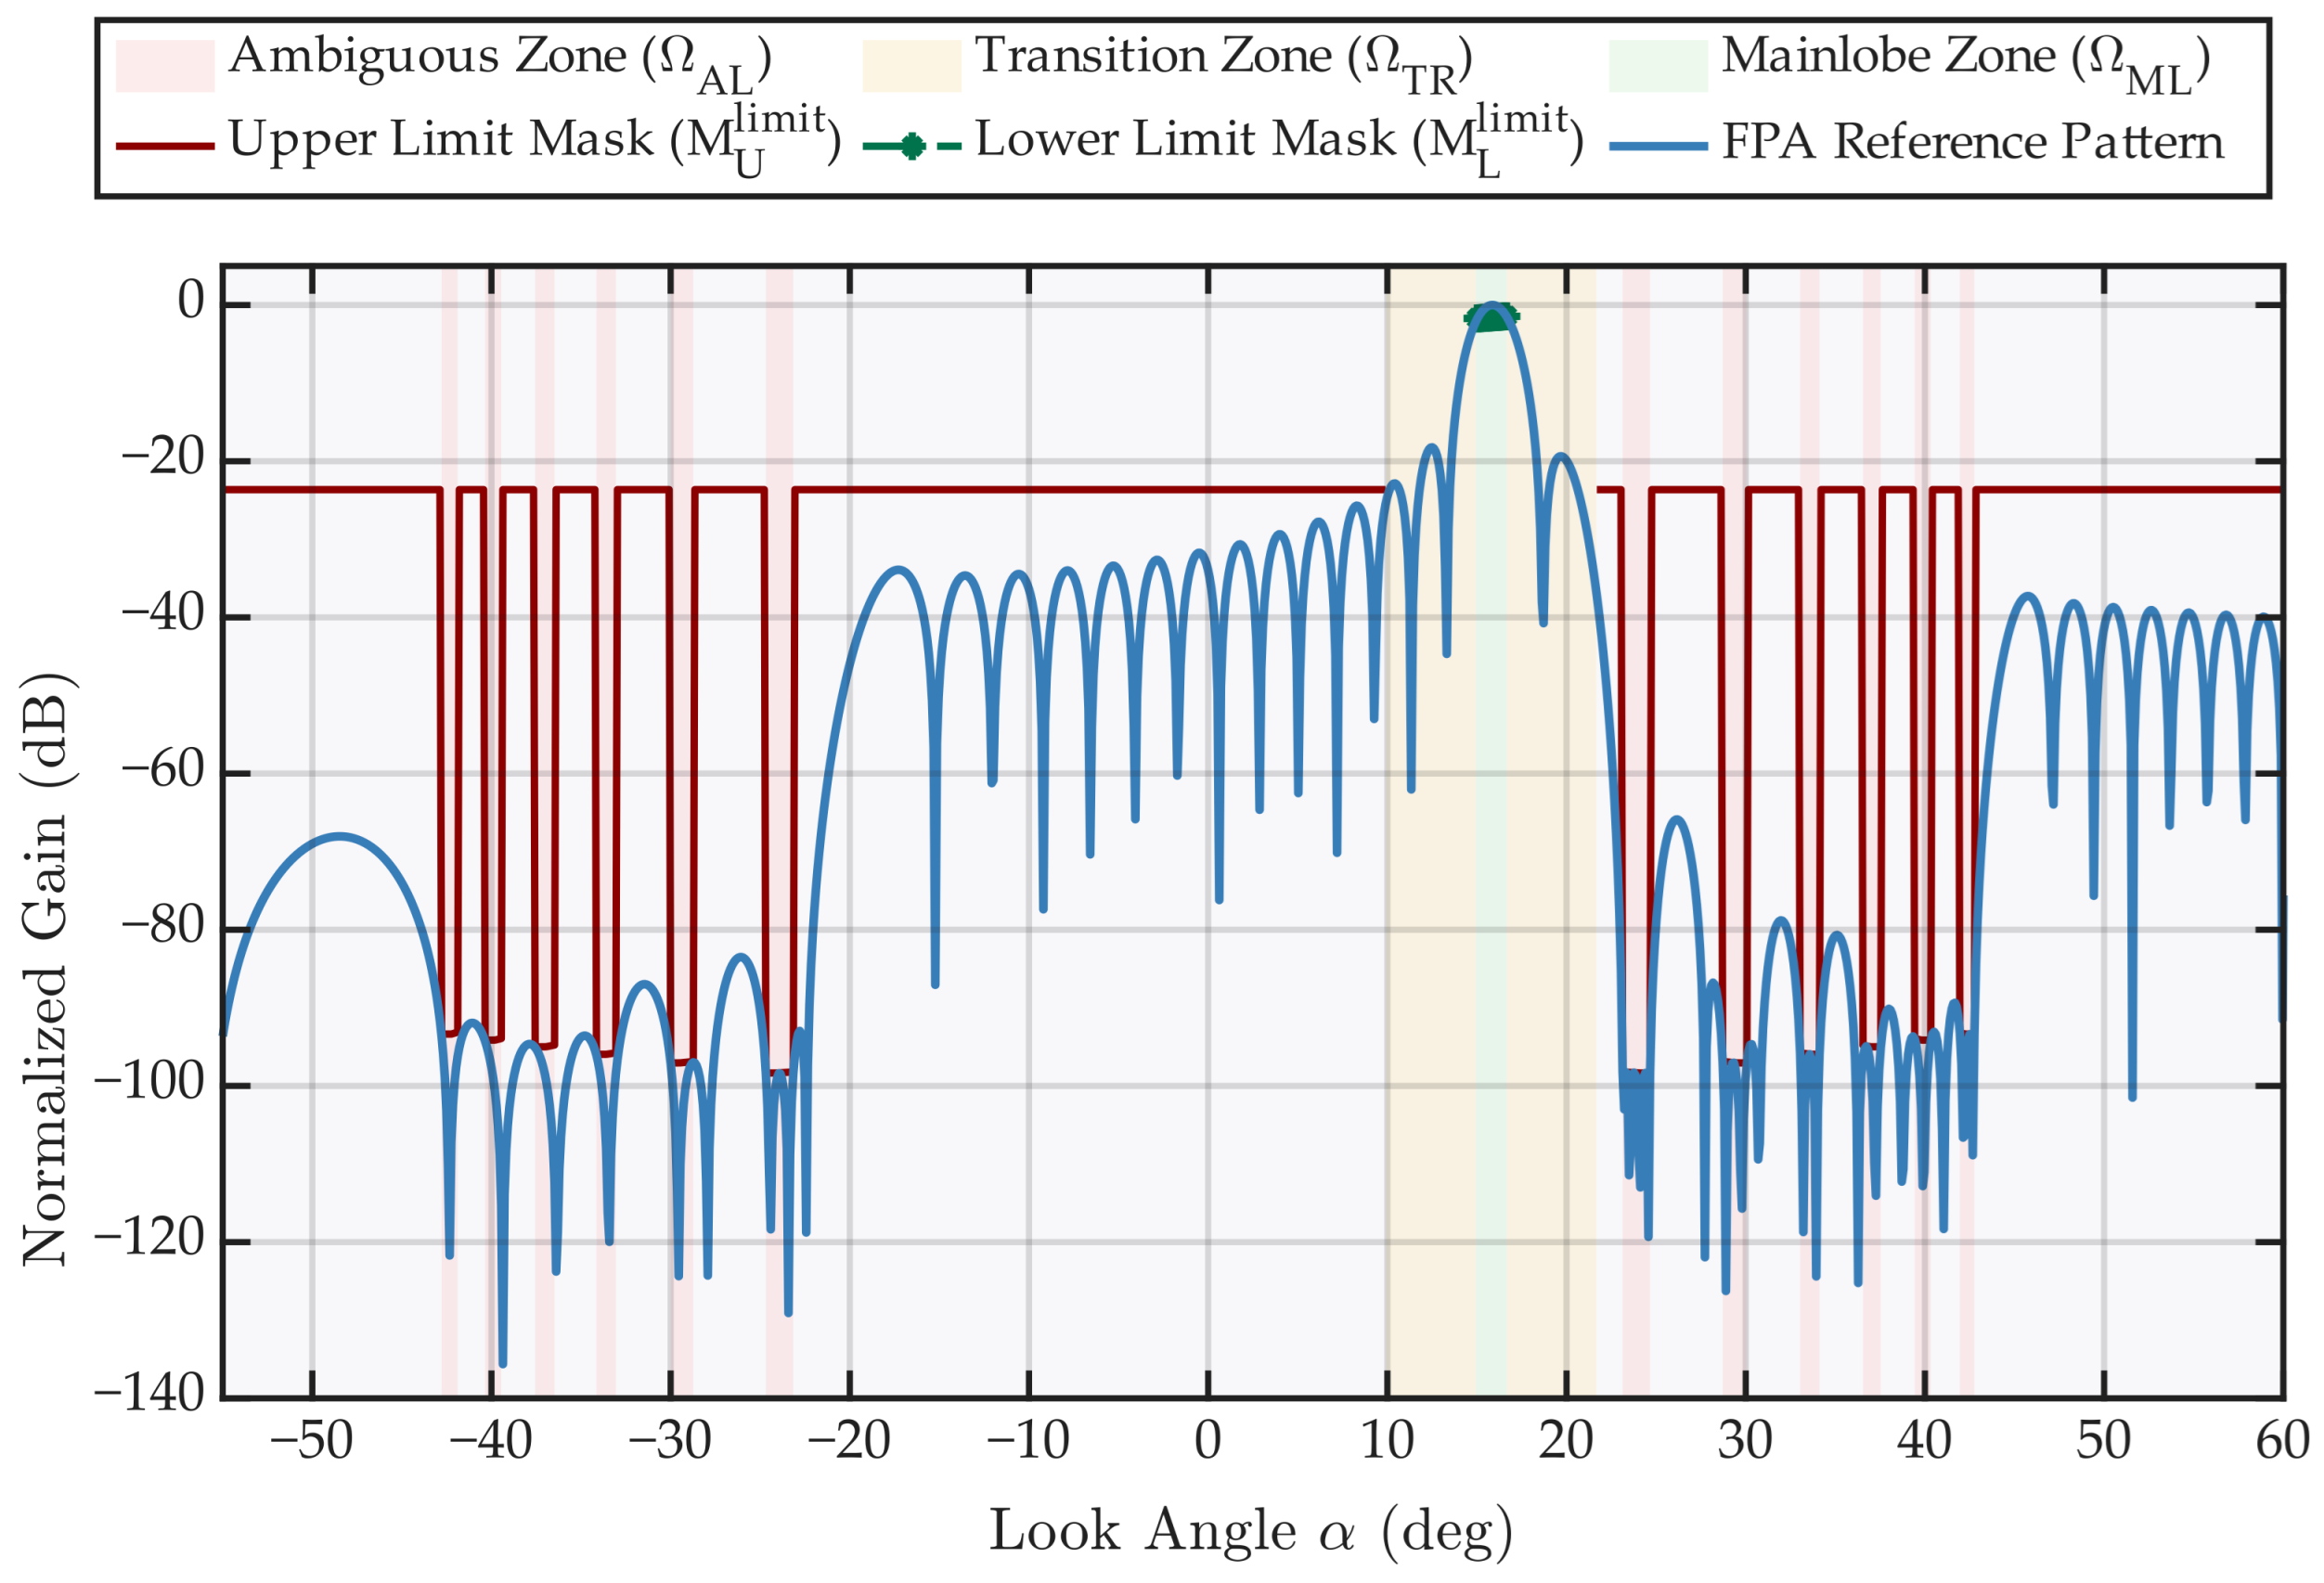
After extracting the reference excitation via eigenvalue decomposition, the baseline system-level performance of the ideal FPA is evaluated by extracting the worst-case (maximum) values of the synthesized actual metrics over the mainlobe swath via (4) and (6), yielding the reference benchmarks dB and dB. The limit mask boundaries and are then constructed via (20) and (21). Figure 4 presents the overlaid view of the reference power pattern and the limit mask boundaries. For this SDP solution, the ratio is , indicating that the retained covariance matrix is approximately rank one. The extracted full-array reference pattern is further evaluated using the same mask violation cost function J in (14), giving a value close to numerical zero for the current regenerated result.
Figure 4.
Reference pattern and synthesis limit masks.
As shown in Figure 4, the mainlobe lower bound exhibits a rippled envelope within the swath, reflecting the inherent requirement of the NESZ metric on the mainlobe gain uniformity; the ambiguous-region upper bound exhibits sharp downward indentations at each ambiguity order angle, reflecting the stringent demand of the RASR metric on the depth of the spatial notches; the non-ambiguous background region maintains the constant baseline sidelobe level . The reference power pattern lies within the mask safety zone bounded by the upper and lower limit masks up to numerical solver tolerance, supporting the practical rank-one recoverability of the phase I SDP result for the considered configuration.
4.2. Topology Comparison
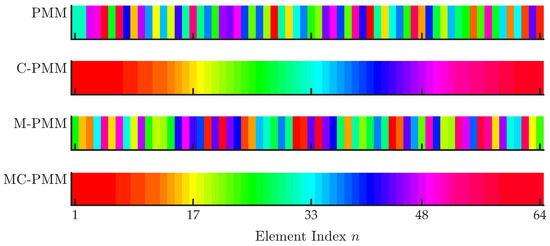
As shown in Figure 5, the partitioning topologies generated by PMM and M-PMM exhibit non-contiguous element scattering and inter-subarray interleaving. Since the K-means algorithm performs clustering solely in the element pattern feature space without imposing physical spatial constraints, elements proximate in the feature space may occupy entirely separate positions on the array aperture, resulting in subarray topologies with crossover feed lines. In contrast, the topologies generated by C-PMM and MC-PMM exhibit strict physical contiguity: every subarray consists of physically adjacent elements, which fundamentally eliminates feed line crossovers.
Figure 5.
Subarray partitioning topologies for different methods.
As summarized in Table 3, PMM and M-PMM both produce non-contiguous K-means-based topologies, with and for PMM, and and for M-PMM. In contrast, the DP-based strategy utilized by C-PMM and MC-PMM structurally guarantees a 100% adjacency rate, fundamentally eliminating crossover feed lines.
Table 3.
Physical contiguity adjacency rate comparison.
4.3. Pattern Comparison
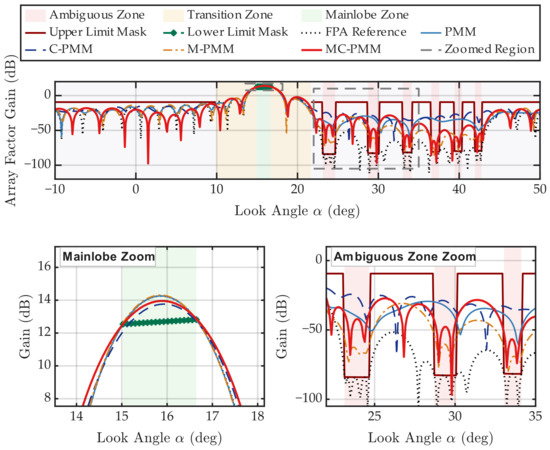
As shown in Figure 6, the four methods exhibit qualitatively distinct pattern matching behaviors. Due to the limited spatial degrees of freedom inherent in subarray dimensionality reduction, exact satisfaction of the deepest notch constraints is not attained by any method in this case. However, under the conventional equality matching framework, PMM and C-PMM indiscriminately consume their limited degrees of freedom, attempting to fit the reference pattern across the entire angular domain. Consequently, they fail to maintain deep nulls at the ambiguity angles, resulting in large mask violations (manifested as pattern elevations exceeding the mask upper bound ). In contrast, M-PMM and MC-PMM operate under the inequality envelope matching framework, which abandons unnecessary waveform fitting within the safety zones. This mechanism concentrates the limited degrees of freedom strictly on regions that violate the mask. Although MC-PMM inevitably exhibits a minor violation at the deepest notches due to the physical contiguity constraint, it reduces the ambiguous zone lobes compared to the equality matching baselines, bringing the pattern closer to the SDP-derived reference mask.
Figure 6.
Power pattern comparison with limit masks: (top), full-angle patterns; (bottom), zooms of the mainlobe and ambiguous regions.
Quantitatively, the cost function J of the four methods is summarized in Table 4. The J values of PMM and C-PMM are substantially higher than those of M-PMM and MC-PMM, confirming that the equality matching framework indeed incurs a significant excessive matching penalty under the hardware dimensionality reduction constraint. M-PMM attains the lowest J, yet its partitioning topology lacks engineering realizability; MC-PMM yields a J value slightly higher than that of M-PMM but achieves a balance between pattern matching performance and engineering realizability under the strict physical contiguity constraint. This ablation confirms that physical contiguity and mask-based weighting solve complementary parts of the design problem.
Table 4.
Mask violation cost comparison.
4.4. System-Level Performance
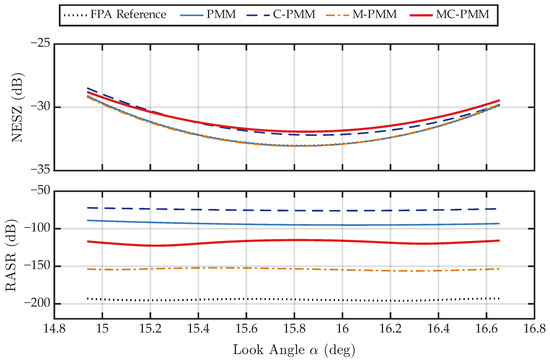
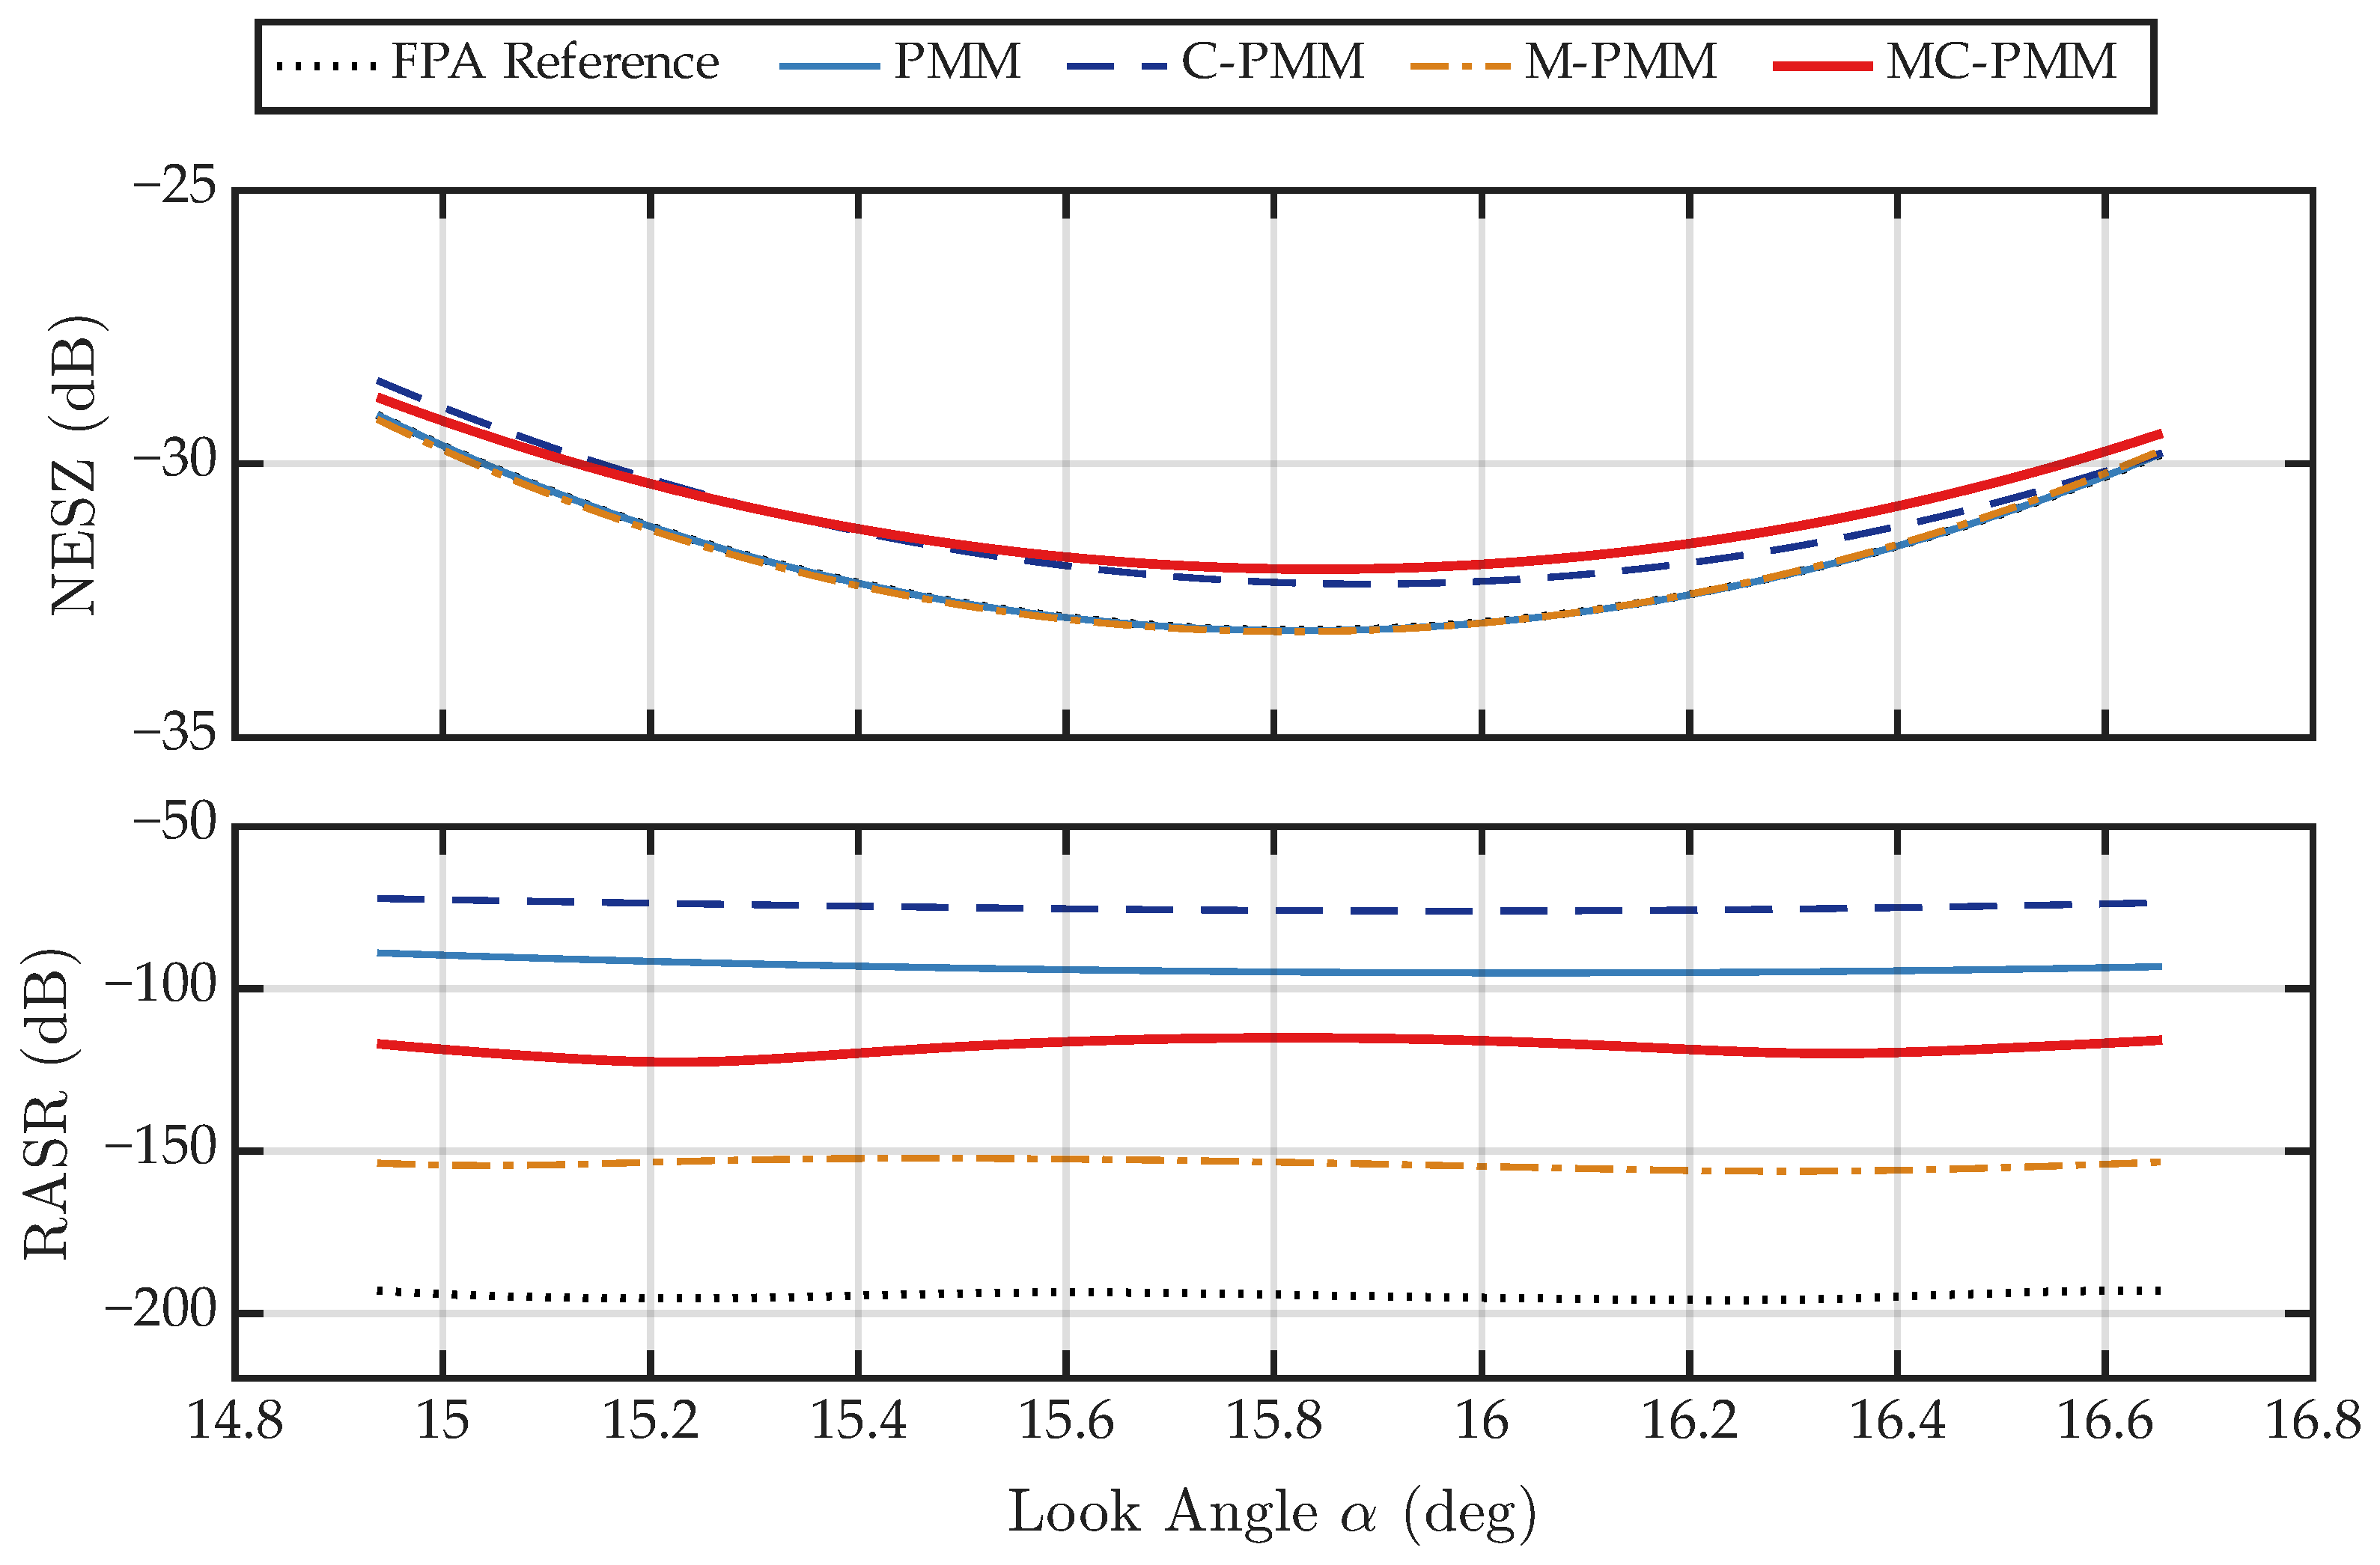
To facilitate a comprehensive evaluation of the SAR system-level metrics, Figure 7 presents the look-angle-dependent performance, while Table 5 summarizes the quantitative results at the representative subarray configuration.
Figure 7.
Look-angle-dependent SAR performance comparison: (top), NESZ; (bottom), RASR.
Table 5.
Quantitative comparison of SAR system-level metrics.
As illustrated in Figure 7 and Table 5, MC-PMM achieves a RASR suppression improvement relative to the equality matching baselines. Specifically, relative to PMM, MC-PMM lowers the worst-case and mean RASR by dB and dB, respectively; relative to C-PMM, the corresponding reductions are dB and dB. This improvement is attributed to the two-phase design: phase I first provides an SAR-metric-aware SDP-derived reference mask for the given array, and phase II then performs Mask-IPM projection with respect to the prescribed mask bounds rather than enforcing equality projection to the full-array reference pattern, thereby directing the reduced CPA degrees of freedom toward the mask-critical angular samples, especially the ambiguity-region notches.
Consequently, the mask-constrained result shows a slight NESZ degradation relative to some comparison cases, while still satisfying the mainlobe lower-mask requirement associated with NESZ (the top panel of Figure 7). However, the quantitative data reveals that this asymmetric performance exchange is favorable: the RASR reduction is obtained at the cost of a marginal worst-case NESZ degradation of only dB compared to the ideal FPA baseline. Furthermore, while M-PMM attains a lower RASR in the numerical result, it fails the fundamental engineering requirement of physical contiguity.
4.5. Convergence Behavior
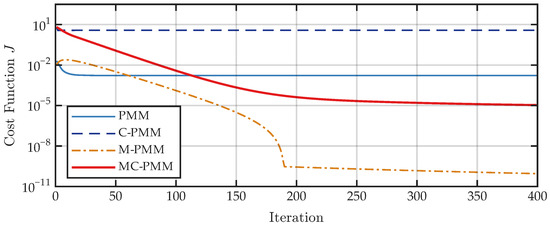
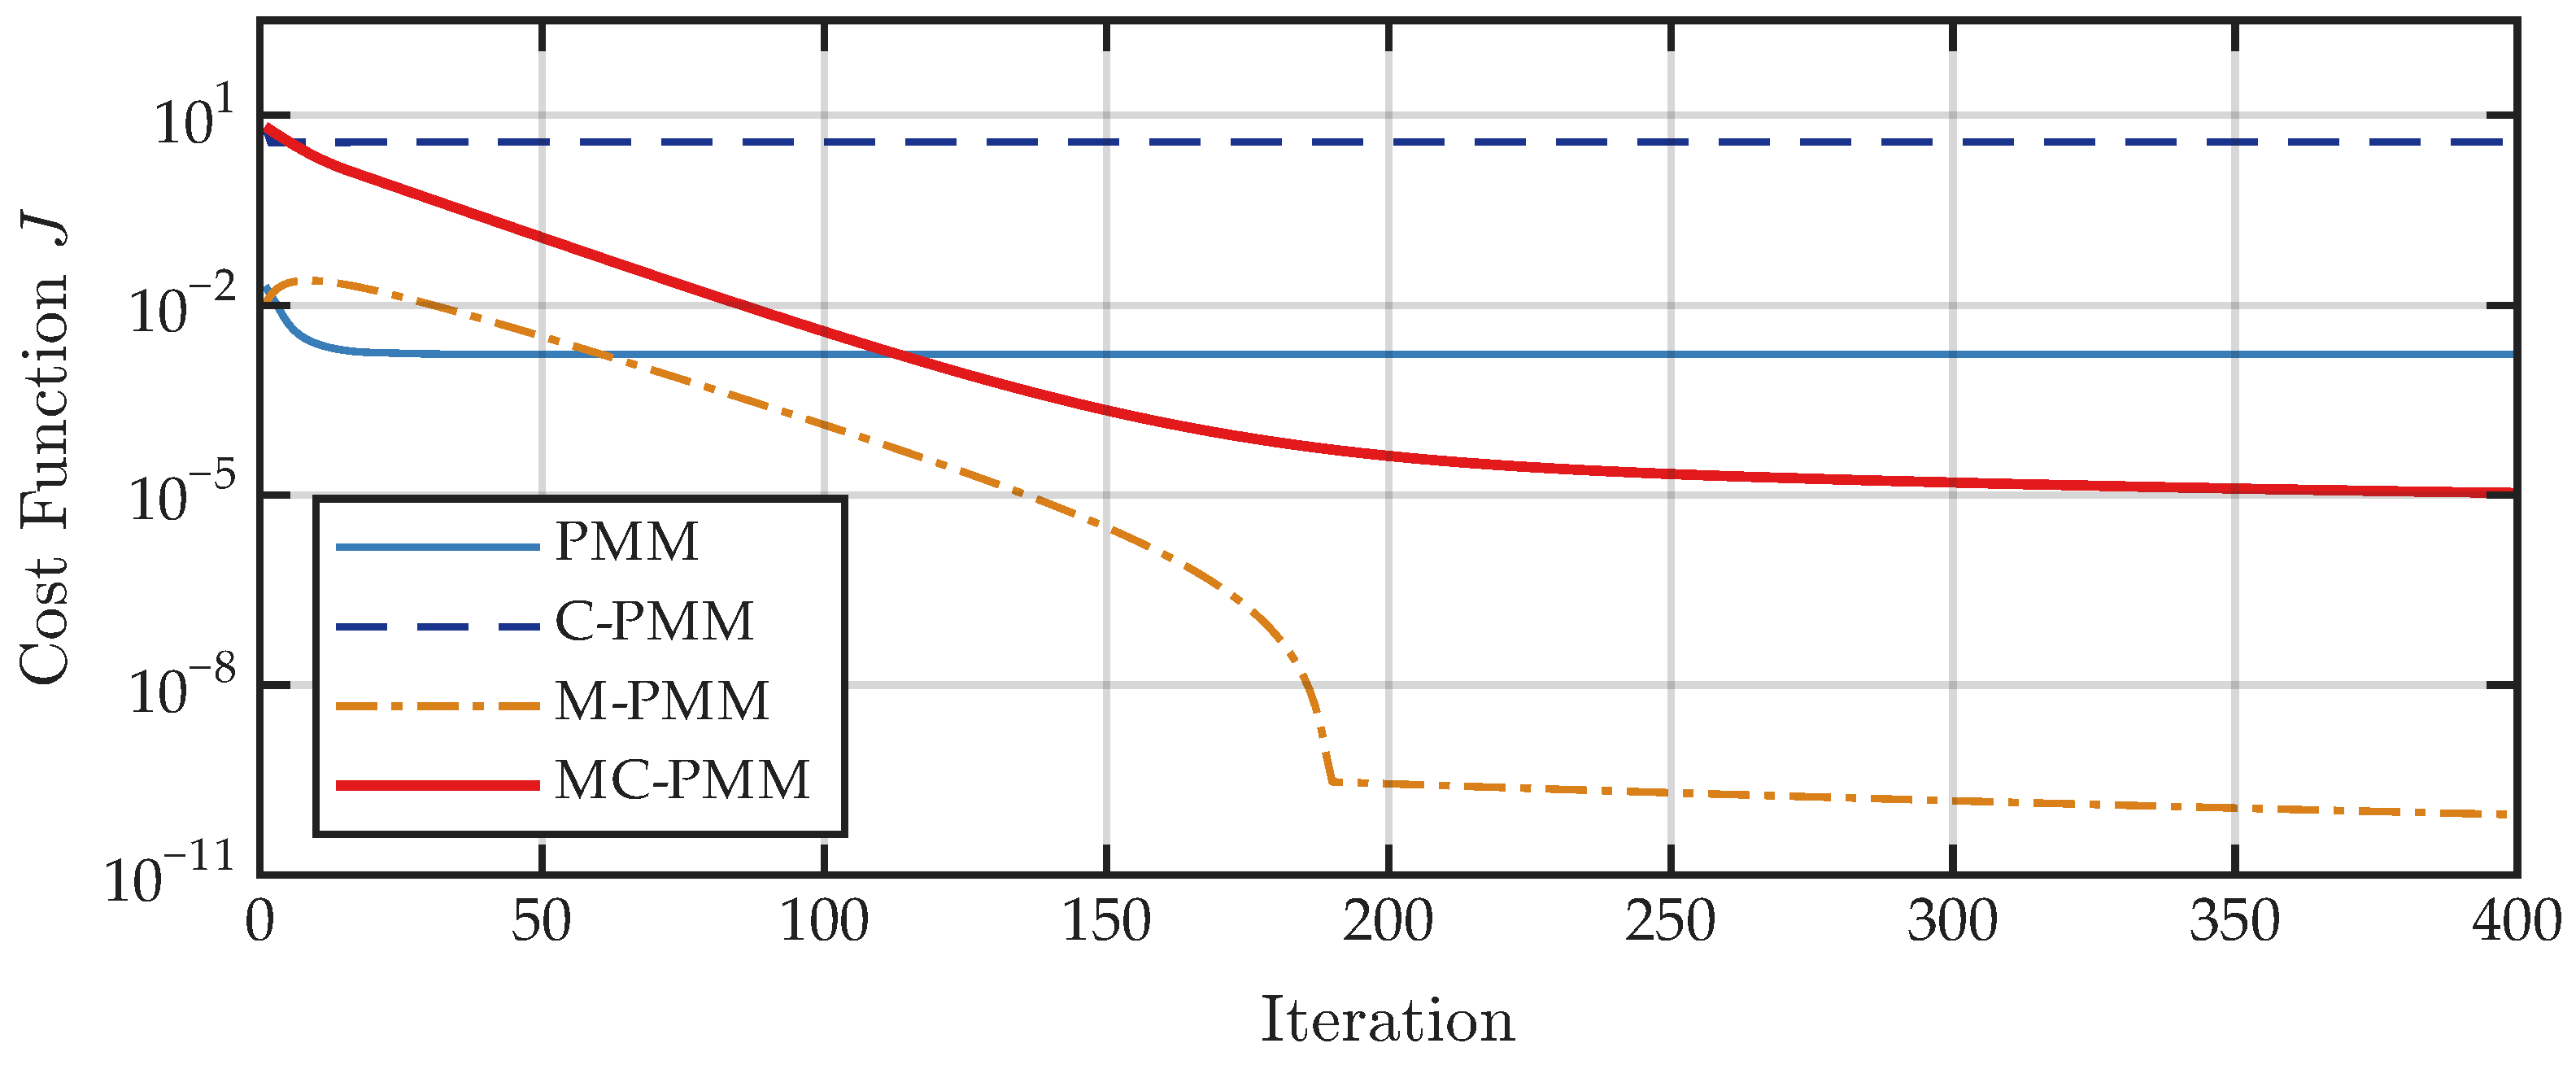
As shown in Figure 8, the mask-violation cost curves of the Mask-IPM-based methods (M-PMM and MC-PMM) exhibit a clear decreasing trend and gradually stabilize within the preset 400 iterations. In contrast, the equality-matching baselines (PMM and C-PMM) quickly plateau at higher mask-violation levels and do not exhibit the same monotonic behavior with respect to J, because their optimization objective is the equality-matching metric rather than the mask-violation cost. Together with the candidate-screening rule described above, these results indicate that Mask-IPM provides favorable numerical convergence behavior for reducing mask violations, while the figure should be interpreted as a numerical convergence assessment rather than a rigorous global convergence proof.
Figure 8.
Convergence of the mask violation cost J.
4.6. Subarray Ratio and Array-Size Sweeps
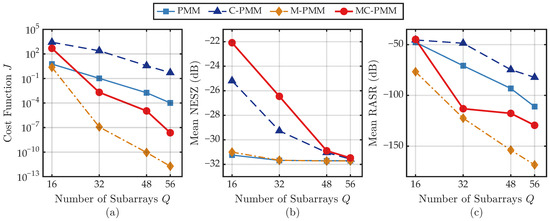
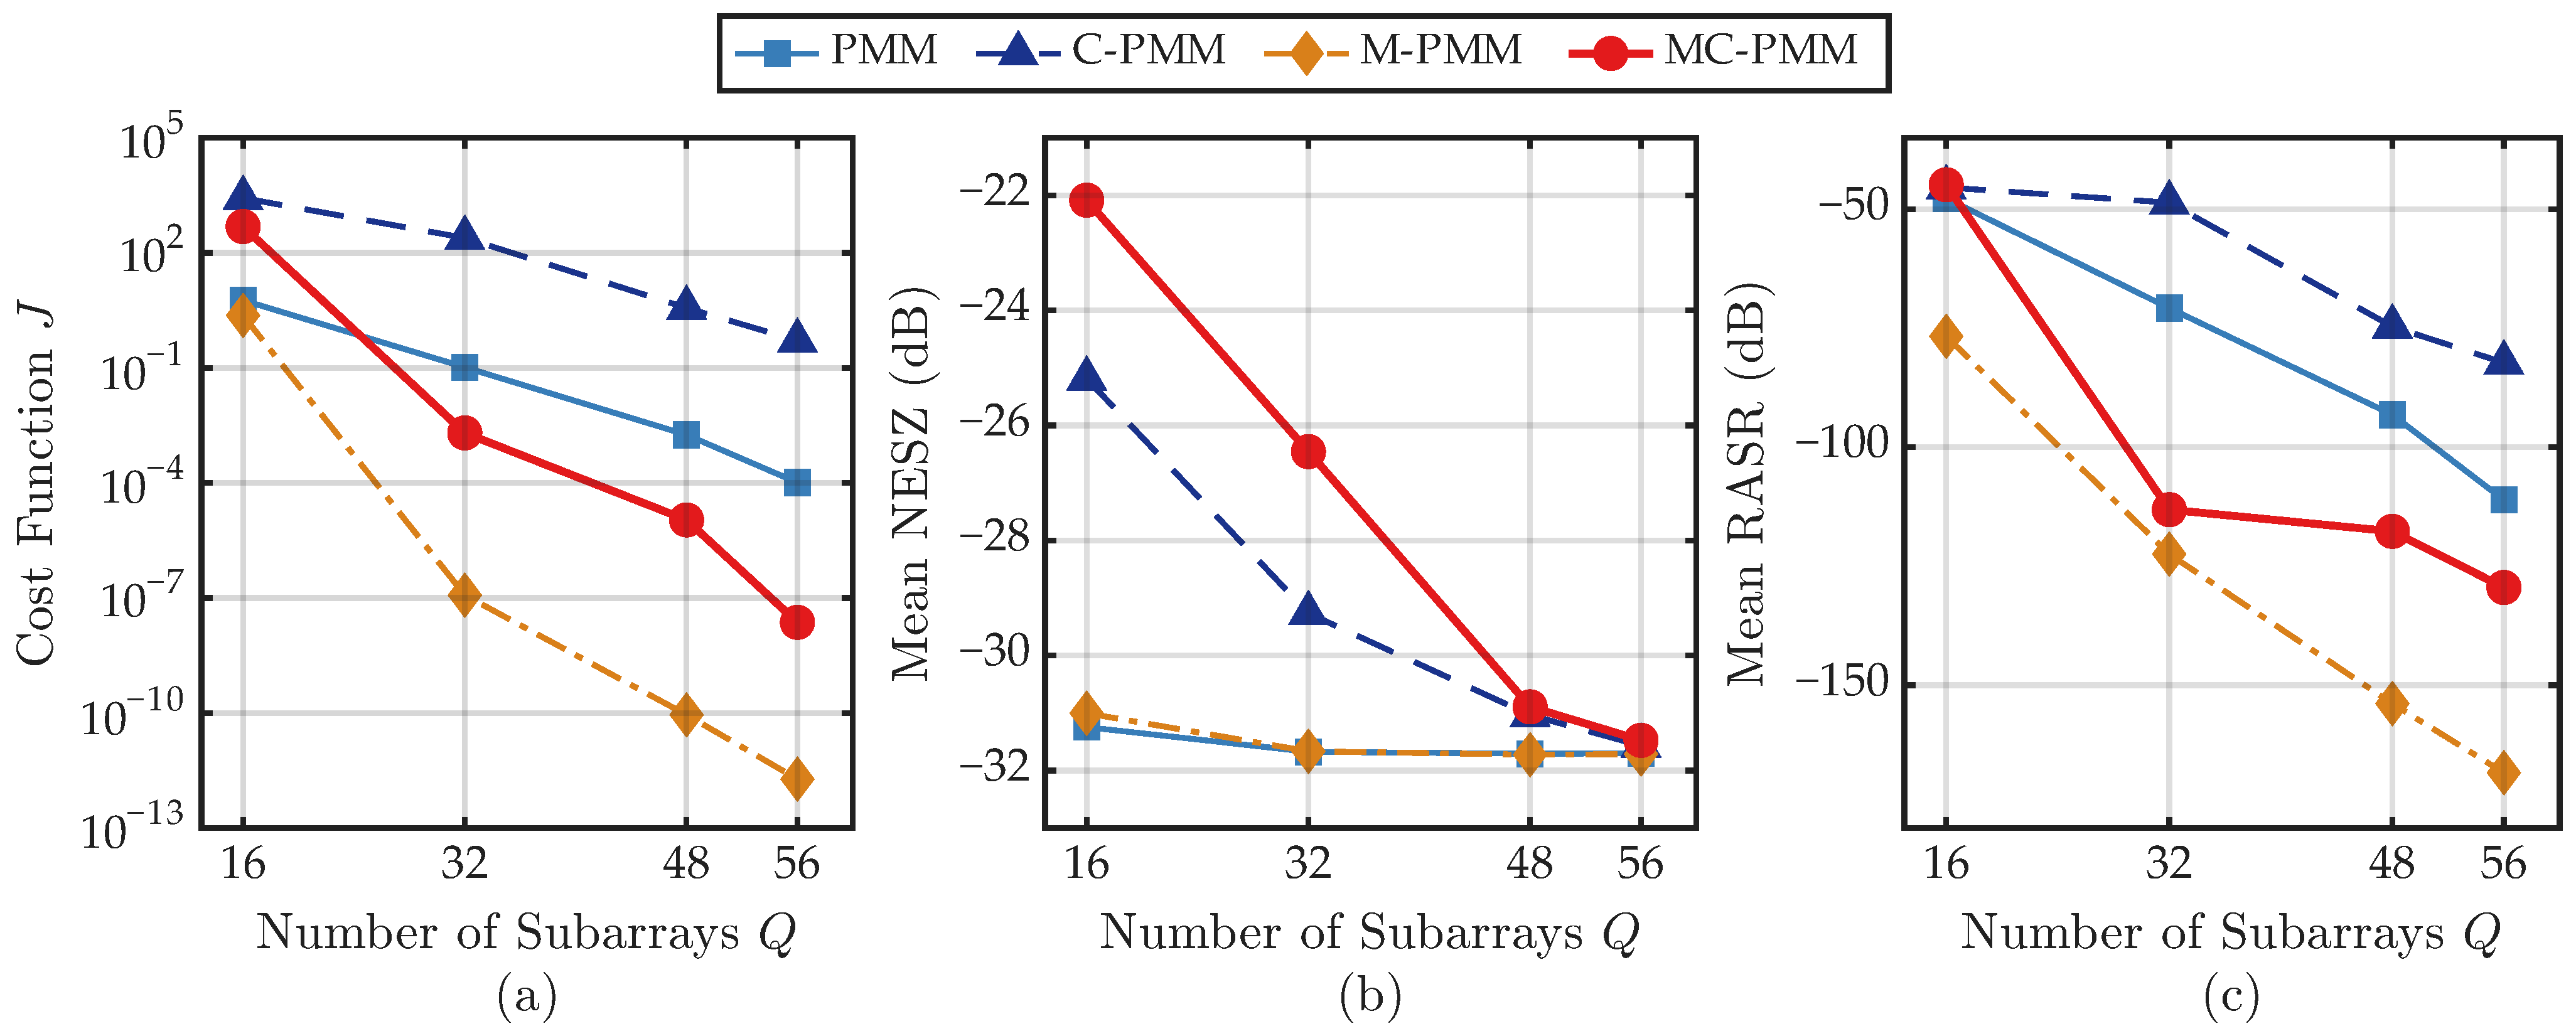
Figure 9 summarizes the fixed-N sweep for and . Figure 9a reports the mask-violation cost J, showing that MC-PMM reduces the violation level as Q increases and approaches the unconstrained M-PMM benchmark when more subarray degrees of freedom are available. Figure 9b reports the mean NESZ, and Figure 9c reports the mean RASR. Although all methods benefit from the increased subarray degrees of freedom as Q grows, MC-PMM maintains lower mean RASR than the equality-matching baselines under practical subarray ratios while retaining physical contiguity, supporting its applicability across different settings.
Figure 9.
Fixed-N sweep over the number of subarrays Q for : (a) mask violation cost J; (b) mean NESZ; (c) mean RASR.
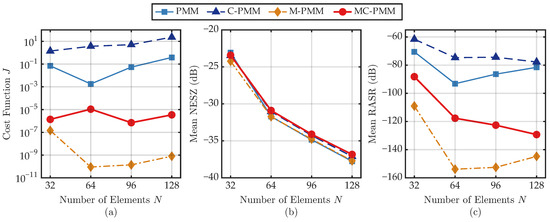
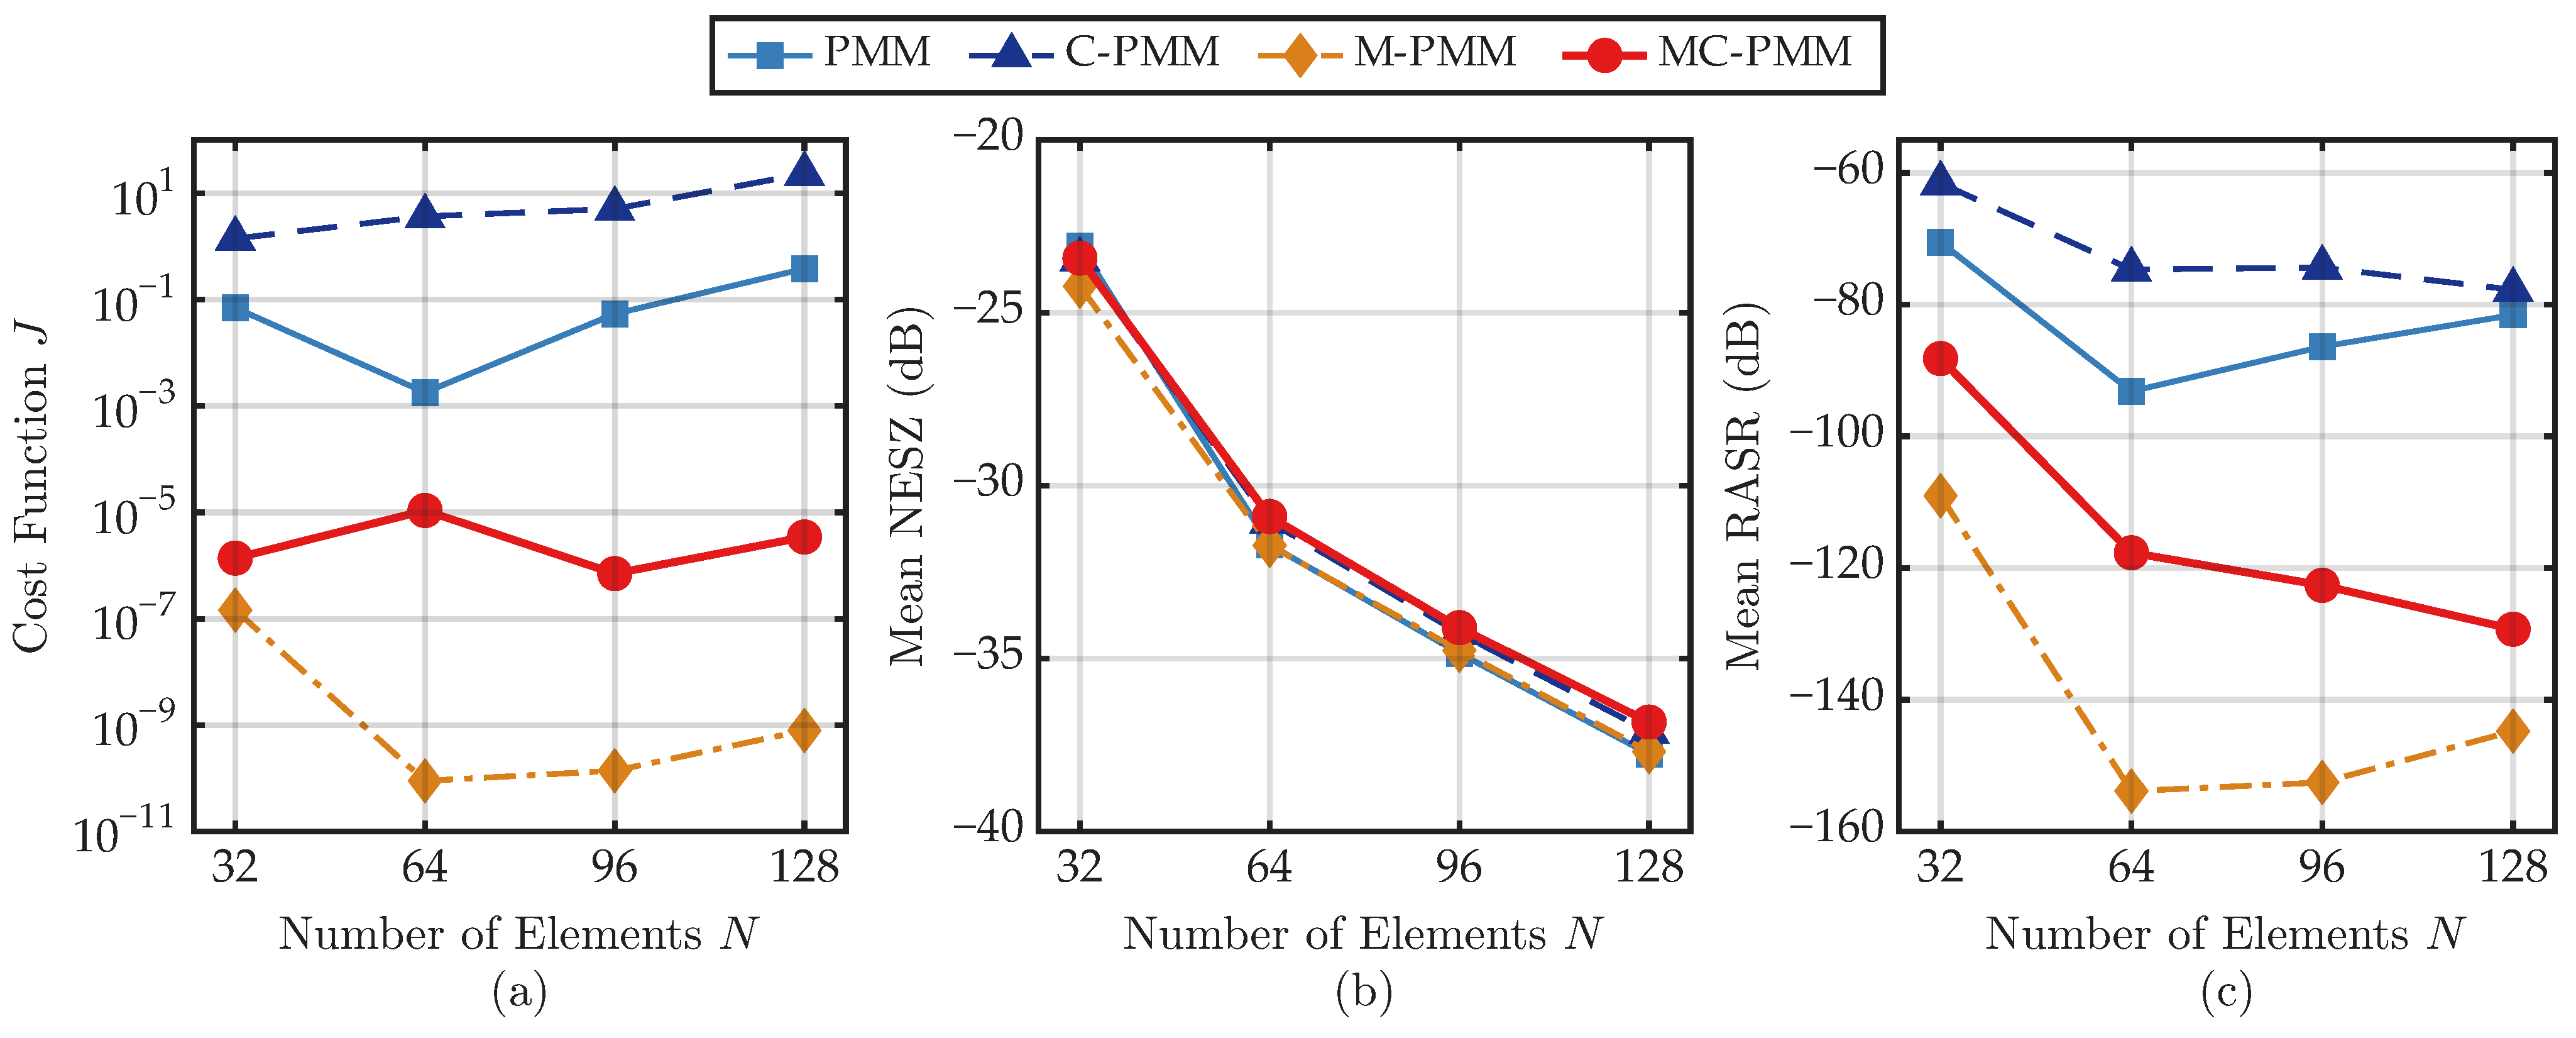
Figure 10 further evaluates the fixed-ratio setting for . Figure 10a shows that MC-PMM maintains low mask violation across the tested array sizes, confirming that the proposed contiguous design remains effective after aperture scaling. The variation of J with N is more moderate than its variation with Q in Figure 9a, which is consistent with the definition of J because the subarray ratio directly controls the reduced-dimensional degrees of freedom available for satisfying the mask constraints. Figure 10b shows that the mean NESZ values of all methods decrease monotonically as N increases, with only small differences among the methods. Figure 10c shows that the mean RASR of MC-PMM remains consistently lower than those of PMM and C-PMM across all tested array sizes. Thus, the array-size sweep demonstrates the effectiveness of MC-PMM across multiple N values without relying on a single representative configuration.
Figure 10.
Fixed-ratio array-size sweep for : (a) mask violation cost J; (b) mean NESZ; (c) mean RASR.
4.7. Computational Time
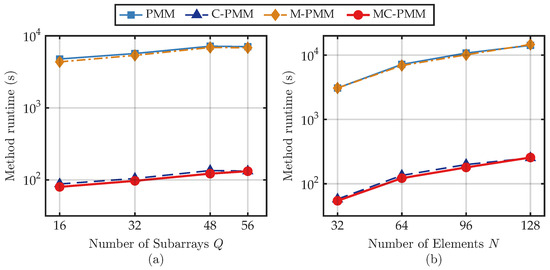
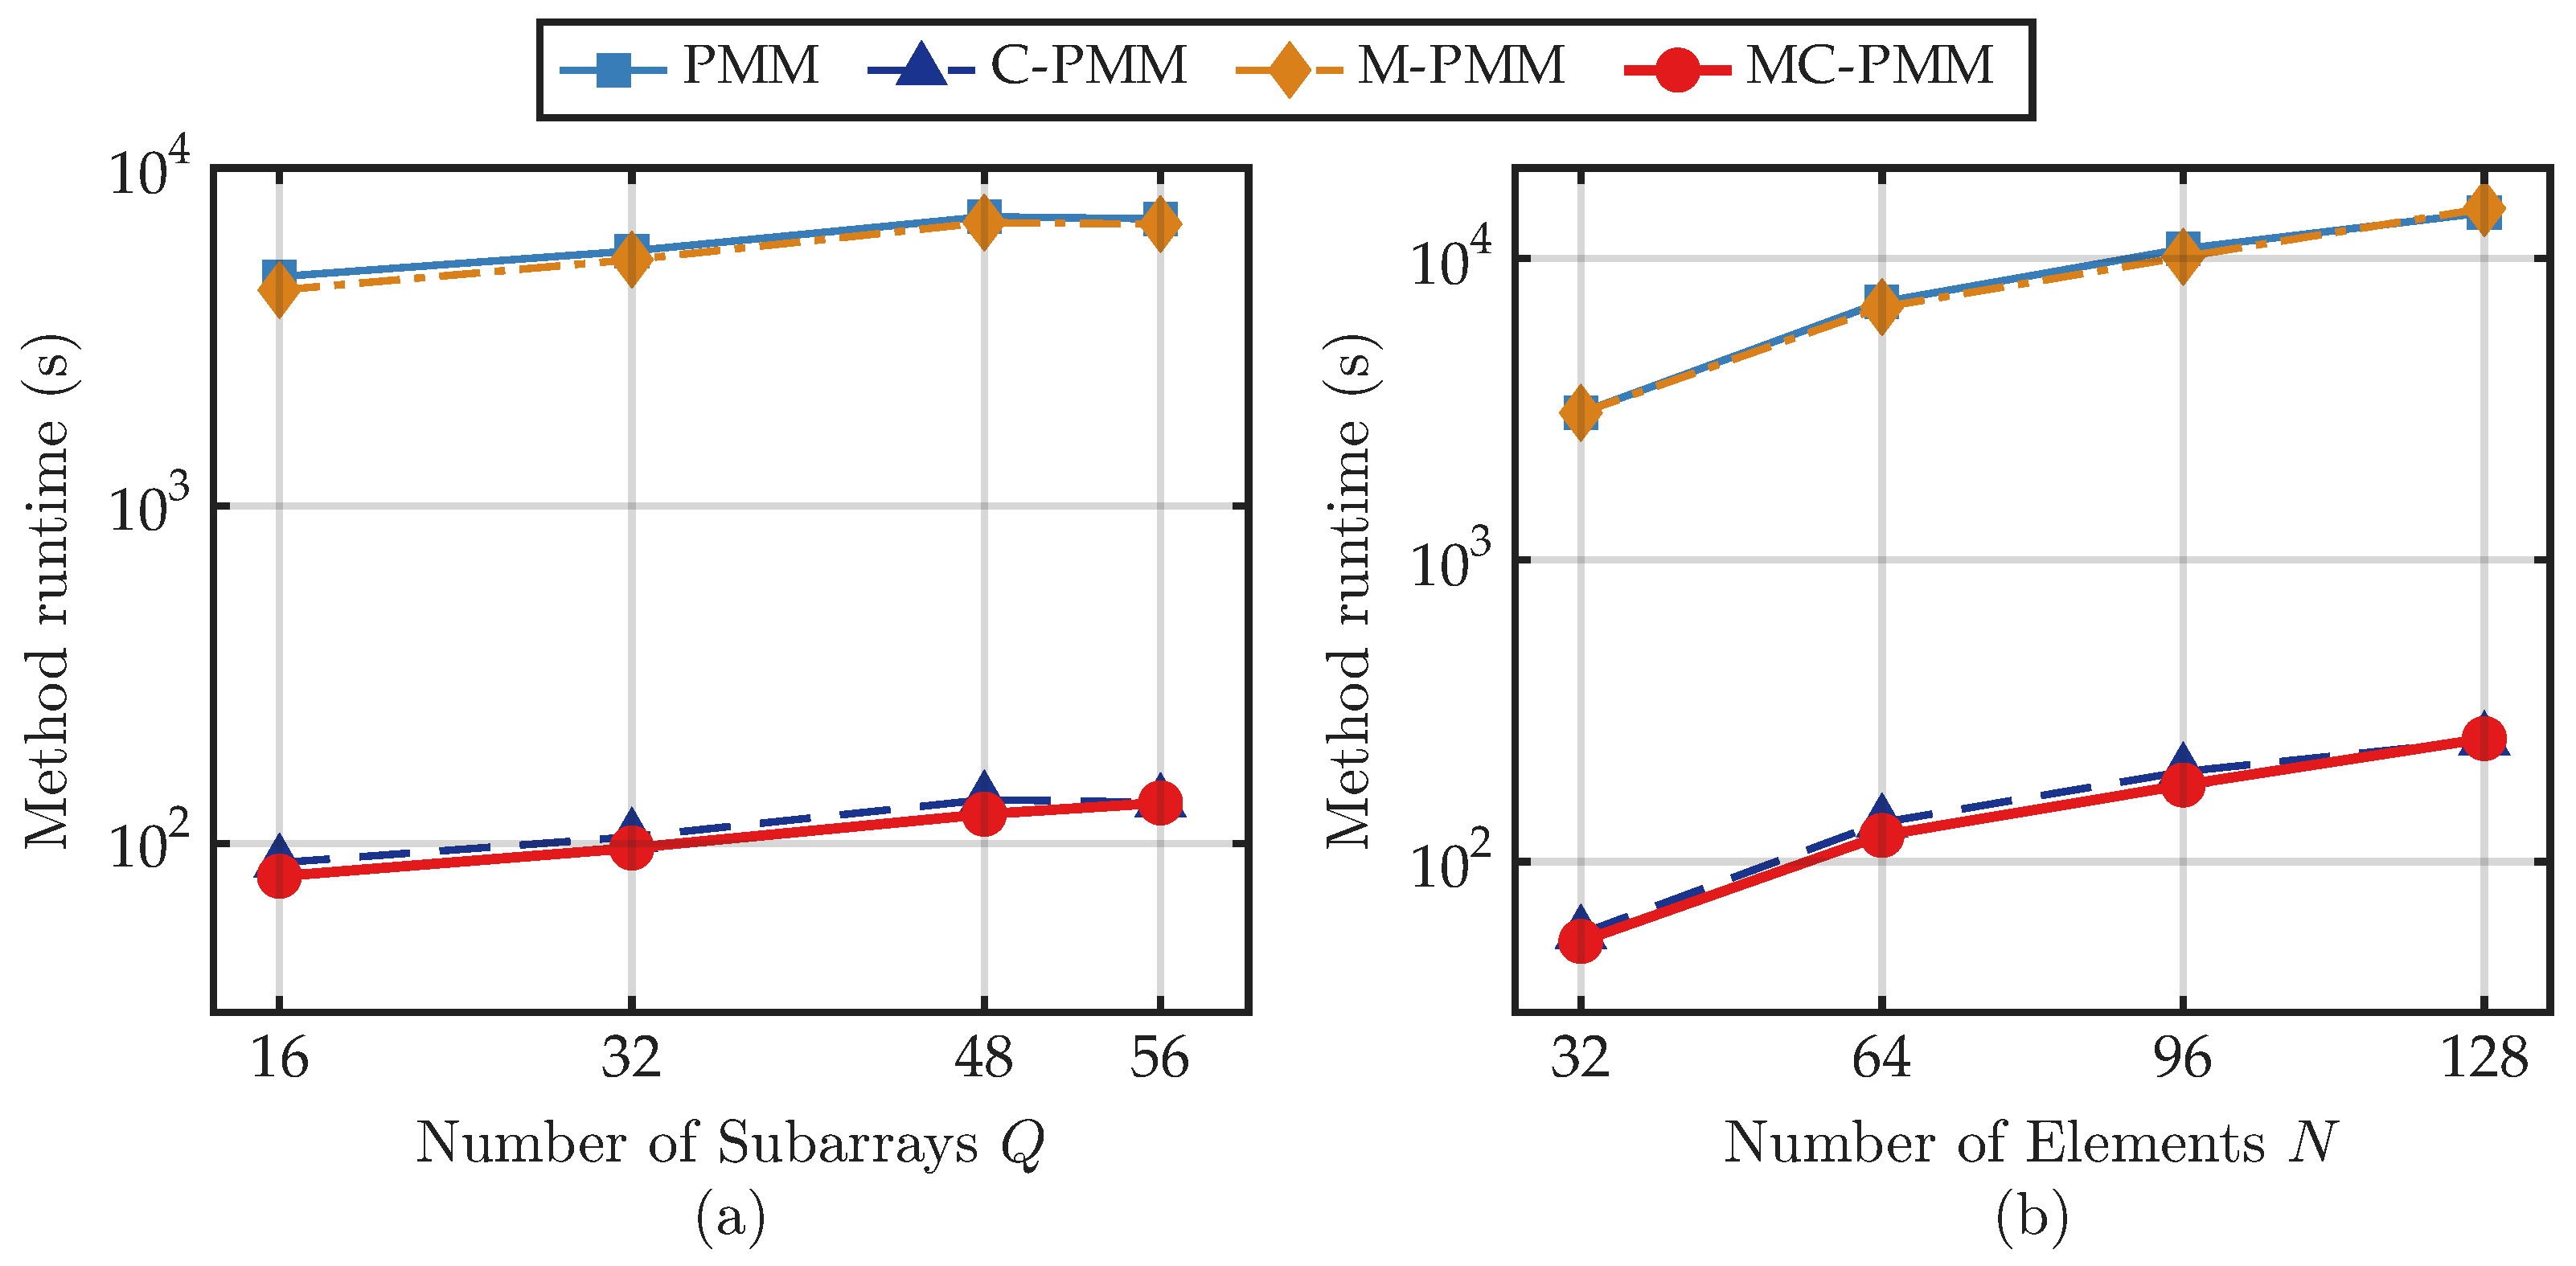
Figure 11 reports the phase II method runtimes measured on a Windows 11 personal computer with 32 GB RAM using six MATLAB R2024b workers. The runtime difference is consistent with the partition-stage complexity: one EP-domain K-means run used by PMM and M-PMM scales as , and the random initializations used in the experiments increase this cost, whereas the DP-based contiguous partition used by C-PMM and MC-PMM precomputes the interval-cost table and has complexity without random restarts. For example, in the representative case, C-PMM requires only 2 min 15 s, whereas PMM requires 1 h 59 min 37 s. In the array-size sweep, MC-PMM requires 2 min 2 s in phase II for and 4 min 16 s for . The phase I SDP-based mask-generation time, which is not included in Figure 11, increases from 4 min 22 s for to 1 h 13 min 8 s for , 2 h 24 min 21 s for , and 3 h 45 min 5 s for . These timings indicate that the tested cases remain feasible for offline design in the stated computing environment, while the phase I SDP cost increases with array size. The recorded MATLAB memory peaks remain moderate, approximately 2.51 GB for the representative regenerated phase II case.
Figure 11.
Measured method runtime: (a) fixed-N sweep over Q for ; (b) fixed-ratio array-size sweep for .
In all simulations, angular samples are used to provide a relatively dense angular discretization for the mask constraints and outer-loop candidate traversal; the resulting computational cost is acceptable for the present numerical validation. Moreover, the proposed subarray synthesis is an offline antenna-array design procedure performed after the array geometry and SAR system parameters have been specified and before mission operation, so the reported runtimes affect design preparation only and do not represent an online SAR imaging burden.
4.8. Image-Domain Illustration
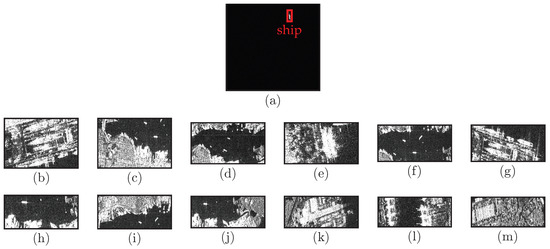
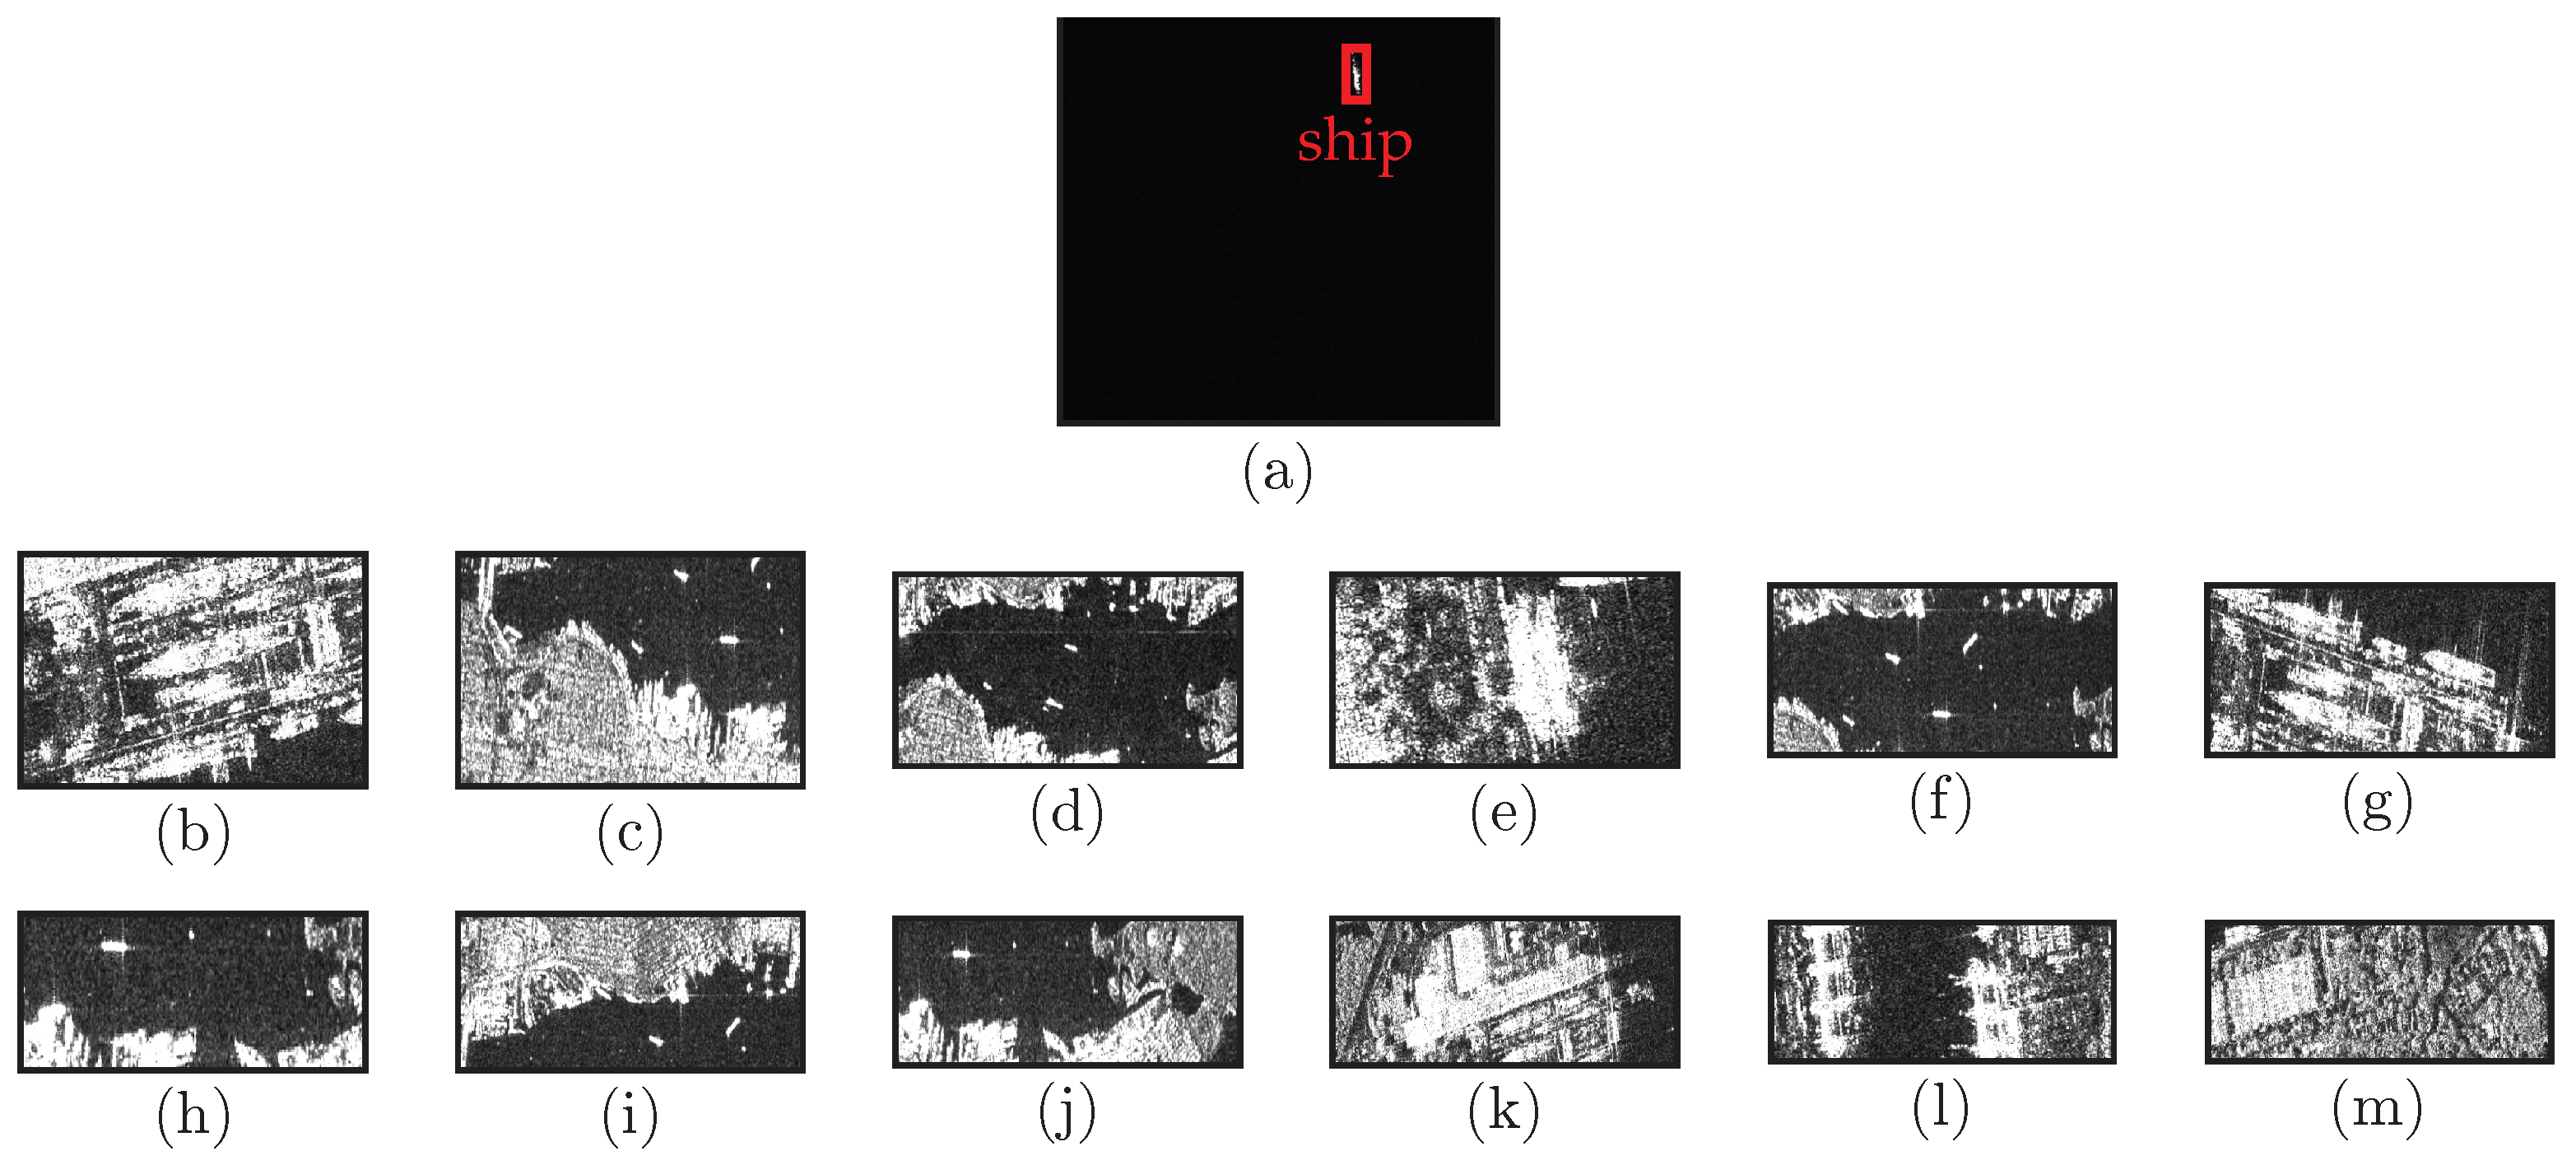
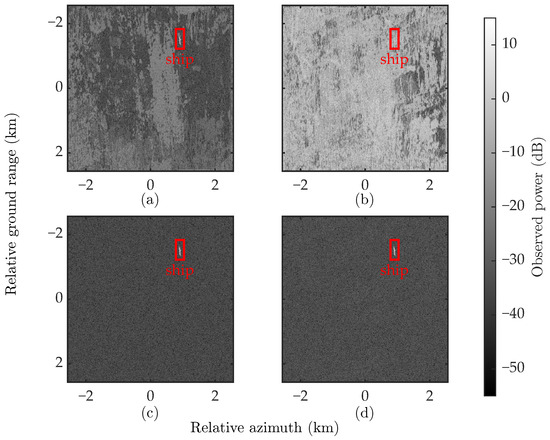
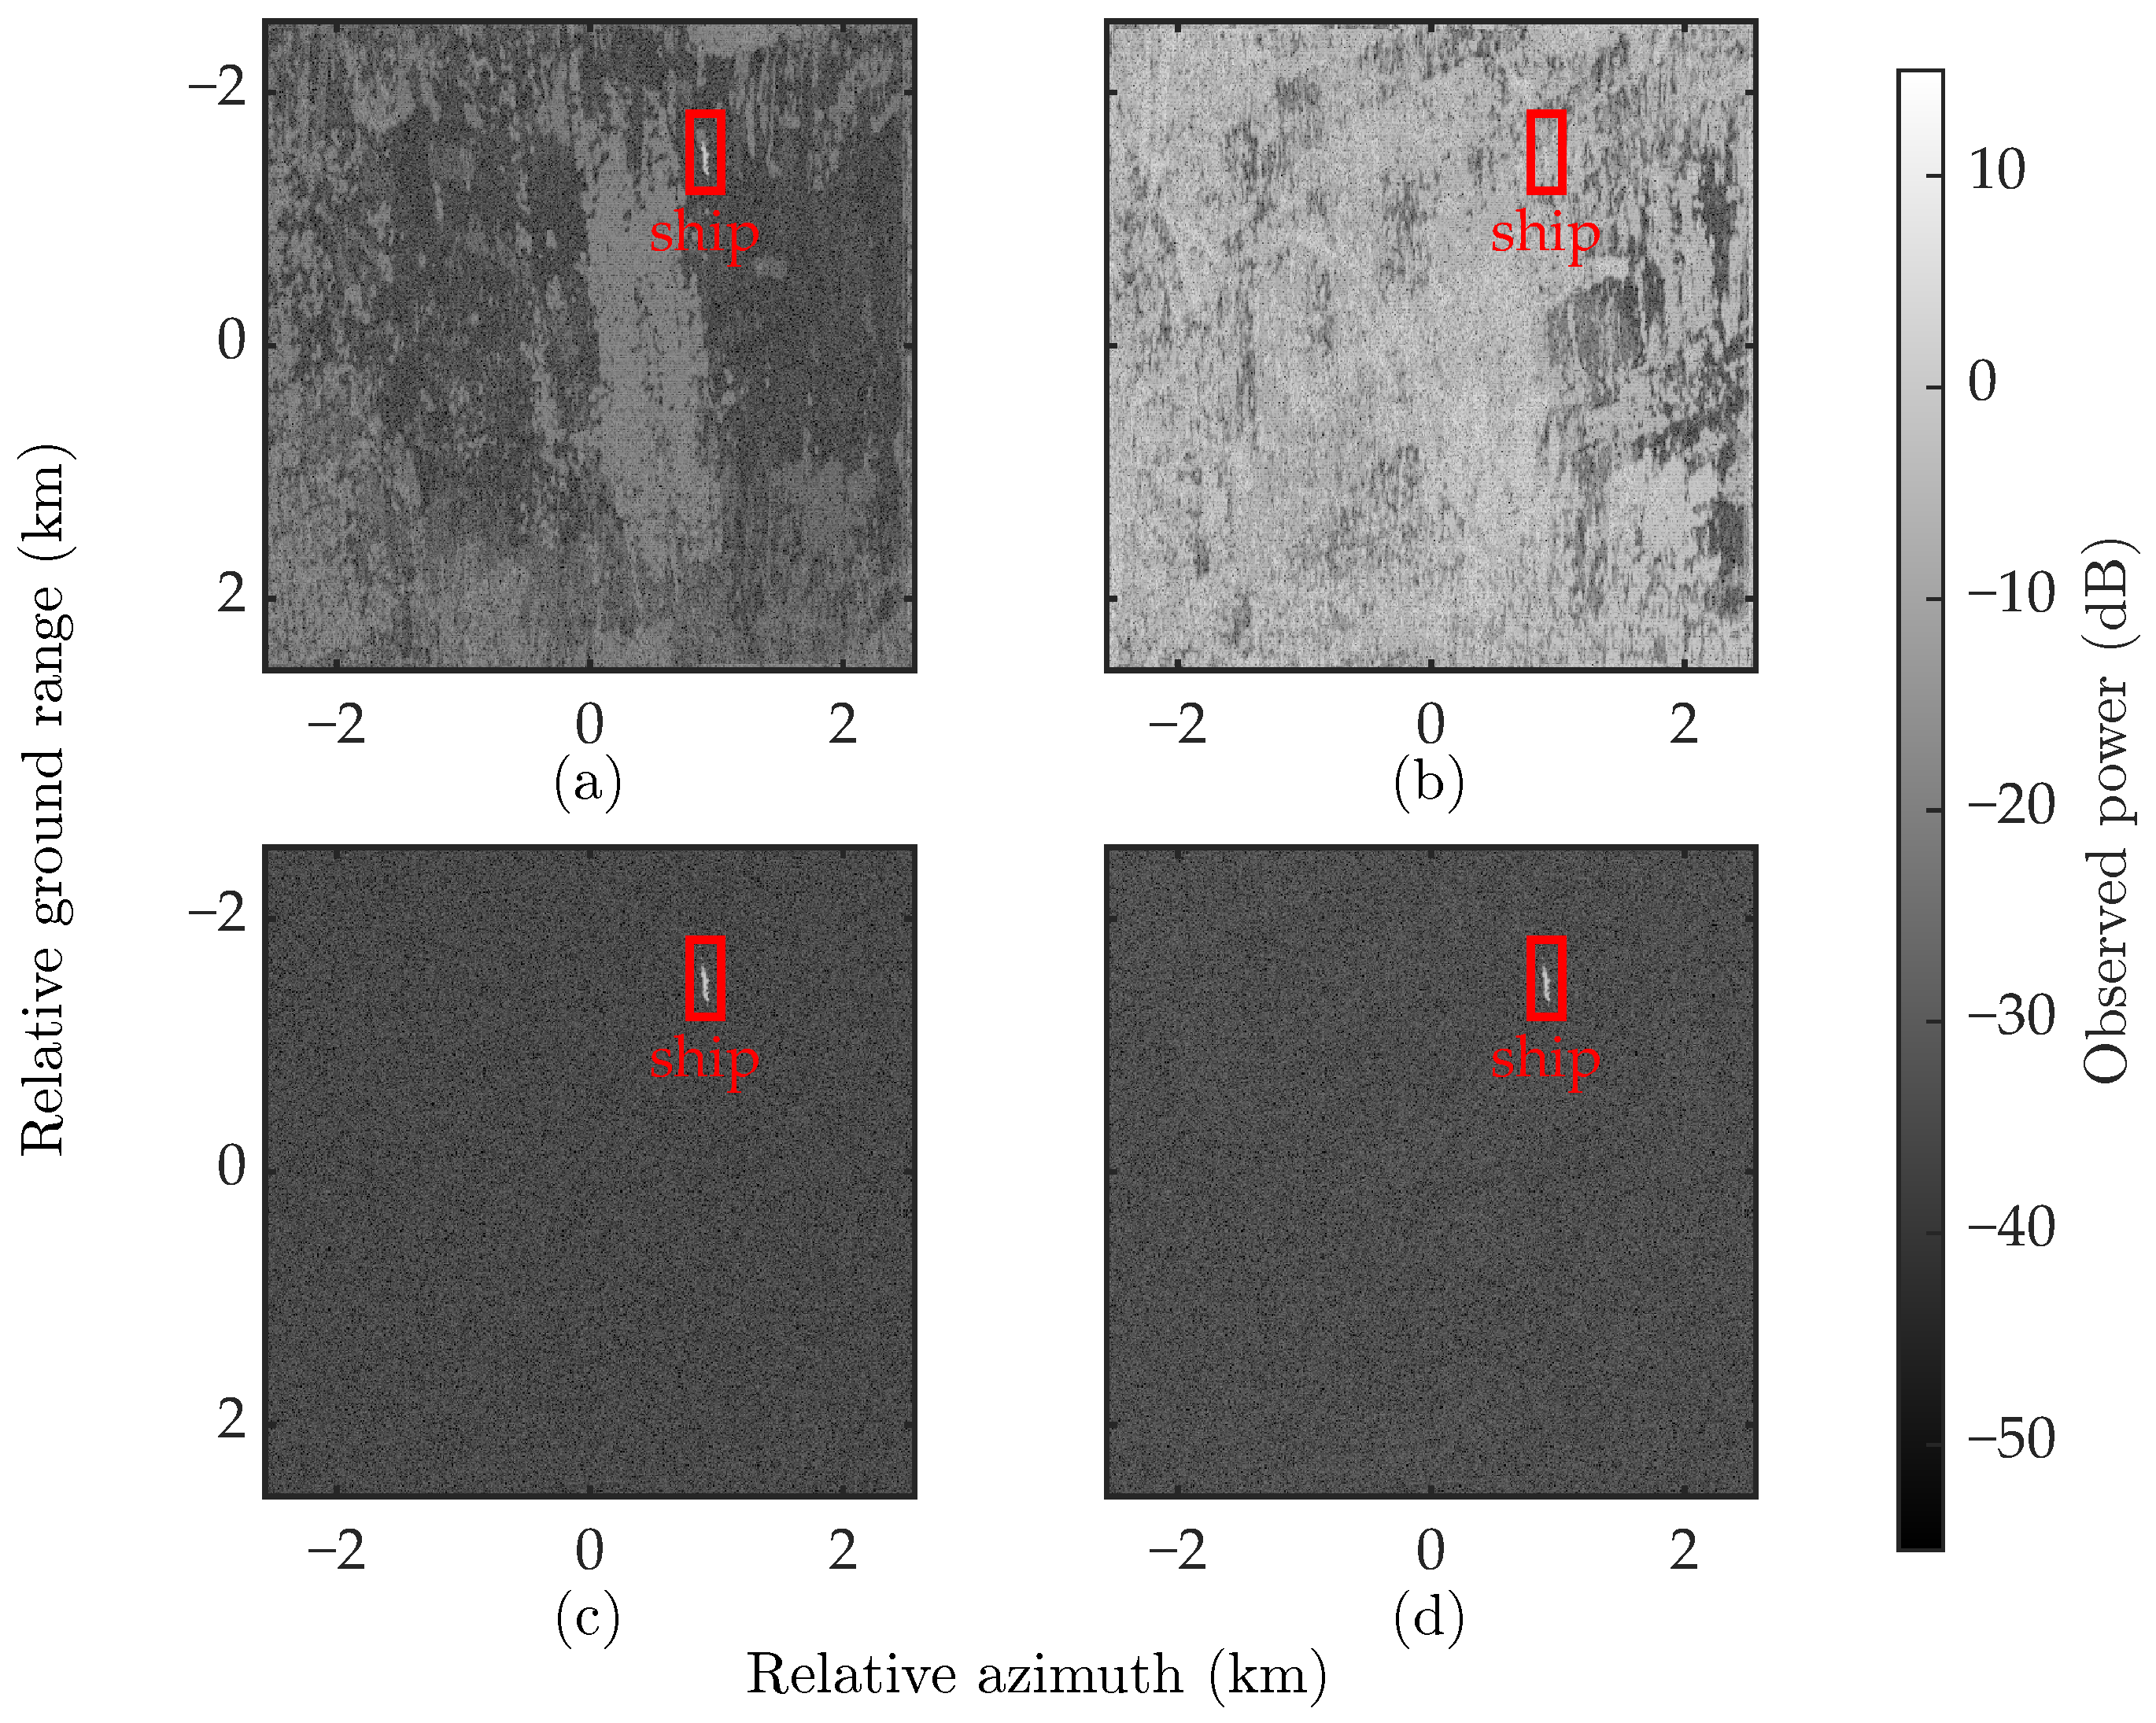
Figure 12 and Figure 13 provide a qualitative SSDD-based image-domain illustration for the case. The SAR image chips are selected from the public SAR ship detection dataset (SSDD) [42]; one weak ship-containing chip is used for the mainlobe swath in (6), and twelve shoreline/land-dominated chips represent the positive and negative ambiguous zones. Their placement in the figures is only illustrative and does not necessarily follow the true spatial locations of the original SSDD scenes. In the image synthesis, the ambiguous zone chips are assigned stronger backscatter, and the additive noise level is set according to the NESZ expression in (4). Under the same illustrative scene and noise/ambiguity conditions, MC-PMM shows visibly reduced ambiguity contamination compared with the equality-matching baselines, so that the highlighted ship target in the mainlobe swath remains relatively clear and the mainlobe-swath image interpretability is improved. It should be emphasized, however, that this experiment is not an end-to-end raw-echo SAR imaging validation, but only an image-domain illustration of the NESZ/RASR effect.
Figure 12.
SSDD-based image chips used for the image-domain illustration: (a) chip corresponding to the mainlobe swath; (b–m) chips corresponding to ambiguous zones.
Figure 13.
SSDD-based image-domain illustration for the case: (a) PMM; (b) C-PMM; (c) M-PMM; (d) MC-PMM.
5. Discussion
The SAR metrics pursued in this study are stricter than many conventional SAR system-level design thresholds. This demanding setting is intended to explore antenna-synthesis margins for future HRWS SAR concepts, interference-sensitive observation modes, and severe ambiguity environments. The following model assumptions and limitations should therefore be noted.
The numerical results in this paper are obtained under an idealized array model with isotropic elements, continuous complex weights, and perfectly known array geometry. The present implementation does not impose a dynamic-range constraint on the element-level excitation amplitudes; consequently, the full-array degree-of-freedom optimization used to establish this reference mask remains an idealized benchmark for the subsequent CPA synthesis. This setting is useful for isolating the algorithmic effects of the proposed MC-PMM framework, especially the role of the SDP-derived limit mask, DP-based contiguous partitioning, and Mask-IPM-based inequality envelope matching. However, the resulting quantitative values should be interpreted as antenna-pattern-level numerical benchmarks rather than direct predictions of an operational spaceborne SAR payload.
In practical active phased arrays, non-ideal element patterns, mutual coupling, transmit/receive module amplitude and phase errors, calibration residuals, quantized control states, feed-network losses, manufacturing tolerances, and element excitation amplitude dynamic ranges may reshape the array manifold and reduce the achievable notch depth. These effects may therefore weaken the stringent SAR metric values reported in the idealized simulations and may also introduce additional trade-offs between ambiguity suppression, NESZ preservation, and feed-network implementation. Nevertheless, the proposed framework can accommodate these factors in future extensions by replacing the ideal steering matrix with an embedded-element or measured array manifold, incorporating loss, quantization, and amplitude dynamic-range constraints into the performance-evaluation pipeline, and re-evaluating the mask-violation cost under the corresponding hardware constraints.
Another limitation is that the present study develops and evaluates MC-PMM under a monostatic elevation-pattern synthesis model for a representative HRWS SAR configuration. Extensions to DBF-SCORE with wide-transmit and narrow-receive beams, MIMO-SAR, asymmetric transmit/receive apertures, two-dimensional planar arrays, and hardware-in-the-loop validation are possible at the framework level, but they require dedicated transmit–receive modeling, channel-dependent pattern definitions, and calibration-error modeling. Due to space limitations, these extensions are beyond the scope of the present antenna-pattern-level algorithmic study but constitute important directions for subsequent work.
6. Conclusions
This paper proposes MC-PMM to address the subarray synthesis challenge for spaceborne SAR elevation arrays under hardware dimensionality reduction. By reconstructing the design workflow into a two-phase procedure, MC-PMM first constructs an SAR-metric-aware SDP-derived reference mask for the subsequent subarray synthesis. Subsequently, by integrating physically contiguous topology generation with mask-violation-based inequality matching, MC-PMM achieves a physical contiguity rate () to eliminate feed-line crossovers while shifting the optimization focus from redundant equality waveform fitting to critical inequality envelope matching. Numerical results and ablation studies demonstrate the distinct roles of the synthesis frameworks: while the spatially unconstrained M-PMM serves as an algorithmic benchmark without physical spatial contiguity constraints, the proposed MC-PMM successfully balances electromagnetic performance and hardware constraints. For the representative case, MC-PMM reduces the mask violation cost function J to and lowers the mean RASR by dB and dB relative to PMM and C-PMM, respectively, with a worst-case NESZ degradation of dB relative to the ideal FPA benchmark. Additional subarray-ratio and array-size sweeps show that MC-PMM retains the physically contiguous topology and maintains favorable overall numerical performance in terms of mask violation cost, NESZ, and RASR across the tested settings; the runtime comparison further shows that the DP-based methods avoid the expensive random-restart structure of the K-means-based baselines, and the image-domain illustration links the pattern-level RASR reduction to reduced ambiguity artifacts. This trade-off confirms that MC-PMM effectively sacrifices a marginal fraction of unconstrained optimization space to secure a strictly contiguous, crossover-free topology, providing a robust and engineering-realizable design pathway for HRWS spaceborne SAR systems.
Author Contributions
Conceptualization, T.Z. and Y.Y.; methodology, T.Z. and Y.Y.; software, T.Z.; validation, T.Z. and H.Q.; formal analysis, Y.Y. and D.M.; investigation, T.Z., Y.Y. and D.M.; resources, Y.Y.; data curation, T.Z. and Y.Y.; writing—original draft preparation, T.Z. and H.Q.; writing—review and editing, Y.Y. and D.M.; visualization, T.Z., Y.Y. and H.Q.; supervision, Y.Y. All authors have read and agreed to the published version of the manuscript.
Funding
This work was supported in part by the National Natural Science Foundation of China under Grant 62301127, in part by the Natural Science Foundation of Sichuan Province under Grant 2026NSFSC1422, and in part by the Fundamental Research Funds for the Central Universities under Grant ZYGX2025XJ004.
Data Availability Statement
The data presented in this study are available on request from the corresponding author due to institutional policies.
Conflicts of Interest
The authors declare no conflicts of interest.
References
- Moreira, A.; Prats-Iraola, P.; Younis, M.; Krieger, G.; Hajnsek, I.; Papathanassiou, K.P. A tutorial on synthetic aperture radar. IEEE Geosci. Remote Sens. Mag. 2013, 1, 6–43. [Google Scholar] [CrossRef] [Scilit]
- Curlander, J.C.; Mcdonough, R.N. Synthetic Aperture Radar: Systems and Signal Processing; Wiley Series in Remote Sensing; Wiley: New York, NY, USA, 1991. [Google Scholar]
- Makas, E.; Aslan, A.R. Spaceborne SAR system design considerations: Minimizing satellite size and mass, system parameter trade-offs, and optimization. Appl. Sci. 2024, 14, 9661. [Google Scholar] [CrossRef] [Scilit]
- Sánchez-Sevilleja, S.; García-Rodríguez, M.; Masa-Campos, J.L.; Cuerda-Muñoz, J.M. Antenna model with pattern optimization based on genetic algorithm for satellite-based SAR mission. Sensors 2025, 25, 4835. [Google Scholar] [CrossRef] [Scilit] [PubMed]
- Reigber, A.; Schreiber, E.; Trappschuh, K.; Pasch, S.; Müller, G.; Kirchner, D.; Geßwein, D.; Schewe, S.; Nottensteiner, A.; Limbach, M.; et al. The high-resolution digital-beamforming airborne SAR system DBFSAR. Remote Sens. 2020, 12, 1710. [Google Scholar] [CrossRef] [Scilit]
- Krieger, G. MIMO-SAR: Opportunities and pitfalls. IEEE Trans. Geosci. Remote Sens. 2014, 52, 2628–2645. [Google Scholar] [CrossRef] [Scilit]
- Jiao, Y.; Wu, L.; Ai, Z.; Zheng, M.; Zhang, H.; Zhao, F. An advanced real-time internal calibration scheme for the DBF-SCORE spaceborne SAR systems. Remote Sens. 2025, 17, 1425. [Google Scholar] [CrossRef] [Scilit]
- Zuo, W.; Li, C.; Zhang, S.; Li, D.; Peng, W.; Li, J.; You, D.; Duan, C. Research on azimuth DBF method of HRWS SPC MAB SAR imaging mode with non-ideal antenna mode. Remote Sens. 2024, 16, 1552. [Google Scholar] [CrossRef] [Scilit]
- Qiu, J.; Zhang, Z.; Deng, Y.; Zhang, H.; Wang, W.; Chen, Z.; Hou, S.; Feng, Y.; Wang, N. A novel real-time multi-channel error calibration architecture for DBF-SAR. Remote Sens. 2025, 17, 2890. [Google Scholar] [CrossRef] [Scilit]
- Guccione, P.; Mapelli, D.; Giudici, D.; Persico, A.R. Design of f-SCAN acquisition mode for synthetic aperture radar. Remote Sens. 2022, 14, 5283. [Google Scholar] [CrossRef] [Scilit]
- Li, H.; Ran, L.; He, C.; Ding, Z.; Chen, S. Adaptive beamforming with sidelobe level control for multiband sparse linear array. Remote Sens. 2023, 15, 4929. [Google Scholar] [CrossRef] [Scilit]
- Zhao, H.; Zhang, Z.; Chen, Z.; Fan, H.; Lv, Z.; Bi, J. A multiple-input multiple-output synthetic aperture radar echo separation and range ambiguity suppression processing framework for high-resolution wide-swath imaging. Remote Sens. 2025, 17, 609. [Google Scholar] [CrossRef] [Scilit]
- Barbarossa, S.; Levrini, G. An antenna pattern synthesis technique for spaceborne SAR performance optimization. IEEE Trans. Geosci. Remote Sens. 1991, 29, 254–259. [Google Scholar] [CrossRef] [Scilit]
- Kim, S.Y.; Myung, N.H.; Kang, M.J. Antenna mask design for SAR performance optimization. IEEE Geosci. Remote Sens. Lett. 2009, 6, 443–447. [Google Scholar] [CrossRef] [Scilit]
- Kim, S.Y.; Myung, N.H. An optimal antenna pattern synthesis for active phased array SAR based on particle swarm optimization and adaptive weighting factor. Prog. Electromagn. Res. C 2009, 10, 129–142. [Google Scholar] [CrossRef] [Scilit]
- Won, Y.J.; Lee, K.H.; Lee, J.H. Performance improvement of spaceborne SAR using antenna pattern synthesis based on quantum-behaved particle swarm optimization. Int. J. Antennas Propag. 2017, 2017, 6928970. [Google Scholar] [CrossRef] [Scilit]
- Kang, M.S.; Won, Y.J.; Lim, B.G.; Kim, K.T. Efficient synthesis of antenna pattern using improved PSO for spaceborne SAR performance and imaging in presence of element failure. IEEE Sens. J. 2018, 18, 6576–6587. [Google Scholar] [CrossRef] [Scilit]
- Battaglia, G.M.; Morabito, A.F.; Sorbello, G.; Isernia, T. Mask-constrained power synthesis of large and arbitrary arrays as a few-samples global optimization. Prog. Electromagn. Res. C 2020, 98, 69–81. [Google Scholar] [CrossRef] [Scilit]
- Wang, F.; Balakrishnan, V.; Zhou, P.; Chen, J.; Yang, R.; Frank, C. Optimal array pattern synthesis using semidefinite programming. In Proceedings of the 2001 IEEE International Conference on Acoustics, Speech, and Signal Processing, Proceedings (Cat. No.01CH37221), Salt Lake City, UT, USA, 7–11 May 2001; Volume 5, pp. 2925–2928. [Google Scholar] [CrossRef] [Scilit]
- Fuchs, B. Application of convex relaxation to array synthesis problems. IEEE Trans. Antennas Propag. 2014, 62, 634–640. [Google Scholar] [CrossRef] [Scilit]
- Liu, Y.; Bai, J.; Xu, K.D.; Xu, Z.; Han, F.; Liu, Q.H.; Jay Guo, Y. Linearly polarized shaped power pattern synthesis with sidelobe and cross-polarization control by using semidefinite relaxation. IEEE Trans. Antennas Propag. 2018, 66, 3207–3212. [Google Scholar] [CrossRef] [Scilit]
- Yang, C.; Ou, N.; Liu, D.; Wang, N. Suppressing range ambiguity by pattern synthesis for SAR via semidefinite relaxation. IEEE Geosci. Remote Sens. Lett. 2022, 19, 4006805. [Google Scholar] [CrossRef] [Scilit]
- Haupt, R.L.; Rahmat-Samii, Y. Antenna array developments: A perspective on the past, present and future. IEEE Antennas Propag. Mag. 2015, 57, 86–96. [Google Scholar] [CrossRef] [Scilit]
- Herd, J.S.; Conway, M.D. The evolution to modern phased array architectures. Proc. IEEE 2016, 104, 519–529. [Google Scholar] [CrossRef] [Scilit]
- Rocca, P.; Oliveri, G.; Mailloux, R.J.; Massa, A. Unconventional phased array architectures and design methodologies—A review. Proc. IEEE 2016, 104, 544–560. [Google Scholar] [CrossRef] [Scilit]
- Mailloux, R. Phased Array Antenna Handbook, 3rd ed.; Artech House: Norwood, MA, USA, 2017. [Google Scholar]
- Abramowitz, M.; Stegun, I.A.; Romain, J.E. Handbook of mathematical functions. Phys. Today 1966, 19, 120–121. [Google Scholar] [CrossRef] [Scilit]
- Fisher, W.D. On grouping for maximum homogeneity. J. Am. Stat. Assoc. 1958, 53, 789–798. [Google Scholar] [CrossRef]
- Caorsi, S.; Massa, A.; Pastorino, M.; Randazzo, A. Optimization of the difference patterns for monopulse antennas by a hybrid real/integer-coded differential evolution method. IEEE Trans. Antennas Propag. 2005, 53, 372–376. [Google Scholar] [CrossRef] [Scilit]
- Manica, L.; Rocca, P.; Massa, A. Design of subarrayed linear and planar array antennas with SLL control based on an excitation matching approach. IEEE Trans. Antennas Propag. 2009, 57, 1684–1691. [Google Scholar] [CrossRef] [Scilit]
- Xiong, Z.Y.; Xu, Z.H.; Zhang, L.; Xiao, S.P. Cluster analysis for the synthesis of subarrayed monopulse antennas. IEEE Trans. Antennas Propag. 2014, 62, 1738–1749. [Google Scholar] [CrossRef] [Scilit]
- Yang, X.; Xi, W.; Sun, Y.; Zeng, T.; Long, T.; Sarkar, T.K. Optimization of subarray partition for large planar phased array radar based on weighted K-means clustering method. IEEE J. Sel. Top. Signal Process. 2015, 9, 1460–1468. [Google Scholar] [CrossRef] [Scilit]
- Abdulqader, A.J.; Mohammed, J.R.; Thaher, R.H. Antenna pattern optimization via clustered arrays. Prog. Electromagn. Res. M 2020, 95, 177–187. [Google Scholar] [CrossRef] [Scilit]
- Yang, S.; Lyu, W.; Zhang, Z. An off-grid compressive sensing strategy for the subarray synthesis of non-uniform linear arrays. arXiv 2021, arXiv:2112.15343. [Google Scholar] [CrossRef] [Scilit]
- Rocca, P.; Poli, L.; Polo, A.; Massa, A. Optimal excitation matching strategy for sub-arrayed phased linear arrays generating arbitrary-shaped beams. IEEE Trans. Antennas Propag. 2020, 68, 4638–4647. [Google Scholar] [CrossRef] [Scilit]
- Benoni, A.; Poli, L.; Rocca, P.; Massa, A. Design of clustered phased arrays by means of an innovative power pattern matching-driven method—The linear array case. IEEE Trans. Antennas Propag. 2024, 72, 4185–4197. [Google Scholar] [CrossRef] [Scilit]
- Bucci, O.M.; Franceschetti, G.; Mazzarela, G.; Panariela, G. Intersection approach to array pattern synthesis. IEE Proc. H Microwaves Antennas Propag. 1990, 137, 349. [Google Scholar] [CrossRef] [Scilit]
- Bucci, O.; D’Elia, G.; Mazzarella, G.; Panariello, G. Antenna pattern synthesis: A new general approach. Proc. IEEE 1994, 82, 358–371. [Google Scholar] [CrossRef] [Scilit]
- Grant, M.; Boyd, S. CVX: Matlab Software for Disciplined Convex Programming | CVX Research, Inc. Available online: https://cvxr.com/cvx/ (accessed on 19 May 2026).
- Nielsen, F.; Nock, R. Optimal interval clustering: Application to Bregman clustering and statistical mixture learning. IEEE Signal Process. Lett. 2014, 21, 1289–1292. [Google Scholar] [CrossRef] [Scilit]
- Wang, H.; Song, M. Ckmeans.1d.dp: Optimal k-means clustering in one dimension by dynamic programming. R J. 2011, 3, 29–33. [Google Scholar] [CrossRef] [Scilit]
- Zhang, T.; Zhang, X.; Li, J.; Xu, X.; Wang, B.; Zhan, X.; Xu, Y.; Ke, X.; Zeng, T.; Su, H.; et al. SAR Ship Detection Dataset (SSDD): Official release and comprehensive data analysis. Remote Sens. 2021, 13, 3690. [Google Scholar] [CrossRef] [Scilit]

Disclaimer/Publisher’s Note: The statements, opinions and data contained in all publications are solely those of the individual author(s) and contributor(s) and not of MDPI and/or the editor(s). MDPI and/or the editor(s) disclaim responsibility for any injury to people or property resulting from any ideas, methods, instructions or products referred to in the content. |
© 2026 by the authors. Licensee MDPI, Basel, Switzerland. This article is an open access article distributed under the terms and conditions of the Creative Commons Attribution (CC BY) license.